Rare earth element analysis in natural waters by multiple isotope dilution – sector field ICP-MS
12
Rare earth element analysis in natural waters by multiple isotope dilution – sector field ICP-MS† Tristan C. C. Rousseau, * a Jeroen E. Sonke, a Jerome Chmeleff, a Frederic Candaudap, a François Lacan, b Geraldo Boaventura, c Patrick Seyler a and Catherine Jeandel b The rare earth elements (REEs) are valuable tracers in the earth, ocean and environmental sciences. Ten out of fourteen stable REEs have two or more isotopes, making them suitable for quantification by isotope dilution. We present a plasma mass spectrometry based multiple isotope dilution method for high precision REE concentration analysis in aqueous media. Key aspects of the method are: (i) flexible spiking of ten REEs via two LREE and HREE mixed spike solutions. (ii) Offline pre-concentration and matrix removal, by ion chromatography for freshwater samples and by iron co-precipitation or ion chromatography with the NobiasÔ resin for seawater samples. (iii) High sensitivity detection by sector field-inductively coupled plasma mass spectrometry (SF-ICP-MS). (vi) The use of a desolvation micro-nebulization introduction system to lower polyatomic Ba and LREE-oxide interferences on HREEs. The method is suitable for a range of freshwater to seawater type samples, and was validated against SLRS-4, SLRS-5, and CASS-5 reference materials and two GEOTRACES marine inter-comparison samples. Long-term external precision on all REEs was <2% RSD, except La and Ce. Minimum sample volumes are 1 ml for freshwater and 50 ml for seawater. The multispike SF-ICP-MS method should be of particular interest in exploring subtle variations in aqueous REE fractionation patterns and anomalies in large numbers of samples. 1 Introduction Rare Earth Elements (REEs) in rocks and sediments are tracers of crustal differentiation or palaeoproxies for seawater REE composition. 1–4 In natural waters REEs – together with Nd isotopes – are tracers of lithogenic inputs, solute–particle interactions, redox processes, and water mass mixing and circulation. 5–11 To rst order, the aqueous geochemistry of the REE is gov- erned by the lanthanide contraction effect, i.e. the gradual decrease in ionic radii from La to Lu. Yet, both in experimental and natural systems complex REE trends are observed that require different explanations. Examples are middle REE (MREE) enrichment in Amazon River waters that have been linked to preferential dissolution of MREE-enriched phosphate minerals, 12 or the so-called tetrad effect in seawater samples. 13 In addition to redox related Ce anomalies in most natural waters, observations of natural Gd and Tb anomalies in seawater 14 and evidence of anthropogenic La and Gd anomalies have been reported. 15,16 Both the tetrad effect and the seawater Gd and Tb anomalies have been questioned due to analytical limitations and normalization issues. 17 Detecting subtle changes in REE patterns and REE anomalies in these fractions oen requires nal uncertainties better than 2% RSD. There are several methods for REE concentration determi- nation in natural waters. Initially highly precise, yet time consuming analyses were made by isotope dilution (ID) thermal ionization mass spectrometry. 8,18 While ID avoids quantica- tion problems due to losses of REE during sample preparation, this method required laborious matrix and intra-REE separa- tions due to a limited Faraday cup conguration exibility and the need to avoid interferences. 19–21 One could typically deter- mine three REEs at the same time, and mono-isotopic REEs were not measured by this method. In the 1990s, the advent of inductively coupled plasma mass spectrometers (ICP-MS) provided much faster yet less precise analyses. REE concentration determination by quadrupole (Q-) ICP-MS using external calibration yields typical RSD's of 5–15%. Despite relatively low detection limits, oxide interferences in REEs, and matrix effects, Q-ICP-MS has been the key in exploring REE cycling in continental waters. 22–25 The use of sample aerosol desolvating devices as ICP-MS introduction systems has been shown to enhance sensitivity and limit Ba and light REEs (LREEs) oxide interferences on heavy REEs (HREEs). 26 Finally, single and a GET, Universit´ e de Toulouse, CNRS, IRD, CNES, 14 Avenue Edouard Belin, F-31400 Toulouse, France. E-mail: [email protected] b LEGOS, Universit´ e de Toulouse, CNRS, IRD, CNES, 14 Avenue Edouard Belin, F-31400 Toulouse, France c Universidade De Brasilia, UNB, LAGEQ, Campus universitario Darcy Ribeiro, 70.910- 900 Brasilia, DF, Brazil † Electronic supplementary information (ESI) available: The ESI contains details on the spike calibration with MC-ICP-MS and further details on the multispike method (spiking strategy, setup, performances and data treatment). See DOI: 10.1039/c3ja30332b Cite this: DOI: 10.1039/c3ja30332b Received 1st November 2012 Accepted 4th February 2013 DOI: 10.1039/c3ja30332b www.rsc.org/jaas This journal is ª The Royal Society of Chemistry 2013 J. Anal. At. Spectrom. JAAS PAPER Downloaded by Universite Paul Sabatier on 11 March 2013 Published on 04 February 2013 on http://pubs.rsc.org | doi:10.1039/C3JA30332B View Article Online View Journal
Transcript of Rare earth element analysis in natural waters by multiple isotope dilution – sector field ICP-MS

JAAS
PAPER
Dow
nloa
ded
by U
nive
rsite
Pau
l Sab
atie
r on
11
Mar
ch 2
013
Publ
ishe
d on
04
Febr
uary
201
3 on
http
://pu
bs.r
sc.o
rg |
doi:1
0.10
39/C
3JA
3033
2B
View Article OnlineView Journal
aGET, Universite de Toulouse, CNRS, IRD, C
Toulouse, France. E-mail: tristanrousseau@bLEGOS, Universite de Toulouse, CNRS, IRD,
Toulouse, FrancecUniversidade De Brasilia, UNB, LAGEQ, Cam
900 Brasilia, DF, Brazil
† Electronic supplementary information (on the spike calibration with MC-ICP-MSmethod (spiking strategy, setup, perform10.1039/c3ja30332b
Cite this: DOI: 10.1039/c3ja30332b
Received 1st November 2012Accepted 4th February 2013
DOI: 10.1039/c3ja30332b
www.rsc.org/jaas
This journal is ª The Royal Society of
Rare earth element analysis in natural waters bymultiple isotope dilution – sector field ICP-MS†
Tristan C. C. Rousseau,*a Jeroen E. Sonke,a Jerome Chmeleff,a Frederic Candaudap,a
François Lacan,b Geraldo Boaventura,c Patrick Seylera and Catherine Jeandelb
The rare earth elements (REEs) are valuable tracers in the earth, ocean and environmental sciences. Tenout of
fourteen stable REEs have twoormore isotopes, making them suitable for quantification by isotope dilution.
We present a plasma mass spectrometry based multiple isotope dilution method for high precision REE
concentration analysis in aqueous media. Key aspects of the method are: (i) flexible spiking of ten REEs
via two LREE and HREE mixed spike solutions. (ii) Offline pre-concentration and matrix removal, by ion
chromatography for freshwater samples and by iron co-precipitation or ion chromatography with the
Nobias� resin for seawater samples. (iii) High sensitivity detection by sector field-inductively coupled
plasma mass spectrometry (SF-ICP-MS). (vi) The use of a desolvation micro-nebulization introduction
system to lower polyatomic Ba and LREE-oxide interferences on HREEs. The method is suitable for a range
of freshwater to seawater type samples, and was validated against SLRS-4, SLRS-5, and CASS-5 reference
materials and two GEOTRACES marine inter-comparison samples. Long-term external precision on all REEs
was <2% RSD, except La and Ce. Minimum sample volumes are 1 ml for freshwater and 50 ml for
seawater. The multispike SF-ICP-MS method should be of particular interest in exploring subtle variations
in aqueous REE fractionation patterns and anomalies in large numbers of samples.
1 Introduction
Rare Earth Elements (REEs) in rocks and sediments are tracersof crustal differentiation or palaeoproxies for seawater REEcomposition.1–4 In natural waters REEs – together with Ndisotopes – are tracers of lithogenic inputs, solute–particleinteractions, redox processes, and water mass mixing andcirculation.5–11
To rst order, the aqueous geochemistry of the REE is gov-erned by the lanthanide contraction effect, i.e. the gradualdecrease in ionic radii from La to Lu. Yet, both in experimentaland natural systems complex REE trends are observed thatrequire different explanations. Examples are middle REE(MREE) enrichment in Amazon River waters that have beenlinked to preferential dissolution of MREE-enriched phosphateminerals,12 or the so-called tetrad effect in seawater samples.13
In addition to redox related Ce anomalies in most natural
NES, 14 Avenue Edouard Belin, F-31400
yahoo.fr
CNES, 14 Avenue Edouard Belin, F-31400
pus universitario Darcy Ribeiro, 70.910-
ESI) available: The ESI contains detailsand further details on the multispikeances and data treatment). See DOI:
Chemistry 2013
waters, observations of natural Gd and Tb anomalies inseawater14 and evidence of anthropogenic La and Gd anomalieshave been reported.15,16 Both the tetrad effect and the seawaterGd and Tb anomalies have been questioned due to analyticallimitations and normalization issues.17 Detecting subtlechanges in REE patterns and REE anomalies in these fractionsoen requires nal uncertainties better than 2% RSD.
There are several methods for REE concentration determi-nation in natural waters. Initially highly precise, yet timeconsuming analyses were made by isotope dilution (ID) thermalionization mass spectrometry.8,18 While ID avoids quantica-tion problems due to losses of REE during sample preparation,this method required laborious matrix and intra-REE separa-tions due to a limited Faraday cup conguration exibility andthe need to avoid interferences.19–21 One could typically deter-mine three REEs at the same time, and mono-isotopic REEswere not measured by this method.
In the 1990s, the advent of inductively coupled plasma massspectrometers (ICP-MS) provided much faster yet less preciseanalyses. REE concentration determination by quadrupole (Q-)ICP-MS using external calibration yields typical RSD's of 5–15%.Despite relatively low detection limits, oxide interferences inREEs, andmatrix effects, Q-ICP-MS has been the key in exploringREE cycling in continental waters.22–25 The use of sample aerosoldesolvating devices as ICP-MS introduction systems has beenshown to enhance sensitivity and limit Ba and light REEs (LREEs)oxide interferences on heavy REEs (HREEs).26 Finally, single and
J. Anal. At. Spectrom.

JAAS Paper
Dow
nloa
ded
by U
nive
rsite
Pau
l Sab
atie
r on
11
Mar
ch 2
013
Publ
ishe
d on
04
Febr
uary
201
3 on
http
://pu
bs.r
sc.o
rg |
doi:1
0.10
39/C
3JA
3033
2BView Article Online
multi-collector sector eldmass spectrometers (SF-ICP-MS) havehigher sensitivity thanQ-ICP-MS,making themmore suitable forultra-trace REE analysis. Following dilution of seawater in orderto lower thematrix ion concentrations introduced in the plasma,and using a desolvator to limit oxide interferences, it has beenpossible to directlymeasure REEs in coastal seawater.27However,REE determination in open ocean waters at the parts-per-quadrillion (ppq) level requires additional pre-concentration andmatrix separation methods. A classic protocol is Fe(OH)3 co-precipitation followed by an anionic chromatography column toremove Fe.28,29 Solvent extraction or solid phase extraction usingcomplexation resins is also a means of REE pre-concentrationand separation.30,31 Recently a new ion-exchange protocol wasdeveloped for direct REE pre-concentration from seawater usingthe new Nobias resin.32–34
Sensitivity variations and matrix effects can be monitoredand corrected for by adding internal standards (In, Re, Tm).35,36
The challenge of REE pre-concentration methods for ICP-MSanalysis is to avoid or account for REE losses during thechemical processing. Isotope dilution using 2 or more REEs tocorrect such losses produces satisfactory results.11,37 Neverthe-less, a recent seawater intercomparison study of the REEsshowed that inter-laboratory REE concentrations do not repro-duce better than 10% 2RSD.38 In 2002, the rst multispikemethod suitable for SF-ICP-MS was published for rock analyseswith a multi-collector ICP-MS (MC-ICP-MS).39 The method isbased on the addition of 10 enriched REE spikes to a rockdigest, followed by a cationic column separation of LREE andHREE fractions to avoid oxide interferences of LREEs in HREEs.Baker et al.39 (2002) achieved long-term external reproducibil-ities on all REEs that were <1% 2RSD. A method including 6enriched REE spikes on a single collector SF-ICP-MS operated inhigh resolution mode on oxide interfered isotopes was pub-lished for rock analyses with a precision <5% 2RSD.40,41
We present here a precise and accurate method for REEanalysis in natural waters by isotope dilution using 10enriched REE spikes with a single collector SF-ICP-MS coupledwith a desolvating introduction system. The method isinspired by the Baker et al. (2002) study, but uses a desolvationintroduction system with additional N2 gas to limit oxideinterferences, and different REE pre-concentration protocols.Our method is suitable for a range of natural water types, i.e.river, ground, or seawater with nal uncertainties better than2% RSD for most REEs.
Fig. 1 Methodological scheme of multispike REE analysis of natural water sample
J. Anal. At. Spectrom.
In the following we discuss isotope dilution principles,spiking strategy, separation/pre-concentration methods andinstrument setup. Then, interference corrections and concen-tration calculations including mono-isotopic REEs (Pr, Tb, Ho,Tm) are detailed. Finally we present and discuss results of thismethod applied to reference river water, coastal seawater andopen ocean seawater.
2 Materials and methods2.1 Multispike REE method
Sample preparation and sample analysis procedures of themultispike method presented hereaer are summarized inFig. 1. This method was validated by analyzing reference solu-tions provided by the Canadian National Research Council(CNRC): SLRS-4 and SLRS-5 riverine water, CASS-5 coastal waterand two seawater samples collected in the framework of theGEOTRACES intercalibration program: one from the surface,the other at 2000 m depth, both collected at 31�50'N, 64�10'W(BATS station: Bermuda Atlantic Time-series Study, http://ijgofs.whoi.edu/Time-Series/BATS_presentation.pdf).
The REE analysis method we present here consists ofsimultaneous addition of known amounts of ten enriched REEisotope spikes to a sample (La, Ce, Nd, Sm, Eu, Gd, Dy, Er, Yb,and Lu). In the remainder we refer to the method as the REE‘multispike method’. Subsequently, we measure the ratios often pairs of REE isotopes in the sample/spike mixture by SF-ICP-MS. The concentrations of the ten corresponding REEs ofnatural isotopic composition in the sample are determined bythe classical ID equation:
½REE�smp ¼ ½REE�spikeWspk
Wsmp
Mnat
Mspk
A2spk
A2nat
�A1spk
A2spk� Rmix
��Rmix � A1nat
A2nat
� (1)
Wsmp: mass in g of the sample.Wspk: mass in g of the spike added to the sample.Msmp: “Natural” NIST REE atomic mass.Mspk: spike atomic mass.A1nat, A2nat, A1spk, A2spk: natural spike relative abundances of
isotopes 1 and 2.Rmix: mass bias corrected ratio of isotope1/isotope2 in the
sample/spike mix measured by SF-ICP-MS.
s on a single collector sector field ICP-MS.
This journal is ª The Royal Society of Chemistry 2013

Fig. 2 Central PAAS normalized REE spectra with a compilation of river waterand seawater REE patterns: (a) Nd normalized LREEs and (b) Er normalized HREEs.
Paper JAAS
Dow
nloa
ded
by U
nive
rsite
Pau
l Sab
atie
r on
11
Mar
ch 2
013
Publ
ishe
d on
04
Febr
uary
201
3 on
http
://pu
bs.r
sc.o
rg |
doi:1
0.10
39/C
3JA
3033
2BView Article Online
The multispike calibration for isotopic composition (IC) andconcentrations was done with a Thermo-Finnigan Neptune MC-ICP-MS. Details of the calibration are reported in the ESI.†Isotope pairs and associated natural and spike isotope abun-dances chosen for isotope dilution, along with atomic massesare reported in Table 1. The ideal amount of enriched spike tobe added to a sample can be determined by evaluating theuncertainty magnication factor, M:
M ¼
�A1nat
A2nat� A1spk
A2spk
�Rmix�
Rmix � A1nat
A2nat
��A1spk
A2spk� Rmix
� (2)
This uncertainty level can be minimized as follows:
dM
dRmix
¼ 0 (3)
We obtain the ideal Rmix:
Rmix-idea ¼ffiffiffiffiffiffiffiffiffiffiffiffiffiffiffiffiffiffiffiffiffiffiffiA1spk
A2spk
A1nat
A2nat
s(4)
A discussion of the uncertainty magnication factor andideal Rmix-ideal is reported in the ESI.†
Finding the optimum spike concentration requires a goodidea of the approximate REE concentrations in an unknownsample. However, as discussed below, a certain amount ofoverspiking or underspiking can be tolerated without muchincrease of the nal uncertainty on REE concentrations. Naturalwater samples display a variety of REE concentrations andspectra. We therefore chose to add the enriched REE spikes tothe samples by using twomixed spike solutions. One containingthe light to middle rare earth element spikes La, Ce, Nd, Sm, Eu,Gd, hereaer called ‘mixed LREE spikes’ and one containingDy, Er, Yb, Lu, hereaer called ‘mixed HREE spikes’. The rela-tive spike concentrations in the mixed LREE and HREE spikeswere chosen to display optimal Rmix when mixed with a simu-lated reference solution. This simulated reference solutionwhen normalized to Post-Archean Average Australian Shale(PAAS)42 displays REE spectra that we call ‘central spectra’. Thedetermination of the central spectra was made using the central
Table 1 REE isotope abundances, ratios and atomic weights of natural and enrichREE element, Ms ¼ atomic mass of the spike REE. ‘nat’ and ‘spk’ refer to natural an
Isotope1 Isotope2 Ab.1nat Ab.2nat Ab.1sp
La 138 139 0.09% 99.91% 6.76%Ce 136 140 0.19% 88.45% 24.342Nd 146 145 17.18% 8.29% 97.35%Sm 149 147 13.82% 14.99% 96.72%Eu 151 153 47.81% 52.19% 97.70%Gd 157 155 15.65% 14.80% 91.66%Dy 163 161 24.90% 18.89% 95.60%Er 167 166 22.95% 33.60% 95.37%Yb 172 171 21.83% 14.28% 95.84%Lu 176 175 2.59% 97.41% 74.49%
This journal is ª The Royal Society of Chemistry 2013
relative value between extreme values of each REE within acompilation of distinct REE patterns of natural waters(seawater, Amazon river tributaries) normalized by the same Ndvalue for the LREEs and Er for the HREEs (Fig. 2a and b).Subsequently, the optimal LREE and HREE spike mixes werenumerically tested to assure adequate spiking of all REE. In thisstep, the sensitivity of ID uncertainty was tested on the “centralspectra” and on “natural spectra” to several levels of overspikingand underspiking (Fig. 3).
Staying within the 2% uncertainty magnication on nalREE concentrations using the ID method allows overspiking of3 times for Yb to 11 times for Sm and underspiking of 4 timesfor Eu to 15 times for Dy. The 4% to 2% uncertainty magni-cation difference being higher for overspiking than under-spiking, overspiking would always be preferred to underspiking.
ed isotope standard solutions. Ab ¼ abundance, Mn ¼ atomic mass of the naturald spike respectively
k Ab.2spk Mn Ms
Ab1natAb2nat
Ab1spkAb2spk
93.24% 138.91 138.84 0.0009 0.0725% 69.85% 140.12 139.01 0.0021 0.3485
0.52% 144.24 145.88 2.0721 186.40340.22% 150.37 148.94 0.9219 429.99692.30% 151.96 150.97 0.9161 42.50300.24% 157.25 156.97 1.0574 375.75940.14% 162.50 162.90 1.3180 678.33161.27% 167.26 166.96 0.6830 75.07201.31% 173.04 171.97 1.5287 73.3741
25.51% 174.97 175.69 0.0266 2.9196
J. Anal. At. Spectrom.

Fig. 3 2% and 4% uncertainty levels due to overspiking and underspiking of the “central spectra” reference REE patterns with the LREE and HREE mixed spikesolutions.
JAAS Paper
Dow
nloa
ded
by U
nive
rsite
Pau
l Sab
atie
r on
11
Mar
ch 2
013
Publ
ishe
d on
04
Febr
uary
201
3 on
http
://pu
bs.r
sc.o
rg |
doi:1
0.10
39/C
3JA
3033
2BView Article Online
The relative spike concentrations in mixed HREE and LREEspikes were also adjusted to minimize the isobaric and oxideinterferences induced by the spike addition. We also aimed toobtain the same order of magnitude of signal within each pairof isotopes to assure that they were measured in the same SF-ICP-MS counting mode, i.e. pulse or analogue mode.
Consequently, some REE spikes were slightly and voluntaryunder or overspiked. For La and Lu, overspiking allowed us tominimize the isobaric interferences of Ba and Yb respectively.Nd, Sm and Dy were slightly underspiked to lower the quantityof Nd and Sm oxide interferences on HREEs and to reduce thedifference of the signal between Dy isotopes. For routine anal-yses, the amounts of LREE and HREE spike mixes added to thesample are calculated by determining the optimal Nd and Erspiking. This requires a prior knowledge of the approximate Ndand Er concentrations in the sample within a 300% condenceinterval.
2.2 Preconcentration, matrix removal, and Ba separation
REE analyses by ICP-MS of freshwater and more specicallyseawater samples can require pre-concentration and matrixremoval in order to increase detection limits, lower the ioniccharge in the plasma, or limit isobaric and oxide interferences(i.e.: Sn, Sb, Ba). The presence of Ba in the sample is critical inthe REE multispike method due to isobaric interferences on Laand Ce and BaO interferences on Nd, Sm and Gd. We used threedifferent separation protocols, one suitable for freshwater andtwo suitable for coastal and open ocean seawaters. All samplepreparations were performed under ISO 2 conditions in theLEGOS and GET clean rooms. All acids used were in-housedouble distilled and deionized (DI) water was <18 MU.
Fig. 4 Ba/REE separation chromatogram with cationic resin AG50W-X8. Volumes
J. Anal. At. Spectrom.
2.2.1 Freshwater samples. For freshwater samples, we useda single offline chromatography column using the AG50W-X8(Dowex) cationic resin.43 A 200 mm height and 2.5 mm innerdiameter quartz column equipped with a 1 mm frit is lled with100–200 mesh AG50W-X8 resin. The exchange capacity of thecolumn is approximately of 2.6 meq. The sample is aliquotedand evaporated to dryness, and then dissolved in 2 ml of 2 MHCl, and loaded on the preconditioned column. Aer a 3 time200 ml rinse with 2 M HCl, 1.4 ml of 2 M HCl is added to thecolumn followed by 8.2 ml of 2.5 M HNO3 for Ba removal. TheREEs are then eluted in 15 ml of 6 M HCl. A chromatogram ofthis separation method is shown in Fig. 4. Aer each sampleelution, the column is washed and regenerated with 7 ml of2.5 M HNO3 and 20 ml of 6 M HCl. The sample is evaporated todryness and redissolved in 0.32 M HNO3 for analysis by SF-ICP-MS. This separation protocol displays a more than 90% recoveryeven for Lu which is the rst REE eluted aer Ba and La which isthe last REE eluted at the end of the 6 M HCl fraction.
2.2.2 Seawater samples. For seawater samples two pre-concentration protocols were used. The rst is inspired by theroutine protocol used at the LEGOS laboratory and consists inREE Fe(OH)3 co-precipitation followed by Fe removal withanionic chromatography.29 The second protocol consists in theretention of REEs onto the Hitachi Nobias� resin. Bothmethods are followed by a chromatographic separation step asdescribed in the previous section to ensure a complete removalof Ba.
(a) Fe oxide REE co-precipitation + AG50W-X8 cationiccolumn. REE pre-concentration by co-precipitation with Fe(OH)3is achieved by adding 0.5 g of puried and HCl dissolved Fe to100–500 ml of the seawater sample. Aer 24 h (at least)
are expressed in ml.
This journal is ª The Royal Society of Chemistry 2013

Paper JAAS
Dow
nloa
ded
by U
nive
rsite
Pau
l Sab
atie
r on
11
Mar
ch 2
013
Publ
ishe
d on
04
Febr
uary
201
3 on
http
://pu
bs.r
sc.o
rg |
doi:1
0.10
39/C
3JA
3033
2BView Article Online
homogenization, the pH is increased to 7–8 by addition ofultrapure NH4OH leading to the formation of an Fe(OH)3precipitate. Aer 24 h sedimentation, the precipitate is rinsedand centrifuged 3 times with DI water in order to remove amaximum of water soluble salts. Aer the last centrifugationstep, the sample is evaporated to dryness, the precipitate isdissolved in 6 M HCl and the Fe is separated from the REEs byretention in a 100mmheight and 2.5mm inner diameter quartzcolumn with a 1 mm frit that is lled with a 200–400 mesh AG1-X8 (Biorad) resin. The REEs are eluted in 6 M HCl and Fe isnally eluted from the column with 0.1 M HCl. This separationprotocol usually displays recoveries of REEs superior to 95%;further details can be found in ref. 29. The eluate containingREEs, traces of Ba and other impurities is then evaporated todryness, redissolved in 2 ml of 2 M HCl, and loaded in theAG50W-X8 cationic column as described in the previous sectionfor Ba separation.
(b) Hitachi Nobias resin + AG50W-X8 cationic column. TheNobias� PA1 columns (Hitachi High Tech, Japan) are packedwith a hydrophilic methacrylate polymer on which ethyl-enediaminetriacetic and iminodiacetic acids are immobilizedthat display a very high affinity for trace metals.44,45 Theperformance of the Nobias resin was tested for the REE pre-concentration/separation and displayed high recovery of REEs,and very efficient separation of Ba.32–34
The Nobias pre-concentration procedure presented in thisstudy was adapted from the previously published studies andinvolves three steps: washing, pre-concentration and elution.The pre-concentration setup used with the Nobias resin isshown in ESI.† The washing solutions, sample and elutionsolutions are pumped with a peristaltic pump and a combina-tion of Tygon and Teon tubing.
The columns are rst washed with 10 ml of commercialacetone, followed by 3 ml of DI water and then, 3 ml of 3 MHNO3. The H2O/HNO3 sequence is repeated 3 times to assurethe removal of impurities brought by the acetone. For the pre-concentration, the pH of the samples previously ltered andacidied is adjusted to a value of 6 � 0.2. Therefore a stock of a2.5 M ammonium acetate buffer solution is prepared withglacial acetic acid (ULTREX II, J.T.Baker�) ammoniac in excess(Merck Suprapur 25%) and DI water. The buffer is added to thesample in order to reach a concentration of 0.125 M and abuffered pH of approximately 4; pH is then secondary raisedwith ammoniac (Merck Suprapur 25%). Before and aer everybuffered sample elution, 10 ml of a 0.125 M ammonium acetatebuffer in DI at pH 6 are systematically passed through thesystem for column conditioning.
During washing and pre-concentration, a Tygon tube isconnected to the bottom of the column and wastes are pumpedwith uxes of 10 ml min�1. In the elution step, the REEs areeluted with 3 ml of 3 M HNO3; columns are therefore installedon a rack for gravity elution directly into savillex beakers. Aerelution, columns are ready for re-use. The Nobias resin used inthe procedure detailed here displays recoveries of REEs superiorto 90%. Eluted samples are then evaporated, redissolved in 2 MHCl and loaded on an AG50W-x8 cationic column as describedpreviously for Ba separation.
This journal is ª The Royal Society of Chemistry 2013
2.3 Instrumental parameters
Following the above outlined sample pre-treatment, REE mul-tispike ID measurements were made by SF-ICP-MS (Element-XR, Thermo-Fisher Scientic), operated in low resolution modewith a desolvation nebulization introduction system. Compar-ative tests were performed on two desolvation systems: theAPEX-Q (ESI Inc.) with no N2 additional gas and the Aridus II(Cetac Inc.) with N2 as an additional gas. The Aridus II systemwas kept for this method because it displayed lower oxideformation.
All atomic masses between 135 and 178 plus 129 and 131were analyzed. This allowed the measurement of all isotopesused for ID, oxide and isobaric interference corrections. Forisotopic ratio measuring purpose we opted like Willbold et al.(2005) for an acquisition method consisting of repeated fastscan measurements of all isotopes instead of long individualmeasurements for each isotope. This reduces the time intervalbetween two acquisitions and is less sensitive to small insta-bilities in the signal due to variation of the sample ow in theintroduction system. 60 consecutive sweeps were thus pro-grammed with 4 short measurements per isotope mass madeon at peak tops in low resolution mode. The dwell time perisotope lasted between 0.004 and 0.4 s according to the signalintensity of each isotope in order to increase precision on theleast abundant isotopes for a total acquisition time of 6 min persample.
Isotope measurements with the Element XR SF-ICP-MS areachieved by setting the magnet to the rst isotopic mass posi-tion. The isotopes to be measured above the magnet mass arereached with electric scans until reaching a default value of 15%mass variation. The magnetic eld is then switched to the nextmass position followed by a settling time of a few tens of ms. Forour method and starting from 129Xe, a 15%mass variation leadsto a rst magnet jump at mass 149 and a second at mass 171.The magnet jump leads to an unusual instrumental mass biasfor the 147Sm/149Sm and 171Yb/172Yb ratios of up to 10%. Thedefault mass scanning range was therefore modied to a valueof 20%. All isotopes between masses 129 and 178 were thencovered with a single “magnet jump” at mass 154 and two seriesof electric scans (135 / 153, and 154 / 178). Setting the“magnet jump” at mass 154 has the advantage of affectingneither the pairs of isotopes used in ID calculation nor theisotopes used for isobaric corrections. Instrument parametersare reported in the ESI.†
2.4 Data treatment
(a) Sequence. A sequence is composed of spiked samples,procedural blanks and CRMs that are regularly bracketed byHNO3 blanks, monitoring solutions and spike solutions formass bias and oxide formation corrections.
(b) Blank correction. The rst step in the data treatment isthe blank correction. Signals on the chemistry blanks (whichinclude the instrumental 0.32 M HNO3 blank) are typically low(<1%) and directly subtracted from sample signals for mostisotope masses. For a better precision of isobaric corrections onLa, Ce and Lu (cf. paragraph d), Xe, Ba and Hf are not corrected
J. Anal. At. Spectrom.

JAAS Paper
Dow
nloa
ded
by U
nive
rsite
Pau
l Sab
atie
r on
11
Mar
ch 2
013
Publ
ishe
d on
04
Febr
uary
201
3 on
http
://pu
bs.r
sc.o
rg |
doi:1
0.10
39/C
3JA
3033
2BView Article Online
for blank contribution, and Ce and Yb blank corrections aremade aer their isobaric interference corrections on La and Lurespectively.
(c) Oxide interference corrections. In the multispikemethod oxide formation is monitored in two synthetic REEsolutions bracketing a series of 5 samples. The rst solutioncontains Ba, La, Ce, Pr, Tb, Er and Yb of natural isotopiccomposition and allows the monitoring of the following oxides:
%BaO ¼ 138Ba16O/138Ba; (5)
%LaO ¼ 139La16O/139La; (6)
%CeO ¼ 140Ce16O/140Ce; (7)
%PrO ¼ 141Pr16O/141Pr; (8)
%TbO ¼ 159Tb16O/159Tb. (9)
The second solution contains Nd, Sm, Eu, Gd, and Dy, andallows the monitoring of:
%NdO ¼ 146Nd16O/146Nd; (10)
%SmO ¼ 149Sm16O/149Sm; (11)
%EuO ¼ 153Eu16O/153Eu; (12)
%GdO ¼ 155Gd16O/155Gd; (13)
%DyO ¼ 161Dy16O/161Dy. (14)
An average value of each elemental oxide formation rate iscalculated for the session; the regular analysis of those oxideformation rates allows us to correct with more accuracy theinterfering oxides and to monitor their stability. Hydroxideformation was found to be below the detection limit and istherefore not considered in this study.
(d) Isobaric interference corrections. 136Ce, 138La and 176Luare required for the Ce, La and Yb isotope dilution calculation.These isotopes are respectively interfered by 136Xe and 136Ba,138Ba and 138Ce and 176Yb and 176Hf. The interference correc-tion of 136Ba and 136Xe on 136Ce is made using the interferencefree 137Ba and 134Xe isotopes. The correction of 138Ba and 176Hfisobars (on 138La and 176Lu respectively) follows the same logic.The interference correction is less trivial for 138Ce and 176Yb on138La and 176Lu, because 138Ce and 176Yb are naturally presentin the sample and are also added to the mixed spike solutions.The pairs of ratios 138Ce/140Ce vs. 136Ce/140Ce and 176Yb/171Yb vs.176Yb/172Yb evolve linearly within the mixing between spike andsample endmembers of contrasted isotopic compositions.These relations allow us to efficiently unravel the combinedspike and natural 138Ce and 176Yb contributions to themeasured signals on masses 138 and 176. The isobaric correc-tions are calculated as follows:
Cps138La ¼Cps138 � Cps137Ba
A137BaA138Ba
� �Cps136Ce0:0305þ 0:0028Cps140Ce� (15)
J. Anal. At. Spectrom.
Cps176Lu ¼Cps176 � Cps177Hf
A177HfA176Hf
� �Cps171Yb0:909þ 0:0101Cps172Yb� (16)
where Cps138 is the measured total ion count on mass 138, ‘A’refers to natural abundance, and coefficients ‘0.0305 and0.0028’ are the slope and intercepts of the mixing diagrams(idem for Lu). Note that in addition mass bias corrections aremade to eqn (15) and (16) (see next section).
(e) Mass bias correction. Isotopic ratios used for isotopedilution and isobaric corrections are corrected for instrumentalmass bias, with a fractionation factor calculated as follows:
fx=y ¼
�CpsxM
CpsyM
��AxMnat
AyMnat
� (17)
fx/y: fractionation factor between the M REE pair of isotopesof x and y masses.
CpsxM: counts per second of the M REE isotope of x mass.AxMnat: natural abundance of the M REE isotope of x mass.Fractionation factors are calculated from the same analysis
of the synthetic bracketing solutions that are also used fordetermining oxide formation (Ba, La, Ce, Pr, Tb, Er, Yb and Nd,Sm, Eu, Gd, Dy). A series of 5 samples are bracketed withmonitoring solutions and blanks. For each series, an averagefractionation factor is calculated using the two bracketinganalyses. The factor is then applied to correct for mass bias onsamples as follows.
corrRx=y ¼
�CpsxMsmp
CpsyMsmp
�f ix=y
(18)
The 131Xe/136Xe mass bias is also monitored in the 0.32 MHNO3 instrument blank solution aer corrections from minor136Ce and 136Ba isobaric interferences. Due to low signals andhighly interfered natural 138La, 136Ce and 175Lu in the bracket-ing monitoring solutions, mass bias for 138La/139La, 136La/140Laand 175Lu/176Lu is monitored in the ‘mixed spike’ solutionswhich display sufficient 138La, 136Ce and 175Lu signals.
(f) Mono-isotopic REEs. The mono-isotopic REE (i.e.: Pr,Tb, Ho, Tm) concentrations are determined by external calcu-lation using a bracketing standard and are corrected forchemistry yields using isotope diluted REEs as internal stan-dards. This method readily integrates the dilution factor,preparation chemistry yields and avoids the need of a thirdinternal standard sometimes used in concentration determi-nation (i.e. Tm, In or Re) to correct the shi of sensitivitybetween standard and sample. This shi of sensitivity iscommonly due to the time elapsed between the two measure-ments and differences of matrix compositions or little variationof the sample ow in the introduction system. Ratios betweensample concentrations obtained by isotope dilution and exter-nally calculated concentrations are monitored for 143Nd, 145Nd,146Nd, 147Sm, 149Sm, 151Eu, 153Eu, 155Gd, 157Gd, 161Dy, 163Dy,166Er, 167Er, 171Yb and 172Yb.
This journal is ª The Royal Society of Chemistry 2013

Paper JAAS
Dow
nloa
ded
by U
nive
rsite
Pau
l Sab
atie
r on
11
Mar
ch 2
013
Publ
ishe
d on
04
Febr
uary
201
3 on
http
://pu
bs.r
sc.o
rg |
doi:1
0.10
39/C
3JA
3033
2BView Article Online
As illustrated for 151Eu:
R 151Eusmp151Eubk
¼�½151Eu� ID þ ½151Eu� spk
�½151Eu� EC
(19)
Abbreviations smp and bk stand for sample and beaker.Abbreviations ID and EC stand for the isotope concentration
determined by “isotope dilution” and “calculated externally”.Spk stands for the spike isotope concentration.
R 151Eusmp151Eubk
¼
½Eu� IDA
151Eunat þ�Ws½Eu� LREEspkA
151Euspk
�We
!
½Eu�std A151Eunat
Cps151EustdCps151Eusap
(20)
LREEspk: “mixed LREE spike”.‘nat’ and ‘std’ stand for natural and standard.An average Rsmp/bk is then calculated for each element, and a
linear regression is then tted between individual elemental Rand the corresponding atomic masses. The Rsmp/bk are theninferred for Pr, Tb, Tm and Ho masses and multiplied by theirexternally calculated concentrations.
3 Results and discussion
In this section we discuss: (1) the performance of the multispikeSF-ICP-MS method, and (2) results for certied referencematerials SLRS-4 and SLRS-5 river water and CASS-5 coastalseawater. We also compare open ocean samples collectedduring a GEOTRACES intercalibration cruise at the BATS (Ber-muda Atlantic Time Series) station at depths of 15 m (GS63) and2000 m (GD41).
3.1 Separation chemistry
The most critical aspect of the separation chemistry is theremoval of Ba. 136Ba and 138Ba interfere with spike isotopes136Ce and 138La respectively. We discuss here the case of 138Ba.Due to the lower La concentration in seawater than in riverwater, the Ba/La ratio is typically more elevated in seawater. Theefficiency of Ba removal during the sample processing was
Table 2 Efficiency of pre-concentration/separation protocols for Ba removal. ‘Copendmember samples (salinities 36.2 and 0) from the Amazon estuary collected on
Sample type Sample id
Untreated sample Cop. + AG1-X8 AG
½Ba�½La�nat
138Ba138Laspiked
½Ba�½La�nat
138Ba138Laspiked
½B½La
Seawater CASS-5 >1000 >2 � 104 — — —GD 41 >2500 >8 � 104 43 1330 —GS 63 >3500 >9.5 � 104 13 308 —AM3 803 >2500 >105 32 1551 —
River water SLRS-4 42 1202 — — 0.0SLRS-5 62 1823 — — 0.0AM3 102 65 1146 41 713 —
This journal is ª The Royal Society of Chemistry 2013
evaluated from the (138Ba/138La)nat and (138Ba/(138Lanat +138Laspk)) ratios for 7 different samples analyzed in this studyand processed with different separation/pre-concentrationtechniques (Table 2). A co-precipitation step applied to river andseawater samples causes a 50- to 250-fold reduction in the [Ba]/[La] ratio for seawater but does not affect signicantly the Ba/Laratio of river water samples. Even with enriched 138La spikeaddition to the sample, the 138Ba/138La ratios are still too high toperform ID on river water La with a single co-precipitation step.
The ionic exchange capacity of AG50W-X8 is sufficient toprocess a river water sample and remove most of the Ba. SLRS-4and SLRS-5 show a 2000-fold drop in the Ba level, allowing a LaID calculation with a 25% isobaric correction of 138Ba on 138La.However, this method is not powerful enough for seawatersamples.
The combination of the Fe(OH)3 co-precipitation + AG1X-8and the AG50W-X8 cationic exchange chromatography resultedin a 15 000- to 40 000-fold removal of Ba for CASS-5 and the GSseawater samples. Only 100 ml of CASS-5 was co-precipitatedand a one-fold overspiking was performed for this CRM to limitthe Ba blank contribution. This allowed an ID calculation for Lawith a 50% residual Ba correction.
The Nobias separation protocol achieves a 1300- to 19 000-fold drop in Ba concentration. This is insufficient for La ID as aresidual 90% isobaric interference correction on 138La remains.A severe overspiking of La would be necessary to counteract theamount of correction needed. Finally, for seawater samples, thecombination of the Nobias and cationic AG50W-X8 displayedthe most efficient Ba removal for this study with a minimum of50 000-fold drop in Ba levels.
In this study we therefore adopted both Nobias + AG50W-X8or Fe co-precipitation + AG1-X8 + AG50W-X8 protocols forseawater. For river waters we used exclusively the single passAG50W-X8protocol. Final 138Ba corrections on 138La ranged from10% to 65%. Final 136Ba corrections on 136Ce ranged from 14%to 66% and 176Hf corrections on 176Lu ranged from 2% to 5%.
3.2 Analysis performance
(a) Sensitivity, blanks. SF-ICP-MS sensitivity, detection andquantication limits, solvent concentration and chemistry
.’ refers to co-precipitation. AM3 803 and AM3 102 are seawater and river water4/10/2008 in the framework of the AMANDES project
50W-X8Cop. + AG1-X8 +AG50W-X8 Nobias
Nobias +AG50W-X8
a��nat
138Ba138Laspiked
½Ba�½La�nat
138Ba138Laspiked
½Ba�½La�nat
138Ba138Laspiked
½Ba�½La�nat
138Ba138Laspiked
— 0.06 0.9 — — — —— — — 1.8 56 0.06 1.4— 0.08 2.2 0.18 4.5 0.01 0.18
— — 0.56 26 0.005 0.1623 0.46 — — — — — —28 0.56 — — — — — —
— — — 0.77 14 0.025 0.32
J. Anal. At. Spectrom.

Table 3 REE sensitivity (Sens.), detection and quantification limits (LOD, LOQ), at instrumental (0.32M HNO3) and procedural blank levels. ‘Mcps’ stands for 106 countsper second
Sens.(Mcps per ppb) LOD (ppq) LOQ (ppq)
0.32 M HNO3
(ppq)
Chemistry blanks (pg)
AG50W-X8Cop + AG1-X8 +AG50W-X8
Nobias +AG50W-X8
Ba 4.3 30 99 1293 20 27 33La 4.7 15 50 76 2.3 5 2.9Ce 4.9 11 37 72 3.3 13 7Pr 5.3 1 5 22 0.4 0.77 0.51Nd 5.5 2 5 72 1.05 2.22 1.41Sm 5.4 3 9 86 0.31 0.42 0.36Eu 5.6 3 8 32 0.10 0.07 0.14Gd 5.8 3 9 172 0.28 0.14 0.62Tb 6.0 2 6 10 0.06 0.06 0.06Dy 6.3 1 4 37 0.36 0.35 0.39Ho 6.5 1 4 6 0.06 0.07 0.07Er 6.6 1 3 24 0.15 0.22 0.19Tm 6.6 1 4 6 0.07 0.06 0.07Yb 6.5 1 2 53 0.25 0.37 0.55Lu 6.6 1 4 12 0.05 0.05 0.08
JAAS Paper
Dow
nloa
ded
by U
nive
rsite
Pau
l Sab
atie
r on
11
Mar
ch 2
013
Publ
ishe
d on
04
Febr
uary
201
3 on
http
://pu
bs.r
sc.o
rg |
doi:1
0.10
39/C
3JA
3033
2BView Article Online
blanks are reported in Table 3. The typical sensitivity was 5million ion counts per parts-per-billion (Mcps per ppb) for Inand 8 Mcps per ppb for U. REE isotope concentrations in pro-cessed samples were adjusted to give maximum signals of 3Mcps. This assured that all isotopes were measured in ioncounting mode, and avoided potential bias from analogous toion counting mode inter-conversion (>4.5 Mcps).
River waters such as SLRS-4 and SLRS-5 in fact do not need tobe pre-concentrated to achieve sufficient sensitivity. However,for the purpose of Ba removal, river waters were processed withnal pre-concentration factors from 0.55 to 1.5. For seawatersamples, the 200-fold pre-concentration factor that is applied inour lab for REE analysis by Q-ICP-MS was reduced to factors of16 to 33 for coastal CASS-5 and 25 to 50 for open ocean BATSsamples (GD41 and GS63).
The multispike SF-ICP-MS method then permits a full REEanalysis of a 50 ml seawater sample. However as proceduralblanks are a limiting factor, by precaution samples volumeswere kept higher with 100 ml for CASS-5, 250 ml for GD41, and500 ml for GS63. Instrumental blank signals in 0.32 M HNO3
were systematically more than 3 orders of magnitude inferior tosample measurement signals. Instrumental detection limits forthe REE were in the range of 0.005 to 1 ppq. Overall REEchemistry blanks are <1 pg, except for La, Ce and Nd with the co-precipitation + AG1-X8 + AG50W-X8 and Nobias + AG50W-X8seawater protocols (<15 pg).
For 139La, chemistry blank corrections were low with 0.08%for SLRS-4 and SLRS-5, 0.29% for CASS-5, 0.4% for GD41 and0.15% for GS63. For 140Ce blanks were less than 0.12% for SLRS-4 and SLRS-5 processed with AG50W-X8 but reached up to 2%for CASS-5 samples and up to 3% for GD41 and inferior to0.8% for GS63. Relatively high blank corrections were alsoobserved for 155Gd, 169Tm and 159Tb ranging from 0.6% to 1.7%for the samples analyzed. All other isotopes analyzed had blankcorrections <0.4%.
J. Anal. At. Spectrom.
The excellent sensitivity and detection limits obtained withour protocol would allow lowering substantially the initialsample volumes. However, this clearly requires further efforts inorder to reduce chemistry blank contributions. For CASS-5,using less than 100 ml would yield signicant blank correc-tions. For the co-precipitation protocol, the chemistry blankscan potentially be reduced by lowering the amount of ironadded to the sample and for the Nobias protocol by improvingthe wash and rinse steps of the column and reducing theamount of buffer added to the sample.
(b) Oxide production. Oxide formation levels of the des-olvation–SF-ICP-MS setup were described in the Materials andmethods section. The use of the CETAC Aridus II as the intro-duction system reduces oxide formation down to values inferiorto 0.001% for BaO/Ba, 0.0035% for LaO/La and 0.002% for CeO/Ce. At these levels, the corrections induced on interferedisotopes are insignicant and comparable to instrumental0.32 M HNO3 blank signals. Maximum corrections of 1.6% and0.25% were made for 139LaO on 155Gd and 149SmO on 165Horespectively.
The previously published multispike method for REE anal-ysis in rock materials on a MC-ICP-MS required chromato-graphic separation of LREEs and HREEs in order to avoid oxideinterferences due to enriched LREE patterns in rocks and thesignicantly higher oxide production when operating the des-olvator with no additional gas.39 It appears that the use of adesolvating introduction system with additional nitrogen gas isan interesting alternative for water samples usually depletedin HREEs.
(c) Isotope dilution. Except for La and Lu, which wereoverspiked to avoid substantial isobaric interference correc-tions of 138Ba and 138Ce on 138La and 176Yb and 176Hf on 176Lu,the long-term uncertainty magnication factors of REEconcentration analysis by the multispike method, based on the19 samples presented, were close to the ideal limit.
This journal is ª The Royal Society of Chemistry 2013
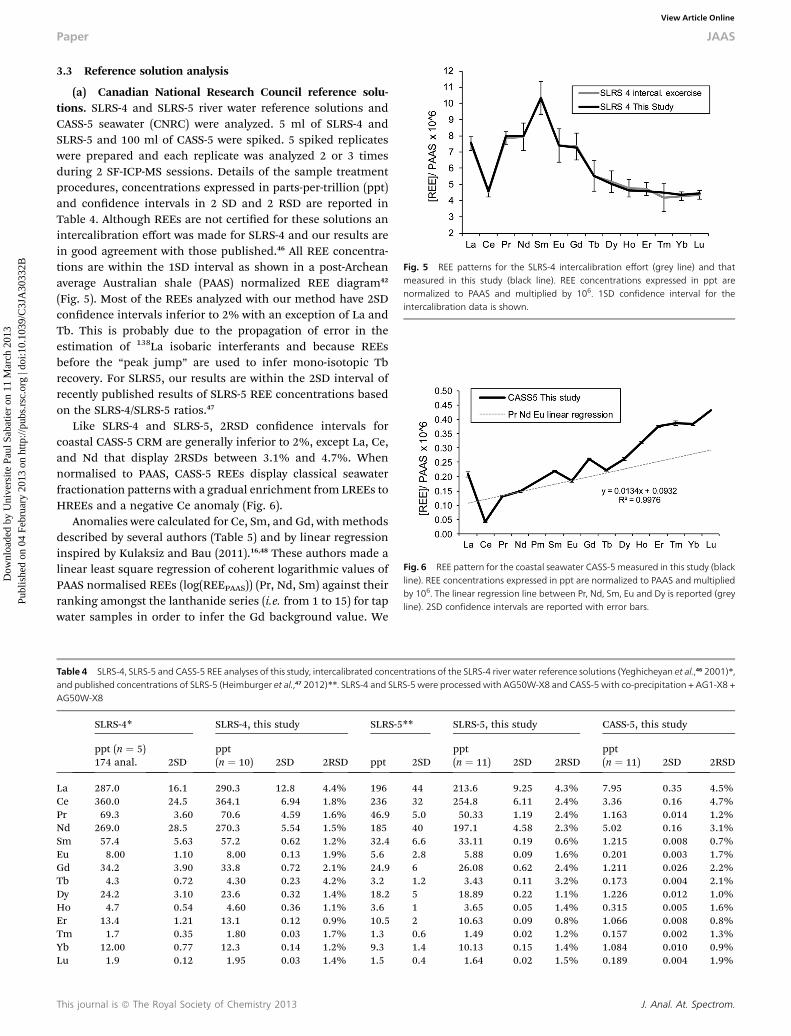
Fig. 5 REE patterns for the SLRS-4 intercalibration effort (grey line) and thatmeasured in this study (black line). REE concentrations expressed in ppt arenormalized to PAAS and multiplied by 106. 1SD confidence interval for theintercalibration data is shown.
Fig. 6 REE pattern for the coastal seawater CASS-5 measured in this study (blackline). REE concentrations expressed in ppt are normalized to PAAS and multipliedby 106. The linear regression line between Pr, Nd, Sm, Eu and Dy is reported (greyline). 2SD confidence intervals are reported with error bars.
Paper JAAS
Dow
nloa
ded
by U
nive
rsite
Pau
l Sab
atie
r on
11
Mar
ch 2
013
Publ
ishe
d on
04
Febr
uary
201
3 on
http
://pu
bs.r
sc.o
rg |
doi:1
0.10
39/C
3JA
3033
2BView Article Online
3.3 Reference solution analysis
(a) Canadian National Research Council reference solu-tions. SLRS-4 and SLRS-5 river water reference solutions andCASS-5 seawater (CNRC) were analyzed. 5 ml of SLRS-4 andSLRS-5 and 100 ml of CASS-5 were spiked. 5 spiked replicateswere prepared and each replicate was analyzed 2 or 3 timesduring 2 SF-ICP-MS sessions. Details of the sample treatmentprocedures, concentrations expressed in parts-per-trillion (ppt)and condence intervals in 2 SD and 2 RSD are reported inTable 4. Although REEs are not certied for these solutions anintercalibration effort was made for SLRS-4 and our results arein good agreement with those published.46 All REE concentra-tions are within the 1SD interval as shown in a post-Archeanaverage Australian shale (PAAS) normalized REE diagram42
(Fig. 5). Most of the REEs analyzed with our method have 2SDcondence intervals inferior to 2% with an exception of La andTb. This is probably due to the propagation of error in theestimation of 138La isobaric interferants and because REEsbefore the “peak jump” are used to infer mono-isotopic Tbrecovery. For SLRS5, our results are within the 2SD interval ofrecently published results of SLRS-5 REE concentrations basedon the SLRS-4/SLRS-5 ratios.47
Like SLRS-4 and SLRS-5, 2RSD condence intervals forcoastal CASS-5 CRM are generally inferior to 2%, except La, Ce,and Nd that display 2RSDs between 3.1% and 4.7%. Whennormalised to PAAS, CASS-5 REEs display classical seawaterfractionation patterns with a gradual enrichment from LREEs toHREEs and a negative Ce anomaly (Fig. 6).
Anomalies were calculated for Ce, Sm, and Gd, with methodsdescribed by several authors (Table 5) and by linear regressioninspired by Kulaksiz and Bau (2011).16,48 These authors made alinear least square regression of coherent logarithmic values ofPAAS normalised REEs (log(REEPAAS)) (Pr, Nd, Sm) against theirranking amongst the lanthanide series (i.e. from 1 to 15) for tapwater samples in order to infer the Gd background value. We
Table 4 SLRS-4, SLRS-5 and CASS-5 REE analyses of this study, intercalibrated concentrations of the SLRS-4 river water reference solutions (Yeghicheyan et al.,46 2001)*,and published concentrations of SLRS-5 (Heimburger et al.,47 2012)**. SLRS-4 and SLRS-5 were processed with AG50W-X8 and CASS-5 with co-precipitation + AG1-X8 +AG50W-X8
SLRS-4* SLRS-4, this study SLRS-5** SLRS-5, this study CASS-5, this study
ppt (n ¼ 5)174 anal. 2SD
ppt(n ¼ 10) 2SD 2RSD ppt 2SD
ppt(n ¼ 11) 2SD 2RSD
ppt(n ¼ 11) 2SD 2RSD
La 287.0 16.1 290.3 12.8 4.4% 196 44 213.6 9.25 4.3% 7.95 0.35 4.5%Ce 360.0 24.5 364.1 6.94 1.8% 236 32 254.8 6.11 2.4% 3.36 0.16 4.7%Pr 69.3 3.60 70.6 4.59 1.6% 46.9 5.0 50.33 1.19 2.4% 1.163 0.014 1.2%Nd 269.0 28.5 270.3 5.54 1.5% 185 40 197.1 4.58 2.3% 5.02 0.16 3.1%Sm 57.4 5.63 57.2 0.62 1.2% 32.4 6.6 33.11 0.19 0.6% 1.215 0.008 0.7%Eu 8.00 1.10 8.00 0.13 1.9% 5.6 2.8 5.88 0.09 1.6% 0.201 0.003 1.7%Gd 34.2 3.90 33.8 0.72 2.1% 24.9 6 26.08 0.62 2.4% 1.211 0.026 2.2%Tb 4.3 0.72 4.30 0.23 4.2% 3.2 1.2 3.43 0.11 3.2% 0.173 0.004 2.1%Dy 24.2 3.10 23.6 0.32 1.4% 18.2 5 18.89 0.22 1.1% 1.226 0.012 1.0%Ho 4.7 0.54 4.60 0.36 1.1% 3.6 1 3.65 0.05 1.4% 0.315 0.005 1.6%Er 13.4 1.21 13.1 0.12 0.9% 10.5 2 10.63 0.09 0.8% 1.066 0.008 0.8%Tm 1.7 0.35 1.80 0.03 1.7% 1.3 0.6 1.49 0.02 1.2% 0.157 0.002 1.3%Yb 12.00 0.77 12.3 0.14 1.2% 9.3 1.4 10.13 0.15 1.4% 1.084 0.010 0.9%Lu 1.9 0.12 1.95 0.03 1.4% 1.5 0.4 1.64 0.02 1.5% 0.189 0.004 1.9%
This journal is ª The Royal Society of Chemistry 2013 J. Anal. At. Spectrom.

Table 5 Definitions and values of REE anomalies discussed in the text for the CASS-5 coastal seawater CRM. * refers to the background value of the anomalous REEand pn refers to PASS normalised
Equation Reference Anomaly 2RSD
Cepn/Ce* ¼ Cepn/(2Prpn � Ndpn) (Bolhar et al., 2004)53 0.371 6.1%Cepn/Ce* ¼ Cepn/f(Prpn, Ndpn, Eupn) — 0.355 4.8%Smpn/Sm* ¼ 3Smpn/(Ndpn + 2Eupn) (Alibo and Nozaki, 1999)30 1.264 1.7%Smpn/Sm* ¼ Smpn/f(Prpn, Ndpn, Eupn) — 1.266 1.6%Gdpn/Gd* ¼ 2Gdpn/(Eupn + Tbpn) (De Baar et al., 1985)54 1.282 2.3%Gdpn/Gd* ¼ Gdpn/f(Prpn, Ndpn, Eupn) — 1.309 2.1%
JAAS Paper
Dow
nloa
ded
by U
nive
rsite
Pau
l Sab
atie
r on
11
Mar
ch 2
013
Publ
ishe
d on
04
Febr
uary
201
3 on
http
://pu
bs.r
sc.o
rg |
doi:1
0.10
39/C
3JA
3033
2BView Article Online
used Pr, Nd and Eu PAAS normalised concentrations for thelinear regression (without logarithm) as illustrated in Fig. 6 (Pmwas introduced in the lanthanide diagram to show the coherentPr, Nd and Eu normalised patterns as a function of theirranking).
REE anomalies were calculated for each replicate analysis inorder to be able to calculate average values and associated2RSD. All anomalies calculated by alternative equations showthe same value within the associated condence intervals.Besides the typical seawater Ce anomaly in CASS-5, three majoradditional anomalies can be observed for La, Sm and Gd. Theunusual Sm anomaly was also observed on other CNRC CRMslike SLRS-4 and SLRS-5 (this study), CASS-4 and NASS-5 and hasbeen attributed to Sm contamination during CRM prepara-tion.49–51 With the exception of Ce, the anomalies calculated forCASS-5 replicates display low uncertainties of 1.7% 2RSD (Sm)and 2.2% 2RSD (Gd). Ce anomalies present 2RSD uncertaintiesof 4.8% and 6.1% due to the higher uncertainties of La and Ceconcentrations. Nevertheless our uncertainty on the Ceanomaly is inferior to the typical 9–21% 2RSD uncertaintiescalculated for the recent GEOTRACES seawater REE inter-comparison.38
(b) BATS station GEOTRACES intercalibration. DedicatedREE samples collected during a GEOTRACES intercalibrationcruise were completely consumed aer the analysis by 9
Table 6 Intercalibrated REE concentrations of the 2000m and 15m (Van de Flierdtand GS63 samples analysed in this study (samples were treated with Nobias + AG5
BATS 2000 mintercalibration BATS 2000 m GD41, this st
ppt 2SD ppt 2SD
La 3.28 0.39 3.25 —Ce 0.72 0.328 0.72 —Pr 0.568 0.050 0.556 0.011Nd 2.49 0.18 2.53 0.02Sm 0.519 0.051 0.505 0.005Eu 0.138 0.015 0.131 0.003Gd 0.761 0.083 0.757 0.013Tb 0.125 0.012 0.116 0.002Dy 0.943 0.062 0.916 0.004Ho 0.251 0.015 0.237 0.003Er 0.843 0.042 0.814 0.005Tm 0.126 0.008 0.119 0.001Yb 0.824 0.043 0.814 0.018Lu 0.141 0.007 0.141 0.004
J. Anal. At. Spectrom.
laboratories.38,52 K. Bruland kindly provided us with closelyrelated samples from the same station and depths, yetpreserved for other trace metal intercalibration efforts. Wereceived 500 ml aliquots of ltered (0.2 mm) acidied seawaterstored in HDPE bottles.
For the GD41 BATS 2000 m deep water sample two 250 mlsub-aliquots were made and spiked independently. For theGS63 BATS 15 m surface water sample 500 ml was spiked. In aninitial attempt, the samples were passed through the Nobiascolumn and analysed twice to determine all REE concentrationsexcept La and Ce which had >90% interferences from Baisotopes. To lower Ba interferences, the remaining sample waspassed through the AG50W-X8 column, allowing more accurateand precise La and Ce concentration determination in a thirdanalysis session.
Table 6 reports REE concentrations published by the GEO-TRACES intercalibration effort and GD41 and GS63 REEconcentrations determined in this study. Concentrations areexpressed in ppt, condence intervals in 2SD and 2 RSD%. Forboth GD41 and GS63 all REEs are within the 2SD condenceinterval established during the intercalibration exercise (Fig. 7aand b). The BATS surface and deep samples reveal numeroussubtle REE features: Ce anomalies calculated according toBolhar et al. (2004)53 increase from 0.177 at 15 m to 0.518at 2000 m depth. Well-developed Gd anomalies for Atlantic
et al., 2012) waters fromNorth East Atlantic BATS station, and corresponding GD410W-X8)
udyBATS 15 mintercalibration
BATS 15 m GS63,this study
2RSD ppt 2SD ppt
— 2.05 0.31 2.16— 1.68 0.38 1.642.4% 0.439 0.052 0.4390.7% 2.04 0.19 2.001.1% 0.482 0.054 0.4642.0% 0.135 0.016 0.1301.8% 0.760 0.086 0.7591.4% 0.126 0.013 0.1220.4% 0.959 0.085 0.9480.8% 0.245 0.022 0.2430.8% 0.803 0.071 0.8080.8% 0.118 0.011 0.1132.2% 0.719 0.089 0.7342.3% 0.117 0.016 0.122
This journal is ª The Royal Society of Chemistry 2013

Fig. 7 REE patterns for the intercalibrated BATS station at depths (a) 15 m and (b) 2000 m (Van de Flierdt et al., 2012)38 (grey lines) and the corresponding (a) GD41and (b) GS63 samples (black lines, this study). REE concentrations expressed in ppt are normalized to PAAS and multiplied by 106. 2SD confidence intervals for theintercalibration data are shown.
Paper JAAS
Dow
nloa
ded
by U
nive
rsite
Pau
l Sab
atie
r on
11
Mar
ch 2
013
Publ
ishe
d on
04
Febr
uary
201
3 on
http
://pu
bs.r
sc.o
rg |
doi:1
0.10
39/C
3JA
3033
2BView Article Online
samples are present, and are constant at both depths, inagreement with observations in the literature.11,14,38 HREEs Yband Lu are signicantly fractionated between both depths.Finally, La also appears fractionated between both depths withLapn/Cepn ratios of 1.14 on the surface and 1.35 at 2000 m. All ofthese features reect the interplay between input sources andelemental fractionation processes related to REE speciation.
4 Conclusions
Based on existing methodologies and technologies we havedeveloped a high precision method for the analysis of REEs infresh and marine waters. The method is based on multipleisotope dilution of 10 out of 14 stable REEs, followed by pre-concentration and matrix removal using Fe co-precipitationand/or ion chromatography. By using a desolvation introduc-tion system to a sector eld ICP-MS, we achieve maximumsensitivity and minimize polyatomic oxide interferences of Baand LREEs on HREEs. With oxide formation below 0.035%(LaO+/La+), polyatomic oxide interference corrections are below2% for all REEs. The long term analytical reproducibility is <2%(2RSD) on all REEs, except La (4.5%) and Ce (4.7%), which arelimited by blank and interference corrections. Mono-isotopicREEs are also reproducible to better than 4.2% (2RSD) usingspiked REEs as internal standards. These results are superior tomost ICP-MS based REE analysis methods for natural waters.38
While the separation chemistry protocols and data treatmentare not trivial, the method does present an interestingcompromise to gather high precision REE data on largenumbers of aqueous samples with a moderate time investment.Two chemistry protocols were tested for seawater samples. Theprotocol including the new Nobias resin allows a better Baremoval and a faster sample preparation compared to thetraditional Fe(OH)3 co-precipitation. By using two mixed LREEand HREE spike solutions the method provides the exibility tocover a range of REE proles, i.e. LREE or HREE enriched, orconcave or convex MREE enriched. Further improvements arepossible for Ce by improving blanks, and the use of a differentenriched Ce isotope spike as 136Ce used in this study is heavilyinterfered by 136Ba and 136Xe. We anticipate that the strong gainin precision on REE patterns and anomalies will stimulate
This journal is ª The Royal Society of Chemistry 2013
experimental and natural observations on the REE aqueousgeochemistry.
Acknowledgements
We would like to thank the following agencies and colleagues:The French CNRS and Brazilian CNPq for funding the 1st
author's PhD scholarship. Research grant ANR-05-BLAN-0179from the French ANR. FEDER, CNRS-INSU, IRD and OMP forfunding the OMP mass spectrometry facilities. C. Pradoux, E.Garcia, J. Riotte, M. Benoit, D. Yeghicheyan, L. Laffont, and P.Brunet for valuable discussions. K Bruland for providing GEO-TRACES BATS inter-calibration samples. Hitachi for providingthe Nobias resin. The two anonymous reviewers and editor arethanked for their constructive comments.
Notes and references
1 G. N. Hanson, Annu. Rev. Earth Planet Sci., 1980, 8, 371–406.2 R. A. Stern and G. N. Hanson, J. Petrol., 1991, 32, 201–238.3 S. M. Lev, S. M. McLennan and G. N. Hanson, J. Sediment.Res., 1999, 69, 1071–1082.
4 P. Henderson, Rare earth element geochemistry, Elsevier,Amsterdam, New York, 1984, p. 510.
5 K. Tachikawa, C. Handel and B. Dupre, Deep Sea Res.Oceanogr. Res. Paper, 1997, 44, 1769–1792.
6 M. Bau, P. Moller and P. Dulski, Mar. Chem., 1997, 56, 123–131.
7 E. Sholkovitz and R. Szymczak, Earth Planet. Sci. Lett., 2000,179, 299–309.
8 D. J. Piepgras and S. B. Jacobsen, Geochim. Cosmochim. Acta,1992, 56, 1851–1862.
9 H. Eldereld, R. Upstill-Goddard and E. R. Sholkovitz,Geochim. Cosmochim. Acta, 1990, 54, 971–991.
10 K. H. Johannesson, K. J. Stetzenbach and V. F. Hodge,Geochim. Cosmochim. Acta, 1997, 61, 3605–3618.
11 F. Lacan and C. Jeandel, Geochem., Geophys., Geosyst., 2004,5(11), DOI: 10.1029/2004gc000742.
12 R. E. Hannigan and E. R. Sholkovitz, Chem. Geol., 2001, 175,495–508.
13 A. Masuda and Y. Ikeuchi, Geochem. J., 1979, 13, 19–22.
J. Anal. At. Spectrom.

JAAS Paper
Dow
nloa
ded
by U
nive
rsite
Pau
l Sab
atie
r on
11
Mar
ch 2
013
Publ
ishe
d on
04
Febr
uary
201
3 on
http
://pu
bs.r
sc.o
rg |
doi:1
0.10
39/C
3JA
3033
2BView Article Online
14 H. J. W. De Baar, P. G. Brewer and M. P. Bacon, Geochim.Cosmochim. Acta, 1985, 49, 1961–1969.
15 S. Kulaksiz and M. Bau, Environ. Int., 2011, 37, 973–979.16 S. Kulaksiz andM. Bau, Appl. Geochem., 2011, 26, 1877–1885.17 S. M. McLennan, Geochim. Cosmochim. Acta, 1994, 58, 2025–
2033.18 M. F. Thirlwall, Chem. Geol., 1982, 35, 155–166.19 J. G. Crock, F. E. Lichte and T. R. Wildeman, Chem. Geol.,
1984, 45, 149–163.20 P. J. Hooker, R. K. O'Nions and R. J. Pankhurst, Chem. Geol.,
1975, 16, 189–196.21 B.-M. Jahn, B. Auvray, S. Blais, R. Capdevila, J. Cornichet,
F. Vidal and J. Hameurt, J. Petrol., 1980, 201–244.22 J. J. Braun, J. Viers, B. Dupre, M. Polve, J. Ndam and
J. P. Muller, Geochim. Cosmochim. Acta, 1998, 62, 273–299.23 K. H. Johannesson, I. M. Farnham, C. X. Guo and
K. J. Stetzenbach, Geochim. Cosmochim. Acta, 1999, 63,2697–2708.
24 C. H. Gammons, S. A. Wood and D. A. Nimick, Geochim.Cosmochim. Acta, 2005, 69, 3747–3758.
25 J. Ingri, A. Widerlund, M. Land, O. Gustafsson, P. Anderssonand B. Ohlander, Chem. Geol., 2000, 166, 23–45.
26 C. H. Chung, I. Brenner and C. F. You, Spectrochim. Acta, PartB, 2009, 64, 849–856.
27 M. G. Lawrence, A. Greig, K. D. Collerson and B. S. Kamber,Appl. Geochem., 2006, 21, 839–848.
28 S. J. Goldstein and S. B. Jacobsen, Earth Planet. Sci. Lett.,1988, 89, 35–47.
29 F. Lacan and C. Jeandel, Earth Planet. Sci. Lett., 2001, 186,497–512.
30 D. S. Alibo and Y. Nozaki, Geochim. Cosmochim. Acta, 1999,63, 363–372.
31 M. B. Shabani, T. Akagi and A. Masuda, Anal. Chem., 1992,64, 737–743.
32 P. O. Persson, P. S. Andersson, J. Zhang and D. Porcelli, Anal.Chem., 2011, 83, 1336–1341.
33 H. Takata, K. Tagami, T. Aono and S. Uchlida, At. Spectrosc.,2009, 30, 10–19.
34 Y. Zhu, T. Umemura, H. Haraguchi, K. Inagaki and K. Chiba,Talanta, 2009, 891–895.
35 G. Bayon, D. Birot, C. Bollinger and J. A. Barrat, Geostand.Geoanal. Res., 2010, 35, 145–153.
36 J. Zhang and Y. Nozaki, Geochim. Cosmochim. Acta, 1996, 60,4631–4644.
37 M. P. Field and R. M. Sherrell, Anal. Chem., 1998, 70, 4480–4486.
J. Anal. At. Spectrom.
38 T. Van de Flierdt, K. Pahnke, H. Amakawa, P. Andersson,C. Basak, B. Coles, C. Colin, K. Crocket, M. Frank,N. Frank, S. L. Goldstein, V. Goswami, B. A. Haley,E. C. Hathorne, S. R. Hemming, G. M. Henderson,C. Jeandel, K. Jones, K. Kreissig, F. Lacan, M. Lambelet,E. E. Martin, D. R. Newkirk, H. Obata, L. Pena,A. M. Piotrowski, C. Pradoux, H. D. Scher, H. Schoberg,S. K. Singh, T. Stichel, H. Tazoe, D. Vance, J. J. Yang andG. I. Partici, Limnol. Oceanogr.: Methods, 2012, 10, 234–251.
39 J. Baker, T. Waight and D. Uleck, Geochim. Cosmochim.Acta, 2002, 66, 3635–3646.
40 M. Willbold, K. Jochum, I. Raczek, M. Amini, B. Stoll andA. Hofmann, Anal. Bioanal. Chem., 2003, 377, 117–125.
41 M. Willbold and K. P. Jochum, Geostand. Geoanal. Res., 2005,29, 63–82.
42 S. McLennan, Rev. Mineral. Geochem., 1989, 169–200.43 G. C. Martin, J. Inorg. Nucl. Chem., 1964, 26, 1621–1623.44 D. V. Biller and K. W. Bruland, Mar. Chem., 2012, 130,
12–20.45 Y. Sohrin, S. Urushihara, S. Nakatsuka, T. Kono, E. Higo,
T. Minami, K. Norisuye and S. Umetani, Anal. Chem., 2008,6267–6273.
46 D. Yeghicheyan, J. Carignan, M. Valladon, M. B. Le Coz, F. LeCornec, M. Castrec-Rouelle, M. Robert, L. Aquilina, E. Aubry,C. Churlaud, A. Dia, S. Deberdt, B. Dupr, R. Freydier,G. Gruau, O. Henin, A. M. de Kersabiec, J. Mace, L. Marin,N. Morin, P. Petitjean and E. Serrat, Geostand. Newsl.,2001, 25, 465–474.
47 A. Heimburger, M. Tharaud, F. Monna, R. Losno,K. Desboeufs and E. B. Nguyen, Geostand. Geoanal. Res.,2012, DOI: 10.1111/j.1751-908X.2012.00185.x.
48 S. Kulaksız and M. Bau, Environ. Int., 2011, 37, 973–979.49 S. N. Willie and R. E. Sturgeon, Spectrochim. Acta, Part B,
2001, 56, 1707–1716.50 N. Freslon, G. Bayon, D. Birot, C. Bollinger and J. A. Barrat,
Talanta, 2011, 85, 582–587.51 M. G. Lawrence and B. S. Kamber, Geostand. Geoanal. Res.,
2007, 31, 95–103.52 K. Pahnke, T. van de Flierdt, K. M. Jones, M. Lambelet,
S. R. Hemming and S. L. Goldstein, Limnol. Oceanogr.:Methods, 2012, 10, 252–269.
53 R. Bolhar, B. S. Kamber, S. Moorbath, C. M. Fedo andM. J. Whitehouse, Earth Planet. Sci. Lett., 2004, 222, 43–60.
54 H. J. W. De Baar, M. P. Bacon, P. G. Brewer andK. W. Bruland, Geochim. Cosmochim. Acta, 1985, 49, 1943–1959.
This journal is ª The Royal Society of Chemistry 2013