Analytical Technique for the Determination of Hoop Stress and ...
Upload
khangminh22Category
view
4download
0
RAPID ANALYTICAL METHODS FOR THE DETERMINATION OF FAT AND MOISTURE CONTENT OF
GROUND MEATS
D.V.S., Makerere University College, Kampala, Uganda, 1963. B.V.Sc., University of East Africa, Nairobi, Kenya, 1964.
submitted in partial fulfillment of the
requirements for the degree
MASTER OF SCIENCE
Department of Animal Husbandry
KANSAS STATE UNIVERSITY Manhattan, Kansas
NASANI ERI MASABA
A MASTER'S THESIS
1968
Approved by
by
TABLE OF CONTENTS
INTRODUCTION 1
REVIEW OF LITERATURE 2
Methods for Determination of Moisture Content ... 3
Thermal Dehydration 3
The Karl Fischer Reagent Titration 11
Electrical and Other Methods 12
Methods of Fats 16
Ether Extract 16
Babcock Method 20
Steinlite Electronic Fat Tester 21
Miscellaneous and Simultaneous Procedures 24
Sampling 25
Rapid Methods 26
METHODS AND PROCEDURES 28
Preparation of Samples 28
Moisture Content Determinations 29
Fat Content Determinations 30
Modified Babcock Method (.Whalen Modification) ... 31
Statistical Analysis 31
RESULTS AND DISCUSSION 32
Critique of Fat Analysis Methods 55
SUMMARY AND CONCLUSION 59
APPENDIX 63
ACKNOWLEDGEMENTS 74
LITERATURE CITED 75
i i

INTRODUCTION
The determination of the Moisture and Fat Content of ground meat and meat products has utmost importance to the meat packing industry and the consumer, who is often represented by the Governmental Regulatory Agencies. Moisture, protein, and fat are important components of meat, fat and moisture being relatively less expensive components. Certain fat and moisture levels are desirable in ground meats and prepared meat products. Water is usually added as ice to facilitate grinding and to reduce temperature. It is also added to processed meats and meat products to impart the desired consistency and texture, to dissolve curing ingredients, and to minimize shrinkage in cooked and smoked meat items.
Although the consumer wants his ground meat palatable, it should not be unduly wasteful. The meat packing industry operates at an extremely small margin of profit, and is often forced to add more fat and water as they are less expensive than muscle. The Government, representing the consumer, imposes legal limitations to protect consumer interests. Some meat packing houses, however, practice accurate and economical product formulation resulting in a uniform reliable product for the consumer with maximum profit and quality. The Meat Industry cannot afford losses entailed by substandard or extra-legal batches of product which can be avoided by careful quality control.

2
To control product composition, the composition of the raw materials used must be known with reasonable accuracy early enough in production to permit adjustments. Formulations developed by assuming an average level for a specific raw material often differ widely from specifications.
Existing official Methods of Analysis for Fat and Moisture content in Meats are not suitable for active quality control by the Meat Packers and for preventative action by Government Inspectors with one main disadvantage being the long time interval before results are known. The importance of the problem has led to development of many rapid methods for fat and moisture analysis.
The work reported in this thesis was undertaken to: 1. Compare the official methods as specified by the Association of Official Analytical Chemists, formerly Association of Agricultural Chemists, hereafter designated as the A.O.A.C. method; Steinlite Electronic Fat Tester; two modified Babcock Methods of fat analysis on ground meat samples of three fat levels and on pork sausage samples.
2. Compare the A.O.A.C. and Moisture Determination balance methods of moisture determination on ground meat samples of three moisture levels and on pork sausage.
3. Determine the effect of salt on Steinlite Electronic Fat Tester results.

3
REVIEW OF LITERATURE
Methods for Determination of Moisture Content The determination of water is one of the most common
methods of analysis. Water is present in organic products as a combined constituent, as a contaminant, or as a diluent or "added" water [Willits (1951), Wierbicki et al. (1958)] , and many materials pick up water from the air. Moisture may influence the activity of some ingredients and many compounds, other than meat, are sold on a "dry" basis. Hence the determina-tion of water or moisture content is necessary and must precede other determinations on a sample (Stillman, 1950).
The most common methods for determining water or moisture can be classified into the following groups; namely oven drying, distillation, titration, electrical measurement of water vapor with hygroscopic film, and others.
Thermal Dehydration Oven drying or thermal drying is the simplest and
probably the oldest method of moisture analysis. Even today, a common concept of moisture analysis is that implied by an old 1885 procedure of the A.O.A.C, which specified moisture as the loss in weight occurring when a substance was heated at 98°C to 100°C (Willits, 1951). This is the most time consuming method and yet forms the standard for most other moisture methods. The expected changes during the heating of a moist organic substance are volatilization of water as moisture, volatilization of other absorbed material, and volatilization of the gaseous products

4
formed by non-reversible decomposition reactions which go on at
all temperatures at varying rates.
Nelson and Hulett (.1920) found that when an organic
substance was heated at constant temperature, the amount of
water liberated from that existing as an external phase,was
dependent upon temperature and its rate of moisture removal,
which is rapid at first,but in time ceases. Their isotherms
indicated that some water remained after successively increased
temperature probably due to successive thinner layers of water
or some other physical phenomenon. Porter and Willis (.1944)
using potato starch, obtained similar drying isotherms and
estimated the end value of drying and the beginning of weight
loss due to the decomposition of the sample. Further studies
by Sair and Fetzer (1944) and Makower et al. (1946) showed
that values of "true moisture" could be reproducible by estab-
lishing conditions of time and temperature which did not
denature the sample.
During oven drying, the moisture of interest is that
occurring principally as an external phase and that occurring
as one or more molecular layers plus liquid water Willits, 1951).
Ideal conditions for thermal drying as stated by Willits were:
1. Using diminished pressure to minimize time of
diffusion of deep-seated moisture.
2. Using dessicated air to sweep out water vapor
from drying chamber.
3. Heating the sample at temperature lower than
that at which the rate of decomposition becomes appreciable.

5
Some of the sources of error in thermal drying were
reviewed by Reith et al. (1948) as stated by Willits (.1951).
1. Nonwater components. In thermal drying, errors
will be introduced if the material being dried contains any
substances in addition to water which have an appreciable vapor
pressure under the conditions of the drying causing an additional
loss in weight of the sample resulting in "high moisture" values.
2. Chemically bonded water. Small quantities of
water may be lost through chemical reaction induced by heat as
in the case of dextrin formation, inversion of disaccharides,
or hydrolysis of proteins.
3. Nonwater Solvents. Often in the case of
preparative organic substances which have been crystallized
from such solvents as acetone or alcohol, moisture values are
too low as indicated by elemental analyses. The "incomplete
drying" is due to substances held throughout the thermal process.
4. Autoxidation. Chemical changes cause an apparent
low moisture due to increased weight of sample by autoxidation,
especially in fats and oils.
5. Decomposition. This occurs when the temperature
of drying is sufficient to cause thermal decomposition of the
substance and the products of this decomposition are volatile
resulting in "high moisture" values.
Willits (1951) pointed out additional sources of error: 1. Slowness in establishing equilibrium between
the vapor pressure of the water of the solid and that of the
atmosphere may cause a slow rate of volatilization of the water

6
resulting in incomplete drying, as in the case of lactose hydrate or starch.
2. Crust formation. The formation of a water impervious crust causes a nearly complete stoppage of evaporation of the remaining moisture.
3. The physical structure of plant or animal tissue. Both types of tissue often contain as high as 60 to 90% moisture. The removal of moisture from the cells, vacuoles, and tubes of these tissues presents separate problems. Cell moisture must diffuse through the cell wall before it can be volatilized. The moisture must leave the surface of the cells by diffusion and this can be slow in thick materials. Furthermore, as the cells lose water and the cell fluid becomes more concentrated, there is a lowering of the vapor pressure of the residual water. To drive the last traces of moisture out of the cells at a reasonable rate, the temperature must be increased, and this often makes the cells less permeable to water and also tends to seal the tubes in the tissue making diffusion of deep seated water vapor very slow.
4. Sampling is a common source of error in moisture analyses, particularly for substances with high moisture content. These samples usually have water vapor pressures much higher than the ambient air and therefore undergo rapid changes. A material having a water content of 90% or more with an error of sampling, which accounts for only a one per cent error in moisture, can cause a 10% error in the non-volatile constituents reported on a moisture-free basis.

7
Willits suggested that most of these errors can readily
be avoided, with the possible exception of those caused by
non water volatile constituents. Three methods that tend to
minimize errors due to non water volatile constituents are
collection of the volatilized water, using an absorbent specific
to water, and the indirect methods of Makower and Porter (1946).
Loss of water through chemical reaction can best be
prevented by drying the sample at low temperatures until the
bulk of the water has been removed and the possibility of the
reaction reduced to a minimum. The substance can then be dried
at the desired elevated temperature.
To prevent errors from substances previously treated
with such solvents as alcohol or acetone, the best remedy is
to humidify the sample,in which process the solvent is replaced
by water and then this is removed by the accepted thermal method.
To limit errors from oxidative changes, an inert gas
(oxygen free) such as nitrogen or carbon dioxide is used in
the thermal drying chamber.
For substances that undergo thermal decomposition, it
is possible to determine the critical temperature at which
decomposition occurs and to use temperatures in a range below
this value for thermal drying.
Where there is slowness in establishing equilibria
between the vapor pressure of the water of the solid and that
of the atmosphere, this error can be avoided by drying for a
longer time, using a higher drying temperature, or both.
8
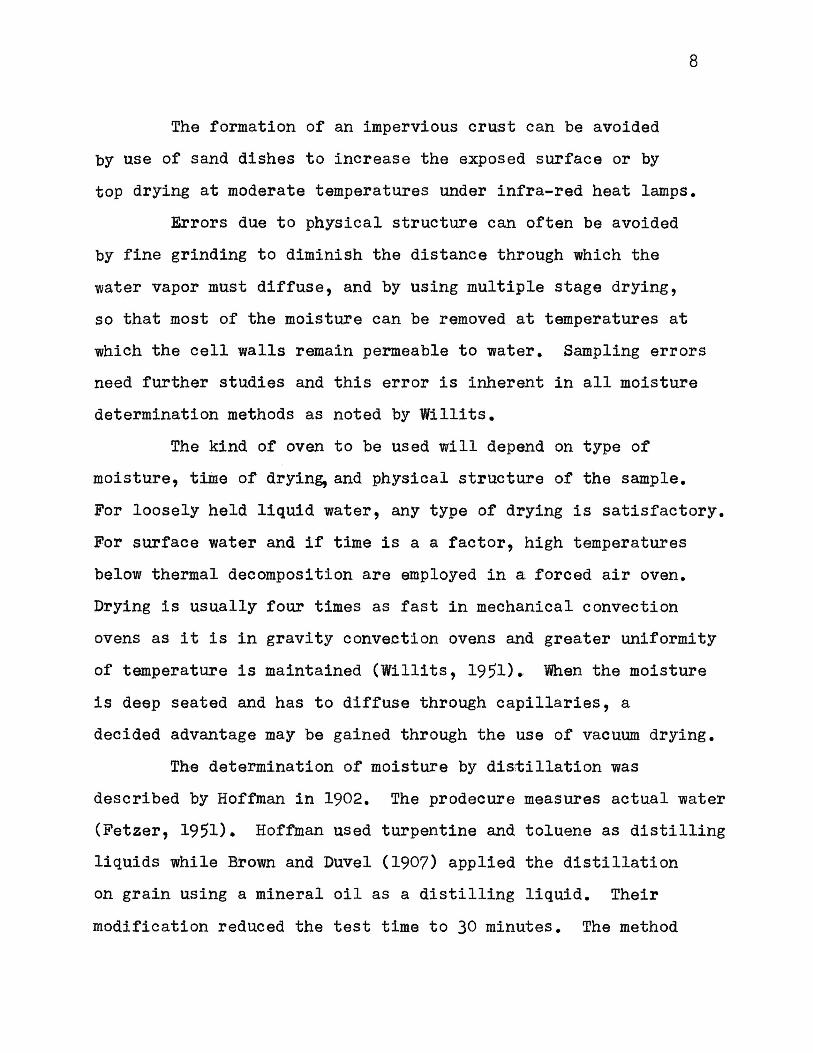
The formation of an impervious crust can be avoided
by use of sand dishes to increase the exposed surface or by
top drying at moderate temperatures under infra-red heat lamps.
Errors due to physical structure can often be avoided
by fine grinding to diminish the distance through which the
water vapor must diffuse, and by using multiple stage drying,
so that most of the moisture can be removed at temperatures at
which the cell walls remain permeable to water. Sampling errors
need further studies and this error is inherent in all moisture
determination methods as noted by Willits.
The kind of oven to be used will depend on type of
moisture, time of drying, and physical structure of the sample.
For loosely held liquid water, any type of drying is satisfactory.
For surface water and if time is a a factor, high temperatures
below thermal decomposition are employed in a forced air oven.
Drying is usually four times as fast in mechanical convection
ovens as it is in gravity convection ovens and greater uniformity
of temperature is maintained (Willits, 1951). When the moisture
is deep seated and has to diffuse through capillaries, a
decided advantage may be gained through the use of vacuum drying.
The determination of moisture by distillation was
described by Hoffman in 1902. The procedure measures actual water
(Fetzer, 1951). Hoffman used turpentine and toluene as distilling
liquids while Brown and Duvel (1907) applied the distillation
on grain using a mineral oil as a distilling liquid. Their
modification reduced the test time to 30 minutes. The method
9
was applied on fats, oils and soaps using xylene or benzene (Marcusson, 1905). Schwalbe (1908) advanced the views of high boiling point distilling liquid on dense materials. The devel-opment of the Dean and Stark (1920) "distilling receiver tubes" permitted use of low boiling point liquids with continuous refluxing and a separation of water. The Bidwell and Sterling (1925) "traps" improved the design for precise work. Norman (1925) and Xamada (1927) drew attention to "still heads" and built-in reflux condensers. Dedlow and Smith (1926) found that xylene distillation caused decomposition when applied to meat extracts and modified the method by conducting the distillation with xylene under a vacuum. Rice (1929) introduced the use of the filter eel in distillation flask and this useful technique was further developed by Fetzer et al. (1935) to apply to viscous materials. Trusler (1940) reported the use of benzene, toluene, and xylene in determination of moisture in soaps. Comprehensive research was reported by Evans and Fetzer (1941) and Cleland and Fetzer (1941) on the moisture determination in sugar products, which often causes trouble in oven drying.
The Sair-Fetzer method of distillation which gave "true moisture" (1942) is the official method for moisture in cereals. Use of carbon tetrachloride as distilling liquid was reported by Alexander (1936) and Marcusson (1948). Rogers et al. (1910) made contributions to the technique of using a volatile liquid heavier than water.

10
The apparatus in use today vary in design, particularly
the design of the moisture receivers or "traps." The designs
have been so widely accepted that they bear the inventor's
name. For distilling liquids lighter than water the moisture
receivers are:
1. Brown-Duvel: No provision for refluxing
2. Dean-Stark: (for multiple distillation and has
"trap" which is removed and weighed)
3. Bidwell-Sterling: has a better "trap" allowing a
slow return of the distilled liquid
4. Cleland and Fetzer: increased capacity of the "trap"
For heavier liquids, three traps are listed:
1. Hercules Trap
2. Bailey Trap
3. Langeland - Pratt Trap
For distilling oils, the moisture receiver is a ASTM (American
Society Testing Materials) Clevenger Trap.
To analyze a sample by this method, the choice of the
distilling liquid or boiling point is important. Toluene
(b. pt. 110° to 112°C) is high enough for most materials
(Willits, 1951). If the material is heat sensitive, benzene
or mixtures of benzene and toluene should be used (Willits, 1951).
A blank determination must be run on the distilling liquid and
the sample size should be chosen so that the amount of collected water falls within 3.5 to 5.0 ml. range, thus approaching the
maximum holding capacity of the trap and resulting in greater
precision.

ll
The Karl Fischer Reagent Titration The Karl Fischer Reagent Titration method is the most
widely used chemical method for determining moisture in many
more types of materials than any other method. It was first
described in 1935 by Karl Fischer. Either a visual or an elect-
rometric end point may be employed. The former requires only
simple apparatus, namely a buret and a long necked flask and is
sensitive to less than 0.5 mg of water. The electrometric
method requires a desiccant protected-closed system and is
sensitive to about 0.2 mg of water(Mitchell, 1951). The
"dead stop" end point employing a direct titration procedure
appears to be the most convenient electrometric technique
(Carter and Williamson, 1945). Fischer reagent consists of
iodine, sulfur dioxide, pyridine and methanol. The overall
process involves the two step reaction as stated by Smith
et al. (1939):
C5H5N.12+C 5H 5N . S02+C 5H 5N . S02+C 5H 5N+H 20 2C5H5N. HI *C5H5N. S03 U )
and
C5H5N. SO3+CH3OH—>C5tt5N. SO3
Numerous variations have been proposed and bromine has
sometimes been used in place of iodine(McComan et al., 1949)
(Johansson, 1947). Organic substances which interfere in the
direct titration for water include carbony1 compounds, mercaptans,
diacyl peroxides, thioacids and hydrazines. There are methods
to eliminate these interferences(Mitchell, 1940). Inorganic
compounds which interfere include metal oxides, hydroxides,
carbonates, bicarbonates, chromates, dichromates, borates and
12
sulfides. Often the interfering reactions are quantitative.
Several methods based on prior distillation or extractions
with water have been proposed and are becoming increasingly
important. Reliable methods have been devised for the deter-
mination of water in petroleum products, oils, fats, and
foodstuffs like soybean (McComb, 1960). In most cases, the
Fischer reagent results were higher than the accepted pro-
cedures. Possibly this titration includes water of hydration
(Schroeder and Nair, 1948). Experiments to date indicate that
the method can result in a time-saving and reliable procedure
in all studies involving the determination of water.
Electrical and Other Methods
Electrical methods have been tried. Microwaves are
electromagnetic radiations which interact with materials such
as water to sense the moisture content of the product directly,
instantly and continuously during production. No sampling is
necessary and the test sample is not lost. An accuracy of
* 0.2% moisture is claimed and can gauge moisture levels from
1% to 99% (Microwave Instruments Co., 1966). Dunmore hygrometers have been tried on solid foods.
Cryoscopy is widely used in the dairy industry to
determine added water by observing a change of the freezing
point (Standard Methods, A.P.H.A. 1960). Nuclear Magnetic Resonance Spectrometers are being
developed and have proven successful on static methods of meat

13
processing (King, 1966). The Varian PA-7 Process Analyzer is one of the commercial Nuclear Magnetic Resonance analyzers on the market. The manufacturers have claimed that the instrument has been used with success to determine moisture in wheat, sugar, corn, wool, soap, etc., and that it was highly sensitive, and that it could take single measurements in thirty seconds with 1% measurement accuracy. It was also claimed that it was non-destructive to the sample and that the results could be read out directly in % by weight (Varian Associates, 1966). There isn't enough evidence yet to support this claim for meat. Lustig (1966) has recently reviewed literature on Nuclear Magnetic Resonance (NMR) spectrometry, and NMR analysis of meat composition was dis-cussed by King (1966). He stated that the new technique of high Nuclear Magnetic Resolution had the ability to detect and separately indicate the amount of fat and water in mixtures. Again, not enough data has been available to support this technique but he explained that although the initial investment would be large, its advantages and low cost in time were enough cause for considering it. Recent developments, he reported, largely overcame the disadvantages of limited sample size and instability in previous instrumentation. The technique was suitable for static laboratory measurements, and that it was being adapted to continuous, accurate flow stream measurements of fat and water content for continuously indicating and recording both the amount of fat and water in meat products on a production line. The basis for the operation as outlined by King (1966) was the phenomenon of Nuclear Magnetic Resonance wherein

14
the nucleus of the atom in a static magnetic field strongly interacted with an applied radio frequency electromagnetic field only at a particular (resonant) frequency. Instrumentation designed to detect the interaction could indicate not only the presence of nuclei of a given atomic specie but also the quantity of the nuclei in a defined region. For a constant magnetic field, the nuclei of different elements resonate at different frequencies, and conversely, for an electromagnetic field of constant frequency the magnitude of static magnetic field required to produce the strong interaction was different for the nuclei of each element. Thus, the presence of different elements in a sample could be selectively detected (King, 1966). King further explained that with high resolution NMR techniques, the analysis of the structure of the molecules allowed the selective detection ("chemical shift") of the concentration of different compounds in a sample that contained the same type of nuclei, and cited the hydrogen nucleus (proton) as an example of the proton which could be separately detected in both water and fats.
Steinlite Electronic Moisture Tester Model 300 LSC is claimed to be the most economical, dependable and simplest elec-tronic equipment. A wide range of materials can be tested in less than a minute and 300 tests can be performed on a single Steinlite in a day. The sample is not denatured and the instru-ment consumes no more electricity than a 30-watt light bulb.
Moisture determination balances are marketed under various trade names. They operate on the principle of thermal drying effected by an infra-red lamp held over the sample in a pan.

15
For the most efficient operation, it is necessary to know the characteristic of the most frequently used materials and prepare the drying curves of the specific material.
To prepare a drying curve (or isotherm), a 10 gram sample is weighed on the moisture determination balance itself and the percent moisture loss is recorded at one minute intervals. When the percent moisture loss values are plotted against time, the length of time required for complete drying is determined by the plateau of the curve. Several drying curves should be run at several heater settings and for the most efficient opera-tion, a heater setting just low enough to prevent scorching, and a timer setting just at the point where the drying curve reaches its highest plateau should be used.
Percent Moisture loss is based on the following equation: Moisture Loss - Wet Sample Weight - Dry Sample Weight
Wet Sample Weight Percent Moisture Loss = "Wet Sample Weight - Dry Sample Weight x 100
Wet Sample Weight The accuracy of the final percent moisture value is dependent upon the accuracy with which the initial 10 gram sample is weighed.
Accuracies of within i % have been claimed and the results compared closely with the official oven drying methods.
The inherent error in this method is that complete drying cannot be effected in equilibrium with water vapor in the atmosphere. The spattering of the fats limits the amount of

16
heat which can apply so that a meat sample cannot be dried
any faster without inaccuracies.
Everson et al. (.1955) investigated the possibility of
combining the principles of two methods into one method for
both.
A distillation method employing an azeotropic mixture
with capryl alcohol was applied to meat samples and the moisture
in the sample distilled, collected and measured volumetrically.
A 15. gram meat sample was used and results were obtained in
ten to fifteen minutes. The percentage of moisture was
calculated as follows:
Moisture % = Volume of Water Collected x 100
15
The electrical capacitance of the residual alcohol-fat solution
was measured in the Steinlite Electronic Fat Tester and the fat
content read from a previously prepared chart converting capacit-
ance readings to fat content. A solvent mixture of capryl
alcohol (2-Octanol) and Octyl alcohol ll-Octanol) was used.
The results of the combined methods were reproducible and
compared favorably with official methods. The total procedure
required 20 to 30 minutes. The limiting factors were the great
effect of temperature of mixture and the fact that addition of
one drop of water to the solvent would cause 1% error.
Methods for Fat
Ether Extract
The determination of the fat content in meats by ether
extraction was first recorded by the Association of Official

17
Agricultural Chemists (1901); where the meat sample was first digested with pepsin, treated with alcohol to remove water, and then with ether in a continuous extractor. Wiley (1907) stated that some fats have substances insoluble in ether and Kelley (1955) reported that there are also minute quantities of bodies, not fats, in foods soluble in ether which are included in the ether extract. Solvent extraction of the wet material following acidification was reported by Bixby et al. (1954) and Trunin (1941) and following acid hydrolysis by Windham (1953). For wet ether extraction, Bixby jet al. (1954) used modified Roose-Gottlieb and Mojonnier Methods (Rohrig, 1905, and Mojonnier et al., 1925), and compared it to the dry ethyl ether extraction method on fresh liver samples. The study revealed that Mojonnier flasks could be successfully applied to the determina-tion of crude fat in about two hours as compared to twenty-four hours with dry ether extraction method. The liver fat values by Mojonnier extraction were consistently from 1.1 to 2.8% higher than values obtained by dry ether extraction, but dry extraction employing a solvent mixture of ethyl ether, petroleum ether, and ethyl alcohol gave values that approximated those obtained by the Mojonnier extraction. Table A illustrates some of the results obtained:

18
Table A
FAT FOUND IN FRESH LIVER, %. Sample No. Mojonnier Ethyl Ether Mixed Solvent
1 5.6 3.5 5.5
2 6.3 4.5 6.5
3 5.4 3.8 5.6
4 5.4 3.4 5.3
5 4.8 2.6 5.2
6 7.1 5.4 7.4
7 6.6 5.1 6.7
8 6.5 5.2 7.2
9 6.1 4.5 6.3
10 4.4 2.8 4.9
ll 4.3 2.7 4.8
12 4.1 2.5 4.5
13 4.3 2.7 4.8
Average 5.5 3.7 5.7
In their discussion, these workers indicated that in the drying of the homogenate for dry extraction, some of the fat may be made inaccessible to ethyl ether. The higher fat values obtained with a mixed solvent could be explained on the basis that alcohol aided complete extraction by permitting ether to pass through a water barrier which could exist as residual water in sample. They also indicated that alcohol might be effective in releasing ether soluble materials that are in combination with proteins

19
or other substances. It was further reported by Budde (1952)
that some Mojonnier wet acid hydrolysis extract materials were
not soluble in dry ether extract. Although the wet ether extra-
ction methods are relatively shorter than the dry ether extraction
methods, they require greater technical skill with many more
man-hours of laboratory work (Salwin et al., 1955).
The widely accepted laboratory method today for the
determination of crude fat in meat and meat products is a dry
ether extraction method as described by the A.O.A.C. (1965).
It involves weighing three or four grams of ground meat sample
into thimbles containing small amounts of sand or asbestos and
drying in ovens for six hours at 100 - 102°C or 1.5 hours at
125°C. The dried sample is extracted with anhydrous ether or
petroleum ether for 14 - 16 hours. The extracted sample is
dried for 30 minutes at 100°C, cooled and weighed, and the loss
in weight reported as Ether Extract or Crude Fat. Two kinds
of apparatus are commonly used for continuous ether extraction.
The Goldfisch apparatus is a faster extractor and a pair of
results from one sample can be obtained by drying the residue
and the ether extract. The manufactures have recently claimed
that the latest model can give results in two to four hours
and can be used in any location without a hood. The Soxhlet
Extractor should be used in the hood and requires 14 to 18
hours and would be preferred in determinations involving many
samples. Bixby et al. (1954) compared results obtained by
20
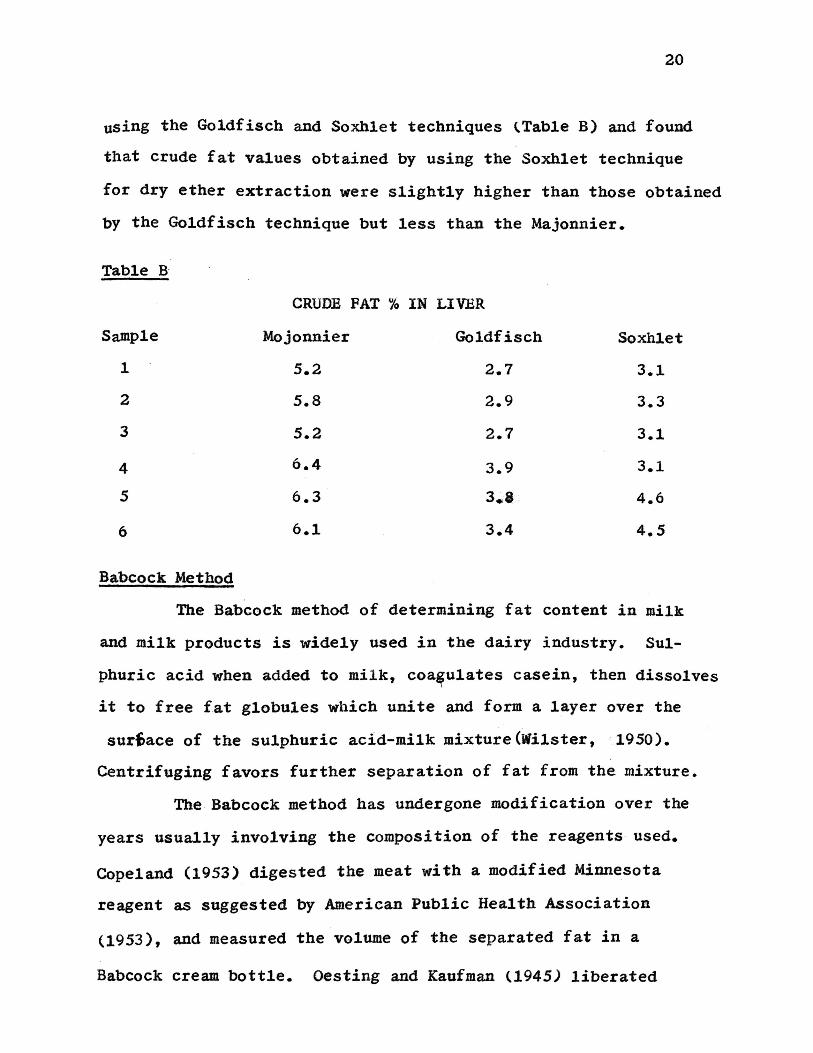
using the Goldfisch and Soxhlet techniques (Table B) and found
that crude fat values obtained by using the Soxhlet technique
for dry ether extraction were slightly higher than those obtained
by the Goldfisch technique but less than the Majonnier.
Table B
CRUDE FAT % IN LIVER
Sample Mojonnier Goldfisch Soxhlet 1 5.2 2.7 3.1 2 5.8 2.9 3.3 3 5.2 2.7 3.1
4 6.4 3.9 3.1 5 6.3 3.8 4.6
6 6.1 3.4 4.5
Babcock Method
The Babcock method of determining fat content in milk
and milk products is widely used in the dairy industry. Sul-
phuric acid when added to milk, coagulates casein, then dissolves
it to free fat globules which unite and form a layer over the
surface of the sulphuric acid-milk mixture(Wilster, 1950).
Centrifuging favors further separation of fat from the mixture.
The Babcock method has undergone modification over the
years usually involving the composition of the reagents used.
Copeland (1953) digested the meat with a modified Minnesota
reagent as suggested by American Public Health Association
(1953), and measured the volume of the separated fat in a
Babcock cream bottle. Oesting and Kaufman (1945) liberated

21
fat from an emulsified meat sample using acetic and sulfuric acids in a Babcock milk test bottle. Talbot (1949) used sulfuric acid and amyl alcohol in a butyrometer. The accuracy of the Babcock test compared to the official method has been studied by Kelley et al. (1954) who found that the Modified Babcock analysis using acetic acid and sulfuric acid compared well with the A.O.A.C, method when the meat was ground and mixed five times. Seasoning in pork sausage interfered with the results. Salwin et al. (1955) compared a modified procedure using a perchloric-acetic acid mixture with the A.O.A.C, methods and his results agreed closely with those of the A.O.A.C, method on a wide range of meats and meat products. Windham compared the modified Babcock using sulfuric acid and Centrifuging; the Babcock modification using perchloric-acetic acid mixture; and the Stein-lite Method to the A.O.A.C. Method and obtained results which agreed within in all three. Recently, a modified Babcock procedure for rapid determination of fat in meats using hot Dimethyl Sulfoxide and concentrated Hydrochloric acid compared closely with the Mojonnier Method (Whalen, 1966), and the mean difference in results by the two methods was 0.5% fat. The technique was simpler and about five minutes shorter.
Steinlite Electronic Fat Tester The Steinlite Electronic Fat Tester has been developed
to measure the oil content of soy beans. The fat in the sample is extracted by the Steinlite Solvent by mixing in a blender.

22
The electrical capacitance of the filtered solvent-fat solution
is measured in the Steinlite Fat Tester cell and the readings
obtained are converted into fat values using a previously prepared
chart converting capacitance readings to percent fat content.
Furgal (1954) obtained results comparable to A.O.A.C, methods
in twenty to thirty minutes for each sample with any meat. There
was no significant difference in the accuracy of the two methods.
He also found that the Steinlite Fat Tester had a standard
error of only ± 1.92% while the A.O.A.C. Method had an error of
± 3.2%. It was also indicated in this study that curing salts
may have an effect on the readings by the Steinlite. Everson
et al. (1955) evaluated the technique and obtained results with
a variation greater than that obtained by the A.O.A.C. Method,
but the maximum difference between methods was 37o in the range
of 15-40% fat. The accuracy of the Steinlite was limited
primarily by the extraction procedure and temperature reading
as noted by Everson et al. (1955).
Herty and Harris ( 1 9 3 0 ) measured the specific gravity
of the fat solvent extract. An empirical formula was devised
to relate specific gravity to fat content. Kraybill et al.
(1953) have summarized this early work. A table of specific
gravities of different mammalian fat is given by Kirschenbauer
(1960;. "The research of Honeywell is aimed at eliminating
measurements of volume, weight and temperature to make the
technique work faster as its main advantage is speed. The
limitations of the method are foreign ingredients and frozen
moisture". (Whitehead, 1966)
23
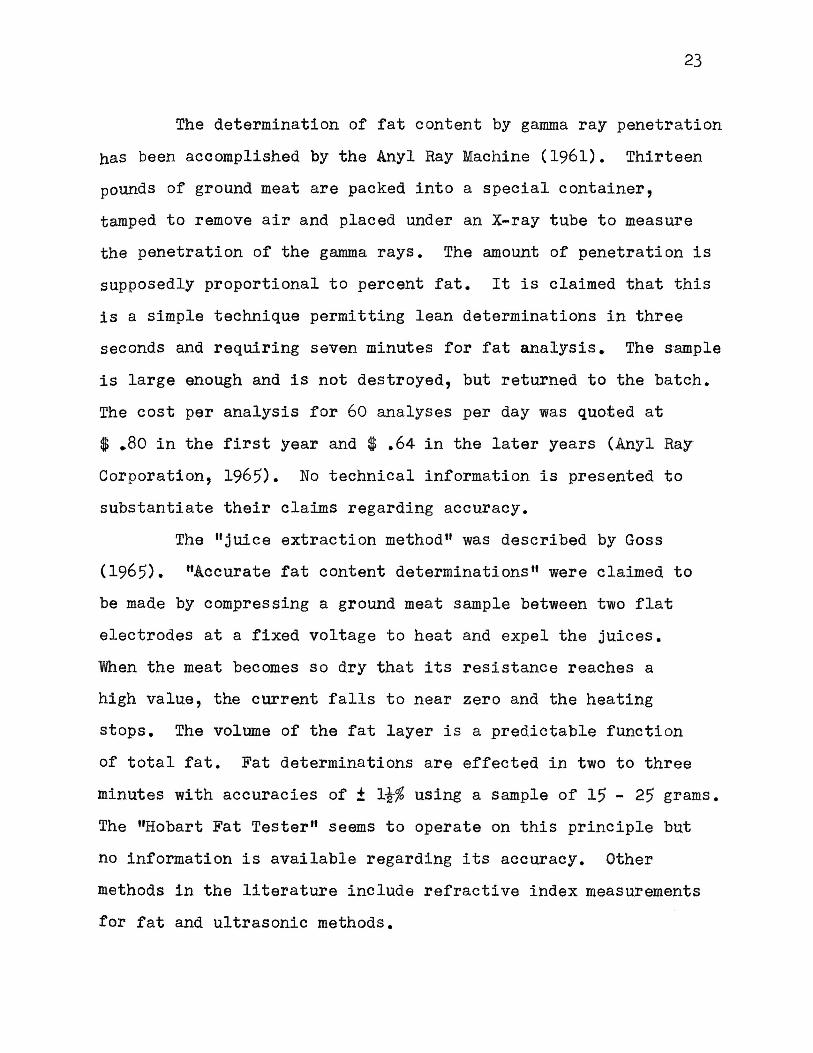
The determination of fat content by gamma ray penetration has been accomplished by the Anyl Ray Machine (1961). Thirteen pounds of ground meat are packed into a special container, tamped to remove air and placed under an X-ray tube to measure the penetration of the gamma rays. The amount of penetration is supposedly proportional to percent fat. It is claimed that this is a simple technique permitting lean determinations in three seconds and requiring seven minutes for fat analysis. The sample is large enough and is not destroyed, but returned to the batch. The cost per analysis for 60 analyses per day was quoted at $ .80 in the first year and $ .64 in the later years (Anyl Ray Corporation, 1965). No technical information is presented to substantiate their claims regarding accuracy.
The "juice extraction method" was described by Goss (1965). "Accurate fat content determinations" were claimed to be made by compressing a ground meat sample between two flat electrodes at a fixed voltage to heat and expel the juices. When the meat becomes so dry that its resistance reaches a high value, the current falls to near zero and the heating stops. The volume of the fat layer is a predictable function of total fat. Fat determinations are effected in two to three minutes with accuracies of t using a sample of 15 - 25 grams. The "Hobart Fat Tester" seems to operate on this principle but no information is available regarding its accuracy. Other methods in the literature include refractive index measurements for fat and ultrasonic methods.
24
Miscellaneous and Simultaneous Procedures
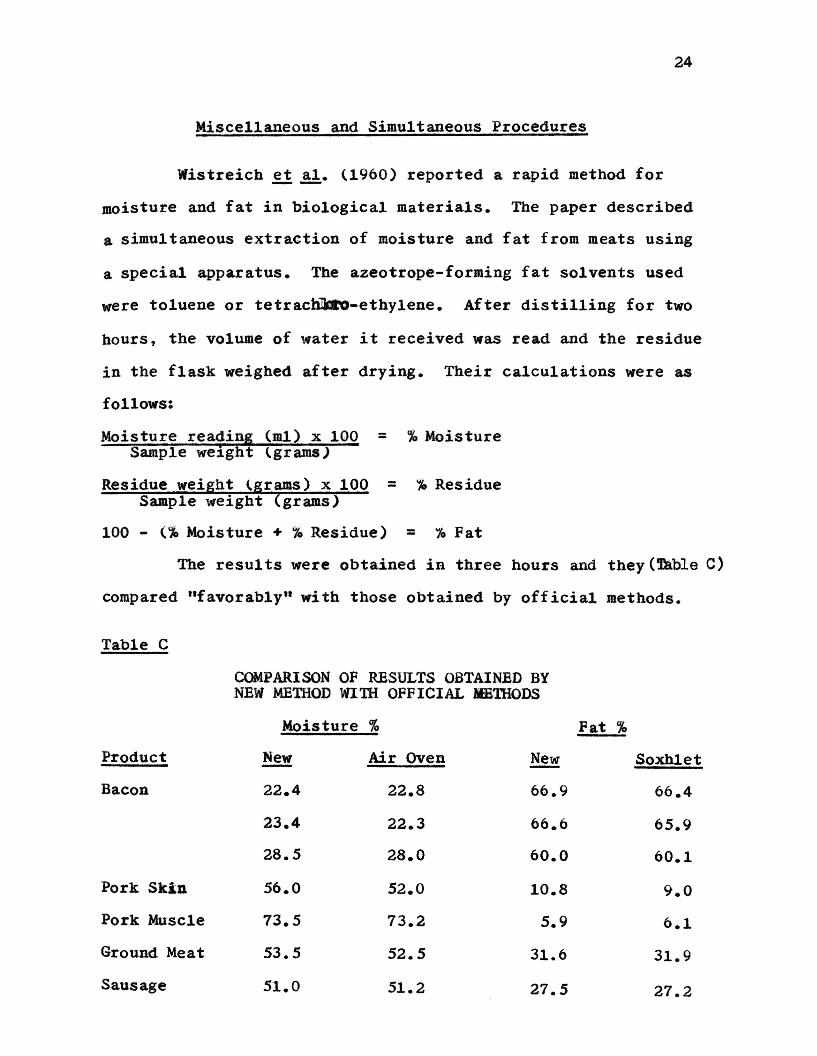
Wistreich et al. (1960) reported a rapid method for
moisture and fat in biological materials. The paper described
a simultaneous extraction of moisture and fat from meats using
a special apparatus. The azeotrope-forming fat solvents used
were toluene or tetrachloro-ethylene. After distilling for two
hours, the volume of water it received was read and the residue
in the flask weighed after drying. Their calculations were as
follows:
Moisture reading (ml) x 100 = % Moisture Sample weight (.grams)
Residue weight (.grams) x 100 = % Residue Sample weight (grams)""
100 - (% Moisture + % Residue) = % Fat
The results were obtained in three hours and they (Table C)
compared "favorably" with those obtained by official methods.
Table C
COMPARISON OF RESULTS OBTAINED BY NEW METHOD WITH OFFICIAL METHODS
Moisture % Fat %
Product New Air Oven New Soxhlet Bacon 22.4 22.8 66.9 66.4
23.4 22.3 66.6 65.9 28.5 28.0 60.0 60.1
Pork Skin 56.0 52.0 10.8 9.0 Pork Muscle 73.5 73.2 5.9 6.1 Ground Meat 53.5 52.5 31.6 31.9 Sausage 51.0 51.2 27.5 27.2

25
The results obtained by the new method were comparable
but slightly higher than the official methods and it was
suggested probably there was no case hardening in the new method.
Davis et al. (.1966) developed a rapid approximate
analytical method for simultaneous determination of moisture
and fat in meat and meat products. The apparatus consisted of
an extraction apparatus and distillation receiver and a micro-
vacuum oven was used to aid dessication. Reliable results for
a sample were obtained by this method within 2 to 2 1/2 hours over
a wide range of sample selected to cover the moisture and fat
content normally encountered. Statistical analysis revealed
that this rapid method and the conventional method had high
repeatability for duplicate determinations, and that there was
a significant difference between fat and moisture values deter-
mined by the two methods. Again, the moisture values were higher
than the official methods.
Sampling
Sampling is important in any experimental study.
Quality control is widely used to maintain uniformity in
manufactured products. The raw materials which go into a
product vary considerably in chemical composition of their
constituents, and since meat is a non-homogeneous solid material,
sampling procedures will have an effect on the composition of
the final product. A sample consists of a small collection
from a population about which we wish information. Facts
learned about the sample examined will be used to make correct

26
inferences about the population (Snedecor, 1956). If there were no variations, any one sample would give the correct infor-mation about the population. The twin problems of sampling are to design and conduct the sampling so that the sample examined shall be representative of the population; and having studied the sample, correct inferences can be made about the sampled population with the most reliable and efficient procedures available for analyzing and interpreting the data as stated by Snedecor (1956) and Fryer (1965).
In any analytical procedure, reliable results can be obtained if a representative sample is examined. The results can be reproducible if the described technique is closely followed (Landmann, 1965). Kelley et al. (1954) presented data to support his contention that preparation of samples and sampling techniques had a decided bearing on the correlation between the different methods of analysis and the official method. Variations in results on the chemical analyses of ground meats and meat products may not only be due to variations in the chemical composition of the materials and determination methods but also may be largely due to difficulty in obtaining a representative sample.
Rapid Methods In the meat packing industry, there is increasing need
for simple, rapid and reasonably accurate analytical methods for fat and moisture content of meat and meat products so as to maintain control of product quality, assure compliance with regul-atory restrictions, and provide a basis for monetary evaluation

27
of raw materials and formulation alternatives. The official methods, sometimes called conventional
methods, are not suitable for active quality control. In recent years, many investigators have developed more rapid methods for fat content in meat as the cost of the raw materials depends largely on the lean-to-fat ratio. The methods of rapid fat determination can be categorized into:
(a) Direct methods which include methods in which the fat is chemically or physically separated from the meat and then analyzed by volume or weight.
(b) Indirect methods in which the amount of fat is measured by some other characteristics of the meat which bear a relationship to the fat content (Whitehead, 1962).
Many methods are available today, the lengthy conventional methods and the rapid methods for the determination of moisture and fat content in ground meats. The indirect non-chemical methods are receiving greater attention coupled with the sophis-tication and publicity involved. Some of the chemical methods reviewed are giving promise of becoming rapid methods. The need for rapid methods has been outlined and an ideal rapid method should incorporate the following features:
1. The method should be rapid so that the test could be completed in half an hour or less.
2. The method should be simple enough to be carried out by non-technical personnel after a brief training period.
3. The method should permit in-plant operation.

28
4. The method should be reasonably accurate.
5. The method must be suitable for any meat product.
6. The method must be useful with any representative
sample, and over a wide range of composition.
7. The method should not be too costly in terms of
initial investment, materials per test and operator's
time.
Little technical information is available regarding
results of some of these methods as compared to the official
method of analysis for fat and moisture. This is especially
true for the Whalen Modification of the Babcock Method and for
use of moisture determination balances, such as the Ohaus Moisture
Determination Balance. Therefore, these methods were checked.
Little information seems available regarding method of sample
preparation for analysis. This seems important since homogenizers
are readily available to perform a more thorough mixing, blending
and cutting of sample.
METHODS AND PROCEDURES
Preparation of Samples
Fresh beef (shank meat) was obtained from the University
Meat Laboratory. Different amounts of beef fat trimmings were
added to the lean meat to obtain three fat levels of the raw
material, namely low (about 15%), medium (about 20%), and
high (about 25%) fat levels. The meat was ground three times
in a large meat grinder using 1/8" plate, mixing thoroughly
after each grinding.

29
Each batch was divided into two portions, A and B. The
A sample was homogenized using a Waring blender and further
mixing by hand; the B sample received no further treatment.
Special samples were prepared from the raw material of
medium fat level by adding 3% NaCl prior to the grinding.
This sample was used to test the effect of added salt on Steinlite
Fat Tester results.
The meat samples were packaged in air tight "Whirlpak"
bags, labelled, frozen in a blast freezer at -10°F, and stored
at 0°F until used.
For Pork Sausage, two pound samples of fresh seasoned
pork sausage were obtained on the day of the test. The seasoning
consisted of two pounds salt, four ounces black pepper and four
ounces rubbed sage per 100 lbs. meat. Each lot was thoroughly
mixed by hand and stored in water tight glass jars at 32°F until
analysis.
Moisture Content Determinations
One method of moisture analysis consisted of oven drying
using a forced circulation oven at 100 - 102°C as outlined in
"Official Methods of Analysis" of the Association of Analytical
(formerly Agricultural) Chemists, 10th edition, 1965, hereafter
designated A.O.A.C. (1). The only modification here involved
the use of paper thimbles in place of crucibles.
A second method of moisture analysis used was drying as
above but using uncovered crucibles and hereafter referred to
as A.O.A.C. (2).
30
Sample size for both A.O.A.C. (1) and A.O.A.C. (2)
consisted of four to six grams.
The third method of moisture analysis utilised the
Moisture Determination Balance (OHAUS). Ten grams of meat
sample were rapidly and accurately weighed and placed on the
Moisture Determination Balance. The heater unit was positioned
at l 1/4 inches above the sample container, the heater control set
at 60 watts, and the timer set at 40 minutes. Moisture loss
was directly read from the scale, to the nearest 0.1% when
the timer sounded the bell.
Prior to use of the Moisture Determination Balance,
drying curves were run in order to determine proper conditions
for this test. Several meat samples were run at different
heater settings starting with the lowest setting and gradually
increasing to a heater setting just high enough to effect
dryness without scorching the meat sample. The timer was
set at the point where the drying curve reached its highest
plateau. Drying curves are illustrated in Plate III.
Pat Content Determinations
The first method involved extraction of dried samples
in paper thimbles with petroleum ether especial low boiling
point for fat determinations) following the procedure described
by Official Analytical Chemists, 10th edition (1965) and
designated hereafter as the A.O.A.C, method. Samples dried in
crucibles to determine moisture percentage were not subjected
to ether extraction.
31
A second procedure involved use of the Steinlite Electronic Fat Tester. The procedure was similar to that described by Furgal (1954) and Everson et al. (1955). A slight modification involved blending for twelve minutes, two minutes at low speed and ten minutes at full speed, in a commer-cial Waring Blender, and a simple gravity filtration using a conical funnel with a folded filter paper (Munktell's No. 5). The suction pump, buchner funnel, buchner flask, and Celite filter aid were not used. Sometimes it was necessary to filter twice to obtain a clear filtrate. The equipment used for this method is shown in figure 1.
The Modified Babcock procedure was similar to that described previously by Kelley et al. (1954) using sulfuric acid with Centrifuging. A slight modification involved weighing the meat samples into 100 ml. beakers, digesting the material in the beaker, and quantitatively transferring the digested material into Babcock cream bottles. To aid in reading of the upper meniscus, two drops of glymol were added in place of sudan III.
Modified Babcock Method (Whalen Modification) The procedure used was described previously by Whalen
(1966). It involves use of hot hydrochloric acid to digest the sample and of dimethyl sulfoxide as a solvent to aid in separation of the fat. Glymol indicator was used to aid in reading of the upper meniscus.
Statistical Analysis Data were analyzed by Analysis of Variance as outlined

32
by Snedecor (1956). If a significant variance ratio was found,
Duncans Multiple Range test was used to determine where
significant differences were located.
RESULTS AND DISCUSSION
Table 1 summarises moisture percentage of three different
ground beef samples as affected by method of preparation and
method of determination.
Each method detected a significant difference between
samples. In general, higher moisture values were obtained by
the A.O.A.C. (1) and Moisture Determination Balance methods.
This may indicate, as suggested by Wistreich et al. (1960),
that there is probably case hardening in this kind of oven
drying employing crucibles (A.O.A.C. 2) even though oven
temperatures are the same.
The highest moisture values were obtained by the A.O.A.C.
(1) method, an oven drying method employing paper thimbles.
Greasy spots were observed on some paper thimbles after oven
drying but would disappear when ether extracted and dried.
Evidently, fat was partially melted, so care must be taken not
to spill or lose any fat. Subsequent fat analysis was not
performed on crucible dried samples so it is not known if ether
extract results were affected.
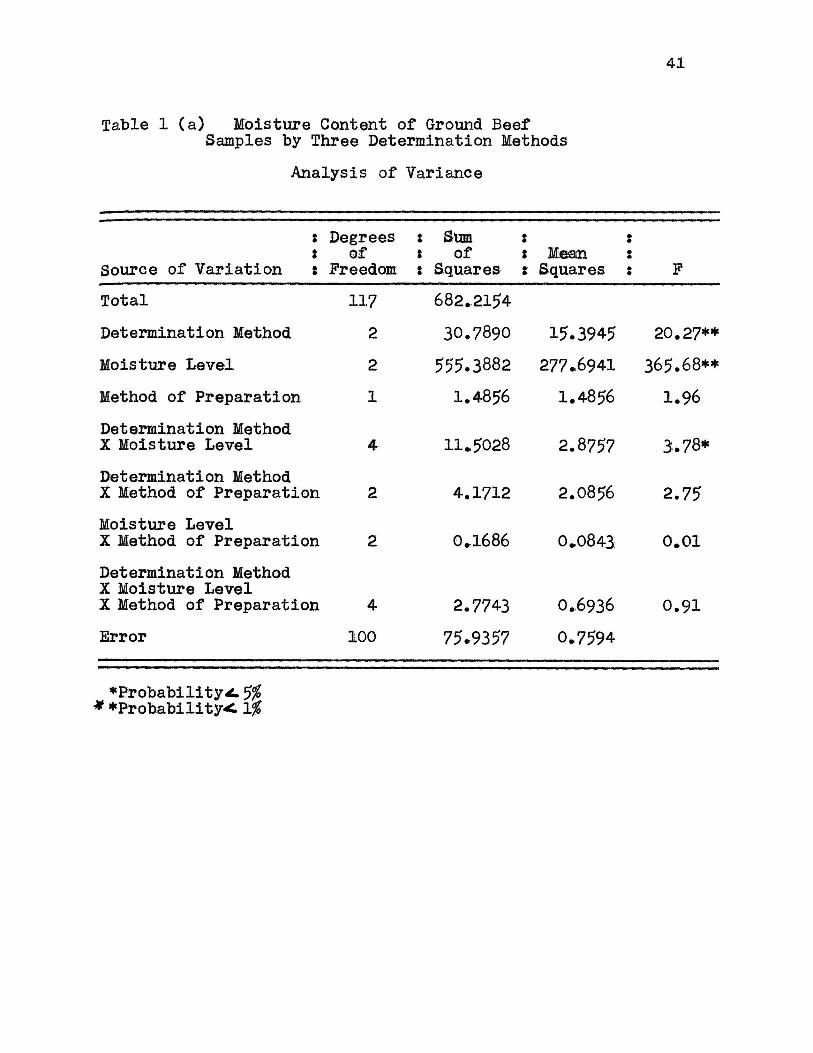
Analysis of Variance (Table la) indicated highly
significant F Values (variance ratios) for method of determination
and level of moisture in the sample. The method of sample
preparation did not cause a significant change although a significant
33
interaction was noted between moisture level and method of determination.
Duncan's Multiple Range Test (Table lb) indicated that all means for moisture level were significantly different from each other (P < %).
The A.O.A.C. (2) and moisture determination balance agreed closely at low and medium levels; but at high level, the A.O.A.C. (2) was significantly lower than the other two methods.
The A.O.A.C. (1) method recorded significantly higher results than both other methods at the medium level of moisture, significantly higher values than the moisture balance method at the low level of moisture and significantly higher results than the A.O.A.C. (2) method, using crucibles, at the high moisture level. It would appear that moisture is more effectively removed from the sample when paper thimbles were used.
Table 2 presents a record of the moisture percentage for pork sausage samples determined by three different methods. A larger standard deviation seems to be associated with the A.O.A.C. (1) method. This may indicate a difficulty in weighing at a constant dryness, due to the affinity of dry sample and thimble for moisture from the air. The smaller standard deviation of the results with the moisture determina-tion balance may be due to a lack of precision in reading.
Care must be taken in establishing wattage - time conditions as with over-heating, "fat splattering" to the

34
outside of the weighing pan may result; thereby causing abnormal
weight loss.
To effect complete uniform drying of the meat sample,
it must be spread thinly and evenly on the aluminum foil pan
rapidly. The procedure was easier with pork sausage but ground
beef was relatively more sticky.
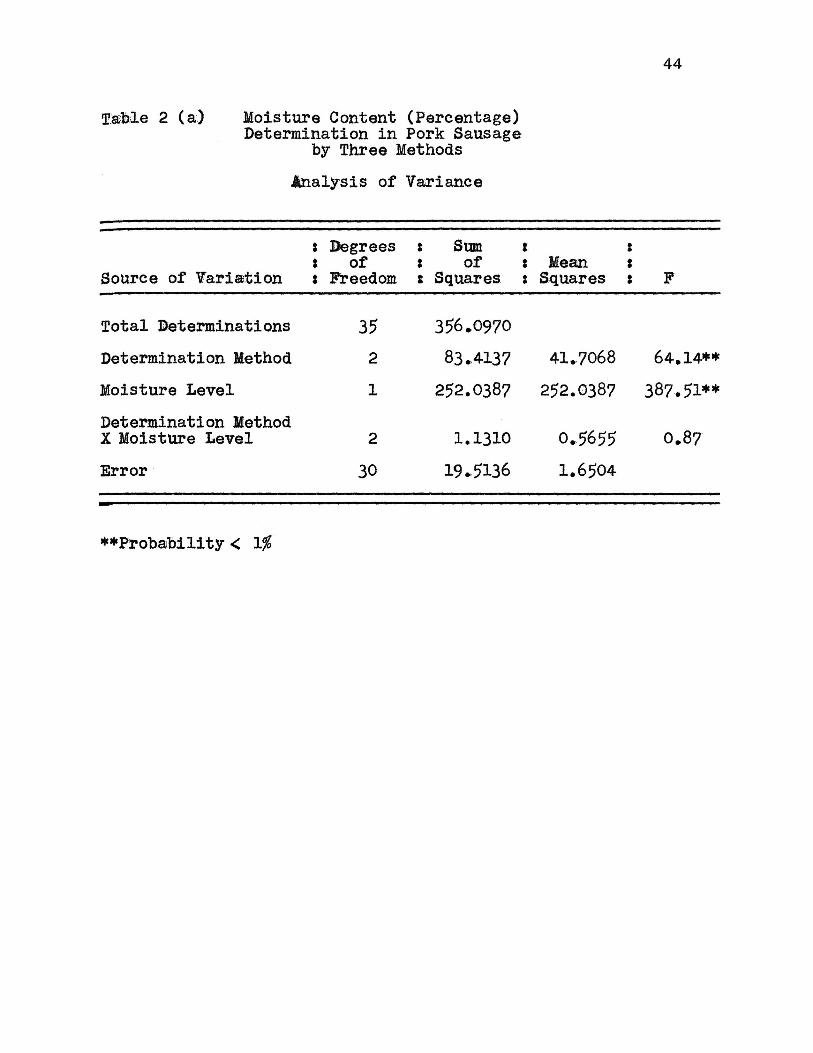
Analysis of variance (Table 2a) indicated highly
significant differences between methods, between moisture levels,
but with no significant interaction between method and moisture
level.
As shown in Table 2, the lowest moisture values were
obtained by the A.O.A.C. (2) method using crucibles and the
highest values were obtained by the A.O.A.C. (.1) method using
thimbles. A significant difference between the two lots of
pork sausage was also noted.
Wistreich (1960) felt that the method employing drying
in crucibles resulted in case hardening of samples, therefore,
sealing in some moisture.
The importance of technique should be emphasized, and
methods of drying, cooling and quick weighing should be care-
fully duplicated from determination to determination. Excessive
moisture pick-up by thimbles during a weighing could also result
in an apparent higher moisture percentage.
The A.O.A.C, methods take too long to be effective in
an active quality control program. Even the forty minutes
required for a moisture determination with the moisture deter-
mination balance may be too long to alter composition of a

35
product in process. With this balance, use of more wattage and a shorter time was found to result in an unclear endpoint because of possible overlap of moisture loss and further decom-positions.
Another problem results from the fact that only one sample can be subjected to moisture determination at a time. Then too, the balance needs approximately thirty minutes to cool between determinations, since an accurate starting weight cannot be established if the balance is hot. As thermal dehydration on the moisture determination balance is carried out in an open container, the relative humidity in the room and air currents in the room could have some influence on the results.
The higher values obtained by use of paper thimbles could be due to:
(i) porosity and increased surface area serving to overcome the physical nature of meat such as case-hardening
(ii) loss of non-water components (volatile and non-volatile)
(iii) errors in weighing caused by either buoyancy or atmospheric water vapor.

36
EXPLANATION OF PLATE I
Figure 1. Apparatus for Steinlite Electronic Fat Tester Method.
From left to right: Steinlite Electronic Tester. Model LOS Fat and Oil Tester. 250 ml beaker (under Steinlite Test Cell). Support with filter funnel held by clamp. Receiving Flask. Filter paper (Munktell's No. 5) in box. Rheostat (variable speed). Timer. Cylinder (1 ml graduations) 100 ml. Waring Blender (with blender jar mounted).
(Analytical balance, spatula - not shown.)
Figure 2. Top panel of Steinlite Electronic Fat Tester.

37
PLATE I.
Fig. 1
Fig. 2.

38
EXPLANATION OF PLATE II
Modified Babcock Fat Columns
#1 and 2. Modified Babcock (Whalen Modification) glymol indicator (red meniscus reader) was added in both columns.
#3 and 4. Modified Babcock (using acetic and sulfuric acids). Glymol indicator was added to #3. No glymol in #4.

39
PLATE II.
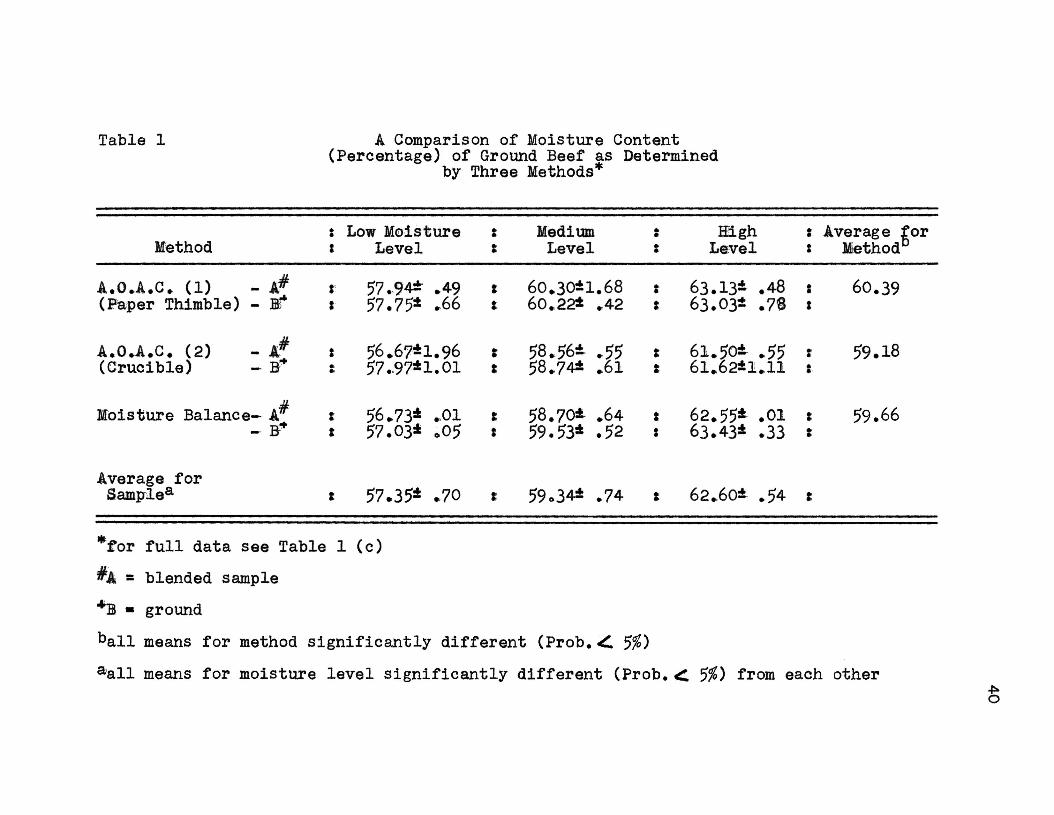
Table 1 A Comparison of Moisture Content (Percentage) of Ground Beef as Determined
by Three Methods*
$ Low Moisture t Medium High i Average for Method s Level : Level $ Level $ Method
A.O.A.C. (1) A # t 57.94* .49 t 60.30*1.68 63.13* .48 i 60.39 (Paper Thimble) - ffi* t 57.75* .66 $ 60.22* .42 i 63.03* .7® i
A.O.A.C. (2) A# t 56.67*1.96 t 58.56*- .55 61.50* .55 . 59.18 (Crucible) B* 1 57.97*1.01 t 58.74* .61 $ 61.62*1.11 $
59.18
Moisture Balance- A# . 56.73* .01 t 58.70* .64 $ 62.55* .01 t 59.66 — B+ : 57.03* ,05 t 59.53* .52 : 63.43* .33 s
59.66
Average for Sample3- s 57.35* .70 t 59-34* .74 t 62.60* .54 t
*for full data see Table 1 (c) #A = blended sample *B - ground ball means for method significantly different (Prob.< 5/0 aall means for moisture level significantly different ( P r o b . % ) from each other 40
41
Table 1 (a) Moisture Content of Ground Beef Samples by Three Determination Methods
Analysis of Variance
t Source of Variation $
Degrees of
Freedom : Sum : : of $ $ Squares t
: Mean $ Squares ; F
Total 117 682.2154 Determination Method 2 30.7890 15.3945 20.27** Moisture Level 2 555.3882 277.6941 365.68** Method of Preparation 1 1.4856 1.4856 1.96 Determination Method X Moisture Level 4 11.5028 2.8757 3.78* Determination Method X Method of Preparation 2 4.1712 2.0856 2.75 Moisture Level X Method of Preparation 2 0*1686 0.0843 0.01 Determination Method X Moisture Level X Method of Preparation 4 2.7743 0.6936 0.91 Error 100 75.9357 0.7594
•Probability*. % **Probability< 1%

42
Table 1 (b) Moisture Content (Mean Percentage) of Ground Beef Samples
by Three Determination Methods4
Moisture Level X Determination Method Interaction
Low Moistures Medium : High : Method Method t. Level t Level s Level $ Average:
A.O.A.C. (1) 57,84b 60.26d 63.08f 60.39
A.O.A.C. (2) 57.32ab 58.65° 6l.56e 59.18
Moisture Balance 56.88a 59.12° 62.99f 59.66
Batch Average* 57.35 59.34 62.54
4All means with the same superscript are not significantly different at % level of probability as tested by Duncan's Multiple Range Test. #A11 method averages significantly different (P< % ) from each other.
*A11 fat level (batch means) averages significantly different (P< 5/0 from each other.
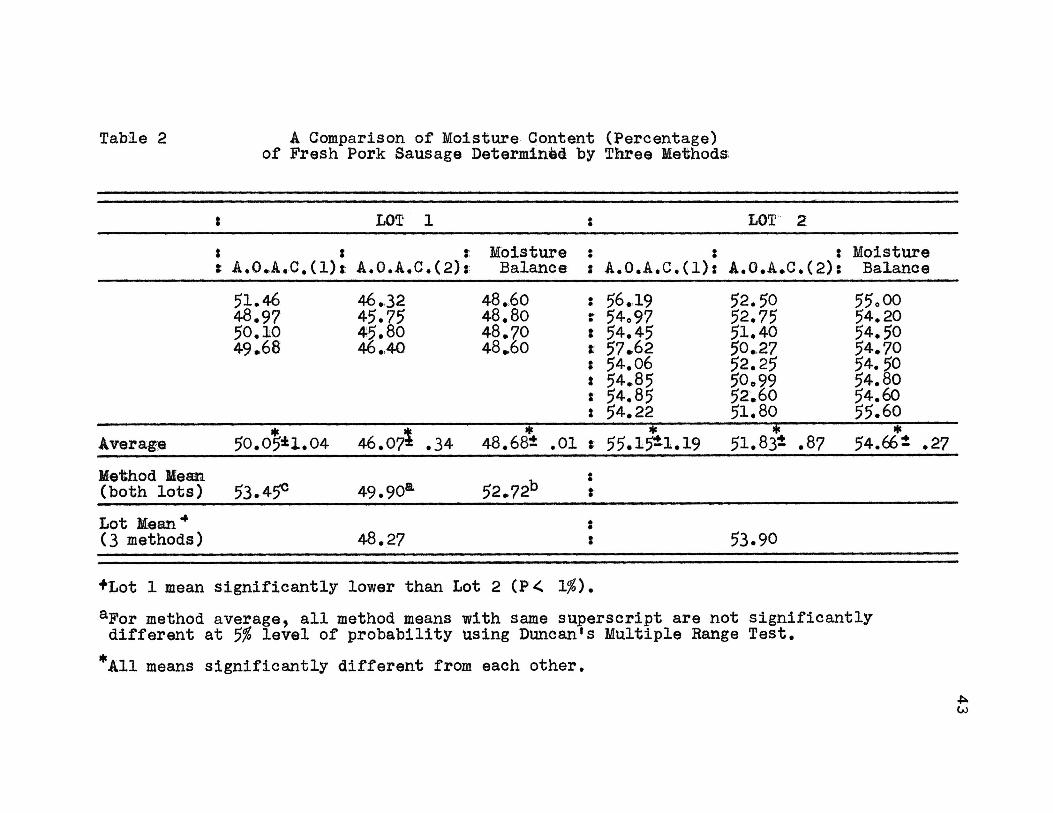
Table 2 A Comparison of Moisture Content (Percentage) of Fresh Pork Sausage Determined by Three Methods
i LOT 1 : LOT 2 t : Moisture . . t Moisture t A.O.A.C.(1)$ A.O.A.C.(2): Balance : A.O.A.C.(1): A.O.A.C.(2)s Balance 51.46 46.32 48.60 56.19 52.50 55oOO 48.97 45.75 48.80 z 54O97 52.75 54.20 50.10 4-5.80 48.70 * 54.45 51.40 54.50 49.68 46.40 48.60 t 57.62 50.27 54.70 49.68
$ 54.06 52.25 54.50 s 54.85 50o99 54.80 i 54.85 52.60 54.60 i 54.22 51.80 55.60
# * * * * * Average 50.05*1.04 46.07* .34 48.68* .01 t 55.15*1.19 51.83* .87 54.66* .27 Method Mean
49.90a .
(both lots) 53.45° 49.90a 52.72b t
Lot Mean4 t (3 methods) 48.27 t 53.90
+Lot 1 mean significantly lower than Lot 2 (P< 1%), aFor method average, all method means with same superscript are not significantly different at % level of probability using Duncan's Multiple Range Test.
*A11 means significantly different from each other.
43
44
Table 2 (a) Moisture Content (Percentage) Determination in Pork Sausage
by Three Methods
Analysis of Variance
Source of Variation
$ Degrees : Sum t : i of : of : Mean $ : Freedom : Squares : Squares $
Total Determinations
Determination Method
Moisture Level
Determination Method X Moisture Level
Error
35 2 1
2 30
356.0970 83.4137 41.7068 64.14** 252.0387 252.0387 387.51**
1.1310 19.5136
0.5655 1.6504
0.87
••Probability < 1%

45
Results of fat analysis of three different ground beef samples prepared in two ways and analyzed by four different methods are presented in Table 3. Complete data is shown in Table 3d in the appendix.
Analysis of Variance of fat values obtained by all four methods for ground beef (Table 3a) indicated that major sources of variation were due to fat level in sample and determination method (P<1%). The method of sample preparation did not have a significant effect upon results. There was, however, a highly significant interaction between fat level and determina-tion method and between method of sample preparation and determination method. The fat level and method of sample preparation interaction was significant at P<5%.
As shown in Tables 3 and 3a, in general, the lowest fat values were obtained by the A.O.A.C, method at all levels of fat, while the percentage values obtained by the Steinlite Fat Tester were generally the highest. The low fat values by the A.O.A.C, method may be due to inherent errors in this crude fat determination as suggested by Wiley (1907) and Bixby et al. (1954).
Duncan's Multiple Range Test (Table 3b) indicated that at the low fat level, the weighted fat at mean values obtained by the Steinlite Electronic Fat Tester and Modified Babcock (Whalen modification) were not significantly different (P<5%) from each other but were significantly higher than the official method (A.O.A.C.) and the modified Babcock method. The A.O.A.C.

46
Table 3 A Comparison of Fat Content (Percentage) of Ground Beef Determined by Four Methods
and Prepared in Two Ways
DETERMINATION AND : Low Fat t Medium Fats High Fat PREPARATION METHOD* : Level : Level : Level
A.O.A.C. -A 16.26- .44 21.10* .94 24.08* .55 B 16.61* .75 20.74* .74 24.42* .50
Average (A and B) 16.44* .51 20.92* .84 24.25* .53
Steinlite -A 17.3#* .48 22.60* .48 26.71*1.37 B 18.44* .38 21.97* .64 26.34* .73
Average (A and B) 17^1* >43 22,29* j56 26,53*1,05
Modified Babcock -A 16.93* .32 20.76* .84 26.43*1.18 B 1?»03* t65 20,46* .73 26,07*1,03
Average (A and B) 16.98* .49 20.61* .79 26.25*1.11
Modified Babcock (Whalen)-A 17.55* .54 21.10* .52 25.02* .96 B 17,43*1,48 21,13* ,87 25,00* ,,36
Average (A and B) 17.49^1.01 21.12* .70 25.01* .66
Preparation Method - A is blended in Waring Blender; B is ground and mixed 3 times.

47
Table 3 (a) Fat Content Determinations on Ground Beef
by Four Methods Analysis of Variance
t Degrees $ Sum : of : of
Source of Variation : Freedom t Squares : Mean $ : Squares t F
Total Determinations 191
Fat Level 2 Method of Sample Preparation 1 Determination Method 3 Fat Level X Method of Sample Preparation 2 Fat Level X Determina-tion Method 6 Method of Sample Preparation X Determination Method 3 Error 174
2,075.9966 1,894.8339 947.4169 2,169.99**
.0022 .0022 29.7888 9.9296
3.7449 1.8724
62.0420 10.3403
9.6187 3.2062 75.9662 0.4366
0.01 22.74**
4.29*
23.68**
7.34**
•Probability< % **Probability< 1%

48
Table 3 (b) Fat Content Determinations on Ground Beef by Four Methods
Fat Level X Determination Method Interaction (Weighted Mean Values)+
: : A.O.A.C.
t :Steinlite
: Modified: : Babcock J
Babcock (Whalen)
Low Fat Level 16.44a 17.91c 16.98b 17.49c
Medium Fat Level 20.92d 22.28e 20.6ld 21.12d
High Fat Level 24.25f 26.52h 26.25h 25.018
Determination Method Weighted Mean 20.54* 22.24* 21.28 21.20
^All values with the same superscript are not significantly different at % level of probability, by Duncan's Multiple Range Test.
•Differs from other means for determination method (P< %).

49
method results were significantly lower than all other methods.
At the medium fat level, the percent values obtained
by the official method and both modified Babcock methods were
not significantly different (P< 5%), but the Steinlite values
were significantly higher than the other three methods.
At the high level of fat, values obtained by the
Steinlite Fat Tester and Modified Babcock were not significantly
different from each other but were significantly higher than
the other two. The lowest value was found by the A.O.A.C,
method, and the highest value by the Steinlite Fat Tester.
For the high fat level sample, the standard deviation
tended to be higher in the Steinlite and Modified Babcock results
(Table 3). At the low fat level, the Modified Babcock (Whalen)
method had the largest standard deviation. Perhaps it is dang-
erous to compare standard deviations when they could not be
subjected to statistical analysis, and when a small number of
determinations were utilized. However, they might give a
comparative idea of variation encountered in using a method.
It can also be noted that at the low and medium levels
of fat, the A.O.A.C, method and Modified Babcock method were
closely related and had lower fat values than the other two
methods.
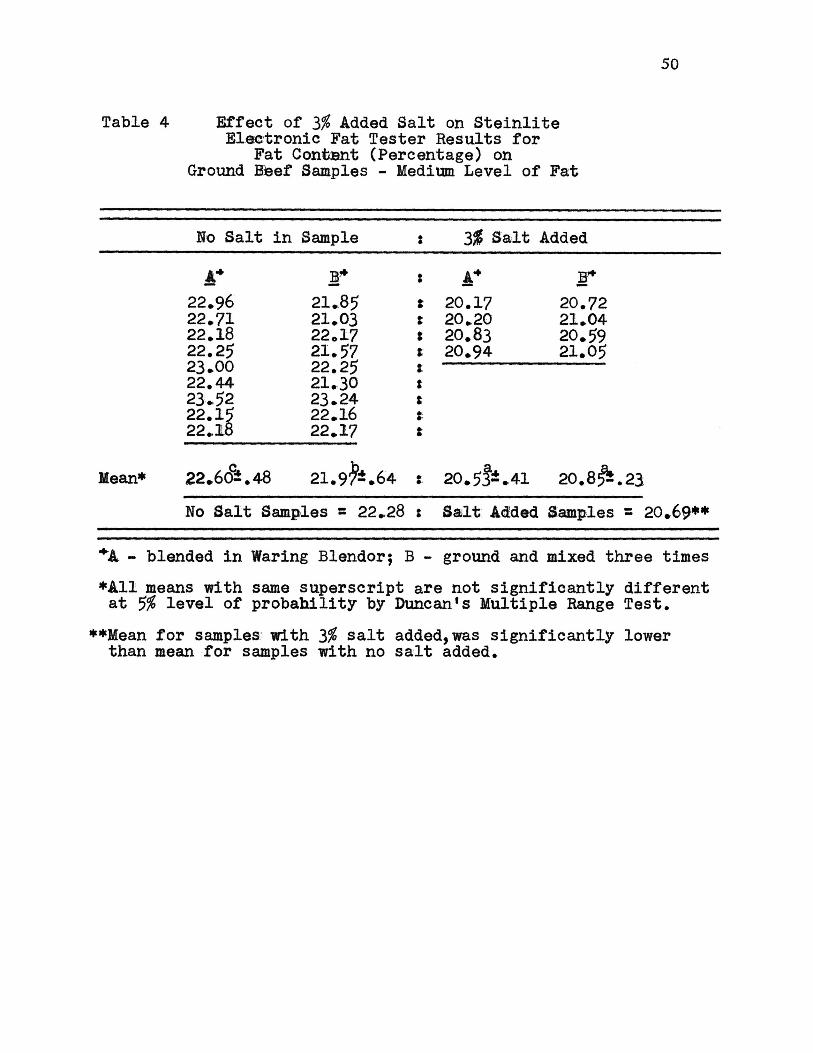
Addition of three per cent sodium chloride had a highly
significant depressing effect on the results obtained by the
Steinlite Electronic Fat Tester as shown in Table 4 and by
analysis of variance in Table 4a. When 3% sodium chloride
50
Table 4 Effect of 3% Added Salt on Steinlite Electronic Fat Tester Results for
Fat Content (Percentage) on Ground Beef Samples - Medium Level of Fat
No Salt in Sample : 3% Salt Added
A* B* : A* B-22.96 21.85 t 20.17 20.72 22.71 21.03 t 20.20 21.04 22.18 22.17 t 20.83 20.59 22.25 21.57 t 20.94 21.05 23.00 22.25 t
21.05 22.44 21.30 : 23.52 23.24 t 22.15 22.16 t 22.18 22.17 t
Mean* 22,60°*. 48 21.9^.64 t 20.5?*.41 20.8^.23 No Salt Samples = 22.28 : Salt Added Samples = 20.69**
- blended in Waring Blender; B - ground and mixed three times *A11 means with same superscript are not significantly different at % level of probability by Duncan's Multiple Range Test.
**Mean for samples with 3% salt added, was significantly lower than mean for samples with no salt added.

51
Table 4 (a) Effect of 3% Added Salt on Fat Determinations of Ground Beef
by the Steinlite Method (Medium Fat Level Only)
Analysis of Variance
: t
Source of Variation t Degrees
of Freedom
$ Sum : of : Squares
: : Mean t Squares
: : : F
Total Determinations 25 21.8407 Method of Preparation 1 0.7412 0.7412 2.80 Salt Level 1 14.0460 14.0460 53.06**
Method of Preparation X Salt Level 1 1.2306 1.2306 4.65* Error 22 5.8229 0.2647
•Probability* % ••Probability < 1%

52
(common salt) was added, the results of fat analysis obtained were 1.59% lower as compared to the non-salt sample. The fat content of the salt-added samples was not determined by any of the other methods to explain the low values obtained. This result differs from those of Furgal (1954) who found no difference in Steinlite results attributable to addition of 3% salt to the solvent. He used samples with a higher fat level and the salt was added to both pure solvent and solvent contain-ing fats which may have affected the depressing action of sodium chloride on final results. The fat mean value of salt-added samples (A) prepared by homogenizing in a Waring Blender and (B) prepared by grinding and mixing was not significantly different. However, a significant variance ratio was calculated for the interaction between method of preparation and salt level (P < 5$).
A comparison of fat content percentages determined by four methods on fresh pork sausage is shown in Table 5. The lowest mean fat value was obtained by the A.O.A.C, method and the highest mean fat value was obtained by the Modified Babcock (Whalen) method. The results obtained by the Steinlite Electronic Fat Tester were closest to the A.O.A.C, results, followed by the usual Modified Babcock method. The fat per-centage of 32.03+1.02 obtained by the A.O.A.C, and the fat percentage of 33.251.23 by the Steinlite would compare favorably with the previous findings of Furgal (1954) who reported that the Steinlite method had less variation than the A.O.A.C. (P < % ) .

53
Analysis of variance showed that the fat values obtained
by each method were significantly different from each other
(P< 57o) and that the method of determination was a highly
significant source of variation. (Table 5a)
It was, however, evident that all the four methods
distinguished between the three levels of fat in ground beef
samples.
The average time in minutes taken to complete fat content
determinations exclusive of sample preparation and assembly of
apparatus was as follows:
Steinlite method 19 to 28
Modified Babcock Method 17 to 25
Modified Babcock (Whalen) Method ll to 15
A.O.A.C. Method Soxhlet Extractor 50 - 52 (hours)
Method of sample preparation had no significant effect
on the results obtained by any of the four methods although
interactions with method of determination and fat level had
been found to be significant.
Hagan et al. (1967) extracted lipids from raw beef
lean by using various solvent systems, three drying procedures
and two sample preparation methods. Their study indicated that
sample preparation had no significant effect on the results of
samples which contained higher proportions of extractable
lipid. When the results from different drying methods and
method solvent-system combinations were compared, no significant
differences in results were found, regardless of cut, between
methods of sample preparation.

54
Table 5 A Comparison of Fat Content (Percentage) Determined by Four Methods
on Fresh Pork Sausage
: A.O.A.C. s s : s : Modified s : Steinlite t Babcock :
Modified Babcock (Whalen)
33.07 33.51 35.00 35.00 31.00 32.98 34.30 35.50 31.34 33.17 33.80 35.80 32.74 33.36 34.20 35.40
Mean* 32.03a Standard n_ Deviation -
33.25b 34.32c
4.23 4.50 35.42d
4.33
•All means with same superscript are not significantly different. <P< 5$).
Table 5 (a) Fat Level in Pork Sausage by Four Methods of Determination
Analysis of Variance
: Source of Variations t
Degrees : Sum : of : of t Mean
Freedom i Squares : Squares : t : F
Total 15 29.6103 Determination Methods 3 25.2539 8.4180 23.19** Error 12 4.3564 .3630
••Probability * 1%

55
Individual variations in fat values between single
determinations for each method were encountered. These variations
could have been caused by variation in the chemical composition
of the samples; errors due to sampling, weighing of sample,
incorrect measurements of reagents, erroneous recording of results
and errors due to inadequate experience of the operator.
Comparing the results obtained by the three rapid methods
with the A.O.A.C, method, indicated that the difference in fat
values increased with increase in fat level. At the low fat
level, the difference between the lowest and highest mean fat
value was within 1.57e, at medium fat level within 1.7% and at
high fat level within 2.3% when all four methods were compared.
Critique of Pat Analysis Methods
The A.O.A.C, method for fat takes too long to be useful
for active quality control. The low fat values consistently
obtained still cause concern. Volatile components may be
responsible or ether insoluble components which are not determined
or both these factors could jointly account for the lower fat
values obtained. Bixby et al. (1954 ) have suggested that the
fat in the center of the sample may not be accessible to dry
ether.
The small sample of four to six grams used for the A.O.A.C,
method increased difficulty of getting a representative sample,
but on the other hand, results in less product being used in
the analysis.

56
The Steinlite Electronic Fat Tester method is a rapid
analytical method and the instrument is rugged enough for non-
professional handling. The unpleasant odor of the solvent with
possible harmful effects of the orthodichlorobenzene solvent
makes it less useful for in-plant operation. The harmful effects
could be minimized by using a hood and careful handling, but
the odor effects would appear difficult to eliminate. Further-
more, the instrument has to be standardized carefully each time,
and the balance knob is in the wrong place making it too easy
to reach and move accidentally
Since 50 to 100 grams of meat sample are employed for
each determination, it might be easier to take representative
samples.
A sample with high fat content seemed to be easier to
prepare for testing with the Steinlite, in that filtration was
faster, and results were obtained in twenty to thirty minutes.
On the other hand, a sample of less than 18% fat content had to
be larger, took longer to extract and filtration was not as
easy. Preliminary experiments revealed flocculation or
precipitation within the filtrate requiring further filtration
of four or five times more. The filtrate so obtained had to be
warmed up in a water bath to the desired temperature range of
75°F to 95°F. The effect of salt on samples with low fat content
included precipitation of the filtrate in the test cell, causing
an erratic drift in the meter and making it difficult at times
to obtain a reading.

57
As for the Modified Babcock method using acetic and sulfuric acid, meat samples with high content of connective tissue could be difficult to digest even with heating. Treat-ing the sample with glacial acetic acid is a predigestion and is supposed to keep the sample in contact with sulfuric acid. Preliminary experiments showed that samples with high connective tissue content separated out on addition of concentrated sulfuric acid such that the connective tissue floated in the beaker and was protected by the separated fat from the action of the acid. It took about ten minutes longer to digest some of this connective tissue without charring the sample. Adding more acid seemed to result in more discoloration. Undigested buoyant material tended to hinder separation of fat in the cream bottle especially, if the volume of material in the cream bottles filled the lower part of the bottle to the base of the stem. Prolonged centrifugation in such a case would sometimes cause a solid undesirable layer of material, making it difficult for fat to separate out into the column when water was added. The method as described by Kelley (1954) calls for Centrifuging two times. The first centrifugation immediately after digestion, where the volume is kept to a minimum, helps to sediment undigested matter and could not be sacrificed for time saving without loss of accuracy. The success of the final centrifuga-tion would depend in part on the first centrifugation. The problem of charring would be important where the meat sample is difficult to digest.
58
The uneven meniscus, especially on lower end of column,
was a problem in prepared meats and where excessive reagents
were used so that less water could be added. Use of a red
glymol indicator improved the upper meniscus and is used by
the dairy industry for Babcock determination to make the
meniscus more clearly visible.
It would be logical to suppose that weighing sample into
the bottle so as to carry on all digestion into the bottle
would minimize errors caused by transferring digested material
into the cream bottle.
Modified Babcock (.Whalen) was found to be a shorter
procedure than the usual Modified Babcock by five to seven
minutes. The procedure has less digestion problems but use of
hot concentrated Hydrochloric Acid necessitates the use of a
hood. The other reagent, dimethyl sulfoxide can be dangerous
if inhaled or if it comes into contact with skin.
Variations were noticed in temperatures of the treated
samples. The lack of uniformity in temperature control would
cause some samples to solidify during centrifugation resulting
in distorted menisci. Incorporating use of a water bath into
the procedure could be advantageous* if the co-efficient of
expansion of fat is considered significant, as it would serve
to standardize temperature. It might also be beneficial due
to the ease of reading a liquid meniscus. However, the lower
meniscus is much more clear in this procedure with ground beef
samples. For pork sausage, it was as difficult to estimate the
lower meniscus due to a "sticky, dirty" mass at the interface of
separated fat which may have been caused by the spices.
59
SUMMARY AND CONCLUSIONS
Rapid methods for the determination of fat and moisture
content of ground beef and pork sausage samples have been compared
with the official methods of analysis of the Association of
Official Analytical Chemists. Ground beef samples were prepared
in two ways (ground and mixed three times or blended in a
Waring Blender) and consisted of three levels of fat and moisture
content. Fat levels were approximately 17%, 21% and 25% for
low, medium and high, respectively.
The moisture determination balance (OHAUS) method was
compared with the A.O.A.C, method employing paper thimbles and
the A.O.A.C, method involving use of crucibles. Results were
obtained in forty minutes by using the moisture determination
balance method as against a minimum of 16 hours required with
the air oven method.
The lowest moisture values were obtained by the A.O.A.C,
(crucible) method,while the highest moisture values were obtained
by the A.O.A.C, (paper thimble) method on ground beef and pork
sausage samples, for all levels of moisture content. The results
obtained with the rapid moisture balance, more closely approached
the results of the official method using paper thimbles than
those where crucibles were employed.
Three rapid methods for the determination of fat content
in ground beef and pork sausage samples, were compared with the
A.O.A.C, method of dry ether extraction. The three methods were: Steinlite Electronic Fat Tester, regular Modified Babcock (using
60
Acetic acid and Sulfuric acid) and Modified Babcock by Whalen
(using Hydrochloric acid and Dimethylsulfoxide).
The effect of 3% added salt (sodium chloride) on the
Steinlite Electronic Fat Tester results was determined using
ground beef samples of medium fat level.
It was possible to complete fat content determinations
by the three rapid methods within thirty minutes as compared
to over fifty hours required for the complete A.O.A.C, procedure
for fat employing Soxhlet extractors.
All the methods employed for the determination of fat
and moisture content in all samples tested, differentiated
between the levels of fat and moisture consistently. In most
cases, the results of each method were significantly different
from each other.
With only one exception, the lowest mean ground beef
fat content, was obtained by A.O.A.C, method for all levels of
fat. The highest mean fat values, were obtained by the Steinlite
Electronic Fat Tester method, for all levels of fat. At low
and medium levels of fat, the Modified Babcock method (using
Acetic acid and Sulfuric acid) yielded results which compared
more closely with the A.O.A.C, method than either the Steinlite
or Modified Babcock by Whalen (using Hydrochloric acid and
Dimethyl sulfoxide).
The major source of variation in all four methods of
fat determination was found to be the level of fat in the sample.

61
Another significant source of variation was the method of deter-
mination. Method of sample preparation did not contribute
appreciable variation.
Addition of 3% sodium chloride (common salt; to ground
beef samples of medium fat level with mean fat percentage of
22.28%, significantly depressed the results obtained by the
Steinlite method by a mean fat value of 1.597o.
The results obtained by the Steinlite method for fat
content in pork sausage were more close to the A.O.A.C, method
than the Babcock methods.
From the findings of this study, it could be concluded
that the rapid fat determination methods studied could be
used with advantage in active product quality control to give
results comparable to the A.O.A.C, method within thirty minutes.
The choice of method would be considered against the
estimated level of fat in the sample to be tested>but the
added substances could be an important consideration where salt
and the Steinlite are involved.
It was apparent that for ground beef samples of low and
medium fat levels, the modified Babcock musing acetic and
sulfuric acids) method gave results identical to the A.O.A.C,
method of dry ether extraction. For the high fat level, the
modified Babcock method by Whalen could be considered more
reliable.
If all the four methods studied were considered for
fat content determinations in ground beef (15 to 25% fat) and
pork sausage samples, the modified Babcock fusing acetic and

62
sulfuric acids) would be the overall rapid method of choice. Other advantages could be readily available inexpensive apparatus, simple procedure, use of common industrial reagents and adaptability to in-plant operation.
The study showed the importance of standardization of materials and procedures in methods of chemical analysis on ground meat samples.

63
APPENDIX Table 1 (c) Moisture Content Determinations on Ground Beef
Percent Values on "as received" Basis
METHODS Moisture : A.O.A.C . (1) : A.O.A.C . (2) Moisture Balance Level : A B : A B : A B
58.41 57.85 : 52.86 57.99 : 56.70 57.00 58.82 56.87 : 56.41 56.05 : 56.80 57.00 57.06 56.91 : 57.83 58.23 : 56.60 57.10 58.06 57.65 : 57.20 59.07 : 56.80 57.00 57.95 57.83 : 58.23 58.27 t
Low 57.85 59.24 : 57.47 58.21 : 58.08 57.08 : : 57.24 57.74 : : 57.69 57.79 : : 58.17 58.19 t
58.05 58.00 : : Mean : 57.94 57.74 : 56.67 57.97 : 56.73 57.03 S.D. : 1.94 2.66 : 21.96 21.01 : 2,01 2.00
NOTE: A = Sample prepared by grinding, mixing 3 times and blended in Waring Blender.
B = Sample prepared by grinding and mixing 3 times. S.D. = Standard deviation.

64
APPENDIX
Table 1 (c) Continued.
METHODS
Moisture $ A.O.A.C . (1) i A.O.A.C . (2) : Moisture Balance
Level : A B £ A B : A B
59.41 59.91 : 58.03 58.28 t 58.20 60.00 59.76 59.87 : 59.06 59.40 t 58.10 59.80 60.06 60.28 : 58.15 58.18 i 59.50 59.50 64.33 60.75 : 59.01 59.13 i 59.00 58.80
Medium 59.86 60.02 t £
61.37 60.45 t 59.83 59.94 s i
59.64 60.63 : t
58.48 59.55 £ I Mean j 60.30 60.22 t 58.56 58.74 s 58.70 59.53 S.D. j 21.68 1 . 4 2 : 1 . 5 5 1 . 6 1 : 1 . 6 4 1 . 5 2

65
APPENDIX
Table 1 (c) Continued.
METHODS
Moisture i A.O.A. C. (1) : A.O.A.C . (2) Moisture Balance
Level : A B : A B i A B
62.45 63.53 : 60.80 59.98 : 62.40 63.80 62.78 64.10 : 61.03 61.61 i 62.50 63.00 62.64 64.06 : 61.84 62.00 $ 62.50 63.50 62.98 63.19 t 61.35 62.06 : 62.80 63.40 64.19 62.99 i 61.77 60.86 t
High 63.07 63.09 : 62.18 63.23 : 63.67 62.40 : 63.05 62.91 $ t
63.12 62.79 : t
63.39 61.28 : t
63.-10 62.98 i 1
Mean : 63.13 63.03 : 61.50 61.62 : 62.55 63.43 S.D. : 2.48 2.78 : 2.53 2l.ll ; 2.01 2.33

APPENDIX Table 3 (a) Fat Content (Percentage) Determinations on Ground Beef
A.O.A.C. Steinlite Mod. Babcock Mod. Babcock (Whalen) Level : A B : A B $ A B : A B
15.50 16.49 t 16.55 18.82 : 17.20 17.00 : 17.80 17.20 16.06 16.53 : 17.69 18.18 . 17.00 17.00 i 18.00 17.40 16.13 15.63 $ 16.71 18.78 : 16.80 16.60 : 17.20 18.00 17.06 16.62 t 17.94 18.77 : 16.40 17.60 s 16 ..60 17.00
Low 16.32 16»59 : 17.65 18.75 : 16.70 18.00 t 18.00 17.00 16.32 16.28 : 17.45 18.93 s 1 7 . 4 0 17.20 : 17.00 18.00 16.34 16.55 : 1 7 . 4 4 17.70 : 17.20 17.00 : 17.80 17.80 16.77 17.60 : 17.60 17.61 s 1 7 . 0 0 15.80 : 18.00 17.00 16.28 15.73 t i 15.77 18.12 : : :
Mean 16.26 16.61 : 17.38 18.44 $ 16.93 17.03 : 17.55 17.43 S.D. ± . 4 4 ±.75 : ±.48 ±.38 i ±.32 ±.65 i ±.54 ±.19
66

APPENDIX
Table 3 (e) Continued. % Fat Values
A.O.A.C. Steinlite Mod. Babcock Mod. Babcock (Whalen)
Level : A B $ A B t A B : A B
20.11 20.66 i 22.96 21.85 i 21.80 21.20 s 21.50 21.00 20.96 21.66 : 22.71 21.03 $ 19.20 20.00 j 20 .70 21.80 22.86 20.18 t 22 .18 22.17 i 20.50 19.20 $ 21.00 20.40 21.50 19.59 I 22.25 21.57 t 21.00 20,60 $ 21.20 20.50
Medium 20.63 20.51 : 23.00 22.25 : 21.20 20,60 : 21.50 20.50 20.45 20.34 : 22.44 21.30 t 21.20 20.80 t 20.00 23.00 22.30 20 .62 : 23.52 23.24 : 21.00 21.00 : 21.00 20.60
20.88 21.23 : 22.15 22.16 i 21 .30 19.50 t 21.20 20 .70
20.23 21.91 i 22 .18 22.17 t 19 .60 21.20 : 21.80 21.70 Mean 21.10 20.74 : 22.60 21.97 : 20 .76 20.46 : 21.10 21.13 S.D. 2.94 2.74 : r.48 2.64 . 2.84 2.52 : 2.52 2.87
67

APPENDIX
Table 3 (e) Continued % Fat Values
A.O.A.C. Steinlite Mod. Babcock Mod. Babcock (Whalen)
Level t A B : A & : A B : A B
23.86 24.65 t 27.37 26.32 : 26.50 26.50 : 26.50 25.20
24.26 25.40 . 25.86 25.55 i 25o 20 25.00 : 25.00 25.60 24.26 24.45 : 25.32 26.17 : 26.00 25.50 i 26.00 25.40
23.68 24.85 : 28.30 27.32 t 28.00 27.30 : 25.20 25.00
High 23.17 24.26 t t 25.00 25.00 24.78 24.19 t t 23.50 24.50 24.94 23.99 t £ 25.00 25.50 23.47 24.11 t £ 24.00 24.80 24.17 24.73 : t
24.25 23.63 t t
Mean 24.08 24.42 t 26.71 26.34 t 26.43 26.07 i 25.02 25.00 S.D. 2.55 2.50 s 11.37 ±.73 : ±1.18 ±1.03 : ±.96
vO no •tl
68

69
APPENDIX
Table 3 (d) DRYING CURVES FOR THE OHAUS MOISTURE DETERMINATION BALANCE.
Moisture Percentage at 1 Minute Intervals at Several Wattage Levels.
Heating Lamp at 1-1/4 Inch Mark : Grounds Ground i Ground : Ground : Ground
Time ins Water : Beef : Beef : Beef : Beef : Beef Minutes: 40W : 40W : 60W : 8 OW : 100W : 140W
0 : 0.00 0.00 0.00 0.00 0.00 0.00
1 : 1.00 0.60 1.20 1.50 2.50 3.00
2 : 3.00 3.00 2.70 3.80 6.00 6.50
3 : 6.00 5.00 6.60 7.80 10.00 11.50
4 : 9.00 9.00 10.00 11.50 14.50 17.00
5 : 12.00 12.00 13.50 15.80 20.00 22.50
6 : 17.00 15.00 16.60 20.00 25.00 28.00
7 : 21.00 18.00 20.50 25.00 30.00 33.00
8 : 25.00 24.50 29.50 34.80 38.00
9 : 28.50 24.00 27.50 34.50 39.50 42.00
10 : 33.50 28.40 31.50 38.50 43.50 46.00
ll : 36.50 30.50 34.80 42.50 47.00 49.00
12 : 40.00 33.50 37.00 46.00 50.50 52.50
13 : 44.50 40.50 49.40 52.50 55.00
14 : 47.00 38.80 43.50 52.00 56.50
15 $ 51.50 41.50 46.00 54.30 56.00 57.00
16 : 56.50 44.00 48.50 55.80 56.80 57.50
17 : 59.50 46.30 50.50 57.00 57.40 57.90
18 s 63.00 48.00 52.50 57.50 57.50 58.00
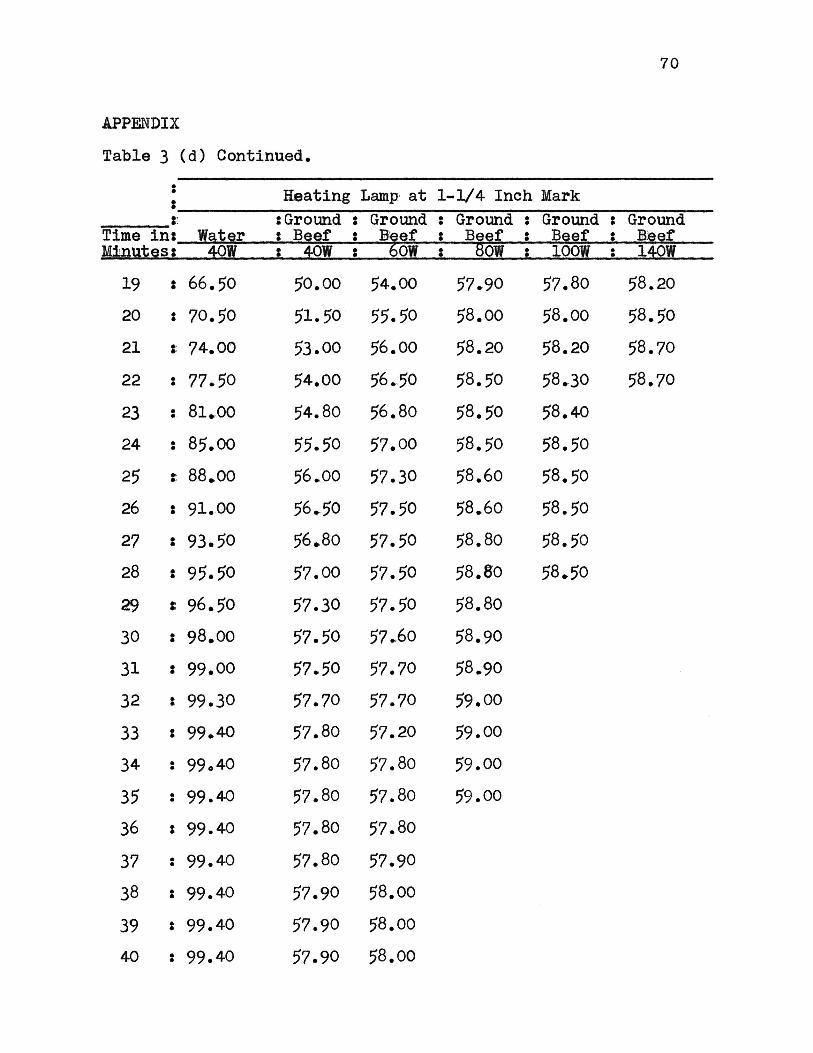
70
APPENDIX Table 3 (d) Continued.
: : Heating Lamp at 1--1/4 Inch Mark : :Ground : Ground $ Ground : Ground : Ground
Time in: Water : Beef : Beef : Beef : Beef : Beef Minutes: 40W : 40W : 6 OW : SOW : 100W : 140W
19 : 66.50 50.00 54.00 57.90 57.80 58.20 20 : 70.50 51.50 55.50 58.00 58.00 58.50 21 : 74.00 53.00 56.00 58.20 58.20 58.70 22 : 77.5 0 54.00 56.50 58.50 58.30 58.70 23 : 81.00 54.80 56.80 58.50 58.40 24 : 85.00 55.50 57.00 58.50 58.50 25 t 88.00 56.00 57.30 58.60 58.50 26 : 91.00 56.50 57.50 58.60 58.50 27 : 93.50 56.80 57.50 58.80 58.50 28 : 95.50 57.00 57.50 58.80 58.50 29 $ 96.50 57.30 57.50 58.80 30 : 98.00 57.50 57.60 58.90 31 : 99.00 57.50 57.70 58.90 32 : 99.30 57.70 57.70 59.00 33 : 99.40 57.80 57.20 59.00 34 : 99.40 57.80 57.80 59.00 35 : 99.40 57.80 57.80 59.00 36 : 99.40 57.80 57.80 37 : 99.40 57.80 57.90 38 : 99.40 57.90 58.00 39 : 99.40 57.90 58.00 40 : 99.40 57.90 58.00
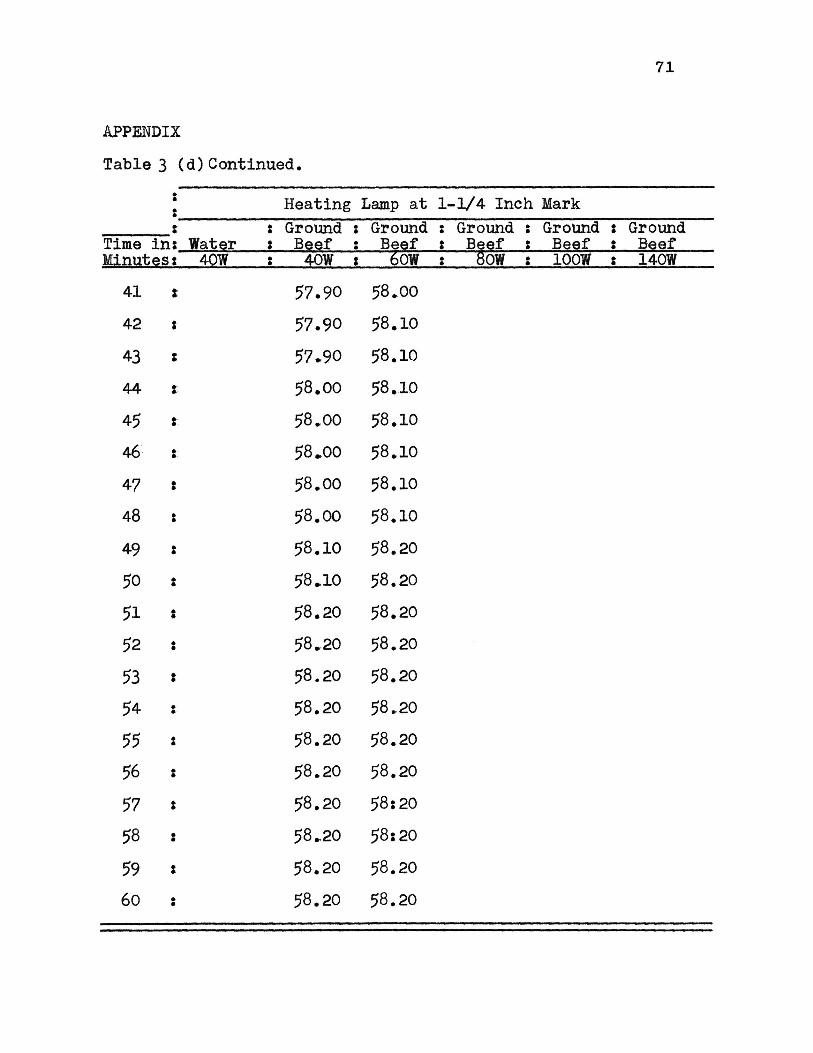
71
APPENDIX
Table 3 (d)Continued.
Heating Lamp at 1-1/4 Inch Mark t : Ground : Ground : Ground : Ground i Ground
Time in; Water : Beef : Beef : Beef : Beef : Beef Minutes :"~40W : 40W : 60W : 80W t 100W : 140W
41 t 57.90 58.00 42 : 57.90 58.10 43 $ 57.90 58.10 44 t 58.00 58.10 45 t 58.00 58.10 46 : 58.00 58.10 47 t 58.00 58.10 48 : 58.00 58.10 49 $ 58.10 58.20 50 • 58.10 58.20 51 : 58.20 58.20 52 $ 58.20 58.20 53 t 58.20 58.20 54 : 58.20 58.20 55 i 58.20 58.20 56 i 58.20 58.20 57 $ 58.20 58:20 58 : 58.20 58:20 59 : 58.20 58.20 60 * 58.20 58.20

72
EXPLANATION OF PLATE III
DRYING CURVES FOR THE OHAUS MOISTURE DETERMINATION BALANCE
See Data in Table 3 (d) in Appendix
= illustrates Drying Curve for Distilled Water at heater setting of 40W.
illustrates Drying Curve for Ground Beef Sample at 40W heater setting.
illustrates Drying Curve for Ground Beef Sample at 6OW.
-= illustrates Drying Curve for Ground Beef ' Sample at 80W heater setting.
ri = illustrates Drying Curve for Ground Beef ^ Sample at 140W.
Drying curve for Ground Beef Sample at 100W heater setting not shown: it was too close to that at 140W heater setting to be shown clearly.

73

74
ACKNOWLEDGEMENTS
The author wishes to express sincere appreciation to Professor D. H. Kropf, major professor; Dr. H. J. Tuma, Department of Animal Husbandry; and to Dr. D. C. Kelley, Department of Pathology and Veterinary Public Health, for their valuable assistance in planning this study, statistical analysis, and preparing this manuscript; and to Dr. B. Brent, Department of Animal Husbandry, for his technical assistance and advice on chemical analytical techniques. The cooperation and assistance given by Dr. T. J. Claydon, Dr. D. J. Mitchell, Dr. A. L. Iga and Mr. E. Lony, Department of Dairy and Poultry Science, was greatly appreciated.
Appreciation is also extended to Mr. D. Z. McCormick and Mrs. R. Morton, International Agricultural Programs, Mrs. Linda Semm, Mr. E. F. Bajunirwe, and Mrs. M. Hemphill for their helpful participation.
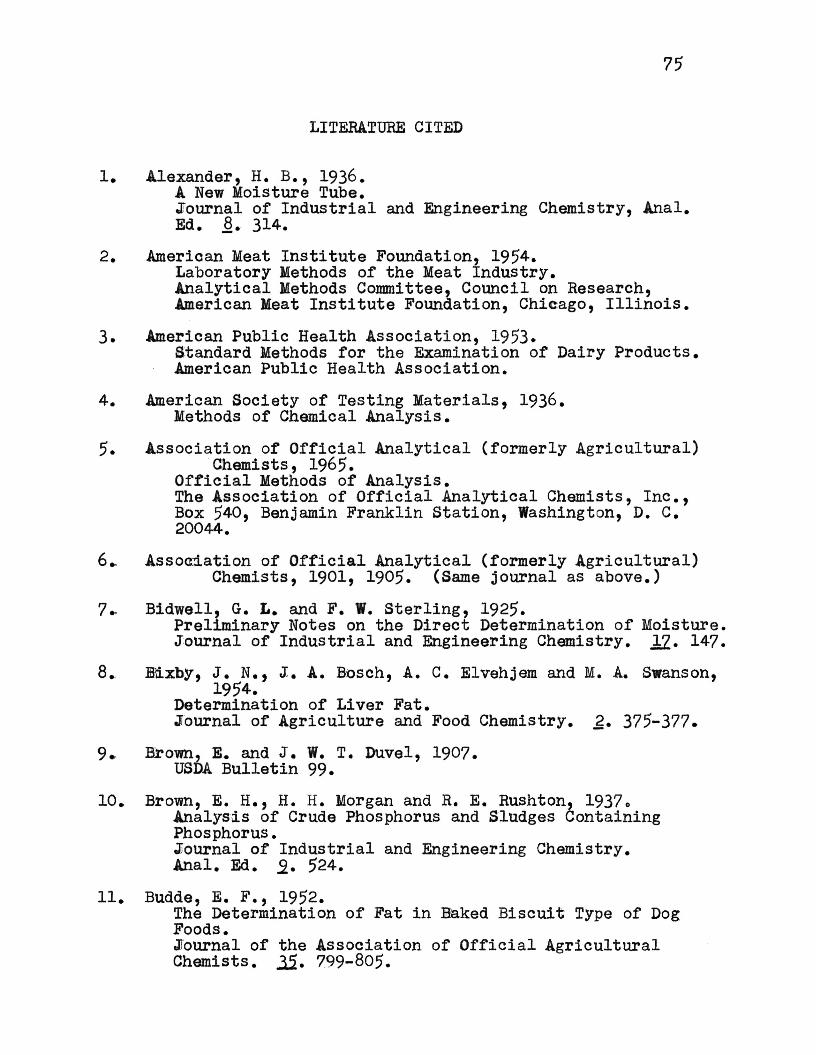
75
LITERATURE CITED
1. Alexander, H. B., 1936. A New Moisture Tube. Journal of Industrial and Engineering Chemistry, Anal. Ed. 8. 314.
2. American Meat Institute Foundation, 1954. Laboratory Methods of the Meat Industry. Analytical Methods Committee, Council on Research, American Meat Institute Foundation, Chicago, Illinois.
3. American Public Health Association, 1953. Standard Methods for the Examination of Dairy Products. American Public Health Association.
4. American Society of Testing Materials, 1936. Methods of Chemical Analysis.
5. Association of Official Analytical (formerly Agricultural) Chemists, 1965.
Official Methods of Analysis. The Association of Official Analytical Chemists, Inc., Box 540, Benjamin Franklin Station, Washington, D. C. 20044.
6. Association of Official Analytical (formerly Agricultural) Chemists, 1901, 1905. (Same journal as above.)
7. Bidwell, G. L. and F. W. Sterling, 1925. Preliminary Notes on the Direct Determination of Moisture. Journal of Industrial and Engineering Chemistry. JL2. 147.
8. Bixby, J. N., J. A. Bosch, A. C. Elvehjem and M. A. Swanson, 1954.
Determination of Liver Fat. Journal of Agriculture and Food Chemistry. 2. 375-377.
9. Brown, E. and J. W. T. Duvel, 1907. USDA Bulletin 99.
10. Brown, E. H., H. H. Morgan and R. E. Rushton, 1937. Analysis of Crude Phosphorus and Sludges Containing Phosphorus. Journal of Industrial and Engineering Chemistry. Anal. Ed. 5. 524.
11. Budde, E. F., 1952. The Determination of Fat in Baked Biscuit Type of Dog Foods. Journal of the Association of Official Agricultural Chemists. 35. 799-805.

76
12. Garter, R. J. and L. Williamson, 194-5. An Electrometric Titration Method for Water Determination Using the Karl Fischer Reagent. Analyst. 22• 369.
13. Cleland, J. E. and R. W. Fetzer, 1941. Determination of Moisture in Sugar Products - Use of Filter-cel for Corn Sirup. Journal of Industrial and Engineering Chemistry. Anal. Ed. 13. 858.
14. Copeland, V. C., 1951. The Chemical Analysis of Foods and Food Products. M. B. Jacobs (Ed.). 2nd Ed., Interscience Publishers, Inc., New York. 662.
15. Cutler, G. D., 1962. Industrial Electronics. 1*125.
16. Davis, Carl E., R. W. Ockerman and V. R. Cahill, 1966. A Rapid Approximate Analytical Method for Simultaneous Determination of Moisture and Fat in Meat and Meat Products.
17. Dean, E. W. and D. D. Stark, 1920. A Government Method for Determination of Water in Petroleum and Other Organic Emulsions. Journal of Industrial and Engineering Chemistry. 12. 486.
18. Dedlow, C. and T. D. Smith, 1926. Determination of Moisture in Meat Extract. Journal of Industrial and Engineering Chemistry. 18. 858.
19. Doty, D. M., 1962. Factors in the Control of Product Composition by Chemical Analysis. American Meat Institute Foundation. Chicago, Illinois.
20. Dudley, R. P., 1966. Preformulation and Handling of Raw Materials. Proceedings American Meat Industry Research Conference. American Meet Institute Foundation. Chicago, Illinois.
21. Duncan, D. B., 1955. Multiple Range Test. Biometrics, ll. 1-42.
22. Evans, J. E. and R. W. Fetzer, 1941. Determination of Moisture in Sugar Products. Filter Paper Method for Corn Sirup. Journal of Industrial and Engineering Chemistry. Anal. Ed. 13. 855.
23. Everson, C. W., T. Keyahian and D. M. Doty, 1955. Rapid Methods for Determination of Fat and Moisture Content in Meat Products. American Meat Institute Foundation. Bulletin No. 26.

77
24. Fetzer, W. R., 1951. Determination of Water by Distillation. Analytical Chemistry. 23. 1062.
25. Fetzer, W. R., J. W. Evans and J. B. Longenecker, 1933. Determination of Dextrin, Maltose and Dextrose in Corn Sirup. Journal of Industrial and Engineering Chemistry. Anal. Ed. 8. 51.
26. Fischer, Karl, 1935. Karl Fischer Reagent Titration. A. angev. Chem. 48. 394.
27. Fryer, R. C., 1966. Concepts and Methods of Experimental Statistics. Allyn and Bacon, Inc., Boston.
28. Furgal, H. P., 1954. Streamlined Assay Sharpens Product Control. Food Engineering. 26. 58.
29. Goss, D. D., 1965. Juice Extraction by Resistance Heating. U. S. Patent #3,178,929.
30. Hagan. N. Susie, E. W. Murphy and L. M„ Shelley, 1967. Extraction of Lipids from Raw Beef Lean by Using Various Solvent Systems. Journal of the Association of Official Analytical Chemists. j>0. 250.
31. Harris, E. P., 1930. Rapid Determination of Total Fat. Journal of Industrial and Engineering Chemistry. Anal. Ed. 2. 410.
32. Herty, C. H., F. B Stem and M. Orr, 1909. Rapid Determination of Oil in Cotton Seed. Journal of Industrial and Engineering Chemistry. 1. 76.
33. Hoffman, J. F*, 1908. Z. angev. Chem. 21. 890.
34. Johansson, A., 1949. The Microdetermination of Water. Acta. Chem. Scand. 3. 1058. Svensk Papperstidn, 3Q. No. 11B, 124 (1947).
35. Kelley. D. C., R. E. Guerrant and D. L. Mackintosh. 1954. A Study of Methods of Testing and Sampling for the Determination of Fat Content of Ground Meat. Food Technology. 3. 273.

78
36. Kelley, D. C., 1955. Title as above. M. S. Thesis. Kansas State University Library.
37. King, J. Derwin, 1966. M B Analysis of Meat Composition. Proceedings of the Meat Industry Research Conference, American Meat Institute Foundation, Chicago, Illinois.
38. Kirschenbauer, H. G., i960. Fats and Oils. Reinhold Publishing Corporation.
39. Kraybill, H. R., H. L. Bitter and 0. G. Hankins, 1952. Journal of Applied Physiology. 4:575. 40. Landmann, W. A., 1965.
Methods of Sampling Various Meat Ingredients with Respect to Accuracy, Precision and Limitations of Rapid Methods to Determine Moisture, Fat and Protein. Proceedings of the 18th Annual Recip. Meat Conference of the American Meat Science Association. National Livestock and Meat Board. Chicago, Illinois.
41. Landmann, W. A. and J. E. Maroney, 1959. Moisture and Fat in Fresh Meat Materials. American Meat Institute Foundation. Circular No. 49.
42. Lustig, Ernest, 1966. Nuclear Magnetic Resonance Spectrometry. Analytical Chemistry. 38.
43. Makower, B., S. M. Chastain and E. Nielsen, 1946. Moisture Determination in Dehydrated Vegetables -Vacuum Oven Method. Journal of Industrial and Engineering Chemistry. 380 725.
44. Marcusson, J., 1904, 1905 (1948). Mitt. kgl. Material prufungsamt. Grogs-Lichterfelde.
45. Matrozova, S., 1938. Chimie & Industrie. 40. 98I.
46. McComas, W. H. and G. A. Allen, 1949. Determination of Water by Karl Fischer Titration. Analytical Chemistry. 20. 510.
47. McComb, E. A., 1948. Determination of Moisture in Protein Materials - Use of Karl Fischer Titration. Analytical Chemistry. 20. 1219.

79
48- Mehlenbacher, V. C., 1962. Analytical Product Control. Proceedings of the 14th Research Conference. American Meat Institute. Circular No. 70.
49. Mehlenbacher, V. C., i960. Analysis of Fats and Oils. The Garrard Press. Champaign, Illinois.
50. Mitchell, J., Jr., 1940. Determination of Moisture in Native Processed Cellulose. Journal of Industrial and Engineering Chemistry. Anal. Ed. 12. 390.
51. Mitchell, J., Jr., 1940. Analytical Procedures Employing Karl Fischer Reagent. Journal of American Chemical Society. 62. 4.
52. Mitchell, J., Jr., and D. M. Smith, 1949. "Aquametry.11 New York Interscience Printers.
53. Mitchell, J., Jr., 1951. Karl Fischer Reagent Titration. Analytical Chemistry. 23. IO69.
54. Mojonnier, T. and H. C. Troy, 1965 (1925). Technical Control of Dairy Products. Mojonnier Brothers. Chicago, Illinois.
55. Nadj, L. J. and D. G. Warden, 1966. Refractometric Estimation of Total Fat in Chocolate Type Products. Analytical Chemistry. 38. 125.
56. Nair, J. H. and C. W. Schroeder, 1948. Determination of Water in Dry Food Materials. Analytical Chemistry. 20. 425.
57. National Provisioner, 1961. Electronic Unit - Simple Technique Permits Lean Determination in Three Seconds. July 29. p. 18. National Livestock and Meat Board. Chicago, Illinois.
58. Nelson, 0. A. and G. A. Hulett, 1920. Moisture Content of Cereals. Journal of Industrial and Engineering Chemistry. 12. 40.
59. Norman, W., 1925. Z. angev. Chem. 38. 380. 60. Oesting, R. B. and I. P. Kaufman, 1945.
Rapid Determination of Fat in Meat and Meat Products. Journal of Industrial and Engineering Chemistry. Anal. Ed. 12. 125.

80
61. O'Shea, J. J. and F. M. Maguire, 1962. Journal of the Association of Official Analytical Chemists. 4£. 790.
62. Ostrander, J. and L. R. Dugan. A Rapid Quantitative Lipid Extraction Method. American Meat Institute Foundation. Bulletin No. 50.
63. Pace, N. and F. N. Rathbun, 1945. The Body Water and Chemically Combined Nitrogen Content Relations to Fat Content. Journal of Biological Chemistry. 158. 667.
64. Porter, W. L. and C. 0. Willits, 1944. Moisture in Potato Starch. Journal of the Association of Official Agricultural Chemists. 2£. 179.
65. Rice, E. W., 1929. Determination of Moisture in Sugar Sirup. Journal of Industrial and Engineering Chemistry. 21. 31.
66. Rogers, J. S., 1910. USDA Bulletin #137. 172.
67. Rohrig, Amir Z., 1905. z; Nahr Genus sum. 531-8.
68. Sair, L. and W. R. Fetzer, 1942. Cereal Chemistry. 12. 633
69. Salwin, H., I. K. Bloch and J. H. Mitchell, 1955. Rapid Determination of Fat in Meat Products. Journal of Agriculture and Food Chemistry. 3. 588.
70. Schain, P., 1949. Science. 110. 121-122.
71. Schroeder, C„ W. and J. H. Nair, 1948. Determination of Water by Karl Fischer Reagent Titration. Analytical Chemistry. 20. 452.
72. Scwalbe, C. G., 1908 (1919). Z. angev. Chem. 21. 2311. Z. angev. Chem. T32. 125).
73. Simon, W., 1942. Vraunkohle. 41. 53.
74. Smith, D. M., W. Bryant and J. Mitchell, 1939. Analytical Procedures Employing Karl Fischer Reagent. Journal of American Chemical Society. 61. 2407.

75
76
77
78
79
80
81
82
83
84,
85,
8 6 ,
81
Smith, G. F., 1955. The Dualistic and Versatile Reaction Properties of Perchloric Acid. Analyst. 80. 16-29.
Smith, G. F., J. 8. Fritz and H. Pyenson, 1948. Babcock Method. Journal of Dairy Science. 31. 905.
Snedecor, G. W., 1956. Statistical Methods. 5th Edition, Iowa State College Press.
Stillman, J. W., 1951. Methods for the Determination of Water. Analytical Chemistry. 32. 1058.
Talbot, A., 1949. Rapid Estimation of Fat in Sausage and Sausage Meats. Analyst. 74. 462.
Trusler, R. B., 1940. Effect of Glycerol on Distillation. Journal of Industrial and Engineering Chemistry. Anal. Ed. 12. 509.
Urbain, M. Walter, 1966. Rapid Processing of Luncheon Meats - Principles and Problems. Proceedings of the American Meat Industry Research Conference. American Meat Institute Foundation. Chicago, Illinois.
Whalen, F., 1966. A Modified Babcock Procedure for Rapid Determination of Fat in Meats Using Dimethyl Sulfoxide. Journal of the Association of Official Agricultural Chemists. 42. 1225.
Whitehead, C. R., 1966. Rapid Fat Determinations. Proceedings of the Meat Industry Research Conference. American Meat Institute Foundation. Chicago, Illinois.
Wierbicki, E. and F. E. Deatherage. Determination of Water Holding Capacity of Fresh Meats. Journal of Agriculture and Food Chemistry. 6. 387.
Wiley, H, W., 1907. Foods and Their Adulteration. P. Blakiston's Son and Co. Philadelphia, Pa.
Williams, E. F., 1966. Analytical Distillation. Analytical Chemistry. 38. 87R.

82
87. Willits, G. 0., 1951. Methods for Determination of Moisture-Oven Drying. Analytical Chemistry. 32. 1054.
88. Windham, E. S., 1953 (1957). Report on Fat in Meat Products. Journal of the Association of Official Analytical Chemists. 36. 288 (40. 755).
89. Wistreich, H. E., J. E. Thompson and E. Karmas, 1960. Rapid Method for Moisture and Fat in Biological Materials. Analytical Chemistry. 32. 1054
90. Yamada, S. and T. Koshitaka, 1927. J. Soc. Chem. Ind. (Japan). 30. 356.
91. Zimmerman, B. G., 1945. Improved Distilling Heads. Journal of Industrial and Engineering Chemistry. Anal. Ed. 17. 815.
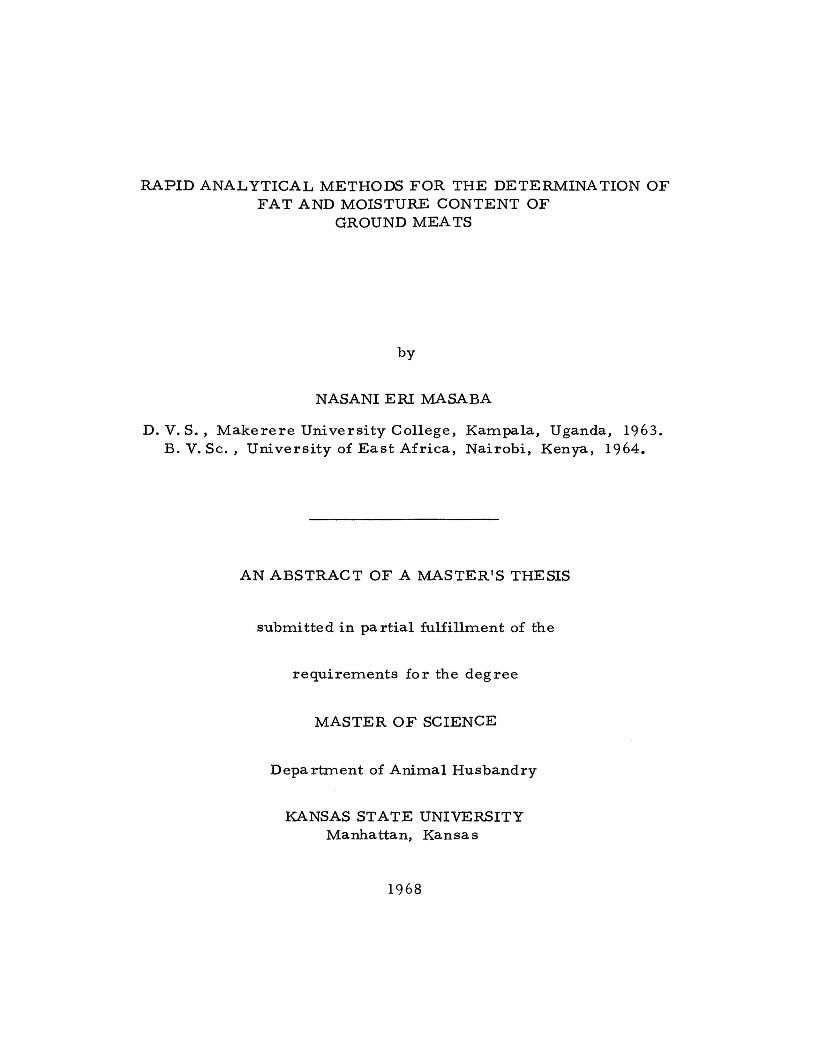
R A P I D A N A L Y T I C A L METHODS F O R T H E D E T E R M I N A T I O N O F F A T AND MOISTURE C O N T E N T O F
GROUND M E A T S
by
NASANI E R I MA SABA
D. V. S. , M a k e r e r e U n i v e r s i t y C o l l e g e , K a m p a l a , Uganda , 1963. B. V . S c . , U n i v e r s i t y of E a s t A f r i c a , N a i r o b i , Kenya , 1964.
AN A B S T R A C T O F A M A S T E R ' S THESIS
s u b m i t t e d in p a r t i a l f u l f i l l m e n t of the
r e q u i r e m e n t s f o r the d e g r e e
M A S T E R O F SCIENCE
D e p a r t m e n t of A n i m a l H u s b a n d r y
KANSAS S T A T E UNIVERSITY M a n h a t t a n , K a n s a s
1968

G r o u n d beef s a m p l e s c o n s i s t i n g of t h r e e l e v e l s of f a t and m o i s t u r e
w e r e p r e p a r e d by m i x i n g f r e s h beef shank m e a t a n d f a t . S a m p l e s w e r e
p r e p a r e d in two w a y s , n a m e l y by g r i n d i n g and m i x i n g t h r e e t i m e s o r b y
m i x i n g and b lending in a W a r i n g blender.
G r o u n d beef con ta in ing 3% s a l t w a s a l s o p r e p a r e d to t e s t e f f e c t s upon
S t e i n l i t e r e s u l t s . G r o u n d beef s a m p l e s w e r e p a c k e d in " W h i r l p a k " b a g s and
s t o r e d f r o z e n un t i l u s e d . Two s e p a r a t e lo t s of p o r k s a u s a g e w e r e s a m p l e d
on the day of the t e s t .
T h r e e m e t h o d s w e r e e m p l o y e d to d e t e r m i n e m o i s t u r e con ten t of
g r o u n d beef a n d p o r k s a u s a g e s a m p l e s u s i n g s a m p l e s of f o u r to s ix g r a m s .
T h e m o i s t u r e d e t e r m i n a t i o n b a l a n c e m e t h o d w a s c o m p a r e d with two a i r oven
d r y i n g m e t h o d s a t 100°C f o r 16-18 h o u r s . One oven d ry ing m e t h o d is an
AOAC p r o c e d u r e involv ing u s e of c r u c i b l e s and the o t h e r p r o c e d u r e invo lved
u s e of p a p e r t h i m b l e s . P o r k s a u s a g e s a m p l e s w e r e s i m i l a r l y a n a l y z e d by
a l l t h r e e m e t h o d s .
F a t con t en t d e t e r m i n a t i o n s on g round beef s a m p l e s of t h r e e f a t l e v e l s ,
a b o u t 17%, 21%, 25% a n d p r e p a r e d in two w a y s , w e r e c a r r i e d out by f o u r
m e t h o d s of f a t d e t e r m i n a t i o n . The t h r e e r a p i d m e t h o d s w e r e : the S t e in l i t e
E l e c t r o n i c F a t T e s t e r , m o d i f i e d B a b c o c k u s i n g s u l f u r i c a c i d and m o d i f i e d
B a b c o c k (Whalen) in which h y d r o c h l o r i c a c i d i s u s e d . The f o u r t h m e t h o d w a s
t h e AOAC m e t h o d of d r y e t h e r e x t r a c t i o n u s i n g Soxh le t e x t r a c t o r s . P o r k
s a u s a g e s a m p l e s w e r e s u b j e c t e d to the s a m e m e t h o d s .
Da ta w e r e a n a l y z e d by a n a l y s i s of v a r i a n c e a s ou t l ined by S n e d e c o r
(19 56). If a s i g n i f i c a n t v a r i a n c e r a t i o w a s found , D u n c a n ' s m u l t i p l e r a n g e
2
t e s t w a s u s e d to l o c a t e the d i f f e r e n c e s .
M o i s t u r e con ten t d e t e r m i n a t i o n s by the m o i s t u r e d e t e r m i n a t i o n b a l a n c e
w e r e c o m p l e t e d in f o r t y m i n u t e s a s c o m p a r e d to t w e n t y - f o u r h o u r s wi th the
oven d ry ing m e t h o d s . The l o w e s t m o i s t u r e v a l u e s w e r e o b t a i n e d by the
AOAC m e t h o d (u s ing c r u c i b l e s ) whi le the h i g h e s t m o i s t u r e v a l u e s w e r e
o b t a i n e d by the AOAC p r o c e d u r e u s i n g p a p e r t h i m b l e s . T h e r e s u l t s o b t a i n e d
wi th the r a p i d m o i s t u r e b a l a n c e m e t h o d m o r e c l o s e l y a p p r o a c h e d the r e s u l t s
of the o f f i c i a l m e t h o d u s i n g p a p e r t h i m b l e s than t h o s e w h e r e c r u c i b l e s w e r e
e m p l o y e d . M e t h o d of s a m p l e p r e p a r a t i o n did not h a v e a s i g n i f i c a n t e f f e c t on
the r e s u l t s . R e s u l t s f o r m o i s t u r e con ten t wi th p o r k s a u s a g e s a m p l e s w e r e of
s i m i l a r p a t t e r n to t h o s e of g r o u n d beef s a m p l e s . E a c h m e t h o d d i f f e r e n t i a t e d
b e t w e e n m o i s t u r e l e v e l s c o n s i s t e n t l y .
F a t con ten t d e t e r m i n a t i o n s by the t h r e e r a p i d m e t h o d s w e r e c o m p l e t e d
w i t h i n t h i r t y m i n u t e s a s c o m p a r e d to o v e r 50 h o u r s f o r the AOAC m e t h o d .
T h e f a t va lues ob t a ined by the AOAC m e t h o d on g r o u n d beef s a m p l e s w e r e the
l o w e s t and by the S t e i n l i t e m e t h o d w e r e the h i g h e s t .
A l l t he m e t h o d s d i f f e r e n t i a t e d b e t w e e n the l e v e l s of f a t c o n s i s t e n t l y .
A t low and m e d i u m f a t l e v e l s , m o d i f i e d B a b c o c k r e s u l t s w e r e c l o s e to the
r e s u l t s ob ta ined by the AOAC m e t h o d , b u t the r e s u l t s o b t a i n e d by the S t e i n l i t e
a n d m o d i f i e d B a b c o c k b y W h a l e n w e r e s i g n i f i c a n t l y h i g h e r than the AOAC
r e s u l t s , t he S t e i n l i t e r e g i s t e r i n g the h i g h e s t v a l u e s . A t the h igh f a t l e v e l ,
the m o d i f i e d B a b c o c k (Whalen) r e s u l t s w e r e c l o s e s t to the AOAC r e s u l t s
a l t hough s i g n i f i c a n t l y h i g h e r .

3
Addi t ion of 3% s a l t to g r o u n d beef s a m p l e s c a u s e d a s i g n i f i c a n t
d e p r e s s i o n in the r e s u l t s ob ta ined by the S t e i n l i t e . The m e t h o d of s a m p l e
p r e p a r a t i o n h a d no s i g n i f i c a n t e f f e c t on the r e s u l t s of a n y f a t m e t h o d .
When p o r k s a u s a g e w a s a n a l y z e d f o r f a t con ten t b y the s a m e f o u r
m e t h o d s , s i g n i f i c a n t d i f f e r e n c e s w e r e n o t e d b e t w e e n a l l m e t h o d s . L o w e s t
f a t con ten t r e s u l t s w e r e ob t a ined by the AOAC m e t h o d with s u c c e s s i v e l y
h i g h e r r e s u l t s by the S t e in l i t e E l e c t r o n i c F a t T e s t e r , m o d i f i e d B a b c o c k and
m o d i f i e d B a b c o c k (Whalen) m e t h o d s .
Copyright © 2022 FDOKUMEN