Application of different analytical methods for determination of volatile chlorination by-products...
10
Talanta 56 (2002) 717–726 Application of different analytical methods for determination of volatile chlorination by-products in drinking water Anastasia D. Nikolaou *, Themistokles D. Lekkas, Spyros K. Golfinopoulos, Maria N. Kostopoulou Water and Air Quality Laboratory, Department of Enironmental Studies, Uniersity of the Aegean, Karadoni 17, 81100 Mytilene, Greece Received 27 June 2001; received in revised form 25 October 2001; accepted 26 October 2001 Abstract Four analytical methods have been applied for the determination of volatile chlorination by-products in drinking water, based on the following techniques: liquid – liquid extraction – gas chromatography – electron capture detection (LLE–GC–ECD); liquid–liquid extraction–gas chromatography–mass spectrometry (LLE–GC–MS); purge and trap – gas chromatography – mass spectrometry (purge and trap – GC – MS); and headspace-gas chromatography – mass spectrometry (headspace – GC – MS). The compounds studied were trihalomethanes, haloacetonitriles, haloketones, chloral hydrate and chloropicrin. LLE – GC – ECD method proved to be the most sensitive for determination of all compounds studied, followed by LLE–GC–MS. Purge and trap–GC–MS method gave good results in the case of trihalomethanes, but had high detection limits for the other volatile chlorination by-products. Headspace – GC – MS method had acceptable recoveries for trihalomethanes, but the detection limits were higher. © 2002 Elsevier Science B.V. All rights reserved. Keywords: Chlorination by-products; Trihalomethanes; Haloacetonitriles; Haloketones www.elsevier.com/locate/talanta 1. Introduction The major class of volatile chlorination by- products in drinking water is that of tri- halomethanes (THMs), which was also the first category of disinfection by-products identified in water [1 – 4]. Other categories of volatile chlorina- tion by-products frequently occurring in drinking water are haloacetonitriles, haloketones, chloral hydrate and chloropicrin [5–14]. These com- pounds have drawn significant scientific attention during the last decades, due to the adverse health effects they may have on human beings (Table 1) [13–18]. The maximum contaminant level of 100 gl −1 for total trihalomethanes concentration in drink- ing water, set by the US Environmental Protec- * Corresponding author. Tel.: +30-251-36227; fax: +30- 251-36226. E-mail address: [email protected] (A.D. Nikolaou). 0039-9140/02/$ - see front matter © 2002 Elsevier Science B.V. All rights reserved. PII:S0039-9140(01)00613-0
Transcript of Application of different analytical methods for determination of volatile chlorination by-products...

Talanta 56 (2002) 717–726
Application of different analytical methods fordetermination of volatile chlorination by-products in
drinking water
Anastasia D. Nikolaou *, Themistokles D. Lekkas, Spyros K. Golfinopoulos,Maria N. Kostopoulou
Water and Air Quality Laboratory, Department of En�ironmental Studies, Uni�ersity of the Aegean, Karadoni 17,81100 Mytilene, Greece
Received 27 June 2001; received in revised form 25 October 2001; accepted 26 October 2001
Abstract
Four analytical methods have been applied for the determination of volatile chlorination by-products in drinkingwater, based on the following techniques: liquid–liquid extraction–gas chromatography–electron capture detection(LLE–GC–ECD); liquid–liquid extraction–gas chromatography–mass spectrometry (LLE–GC–MS); purge andtrap–gas chromatography–mass spectrometry (purge and trap–GC–MS); and headspace-gas chromatography–massspectrometry (headspace–GC–MS). The compounds studied were trihalomethanes, haloacetonitriles, haloketones,chloral hydrate and chloropicrin. LLE–GC–ECD method proved to be the most sensitive for determination of allcompounds studied, followed by LLE–GC–MS. Purge and trap–GC–MS method gave good results in the case oftrihalomethanes, but had high detection limits for the other volatile chlorination by-products. Headspace–GC–MSmethod had acceptable recoveries for trihalomethanes, but the detection limits were higher. © 2002 Elsevier ScienceB.V. All rights reserved.
Keywords: Chlorination by-products; Trihalomethanes; Haloacetonitriles; Haloketones
www.elsevier.com/locate/talanta
1. Introduction
The major class of volatile chlorination by-products in drinking water is that of tri-halomethanes (THMs), which was also the firstcategory of disinfection by-products identified in
water [1–4]. Other categories of volatile chlorina-tion by-products frequently occurring in drinkingwater are haloacetonitriles, haloketones, chloralhydrate and chloropicrin [5–14]. These com-pounds have drawn significant scientific attentionduring the last decades, due to the adverse healtheffects they may have on human beings (Table 1)[13–18].
The maximum contaminant level of 100 �g l−1
for total trihalomethanes concentration in drink-ing water, set by the US Environmental Protec-
* Corresponding author. Tel.: +30-251-36227; fax: +30-251-36226.
E-mail address: [email protected] (A.D. Nikolaou).
0039-9140/02/$ - see front matter © 2002 Elsevier Science B.V. All rights reserved.
PII: S 0039 -9140 (01 )00613 -0

A.D. Nikolaou et al. / Talanta 56 (2002) 717–726718
tion Agency (USEPA) in 1979, was later loweredto 80 �g l−1. Reduction of this level to 40 �g l−1
is being considered [19]. Chloropicrin,dichloroacetonitrile, trichloroacetonitrile and di-bromoacetonitrile are going to be regulated by theEPA [16]. The World Health Organization(WHO) has also set quality target levels for theconcentrations of chlorination by-products indrinking water (Table 1) [20].
The techniques used for determination ofvolatile chlorination by products in drinking wa-ter include sample pretreatment with liquid– liq-uid extraction (LLE), headspace [21], closed loopstripping apparatus [22] or purge and trap [23–26]followed by gas chromatographic separation withelectron capture detector (ECD) or mass spec-trometer detector (MSD) [12,27–35].
This paper presents the application and com-parison of four analytical methods for the deter-mination of volatile organic chlorinationby-products in drinking water.
2. Experimental
Glassware: All glassware used during analysiswas washed with detergent, rinsed with tap water,ultrapure water (Millipore: Milli-Ro 5 plus and
Milli Q plus 185) and acetone (MallinckrodtChemical Works, St. Louis) and placed in an ovenat 150 °C for 2 h.
2.1. LLE–GC–ECD method
2.1.1. Standard solutionsStock solutions were prepared in 10 ml volu-
metric flasks containing methanol purge and trapgrade (Sigma–Aldrich) by addition of appropriatealiquots of certified trihalomethanes, haloketones,haloacetonitriles, chloropicrin and chloral hydratestandards (Chemservice, purity �99%). Thesestock solutions were used to prepare a solutionwith all the studied chlorination by-products 100mg l−1 in methanol. Known volumes of the latterwere injected into ultrapure water (Millipore:Milli-Ro 5 plus and Milli Q plus 185) in order toobtain standard solutions of concentrations rang-ing from 0.25 to 100.00 �g l−1. All stock solutionsin methanol were stored at 4 °C.
2.1.2. Sample preparationA modification of EPA Method 551.1 was per-
formed [36]. Six grams sodium sulfate anhydrous(Merck) and 2 ml methyl-tert-butyl ether (MTBE)(Merck, for organic trace analysis) were added to35 ml of chlorination by-products solution in a 40ml glass vial capped with PTFE-faced silica sep-tum (Pierce 13075). The vial was sealed andshaken by hand for 1 min and left undisturbed for2 min. One microliter of the ether phase was theninjected into the gas chromatograph.
2.1.3. ApparatusA Hewlett–Packard gas chromatograph 5890
Series II with a 63Ni electron capture detector(ECD) was used. The carrier gas was helium andthe make-up gas nitrogen. The column used wasfused silica DB-1, 30 m×0.32 mm i.d.×0.25 �mfilm thickness. The injection technique was split/splitless. The analytical conditions of the gaschromatograph are presented in Table 2. Chro-matograms of standard solutions of tri-halomethanes and other volatile chlorinationby-products are shown in Figs. 1 and 2,respectively.
Table 1Cancer group classification and quality target levels set by theWHO for chlorination by-products
Compound WHO guidelinesCancer group(�g l−1)(EPA)a
B2Chloroform 200B2 60Dichlorobromomethane
Dibromochloromethane C 100Bromoform 100B2
C 90DichloroacetonitrileCDibromoacetonitrile 100
–bChloral hydrate C
a Group B2, probable human carcinogen (sufficient datafrom animal studies); Group C, possible human carcinogen.
b Not regulated.

A.D. Nikolaou et al. / Talanta 56 (2002) 717–726 719
Table 2Analytical conditions of the GC–ECD, GC–MS, purge andtrap–GC–MS and headspace–GC–MS methods for the deter-mination of volatile chlorination by-products
1. LLE–GC–ECDmethodCarrier gas flow 1.6 ml min−1
Oven temperature 39 °C (12 min)Injector 175 °C
temperature1:25Split ratio
Detector 300 °Ctemperature
2. LLE–GC–MSmethod
Carrier gas flow 1.3 ml min−1
Oven temperature 35 °C (9 min)to 40 °C (3 min) at 1 °C min−1
to 150 °C at 6 °C min−1
175 °CInjectortemperature
Split ratio 1:2514 minSolvent delay
MS temperature 280 °C2200EMV
Acquisition mode SIM83, 85 (chloroform, CHCl3)Selected ions108, 110 (trichloroacetonitrile, TCAN)83, 85 (dichlorobromomethane,CHCl2Br)82, 111, 113 (chloral hydrate, CH)82 (dichloroacetonitrile, DCAN)43 (1,1-dichloropropanone, 1,1-DCP)117, 119, 82 (chloropicrin, CP)129, 127 (dibromochloromethane,CHClBr2)155, 157 (bromochloroacetonitrile,BCAN)125, 97, 83 (1,1,1-trichloropropanone,1,1,1-TCP)126 (1,3-dichloropropanone, 1,3-DCP)173, 254 (bromoform, CHBr3)118, 199 (dibromoacetonitrile, DBAN)100 msDwell per ion
3. Purge andtrap–GC–MSmethod
44 ml min−1 He, 11 min, 30 °CPurge250 °C for 3 min (preheat 245 °C)Desorb260 °C for 8 minBakeLine 200 °C, valve 200 °C, moistureTemperaturescontrol system 120 °C
Gas chromatograph conditions as described above inSection 2.2Mass spectrometer conditions as described above inSection 2.2, except for solvent delay. Here solvent delay iszero
2.2. LLE–GC–MS method
Standard solutions and samples were preparedas described in the previous paragraph (LLE–GC–ECD method).
2.2.1. ApparatusA Hewlett–Packard gas chromatograph 5890
Series II coupled with a Hewlett–Packard massselective detector 5971 was used. The carrier gaswas helium. The column was a fused silica capil-lary HP-VOC (60 m×0.32 mm×1.8 �m) and theinjection technique was split/splitless. The analyti-cal conditions of the gas chromatograph and themass spectrometer are presented in Table 2. Theanalysis was performed in several smaller groupsbased on elution time. The first ion mentionedwas the one used for quantitation in each case.Chromatogram of a standard solution of chlori-nation by-products is shown in Fig. 3.
2.3. Purge and trap–GC–MS method
2.3.1. Standard solutionsStandard solutions for the other volatile chlori-
nation by-products were prepared as described inSection 2.1 (LLE–GC–ECD method) in order toobtain standard solutions with final concentra-tions 0.10, 0.25, 0.50, 1.00, 2.00, 5.00 and 10.00�g l−1. These solutions were used for system cali-bration and were always analyzed within 12 h.
2.3.2. ApparatusA Hewlett–Packard purge and trap concentra-
tor 7695 coupled with a Hewlett–Packard gaschromatograph 5890 Series II and a Hewlett–Packard mass selective detector 5971 was used.The purge and trap concentrator was supportedby the HP G1909 P&T control software. The gaschromatograph–mass spectrometer were sup-ported by the HP G1034C system software. Thecarrier gas was helium. The column of the gaschromatograph was fused silica capillary HP-VOC (60 m×0.32 mm×1.8 �m). The adsorbenttrap (30 cm) of the purge and trap concentratorwas Vocarb 3000. The analytical conditions of thepurge and trap concentrator, the gas chro-matograph and the mass spectrometer [37] arepresented in Table 2.

A.D. Nikolaou et al. / Talanta 56 (2002) 717–726720
2.4. Headspace–GC–MS method
2.4.1. Standard solutionsStandard solutions of volatile chlorination by-
products were prepared as described in Section2.1 (LLE–GC–ECD method).
2.4.2. Sample preparationStandard solutions (8 ml) were placed in 10 ml
flat base headspace vials (23 mm×46 mm×20mm crimp) and immediately capped with 20 mm
aluminum silver seals with PTFE gray butyl rub-ber septa. The vials were placed in a water bath at45 °C for 40 min. Then, a 500 �l aliquot of thegas phase above the solution was withdrawn witha gas-tight syringe after piercing the septa andinjected into the gas chromatograph.
2.4.3. ApparatusThe instrumentation and the analytical condi-
tions used were the same as in Section 2.2 (LLE–GC–MS method) and are presented in Table 2.
Fig. 1. GC–ECD chromotagram of trihalomethanes (extract of 5 �g l−1 solution). 1, chloroform; 2, dichlorobromomethane; 3,dichlorobromomethane; and 4, bromoform.
Fig. 2. GC–ECD chromotagram of chlorination by-products (extract of 5 �g l−1 solution). 1, Monochloroacetonitrile; 2,trichloroacetonitrile; 3, dichloroacetonitrile; 4, chloralhydrate; 5, 1,1-dichloropropanone; 6, monobromoacetonitrile; 7, chloropicrin;8, bromochloroacetonitrile; 9, 1,1,1-trichloropropanone; 10, 1,3-dichloropropanone; 11, dibromoacetonitrile.

A.D. Nikolaou et al. / Talanta 56 (2002) 717–726 721
Fig. 3. GC–MS chromotagram of chlorination by-products (extract of 5 �g l−1 solution). 1, Chloroform; 2, trichloroacetonitrile;3, dichlorobromomethane; 4, chloral hydrate; 5, dichloroacetonitrile; 6, 1,1-dichloropropanone; 7, chloropicrin; 8, dibro-mochloromethane; 9, bromochloroacetonitrile; 10, 1,1,1-trichloropropanone; 11, 1,3-dichloropropanone; 12, bromoform; 13, dibro-moacetonitrile.
2.5. Statistical analysis
Statistical analysis of the results was performedby use of STATGRAPHICS 4.0 and included Kol-mogorov–Smirnov tests for distribution fittingand one-way analysis of variance (ANOVA) todetermine whether the differences between therecoveries and detection limits of the differentmethods applied are statistically significant or not.Wherever statistically significant difference wasobserved, least significant difference (LSD) testswere applied, in order to determine the sub-groups of data which belong to a different popu-lation [38].
3. Results and discussion
3.1. E�aluation of the methods
3.1.1. LLE–GC–ECD methodThe mean recovery and relative standard devia-
tion of LLE–GC–ECD method for the determi-nation of volatile chlorination by-products,estimated at five concentration levels rangingfrom 0.5 to 20 �g l−1 (five replicates at each level)are presented in Table 4. Percent recovery was
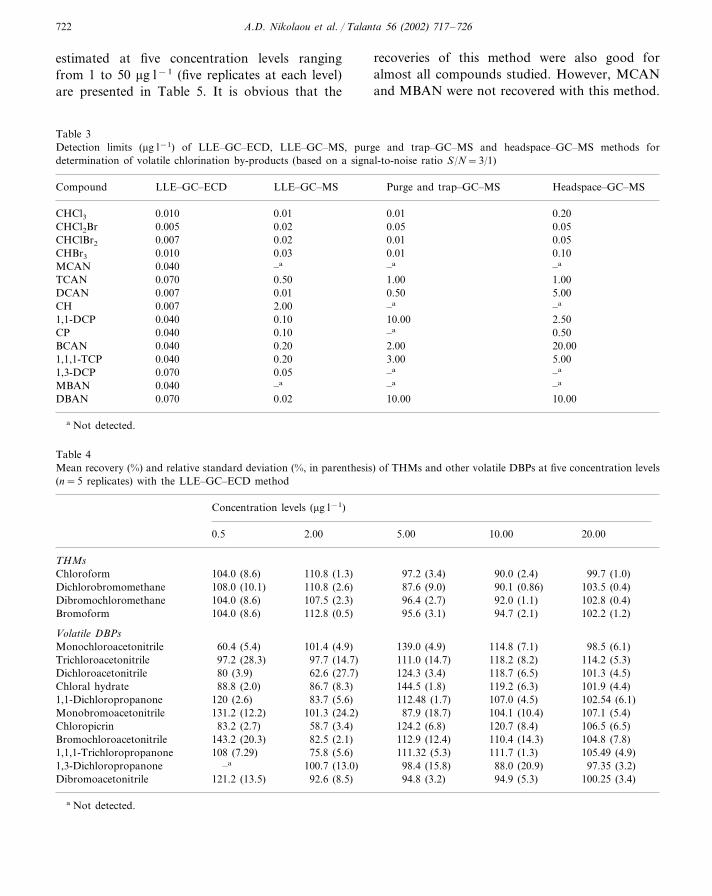
estimated using the equation P=100(A−B)%/T,where B=background concentration, A=con-centration determined after addition of the com-pound and T= true value of addition [39]. It canbe observed that the method had good recoveriesfor almost all compounds tested. For tri-halomethanes recoveries ranged from 87.6%(dichlorobromomethane) to 112.8% (bromoform).For the other volatile DBPs the range was 60.4%(MCAN) to 144.5% (CH). 1,3-Dichloro-propanone was not recovered at concentrationsbelow 0.5 �g l−1. Low recoveries ofmonochloroacetonitrile and 1,3-DCP with thismethod have also been reported by Cancho et al.[40]. The detection limits of LLE–GC–ECDmethod, presented in Table 3, ranged from 0.005�g l−1 (CHCl2Br) to 0.070 �g l−1 (TCAN, 1,3-DCP and DBAN) and, in comparison to thosereported by Chen and Weisel [32], who performedLLE with pentane, are lower for trihalomethanesand similar for the other volatile chlorinationby-products.
3.1.2. LLE–GC–MS methodThe mean recovery and relative standard devia-
tion of the LLE–GC–MS method for the deter-mination of volatile chlorination by-products,
A.D. Nikolaou et al. / Talanta 56 (2002) 717–726722
estimated at five concentration levels rangingfrom 1 to 50 �g l−1 (five replicates at each level)are presented in Table 5. It is obvious that the
recoveries of this method were also good foralmost all compounds studied. However, MCANand MBAN were not recovered with this method.
Table 3Detection limits (�g l−1) of LLE–GC–ECD, LLE–GC–MS, purge and trap–GC–MS and headspace–GC–MS methods fordetermination of volatile chlorination by-products (based on a signal-to-noise ratio S/N=3/1)
Compound LLE–GC–MS Purge and trap–GC–MS Headspace–GC–MSLLE–GC–ECD
0.010 0.01 0.01 0.20CHCl30.050.050.02CHCl2Br 0.005
CHClBr2 0.010.007 0.050.020.010 0.03CHBr3 0.01 0.100.040MCAN –a–a–a
1.00 1.00TCAN 0.070 0.500.010.007 0.50 5.00DCAN
–aCH –a0.007 2.000.0401,1-DCP 2.500.10 10.00
CP 0.50–a0.040 0.102.00 20.00BCAN 0.040 0.203.00 5.001,1,1-TCP 0.040 0.20
–a–a0.051,3-DCP 0.070–a –aMBAN 0.040 –a
10.00DBAN 0.070 0.02 10.00
a Not detected.
Table 4Mean recovery (%) and relative standard deviation (%, in parenthesis) of THMs and other volatile DBPs at five concentration levels(n=5 replicates) with the LLE–GC–ECD method
Concentration levels (�g l−1)
2.00 5.00 10.00 20.000.5
THMs104.0 (8.6) 110.8 (1.3) 99.7 (1.0)97.2 (3.4)Chloroform 90.0 (2.4)
110.8 (2.6) 87.6 (9.0) 90.1 (0.86) 103.5 (0.4)Dichlorobromomethane 108.0 (10.1)107.5 (2.3)Dibromochloromethane 96.4 (2.7)104.0 (8.6) 92.0 (1.1) 102.8 (0.4)
104.0 (8.6)Bromoform 112.8 (0.5) 95.6 (3.1) 94.7 (2.1) 102.2 (1.2)
Volatile DBPs101.4 (4.9) 139.0 (4.9) 114.8 (7.1)Monochloroacetonitrile 98.5 (6.1)60.4 (5.4)
97.2 (28.3)Trichloroacetonitrile 114.2 (5.3)97.7 (14.7) 118.2 (8.2)111.0 (14.7)Dichloroacetonitrile 124.3 (3.4) 118.7 (6.5) 101.3 (4.5)62.6 (27.7)80 (3.9)
86.7 (8.3) 144.5 (1.8)Chloral hydrate 119.2 (6.3)88.8 (2.0) 101.9 (4.4)83.7 (5.6) 112.48 (1.7)1,1-Dichloropropanone 107.0 (4.5)120 (2.6) 102.54 (6.1)
107.1 (5.4)Monobromoacetonitrile 131.2 (12.2) 104.1 (10.4)101.3 (24.2) 87.9 (18.7)Chloropicrin 124.2 (6.8) 120.7 (8.4) 106.5 (6.5)58.7 (3.4)83.2 (2.7)
82.5 (2.1) 112.9 (12.4)Bromochloroacetonitrile 110.4 (14.3)143.2 (20.3) 104.8 (7.8)108 (7.29)1,1,1-Trichloropropanone 75.8 (5.6) 111.32 (5.3) 111.7 (1.3) 105.49 (4.9)
100.7 (13.0) 98.4 (15.8)1,3-Dichloropropanone 88.0 (20.9)–a 97.35 (3.2)Dibromoacetonitrile 100.25 (3.4)94.9 (5.3)94.8 (3.2)121.2 (13.5) 92.6 (8.5)
a Not detected.

A.D. Nikolaou et al. / Talanta 56 (2002) 717–726 723
Table 5Mean recovery (%) and relative standard deviation (%, in parenthesis) of THMs and other volatile DBPs at five concentration levels(n=5 replicates) with the LLE–GC–MS method
Concentration levels (�g l−1)
4.00 10.001.00 25.00 50.00
THMs110.5 (8.1) 138.4 (4.4) 130.7 (5.1) 95.1 (3.4)Chloroform 100.0 (33.2)125.5 (10.7) 137.4 (4.1)84.0 (34.3) 129.6 (5.6)Dichlorobromomethane 96.2 (4.0)
78 (21.1)Dibromochloromethane 114.5 (10.9) 128.8 (4.6) 123.0 (6.2) 98.8 (4.3)121.5 (10.9) 127.6 (4.9) 119.5 (6.5)92.0 (37.9) 100.3 (4.1)Bromoform
Volatile DBPs117.5 (7.2) 122.0 (4.4)120.0 (37.4) 119.2 (5.0)Trichloroacetonitrile 98.9 (4.3)111.0 (2.6)Dichloroacetonitrile 98.8 (22.1)78.0 (5.7) 101.2 (0.8) 103.0 (5.3)
93.5 (20.6) 81.0 (22.9)48.0 (30.9) 106.8 (7.1)Chloral hydrate 106.4 (4.6)116.0 (31.4)1,1-Dichloropropanone 84.0 (22.4) 118.0 (31.2) 114.3 (9.5) 100.6 (2.9)
Chloropicrin 102.5 (8.6)132.0 (18.1) 117.0 (3.5) 114.9 (4.5) 99.1 (4.4)98.5 (2.8) 122.4 (2.5)100 (14.1) 97.92 (2.3)Bromochloroacetonitrile 106.6 (7.1)73.0 (6.1) 114.0 (4.7)1,1,1-Trichloropropanone 104.4 (1.9)106.0 (8.4) 105.2 (5.2)
130.5 (23.3) 72.6 (31.3)112.0 (42.5) 134.8 (15.6)1,3-Dichloropropanone 128.9 (1.3)120.0 (23.5)Dibromoacetonitrile 102.0 (2.1) 120.4 (2.1) 96.9 (3.7) 102.6 (7.4)
For trihalomethanes the range of recoveries was78% (dibromochloromethane) to 138.4% (chloro-form). For the other volatile DBPs the meanrecoveries ranged from 48% (CH) to 132% (CP).The detection limits of LLE–GC–MS method arepresented in Table 3 and were higher than thoseof LLE–GC–ECD method for all compoundsexcept for 1,3-DCP and DBAN. The detectionlimits ranged from 0.01 (CHCl3 and DCAN) to 2�g l−1 (CH). ECD detector is generally moresensitive than MS as regards halogenated organiccompounds [39]. However, the main advantage ofMS detection is the ability to certify the com-pounds detected in the samples.
3.1.3. Purge and trap–GC–MS methodThis technique, compared to the liquid-liquid
extraction, has the advantage of minimization ofuse of solvents during analysis, thus eliminatinglarge volumes of harmful wastes. In addition, asignificant amount of time and effort requestedfor sample preparation is saved. However, leakingmay often occur in the system, especially at thesparger and at the bottom of the trap, as has beenreported by Roose and Brinkman, who also pro-posed a technical improvement of the device [41].
Optimization of the analytical conditions of thepurge and trap–GC–MS method has been previ-ously described by Nikolaou et al. [42]. Themethod is very useful for the determination oftrihalomethanes, but not sensitive enough for thedetermination of the other volatile chlorinationby-products at the range of concentrations theyusually occur in drinking water. The detectionlimits of the purge and trap–GC–MS method areshown in Table 3 and are low for trihalomethanes(0.01 �g l−1 for CHCl3, CHClBr2 and CHBr3 and0.05 �g l−1 for CHCl2Br), but high for the othervolatile chlorination by-products. Specifically, thedetection limit is 0.5 �g l−1 for DCAN, 1 �g l−1
for TCAN, 2 �g l−1 for BCAN, 3 �g l−1 for1,1,1-TCP and 10 �g l−1 for 1,1-DCP andDBAN. MCAN, CH, CP, 1,3-DCP and MBANwere not recovered with this method, probablydue to inability of the particular trap to effectivelyretain these compounds or due to decompositionreactions in some cases [35]. Higher detectionlimits for trihalomethanes with a purge and trapmethod have been reported by Kampioti andStephanou [43]. In the same study, the othervolatile chlorination by-products were found to beunmeasurable with this technique. The mean re-

A.D. Nikolaou et al. / Talanta 56 (2002) 717–726724
covery and relative standard deviation of thepurge and trap–GC–MS method for the determi-nation of volatile chlorination by-products, esti-mated at seven concentration levels, ranging from0.1 to 40 �g l−1 (five replicates at each level) arepresented in Table 6. The mean recoveries rangedfrom 86% (CHCl3) to 124% (CHCl2Br).
3.1.4. Headspace–GC–MS methodThis method also avoids use of solvents and
production of wastes. However, it has been re-ported to have relatively low recoveries [21,40].The detection limits of the headspace–GC–MSmethod are shown in Table 3. For tri-halomethanes the detection limits are 0.05 �g l−1
for CHCl2Br and CHClBr2, 0.1 �g l−1 for CHBr3
and 0.2 �g l−1 for CHCl3. For the other volatilechlorination by-products the detection limits weresignificantly higher. Specifically, the detectionlimit is 5 �g l−1 for DCAN, 1 �g l−1 for TCAN,0.5 �g l−1 for CP, 20 �g l−1 for BCAN, 5 �g l−1
for 1,1,1-TCP, 2.5 �g l−1 for 1,1-DCP and 10
�g l−1 for DBAN. MCAN, CH, 1,3-DCP andMBAN were not recovered with this method. Fortrihalomethanes the average recovery and relativestandard deviation, estimated at five concentra-tion levels ranging from 0.5 to 10 �g l−1 (fivereplicates at each level) are presented in Table 7.The mean recovery ranged from 88.4% (CHCl3)to 99.1% (CHBr3). The recovery values and thedetection limits are comparable to those reportedby Kuivinen and Johnsson [21] for headspace–GC–ECD method.
3.2. Comparison of the methods
The LLE–GC–ECD method proved to be themost sensitive one for determination of all volatilechlorination by-products tested in this study, hav-ing the highest recoveries and the lowest detectionlimits. The only exceptions are 1,3-DCP andDBAN, with lower detection limits with theLLE–GC–MS method. LLE–GC–MS method isalso a sensitive method for determination of al-
Table 6Mean recovery (%) and relative standard deviation (%, in parenthesis) of THMs at seven concentration levels (n=5 replicates) withthe purge and Trap–GC–MS method
Concentration levels (�g l−1)
0.500.10 1.00 40.0020.0010.005.00
THMs97 (3.4)86 (13.2)96 (9.3) 109.1 (0.4)102 (4.3)CHCl3 108.7 (1.0)92 (3.7)
106 (12.6) 103.8 (0.1)96 (9.3) 124 (12.2) 87 (9.0) 99 (4.2)CHCl2Br 103.8 (1.0)95.7 (0.8) 95.8 (0.7)CHClBr2 96 (9.3)104 (8.6) 88 (9.5) 96 (2.7) 89 (3.8)92.7 (0.8) 93.8 (0.7)96 (9.3)CHBr3 88 (9.5)102 (4.3) 96 (3.1) 89 (4.9)
Table 7Mean recovery (%), relative standard deviation (in parenthesis) of THMs at five concentration levels with the headspace–GC–MSmethod
Concentrations levels (�g l−1)
1.0 2.0 5.00.5 10.0
THMs100 (0.0)CHCl3 46 (24.8) 79 (23.4) 104 (20.7) 112 (14.2)104 (16.0) 88 (9.5)CHCl2Br 70 (17.5) 121 (12.4)105 (16.7)
74 (12.0)100 (14.1) 89 (10.0)CHClBr2 102 (13.1) 123 (11.8)112 (39.1)CHBr3 82 (5.4) 86 (11.2) 96 (10.5) 120 (9.7)

A.D. Nikolaou et al. / Talanta 56 (2002) 717–726 725
Table 8Results of the ANOVA technique for the detection limits and recoveries of DBPs by use of different analytical methods
Parameter F-ratioDegrees of freedom F0.05 F0.01 Significance level
4.96 4.38Detection limits of chlorination by-products (log)a 8.1819 0.0390b
0.13 4.38 8.18 0.7230Recoveries of chlorination by-productsa 195.25 3.0615 4.89Detection limits of THMc 0.0152b
Recoveries of THMc 81.6415 3.06 4.89 0.0000b
a Analysis for the methods LLE–GC–ECD and LLE–GC–MS.b Statistically significant difference (significance level �0.05).c Analysis for all four methods applied.
most all of the chlorination by-products studied,although with slightly higher detection limits formost of them. However, MCAN and MBANcannot be determined with this method. Applica-tion of the ANOVA technique showed statisticallysignificant difference between the detection limitsof LLE–GC–ECD and LLE–GC–MS methods,confirming the observed results (Table 8). How-ever, there was not statistically significant differ-ence between recoveries of these two methods.Purge and trap–GC–MS method proved to besuitable only for determination of tri-halomethanes, with low detection limits and highrecoveries, but cannot be used for determinationof the other volatile chlorination by-products,since MCAN, CH, CP, 1,3-DCP and MBAN arenot recovered, while the detection limits for theother compounds are high, ranging from 0.5 to 10�g l−1. Haloacetonitriles and haloketones havebeen reported to occur in drinking waters usuallyat concentrations below 1 �g l−1 [6–8,10,12,14].The headspace–GC–MS method was the onewith the highest detection limits for tri-halomethanes, statistically confirmed by ANOVAtechnique (Table 8), and the recoveries with thismethod were slightly lower than with the threeother methods. However, the detection limits forvolatile DBPs other than trihalomethanes werehigh, as in the case of the purge and trap–GC–MS method, making the method not applicablefor determination of these compounds in traceconcentrations in drinking water. MoreoverMCAN, CH, 1,3-DCP and MBAN are not recov-ered with this method. Blank samples were ana-lyzed with all methods and no interferences werepresent.
4. Conclusions
Four analytical techniques have been appliedfor the determination of volatile chlorination by-products (trihalomethanes, haloacetonitriles,haloketones, chloral hydrate and chloropicrin) indrinking water:(a) Liquid– liquid extraction–gas chromatogra-
phy–electron capture detection (LLE–GC–ECD);
(b) Liquid– liquid extraction–gas chromatogra-phy–mass spectrometry (LLE–GC–MS);
(c) Purge and trap–gas chromatography–massspectrometry (purge and trap–GC–MS);
(d) Headspace–gas chromatography–mass spec-trometry (headspace–GC–MS).
LLE–GC–ECD method proved to be the mostsensitive for determination of all compounds stud-ied, followed by LLE–GC–MS. Exceptions arethe compounds 1,3-DCP and DBAN, with lowerdetection limits with the LLE–GC–MS method.MCAN and MBAN cannot be determined withthe LLE–GC–MS method.
Purge and trap–GC–MS method gave goodresults in the case of trihalomethanes, but hadhigh detection limits for the other volatile chlori-nation by-products, which usually occur in drink-ing water at very low concentrations.
Headspace–GC–MS method had acceptablerecoveries for trihalomethanes, but the de-tection limits were higher. For the other volatilechlorination by-products the detection limits ofthis method are even higher, making this methodunsuitable for their determination in drinkingwater.
A.D. Nikolaou et al. / Talanta 56 (2002) 717–726726
Acknowledgements
This research was financed by the Athens Wa-ter and Sewage Corporation. The authors wouldlike to thank Mr Philippos Tzoumerkas who is inthe charge of the Water Quality Control inAthens treatment plants for his scientific and tech-nical assistance.
References
[1] J.J. Rook, Water Treat. Exam. 23 (1974) 234–243.[2] T.A. Bellar, J.J. Lichtenberg, R.C. Kroner, J. AWWA 66
(1974) 703–711.[3] J.M. Symons, T.A. Bellar, J.K. Carswell, J. Demarco,
K.L. Kropp, G.G. Robeck, D.R. Seeger, S.J. Slocum, B.L.Smith, A.A. Stevens, J. AWWA 67 (1975) 634.
[4] H. Arora, M.W. LeChevallier, K.L. Dixon, J. AWWA 89(1997) 60–68.
[5] B.G. Oliver, Environ. Sci. Technol. 17 (1983) 80–83.[6] S.W. Krasner, M.J. McGuire, J.G. Jacangelo, N.L. Pata-
nia, K.M. Reagan, E.M. Aieta, J. AWWA 81 (1989)41–53.
[7] D.T. Williams, G.L. LeBel, F.M. Benoit, Chemosphere 34(1997) 299–316.
[8] A.D. Nikolaou, M.N. Kostopoulou, T.D. Lekkas, GlobalNest: Int. J. 1 (1990) 143–156.
[9] E.C. Nieminski, S. Chaudhuri, S.-T. Lamoreaux, J.AWWA 85 (1993) 98–105.
[10] G.L. LeBel, F.M. Benoit, D.T. Williams, Chemosphere 34(1997) 2301–2317.
[11] D.T. Williams, F.M. Benoit, G.L. LeBel, Environmetrics9 (1998) 555–563.
[12] K.J. Simpson, K.P. Hayes, Water Res. 32 (1998) 1522–1528.
[13] T.D. Lekkas, Environmental Engineering I: Water re-sources management, University of the Aegean, Depart-ment of Environmental Studies, Mytilene, 1996.
[14] S.K. Golfinopoulos, A.D. Nikolaou, Environ. Sci. HealthA36 (2001) 483–499.
[15] AWWA, Water Quality and Treatment: A Handbook ofCommunity Water Supplies, 4th ed., McGraw-Hill, NewYork, 1990, pp. 135–145.
[16] EPA Drinking Water Regulations and Health Advisories,1996. [http://www.epa.gov/ostwater/Tools/dwstds0.html-dwstds7.html].
[17] R.J. Bull, M. Robinson, Water chlorination: Chemistry,Environmental Impact and Health Effects, (vol. 5), Lewis,Boca Raton, FL, pp. 221-227.
[18] EPA, National Primary Drinking Water Regulations: Dis-infectants and Disinfection By-Products Notice of DataAvailability; Office of Ground Water and Drinking Water,1998. [http://www.epa.gov/OGWDW/mdbp/dis.html].
[19] J.A. Roberson, J.E. Cromwell, S.W. Krasner, M.J.
McGuire, D.M. Owen, S. Regli, R.S. Summers, J. AWWA87 (1995) 46–57.
[20] WHO, Desinfection de l’eau, Local authorities, Healthand Environment briefing pamphlet series, No. 3, 1995.
[21] J. Kuivinen, H. Johnsson, Water Res. 33 (1999) 1201–1208.
[22] A. Bruchet, Water chlorination: Chemistry, Environmen-tal Impact and Health Effects, vol. 5, Lewis, Boca Raton,FL, 1986, pp. 1165–1184.
[23] H.J. Brass, J. AWWA 74 (1982) 107–112.[24] B.K Koch, S.W. Krasner, M.J. Sclimenti, W.K. Schimpff,
J. AWWA 83 (1991) 62–70.[25] E. Diamadopoulos, D. Sakellariadis, E. Koukouraki, Wa-
ter Res. 32 (1998) 3325–3330.[26] M. Karadanelli, S. Golfinopoulos, A. Kotrikla, G. Pavlo-
georgatos, N. Xilourgidis, Ch. Makri, G. Kolokithas, D.Lekkas, A. Nikolaou, Proceedings of the InternationalConference on Protection and Restoration of the Environ-ment IV, vol. 1, Halkidiki, Greece, 1998.
[27] A.A. Stevens, D.R. Seeger, C.J. Slocum, M.M. Domino,J. AWWA 73 (1981) 548–554.
[28] D.A. Reckhow, P.C. Singer, J. AWWA 82 (1990) 173–180.
[29] L. Tan, G.L. Amy, J. AWWA 83 (1991) 74–79.[30] N.M. Fayad, J. AWWA 85 (1993) 46–50.[31] P.C. Singer, A. Obolensky, A. Greiner, J. AWWA 87
(1995) 83–92.[32] W.J. Chen, C.P. Weisel, J. AWWA 90 (1998) 151–163.[33] S.K. Golfinopoulos, N.K. Xylourgidis, M.N. Kostopou-
lou, T.D. Lekkas, Water Res. 32 (1998) 2821–2829.[34] A.D. Nikolaou, S.K. Golfinopoulos, M.N. Kostopoulou,
T.D. Lekkas, Chemosphere 41 (2000) 1149–1154.[35] A.D. Nikolaou, T.D. Lekkas, M.N. Kostopoulou, S.K.
Golfinopoulos, Chemosphere 44 (2001) 907–912.[36] EPA, EPA Method 551.1. Determination of chlorinated
disinfection by-products, chlorinated solvents, and halo-genated pesticides/herbicides in drinking water by liquid-liquid extraction and gas chromatography with electroncapture detection, USEPA, Office of Water, TechnicalSupport Center, 26 W, Martin Luther King Drive, Cincin-nati, OH 45268, 1998.
[37] S.K. Golfinopoulos, T.D. Lekkas, A.D. Nikolaou,Chemosphere 45 (2001) 275–284.
[38] J.H. Zar, Biostatistical Analysis, Prentice-Hall, Engle-wood Cliffs, NJ, 1984.
[39] APHA, Purge and trap–GC–MS method—quality con-trol, Standard Methods for the Examination of Water andWastewater, 18th ed., 1992, pp. 6–24.
[40] B. Cancho, F. Ventura, M. Galceran, M. Bull, Environ.Contam. Toxicol. 63 (1999) 610–617.
[41] P. Roose, U.A.T. Brinkman, Analyst 123 (1998) 2167–2173.
[42] A.D. Nikolaou, S.K. Golfinopoulos, M.N. Kostopoulou,T.D. Lekkas, Proceedings of the International Conferenceon Instrumental Methods of Analysis—Modern Trendsand Applications, IMA99, Chalkidiki Makedonia, Greece,1999, pp. 19–22.
[43] A.A. Kampioti, E.G. Stephanou, J. Chromatogr. A 857(1999) 217–229.