8.1 Form Zbus for the circuit of Fig. 8.13 after removing node ...
Upload
khangminh22Category
view
1download
0
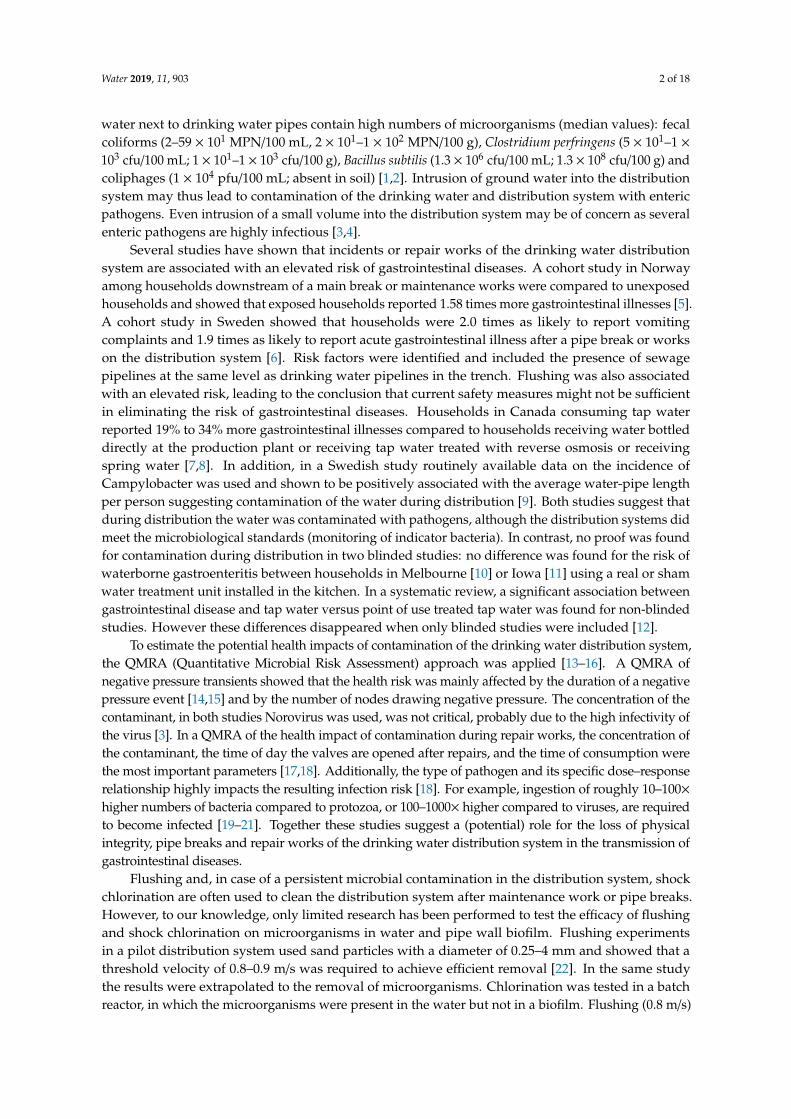
water
Article
Efficacy of Flushing and Chlorination in RemovingMicroorganisms from a Pilot Drinking WaterDistribution System
Nikki van Bel 1,*, Luc M. Hornstra 1, Anita van der Veen 1 and Gertjan Medema 1,2
1 KWR Watercycle Research Institute, P.O. Box 1072, 3430 BB Nieuwegein, The Netherlands;[email protected] (L.M.H.); [email protected] (A.v.d.V.);[email protected] (G.M.)
2 Sanitary Engineering, Department of Water Management, Faculty of Civil Engineering and Geosciences,Delft University of Technology, P.O. Box 5048, 2600 GA Delft, The Netherlands
* Correspondence: [email protected]; Tel.: +31-30-606-9516
Received: 22 March 2019; Accepted: 24 April 2019; Published: 29 April 2019�����������������
Abstract: To ensure delivery of microbiologically safe drinking water, the physical integrity ofthe distribution system is an important control measure. During repair works or an incident thedrinking water pipe is open and microbiologically contaminated water or soil may enter. Beforetaking the pipe back into service it must be cleaned. The efficacy of flushing and shock chlorinationwas tested using a model pipe-loop system with a natural or cultured biofilm to which a microbialcontamination (Escherichia coli, Clostridium perfringens spores and phiX174) was added. On average,flushing removed 1.5–2.7 log microorganisms from the water, but not the biofilm. In addition, sandadded to the system was not completely removed. Flushing velocity (0.3 or 1.5 m/s) did not affectthe efficacy. Shock chlorination (10 mg/L, 1–24 h) was very effective against E. coli and phiX174, butC. perfringens spores were partly resistant. Chlorination was slightly more effective in pipes with anatural compared to a cultured biofilm. Flushing alone is thus not sufficient after high risk repairworks or incidents, and shock chlorination should be considered to remove microorganisms to ensuremicrobiologically safe drinking water. Prevention via hygienic working procedures, localizing andisolating the contamination source and issuing boil water advisories remain important, especiallyduring confirmed contamination events.
Keywords: chlorination; flushing; drinking water distribution system; water quality; contamination; cleaning
1. Introduction
Due to extensive purification of ground water or surface water, the level of pathogenicmicroorganisms and indicator organisms are absent in detectable levels in treated drinking water.To ensure that microbial safety of drinking water is maintained during distribution, the two mostimportant control measures are the physical integrity of the distribution system and a continuouslyhigh water-pressure. These measures combined prevent the intrusion of contaminated water carryingpathogenic microorganisms in the distribution system. If these two requirements are not met, a chlorineresidual in the distribution system may protect the drinking water to some extent to intrusion ofmicroorganisms. The drinking water in the Netherlands is distributed without a chlorine disinfectionresidual, which requires extra vigilance during repair works or incidents. If small cracks are presentand the water pressure is reduced, for example due to a pipe break or pressure transients, groundwater may leak into the distribution system [1]. During repair works or incidents contamination mayoccur as well, despite the hygienic procedures that are in place. Sewage and drinking water pipesare often present in the underground and are close to each other. For that reason the soil and ground
Water 2019, 11, 903; doi:10.3390/w11050903 www.mdpi.com/journal/water
Water 2019, 11, 903 2 of 18
water next to drinking water pipes contain high numbers of microorganisms (median values): fecalcoliforms (2–59 × 101 MPN/100 mL, 2 × 101–1 × 10² MPN/100 g), Clostridium perfringens (5 × 101–1 ×10³ cfu/100 mL; 1 × 101–1 × 10³ cfu/100 g), Bacillus subtilis (1.3 × 10⁶ cfu/100 mL; 1.3 × 10⁸ cfu/100 g) andcoliphages (1 × 10⁴ pfu/100 mL; absent in soil) [1,2]. Intrusion of ground water into the distributionsystem may thus lead to contamination of the drinking water and distribution system with entericpathogens. Even intrusion of a small volume into the distribution system may be of concern as severalenteric pathogens are highly infectious [3,4].
Several studies have shown that incidents or repair works of the drinking water distributionsystem are associated with an elevated risk of gastrointestinal diseases. A cohort study in Norwayamong households downstream of a main break or maintenance works were compared to unexposedhouseholds and showed that exposed households reported 1.58 times more gastrointestinal illnesses [5].A cohort study in Sweden showed that households were 2.0 times as likely to report vomitingcomplaints and 1.9 times as likely to report acute gastrointestinal illness after a pipe break or workson the distribution system [6]. Risk factors were identified and included the presence of sewagepipelines at the same level as drinking water pipelines in the trench. Flushing was also associatedwith an elevated risk, leading to the conclusion that current safety measures might not be sufficientin eliminating the risk of gastrointestinal diseases. Households in Canada consuming tap waterreported 19% to 34% more gastrointestinal illnesses compared to households receiving water bottleddirectly at the production plant or receiving tap water treated with reverse osmosis or receivingspring water [7,8]. In addition, in a Swedish study routinely available data on the incidence ofCampylobacter was used and shown to be positively associated with the average water-pipe lengthper person suggesting contamination of the water during distribution [9]. Both studies suggest thatduring distribution the water was contaminated with pathogens, although the distribution systems didmeet the microbiological standards (monitoring of indicator bacteria). In contrast, no proof was foundfor contamination during distribution in two blinded studies: no difference was found for the risk ofwaterborne gastroenteritis between households in Melbourne [10] or Iowa [11] using a real or shamwater treatment unit installed in the kitchen. In a systematic review, a significant association betweengastrointestinal disease and tap water versus point of use treated tap water was found for non-blindedstudies. However these differences disappeared when only blinded studies were included [12].
To estimate the potential health impacts of contamination of the drinking water distribution system,the QMRA (Quantitative Microbial Risk Assessment) approach was applied [13–16]. A QMRA ofnegative pressure transients showed that the health risk was mainly affected by the duration of a negativepressure event [14,15] and by the number of nodes drawing negative pressure. The concentration of thecontaminant, in both studies Norovirus was used, was not critical, probably due to the high infectivity ofthe virus [3]. In a QMRA of the health impact of contamination during repair works, the concentration ofthe contaminant, the time of day the valves are opened after repairs, and the time of consumption werethe most important parameters [17,18]. Additionally, the type of pathogen and its specific dose–responserelationship highly impacts the resulting infection risk [18]. For example, ingestion of roughly 10–100×higher numbers of bacteria compared to protozoa, or 100–1000× higher compared to viruses, are requiredto become infected [19–21]. Together these studies suggest a (potential) role for the loss of physicalintegrity, pipe breaks and repair works of the drinking water distribution system in the transmission ofgastrointestinal diseases.
Flushing and, in case of a persistent microbial contamination in the distribution system, shockchlorination are often used to clean the distribution system after maintenance work or pipe breaks.However, to our knowledge, only limited research has been performed to test the efficacy of flushingand shock chlorination on microorganisms in water and pipe wall biofilm. Flushing experimentsin a pilot distribution system used sand particles with a diameter of 0.25–4 mm and showed that athreshold velocity of 0.8–0.9 m/s was required to achieve efficient removal [22]. In the same studythe results were extrapolated to the removal of microorganisms. Chlorination was tested in a batchreactor, in which the microorganisms were present in the water but not in a biofilm. Flushing (0.8 m/s)
Water 2019, 11, 903 3 of 18
does not remove Bacillus subtilis from the biofilm of a cement-lined ductile iron pipe, whereas shockchlorination (200 mg/L, 2 h) in the same pilot distribution system led to a modest 1.2–1.4 log removalfrom the biofilm [23]. However, removal from the water was not tested.
After cleaning the distribution system using flushing or chlorination, drinking water companieswant to put the distribution system back into service as quickly as possible. Current practice is thatthe cleaned area can be put back into service after the monitoring of the water for the fecal indicatorsE. coli and enterococci shows that these are absent. To ensure the safety of the consumers and to be ableto restore normal water distribution, it is important that monitoring can be performed quickly afterthe cleaning regime is finished and that monitoring is optimized in such a way that the probabilityof detecting fecal indicators (if present) is as high as possible. Currently, a sample is taken from aconvenient tap in the vicinity of the cleaned network, but information about the impact of time andplace of sampling on the probability of picking up residual fecal indicators is lacking.
In this paper we used a model pipe-loop system, in which a biofilm was cultured, to study (i) theinfluence of the waiting time between flushing of the system and sampling the water and (ii) theeffect of the distance between sampling point and point of contamination. This knowledge is used tounderpin the sampling strategy after flushing in which the waiting time should be as short as possiblewithout decreasing the probability of detecting the fecal indicators. We extend the knowledge on theefficacy of flushing and shock chlorination in removal of a microbial contamination from drinkingwater pipes. Both flushing and shock chlorination were tested in a model pipe-loop system containingpipes with a cultured biofilm or pipes with an old and natural biofilm that were excavated from thedrinking water distribution system. Flushing was tested using several conditions (flushing velocityand flushed water volume) and chlorination was tested for several time periods. Following this, wedescribe the application of these results to real-life situations.
2. Materials and Methods
Experiments were carried out with Escherichia coli (E. coli WR1, NCTC 13167), Enterococcusfaecium (E. faecium WR63, NCTC 13169), Clostridium perfringens (C. perfringens D10, NCTC 13170) spores,somatic coliphage phiX174 (ATCC 13706-B1) and bacteriophage MS2 (ATCC 15597-B1). E. coli is themost commonly studied microorganism and also the one most often used as a bacterial indicator offecal pollution in drinking water. Bacteriophages are used in this study as an alternative for entericviruses, due to their match in morphology and biological properties [24]. The efficacy of chlorinedisinfection of the distribution system depends on several factors including the chlorine concentration,contact time and the type of microorganism. Therefore several types of microorganisms were selectedrepresenting bacteria (E. coli), bacterial spores (C. perfringens spores) and viruses (the bacteriophagephiX174), and also representing a spectrum of chlorine-sensitivity, from sensitive (E. coli) to insensitive(spores of C. perfringens). For analysis of the optimal sampling strategy, the fecal indicator bacteriaE. coli and enterococci were used. These two indicators are routinely monitored and monitoring iscompulsory after works in the distribution system. A water sample of 100 mL should be negative forboth bacteria.
E. coli and Enterococcus faecium used to test the optimal sampling strategy (experiments A1–A4,Table 1), were grown in mineral medium supplied with glucose and potassium nitrate, respectivelyglucose and brain heart infusion broth. Growth at 22 ◦C was monitored by streak-plating on Lab LemcoAgar (LLA) plates. When the maximum colony count was reached the bacterial suspensions were storedat 4 ◦C until use. One suspension of each bacterium was prepared and used in all experiments. Shortlybefore each experiment the colony counts were determined on a specific medium: Laurylsulphate agar(LSA) for E. coli and Slanetz and Bartley agar (S&B) for Enterococcus faecium. The E. coli colony countswere determined according to NEN-EN-ISO 9308-1 using membrane filtration (0.45 µm pore size), orstreak-plating of the sample on LSA-agar plates. Agar plates were incubated for 5 h at 25 ◦C followedby 14 h at 36 ◦C. The Enterococcus faecium colony counts were determined on S&B agar for 48 h at36 ◦C, according to NEN-EN-ISO 7899-2. MS2 F-specific bacteriophages were purchased via GAP
Water 2019, 11, 903 4 of 18
EnviroMicrobial Services. The number of MS2 was determined according to the double-agar layermethod in NEN-ISO 10705-1. In short, decimal dilutions of the sample containing MS2 was mixedwith the host bacterium Salmonella typhimurium WG49 in log-phase and semi-solid Tryptone-YeastExtract-Glucose agar. The mixture was immediately spread on an agar plate and allowed to solidify.Incubation was performed at 36 ◦C for 24 h. The heterotrophic plate count (HPC) was determinedaccording to NEN-EN-ISO 6222. The sample is mixed with dissolved plate count agar solution andpoured into a petri dish. The sample is incubated at 22 ◦C for 68 h.
Table 1. Flushing conditions to determine the optimal sampling strategy.
ContaminationE. coli Enterococci MS2
FlushingTotal cfu Total cfu Total pfu
A1 Water 1.2 × 10¹⁰ 8.1 × 10⁸ 1.3 × 10¹¹ 1.27 m/s, 2.5 volA2 Water 5.3 × 10⁹ 4.0 × 10⁸ 9.7 × 10¹⁰ 1.27 m/s, 2.5 volA3 Sand and Water 1.1 × 10¹⁰ 2.6 × 10⁸ 1.7 × 10¹¹ 1.27 m/s, 2.5 volA4 Water 2.6 × 10¹⁰ 7.4 × 10⁸ 1.0 × 10¹¹ 0.45 m/s, 0.9 vol
For the flushing and chlorination experiments (experiments B1–B5 and C1–C3, Tables 2 and 3),E. coli bacteria were grown in Lab Lemco Broth (LLB) for 72 h at 36 ◦C. Growth medium was removedby washing the bacteria three times in sterile tap water. The number of E. coli bacteria in the suspensionwas determined on LSA agar plates as described above. For each experiment the bacteria were freshlyprepared. C. perfringens D10 was cultured on Perfringens agar base (PAB), after which the colonieswere aseptically transferred to sterile tap water. To induce sporulation of the bacteria, the bacteria wereincubated for two weeks at 36 ◦C after which the spores were stored at 4 ◦C. One spore suspensionwas prepared and used for all experiments. A few days before each experiment the number of sporesin the suspension was determined according to NEN-ISO 6461. In short, prior to enumeration thesample was heated at 60 ◦C for 30 min to kill vegetative bacteria. The colony count was determinedusing membrane filtration or streak-plating on PAB agar plates at 36 ◦C for 24 to 48 h. phiX174 somaticcoliphages were grown by infection of an E. coli WG5 culture with phiX174 for 5 h at 36 ◦C. The growthmedium was removed by centrifugation and ultrafiltration. One suspension of phiX174 coliphageswas prepared and used for all experiments. A few days before each experiment the number of phiX174in the suspension was determined according to NEN-ISO 10705-2. The sample was mixed with E. coliWG5 in log-phase and semi-solid Modified Scholtens Agar, spread immediately on an agar plate andallowed to solidify. Incubation was performed at 36 ◦C for 24 h.
Table 2. Conditions to determine the efficacy of flushing and chlorination on the removal microorganismsfrom the water and biofilm.
E. coli Clostridium D10 phiX174 Flushing FreeChlorineTotal cfu cfu/mL Total cfu cfu/mL Total pfu pfu/mL
B1 7.5 × 10¹⁰ 9.4 × 10⁵ 2.6 × 10⁸ 3.3 × 10³ - - 1.5 m/s, 3 vol 10 mg/L,0–24 h
B2 6.3 × 10¹⁰ 5.7 × 10⁵ 8.4 × 10⁸ 7.6 × 10³ 1.0 × 10¹¹ 9.1 × 10⁵ 1.5 m/s, 3 vol 10.5 mg/L,0–24 h
B3 7.9 × 10¹⁰ 7.2 × 10⁵ 2.0 × 10⁹ 1.8 × 10⁴ 5.4 × 10¹⁰ 5.0 × 10⁵ 1.0 m/s, 3 vol –
B4 7.5 × 10¹¹ 6.8 × 10⁶ 3.4 × 10⁸ 3.1 × 10³ 9.4 × 10¹⁰ 8.5 × 10⁵ 0.3 m/s,3–6–10–15 vol
10 mg/L,0–24 h
B5 5.2 × 10⁸ 5.7 × 10¹⁰ 1.5 × 10⁷ 1.7 × 10⁹ 4.0 × 10⁸ 4.4 × 10¹⁰
0.3 m/s,3–6–10–15 vol;
1.5 m/s,3–6–10–15 vol
-
Water 2019, 11, 903 5 of 18
Table 3. Experimental conditions to determine the efficacy of flushing and chlorination on the removalof microorganisms from the water and biofilm from real-world pipe segments with a natural biofilm.
E. coli C. perfringens phiX174 Flushing FreeChlorineTotal cfu cfu/mL Total cfu cfu/mL Total pfu pfu/mL
C1 5.0 × 10¹⁰ 4.5 × 10⁵ 1.0 × 10⁹ 9.2 × 10⁹ 6.7 × 10¹⁰ 6.1 × 10⁵ 1.5 m/s, 3 vol 10 mg/L,0–24 h
C2 7.5 × 10¹⁰ 5.8 × 10⁵ 3.2 × 10⁹ 2.9 × 10⁴ 4.0 × 10¹⁰ 3.7 × 10⁵ 1.5 m/s, 3 vol 10 mg/L,0–24 h
C3 1.0 × 10¹¹ 9.5 × 10⁵ 3.0 × 10⁹ 2.7 × 10⁴ 4.7 × 10¹⁰ 4.3 × 10⁵ 0.3 m/s,3–6–10–15 vol
10 mg/L,0–24 h
To determine the adenosine triphosphate (ATP) concentration in the samples luciferin andluciferase were added. In the presence of ATP luciferin is degraded by luciferase during this processlight is produced and measured in a luminometer. For measuring the iron concentration the watersample was treated with nitric acid according to NEN-EN-ISO 15587-2:2002. The concentration of thereleased iron determined using inductively coupled plasma mass spectrometer (ICP-MS).
Analyses of the biofilm were performed by swabbing roughly 7 cm of pipe wall biofilm (all sides),1–2 cm pipe wall biofilm at the start of the pipe segment was not swabbed. For swabbing multiplesterile cotton swabs were used. Of each pipe the swabbed surface area was calculated. The swabswere pooled in 40 mL sterile tap water and the biomass was released from the swab by low-energysonification using a Branson Sonifier ultrasonic cell disruptor for 2 min at 40-kHz and 90-Watt poweroutput (equivalent to 45% amplitude). During sonification the mixture was kept on ice. In the resultingwater sample the required parameters were determined.
Die-off kinetics of all microorganisms were determined in tap water to which a concentrationof microorganisms was added in similar concentrations as to the pipe-loop system. The water wasincubated for 24–72 h at 22 ◦C, the number of microorganisms was determined several times duringthis period.
In some of the experiments an artificial biofilm was cultured in the pipe-loop system prior to theexperiment. To achieve a reproducible biofilm acetate (NaCH3COO, 10 µg C/L), nitrate (KNO3, 2 µgN/L) and phosphate (KH2PO4, 0.1 µg P/L) were added to the water. After continuous circulation of thewater at 0.1 m/s in the pilot system for two weeks the biofilm and water were analyzed for ATP andHPC. The system was drained and flushed on low speed to remove remaining nutrients before startingthe experiment.
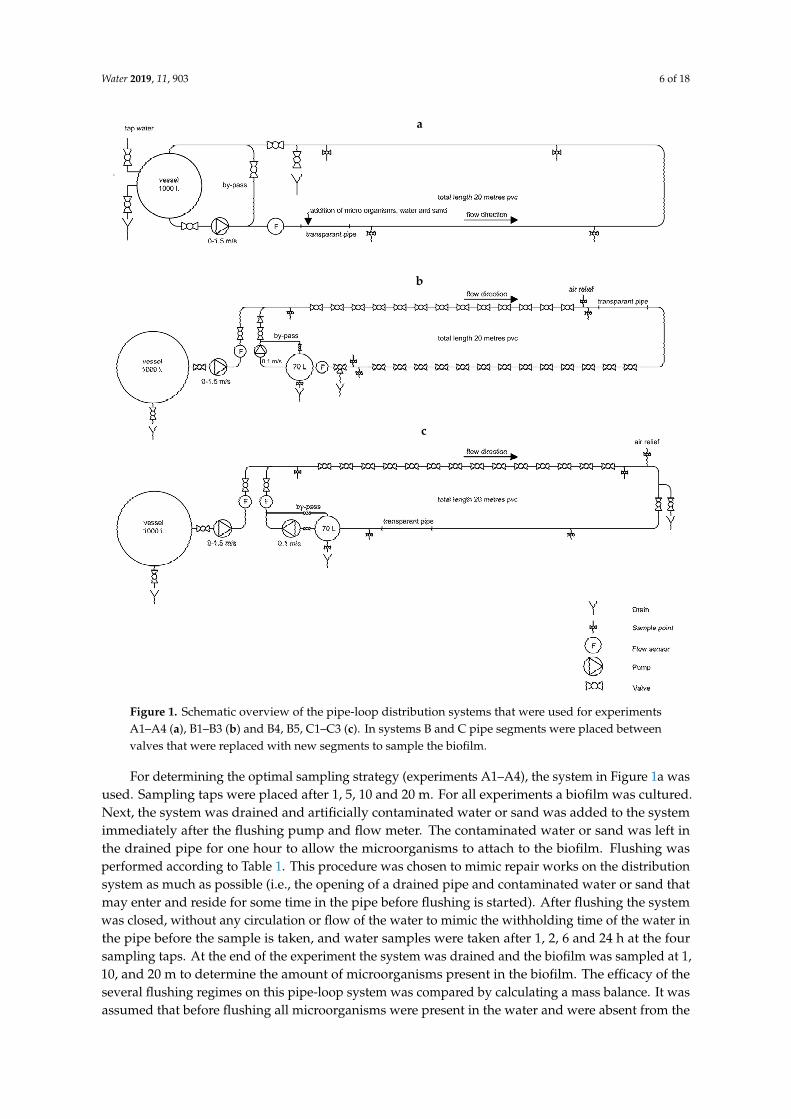
Three slightly different model pipe-loop systems were built (Figure 1). All systems were 20 mlong and consisted of PVC-pipes with an outer diameter of 63 mm and inner diameter of 55 mm.At several points along the 20 m-system taps for water sampling were placed. A flow meter wasplaced immediately after the flushing pump. After each experiment the biofilm was removed fromthe complete system by flushing with a SDS solution, tap water, citric acid solution and tap water.In addition, the long stretches of pipe were replaced with new pipes. Depending on the specificresearch questions, small alterations were made to the pipe-loop system, as described below.
Water 2019, 11, 903 6 of 18
Water 2018, 10, x FOR PEER REVIEW 5 of 18
Figure 1. Schematic overview of the pipe-loop distribution systems that were used for experiments A1–A4 (a), B1–B3 (b) and B4, B5, C1–C3 (c). In systems B and C pipe segments were placed between valves that were replaced with new segments to sample the biofilm.
For determining the optimal sampling strategy (experiments A1–A4), the system in Figure 1a was used. Sampling taps were placed after 1, 5, 10 and 20 meters. For all experiments a biofilm was cultured. Next, the system was drained and artificially contaminated water or sand was added to the system immediately after the flushing pump and flow meter. The contaminated water or sand was left in the drained pipe for one hour to allow the microorganisms to attach to the biofilm. Flushing was performed according to Table 1. This procedure was chosen to mimic repair works on the distribution system as much as possible (i.e., the opening of a drained pipe and contaminated water or sand that may enter and reside for some time in the pipe before flushing is started). After flushing the system was closed, without any circulation or flow of the water to mimic the withholding time of the water in the pipe before the sample is taken, and water samples were taken after 1, 2, 6 and 24 hours at the four sampling taps. At the end of the experiment the system was drained and the biofilm was sampled at 1, 10, and 20 meters to determine the amount of microorganisms present in the biofilm. The efficacy of the several flushing regimes on this pipe-loop system was compared by
a
b
c
Figure 1. Schematic overview of the pipe-loop distribution systems that were used for experimentsA1–A4 (a), B1–B3 (b) and B4, B5, C1–C3 (c). In systems B and C pipe segments were placed betweenvalves that were replaced with new segments to sample the biofilm.
For determining the optimal sampling strategy (experiments A1–A4), the system in Figure 1a wasused. Sampling taps were placed after 1, 5, 10 and 20 m. For all experiments a biofilm was cultured.Next, the system was drained and artificially contaminated water or sand was added to the systemimmediately after the flushing pump and flow meter. The contaminated water or sand was left inthe drained pipe for one hour to allow the microorganisms to attach to the biofilm. Flushing wasperformed according to Table 1. This procedure was chosen to mimic repair works on the distributionsystem as much as possible (i.e., the opening of a drained pipe and contaminated water or sand thatmay enter and reside for some time in the pipe before flushing is started). After flushing the systemwas closed, without any circulation or flow of the water to mimic the withholding time of the water inthe pipe before the sample is taken, and water samples were taken after 1, 2, 6 and 24 h at the foursampling taps. At the end of the experiment the system was drained and the biofilm was sampled at 1,10, and 20 m to determine the amount of microorganisms present in the biofilm. The efficacy of theseveral flushing regimes on this pipe-loop system was compared by calculating a mass balance. It wasassumed that before flushing all microorganisms were present in the water and were absent from the
Water 2019, 11, 903 7 of 18
biofilm. Numbers found in the water and biofilm samples 24 h after flushing were extrapolated tothe entire water phase and pipe wall. Using these numbers the log removal of the microorganismswas calculated.
To determine to efficacy of flushing and chlorination on removal of microorganisms from waterand biofilm (experiments B1–B5), the system in Figure 1b was used. A large number of removable pipesegments were included with ball valves on both sides. Individual segments could be taken out foranalyses and replaced by a new segment, without loss of water or the need to drain the system. A smallcirculation reservoir, circulation pump, and flow meter were included in the system. During the entireexperiment the water was circulated with 0.1 m/s (the average flow in the Dutch distribution system)using the circulation pump. For all experiments a biofilm was cultured. Microorganisms were addedto the water and circulated for 24 h before the system was flushed according to Table 2. Only the pipesbetween the flushing pump and the drain to the sewage system were flushed. The parts necessary forcirculation (pump, reservoir, flow meter) were blocked by closed valves. After flushing, samples weretaken and the water in the entire system was circulated for 30 min to ensure mixing of microorganismsthroughout the water phase. Shock chlorination was started by addition of concentrated sodiumhypochlorite to the circulation reservoir up to a concentration of 10 mg/L in the water of the entiresystem. The free chlorine concentration was measured after 20 min, 1–3–6–24 h (Hach, LCK310).During the flushing and chlorination procedures the water and biofilm were sampled at differenttime points, depending on the experiment: after 3–6–10–15 flushing volumes (the volume of the pipesegment that is flushed, i.e., 3 flushing volumes implies that the volume of the pipe segment wasreplaced three times) and after 1, 6 and 24 h contact time with chlorine.
To test the efficacy of flushing and chlorination on real-world pipes (PVC) with a natural biofilm(experiments C1–C3), the system of Figure 1b was adapted in such a way that pipes excavated froma distribution system could be incorporated in the pipe-loop system. The pipes were derived fromdifferent Dutch drinking water companies and were 35, 51, and 27 years old. Five meters of pipe,in segments of 50 cm, were excavated under hygienic procedures. The segments were closed witha cap and packaged in plastic bags, transported at 4 ◦C to the laboratory and incorporated within6 h in the pilot distribution system. Before incorporation the sawdust was gently removed and thesegments were incorporated using the same orientation (flow direction and up and bottom side of thepipe) as in the distribution system. Only the incorporated part was flushed (Figure 1c). No biofilmwas grown in the remaining 15 m pipe that were not flushed, to ensure that only the effect of anatural biofilm was monitored. After incorporation of the real-world pipe segments in the system, thesystem was circulated for 4 days with location-specific drinking water. After 4 days the water wasrefreshed, microorganisms were added and circulated for 24 h at 0.1 m/s. Flushing and chlorinationwere performed as described above (Table 3).
3. Results and Discussion
3.1. Growth or Decay of Microorganisms in Pipe-Loop System
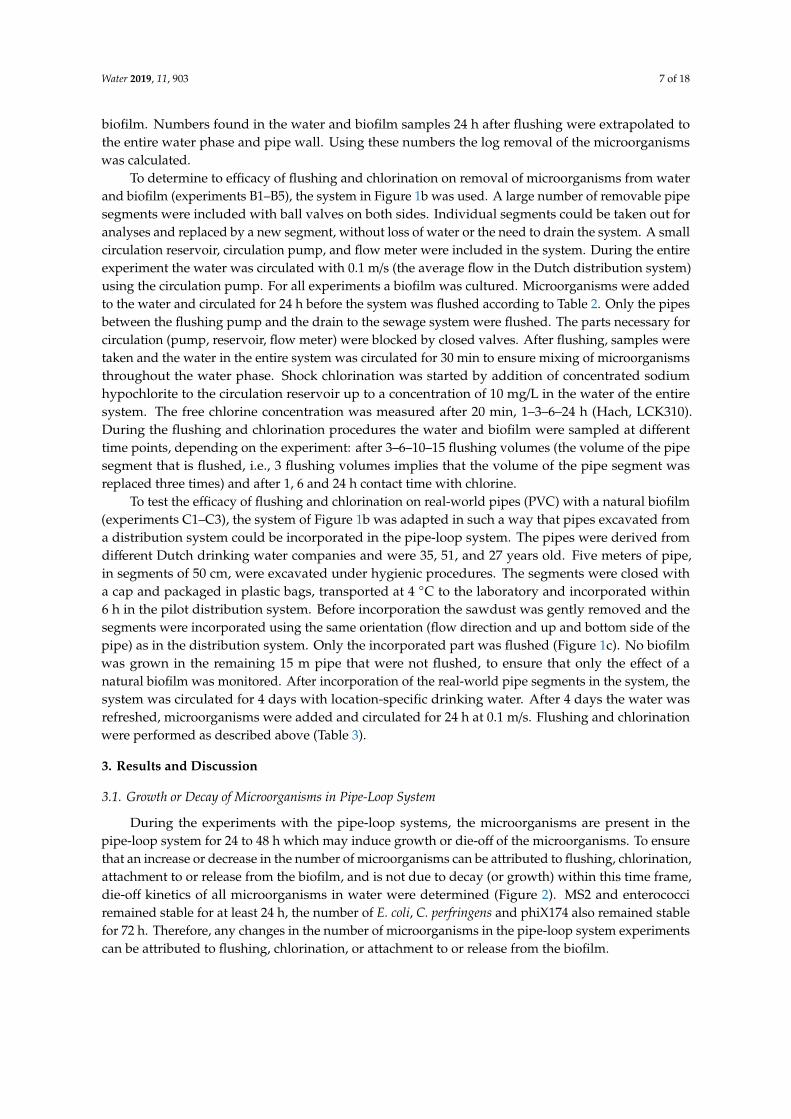
During the experiments with the pipe-loop systems, the microorganisms are present in thepipe-loop system for 24 to 48 h which may induce growth or die-off of the microorganisms. To ensurethat an increase or decrease in the number of microorganisms can be attributed to flushing, chlorination,attachment to or release from the biofilm, and is not due to decay (or growth) within this time frame,die-off kinetics of all microorganisms in water were determined (Figure 2). MS2 and enterococciremained stable for at least 24 h, the number of E. coli, C. perfringens and phiX174 also remained stablefor 72 h. Therefore, any changes in the number of microorganisms in the pipe-loop system experimentscan be attributed to flushing, chlorination, or attachment to or release from the biofilm.
Water 2019, 11, 903 8 of 18
1
Figure 2
Figure 2. Die-off curves of micro-organisms in water for 24–72 h.
3.2. Biofilm Characteristics
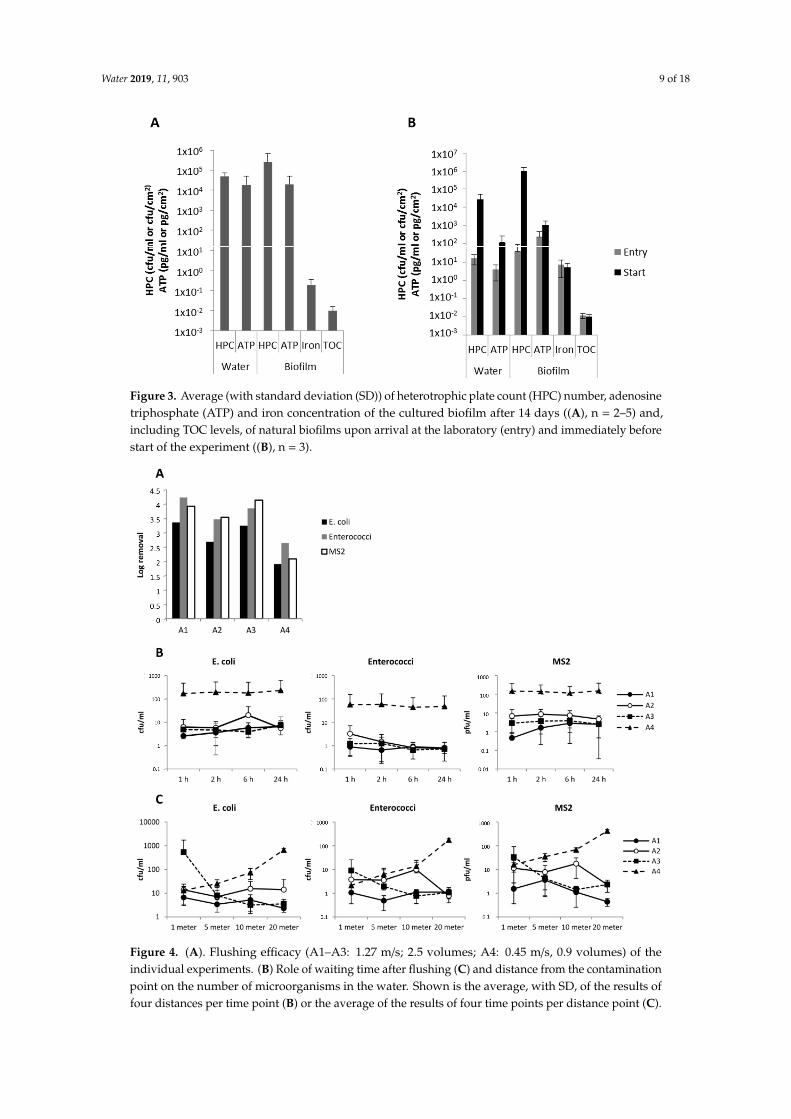
During all experiments, a biofilm was present in the pipe-loop system, either a biofilm wascultured or real-world pipe segments with a natural biofilm were incorporated in the system. Justbefore the start of each experiment, the water in the pipe-loop system and the biofilm were analyzedfor HPC, ATP and iron. Previous studies mention different HPC numbers for a representative, livingbiofilm: 104–105 cfu/mL in water and 104–105 cfu/cm2 for a cultured biofilm (USEPA, 2008) and101–106 cfu/cm2 for established biofilms [25,26]. The HPC count in the water of the pipe-loop systemswith a cultured biofilm falls within this range (5.9 × 10⁴ cfu/mL), the biofilm yields slightly higher HPCnumbers (3.1 × 10⁵ cfu/cm2; Figure 3A). ATP counts were high (2.8 × 10⁴ pg/mL and 2.9 × 10⁴ pg/cm2),indicating a large active biomass population and a very low amount of iron was present (0.23 µg/cm2).The low iron concentration shows that within two weeks a microbiological representative and livingbiofilm can be cultured, but accumulation of iron in the biofilm is very limited. The excavated pipesfrom the distribution system with a natural biofilm showed lower HPC counts and ATP concentrationsthan the cultured biofilms (‘Entry’ in Figure 3B): 16.7 cfu HPC/mL and 3.97 pg ATP/mL in the waterand 40.2 cfu HPC/mL and 227 pg ATP/cm2 in the biofilms. The iron concentration was much higher(7.5 µg/cm2) and clearly visible by eye. After four days of circulation with drinking water, the HPCnumber had increased with 3.2–4.8 logs and the ATP concentration with 0.7–1.6 log. The iron and TOClevels remained stable at 5.4–7.0 µg/cm2 respectively 0.01 mg C/cm2.
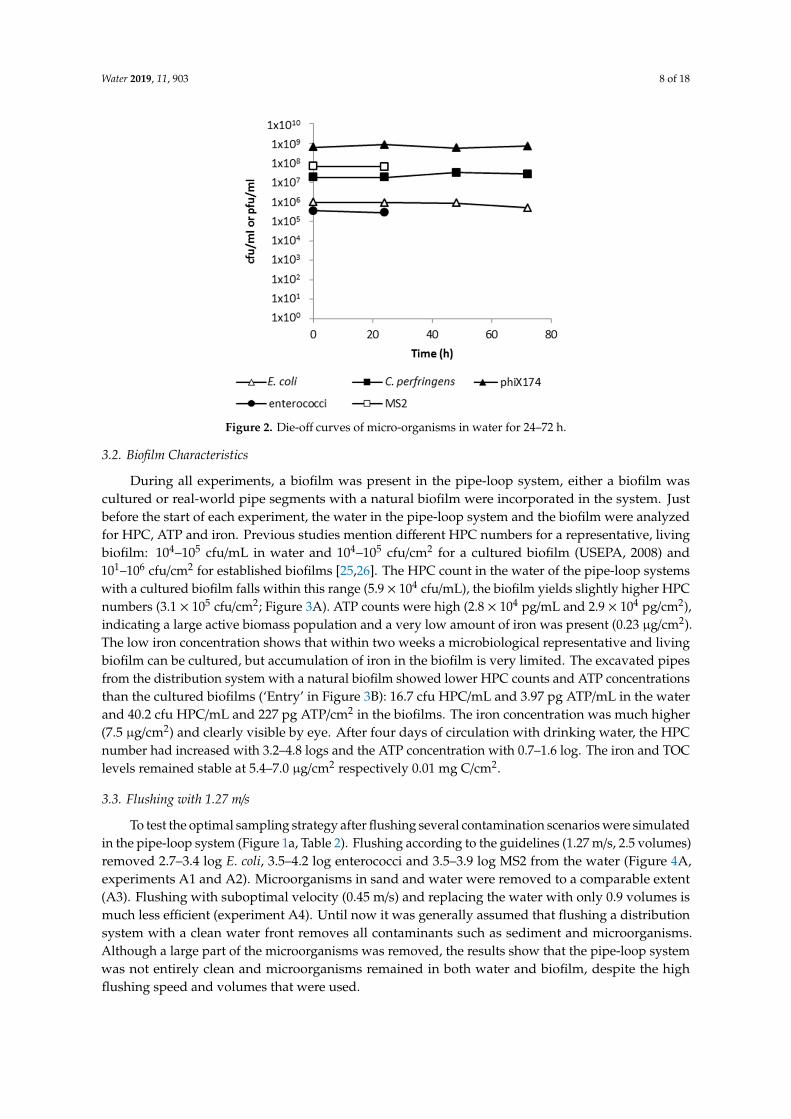
3.3. Flushing with 1.27 m/s
To test the optimal sampling strategy after flushing several contamination scenarios were simulatedin the pipe-loop system (Figure 1a, Table 2). Flushing according to the guidelines (1.27 m/s, 2.5 volumes)removed 2.7–3.4 log E. coli, 3.5–4.2 log enterococci and 3.5–3.9 log MS2 from the water (Figure 4A,experiments A1 and A2). Microorganisms in sand and water were removed to a comparable extent(A3). Flushing with suboptimal velocity (0.45 m/s) and replacing the water with only 0.9 volumes ismuch less efficient (experiment A4). Until now it was generally assumed that flushing a distributionsystem with a clean water front removes all contaminants such as sediment and microorganisms.Although a large part of the microorganisms was removed, the results show that the pipe-loop systemwas not entirely clean and microorganisms remained in both water and biofilm, despite the highflushing speed and volumes that were used.
Water 2019, 11, 903 9 of 18
2
Figure 3
Figure 3. Average (with standard deviation (SD)) of heterotrophic plate count (HPC) number, adenosinetriphosphate (ATP) and iron concentration of the cultured biofilm after 14 days ((A), n = 2–5) and,including TOC levels, of natural biofilms upon arrival at the laboratory (entry) and immediately beforestart of the experiment ((B), n = 3).Water 2018, 10, x FOR PEER REVIEW 9 of 18
Figure 4. (A). Flushing efficacy (A1–A3: 1.27 m/s; 2.5 volumes; A4: 0.45 m/s, 0.9 volumes) of the individual experiments. (B) Role of waiting time after flushing (C) and distance from the contamination point on the number of microorganisms in the water. Shown is the average, with SD, of the results of four distances per time point (B) or the average of the results of four time points per distance point (C).
3.4. Role of Waiting Time between Flushing and Sampling
After flushing, the pipe-loop system was closed and water remained stagnant for 24 hours during which samples were taken. The number of microorganisms in the water changed very little over time (Figure 4B). Two exceptions showed a decreasing (enterococci in A2) or increasing (MS2 in A1) pattern. This result was only seen once and therefore suggests that this may be variation caused by the large setup of the experiments or might be explained by natural variation. Differences in waiting time between flushing and sampling thus does not appear to affect the number of microorganisms present in the water. The general lack of changes in the number of microorganisms suggests that exchange between water and biofilm is not significant: the number of microorganisms that attaches to or releases from the biofilm is too small to detect in this setup. An alternative explanation could be that the microorganisms in biofilm and water are in equilibrium, with the same number of microorganisms attaching to and releasing from the biofilm. The results indicate that the probability of detecting fecal indicators one hour after flushing is similar to later time points. Hence, in a real situation in which repair works have been performed, followed by flushing, a waiting time longer than one hour before sampling is not necessary, does not change the chance of detecting a microorganism and unnecessarily leads to a longer period during which that particular section of the drinking water distribution system cannot be released for consumption.
After flushing, the water was sampled at different distances along the pipe-loop system to test whether the distance between the point of contamination and sampling point affects the number of
Figure 4. (A). Flushing efficacy (A1–A3: 1.27 m/s; 2.5 volumes; A4: 0.45 m/s, 0.9 volumes) of theindividual experiments. (B) Role of waiting time after flushing (C) and distance from the contaminationpoint on the number of microorganisms in the water. Shown is the average, with SD, of the results offour distances per time point (B) or the average of the results of four time points per distance point (C).

Water 2019, 11, 903 10 of 18
3.4. Role of Waiting Time between Flushing and Sampling
After flushing, the pipe-loop system was closed and water remained stagnant for 24 h duringwhich samples were taken. The number of microorganisms in the water changed very little overtime (Figure 4B). Two exceptions showed a decreasing (enterococci in A2) or increasing (MS2 in A1)pattern. This result was only seen once and therefore suggests that this may be variation caused bythe large setup of the experiments or might be explained by natural variation. Differences in waitingtime between flushing and sampling thus does not appear to affect the number of microorganismspresent in the water. The general lack of changes in the number of microorganisms suggests thatexchange between water and biofilm is not significant: the number of microorganisms that attaches toor releases from the biofilm is too small to detect in this setup. An alternative explanation could be thatthe microorganisms in biofilm and water are in equilibrium, with the same number of microorganismsattaching to and releasing from the biofilm. The results indicate that the probability of detecting fecalindicators one hour after flushing is similar to later time points. Hence, in a real situation in whichrepair works have been performed, followed by flushing, a waiting time longer than one hour beforesampling is not necessary, does not change the chance of detecting a microorganism and unnecessarilyleads to a longer period during which that particular section of the drinking water distribution systemcannot be released for consumption.
After flushing, the water was sampled at different distances along the pipe-loop system to testwhether the distance between the point of contamination and sampling point affects the numberof microorganisms that were found. When microorganisms were dosed in water and flushing wasperformed according to the guidelines, the number of microorganisms in water varied little overthe distance (Figure 4C; experiment A1 and A2). Exceptions are Enterococcus faecium and MS2 inexperiment A2: at 20 m lower numbers were found than at the 10-m sampling point. Dosage ofmicroorganisms in sand and water in experiment A3 leads to high numbers close to the contaminationpoint and the number of microorganisms declined with an increasing distance. Especially at the firstsampling point at 1 m high numbers of microorganisms were found, and these numbers declinedrapidly with increasing distance. After flushing, the sand was not completely removed and wasparticularly present in the first few meters after the contamination point, and was most likely thecause of the larger number of microorganisms at 1- and 5-m sampling points. Slower flushing withless volumes yielded the reverse picture, the number of microorganisms increased with the distance(experiment A4). At 1 m the number was comparable to the other experiments, but at 20 m the numberwas about two logs higher. The water in the pipe-loop system was not completely refreshed as flushingwas performed with only 0.9 volumes. After flushing the bulk of the contamination has arrived ataround the 20-m point where the sample was taken. Whether the less efficient removal is caused bythe lower flushing velocity or by lower flushing volume cannot be determined from these experiments.However, the comparable low number of microorganisms at 1 m between experiments A1, A2 and A4suggests that the flushing speed is less important.
3.5. Attachment of Microorganisms to the Biofilm
In the previous experiments only the flushing efficacy in removing microorganisms from the waterwas tested. However, in all pipes of the drinking water distribution system a biofilm is present. It maybe possible that characteristics of the biofilm influence the attachment of microorganisms and thus theefficacy of flushing and chlorination. Therefore, not only a biofilm was cultured in the pipe-loop system,but also segments of real-world pipes with a natural biofilm were taken from the distribution systemand incorporated in the pipe-loop system. Binding of microorganisms to the biofilm, flushing andchlorination were tested in pipe-loop systems with a cultured biofilm (experiments B1–B3, Figure 1band Table 2) or a natural biofilm (experiments C1–C3, Figure 1c and Table 3).
After addition of the microorganisms to the water in the pipe-loop system, the water was circulatedfor 24 h to allow the microorganisms to attach to the biofilm (Table 4). The binding efficacy differed foreach microorganism, but was comparable between the cultured and natural biofilm: C. perfringens
Water 2019, 11, 903 11 of 18
spores bound most efficiently to the biofilm (42.3% and 36.4%, respectively), followed by E. coli (6.7%and 3.3%) and phiX174 (0.6% and 0.7%). These binding efficiencies are comparable to a previousstudy using small reactors with glass pearls on which a biofilm was cultured using similar methods asthis study. Approximately 10% of the E. coli bacteria was bound to the biofilm [27]. However, usingyoung, natural, 7–10 months old, drinking water biofilms in a flow chamber only 0.03% of E. coli wasattached [28]. Another study showed a 1 log/cm2 binding of phiX174 (after dosing 5.6 log) to a natural,7-month old, biofilm [29], compared to 3–4 log/cm2 in this study. Additionally, in a pilot distributionsystem spores of the bacterium Bacillus subtilis attached to a cultured biofilm with 3–4 log/cm2 [23].Some reasons for the large differences in binding characteristics between the studies might be theenvironment, the composition of the drinking water and the pipe material that affect biofilm formation.However, within our study we did not find differences between a cultured biofilm and a natural biofilmand when drinking water from different locations was used. A clear explanation for the differences islacking, however, in all studies the microorganisms bind to the biofilm. These attached microorganismsmay negatively affect the efficacy of flushing procedures and the chlorine disinfection.
Table 4. Binding of microorganisms to cultured and natural biofilm.
E. coli C. perfringens phiX174
Water Biofilm Water Biofilm Water Biofilm
Culturedbiofilm
B1 99.7 0.3 27.0 73.0 - -B2 87.5 12.5 72.6 27.4 99.3 0.7B3 86.3 13.7 76.2 23.8 99.7 0.3B4 93.7 6.3 28.2 71.8 98.7 1.3B5 99.2 0.8 84.4 15.6 99.9 0.1
Average ± SD 93.3 ± 6.3 6.7 ± 6.3 57.7 ± 27.8 42.3 ± 27.8 99.4 ± 0.5 0.6 ± 0.5
Naturalbiofilm
C1 94.4 5.6 45.0 55.0 99.3 0.7C2 99.1 0.9 91.8 8.2 99.8 0.2C3 96.5 3.5 54.0 46.0 98.8 1.2
Average ± SD 96.7 ± 2.4 3.3 ± 2.4 63.6 ± 24.9 36.4 ± 24.9 99.3 ± 0.5 0.7 ± 0.5
Note: SD: Standard deviation.
3.6. Normal Flushing with 1–1.5 m/s
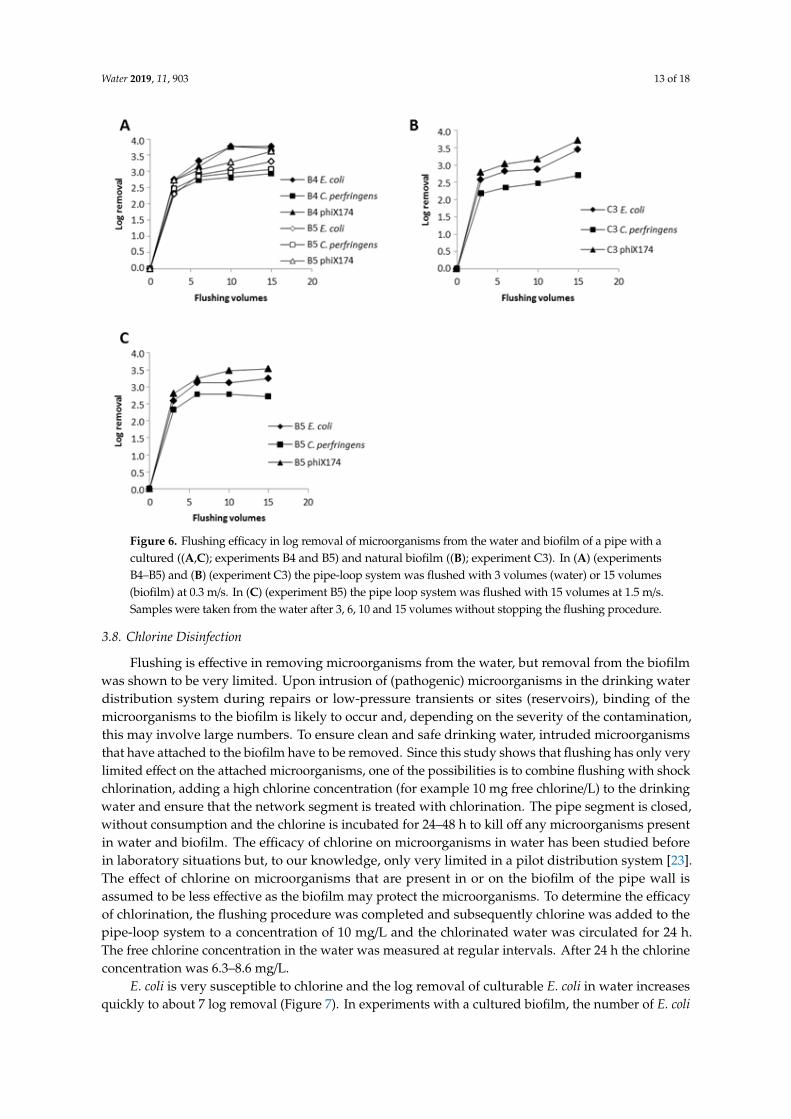
After 24 h circulation, flushing (1.0–1.5 m/s and 3 volumes) removed 1.2–3.1 log E. coli, 0.5–3.0log C. perfringens spores and 2.7–3.3 log phiX174 from the water in the presence of a cultured biofilm(Figure 5A). Removal of phiX174 from water seemed to be most efficient, although the differences weresmall. The log removal in experiment B1 was markedly lower compared to the other experiments, thereason for this is not known. Removal of microorganisms attached to a cultured biofilm by flushingwas limited: 0.3–1.3 log E. coli, 0–0.9 log C. perfringens and 0.9–1.4 log phiX174 were removed. Removalof microorganisms from water and biofilm when pipe segments with a natural, old biofilm wereused, was comparable to the experiments with a cultured biofilm (Figure 5B). Removal from the waterphase was slightly lower in this case, and relatively constant, despite the differences in biofilm siteand age and water quality (1.6–2.6 log E. coli; 2.0–2.2 log C. perfringens; 2.6–2.7 log phiX174). Removalof microorganisms from the natural biofilm was also slightly lower: 0.2–1.4 log E. coli; 0.2–0.4 logC. perfringens; −0.2–0.5 log phiX174. Extended flushing with up to 15 volumes only yielded an extra0.4–0.7 log removal from the water (Figure 6C). Removal in the first three volumes was largest, afterwhich flushing became less effective.

Water 2019, 11, 903 12 of 18
3
Figure 5
Figure 5. Flushing efficacy in log removal of microorganisms from the water and biofilm of a pipe witha cultured biofilm (A,C) or a natural biofilm (B,D). In (A) (experiments B1–B3) and (B) (experimentsC1–C2) the pipe-loop system was flushed with 3 volumes at 1.5 m/s. In (C) (experiment B4–B5)and (D) (experiment C3) the pipe-loop system was flushed with 3 (water) or 15 volumes (biofilm) at0.3 m/s. # phiX174 not added to pipe-loop system and not determined.
3.7. Slow Flushing with 0.3 m/s
Although flushing of the drinking water distribution system should normally be performed at avelocity of 1.5 m/s and 3 volumes, this is not always possible due to practical reasons. As mentioned in theAWWA standard C651-14, an alternative can be to flush the distribution system with a lower velocity [30].In addition, flushing can be extended so more pipe volumes are replaced. However, it is unknownwhether this is as efficient as flushing with 1.5 m/s. Flushing with low speed (0.3 m/s) was tested in thepipe-loop system with a cultured (experiments B4–B5) or natural biofilm (experiment C3). Flushing withthree volumes at 0.3 m/s removed 2.4–2.8 log microorganisms from the water of a pipe-loop system witha cultured biofilm (Figure 6A). Microorganisms were not removed from the cultured biofilm (0–0.3 logremoval). Flushing pipes at low speed with three volumes and a natural biofilm yielded comparableresults: 2.2–2.8 log removal of microorganisms from water and −0.1–0.5 log removal from the biofilm(Figure 6B). Extended flushing with more volumes (up to 15 volumes) at 0.3 m/s only yielded an additional0.2–1.0 log (in the presence of a cultured biofilm) or 0.5–0.9 log (natural biofilm) removal from water(Figure 5C,D). The results show that flushing a pipe-loop system with a cultured or natural biofilm andwith a low or high-speed yield comparable results. Flushing removes a large part of the microorganismsfrom the water, but removal is incomplete. Microorganisms bound to the biofilm are not removed oronly to a limited extent. Although a natural and cultured biofilm can have different characteristics, theirbehavior in flushing experiments is comparable. Results of flushing experiments in a pipe-loop systemwith a cultured biofilm are thus predictive for results obtained with a natural biofilm.
Water 2019, 11, 903 13 of 18
4
Figure 6
Figure 6. Flushing efficacy in log removal of microorganisms from the water and biofilm of a pipe with acultured ((A,C); experiments B4 and B5) and natural biofilm ((B); experiment C3). In (A) (experimentsB4–B5) and (B) (experiment C3) the pipe-loop system was flushed with 3 volumes (water) or 15 volumes(biofilm) at 0.3 m/s. In (C) (experiment B5) the pipe loop system was flushed with 15 volumes at 1.5 m/s.Samples were taken from the water after 3, 6, 10 and 15 volumes without stopping the flushing procedure.
3.8. Chlorine Disinfection
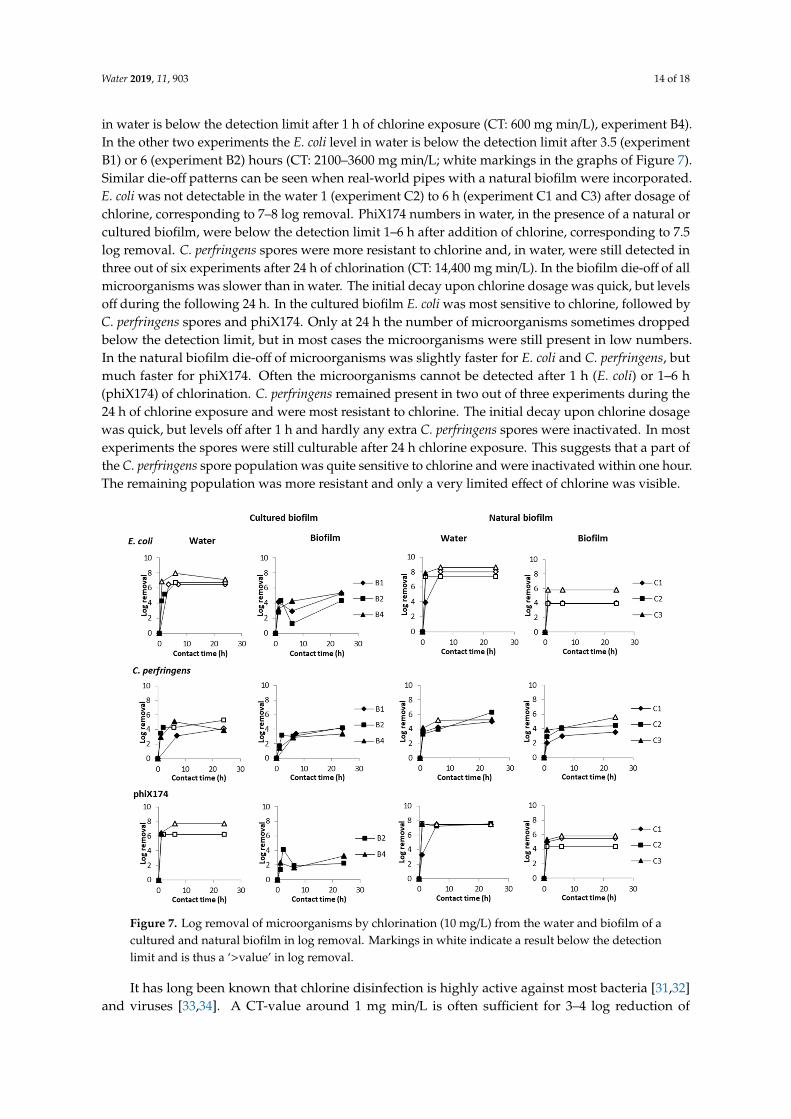
Flushing is effective in removing microorganisms from the water, but removal from the biofilmwas shown to be very limited. Upon intrusion of (pathogenic) microorganisms in the drinking waterdistribution system during repairs or low-pressure transients or sites (reservoirs), binding of themicroorganisms to the biofilm is likely to occur and, depending on the severity of the contamination,this may involve large numbers. To ensure clean and safe drinking water, intruded microorganismsthat have attached to the biofilm have to be removed. Since this study shows that flushing has only verylimited effect on the attached microorganisms, one of the possibilities is to combine flushing with shockchlorination, adding a high chlorine concentration (for example 10 mg free chlorine/L) to the drinkingwater and ensure that the network segment is treated with chlorination. The pipe segment is closed,without consumption and the chlorine is incubated for 24–48 h to kill off any microorganisms presentin water and biofilm. The efficacy of chlorine on microorganisms in water has been studied beforein laboratory situations but, to our knowledge, only very limited in a pilot distribution system [23].The effect of chlorine on microorganisms that are present in or on the biofilm of the pipe wall isassumed to be less effective as the biofilm may protect the microorganisms. To determine the efficacyof chlorination, the flushing procedure was completed and subsequently chlorine was added to thepipe-loop system to a concentration of 10 mg/L and the chlorinated water was circulated for 24 h.The free chlorine concentration in the water was measured at regular intervals. After 24 h the chlorineconcentration was 6.3–8.6 mg/L.
E. coli is very susceptible to chlorine and the log removal of culturable E. coli in water increasesquickly to about 7 log removal (Figure 7). In experiments with a cultured biofilm, the number of E. coli
Water 2019, 11, 903 14 of 18
in water is below the detection limit after 1 h of chlorine exposure (CT: 600 mg min/L), experiment B4).In the other two experiments the E. coli level in water is below the detection limit after 3.5 (experimentB1) or 6 (experiment B2) hours (CT: 2100–3600 mg min/L; white markings in the graphs of Figure 7).Similar die-off patterns can be seen when real-world pipes with a natural biofilm were incorporated.E. coli was not detectable in the water 1 (experiment C2) to 6 h (experiment C1 and C3) after dosage ofchlorine, corresponding to 7–8 log removal. PhiX174 numbers in water, in the presence of a natural orcultured biofilm, were below the detection limit 1–6 h after addition of chlorine, corresponding to 7.5log removal. C. perfringens spores were more resistant to chlorine and, in water, were still detected inthree out of six experiments after 24 h of chlorination (CT: 14,400 mg min/L). In the biofilm die-off of allmicroorganisms was slower than in water. The initial decay upon chlorine dosage was quick, but levelsoff during the following 24 h. In the cultured biofilm E. coli was most sensitive to chlorine, followed byC. perfringens spores and phiX174. Only at 24 h the number of microorganisms sometimes droppedbelow the detection limit, but in most cases the microorganisms were still present in low numbers.In the natural biofilm die-off of microorganisms was slightly faster for E. coli and C. perfringens, butmuch faster for phiX174. Often the microorganisms cannot be detected after 1 h (E. coli) or 1–6 h(phiX174) of chlorination. C. perfringens remained present in two out of three experiments during the24 h of chlorine exposure and were most resistant to chlorine. The initial decay upon chlorine dosagewas quick, but levels off after 1 h and hardly any extra C. perfringens spores were inactivated. In mostexperiments the spores were still culturable after 24 h chlorine exposure. This suggests that a part ofthe C. perfringens spore population was quite sensitive to chlorine and were inactivated within one hour.The remaining population was more resistant and only a very limited effect of chlorine was visible.
Water 2018, 10, x FOR PEER REVIEW 14 of 18
experiment B4). In the other two experiments the E. coli level in water is below the detection limit after 3.5 (experiment B1) or 6 (experiment B2) hours (CT: 2100–3600 mg min/L; white markings in the graphs of Figure 7). Similar die-off patterns can be seen when real-world pipes with a natural biofilm were incorporated. E. coli was not detectable in the water 1 (experiment C2) to 6 hours (experiment C1 and C3) after dosage of chlorine, corresponding to 7–8 log removal. PhiX174 numbers in water, in the presence of a natural or cultured biofilm, were below the detection limit 1–6 hours after addition of chlorine, corresponding to 7.5 log removal. C. perfringens spores were more resistant to chlorine and, in water, were still detected in three out of six experiments after 24 hours of chlorination (CT: 14,400 mg min/L). In the biofilm die-off of all microorganisms was slower than in water. The initial decay upon chlorine dosage was quick, but levels off during the following 24 hours. In the cultured biofilm E. coli was most sensitive to chlorine, followed by C. perfringens spores and phiX174. Only at 24 hours the number of microorganisms sometimes dropped below the detection limit, but in most cases the microorganisms were still present in low numbers. In the natural biofilm die-off of microorganisms was slightly faster for E. coli and C. perfringens, but much faster for phiX174. Often the microorganisms cannot be detected after 1 hour (E. coli) or 1–6 hours (phiX174) of chlorination. C. perfringens remained present in two out of three experiments during the 24 hours of chlorine exposure and were most resistant to chlorine. The initial decay upon chlorine dosage was quick, but levels off after 1 hour and hardly any extra C. perfringens spores were inactivated. In most experiments the spores were still culturable after 24 hours chlorine exposure. This suggests that a part of the C. perfringens spore population was quite sensitive to chlorine and were inactivated within one hour. The remaining population was more resistant and only a very limited effect of chlorine was visible.
Figure 7. Log removal of microorganisms by chlorination (10 mg/L) from the water and biofilm of a cultured and natural biofilm in log removal. Markings in white indicate a result below the detection limit and is thus a ‘>value’ in log removal.
It has long been known that chlorine disinfection is highly active against most bacteria [31,32] and viruses [33,34]. A CT-value around 1 mg min/L is often sufficient for 3–4 log reduction of these microorganisms. However, most protozoa and spores are highly resistant against chlorine and inactivation is limited [35,36]. In our experiments C. perfringens spores were most resistant to chlorine,
Figure 7. Log removal of microorganisms by chlorination (10 mg/L) from the water and biofilm of acultured and natural biofilm in log removal. Markings in white indicate a result below the detectionlimit and is thus a ‘>value’ in log removal.
It has long been known that chlorine disinfection is highly active against most bacteria [31,32]and viruses [33,34]. A CT-value around 1 mg min/L is often sufficient for 3–4 log reduction of
Water 2019, 11, 903 15 of 18
these microorganisms. However, most protozoa and spores are highly resistant against chlorineand inactivation is limited [35,36]. In our experiments C. perfringens spores were most resistant tochlorine, but still 3–5 log was inactivated after 24 h incubation (CT: 14,400 mg min/L). In another studyinactivation was lower: 1.7 log C. perfringens spores were inactivated upon incubation in a 5 mg/Lchlorine solution for 24 h (CT: 7200 mg min/L) [37]. In the same study, Cryptosporidium parvum sporeswere completely resistant to the chlorine treatment. Bacillus subtilis spores were not inactivated during180-min incubation in a 1–10 mg/L chlorine solution (CT: 180–1800 mg min/L) [22]. One of the reasonsthat cause the differences in inactivation kinetics may be the age of the spores. From UV-disinfectionstudies it is known that young spores are more vulnerable to UV disinfection then older spores [38].It is possible that the same principle holds for chlorine disinfection, in that older spores are moreresistant to chlorine than young spores. Disinfection studies in which the indicator viruses MS2 andphiX174 were incubated with 0.5 mg/L chlorine a >3.5 log reduction within 30 min for MS2 and 1min for phiX174 was observed (CT: 15 and 0.5 mg min/L) [39]. In another study, applying 1–10 mg/Lchlorine, a >5 log inactivation of free-suspended MS2 bacteriophage was achieved (CT: 15–20 mgmin/L) [22]. PhiX174 was also quickly inactivated in our study (6 log inactivation, CT: 600 mg min/L).However, as inactivation was not measured in the first hour the results cannot be directly comparedto literature.
For the same reason the inactivation kinetics of E. coli in our study (4–7 log, CT: 600 mg min/L)cannot be compared directly to literature in which E. coli seems apparently more vulnerable to chlorine(5–6 log inactivation within 5 min at 1 mg/L [22] or 4 log at 0.5 mg/L within 30 s) [32].
3.9. Application to Real-Life Situation
The flushing and disinfection experiments show that microorganisms in the water phase of adistribution system are readily removed by flushing. Although removal by flushing is not complete,in a real-life situation flushing is often probably sufficient as a contamination is likely to harbor lessmicroorganisms than that were dosed in these experiments. A 2–3 log removal efficacy is sufficientin these cases. The tested flushing velocities (0.3 m/s or 1.5 m/s) yielded similar removal efficiencies.However, the microbial contamination was suspended in water and not bound to sediment particleswhich may make removal more difficult as a sufficient flow velocity is required to resuspend theparticles in to the water phase. A previous study showed that lower flushing velocities (0.25–0.4 m/s)are sufficient for removal of sediment particles from a 100 mm pipe, however resuspension is likely tobe more effective at 1.5 m/s compared to 0.3 m/s. Therefore, it remains recommendable to aim for aflushing velocity of 1.5 m/s. In situations in which 1.5 m/s cannot be reached due to practical reasons,flushing with 0.3 m/s can be used to remove the contamination from the water phase, but a less efficientremoval of particles with attached microorganisms should be taken into account.
If a contamination enters the drinking water pipe and is not removed immediately, themicroorganisms will have bound to the biofilm, and chlorine disinfection is required to inactivatethese microorganisms. Chlorine disinfection should also be considered when the repair works have ahigh risk, for example when leaking sewage pipes are located close to or above the drinking waterpipe line. The surrounding ground water or soil is likely to contain high numbers of microorganismsand even a contamination with a small amount of water or soil may introduce a large number ofmicroorganisms. In these cases disinfection with a high chlorine concentration is required to inactivatethe bound microorganisms and to ensure the microbiological safety of drinking water. Other options toremove, and thus clean the biofilm are available, for example, (ice) pigging during which an ice slurryis pushed through the pipe, removes the pipe wall biofilm and (nearly) all loose sediment particles.However, chlorination can be performed on a short notice, which is not possible for (ice) pigging.
Prevention of ingress of fecal contamination into the network remains pivotal in protecting thepublic health and requires strict adherence to hygienic working procedures. If the network becomescontaminated, protecting the public health remains the first priority. Therefore, not only flushing, andpossibly chlorination, should be applied, but also a (preventive) boil water advice to the consumers.
Water 2019, 11, 903 16 of 18
Once the distribution system is contaminated it remains important to first localize and isolate thecontamination source before performing flushing and chlorination.
4. Conclusions
Flushing and chlorine disinfection experiments in a pipe-loop system show that (1) sampling ofwater from the distribution system for microbiological monitoring can be performed 1 h after flushing,(2) small microbial contaminations in the water phase can be effectively flushed out of the system,(3) a contamination with sand was not completely removed from the system and present in the first fewmeters, (4) flushing with more than the prescribed three volume replacements removes only a limitednumber of extra microorganisms, (5) after high risk repair works or incidents shock chlorination isadvised to ensure the microbiological safety of the drinking water as flushing is not efficient enough,(6) experiments with pipes with a cultured biofilm yield comparable results to pipes with a naturalbiofilm. For future experiments pipes with a cultured biofilm can be used, instead of pipes with anatural biofilm which have to be extracted from a distribution system by a drinking water company.
Author Contributions: Conceptualization, N.v.B., L.M.H. and G.M.; Investigation, N.v.B. and A.v.d.V.;Methodology, N.v.B., L.M.H. and A.v.d.V.; Visualization, N.v.B.; Writing—original draft, N.v.B.; Writing—review& editing, N.v.B. and G.M.
Funding: The research was funded by the Dutch drinking water companies through the Joint Research Program.
Acknowledgments: We would like to thank the Dutch drinking water companies, especially Jamal El Majjaoui(Dunea), Falco van Driel (Water Maatschappij Limburg) and Agata Donocik (Brabant Water), for arranging theexcavation of the pipe segments from the real distribution network. The experiments would not have beenpossible without the technical assistance of the Laboratory of Microbiology of KWR.
Conflicts of Interest: The authors declare no conflict of interest.
References
1. Karim, M.R.; Abbaszadegan, M.; LeChevallier, M. Potential for pathogen intrusion during pressure transients.J. Am. Water Works Assoc. 2003, 95, 134–146. [CrossRef]
2. Besner, M.C.; Broseus, R.; Lavoie, J.; Giovanni, G.D.; Payment, P.; Prevost, M. Pressure monitoring andcharacterization of external sources of contamination at the site of the payment drinking water epidemiologicalstudies. Environ. Sci. Technol. 2010, 44, 269–277. [CrossRef] [PubMed]
3. Teunis, P.F.; Moe, C.L.; Liu, P.; Miller, S.E.; Lindesmith, L.; Baric, R.S.; Le Pendu, J.; Calderon, R.L. Norwalkvirus: How infectious is it? J. Med. Virol. 2008, 80, 1468–1476. [CrossRef] [PubMed]
4. Messner, M.J.; Berger, P.; Nappier, S.P. Fractional poisson—A simple dose-response model for humannorovirus. Risk Anal. 2014, 34, 1820–1829. [CrossRef] [PubMed]
5. Nygard, K.; Wahl, E.; Krogh, T.; Tveit, O.A.; Bohleng, E.; Tverdal, A.; Aavitsland, P. Breaks and maintenancework in the water distribution systems and gastrointestinal illness: A cohort study. Int. J. Epidemiol. 2007, 36,873–880. [CrossRef] [PubMed]
6. Save-Soderbergh, M.; Bylund, J.; Malm, A.; Simonsson, M.; Toljander, J. Gastrointestinal illness linked toincidents in drinking water distribution networks in Sweden. Water Res. 2017, 122, 503–511. [CrossRef][PubMed]
7. Payment, P.; Siemiatycki, J.; Richardson, L.; Renaud, G.; Franco, E.; Prevost, M. A prospective epidemiologicalstudy of gastrointestinal health effects due to the consumption of drinking water. Int. J. Environ. Health Res.1997, 7, 5–31. [CrossRef]
8. Payment, P.; Richardson, L.; Siemiatycki, J.; Dewar, R.; Edwardes, M.; Franco, E. A randomized trialto evaluate the risk of gastrointestinal disease due to consumption of drinking water meeting currentmicrobiological standards. Am. J. Public Health 1991, 81, 703–708. [CrossRef]
9. Nygard, K.; Andersson, Y.; Rottingen, J.A.; Svensson, A.; Lindback, J.; Kistemann, T.; Giesecke, J. Associationbetween environmental risk factors and campylobacter infections in Sweden. Epidemiol. Infect. 2004, 132,317–325. [CrossRef]
Water 2019, 11, 903 17 of 18
10. Hellard, M.E.; Sinclair, M.I.; Forbes, A.B.; Fairley, C.K. A randomized, blinded, controlled trial investigatingthe gastrointestinal health effects of drinking water quality. Environ. Health Perspect. 2001, 109, 773–778.[CrossRef]
11. Colford, J.M., Jr.; Wade, T.J.; Sandhu, S.K.; Wright, C.C.; Lee, S.; Shaw, S.; Fox, K.; Burns, S.; Benker, A.;Brookhart, M.A.; et al. A randomized, controlled trial of in-home drinking water intervention to reducegastrointestinal illness. Am. J. Epidemiol. 2005, 161, 472–482. [CrossRef]
12. Ercumen, A.; Gruber, J.S.; Colford, J.M., Jr. Water distribution system deficiencies and gastrointestinal illness:A systematic review and meta-analysis. Environ. Health Perspect. 2014, 122, 651–660. [CrossRef] [PubMed]
13. Besner, M.C.; Prevost, M.; Regli, S. Assessing the public health risk of microbial intrusion events indistribution systems: Conceptual model, available data, and challenges. Water Res. 2011, 45, 961–979.[CrossRef] [PubMed]
14. Teunis, P.F.; Xu, M.; Fleming, K.K.; Yang, J.; Moe, C.L.; Lechevallier, M.W. Enteric virus infection risk fromintrusion of sewage into a drinking water distribution network. Environ. Sci. Technol. 2010, 44, 8561–8566.[CrossRef]
15. Yang, J.; LeChevallier, M.W.; Teunis, P.F.; Xu, M. Managing risks from virus intrusion into water distributionsystems due to pressure transients. J. Water Health 2011, 9, 291–305. [CrossRef]
16. Davis, M.J.; Janke, R. Development of a Probabilistic Timing Model for the Ingestion of Tap Water. J. WaterResour. Plan. Manag. 2009, 135, 397–405. [CrossRef]
17. Blokker, E.; Smeets, P.; Medema, G. QMRA in the Drinking Water Distribution System. Procedia Eng. 2014,89, 151–159. [CrossRef]
18. Blokker, M.; Smeets, P.; Medema, G. Quantitative microbial risk assessment of repairs of the drinking waterdistribution system. Microb. Risk Anal. 2017. [CrossRef]
19. Teunis, P.F.M.; Chappell, C.L.; Okhuysen, P.C. Cryptosporidium Dose-Response Studies: Variation BetweenHosts. Risk Anal. 2002, 22, 475–485. [CrossRef]
20. Regli, S.; Rose, J.B.; Haas, C.N.; Gerba, C.P. Modeling the Risk From Giardia and Viruses in Drinking Water.J. Am. Water Works Assoc. 1991, 83, 76–84. [CrossRef]
21. Teunis, P.; van der Heijden, O.; van der Giessen, J.; Havelaar, A.H. THE DOSE-RESPONSE RELATIONin Human Volunteers for Gastro-Intestinal Pathogens; Rijksinstituut Voor Volksgezondheid en Milieu RIVM:Bilthoven, The Netherlands, 1996.
22. Yang, J.; Schneider, O.D.; Jjemba, P.K.; Lechevallier, M.W. Microbial Risk Modeling for Main Breaks. J. Am.Water Works Assoc. 2015, 107, E97–E108. [CrossRef]
23. Krishnan, R.P.; Randall, P. Pilot-Scale Tests and Systems Evaluation for the Containment, Treatment, andDecontamination of Selected Materials from T&E Building Pipe Loop Equipment; U.S. Environmental ProtectionAgency: Washington, DC, USA, 2008.
24. McMinn, B.R.; Ashbolt, N.J.; Korajkic, A. Bacteriophages as indicators of faecal pollution and enteric virusremoval. Lett. Appl. Microbiol. 2017, 65, 11–26. [CrossRef]
25. Wingender, J.; Flemming, H.C. Contamination potential of drinking water distribution network biofilms.Water Sci. Technol. 2004, 49, 277–286. [CrossRef]
26. Langmark, J.; Storey, M.V.; Ashbolt, N.J.; Stenstrom, T.A. Biofilms in an urban water distribution system:Measurement of biofilm biomass, pathogens and pathogen persistence within the Greater Stockholm Area,Sweden. Water Sci. Technol. 2005, 52, 181–189. [CrossRef]
27. Bauman, W.J.; Nocker, A.; Jones, W.L.; Camper, A.K. Retention of a model pathogen in a porous mediabiofilm. Biofouling 2009, 25, 229–240. [CrossRef]
28. Paris, T.; Skali-Lami, S.; Block, J.C. Probing young drinking water biofilms with hard and soft particles.Water Res. 2009, 43, 117–126. [CrossRef]
29. Helmi, K.; Skraber, S.; Gantzer, C.; Willame, R.; Hoffmann, L.; Cauchie, H.M. Interactions of Cryptosporidiumparvum, Giardia lamblia, vaccinal poliovirus type 1, and bacteriophages phiX174 and MS2 with a drinkingwater biofilm and a wastewater biofilm. Appl. Environ. Microbiol. 2008, 74, 2079–2088. [CrossRef]
30. Mains, D.W. American Water Works Association. In ANSI/AWWA C651-14; American Water Works Association:New York, NY, USA, 2015. [CrossRef]
31. Blaser, M.J.; Smith, P.F.; Wang, W.L.; Hoff, J.C. Inactivation of Campylobacter jejuni by chlorine andmonochloramine. Appl. Environ. Microbiol. 1986, 51, 307–311.
Water 2019, 11, 903 18 of 18
32. Zhao, T.; Doyle, M.P.; Zhao, P.; Blake, P.; Wu, F.M. Chlorine inactivation of Escherichia coli O157:H7 in water.J. Food Prot. 2001, 64, 1607–1609. [CrossRef]
33. Engelbrecht, R.S.; Weber, M.J.; Salter, B.L.; Schmidt, C.A. Comparative inactivation of viruses by chlorine.Appl. Environ. Microbiol. 1980, 40, 249–256.
34. Thurston-Enriquez, J.A.; Haas, C.N.; Jacangelo, J.; Gerba, C.P. Chlorine inactivation of adenovirus type 40and feline calicivirus. Appl. Environ. Microbiol. 2003, 69, 3979–3985. [CrossRef] [PubMed]
35. Jarroll, E.L.; Bingham, A.K.; Meyer, E.A. Effect of chlorine on Giardia lamblia cyst viability.Appl. Environ. Microbiol. 1981, 41, 483–487.
36. Shields, J.M.; Hill, V.R.; Arrowood, M.J.; Beach, M.J. Inactivation of Cryptosporidium parvum underchlorinated recreational water conditions. J. Water Health 2008, 6, 513–520. [CrossRef] [PubMed]
37. Venczel, L.V.; Arrowood, M.; Hurd, M.; Sobsey, M.D. Inactivation of Cryptosporidium parvumOocysts and Clostridium perfringens Spores by a Mixed-Oxidant Disinfectant and by Free Chlorine.Appl. Environ. Microbiol. 1997, 63, 4625. [PubMed]
38. Hijnen, W.A.; Beerendonk, E.F.; Medema, G.J. Inactivation credit of UV radiation for viruses, bacteria andprotozoan (oo)cysts in water: A review. Water Res. 2006, 40, 3–22. [CrossRef]
39. Sobsey, M.D.; Fuji, T.; Shields, P.A. Inactivation of Hepatitis a Virus and Model Viruses in Water by FreeChlorine and Monochloramine. Water Sci. Technol. 1988, 20, 385–391. [CrossRef]
© 2019 by the authors. Licensee MDPI, Basel, Switzerland. This article is an open accessarticle distributed under the terms and conditions of the Creative Commons Attribution(CC BY) license (http://creativecommons.org/licenses/by/4.0/).
Copyright © 2022 FDOKUMEN