Flushing time in Perlas Lagoon and Bluefields Bay, Nicaragua
8
Flushing time in Pearl Lagoon and Bluefields Bay, Nicaragua 1 Invest. Mar., Valparaíso, 35(1): xx-xx, 2007 Nota Científica Flushing time in Perlas Lagoon and Bluefields Bay, Nicaragua Carlos L. Brenes 1 , Aldo Hernández 2 & Daniel Ballestero 1 1 Laboratorio de Oceanografía y Manejo Costero, Universidad Nacional Apdo 86-3000, Heredia, Costa Rica 2 Administración Nacional de Pesca y Acuicultura (AdPesca), Apdo 2020, Managua, Nicaragua ABSTRACT. The flushing time of Perlas Lagoon and Bluefields Bay were studied in January, March, May, and July 2001. Calculations of the total water volume, tidal prism, mean salinity, and fresh water flows are shown. The flushing times range from 14 to 17 days for Perlas Lagoon and from 2 to 4 days for Bluefields Bay. Flushing time variability, determined largely by the fresh water contribution, is greater for Bluefields Bay, duplicating its magnitude during the dry months compared to the rainy season. In both bodies of water, the relationship between fresh water input and flushing time is inverse: for Bluefields Bay T = 5.2·e -0.0008 (FW) , where r 2 = 0.835 and for Perlas Lagoon T= 20.2·e -0.0004 (FW) , where r 2 = 0.873. Key words: flushing time, coastal lagoons, Caribbean Sea. Tiempo de renovación para la Laguna de Perlas y la bahía de Bluefields, Nicaragua RESUMEN. Se estudió el tiempo de renovación de la Laguna de Perlas y bahía de Bluefields para los meses de enero, marzo, mayo y julio de 2001. Se presentan cálculos del volumen total de agua, prisma mareal, salinidad media y flujos de agua dulce. En el caso de Laguna de Perlas, los tiempos obtenidos estuvieron entre 14 y 17 días, y en la bahía de Bluefields, entre 2 y 4 días. La variación en el tiempo de renovación de ambas lagunas, está dominado por el aporte de agua dulce. El tiempo de renovación de la bahía de Bluefields varió durante el período de muestreo de una manera mucho más significativa, duplicando su valor durante los meses secos respecto al mes más lluvioso. En ambas lagunas existe una relación inversa entre el aporte de agua dulce y el tiempo de renovación, de manera que para la bahía de Bluefields dicha relación está expresada por la ecuación, T = 5,2·e -0,0008 (FW) , con un r 2 = 0,835, mientras que para la Laguna de Perlas esa relación está dada por la expresión: T = 20,2·e -0,0004 (FW) , con un r 2 = 0,873. Palabras clave: tiempo de renovación, lagunas costeras, mar Caribe Corresponding author: Carlos L. Brenes ([email protected]) Officer (1980) defines the residence time for an es- tuary as the mean time a particle of a conservative substance spends in a given volume. Salt and fresh water are usually considered conservative substanc- es in estuarine hydrodynamics. The fresh water res- idence time, also known as the flushing time, can be defined as the time needed to replace the fresh water volume in the estuary with a rate equal to the fluvial discharge. There are several formulations for “flushing time”, most of them strictly valid only for well-mixed res- ervoirs in a steady state. This was emphasized by Bolin & Rodhe (1973), who reviewed several terms such as “reposition time” and “mean transit time”. In the present study, the term “residence time” was used where no further discussion was needed. This definition does not require a well-mixed reservoir. The flushing time is equivalent to the “reposition time” of Bolin & Rhode (1973), also known as “re- placement time”. The definition is strictly oriented at the time needed for the volume introduced by the river flux to be equal to the fresh water volume in the lagoon, but says nothing about the processes of replacement. The total volume of a lagoon is determined by sev- eral fluxes of continental, oceanic, and atmospheric
-
Upload
independent -
Category
Documents
-
view
0 -
download
0
Transcript of Flushing time in Perlas Lagoon and Bluefields Bay, Nicaragua
Flushing time in Pearl Lagoon and Bluefields Bay, Nicaragua 1Invest. Mar., Valparaíso, 35(1): xx-xx, 2007
Nota Científica
Flushing time in Perlas Lagoon and Bluefields Bay, Nicaragua
Carlos L. Brenes1, Aldo Hernández2 & Daniel Ballestero1
1Laboratorio de Oceanografía y Manejo Costero, Universidad NacionalApdo 86-3000, Heredia, Costa Rica
2Administración Nacional de Pesca y Acuicultura (AdPesca), Apdo 2020, Managua, Nicaragua
ABSTRACT. The flushing time of Perlas Lagoon and Bluefields Bay were studied in January, March, May, and July 2001. Calculations of the total water volume, tidal prism, mean salinity, and fresh water flows are shown. The flushing times range from 14 to 17 days for Perlas Lagoon and from 2 to 4 days for Bluefields Bay. Flushing time variability, determined largely by the fresh water contribution, is greater for Bluefields Bay, duplicating its magnitude during the dry months compared to the rainy season. In both bodies of water, the relationship between fresh water input and flushing time is inverse: for Bluefields Bay T = 5.2·e-0.0008 (FW), where r2 = 0.835 and for Perlas Lagoon T= 20.2·e-0.0004 (FW), where r2= 0.873.
Key words: flushing time, coastal lagoons, Caribbean Sea.
Tiempo de renovación para la Laguna de Perlas y la bahía de Bluefields, Nicaragua
RESUMEN. Se estudió el tiempo de renovación de la Laguna de Perlas y bahía de Bluefields para los meses de enero, marzo, mayo y julio de 2001. Se presentan cálculos del volumen total de agua, prisma mareal, salinidad media y flujos de agua dulce. En el caso de Laguna de Perlas, los tiempos obtenidos estuvieron entre 14 y 17 días, y en la bahía de Bluefields, entre 2 y 4 días. La variación en el tiempo de renovación de ambas lagunas, está dominado por el aporte de agua dulce. El tiempo de renovación de la bahía de Bluefields varió durante el período de muestreo de una manera mucho más significativa, duplicando su valor durante los meses secos respecto al mes más lluvioso. En ambas lagunas existe una relación inversa entre el aporte de agua dulce y el tiempo de renovación, de manera que para la bahía de Bluefields dicha relación está expresada por la ecuación, T = 5,2·e-0,0008 (FW), con un r2 = 0,835, mientras que para la Laguna de Perlas esa relación está dada por la expresión: T = 20,2·e-0,0004 (FW), con un r2 = 0,873.
Palabras clave: tiempo de renovación, lagunas costeras, mar Caribe
Corresponding author: Carlos L. Brenes ([email protected])
Officer (1980) defines the residence time for an es-tuary as the mean time a particle of a conservative substance spends in a given volume. Salt and fresh water are usually considered conservative substanc-es in estuarine hydrodynamics. The fresh water res-idence time, also known as the flushing time, can be defined as the time needed to replace the fresh water volume in the estuary with a rate equal to the fluvial discharge.
There are several formulations for “flushing time”, most of them strictly valid only for well-mixed res-ervoirs in a steady state. This was emphasized by Bolin & Rodhe (1973), who reviewed several terms
such as “reposition time” and “mean transit time”. In the present study, the term “residence time” was used where no further discussion was needed. This definition does not require a well-mixed reservoir. The flushing time is equivalent to the “reposition time” of Bolin & Rhode (1973), also known as “re-placement time”. The definition is strictly oriented at the time needed for the volume introduced by the river flux to be equal to the fresh water volume in the lagoon, but says nothing about the processes of replacement.
The total volume of a lagoon is determined by sev-eral fluxes of continental, oceanic, and atmospheric
2 Investigaciones Marinas, Vol. 35(1) 2007
origins: riverine discharge, coastal water incoming through passages, evaporation, and precipitation. Such fluxes have to be known or estimated to de-cide whether they have to be taken into account in the dynamic analysis of the ecosystem.
The salinity field is closely related to these flux-es. If the fluxes maintain a stationary state in the sa-linity distribution of the lagoon for a given time in-terval, the excess or deficit of salinity, as compared to the sea water, can be used to estimate the flushing time of the lagoon.
Assuming complete mixing within the estuary and a stationary distribution of fresh and salty wa-ter for a constant river flux, Ketchum (1950) devel-oped simplified mixing models. Ketchum (1951) introduced variations to his original idea, dividing the estuary in segments; each segment was totally mixed. The method, called segmented tidal prism, was later improved by Dyer & Taylor (1973) who noted problems related to the principle of volume continuity and the segmentation of the estuary. Seg-mented tidal prism models are mainly applicable to well-mixed conditions.
Perlas Lagoon and Bluefields Bay are estuarine-lagoon systems which have been studied for over five years. Several biological, oceanographic, and fishing issues have been addressed (Pérez, 1999; Brenes & Castillo, 1999a, 1999b) but flushing time has not been explored.
Determination of the flushing time in Bluefields Bay is of particular interest. This ecosystem sup-
ports a much larger population and economic ac-tivity than Perlas Lagoon. Residual water from the population and industrial activities, which lack a collection and disposal system, is the main source of pollution into the bay (CIMAB, 1996).
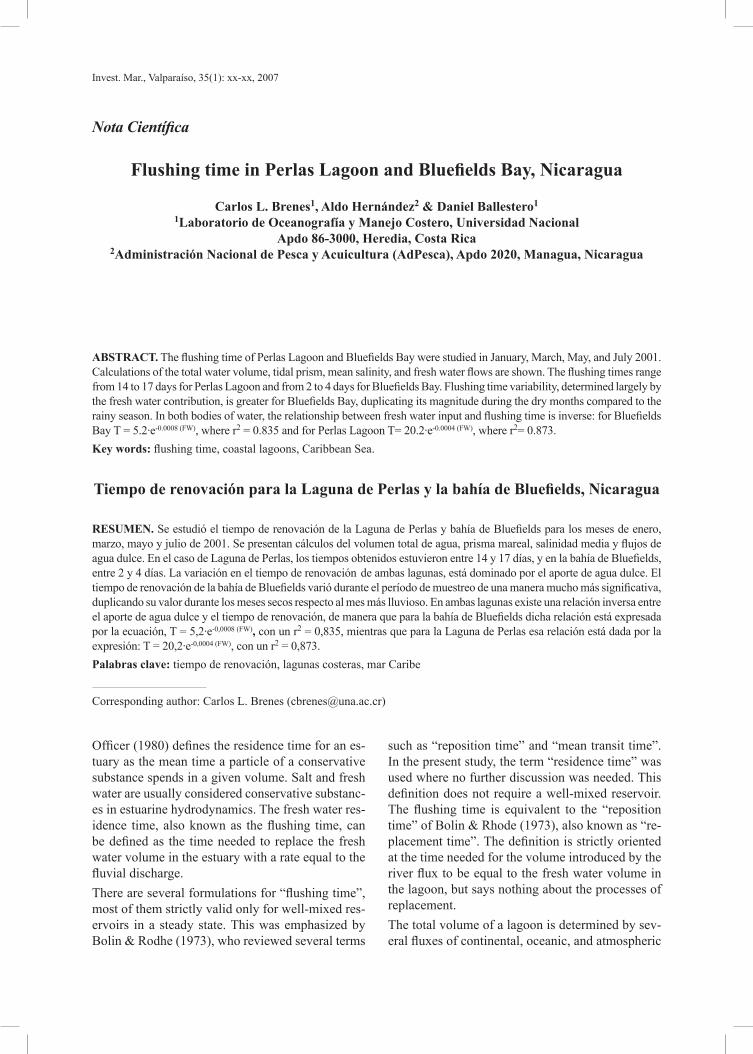
In this study, the flushing time was estimated for January, March, May, and July 2001. Flushing times obtained for Perlas Lagoon (PL) and Bluefields Bay (BB) are shown in Figure 1 as a function of the total fresh water input (Pilson, 1985).
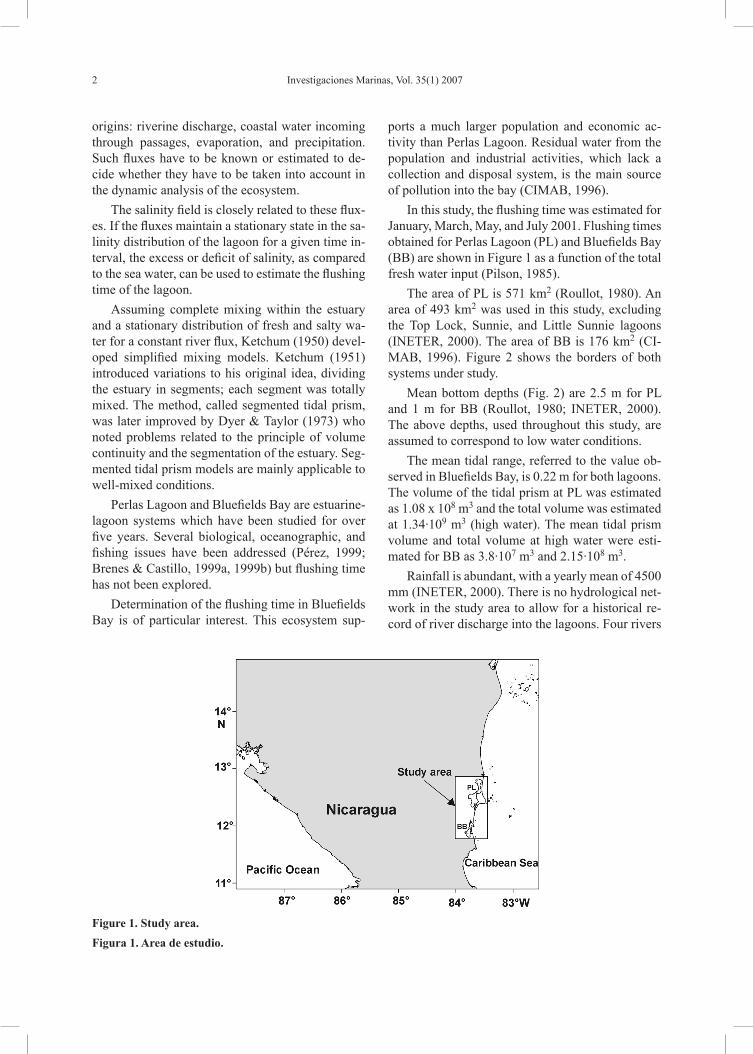
The area of PL is 571 km2 (Roullot, 1980). An area of 493 km2 was used in this study, excluding the Top Lock, Sunnie, and Little Sunnie lagoons (INETER, 2000). The area of BB is 176 km2 (CI-MAB, 1996). Figure 2 shows the borders of both systems under study.
Mean bottom depths (Fig. 2) are 2.5 m for PL and 1 m for BB (Roullot, 1980; INETER, 2000). The above depths, used throughout this study, are assumed to correspond to low water conditions.
The mean tidal range, referred to the value ob-served in Bluefields Bay, is 0.22 m for both lagoons. The volume of the tidal prism at PL was estimated as 1.08 x 10⁸ m3 and the total volume was estimated at 1.34·109 m3 (high water). The mean tidal prism volume and total volume at high water were esti-mated for BB as 3.8·107 m3 and 2.15·108 m3.
Rainfall is abundant, with a yearly mean of 4500 mm (INETER, 2000). There is no hydrological net-work in the study area to allow for a historical re-cord of river discharge into the lagoons. Four rivers
Figure 1. Study area.
Figura 1. Area de estudio.
Flushing time in Pearl Lagoon and Bluefields Bay, Nicaragua 3
Figure 2. Bathymetry (m) of a) Perlas Lagoon and b) and Bluefields Bay.
Figura 2. Batimetría (m) de a) laguna de Perlas y b) bahía de Bluefields.
provide the main source of fresh water inflow into PL: Grande de Matagalpa (through the Top Lock Lagoon), Wawasán, Pach, and Ñary; another four rivers flow into BB: Escondido, Caño Negro, Kukra, and Torsuani. Murray et al. (1982) reported mean yearly fluxes of 850 m3·s-1 and 950 m3·s-1 for the Escondido River and Río Grande de Matagalpa.
The fluxes φ (in m3·s-1, Table 1, 2) were esti-mated using surface velocities measured in January, March, May, and July 2001 as:
φ = v·A T, (1)
where: v is the mean river velocity at the surface (m·s-1) and AT the cross sectional area of the river (m2).
Lagrangian drifters were used to determine the surface velocity. To estimate the cross sectional area AT, the width of the river was measured along with the mean bottom depth evaluated along the transect across the river. The measurements were carried out along transects far from the river mouths, where sa-linity is 0.
Additional fresh water input due to precipita-tion on PL and BB (in m3·s-1) was estimated using climatological information from the Bluefields sta-tion (Table 3) as the difference between precipita-tion and evaporation (P-E) times in the lagoon area (Table 4, 5).
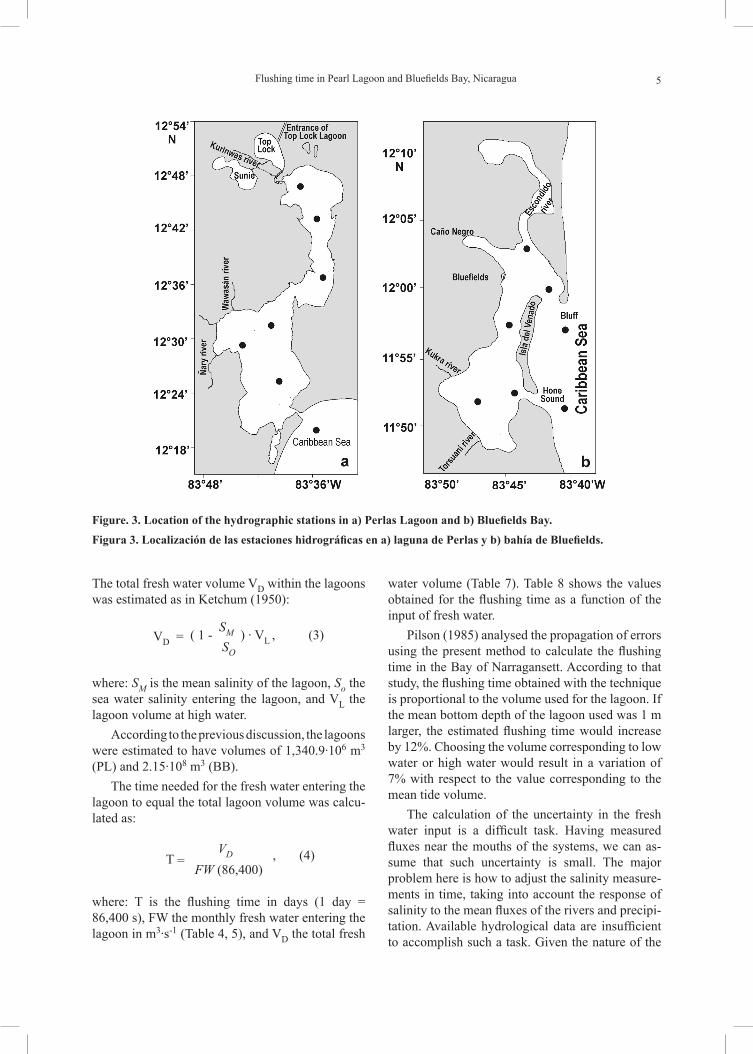
Mean salinity was determined from the hydro-graphic surveys carried out during the sampling pe-riod (Fig. 3) measuring surface and bottom salinity at high water.
It is difficult to determine the salinity of the sea water entering the lagoons, through a bar (PL) and two straits located in El Bluff in the area known as Barra Hone Sound (BB). Salinity varies with time and the mixing processes taking place in these areas are poorly understood. However, the salinity fields are consistent with a two-layer model in which a seaward, low salinity flux overlays a salty wedge entering the lagoon in the lower layer. The maxi-mum salinity measured in the bottom layer in the external part of the lagoons was used to estimate the sea water salinity (Fig 3, Table 6).
4 Investigaciones Marinas, Vol. 35(1) 2007
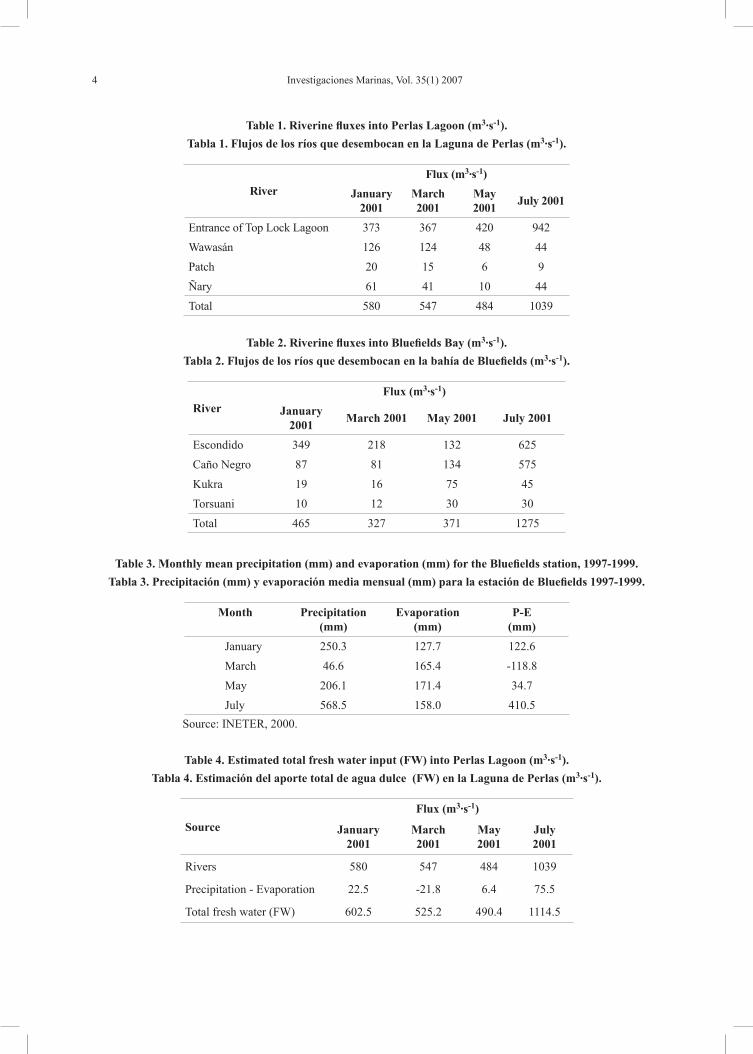
Table 1. Riverine fluxes into Perlas Lagoon (m3·s-1).
Tabla 1. Flujos de los ríos que desembocan en la Laguna de Perlas (m3·s-1).
RiverFlux (m3·s-1)
January 2001
March 2001
May2001
July 2001
Entrance of Top Lock Lagoon 373 367 420 942
Wawasán 126 124 48 44
Patch 20 15 6 9
Ñary 61 41 10 44
Total 580 547 484 1039
Table 2. Riverine fluxes into Bluefields Bay (m3·s-1).
Tabla 2. Flujos de los ríos que desembocan en la bahía de Bluefields (m3·s-1).
RiverFlux (m3·s-1)
January 2001
March 2001 May 2001 July 2001
Escondido 349 218 132 625
Caño Negro 87 81 134 575
Kukra 19 16 75 45
Torsuani 10 12 30 30
Total 465 327 371 1275
Table 3. Monthly mean precipitation (mm) and evaporation (mm) for the Bluefields station, 1997-1999.
Tabla 3. Precipitación (mm) y evaporación media mensual (mm) para la estación de Bluefields 1997-1999.
Month Precipitation (mm)
Evaporation(mm)
P-E(mm)
January 250.3 127.7 122.6
March 46.6 165.4 -118.8
May 206.1 171.4 34.7
July 568.5 158.0 410.5
Source: INETER, 2000.
Table 4. Estimated total fresh water input (FW) into Perlas Lagoon (m3·s-1).
Tabla 4. Estimación del aporte total de agua dulce (FW) en la Laguna de Perlas (m3·s-1).
Source
Flux (m3·s-1)
January 2001
March 2001
May 2001
July 2001
Rivers 580 547 484 1039
Precipitation - Evaporation 22.5 -21.8 6.4 75.5
Total fresh water (FW) 602.5 525.2 490.4 1114.5
Flushing time in Pearl Lagoon and Bluefields Bay, Nicaragua 5
The total fresh water volume VD within the lagoons was estimated as in Ketchum (1950):
VD = ( 1 - SM ) · VL , (3)SO
where: SM is the mean salinity of the lagoon, So the sea water salinity entering the lagoon, and VL the lagoon volume at high water.
According to the previous discussion, the lagoons were estimated to have volumes of 1,340.9·106 m3 (PL) and 2.15·108 m3 (BB).
The time needed for the fresh water entering the lagoon to equal the total lagoon volume was calcu-lated as:
T =
VD , (4)FW (86,400)
where: T is the flushing time in days (1 day = 86,400 s), FW the monthly fresh water entering the lagoon in m3·s-1 (Table 4, 5), and VD the total fresh
Figure. 3. Location of the hydrographic stations in a) Perlas Lagoon and b) Bluefields Bay.
Figura 3. Localización de las estaciones hidrográficas en a) laguna de Perlas y b) bahía de Bluefields.
water volume (Table 7). Table 8 shows the values obtained for the flushing time as a function of the input of fresh water.
Pilson (1985) analysed the propagation of errors using the present method to calculate the flushing time in the Bay of Narragansett. According to that study, the flushing time obtained with the technique is proportional to the volume used for the lagoon. If the mean bottom depth of the lagoon used was 1 m larger, the estimated flushing time would increase by 12%. Choosing the volume corresponding to low water or high water would result in a variation of 7% with respect to the value corresponding to the mean tide volume.
The calculation of the uncertainty in the fresh water input is a difficult task. Having measured fluxes near the mouths of the systems, we can as-sume that such uncertainty is small. The major problem here is how to adjust the salinity measure-ments in time, taking into account the response of salinity to the mean fluxes of the rivers and precipi-tation. Available hydrological data are insufficient to accomplish such a task. Given the nature of the
6 Investigaciones Marinas, Vol. 35(1) 2007
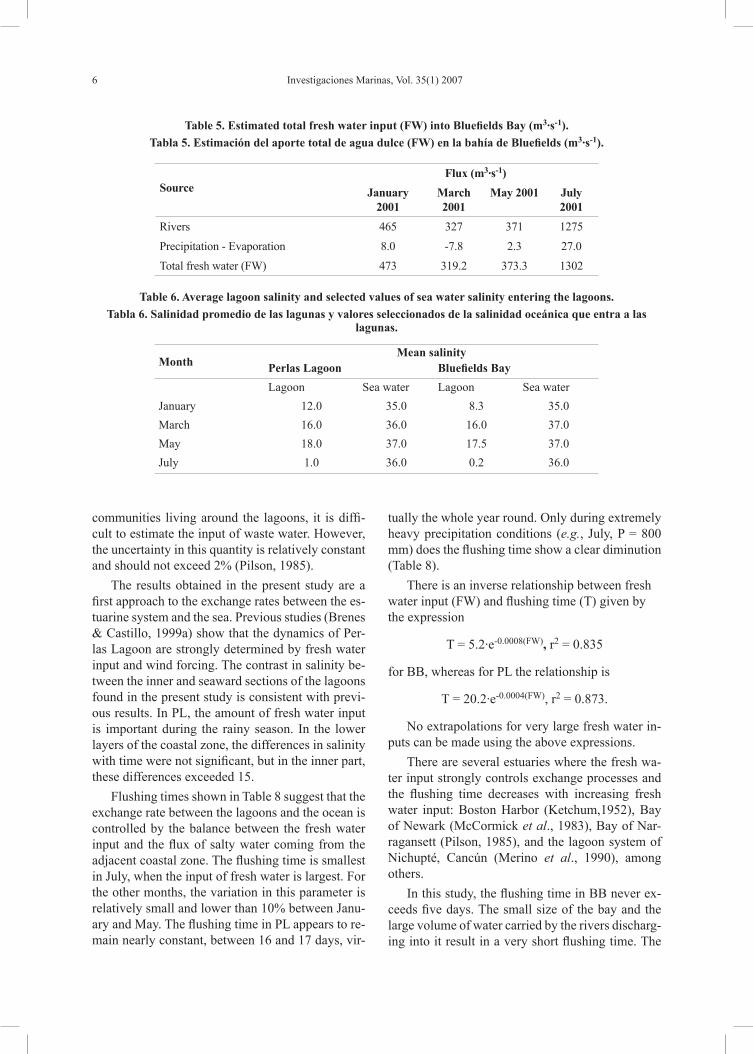
Table 5. Estimated total fresh water input (FW) into Bluefields Bay (m3·s-1).
Tabla 5. Estimación del aporte total de agua dulce (FW) en la bahía de Bluefields (m3·s-1).
SourceFlux (m3·s-1)
January 2001
March 2001
May 2001 July 2001
Rivers 465 327 371 1275
Precipitation - Evaporation 8.0 -7.8 2.3 27.0
Total fresh water (FW) 473 319.2 373.3 1302
Table 6. Average lagoon salinity and selected values of sea water salinity entering the lagoons.
Tabla 6. Salinidad promedio de las lagunas y valores seleccionados de la salinidad oceánica que entra a las lagunas.
MonthMean salinity
Perlas Lagoon Bluefields Bay
Lagoon Sea water Lagoon Sea water
January 12.0 35.0 8.3 35.0
March 16.0 36.0 16.0 37.0
May 18.0 37.0 17.5 37.0
July 1.0 36.0 0.2 36.0
communities living around the lagoons, it is diffi-cult to estimate the input of waste water. However, the uncertainty in this quantity is relatively constant and should not exceed 2% (Pilson, 1985).
The results obtained in the present study are a first approach to the exchange rates between the es-tuarine system and the sea. Previous studies (Brenes & Castillo, 1999a) show that the dynamics of Per-las Lagoon are strongly determined by fresh water input and wind forcing. The contrast in salinity be-tween the inner and seaward sections of the lagoons found in the present study is consistent with previ-ous results. In PL, the amount of fresh water input is important during the rainy season. In the lower layers of the coastal zone, the differences in salinity with time were not significant, but in the inner part, these differences exceeded 15.
Flushing times shown in Table 8 suggest that the exchange rate between the lagoons and the ocean is controlled by the balance between the fresh water input and the flux of salty water coming from the adjacent coastal zone. The flushing time is smallest in July, when the input of fresh water is largest. For the other months, the variation in this parameter is relatively small and lower than 10% between Janu-ary and May. The flushing time in PL appears to re-main nearly constant, between 16 and 17 days, vir-
tually the whole year round. Only during extremely heavy precipitation conditions (e.g., July, P = 800 mm) does the flushing time show a clear diminution (Table 8).
There is an inverse relationship between fresh water input (FW) and flushing time (T) given by the expression
T = 5.2·e-0.0008(FW), r2 = 0.835
for BB, whereas for PL the relationship is
T = 20.2·e-0.0004(FW), r2 = 0.873.
No extrapolations for very large fresh water in-puts can be made using the above expressions.
There are several estuaries where the fresh wa-ter input strongly controls exchange processes and the flushing time decreases with increasing fresh water input: Boston Harbor (Ketchum,1952), Bay of Newark (McCormick et al., 1983), Bay of Nar-ragansett (Pilson, 1985), and the lagoon system of Nichupté, Cancún (Merino et al., 1990), among others.
In this study, the flushing time in BB never ex-ceeds five days. The small size of the bay and the large volume of water carried by the rivers discharg-ing into it result in a very short flushing time. The
Flushing time in Pearl Lagoon and Bluefields Bay, Nicaragua 7
Table 7. Total fresh water volume VD (m3) obtained using equation (3).
Tabla 7. Volumen total de agua dulce VD (m3), obtenido a partir de la ecuación (3).
Month VD = Total fresh water volume(m3) · 109
Perlas Lagoon Bluefields Bay
January 0.89 0.16
March 0.75 0.12
May 0.70 0.11
July 1.30 0.21
Table 8. Estimated fresh water volume (FW) entering the lagoons and flushing time for the studied months.
Tabla 8. Volumen estimado de agua dulce (FW) que entra a las lagunas y tiempo de lavado para los meses de muestreo.
Month Perlas Lagoon Bluefields Bay
FW(m3·s-1)
Flushing time(days)
FW(m3·s-1)
Flushing time(days)
January 602 17 473 4
March 525 16 319 4
May 490 16 373 4
July 1114 14 1302 2
results obtained for the flushing time in BB (Table 8) suggest that the exchange rate between the bay and the ocean is also controlled by the fresh water input.
ACKNOWLEDGMENTS
This study was supported by DIPAL II (Proyecto para el Desarrollo Integral de la Pesca Artesanal en la Región Autónoma Atlántico Sur, Nicaragua), and by the Servicio Regional de Información Ocean-ográfica (SERIO), Universidad Nacional, Costa Rica.
REFERENCES
Brenes, C.L. & E. Castillo. 1999a. Caracterización hidrográfica de la laguna de Perlas, Nicaragua. Proyecto DIPAL II, Bluefields, Nicaragua, 46 pp.
Brenes, C.L. & E. Castillo. 1999b. Hidrografía de la bahía de Bluefields. Proyecto DIPAL II, Blue-fields, Nicaragua, 22 pp.
Bolin, B. & H. Rodhe. 1973. A note on the concepts of age distribution and transit time in natural reser-voirs. Tellus, 25: 58-62.
Centro de Ingeniería y Manejo Ambiental de Bahías y Zonas Costeras (CIMAB). 1996. Centro de In-geniería y Manejo Ambiental de Bahías y Zonas Costeras. Case of study: La Laguna de Blufields Nicaragua, bases para la formulación de un Plan de Manejo Ambiental. Proyecto Regional PNUMA CAR/P/CR/5101-90-05(2494), La Habana, 86 pp.
Dyer, K. & P.A. Taylor. 1973. A simple segmented prism model of tidal mixing in well-mixed estuar-ies. Estuar. Coast. Mar. Sci., 1: 411-418.
Instituto Nicaragüense de Estudios Territoriales (INETER). 2000. Instituto Nicaragüense de Es-tudios Territoriales. Dirección de Meteorología. Informe escrito, 25 pp.
Ketchum, B.H. 1950. Hydrographic factors involved in the dispersion of pollutants introduced into tidal waters, J. Bos. Soc. Civil Eng., 37: 296-314.
Ketchum, B.H. 1951. The exchanges of fresh and salt waters in tidal estuaries. J. Mar. Res., 10: 18-37.
Ketchum, B.H. 1952. Circulation in estuaries. Pro-ceedings third Conference on Coastal Engineer-ing, 65-76 pp.

8 Investigaciones Marinas, Vol. 35(1) 2007
McCormick, J.M., R.I. Hires, G.W. Luther & S.L. Cheng. 1983. Partial recovery of Newark Bay, NJ, following pollution abatement. Mar. Poll. Bull., 14: 188-197.
Merino, M., S. Czitrom, E. Jordán, E. Martin, P. Thomé & O. Moreno. 1990. Hydrology and rain flushing on the Nichupté Lagoon system, Cancún, México. Estuar. Coast. Mar. Sci., 30: 223-237.
Murray, S.P, S.A. Hsu, H.R. Roberts, E.H. Owens & R.L. Grout. 1982. Physical processes and sedi-mentation on a broad, shallow bank. Estuar. Coast. Mar. Sci., 14: 135-157.
Officer, C.B. 1980. Box models revisited. In: P. Ham-ilton & R.B. Macdonald (eds.). Estuarine and wet-
Recibido: 16 agosto de 2005; Aceptado 15 enero 2007
land processes, Mar. Sci. Ser., Plenun Press, New York, 11: 65-114.
Pérez, M. 1999. Biología pesquera y aspectos ecológi-cos de la ictiofauna más importante de la cuenca de Laguna de Perlas en la región autónoma del Atlán-tico sur (RAAS) de Nicaragua. Proyecto DIPAL II, Bluefields, Nicaragua, 142 pp.
Pilson, M.E.Q. 1985. On the residence time of water in Narragansett Bay. Estuaries, 8: 2-14.
Roullot, J. 1980. Informe de la misión en la Laguna de Perlas, Nicaragua. Programa Interregional de Ordenación y Desarrollo Pesqueros. Informe WE-CAF, 34: 62 pp.


![Consumo Energético, Rivas-Nicaragua [Subcuenca Gil Gonzalez]](https://static.fdokumen.com/doc/165x107/632535c285efe380f30695c2/consumo-energetico-rivas-nicaragua-subcuenca-gil-gonzalez.jpg)