User Manual Convertible Tablet roda PEGASUS - roda computer ...
Upload
digitaluniversityCategory
view
1download
0
Available online at www.ilcpa.pl
International Letters of Chemistry, Physics and Astronomy
3 (2015) 25-35 ISSN 2299-3843
Analytical Method Validation of Simultaneous determination of Spironolactone and Furosemide in
tablet formulation and its Statistical evaluation
Rajesh R. Ram1,*, Vijay R. Ram2, Hitendra S. Joshi3
1Department of Mathamatics, Bahauddin Science College, Junagadh, Gujarat, India
2Department of Chemistry, KSKV Kachchh University, Bhuj, Gujarat, India
3Department of Chemistry, Saurashtra University, Rajkot, Gujarat, India
*E-mail address: [email protected]
ABSTRACT
The objective of current study was to Statistical Comparison for Precision and Intermediate
Precision study for Analytical Method Validation of Spironolactone and Furosemide in tablet
formulation and developed easy, exact and correct isocratic stability indicating reversed phase HPLC
assay method and validated for determination of Spironolactone and Furosemide in solid
pharmaceutical dosage forms. Isocratic RP-HPLC separation was achieved on an SGE make 150
4.6mm SS Wakosil II 5C18RS 5 μm column (Part Number: 206610 and Serial Number: A01-063)
using mobile phase of Acetonitrile- Ammonium acetate buffer (50:50, v/v) at a flow rate of 1.1 ml/min
and the detection was carried out at 254 nm using photo-diode array detector. The method was
validated for specificity, linearity, precision, accuracy, robustness and solution stability. The method
was linear in the drug concentration range of 40-160 µg/ml with a correlation coefficient 0.9977 and
0.9953 for Spironolactone and Furosemide respectively. The precision (RSD) amongst six-sample
preparation was 0.87% and 1.1 % for Spironolactone and Furosemide respectively. For repeatability
and intermediate precision (RSD) amongst six-sample preparation was 0.46 % and 0.20 % for
Spironolactone and Furosemide respectively. As result shown that for furosemide, % RSD was 1.12%
and in ANOVA study Significance F value found 0.625502408 and for spironolactone Precision study
and Intermediate precision study % RSD was 0.68, in ANOVA study Significance F value found
0.905843808.
Keywords: Statistical Comparison; Precision and Intermediate Precision study; Analytical Method
Validation; Spironolactone; Furosemide; Tablet Formulation
1. INTRODUCTION
Stress testing is a part of developmental strategy under the ICH requirements and is
carried out under more severe conditions than accelerated conditions. These studies serve to
give information on drug’s inherent stability and help in the validation of analytical methods

International Letters of Chemistry, Physics and Astronomy 3 (2015) 25-35
-26-
to be used in stability studies [1-3]. It is suggested that stress testing should include the effect
of temperature, light, oxidizing agents as well as susceptibility across a wide range of pH
values. It is also recommended that analysis of stability sample should de done through the
use of a validated stability testing methods.
1. 1. Introduction of drug
1. 1. 1. Introduction of furosemide
Furosemide is chemically 4-Chloro-2-(furan-2-ylmethylamino)-5-sulfa moylbenzoic
acid (Figure 1). Its CAS number is 54-31-9. Its molecular formula is C12H11ClN2O5S having
molecular weight 330.74gm/mole. Furosemide, an anthranilic acid derivative, is a potent
diuretic that inhibits the active reabsorption of chloride in the diluting segment of the loop of
Henle, thus preventing the reabsorption of sodium, which passively follows chloride [4]. This
loop diuretic is commonly used for the treatment of renal diseases, congestive heart failure
and hypertension [5].
Cl
S
O
NH2
O
O OH
NHO
Figure 1. 4-Chloro-2-(furan-2-ylmethylamino)-5-sulfamoylbenzoic acid.
1. 1. 2. Introduction of spironolactone
Spironolactone is chemically 7α-Acetylthio-3-oxo-17α-pregn-4-ene-21,17-carbolactone
(Figure 2). Its molecular formula is C24H32O4S having molecular weight 416.58 gm/mole.
Spironolactone inhibits the effect of aldosterone by competing for intracellular aldosterone
receptors in the distal tubule cells (it actually works on aldosterone receptors in the collecting
duct). This increases the excretion of water and sodium, while decreasing the excretion of
potassium. Spironolactone has a fairly slow onset of action, taking several days to develop,
and similarly the effect diminishes slowly. Spironolactone has anti-androgen activity by
binding to the androgen receptor and preventing it from interacting with dihydro testosterone
[6]. Various publications are available regarding determination method of Spironolactone and
Furosemide but most of the methods are applicable to alone Spironolactone or Furosemide in
pharmaceutical dosage form or in biological fluids. Potentiometric [7], colorimetric
estimation [8], thin-layer chromatography [9], fluorometrically [10], complexation [11], flow
injection chemiluminescence method [12], proton nuclear magnetic resonance spectroscopic
[13] and HPLC methods [14] are reported. Only four methods are reported for the
simultaneous determination of spironolactone and furosemide. One method is reported for
HPLC analysis. [15] As far as our knowledge is concern, no method for the determination of
spironolactone and furosemide in combine dosage forms has been published. The previous

International Letters of Chemistry, Physics and Astronomy 3 (2015) 25-35
-27-
published methods are not directly applicable for this issue and need more investigation for
method development and validation.
O
O
O
H
H
H
H
S
O CH3
H
Figure 2. 7α-Acetylthio-3-oxo-17α-pregn-4-ene-21,17-carbolactone.
2. EXPERIMENTAL
2. 1. Materials
Spironolactone and Furosemide standard of was provided by Alembic Pharmaceuticals
Ltd., Baroda (India). Spironolactone and Furosemide tablets containing 50 mg Spironolactone
and 20 mg Furosemide and the inactive ingredient used in drug matrix were obtained from
market. HPLC grade acetonitrile and water were obtained from Spectrochem Pvt. Ltd.,
Mumbai (India). Analytical grade ammonium acetate, hydrochloric acid, glacial acetic acid,
sodium hydroxide pellets and 30% v/v hydrogen peroxide solution were obtained from
Ranbaxy Fine Chemicals, New Delhi (India).
2. 2. Instrumentation
The chromatographic system used to perform development and validation of this assay
method was comprised of a LC-10ATvp binary pump, a SPD-M10Avp photo-diode array
detector and a rheodyne manual injector model 7725i with 20μl loop (Shimadzu, Kyoto,
Japan) connected to a multi-instrument data acquisition and data processing system (Class-VP
6.13 SP2, Shimadzu).
2. 3. Chromatographic conditions
Chromatographic analysis was performed on a SGE make SS Wakosil II 5C18RS
column (150mm x 4.6mm i.d., 5 μm particle size) column. The mobile phase consisted of
acetonitrile – 0.01M ammonium acetate buffer pH 3.9 (50: 50, v/v). To prepare the buffer
solution, 0.7708 g ammonium acetate were weighed and dissolve in 1000 ml HPLC grade
water and then adjusted to pH 3.9 with glacial acetic acid. Mobile phase was filtered through
a 0.45μm nylon membrane (Millipore Pvt. Ltd. Bangalore, India) and degassed in an
ultrasonic bath (Spincotech Pvt. Ltd., Mumbai). The flow rate of the mobile phase was
adjusted to 1.1 ml/min and the injection volume was 20 μl. Detection was performed at
254nm.

International Letters of Chemistry, Physics and Astronomy 3 (2015) 25-35
-28-
2. 4. Standard preparation
Spironolactone standard stock solution containing 500µg/ml was prepared in a 100 ml
volumetric flask by dissolving 50.00 mg of Spironolactone and then diluted to volume with
diluent. Further take 10 ml of this stock solution in 50 ml volumetric flask and make up to
mark with diluent (this standard solution of 100µg/ml). And for a Furosemide standard stock
solution containing 200µg/ml was prepared in a 100 ml volumetric flask by dissolving 20.00
mg of Furosemide and then diluted to volume with diluent. Further take 10 ml of this stock
solution in 50 ml volumetric flask and make up to mark with diluent (this standard solution of
40µg/ml).
Figure 3. Chromatogram of standard preparation.
2. 5. Test preparation
Twenty tablets were weighed and the average weight of tablet was determined. From
these, five tablets were weighed and transfer into a 500 ml volumetric flask. About 50 ml of
diluent was added and sonicated for a minimum 30 min. with intermittent shaking. Then
content was brought back to room temperature and diluted to volume with diluent. The
sample was filtered through 0.45µm nylon syringe filter. Further take 10 ml of this stock
solution in 50 ml of volumetric flask and make up to mark with diluent. The concentration
obtained was 100 µg/ml of Spironolactone and 40 µg/ml of Furosemide.
3. RESULT AND DISCUSSION
3. 1. Method validation
3. 1. 1. Specificity study
The evaluation of the specificity of the method was determined against placebo. The
interference of the excipients of the claimed placebo present in pharmaceutical dosage form
was derived from placebo solution. Further the specificity of the method toward the drug was
established by means of checking the interference of the degradation products in the drug
quantification for assay during the forced degradation study.
Minutes
0 1 2 3 4 5 6 7 8 9 10 11 12
mA
U
0
100
200
Fu
rose
mid
e
Sp
iro
no
lacto
ne

International Letters of Chemistry, Physics and Astronomy 3 (2015) 25-35
-29-
Table 1. Precision study for Analytical Method Validation of Furosemide Spironolactone.
Furosemide Spironolactone
Description Mean
area Wt. (mg)
%
Assay Description
Mean
area
Wt.
(mg)
%
Assay
Set 1 998819 1071.5 101.0 Set 1 3366197 1071.5 101.0
Set 2 999963 1070.5 101.1 Set 2 3379481 1070.5 101.4
Set 3 978857 1071.3 98.9 Set 3 3311436 1071.3 99.4
Set 4 975578 1070.3 98.6 Set 4 3366585 1070.4 101.0
Set 5 987644 1071.4 99.8 Set 5 3351654 1071.4 100.6
Set 6 1003532 1072 101.4 Set 6 3397057 1072 101.9
Mean 100.1 Mean 100.9
Stdev 1.19 Stdev 0.87
% RSD 1.19 %
RSD 0.87
Standard
mean area 995588
Standard
mean
area
Standard mean
area 3374356
Standard
wt. (mg) 19.8
Standard
wt. (mg)
Standard wt.
(mg) 49.8
Test wt 1071.3 Test wt Test wt 1071.3
Label claim
(mg) 20
Label
claim
(mg)
Label claim
(mg) 50
Average
Wt. (mg) 217.8
Average
Wt. (mg)
Average Wt.
(mg) 217.8
International Letters of Chemistry, Physics and Astronomy 3 (2015) 25-35
-30-
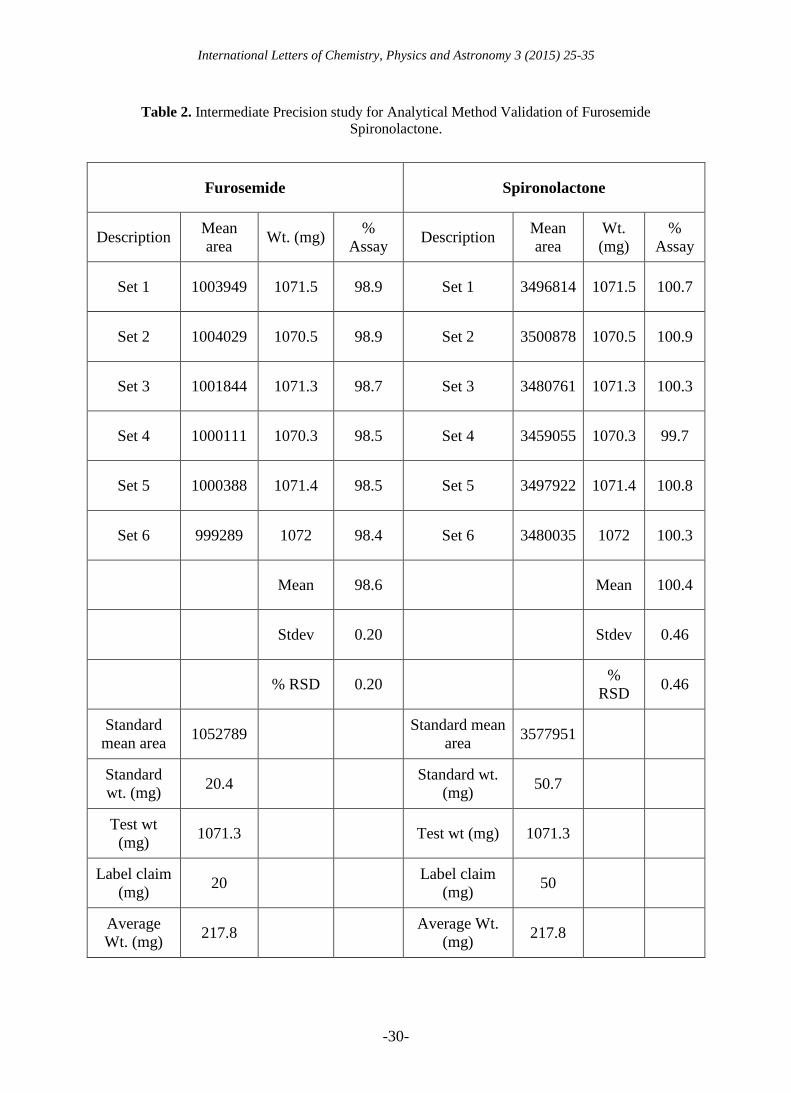
Table 2. Intermediate Precision study for Analytical Method Validation of Furosemide
Spironolactone.
Furosemide Spironolactone
Description Mean
area Wt. (mg)
%
Assay Description
Mean
area
Wt.
(mg)
%
Assay
Set 1 1003949 1071.5 98.9 Set 1 3496814 1071.5 100.7
Set 2 1004029 1070.5 98.9 Set 2 3500878 1070.5 100.9
Set 3 1001844 1071.3 98.7 Set 3 3480761 1071.3 100.3
Set 4 1000111 1070.3 98.5 Set 4 3459055 1070.3 99.7
Set 5 1000388 1071.4 98.5 Set 5 3497922 1071.4 100.8
Set 6 999289 1072 98.4 Set 6 3480035 1072 100.3
Mean 98.6 Mean 100.4
Stdev 0.20 Stdev 0.46
% RSD 0.20 %
RSD 0.46
Standard
mean area 1052789
Standard mean
area 3577951
Standard
wt. (mg) 20.4
Standard wt.
(mg) 50.7
Test wt
(mg) 1071.3 Test wt (mg) 1071.3
Label claim
(mg) 20
Label claim
(mg) 50
Average
Wt. (mg) 217.8
Average Wt.
(mg) 217.8

International Letters of Chemistry, Physics and Astronomy 3 (2015) 25-35
-31-
Table 3. Statistical Comparison of Precision and Intermediate Precision study for Analytical Method
Validation of Furosemide in tablet formulation.
Precision
study
FUROSEMIDE
Set 1 101.0 For Precision For Intermediate Precision
Set 2 101.1 Mean 101.35 Mean 100.3333
Set 3 98.9 Standard
Error 0.287228132
Standard
Error 0.567255
Set 4 98.6 Median 101.15 Median 99.8
Set 5 99.8 Mode #N/A Mode #N/A
Set 6 101.3 Standard
Deviation 0.703562364
Standard
Deviation 1.389484
Intermediate
precision
study
Set 1 98.9 Sample
Variance 0.495
Sample
Variance 1.930667
Set 2 98.9 Kurtosis -
1.398102234 Kurtosis -1.40619
Set 3 98.7 Skewness 0.478086455 Skewness 0.698096
Set 4 98.5 Range 1.8 Range 3.5
Set 5 98.5 Minimum 100.5 Minimum 98.8
Set 6 98.4 Maximum 102.3 Maximum 102.3
Mean 99.4 Sum 608.1 Sum 602
Stdev 1.12 Count 6 Count 6
% RSD 1.12 Confidence
Level(95.0%) 0.738342213
Confidence
Level(95.0%) 1.458172
FUROSEMIDE
SUMMARY
OUTPUT
Regression
Statistics
Multiple R 0.255205564
R Square 0.06512988

International Letters of Chemistry, Physics and Astronomy 3 (2015) 25-35
-32-
Adjusted R
Square -0.16858765
Standard
Error 0.234357888
Observations 6
ANOVA
df SS MS F Significance
F
Regression 1 0.015305522 0.015305522 0.278669 0.625502408
Residual 4 0.219694478 0.05492362
Total 5 0.235
Coefficients Standard
Error t Stat P-value Lower 95% Upper 95%
Intercept 93.99657614 8.815636944 10.66248267 0.000438 69.5204441 118.4727082
X Variable 1 0.046734418 0.088530383 0.527891288 0.625502 -0.19906533 0.292534165
3. 1. 2. Linearity
Linearity test solutions for the assay method were prepared at seven concentration levels
from 40 to 160 % of assay analyte concentration (40, 60, 80, 100, 120, 140 and 160µg/ml).
The peak areas versus concentration data were evaluated by linear regression analysis.
3. 1. 3. Precision
The precision of the assay method was evaluated in terms of repeatability by carrying
out six independent assays of Spironolactone and Furosemide test sample preparation and
calculated the % RSD of assay (intraday). Intermediate precision of the method was checked
by performing same procedure on the different day (interday) by another person under the
same experimental condition.
3. 1. 4. STATISTICAL EVALUATION
Statistical evaluation is given in table no. 1, 2, 3 and 4. And Formula for assay
calculation was
% Assay = Average Test area / Average std. area * Std. wt. * 405.48/441.94 / 250 * 250 / Test
wt. / Label claim * Average wt. * Potency of std.

International Letters of Chemistry, Physics and Astronomy 3 (2015) 25-35
-33-
Table 4. Statistical Comparison of Precision and Intermediate Precision study for Analytical Method
Validation of Spironolactone in tablet formulation.
Precision
study
SPIRONOLACTONE
Set 1 101.0 For Precision For Intermediate Precision
Set 2 101.4 Mean 101.35 Mean 100.3333
Set 3 99.4 Standard
Error 0.287228132
Standard
Error 0.567255
Set 4 101.0 Median 101.15 Median 99.8
Set 5 100.6 Mode #N/A Mode #N/A
Set 6 101.9 Standard
Deviation 0.703562364
Standard
Deviation 1.389484
Intermediate
precision
study
Set 1 100.7 Sample
Variance 0.495
Sample
Variance 1.930667
Set 2 100.9 Kurtosis -
1.398102234 Kurtosis -1.40619
Set 3 100.3 Skewness 0.478086455 Skewness 0.698096
Set 4 99.7 Range 1.8 Range 3.5
Set 5 100.8 Minimum 100.5 Minimum 98.8
Set 6 100.3 Maximum 102.3 Maximum 102.3
Mean 100.7 Sum 608.1 Sum 602
Stdev 0.69 Count 6 Count 6
% RSD 0.68 Confidence
Level(95.0%) 0.738342213
Confidence
Level(95.0%) 1.458172
FUROSEMIDE
SUMMARY
OUTPUT
Regression
Statistics
Multiple R 0.062853564
R Square 0.00395057

International Letters of Chemistry, Physics and Astronomy 3 (2015) 25-35
-34-
Adjusted R
Square -0.245061787
Standard
Error 0.497762288
Observations 6
ANOVA
df SS MS F Significance
F
Regression 1 0.003930818 0.003930818 0.015865 0.905843808
Residual 4 0.991069182 0.247767296
Total 5 0.995
Coefficients Standard
Error t Stat P-value Lower 95% Upper 95%
Intercept 97.28805031 25.10439313 3.875339659 0.017912 27.58708089 166.9890197
X Variable 1 0.031446541 0.249662563 0.125956173 0.905844 -
0.661727859 0.72462094
4. CONCLUSION
In this current study a new analytical method has been developed to be routinely applied
to simultaneous determine Spironolactone and Furosemide in pharmaceutical dosage form.
The developed procedure has been statistically evaluated for Precision study and Intermediate
precision study. And as result shown that for furosemide, % RSD was 1.12% and in ANOVA
study Significance F value found 0.625502408 and for spironolactone Precision study and
Intermediate precision study % RSD was 0.68, in ANOVA study Significance F value found
0.905843808. So, it is concluded that current method passes through its Significance value.
Hence, the method is recommended for routine quality control analysis and also stability
sample analysis.
Acknowledgements
The authors are thankful to Department of Chemistry, Saurashtra University, Rajkot (INDIA) and Department of
Chemistry, KSKV Kachchh University for providing analytical facilities.

International Letters of Chemistry, Physics and Astronomy 3 (2015) 25-35
-35-
Reference
[1] S. Singh, M. Bakshi, Pharm. Technol. 24 (2004) 1.
[2] M. Bakshi, B. Singh, A. Singh, S. Singh, J. Pharm. Biomed. Anal. 26 (2001) 1011.
[3] M. Bakshi, S. Singh, J. Pharm. Biomed. Anal. 28 (2002) 891.
[4] E. Berardesca, P. Gabba, G. Ucci, G. Borroni, G. Rabbiosi, Int. J. Tissue React. 10(2)
(1988) 115.
[5] H. R. Jacobson, J. P. Kokko, Annu. Rev. Pharmacol. Toxicol. 16 (1976) 201.
[6] www.sanofi-aventis.com
[7] www.archneur.ama-assn.org
[8] Felipe Silva Semaan, Paulo Alberto Nogueira, Eder Tadeu Gomes Cavalheiro,
Analytical Letters 41(1) (2008) 66-79.
[9] Juan Xie, Fang Yang, Yu Zhai, Jie Yao, Weiqun Zhang, Zhongguo Yaofang.
Tetrahedron 18(31) (2007) 2454-2455.
[10] Pradeep Mishra, D. Katrolia, R. K. Agrawal, Current Science 58(9) (1989) 503-505.
[11] Lilo O. Guerello, Jose Dobrecky, Revista Farmaceutica 111(1-2) (1969) 13-16.
[12] B Wesley-Hadzija, A M Mattocks, Journal of chromatography 229(2) (1982) 425-32.
[13] A. Goelcue, Journal of Analytical Chemistry 61(8) (2006) 748-754.
[14] dward F. Salim, A. Haussler, J. B. Vaughan, Journal of Pharmaceutical Sciences 57(4)
(1968) 640-641.
[15] V. Ram, P. Dave and H. Joshi, Journal of Chromatographic Science 50(8) (2012) 721-
726.
( Received 05 November 2014; accepted 18 November 2014 )
Copyright © 2022 FDOKUMEN