Analytical sensitivity and specificity of four point of care rapid ...
26
Category: Infectious Disease Analytical sensitivity and specificity of four point of care rapid antigen diagnostic tests for SARS-CoV-2 using real-time quantitative PCR, quantitative droplet digital PCR, and a mass spectrometric antigen assay as comparator methods Brad S. Karon *1 , Leslie Donato 1 , Amber R. Bridgeman 1 , Joseph H. Blommel 1 , Benjamin Kipp 1 , Anthony Maus 1 , Santosh Renuse 1,2 , Jennifer Kemp 1 , Anil K. Madugundu 1,3,4,5 , Patrick M. Vanderboom 1 , Sandip Chavan 1 , Surendra Dasari, 6 Ravinder J. Singh 1 , Stefan K. G. Grebe 1,7 , Akhilesh Pandey 1,2 1. Department of Laboratory Medicine and Pathology 2. Center for Individualized Medicine 3. Institute of Bioinformatics, International Technology Park, Bangalore 560066, Karnataka, India 4. Manipal Academy of Higher Education (MAHE), Manipal 576104, Karnataka, India 5. Center for Molecular Medicine, National Institute of Mental Health and Neurosciences, Hosur Road, Bangalore, 560029, Karnataka, India 6. Division of Biomedical Statistics and Informatics, Department of Health Sciences Research 7. Department of Medicine, Division of Endocrinology Mayo Clinic, Rochester MN 55905 USA Running Title: Analytical sensitivity and specificity of SARS-CoV-2 antigen tests * To whom correspondence should be addressed at: Brad S. Karon MD PhD Department of Laboratory Medicine and Pathology Mayo Clinic Rochester 200 First St SW Rochester, MN 55905 Email: [email protected] Fax: 507-538-7060 Key words: SARS-CoV-2, antigen, point of care, rapid diagnostic test Abbreviations: Ag RDT: rapid antigen diagnostic tests; RT-qPCR: reverse transcription quantitative polymerase chain reaction; ddPCR: droplet digital PCR; PBS: phosphate buffered saline; LF: lateral flow; FIA: fluorescence immunoassay; SARS-CoV-2: severe acute respiratory syndrome coronavirus 2; NAAT: nucleic acid amplification tests; LC-480: Roche Light Cycler 480; EUA: emergency use authorization; FDA: U.S Food and Drug Administration; Ct: cycle threshold; POC: point of care; PRM: parallel reaction monitoring; MS: mass spectrometric Page 1 of 33 Manuscripts submitted to Clinical Chemistry 1 2 3 4 5 6 7 8 9 10 11 12 13 14 15 16 17 18 19 20 21 22 23 24 25 26 27 28 29 30 31 32 33 34 35 36 37 38 39 40 41 42 43 44 45 46 47 48 49 50 51 52 53 54 55 56 57 58 59 60 © American Association for Clinical Chemistry 2021. All rights reserved. For permissions, please e-mail: [email protected] Downloaded from https://academic.oup.com/clinchem/advance-article/doi/10.1093/clinchem/hvab138/6317830 by guest on 15 July 2021
-
Upload
khangminh22 -
Category
Documents
-
view
1 -
download
0
Transcript of Analytical sensitivity and specificity of four point of care rapid ...

Category: Infectious Disease
Analytical sensitivity and specificity of four point of care rapid antigen diagnostic tests for SARS-CoV-2 using real-time quantitative PCR, quantitative droplet digital PCR, and a
mass spectrometric antigen assay as comparator methods
Brad S. Karon*1, Leslie Donato1, Amber R. Bridgeman1, Joseph H. Blommel1, Benjamin Kipp1, Anthony Maus1, Santosh Renuse1,2, Jennifer Kemp1, Anil K. Madugundu1,3,4,5, Patrick M. Vanderboom1, Sandip
Chavan1, Surendra Dasari,6 Ravinder J. Singh1, Stefan K. G. Grebe1,7, Akhilesh Pandey1,2
1. Department of Laboratory Medicine and Pathology 2. Center for Individualized Medicine3. Institute of Bioinformatics, International Technology Park, Bangalore 560066, Karnataka, India4. Manipal Academy of Higher Education (MAHE), Manipal 576104, Karnataka, India5. Center for Molecular Medicine, National Institute of Mental Health and Neurosciences, Hosur
Road, Bangalore, 560029, Karnataka, India6. Division of Biomedical Statistics and Informatics, Department of Health Sciences Research7. Department of Medicine, Division of Endocrinology
Mayo Clinic, Rochester MN 55905 USA
Running Title: Analytical sensitivity and specificity of SARS-CoV-2 antigen tests
* To whom correspondence should be addressed at:
Brad S. Karon MD PhD
Department of Laboratory Medicine and Pathology
Mayo Clinic Rochester
200 First St SW
Rochester, MN 55905
Email: [email protected]
Fax: 507-538-7060
Key words: SARS-CoV-2, antigen, point of care, rapid diagnostic test
Abbreviations: Ag RDT: rapid antigen diagnostic tests; RT-qPCR: reverse transcription quantitative polymerase chain reaction; ddPCR: droplet digital PCR; PBS: phosphate buffered saline; LF: lateral flow; FIA: fluorescence immunoassay; SARS-CoV-2: severe acute respiratory syndrome coronavirus 2; NAAT: nucleic acid amplification tests; LC-480: Roche Light Cycler 480; EUA: emergency use authorization; FDA: U.S Food and Drug Administration; Ct: cycle threshold; POC: point of care; PRM: parallel reaction monitoring; MS: mass spectrometric
Page 1 of 33 Manuscripts submitted to Clinical Chemistry
123456789101112131415161718192021222324252627282930313233343536373839404142434445464748495051525354555657585960
© American Association for Clinical Chemistry 2021. All rights reserved. For permissions, please e-mail:
Dow
nloaded from https://academ
ic.oup.com/clinchem
/advance-article/doi/10.1093/clinchem/hvab138/6317830 by guest on 15 July 2021

2
1 Abstract
2 Background: We evaluated the analytical sensitivity and specificity of four rapid antigen
3 diagnostic tests (Ag RDTs) for SARS-CoV-2, using reverse transcription quantitative PCR (RT-
4 qPCR) as the reference method; and further characterizing samples using droplet digital
5 quantitative PCR (ddPCR) and a mass spectrometric antigen test.
6 Methods: 350 (150 negative and 200 RT-qPCR positive) residual phosphate buffered saline (PBS)
7 samples were tested for antigen using the BD Veritor lateral flow (LF), ACON LF, ACON
8 fluorescence immunoassay (FIA), and LumiraDx FIA. ddPCR was performed on RT-qPCR
9 positive samples to quantitate the viral load in copies/mL applied to each Ag RDT. Mass
10 spectrometric antigen testing was performed on PBS samples to obtain a set of RT-qPCR positive,
11 antigen positive samples for further analysis.
12 Results: All Ag RDTs had nearly 100% specificity compared to RT-qPCR. Overall analytical
13 sensitivity varied from 66.5% to 88.3%. All methods detected antigen in samples with viral load
14 >1,500,000 copies/mL RNA, and detected ≥75% of samples with viral load of 500,000 to
15 1,500,000 copies/mL. The BD Veritor LF detected only 25% of samples with viral load between
16 50,000-500,000 copies/mL, compared to 75% for the ACON LF device and >80% for LumiraDx
17 and ACON FIA. The ACON FIA detected significantly more samples with viral load <50,000
18 copies/mL compared to the BD Veritor. Among samples with detectable antigen and viral load
19 <50,000 copies/mL, sensitivity of the Ag RDT varied between 13.0% (BD Veritor) and 78.3%
20 (ACON FIA).
21 Conclusions: Ag RDTs differ significantly in analytical sensitivity, particularly at viral load
22 <500,000 copies/mL.
Page 2 of 33
https://mc.manuscriptcentral.com/clinchem
Manuscripts submitted to Clinical Chemistry
123456789101112131415161718192021222324252627282930313233343536373839404142434445464748495051525354555657585960
Dow
nloaded from https://academ
ic.oup.com/clinchem
/advance-article/doi/10.1093/clinchem/hvab138/6317830 by guest on 15 July 2021
3
23 1. Introduction
24 Severe acute respiratory syndrome coronavirus 2 (SARS-CoV-2) causes a mild to severe
25 respiratory illness(1). While most infections are asymptomatic or cause mild symptoms,
26 individuals with underlying health conditions and the elderly are at highest risk of developing
27 severe complications(2). Nucleic acid amplification tests (NAAT), primarily reverse transcription
28 quantitative polymerase chain reaction (RT-qPCR), are considered the gold standard for diagnosis,
29 but most take several hours to complete. Cost and instrumentation are also barriers to providing
30 NAAT testing; especially for screening in communities, schools or long-term care facilities.
31 Rapid diagnostic tests that detect SARS-CoV-2 antigen (Ag RDTs) are one solution to
32 expand screening for SARS-CoV-2 infection, but large prospective studies have reported variable
33 clinical sensitivity of Ag RDT. Depending upon the population studied and reference NAAT
34 method, sensitivities of Ag RDTs have ranged from 35.8-97.6% in independent studies (3-11).
35 Most studies have used lateral flow (LF) immunoassay devices, though fluorescence immunoassay
36 (FIA) devices also have been found to have variable clinical sensitivity ranging from 41.2-97.6%
37 (8, 12).
38 Differing results for clinical sensitivity of Ag RDTs may be due to factors such as patient
39 population studied, reference test used, or differences in the analytical sensitivity of Ag RDTs.
40 For influenza rapid antigen testing, FIA methods have shown improved clinical and analytical
41 sensitivity compared to LF methods (13, 14). In contrast few studies have evaluated the analytical
42 sensitivity of Ag RDTs (15-18). One study compared an FIA Ag RDT to three LF devices and
43 found that the FIA had higher sensitivity in specimens with viral loads >1,000,000 copies/mL(15).
44 Comparing the analytical sensitivity of Ag RDTs is challenging because archived samples must
Page 3 of 33
https://mc.manuscriptcentral.com/clinchem
Manuscripts submitted to Clinical Chemistry
123456789101112131415161718192021222324252627282930313233343536373839404142434445464748495051525354555657585960
Dow
nloaded from https://academ
ic.oup.com/clinchem
/advance-article/doi/10.1093/clinchem/hvab138/6317830 by guest on 15 July 2021

4
45 be used that are not the intended sample type, and there is currently no reference method for antigen
46 detection. The clinical significance of SARS-CoV-2 NAAT positive, antigen negative samples
47 remains uncertain.
48 We compared the analytical sensitivity and specificity of four SARS-CoV-2 Ag RDTs, two LF
49 and two FIA assays, using 150 negative and 200 positive phosphate buffered saline (PBS) samples
50 tested by an RT-qPCR reference method. Ag RDTs were performed after 10-fold dilution of PBS
51 sample into method-specific extraction buffer, after validation of the dilution protocol. To help
52 address the lack of a reference method for antigen measurement, we also used a laboratory-
53 developed, mass spectrometric measurement for SARS-CoV-2 antigen to define a subset of RT-
54 qPCR positive, antigen positive samples. We further characterized RT-qPCR positive samples by
55 performing quantitative droplet digital PCR (ddPCR), allowing us to quantitate the viral load
56 applied to each Ag RDT for direct comparison of analytical sensitivity. The results allow direct
57 comparison of the analytical sensitivity of Ag RDT devices stratified by viral load applied to each
58 test; and provide information about the extent to which differences in analytical sensitivity of Ag
59 RDT may impact interpretation of clinical studies or limit the clinical utility of these devices.
Page 4 of 33
https://mc.manuscriptcentral.com/clinchem
Manuscripts submitted to Clinical Chemistry
123456789101112131415161718192021222324252627282930313233343536373839404142434445464748495051525354555657585960
Dow
nloaded from https://academ
ic.oup.com/clinchem
/advance-article/doi/10.1093/clinchem/hvab138/6317830 by guest on 15 July 2021
5
60 2. Materials and Methods
61 Sample selection and reference RT-qPCR testing: This was a retrospective study using residual
62 clinical samples tested for SARS-CoV-2 by RT-qPCR. Sterile, nylon fiber, non-flocked
63 nasopharyngeal swabs were collected from symptomatic and asymptomatic patients with a clinical
64 order for SARS-CoV-2 NAAT at Mayo Clinic, Rochester MN. Swabs were placed in 3 mL
65 phosphate-buffered saline (PBS) for transportation to the testing lab. PBS samples were kept at 4º
66 C for up to 3 days after RT-qPCR testing, then frozen at -80º C until point of care (POC) Ag RDT
67 testing. Although we could find no published data on nucleocapsid antigen stability in PBS
68 samples, mass spectrometry experiments demonstrated no loss of nucleocapsid peptides (as
69 measured by peak height) after 5 days at room temperature (data not shown).
70 Reference RT-qPCR testing was performed with a laboratory-developed test using the
71 TaqMan assay on a Roche Light Cycler 480 (LC480) performed in the Mayo Clinic Rochester
72 laboratories. For LC480 testing, nucleic acid is first extracted on the bioMerieux
73 easyMAG/eMAG, Hamilton STAR, or Roche MP96. This TaqMan assay employs a reverse
74 transcriptase reaction to convert RNA to complementary DNA followed by amplification of the
75 nucleocapsid gene. A Taqman probe specific for SARS-CoV-2 RNA is labeled with the
76 fluorophore FAM. The dye labeled probe allows for detection of SARS-CoV-2 virus in the
77 corresponding detector channel of the LC480 instrument. The test has received Emergency Use
78 Authorization (EUA) by the Food and Drug Administration (FDA). RT-qPCR samples were
79 selected non-consecutively to obtain 150 negative and 200 positive samples. Positive samples were
80 chosen to span cycle threshold (Ct) values of 20-35, with most samples selected to be in Ct ranges
81 of 25.01-30.00 or 30.01-35.00 (Table 1). The study protocol was approved by the Mayo Clinic
82 Institutional Review Board.
Page 5 of 33
https://mc.manuscriptcentral.com/clinchem
Manuscripts submitted to Clinical Chemistry
123456789101112131415161718192021222324252627282930313233343536373839404142434445464748495051525354555657585960
Dow
nloaded from https://academ
ic.oup.com/clinchem
/advance-article/doi/10.1093/clinchem/hvab138/6317830 by guest on 15 July 2021
berapin.wu
高亮
berapin.wu
高亮

6
83 POC Ag RDTs: POC tests used included the BD Veritor (Becton, Dickinson and Co), an
84 immunochromatographic (LF) assay with an opto-electronic interpretation instrument (reader).
85 The test detects nucleocapsid proteins from SARS-CoV-2 by capturing antigen-conjugate
86 complexes as they migrate across a reaction area coated by antibodies to nucleocapsid proteins.
87 After placing sample in the extraction tube, 3 drops of extracted sample are applied to the test
88 cassette, and the cassette is placed in the reader. Results take 15 minutes, and the test has received
89 FDA EUA. The ACON SARS-CoV-2 Antigen Rapid Test (ACON Laboratories) is a LF
90 immunoassay for the qualitative detection of nucleocapsid protein antigen to SARS-CoV-2. The
91 test consists of an extraction tube and test cassette, takes 15 minutes, and has not received FDA
92 EUA. ACON SARS-CoV-2 Antigen Test Kit FIA is an immunofluorescent sandwich assay (FIA)
93 that uses lateral flow technology with fluorescent detection of nucleocapsid antigens to SARS-
94 CoV-2. The test uses the same extraction tube as the LF device, but extracted sample (4 drops) is
95 applied to an FIA test cassette and the cassette placed in an FIA reader. The test has not received
96 FDA EUA. LumiraDx (LumiraDx) is a microfluidic immunofluorescence (FIA) assay for
97 qualitative detection of nucleocapsid antigens to SARS-CoV-2. The test requires a disposable test
98 strip and reader. Sample is introduced into the extraction tube, then a single drop of extracted
99 sample is applied to the strip. Results take approximately 12 minutes and the test has received
100 FDA EUA.
101 For all Ag RDTs, residual PBS samples were added to vendor-specific extraction buffer in
102 a 1:9 ratio (one part PBS residual sample, nine parts vendor-specific extraction buffer), such that
103 samples applied to Ag RDT consisted primarily of extraction buffer to optimize performance of
104 each assay. To ensure that results of the visually read test (ACON LF) would be unbiased, ACON
105 LF results were read and recorded by a separate technologist prior to recording results of the other
Page 6 of 33
https://mc.manuscriptcentral.com/clinchem
Manuscripts submitted to Clinical Chemistry
123456789101112131415161718192021222324252627282930313233343536373839404142434445464748495051525354555657585960
Dow
nloaded from https://academ
ic.oup.com/clinchem
/advance-article/doi/10.1093/clinchem/hvab138/6317830 by guest on 15 July 2021
berapin.wu
高亮
berapin.wu
高亮
berapin.wu
高亮
berapin.wu
高亮
7
106 Ag RDTs. ACON LF results were also photographed to resolve any faint or uncertain control or
107 test lines (there were none in the study).
108 Quantitative, digital droplet PCR: After extracted RNA samples were tested for RT-qPCR, they
109 were stored at -80C until ddPCR testing. The assay utilizes the QX200 AutoDG Droplet Digital
110 PCR System (Bio-Rad) following the Bio-Rad SARS-CoV-2 ddPCR Kit EUA Instructions for
111 Use. Further information on the ddPCR method can be found in the online Supplemental Data
112 Appendix 1.
113 Mass spectrometric (MS) antigen detection: After POC Ag RDT testing, PBS samples were frozen
114 at -80C until MS testing. PBS samples underwent viral inactivation followed by antibody-based
115 purification using an anti-nucleocapsid protein monoclonal antibody coupled to MSIA
116 D.A.R.T.’STM. The bound material was eluted with 100 μL of 0.2% TFA and 0.002% Z3-16 in
117 water and immediately subjected to in-solution trypsin digestion. Parallel reaction monitoring
118 (PRM) analysis was performed on an Exploris 480TM mass spectrometer (ThermoFisher
119 Scientific)(19). A detailed description of the MS method is provided in the online Supplemental
120 Data Appendix 2.
121 Statistical analysis: The primary outcome was sensitivity and specificity of Ag RDT for detection
122 of SARS-CoV-2 antigen in PBS samples, using RT-qPCR as the reference method. Sensitivity
123 was estimated (with 95th% confidence intervals) using McNemar tests (for all specimens
124 combined), and with exact McNemar tests when stratifying by copies/mL (<50,000; 50,000 to
125 <500,000; 500,000 to <1,500,000; and ≥1,500,000). We used 200 positive samples to achieve
126 >90% power to detect differences in overall sensitivity ≥10% between methods (McNemar test,
127 5% type-I error, assuming >10% discordant samples). Viral load brackets were developed post hoc
Page 7 of 33
https://mc.manuscriptcentral.com/clinchem
Manuscripts submitted to Clinical Chemistry
123456789101112131415161718192021222324252627282930313233343536373839404142434445464748495051525354555657585960
Dow
nloaded from https://academ
ic.oup.com/clinchem
/advance-article/doi/10.1093/clinchem/hvab138/6317830 by guest on 15 July 2021
berapin.wu
高亮

8
128 after measuring viral load and keeping roughly equal numbers of samples in the lowest two viral
129 load brackets. P-values less than 0.005 were considered statistically significant to account for
130 multiple comparisons between methods. Analyses were performed using SAS version 9.4 (SAS
131 Institute Inc).
132
Page 8 of 33
https://mc.manuscriptcentral.com/clinchem
Manuscripts submitted to Clinical Chemistry
123456789101112131415161718192021222324252627282930313233343536373839404142434445464748495051525354555657585960
Dow
nloaded from https://academ
ic.oup.com/clinchem
/advance-article/doi/10.1093/clinchem/hvab138/6317830 by guest on 15 July 2021

9
133 3. Results:
134 Familiarization and dilution experiments: Familiarization experiments consisted of running the
135 vendor-specific positive and negative controls, PBS blank (PBS diluted 1:9 into vendor-specific
136 extraction buffer), and extraction buffer blank, following manufacturer’s directions for use of each
137 test. All tests recovered intended positive (positive QC) and negative (negative QC, PBS blank
138 and extraction buffer blank) results. Next, we used 13 PBS pools (pools made from RT-qPCR
139 positive PBS samples) with Ct values of 22-34, with all samples (except positive and negative QC)
140 diluted 1:9 into method-specific extraction buffer. The BD Veritor was positive for PBS pools with
141 Ct 22-27, and negative for PBS pools 28-34. The ACON FIA and ACON LF were positive for
142 PBS pools Ct 22-28; while the LumiraDx was positive up to a Ct of 32. Two technologists
143 reviewed and photographed LF results for BD Veritor and ACON LF. The background of the LF
144 devices were not different between extraction buffer blanks, negative QC, and negative or positive
145 PBS pool samples diluted 1:9 into extraction buffer. For the LumiraDx FIA, raw fluorescence
146 values were available in development mode of the software; and raw fluorescence values for PBS
147 blanks or negative PBS pools did not differ from background fluorescence observed for negative
148 QC or extraction buffer blanks (data not shown).
149 Specificity of Ag RDTs: 150 PBS samples that previously tested negative by RT-qPCR were used
150 as the negative sample set. The specificity (95% CI) of the Ag RDT was 100 (97.5-100)% for BD
151 Veritor, LumiraDx and ACON FIA tests, and 97.3 (93.3-99.0) % for the ACON LF. The MS
152 antigen test was positive in two RT-qPCR negative samples. One of these samples tested positive
153 by ddPCR with a viral load (in the PBS sample) of 6509 copies/mL (651 copies/mL applied to Ag
154 RDT); while the other tested negative by ddPCR initially but upon repeat was just above the
Page 9 of 33
https://mc.manuscriptcentral.com/clinchem
Manuscripts submitted to Clinical Chemistry
123456789101112131415161718192021222324252627282930313233343536373839404142434445464748495051525354555657585960
Dow
nloaded from https://academ
ic.oup.com/clinchem
/advance-article/doi/10.1093/clinchem/hvab138/6317830 by guest on 15 July 2021
berapin.wu
高亮
berapin.wu
高亮

10
155 detection threshold at 332 copies/mL in the PBS sample. These two samples were negative by all
156 four Ag RDT and were considered true negative samples for calculation of Ag RDT specificity.
157 Sensitivity of Ag RDTs: 200 PBS samples previously testing positive by RT-qPCR were used as
158 the positive sample set. There were three samples that tested positive by RT-qPCR, but negative
159 by ddPCR and all five (including the MS antigen) antigen tests. These samples were excluded
160 from further analysis because the presence of SARS-CoV-2 RNA or antigen could not be
161 confirmed. Among the remaining 197 positive RT-qPCR samples, the sensitivity (95% CI) of the
162 MS antigen test was 90.9 (86.0-94.1)%. The sensitivities of the Ag RDT were 66.5 (59.6-72.7)%
163 for BD Veritor, 77.7 (71.4-82.9)% for ACON LF, 83.2 (77.4-87.8)% for LumiraDx, and 88.3 (83.1-
164 92.1)% for ACON FIA (Figure 1). The BD Veritor detected significantly fewer RT-qPCR positive
165 samples than did the ACON LF, Lumira Dx FIA, or ACON FIA (P <0.0001). Differences between
166 the ACON LF and LumiraDx FIA (P=0.0045) and ACON LF and ACON FIA (P <0.0001) were
167 also statistically significant, while differences between the LumiraDx and ACON FIA were not
168 statistically significant (P=0.008). The MS antigen test was significantly more sensitive (P ≤
169 0.0001) than all Ag RDT except the ACON FIA (P=0.10).
170 When Ag RDT results are broken down into brackets of applied viral load, all Ag RDT are
171 very sensitive when > 1,500,000 copies/mL of viral RNA are applied (Figure 1). All the Ag RDT
172 demonstrated ≥75% sensitivity for detection of antigen in samples with 500,000 to 1,500,000
173 million copies/mL RNA, though the BD Veritor showed a trend towards lower sensitivity in this
174 group that did not reach statistical significance (P >0.005 all comparisons). In contrast in the range
175 of 50,000 to 500,000 copies/mL, the BD Veritor detected only 25 (13.1-42.1)% of samples
176 compared to the ACON LF which detected 75 (57.9-86.7)%. The BD Veritor was significantly
Page 10 of 33
https://mc.manuscriptcentral.com/clinchem
Manuscripts submitted to Clinical Chemistry
123456789101112131415161718192021222324252627282930313233343536373839404142434445464748495051525354555657585960
Dow
nloaded from https://academ
ic.oup.com/clinchem
/advance-article/doi/10.1093/clinchem/hvab138/6317830 by guest on 15 July 2021
berapin.wu
高亮
berapin.wu
高亮
berapin.wu
高亮

11
177 less sensitive (P < 0.0001) than the other Ag RDT in the range of 50,000-500,000 copies/mL. The
178 two FIA tests demonstrated >80% sensitivity in this viral load range. At the lowest viral load
179 range (< 50,000 copies/mL), both the BD Veritor (P < 0.0001) and ACON LF (P= 0.0001) were
180 significantly less sensitive than the ACON FIA (Figure 1), while other comparisons did not yield
181 statistically significant differences. Three samples failed repeated runs by ddPCR for unknown
182 reasons and are included in overall sensitivity but not in any viral load bracket.
183 A scatterplot showing the viral load of detected and undetected samples by each method
184 for all RT-qPCR positive samples with <1,500,000 copies/mL is shown in Figure 2. On the BD
185 Veritor platform, only four PBS samples with viral load <200,000 copies/mL were detected.
186 Compared to the BD Veritor, the ACON LF method detected more samples with viral load between
187 30,000-100,000, and missed only 5 samples with viral load >100,000 (Figure 2). The LumiraDx
188 FIA was able to detect approximately half (12 of 26) of samples in the 10,000-100,000 copies/mL
189 range; while only the ACON FIA detected a majority (18 of 26) of specimens with viral load
190 between 10,000-100,000 copies/mL (Figure 2).
191 Viral load of antigen negative samples and comparison of Ag RDT at low viral load: There were
192 16 samples that were RT-qPCR positive, ddPCR positive, but tested negative by all antigen tests.
193 The Ct and dd-PCR copy number are shown in Table 2. Excluding the 16 samples that were
194 negative by all antigen tests, the sensitivity of Ag RDTs for detecting samples with <50,000
195 copies/mL varied from 13.0% (3/23, BD Veritor), 17.4% (4/23, ACON LF), 52.1% (12/23
196 LumiraDx), to 78.3% (18/23 ACON FIA). Differences between the BD Veritor and ACON FIA
197 (P < 0.0001) and ACON LF and ACON FIA (P = 0.0001) were statistically significant.
Page 11 of 33
https://mc.manuscriptcentral.com/clinchem
Manuscripts submitted to Clinical Chemistry
123456789101112131415161718192021222324252627282930313233343536373839404142434445464748495051525354555657585960
Dow
nloaded from https://academ
ic.oup.com/clinchem
/advance-article/doi/10.1093/clinchem/hvab138/6317830 by guest on 15 July 2021
berapin.wu
高亮

12
198 Relationship between Ct value and viral load by ddPCR: Previous studies have used Ct value as a
199 surrogate for viral load, both to estimate the limit of detection of antigen tests(15, 16) or to
200 characterize RT-qPCR positive, Ag RDT negative samples(5-7). We investigated the relationship
201 between Ct and viral load by quantitative ddPCR in PBS samples. Viral load decreases as a
202 function of Ct between values of 29 to 33, although with considerable variability. Above Ct 33,
203 the viral load is highly variable with values between <10,000 and >1,000,000 copies/mL (Figure
204 3). The ddPCR viral load of samples with Ct value of 35.00 varied from 378 to 1,119,259
205 copies/mL (Figure 3). We have observed a similar relationship between Ct and viral load by
206 ddPCR for the Roche 6800 RT-qPCR method (data not shown).
Page 12 of 33
https://mc.manuscriptcentral.com/clinchem
Manuscripts submitted to Clinical Chemistry
123456789101112131415161718192021222324252627282930313233343536373839404142434445464748495051525354555657585960
Dow
nloaded from https://academ
ic.oup.com/clinchem
/advance-article/doi/10.1093/clinchem/hvab138/6317830 by guest on 15 July 2021
berapin.wu
高亮
berapin.wu
高亮

13
207 4. Discussion
208 One reason for differing clinical sensitivities of Ag RDT is that the tests may vary in analytical
209 sensitivity. A few comparisons of Ag RDT analytical sensitivity have been performed using RNA
210 standards or other methods to quantitate viral load as a function of Ct value of RT-qPCR results(15-
211 17). In RT-qPCR, differences in amplification efficiencies between individual samples
212 significantly affects the accuracy and reproducibility of measured target concentration derived
213 from calibration curves(20). In contrast, ddPCR partitions each sample into independent sub-
214 reactions, allowing the accurate and precise quantitation of targets without use of a calibration
215 curve(20). In one study ddPCR exhibited 4-20 fold increased precision for quantitation of HIV
216 DNA compared to RT-qPCR(21). We found that the relationship between Ct and viral load by
217 ddPCR was poor for samples with Ct values >33. These samples could have between several
218 hundred to > 1,000,000 copies/mL. This limits the use of Ct to interpret the potential significance
219 of RT-qPCR positive, Ag RDT negative samples.
220 Other studies have used serial dilution of samples with known RNA content to compare
221 analytical sensitivity of AgRDTs (18, 22). Estimates for the limit of detection of Ag RDT range
222 from 40,000 copies/mL(16) to >50,000,000 copies/mL(18), with the latter study finding a 50-fold
223 difference in analytical sensitivity between Ag RDTs evaluated (18). ddPCR is a quantitative
224 method capable of precise measurement of low viral loads, and has been found to be more sensitive
225 analytically than RT-qPCR for detection of SARS-CoV-2 RNA(23). We used RT-qPCR as the
226 reference method for SARS-CoV-2, but also performed ddPCR to allow direct comparison of the
227 analytical sensitivity of Ag RDT across a range of measured viral loads.
Page 13 of 33
https://mc.manuscriptcentral.com/clinchem
Manuscripts submitted to Clinical Chemistry
123456789101112131415161718192021222324252627282930313233343536373839404142434445464748495051525354555657585960
Dow
nloaded from https://academ
ic.oup.com/clinchem
/advance-article/doi/10.1093/clinchem/hvab138/6317830 by guest on 15 July 2021

14
228 Another obstacle to direct analytical comparisons of Ag RDTs is that no reference method
229 exists for presence of SARS-CoV-2 antigen in residual PBS samples. In this study we used a
230 laboratory-developed, MS antigen test that uses antibody enrichment followed by tryptic digestion
231 to allow detection of SARS-CoV-2 antigen. While we do not propose the MS antigen method as
232 a reference method, detection of antigen by four POC Ag RDT methods as well as the MS antigen
233 method allowed us to compare Ag RDT sensitivity among a set of NAAT positive patient samples
234 with antigen detectable by one or more methods. Most previous studies have reported results as
235 positive and negative percent agreement, rather than sensitivity and specificity, due to the lack of
236 reference methods for SARS-CoV-2 antigen or RNA. We chose to report analytical sensitivity and
237 specificity because our study design, while not perfect, has gone far beyond previous studies in
238 addressing the lack of reference methods.
239 One of the major findings from our study is that the two LF methods varied substantially
240 in analytical sensitivity. All samples with >50,000 copies/mL had antigen detected by at least one
241 antigen-based detection method. Among samples with viral load between 50,000-500,000
242 copies/mL, the BD Veritor LF method detected only 25% of samples compared to 75% for the
243 ACON LF test. The two FIA tests had >80% sensitivity in this range, consistent with studies
244 performed on Ag RDT for influenza demonstrating better analytical sensitivity using FIA
245 technology(13, 14).
246 The differences in analytical sensitivity between Ag RDTs were even greater at viral load
247 <50,000 copies/mL. Analytical sensitivity ranged from 13.0% for BD Veritor to 78.3% for ACON
248 FIA in this range. Because RT-qPCR positive, Ag RDT negative samples tend to have higher Ct
249 value, some investigators have suggested that these represent non-infectious samples. Viral culture
250 has been used to help define the sensitivity of Ag RDTs (9, 15) among presumably infectious
Page 14 of 33
https://mc.manuscriptcentral.com/clinchem
Manuscripts submitted to Clinical Chemistry
123456789101112131415161718192021222324252627282930313233343536373839404142434445464748495051525354555657585960
Dow
nloaded from https://academ
ic.oup.com/clinchem
/advance-article/doi/10.1093/clinchem/hvab138/6317830 by guest on 15 July 2021
berapin.wu
高亮
berapin.wu
高亮
15
251 samples; but both biological and environmental limitations to viral culture for SARS-CoV-2 make
252 interpretation of NAAT positive, culture negative samples unclear(9). We used ddPCR to
253 quantitatively measure viral load, and found that Ag RDTs vary significantly in analytical
254 sensitivity when viral loads are <500,000 copies/mL. We found that RT-qPCR positive samples
255 without detectable antigen by any method had viral load <50,000 copies/mL and high Ct value.
256 However, the majority of samples with high (33-35) Ct values had detectable antigen by one or
257 more methods.
258 We speculate that samples with no detectable antigen by more sensitive methods and low viral
259 load are least likely to be infectious. To design studies to identify infectious patients, investigators
260 will need to be aware of both the differential sensitivity of POC antigen tests and the imperfect
261 relationship between Ct and viral load (if Ct value will be used as a surrogate for viral load). Our
262 study shows that use of more sensitive FIA methods allows detection of antigen in the majority of
263 RT-qPCR positive samples, even with very low viral loads. By using more sensitive Ag RDT
264 methods, studies can eventually determine whether the absence of antigen really does imply
265 reduced or no risk of infectivity. Use of more sensitive Ag RDTs clinically will diminish
266 discrepancies in patient classification between Ag RDTs and RT-qPCR.
267 Limitations: The primary limitations of our study are the lack of a reference methods for SARS-
268 CoV-2 antigen detection or RNA detection, and inability to compare multiple Ag RDTs using the
269 intended sample type (nasal swab direct to vendor-specific extraction buffer). We addressed these
270 limitations by validating a dilution protocol using PBS samples and further characterizing PBS
271 samples by ddPCR and a MS antigen method. We also compared the overall sensitivity of the MS
272 antigen test using undiluted PBS samples to Ag RDT using diluted samples, which may have
273 underestimated the overall sensitivity of the POC tests. Lastly, we studied only four (2 LF and 2
Page 15 of 33
https://mc.manuscriptcentral.com/clinchem
Manuscripts submitted to Clinical Chemistry
123456789101112131415161718192021222324252627282930313233343536373839404142434445464748495051525354555657585960
Dow
nloaded from https://academ
ic.oup.com/clinchem
/advance-article/doi/10.1093/clinchem/hvab138/6317830 by guest on 15 July 2021

16
274 FIA) Ag RDT methods. Though we demonstrated significant variability in analytical sensitivity,
275 we do not know if these results represent lower and upper bounds for assay performance or whether
276 some Ag RDTs demonstrate better or worse performance.
277 Conclusions: Ag RDTs differ significantly in analytical sensitivity, especially among specimens
278 with <500,000 copies/mL RNA content. Interpreting the significance of NAAT positive, Ag RDT
279 negative samples requires knowledge of the analytical sensitivity of the Ag RDT used. When
280 antigen is present more sensitive methods can detect it in the majority of specimens with viral load
281 <50,000 copies/mL; while less sensitive methods will fail to detect antigen in most samples with
282 <500,000 copies/mL RNA.
283
Page 16 of 33
https://mc.manuscriptcentral.com/clinchem
Manuscripts submitted to Clinical Chemistry
123456789101112131415161718192021222324252627282930313233343536373839404142434445464748495051525354555657585960
Dow
nloaded from https://academ
ic.oup.com/clinchem
/advance-article/doi/10.1093/clinchem/hvab138/6317830 by guest on 15 July 2021

17
284 Acknowledgments
285 We thank LumiraDx and ACON for providing readers, disposables, extraction buffer, and controls
286 for these devices. We also thank Sarah Jenkins for help with statistical analysis. None of the
287 authors have disclosures to report for this study. We thank Eric and Wendy Schmidt for supporting
288 the Advanced Diagnostic Laboratory at Mayo Clinic, where the mass spectrometric antigen test
289 was developed.
290
291 Author Contributions: All authors confirmed they have contributed to the intellectual content of this 292 paper and have met the following 4 requirements: (a) significant contributions to the conception and 293 design, acquisition of data, or analysis and interpretation of data; (b) drafting or revising the article for 294 intellectual content; (c) final approval of the published article; and (d) agreement to be accountable for 295 all aspects of the article thus ensuring that questions related to the accuracy or integrity of any part of 296 the article are appropriately investigated and resolved.297298 Authors’ Disclosures or Potential Conflicts of Interest: Upon manuscript submission, all authors 299 completed the author disclosure form. Disclosures and/or potential conflicts of interest:300301 Employment or Leadership: None declared.302 Consultant or Advisory Role: None declared.303 Stock Ownership: None declared. 304 Honoraria: None declared.305 Research Funding: LumiraDx and ACON provided readers, disposables, extraction buffer, and controls 306 for the devices.307 Expert Testimony: None declared.308 Patents: None declared.309310 Role of Sponsor: The funding organizations played no role in the design of study, choice of enrolled 311 patients, review and interpretation of data, preparation of manuscript, or final approval of manuscript.312313
Page 17 of 33
https://mc.manuscriptcentral.com/clinchem
Manuscripts submitted to Clinical Chemistry
123456789101112131415161718192021222324252627282930313233343536373839404142434445464748495051525354555657585960
Dow
nloaded from https://academ
ic.oup.com/clinchem
/advance-article/doi/10.1093/clinchem/hvab138/6317830 by guest on 15 July 2021

18
314 References
315
316 1. Guan WJ, Ni ZY, Hu Y, Liang WH, Ou CQ, He JX, et al. Clinical Characteristics of Coronavirus
317 Disease 2019 in China. N Engl J Med 2020;382:1708-20.
318 2. Grasselli G, Zangrillo A, Zanella A, Antonelli M, Cabrini L, Castelli A, et al. Baseline Characteristics
319 and Outcomes of 1591 Patients Infected With SARS-CoV-2 Admitted to ICUs of the Lombardy
320 Region, Italy. JAMA 2020;323:1574-81.
321 3. Beck ET, Paar W, Fojut L, Serwe J, Jahnke RR. Comparison of the Quidel Sofia SARS FIA Test to
322 the Hologic Aptima SARS-CoV-2 TMA Test for Diagnosis of COVID-19 in Symptomatic
323 Outpatients. J Clin Microbiol 20211;59:e02727-20.
324 4. Kilic A, Hiestand B, Palavecino E. Evaluation of Performance of the BD Veritor SARS-CoV-2
325 Chromatographic Immunoassay Test in COVID-19 Symptomatic Patients. J Clin Microbiol
326 2021;59:e00260-21
327 5. Okoye NC, Barker AP, Curtis K, Orlandi RR, Snavely EA, Wright C, et al. Performance
328 Characteristics of BinaxNOW COVID-19 Antigen Card for Screening Asymptomatic Individuals in
329 a University Setting. J Clin Microbiol 2021;59:e03282-20.
330 6. Pilarowski G, Lebel P, Sunshine S, Liu J, Crawford E, Marquez C, et al. Performance
331 characteristics of a rapid SARS-CoV-2 antigen detection assay at a public plaza testing site in San
332 Francisco. J Infect Dis 2021;223:1139-44..
333 7. Pollock NR, Jacobs JR, Tran K, Cranston AE, Smith S, O'Kane CY, et al. Performance and
334 Implementation Evaluation of the Abbott BinaxNOW Rapid Antigen Test in a High-throughput
335 Drive-through Community Testing Site in Massachusetts. J Clin Microbiol 2021;59:e00083-21.
Page 18 of 33
https://mc.manuscriptcentral.com/clinchem
Manuscripts submitted to Clinical Chemistry
123456789101112131415161718192021222324252627282930313233343536373839404142434445464748495051525354555657585960
Dow
nloaded from https://academ
ic.oup.com/clinchem
/advance-article/doi/10.1093/clinchem/hvab138/6317830 by guest on 15 July 2021

19
336 8. Pray IW, Ford L, Cole D, Lee C, Bigouette JP, Abedi GR, et al. Performance of an Antigen-Based
337 Test for Asymptomatic and Symptomatic SARS-CoV-2 Testing at Two University Campuses -
338 Wisconsin, September-October 2020. MMWR Morb Mortal Wkly Rep 2021;69:1642-7.
339 9. Prince-Guerra JL, Almendares O, Nolen LD, Gunn JKL, Dale AP, Buono SA, et al. Evaluation of
340 Abbott BinaxNOW Rapid Antigen Test for SARS-CoV-2 Infection at Two Community-Based
341 Testing Sites - Pima County, Arizona, November 3-17, 2020. MMWR Morb Mortal Wkly Rep
342 2021; 70:100-5.
343 10. Young S, Taylor SN, Cammarata CL, Varnado KG, Roger-Dalbert C, Montano A, et al. Clinical
344 Evaluation of BD Veritor SARS-CoV-2 Point-of-Care Test Performance Compared to PCR-Based
345 Testing and versus the Sofia 2 SARS Antigen Point-of-Care Test. J Clin Microbiol 2020;59:e02338-
346 20.
347 11. Berger A, Nsoga MTN, Perez-Rodriguez FJ, Aad YA, Sattonnet-Roche P, Gayet-Ageron A, et al.
348 Diagnostic accuracy of two commercial SARS-CoV-2 antigen-detecting rapid tests at the point of
349 care in community-based testing centers. PLoS One 2021;16:e0248921.
350 12. Drain PK, Ampajwala M, Chappel C, Gvozden AB, Hoppers M, Wang M, et al. A Rapid, High-
351 Sensitivity SARS-CoV-2 Nucleocapsid Immunoassay to Aid Diagnosis of Acute COVID-19 at the
352 Point of Care: A Clinical Performance Study. Infect Dis Ther 2021;10:753-61.
353 13. Leonardi GP, Wilson AM, Mitrache I, Zuretti AR. Comparison of the Sofia and Veritor direct
354 antigen detection assay systems for identification of influenza viruses from patient
355 nasopharyngeal specimens. J Clin Microbiol 2015;53:1345-7.
356 14. Leonardi GP, Wilson AM, Zuretti AR. Comparison of conventional lateral-flow assays and a new
357 fluorescent immunoassay to detect influenza viruses. J Virol Methods 2013;189:379-82.
Page 19 of 33
https://mc.manuscriptcentral.com/clinchem
Manuscripts submitted to Clinical Chemistry
123456789101112131415161718192021222324252627282930313233343536373839404142434445464748495051525354555657585960
Dow
nloaded from https://academ
ic.oup.com/clinchem
/advance-article/doi/10.1093/clinchem/hvab138/6317830 by guest on 15 July 2021

20
358 15. Kohmer N, Toptan T, Pallas C, Karaca O, Pfeiffer A, Westhaus S, et al. The Comparative Clinical
359 Performance of Four SARS-CoV-2 Rapid Antigen Tests and Their Correlation to Infectivity In
360 Vitro. J Clin Med 2021;10:32.
361 16. Perchetti GA, Huang ML, Mills MG, Jerome KR, Greninger AL. Analytical Sensitivity of the Abbott
362 BinaxNOW COVID-19 Ag CARD. J Clin Microbiol 2021;59:e02880-20.
363 17. Corman VM, Haage VC, Bleicker T, Schmidt ML, Muhlemann B, Zuchowski M, et al. Comparison
364 of seven commercial SARS-CoV-2 rapid point-of-care antigen tests: a single-centre laboratory
365 evaluation study. Lancet Microbe 2021;2:e311-e319.
366 18. Haage V, Ferreira de Oliveira-Filho E, Moreira-Soto A, Kuhne A, Fischer C, Sacks JA, et al.
367 Impaired performance of SARS-CoV-2 antigen-detecting rapid diagnostic tests at elevated and
368 low temperatures. J Clin Virol 2021;138:104796
369 19. Renuse S, Vanderboom P, Maus A, Kemp J, Gurtner K, Madugundu A, et al. A mass
370 spectrometry-based targeted assay for detection of SARS-CoV-2 antigen from clinical specimens.
371 EBioMedicine 2021. In press.
372 20. Quan PL, Sauzade M, Brouzes E. dPCR: A Technology Review. Sensors (Basel) 2018;18(4):1271.
373 21. Strain MC, Lada SM, Luong T, Rought SE, Gianella S, Terry VH, et al. Highly precise measurement
374 of HIV DNA by droplet digital PCR. PLoS One 2013;8:e55943.
375 22. Mak GC, Lau SS, Wong KK, Chow NL, Lau CS, Lam ET, et al. Analytical sensitivity and clinical
376 sensitivity of the three rapid antigen detection kits for detection of SARS-CoV-2 virus. J Clin Virol
377 2020;133:104684.
378 23. Gniazdowski V, Morris CP, Wohl S, Mehoke T, Ramakrishnan S, Thielen P, et al. Repeat COVID-19
379 Molecular Testing: Correlation of SARS-CoV-2 Culture with Molecular Assays and Cycle
380 Thresholds. [epub ahead of print] Clin Infect Dis 2020 Oct 27 as doi: 10.1093/cid/ciaa1616.
381
Page 20 of 33
https://mc.manuscriptcentral.com/clinchem
Manuscripts submitted to Clinical Chemistry
123456789101112131415161718192021222324252627282930313233343536373839404142434445464748495051525354555657585960
Dow
nloaded from https://academ
ic.oup.com/clinchem
/advance-article/doi/10.1093/clinchem/hvab138/6317830 by guest on 15 July 2021

21
382 Table 1: Cycle threshold (Ct) values of positive RT-qPCR specimens by Ct bracket used for sample
383 selection for Ag RDT testing, viral load by ddPCR, and MS antigen analysis.
384
385
386
387 * Positive RT-qPCR specimens exceeded the fluorescence threshold within 40 cycles, but all
388 positive samples with cycle threshold greater than or equal to 35.00 cycles are reported as Ct 35.00.
Ct bracket Number of samples selected20.00 – 25.00 2425.01 – 30.00 8830.01 – 35.00* 88
Page 21 of 33
https://mc.manuscriptcentral.com/clinchem
Manuscripts submitted to Clinical Chemistry
123456789101112131415161718192021222324252627282930313233343536373839404142434445464748495051525354555657585960
Dow
nloaded from https://academ
ic.oup.com/clinchem
/advance-article/doi/10.1093/clinchem/hvab138/6317830 by guest on 15 July 2021

22
389 Table 2: Viral load (copies/mL by ddPCR) and cycle threshold (Ct) value for 16 samples that were
390 positive by RT-qPCR and ddPCR, but negative by all five antigen tests (including the MS antigen
391 test).
Sample ddPCR viral load (copies/mL)
RT-qPCR cycle threshold (Ct)
1 49,443 34.362 38 35.003 1941 35.004 880 33.685 4366 35.006 10,817 35.007 831 35.008 4655 35.009 5876 35.0010 1299 32.1811 35,025 32.1312 427 35.0013 12,792 35.0014 2041 35.0015 10,425 35.0016 90 35.00
392
393
Page 22 of 33
https://mc.manuscriptcentral.com/clinchem
Manuscripts submitted to Clinical Chemistry
123456789101112131415161718192021222324252627282930313233343536373839404142434445464748495051525354555657585960
Dow
nloaded from https://academ
ic.oup.com/clinchem
/advance-article/doi/10.1093/clinchem/hvab138/6317830 by guest on 15 July 2021

23
394 Figure Legends
395 Figure 1: Sensitivity (% samples detected by antigen tests) for the BD Veritor LF, ACON LF,
396 LumiraDx FIA, and ACON FIA rapid antigen tests and mass spectrometric antigen test for
397 SARS-CoV-2 among 197 RT-qPCR positive samples. Sensitivity among samples with viral load
398 (measured by ddPCR) of >1,500,000 copies/mL, 500,000 to 1,500,000 copies/mL, 50,000 to
399 500,000 copies/mL, and <50,000 copies/mL is also shown for the four rapid antigen tests. The
400 percent sensitivity is shown above each bar except for tests showing 100% sensitivity. *
401 indicates statistically significant (P < 0.005) difference between paired comparisons for
402 comparisons within viral load brackets (overall sensitivity not shown, see results).
403 Figure 2: Scatterplot showing the viral load (copies/mL measured by ddPCR) among RT-qPCR
404 positive PBS samples with antigen detected (D) or undetected (U) by the BD Veritor LF, ACON
405 LF, LumiraDx FIA, and ACON FIA methods. Note the Y axis is displayed in logarithmic scale.
406 Figure 3: Viral load (copies/mL by ddPCR) vs cycle threshold (Ct) by RT-qPCR for all samples
407 with Ct greater than 29.00 that did not saturate the ddPCR method (ddPCR saturated at
408 15,000,000 copies/mL in PBS samples). Most samples with Ct less than 29.00 saturated the
409 ddPCR method.
Page 23 of 33
https://mc.manuscriptcentral.com/clinchem
Manuscripts submitted to Clinical Chemistry
123456789101112131415161718192021222324252627282930313233343536373839404142434445464748495051525354555657585960
Dow
nloaded from https://academ
ic.oup.com/clinchem
/advance-article/doi/10.1093/clinchem/hvab138/6317830 by guest on 15 July 2021

Figure 1
Page 24 of 33
https://mc.manuscriptcentral.com/clinchem
Manuscripts submitted to Clinical Chemistry
123456789101112131415161718192021222324252627282930313233343536373839404142434445464748495051525354555657585960
Dow
nloaded from https://academ
ic.oup.com/clinchem
/advance-article/doi/10.1093/clinchem/hvab138/6317830 by guest on 15 July 2021

Figure 2
Page 25 of 33
https://mc.manuscriptcentral.com/clinchem
Manuscripts submitted to Clinical Chemistry
123456789101112131415161718192021222324252627282930313233343536373839404142434445464748495051525354555657585960
Dow
nloaded from https://academ
ic.oup.com/clinchem
/advance-article/doi/10.1093/clinchem/hvab138/6317830 by guest on 15 July 2021
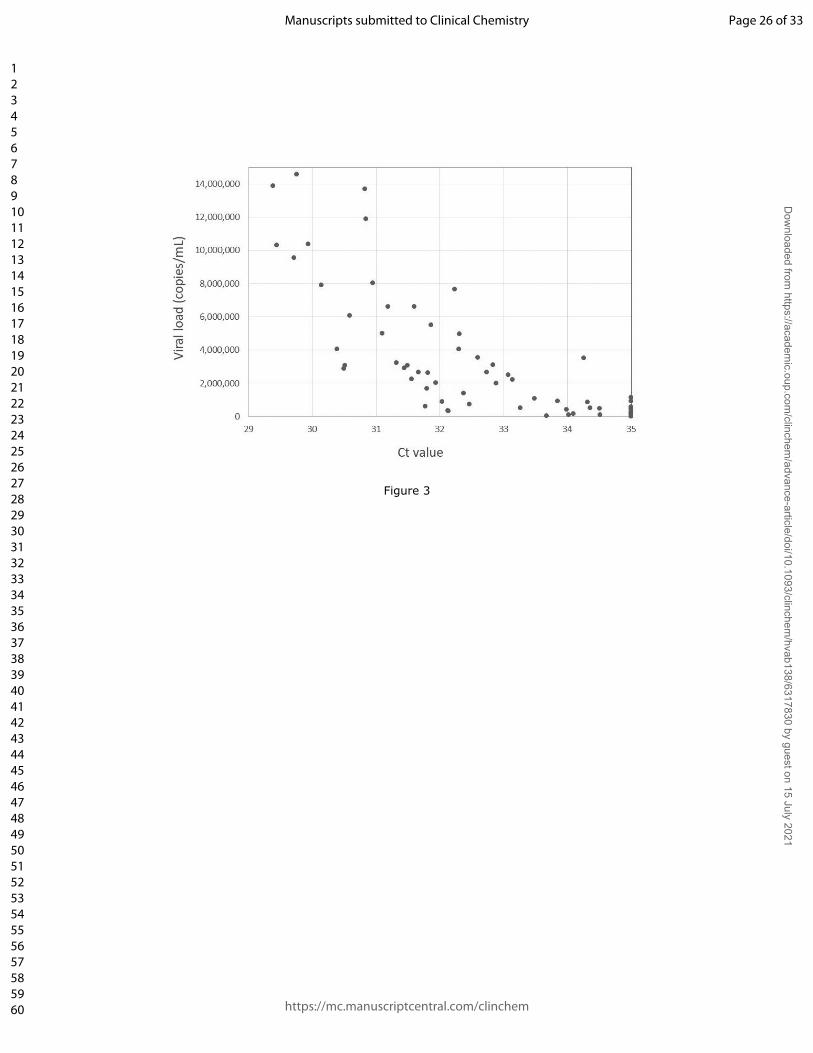
Figure 3
Page 26 of 33
https://mc.manuscriptcentral.com/clinchem
Manuscripts submitted to Clinical Chemistry
123456789101112131415161718192021222324252627282930313233343536373839404142434445464748495051525354555657585960
Dow
nloaded from https://academ
ic.oup.com/clinchem
/advance-article/doi/10.1093/clinchem/hvab138/6317830 by guest on 15 July 2021