Native English-Speaking Teachers versus Non-Native English-Speaking Teachers
eScholarship provides open access, scholarly publishingservices to the University of California and delivers a dynamicresearch platform to scholars worldwide.
University of California
Peer Reviewed
Title:Sensitivity and specificity of the Mini-Mental State Examination for identifying dementia in theoldest-old: The 90+study
Author:Kahle-Wrobleski, KristinCorrada, Maria MLi, BixiaKawas, Claudia H
Publication Date:02-01-2007
Publication Info:Postprints, Multi-Campus
Permalink:http://escholarship.org/uc/item/36w6p83f
Additional Info:http://www.blackwell-synergy.com/doi/pdf/10.1111/j.1532-5415.2007.01049.x The definitiveversion is available at www.blackwell-synergy.com
Keywords:dementia, MMSE, oldest-old, sensitivity, specificity
Abstract:OBJECTIVES: To evaluate the sensitivity and specificity of the Mini-Mental State Examination(MMSE) in identifying dementia in the oldest-old when stratified by age and education. DESIGN:Cross-sectional. SETTING: Research clinic and in-home visits. PARTICIPANTS: Population-based sample of adults aged 90 and older (n=435) who are enrolled in the 90+ Study, alongitudinal, population-based study. MEASUREMENTS: Neurological examination to determinedementia diagnosis, MMSE, and demographic data. RESULTS: Receiver operating characteristic(ROC) analyses indicated that the MMSE had high diagnostic accuracy for identifying dementia insubjects aged 90 and older across different age and education groups (area under the ROC curvevalues ranged from 0.82 to 0.98). A range of possible cutoff values and corresponding sensitivityand specificity are provided for the following age groups: 90-93, 94-96, and >= 97. Age groupswere subdivided by educational attainment (<= high school, vocational school or some college,college degree or higher). In subjects aged 90 to 93 with a college degree or higher, the suggestedMMSE cutoff score is <= 25 (sensitivity=0.82, specificity=0.80). In those aged 94 to 96 with acollege degree or higher, the suggested cutoff is <= 24 (sensitivity=0.85, specificity=0.80). Thoseaged 97 and older with an education of high school or less had the lowest suggested cutoff <= 22(sensitivity=0.80, specificity=0.76). CONCLUSION: Overall, the MMSE had good sensitivity andspecificity across all age and educational groups. Optimal cutoff points were lower in the older agegroups and those with less education, primarily to preserve specificity. This screening instrumentis appropriate for use with the oldest-old.
Sensitivity and Specificity of the Mini-Mental State Examination for Identifying Dementia in the Oldest-old: The 90+ Study
Kristin Kahle-Wrobleski, Ph.D.1, María M. Corrada, Sc.D.12, Bixia Li, M.S.1 and Claudia H. Kawas, M.D.123
1Institute for Brain Aging and Dementia 2Department of Neurology 3Department of
Neurobiology & Behavior, University of California, Irvine Corresponding Author: Kristin Kahle-Wrobleski University of California, Irvine 1515 Hewitt Hall Irvine, CA 92697-1400 Email: [email protected] Alternate Corresponding Author: Claudia Kawas University of California, Irvine 1121 Gillespie Irvine, CA 92697-4540 Email: [email protected] The 90+ Study is supported by the National Institute on Aging grant R01AG21055 and the Al and Trish Nichols Chair in Clinical Neuroscience. Portions of this study were presented at the 2006 Annual Conference of the American Academy of Neurology.
Running Head: Sensitivity and specificity of MMSE in 90+ year olds
1
ABSTRACT
Objectives: To evaluate the sensitivity and specificity of the Mini-Mental State Exam (MMSE)
in identifying dementia among the oldest-old when stratified by age and education.
Design: Cross-sectional.
Setting: Research clinic and in-home visits.
Participants: Population-based sample of adults aged 90 or older (n=435) who are enrolled in
the 90+ Study, a longitudinal, population-based study.
Measurements: Neurological examination to determine dementia diagnosis, MMSE, and
demographic data.
Results: Receiver operating characteristics (ROC) analyses indicated that the MMSE had high
diagnostic accuracy for identifying dementia in subjects aged 90 and older across different age
and education groups (area under the ROC curve values ranged from 0.82 to 0.98). A range of
possible cutoff values and corresponding sensitivity and specificity are provided for the
following age groups: 90 to 93, 94 to 96, and ≥97. Age groups were subdivided by educational
attainment (<high school, vocational school or some college, college degree or higher). In
subjects aged 90 to 93 with a college degree or higher, the suggested cutoff is MMSE <25
(sensitivity=0.82, specificity=0.80). In those aged 94 to 96 with a college degree or higher, the
suggested cutoff is MMSE <24 (sensitivity=0.85, specificity=.080). Those aged 97 and older
with an education of high school or less had the lowest suggested cutoff <22 (sensitivity=0.80,
specificity=0.76).
Conclusions: Overall, the MMSE had good sensitivity and specificity across all age and
educational groups. Optimal cutoff points were lower in the older age groups and those with less
education, primarily to preserve specificity.
2
INTRODUCTION
The age composition of the United States is rapidly changing. An increasing proportion
of the US population is aged 65 and older, and advances in public health and medicine contribute
to an extended lifespan. In the year 2000, approximately 1.4 million Americans were aged 90 or
older, and that number is expected to reach nearly 10 million by 2050.1,2 With the relatively new
emergence of this age group, little is known about the psychological, medical, and social aspects
of living into one’s 10th decade of life. Studies of the oldest-old are needed to better characterize
specific adaptations in health care practices required by this unique group.
For laypersons and health care providers, cognitive decline often is thought of as an
unavoidable part of the aging process. This expected link between aging and deteriorating
cognition likely is due in part to age-related increases in incident dementia beginning at
approximately the age of 65.3,4 Although age is a significant risk factor for dementia, not all
older adults go on to develop a dementing illness. Differentiating dementia from normal age-
related changes in cognition is a challenge for researchers and healthcare providers working with
the elderly. Several valid and reliable dementia screening instruments have been developed to
address this issue, including the Blessed Dementia Scale,5 Dementia Rating Scale (DRS),6 Mini
Mental State Examination (MMSE),7 and Modified Mini Mental State Examination (3MS) 8 – an
expanded version of the MMSE. These screening instruments are essential tools in identifying
possible cognitive impairment as well as monitoring decline in global cognitive functioning.
Of the many different screening tests used in practice, the MMSE is probably the most
widely used instrument, owing in part to its ease of administration, sampling of multiple
cognitive domains, and its validity in detecting dementia.9,10 Although the psychometric
properties of the MMSE for various populations are well documented in the literature, little
3
information is available on the sensitivity and specificity of this screening instrument in the
oldest-old. The proper use of the MMSE with nonagenarians and centenarians depends on the
availability of appropriate cutoff scores that take into account both age and education. This study
presents the sensitivity and specificity of the MMSE for identifying dementia in a sample of 90+
year olds. These data are presented to help researchers and healthcare providers appropriately
interpret this screening instrument when applied to their oldest-old patients. The sensitivity and
specificity are analyzed by age and education subgroups. Suggested cutoff points are provided
that best balance sensitivity and specificity.
METHODS
Participants were drawn from the 90+ Study, a Southern California-based
epidemiological investigation of longevity and brain aging in persons aged 90 and older. These
90+ year olds are from a cohort that was first contacted in the early 1980s as part of the Leisure
World Cohort Study, an epidemiological investigation of a large retirement community.
Beginning in 2001, the 1,150 participants from the original cohort who were 90 or older were
invited to join the 90+ Study. As of April 2006, trained neurological examiners and
neuropsychological testers who collected data on medical history, medication usage, functional
ability, social engagement, neuropsychological functioning, and neurological status recruited and
examined more than 500 people in person. The Institutional Review Board of the University of
California, Irvine, approved this research and informed consent was obtained from all
participants or their legal representatives.
Participants in these analyses were limited to those completing all items on the MMSE.
The 30-point MMSE is embedded within the 3MS, and a derived MMSE score is computed by
4
adding its 11 items. Because there are additional items on the 3MS, the order of presentation for
MMSE items deviates from the standard MMSE administration and presents items in order of
registration, mental reversal, recall, temporal orientation, spatial orientation, naming, repetition,
read and obey, writing, 3-stage command, and pentagon copy. The three registration and recall
words used were “brown”, “shirt”, and “honesty”. The mental reversal item was “world” spelled
backwards rather than serial 7s. A more detailed description of the neuropsychological battery
and its administration is available in a normative study of the 90+ Study participants.11
Every 6 months, trained neurological examiners who assessed the participants in person
assign participants in The 90+ Study a diagnosis according to the Diagnostic and Statistical
Manual of Mental Disorders, Fourth Edition (DSM-IV) criteria for dementia. The neurological
examiners observed the administration of the 3MS, from which the MMSE was derived, to
supplement their own cognitive status assessment but were not made aware of the total score.
Participants were classified into one of three diagnostic categories: normal, cognitively impaired
– not demented (CIND), and demented. The normal group includes participants with no
cognitive or functional loss. The CIND group includes participants with functional loss and only
one domain of cognitive decline, or with no functional loss and 2 or more domains of cognitive
decline, thus not meeting criteria for dementia. For purposes of our analyses, we combined
participants with normal cognition and CIND in the nondemented group. The demented group
included all participants meeting DSM-IV criteria for dementia.
Participants were stratified into age and education categories that resulted in the most
even distribution of participants. The age categories were 90 to 93, 94 to 96, and 97 and older.
Age groups were subdivided by education attainment as follows: High school or less (<HS),
vocational school or some college, and college degree or higher (college+).
5
Sensitivity and specificity were calculated using a receiver operating characteristic
(ROC) curve that plots sensitivity and specificity across the range of possible cutoff scores. ROC
analyses give an estimate of the overall discriminative ability of a scale using the area under the
curve (AUC) statistic. The AUC provides an indication of how close a scale is to the ideal point
of 100% sensitivity and 100% specificity, and it is not dependent on any particular cutoff.
Sensitivity is defined as the proportion of true-positives over combined true-positives and false-
negatives in the entire sample. Specificity is the proportion of true-negatives over combined true-
negatives and false-positives in the entire sample.
All analyses were performed using SPSS,version 13.0 statistical software for Windows
(SPSS Inc., Chicago, IL) and SAS, version 7.1 (SAS Institute Inc., Cary, NC).
RESULTS
Of the 524 90+ Study participants who were seen in person for evaluation, 435
participants met inclusion criteria with completion of all items on the MMSE, complete
demographic information, and having an assigned diagnosis by a neurological examiner.
Demographic characteristics of the sample are presented in Table 1. The mean age of this sample
was 95 (range 90-104). The sample was 74% female, and 73% of the participants had more than
12 years of formal education. Based on the neurological examiner’s diagnosis, 36% of
participants were normal, 28% CIND, and 36% demented. Eight-six participants did not meet
inclusion criteria because of failure to complete all items on the MMSE due to severe dementia,
fatigue, physical impairment, vision impairment, hearing impairment, or refused testing. Three
additional participants did not report their educational attainment and were excluded. The
participants who were not included in the analyses were older (mean age of 96.01+3.62 vs.
6
94.98+3.02, P=.01), had proportionally less education (71% of noncompleters with greater than
high school vs. 73% of completers, P=.67), and had a greater proportion with a dementia
diagnosis (71% diagnosed with dementia vs. 36% of completers, P<.001).
Table 1 presents the number of participants included in each age by education subgroup
as well as mean MMSE and AUC values for age and education subgroups. The mean MMSE
scores in the group aged 90 to 93 were approximately the same for all levels of educational
attainment. In the groups aged 94 to 96 and 97 and older, the <HS group had the lowest mean
MMSE scores. The lowest AUC value (0.82) occurred in the group aged 97 and older with the
least education. The highest AUC value (0.98) was for the group aged 90 to 93 with vocational
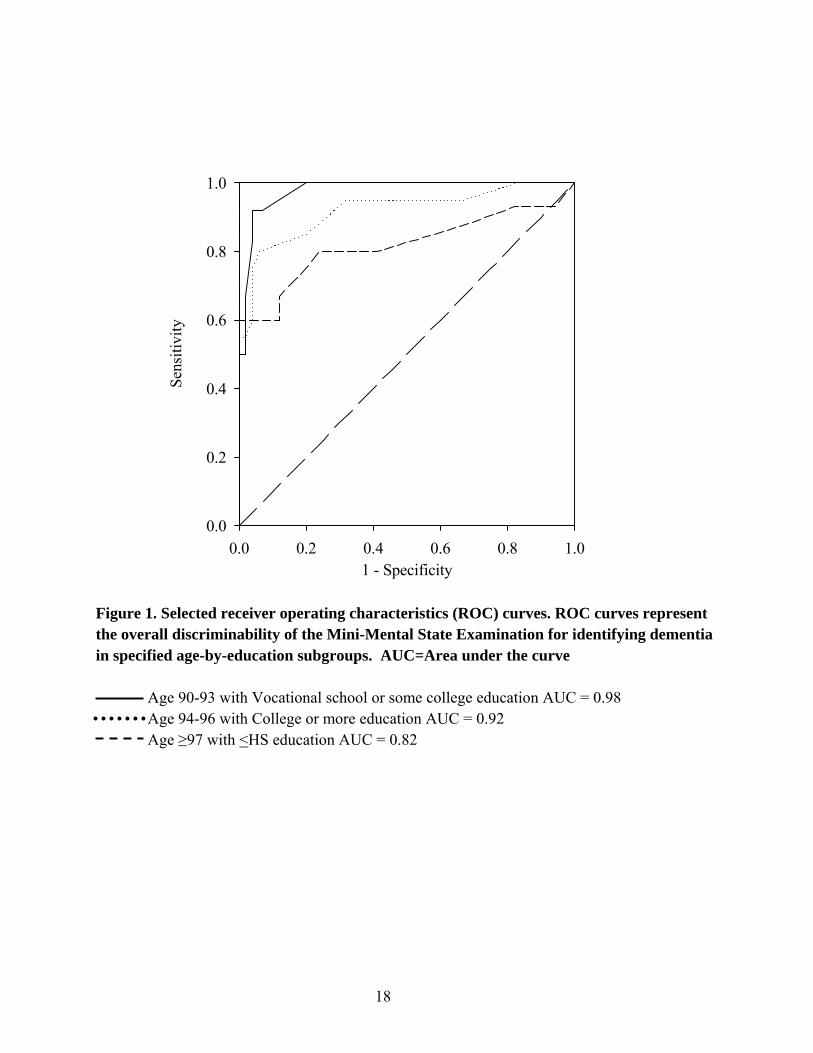
school or some college. Figure 1 shows the ROC curves representing the lowest and highest
AUC values, as well as the ROC curve for the group aged 94 to with more than a college
education, whose AUC value of 0.92 is the same as the overall mean AUC value of 0.92. All
other AUC values for the MMSE ranged from 0.90 to 0.95, indicating excellent overall accuracy
at identifying dementia across age and education stratifications.
The optimal cutoffs were determined by finding the MMSE values that allowed for the
best balance between sensitivity and specificity. A range of possible cutoff values is provided in
Table 2. For the MMSE, the optimal cutoff for dementia in those aged 90 to 93 was highest in
the group with college or more education (<HS cutoff <23, vocational or some college cutoff
<22, college+ cutoff <25). For the group aged 94 to 96, the optimal cutoffs by educational
attainment were <23 for <HS, ≤25 for vocational or some college, and <25 for college+ cutoff
<24. The group aged 97 and older had the following optimal cutoffs by education: ≤22 for <HS,
≤24 for vocational or some college, and ≤22 for college+.
7
DISCUSSION
The purpose of this study was to provide cutoff scores on the MMSE for the detection of
dementia in subjects aged 90 and older stratified according to age and education. The sensitivity
and specificity, as well as the overall accuracy, of the MMSE at detecting dementia in the
oldest-old were assessed. The current results support making adjustments for age and education
when determining cutoff scores for dementia on the MMSE in a sample of people aged 90 and
older.
Across all age and education groups, the MMSE demonstrated good overall diagnostic
accuracy as reflected by high AUC values (Table 1 and Figure 1). The AUC values ranged from
a low of 0.82 in the group aged 97 and older with a high school education or less to a high of
0.98 in the group aged 90 to 93with vocational school or some college education. In the group
with the lowest AUC, the specificity values were notably lower than in other groups. In those
aged 97 and older with a high school education or less, the MMSE is a less accurate screening
tool than for other age and education groups. This may be due in part to a greater proportion of
aged 97 and older with a high school education or less that have some cognitive impairment and
were included in the nondemented group. Across all education groups in those aged 97 and
older, more participants were CIND than normal (32% CIND and 25% normal), but in those
aged 90 to 93, fewer participants were CIND than were normal (28% CIND and 42% normal).
The participants with cognitive impairment of insufficient severity to meet criteria for dementia
likely had lower MMSE scores that resulted in more false positives, thus lowering specificity. In
an extension of the current study, analyses looking at the diagnostic accuracy of the MMSE for
identifying CIND in the oldest-old are presently underway with participants of the 90+ Study.
8
One consistent finding in the scientific literature is that increasing age is associated with
lower MMSE scores.11-15 The decline in MMSE scores across the later decades of life could be
due to a decline in cognition related to benign age-related changes, or, alternatively, may result
from a higher proportion of cognitively impaired or demented persons in the oldest-old group.
Regardless of the cause of age-related changes in MMSE, failure to adjust cutoffs based on age
typically results in a loss of specificity.16-17 Given the reported age effects, the cutoff scores for
dementia on the MMSE need to be adjusted according to age to maximize the sensitivity and
specificity of the scale.18
With advancing age, optimal cutoff scores were expected to decline regardless of
educational attainment. Although the optimal cutoffs in this sample did not follow a direct linear
trend of lower cutoffs with increasing age across all educational groups, the lowest optimal
cutoff score was in the oldest age group. For instance, in the college+ group, the recommended
cutoff for dementia in those aged 90 to 93 was ≤25, decreasing to ≤24 for those aged 94 to 96,
and further decreasing to ≤22 for those aged 97 and older. These downward adjustments were in
favor of preserving specificity. Keeping the same cutoff of <25 for those aged 94 to 96 and 97
and older in the college+ group would have lowered the specificity from 0.80 to 0.74 and 0.58,
respectively. The decline in specificity with increasing age was similarly noted in findings from
the Canadian Study on Health and Aging (CSHA).17 When using a cutoff of 24 in the CSHA
sample, sensitivity was higher and specificity was lower in those aged 80 to 89 (sensitivity=
0.95, specificity = 0.82) than in those aged 65 to 79 (sensitivity= 0.82, specificity = 0.86). Age-
adjusted cutoffs for the MMSE may help preserve specificity, thus allowing for accurate
screening of dementia for the elderly patients even into their nineties.
9
The unexpected finding of lower optimal cutoffs for younger participants found in the
group with vocational school or some college education (<22 for ages 90 to 93, <25 for ages 94
to 96, and <24 for ages ≥97) may be due in part to the number of specific MMSE scores
represented in each subgroup. Subjects aged 94 to 96 had a more evenly distributed number of
persons with specific cutoff scores (i.e., 2 participants with a score of 23, 1 participants with a
score of 24, and 3 participants with a score of 25), whereas those aged 90 to 93 had one
participant with a score of 22, no participant with a score of 24, and seven participants with a
score of 25. Given the small sample sizes in the subgroups, these variations in represented scores
possibly influenced the sensitivity and specificity estimations. Regardless of chosen cutoff
scores, the group aged 90 to 93 had higher specificity than those aged 94 to 96 and 97 and older
in the group with vocational school or some college education, in keeping with the trend of the
other age-by-education groups in this sample. Therefore, age-adjusted cutoffs are likely to be
useful when using the MMSE with subjects 90 and older.
Along with older age, lower educational level is associated with lower MMSE
scores.13,15,19-20 Education-adjusted cutoff scores generally are thought to reduce the risk of
misclassification bias in screening for dementia.21 Adjusting the MMSE cutoff for dementia to a
lower cutoff score in patients with less education would help preserve specificity.
Results from the present study did not show a clear advantage for lowering the cutoff
point for participants having less education. In the group aged 90 to 93, for example, the best
balance between sensitivity and specificity occurred at a cutoff of <23 for participants with a
high school education or less, decreased to a cutoff of <22 for those with vocational training or
some college, and increased to a cutoff of <25 for those with a college education or higher.
Furthermore, in the group aged 97 and older, the cutoff for the <HS group and college+ groups
10
was the same when considering the best sensitivity versus specificity trade-off, whereas the
optimal cutoff for the vocational school or some college group was higher. The unexpected
variation in cutoffs for the vocational school or some college educational group in relation to the
<HS and college+ groups possibly reflects the heterogeneity of the vocational school or some
college group. It is possible that those who attended vocational school are different than those
who attended some college in a manner that would affect cognitive test performance, but the
present data set does not allow a separation of the two groups for further analyses. Results from
this sample suggest that education-adjusted cutoffs in those aged 90 and older may not be as
useful as age-adjusted cutoff scores because of the variation seen in the vocational school or
some college group. Furthermore, the small number of participants in this sample having a high
school education or less precluded further analyses across a lower range of educational
achievement.
Several caveats must be considered when evaluating these study results. First, the
neurology examiners observed the administration of the MMSE items during participants’
evaluations. As such, a participant’s performance on the MMSE may have influenced the
dementia diagnosis. This is unlikely to have significantly impacted the outcomes because the
final MMSE score was not shared with the neurological examiner until after the entire protocol
was completed and a diagnosis had already been assigned. Furthermore, the MMSE data were
used within the context of a much longer neurological exam that included additional mental
status assessment. Finally, no predetermined MMSE cutoff scores were used in the neurologist’s
diagnosis of dementia.
The second caveat relates to the generalizability of these findings for persons with low
educational attainment. This sample represents a highly educated group of the oldest-old. Ninety-
11
12
one percent of participants had completed at least high school, compared to approximately 53%
of the general US population in the same age cohort.1 Optimal cutoffs for the oldest-old having a
grade school education may be lower than those demonstrated with our sample.
This study has several strengths. It includes a large number of subjects aged 90 and older,
ranging from 90 to 104. This allowed a more detailed analysis of age-related cutoff points than is
currently available in the literature. In addition, the availability of a neurological diagnosis,
including CIND, allowed reasonable inferences to be made as to the effect of a higher proportion
of subjects aged 97 and older with a CIND diagnosis potentially impacting the specificity of the
MMSE as a screening tool. Also, by presenting MMSE cutoff scores for dementia across the
tenth decade, this study expands the usefulness of a tool that is already in widespread use in
research and clinical practice.
The oldest-old are the fastest growing segment of the population, and having age-
appropriate cutoff scores for screening measures such as the MMSE provides useful tools for the
accurate screening and further treatment of cognitive dysfunction in these patients. The MMSE
appears to be an accurate instrument for dementia screening in subjects aged 90 and older. To
preserve a balance between sensitivity and specificity, suggested cutoff values on the scale were
adjusted downward for older subjects and those with less education. Based on findings from the
present study, age- and education-related adjustments should be considered when using the
MMSE with patients who are aged 90 or older.
Key words: dementia, MMSE, oldest-old, sensitivity, specificity
ACKNOWLEDGMENTS
The authors extend their sincere thanks to the 90+ Study participants, families, and caregivers for
their time and effort. Thank you also to the dedicated staff members of the 90+ Study for their
continued hard work.
Financial Disclosure(s):
The 90+ Study is supported by the National Institute on Aging grant R01AG21055 and the Al
and Trish Nichols Chair in Clinical Neuroscience.
Author Contributions: Kristin Kahle-Wrobleski – study concept and design, acquisition of
data, analysis and interpretation of data, manuscript preparation. María M. Corrada and Claudia
H. Kawas– study concept and design, interpretation of data, manuscript edits. Bixia Li – study
concept and design, analysis and interpretation of data, manuscript edits.
Sponsor’s role: None
13
REFERENCES
1. U.S. Census Bureau. Census 2000 Summary File. United States of America, 2001.
2. U.S. Census Bureau. Population projections (Middle series). United States of America, 2002.
3. Bachman D, Wolf P, Linn R et al. Incidence of dementia and probable Alzheimer’s disease in
a general population: The Framingham Study. Neurology 1993; 43:515-519.
4. Kawas C, Gray, S, Brookmeyer, R et al. Age-specific incidence rates of Alzheimer’s disease:
The Baltimore Longitudinal Study of Aging. Neurology 2000; 54:2072-2077.
5. Blessed G, Tomlinson BE, Roth M. The association between quantitative measures of
dementia and of senile changes in the cerebral grey matter of elderly subjects. Br J
Psychiatry1968; 114:797-811.
6. Mattis S. Dementia Rating Scale. Odessa, FL: Psychological Assessment Resources, 1988.
7. Folstein M, Folstein S, McHugh P. Mini-Mental State: A practical method for grading the
cognitive state of patients for the clinician. J Psychiat Res 1975; 12:189-198.
8. Teng E, Chui H. The Modified Mini-Mental State (3MS) Examination. J Clin Psychiatry
1987; 48:314-318.
9. Tombaugh T, McIntyre N. The Mini-Mental State Examination: A comprehensive review. J
Am Geriatr Soc 1992; 40:922-935.
10. Malloy P, Cummings J, Coffey C et al. Cognitive screening instruments in neuropsychiatry:
A report of the committee on research of the American Neuropsychiatric Association. J
Neuropsychiatry Clin Neurosci 1997; 9:189-197.
11. Whittle C, Corrada M, Dick M. Neuropsychological data in non-demented oldest-old: The
90+ Study. J Clin Exp Neuropsychol In Press 2006.
14
12. Bleecker M, Bolla-Wilson K, Kawas C et al. Age-specific norms for the Mini-Mental State
Exam. Neurology 1988; 38:1565-1568.
13. Black S, Espino D, Mahurin R et al. The influence of noncognitive factors on the Mini-
Mental State Examination in older Mexican-Americans: Findings from the Hispanic EPESE. J
Clin Epidemiol 1999; 52:1095-1102.
14. Crum R, Anthony J, Bassett S et al. Population-based norms for the Mini-Mental State
Examination by age and education level. JAMA 1993; 269:2386-2391.
15. O’Connor D, Pollitt P, Treasure F et al. The influence of education, social class and sex on
Mini-Mental State scores. Psychol Med 1989; 19:771-776.
16. Reischies F, Geiselmann B. Age-related cognitive decline and vision impairment affecting
the detection of dementia syndrome in old age. Br J Psychiatry 1997; 171:449-451.
17. Tombaugh T, McDowell I, Kristjansson B et al. Mini-Mental State Examination (MMSE)
and the Modified MMSE (3MS): A psychometric comparison and normative data. Psychol
Assess 1996; 8:48-59.
18. Iverson G. Interpretation of Mini-Mental State Examination scores in community-dwelling
elderly and geriatric neuropsychiatry patients. Int J Geriat Psychiatry 1998; 13:661-666.
19. Fratiglioni L, Jorm A, Grut M et al. Predicting dementia from the Mini-Mental State
Examination in an elderly population: The role of education. J Clin Epidemiol 1993; 46:281-287.
20. Uhlmann R, Larson E. Effect of education on the Mini-Mental State Examination as a
screening test for dementia. J Am Geriatr Soc 1991; 39:876-880.
21. Kukull W, Larson E, Teri L. The Mini-Mental State Examination score and the clinical
diagnosis of dementia. J Clin Epidemiol 1994; 47:1061-1067.
15
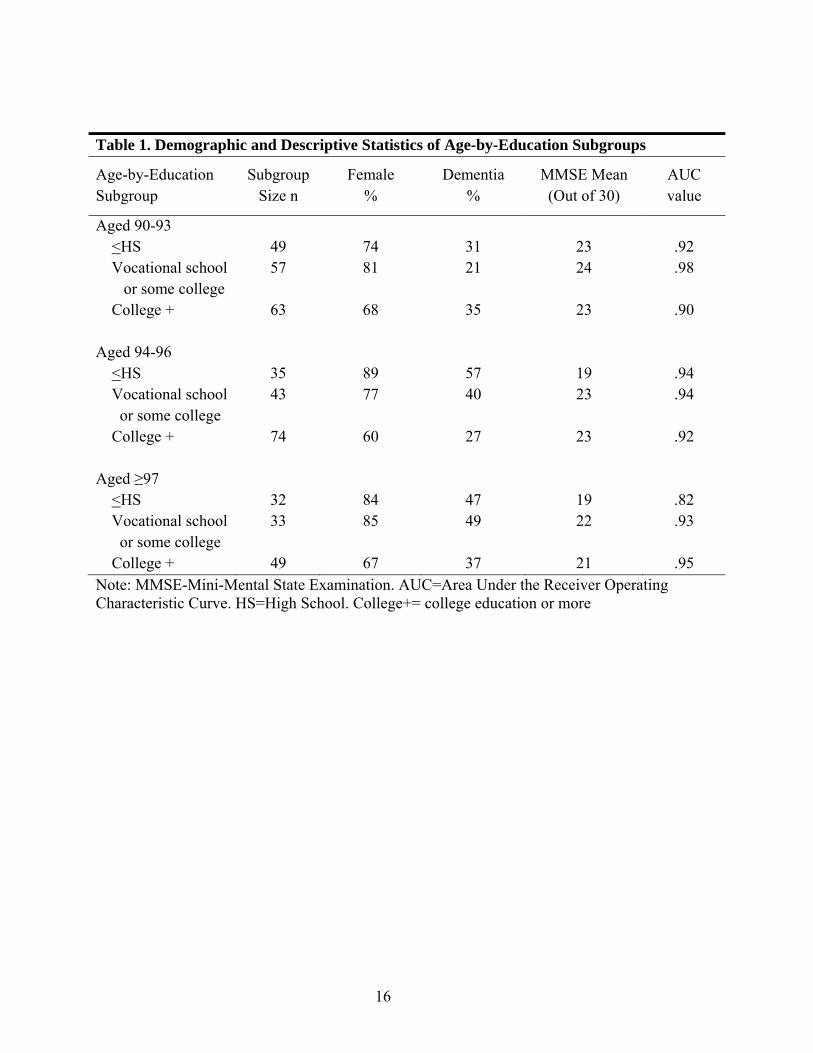
Table 1. Demographic and Descriptive Statistics of Age-by-Education Subgroups
Age-by-Education Subgroup
Subgroup Size n
Female %
Dementia %
MMSE Mean (Out of 30)
AUC value
Aged 90-93 <HS Vocational school or some college College +
49 57
63
74 81
68
31 21
35
23 24
23
.92 .98
.90
Aged 94-96 <HS Vocational school or some college College +
35 43
74
89 77
60
57 40
27
19 23
23
.94 .94
.92
Aged ≥97 <HS Vocational school or some college College +
32 33
49
84 85
67
47 49
37
19 22
21
.82 .93
.95
Note: MMSE-Mini-Mental State Examination. AUC=Area Under the Receiver Operating Characteristic Curve. HS=High School. College+= college education or more
16
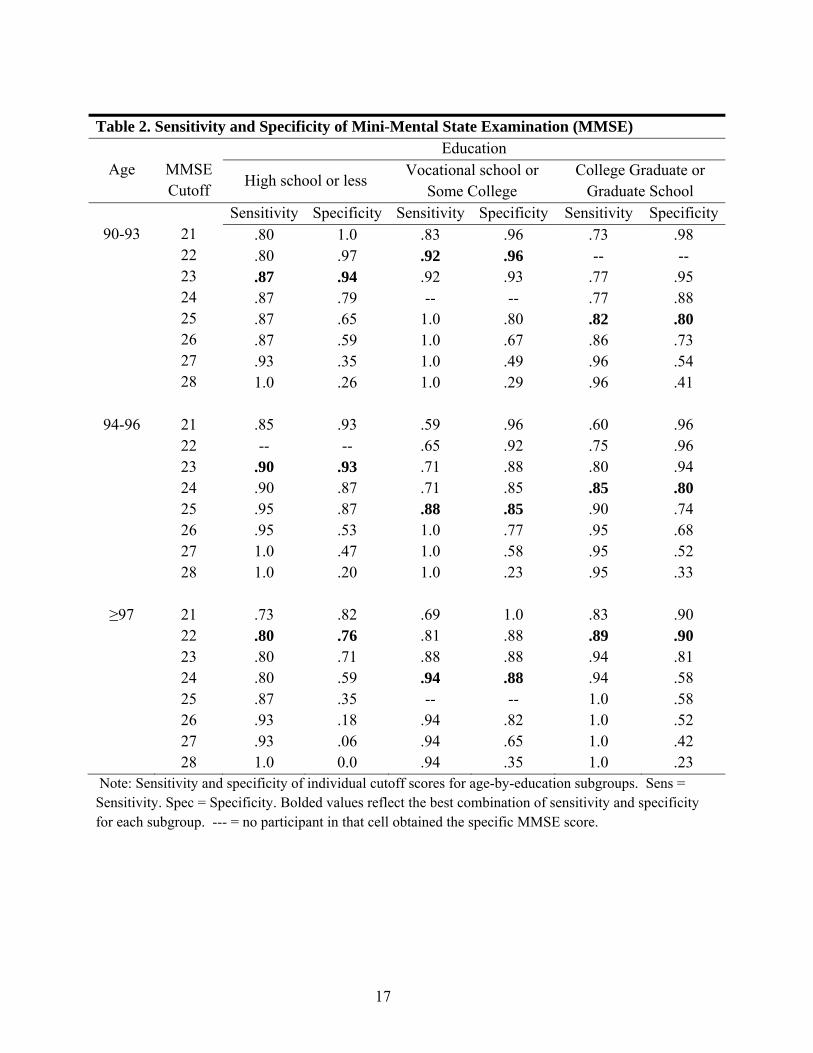
Table 2. Sensitivity and Specificity of Mini-Mental State Examination (MMSE)
Age
MMSE Cutoff
Education
High school or less Vocational school or
Some College College Graduate or
Graduate School
90-93
21 22 23 24 25 26 27 28
Sensitivity Specificity Sensitivity Specificity Sensitivity Specificity.80 .80 .87 .87 .87 .87 .93 1.0
1.0 .97 .94 .79 .65 .59 .35 .26
.83
.92
.92 --
1.0 1.0 1.0 1.0
.96
.96
.93 --
.80
.67
.49
.29
.73 --
.77
.77
.82
.86
.96
.96
.98 --
.95
.88
.80
.73
.54
.41
94-96
21 22 23 24 25 26 27 28
.85 --
.90
.90
.95
.95 1.0 1.0
.93 --
.93
.87
.87
.53
.47
.20
.59 .65 .71 .71 .88 1.0 1.0 1.0
.96 .92 .88 .85 .85 .77 .58 .23
.60 .75 .80 .85 .90 .95 .95 .95
.96 .96 .94 .80 .74 .68 .52 .33
≥97
21 22 23 24 25 26 27 28
.73 .80 .80 .80 .87 .93 .93 1.0
.82 .76 .71 .59 .35 .18 .06 0.0
.69 .81 .88 .94 --
.94
.94
.94
1.0 .88 .88 .88 --
.82
.65
.35
.83 .89 .94 .94 1.0 1.0 1.0 1.0
.90 .90 .81 .58 .58 .52 .42 .23
Note: Sensitivity and specificity of individual cutoff scores for age-by-education subgroups. Sens = Sensitivity. Spec = Specificity. Bolded values reflect the best combination of sensitivity and specificity for each subgroup. --- = no participant in that cell obtained the specific MMSE score.
17
1 - Specificity0.0 0.2 0.4 0.6 0.8 1.0
0.0
0.2
0.4
0.6
0.8
1.0
Sens
itivi
ty
Figure 1. Selected receiver operating characteristics (ROC) curves. ROC curves represent the overall discriminability of the Mini-Mental State Examination for identifying dementia in specified age-by-education subgroups. AUC=Area under the curve Age 90-93 with Vocational school or some college education AUC = 0.98 Age 94-96 with College or more education AUC = 0.92 Age ≥97 with <HS education AUC = 0.82
18
Copyright © 2022 FDOKUMEN