Classical and molecular cytogenetic analysis in head and neck squamous cell carcinomas
Upload
khangminh22Category
view
3download
0
HAL Id: tel-01844471https://hal.archives-ouvertes.fr/tel-01844471v1
Submitted on 19 Jul 2018 (v1), last revised 27 Dec 2019 (v2)
HAL is a multi-disciplinary open accessarchive for the deposit and dissemination of sci-entific research documents, whether they are pub-lished or not. The documents may come fromteaching and research institutions in France orabroad, or from public or private research centers.
L’archive ouverte pluridisciplinaire HAL, estdestinée au dépôt et à la diffusion de documentsscientifiques de niveau recherche, publiés ou non,émanant des établissements d’enseignement et derecherche français ou étrangers, des laboratoirespublics ou privés.
Radiosensitizing effect of AGuIX ® in Head and NeckSquamous Cell Carcinoma (HNSCC): from cellular
uptake to subcellular damageStéphanie Simonet
To cite this version:Stéphanie Simonet. Radiosensitizing effect of AGuIX ® in Head and Neck Squamous Cell Carcinoma(HNSCC): from cellular uptake to subcellular damage. Cancer. Université Claude Bernard Lyon 1,2018. English. �tel-01844471v1�

1
N° d’ordre NNT : xxx
THESE de DOCTORAT DE L’UNIVERSITE DE LYON Opérée au sein de
L’Université Claude Bernard Lyon 1
Ecole Doctorale Interdisciplinaire Sciences-Santé N° 205
Spécialité de doctorat : Radiobiologie
Discipline : Biologie Cellulaire et Oncologie
Soutenue publiquement le 26/03/2018, par :
Stephanie SIMONET
Radiosensitizing effect of AGuIX® in Head and Neck Squamous Cell
Carcinoma (HNSCC): from cellular uptake to subcellular damage
Devant le jury composé de :
Nom, prénom grade/qualité établissement/entreprise Président.e (à préciser après la
soutenance)
Professeur Laurent CHARLET – Université Grenoble-Alpes Rapporteur
Professeur Stéphane ROUX – Université Franche-Comté Rapporteur
Docteur Cécile SICARD-ROSELLI – Université Paris-Sud Rapportrice
Docteur Hélène ELLEAUME– Université Grenoble-Alpes Examinatrice
Professeur Léa PAYEN – Université Lyon 1 Examinatrice
Professeur Claire RODRIGUEZ-LAFRASSE – Université Lyon 1 Invitée
Professeur Olivier TILLEMENT - Université Lyon 1 Invité
Docteur Dominique ARDAIL – Université Lyon 1 Directeur de thèse
Docteur Walid RACHIDI – Université Grenoble-Alpes Co-directeur de thèse

2
3
Abstract
Head and Neck Squamous Cell Carcinoma is ranked among the top ten deadliest cancers due to its high radioresistance and recurrence. One radiosensitizing strategy is the use of high-Z metal nanoparticles. In this study, ultrasmall gadolinium-based nanoparticles, AGuIX®, were used for their potential as a radiosensitizing agent. The objectives of this work were to determine the radiosensitizing conditions of AGuIX® in an HNSCC cell model, their localization after uptake, and the biological consequences generated at the subcellular level after the combined treatment. A preliminary proteomic approach was initiated in order to identify potential molecular targets involved in radiosensitization. The treatment of SQ20B cells with 0.8mM Gd for 24h resulted in a dose enhancement factor (DEF) of 1.3. AGuIX® were predominantly localized in lysosomes. The overproduction of radical oxygen species following AGuIX® + radiation was intimately involved in the radiosensitization, although largely subdued by the high level of endogenous antioxidant defenses. Autophagy was specifically triggered after the combined treatment, while other irradiation-induced cell deaths remained unchanged. The number of complex, residual double strand breaks (DSBs) was specifically increased with AGuIX® combined to radiation. Lastly, our preliminary proteomic analysis allowed the isolation of potential molecular targets with great promise. Collectively, it seems that the radiosensitizing effect observed in this work may result from a combination of events.
Future work is required to understand the mechanisms linking lysosomes-entrapped AGuIX® with the upregulation of autophagic cell death after radiation.
Keywords: Head and Neck Squamous Cell Carcinoma (HNSCC); ionizing radiation; nanomedicine;
radiosensitizing strategies; nanoparticles; AGuIX®; Radical Oxygen Species (ROS)
Résumé
Les cancers des Voies Aérodigestives Supérieures sont classés parmi les dix cancers les plus agressifs du fait de leur radioresistance intrinsèque et leur forte probabilité de récurrence. L’objectif de ce travail a été d’étudier le potentiel radiosensibilisant de nanoparticules à base de gadolinium, AGuIX®, sur un modèle cellulaire de cancer des VADS. Après avoir déterminé et validé les conditions optimales de radiosensibilisation de notre modèle par les AGuIX®, leur localisation après internalisation ainsi que les conséquences biologiques générées à l’échelle subcellulaire ont été successivement étudiées. Enfin, une approche préliminaire protéomique a été initiée afin d’identifier des cibles moléculaires potentielles impliquées dans cette radiosensibilisation.
Le traitement des cellules SQ20B avec 0.8mM Gd pendant 24h se sont révélées être optimales avec un DEF (dose enhancement factor) de 1.3. Les AGuIX® sont localisées presque exclusivement dans les lysosomes après internalisation. La radiosensibilisation est liée à une surproduction de radicaux libres oxygénés, minimisée toutefois par des défenses antioxydantes endogènes élevées. Le traitement combiné (AGuIX®+ irradiation) déclenche spécifiquement la mort cellulaire autophagique et s’accompagne d’une augmentation significative du nombre de cassures double brins résiduelles complexes. L’étude protéomique préliminaire a permis d’identifier une cible moléculaire potentiellement impliquée dans cette radiosensibilisation (la ribonucléotide réductase), cible qui fera l’objet d’une suite à ce travail. De plus, la prochaine étape sera de comprendre les mécanismes qui relient les AGuIX® internalisées dans les lysosomes avec l’augmentation de la mort cellulaire autophagique après irradiation.
Mots clés: Cancers des Voies Aéro-Digestives Supérieurs (VADS); irradiation ionisante; nanomédicine; stratégie radiosensibilisante; nanoparticules; AGuIX®; Radicaux Libres Oxygénés (RLO)

4

5
UNIVERSITE CLAUDE BERNARD - LYON 1
Président de l’Université
Président du Conseil Académique
Vice-président du Conseil d’Administration
Vice-président du Conseil Formation et Vie Universitaire
Vice-président de la Commission Recherche
Directrice Générale des Services
M. le Professeur Frédéric FLEURY
M. le Professeur Hamda BEN HADID
M. le Professeur Didier REVEL
M. le Professeur Philippe CHEVALIER
M. Fabrice VALLÉE
Mme Dominique MARCHAND
COMPOSANTES SANTE
Faculté de Médecine Lyon Est – Claude Bernard
Faculté de Médecine et de Maïeutique Lyon Sud – Charles
Mérieux
Faculté d’Odontologie
Institut des Sciences Pharmaceutiques et Biologiques
Institut des Sciences et Techniques de la Réadaptation
Département de formation et Centre de Recherche en Biologie
Humaine
Directeur : M. le Professeur G.RODE
Directeur : Mme la Professeure C. BURILLON
Directeur : M. le Professeur D. BOURGEOIS
Directeur : Mme la Professeure C. VINCIGUERRA
Directeur : M. X. PERROT
Directeur : Mme la Professeure A-M. SCHOTT
COMPOSANTES ET DEPARTEMENTS DE SCIENCES ET TECHNOLOGIE
Faculté des Sciences et Technologies
Département Biologie
Département Chimie Biochimie
Département GEP
Département Informatique
Département Mathématiques
Département Mécanique
Département Physique
UFR Sciences et Techniques des Activités Physiques et Sportives
Observatoire des Sciences de l’Univers de Lyon
Polytech Lyon
Ecole Supérieure de Chimie Physique Electronique
Institut Universitaire de Technologie de Lyon 1
Ecole Supérieure du Professorat et de l’Education
Institut de Science Financière et d'Assurances
Directeur : M. F. DE MARCHI
Directeur : M. le Professeur F. THEVENARD
Directeur : Mme C. FELIX
Directeur : M. Hassan HAMMOURI
Directeur : M. le Professeur S. AKKOUCHE
Directeur : M. le Professeur G. TOMANOV
Directeur : M. le Professeur H. BEN HADID
Directeur : M. le Professeur J-C PLENET
Directeur : M. Y.VANPOULLE
Directeur : M. B. GUIDERDONI
Directeur : M. le Professeur E.PERRIN
Directeur : M. G. PIGNAULT
Directeur : M. le Professeur C. VITON
Directeur : M. le Professeur A. MOUGNIOTTE
Directeur : M. N. LEBOISNE

6

7
Table of Contents
List of Figures ......................................................................................................................................... 13
List of Tables .......................................................................................................................................... 19
List of Abbreviations .............................................................................................................................. 21
General Introduction ............................................................................................................................. 25
Bibliography Review .............................................................................................................................. 31
Chapter I. Head and Neck Squamous Cell Carcinoma ....................................................................... 33
1. Generalities, Facts, and Statistics .......................................................................................... 33
2. Frequently dysregulated pathways in HNSCC ....................................................................... 34
3. Treatments options in HNSCC ............................................................................................... 36
3.1. Surgery ........................................................................................................................... 37
3.2. Chemotherapy ............................................................................................................... 37
3.3. Radiotherapy ................................................................................................................. 41
3.4. Targeted therapies ........................................................................................................ 43
Chapter II. Radiotherapy ................................................................................................................... 53
1. Interactions of ionizing radiations (photons) with matter .................................................... 53
1.1. The Photoelectric Effect ................................................................................................ 54
1.2. The Compton Effect ....................................................................................................... 54
1.3. Pair production .............................................................................................................. 55
1.4. Thomson-Rayleigh diffusion .......................................................................................... 56
1.5. Nuclear reaction ............................................................................................................ 56
1.6. Predominance of each effect ........................................................................................ 56
2. Biological effects of ionizing radiations: direct vs. indirect effect......................................... 57
2.1. Direct effect ................................................................................................................... 58
2.2. Indirect effect: water radiolysis ..................................................................................... 58

8
3. DNA Damage induced by ionizing radiations and DNA damage repair................................. 59
3.1. DNA damage .................................................................................................................. 59
DNA damage repair: Overview of the mechanisms involved .................................................... 61
4. Radiosensitizing strategies .................................................................................................... 65
4.1. Modulating the DNA damage response ........................................................................ 65
4.2. Modulating cell cycle checkpoints ................................................................................. 66
4.3. Modulating signal transduction pathways .................................................................... 67
4.4. Receptor targeting strategies ........................................................................................ 67
4.5. Modulating the microenvironment ............................................................................... 69
4.6. Targeting cancer stem cells (CSCs) ................................................................................ 69
4.7. Other directions............................................................................................................. 70
Chapter III. Nanotechnology: the rise of nanomedicine ................................................................... 71
1. Generalities ........................................................................................................................... 71
1.1. Nanotechnologies for medical applications: Nanomedicine......................................... 73
1.2. Nanomedicine for cancer .............................................................................................. 73
2. Nanoparticles coupled to Radiotherapy ................................................................................ 79
2.1. Different types of radiosensitizing nanoparticles ......................................................... 80
2.2. Focus on metal-based nanoparticles ............................................................................. 83
2.3. Physicochemical mode of action of high-Z metal NPs .................................................. 92
3. AGuIX® (Activation and Guidance of Irradiation by X-ray) nanoparticles ............................. 95
3.1. AGuIX® as radiosensitizers: state-of the-art .................................................................. 95
Chapter IV. Radical Oxygen Species (ROS) in Cancer, the role of mitochondria and other organelles
......................................................................................................................................................... 107
1. Water radiolysis and generation of reactive oxygen species .............................................. 107
2. Generation of reactive nitrogen species ............................................................................. 108
3. Other sources of reactive species ....................................................................................... 108
4. Reactive oxygen species (ROS) signaling pathways regulation ........................................... 109

9
5. Mitochondria and delayed effects of ionizing radiation ..................................................... 110
5.1. Generalities ................................................................................................................. 110
5.2. mROS production after ionizing radiations ................................................................. 111
5.3. mROS damage to mitochondrial DNA ......................................................................... 112
5.4. Other damages induced by mROS ............................................................................... 113
6. Radical oxygen species and their implication in tumorigenesis .......................................... 113
6.1. Targeting Radical Oxygen Species for therapy: a clinical approach ............................ 114
7. Effects of ionizing radiation on lysosomes and other cell organelles ................................. 116
7.1. Effects of ionizing radiation on lysosomes .................................................................. 116
7.2. Effects of ionizing radiation on other cell organelles .................................................. 117
Chapter V. Ionizing Radiation (IR)-induced cell death ..................................................................... 119
1. Apoptosis ............................................................................................................................. 119
1.1. The intrinsic apoptotic pathway .................................................................................. 120
1.2. The extrinsic apoptotic pathway ................................................................................. 120
1.3. The membrane stress apoptotic pathway ................................................................... 121
2. Mitotic catastrophe ............................................................................................................. 121
3. Necrosis and necroptosis .................................................................................................... 121
4. Senescence .......................................................................................................................... 122
5. Autophagy ........................................................................................................................... 122
Materials and Methods ....................................................................................................................... 125
1. Cell culture and treatments ................................................................................................. 127
1.1. Cell Culture .................................................................................................................. 127
1.2. AGuIX® (Activation and Guidance of Irradiation by X-ray) nanoparticles ................... 127
1.3. AGuIX® treatment of SQ20B cells ................................................................................ 128
1.4. DMF/BSO treatment .................................................................................................... 128
1.5. Photon Irradiation ....................................................................................................... 129
2. Characterization of the radiosensitization effect of SQ20B J.L. cells by AGuIX® ................ 129
10
2.1. Determining the AGuIX® concentration and ideal medium for a radiosensitizing effect
129
2.2. Cellular localization of AGuIX® in SQ20B JL cells ......................................................... 133
3. Study of cell death after AGuIX® treatment + irradiation ................................................... 134
3.1. Study of apoptosis and necrosis .................................................................................. 134
3.2. Study of the cell cycle kinetics ..................................................................................... 136
3.3. Study of other cellular death pathways via Western Blot........................................... 137
4. Kinetic study of cellular and mitochondrial radical oxygen species (ROS) production induced
by AGuIX® + IR ............................................................................................................................. 141
4.1. Cytoplasmic reactive oxygen species assay ................................................................. 141
4.2. Mitochondrial reactive oxygen species assay ............................................................. 142
5. Study of nuclear damages induced by AGuIX® + IR ............................................................. 142
5.1. Detection of single-stranded breaks: Comet assay +/- FPG ........................................ 142
5.2. Detection of double-stranded breaks: Foci ƳH2AX ..................................................... 144
5.3. Quantification of 8-oxo-G by HPLC-MS/MS ................................................................ 145
6. Functional consequences on the mitochondria of AGuIX® + I.R. ........................................ 147
6.1. Common deletion of mitochondrial DNA .................................................................... 147
6.2. The mitochondrial membrane potential ..................................................................... 148
7. Proteomic Analysis .............................................................................................................. 150
7.1. Sample preparation ..................................................................................................... 150
7.2. Shut-gun Proteomics (EDyP Platform)......................................................................... 150
Results & Discussion ............................................................................................................................ 155
Chapter I. Characterization of the radiosensitizing effects of AGuIX .............................................. 157
1. Determining the optimal radiosensitizing conditions of AGuIX® nanoparticles on SQ20B J.L.
cells 161
1.1. Assessing of the concentration and media parameters .............................................. 161
1.2. Increasing the incubation time .................................................................................... 167
2. Toxicity study ....................................................................................................................... 172
11
2.1. Proliferation assay: % confluency measurements by IncuCyte ................................... 172
2.2. Cell viability: Trypan Blue assay ................................................................................... 173
2.3. Mitochondrial activity: MTT assay............................................................................... 173
3. Subcellular localization of AGuIX® in SQ20B J.L. cells .......................................................... 174
3.1. With respect to the nucleus ........................................................................................ 174
3.2. With respect to mitochondria ..................................................................................... 175
3.3. With respect to lysosomes .......................................................................................... 177
3.4. Kinetic study of the internalization of AGuIX® by confocal microscopy: 1h-2h-4h-6h,
with respect to the lysosomes ................................................................................................ 178
Chapter II. Study of the Oxidative Stress Induced by the combined treatment of AGuIX® + I.R. and
its functional consequences on mitochondria ................................................................................ 181
1. Study of the oxidative stress (mitochondrial and cytosolic reactive oxygen species) induced
by the the combined treatment of AGuIX® + I.R.......................................................................... 183
1.1. Cytosolic Radical Oxygen Species (cROS) .................................................................... 183
1.2. Mitochondrial ROS (mROS) ......................................................................................... 184
2. Kinetic study of the mitochondrial membrane potential (Ψm) after AGuIX® + I.R. ............. 185
3. Study of the mitochondrial DNA (mtDNA) common deletion after AGuIX® + I.R. ............... 186
4. Radiosensitization after the addition of DMF/BSO treatment ............................................ 188
4.1. Quantification of the endogenous GSH content in SQ20B cells .................................. 188
4.2. Comparative study of cytosolic ROS produced with or without the addition of
DMF/BSO ................................................................................................................................. 189
4.3. Comparative study of mitochondrial ROS produced with or without the addition of
DMF/BSO ................................................................................................................................. 192
5. Studying the effect of DMF/BSO treatment on the clonogenic survival assay ................... 193
Chapter III. Study of the different types of cellular deaths induced by the combination of AGuIX® +
I.R. .................................................................................................................................................... 195
1. Apoptosis, Necrosis, and Mitotic Catastrophe .................................................................... 197
1.1. Total Caspases activation ............................................................................................ 197
1.2. Annexin V/P.I. .............................................................................................................. 199

12
1.3. Study of the cell cycle .................................................................................................. 200
2. Kinetic study of senescence ................................................................................................ 203
2.1. p16 ............................................................................................................................... 203
2.2. p21 ............................................................................................................................... 204
3. Kinetic study of autophagy .................................................................................................. 205
Chapter IV. Study of the DNA-damage induced by AGuIX® combined with radiation ................... 209
1. Detection of DNA single-strand-breaks (SSBs) and DNA oxidative damage ....................... 211
2. Quantitative measurement of 8-oxo-guanine by HPLC-MS/MS ......................................... 212
3. Detection of DNA double-stranded breaks (DSBs) ............................................................. 212
3.1. Initial (30 min) and residual (24h) γH2Ax after 2 Gy irradiation ................................. 213
3.2. Kinetic study of the formation and repair of DSBs ...................................................... 215
Chapter V. Shotgun/Bottom-up Proteomics study: preliminary experiments ................................ 219
1. Analysis of proteins with a fold-change ≥ 1.2 (over-expression) or ≤0.8 (under-expression)
using the DAVID software ........................................................................................................... 222
1.1. DAVID Software Analysis ............................................................................................. 222
1.2. IPA Analysis .................................................................................................................. 232
2. Analysis of proteins with a fold change of 5X over or under-expressed: the identification of
16 modulated proteins ................................................................................................................ 235
Conclusion & Perspectives .................................................................................................................. 255
Résumé Français .................................................................................................................................. 261
Bibliography References ...................................................................................................................... 273
Annexes ............................................................................................................................................... 323
Annex 1: The DNA damage response pathways and its inhibitors. Ongoing clinical trials and targets.
......................................................................................................................................................... 325
Annex 2: AGuIX® synthesis and characterization during the synthesis .......................................... 326
Annex 3: Media composition of HBSS, PBS Ca2+/Mg2+, and DMEM-GlutamaxTM ............................ 329
Oral and Poster Communications ................................................................................................... 331

13
List of Figures
Bibliography Review
Figure 1: HNSCC sites.
Figure 2: Frequently dysregulated pathways in HNSCC.
Figure 3: Signaling pathways activated following ligand binding of EGFR.
Figure 4: Mechanism of action of Cetuximab or Gefinib.
Figure 5: Possible mechanisms of resistance to EGFR-targeted therapy in HNSCC.
Figure 6: The complex signaling cascade at the cellular level in HNSCC with potential points
of therapeutic targets.
Figure 7: Radiation induces changes to the tumour cell immunophenotype.
Figure 8: Representation of the Photoelectric effect.
Figure 9: Representation of the Compton effect.
Figure 10: Representation of pair production.
Figure 11: Relative importance of the three effects as a function of the incident photon’s
energy and the atomic number of the target.
Figure 12: Direct vs. indirect effect following ionizing radiation.
Figure 13: Schematic representation of the indirect effect of ionizing radiation.
Figure 14: Types of DNA damage induced by ionizing radiation.
Figure 15: Oxidation of guanine following ionizing radiation.
Figure 16: Potential fates of the cell at the cell cycle checkpoint.
Figure 17: ATM and ATR regulate the S/G2 cellular response to DNA damage.
Figure 18: Schematic representation of the base excision repair pathway (BER).
Figure 19: Overview of homologous recombination (HR) and non-homologous end
joining(NHEJ).
Figure 20: Schematic representation of existing and future radiosensitizing strategies.
Figure 21: Different approaches for enhancing radiation efficacy with nanotechnology.
Figure 22: Cascade for nanomaterial characterization.
Figure 23: Total number of publications (Web of Science®) and clinical trials
(clinicaltrials.gov) during the last 10 years.
Figure 24: Schematic illustration of established nanotherapeutic platforms.
Figure 25: Representation of the enhanced permeability retention effect.
Figure 26: Mechanism of action following the interaction of high-energy photons with a
quantum dot.
Figure 27: Different types of gold nanoparticles and their applications.
Figure 28: T1-weighted MRI images of the brain of a 9LGS-bearing rate before and 5, 20, and
45 minutes after intravenous injection of GBNs.

14
Figure 29: Schematic representation of the physical, chemical, and biological phases
following the interactions of X-rays with heavy metal nanoparticles.
Figure 30: Schematic representation of AGuIX® nanoparticles.
Figure 31: a. Comparison of photon mass energy absorption coefficients for gadolinium and
soft tissues. b. Illustration of nanoscale effects around irradiated AGuIX® gadolinium
nanoparticles.
Figure 32: T1-weighted image of a slice, including a kidney (K) and bladder (B) of a mouse
before (t=0), 5 min after and 60 min after intravenous injection of AGuIX® nanoparticles.
Figure 33: In vivo imaging of AGuIX nanoparticles in kidneys.
Figure 34: Time of the study protocol for the first in Man NANORAD-Phase I.
Figure 35: Pipeline of clinical trials with AGuIX®.
Figure 36: Effects of ionizing radiation on different subcellular compartments.
Figure 37: Production of ROS and their evolution.
Figure 38: Increased ROS in cells will modify cellular signaling pathways which in turn will
promote cell survival, growth, and proliferation which leads to tumorigenesis.
Figure 39: Schematic representation of the mtDNA and the delimitation of the common
deletion.
Figure 40: Evolution of tumorigenicity as a function of mitochondrial DNA mutations.
Figure 41: Representation of the ROS levels in three different cell states alongside with the
main ROS generators and ROS scavengers.
Figure 42: Balance of ROS and anti-oxidants in normal and cancer cells.
Figure 43: Ionizing radiation (I.R.)-induced cell deaths.
Figure 44: Different signaling pathways activated following radiation-induced apoptosis.
Figure 45: In-vitro and in-vivo observations following autophagy induced by radiation.
Figure 46: Radiation-induced autophagic triggers.
Materials & Methods
Figure 47: Characterization of AGuIX® nanoparticles.
Figure 48: Photo of the interior of the X-ray irradiator.
Figure 49: Interior of the IncuCyte apparatus.
Figure 50: Confocal spinning-disk microscope.
Figure 51: LSR II BD Biosciences and the computer for acquisition.
Figure 52: Representative graphs of total caspase analysis in flow cytometry (LSRII).
Figure 53: Representative graphs of Annexin/P.I. in flow cytometry (FACSCalibur).
Figure 54: Schematic representation of a cell cycle in flow cytometry.
Figure 55: Schematic representation of the three different steps for the preparation of the
gel for Western-Blot.
Figure 56: AmershamTM ECLTM RainbowTM Marker-Full Range, GE Lifesciences Ref RPN800E;
BIO-RAD ChemiDOcTM XRS.

15
Figure 57: The Metafer platform used for γH2AX analysis along with the microscope.
Figure 58: Photograph of the HPLC coupled to a MS/MS for the detection of the 8-oxo-
guanine.
Figure 59: Schematic representation of trypsin digestion of proteins.
Figure 60: Schematic representation of nano-Liquid Chromatography followed by Mass
Spectroscopy MS/MS.
Figure 61: Following nanoLC MS/MS, amino acids are determined from the spectra, and
using bioinformatics tools, proteins are identified.
Figure 62: Photos representing the equipment used for the Proteomics study.
Results & Discussion
Chapter I: Characterization of the radiosensitizing effect of AGuIX®
Figure 63: Chemical structures of Gd-DTPA (linear) versus Gd-DOTA (cyclic) chelating agents.
Figure 64: Survival fraction at 4Gy varying concentration from 0-3 mM Gd in HBSS media.
Figure 65: Clonogenic survival assay 0-8 Gy following a 1h AGuIX® treatment in HBSS media
at 1.5 mM Gd.
Figure 66: Survival fraction at 4Gy varying concentration from 0-3 mM Gd in PBS Ca2+/Mg2+
media.
Figure 67: Clonogenic survival assay 0-8 Gy following a 1h AGuIX® treatment in PBS
Ca2+/Mg2+ media at 1mM Gd.
Figure 68: Survival fraction at 4Gy varying concentration from 0-3 mM Gd in serum-free
DMEM-Glutamax media.
Figure 69: Clonogenic survival assay 0-8 Gy following a 1h AGuIX® treatment in serum-free
DMEM-Glutamax media.
Figure 70: Quantity of gadolinium internalized by SQ20B J.L. cells as a function of treatment
time (1-4-12-24 hours of exposure to AGuIX® treatment) in serum-free DMEM-Glutamax
(0.8mM Gd) quantified by ICP-AES.
Figure 71: Survival fraction at 4Gy at 0.8mM Gd following different AGuIX® treatment times
(1h-4h-12h-24h).
Figure 72: Clonogenic survival assay 0-10 Gy following a 24h AGuIX® treatment in serum-free
DMEM-Glutamax at a concentration of 0.8mM Gd.
Figure 73: Clonogenic survival assay 0-6 Gy following a 24h AGuIX® treatment in full media at
a concentration of 0.8mM Gd.
Figure 74: Proliferation assay measuring the percentage confluency using the IncuCyte Live
Cell Analysis.
Figure 75: Percentage viability using the blue trypan assay.
Figure 76: Percent (%) proliferation measured by the MTT assay.
Figure 77: Three separate planes of the localization of AGuIX®-Cya5.5 nanoparticles in SQ20B
J.L. cell line in respect to the nucleus with a confocal spinning-disk microscope.

16
Figure 78: Three separate planes of the localization of AGuIX® nanoparticles in SQ20B J.L. cell
line with respect to mitochondria with a confocal spinning-disk.
Figure 79: Three separate planes of the localization of AGuIX® nanoparticles in SQ20B J.L. cell
line in respect to lysosomes with a confocal spinning-disk microscope.
Figure 80: Kinetic study (1-2-4-6 hours) of the localization of AGuIX® nanoparticles in SQ20B
J.L. cell line in respect to lysosomes with a confocal spinning-disk microscope.
Chapter II: Study of the Oxidative Stress Induced by the combined treatment of AGuIX® + I.R.
and its functional consequences on mitochondria.
Figure 81: Kinetic study of cellular ROS (cROS) production, 0 minutes to 120 hours after a 10
Gy irradiation measured by flow cytometry as a function of the mean fluorescence intensity.
Figure 82: Kinetic study of mitochondrial ROS (mROS) production, 0 minutes to 120 hours
after a 10 Gy irradiation measured by flow cytometry as a function of the mean fluorescence
intensity.
Figure 83: Kinetic study 24-240 hours post-irradiation of the percentage drop in the
mitochondrial membrane potential (Ψm) depending on the treatment conditions.
Figure 84: Deleted mtDNA/total mtDNA ratio for SQ20B J.L. cells following different
treatment conditions.
Figure 85: Glutathione (GSH) concentration (µmol/l) measured in SQ20B J.L. cells with or
without DMF/BSO treatment.
Figure 86: Example of a flow cytometry CM-H2DCFDA analysis.
Figure 87: Kinetic study (0-72 hours) of cellular ROS (cROS) measured by the LSRII flow
cytometer (BD Biosciences) using the CM-H2DCFDA assay, normalized to the non-treated
non-irradiated cells.
Figure 88: Kinetic study (0-72 hours) of mitochondrial ROS (mROS) measured by the LSRII
flow cytometer (BD Biosciences) using the Mitosox assay, normalized to the non-treated
non-irradiated cells.
Figure 89: Example of a flow cytometry Mitosox analysis.
Figure 90: Clonogenic survival assay 0-10 Gy for SQ20B J.L. cells, with various treatment
protocols; +/- AGuIX® and +/- DMF/BSO.
Chapter III: Study of the different types of cellular deaths induced
by the combination of AGuIX + I.R.
Figure 91: Representative graphs at 10 days after irradiation of flow cytometry analysis
measuring the fluorescence intensity of Alexa Fluor 488.
Figure 92: Kinetic study of apoptosis from 24 hours to 10 days following a 10 Gy irradiation in
SQ20B J.L. cells using the CaspACETM FITC-VAD-FMK kit to observe the activation of total
caspases following the different treatment conditions.

17
Figure 93: Representative graphs of Annexin/P.I. in flow cytometry (FACSCalibur); the x-axis
represents the cells marked by Annexin V-FITC; while the y-axis represents Propidium Iodide
marked cells.
Figure 94: Kinetic study of apoptosis versus necrosis in SQ20B J.L. cells using the Annexin/P.I.
kit the cellular death pathways after the different treatment conditions.
Figure 95: Representative graphs of the cell cycle analysis using the Diva Software analysis
after flow cytometry.
Figure 96: Kinetic study of the different stages of the cell cycle after a 10 Gy irradiation.
Figure 97: p16 protein expression analysis via Western Blot.
Figure 98: p21 protein expression analysis via Western Blot.
Figure 99: LC3B protein expression analysis via Western Blot.
Chapter IV: Study of the DNA-damage induced by AGuIX® combined with radiation
Figure 100: Kinetic study of single-strand breaks (-FPG) and oxidative damage (+FPG)
following a 4 Gy irradiation +/- AGuIX® expressed in terms of the mean % tail intensity.
Figure 101: Initial (30 minutes) and residual (24 hours) γH2Ax per nucleus after 2Gy
irradiation +/- AGuIX®.
Figure 102: Representative nuclei depending on the treatment conditions and the time post-
irradiation.
Figure 103: Distribution classes of the number of foci/nucleus as a function of the number of
nucleus included in the class: irradiated only cells (2Gy) versus AGuIX® + irradiated cells
(0.8mM Gd 2Gy).
Figure 104: Kinetic study (0-0.5-1-2-4-6-24 hours) of foci γH2Ax after a 2 Gy irradiation
depending on the different treatment conditions.
Chapter V: Preliminary results of the proteomic study of 0mM Gd 10Gy
versus 0.8mM Gd 10Gy at T=24H after I.R.
Figure 105: Summary of the raw data obtained following shot-gun proteomics for SQ20B J.L.
cells and how the analysis can be done.
Figure 106: Modulated proteins in the metabolic pathways, with 15 genes being affected.
Figure 107: Illustration of the mitochondrial Electron Transport Chain (ETC) where oxidative
phosphorylation occurs.
General Discussion
Figure 108: Molecular-targeted therapies in development for the treatment of head and
neck squamous cell carcinoma.
Figure 109: ROS levels in normal versus cancer cells.

18
Figure 110: Effects of efficient or deregulated autophagy in cancer development.
Figure 111: Autophagosome and autolysosome formation.
Conclusion & Future Perspectives
Figure 112: Schematic representation of results obtained following irradiation versus
irradiation + AGuIX® treatment.
Résumé Français
Figure 113: Effet radiosensibilisant des AGuIX et leurs localisations subcellulaires.
Figure 114: Etude cinétique (0-72h) des RLO cytosolique (RLOc) mesurée en cytométrie de
flux.
Figure 115: Augmentation de la mort cellulaire par autophagie suite au traitement combine
(AGuIX® + irradiation).
Figure 116: Mesure des cassures doubles brins de l’ADN (γH2Ax).

19
List of Tables
Bibliography Review
Table 1: Selected milestones in the history of chemotherapy for HNSCC.
Table 2: Food and Drug Administration-Approved Systemic Agents in the treatment of
HNSCC.
Table 3: Selected clinical studies with TKI for HNSCC treatment.
Table 4: Selected clinical immunotherapy trials in HNSCC patients.
Table 5: The photoelectric vs. Compton effect.
Table 6: Number of lesions per Gray per nucleus depending on the type of DNA damage.
Table 7: Polymer-based nanocarriers in clinical trials.
Table 8: Ongoing clinical trials with NBTXR3 (hafnium oxide nanoparticles) as radiosensitizing
agent in several different cancer types.
Table 9: Summary of in vitro studies using gold nanoparticles as radiosensitizers.
Table 10: Summary of in vivo studies using gold nanoparticles as radiosensitizers.
Table 11: Studies of radiosensitizing effect of AGuIX® in various cellular models.
Table 12: Determination of the Maximum Dose Tolerated (MDT) of AGuIX® in non-tumor
bearing Mice after a Single IV injection.
Materials & Methods
Table 13: Seeding concentrations of SQ20B J.L. cells for the clonogenic cell survival assay
depending on the treatment conditions.
Table 14: List of proteins of interest studied by Western Blot analysis with references and
protocol details.
Table 15: Corresponding chosen primers.
Results & Discussion
Chapter I: Characterization of the radiosensitizing effect of AGuIX®
Table 16: The log K’ value and the Ktherm constants for the ligand and different elements
found in the body depending on the ligand type: DTPA versus DOTA.
Table 17: Kobs values and T1/2 for DTPA and DOTA chelating agents.
Table 18: Summary of parameters evaluating the radiosensitizing effect of AGuIX® at 1.5mM
Gd in HBSS.

20
Table 19: Summary of parameters evaluating the radiosensitizing effect of AGuIX® at 1mM
Gd in PBS Ca2+/Mg2+.
Table 20: Summary of parameters evaluating the radiosensitizing effect of AGuIX® at 0.8mM
Gd in serum-free DMEM-Glutamax.
Table 21: Calculated Enhanced Biological Response at 4Gy for the four different incubation
times at 0.8mM Gd in serum-free DMEM-Glutamax.
Table 22: Summary of parameters evaluating the radiosensitizing effect of the addition of
AGuIX® for 24 hours at 0.8mM Gd in serum-free DMEM-Glutamax.
Table 23: Summary of parameters evaluating the radiosensitizing effect of the addition of
AGuIX® in full media.
Chapter II: Study of the Oxidative Stress Induced by the combined treatment of AGuIX® + I.R.
and its functional consequences on mitochondria
Table 24: Calculated survival fractions at different irradiation doses (0-10 Gy) depending on
the different treatments (+/- AGuIX® and +/- DMF/BSO).
Table 25: Summary of parameters evaluating the radiosensitizing effect of the addition of
AGuIX® and/or DMF + BSO.
Chapter IV: Study of the DNA-damage induced by AGuIX® combined with radiation
Table 26: Quantitative measurement by HPLC-MS/MS of 8-oxo-guanine DNA damage
expressed in terms of 8-oxodGuo/106 bases for different time points post-irradiation
dependent on the treatment conditions.
Chapter V: Preliminary results of the proteomic study of 0mM Gd 10Gy
versus 0.8mM Gd 10Gy at T=24H after I.R.
Table 27: Modulated genes within the metabolic pathways.
Table 28: Modulated genes in the carbon metabolism.
Table 29: Modulated genes in the citrate cycle (TCA Cycle).
Table 30: Modulated genes in the oxidative phosphorylation.
Table 31: Modulated genes in the glycolysis/gluconeogenesis pathway.
Table 32: Modulated mitochondrial genes.
Table 33: Modulated proteins with an oxidoreduction function.
Table 34: List of the 23 modulated proteins associated with clathrin-mediated endocytosis
signaling.
Table 35: List of the 22 modulated proteins associated with NRF2-mediated oxidative stress
response.
Table 36: List of proteins with an over- or under- expression of at least 5 times with its
cellular localization.

21
List of Abbreviations
•NO: nitric oxide
5-FU: Fluorouracil
8-oxo-G: 8-oxo-guanine
ADP: Adenosine Diphosphate
AgNPs: silver nanoparticles
AGuIX®: Activation and Guidance of
Irradiation by X-ray
AKT (PKB): Protein Kinase B
ANSM: Agence National de Sécurité du
Médicament et des produits de santé
APAF1: Apoptotic Peptidase Activating
Factor 1
ATM: Ataxia Telangectasia Mutated
ATP: Adenosine Triphosphate
ATR: Ataxia Telangectasia mutated and
Rad3 related
AuNPs: Gold nanoparticles
Bax: Bcl2 Associated X
BCA: Bicinchonic Acid
Bcl-2: B-cell lymphoma 2
Bcl-Xl: B-cell lymphoma-extra large
BER: Base Excision Repair
BSO : L-buthionine sulfoximine
CD95: Cluster of Differentiation 95
Cdc2: Cell-division cycle protein 2
CDKs: Cyclin-Dependent Kinases
CHKs: Checkpoint Kinases
CL: Cardiolipin
cROS: cytosolic Reactive Oxygen Species
CSCs: Cancer Stem Cells
CT: Computed Tomography
CTLA-4: Cytotoxic T-lymphocyte-
associated Protein 4
Cya5.5: cyanine 5.5
D: Dose
DAPI: 4’,6’-diamidino-2-phenylindole
DAVID: Database for Annotation,
Visualization, and Integrated Discovery
DD: Death Domain
DEF: Dose Enhancement Fraction
del mtDNA: deleted mitochondrial DNA
DISC: Death Inducing Signaling Complex
DLS: Dynamic Light Scattering
DMEM : Dulbecco’s Modified Eagle
Medium
DMF : Dimethylfumarate
DMSO: Dimethyl sulfoxide
DNA: Deoxyribnucleic acid
DNA-PK: DNA-dependent Protein Kinase
DOTA: 1,4,7,10-tetraazacyclododecane-
1,4,7,10-tetraacetic acid
DOTAREM: gadoterate muglumine
DR5: Death Receptor 5
DSBs: Double-Strand Breaks
DTPA: Diethylenetriaminepentaacetic acid
dTTP: desoxythymide triphosphate
EBR: Enhanced Biological Response
EcOG: Eastern Cooperative Oncology
Group
EDTA: Ethylenediaminetetraacetic acid
EDTA-Na2: Disodium
ethylenediaminetetraacetate dihydrate
EGFR: Epidermal Growth Factor Receptor
EPR: Enhanced Permeability Retention
ER: Endoplasmic Reticulum
ERK: Extracellular signal-Regulated Kinases
ETC: Electron Transport Chain
FADD: Fas-Associated Death Domain
FCS: Fetal Calf Serum
FDA: Federal Drug Administration
FFF: Flattening Filter Free
FITC: Fluorescein isothiocyanate

22
FOXO3a: Forkhead box protein O3
FPG: FormamidoPyrimidine [fapy]-DNA
Glycosylase
GBM: Glioblastoma Multiforme
GBNs: Gadolinium-Based Nanoparticles
G-CSF: Granulocyte-Colony-Stimulating
Factor
Gd: Gadolinium
Gd2O3: Gadolinium oxide
GPX: Glutathione Peroxidase
GRX: Glutaredoxin
GSH: Reduced glutathione
GSH: Glutathione
GSSG: Oxidized glutathione
Gy: Gray
H2O2: hydrogen peroxide
HBSS: Hank’s Balanced Salt Solution
HCl: Hydrochloric acid
HIF-1α: Hypoxia-Inducible Factor 1α
HNSCC: Head and Neck Squamous Cell
Carcinoma
HO•: Hydroxyl
HO2•: Perhydroxyl
HPLC MS/MS: High-performance Liquid
Chromatography-Mass spectrometry
HPV: Human Papillomavirus
HR: Homologous Recombination
I.R.: Ionizing Radiation
ICP-AES: Inductively Coupled Plasma-
Atomic Emission Spectrometry
ICP-OES: Inductively Coupled Plasma-
Optical Emission Spectrometry
IgG1: Immunoglobulin G1
IgG2a: Immunoglobulin G2a
IMRT: Intensity-Modulated Radiation
Therapy
IPA: Ingenuity Pathway Analysis
IV: intravenous
JAK: Janus kinase
JC-1: 5’,5’, 6, 6’-tetrachloro-1, 1’, 3, 3’-
tetraethylbenzimidazolycarbocyanine
iodide
JNK: c-Jun N-terminal Kinase
keV/MeV: kilo electron-volt (energy unit)
L: Ligand
LAMP-2: Lysosomal-Associated Membrane
Protein-2
LC3: microtubule-associated protein
1A/1B-Ligh chain 3
LET: Linear Energy Transfer
M: Metal
mAb: monoclonal antibody
MAPK: Mitogen-Activated Protein kinases
MDA: Malondialdehyde
MDM2:human Murine Double Minute 2
MDT: Maximum Dose Tolerated
MgCl2: Magnesium chloride
MHC: Major Histocompatibility Complex
ML: complex Metal/Ligand
MMP: Matrix metalloprotease
MnSOD (SOD2): superoxide dismutase
Mn-dependent
mPTP: mitochondrial Permeability
Transition Pore
MRI: Magnetic Resonance Imaging
mROS: mitochondrial Reactive Oxygen
Species
mtDNA : mitochondrial DNA
mTOR: Mammalian Target Of Rapamycin
MTT: 3-(4,5-dimethylthiazol-2-yl)-2,5-
diphenyltetrazolium bromide
NAC: N-acetyl Cysteine
NaCl: Sodium chloride
NADPH: Nicotinamide adenine
Dinucleotide Phosphate
NaI: Sodium Iodide
nanoLC MS/MS
NaOH: Sodium hydroxide
nDNA : nuclear DNA

23
NEM: N-ethylmaleimide
NER: Nucleotide Excision Repair
NFκB: Nuclear Factor-kappa B
NHEJ: Non-Homologous End-Joining
NHP: Non-Human Primates
NOS: Nitric Oxide Synthase
NOX: NADPH Oxydase
NOXA: Latin for damage
NPs: Nanoparticles
NSCLC: Non-Small-Cell Lung Cancer
O2•−: Superoxide anion
ONOO−: Peroxynitrite anion
P.I.: Propidium Iodide
PARP: Poly(ADP-Ribose) Polymerase
PBS : Phosphate-Buffered Saline
PCR: Polymerase Chain Reaction
PD-L1: Programmed Death-Ligand 1
PE : Plating Efficiency
Pep: Peptide
PFA: Paraformaldehyde
pg: picogram
PI3K: Phosphatidylinositol-3-Kinase
PLGA: Poly(Lactic-co-Glycolic Acid)
PRDX : Peroxiredoxins
PTEN: Phosphatase and TENsin homolog
PUMA: p53 upregulated modulator of
apoptosis
QDs: Quantum Dots
R•: organic radicals
RAD 51: Recombinase RAD51
RIP: Receptor-Interacting Protein
RO2•: alkoxy radical
RO2•: peroxyl radicals
ROOH : hydroperoxides
ROS: Reactive Oxygen Species
RT: Radiation Therapy; RT: Room
Temperature
S : Survival
SAPKs: Stress-Activated Protein Kinases
SC: Spectral Count
SCC: Specific Spectral Count
SDS: Sodium Dodecyl Sulfate
SER: Sensitivity Enhancement Ratio
SF4Gy : Survival Fraction at 4Gy
SIRT1: Sirtuin 1
SPIONS: SuperParamagnetic Iron Oxide
Nanoparticles
SR-DUV: Super resolution-deep ultraviolet
SSBs: Single-Strand Breaks
STAT: Signal Transducer and Activator of
Transcription
TCF4: Transcription Factor 4
TEM: Transmission Electron Microscope
TGF-β: Transforming Growth Factor β
TiONts: Titanate Nanotubes
TKI: Tyrosine Kinase Inhibitors
TNF-α: Tumor Necrosis Factor-α
tot mtDNA: total mitochondrial DNA
Tris-HCl: Tris hydrochloride
UPR: Unfolded Protein Response
VEGF: Vascular Endothelial Growth Factor
VMAT: Volumetric Modulated Arc Therapy
WSC: Weighted Spectral Count
γGLU-GLU: Gamma glutamyl-glutamic acid

24

25
General Introduction

26

General Introduction
27
Head and Neck cancer belongs to one of the most prevalent cancers with the majority of
cases representing squamous cell carcinoma (SCC) arising in the stratified epithelium of the
oral cavity, pharynx, and larynx (Leemans et al, 2011). This group of cancer is known under
the common name of Head and Neck Squamous Cell Carcinoma (HNSCC), and is ranked
among the ten deadliest cancer worldwide due to its high radioresistance and recurrence,
which in turn leads to a 5-year survival rate less than 50%. The annual incidence of HNSCC is
around 600,000 new cases, frequently presented as locally advanced disease and accounts
for 350 000 deaths worldwide per year (Siegel et al., 2016). HNSCC therefore represents an
important health concern. Current treatment of HNSCC patients is based on the stage and
anatomic location, independent of the underlying biology, and consists in surgery,
chemotherapy, radiotherapy, or a combination of these different cancer treatments.
Although advancements in the therapeutic options, (in the delivery as well as in the
supportive care), have moderately improved the quality of life for patients, the risk of
regional and distant relapse is still high. Indeed, patients with recurrent or metastatic HNSCC
present an enhanced morbidity and a poor prognosis, with a median survival of ten months
(Sacco and Cohen, 2015). Thus, besides gaining insight into the molecular principles that
control the high incidence of local recurrence and distant metastasis, the development of
more effective and less toxic therapeutic modalities for the management of HNSCC is
needed and mandatory. Radiation therapy remains a crucial treatment modality, but rates of
therapeutic success is still unacceptable. The different mechanisms that contribute to the
radioresistance phenomena in HNSCC are numerous and complex, thus explaining why many
promising therapies have often failed during their evaluation in clinical trials.
In the vision of the development of new radiosensitizing strategies (increasing the dose
delivered to the tumor while sparing the healthy surrounding tissues), the field of
nanotechnology/nanomedicine is quite attractive and shows great promise. Indeed,
nanoparticles (NPs) composed of high-Z atoms, such as metallic (gold, platinum) and oxide
(hafnium, gadolinium) nanoparticles (NPs) have been proposed as potential nanodrugs to
amplify radiation-based therapies (Hainfeld et al., 2008; Porcel et al., 2010; Le Duc et al.,
2014). These are being presented as being new compounds able to improve both expected
aspects of innovative radiation-based therapies: specificity and efficiency. Results obtained
with various types of NPs showed that they can specifically increase the radiosensitivity of
tumor cells. Among these, gadolinium-based nanoparticles (GdBNs) have been designed,
which can act as multimodal agents and improve not only the therapeutic index of the
treatment, but also Magnetic Resonance Imaging (MRI) performance (theranostics) (Sancey
et al., 2014). In this study, we will use GdBNs named AGuIX® (Activation and Guidance of
Irradiation by X-rays) nanoparticles, which are ultrasmall (2-5 nm hydrodynamic diameter)
gadolinium-based nanoparticles. These nanoparticles are characterized by their high
colloidal stability and good Gd chelation, an absence of in vivo toxicity, a high EPR effect
(which means that they will preferentially accumulate in tumors due to the tumor’s leaky
vasculature, which will in turn increase the local dose inside the tumor while sparing the

General Introduction
28
healthy surrounding tissues), a good biocompatibility after IV injection, a facilitated renal
excretion and their potential use as a contrast agent for M.R.I., making AGuIX® a promising
theranostic agent (Sancey et al., 2014).
Although many groups have shown early evidence of the radiosensitizing potential of
AGuIX®, little is known about the subcellular mechanisms leading to the radiosensitization.
Up to now, a significant number of in vitro demonstrations of the radiosensitizing effect of
GBNs have been reported following different experimental conditions. These experimental
conditions varied in terms of the energy of irradiation from keV to MeV, different
concentrations of nanoparticles (from 0.1 to 1 mM) and times of incubation (from 1h to
24h), different types of tumor cell lines, as well as the nature of the irradiation (photons,
neutrons or ions) (Sancey et al., 2014). Indeed, several in vitro studies have demonstrated
the radiosensitizing effect of AGuIX® nanoparticles combined to photon irradiation in
glioblastoma cells (Štefančíková et al., 2016; Štefančíková et al., 2014), cervical carcinoma
HeLa cells (Luchette et al., 2014), HNSCC (Miladi et al., 2015), and prostate cancer cells (K.
Butterworth, personal communication). Apart from the work of Miladi et al. where the
involvement of mitotic catastrophe and late apoptosis was demonstrated in HNSCC (Miladi
et al., 2015), little is known about the subcellular effects of these GBNs, the organelles
involved in their radiosensitizing effect, as well as the connection between the physical,
chemical, and biological effects of GBNs. Moreover, although GBNs were never found to be
localized within nuclei (Rima et al., 2013), γ-H2AX or 53BP1 foci have been generally
quantified to reflect DNA double-strand breaks (DSBs) and contradictory results have been
reported with the same GBNs in different cell lines. While an increase of residual DSBs have
been demonstrated in HNSCC, 1h after treatment with GBNs combined to radiation (Miladi
et al., 2015), opposite results have been reported with AGuIX® in glioblastoma (Štefančíková
et al., 2016).
Given the variety of experimental conditions and cells involved in the studies mentioned
above, as well as for other high-Z NPs, it seems impossible that all induce the same cellular
response. Moreover, in the direction of a better understanding of the radiosensitization
process, the clonogenic survival curve assay cannot be the only way to probe the cellular
responses which therefore should be investigated in more details. This work has been
undertaken with AGuIX® containing DOTAGA as a macrocyclic Gd3+ chelate which is a more
stable and better chelator (Mignot et al., 2013) compared to the acyclic ligand DTPA that
could release toxic gadolinium (Rogosnitzky et al., 2016).
Despite AGuIX®’s potential to induce radiosensitization in cancer cells, there are several
challenges towards their clinical translation which has, to date, led to only a few clinical trials
being undertaken (NCT02820454: NANO-RAD and NCT03308607: NANOCOL).

General Introduction
29
The first objective of this work was to determine the radiosensitizing conditions of
AGuIX® in an HNSCC cellular model, SQ20B J.L. cells. Their subcellular localization was
studied by time-lapse confocal microscopy. The mechanism leading to the radiosensitization
with the combined treatment of AGuIX® treatment + ionizing radiation will then be studied
in terms of: (1) ROS production and the oxidative cellular state, (2) the types of cell deaths
involved and (3) the potential resulting DNA-damage. At last, a proteomic approach was
initiated in order to reveal potential targets and/or subcellular pathways involved after the
combined treatment. This work was therefore expected to better understand the
mechanisms of action mediating the biological effects of this new formulation of AGuIX® and
the potential subcellular targets in cells in order to move towards clinical applications in a
more robust way.

30

31
Bibliography Review

32

Bibliography Review Chapter I. Head and neck Squamous Cell Carcinoma
33
Chapter I. Head and Neck Squamous Cell Carcinoma
1. Generalities, Facts, and Statistics
Head and Neck Squamous Cell Carcinoma (HNSCC) is a very heterogeneous disease with
different sites as well as different histological characteristics. HNSCC represents all cancers
arising from the epithelium mucosa of the oral cavity, oropharynx, laryngopharynx, and
larynx.
Figure 1: HNSCC sites.
HNSCC represents a major worldwide health concern as it represents 12% of all
malignancies and is ranked as the eighth deadliest cancer. 650 000 new cases are diagnosed
each year and over 320 000 individuals die every year, ranking this type of cancer eighth
according to the World Health Organization. In France, it is the ranked the fourth most
common type of cancer and the fifth cause of cancer mortality. This type of cancer is known
to be caused by alcohol consumption, tobacco use, and more recently, the infection by the
Epstein-Barr virus and human papillomavirus (HPV) have also been found to be linked to this
type of cancer. HNSCC can be treated via surgery when possible, chemotherapy,
radiotherapy, or a combination of these different treatments, radiotherapy remaining the
most frequently used. However, improvements in survival rates for patients remain low as 5-
year survival of patients is still under 50% which is unacceptable. This bad prognostic is
mostly due to the resistance of the tumors to radiotherapy as well as its recurrence. It is
therefore mandatory to further investigate more efficient treatment options. (Jemal et al.,
2007; Boyle and Levin, 2008)

Bibliography Review Chapter I. Head and neck Squamous Cell Carcinoma
34
HNSCC are classified under the TNM system (T= size of primary tumor, N= degree of spread to
regional lymph nodes; M= presence of distant metastasis). However, as previously mentioned,
HNSCC tumors being very heterogeneous, this system lacks biological and molecular markers, which
leads to the same treatment for malignancies that are significantly different. This might, in part,
explain the low survival rates while the recurrence is high.
2. Frequently dysregulated pathways in HNSCC
In order to find more efficient treatments, much research has been focused on the
understanding of the molecular networks involved in head and neck carcinogenesis. Two
classes of genes are present in cells: oncogenes and tumor suppressor genes. It was shown
that for many cancer types, carcinogenesis mostly comes from an imbalance where
oncogenes will be overexpressed and therefore will promote cell proliferation (Hanahan and
Weinberg, 2011). Genetic and epigenetic alterations observed in HNSCC show a loss of
tumor suppressor function and aberrant gene and protein expression making HNSCC a
particularly radio-resistant type of cancer with a bad prognosis (Molinolo et al., 2010).
Genetic and epigenetic alterations observed in HNSCC include alterations leading to
dysplegia (abnormality of development, alteration in size, shape, and organization of cells)
(9p21, 3p21, 17p13), carcinoma in situ and invasive tumors (Forastiere et al., 2001, Califano
et al., 1996). Several known tumor suppressor genes have been highlighted in HNSCC
including p16 and p14ARF. Loss of the chromosomal region 9p21 is found in 70-80% of
dysplastic lesions of the oral mucosa, which together with the inactivation of the remaining
alleles of p16 and p14ARF by promoter hypermethylation, represent one of the earliest and
most frequent events in HNSCC progression (Molinolo et al., 2009; Forastiere et al., 2001;
Califano et al. 1996).
One of the characteristics of cancer cells is their ability to replicate endlessly. In HNSCC, it
has been shown that this proliferative property is linked to the genetic and epigenetic
inactivation of p16, the mutation of p53 and an enhanced activity of telomerase (Todd et al.,
2002). The inactivation of p16 in HNSCC tumors allows cells to bypass the “replicative stress-
induced senescence”, while the enhanced telomerase activity prevents the shortening of the
telomeres and the consequent generation of signals from uncapped telomeres that impinge
on p53 and other molecules involved in the DNA-damage response (Collado et al., 2007;
Molinolo et al., 2009).
Nearly 50% of HNSCC cases have mutations in the p53 tumor suppressor gene (Poeta et
al., 2007; Boyle et al., 1993). p53 can halt the cell’s progress in the cell-cycle if it detects
DNA-damage and therefore can trigger apoptosis if the detected DNA damage is not
repaired. However, this tumor suppressor gene is often mutated in most human cancers.
Therefore, in HNSCC, mutations rendering p53 inactive are associated with tumor
progression and decreased overall survival (Poeta et al., 2007). If p53 does not present point
mutations, it can also be inactivated by its ubiquitin-dependent degradation (Molinolo et al.,

Bibliography Review Chapter I. Head and neck Squamous Cell Carcinoma
35
2009; Vousden and Lane, 2007). Infection by HPV will also bring in a new mechanism in
which p53 is inactivated and is unable to play its tumor suppressor role. The following can
therefore be responsible for a reduced activity of p53 including: the infection with HPV16
and/or HPV18, the overexpression of MDM2, or the inactivation of p14ARF (Molinolo et al.,
2009; Vousden and Lane, 2007). This therefore leads to further accumulate unchecked
alterations due to inappropriate cellular response to DNA damage.
Aberrant gene and protein expression in HNSCC include members of the Wnt and Notch
family which have been shown to be involved in tumor progression of HNSCC (Leethanakul
et al., 2000). Altered expression of genes involved in cell signaling, gene transcription, cell
cycle regulation, oncogenesis, tumor suppression, differentiation, motility and invasion have
also been reported in HNSCC (Leethanakul et al., 2000, Alevizos et al., 2001). Frequently
upregulated genes include the matrix metalloprotease (MMP) family members, such as
MMP-1, MMP-3, MMP-10, and MMP-12, pro-angiogenic chemokines, including IL8 (CXCL8)
and Gro-α (CXCL1) whereas down-regulated genes include KRT4, MAL, SPINK5, and TGM3
(Ye et al, 2008; Ziober et al., 2006). Using proteomics analysis, several dysregulated, over- or
under-expressed, proteins in HNSCC were identified such as heat shock proteins HSP60 and
HSP27, calgranulin B, myosin, tropomyosin, and galectin 1 in tongue carcinoma tissues (He et
al., 2004).
The Epidermal Growth Factor Receptor (EGFR) is overexpressed in 80-90% of all HNSCC
tumors (Grandis and Tweardy, 1993). Overexpression of EGFR represents an independent
prognostic marker and can correlate with increased tumor size, increased radioresistance,
and increased risk of occurrence (Grandis and Tweardy, 1993; Ang et al. 2002; Gupta et al.,
2002). This overexpression is due to gene amplification with more than 12 copies per cell
found in HNSCC (Temam et al., 2007). Examples of pathways activated via EGFR includes the
Ras/Raf/mitogen protein kinase (MAPK), the transducer and activator transcription (STAT),
and the phosphatidylinositol-3-kinase (PI3K)/AKT/mammalian target of rapamycin (mTOR)
pathway, all these leading to the malignant growth and metastatic potential of HNSCC
(Molinolo et al., 2009). The over-expression of EGFR and its consequences will be further
discussed in the paragraph entitled targeted therapies.
Another factor in HNSCC cancer growth is the aberrant activity of the transcription factor
NFκB. NFκB was shown to be, in part responsible in the treatment resistance of HNSCC
tumors as its dysregulation promotes tumor angiogenesis and metastasis, and suppresses
the pro-apoptotic potential of chemotherapeutic drugs and radiotherapy (Karin et al., 2005;
Nakanishi and Toi, 2005). In HNSCC, the expression and activity of NFκB is often upregulated,
and its protein level increases gradually from pre-malignant lesions to invasive cancer
(Ondrey et al., 1999, Mishra et al., 2006; Sawhney et al., 2007; Bindhu et al., 2006), which
suggests that NFκB signaling plays an important role at the early stages of HNSCC
Bibliography Review Chapter I. Head and neck Squamous Cell Carcinoma
36
carcinogenesis. In fact, NFκB promotes the expression of the anti-apoptotic protein Bcl-2 in
HNSCC (Jordan et al., 1996).
In summary, as described above, several dysregulated signaling pathways in HNSCC were
highlighted that could have a therapeutic interest as diagnostic markers and/or potential
therapeutic targets including:
✓ the activation of the signal transducer and activator of transcription (STAT) proteins
✓ the Wnt protein family
✓ the transforming growth factor-β (TGF-β) (dual role in carcinogenesis: acts as a
potent tumor suppressor during the early stages while it would promote tumor
growth at later stages) (Prime et al., 2004)
✓ the aberrant function of the phosphatidylinositol 3-kinase (PI3Ks), PTEN, AKT and
mTOR signaling network
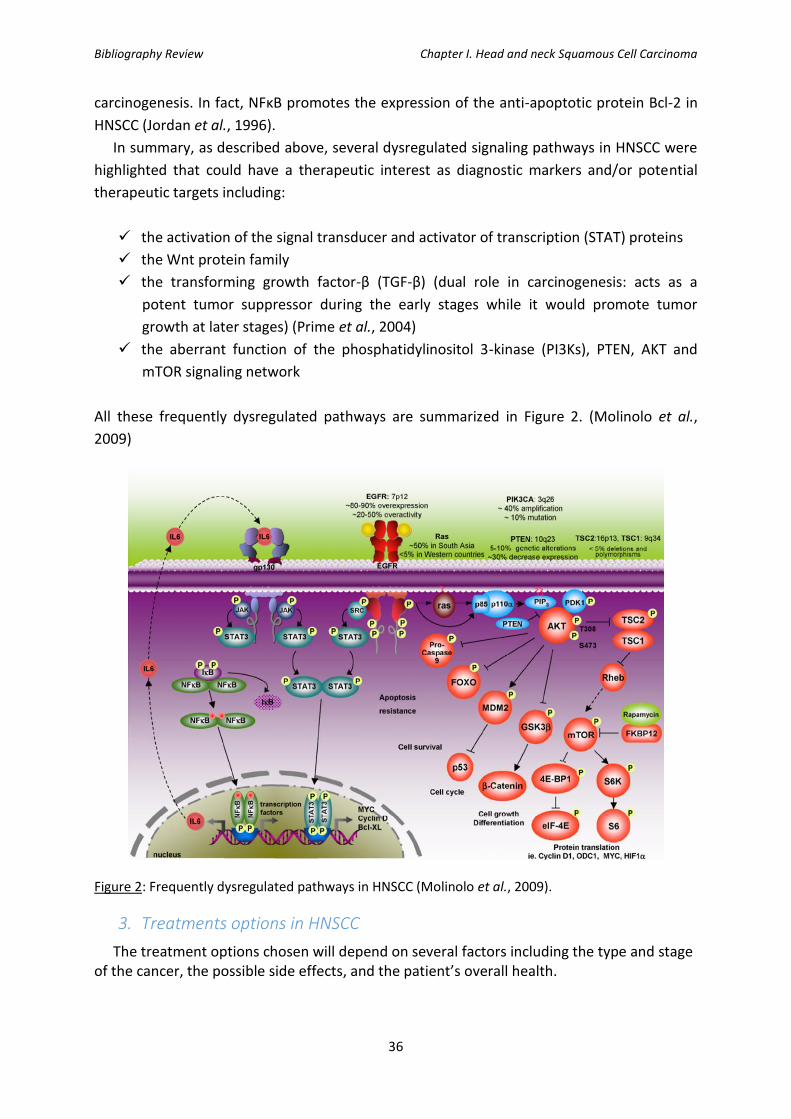
All these frequently dysregulated pathways are summarized in Figure 2. (Molinolo et al.,
2009)
Figure 2: Frequently dysregulated pathways in HNSCC (Molinolo et al., 2009).
3. Treatments options in HNSCC
The treatment options chosen will depend on several factors including the type and stage of the cancer, the possible side effects, and the patient’s overall health.

Bibliography Review Chapter I. Head and neck Squamous Cell Carcinoma
37
3.1. Surgery
Surgery is the oldest type of cancer therapy and remains one of the most effective
treatments as it removes the cancerous tumor and some surrounding healthy tissue (in
order to make sure that no cancer is left). Surgery in cancer treatment can take multiple
forms:
- Laser technology: can be used to treat early-stage tumors, especially when it was
found in the larynx.
- Excision (most commonly used) which removes the tumor as well as a small part of
the surrounding healthy tissue.
- Lymph node dissection or neck dissection: when the cancer has spread
- When cancer has spread in a large part and therefore requires major tissue removal
(i.e. removal of the jaw, skin, pharynx, or tongue), reconstructive (plastic) surgery can
be performed in order to replace the missing tissue. This allows the patient to
recover his/her appearance as well as the function of the affected area.
Often, one surgery is not sufficient and the patient will be further treated with chemo
and/or radiotherapy in order to destroy the remaining cancerous cells.
Although surgery might be thought of as the therapy with the most “positive” outcome,
there are still several side effects dependent on the location and type that cannot be ignored
in particular: temporary or permanent loss of normal voice, impaired speech, hearing loss,
difficulty in chewing and swallowing, swelling of mouth and throat area, difficulty breathing
and facial disfigurement. Also, if total laryngectomy, patients may have decreased
functioning of the thyroid gland (which will need to be managed).
3.2. Chemotherapy
Chemotherapy is defined as the use of drugs to destroy cancer cells, usually by stopping
the cancer cell’s ability to grow and divide. However, one of its major drawbacks is that the
majority of the drugs used in chemotherapy do not specifically target cancer cells but all cells
that divide rapidly. Systemic chemotherapy, usually delivered by IV injection or swallowing
of a pill or capsule, gets into the bloodstream to reach cancer cells throughout the body. Side
effects of chemotherapy include fatigue, risk of injection, nausea and vomiting, hair loss, loss
of appetite, and diarrhea.
Depending on the administered mode of chemotherapy, we can define four different
types of chemotherapies including simultaneous, adjuvant, palliative, or inductive
neoadjuvant chemotherapy.
Induction chemotherapy is employed as the primary treatment for cancer therapy that will
be followed by another approach such as surgery or radiotherapy. Such a treatment allows

Bibliography Review Chapter I. Head and neck Squamous Cell Carcinoma
38
to give a first evaluation of the tumor’s response to treatment: if a patient responds to
inductive chemotherapy, it means that the tumor is sensitive to the treatment and
therefore, the next step will be radiotherapy. If not, there is a probability of non-response to
radiotherapy which will direct towards surgery. The use of cisplatin in combination with
taxanes and Fluorouracil (5-FU) seemed up to now to be most efficient (Vermorken et al.,
2007; Qin et al., 2012). However, it appears that this type of approach does not result in a
significant increase in the time of survival nor in the locoregional control of the tumor.
Simultaneous or concomitant chemotherapy uses chemotherapeutic agents in combination
with radiotherapy. The chemotherapy treatment can be used as mono-therapy where
cisplatin is mostly used, whereas in poly-chemotherapeutic treatments, the combination of
platin salts (cisplatin or carboplatin) with 5-FU are commonly used. Concomitant
chemotherapy has shown benefits compared to radiotherapy alone (Pignon et al., 2009).
Concomitant chemotherapy allows the preservation of healthy organs with a decrease of
laryngectomies for example (Forastière et al., 2003) as well as an increased survival that is
significant when comparing to patients treated with radiotherapy alone (+ 6% at 5 years)
(Pignon et al., 2009).
Adjuvant chemotherapy allows for the treatment of residual tumors by chemotherapy +/-
radiotherapy after surgery and/or following a radiotherapy treatment. Two studies showed
a better efficacy of adjuvant chemotherapy used with radiotherapy after surgery including a
better locoregional control and a significant increase of the 5-year survival of patients
(Bernier et al., 2004; Cooper et al., 2004).
With palliative chemotherapy, the aim is a little different than other types of chemotherapy,
as the main goal is to increase the patients’ life with a particular attention in improving the
patients’ quality of life. In this case, mono- or multiple-therapies are mostly used, including
treatment with methotrexate, platin salts, 5-FU, taxanes, or anti-EGRF antibody.
Platinum derivatives are the most widely used and effective drugs in HNSCC. Cisplatin, a
planar heavy-metal complex, targets DNA and will form different kinds of DNA adducts
including 1,2-intrastrand cross-links, inter-strand cross-links, monofunctional adducts, or
protein-DNA cross-links. A study showed including 288 patients with recurring and
metastasized HNSCC, showed that monotherapy of cisplatin had an average remission rate
of 28% (Al-Sarraf, 1987). Another agent under the same category is carboplatin. Although
this molecule showed a more favorable nephrotoxic, ototoxic, and emetogenic profile, it was
more myelotoxic (Canetta et al., 1985). However, higher concentrations of carboplatin,
compared to cisplatin, are needed to have the same effect on DNA.
Methotrexate is another compound used in HNSCC showing promising results as it
blocked tumor growth. It blocks the formation of tetrahydrofolic acid because of its high

Bibliography Review Chapter I. Head and neck Squamous Cell Carcinoma
39
affinity for dihydrofolic acid reductase, a co-enzyme for C1-metabolism during the synthesis
in the G1 phase (Hoffmann, 2012).
5-FU, developed by Heidelberger et al., exists since 1957 following an observation that
the uracil base was used more often in tumoral DNA synthesis. It is believed that following
intra-cellular nucleotide metabolism, 5-FU blocks the key enzyme, thymidylate synthase,
which leads to a reduction of desoxythymide triphosphate (dTTP), a preliminary product of
DNA synthesis(Sommer and Santi, 1974). In addition, it appears that it acts on RNA synthesis
by blocking it (Hoffmann, 2012). If used as a monotherapy in HNSCC, 5-FU only improved
remission rate by 15% which is rather low (Al-Sarraf, 1987). Therefore, a combination with
cisplatin is important to observe important therapeutic benefits (Armand and Couteau,
1995).
Mitomycin C is an antibiotic used as a chemotherapeutic agent. This drug inserts itself
between the two strands of DNA therefore causing irreversible damage triggering cytotoxic
signaling cascades. It can either be used as a monotherapy or in combination with 5-FU. It
can also be used in combination with radiotherapy and it will increase the outcome
compared to radiotherapy alone (Budach et al., 2005).
Taxanes (paclitaxel, docetaxel) are also employed for their cytostatic properties. Taxanes
will block cell division and therefore tumor growth by inhibiting the spindle apparatus.
Docetaxel monotherapy in HNSCC has a good response rate of 42% (Dreyfuss et al., 1996).
Promising remission rates were obtained when combining taxanes with 5-FU and a platin,
salt but toxicity can be an issue when administered as induction therapy (Posner et al., 2007,
Vermorken et al., 2007).
Other chemotherapeutic drugs used in HNSCC include bleomycin, which binds specifically
to guanine and cleaves single and double strands of DNA (Muller and Zahn, 1976);
vincristine, which binds to tubulin and therefore inhibits the polymerization to microtubule
therefore inducing the cell the a metaphasic arrest (Madoc-Jones and Mauro, 1968). Last,
other more rarely used compounds include ifosfamide, gemcitabine, pemetrexed and oral
etoposide… (Hoffmann, 2012)
Table 1 shows selected milestones in the history of chemotherapy specifically for the
treatment of HNSCC while Table 2 shows FDA-approved chemotherapeutic agents for the
treatment of HNSCC.

Bibliography Review Chapter I. Head and neck Squamous Cell Carcinoma
40
Year (Study) Advances
1965 (Rosenberg et al.) Michigan State University researchers discover platinum-based compounds can impact cell division (precursor to cisplatin).
1970 (Ansfield et al.) Trials at University of Wisconsin demonstrate increased survival with 5-FU-based concurrent chemoradiation in advanced oral/oropharyngeal HNSCC.
1977 (Wittes et al.) Memorial Sloan Kettering reports “major response” rate of 30% in recurrent HNSCC patients receiving platinum-based chemotherapy.
1982 (Kish et al.) Trials at Wayne State University show improved survival with combination 5-FU/cisplatin therapy compared with single-agent therapy in advanced HNSCC.
1991 (VA Laryngeal Cancer Group) Induction chemotherapy followed by radiation shown to be equivalent to surgery followed by radiation in advanced laryngeal cancer, allowing for “organ preservation.”
2004 (RTOG 9501 and EORTC 22931 trials) Improved locoregional control demonstrated in high-risk patients receiving postoperative concurrent chemoradiation.
2006 (Bonner et al.) Cetuximab-based chemoradiation is superior to radiotherapy alone, becoming the first targeted therapy used in HNSCC.
2016 (KEYNOTE-012 and CheckMate 141 trials)
Efficacy of immune checkpoint inhibitors pembrolizumab and nivolumab demonstrated in recurrent/metastatic HNSCC.
5-FU= 5-fluoracil; CheckMate 141 = Trial of Nivolumab vs. Therapy of Investigator’s Choice in Recurrent or Metastatic Head and Neck Carcinoma; EORTC = European Organization for Research and Treatment of Cancer; KEYNOTE-012 = Study of Pembrolizumab (MK-3475) in Participants With Advanced Solid Tumors; HNSCC = head and neck squamous cell carcinoma; RTOG = Radiation Therapy Oncology Group; VA = Veteran Affairs.
Table 1: Selected milestones in the history of chemotherapy for HNSCC (Blasco et al., 2017)

Bibliography Review Chapter I. Head and neck Squamous Cell Carcinoma
41
Agent Mechanism Year of
Approval Indication Important Trials
Methotrexate Antimetabolite 1959 Advanced HNSCC Hertz et al., 1956
Hydroxyurea Inhibits DNA synthesis
1967 Concurrent chemoradiation in locally advanced HNSCC
Argiris et al., 2003
Bleomycin Induces DNA damage
1973 Advanced HNSCC Ichikawa, 1968
Cetuximab EGFR inhibitor 2006
Concurrent chemoradiation in locally advanced HNSCC; combination chemotherapy in recurrent/metastatic HNSCC
Bonner et al., 2006, Vermoken et al., 2008
TPF Combination chemotherapy
2006 Induction in unresectable locally advanced HNSCC
Vermoken et al., 2007, Posner et al., 2007
Pembrolizumab PD-1 inhibitor 2016 Recurrent/metastatic HNSCC Seiwert et al., 2016
Nivolumab PD-1 inhibitor 2016 Platinum-refractory recurrent/metastatic HNSCC
Ferris et al., 2016
EGFR = epidermal growth factor receptor; HNSCC = head and neck squamous cell carcinoma; PD-1 = programmed death protein 1; TPF = docetaxel/displatin/5-fluorouracil.
Table 2: Food and Drug Administration-Approved Systemic Agents in the treatment of HNSCC (Blasco et al., 2017).
Further discussion on cetuximab, a targeted therapy and chemotherapeutic drug
frequently used in HNSCC will be discussed later in a dedicated paragraph.
3.3. Radiotherapy
Radiation therapy is the use of high-energy X-rays or other particles to destroy cancer
cells. A radiotherapy treatment plan is established which usually consists of a specific
number of treatments given over a set period of time. Radiotherapy treatment plan in
HNSCC consists of 2Gy irradiation 5 times a week for 7 weeks, for a total dose of 70Gy. In the
case of HNSCC, radiotherapy can be the unique treatment or it can be used as adjuvant
therapy, for example after surgery in order to destroy the remaining cancerous cells which
were not removed by the surgery.
The most common type of radiotherapy used is external-beam radiation therapy
(radiation delivered by a machine outside of the body). Radiotherapy has majorly improved
since its invention and a specific type of external-beam radiation therapy is intensity-
modulated radiation therapy (IMRT) which uses advanced technology to accurately direct
the beams of radiation at the tumor while minimizing the field to the healthy tissues.
Side effects of radiotherapy are numerous and include tooth decay, short- or long-term
pain or difficulty swallowing, changes in voice because of swelling and scarring, loss of
appetite, redness or skin irritation in the treated area, fatigue, nausea, hearing loss … In
order to reduce these side effects, new techniques and protocols to improved radiotherapy

Bibliography Review Chapter I. Head and neck Squamous Cell Carcinoma
42
protocols have been proposed including accelerated fractioning, hyperfractionation,
intensity-modulated radiation therapy (IMRT), volumetric modulated arc therapy (VMAT), or
tomotherapy.
✓ Accelerated fractioning: the dose of radiation treatment is delivered on a shorter period
of time, so that cancer cells have less time to repair radiation-induced damages.
✓ Hyperfractionation: the dose of radiation is delivered in fraction throughout the day in
order to reduce the amount of radiation received at once, therefore allowing healthy
cells to better recover, while limiting the time for cancer cells to recover. This will
indeed limit the late side effects caused by radiotherapy. This type of therapy showed a
better overall 5-year survival in patients following their treatment (8% gain) but without
improving the locoregional control (Bourhis et al., 2006)
✓ Intensity-modulated radiation therapy (IMRT): This irradiation mode allows for a more
precise radiation dose to the 3-D shape of the tumor by modulating the intensity of the
radiation in multiple small volumes. It also allows higher radiation doses to be focused
to regions within the tumor while minimizing the dose to surrounding normal critical
structures. Treatment is carefully planned by using 3-D computed tomography (CT) or
magnetic resonance (MRI) images of the patient in conjunction with computerized dose
calculations to determine the dose intensity pattern that will best conform to the tumor
shape. Typically, combinations of multiple intensity-modulated fields coming from
different beam directions produce a custom radiation dose that maximizes tumor dose
while also minimizing the dose to adjacent healthy tissues. Toxicity due to the
treatment is reduced, even when the doses are increased. This type of radiation is
mostly used to treat prostate cancer, head and neck, and the central nervous system. It
can also be used in breast cancer, thyroid, lung, gastrointestinal, gynecologic
malignancies and certain types of sarcomas, and can also be beneficial for treating
pediatric malignancies.
✓ Volumetric modulated arc therapy (VMAT): Advanced form of IMRT, delivers a
precisely-sculpted 3D dose distribution with a 360-degree rotation of the gantry in a
single or multi-arc treatment. VMAT can deliver the total dose to the tumor in a 360-
degree rotation in less than two minutes.
✓ Tomotherapy: Type of IMRT, also called helical tomotherapy. The radiation is focused
on the tumor from many different directions as the accelerator is coupled to a scanner
in order to visualize the tumor “in real-time”. This enables the delivery of a high dose to
the tumor, by always doing a maximum to spare the healthy tissue in proximity.
However, radiotherapy alone still results in poor local control and survival owing to the
radio-resistance of HNSCC tumors which leads to their recurrence.

Bibliography Review Chapter I. Head and neck Squamous Cell Carcinoma
43
The interaction of X-ray with matter will be further discussed in the next chapter which is
specific to radiotherapy.
3.4. Targeted therapies
Novel therapies giving alternatives to chemotherapy and/or radiotherapy are arising to
mainly counter the many side effects that patients face when receiving such treatments as
well as improve their quality of life. Chemotherapy and radiotherapy, although much
progress has been done, do not only target tumor cells but can also cause damage to healthy
cells. Therefore, increasing interest was focused on targeted therapies. These therapies are
called as such because the molecule used specifically targets a certain molecule/target of the
cancer cell. Several examples exist targeting different pathways and will be developed in the
following paragraphs.
A special focus, because more commonly used in HNSCC, is the development of a
monoclonal antibody against the Epidermal Growth Factor Receptor (EGFR) which is
Cetuximab, and was approved for use by the FDA in 2006.
Figure 3: Signaling pathways activated following ligand binding of EGFR. (Hoffmann, 2012)
As can be observed in Figure 3, following ligand binding to the EGFR, intracellular and
nuclear cellular signaling cascades are activated, which leads to a conformational change and
auto-phosphorylation of EGFR. This is followed by the consecutive activation of signaling
pathways leading to tumor-cell proliferation, survival, and metastasis. Inhibition of this
ligand binding or receptor phosphorylation has been a new therapeutic approach in HNSCC
(Hoffmann, 2012).

Bibliography Review Chapter I. Head and neck Squamous Cell Carcinoma
44
3.4.1 Development of drugs (monoclonal antibodies) targeting the overexpression of
EGFR
The overexpression of EGFR is one of the main causes for decreased overall survival due
to its role in cancer cell survival. The epidermal growth-factor receptor has many roles
including proliferation, differentiation, anti-apoptotic signaling, angiogenesis, and
metastasis. Expression of EGFR is found in 90% of HNSCC cancer cases, and it is used as an
independent prognostic marker as high expression is associated with increased tumor size,
decreased radiation sensitivity, and increased risk of recurrence.
After studying the overexpression of EGFR as a potential target to specifically target
tumors, two main categories of molecules of key importance were identified (Figure 4):
- Monoclonal antibodies (i.e. cetuximab, panitumumab)
- Tyrosine kinase inhibitors (i.e. gefitinib and erlotinib)
Figure 4: Mechanism of action of cetuximab (monoclonal antibody) or gefinib (tyrosine kinase inhibitor) (Graham et al., 2004).
3.4.1.1 Cetuximab
Cetuximab is a chimeric (human/mouse) monoclonal antibody against EGFR that received
FDA approval for recurrent and metastatic HNSCC, as well as for locally advanced HNSCC.
Many clinical trials were put in place in order to see the effects and the possibilities of
bettering cancer therapy using cetuximab. One of the pioneering studies was done in
patients with locally advanced HNSCC without a primary surgical treatment option, where
two treatments were compared: cetuximab combined with radiotherapy versus
radiotherapy alone. When comparing radiotherapy alone to radiotherapy + cetuximab, an

Bibliography Review Chapter I. Head and neck Squamous Cell Carcinoma
45
increase in the median survival time by 19.7 months (49.0 vs. 29.3 months) was observed for
I.R. + cetuximab. An increase in the median time to loco-regional failure by 9.5 months (24.4
vs, 14.9 months) was also observed (Hoffmann, 2012; Bonner et al., 2006; Bonner et al.,
2010). No benefits were seen for patients at the T4 or N0 stage, those who had a poor
Karnosfsky index, nor for those who were over 65 years of age (Hoffmann, 2012). Several
Phase III trials are underway to study the interaction of radiotherapy with cetuximab (RTOG-
0920; GORTEC2007-01, and GORTEC2007-02).
Following the many clinical trials, cetuximab/Erbitux® + radiation therapy was registered
for the treatment of patients with advanced HNSCC in 2006, and in 2008, it was also
approved in combination with first-line chemotherapy for patients with recurrent/metastatic
HNSCC. In summary, Erbitux® (cetuximab) can be prescribed with radiation therapy for the
initial treatment of certain types of locally or regionally advanced head and neck cancer.
Erbitux® can also be used in combination with platinum-based chemotherapy with 5-FU for
patients whose tumor has returned in the same location or spread to other parts of the
body. Additionally, Erbitux® is approved for the use alone to treat patients whose tumor has
returned in the same location or spread to other parts of the body and whose disease has
progressed following platinum-based chemotherapy1.
A couple of other monoclonal antibodies were developed including matuzumab, a
humanized EMD72000, a version of IgG1 with an elongated half-life (Bier et al., 2001),
panitumumab and zalutumumab, which are two completely humanized antibodies, IgG2a
and IgG1 respectively. All four antibodies bind to the EGFR with a higher affinity than the
endogenous ligands, which therefore prevents the dimerization, internalization, and auto-
phosphorylation. Preclinical studies have shown an inhibition of the proliferation and the
induction of apoptosis in the tumor. Also, some interest has been turned towards the
combination of anti-EGFR antibodies with taxanes (Hoffmann, 2012).
However, one problem still remains, and that is the : intrinsic and acquired drug
resistance. According to Boeckx et al. (2013), “many HNSCC tumors remain nonresponsive to
EGFR targeting agents, as the response rate with such agents, as for instance cetuximab as a
single agent, is consistently lower than 15%”. Possible mechanisms of resistance to EGFR-
targeted therapy in HNSCC are illustrated in Figure 5.
1https://www.erbitux.com/

Bibliography Review Chapter I. Head and neck Squamous Cell Carcinoma
46
Figure 5: Possible mechanisms of resistance to EGFR-targeted therapy in HNSCC described: (1) overexpression of ligands, (2) activating mutations in EGFR, (3) translocation of EGFR to the nucleus, (4) loss of PTPRS, (5) activating Ras mutations, (6) downregulation of DUSP, (7) activating mutations in PIK3CA or inactivating mutation in PTEN, (8) activation of Src kinases, (9) dysregulation of the STAT pathway, (10) heterodimerization with other ErbB family members, (11) parallel signaling of other receptors, IGF-1R or MET, (12) overexpression of the Aurora kinase A and B, (13) deregulation of cyclin D1 or the A870G polymorphism, (14) loss of functional p53, and (15) activation of HIF-1 signaling. (Boeckx et al., 2013).
3.4.2 Anti-angiogenesis
In HNSCC, it was shown that a correlation exists between tumoral VEGF (Vascular
Endothelial Growth Factor) expression and tumor stage, vascular invasion, and survival.
Therefore, antibodies against VEGF are being developed (bevacizumab, Avastin®), as well as
tyrosine kinase inhibitors that attack intracellularly at the receptor domain
(sunitinib/sorafenib). (Hoffmann, 2012)
3.4.3 Signaling cascade inhibition
3.4.3.1 Tyrosine kinase inhibitors (TKIs)
It was shown that one main reason for resistance to drugs targeting EGFR was due to a
mutation such as EGFRvIII, which appears to be responsible for the constitutive activation of
the downstream signaling cascade. In order to overcome this resistance, new possibilities
targeting downstream signaling cascades have been shed to light. One such approach is

Bibliography Review Chapter I. Head and neck Squamous Cell Carcinoma
47
targeting the EGFR-associated tyrosine kinase. Table 3 summarizes selected clinical studies
using TKI for HNSCC treatment.
Study, phase Number of
patients Characteristics tumor Dosage Result
Gefitinib- selective EGFR inhibitor-
Cohen et al., 2005 II, monotherapy
70 Recurrent/metastatic 250mg/d OR 1.4%, PR 1, SD 23, OS 5.5 mo
Kirby et al. 2006 II, monotherapy
47 Recurrent/metastatic 500mg/d OR 4.3%, PR 4, SD 13, OS 4.3 mo
Stewart et al. 2009 III, monotherapy
486 Recurrent 250-500mg/d OS 5.6-6.0 mo
Erlotinib- selective EGFR inhibitor-
Siu et al. 2007, I/II, combination therapy + cisplatin
51 Recurrent/metastatic 100mg/d + Cisplatin (75mg/m2 3 w-1)
CR 1, PR 8, OS 7.9 mo
Soulieres et al. 2004 II, monotherapy
115 Recurrent/metastatic 150mg/d OR 21%, PR 5, SD 44, OS 6.0 mo
Lapatinib-dual tyrosine kinase inhibitor (EGFR, HEP2)-
Abidoye et al. 2006, II, monotherapy
42 Recurrent/metastatic with (A) or without (B) previous EGFR inhibitor
1500ng.d A: SD= 37%; TTP= 1.6 mo B: SD= 20%; TTP= 1.7 mo
Sorafenib-multi-kinase inhibitor-
Williamson et al. 2010 II, monotherapy
41 Recurrent/metastatic 2x400mg/d PR 1, OS 9.0 mo
Table 3: Selected clinical studies with TKI for HNSCC treatment (Hoffmann, 2012)
3.4.3.2 mTOR and other signaling molecules
Sirolimus/rapamycine (Rapamune®) inhibits a number of cytokine-mediated signal
transduction pathways via the complexation of the mTOR protein, a 282 kDa
phosphoinositide 3-kinase often activated in HNSCC. The deactivation of mTOR prevents
mTOR-dependent cell metabolism which in turn disrupts the cell cycle and inhibits cell
growth. Even though sirolimus is a novel treatment approach, studies in HNSCC are
currently limited to Phase I trials (Cohen et al., 2011; Hoffmann, 2012). Rapamycin
derivatives, such as everolimus, temsirolimus and forolimus, are potent mTOR inhibitors that
are more stable and soluble than rapamycin which would therefore make them more
attractive. Early clinical studies of these agents as monotherapy or in combination with
chemotherapy and chemo-radiotherapy have been initiated (Hoffmann, 2012).
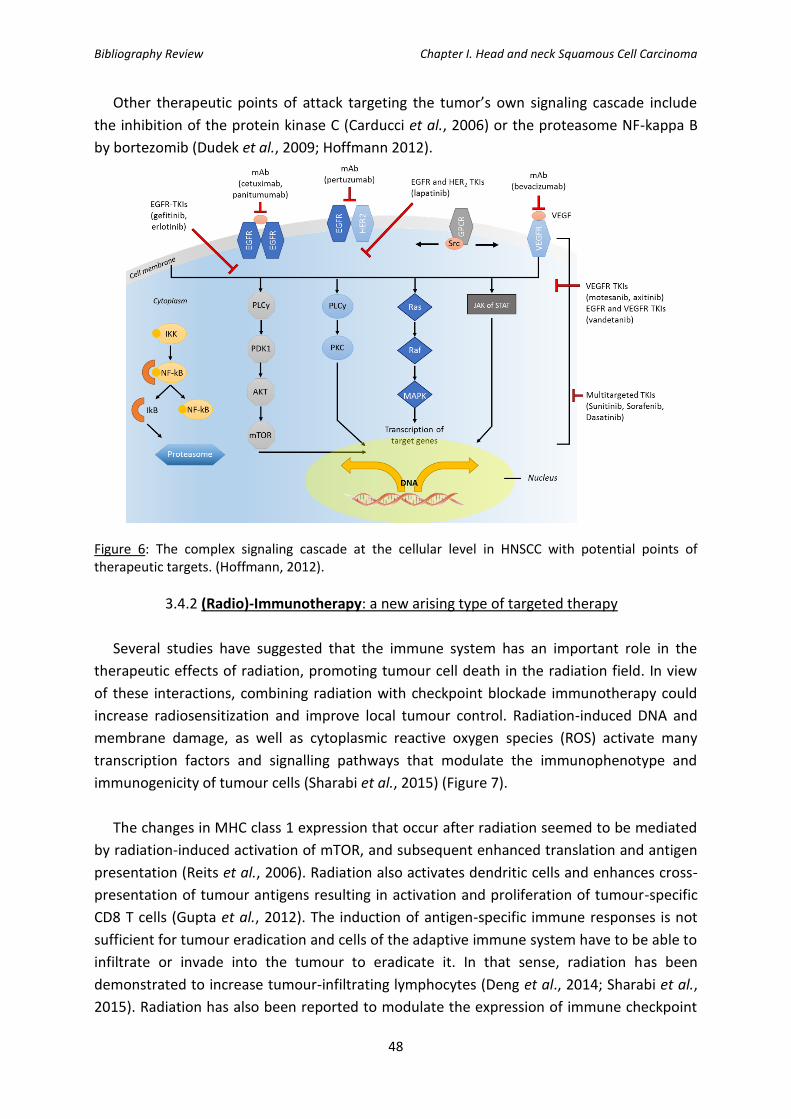
Bibliography Review Chapter I. Head and neck Squamous Cell Carcinoma
48
Other therapeutic points of attack targeting the tumor’s own signaling cascade include
the inhibition of the protein kinase C (Carducci et al., 2006) or the proteasome NF-kappa B
by bortezomib (Dudek et al., 2009; Hoffmann 2012).
Figure 6: The complex signaling cascade at the cellular level in HNSCC with potential points of therapeutic targets. (Hoffmann, 2012).
3.4.2 (Radio)-Immunotherapy: a new arising type of targeted therapy
Several studies have suggested that the immune system has an important role in the
therapeutic effects of radiation, promoting tumour cell death in the radiation field. In view
of these interactions, combining radiation with checkpoint blockade immunotherapy could
increase radiosensitization and improve local tumour control. Radiation-induced DNA and
membrane damage, as well as cytoplasmic reactive oxygen species (ROS) activate many
transcription factors and signalling pathways that modulate the immunophenotype and
immunogenicity of tumour cells (Sharabi et al., 2015) (Figure 7).
The changes in MHC class 1 expression that occur after radiation seemed to be mediated
by radiation-induced activation of mTOR, and subsequent enhanced translation and antigen
presentation (Reits et al., 2006). Radiation also activates dendritic cells and enhances cross-
presentation of tumour antigens resulting in activation and proliferation of tumour-specific
CD8 T cells (Gupta et al., 2012). The induction of antigen-specific immune responses is not
sufficient for tumour eradication and cells of the adaptive immune system have to be able to
infiltrate or invade into the tumour to eradicate it. In that sense, radiation has been
demonstrated to increase tumour-infiltrating lymphocytes (Deng et al., 2014; Sharabi et al.,
2015). Radiation has also been reported to modulate the expression of immune checkpoint

Bibliography Review Chapter I. Head and neck Squamous Cell Carcinoma
49
ligands, including PD-L1, on the surface of tumour cells and on immune cells in the tumour
microenvironment (Parikh et al., 2014). Many preclinical studies from several different
groups have reported substantial increases in locoregional tumour control when radiation is
combined with checkpoint blockade immunotherapy (Dovedi et al., 2014; Deng et al., 2014;
Yoshimoto et al., 2014) though it warrants further clinical investigation.
Figure 7: Radiation induces changes to the tumour cell immunophenotype (Sharabi et al., 2015).
In that sense, many murine studies have shown evidence for distant and persistent anti-
tumour effects, which are probably immune-mediated, after radiosensitizing
immunotherapy. The combination of radiation with anti-CTLA-4 antibodies was the first
assay (Demaria et al., 2005) that demonstrated a statistically significant improvement in
local tumour control on a metastatic breast carcinoma cell line. Recently, similar results were
obtained by Belcaid et al. (2014) using an orthotopic glioblastoma model to study the effects
of stereotactic radiation combined with anti-CTLA-4 antibody (Belcaid et al., 2014). Similar to
anti-CTLA-4, several preclinical reports have noted the synergistic effects of radiation and
anti-PD-1 immunotherapy on local control. Zeng et al (2013) used intracranial implantation
of a mouse glioma cell line and presented evidence for a long-term survival of mice that
received the combined treatment. In another study, Deng et al (2014) reported a significant
improved local tumour control when radiation was combined with anti-PD-L1 in mouse
models of breast and colorectal cancer (Zeng et al., 2013; Deng et al., 2014). All these results
suggest immunotherapy as the fourth pillar in cancer treatment alongside surgery,
chemotherapy, and radiation.
Bibliography Review Chapter I. Head and neck Squamous Cell Carcinoma
50
Immunotherapy is an arising treatment option that is being more and more studied for its
potential as a cancer therapy option: it would be designed to boost the body’s natural
defenses in order to fight off cancer. This mode of therapy is of particular interest as the
immune system plays a key role in the development of HNSCC, there is therefore a growing
number of studies focusing on immunotherapy for HNSCC. Table 4 shows a selection of
clinical immunotherapy trials in HNSCC patients.
FDA approved immunotherapeutic drugs
For recurrent or metastatic HNSCC patients (where the tumor does not respond to
chemotherapy), there are two immunotherapeutic drugs that were approved in 2016 which
are: pembrolizumab (Keytruda) which was approved by the FDA in August 2016, and
Nivolumb (Obdivo), which was approved in November 2016. Both are immune checkpoint
inhibitors. These two drugs were also approved for the treatment of certain patients that
have advanced lung cancer or melanoma.
Pembrolizumab is a monoclonal antibody anti-PD-1 (programmed death-1) which
potentiates the T-cells’ responses, including anti-tumoral responses.

Bibliography Review Chapter I. Head and neck Squamous Cell Carcinoma
51
Clinical trial title Phase Target Population
Pembrolizumab (MK3475) Versus standard treatment for recurrent or metastatic Head and Neck Cancer (MK-3475-040/KEYNOTE-040)
III PD-1 R/M HNSCC after platinum failure
A study of pembrolizumab (MK-3475) for first line treatment of recurrent or metastatic squamous cell cancer of the Head and Neck (MK-3475 048/KEYNOTE-048)
III PD-1 R/M HNSCC first line
Tolerance and efficacy of pembrolizumab or cetuximab combined with RT in patients with locally advanced HNSCC (PembroRad)
II PD-1 +
Irradiation Locally advanced HNSCC
Talimogene Laherparepvec with pembrolizumab for recurrent metastatic squamous cell carcinoma of the Head and Neck (MASTERKEY232)
I PD-1 +
oncolytic virus R/M HNSCC after platinum failure
Trial of Nivolumab vs Therapy of investigator’s choice in recurrent or Metastatic head and neck carcinoma (CheckMate 141)
III PD-1 R/M HNSCC after platinum failure
Study of Nivolumab in combination with Ipilimumab compared to the Standard of Care (Extreme Study Regimen) as First Line Treatment in Patients with recurrent or Metastatic Squamous Cell Carcinoma of the Head and Neck (CheckMate 651)
II PD-1/CTLA-4 R/M HNSCC first line
Safety study of Anti-LAG-3 with and without Anti-PD-1 in the treatment of solid tumors.
I PD1/LAG-3 R/M HNSCC immunotherapy naive
Study of MeDI4736 Monotherapy and in combination with tremelimumab versus standard of care therapy in patients with Head and Neck Cancer.
III PD-1/CTLA-4 R/M HNSCC after platinum failure
Table 4: Selected clinical immunotherapy trials in HNSCC patients (Fuereder, 2016).

Bibliography Review Chapter I. Head and neck Squamous Cell Carcinoma
52

Bibliography Review Chapter II. Radiotherapy
53
Chapter II. Radiotherapy
As seen in the previous chapter, radiotherapy is very often used as a treatment option in
HNSCC as an about 75% of patients with HNSCC will receive radiotherapy as their primary
treatment or as adjuvant therapy. The concept of radiotherapy is the use of ionizing (high-
energy) radiation in order to cause damages to cancer cells.
There are different types of radiations, of which not all are ionizing. Ionizing radiation is
defined as a radiation, (energy emitted from a source), made-up of particles with sufficient
energy to cause ionization when it encounters an atom in the medium through which it
passes through, as it can remove tightly bonded electrons from it, and the atom therefore
becomes charged.
The interaction of ionizing radiation with matter is characterized by the linear energy
transfer (LET) which represents the density of energy absorbed by matter and is dependent
on the distance travelled by the energy. LET is expressed in keV/µm and is represented by:
LET= dE/dl
Where: dE= the average energy transferred to matter,
dl: the distance travelled by the particle
The LET is dependent on two factors: the type of ionizing radiation and its energy. It is
important to note that the energy deposited is different than the energy emitted by the
source. The international unit used for ionizing radiation is Gray (Gy) which represents the
number of Joules deposited for 1kg of matter.
1. Interactions of ionizing radiations (photons) with matter
The physical interactions between matter and particles are of three types:
✓ Atoms’ ionization: if the energy of the incoming radiation is superior to the binding
energy of electrons present in the matter, the electron is pulled off from its
electronic cloud.
✓ Atoms’ excitation: if the energy is not sufficient to pull-off the electron, it can still be
sufficient to move the electron from its fundamental level to a level of higher energy,
the atom is then excited.
✓ Thermal transfer: if the energy is not sufficient to excite the atom, it can be high
enough to increase its kinetic energy of translation, rotation, and vibration, which is
all known under the term of thermal transfers.
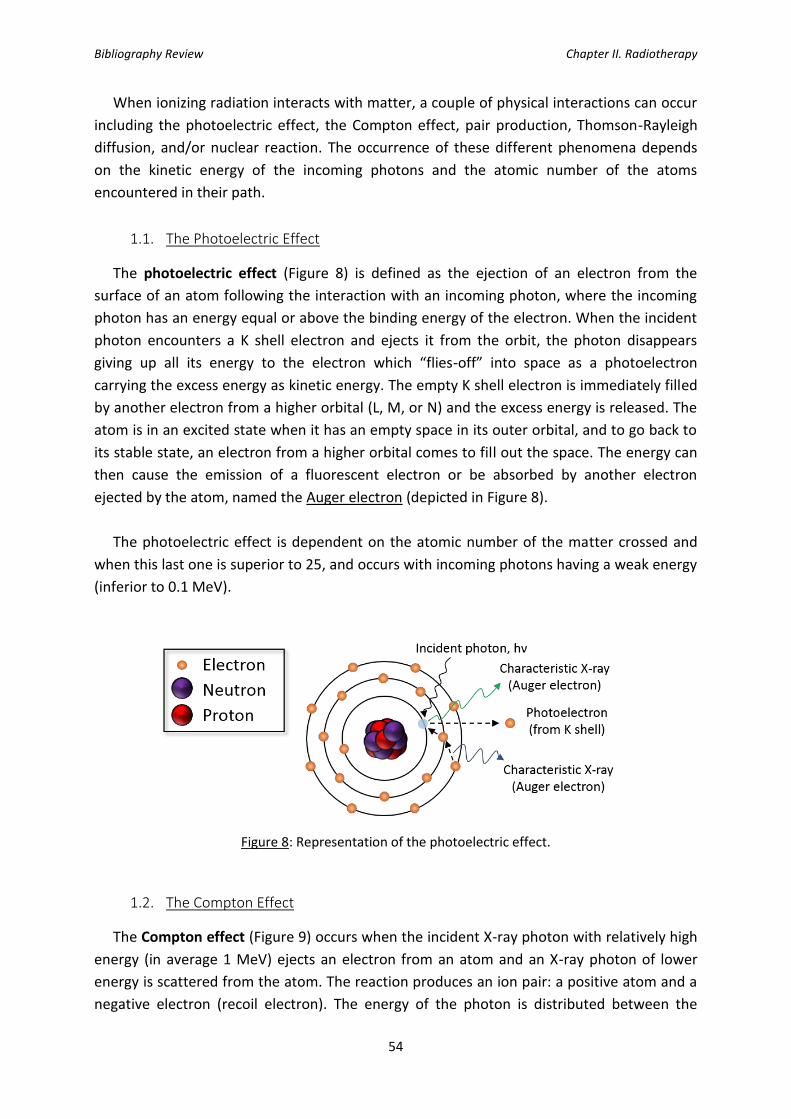
Bibliography Review Chapter II. Radiotherapy
54
When ionizing radiation interacts with matter, a couple of physical interactions can occur
including the photoelectric effect, the Compton effect, pair production, Thomson-Rayleigh
diffusion, and/or nuclear reaction. The occurrence of these different phenomena depends
on the kinetic energy of the incoming photons and the atomic number of the atoms
encountered in their path.
1.1. The Photoelectric Effect
The photoelectric effect (Figure 8) is defined as the ejection of an electron from the
surface of an atom following the interaction with an incoming photon, where the incoming
photon has an energy equal or above the binding energy of the electron. When the incident
photon encounters a K shell electron and ejects it from the orbit, the photon disappears
giving up all its energy to the electron which “flies-off” into space as a photoelectron
carrying the excess energy as kinetic energy. The empty K shell electron is immediately filled
by another electron from a higher orbital (L, M, or N) and the excess energy is released. The
atom is in an excited state when it has an empty space in its outer orbital, and to go back to
its stable state, an electron from a higher orbital comes to fill out the space. The energy can
then cause the emission of a fluorescent electron or be absorbed by another electron
ejected by the atom, named the Auger electron (depicted in Figure 8).
The photoelectric effect is dependent on the atomic number of the matter crossed and
when this last one is superior to 25, and occurs with incoming photons having a weak energy
(inferior to 0.1 MeV).
Figure 8: Representation of the photoelectric effect.
1.2. The Compton Effect
The Compton effect (Figure 9) occurs when the incident X-ray photon with relatively high
energy (in average 1 MeV) ejects an electron from an atom and an X-ray photon of lower
energy is scattered from the atom. The reaction produces an ion pair: a positive atom and a
negative electron (recoil electron). The energy of the photon is distributed between the

Bibliography Review Chapter II. Radiotherapy
55
kinetic energy of recoil electron and the energy retained by the deflected photon. There are
two factors that determine the amount of energy the photon transmits. First, it depends on
the initial energy (the higher the energy, the more difficult it is to deflect: high energy travel
straight retaining most of the energy while low energy scatter back at an angle of 180°). The
second factor is the angle of deflection, as the greater the angle, the less the energy is
transmitted. With a direct hit, maximum energy is transferred to the recoil electron. The
photon retains some energy and deflects back along its original path at an angle of 180°.
The probability of occurrence depends on the total number of electrons and the energy of
radiation.
Figure 9: Representation of the Compton effect.
The similarities and differences between the photoelectric and Compton effects are
summarized in the following table:
Photoelectric Effect Compton Effect
A low-energy phenomenon A mid-energy phenomenon.
Photon delivers its total amount of energy to a single electron.
The photon transfers part of its energy to a single electron.
The photon disappears after the interaction. The wavelength of the scattered photon is higher than that of the incident photon.
Table 5: The photoelectric vs. Compton effect.
1.3. Pair production
An electron (●-) and a positron (●+) with the same mass and energy as the incident
photon can be emitted from matter when the kinetic energy of the incoming photon is
greater than 1.02 MeV (representing twice the mass of an electron at rest) and interacts
with the atom’s nucleus (see Figure 10). The emitted electron and positron lose their energy
via ionization and excitation of the medium. The positron will undergo annihilation with a

Bibliography Review Chapter II. Radiotherapy
56
negative electron of the environment, therefore emitting two γ-photons with individual
energies of 0.511 MeV forming an angle of 180 degrees between them.
Figure 10: Representation of pair production.
The photoelectric effect, the Compton effect, and pair production are the three
predominant types of interactions that occur during a radiotherapeutic treatment with the
current photon energy used.
1.4. Thomson-Rayleigh diffusion
During the Thomson-Rayleigh diffusion, the incoming photon interacts with an electron
which will absorb the energy and re-emits the electron with the same energy in another
direction. However, it is important to note that this form of interaction does not occur often
with ionizing radiation as this phenomenon occurs with very weak energy photons, such as
those emitted in the specter of infrared, visible, and low-energy X-rays.
1.5. Nuclear reaction
A nuclear reaction will occur, as the name implies, when the incoming photon interacts
directly with the atom’s nucleus and there will be an emission of one or a few neutrons.
Again, this interaction occurs very rarely in radiotherapy, as the photon energy required for
this phenomenon to occur is quite high (greater than 10 MeV) which is very seldom used in
medicine.
1.6. Predominance of each effect
The occurrence of each effect is dependent on the energy of the incoming photons as
well as the atomic number of the elements present in the matter with which it will interact.
These phenomena are well represented in the figure below.

Bibliography Review Chapter II. Radiotherapy
57
Figure 11: Relative importance of the three effects as a function of the incident photon’s energy and the atomic number of the target: representation of the predominance of the photoelectric effect versus Compton effect versus pair production. A. Predominance of the different effects as a function of the absorbent type. B. Probability of having each physical effect as a function of the incident energy.
As previously mentioned, Thomson-Rayleigh diffusion is predominant in weak energy
irradiation, while the nuclear reaction will occur solely if the photons’ energy is very high.
These effects occur in “extreme” cases, which make therefore make them rare in the
medical field.
Therefore, the most predominant effects observed in the clinical field, are the
photoelectric effect and pair production: these two effects are even so more dependent on
the energy of the atomic number of the encountered matter. These interactions are
therefore important when the atomic number of atoms encountered is superior to 25. The
photoelectric effect is predominant in the case of low-energy photons (incident energy
inferior to 0.1 MeV), while pair production is predominant when the incoming energy is
superior to 10 MeV.
2. Biological effects of ionizing radiations: direct vs. indirect effect
In order to simplify the understanding of the biological interactions of ionizing radiation
with matter, we can distinguish two types of effects: direct and indirect. The subcellular
target of direct effects is mainly DNA. The incoming electrons will directly cause damage to
DNA, whereas the process goes through water radiolysis for indirect effects. These two types
of effects are further discussed in the next paragraphs.

Bibliography Review Chapter II. Radiotherapy
58
Figure 12: Direct vs. indirect effect following ionizing radiation. (Desouky et al., 2015)
2.1. Direct effect
Ionizing radiation can have an effect with matter through the direct interaction of the
electrons with cellular components: these molecules will therefore become excited or
ionized. Radiation directly hits DNA, modifying its molecular structure. In order for the
molecules to go back to their stable form, they will either release a photon of fluorescence
or a rupture of a chemical covalent bond will occur and highly reactive species will appear.
Electrons as well as these species will highly react with the cell’s DNA. This interaction
therefore leads to cell damage or even cell death if the cell is unable to repair the damage.
2.2. Indirect effect: water radiolysis
As cells are mainly composed of water (about 80%), an indirect effect can occur when the
incoming radiation first interacts with the water molecules within cells (water radiolysis: see
Figure 13). Following this interaction, free radicals will be produced, mainly hydroxyl (HO•)
and alkoxy (RO2•) (Jordan and Sonveaux, 2012). Free radicals are very highly reactive species
that interact with DNA molecules and disrupt its structure. Hydrogen peroxide, H2O2, is also
produced and is known to be toxic to cells, more so to DNA molecules.
These free radicals can also interact with other cellular organelles, such as mitochondria
or other cellular constituents such as proteins, lipids, and will therefore cause damage to the
cell.

Bibliography Review Chapter II. Radiotherapy
59
Figure 13: Schematic representation of the indirect effect of ionizing radiation. A. Water radiolysis. B. Subsequent reactions following water radiolysis. C. DNA damage. D. Damage fixation. (Jordan and Sonveaux, 2012).
3. DNA Damage induced by ionizing radiations and DNA damage repair
3.1. DNA damage
Following ionizing radiation, multiple DNA lesions can occur including base modifications,
oxidative lesions, abasic sites, DNA-protein cross-link, single and double strand breaks.
Figure 14 shows the different types of DNA damage that can occur while Table 6 shows the
number of lesions caused by 1 Gray irradiation per nucleus.
Figure 14: Types of DNA damage induced by ionizing radiation. (Lomax et al., 2013)

Bibliography Review Chapter II. Radiotherapy
60
Type of DNA lesion Number of lesions/Gray/Nucleus
Single-strand breaks 750
Double-strand breaks 40
Intra or inter-chain lesions 30
DNA-Protein bridging 150
Base Modifications 1400
Sugar Modifications 1200
Table 6: Number of lesions per Gray per nucleus depending on the type of DNA damage.
Since not all DNA damages listed above were studied during this PhD work, I will only go
further in details with three types of DNA lesions: base oxidation (8-oxo-guanine), single-
strand breaks (SSBs), and double-strand breaks (DSBs).
3.1.1. Base modification
Purine and pyrimidine bases, as well as the -ose constituents of DNA, can be oxidized by
the hydroxyl radicals. One common type of base modification is the oxidation of the guanine
base, the most frequent being 8-oxo-7,8-dihydrodeoxyguanine (8-oxoguanine).
Figure 15: Oxidation of guanine following ionizing radiation. Molecular structure of guanine and 8-
oxo-guanine. (Mutagenesis and DNA Repair, www.atdbio.com)
3.1.2. Single-strand breaks (SSB)
Single-strand breaks are the result of the deoxyribose oxidation, which leads to the
rupture of the phosphodiester bond between the phosphate and the deoxyribose (Evans et
al., 2004). This break leads to a spacing between the two DNA strands which allows water
molecules to penetrate, which will in turn break the hydrogen bonds between the two DNA
strands. The number of SSB increases with the radiation dose. However, these types of
lesions are easily repaired by the cell and therefore has a low impact on the cell’s viability.

Bibliography Review Chapter II. Radiotherapy
61
3.1.3. Double-strand breaks (DSBs)
Double-strand breaks are the result of, either a single hydroxyl radical on the deoxyribose
with transfer of the formed radical on the opposite strand, or by two hydroxyl radicals going
through the same regions in a lapse of time insufficient for the cell to repair the first break
(Dikomey et al., 1998). The number of these types of lesions is also dependent on the dose
of irradiation, however these types of lesions are much harder for the cell to repair and
therefore play an important role in the cell’s fate: survival or death induced by irradiation.
DNA damage repair: Overview of the mechanisms involved
Cell Cycle Checkpoint Regulation following IR-Induced DNA Damage
The cells’ fate is highly regulated by the cell cycle. In order to move through the cell cycle,
the cell must pass checkpoints. Its successfulness in passing these checkpoints is highly
dependent on the DNA’s integrity. Two checkpoints exist during interphase, including the
G1 checkpoint which will allow the cell to enter chromosomal replication, and the G2
checkpoint, which will allow the cell to enter mitosis. When the cell arrives at the checkpoint
of the cell cycle, it will assess whether its genome is ready for division, or if repair needs to
occur prior to division. Figure 16 shows the process a cell enters when it reaches a cell cycle
checkpoint: a cell will have a few options depending on its DNA integrity. If the DNA has no
errors it will progress to cell division. If the DNA needs repair, it will stop in the cycle and
allow for the DNA to repair. If DNA repair is successful, the cell can progress to cell division. If
the DNA is not repaired, one of two options can happen: the cell will die through apoptosis,
or it will move on to cellular division however with mutations (which can lead to the
development of cancer).
Figure 16: Potential fates of the cell at the cell cycle checkpoint. (Santivasi and Xia, 2014)
Ataxia Telangectasia mutated and Rad3 related (ATR) and Ataxia Telangectasia Mutated
(ATM), two serine/threonine-specific protein kinases, are fundamental proteins involved in

Bibliography Review Chapter II. Radiotherapy
62
the repair of DNA-strand lesions. ATR is activated by the presence of single strand breaks,
generated from the uncoupling of helicase and DNA polymerase during replication fork
stalling, while ATM is activated by double-stranded breaks. When SSB or DSBs are detected
by ATR and ATM, these proteins are phosphorylated and activate downstream signaling for
the repair of the lesions. Many different transducers and effectors are activated and play a
role in these types of DNA repair (Santivasi and Xia, 2014; Brown and Baltimore, 2003;
Jossen and Bermejo 2013; Lee and Paull, 2007).
Figure 17: ATM and ATR regulate the S/G2 cellular response to DNA damage. (Santivasi and Xia,
2014)
Several DNA repair pathways exist depending on the type of DNA lesion. These include
direct reversal, base excision repair (BER), nucleotide excision repair (NER), mismatch repair,
homologous recombination (HR), and non-homologous end-joining (NHEJ). In the following
paragraphs, we will focus on the three pathways studied in this work i.e for the repair of
base oxidations, SSBs, and DSBs.
3.1.4. Base excision repair (BER)
Base excision repair (BER) is by definition the repair system used for the repair of
damaged bases resulting from small chemical modifications. BER can therefore be used for
the repair of oxidized, methylated, alkylated or deaminated bases as well as abasic sites and

Bibliography Review Chapter II. Radiotherapy
63
single-strand breaks (Christmann et al., 2003). The above-mentioned damages lead to a
chemical structure modification of the DNA but does not deform its double-helix. This repair
pathway is often considered as the principal guardian of induced damages by the cellular
metabolism, in particular from the oxidative stress (Hoeijmakers, 2001).
BER is composed of four main steps (see Figure 18) (Parsons and Dianov, 2013): 1.
Recognition of the lesion by a DNA glycosylase specific to the damaged base, or by PARP1 in
the case of a SSB; 2. Cleavage of the phosphodiester bond by an AP endonuclease (this step
will not occur in SSB repair); 3. Repolymerization by specific proteins; 4. Ligation of the newly
synthesized nucleotides.
Figure 18: Schematic representation of the base excision repair pathway (BER) (Jeppesen et al., 2011).
3.1.5. Homologous recombination (HR) and non-homologous end joining (NHEJ)
Following double-strand breaks of DNA after ionizing radiation, the cell will respond using
one of the two adequate repair mechanisms: homologous recombination (HR) or non-

Bibliography Review Chapter II. Radiotherapy
64
homologous end joining (NHEJ) (Figure 19). If the damages are not repaired or not properly
repaired, DSBs can be sufficient to trigger apoptosis (Frosina, 2009).
In homologous recombination (HR), the cell uses a DNA template in order to re-synthesize
the new DNA strand: it is characterized by deriving the correct sequence from a homologous
strand of intact DNA, making it a “high-fidelity” repair (Santivasi and Xia, 2014). This
mechanism uses nuclease-mediated resection of damaged DNA ends, polymerization of new
DNA, and ligation to restore strand integrity (Santivasi and Xia, 2014). This repair pathway is
mainly used during the S and G2 phases of the cell cycle.
Non-homologous end joining (NHEJ) functions occurs during the G1 phase of the cell cycle
and will repair a wide variety of DSBs with distinct break structures and sequences (Lieber et
al., 2003). NHEJ is mainly regulated by DNA-PK and KU. Compared to HR, NHEJ shows little
fidelity as it does not use or uses little homologous template to repair the break. This type of
repair consists in digesting the damaged base, repolymerization/repair, and finally digestion
(Weterings and Chen, 2008).
It was suggested that there is a connection between the malfunction of NHEJ and
radioresistance: in several types of cancer, in particular in glioblastoma multiforme (GBM),
the increased function of DNA-PK, primary enzyme used in NHEJ, was demonstrated to
increase radiation resistance (Santivasi and Xia, 2014; Burma and Chen, 2004).
Figure 19: Overview of A. homologous recombination and B. non-homologous end-joining (Weterings and Chen, 2008).

Bibliography Review Chapter II. Radiotherapy
65
4. Radiosensitizing strategies
As mentioned above, radiation therapy plays an essential role in the treatment of
numerous cancers including head and neck squamous cell carcinoma, yet therapeutic
efficacy is hindered by treatment-associated toxicity and tumor recurrence. Moreover, a
complementary approach is to explore mechanisms of reducing normal tissue injury that is
induced by ionizing radiation, which is especially important in dose-escalation studies that
aim to increase tumor control probability. Both approaches, increasing tumor cell kill and
decreasing morbidity, can improve cure rates and the quality of life of cancer patients
undergoing radiotherapy. Central to success is finding and exploiting genetic or
microenvironmental differences between normal and malignant tissues.
Ionizing radiation as applied in the radiotherapy clinic induces a complex response in cells.
Some processes aim to repair damage, whereas others counteract propagation of the
damage or induce cell death. In addition, many aspects of the tumor microenvironment,
such as hypoxia or vasculature development have been widely investigated with respect to
improving radiotherapy. As the mechanisms that contribute to radioresistance are
numerous, an extensive literature has been proposed for the understanding and the reversal
of this phenomenon which cannot therefore be fully exposed in this manuscript. Among all
the strategies explored, one can mention the modulation of the DNA damage response, the
modulation of the cell cycle checkpoints, the modulation of the signal transduction
pathways, receptor targeting strategies, the modulation of the microenvironment, the
targeting of cancer stem cells (CSCs), and other directions, further described in the sections
below.
4.1. Modulating the DNA damage response
Owing to genetic instability, tumors are often defective in one aspect of DNA repair but
usually have backup pathways for accomplishing repair. Attacking these backup pathways
can render the tumor radiosensitive while leaving the normal tissue relatively resistant.
Inhibitors of important molecules in DNA damage repair, such as ATM (Zou et al., 2008 ;
Biddlestone-Thorpe et al., 2013 ; Vecchio et al., 2014 ; Dohmen et al., 2017), ATR (Fokas et
al., 2012 ; Vávrová et al., 2013 ; Šalovská et al., 2014), DNA-dependent protein kinase (DNA-
PK) (Du et al., 2010 ; Niazi et al., 2014 ; Dolman et al., 2015 ; Mamo et al., 2017) but also RAD
51 (Kobashigawa et al., 2015 ; King et al., 2017) or PARP (Hirai et al., 2012 ; Wuster et al.,
2016 ; Lohse et al., 2016) have been shown to sensitize cancer cells to radiotherapy. Besides
DNA repair, other targets may be mentioned such as telomerase (Wang et al., 2015 Wu et
al., 2017), histone deacetylase (Hehlgans et al., 2013; Barrazuol et al., 2015; Chun et al.,
2015). Transcription factors such as STAT3 (Bonner et al., 2009; Zhang et al., 2015;
Ouédraogo et al., 2016), TCF4 (Kendziorra et al., 2011) or NFκB (Kim et al., 2005; Watson et
al., 2009) have also been suggested as potential radiosensitizing targets.

Bibliography Review Chapter II. Radiotherapy
66
Due to potential toxicity, only very few inhibitors of repair are on the market with an FDA
approval. Ongoing clinical trials and targets are summarized in Annex 1.
Integrin cell adhesion molecules, as well as their associated adaptor proteins are also
attractive targets which may play a crucial role in tumor cell resistance to cancer therapy
(Cordes et al., 2006; Eke et al., 2013; Eke et al., 2012; Cordes et al., 2006; Nam et al., 2010;
Weaver et al., 2002; Damiano et al., 2001; Cordes et al., 2003; Gao et al., 2014; Mantoni et
al., 2011; Cabodi et al., 2010). Indeed, many essential pro-survival signals come from the
tumor microenvironment including integrin-mediated cell adhesion to the ECM (Cordes et
al., 2003; Hanahan and Weinberg, 2011). β1 integrin is an interesting radiosensitizing
approach, as their targeting has shown a promising approach to overcome HNSCC
radioresistance (Cordes, 2006; Eke et al., 2012; Cordes and Park, 2007; Eke et al., 2012). β1-
integrin-mediated adhesion was shown to confer radioresistance due to their role in the
regulation of DNA repair via the FAK/JNK1 signaling pathway (Dickreuter et al., 2015). In a
recent study, Steglich et al. (2015) used a siRNA targeting the α3 integrin which resulted in a
reduced clonogenic survival and enhanced radiosensitivity through the induction of
apoptosis. It was demonstrated that these events were associated with the decrease of the
phosphorylation of Akt, Cortactin and Paxillin. Moreover, the simultaneous inhibition of α3
and β1 integrin led to higher cytotoxicity and radiosensitization compared to α3 integrin
alone (Steglich et al., 2015), a result which was however cell line-dependent.
Another dual targeting option, involving β1 integrin and EGFR, was tested in order to
counteract inhibit radioresistance in HNSCC. The combined β1 integrin-EGFR targeting
resulted in an enhanced cytotoxicity and radiosensitization in eight out of ten tested HNSCC
cell lines, as a result of FAK dephosphorylation. In vivo experiments targeting integrins also
showed a better tumor control. (Eke et al., 2015). Very recently, Koppenhagen et al. (2017)
hypothesized that c-Abl tyrosine kinase could be an important mediator of β1 integrin
signaling for radioresistance. They demonstrated a greater degree of radiosensitization in a
subset of cancer cell lines with simultaneous β1-integrin/c-Abl targeting compared to
monotherapies. This showed that c-Abl is an important determinant of radioresistance in cell
lines originating from different solid tumors (Koppenhagen et al., 2017). And again, this
showed the benefits of dual- or multi-targeting therapies.
4.2. Modulating cell cycle checkpoints
Interfering with the cell cycle control might result in a loss of G1 or G2/M block, failure of
DNA repair and, thus, induction of cell death. Numerous in vitro studies have been published
about the use of checkpoint kinases (CHKs) or cyclin-dependent kinases (CDKs) inhibitors as
radiosensitizing agents. Among these, one can quote the specific inhibition of CHK-1 (Wang
et al., 2012; Collins et al., 2013), CHK-2 (Jobson et al., 2009; Riesterer et al., 2011) or CDKs
(Kodym et al., 2009; Raqhavan et al., 2012). On the basis of these successful in vitro studies,
second-generation pyridopyrimidine-derived inhibitors with high specificity towards CDK4/6

Bibliography Review Chapter II. Radiotherapy
67
are for example being tested clinically (Michaud et al., 2010). Palbociclib (PD0332991, PD)
has received FDA approval for potential treatment of breast cancer, and Abemaciclib
(LY2835219) is undergoing a phase III trial for breast and lung cancer (Gelbert et al., 2014;
Barton et al., 2013). However, only few pre-clinical studies have up to now addressed the
combination of CDK-inhibitors with radiotherapy (Cen et al., 2012; Barton et al., 2013).
4.3. Modulating signal transduction pathways
As important intracellular factors, aberrant tumor transmembrane signal transduction
pathways, which include the prosurvival cascades (PI3K ⁄ Akt, MAPK⁄ ERK and JAK ⁄ STAT)
and the pro-apoptosis pathways (Wnt), p53 and TNF-α ⁄ NF-κB), have been proved to be
crucial determinants of the probability of cell sensitivity to radiation in various malignancies.
Among the strategies inhibiting proliferative pathways, one can mention the PI3K/Akt
pathway after combination of LY294002 and radiation (Liu et al., 2011), BKM120 and
radiation (Liu et al., 2014) or PI3K/mTOR pathway after combination of NVP-BEZ 235 and
radiation (Maity et al., 2011 ; Potiron et al., 2013 ; Kuger et al., 2013).
Considering the MAPK/ERK pathway, AZD6244 has been reported to enhance
radiosensitivity (Chung et al., 2009). The co-targeting of PI3K and MAPK has also been
successfully investigated (Williams et al., 2012). With regard to the JAK/STAT pathway,
several chemical compounds, including S3I-201, Stattic, STA-21 and a JAK kinase inhibitor
AG490 have been reported to successfully inhibit JAK. STAT signaling and effectively improve
the sensitization to radiation of tumors without obvious toxicity (Kim et al., 2008). Among
the strategies promoting pro-apoptotic pathways, the Wnt signaling pathway has been
explored through the use of niclosamide (Yin et al, 2016), curcubitacin B (Duangmano et al.,
2012), LGK-974 (Tian et al., 2017) or miRNAs (hsa-miR-138-2-3p); according to the predicted
genes and pathways of differential miRNAs target, down-regulated expression of has-miR-
138-2-3p under radiation was thought to play a key role in enhancing the radio-sensitivity in
human laryngeal squamous cancer stem cells (Zhu et al., 2017) as radiosensitizing agents.
Although understanding the cellular and molecular basis for innate and acquired
resistance of cancer cells to radiotherapy is a prerequisite for overcoming this difficulty,
there are potential concerns and challenges related to the clinical use of current targeted
drugs owing to their low cancer selectivity and specificity. Therefore, the development of
multi-targeting agents or direct conjugation of multifarious therapeutic molecular agents
may accomplish promising efficacy.
4.4. Receptor targeting strategies
The recent shift to the development of anticancer therapies that target specific
alterations in cancer cells, fueled by the clinical success of monoclonal antibodies (mAb)
targeting growth factors or their receptors and inhibitors of receptor tyrosine kinases (TK)
has also sparked an interest in combining molecular targeted therapies with radiation
Bibliography Review Chapter II. Radiotherapy
68
therapy. Bevacizumab, a monoclonal antibody against vascular endothelial growth factor A
(VEGF-A), is a pioneering targeted agent that has been studied in large clinical trials (Schmidt
et al., 2012). Although the toxicities of treatments were acceptable, similar survival to
historical control were generally obtained, whatever the type of cancer studied (Small et al.,
2011; Chinot et al., 2014). Concerning the Epidermal Growth Factor Receptor (EGFR), which
is known to play an important role in tumor progression and treatment resistance for many
types of malignancies including head and neck, colorectal and nonsmall lung cancer, many
studies have shown the in vitro efficiency of anti-EGFR-targeted therapies in combination
with radiotherapy (Raben et al., 2005; Wang et al., 2011; Lu et al, 2012). To date, the only
FDA approved use of an anti-EGFR therapy (cetuximab) in combination with radiation
therapy is for locally advanced head and neck cancer. In a large, multi-institutional,
randomized trial, Bonner et al. (2010) reported an overall survival benefit when adding
cetuximab to RT in locally advanced HNSCC. However, the follow-up study, RTOG 0522,
which added cetuximab to cisplatin-based chemoradiation for locally advanced HNSCC, did
not show a survival benefit with the addition of cetuximab (Ang et al., 2014). Similarly, a
recently reported randomized phase III trial for stage IIIA/B non–small-cell lung cancer
(NSCLC), RTOG 0617, demonstrated no clinical benefit with the addition of cetuximab to
standard or dose-escalated chemoradiation (Bradley et al., 2015). A related EGFR antibody,
panitumumab, has been examined in the randomized phase II trials for HNSCC, CONCERT-1
(Mesia et al., 2015) and CONCERT-2 (Giralt et al, 2015): both treatments demonstrated no
additional benefit with the addition of panitumumab.
Apart from anti-EGFR receptor antibodies, other small molecules such as EGFR-receptor
tyrosine kinases inhibitors (erlotinib, afatinib…) have been reported to radiosensitize cancer
cells in vitro (Tsai et al., 2013; Huguet et al., 2016). Although a phase II trial of erlotinib
combined with temozolomide in addition to RT in glioblastoma multiforme reported better
survival than historical controls (Prados et al, 2009). However, a randomized phase II trial
comparing erlotinib plus cisplatin-based chemoradiation with chemoradiation alone in
patients with locally advanced HNSCC demonstrated no difference in clinical complete
response rates between the two groups (Martins et al., 2013). So, there are many single
institutional case series that have provided mixed data, with some suggesting safety and
others suggesting unexpected toxicities. Despite this and given the important role EGFR
plays in several types of cancer and the well-defined role of EGFR in the response to
radiation therapy, this receptor remains an important target for radio- and
chemoradiosensitization.
Another interesting target is the targeting of integrins as it was previously described in
section 4.1.
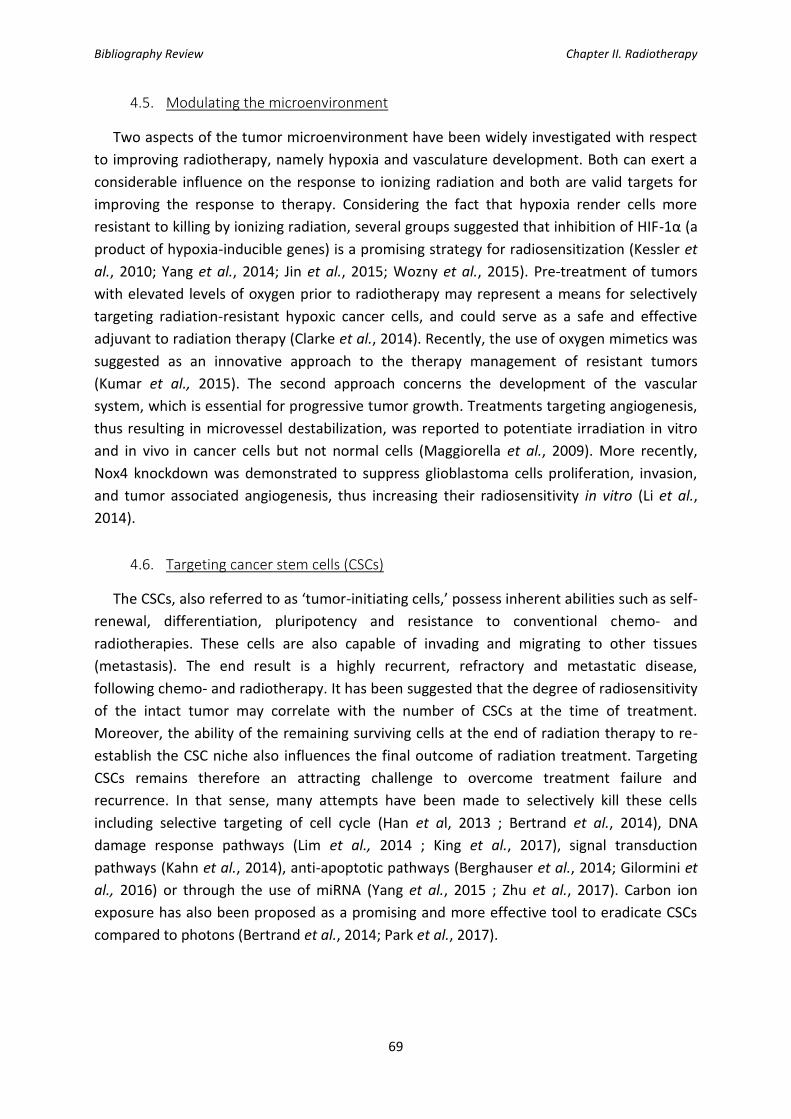
Bibliography Review Chapter II. Radiotherapy
69
4.5. Modulating the microenvironment
Two aspects of the tumor microenvironment have been widely investigated with respect
to improving radiotherapy, namely hypoxia and vasculature development. Both can exert a
considerable influence on the response to ionizing radiation and both are valid targets for
improving the response to therapy. Considering the fact that hypoxia render cells more
resistant to killing by ionizing radiation, several groups suggested that inhibition of HIF-1α (a
product of hypoxia-inducible genes) is a promising strategy for radiosensitization (Kessler et
al., 2010; Yang et al., 2014; Jin et al., 2015; Wozny et al., 2015). Pre-treatment of tumors
with elevated levels of oxygen prior to radiotherapy may represent a means for selectively
targeting radiation-resistant hypoxic cancer cells, and could serve as a safe and effective
adjuvant to radiation therapy (Clarke et al., 2014). Recently, the use of oxygen mimetics was
suggested as an innovative approach to the therapy management of resistant tumors
(Kumar et al., 2015). The second approach concerns the development of the vascular
system, which is essential for progressive tumor growth. Treatments targeting angiogenesis,
thus resulting in microvessel destabilization, was reported to potentiate irradiation in vitro
and in vivo in cancer cells but not normal cells (Maggiorella et al., 2009). More recently,
Nox4 knockdown was demonstrated to suppress glioblastoma cells proliferation, invasion,
and tumor associated angiogenesis, thus increasing their radiosensitivity in vitro (Li et al.,
2014).
4.6. Targeting cancer stem cells (CSCs)
The CSCs, also referred to as ‘tumor-initiating cells,’ possess inherent abilities such as self-
renewal, differentiation, pluripotency and resistance to conventional chemo- and
radiotherapies. These cells are also capable of invading and migrating to other tissues
(metastasis). The end result is a highly recurrent, refractory and metastatic disease,
following chemo- and radiotherapy. It has been suggested that the degree of radiosensitivity
of the intact tumor may correlate with the number of CSCs at the time of treatment.
Moreover, the ability of the remaining surviving cells at the end of radiation therapy to re-
establish the CSC niche also influences the final outcome of radiation treatment. Targeting
CSCs remains therefore an attracting challenge to overcome treatment failure and
recurrence. In that sense, many attempts have been made to selectively kill these cells
including selective targeting of cell cycle (Han et al, 2013 ; Bertrand et al., 2014), DNA
damage response pathways (Lim et al., 2014 ; King et al., 2017), signal transduction
pathways (Kahn et al., 2014), anti-apoptotic pathways (Berghauser et al., 2014; Gilormini et
al., 2016) or through the use of miRNA (Yang et al., 2015 ; Zhu et al., 2017). Carbon ion
exposure has also been proposed as a promising and more effective tool to eradicate CSCs
compared to photons (Bertrand et al., 2014; Park et al., 2017).

Bibliography Review Chapter II. Radiotherapy
70
4.7. Other directions
Outside the targets mentioned above and apart from nanotechnologies, many reports
have proposed other promising strategies to improve radiosensitization: modulation of
oxidative stress (Boivin et al., 2011; Xu et al., 2013; Sun et al., 2015), inhibition of heat shock
proteins (Aloy et al., 2008; Kabakov et al., 2010 ; Schilling et al., 2017), ceramide metabolism
(Alphonse et al., 2004 ; Pchejetski et al., 2010 ; Morad et al., 2013), Bcl-2 family (Loriot et al.
2014; Zerp et al., 2015; Gilormini et al., 2016), microtubule manipulation (Hoffstetter et al.,
2005 ; Forde et al., 2011). Various molecules such as curcumin (Verma, 2016), metformin
(Koritzinski, 2015) or mitochondrial metabolism-interfering agents (Mitrakas et al., 2014)
have also been studied.
Figure 20: Schematic representation of existing and future radiosensitizing strategies for HNSCC.
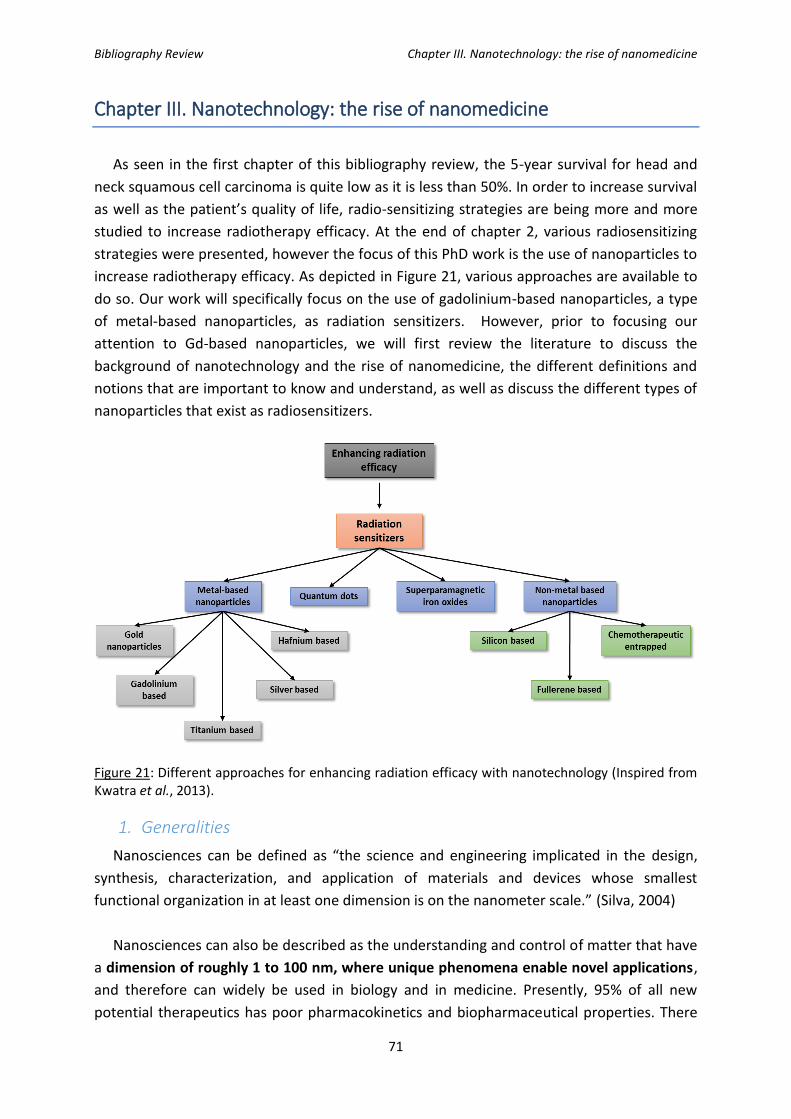
Bibliography Review Chapter III. Nanotechnology: the rise of nanomedicine
71
Chapter III. Nanotechnology: the rise of nanomedicine
As seen in the first chapter of this bibliography review, the 5-year survival for head and
neck squamous cell carcinoma is quite low as it is less than 50%. In order to increase survival
as well as the patient’s quality of life, radio-sensitizing strategies are being more and more
studied to increase radiotherapy efficacy. At the end of chapter 2, various radiosensitizing
strategies were presented, however the focus of this PhD work is the use of nanoparticles to
increase radiotherapy efficacy. As depicted in Figure 21, various approaches are available to
do so. Our work will specifically focus on the use of gadolinium-based nanoparticles, a type
of metal-based nanoparticles, as radiation sensitizers. However, prior to focusing our
attention to Gd-based nanoparticles, we will first review the literature to discuss the
background of nanotechnology and the rise of nanomedicine, the different definitions and
notions that are important to know and understand, as well as discuss the different types of
nanoparticles that exist as radiosensitizers.
Figure 21: Different approaches for enhancing radiation efficacy with nanotechnology (Inspired from Kwatra et al., 2013).
1. Generalities
Nanosciences can be defined as “the science and engineering implicated in the design,
synthesis, characterization, and application of materials and devices whose smallest
functional organization in at least one dimension is on the nanometer scale.” (Silva, 2004)
Nanosciences can also be described as the understanding and control of matter that have
a dimension of roughly 1 to 100 nm, where unique phenomena enable novel applications,
and therefore can widely be used in biology and in medicine. Presently, 95% of all new
potential therapeutics has poor pharmacokinetics and biopharmaceutical properties. There

Bibliography Review Chapter III. Nanotechnology: the rise of nanomedicine
72
is a huge need for novel drug fabrication in order to have specific interactions with the
diseased tissue only. Therefore, one of the greatest values of nanosciences will be in the
development of new and effective medical treatments as they open many opportunities for
imaging, diagnostics, and specific drug delivery to diseased sites.
It is important to note the physico-chemical characterizations of nanomaterials which is
of the outmost importance for nanomedicine applications.
Figure 22: Cascade for nanomaterial characterization. The physico-chemical properties of nanocarriers affect their pharmacokinetic and pharmacodynamic profiles. Detailed characterization of nanomedicine products is necessary to predict their performance in the clinical setting. (Wicki A. et al., 2015)
Nanotechnologies being a field with promises in a variety of applications is receiving
increasing global investment from governments and industries (Paull et al., 2003).
Worldwide investment in nanotechnology-related research & development by government
organizations has considerably increased as well as the number of publications and clinical
trials (Figure 23).
In France, nanosciences and nanotechnology mobilize more than 5 300 researchers in 240
laboratories (Campus France, La recherche en nanosciences en France) and is ranked second
after Germany for their investment in nanosciences’ research, and 5th worldwide in terms of
publications (Invest in France Agency, Les Nanotechnologies en France).
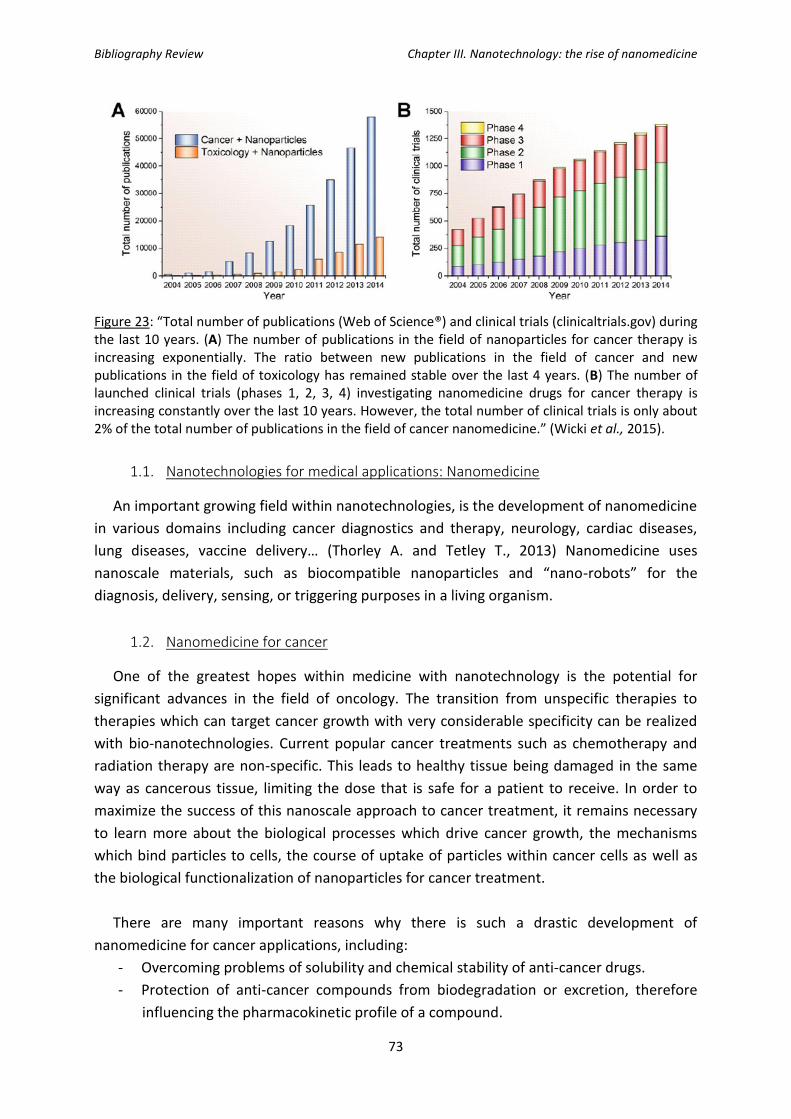
Bibliography Review Chapter III. Nanotechnology: the rise of nanomedicine
73
Figure 23: “Total number of publications (Web of Science®) and clinical trials (clinicaltrials.gov) during the last 10 years. (A) The number of publications in the field of nanoparticles for cancer therapy is increasing exponentially. The ratio between new publications in the field of cancer and new publications in the field of toxicology has remained stable over the last 4 years. (B) The number of launched clinical trials (phases 1, 2, 3, 4) investigating nanomedicine drugs for cancer therapy is increasing constantly over the last 10 years. However, the total number of clinical trials is only about 2% of the total number of publications in the field of cancer nanomedicine.” (Wicki et al., 2015).
1.1. Nanotechnologies for medical applications: Nanomedicine
An important growing field within nanotechnologies, is the development of nanomedicine
in various domains including cancer diagnostics and therapy, neurology, cardiac diseases,
lung diseases, vaccine delivery… (Thorley A. and Tetley T., 2013) Nanomedicine uses
nanoscale materials, such as biocompatible nanoparticles and “nano-robots” for the
diagnosis, delivery, sensing, or triggering purposes in a living organism.
1.2. Nanomedicine for cancer
One of the greatest hopes within medicine with nanotechnology is the potential for
significant advances in the field of oncology. The transition from unspecific therapies to
therapies which can target cancer growth with very considerable specificity can be realized
with bio-nanotechnologies. Current popular cancer treatments such as chemotherapy and
radiation therapy are non-specific. This leads to healthy tissue being damaged in the same
way as cancerous tissue, limiting the dose that is safe for a patient to receive. In order to
maximize the success of this nanoscale approach to cancer treatment, it remains necessary
to learn more about the biological processes which drive cancer growth, the mechanisms
which bind particles to cells, the course of uptake of particles within cancer cells as well as
the biological functionalization of nanoparticles for cancer treatment.
There are many important reasons why there is such a drastic development of
nanomedicine for cancer applications, including:
- Overcoming problems of solubility and chemical stability of anti-cancer drugs.
- Protection of anti-cancer compounds from biodegradation or excretion, therefore
influencing the pharmacokinetic profile of a compound.
Bibliography Review Chapter III. Nanotechnology: the rise of nanomedicine
74
- Improving the distribution and the targeting of anti-tumor medication.
- The design so their payload is released upon a trigger resulting from a stimuli-
sensitive nanomedicine therapeutics.
- The potential decrease of resistance of tumors against the cancer treatment (by
increasing circulation time of compound and by mediating stimuli-responsive drug
release as well as endocytic drug uptake).
1.2.1. Different types of nanoparticles used in cancer therapy
Different types of nanoparticles can be used for cancer clinical care including viral
nanoparticles, organic nanocarriers and inorganic nanoparticles. Each of these are
represented in Figure 24 and each will be further discussed in the next paragraphs.
Figure 24: “Schematic illustration of established nanotherapeutic platforms. Different nanomedicine products such as drug conjugates, lipid-based nanocarriers, polymer-based nanocarriers, inorganic nanoparticles, and viral nanoparticles are used in clinical cancer care. (Wicki A. et al., 2015)
Viral nanoparticles can be of interest in cancer therapy as the tumor-homing viruses
engineered to express therapeutic proteins can be used. An example of such nanoparticle is
JX-594 which is a poxvirus designated to replicate in tumor cells and induce their destruction
via the activation of the EGFR-Ras-MAPK signaling pathway. The JX-594 viral nanoparticle
also has the expression of granulocyte colony-stimulating factor (G-CSF) which potentially
increases the immunological anti-tumor response. In a clinical study, 10 patients with
primary or metastatic liver cancer were injected intratumorally with JX-594. Results showed
3 cases of partial remission and 6 cases of stable disease (Park B. et al., 2008). In another
phase 1 clinical trial, JX-594 was used to treat advanced solid tumors in 23 patients

Bibliography Review Chapter III. Nanotechnology: the rise of nanomedicine
75
(Breitbach C. et al., 2011). The virus was successful in that it specifically reached the tumor
site while normal tissue showed no viral replication. Adjacent epithelium up took the
particles however they were not active, therefore showing no toxicity. A dose-related anti-
tumor activity of JX-594 was observed. This study was the first to show a dose-related viral
replication and tumor response after intravenous injection of an oncolytic virus (Wicki et al.,
2015).
Other success using oncolytic nanoparticles included the OPTiM study in patients with
advanced (stage IIIB-IV) melanoma (Andtbacka et al., 2013). T-Vec, and other oncolytic
viruses were tested in clinical trials however, none of which reached the market, mainly due
to concerns arisen concerning their biosafety and cytocompatibility (Vile R. et al., 2002).
Organic nanocarriers used for a wide range of applications whether for targeted or non-
targeted drug delivery, included several subtypes: drug conjugates, lipid-based nanocarriers,
natural polymers- protein and peptide or glycan nanocarriers, and last but not least
synthetic polymer-based nanocarriers.
Drug conjugates are defined as “nanotherapeutics because of their size scale in the lower
nanometer range and their conjugation to active pharmaceutical ingredients (Duncan, 2006;
Hawe et al., 2011). The active agents are covalently linked to targeted antibodies and
peptides or to polymers. The conjugate is usually mono- or oligomeric, and is intended to
improve targeted delivery of the drug without necessarily impacting on drug solubility,
stability, or biodegradability. In contrast, nanocarriers based on lipids, proteins, glycans, or
synthetic polymers usually encapsulate the drug, and they obviate the need to link the drug
covalently to the carrier.” Approved antibody conjugates include trastuzumab-emtansine
which targets HER2-overexpression in breast cancer (Verma et al., 2012) and brentuximab-
vedotin against CD30-positive Hodgkin lymphoma and anaplastic large-cell lymphoma
(Younes et al., 2010). Polymer-drug conjugates are an interesting class as they change the
pharmacokinetic profile of a drug (Duncan, 2006, Duncan et al., 2005). As an example, the
HPMA copolymer-doxorubicin conjugate PK1 is a novel anti-cancer agent with a significantly
lower frequency of cardiotoxicity and alopecia compared to free doxorubicin. A phase 2
study showed promising signs of activity in breast cancer and non-small-cell lung cancer
(Seymour et al., 2009).
Lipid-based nanocarriers include two classes: liposomes (closed phospholipid bilayers)
and micelles (normal phase, oil-in-water micelles). What makes them attractive is their
capacity to carry 1 to 6 drug molecules per monoclonal antibody, which represents a load of
three to four orders of magnitude compared to antibody-drug conjugates. The first
nanocarrier approved by the U.S. FDA was pegylated liposomal doxorubicin (Doxil® or
Caelyx®) in 1995 (Barenholz, 2012, Harrison et al., 1995). Since then, five more lipid
nanocarriers were approved for clinical use including: non-pegylated liposomal doxorubicin

Bibliography Review Chapter III. Nanotechnology: the rise of nanomedicine
76
(Myocet) (Chan et al., 2004), non-pegylated liposomal daunorubicin (DaunoXome®) (Gill et
al., 1996), non-pegylated liposomal cytarabine (DepoCyt®) (Gökbuget N. et al., 2011),
vincristine sulfate liposomes (Marquibo®) (O’Brien et al., 2013), and liposomal mifamurtide
(Mepact®) (Frampton 2010, Meyers et al., 2008). Although none of these are targeted, the
nano-formulations of doxorubicin, daunorubicin, and vincristine prolong the half-life of the
cytotoxic compounds and in turn improve their toxicity profiles. Liposomal formulations
allow stable encapsulation of drugs but these formulations still reach the tumor via the
enhanced permeability retention effect. In order to target them to the tumor tissue,
liposomes will have to be modified on their surface to improve specificity. An example to
target liposomes is the conjugation of antibodies, antibody fragments, or single-chain
antibodies to its surface (Huwyler et al., 1996, Koshkaryev et al., 2013) By adding these
compounds at its surface however, it was observed that the plasma half-life was reduced,
probably due to the entrapment of Fc-containing ILs in the endoplasmic reticulum.
Therefore, Fc-free antibodies were developed, such as anti-HER2, anti-EGFR (i.e. cetuximab)
or anti-VEGFR2 (i.e. DC101) antibodies. (Huwyler et al., 1996; Koshkaryev et al., 2013;
Mamot et al., 2003 ; Mamot et al., 2005 ; Park et al., 2002 ; Wicki et al., 2012). Further in-
vivo studies on mice xenografted with human cancer cells showed that these antibody-
grafted nanocarriers delivered their cytotoxic compounds specifically to the cells expressing
the target antigen. In a clinical study, treatment of tumors (breast cancer in the MMTV-
PyMT mouse model and HT-29 human colon cancer xenograft transplantation model) with
anti-VEGR2-targeted and doxorubicin-loaded ILs resulted in a tumor shrinkage to 1/6th of the
size when compared to tumors treated with an identical dose of non-targeted liposomal
doxorubicin (Wicki A. et al., 2012). This study clearly demonstrated the benefits of using
targeted lipid nanocarriers instead of their non-targeted counterparts. An additional
advantage of these targeted lipid nanocarriers is their capacity to overcome multidrug
resistance in cancer cells (Mamot et al., 2012; Huwyler et al., 2008). The first clinical trial
with GAH-coated doxorubicin-loaded ILs (MCC-465) in patients with metastatic stomach
cancer (Matsumura et al., 2004) showed that out of 18 patients were treated, 10 of the 18
had stable disease but no remission was observed.
In addition, lipid nanocarriers have also been studied for systemic delivery of nucleic acids
and other substances with short plasma half-life (Li and Rana 2014, Pecot et al., 2011), as
well as testing the feasibility and efficacy of siRNA delivery (Coelho et al., 2013; Couvreur et
al., 2006).
There is only one type of protein-based nanoparticle that has reached the clinical setting:
albumin-nanoparticle-bound paclitaxel (nab-paclitaxel; Abraxane®). This type of
nanoparticle is being used in breast cancer, non-small-cell lung cancer, and pancreatic
cancer. In this case, we cannot talk about an active targeted nanoparticle but it has been
observed that albumin may mediate transcytosis of the compound via the gp60 receptor on
the epithelium which enhances its deliver to the tumor site. (Predescu et al., 2004). During

Bibliography Review Chapter III. Nanotechnology: the rise of nanomedicine
77
the clinical trials, it was observed in breast cancer that nab-paclitaxel improved response
rates compared to conventional paclitaxel (Gradishar et al., 2005), and that nab-paclitaxel in
combination with gemcitabine increased survival in pancreatic-cancer patients when
compared to gemcitabine monotherapy (Hoff et al., 2013). Other albumin stabilized
nanoparticles including ABI-008, ABI-009, and ABI-011. (Qu et al., 2013) are under clinical
trials.
No glycan nanocarriers for systemic cancer therapy has been approved yet but there are
ongoing phase 1 and 2 trials for the proof-of-concept. It would seem that these types of
nanoparticles show fewer side effects. For example, cyclodextrin nanoparticles were
compared to free camptothecin in a phase 2 clinical trials and fewer side effects were
observed as well as an overall response rate of 64% (Weiss et al., 2013).
Synthetic polymer-based nanocarriers show much promise for nanomedicine
therapeutics due to their chemical versatility (Kamaly et al., 2012). Many types of synthetic
polymer-based nanocarriers are under clinical trials and are summarized in Table 7 (see
below).
Inorganic nanoparticles have also been of increased interest for cancer therapy. These
types of nanoparticles have a variety of applications including imaging, radiosensitization,
and drug delivery (Huang et al., 2011). These types of nanoparticles will be further discussed,
but just to mention a few, iron oxide nanoparticles are used for diagnostic purposes (Ross et
al., 2009) while others are being tested in clinical trials for the magnetic resonance imaging
of tumors. An example of patented iron-oxide nanoparticle is NanoTherm®, an aqueous
colloidal dispersion that is activated, after tumor internalization, through thermal ablation
performed with an alternating magnetic field applicator (magnetic hyperthermia). This type
of therapy was shown to be beneficial and robust data was already collected for
glioblastoma (Rivera et al., 2010). Although not approved worldwide, NanoTherm® gained
marketing approval in several European countries (Wicki et al., 2015).
Other inorganic nanoparticles are hafnium oxide nanoparticles which will be further
discussed in details in the radiosensitization paragraph. As of 2015, no inorganic
nanoparticle for drug delivery has received market approval but some of them are in the
testing phase in clinical trials including pegylated colloidal gold-TNFα particles for cancer
therapy (Libutti et al., 2010) and silicon nanocarriers for parenteral peptide delivery
(Kovalainen et al., 2013).

Bibliography Review Chapter III. Nanotechnology: the rise of nanomedicine
78
Product (Company) Polymer Drug Indication Status Reference
ABI-008 (Abraxis/Celgene) Albumin nanoparticle Docetaxel Metastatic breast cancer, prostate cancer Phase 2 Hawkins M.J. et al., 2008)
ABI-009 (Abraxis/Celgene) Albumin nanoparticle Rapamycin Solid tumors, lymphoma Phase 1/2 Gonzalez-Angulo A.M. et al., 2013)
ABI-011 (Abraxis/Celgene) Albumin nanoparticle Thiocolchicine dimer Solid tumors, lymphoma Phase 1/2 Celgene Corporation, 2014
BIND-014 (Bind Therapeutics) PEG-PLGA polymeric nanoparticle*
Docetaxel Non-small-cell-lung cancer, prostate cancer Phase 1/2 Hrkach J. et al., 2012)
CALAA-01 (Calando Pharmaceuticals) Cyclodextrin polymeric nanoparticle**
siRNA targeting ribonucleotide Solid tumors Phase 1 Davis M.E. et al., 2010
CRLX-101 (IT-101) (Cerulean Pharma) Cyclodextrin nanoparticle Camptothecin Solid tumors, renal cell carcinoma, rectal cancer, non-small-cell lung cancer
Phase 1/2 Gaur S. et al.,, 2014
DHAD-PBCA-NP Polymeric nanoparticle Mitoxantrone Heptacellular carcinoma Phase 2 Zhou Q. et al., 2009
Docetaxel-PNP (Samyang Biopharmaceuticals)
Polymeric nanoparticle Docetaxel Solid tumors Phase 1 Jung J. et al., 2012
Lipotecan (TLC388) (Taiwan Liposome) Polymeric micelle TLC388 (Camptothecin derivate)
Liver cancer, renal cancer Phase 1/2 (orphan drug status)
Ghamande S. et al., 2014
Nanotax (CritiTech) Polymeric nanoparticle Paclitaxel Peritoneal neoplasms Phase 1 Roby K.F. et al., 2008
Nanoxel (Fresenius Kabi Oncology) Polymeric micelle Paclitaxel Advanced breast cancer Phase 1 Madaan A. et al., 2013
NC-4016 (NanoCarrier) Polymeric micelle Oxaliplatin Solid tumors, lymphoma Phase 1 Ueno T. et al., 2014
NC-6004 (Nanoplatin) (NanoCarrier) PEG-PGA polymeric micelle Cisplatin Pancreas cancer Phase 2/3 Plummer R. et al., 2011
NC-6300 (K-912) (Nanocarrier) pH sensitive polymeric micelle
Epirubicin Solid tumors Phase 1 (Japan) Harada M. et al., 2011
NK-012 (Nippon Kayaku) PEG-PGA polymeric micelle SN-38 (active metabolite of irinotecan)
Solid tumors, small cell lung cancer, breast cancer Phase 2 Hamaguchi T. et al., 2010
NK-105 (NanoCarrier Nippon Kayaku) PEG-PAA polymeric micelle Paclitaxel Gastric cancer, breast cancer Phase 2/3 Kato K. et al., 2012
NK-911 (National Cancer Institute Japan/Nippon Kayaku)
PEG-PAA polymeric micelle Doxorubicin Solid tumors Phase 1 Matsumura Y. et al., 2004
Paclical (Oasmia Pharmaceutical) Polymeric micelle Paclitaxel Ovarian cancer Phase 3 (orphan drug status)
Oasmia Pharmaceutical AB, 2014
SP1049C (Supratek Pharma) Polymeric micelle*** Doxorubicin Advanced adenocarcinoma Phase 2/3 Valle J.W. et al., 2011
Transdrug BA-003 (Livatage) (BioAlliance Pharma)
Polymeric nanoparticle Doxorubicin Hepatocellular carcinoma Phase 3 (2004 EU orphan drug status)
Barraud L. et al., 2005
Table 7: Polymer-based nanocarriers in clinical trials. Polymer-based nanocarriers consist of a natural or synthetic polymer. Most commonly used natural polymers are proteins (e.g. albumin) or glycans (e.g. cyclodextrin). For active targeting strategies, the targeting ligand and cognate receptor are indicated. Products are listed alphabetically. Alternative names for the products are given in brackets. (Wicki et al., 2015)

Bibliography Review Chapter III. Nanotechnology: the rise of nanomedicine
79
1.2.2. Passive versus active targeting
Passive targeting plays on the enhanced permeability and retention effect: it exploits the
anatomical differences present between normal and diseased tissues. It occurs due to the
extravasation of the nanoparticles at the diseased site where the microvasculature is leaky.
In order for the nanoparticles to be able to reach the diseased site, they must be able to
freely circulate in blood.
Figure 25: Representation of the enhanced permeability retention effect. The vasculature in tumors is leaky and permeable allowing small sized-objects (i.e. nanoparticles) to pass through.
Active targeting requires the conjugation of a receptor specific ligand that can promote
site specific targeting. Success of drug targeting depends on the selection of the targeting
moieties. The moiety should be abundant, have a high affinity and specificity, and must be
well suited to chemical modification for conjugation. Ligands are coupled to nanoparticles in
two ways: either by covalent or non-covalent bonding. Covalent bonding may be the
formation of disulfide bonds, cross-linking between two primary amines, or the reaction
between a carboxylic acid and a primary amine… Non-covalent bonding can imply the
physical association of the targeting ligands to the nanocarrier surface. One of the
advantages of non-covalent bonding is the elimination of rigorous, destructive reaction
agents used. However, potential problems with non-covalent bonding include low and weak
binding, poor control of the reactions as the ligand may not be in the desired orientation.
2. Nanoparticles coupled to Radiotherapy
As summarized in Figure 21, different types of nanoparticles can be used for
radiosentization purposes. They can be divided in different subgroups, including polymeric
nanoparticles (i.e. albumin nanoparticles, poly(lactic-co-glycolic acid) (PLGA) nanoparticles,
high-Z nanoparticles (i.e. gold, gadolinium-based nanoparticles…), superparamagnetic
nanoparticles (SPIONS), quantum dots and non-metal based nanoparticles.

Bibliography Review Chapter III. Nanotechnology: the rise of nanomedicine
80
2.1. Different types of radiosensitizing nanoparticles
In this paragraph, we will briefly describe different types of nanoparticles that can be
used as radiation therapy sensitizers before focusing on AGuIX® which were used for this
work.
2.1.1. Quantum dots
Quantum dots (QDs) can be defined as small fluorescent nanocrystals (2 to 10 nm) that
are composed of semiconductor materials displaying quantum mechanical properties due to
their small size. QDs have the particularity that they can absorb a broad spectrum of
electromagnetic waves and emit light usually in the near infrared range (Seeta Rama Raju et
al., 2015). QDs have a central core made of a metal or a metalloid that can be encapsulated
by biocompatible molecules, such as ZnS and silica, to prevent them from being eliminated
from the body before they reach cancer cells (Jin and Hildebrandt, 2012). Currently, due to
their optical and electrical properties, their use is mainly as diagnostic agents (Wegner and
Hildebrandt, 2015). A couple of quantum dots made of CaF, LaF, ZnS or ZnO have already
been studied for their potential as radiosensitizers (Kwatra et al., 2013; Juzenas et al., 2008;
Wang et al., 2008). The mechanism of action relies on the generation of radical oxygen
species upon the interaction of high-energy photons (X-rays and gamma rays) with the heavy
metals since quantum dots have a high atom and electron density, which will in turn cause
localized and targeted damage to cancer cells (Park et al., 2006; Carter et al., 2007; Kwatra et
al., 2013; Juzenas et al., 2008).
Figure 26: Mechanism of action following the interaction of high-energy photons with a quantum dot (Juzenas et al., 2008).
It was observed that QDs are taken up by endocytosis and retained in lysosomes (Juzenas
et al., 2008; Silver and Ou 2005). QDs were also observed in the perinuclear region using an
immunofluorescence staining of the lysosomal membrane protein LAMP-2 (Saftig, 2005).
Bibliography Review Chapter III. Nanotechnology: the rise of nanomedicine
81
For a better internalization, QDs can be functionalized either by using a peptide containing a
cell entering signal (Zhou and Ghosh, 2007; Patel et al., 2007), or targeting receptor-
mediated endocytosis by binding specific peptidic receptors (Delehanty et al., 2006). In
cancer cells overexpressing the folate receptor, the functionalization of QDs with folate also
showed an increased cellular internalization (Delehanty et al., 2006; Bharali et al., 2005;
Schroeder et al., 2007). (Juzenas et al., 2008)
A recent study was published using tungsten sulfide QDs as multifunctional
nanotheranostics for in-vivo dual-modal image-guided photothermal/radiotherapy
synergistic therapy. (Yong et al., 2015). The authors developed WS2, QDs of a small size (3
nm) with good biocompatibility. As seen previously, this small size allows for the non-
retention of the particles in the liver while allowing renal excretion. Due to its high Z
number WS2 was predicted to be a good radiosensitizer. Indeed, treatment of HeLa and
HepG2 cells with these WS2 QDs for 24h resulted in radiosensitization (inhibition of cell
survival from 75% to 31%) without any toxicity when in absence of radiation. In-vivo studies
indicated no obvious signs of abnormal mouse behavior in body weight, eating, drinking, nor
activity. QDs accumulated in the kidney, liver, and spleen, without any further hepatic nor
renal dysfunctions and promising results were obtained in vivo.
2.1.2. Superparamagnetic iron oxides
Superparamagnetic iron oxide nanoparticles (SPIONS) are composed of an iron oxide core
that gives them paramagnetic abilities when placed in a magnetic field (Seeta et al., 2015).
SPIONS are therefore used as contrast agents in magnetic resonance imaging (MRI) as well
as for drug delivery to tumors. In addition, these types of nanoparticles have been studied
for their potential radiosensitizing properties. SPIONS have shown negligible toxicity to
healthy tissues which allows for their usage in therapy (Mikhaylov and Vasiljeva, 2011).
It was reported that these SPIONs can induce cytotoxic effects due to the production of
ROS such as hydrogen peroxide, hydroxyl radical, hydroperoxyl radical and superoxide anion
which in turn results in DNA (Huang et al., 2013) and other cellular organelle damage
(Kwatra et al., 2013). In addition, an enhancement in radiation efficacy was observed on
MCF-7 cells as the nanoparticles enhanced the impact of X-rays on ROS generation by about
240% (Klein et al., 2012).
Another example studied is a superparamagnetic chitosan iron oxide nanoparticle
carrying human Adenovirus type 5 early region 1A (E1A) gene. The E1A gene is known to
reduce the expression of HER-2 and increase the expression of p53, two proteins that are
known to play a role in the regulation of radioresistance in cancer (Kwatra et al., 2013;
Raybaud-Diogène et al., 1997). The combination of genetic therapy with increased oxidative
stress by iron oxide nanoparticles further enhanced the radiosensitivity of human cervical

Bibliography Review Chapter III. Nanotechnology: the rise of nanomedicine
82
cancer in xenografted mice (Kwatra et al., 2013; Shen et al., 2010). A nanocomposite using
Fe3O4/Ag conjugated to the EGFR antibody could be used as a theranostic agent: this
nanocomposite can be used as a diagnostic tool through MRI and was shown to be a
radiosensitizer in nasopharyngeal carcinoma in a dose-dependent manner (Zhao et al.,
2012).
2.1.3. Non-metal based nanoparticles
Non-metal based nanoparticles, although less largely used than metal-based
nanoparticles, can also be used as radiosensitizing agents. For example, Klein et al.
synthesized ultrasmall uncapped and aminosilanized oxidized silicon nanoparticles and
tested them in-vitro on MCF-7 (breast cancer) and 3T3 cells (mouse fibroblast cells). Their
results showed a radiosensitizing effect when the treated cells were exposed to X-rays of 3
Gy (Klein et al., 2013). It was also reported that these nanoparticles induced a significant
increase in ROS production that reached the mitochondria and caused oxidative stress
damage within the organelle. The increased ROS production was observed in both the
cancer cells and normal cells but the deleterious effects were more significant in cancer cells
(Klein et al., 2013; Kwatra et al., 2013).
Another example of a non-metal-based nanoparticles is C60, a fullerene that has potent
anti-cancer activities and induces markers of autophagy in cancer cells (Zhang et al., 2009)
but significant toxicity in normal tissue was put in evidence which limits its use (Sayes et al.,
2005). In order to further explore its capacities, a team used nanocrystals of underivatized
fullerene C60 (Nano- C60) at concentration that were non-toxic to normal cells and studied
their radiosensitizing potential. B16 (mouse melanoma cell line) and SMMU-7721 (human
hepato-carcinoma cell line) were treated with Nano- C60 and exposed to γ-radiation and
results showed enhanced membrane damage and induction of apoptotic cell death
(Veeraraghavan et al., 2011).
As previously mentioned, polymeric nanoparticles are also available and have been
formulated using different chemotherapeutic agents either alone or in combination (Kwatra
et al., 2013). Genexol-PM, a clinically approved formulation of paclitaxel was studied on
non-small cell lung cancer mouse xenograft models. This formulation was found to be both
a better radiosensitizer than the normal drug and a safer therapeutic issue with much
reduced exposure of the drug to the healthy lung tissue (Kwatra et al., 2013; Werner et al.,
2013). Another example is a nanomiceller composite formulation of doxorubicin which
showed a significant enhancement of radiation sensitivity in a multicellular spheroid of A549
lung cancer cell line (Xu et al., 2012).
Biodegradable lipid polymer nanoparticles have also been designed using docetaxel as the
entrapped drug and targeted to cancer tissue using folate. The studies indicated that the
targeted nanoparticles showed better radiosensitizing properties as compared to drug alone

Bibliography Review Chapter III. Nanotechnology: the rise of nanomedicine
83
or unmodified nanoparticles. The studies also showed that the radiosensitizing effects using
nanoparticulate formulations significantly depends on the time gap between the dosing of
the formulation and the radiation (Kwatra et al., 2013; Werner et al., 2011).
2.1.4. Metal-based nanoparticles
Metal-based nanoparticles will be further discussed in the next chapter.
2.2. Focus on metal-based nanoparticles
2.2.1. Hafnium nanoparticles
Hafnium oxide nanoparticles, NBTXR3, were designed so they concentrate in tumor cells
to achieve intracellular high-energy dose deposit. Magglorella et al. (2012) studied hafnium
oxide nanoparticles and observed a nine-fold radiation enhancement compared with water.
In addition, the nanoparticles showed satisfactory dispersion and persistence within the
tumor as they formed clusters in the cytoplasm of cancer cells. NBTXR3 nanoparticles have a
hydrodynamic diameter of 50 nm, a polydispersity index of 0.100, and a zeta potential of -50
mV. The irradiation source was a cobalt-60 (average photon energy: 1.25 MeV) at a dose
rate of 0.66 or 0.46 Gy/min, a 6-MV accelerator at a dose rate of 1Gy/min or an applicator
coupled to a curietherapy device containing a high dose rate iridium-192 source (average
photon energy: 0.38 MeV). The cell lines tested were HT1080 (human fibrosarcoma model),
HCT116 (human colorectal tumor cell line), and A673 (human Ewing family type sarcoma
model). Results showed the location of NBTXR3 nanoparticles in vesicles (endosomes) in the
cell’s cytoplasm. The energy release from the clusters of nanoparticles constitutes what the
authors called a dose deposit ‘hotspot’, which could lead to high and localized destruction of
biological subcellular structures and induce cell death (Maggiorella et al., 2012).
A good dispersion of NBTXR3 was observed in-vivo following one IT injection with
nanoparticles both in the central and peripheral areas of the tumor. After 14 days, the
nanoparticles were still present in the tumor but the evaluation was no longer possible due
to ethical mice sacrifice. A marked increase in the radiation response of HT1080 tumor
xenografts was observed with an enhanced biological response (EBR) over 1.5 as well as an
increase in the apoptotic response in the cells treated with NBTXR3 combined with
irradiation. Six clinical trials using NBTXR3 are ongoing with one clinical trial completed.
These clinical trials are summarized in Table 8 below.

Bibliography Review Chapter III. Nanotechnology: the rise of nanomedicine
84
Study Title Condition Phase Purpose
NBTXR3 Crystalline Nanoparticles and Radiation Therapy in Treating Patients With Soft Tissue Sarcoma of the Extremity
Adult Soft Tissue Sarcoma 1 To evaluate the feasibility of the NBTXR3 injection in the tumor, safety and the adequate dose of NBTXR3 when given with radiation therapy.
NBTXR3 Crystalline Nanoparticles and Stereotactic Body Radiation Therapy in the Treatment of Liver Cancers
Hepatocellular Carcinoma; Liver Cancer
1/2 To evaluate the safety and preliminary efficacy of NBTXR3 nanoparticles given by intralesional (IL) or intraarterial (IA) injection and activated by Stereotactic Body Radiation Therapy in the treatment of liver cancers.
NBTXR3 Nanoparticles and EBRT or EBRT With Brachytherapy in the Treatment of Prostate Adenocarcinoma
Prostate Cancer 1/2 Open-label involving 2 groups of patients newly diagnosed with either unfavorable intermediate risk or high-risk prostate adenocarcinoma. One group will receive only EBRT and the other group will receive a Brachytherapy boost and EBRT. Both groups will receive treatment with androgen deprivation. There will be consecutive steps, a dose escalation and a subsequent dose expansion part.
NBTXR3 Crystalline Nanoparticles and Radiation Therapy in Treating Patients With Locally Advanced Squamous Cell Carcinoma of the Oral Cavity or Oropharynx.
Head and Neck Cancer 1 Determination of the recommended doses and the early Dose Limiting Toxicities. Evaluation of the safety and tolerability of NBTXR3, evaluation of the objective response rate and the complete response rate as per response evaluation Criteria in Solid tumors and the tumor volume estimation; evaluation of the local progression free survival; evaluation of the progression free survival of NBTXR3; characterization of the body kinetics profile of NBTXR3; evaluation of the feasibility of local administration either intratumor or intra-arterial route.
NBTXR3 Crystalline Nanoparticles and Radiation Therapy in Treating and Randomized Patients in Two Arms With Soft Tissue Sarcoma of the Extremity and Trunk Wall
Adult Soft Tissue Sarcoma 2/3 To compare antitumor activity I terms of Pathological complete response rate of intratumor injection of NBTXR3 activated by external beam radiation therapy versus EBRT alone. Secondary outcome measures include the incidence of early and late TEAE, post-TEAE, SAE, and laboratory abnormalities; objective response rate by imaging (MRI) according to RECIST 1.1; tumor volume changes; resection margins, limb imputation rate.
A Study of PEP503 With Radiotherapy in Combination With Concurrent Chemotherapy for Patients With Head and Neck Cancer
Head and Neck Squamous Cell Carcinoma
1/2 Phase 1: Determination of the recommended doses and the dose limiting toxicities. Phase 2: the rate of locoreginal control at one year. Phase 1 and 2: Evaluation of the safety profile of PEP503
A Study of PEP503(Radio-enahncer) With Radiotherapy and Chemotherapy for Patiens With Rectal Cancer
Rectal Cancer 1/2 Determining the safety profile: dose limiting toxicity, the recommended volume (dose, and the anti-tumor activity.
*: PEP503= another name for NBTXR3.
Table 8: Ongoing clinical trials with NBTXR3 (hafnium oxide nanoparticles) as radiosensitizing agent in several different cancer types. (clinicaltrials.gov)

Bibliography Review Chapter III. Nanotechnology: the rise of nanomedicine
85
2.2.2. Silver nanoparticles
Silver nanoparticles conjugated with BSA have shown a radiosensitizing effect on gastric
cancer cells (Huang et al., 2011) and hepatocellular carcinoma (Zheng et al., 2013) probably
resulting from the release of Ag+ cations from the silver microspheres inside the cells. These
cations are oxidative agents and may capture electrons, which could further reduce the
cellular ATP content and increase ROS production (Bergs et al., 2015; Huang et al., 2011).
Magnetic silver Fe3O4/Ag nanocomposites, conjugated to an EGFR-specific antibody
(C225) were used as a theranostic agent for simultaneous molecular targeted cancer therapy
and MRI diagnosis (Zhao et al., 2012). The use of these nanoparticles in nasopharyngeal
carcinoma cells (CNEs) showed a time- and concentration-dependent inhibition of
proliferation and enhanced X-ray cytotoxicity by a factor of 2.26 (Zhao et al., 2012).
2.2.3. Titanium nanoparticles
Titanium is already used for photodynamic therapy, which is based on the generation of
radical oxygen species (ROS) upon photoactivation. Historically, nanotitania has been used
to induce cancer cell apoptosis and can be used as a photosensitizer in UV photodynamic
therapy (PTD) for endobronchial and esophageal cancers (Townley et al., 2012; Ozben,
2007). However, this technique is limited to superficial tumors due to its limitation of the
penetration depth of UV light.
Very few studies have used titanium nanoparticles as radiosensitizing agents. In 2012,
Townley et al. published a study with titania nanoparticles doped with rare earth elements.
The nanoparticles were coated with silica to inhibit aggregation and to improve its
biocompatibility. In this study, they used Hep-G2 cells, grown as 3D spheroids to best
represent the tumor environment. The combined treatment led to an increase of apoptosis
as assessed by the cells’ morphology and the loss of contact between the cells within the
spheroid. An in-vivo study was also undertaken used to test the efficacy of these
nanoparticles: human non-small cell lung cancer xenografts were established by injecting
A549 cells subcutaneously into the hind limb of SCID Beige mice. No toxicity due to
nanoparticle treatment was observed, nanoparticle augmented radiation therapy as the
tumor growth was reduced compared to radiation treatment alone: the tumors of mice who
had received the nanoparticles were approximately half the size of the ones treated with
irradiation alone. Once again, this study shows the potential use of titanium-based
nanoparticles to enhance the efficacy of radiation therapy.
In 2013, Mirjolet et al. published their work on the radiosensitization of glioblastoma cell
lines (SNB-19 and U87 MG) using titanate nanotubes (TiONts). TiONts have a diameter of
about 10 nm with an inner cavity of about 4nm, and a length of about several hundred

Bibliography Review Chapter III. Nanotechnology: the rise of nanomedicine
86
nanometers. TiONts entered the cells via endocytosis with an invagination of the membrane
or via a diffusion process and were free in cytosol or localized inside vesicles. Clonogenic
assays showed a significant radiosensitization for cells incubated with the TiONts compared
to control cells (SF2 = 0.36 vs. 0.18 for SNB-19 cells and 0.60 vs. 0.43 for U87MG cells). After
24h of treatment with or without TiONts, no differences in ROS production, early apoptosis
and autophagy was observed. However, cell cycle analysis showed an increase, in both cell
lines, of the number of cells in the G2 phase after treatment with TiONts. As cells in the G2
phase are more sensitive to radiation, treatment with TiONts led to a significant increase, in
both cell lines, of γ-H2AX foci as a result of DNA damage (residual DNA double-stranded-
break).
More recently, Nakayama et al. (2016) used titanium peroxide nanoparticles combined to
X-ray irradiation in a pancreatic cancer model. They observed an increase of hydroxyl radical
and hydrogen peroxide levels in cells treated with PAA-TiOxNPs and X-ray irradiation but
without any increase of the superoxide level. They also observed that X-ray + PAA-TiOxNPs
induced a higher number of γ-H2AX foci and induction of apoptosis. In-vivo experiments
showed a reduction of the tumor volume to 35.4% compared to X-ray alone without any
toxicity throughout the 43 days of observation. Despite an intra-tumoral injection of PAA-
TiOxNPs instead of intravenous injection, overall results from this study highlighted the
potential of using PAA-TiOxNPs combined to radiotherapy in pancreatic cancer.
2.2.4. Gold nanoparticles
Gold nanoparticles have been extensively studied in nanomedicine owing to its presumed
biocompatibility and a potential better absorption of X-rays due to its high atomic number.
Various studies show the efficient use of gold nanoparticles as radiosensitizers, with studies
showing a Dose Enhancement Factor (DEF) of up to 50. Although their toxicity is yet to be
further studied, detailed experiments were brought to light investigating the effects of
different parameters of a nanoparticle including its size, shape, surface coating,
concentration, and photon energy which each have an impact in the radiosensitizing
capacities. However, we must keep in mind that different results were obtained according to
the tumor cell lines studied. Moreover, as it was long believed that radiosensitization using
gold nanoparticles would only be achievable in keV range, it was a big surprise to observe
radiosensitization by gold nanoparticles using X-rays in the MeV range (as often used in the
medical setting).
Gold nanoparticles represent a wide platform for a variety of different applications as it
can be seen in Figure 27. The main in-vitro and in-vivo studies were summarized in a recent
paper (Her et al, 2017) as shown in the following tables. From these tables, we can observe
that gold nanoparticles have been widely studied with different sizes, types, and in different

Bibliography Review Chapter III. Nanotechnology: the rise of nanomedicine
87
cellular models and different energies showing its wide application as a radiosensitizing
agent.
Figure 27: Different types of gold nanoparticles and their applications. a. The synthetic versatility of AuNPs. AuNPs offer a unique platform for straightforward manipulation of particle size, shape, surface coating and functionalization, enabling fine-tuning of particle properties. b. Biomedical applications of AuNPs. Owing to their unique physico-chemical, optical and electronic properties, AuNPs have been exploited for a wide range of applications in diagnostics, imaging, delivery, and therapy. (Her et al., 2017)
a.
b.

Bibliography Review Chapter III. Nanotechnology: the rise of nanomedicine
88
Author (Ref) Size Conc. Surface Cell line Energy DEF/Effect
Butterworth et al., 2010 1.9 nm 2.4 µm 0.24 µm
Proprietary thiol (AuroVistTM) AGO-1552B Astro DU-145 L132 MCF-7 MDA-MB-231 PC-3 T98G
160 kVp 1.97 0.96 0.81 0.87 1.09 1.11 1.02 1.91
Chang et al., 2008 13 nm 10 nM Citrate B16F10 6 MeV e- Significant decrease in SF at 8Gy with AuNPs vs. IR alone
Chattopadhyay et al., 2013
30 nm 2.4 mg/mL
PEG HER2 targeted (trastuzumab)
MDA-MB-361 100 kVp 1.6 (targeted) 1.3 (non-targeted)
Chen et al., 2015 28 nm (18 nm core)
36 µg/mL
BSA U87 160 kVp 1.37
Chithrani et al., 2010 14 nm 50 nm 74 nm
7 X 10⁹ NPs/mL
Citrate-AuNPs HeLa 105 kVp 220 kVp 660 keV (137-Cs) 6 MVp
1.66 1.43 1.18 1.17
Coulter et al., 2012 1.9 nm 12 µM (500 µg/mL)
Proprietary thiol (AuroVistTM) MDA-MB-231 DU145 L132
160 kVp ~1.8 (MDA-MB-231)
Cui et al., 2014 2.7 nm 0.5 mg/mL
Tiopronin MDA-MB-231 225 kVp 1.04-1.44
Geng et al., 2011 14 nm 1.25, 2.5, 5 nM
Glucose SK-OV-3 90 kVp 6 MV
1.44 1.3-1.37
Jain et al., 2014 1.9 nm 12 µM (500 µg/mL)
Proprietary thiol (AuroVistTM) MDA-MB-231 160 kVp 1.41
Jain et al., 2011 1.9 nm 12 µM (500
Proprietary thiol (AuroVistTM) MDA-MB-231 L132
160 kVp 6 MV
1.41 1.29
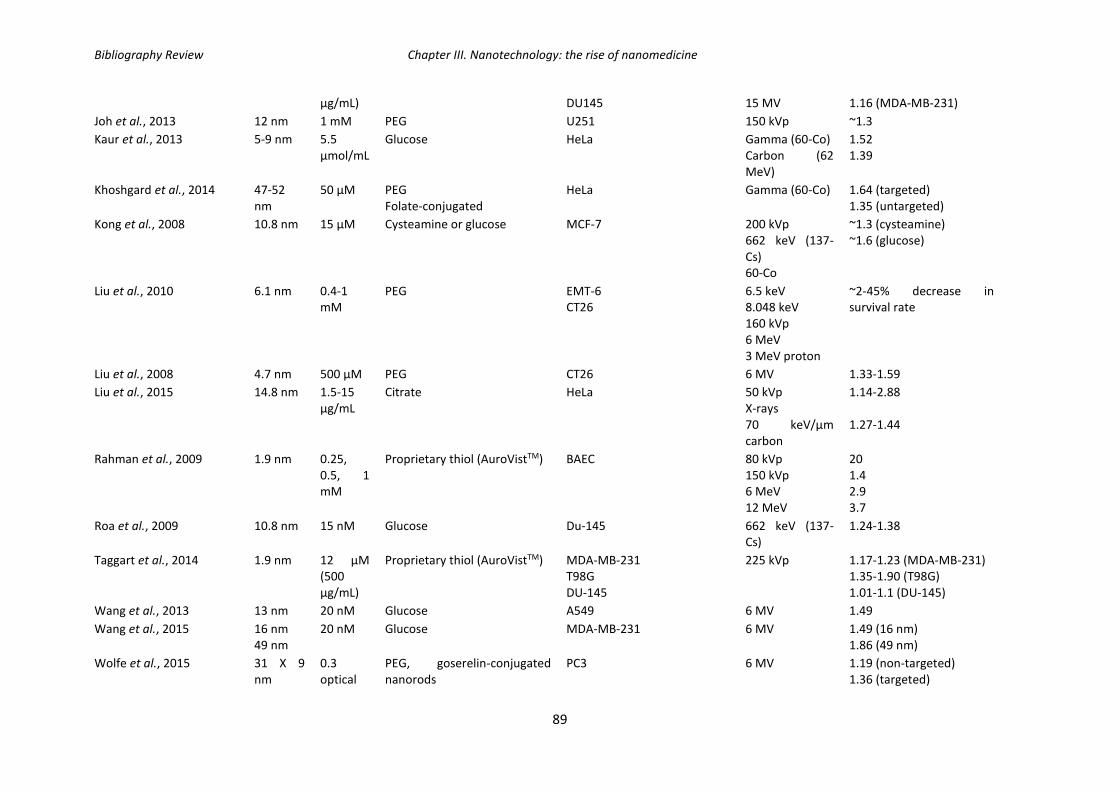
Bibliography Review Chapter III. Nanotechnology: the rise of nanomedicine
89
µg/mL) DU145 15 MV 1.16 (MDA-MB-231)
Joh et al., 2013 12 nm 1 mM PEG U251 150 kVp ~1.3
Kaur et al., 2013 5-9 nm 5.5 µmol/mL
Glucose HeLa Gamma (60-Co) Carbon (62 MeV)
1.52 1.39
Khoshgard et al., 2014 47-52 nm
50 µM PEG Folate-conjugated
HeLa Gamma (60-Co) 1.64 (targeted) 1.35 (untargeted)
Kong et al., 2008 10.8 nm 15 µM Cysteamine or glucose MCF-7 200 kVp 662 keV (137-Cs) 60-Co
~1.3 (cysteamine) ~1.6 (glucose)
Liu et al., 2010 6.1 nm 0.4-1 mM
PEG EMT-6 CT26
6.5 keV 8.048 keV 160 kVp 6 MeV 3 MeV proton
~2-45% decrease in survival rate
Liu et al., 2008 4.7 nm 500 µM PEG CT26 6 MV 1.33-1.59
Liu et al., 2015 14.8 nm 1.5-15 µg/mL
Citrate HeLa 50 kVp X-rays 70 keV/µm carbon
1.14-2.88 1.27-1.44
Rahman et al., 2009 1.9 nm 0.25, 0.5, 1 mM
Proprietary thiol (AuroVistTM) BAEC 80 kVp 150 kVp 6 MeV 12 MeV
20 1.4 2.9 3.7
Roa et al., 2009 10.8 nm 15 nM Glucose Du-145 662 keV (137-Cs)
1.24-1.38
Taggart et al., 2014 1.9 nm 12 µM (500 µg/mL)
Proprietary thiol (AuroVistTM) MDA-MB-231 T98G DU-145
225 kVp 1.17-1.23 (MDA-MB-231) 1.35-1.90 (T98G) 1.01-1.1 (DU-145)
Wang et al., 2013 13 nm 20 nM Glucose A549 6 MV 1.49
Wang et al., 2015 16 nm 49 nm
20 nM Glucose MDA-MB-231 6 MV 1.49 (16 nm) 1.86 (49 nm)
Wolfe et al., 2015 31 X 9 nm
0.3 optical
PEG, goserelin-conjugated nanorods
PC3 6 MV 1.19 (non-targeted) 1.36 (targeted)
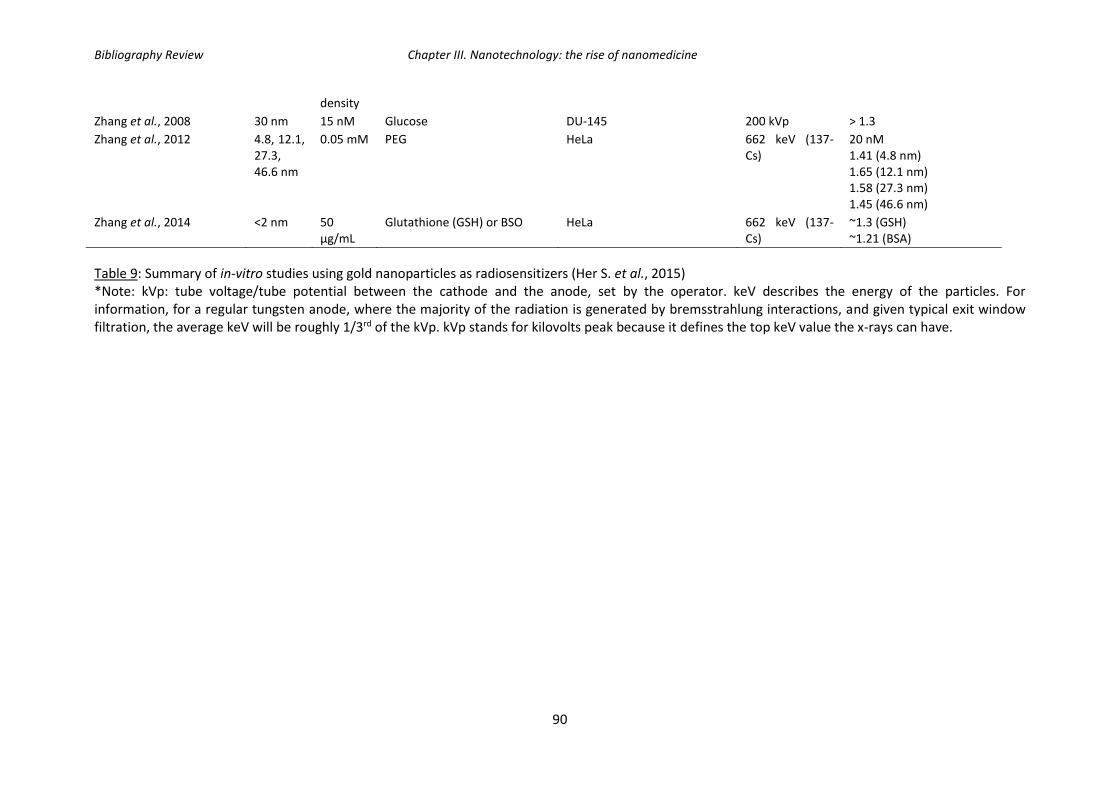
Bibliography Review Chapter III. Nanotechnology: the rise of nanomedicine
90
density
Zhang et al., 2008 30 nm 15 nM Glucose DU-145 200 kVp > 1.3
Zhang et al., 2012 4.8, 12.1, 27.3, 46.6 nm
0.05 mM PEG HeLa 662 keV (137-Cs)
20 nM 1.41 (4.8 nm) 1.65 (12.1 nm) 1.58 (27.3 nm) 1.45 (46.6 nm)
Zhang et al., 2014 <2 nm 50 µg/mL
Glutathione (GSH) or BSO HeLa 662 keV (137-Cs)
~1.3 (GSH) ~1.21 (BSA)
Table 9: Summary of in-vitro studies using gold nanoparticles as radiosensitizers (Her S. et al., 2015) *Note: kVp: tube voltage/tube potential between the cathode and the anode, set by the operator. keV describes the energy of the particles. For information, for a regular tungsten anode, where the majority of the radiation is generated by bremsstrahlung interactions, and given typical exit window filtration, the average keV will be roughly 1/3rd of the kVp. kVp stands for kilovolts peak because it defines the top keV value the x-rays can have.

Bibliography Review Chapter III. Nanotechnology: the rise of nanomedicine
91
Author Size Surface Injection dose (i.v./i.t./i.p.)
Cell model Energy Outcome
Chang et al., 2008 13 nm Citrate 200 µL, 200 nM AuNPs i.v.
B16F10 6 MeV e- Significant tumor growth delay; increase in survival
Chattopadhyay et al., 2013 30 nm PEG HER2 targeted (trastuzumab)
~0.8 mg Au (4.8 mg/g tumor) i.t.
MDA-MB-361 100 kVP, 11 Gy Tumor growth inhibition (46% vs. 16%)
Chen et al., 2015 28 nm (18 nm core)
BSA 1.3 mg/mL (250 µL) i.v.
U87 160 kVp, 3Gy at 2h post-inj + 2 Gy at 24h post-injection
Tumor regression
Hainfeld et al., 2004 1.9 nm Proprietary thiol (AuroVistTM)
1.35 g Au/kg 2.7 g Au/kg i.v.
EMT-6 250 kVp, 26 Gy 50% long-term survival (> 1 year at 1.35 g Au/kg) 86% long-term survival (> 1 year at 2.7 g Au/kg)
Hainfeld et al., 2010 1.9 nm Proprietary thiol (AuroVistTM)
1.9 g/kg i.v. SCCVII 68 keV 42 Gy 157 keV 50.6 Gy
Increase in median survival (53 vs. 76 days at 68 keV; 31 vs. 49 days at 157 keV)
Hainfeld et al., 2013 1.9 nm Proprietary thiol (AuroVistTM)
4 g Au/kg i.v. Tu-2449 100 kVp, 30Gy 50% long-term tumor-free survival (>1 year)
Joh et al., 2013 12 nm PEG 1.25 g Au/kg i.v. U251 175 kVp 20 Gy
Median survival (28 vs 14 days)
Wolfe et al., 2015 31 X 9 nm
PEG, goserilin-conjugated nanorods
100 µL, 40 µM AuNPs i.v.
PC3 6 MV Tumor growth delays 17 days (targeted) and 3 days (untargeted)
Zhang et al., 2012 4.8, 12.1, 27.3, 46.6 nm
PEG 4 mg/kg i.v. HeLa 662 keV (137-Cs) Tumor growth inhibition
Zhang et al., 2014 <2 nm Glutathione (GSH) or BSA
10 mg/kg i.p. U14 662 keV (137-Cs) ~55 (GSH-AuNPs) and ~38% (BSA-AuNPs) decrease in tumor volume.
Table 10: Summary of in-vivo studies using gold nanoparticles as radiosensitizers (Her et al., 2015).
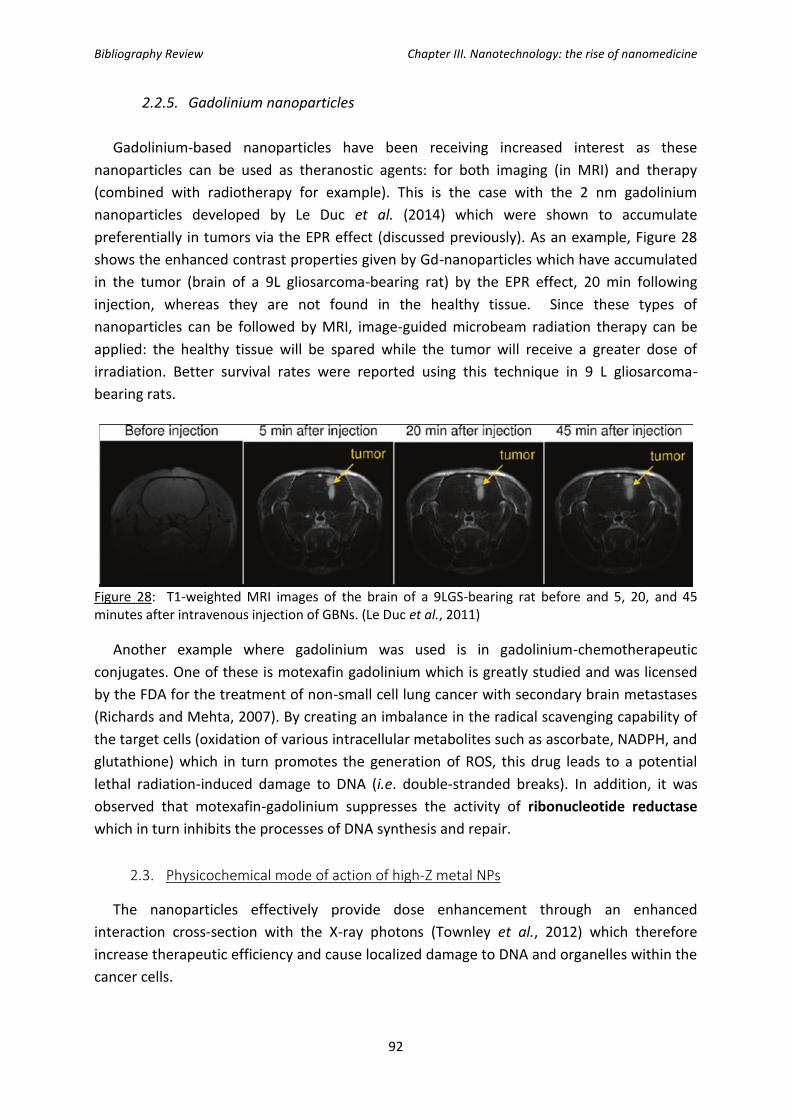
Bibliography Review Chapter III. Nanotechnology: the rise of nanomedicine
92
2.2.5. Gadolinium nanoparticles
Gadolinium-based nanoparticles have been receiving increased interest as these
nanoparticles can be used as theranostic agents: for both imaging (in MRI) and therapy
(combined with radiotherapy for example). This is the case with the 2 nm gadolinium
nanoparticles developed by Le Duc et al. (2014) which were shown to accumulate
preferentially in tumors via the EPR effect (discussed previously). As an example, Figure 28
shows the enhanced contrast properties given by Gd-nanoparticles which have accumulated
in the tumor (brain of a 9L gliosarcoma-bearing rat) by the EPR effect, 20 min following
injection, whereas they are not found in the healthy tissue. Since these types of
nanoparticles can be followed by MRI, image-guided microbeam radiation therapy can be
applied: the healthy tissue will be spared while the tumor will receive a greater dose of
irradiation. Better survival rates were reported using this technique in 9 L gliosarcoma-
bearing rats.
Figure 28: T1-weighted MRI images of the brain of a 9LGS-bearing rat before and 5, 20, and 45 minutes after intravenous injection of GBNs. (Le Duc et al., 2011)
Another example where gadolinium was used is in gadolinium-chemotherapeutic
conjugates. One of these is motexafin gadolinium which is greatly studied and was licensed
by the FDA for the treatment of non-small cell lung cancer with secondary brain metastases
(Richards and Mehta, 2007). By creating an imbalance in the radical scavenging capability of
the target cells (oxidation of various intracellular metabolites such as ascorbate, NADPH, and
glutathione) which in turn promotes the generation of ROS, this drug leads to a potential
lethal radiation-induced damage to DNA (i.e. double-stranded breaks). In addition, it was
observed that motexafin-gadolinium suppresses the activity of ribonucleotide reductase
which in turn inhibits the processes of DNA synthesis and repair.
2.3. Physicochemical mode of action of high-Z metal NPs
The nanoparticles effectively provide dose enhancement through an enhanced
interaction cross-section with the X-ray photons (Townley et al., 2012) which therefore
increase therapeutic efficiency and cause localized damage to DNA and organelles within the
cancer cells.
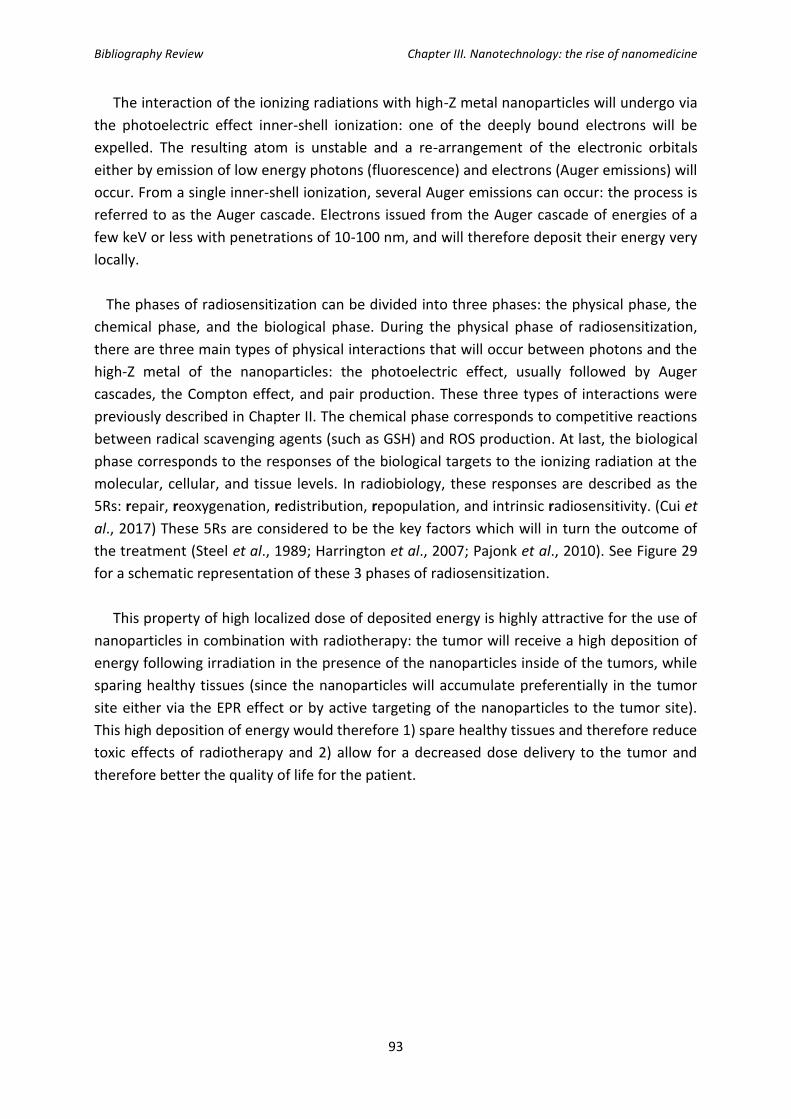
Bibliography Review Chapter III. Nanotechnology: the rise of nanomedicine
93
The interaction of the ionizing radiations with high-Z metal nanoparticles will undergo via
the photoelectric effect inner-shell ionization: one of the deeply bound electrons will be
expelled. The resulting atom is unstable and a re-arrangement of the electronic orbitals
either by emission of low energy photons (fluorescence) and electrons (Auger emissions) will
occur. From a single inner-shell ionization, several Auger emissions can occur: the process is
referred to as the Auger cascade. Electrons issued from the Auger cascade of energies of a
few keV or less with penetrations of 10-100 nm, and will therefore deposit their energy very
locally.
The phases of radiosensitization can be divided into three phases: the physical phase, the
chemical phase, and the biological phase. During the physical phase of radiosensitization,
there are three main types of physical interactions that will occur between photons and the
high-Z metal of the nanoparticles: the photoelectric effect, usually followed by Auger
cascades, the Compton effect, and pair production. These three types of interactions were
previously described in Chapter II. The chemical phase corresponds to competitive reactions
between radical scavenging agents (such as GSH) and ROS production. At last, the biological
phase corresponds to the responses of the biological targets to the ionizing radiation at the
molecular, cellular, and tissue levels. In radiobiology, these responses are described as the
5Rs: repair, reoxygenation, redistribution, repopulation, and intrinsic radiosensitivity. (Cui et
al., 2017) These 5Rs are considered to be the key factors which will in turn the outcome of
the treatment (Steel et al., 1989; Harrington et al., 2007; Pajonk et al., 2010). See Figure 29
for a schematic representation of these 3 phases of radiosensitization.
This property of high localized dose of deposited energy is highly attractive for the use of
nanoparticles in combination with radiotherapy: the tumor will receive a high deposition of
energy following irradiation in the presence of the nanoparticles inside of the tumors, while
sparing healthy tissues (since the nanoparticles will accumulate preferentially in the tumor
site either via the EPR effect or by active targeting of the nanoparticles to the tumor site).
This high deposition of energy would therefore 1) spare healthy tissues and therefore reduce
toxic effects of radiotherapy and 2) allow for a decreased dose delivery to the tumor and
therefore better the quality of life for the patient.
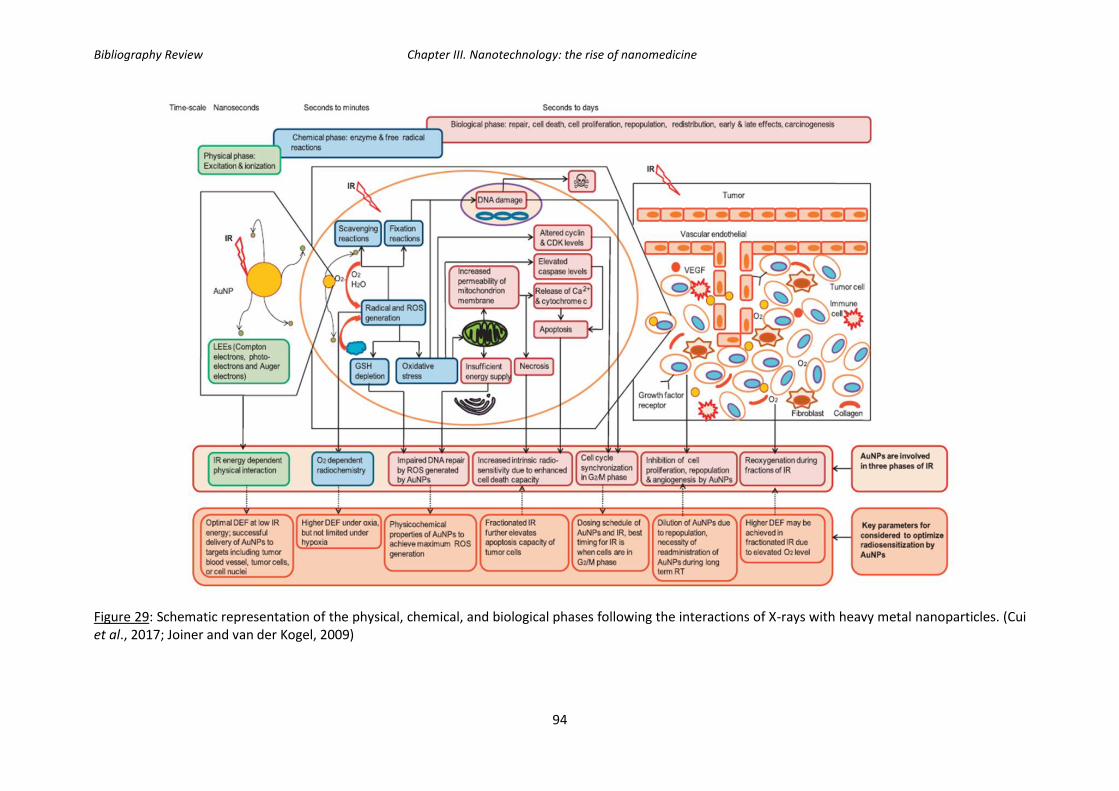
Bibliography Review Chapter III. Nanotechnology: the rise of nanomedicine
94
Figure 29: Schematic representation of the physical, chemical, and biological phases following the interactions of X-rays with heavy metal nanoparticles. (Cui et al., 2017; Joiner and van der Kogel, 2009)

Bibliography Review Chapter III. Nanotechnology: the rise of nanomedicine
95
3. AGuIX® (Activation and Guidance of Irradiation by X-ray) nanoparticles
In order to minimize the dose of ionizing radiations delivered to the patient while
enhancing the radio sensitivity of tumors, a new approach on the rise is the development of
hybrid nanoparticles made of gadolinium oxides. Gadolinium, a rare earth metal, is a high-Z
element currently used as a contrast agent for MRI. Free gadolinium ions cannot be used as
it is highly toxic in humans, but can be used by chelating the gadolinium with DOTAREM
(gadoterate muglumine), which is a gadolinium-based contrast agent indicated for
intravenous for magnetic resonance imaging (MRI) and which allows Gd3+ to form a stable
non-toxic complex.
AGuIX® present multiple characteristics that make them an attractive radiosensitizer
including their small size (hydrodynamic diameter < 5 nm), high colloidal stability and good
gadolinium chelation, absence of in-vivo toxicity, high EPR effect, biocompatibility and
possibility of IV injection, facilitated renal excretion, and their use as a contrast agent for
MRI which makes it a theranostic agent (Sancey et al., 2014).
Figure 30: Schematic representation of AGuIX® nanoparticles. Gadolinium atoms are represented in yellow and are chelated by DOTA derivatives (brownish color), and the polysiloxane matrix which is mainly composed of silicon (grey), oxygen (red), and nitrogen (blue).
3.1. AGuIX® as radiosensitizers: state-of the-art
As previously mentioned, adding a high-Z element such as gadolinium will allow for an
increased interaction with the incoming radiation (see details above, general mechanisms of
action for heavy metal nanoparticles), which will in-turn causes increased damages to cancer
cells. Since water is the major constituents of cells (~80%), the coefficient of photon mass
energy absorption is quite low compared to that of gadolinium (Figure 31 below (a)). In
addition, in Figure 31 b, we can observe the energy deposited as a function of the distance
from the nanoparticles (total energy decomposed in auger-and photo-electrons).
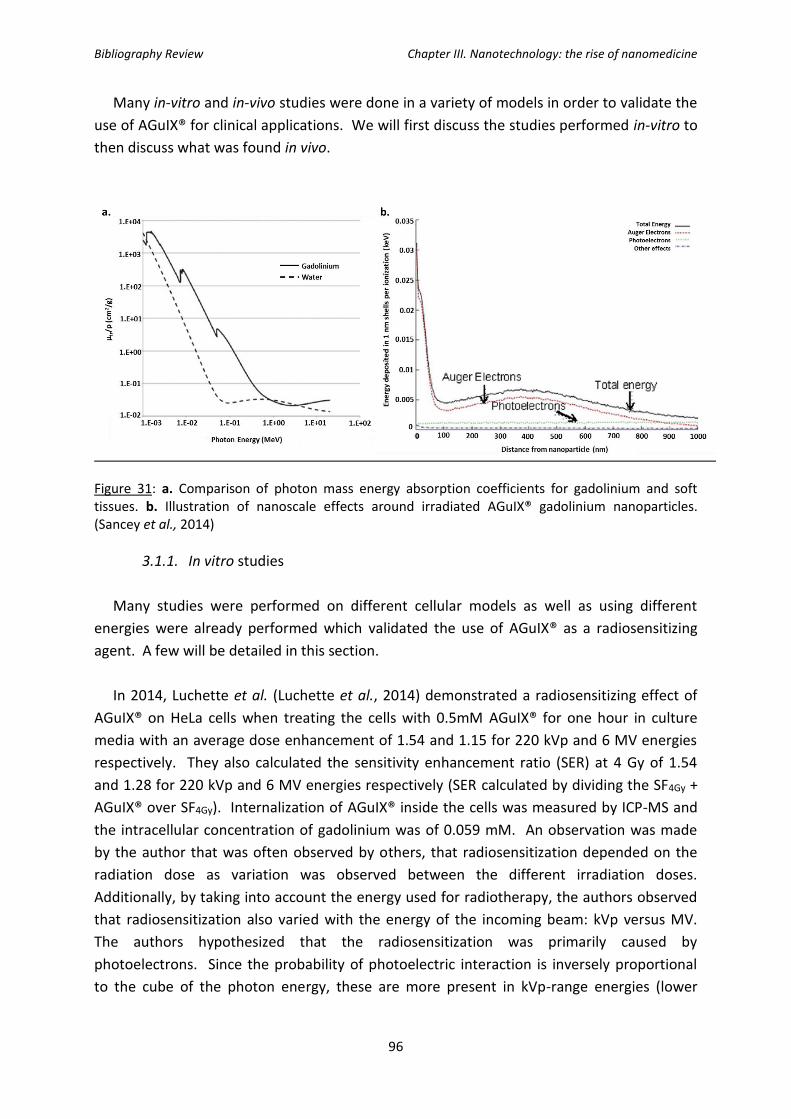
Bibliography Review Chapter III. Nanotechnology: the rise of nanomedicine
96
Many in-vitro and in-vivo studies were done in a variety of models in order to validate the
use of AGuIX® for clinical applications. We will first discuss the studies performed in-vitro to
then discuss what was found in vivo.
Figure 31: a. Comparison of photon mass energy absorption coefficients for gadolinium and soft tissues. b. Illustration of nanoscale effects around irradiated AGuIX® gadolinium nanoparticles. (Sancey et al., 2014)
3.1.1. In vitro studies
Many studies were performed on different cellular models as well as using different
energies were already performed which validated the use of AGuIX® as a radiosensitizing
agent. A few will be detailed in this section.
In 2014, Luchette et al. (Luchette et al., 2014) demonstrated a radiosensitizing effect of
AGuIX® on HeLa cells when treating the cells with 0.5mM AGuIX® for one hour in culture
media with an average dose enhancement of 1.54 and 1.15 for 220 kVp and 6 MV energies
respectively. They also calculated the sensitivity enhancement ratio (SER) at 4 Gy of 1.54
and 1.28 for 220 kVp and 6 MV energies respectively (SER calculated by dividing the SF4Gy +
AGuIX® over SF4Gy). Internalization of AGuIX® inside the cells was measured by ICP-MS and
the intracellular concentration of gadolinium was of 0.059 mM. An observation was made
by the author that was often observed by others, that radiosensitization depended on the
radiation dose as variation was observed between the different irradiation doses.
Additionally, by taking into account the energy used for radiotherapy, the authors observed
that radiosensitization also varied with the energy of the incoming beam: kVp versus MV.
The authors hypothesized that the radiosensitization was primarily caused by
photoelectrons. Since the probability of photoelectric interaction is inversely proportional
to the cube of the photon energy, these are more present in kVp-range energies (lower

Bibliography Review Chapter III. Nanotechnology: the rise of nanomedicine
97
energy and therefore high photoelectric interaction probability) (Butterworth et al., 2010;
Rahman et al., 2009; Chithrani et al., 2010; Jain et al., 2011).
Another study was published in 2015 (Detappe et al., 2015) showing a radiosensitizing
effect on Panc-1 cells (pancreatic cancer cell model). Again, two photon energies were used:
220 kVp and 6 MV (same as the energies previously used on HeLa cells), but in addition they
also test a flattening filter free 6 MV beam (FFF). The cells were treated with 0.5 mM
AGuIX®, and different incubation times were tested: 30 min, 1, 3, 6, 24, and 48 hours. They
observed a saturation of the internalization of AGuIX® after 30 minutes of treatment with a
quantification of 1.25 pg of gadolinium internalized per cell. Transmission Electron
Microscopy (TEM) images were taken in order to observe the localization of AGuIX® in Panc-
1 cells after 1 hour of internalization: the nanoparticles were predominantly localized in the
cytoplasm in vacuoles. A clonogenic survival assay (in the presence of AGuIX® during
irradiation) was done to observe the radiosensitizing effect of AGuIX®, and the following
were found:
- For the 220 kVp irradiation: SER (4Gy): 1.41; DEF 20%: 1.31
- For the 6 MV STD: SER (4Gy): 1.12; DEF 20%: 1.23
- For the 6 MV FFF: SER (4 Gy) 1.20; DEF 20%: 1.3
In 2015, another gadolinium-based nanoparticle (AGuIX® of first generation, chelated by
DTPA) were validated for the radiosensitizing potential in a head and neck squamous cell
carcinoma (HNSCC) model. SQ20B J.L. cells were treated with 0.4 mM or 0.6 mM AGuIX®
and the irradiation was done using a 250kV photon irradiator. A radiosensitizing potential
was observed with corresponding SER (2 Gy) of 1.2 (0.4 mM GBNs) and 2.06 (0.6 mM GBNs).
Localization was studied using confocal microscopy using GBNs-Cya5.5 nanoparticles and a
strictly cytosolic localization was observed. ICP-OES was performed to quantify gadolinium
content and 1.24 pg/cell of gadolinium was found. Cytotoxicity tests showed not toxicity
issues 72h after nanoparticle treatment. In order to see if the nanoparticles had an
influence on DNA double-stranded breaks (DSBs) even though the nanoparticles are not
localized in the nucleus, foci γH2Ax were quantified. Thirty minutes after a 2 Gy irradiation,
0.4 mM GBNs induced an increase of γH2Ax by 41% while 0.6 mM GBNs increased γH2Ax by
53%. Twenty-four hours after the 2 Gy irradiation, the non-treated cells returned to their
basal level of γH2Ax while in cells treated, 30% of the initial number of γH2Ax remained.
Following cell cycle analysis and caspase-2 tests, it was concluded that the combination of
GBNs with photonic irradiation inhibited cell proliferation, modified the distribution of cells
in the cell cycle and induced mitotic catastrophe leading to apoptotic cell death (Miladi et
al., 2015).
Kobt et al. studied a melanoma model (B16F10) and published in 2016 showing a
radiosensitizing effect of AGuIX® in-vitro as well as in-vivo (later discussed). B16F10 cells
were treated with 0.6 mM of AGuIX® for one hour in serum free DMEM. In order to study

Bibliography Review Chapter III. Nanotechnology: the rise of nanomedicine
98
the localization of the AGuIX® in B16F10 cells, confocal microscopy was used with FITC-
labeled AGuIX® nanoparticles. The nanoparticles were located in the cytoplasm inside
vesicles: these results were confirmed with TEM. The SER at 2 Gy was calculated and found
to be 2.08 with a DEF of 1.3. They also observed an increase in the directly lethal damage as
the α-factor increased (the α-factor is obtained from the linear quadratic equation using the
clonogenic survival curve assay). Foci γH2Ax were counted at thirty minutes and 24 hours.
While no changes were observed with the addition of AGuIX® at 30 minutes after 2 Gy
irradiation, 24 hours after irradiation, the number of residual γH2Ax increased by an average
of 9 (19.3 foci/nucleus after irradiation alone versus 28 foci/nucleus after irradiation + 0.6
mM AGuIX®). (Kobt et al., 2016)
Novel nanoparticles are being developed with the addition of the bismuth ion on AGuIX®
in order to further increase their radiosensitizing potential. This silica-based nanoparticle
(SiBiGdNP) therefore contains both gadolinium and bismuth which makes it a nanoparticle
suitable for use as an imaging agent in both MRI and CT. A549 Non-Small Cell Lung Cancer
(NSCLC) cells were treated with 0.5 mM of SiBiGdNP for 30 minutes prior to irradiation.
Irradiation with the addition of SiBiGdNP resulted in a dose enhancement factor of 1.99. An
increase in γH2Ax and 53BP1 foci was observed along with a significant increase in
apoptosis. (Detappe et al., 2017)
These studies as well as other studies using AGuIX® are summarized below in Table 11.

Bibliography Review Chapter III. Nanotechnology: the rise of nanomedicine
99
Investigator (team, town) Radiation/energy Cell line NP/incubation time Biological effect
K. Butterworth (Queen’s University, Belfast, UK)
225 keV Prostate: DU145 From 0.1 to 5.0 mM AGuIX-DTPA/1h
1.17< SF < 2.50
Glioblastoma : T98G SF= 1.25
Prostate : PC-3 1.25< SF < 1.33
R. Berbeco (Harvard, Boston, MA) 220 kVp X-ray Cervical carcinoma- HeLa 0.5mM AGuIX-DOTA/1h SER4Gy= 1.50 DEF= 1.5
C. Rodriguez-Lafrasse (University Lyon, Lyon, France
250 kV Head and neck squamous cell carcinoma- SQ20B
0.4mM AGuIX-DTPA /1h SF2 = 0.60 vs 0.72 (SER = 1.2_
0.6 mM AGuIX-DTPA /1h SF2= 0.35 vs 0.72 (SER = 2.00)
SQ20B cancer stem cells 0.6 mM AGuIX-DTPA /1h SF2= 0.6 vs 0.82 (SER= 1.60)
M. Dutreix (Institut Curie, Paris, France)
660 keV Glioblastoma- U-87MG 0.1 mM/1h γH2Ax + 80% vs irradiation only
0.5mM/1h
R. Berbeco (Harvard, Boston, MA) 6MV Cervical carcinoma- HeLa 0.5 mM AGuIX-DOTA/1h SER4Gy = 1.30 DEF = 1.2
M. Barberi-Heyob (CRAN, Nancy, France)
6 MV Glioblastoma- U-87MG From 0.01 to 0.50 mM AGuIX-DOTA/24h
SER frp, 1.10 to 1.50
G. Blondiaux (CERI, Orleans, France)
Neutron cyclotron (Orleans, France)
Mouse lymphoma- EL4 From 0.05 to 0.30 mM Estimated SER3Gy >2.00
S. Lacombe (University of Paris-Sud, Orsay, France)
Ions He2+ beam (Chiba, Japan)
Chinese hamster ovary carcinoma- CHO
1.0mM /6h SER = 1.14
S. Lacombe (University of Paris-Sud, Orsay, France)
C6+ beam (200 MeV/ma) (Chiba, Japan)
Chinese hamster ovary carcinoma- CHO
1.0mM /6h SER4Gy = 1.50
C. Rodriguez-Lafrasse (University Lyon, Lyon, France
C6+ (33.6 keV µm-1) (Caen, France)
Head and neck squamous cell carcinoma- SQ20B
0.3mM/1h SER= 1.33
0.6mM/1h SER= 1.59
Table 11: Studies of radiosensitizing effect of AGuIX® in various cellular models. (DEF: Dose Enhancement Fraction; NP, nanoparticle; SER, sensitizing enhancement ratio; SF, survival fraction. Non-human lines are indicated. a AGuIX®-DTPA; b AGuIX®-DOTA)

Bibliography Review Chapter III. Nanotechnology: the rise of nanomedicine
100
3.1.2. In-vivo studies
In-vivo studies were realized to validate the radiosensitizing effect observed in vitro with
the aim of being able to move on to clinical trials with AGuIX®. In vivo, AGuIX® nanoparticles
accumulated via the EPR effect after intravenous injection (Lux et al., 2011; Sancey et al.,
2014; LeDuc et al., 2014; LeDuc et al., 2011; Dufort et al., 2016). They were tested in several
models including glioma, head and neck, lungs, pancreas, melanoma, and multiple brain
metastases, and showed a high efficiency for both use as a contrast agent in MRI and a
radiosensitizing agent using external X-rays which makes it a strong theranostic agent.
In 2014, 9L-gliosarcoma (9LGS) cells were implanted in the brain of male fisher F344 rats.
After an intravenous injection of an aqueous solution containing 40 mM of AGuIX®, a rapid
highlight of the kidney and later of the bladder was observed by MRI. In addition,
angiography images showed a clear highlight of the blood brain vessels with a better
contrast for the nanoparticles bearing tumors due to the higher relaxivity and longer
residence time in the blood circulation. The authors observed an accumulation of AGuIX® in
the tumor via the EPR effect. Irradiation of the animals 20 minutes after the intravenous
injection of AGuIX® leads to an important increase of the median survival time to 102.5 days
which corresponds to an increased life span of 439%. (Le Duc et al., 2014)
In 2015, gadolinium-based nanoparticles (chelated by DTPA) showed a radiosensitizing
effect in SQ20B xenografted tumors. In vivo optical images were acquired and showed an
intra-tumoral localization of nanoparticles immediately after injection and for 15 minutes.
The combination of the nanoparticles with a 10 Gy irradiation strongly limited tumor growth:
the mean tumor growth was 5-fold smaller in tumors that received the combined treatment
compared to the tumors that had received irradiation only. Increased apoptotic cell death
as well as an altered tumor proliferation was observed after the addition of nanoparticle
treatment alongside radiation. (Miladi et al., 2015)
In 2016, after showing a radiosensitizing effect of AGuIX® on B16F10 melanoma cells,
these cells were othotopically grafted into mouse brains to mimic melanoma brain
metastases. A kinetic study was performed in order to determine the amount of
nanoparticles as well as their distribution within the tumor cells versus the surrounding
healthy tissues. It was concluded that radiation exposure could be performed from 1 to 24
hours after injection of the AGuIX® solution (substantial uptake of AGuIX and absence in
healthy tissue). Irradiation was done five days after tumor implantation and 3.5 hours post
AGuIX-injection for a highest tumor to healthy tissue ratio. When compared to the control
group, the addition of AGuIX® prior to irradiation improved treatment efficacy by 3-fold: the
increase in life span for the irradiated-only tumor was 8.3 % while it increased to 25% with
the addition of AGuIX®. (Kotb et al., 2016)

Bibliography Review Chapter III. Nanotechnology: the rise of nanomedicine
101
In 2017, SiBiGdNP also showed their radiosensitizing potential in vivo in a fast-growing
subcutaneous xenograft solid tumor model (A549 lung adenocarcinoma). The group treated
with SiBiGdNP followed by radiation showed a statistically significant improvement in tumor
growth delay and survival. A significant increase in DNA damage was also observed in the
tumor when the irradiation was performed after SiBiGdNP treatment (89%) compared to
radiation alone (67%), and compared to non-irradiated treated and non-treated cells control
groups (8 and 5% respectively). (Detappe et al., 2017)
In 2016, a safety evaluation and imaging properties of AGuIX® was done in nonhuman
primates (NHP). This study was performed in the context of MRI studies in atherosclerosis
bearing animals and healthy controls. In healthy NHP, the pharmacokinetics and toxicity
profiles demonstrated the absence of dose, time, and sex-effects, as well as a suitable
tolerance of intravenous administration of the nanoparticles. This preliminary investigation
reports the efficient and safe imaging of atherosclerotic plaques. Although this study does
not show the radiosensitizing properties of AGuIX®, we can show with this study the multiple
facets and opportunities that these nanoparticles offer as a strong imaging agent. (Kotb et
al., 2016)
Figure 32: T1-weighted image of a slice, including a kidney (K) and bladder (B) of a mouse before (t=0), 5 min after and 60 min after intravenous injection of AGuIX® nanoparticles. (Sancey et al., 2014)
AGuIX® renal kinetics and mechanism of elimination (Sancey et al., 2015)
In vivo studies showed a rapid kidney accumulation and renal clearance of AGuIX®
nanoparticles. This is mainly due to its small size (hydrodynamic diameter <6nm) (Deen,
2004). Twenty-four hours after intravenous injection, less than 0.2% of the injected dose of

Bibliography Review Chapter III. Nanotechnology: the rise of nanomedicine
102
the radiolabeled particles was observed in any other organ (Sancey et al., 2015; Lux et al.,
2011; Mignot et al., 2013; Kryza et al., 2011; Bianchi A et al., 2013). After injection, AGuIX®
nanoparticles rapidly reached the kidneys, as early as 5 minutes after IV injection. One week
after injection, most of the signal had been cleared, indicating effective particle elimination
from the body via urine (Figure 32).
AGuIX® nanoparticle biodegradation and toxicity studies
Concerning the elimination of AGuIX®, it was shown that small degraded particles were
eliminated from the body in the first minutes post-injection, whereas full native AGuIX® NPs
were entrapped in the proximal convoluted tubules from a few hours to several days before
elimination from the organism as native AGuIX® NPs. (Sancey et al., 2015).
Prior to a clinical application, a safety evaluation of AGuIX® was essential. The renal
function, assessed through the serum creatinine levels and histological analysis as well as the
Maximum Dose Tolerated (MDT), see Table 12). Serum creatinine results showed a transient
small increase 30 minutes after AGuIX® administration whereas histological studies showed
neither atrophic tubules nor necrotic cells in the tubules, the absence of lesions in the
glomeruli and the absence of fibrosis or edema the interstitial tissue. The authors therefore
concluded that the observed modifications were slight and transient after three consecutive
injections of AGuIX® NPs. (Sancey et al., 2015)
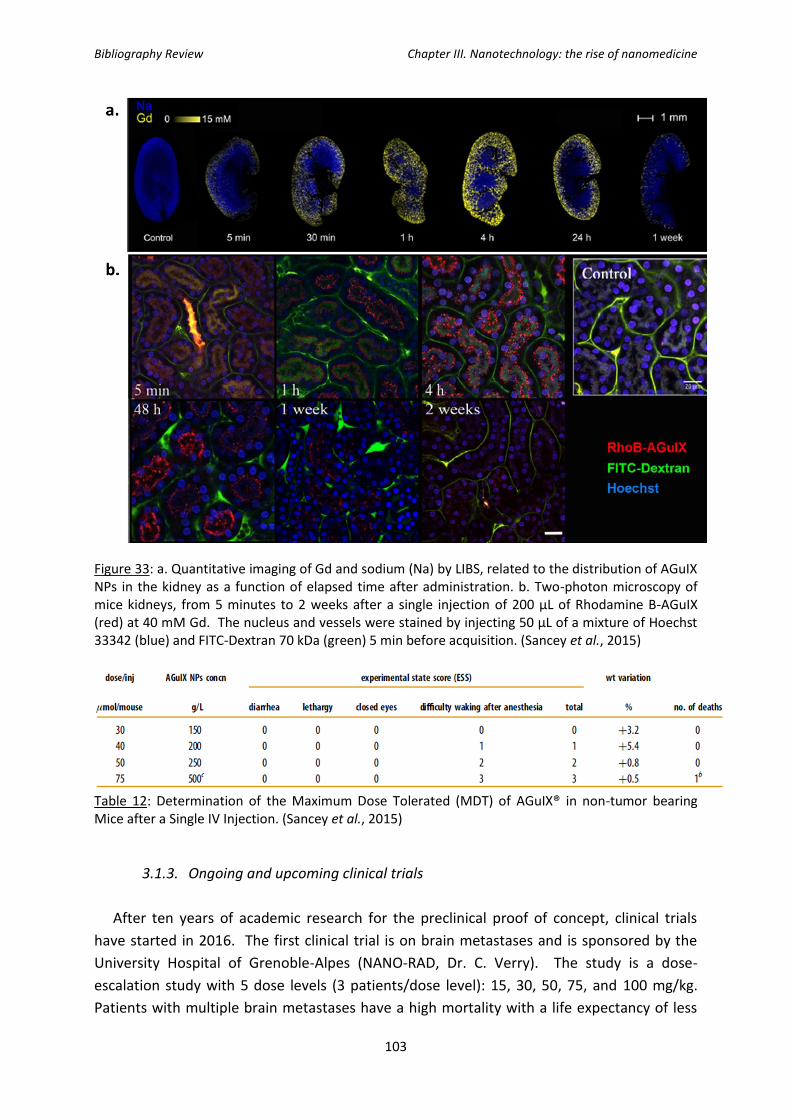
Bibliography Review Chapter III. Nanotechnology: the rise of nanomedicine
103
Figure 33: a. Quantitative imaging of Gd and sodium (Na) by LIBS, related to the distribution of AGuIX NPs in the kidney as a function of elapsed time after administration. b. Two-photon microscopy of mice kidneys, from 5 minutes to 2 weeks after a single injection of 200 µL of Rhodamine B-AGuIX (red) at 40 mM Gd. The nucleus and vessels were stained by injecting 50 µL of a mixture of Hoechst 33342 (blue) and FITC-Dextran 70 kDa (green) 5 min before acquisition. (Sancey et al., 2015)
Table 12: Determination of the Maximum Dose Tolerated (MDT) of AGuIX® in non-tumor bearing Mice after a Single IV Injection. (Sancey et al., 2015)
3.1.3. Ongoing and upcoming clinical trials
After ten years of academic research for the preclinical proof of concept, clinical trials
have started in 2016. The first clinical trial is on brain metastases and is sponsored by the
University Hospital of Grenoble-Alpes (NANO-RAD, Dr. C. Verry). The study is a dose-
escalation study with 5 dose levels (3 patients/dose level): 15, 30, 50, 75, and 100 mg/kg.
Patients with multiple brain metastases have a high mortality with a life expectancy of less
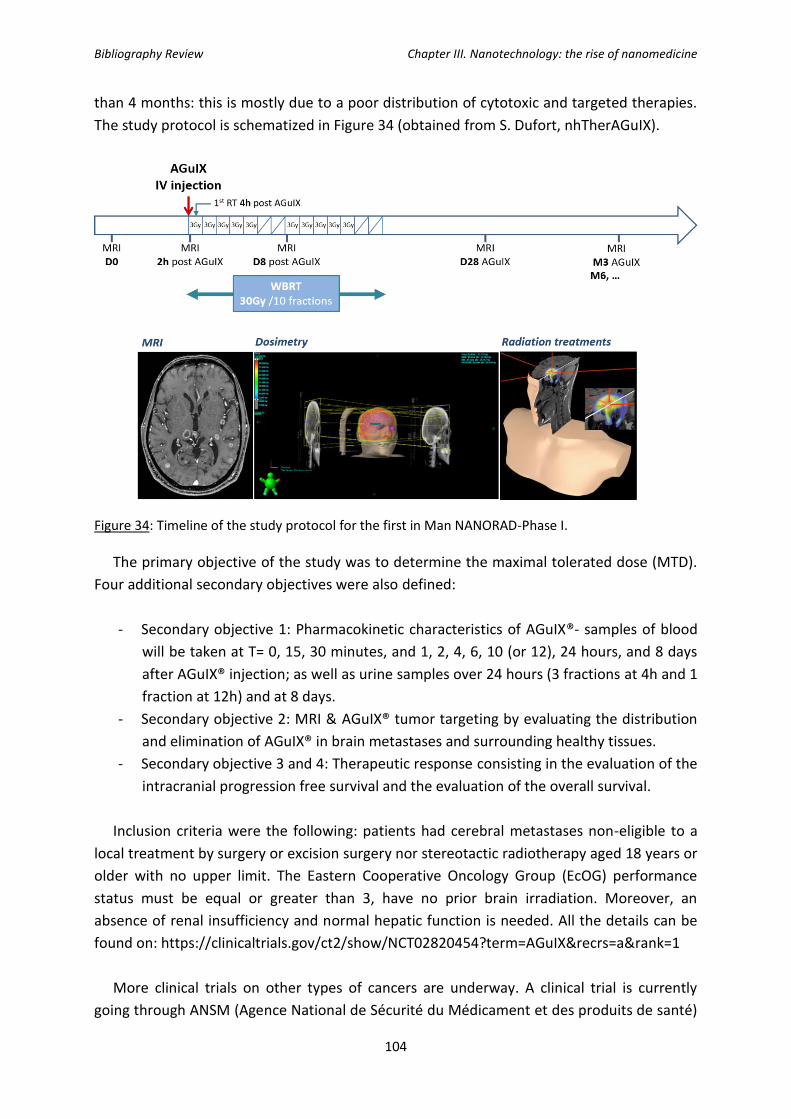
Bibliography Review Chapter III. Nanotechnology: the rise of nanomedicine
104
than 4 months: this is mostly due to a poor distribution of cytotoxic and targeted therapies.
The study protocol is schematized in Figure 34 (obtained from S. Dufort, nhTherAGuIX).
Figure 34: Timeline of the study protocol for the first in Man NANORAD-Phase I.
The primary objective of the study was to determine the maximal tolerated dose (MTD).
Four additional secondary objectives were also defined:
- Secondary objective 1: Pharmacokinetic characteristics of AGuIX®- samples of blood
will be taken at T= 0, 15, 30 minutes, and 1, 2, 4, 6, 10 (or 12), 24 hours, and 8 days
after AGuIX® injection; as well as urine samples over 24 hours (3 fractions at 4h and 1
fraction at 12h) and at 8 days.
- Secondary objective 2: MRI & AGuIX® tumor targeting by evaluating the distribution
and elimination of AGuIX® in brain metastases and surrounding healthy tissues.
- Secondary objective 3 and 4: Therapeutic response consisting in the evaluation of the
intracranial progression free survival and the evaluation of the overall survival.
Inclusion criteria were the following: patients had cerebral metastases non-eligible to a
local treatment by surgery or excision surgery nor stereotactic radiotherapy aged 18 years or
older with no upper limit. The Eastern Cooperative Oncology Group (EcOG) performance
status must be equal or greater than 3, have no prior brain irradiation. Moreover, an
absence of renal insufficiency and normal hepatic function is needed. All the details can be
found on: https://clinicaltrials.gov/ct2/show/NCT02820454?term=AGuIX&recrs=a&rank=1
More clinical trials on other types of cancers are underway. A clinical trial is currently
going through ANSM (Agence National de Sécurité du Médicament et des produits de santé)
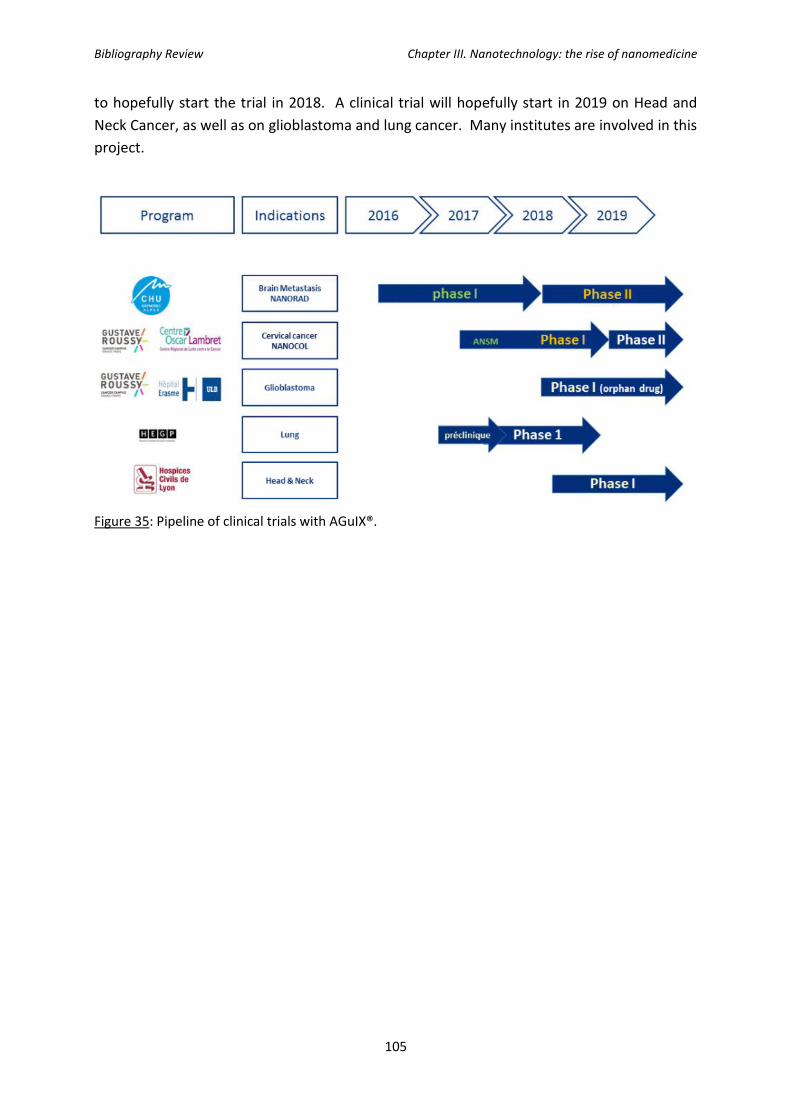
Bibliography Review Chapter III. Nanotechnology: the rise of nanomedicine
105
to hopefully start the trial in 2018. A clinical trial will hopefully start in 2019 on Head and
Neck Cancer, as well as on glioblastoma and lung cancer. Many institutes are involved in this
project.
Figure 35: Pipeline of clinical trials with AGuIX®.

Bibliography Review Chapter IV. Radical Oxygen Species (ROS) in Cancer
106

Bibliography Review Chapter IV. Radical Oxygen Species (ROS) in Cancer
107
Chapter IV. Radical Oxygen Species (ROS) in Cancer, the role of
mitochondria and other organelles
Cellular exposure to ionizing radiation leads to oxidizing events that alter the atomic
structure through the direct interactions of radiation with target macromolecules or via
products of water radiolysis that results in the generation of reactive chemical species by the
stimulation of oxidases and nitric oxide synthases (see Figure 36 below).
Figure 36: Effects of ionizing radiation on different subcellular compartments. (Taken from Azzam et
al, 2014)
Ionizing radiation may also disrupt mitochondrial functions significantly contributing to
persistent alterations in lipids, proteins, nuclear DNA (nDNA) and mitochondrial DNA
(mtDNA).
1. Water radiolysis and generation of reactive oxygen species
As previously seen in Chapter II, water is the major (∼80%) constituent of cells. The
absorption of energetic radiations by water results in both excitations and ionizations
leading to the production of free radicals that in turn can attack other critical molecules
(indirect effect). The complex events linked to the absorption of high-energy photons can be
divided into four consecutive temporal stages: during the first or “physical” stage, the energy
deposition is caused by the incident radiation and secondary electrons are generated. The
resulting species are extremely unstable and undergo fast reorganization in the second or
“physicochemical” stage. During the third stage, the various chemically reactive species
diffuse and react with one another or with the environment. In the final, biological stage, the

Bibliography Review Chapter IV. Radical Oxygen Species (ROS) in Cancer
108
cells respond to the damage resulting from the products formed in the preceding stages. The
species produced in the radiolysis of pure deaerated water are e−aq, •OH, H•, H2, and H2O2,
respectively (Ferrradini and Jay-Gerin, 1999). In the presence of oxygen, e−aq and H• atoms
are rapidly converted to superoxide/perhydroxyl (O2•−/HO2
•) radicals. In biological systems,
organic radicals (R•) are also formed, initiated by •OH radicals for example which usually
react rapidly with O2 to give peroxyl radicals (RO2•). The RO2
• radicals can abstract H• from
other molecules to form hydroperoxides (ROOH), a reaction known to be involved in lipid
peroxidation.
2. Generation of reactive nitrogen species
Ionizing radiation can also stimulate inducible nitric oxide synthase (NOS) activity in hit
cells (Mikkelsen et al, 2003), thereby generating large amounts of nitric oxide (•NO). •NO
reacts with O2 •− to form the peroxynitrite anion (ONOO−) which is highly reactive and
capable of attacking a wide range of cellular targets, including lipids, thiols, proteins and
DNA bases but in their immediate vicinity. By contrast, the much lower reactivity of H2O2 and
O2•− allows them to diffuse a longer distance away from the originating site. In the presence
of catalytic redox metal ions (principally Fe2+ and Cu+), these species lead to the production
of •OH radicals via Fenton and Haber-Weiss chemistry which can enhance damage (Halliwell
and Gutteridge, 2007).
3. Other sources of reactive species
An additional major source of intracellular ROS is the NADPH oxidases which are enzyme
complexes that catalyzes the production of superoxide from O2 and NADPH (for the four
isoforms NOX1, NOX2, NOX3 and NOX5) and the production of H2O2 by NOX4 (Meitzler et
al., 2014). Whereas tissue distribution varies greatly, cellular localization is somewhat less
diverse. All NOX proteins exist as transmembrane species and have been found, to varying
degrees, at the plasma membrane surface. Intracellular localization has been characterized
for NOX1, NOX4, and NOX5 in such structures as trafficking vesicles, the ER, mitochondria, or
nuclear membranes (Fulton, 2009; Graham et al., 2010). Mitochondrial ROS are the largest
contributor to cellular ROS and it was estimated that 1% of the total mitochondrial O2
consumption is used to produce superoxide (Quinlan et al., 2012; Handy and Loscalzo, 2012).
Mitochondria have seven known sites capable of producing superoxide (Murphy, 2009;
Brand, 2010) but the sites with the greatest maximum capacities to produce superoxide
(O2.-) are at complex I and complex III of the electron transport chain. O2
.- is then converted
to hydrogen peroxide (H2O2) by superoxide dismutase in the matrix (SOD2; also known as
MnSOD), or in the intermembrane space (SOD1; also known as CuZn–SOD). The H2O2 is
degraded in the matrix by glutathione peroxidase 1 (GPX1) or peroxiredoxins (PRDX3 or
PRDX5) using reducing equivalents obtained from the oxidation of reduced glutathione
(GSH). Oxidized glutathione (GSSG) is reduced by glutathione reductase, which obtains its
equivalents from NADPH oxidation. H2O2 generated in the matrix can oxidize proteins, lipids
or mitochondrial DNA (mtDNA). Oxidized proteins are repaired by the enzymatic systems

Bibliography Review Chapter IV. Radical Oxygen Species (ROS) in Cancer
109
thioredoxin/thioredoxin reductase and glutaredoxin (GRX)/glutathione/glutathione
reductase, as well as the methionine sulfoxide reductase depending on the oxidized damage.
TRX2 and GRX are subsequently reduced by thioredoxin reductase 2 or by glutathione. Lipid
hydroperoxides are reduced by GPX4. Ultimately, all ROS removal depends on the availability
of GSH, which is maintained by the availability of NADPH in the respective compartments.
Different subcellular compartments can be affected by ETC-derived ROS, depending on
where the superoxide is generated: ROS can be driven toward the intermembrane space or
released in the matrix. When high levels of ROS overwhelm the antioxidant capacities in
both compartments, ROS can reach cytosol since they have some ability to cross
membranes, H2O2 through aquaporins and superoxide through anion channels (Han et al.,
2003; Bienert et al., 2007). They can then participate in redox signaling or cause oxidative
damage.
Figure 37: Production of ROS and their evolution: either they degrade to water after the action of antioxidants or in the presence of Fe2+, they are converted to OH• which can cause damages to cells. (Sullivan et al., 2014)
4. Reactive oxygen species (ROS) signaling pathways regulation
Cytosolic ROS (cROS) and mitochondrial ROS (mROS) act as signaling molecules regulating
various signaling pathways. For example, it was observed that they:
- enhance phosphoinositide 3-kinase signaling (PI3K). This pathway is hyper-activated
in many cancers and it has been shown to increase proliferation, promote survival,
and increase cellular mobility (Cantley, 2002).
- activate hypoxia-inducible factors (HIFs) in order to initiate a transcriptional network
which allows tumor cells to adapt to their lower oxygen microenvironment. It was
observed that transcriptional targets of HIFs include genes that promote survival
under hypoxia, shifting to a metabolism with increased glycolysis, and the activation
of angiogenesis (Semenza, 2003)
- modify the cell’s metabolism.

Bibliography Review Chapter IV. Radical Oxygen Species (ROS) in Cancer
110
- The overproduction of ROS in cancer cells increases tumorigenic mutations which in
turn increases the production of ROS.
Surprisingly, in cancerous cells, a vicious circle is put in place as ROS will stimulate the
production of even more ROS which will in turn increase mitochondrial mutations which will
increase mROS production. Moreover, high mitochondrial ROS levels can result in long
mitochondrial permeability transition pore (mPTP) openings which may release a ROS burst
leading to the destruction of mitochondria, and if propagated from mitochondrion to
mitochondrion, a phenomenon called ROS-induced ROS release (Zorov et al., 2014).
Figure 38: Increased ROS in cells will modify cellular signaling pathways which in turn will promote cell survival, growth, and proliferation which leads to tumorigenesis. (Sullivan et al., 2014)
5. Mitochondria and delayed effects of ionizing radiation
5.1. Generalities
Mitochondria is a double membrane-bound organelle found in all eukaryotic cells and are
mostly known as the “power house” of the cell as it provides energy (ATP) to the cell.
Although energy production is one of the most known and important function of
mitochondria, it is not its only role: mitochondria are also involved in many other tasks such
as signaling, cellular differentiation and cell death, which makes it a central organelle in the
control of the cell’s fate.

Bibliography Review Chapter IV. Radical Oxygen Species (ROS) in Cancer
111
Mitochondria are complex organelles which cooperate with their host cells by
contributing to bioenergetics, metabolism, biosynthesis, and cell death or survival functions.
One of the particularities of mitochondria is that it has its own circular DNA composed of
16 569 bp encoding for 37 genes of which codes for 13 polypeptides of the mitochondrial
electron transport chain (ETC), 2 rRNA, and 22 tRNA. As we will see later, mitochondrial DNA
can also be affected by IR, and more specifically, a common deletion of 4977 bp was put in
evidence (Peng et al., 2006; Prithivirajsingh et al., 2004). The study of this common deletion
can be a functional test since it most likely results from the increased production of mROS. A
schematic representation of the mtDNA is represented in Figure 39 showing the full length
and what it codes for, as well as where the common deletion occurs.
Figure 39: Schematic representation of the mtDNA and the delimitation of the common deletion (Shen et al., 2010).
5.2. mROS production after ionizing radiations
Upon cellular exposure to ionizing radiation, ROS generating-oxidases may be activated,
antioxidants modulated, and metabolic activity altered in response to the oxidative insult.
Among the multitude of induced effects, IR may disrupt mitochondrial functions because
they occupy a substantial fraction of cell volume, they consume about 90% of the body's
oxygen and are the richest source of ROS (Cadenas and Davies, 2000) as they divert about 1-
5% of electrons from the ETC to the formation of superoxide radicals by ubiquinone-
dependent reduction (Boveris et al., 1976). The leakage of electrons (mainly from complexes
I and III of the ETC) results in the reduction of O2 to create superoxide (O2 •). Radiation
causes further leakage of electrons from the ETC and therefore results in excess O2•−
generation (Droge, 2002), in addition to the ROS produced during water radiolysis. ROS
production by mitochondria plays multiple roles in signalling cascades (Sabharwal and
Bibliography Review Chapter IV. Radical Oxygen Species (ROS) in Cancer
112
Schumacker, 2014 as a review) and mediates apoptosis (Wu and Bratton, 2015) whereas
excess ROS may cause mutations in mitochondrial DNA, and damage or alter the expression
of proteins required for critical mitochondrial and cellular functions.
5.3. mROS damage to mitochondrial DNA
Considering mitochondrial DNA (mtDNA), short- and long-term radiation-induced
ROS/RNS could result in damage to mtDNA and/or nuclear DNA (nuDNA) coding for
mitochondrial ETC subunits as well as the biochemical machinery necessary for their proper
expression and assembly. Unlike nuclear DNA, mtDNA is not protected by histones;
therefore, the proofreading capacity is limited and ROS that is generated in the matrix can
attack it (Alexeyev et al., 2013). Accordingly, the rate of mitochondrial mutation is much
greater than for nuclear DNA (Larssen et al., 2005). Among the potential mutations, which
include insertions, point mutations and changes in mtDNA copy number, the ‘common
deletion’ in the mitochondrial genome is one of the major events following ROS attack. This
deletion involves the loss of 4977 base pairs coding for genes that include subunits of the
mitochondrial ATPase, NADH dehydrogenase complex I and cytochrome c oxidase
(Prithivirajsingh et al, 2004). It has been proposed that the ‘common deletion’ leads to
inefficient mitochondrial metabolism and thus increased ROS production (Biskup and Moore,
2006).
Figure 40 schematizes the damages that can result to mitochondrial DNA mutations
throughout different stages of the tumorigenic growth. When ROS production is low, the
mitochondrial biosynthetic capacity is intact and therefore there are no or very few mtDNA
mutations. With a high ROS production, but when the mitochondrial biosynthetic capacity
remains intact even with mtDNA mutations, tumorigenicity is increased. Only once the
mitochondrial biosynthetic capacities are impaired due to the high ROS production (too
much) will the tumorigenicity decrease as cells will die.

Bibliography Review Chapter IV. Radical Oxygen Species (ROS) in Cancer
113
Figure 40: Evolution of tumorigenicity as a function of mitochondrial DNA mutations (Sullivan et al., 2014).
5.4. Other damages induced by mROS
Considering other mitochondrial functions, the inner mitochondrial membrane is located
near the site of ROS production and is therefore prone to lipid peroxidation. Peroxidation of
mitochondrial phospholipids can increase proton permeability of the inner mitochondrial
membrane (Stewart and Heales, 2003), alter the fluidity and other biophysical properties of
mitochondrial membranes and impair biochemical functions of various transporters and
respiratory enzymes in the inner and outer membranes. In that sense, cardiolipin (CL), a
phospholipid located at the level of the inner mitochondrial membrane, is known to be
intimately involved in several mitochondrial bioenergetics processes as well as
mitochondrial-dependent steps in apoptosis and mitochondrial membrane stability and
dynamics (Paradies et al., 2010). Oxidation of CL promotes the detachment of cytochrome c
from mitochondria (Petrosillo et al., 2001) leading to the permeabilization of the outer
mitochondrial membrane and the triggering of apoptosis (Ott et al., 2007). Moreover ROS
may promote mitochondrial permeability transition by causing oxidation of thiol groups on
the adenine nucleotide translocator, which is believed to form part of the mitochondrial
permeability transition pore (Valko et al., 2007).
6. Radical oxygen species and their implication in tumorigenesis
It is a well-known fact that mitochondria, even in a normal cell, produce reactive oxygen
species (mROS) as a natural byproduct of the ETC. These mROS will act as signaling
molecules and can stimulate a cell towards a “pro-growth” response. It is all a question of
balance: mROS produced by the ETC will be counteracted by anti-oxidant enzymes.
However, if the cell is unable to maintain its redox homeostasis, it can lead to a tumor-like
signaling and metabolic reprogramming. Increased ROS production has long been observed

Bibliography Review Chapter IV. Radical Oxygen Species (ROS) in Cancer
114
to be a hallmark of many tumors and cancer cell lines (Szatrowski and Nathan, 1991). As
previously mentioned, ROS can cause damage to proteins, lipids, and DNA, therefore it is
believed that ROS, if not counteracted, can promote genomic instability in turn leading to
tumors (Ames et al., 1993). As we can observe in Figure 40, tumor cells generate increased
ROS capable of increasing tumorigenesis by activating signaling pathways regulating cellular
proliferation, metabolic alterations, and angiogenesis: the cell is in a state of increased ROS
which promotes tumorigenesis but the level of ROS is not high enough to be toxic to the
cells. Only once the ROS levels have surpassed a certain level will they become toxic to the
cell and the cell will die. However, it is hard to know where that threshold is and it is often
cell type-dependent. Since ROS seems to play a crucial role in carcinogenesis, researchers
have used this knowledge to develop therapeutic approaches to kill cancer cells, and these
approaches will be described in the next paragraph.
Figure 41: Representation of the ROS levels in three different cell states alongside with the main ROS generators and ROS scavengers (Sullivan et al., 2014)
6.1. Targeting Radical Oxygen Species for therapy: a clinical approach
Even though all the different mechanisms on how ROS promotes tumorigenesis are not fully
understood, it was clearly demonstrated that ROS play an important role in the spread of
cancer as mentioned previously. Therefore, two therapeutic approaches were studied in
which case both target ROS. One involves the suppression of ROS production in order to
inhibit cellular proliferation, and the second does the opposite by increasing ROS to
overcome the “threshold” and selectively kill cancer cells. On Figure 42, one of the
approaches tries to bring back the cell to its cytostatic state, while the other aims at
overcoming the threshold so that the ROS levels are cytotoxic. Figure 42 schematizes these
two approaches.
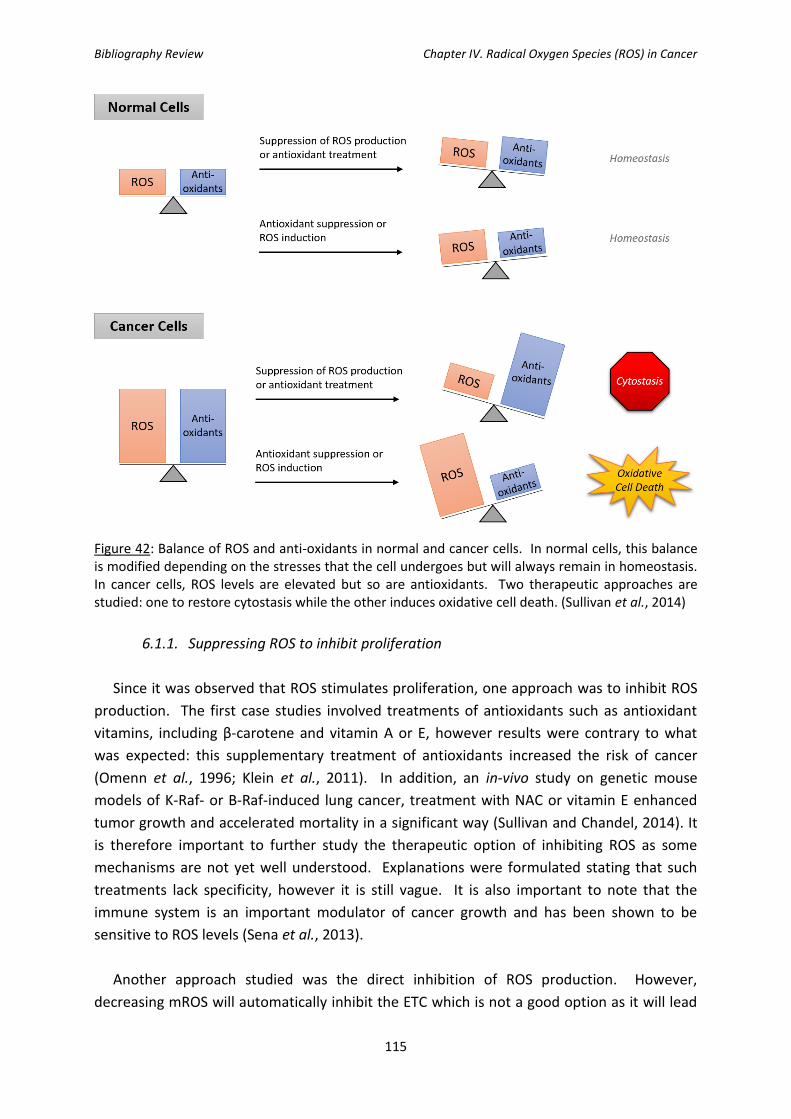
Bibliography Review Chapter IV. Radical Oxygen Species (ROS) in Cancer
115
Figure 42: Balance of ROS and anti-oxidants in normal and cancer cells. In normal cells, this balance is modified depending on the stresses that the cell undergoes but will always remain in homeostasis. In cancer cells, ROS levels are elevated but so are antioxidants. Two therapeutic approaches are studied: one to restore cytostasis while the other induces oxidative cell death. (Sullivan et al., 2014)
6.1.1. Suppressing ROS to inhibit proliferation
Since it was observed that ROS stimulates proliferation, one approach was to inhibit ROS
production. The first case studies involved treatments of antioxidants such as antioxidant
vitamins, including β-carotene and vitamin A or E, however results were contrary to what
was expected: this supplementary treatment of antioxidants increased the risk of cancer
(Omenn et al., 1996; Klein et al., 2011). In addition, an in-vivo study on genetic mouse
models of K-Raf- or B-Raf-induced lung cancer, treatment with NAC or vitamin E enhanced
tumor growth and accelerated mortality in a significant way (Sullivan and Chandel, 2014). It
is therefore important to further study the therapeutic option of inhibiting ROS as some
mechanisms are not yet well understood. Explanations were formulated stating that such
treatments lack specificity, however it is still vague. It is also important to note that the
immune system is an important modulator of cancer growth and has been shown to be
sensitive to ROS levels (Sena et al., 2013).
Another approach studied was the direct inhibition of ROS production. However,
decreasing mROS will automatically inhibit the ETC which is not a good option as it will lead
Bibliography Review Chapter IV. Radical Oxygen Species (ROS) in Cancer
116
to toxicity through inhibition of mitochondrial respiration. Again, surprising results were
obtained, as patients taking the drug metformin, an inhibitor of complex I of the ETC, have a
reduced risk of cancer incidence and mortality (Noto et al., 2012; El-Mir et al., 2000; Owen et
al., 2000). Another approach is to inhibit NADPH oxidases: loss of NOX 4 showed an
activation of apoptosis in pancreatic cancer cells (Mochizuki et al., 2006). Additional positive
results were obtained using inhibitors of NADPH oxidase activity on mouse models of cancer
in-vivo (Bhandarkar et al., 2009; Munson et al., 2012).
6.1.2. Increasing ROS to selectively kill cancer cells
Increasing ROS production in order to overcome the threshold and have a cytotoxic level
of ROS has been proposed in different therapeutic approaches. Indeed, as seen in Chapter 3,
the use of nanoparticles to radiosensitize cancer cells is expected to increase the ROS levels
to a toxic level to provoke cell death. This mechanism is also how many current
chemotherapeutics function (Conklin; 2004).
Another interesting approach used is the inhibition of antioxidants since cancer cells
increase their expression in order to maintain homeostasis. By inhibiting antioxidants, the
cells will be exposed to their endogenously produced ROS which, without defense, can be
toxic (Gorrini et al., 2013). Another approach involves the use of chemical drugs such as
dimethylfumarate (a glutathione depleting agent) and L-buthionine sulfoximine (a GSH
biosynthesis inhibitor) so the cell is unable to “counter-act” with the submerging quantity of
ROS produced. It was observed that the transient alteration of the cellular redox buffering
before irradiation triggered apoptosis in a head and neck squamous cell carcinoma model
(Boivin et al., 2011).
7. Effects of ionizing radiation on lysosomes and other cell organelles
Most studies studying the effects of ionizing radiation focus on the damages done on the
nucleus, and more specifically on DNA. As these effects were already thoroughly discussed
in Chapter 2, we will therefore focus on a quick overview of the other organelles that can
also be damaged by ionizing radiation such as lysosomes, plasma membrane or the
endoplasmic reticulum.
7.1. Effects of ionizing radiation on lysosomes
In attempts to explain the cytotoxic effects of radiation damage, HO· has been repeatedly
invoked as an important intermediate, because HO· forms by radiolysis of water. However, it
should be noted that even small amounts of H2O2 formed intra-lysosomally should induce
substantial Fenton-type chemistry leading to lysosomal rupture with release of hydrolytic
enzymes and redox-active iron (Persson et al., 2005). Released lysosomal redox-active iron
may partly relocate to nuclear and mitochondrial DNA, causing site-specific HO· production

Bibliography Review Chapter IV. Radical Oxygen Species (ROS) in Cancer
117
in the presence of oxidative stress (Tenopoulou et al., 2005). Such site-specific HO· induction
would be much more powerful with respect to DNA damage than random formation of HO·
due to radiolysis of water.
7.2. Effects of ionizing radiation on other cell organelles
IR has also recently been shown to induce endoplasmic reticulum (ER) stress thereby
activating the unfolded protein response (UPR) signaling pathway in intestinal epithelial
cells, an activation that precedes caspase activation in irradiated IEC-6 cells. (Lee et al.,
2014). ER stress has also been shown to trigger both apoptosis and autophagy, and act as an
important mediator linking the two programmed cell death pathways (Moretti et al., 2007).
Apart from the radiation-induced plasma membrane signaling involving the acid
SMase/ceramide pathway (see Chapter V), the effects of IR on biological membranes include
alterations in membrane proteins, peroxidation of unsaturated lipids accompanied by
perturbations of the lipid bilayer polarity and fluidity (Berroud et al., 1996). Moreover,
membrane lipid peroxidation results in increased membrane permeability to small molecules
and ions (Stanimirovic et al., 1995). The inability of plasma membrane to maintain ionic
homeostasis could therefore result in cell death.

Bibliography Review Chapter V. Ionizing Radiation (IR)-induced cell death
118
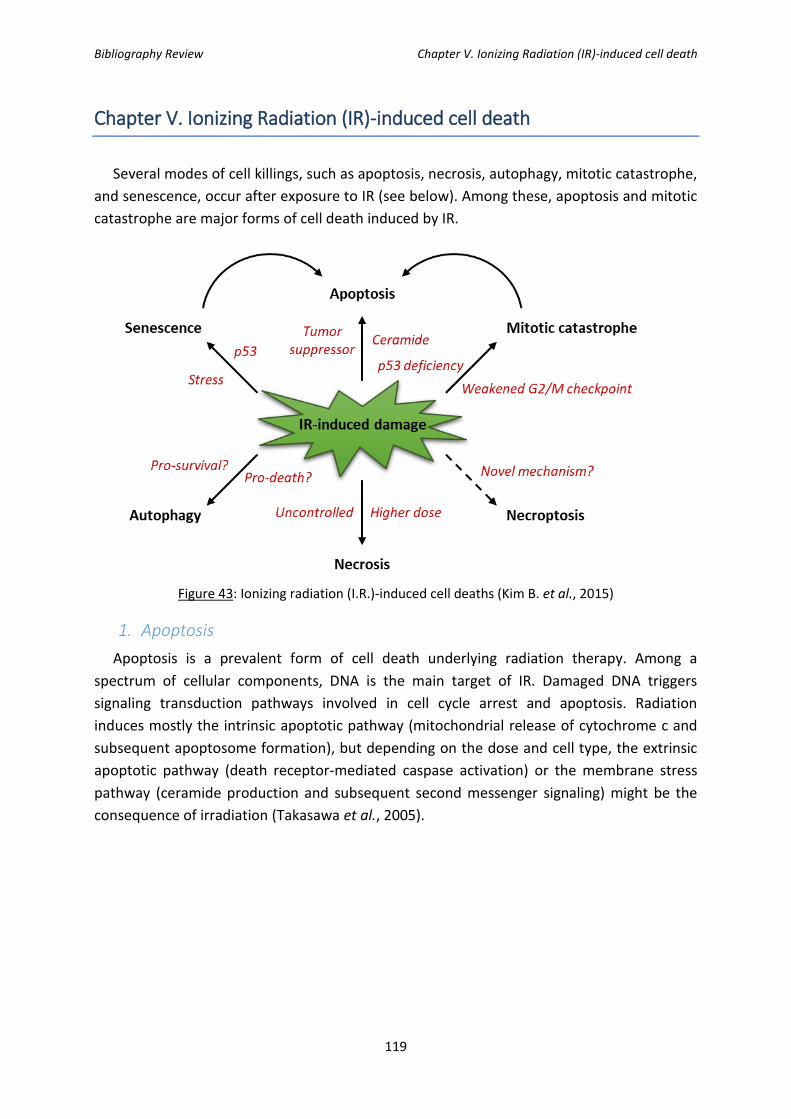
Bibliography Review Chapter V. Ionizing Radiation (IR)-induced cell death
119
Chapter V. Ionizing Radiation (IR)-induced cell death
Several modes of cell killings, such as apoptosis, necrosis, autophagy, mitotic catastrophe,
and senescence, occur after exposure to IR (see below). Among these, apoptosis and mitotic
catastrophe are major forms of cell death induced by IR.
Figure 43: Ionizing radiation (I.R.)-induced cell deaths (Kim B. et al., 2015)
1. Apoptosis
Apoptosis is a prevalent form of cell death underlying radiation therapy. Among a
spectrum of cellular components, DNA is the main target of IR. Damaged DNA triggers
signaling transduction pathways involved in cell cycle arrest and apoptosis. Radiation
induces mostly the intrinsic apoptotic pathway (mitochondrial release of cytochrome c and
subsequent apoptosome formation), but depending on the dose and cell type, the extrinsic
apoptotic pathway (death receptor-mediated caspase activation) or the membrane stress
pathway (ceramide production and subsequent second messenger signaling) might be the
consequence of irradiation (Takasawa et al., 2005).
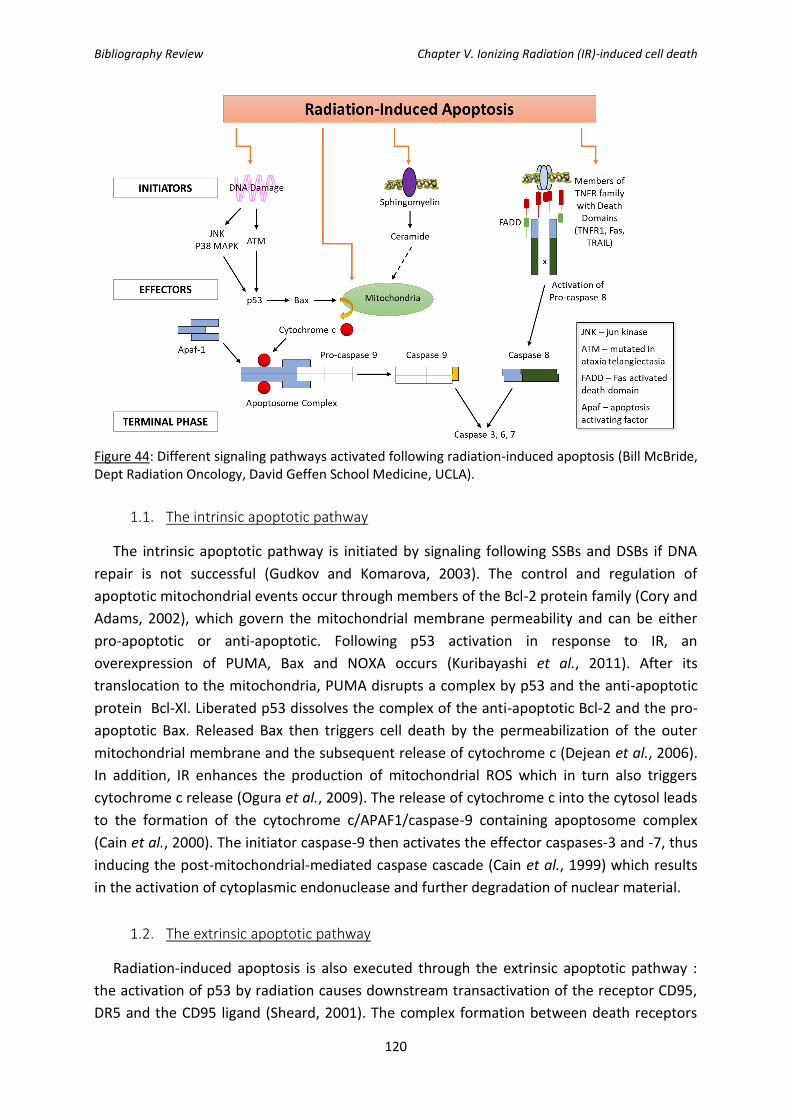
Bibliography Review Chapter V. Ionizing Radiation (IR)-induced cell death
120
Figure 44: Different signaling pathways activated following radiation-induced apoptosis (Bill McBride, Dept Radiation Oncology, David Geffen School Medicine, UCLA).
1.1. The intrinsic apoptotic pathway
The intrinsic apoptotic pathway is initiated by signaling following SSBs and DSBs if DNA
repair is not successful (Gudkov and Komarova, 2003). The control and regulation of
apoptotic mitochondrial events occur through members of the Bcl-2 protein family (Cory and
Adams, 2002), which govern the mitochondrial membrane permeability and can be either
pro-apoptotic or anti-apoptotic. Following p53 activation in response to IR, an
overexpression of PUMA, Bax and NOXA occurs (Kuribayashi et al., 2011). After its
translocation to the mitochondria, PUMA disrupts a complex by p53 and the anti-apoptotic
protein Bcl-Xl. Liberated p53 dissolves the complex of the anti-apoptotic Bcl-2 and the pro-
apoptotic Bax. Released Bax then triggers cell death by the permeabilization of the outer
mitochondrial membrane and the subsequent release of cytochrome c (Dejean et al., 2006).
In addition, IR enhances the production of mitochondrial ROS which in turn also triggers
cytochrome c release (Ogura et al., 2009). The release of cytochrome c into the cytosol leads
to the formation of the cytochrome c/APAF1/caspase-9 containing apoptosome complex
(Cain et al., 2000). The initiator caspase-9 then activates the effector caspases-3 and -7, thus
inducing the post-mitochondrial-mediated caspase cascade (Cain et al., 1999) which results
in the activation of cytoplasmic endonuclease and further degradation of nuclear material.
1.2. The extrinsic apoptotic pathway
Radiation-induced apoptosis is also executed through the extrinsic apoptotic pathway :
the activation of p53 by radiation causes downstream transactivation of the receptor CD95,
DR5 and the CD95 ligand (Sheard, 2001). The complex formation between death receptors

Bibliography Review Chapter V. Ionizing Radiation (IR)-induced cell death
121
and their cognate death ligands results in receptor trimerization and clustering of death
domain receptors. Furthermore, recruitment of an adaptor protein like as Fas-associated
death domain (FADD) mediated by Death Domain (DD) leads to the formation of the death
inducing signaling complex (DISC) by the interaction between pro-caspase 8 and FADD. The
resulting complex activates caspase-8 as a caspase initiator which in turn triggers
executioner caspases 3 and 7 which results in cell death (Fulda and Debatin, 2006).
1.3. The membrane stress apoptotic pathway
DNA damage-independent apoptotic processes do not require p53. Radiation-induced
plasma membrane damage results in the activation of sphingomyelinase (Kolesnick, 2002),
followed by the release of ceramide, which acts as the second messenger. Once released,
ceramide exhibits diverse effects on signalling complexes including the:
- activation of stress-activated protein kinases (SAPKs) such as JNK and p38 (Ruvolo, 2003),
- activation of the kinase suppressor of Ras (KSR-1) pathway resulting in the up-regulation of
the downstream MAPK pathway (Zhang et al., 1997),
- binding to cathepsin D
- recruitment and activation of protein phosphatases (Pettus et al., 2002)
- …
2. Mitotic catastrophe
Along with apoptosis, mitotic catastrophe accounts for the majority of IR-induced cancer
cell death. Mitotic catastrophe or mitotic cell death results from the premature induction of
mitosis before completion of the S and G2 phases (Castedo et al., 2004). Aberrant mitosis
produces an atypical chromosome segregation and cell division causing the formation of
giant cells with aberrant nuclear morphology, multiple nuclei, or several micronuclei
(Eriksson et al., 2007). Interestingly, mitotic catastrophe can be enhanced by a p53
deficiency and a weakened G2/M checkpoint (Ianzini et al., 2006). The induction of mitotic
catastrophe induced by IR is associated with the increased expression of cyclin B1 and the
kinase activity of Cdc2 (Ianzini et al., 1997).
As a conclusion, it has been suggested that IR-induced cellular damage may induce the
premature entry of cells into mitosis and that mitotic cell death may be a key contributor to
the loss of clonogenic potential in tumor cells and solid tumors exposed to IR, especially
those with a p53 deficiency.
3. Necrosis and necroptosis
Necrosis has historically been regarded as an uncontrolled, i.e., not genetically regulated,
form of cell death. Necrosis is much less common after IR treatment but does occur. The
decision as to whether they will undergo apoptosis or necrosis after IR exposure seems to be
dose-dependent in some cancer cell types, as shown by Rainaldi and co-workers (2003).

Bibliography Review Chapter V. Ionizing Radiation (IR)-induced cell death
122
More recently, a programmed/genetically regulated type of necrosis, necroptosis, was
identified : this program is caspase-independent and controlled by the receptor-interacting
protein 1 and 3 (RIP1/3) kinases (Cho et al., 2009). Although little is known about this type of
death, recent studies indicate necroptosis to be a novel mechanism of IR-induced death of
some endocrine cancer cell types, such as thyroid and adrenocortical carcinoma cells (Neh
et al., 2011).
4. Senescence
Senescent cells are viable but non-dividing and undergo irreversible cell cycle arrest and
stop DNA synthesis. Cellular senescence is a process that results from multiple mechanisms,
including telomere shortening, tumor suppressor signals such as p53 and p16INK4A/pRb,
and DNA damage. Although p53-independent mechanisms have also been described in IR-
induced senescence (Chen et al., 2010), a genetically regulated response to IR-induced DNA
damage is usually seen in solid tumor-derived cell lines, especially those with wild-type p53
(Mirzayans et al., 2005). Indeed, the IR-induced retardation of tumor growth is largely
attributable to the induction of senescence, not apoptosis, in some lung cancer cell types
(Luo et al., 2013).
5. Autophagy
Autophagy induced by radiation is critical to the cell fate’s decision, particularly in solid
tumors (Jaboin et al., 2007). Autophagy induced by radiation play bi-directional effects in the
cell fate’s decision whether cells survive or die depending on the severity and duration of
this phenomenon (Dalby et al., 2010). Besides, dual activity of autophagy on tumor cell fate
in-vitro (Mo et al., 2014 ; Wu et al., 2014), as well as recently in-vivo studies, also
demonstrated that irradiation-induced autophagy exerts a crucial activity on tumor
clearance by the immune system (Huang et al., 2014).
Figure 45: In-vitro and in-vivo observations following autophagy induced by radiation.
As radiation can directly or indirectly damage DNA which can activate the repair signaling
pathway, a large number of proteins participating in the DNA damage repair signaling
pathway such as p53 (Fei et al., 2003), ATM, PARP1 (Rodriguez-Vargas et al., 2012) , FOXO3a,
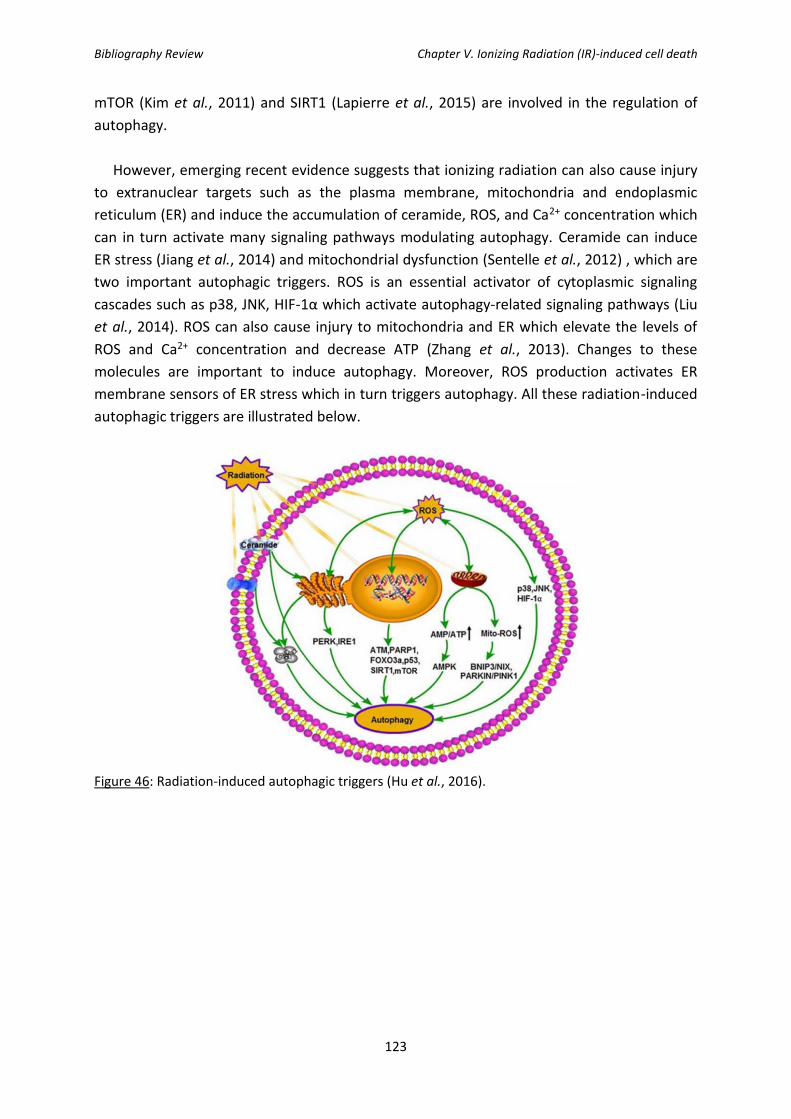
Bibliography Review Chapter V. Ionizing Radiation (IR)-induced cell death
123
mTOR (Kim et al., 2011) and SIRT1 (Lapierre et al., 2015) are involved in the regulation of
autophagy.
However, emerging recent evidence suggests that ionizing radiation can also cause injury
to extranuclear targets such as the plasma membrane, mitochondria and endoplasmic
reticulum (ER) and induce the accumulation of ceramide, ROS, and Ca2+ concentration which
can in turn activate many signaling pathways modulating autophagy. Ceramide can induce
ER stress (Jiang et al., 2014) and mitochondrial dysfunction (Sentelle et al., 2012) , which are
two important autophagic triggers. ROS is an essential activator of cytoplasmic signaling
cascades such as p38, JNK, HIF-1α which activate autophagy-related signaling pathways (Liu
et al., 2014). ROS can also cause injury to mitochondria and ER which elevate the levels of
ROS and Ca2+ concentration and decrease ATP (Zhang et al., 2013). Changes to these
molecules are important to induce autophagy. Moreover, ROS production activates ER
membrane sensors of ER stress which in turn triggers autophagy. All these radiation-induced
autophagic triggers are illustrated below.
Figure 46: Radiation-induced autophagic triggers (Hu et al., 2016).

124

125
Materials and Methods

126

Materials and Methods
127
1. Cell culture and treatments
1.1. Cell Culture
SQ20B J.L. cell line was used as the in vitro model in this study. This cell line was derived
from a human larynx radioresistant carcinoma obtained from the John Little Laboratory
(Harvard School of Public Health, Boston, USA). SQ20B J.L. cells were previously
characterized with a 2Gy survival fraction of 72%.
The cells were cultured in Dulbecco’s Modified Eagle’s Medium-Glutamax (DMEM-
Glutamax) containing 4.5 g/L of glucose (ThermoFisher ref 10566016), supplemented by 10%
of fetal calf serum (FCS) (PAA ref A15-151), 0.04 mg/l of hydrocortisone (Sigma ref H0396),
100 U/ml of penicillin and 0.1 g/L of streptomycin (PAA ref P11-010). The cells were kept in
an incubator at a constant temperature of 37°C and 5% CO2.
1.2. AGuIX® (Activation and Guidance of Irradiation by X-ray) nanoparticles
AGuIX® nanoparticles were provided by a collaborative research group, the laboratory of
O. Tillement (FENNEC Team director, part of the Institut Lumière Matière laboratory,
University Claude Bernard Lyon 1).
These nanoparticles are made of a polysiloxane core grafted to 7-10 Gd-DOTA species via
amide functions in the periphery. Their molecular mass is about 8.5 +/- 1 kDa with a
hydrodynamic diameter of 3.0+/- 0.1nm. A detailed description of these nanoparticles was
previously reported by Sancey et al (2014). Figure 47 shows a schematic representation of
AGuIX® nanoparticles along with their main characteristics.

Materials and Methods
128
Figure 47: Characterization of AGuIX® nanoparticles. a. Schematic representation of AGuIX®. b. Hydrodynamic diameter and c. Zeta potential, measured by DLS d. Physical properties of AGuIX®. (Kotb et al., 2016)
1.3. AGuIX® treatment of SQ20B cells
Preparation of the AGuIX® solution
AGuIX® were received lyophilized for a better conservation. The day of the treatment,
AGuIX® are resuspended in sterile dH2O for a minimum of one hour. AGuIX® were then
diluted to the appropriate concentration in DMEM alone. Once resuspended, the
nanoparticles are kept for a maximum of 24 hours for stability purposes.
SQ20B treatment
SQ20B J.L. cells were seeded at a density of 40 000 cells/cm2 16 hours prior to AGuIX®
treatment. Before treatment, cells were washed with Phosphate-Buffered Saline (PBS), and
then incubated with 0.8mM Gd for 24 hours in DMEM-Glutamax alone (without FCS). After
the 24 hours of incubation with AGuIX®, the nanoparticles were removed, the cells were
washed twice with PBS and full SQ20B J.L. culture media was added to the flasks before
irradiation.
1.4. DMF/BSO treatment
After the 24h AGuIX® treatment, the cells were rinsed twice with PBS. The cells were then
incubated for four hours prior to irradiation with dimethylfumarate (DMF 250 mM
solubilized in DMSO), a GSH-depleting agent, and L-buthionine sulfoximine (BSO 100 mM

Materials and Methods
129
solubilized in PBS) an inhibitor of GSH biosynthesis, at working concentrations of 100µM
each. Controls without DMF/BSO were done in parallel to directly compare both conditions.
1.5. Photon Irradiation
Monolayers of cultured cells were irradiated using an X-Rad 320 irradiator (Precision X-ray
Inc., North Branford, CT) located at the Lyon-Sud Medical School, with an energy of 250 kV
and an intensity of 15 mA delivered at a dose rate of 2Gy/min. The distance between the
beam and the cells was kept constant at 50 cm. Figure 48 is a photo taken of the interior of
the X-Rad 320 irradiator and the screen for the control panel.
*Note: the cells were never irradiated in the presence of AGuIX®. After the 24 hours
treatment, the “non-internalized” nanoparticles were washed off, and the cells were
irradiated solely with the nanoparticles inside the cells or the ones that had adhered to the
cells’ membrane.
Figure 48: Photo of the interior of the X-ray irradiator (Laboratory of Cellular and Molecular Radiobiology, Lyon-Sud Medical School, Lyon, France).
2. Characterization of the radiosensitization effect of SQ20B J.L. cells by
AGuIX®
2.1. Determining the AGuIX® concentration and ideal medium for a radiosensitizing
effect
This next section will describe the protocol used for determining the radiosensitizing
conditions of SQ20B JL cells with AGuIX® nanoparticles. The radiosensitizing effect of AGuIX®
was determined and validated by the clonogenic survival curve assay.
SQ20B J.L. cells were plated in 25 cm2 flasks at a density of one million 16 hours prior to
AGuIX® treatment. The cells were then treated as previously detailed in paragraph 1.3. After
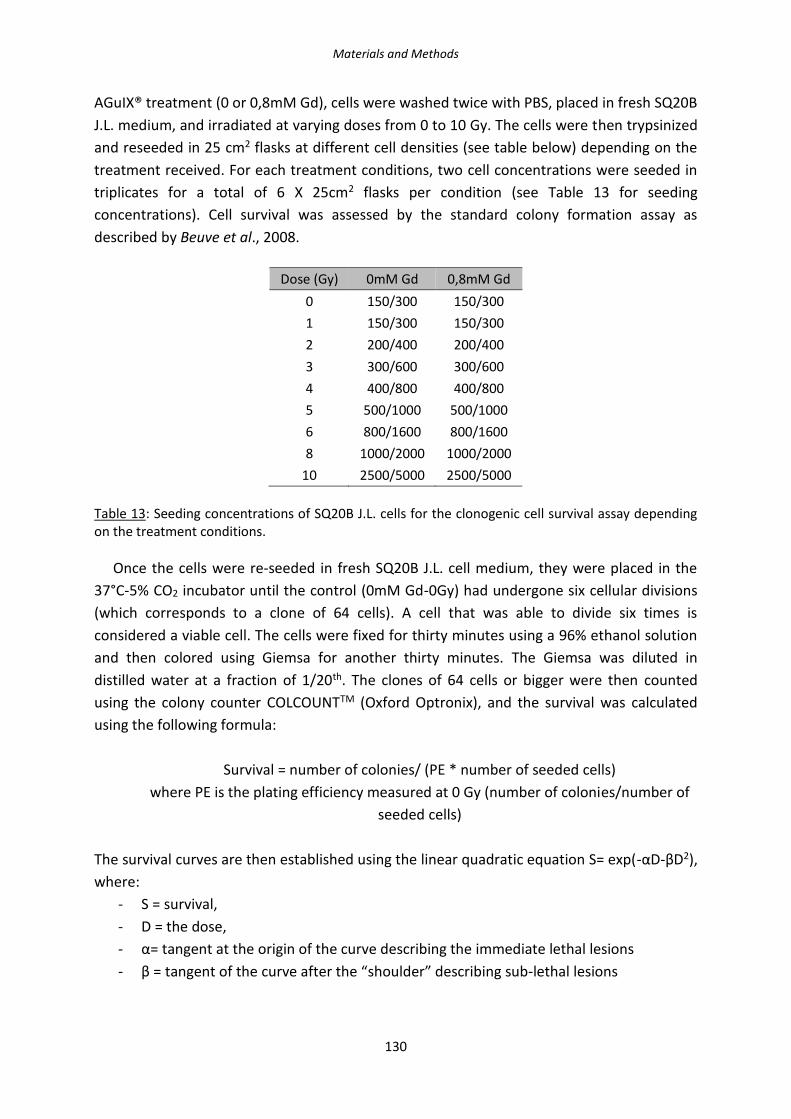
Materials and Methods
130
AGuIX® treatment (0 or 0,8mM Gd), cells were washed twice with PBS, placed in fresh SQ20B
J.L. medium, and irradiated at varying doses from 0 to 10 Gy. The cells were then trypsinized
and reseeded in 25 cm2 flasks at different cell densities (see table below) depending on the
treatment received. For each treatment conditions, two cell concentrations were seeded in
triplicates for a total of 6 X 25cm2 flasks per condition (see Table 13 for seeding
concentrations). Cell survival was assessed by the standard colony formation assay as
described by Beuve et al., 2008.
Dose (Gy) 0mM Gd 0,8mM Gd
0 150/300 150/300
1 150/300 150/300
2 200/400 200/400
3 300/600 300/600
4 400/800 400/800
5 500/1000 500/1000
6 800/1600 800/1600
8 1000/2000 1000/2000
10 2500/5000 2500/5000
Table 13: Seeding concentrations of SQ20B J.L. cells for the clonogenic cell survival assay depending on the treatment conditions.
Once the cells were re-seeded in fresh SQ20B J.L. cell medium, they were placed in the
37°C-5% CO2 incubator until the control (0mM Gd-0Gy) had undergone six cellular divisions
(which corresponds to a clone of 64 cells). A cell that was able to divide six times is
considered a viable cell. The cells were fixed for thirty minutes using a 96% ethanol solution
and then colored using Giemsa for another thirty minutes. The Giemsa was diluted in
distilled water at a fraction of 1/20th. The clones of 64 cells or bigger were then counted
using the colony counter COLCOUNTTM (Oxford Optronix), and the survival was calculated
using the following formula:
Survival = number of colonies/ (PE * number of seeded cells)
where PE is the plating efficiency measured at 0 Gy (number of colonies/number of
seeded cells)
The survival curves are then established using the linear quadratic equation S= exp(-αD-βD2),
where:
- S = survival,
- D = the dose,
- α= tangent at the origin of the curve describing the immediate lethal lesions
- β = tangent of the curve after the “shoulder” describing sub-lethal lesions

Materials and Methods
131
The ratio α/β therefore measures the repair capacities of the cell and therefore
characterizes a cell or tissue type.
2.1.1. Survival Fraction at 4Gy (SF4Gy)
In order to isolate the radiosensitizing concentration of AGuIX®, concentrations varying
from 0 to 3 mM Gd along with three different culture media were tested: HBSS, PBS
Ca2+/Mg2+, and serum-free DMEM-Glutamax. In order to screen these different conditions,
the survival fraction at 4Gy (SF4Gy) was evaluated. Each time the following technique was
used:
Cells were plated at a density of 1 million in 25 cm2 flasks. Once plated, the cells were
treated with AGuIX® concentration varying from 0-3 mM Gd for one hour. The AGuIX®
solution was then removed and the cells were washed twice with PBS and placed back in
their culture medium. The cells were irradiated at 4Gy, then trypsinized and re-seeded in
25cm2 flasks at the following clonal densities: 150 and 300 cells for the control (0Gy) and 400
and 800 cells for the cells that had received a 4Gy irradiation. The cells were then put back in
the incubator and left between 8-12 days, until the untreated and non-irradiated cells had
clones of at least 64 cells (6 divisions). Once clones had reached the 64 cells, cells were
washed twice with PBS, fixed, stained, and counted as previously described.
Once the radiosensitizing AGuIX® concentration was determined, different incubation
times were tested: 1h, 4h, 12h, and 24h in order to optimize the radiosensitizing effect. The
same SF4Gy protocol was used.
2.1.2. Determining the quantity of gadolinium internalized by Inductively Coupled
Plasma-Atomic Emission Spectrometry (ICP-AES)
Cells were plated at a density of 7 million in 175 cm2 flasks and incubated with different
AGuIX® concentrations. After treatment, the cells were rinsed twice with PBS and
trypsinized, centrifuged at 300 x g for 5 minutes at room temperature (RT), and rinsed twice
with PBS. The samples were then kept as dry pellets at 4°C until further treatment.
The samples were transferred in 50 mL falcon tubes and 2 mL of ultrapure water was added.
For the next step (the mineralization step), the samples were transferred to a new 50 mL
falcon tube followed by the addition of 4-5 mL of aqua regia (composed of a mix of nitric
acid and hydrochloric acid, optimally at a molar ratio of 1:3). The samples were kept at 80°C
for three hours. Ten mL was then filtered through a 0.2 µm filter and analyzed with a Varian
710-ES (ILM- Fennec Team).
Materials and Methods
132
2.1.3. Toxicity studies
2.1.3.1. Trypan blue toxicity assay
In order to verify cellular toxicity of AGuIX® treatment in SQ20B JL cells, trypan blue
toxicity assay was performed. Trypan blue is used as a viability test as cells that uptake
trypan blue are considered non-viable.
SQ20B J.L. cells were plated in six-well plates at a density of 400 000 cells per well and
treated with AGuIX® for either one or twenty-four hours in serum-free DMEM-Glutamax.
After treatment, cells were rinsed twice with PBS and put back in their culture medium. For
the times over 24h, the cells were trypsinized and re-plated as to not exceed an 80%
confluency.
At t = 24h, 48h, 72h, 120h and up to 7 days, the cells were trypsinized; 10 µL of trypan
blue solution was added to 10 µL of the cell suspension and the cell viability was measured
using the Countess automated cell counter (Invitrogen) that allow to quantify the number of
total cells, live cells, dead cells, and percent viability.
2.1.3.2. 3-(4,5-dimethylthiazol-2-yl)-2,5-diphenyltetrazolium bromide (MTT)
toxicity assay
The 3-(4,5-dimethylthiazol-2-yl)-2,5-diphenyltetrazolium bromide (MTT) assay is a
colorometric assay used to measure the cellular metabolic activity. NAD(P)H-dependent
cellular oxidoreductase enzyme activities reflect the number of viable cells: the enzymes are
capable of reducing the tetrazolium dye MTT to its insoluble formazon: we will then observe
a purple color which is more or less dark depending on the number of viable cells.
SQ20B JL cells were plated in six-well plates at a density of 400 000 cells per well and
treated with AGuIX® for either one or twenty-four hours in serum-free DMEM-Glutamax.
After treatment, cells were rinsed twice with PBS, trypsinized and re-plated in 96-well plates.
At t = 24h, 48h, 72h, 120h and up to 7 days, 200 µL of a solution at 0.5 g/ml of MTT
(Sigma, M-5655) was added to each well. The plate was incubated for two hours at 37°C and
5% CO2. The wells were then rinsed twice with PBS and 100 µL of DMSO were added to each
well and left for thirty minutes under agitation (during which the DMSO will dilute the
crystallized MTT). At the end, the plate was read at an absorbance of 560 nm using the
SpectraMax M2 spectrophotometer (Molecular Devices).

Materials and Methods
133
2.1.4. Proliferation assay: confluency percentage measurements by Incucyte
SQ20B J.L. cells were plated in 25 cm2 flasks and received corresponding treatments. After
either a 0 or 10 Gy irradiation, cells were trypsinized and re-seeded in a 96-well plate at a
density of 5 000 cells per well. Pictures were taken in phase contrast by the Incucyte (Essen
Biosciences) every two hours for 7 days. Photographs of the IncuCyte where the plates are
put is shown in Figure 49.
Figure 49: Interior of the IncuCyte apparatus.
2.2. Cellular localization of AGuIX® in SQ20B JL cells
2.2.1. Confocal microscopy
Cells were plated in two-chambers LabTek®II Chambered #1.5 German Coverglass System
(Dutscher) and AGuIX® covalently linked to Cya5.5 (as a fluorescent marker) were used.
For co-localization studies with the nucleus, the cells were fixed in 4% PFA for 20 minutes,
rinsed three times with PBS for 5 minutes and then exposed to DAPI (1µM) (4’,6’-diamidino-
2-phenylindole) for 15 minutes. After staining the nucleus, the cells were rinsed three times
with PBS for 5 minutes and then kept in 1 mL of PBS for observation under the confocal
spinning disk microscope of the µLife Platform (see Figure 50) (CEA-Grenoble).
For the co-localization studies with the mitochondria or lysosomes, live-cell imaging was
performed. SQ20B J.L. cells were incubated with either 200 nM Mitotracker-Green
(Invitrogen) for 45 min or 75 nM Lysotracker-green (Invitrogen) for 45 minutes in culture
medium prior to AGuIX®-Cya5.5 treatment. The probes were then washed out and the cells
rinsed twice with PBS before treatment with AGuIX®-Cya5.5. After 24 hours of incubation,

Materials and Methods
134
the AGuIX®-Cya5.5 were washed out of the cells, and the cells were observed using the
confocal spinning disk of the µLife Platform (CEA-Grenoble).
AGuIX®-Cya5.5 were excited with a laser at 642 nm, while Lysotracker and Mitotracker-
Green were excited at 491 nm. Images were taken in 60X oil objective on a z-width of 15 µm
with step-sizes of 0,5 µm.
Figure 50: Confocal spinning-disk microscope (µLife Platform, CEA-Grenoble, Grenoble, France).
A kinetic study was also done in order to observe the internalization of AGuIX® in time: 1h – 2h – 4h – 6h.
3. Study of cell death after AGuIX® treatment + irradiation
3.1. Study of apoptosis and necrosis
The CaspACETM FITC-VAD-FMK in situ Marker (Promega) was used to quantify total
caspase activity by flow cytometry. The cells were trypsinized and incubated with 5 µM
CaspACETM FITC-VAD-FMK for 20 minutes at room temperature. The cells are then washed
twice with PBS and resuspended in PBS for flow cytometry analysis with an excitation at 488
nm and emission at 530 nm (LSRII, BD, Biosciences- Lyon Sud Medical School, see Figure 51
showing a photo of the LSRII used throughout the thesis). Figure 52 represents the graphs
obtained using the DIVA software. After a 10Gy irradiation, the peak expands and slightly
shifts to the right representing an increase in the number of cells positively stained by the
marker.

Materials and Methods
135
Figure 51: LSR II BD Biosciences and the computer for acquisition. (Lyon-Sud Medical School, Lyon, France).
Figure 52: Representative graphs of total caspase analysis in flow cytometry (LSRII). a. 0mM Gd 0Gy; b. 0,8mM Gd 10Gy.
Apoptosis and necrosis were studied using the Annexin V/P.I. assay (Alexa Fluor 488
Annexin V/Dead, Ref V13241, Life Technologies SAS). The cells were trypsinized and marked
for 15 minutes with 1 µL of annexin and 1 µL of P.I. per tube in 200 µL of 1X buffer provided
in the kit, as instructed by the manufacturer. The cells were then centrifuged and washed
once with PBS. The cells were re-suspended in 500 µL of PBS and analyzed using the
FACSCalibur (Becton Dickinson). The excitation/emission wavelength was 488/530 for
Annexin FITC and 585/45 for propidium iodide (CEA-Grenoble).

Materials and Methods
136
Figure 53: Representative graphs of Annexin/P.I. in flow cytometry (FACSCalibur). a. 0mM Gd 0Gy; b. 0,8mM Gd 10Gy. (CEA-Grenoble, Grenoble, France)
3.2. Study of the cell cycle kinetics
Samples were collected at 24, 48, 72, 192, and 240 hours after a 10Gy irradiation. *Note:
Two things are important to note. First, the supernatant must be kept (the trypsin will be
stopped using this supernatant) and after trypsination, the cells must be kept on ice at all
times. After trypsination, the cells were centrifuged for 10 minutes at 300 x g at 4°C and
rinsed twice with cold PBS. The cells were then re-suspended in 250 µL of PBS and 2 mL of
70% ethanol per tube was added in order to fix the cells. The cells must remain in the 70%
ethanol for at least 24h prior to the proceeding of the protocol.
For cell cycle analysis by flow cytometry by flow cytometry, the cells were centrifuged for
five minutes at 300 x g and 4°C, rinsed twice with cold PBS and then marked with 500 µL of a
DAPI (4’,6’-diamidino-2-phenylindole) solution with a final concentration of 1 µg/mL in PBS.
The samples were then analyzed by flow cytometry at an excitation wavelength of 355 nm
and an emission of 450 nm (FACScan, BD LSRII flow cytometer, BD Biosciences). The different
phases of the cell cycle (sub-G1, G0/G1, S, G2/M, and 4n) can be studied and quantified as is
shown in Figure 54.

Materials and Methods
137
Figure 54: Schematic representation of a cell cycle in flow cytometry (LSRII BD Biosciences- Lyon-Sud Medical School Lyon, France). The different cell cycle phases are represented by P3: sub-G1, P4: GO-G1, P5: S, P6: G2/M, and P7: 4n. a. 0mM Gd 0Gy, b. 0mM Gd 10Gy.
3.3. Study of other cellular death pathways via Western Blot
Senescence and autophagy were explored via Western Blot using the p16 and p21
antibodies for senescence and LC3B for autophagy.
3.3.1. Sample preparation for Western Blot
At t = 24, 48, 72, 120, 192, and 240 hours after a 10Gy irradiation, the cells were
trypsinized, centrifuged for 5 minutes at 300 x g at 4°C and rinsed twice with PBS. The
samples were then stored at -80°C as dry pellets. Once all samples were collected, we
proceeded with protein extraction: the cells were lysed with 100-500 µL of lysis buffer (150
mM NaCl, 50 mM Tris-HCl pH 8.0, 1% Triton X-100) containing anti-proteases and anti-
phosphatases (Roche) for 30 minutes at 4°C. The lysates were then centrifuged at 15 000 x g
for 20 minutes at 4°C. The supernatants were then transferred to a new labelled Eppendorf
tube while the pellet was thrown away (the pellet contains the cells’ debris).
The protein concentration of each sample was measured using the Bicinchonic Acid (BCA)
assay. A standard curve was done with bovine serum albumin, with concentrations varying
from 0-80 mg/L. The standard and the samples were incubated with SDS 0.05% and BCA-
CuSO4 0.01% for 30 minutes at 37°C and the absorbance was measured at a wavelength of
562 nm.
3.3.2. Polyacrylamide Gel Electrophoresis (SDS-PAGE) and transfer on a nitrocellulose
membrane
Depending on the studied protein, 20 µg or 40 µg was diluted to the 4th in a denaturing
buffer (Laemmli buffer: 125 mM Tris-HCl pH 6.8, 20% glycerol, 2% SDS, 5% β-
mercaptoethanol, 0.05% bromophenol blue) and denatured for 5 minutes at 95°C. The
samples were then deposited on the polyacrylamide gel.

Materials and Methods
138
Gel preparation
12% polyacrylamide gels were casted using the Bio-Rad’s TGX Stain-FreeTM Fast CastTM
Acrylamide kit 12% (BioRad Catalog number 161-0185). These gels include unique trihalo
compounds that allow rapid fluorescent detection of proteins without staining (known as
Stain-FreeTM Technology). The protocol for the gel preparation is shown in Figure 55. Fully
prepared casted gels were also used.
1) Resolver solution preparation
2) Stacker solution preparation
3) Insertion of comb and polymerization
Figure 55: Schematic representation of the three different steps for the preparation of the gel for Western-Blot.

Materials and Methods
139
Gel migration
The protein samples previously prepared were deposited onto the polyacrylamide gel. A
protein molecular weight standard (AmershamTM ECLTM RainbowTM Marker-Full Range, GE
Lifesciences Ref RPN800E) was deposited in the first lane. The migration was performed at
100 V for 15 minutes and then increased to 120 V for about 90 minutes in a Mini-PROTEAN®
Tetra Cell (Bio-Rad) tank. The migration buffer used was Tris-Glycine Buffer 10X (Sigma
T4904) diluted to 1X and 1% SDS (TGS-Glycine Buffer 1X-1% SDS).
After migration, the gel was removed from its cast and placed in the BioRad system in
order to activate total proteins (by activating all tryptophans) for later normalization during
analysis. The trihalo compounds (mentioned earlier) react with tryptophan residues in a UV-
Induced reaction to produce a fluorescence, which can be detected by the imager within
gels.
Next, a semi-dry transfer was performed with the Trans-Blot Turbo Transfer System (Bio-
Rad) and consumables that are ready-to-use: paper filters and a nitrocellulose membrane
already incubated in transfer buffer. The transfer program with the following parameters
was used:
- For MiniGel: 1,3A- 25V-7 minutes
- For 2 MiniGels or 1 MidiGel: 2.5A-25V-7 minutes
The protocol then slightly varied depending on the protein of interest and will therefore
be described separately.
Protein of interest: p16
After transfer, the nitrocellulose membrane was rinsed for 5 minutes in PBS (Phosphate
Buffer Saline) and incubated for one-hour with the blocking solution (PBS-Tween 0.5%-5%
milk). The membrane was then rinsed three times with the solution PBS-Tween 0.5% for 5
minutes. Next, the primary antibody was incubated (1/2 000 dilution) in PBS-Tween 0.5%-
Milk 1% for one hour at room temperature (RT) under gentle agitation. Then, the membrane
was rinsed three times with PBS-Tween 0.5% for 5 minutes and the secondary antibody, goat
antibody anti-mouse HRP (1/10 000) was incubated for one hour under gentle agitation at
RT. The secondary antibody was removed and the membrane rinsed three times with PBS-
Tween 0.5% for 5 minutes followed by 2 washes with PBS alone. Finally, the membrane was
exposed for about 30 seconds to the revelator solution ClarityTM Western ECL Substrate
(Sigma, Cat#170-5061). The protein was revealed using the BioRad ChemiDoc XRS system
(Molecular Imager) and normalized with GAPDH.

Materials and Methods
140
Protein of interest: p21
After transfer, the nitrocellulose membrane was rinsed for 5 minutes in TBS (Tris-Buffered
saline, Sigma T5912) and incubated for one-hour with the blocking solution (TBS-Tween
0.5%-5% milk). The membrane was then rinsed with the solution TBS-Tween 0.5% for 5
minutes three times and incubated with the primary antibody (1/500 dilution) in TBS-Tween
0.5%-Milk 5% overnight at 4°C. The following morning, the membrane was rinsed three
times with TBS-Tween 0.5% for 5 minutes and incubated with the secondary antibody, the
goat antibody anti-mouse HRP (1/10 000) for one hour under gentle agitation at RT. The
secondary antibody was removed and the membrane was rinsed three times with TBS-
Tween 0.5% for 5 minutes followed by 2 washes with TBS alone. The membrane was then
exposed for 5 minutes to the revelator solution ClarityTM Western ECL Substrate (Sigma,
Cat#170-5061) and the protein was revealed using the BioRad ChemiDoc XRS system
(Molecular Imager).
Protein of interest: LC3B
After transfer, the nitrocellulose membrane was rinsed for 5 minutes in TBS and then
incubated for one-hour with the blocking solution (TBS-5% milk-1% BSA). The membrane
was then rinsed with the solution TBS-Tween 0.1% for 10 minutes three times. Next, the
primary antibody is incubated (1/2 000 dilution) in the blocking buffer overnight at 4°C. The
membrane was then rinsed in water once and then three times with TBS-Tween 0.1% for 10
minutes followed by the incubation with the secondary antibody, rabbit IgG HRP-conjugated
(1/20 000) in blocking buffer for one hour under gentle agitation at RT. The secondary
antibody was removed and the membrane is washed three times with PBS-Tween 0.1% for
10 minutes followed by 2 washes with TBS alone. The membrane was then exposed for 5
minutes and the protein revealed as described above.
Protein of interest
Supplier/Reference Production host
Protein Quantity
SDS-Page Gel
Blocking solution
Dilution
p16 (16 kDa)
BD Biosciences/550834
Mouse 40 µg 16% PBS-
0,5%Tween20-5% Milk
1/2000
p21 (21 kDa)
Sigma/P1484 Mouse 40 µg 12% TBS-
0,5%Tween20-5% Milk
1/500
LC3B (17 kDa)
BioTechne/NB100-2220
Rabbit 20 µg Gradient
TBS-0,5%Tween20-
1% BSA- 5% Milk
1/2000
Table 14: List of proteins of interest studied by Western Blot analysis with references and protocol details.
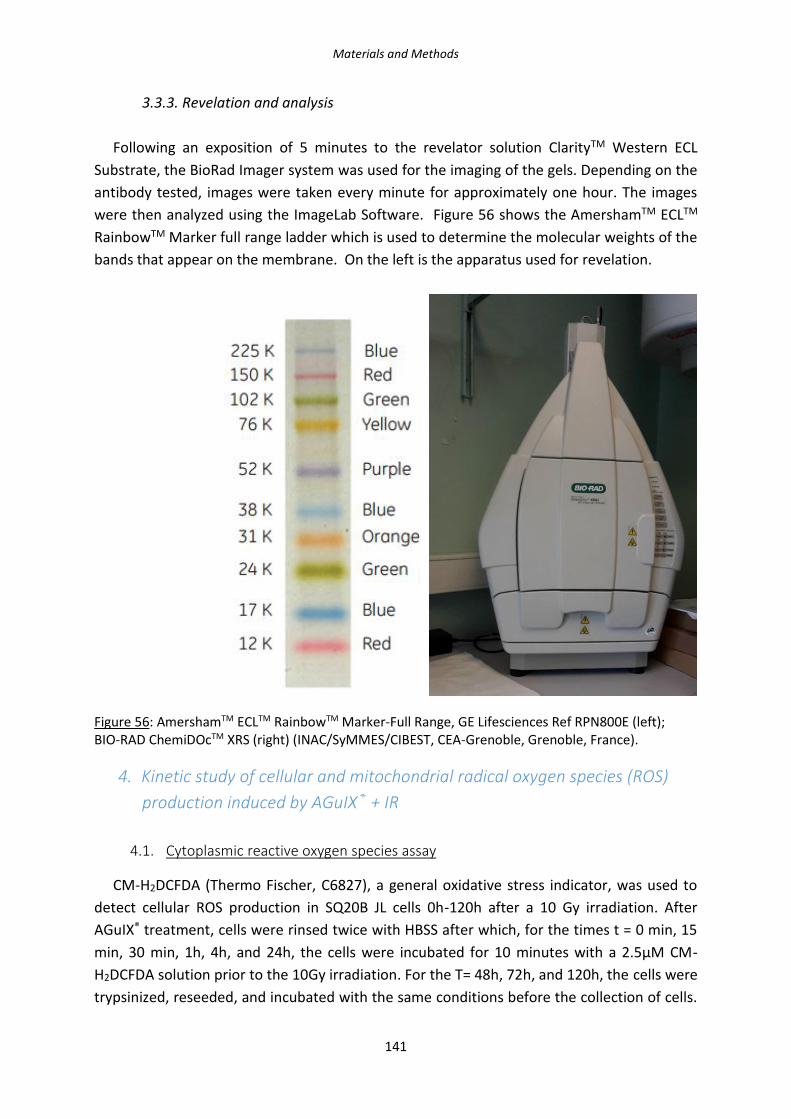
Materials and Methods
141
3.3.3. Revelation and analysis
Following an exposition of 5 minutes to the revelator solution ClarityTM Western ECL
Substrate, the BioRad Imager system was used for the imaging of the gels. Depending on the
antibody tested, images were taken every minute for approximately one hour. The images
were then analyzed using the ImageLab Software. Figure 56 shows the AmershamTM ECLTM
RainbowTM Marker full range ladder which is used to determine the molecular weights of the
bands that appear on the membrane. On the left is the apparatus used for revelation.
Figure 56: AmershamTM ECLTM RainbowTM Marker-Full Range, GE Lifesciences Ref RPN800E (left); BIO-RAD ChemiDOcTM XRS (right) (INAC/SyMMES/CIBEST, CEA-Grenoble, Grenoble, France).
4. Kinetic study of cellular and mitochondrial radical oxygen species (ROS)
production induced by AGuIX® + IR
4.1. Cytoplasmic reactive oxygen species assay
CM-H2DCFDA (Thermo Fischer, C6827), a general oxidative stress indicator, was used to
detect cellular ROS production in SQ20B JL cells 0h-120h after a 10 Gy irradiation. After
AGuIX® treatment, cells were rinsed twice with HBSS after which, for the times t = 0 min, 15
min, 30 min, 1h, 4h, and 24h, the cells were incubated for 10 minutes with a 2.5µM CM-
H2DCFDA solution prior to the 10Gy irradiation. For the T= 48h, 72h, and 120h, the cells were
trypsinized, reseeded, and incubated with the same conditions before the collection of cells.
Materials and Methods
142
At the corresponding times, the cells were rinsed twice with PBS, trypsinized, and the trypsin
was inhibited using the recovered culture medium. The cells were centrifuged twice and
then re-suspended in PBS for flow cytometry analysis using the blue laser with an excitation
at 488nm and a maximum emission at 525 nm (LSRII, BD Biosciences, Lyon-Sud Medical
School).
4.2. Mitochondrial reactive oxygen species assay
MitoSOXTM red assay (Thermo Fischer, M36008), a specific mitochondrial superoxide
indicator, was used to detect mitochondrial ROS more specifically. MitoSOXTM was used at a
concentration of 5 µM in HBSS for 10 minutes. The same protocol was used as described for
the CM-H2DCDA assay. Fluorescence intensity was measured by flow cytometry at an
excitation wavelength of 488 nm and emission wavelength of 575 nm (LSRII, BD Biosciences,
Lyon-Sud Medical School).
5. Study of nuclear damages induced by AGuIX® + IR
5.1. Detection of single-stranded breaks: Comet assay +/- FPG
Cells were plated in six-well plates at a density of 400 000 cells per well in triplicate and
irradiated at either 4 or 10Gy. Four times were analyzed after irradiation: immediately after
(0 min), 30 min, 2 h, and 24 h post-irradiation. For each treatment conditions, 3 slides
without FormamidoPyrimidine [fapy]-DNA Glycosylase (FPG) and 3 slides with FPG were
prepared and an internal positive control (+H2O2) was included.
5.1.1. Slide preparations
The slides should be prepared at least one day in advance. 100 mL of normal agarose at
1% (1 g of agarose in 100 mL of PBS without Ca2+ nor Mg2+) was prepared by melting the
agarose on a heat block under gentle agitation. Each slide was dipped in the agarose and
then left to dry overnight.
5.1.2. Collection of the cells
The cells were trypsinized as typical protocol. The cells were then centrifuged at 300 x g
for 5 minutes at 4°C and then re-suspended in freezing buffer at a concentration of 200 000
cells in 100 µL (for 50 mL of freezing buffer: final concentrations of 85.5 g/L sucrose, 11.76
g/L sodium citrate, 50 mL/L DMSO, and the pH was adjusted to 7.6 with a few drops of citric
acid 0.1 M. The volume was then adjusted to 50 mL with milli-Q dH2O and the solution
filtered through a 0.2 µm filter and kept at 4°C). The cells were then stocked at -80°C until
further treatment.

Materials and Methods
143
5.1.3. Depositing the cells on the slides
A 0.6 % solution of low-melt agarose was prepared in PBS. The solution should be well
diluted but should not be brought to a boil. The solution was added in Eppendorf tubes
before the addition of the 900 µL of low-melt agarose solution. The tubes were placed in the
pre-heated 37°C water bath. The previously collected cells were taken out from the -80°C
and dipped in the water bath to unfreeze them. After centrifugation for 5 minutes at 300 x g
at 4°C, the supernatant was removed and the pellet re-suspended in 100 µL of PBS to the
900 µL of low-melt agarose. The solution was homogenized and 100 µL of the solution was
added to each slide (deposition of about 20 000 cells per slide). A coverslide was
immediately put and the slides were put on ice for a minimum of 10 minutes.
5.1.4. H2O2 positive control
The coverslide was removed and 100 µL per slide of a 50 µM H2O2 solution was
deposited. A coverslide was immediately put over and the slide put back on ice for 10
minutes. After removing the coverslide, the slide was rinsed with 1 mL of PBS. Note: a
maximum of the PBS should be removed from the slide.
5.1.5. Cell lysis
After removing the coverslide, the slides were placed at the bottom of a container where
they will be covered with lysis buffer for one hour (a 1 L solution is prepared with the
following final concentrations: 2.5 M NaCl, 10 mM Tris, 0.1 M EDTA; the pH was then
adjusted to 10 with concentrated NaOH). Immediately prior to use, to 133,5 mL of the
previously prepared solution, 15 mL of DMSO and 1.5 mL of Triton are mixed. After cell lysis,
the slides were rinsed three times for 5 minutes with Tris-HCl 0.4 M, pH 7.4 (dilution by 1/3
of the previously prepared 1L of Tris-HCl 1.2 M (145,5 g of Tris was weighed and the pH was
then adjusted to 7.4 with concentrated HCl).
5.1.6. Incubation with Fpg (formamidopyrimidine [fapy]-DNA glycosylase)
The slides were left to dry for about 5 minutes on the lab-bench while the FPG solutions
were prepared as follows:
- With FPG: FPG 0.05 u/µL (1.25 µL/slide) + FPG buffer diluted 10 times in milli-Q H2O.
- Without FPG: FPG buffer diluted 10 times in milli-Q H2O.
For each condition, 100 µL of the with FPG solution or without FPG solution was
deposited on the slides and a coverslip was put down. The slides were set on a humidified

Materials and Methods
144
bed and put in a 37°C incubator for one hour. After the one-hour incubation, the slides were
put on an ice-bed in order to stop the enzymatic reaction.
5.1.7. Migration
After removing the coverslips, the slides were placed in an electrophoresis tank. The
slides were covered with the electrophoresis buffer (0.3 M NaOH and 1mM EDTA diluted in
MilliQ dH2O) that was previously prepared and stored at 4°C. An “equilibration” time of 30
minutes was observed before starting the electrophoresis which was performed at a voltage
of 25 V, 300 mA, for 30 minutes. After migration, the electrophoresis buffer was thrown out,
and the slides were rinsed three times for 5 minutes in Tris-HCl 0,4 M buffer.
5.1.8. Analysis
The counting of the comet assay by microscopy was usually done the following day. For a
reading within the next 15 days, 50 µL of Gel Red was added per slide and a coverslip was
put right away. For each slide, comets were counted under the microscope using the 10X
objective: a minimum of 50 comets were counted per slide. For storage, the slides were kept
at 4°C in the dark.
5.2. Detection of double-stranded breaks: Foci ƳH2AX
Cells were plated in six-well plates at a density of 400 000 cells per well in duplicate for
each condition: 30 minutes and 24 hours after a 2Gy irradiation. Cells were rinsed twice with
cold PBS and then fixed in a 4% PFA (paraformaldehyde) solution for 20 minutes. The cells
were rinsed 3 times with PBS in order to remove any traces of PFA.
After collection, the cells were permeabilized for 5 minutes with a permeabilization buffer
made of PBS-0,2% Triton X100 solution. The cells were then washed 3 times for 5 minutes
with a wash solution (PBS-0,1% Tween 20- 0,05% Triton X100) and then aspecific sites were
blocked with a PBS- 0.2% milk-5% FCS- 0,05% Triton X100 for 10 minutes. This blocking step
was followed by a one-hour incubation of the monoclonal primary antibody produced in
mouse: the anti-phospho-histone H2AX (Ser 139) clone JBW301 (Invitrogen Ref 05-636) 100
µl of the antibody solution (1/1000 dilution in blocking buffer) was deposited on each
coverslide. Following the hour incubation with the primary antibody, the cells were rinsed 3
times for 5 minutes with the wash buffer and then incubated for one hour with the
secondary antibody Alexa-Fluor 488-antiIgG against mouse produced in goat (Invitrogen Ref
A11001) (1/500 dilution in blocking buffer). The cells were then rinsed twice for five minutes
in a PBS-0,1% Tween 20 solution. The nucleus of cells was stained with DAPI at a
concentration of 1 µg/ml for 15 minutes and washed three times in PBS for 5 minutes each.
Each coverslide was then mounted using the mounting medium Fluoromount (Sigma).

Materials and Methods
145
Slides were left to dry for about 24 hours and are then polished for an optimal
conservation. Each slide was then counted for a minimum of 300 nuclei per slide using the
Metafer analysis system which uses both the intensity and size as parameters to distinguish
a foci under a 63X objective.
Figure 57: The Metafer platform used for γH2AX analysis along with the microscope (Lyon-Sud Medical School).
A kinetic study 0 min- 30 min - 1h – 2h – 4h – 6h – 24h was once realized in triplicate in order
to study the repair kinetics of DNA double-stranded breaks. The study with T= 30 minutes
and 24 hours was done in triplicate with duplicate slides for each condition.
5.3. Quantification of 8-oxo-G by HPLC-MS/MS
5.3.1. DNA Extraction
Each dry pellet was re-suspended in 750 µL of the lysis buffer A and transferred in 2 mL
Eppendorf tubes. The buffer lysis A solution is composed of 10.97 g of sucrose, 101 mg of
MgCl2, 121 mg of Tris, 100 µL of deferoxamine, and 1 mL of Triton X100. The pH was
adjusted to 7.5 before the addition of Triton X100 and the volume was adjusted to 100 mL.
This buffer allows the lysis of the cells’ plasma membrane. The tubes were then centrifuged
for 5 minutes at 1500 x g at RT. The supernatant was removed and 750 µL of Lysis buffer
solution A was again added to the tubes and centrifuged at 1500 x g for 5 minutes at room
temperature. After removing the supernatant, the pellet was re-suspended in 300 µL of lysis
buffer B (for a volume of 100 mL: 186 mg of EDTA-Na2, 121 mg Tris, 150 µL deferoxamine.
The pH was verified and adjusted to 8.0). Eighteen µL of 10% SDS (Sodium Dodecyl Sulfate)
was added to the mixture and the solution vortexed. 1.5 µL of RNAse A (Sigma, ref R5125-
250mg) (100 mg/ml) and 3.5 µL of RNAse T1 (1U/µL) were added and the suspension was
incubated at 50 °C for 15 minutes. Fifteen µL of protease (Qiagen ref 19157) per sample was
then added and the mixture vortexed and incubated at 37° C for one hour. Following the

Materials and Methods
146
hour incubation, 600 µL of a NaI solution was added (20 mM EDTA-Na2, 7.6 M NaI, 40 mM
Tris/HCl, 0.30 mM deferoxamine) followed by 1 mL of 100 % isopropanol per sample. Each
sample was gently agitated and then centrifuged for five minutes at 5000 x g at RT. The
supernatant was then removed and 500 µL of 40% isopropanol was added. The samples
were once again centrifuged for 5 minutes at 5000 x g at RT. The supernatant was removed
and 500 µL of 70% ethanol was added followed by a centrifugation at 5000 x g for 5 minutes
at RT. Following this centrifugation, a maximum of the supernatant was carefully removed
and the pellet was re-suspended with 50 µL of deferoxamine 0.1 mM.
5.3.2. Enzymatic Digestion
A mix was prepared so that each sample received:
- 0.25 µL of phosphodiesterase II at 0.1 U/µL (Sigma, ref P9041-25U)
- 0.5 µL of DNase II at 10U/µL (Sigma, ref D4138-20KU)
- 2.5 µL of Nuclease P1 at 0.2U/µL (Sigma ref N8630-1VL)
(P1 buffer solution: 300 mM ammonium acetate (Sigma ref A1542-250g), 1 mM
ZnSO4 (Sigma), adjusted pH to 5.3. For the nuclease P1, a concentration of 0.2U/µL
was used. The nuclease P1 was diluted in the P1 buffer)
- 2.5 µL of MNSPDE buffer
(For a 10X solution: 200 mM succinic acid (Sigma ref S3674-100g) and 100 mM CaCl2
(Sigma ref C1016-100G) adjusted to pH6)
5.5 µL of the mix was added to each sample and the samples were vortexed and
incubated for 2 hours at 37°C. The samples were vortexed after the first 30 minutes of
incubation.
After the two hours of incubation, 6.55 µL of the following mix was added to each sample:
- 6µL of phosphatase alkaline buffer (500 mM Tris (Sigma ref 34549), 1mM EDTA
(Sigma ref T6066), pH8)
- 0.5 µL of phosphodiesterase I (Sigma, ref P3243-1VL)
- 2 units of alkaline phosphatase (Sigma ref P6774-2KU)
After a 2-hour incubation of the samples at 37°C, 3.5 µL of 0.1N HCl was added to each
sample before centrifugation at 5000 x g for 5 minutes. If ethanol remained in the tubes, it
was evaporated by speed vacuum for 10 minutes. The samples were then transferred to
HPLC vials and kept at 4°C or -20°C until HPCL MS/MS analysis. (Note: while transferring
samples to HPLC vials, one must be careful with air bubbles at the bottom of the vials.)

Materials and Methods
147
5.3.4. Analysis by HPLC MS/MS
The measurements were made with a TSQ Quantum Ultra electrospray ionization tandem
mass spectrometer (Thermo Fisher Scientific Inc.).
Figure 58: Photograph of the HPLC coupled to a MS/MS for detection of 8-oxo-guanine (INAC/SyMMES/CIBEST, CEA-Grenoble, Grenoble, France).
6. Functional consequences on the mitochondria of AGuIX® + I.R.
6.1. Common deletion of mitochondrial DNA
The cells were trypsinized and rinsed twice with PBS and kept at -80°C as a dry cellular
pellet until further treatment.
6.1.1. Cell lysis
The cells were lysed with a buffer containing Tween 20, NP40, Tris HCl pH 8.3 completed
with dH2O to which proteinase K was added to a final concentration of 0,1 mg/mL. The
cellular pellets were then grinded to explode the mitochondrial membranes using the Tissue
Lyser II at a 30Hz frequency for 2 minutes. The samples were then incubated in a heat block
set at 56°C for 30 minutes followed by 15 min incubation at 98°C to inactivate the Proteinase
K.
6.1.2. Sample preparation
In order to prepare the sample solutions for PCR analysis, the samples underwent a series
of dilution. First, the lysis buffer previously used was diluted by a factor of 7 and sonicated
for 10min. The samples were diluted as follows: 20 µL of lysat + 40 µL non-sonicated lysis

Materials and Methods
148
buffer + 60 µL of milliQ H2O. Twenty µL of this first dilution were then added to 80 µL of the
sonicated diluted lysis buffer to have a final dilution of 1/9.
6.1.3. Mix preparation
The Fast Start DNA Master Syber Green I kit (Roche) was used for the PCR assay. First, the
Mastermix was prepared by adding 10 µL of tube 1a to 1b. Then the PCR mix was prepared
as follows (volumes per sample):
- 0.4 µL of forward Primer 20 µM
- 0.4 µL of reverse Primer 20 µM
- 7.4 µL of nuclease free H2O
- 4.8 µL of MgCl2
The mix was vortexed and 2 µL of the Mastermix was added.
15 µL of this mix was added to each well of the PCR plaque and 5 µL of each sample was
deposited. The plaque was then centrifuged at 700 rpm for 5 minutes at room temperature.
The thermal profile for the PCR (Stratagene) was as follows: 1 cycle for 10 minutes at 95°C
(denaturation), 45 cycles at 5 seconds at 54°C, 8 seconds at 72°C (amplification), 20 seconds
at 95°C, 30 seconds at 68°C, 30 seconds at 98°C (fusion).
Three couple of primers were used: total mitochondrial DNA (tot mtDNA), deleted
mitochondrial (del mtDNA), and GAPDH.
The total and deleted mitochondrial DNA were both normalized with GAPDH before
calculation of the ratio: deleted mtDNA/total mtDNA.
Primer Forward/Reverse Sequence
Tot mtDNA F 5'- GGACTAACCCCTATACCTTCTGCAT -3'
R 5'- CGGGTGTGCTCTTTTAGCTGTT -3'
Del mtDNA F 5'- CCTTACACTATTCCTCATCACCCAA -3'
R 5'- TGTGGTCTTTGGAGTAGAAACCTGT -3'
GAPDH F 5'- CTGACCTTTACTCCTGCCCTTTG -3'
R 5'- CATGGTATTCACCACCCCACTATG -3'
Table 15: Corresponding chosen primers.
6.2. The mitochondrial membrane potential
The JC-1 (5’,5’, 6, 6’-tetrachloro-1, 1’, 3, 3’-tetraethylbenzimidazolycarbocyanine iodide)
dye (Sigma-Aldrich, Ref T4069) was used to measure the mitochondrial membrane potential
drop. After trypsination, the cells were incubated with JC-1 for 20 minutes at 37°C at a

Materials and Methods
149
concentration of 5 µM. Cells were then analyzed using flow cytometry with an excitation
wavelength of 488 nm and an emission wavelength of 525 nm (LSRII, BD Biosciences).
Measuring glutathione content in SQ20B J.L. cells
Sample preparation
Cells were plated at a density of 150 000 cells in six-well plates and were treated with
0mM or 0,8mM of AGuIX®, and depleted or not of glutathione (see section DMF/BSO
treatment). At t =0 minutes and 24 hours after irradiation, glutathione measurements were
performed. At a given time, the supernatant was removed and the cells were washed twice
in PBS. 150 µL of R1 (composed of NEM/EDTA/γGLU-GLU) was added to each well and the
wells were shaken for 10 seconds. N-ethymaleimide (NEM) is used to block glutathione in its
reduced form therefore avoiding the generation of artefactual high levels of glutathione
disulfide. Next, 50 µL of R2 (6% ASS) was added and the wells were again shaken for 10
seconds. The plates were then left to rest for 30 minutes at room temperature. After the
scraping step, the solution from the well was removed from each well and centrifuged for 10
minutes at 4500 tr/minutes at 4°C. The supernatant was then transferred to a clean 1,5 mL
Eppendorf tube.
HPLC MS/MS
Glutathione concentration (from a cell pellet) was measured by HPLC MS/MS (Agilent
Technologies, Venissieux, France), in a positive electrospray ionization mode after a
separation by chromatography on a 150mm×2mm stability 100 BS-C17 column (CIL Cluzeau,
Sainte Foy La Grande, France). Briefly, after removal of proteins by sulfosalycic acid 6%, the
stabilization of glutathione by 20 mM of NEM and adding gamma glutamyl-glutamic acid as
an internal standard, the cell pellet was degraded by a freeze/thaw cycle followed by a
centrifugation at 10.000g during 10 minutes. The supernatant was then diluted in a mobile
phase and injected into the chromatographic system.
The elution was performed using a mobile phase containing MeOH/acetate ammonium
buffer (8mM) adjusted to pH 2.7 (63/37, V/V) in an isocratic mode. Chromatograms were
recorded in single ion monitoring (M+H)+ at m/z 277 for gamma glutamyl-glutamic acid, at
308 for GSH, at 433 for GSH-NEM and 613 for GSSG for 10 minutes. The results were
integrated with Chemstation software (Agilent Technologies (version B.01.01)).

Materials and Methods
150
7. Proteomic Analysis
7.1. Sample preparation
7.1.1. AGuIX® treatment and Irradiation (Lyon-Sud Medical School)
Cells were plated at a density of 40 000 cells/cm2 16 hours prior to AGuIX® treatment in
T7 flasks. The next day, the cells were treated with 0mM Gd or 0.8mM Gd for 24 hours. Prior
to irradiation, AGuIX® were removed from the medium, the cells were rinsed twice with PBS
and then irradiated at 10 Gy and put back in the incubator at 37°C 5% CO2 for 24 hours.
Twenty-four hours after irradiation, the cells were trypsinized and each flask was
separated into two:
- One half would be used for protein extraction in order to dose the quantity of
proteins using the BCA assay (previously detailed)
- Cells will be re-suspended in Laemmli 2X buffer for a final concentration of 3 µg/µl for
proteomics analysis.
For quality check, the samples used for protein extraction were ran through a
polyacrylamide gel electrophoresis. The gel was stained using a Coomassie blue solution, and
de-stained with an acetic acid solution.
The samples were then brought to the EDyP Platform (CEA - Grenoble) in dry ice for
further preparation of the samples for proteomic analysis.
7.2. Shut-gun Proteomics (EDyP Platform)
7.2.1. Protein extraction and digestion
Once the samples were received by the platform, a staking gel (so proteins are
concentrated in one single band) was done and each band (4 total for the 4 separate
samples), was cut out of the gel for further treatment: each sample was treated and
digested by trypsin in order to separate proteins into peptides (smaller fragments for nanoLC
MS/MS).
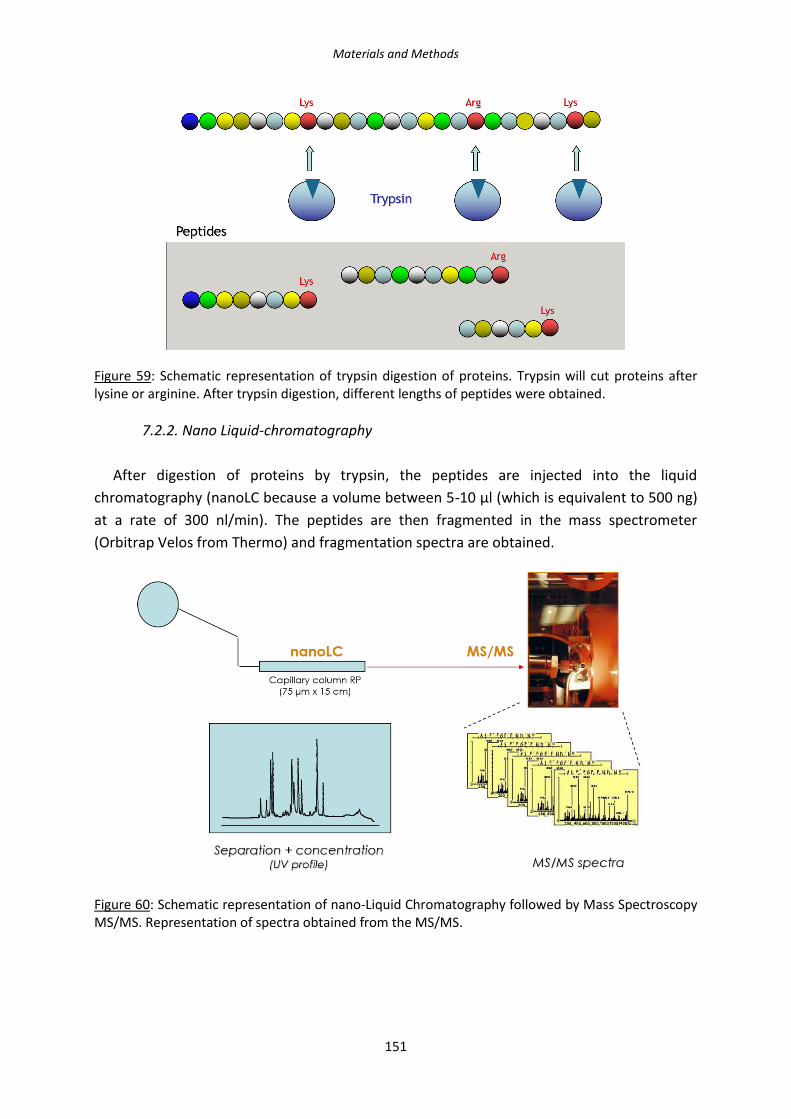
Materials and Methods
151
Figure 59: Schematic representation of trypsin digestion of proteins. Trypsin will cut proteins after lysine or arginine. After trypsin digestion, different lengths of peptides were obtained.
7.2.2. Nano Liquid-chromatography
After digestion of proteins by trypsin, the peptides are injected into the liquid
chromatography (nanoLC because a volume between 5-10 µl (which is equivalent to 500 ng)
at a rate of 300 nl/min). The peptides are then fragmented in the mass spectrometer
(Orbitrap Velos from Thermo) and fragmentation spectra are obtained.
Figure 60: Schematic representation of nano-Liquid Chromatography followed by Mass Spectroscopy MS/MS. Representation of spectra obtained from the MS/MS.
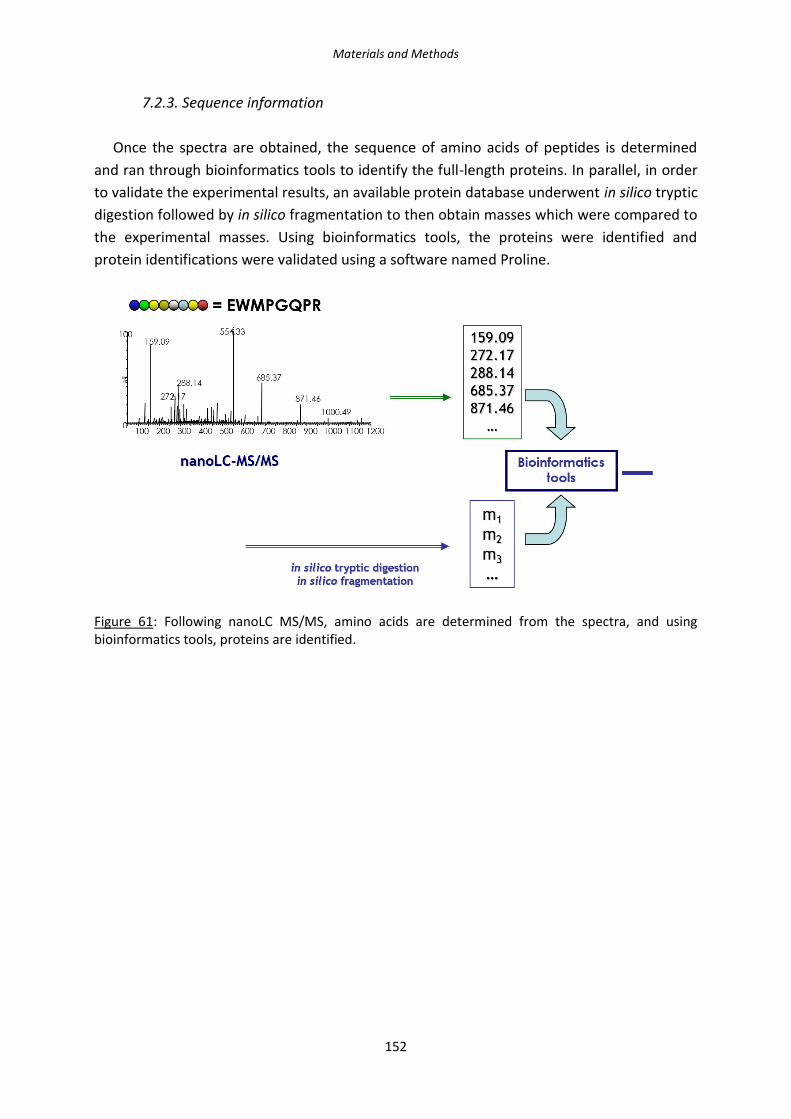
Materials and Methods
152
7.2.3. Sequence information
Once the spectra are obtained, the sequence of amino acids of peptides is determined
and ran through bioinformatics tools to identify the full-length proteins. In parallel, in order
to validate the experimental results, an available protein database underwent in silico tryptic
digestion followed by in silico fragmentation to then obtain masses which were compared to
the experimental masses. Using bioinformatics tools, the proteins were identified and
protein identifications were validated using a software named Proline.
Figure 61: Following nanoLC MS/MS, amino acids are determined from the spectra, and using bioinformatics tools, proteins are identified.

Materials and Methods
153
Figure 62: Photos representing the equipment used for the Proteomics study (EdYP Platform, CEA-Grenoble, Grenoble, France). a. Protein extraction and digestion by a robotized system; b. Nano-Liquid Chromatography; c. MS/MS; d. Sequence information, peak integration.
7.2.4. Data analysis
Once all data was extracted and protein identification was finished, an Excel worksheet
was given with the name of identified proteins, fold-change, and spectral counts.
In the Excel sheet, the following was detailed:
- Pep: the number of peptides corresponding to the protein
- SC (Spectral Count): number of peptides observed for one protein, but these peptides
can be shared peptides between different proteins

Materials and Methods
154
- SCC (Specific Spectral Count): number of peptides specific to a unique protein
- WSC (Weighted Spectral Count): logarithmic calculation which takes into account SC
and SCC
Two different techniques were used in order to further analyze the results obtained and
the analysis was focused on the comparison of 10Gy versus 0,8mM Gd + 10 Gy.
The fold-change was calculated as the ratio:
0,8mM Gd + 10 Gy / 10 Gy
First, proteins with a fold change of ≤ 0,8 (under-expression) or ≥ 1,2 (over-expression)
were identified (which corresponded to 800+ proteins) and then ran through proteomics
bioinformatics analysis tools to identify modulated signaling pathways. One such tool used
for the analysis of the results was DAVID (Database for Annotation, Visualization and
Integrated Discovery https://david.ncifcrf.gov/).
Another analysis technique which is used by the EDyP platform is more drastic and will
consider a significant fold-change only when a protein was over-expressed or under-
expressed by a minimum factor of 5. 16 proteins were modulated using these more drastic
cut-offs, and individual bibliography research using PubMed was done.

155
Results & Discussion

156

Results & Discussion Chapter I. Characterization of the radiosensitizing effects of AGuIX®
157
Chapter I. Characterization of the radiosensitizing effects of AGuIX®
adiosensitization using high-Z metal nanoparticles has shown great promises to
improve radiotherapy treatment in radio-resistant tumors, such as in Head and
Neck Squamous Cell Carcinoma (HNSCC). In this study, we have used a new
formulation of gadolinium-based nanoparticles named AGuIX® (Activated Guidance
Irradiation by X-rays) in order to determine their potential as a radiosensitizer in vitro, using
SQ20B J.L. cells, a radio-resistant HNSCC cell line.
Therefore, this first chapter of the Results & Discussion section is devoted to the
characterization of the effects of AGuIX® nanoparticles which includes the optimization of the
radiosensitizing conditions of AGuIX® on this cellular model. Firstly, different concentrations,
media, and incubation times have been tested. Next, the potential toxicity has been checked,
and the cellular localization of AGuIX® with respect to the nucleus, mitochondria, and
lysosomes has been studied using confocal microscopy.
R

Results & Discussion Chapter I. Characterization of the radiosensitizing effects of AGuIX®
158
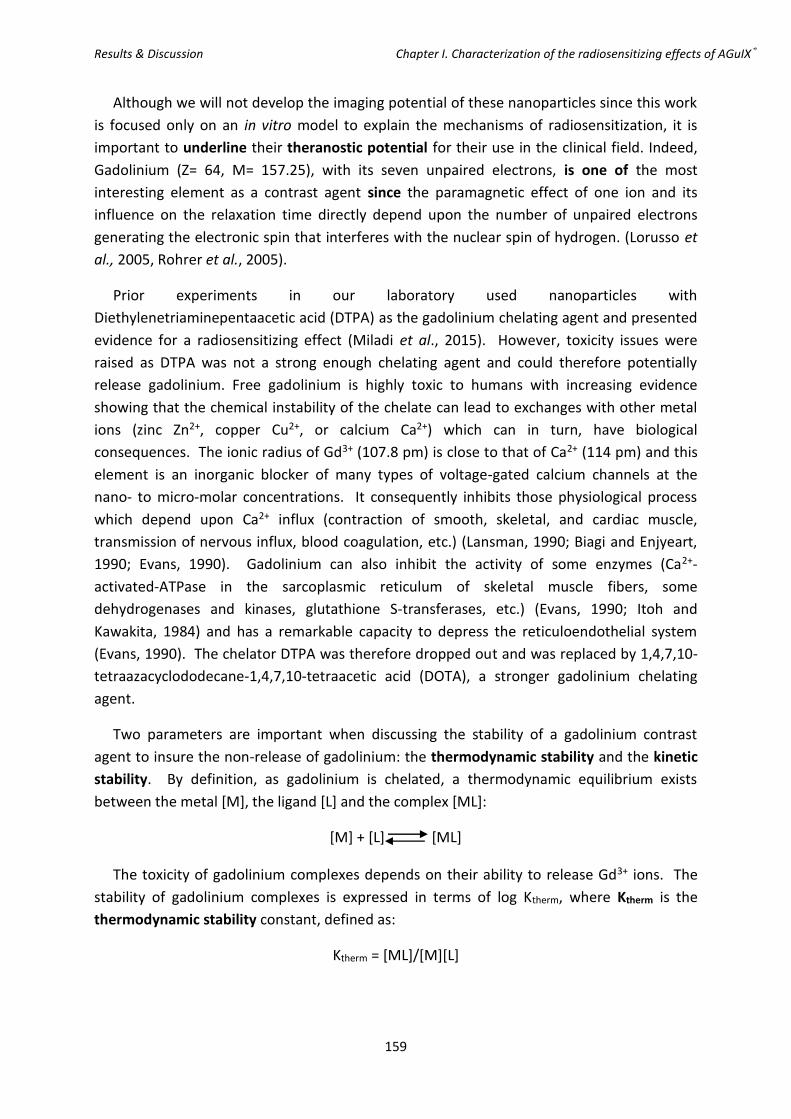
Results & Discussion Chapter I. Characterization of the radiosensitizing effects of AGuIX®
159
Although we will not develop the imaging potential of these nanoparticles since this work
is focused only on an in vitro model to explain the mechanisms of radiosensitization, it is
important to underline their theranostic potential for their use in the clinical field. Indeed,
Gadolinium (Z= 64, M= 157.25), with its seven unpaired electrons, is one of the most
interesting element as a contrast agent since the paramagnetic effect of one ion and its
influence on the relaxation time directly depend upon the number of unpaired electrons
generating the electronic spin that interferes with the nuclear spin of hydrogen. (Lorusso et
al., 2005, Rohrer et al., 2005).
Prior experiments in our laboratory used nanoparticles with
Diethylenetriaminepentaacetic acid (DTPA) as the gadolinium chelating agent and presented
evidence for a radiosensitizing effect (Miladi et al., 2015). However, toxicity issues were
raised as DTPA was not a strong enough chelating agent and could therefore potentially
release gadolinium. Free gadolinium is highly toxic to humans with increasing evidence
showing that the chemical instability of the chelate can lead to exchanges with other metal
ions (zinc Zn2+, copper Cu2+, or calcium Ca2+) which can in turn, have biological
consequences. The ionic radius of Gd3+ (107.8 pm) is close to that of Ca2+ (114 pm) and this
element is an inorganic blocker of many types of voltage-gated calcium channels at the
nano- to micro-molar concentrations. It consequently inhibits those physiological process
which depend upon Ca2+ influx (contraction of smooth, skeletal, and cardiac muscle,
transmission of nervous influx, blood coagulation, etc.) (Lansman, 1990; Biagi and Enjyeart,
1990; Evans, 1990). Gadolinium can also inhibit the activity of some enzymes (Ca2+-
activated-ATPase in the sarcoplasmic reticulum of skeletal muscle fibers, some
dehydrogenases and kinases, glutathione S-transferases, etc.) (Evans, 1990; Itoh and
Kawakita, 1984) and has a remarkable capacity to depress the reticuloendothelial system
(Evans, 1990). The chelator DTPA was therefore dropped out and was replaced by 1,4,7,10-
tetraazacyclododecane-1,4,7,10-tetraacetic acid (DOTA), a stronger gadolinium chelating
agent.
Two parameters are important when discussing the stability of a gadolinium contrast
agent to insure the non-release of gadolinium: the thermodynamic stability and the kinetic
stability. By definition, as gadolinium is chelated, a thermodynamic equilibrium exists
between the metal [M], the ligand [L] and the complex [ML]:
[M] + [L] [ML]
The toxicity of gadolinium complexes depends on their ability to release Gd3+ ions. The
stability of gadolinium complexes is expressed in terms of log Ktherm, where Ktherm is the
thermodynamic stability constant, defined as:
Ktherm = [ML]/[M][L]

Results & Discussion Chapter I. Characterization of the radiosensitizing effects of AGuIX®
160
The better stability of Gd-chelated agent by DOTA can also be explained by the chemical
structures of DOTA, which has a cyclic structure, versus DTPA, which has a linear chemical
structure (Figure 63).
Figure 63: Chemical structures of Gd-DTPA (linear) versus Gd-DOTA (cyclic) chelating agents. (Idée et al., 2006)
Ligand L Log K’ Log Ktherm (GdL) Log Ktherm (CaL) Log Ktherm (CuL) Log Ktherm (ZnL)
DTPA 17.7 22.1 10.7 21.4 18.3
DOTA 18.8 25.8 17.2 22.6 21.0
Table 16: The log K’ value and the Ktherm constants for the ligand and different elements found in the body depending on the ligand type: DTPA versus DOTA. (Idée et al., 2006)
Another parameter that is important to take note of is the kinetic rate at which
equilibrium is reached, estimated through the half-life (T1/2) of dissociation of the complex.
In a very acidic medium, the complex dissociation is a pseudo-first-order reaction, with:
Dissociation rate = kdiss[H+] [GdL].
As [H+] is considerably higher than [GdL] throughout the whole dissociation process, it
was considered that [H+] is constant and equal to [H+]0. Therefore:
Dissociation rate = kobs[GdL]
where
kobs = kdiss[H+]0.
Gadolinium chelates Kobs (s-1) T1/2
Gd-DTPA 1.2 X 10⁻³ 10 min
Gd-DOTA 2.1 X 10⁻⁵ >1 month
Table 17: Kobs values and T1/2 for DTPA and DOTA chelating agents. (Idée et al., 2006)
The main physicochemical criterion to minimize any transmetallation in vivo is the kinetic
stability. It is now well-established that the macro-cyclic ligand (i.e. DOTA) has a much
Results & Discussion Chapter I. Characterization of the radiosensitizing effects of AGuIX®
161
slower decomplexation and transmetallation reaction kinetics and is consequently
characterized by an inertia to decomplexation or transmetallation. (Idée et al., 2006)
An additional factor probably in-part responsible for having to re-determine the
radiosensitizing conditions is that the DTPA-gadolinium-based nanoparticles were designed
differently as they had a gadolinium oxide core surrounded by polysiloxane shell while
AGuIX® nanoparticles have a polysiloxane core surrounded by gadolinium chelates
covalently grafted on the inorganic matrix. Very often, as was mentioned in the bibliography
review, the conditions used for one type of nanoparticle on a cell line is not completely
transferable to another couple nanoparticle/cell line. It is therefore very important to
develop the conditions for use before moving on.
1. Determining the optimal radiosensitizing conditions of AGuIX®
nanoparticles on SQ20B J.L. cells
In order to determine the optimal radiosensitizing conditions of AGuIX® nanoparticles in
SQ20B J.L. cells, several parameters and experimental conditions were tested including:
various culture media, increasing NPs concentrations from 0 to 3 mM Gd, and the time of
incubation. The survival fraction at 4Gy (SF4Gy) assay was used as a first preliminary test to
screen a greater number of conditions to establish the best radiosensitizing effect.
Thereafter, a full clonogenic survival curve was performed in order to validate the
radiosensitizing concentration isolated by the SF4Gy assay.
1.1. Assessing of the concentration and media parameters
In order to test one parameter after another, the first treatment time used was one hour
as previously validated with DTPA NPs on SQ20B J.L. cells (Miladi et al., 2015). Three culture
media were successively tested (HBSS, PBS Ca2+/Mg2+, and serum-free DMEM-Glutamax),
with increasing AGuIX® concentrations from 0mM Gd (control) to 3mM Gd. Two
independent experiments were done for each tested media, including six 25cm2 flasks with
two varying cell concentrations.
1.1.1. AGuIX® treatment in HBSS media
Hanks’ Balanced Salt Solution (HBSS) was the first media tested according to the previous
study with DTPA NPs (Miladi et al., 2015).
✓ SF4Gy assay
Figure 64 shows the SF4Gy obtained for the different concentrations of AGuIX®.

Results & Discussion Chapter I. Characterization of the radiosensitizing effects of AGuIX®
162
Figure 64: Survival fraction at 4Gy varying concentration from 0-3 mM Gd in HBSS media (n=2).
In this culture medium, 1.5 mM Gd was the smallest radiosensitizing concentration obtained
with a SF4Gy of 0.32 compared to 0.45 for untreated cells.
✓ Full clonogenic survival curve assay
Next, the complete clonogenic survival curve was performed using the AGuIX®
concentration isolated by the SF4Gy assay, i.e. 1.5 mM Gd. As depicted in Figure 65, no
significant radiosensitizing effect was obtained under these experimental conditions. This
result is the mean of two independent experiments.
Figure 65: Clonogenic survival assay 0-8 Gy following a 1h AGuIX® treatment in HBSS media at 1.5mM Gd. Blue: 0mM Gd, red: 1,5mM Gd. (n = 2). Each experimental point represents the counting of 6 independent T25cm2 flasks, and the curve represent the combination of two independent experiments.

Results & Discussion Chapter I. Characterization of the radiosensitizing effects of AGuIX®
163
[Gd] (mM) α β 10%
Survival 50%
Survival EBR-10% EBR-50%
0 0.095 0.0247 7.92 3.72 0.972 0.847
1.5 0.0127 0.0331 8.15 4.39
Table 18: Summary of parameters evaluating the radiosensitizing effect of AGuIX® at 1.5mM Gd in HBSS. (The α and β parameter are calculated using the linear quadratic equation S=exp(-αD-βD2, described page 126 of the Materials and Methods section).
As can be seen in Table 18, whether we look at the 10% Enhanced Biological Response
(EBR) or the 50% EBR, it is lower than 1, which means that treating the cells with AGuIX®
prior to radiation does not increase cellular death. In addition, one might notice in Figure
65, that the red curve (cells treated with 1.5mM Gd) is over that of the untreated cells,
however, most error bars overlap and therefore means that there is no significant difference
in the survival fraction between untreated and treated cells.
Collectively, after analyzing the clonogenic survival curve assay, we did not validate 1.5
mM AGuIX® for 1 hour in HBSS as a working radiosensitizing concentration.
1.1.2. AGuIX® treatment in Phosphate Buffer Saline (PBS) Ca2+/Mg2+
Phosphate Buffer Saline (PBS) with Ca2+ and Mg2+ was the second medium tested.
(*Note: Ca2+/Mg2+ was necessary, otherwise the cells would unattach from the flask).
✓ SF4Gy assay
Figure 66 shows the SF4Gy obtained for the different concentrations of AGuIX® tested.
Figure 66: Survival fraction at 4Gy varying concentration from 0-3 mM Gd in PBS Ca2+/Mg2+ media (n=2).

Results & Discussion Chapter I. Characterization of the radiosensitizing effects of AGuIX®
164
In this medium, 1.0mM Gd was the smallest radiosensitizing concentration obtained with
a SF4Gy of 0.32 compared to 0.48 for untreated cells.
✓ Full clonogenic survival curve assay
Again, the complete clonogenic survival curve was then performed using the gadolinium
concentration isolated by the SF4Gy assay, i.e. 1mM Gd. As it can be observed in Figure 67,
no significant radiosensitizing effect was obtained in this medium with 1mM AGuIX®.
Figure 67: Clonogenic survival assay 0-8 Gy following a 1h AGuIX® treatment in PBS Ca2+/Mg2+ media at 1mM Gd. Blue: 0mM Gd, red: 1mM Gd (n= 2).
[Gd] (mM) α β 10% 50% EBR-10% EBR-50%
0 0.0189 0.0473 6.75 3.62 0.935 0.889
1.0 -0.0217 0.0471 7.22 4.07
Table 19: Summary of parameters evaluating the radiosensitizing effect of AGuIX® at 1mM Gd in PBS Ca2+/Mg2+.
As can be seen in Table 19, both the 10% and the 50% EBR were lower than 1, which
means that treating the cells with 1 mM AGuIX® prior to radiation does not improve survival.
Again, one might notice in Figure 67 that the red curve (cells treated with 1mM Gd) is over
that of the untreated cells with error bars overlapping which means that there is not
difference in the survival fraction between untreated and treated cells. At last, a negative α
value was obtained whereas no difference concerning the β parameter occurred between
untreated and treated cells.

Results & Discussion Chapter I. Characterization of the radiosensitizing effects of AGuIX®
165
In this culture medium, the clonogenic survival curve assay did not allow us to choose
1mM Gd for 1 hour in PBS Ca2+/Mg2+ as a working radiosensitizing condition.
1.1.3. AGuIX® treatment in serum-free DMEM-Glutamax
Dulbecco’s Modified Eagle’s Medium was the third and last media tested.
✓ SF4Gy assay
Figure 68 shows the SF4Gy obtained for the different concentrations of AGuIX® tested.
Figure 68: Survival fraction at 4Gy varying concentration from 0-3 mM Gd in serum-free DMEM-Glutamax media (n=2).
The concentration 0.8 mM Gd was noted as the best radiosensitizing concentration when
the treatment was done in serum-free DMEM-Glutamax with a SF4Gy of 0.28 compared to
0.42 for untreated cells.
✓ Full clonogenic survival curve assay
When performing the full clonogenic assay using 0.8 mM AGuIX® in serum-free DMEM-
Glutamax, no radiosensitizing effect was observed, as can be seen in Figure 69. We were
therefore unable to validate the concentration of 0.8mM Gd in DMEM-Glutamax.
As can be seen in Table 20, both the 10% and 50% EBR were close to 1 thus confirming
the absence of a radiosensitizing effect. As shown in in Figure 69, the survival curves
obtained for untreated and treated cells were very close to each other. However, we can
note a difference in the α parameter, as it is doubled in the presence of nanoparticles, which
suggest that more immediate lethal lesions should occur whereas no significant difference
was obtained concerning the β.

Results & Discussion Chapter I. Characterization of the radiosensitizing effects of AGuIX®
166
Figure 69: Clonogenic survival assay 0-8 Gy following a 1h AGuIX® treatment in serum-free DMEM-Glutamax media. Blue: 0mM Gd, red: 0.8mM Gd (n= 9).
[Gd] (mM) α β 10% 50% EBR-10% EBR-50%
0 0.0589 0.0354 7.25 3.65 0.964 1.058
0.8 0.1103 0.026 7.52 3.45
Table 20: Summary of parameters evaluating the radiosensitizing effect of AGuIX® at 0.8mM Gd in serum-free DMEM-Glutamax.
When treating the cells for 1 hour with 0.8mM Gd in serum-free DMEM-Glutamax for
one hour, we do not observe any radiosensitizing effect.
The three mediums tested are quite different in their composition: some are isotonic
solutions (PBS and HBSS) whereas DMEM-Glutamax is a much more complex solution
containing inorganic salts, amino acids, vitamins, and phenol red. The complete ingredient
lists for HBSS, PBS Ca2+/Mg2+, and DMEM-Glutamax with corresponding concentrations can
be found in Annex 3.
When analyzing the results obtained for the SF4Gy assay in all three media, no linear
relationship was obtained between the AGuIX® concentration used and the SF4Gy. An
interesting observation that we can make, is that the radiosensitizing effect of AGuIX® does
not represent a linear relationship. Indeed, one could think that as the AGuIX®
concentration is increased, the radiosensitizing effect would increase. Surprisingly, a U-
shaped curve occurred. Considering the results obtained after the full clonogenic survival
curves, i.e. no significant radiosensitizing effect whatever the culture medium or the AGuIX®

Results & Discussion Chapter I. Characterization of the radiosensitizing effects of AGuIX®
167
concentration used, we decided to increase the incubation time with AGuIX® before
irradiation.
1.2. Increasing the incubation time
As the lowest concentration of AGuIX® isolated from the SF4Gy assay was obtained in
serum-free DMEM Glutamax, we further used these experimental conditions with increasing
incubation time: 1 hour (reference treatment time), 4, 12, and 24 hours. Moreover, we
quantified the amount of AGuIX® taken up by the cells by inductively coupled plasma atomic
emission spectroscopy (ICP-AES) in order to investigate if more AGuIX® internalized would
improve radiosensitization.
1.2.1. Internalization of AGuIX in SQ20B J.L. cells: ICP-AES experiments
In order to quantify gadolinium internalization by SQ20B J.L. cells, a kinetic study ranging
from 1h up to 24h was performed with ICP-AES.
As mentioned above, a concentration of 0.8mM Gd in serum-free DMEM-Glutamax was
used throughout these experiments. The results are summarized in Figure 70.
Figure 70: Quantity of gadolinium internalized by SQ20B J.L. cells as a function of incubation time (1-4-12-24 hours of exposure to 0.8 mM of AGuIX®) in serum-free DMEM-Glutamax quantified by ICP-AES. The three wavelengths of gadolinium are represented (342, 336, and 332 nm). This is a mean of 2 independent experiments with three flasks for each, and three separate readings from the ICP.
After one-hour of incubation with the AGuIX®, SQ20B J.L. cells internalize about 0.05 pg
Gd/cell. This value was not significantly modified even after 4 and 12 hours of treatment
(ICP values are 1h: 0.0484; 4h: 0.0651; 12h: 0.0571 pg/cell, respectively). However, under
the same experimental conditions, about 0.11 pg of gadolinium per cell was internalized 24
hours after of AGuIX® treatment, whatever the wavelengths of gadolinium (335, 336, and

Results & Discussion Chapter I. Characterization of the radiosensitizing effects of AGuIX®
168
342 nm) used. This is more than 10 times lower than the quantity that was internalized by
these cells when treated with the DTPA-gadolinium-based nanoparticles (1.24 pg/cell: Miladi
et al., 2015). When compared to other studies, the quantity of nanoparticles internalized by
SQ20B J.L. cells is quite low, 0.4 pg Gd/cell in B16F10 melanoma cells after 1 hour of
treatment with 0.6 mM Gd (Kobt et al., 2016); 1.25 pg Gd/cell In Panc-1 cells, after only 30
minutes of incubation (Detappe et al., 2015) whereas 0.059 mM of gadolinium was taken up
by HeLa cells, one hour after treatment with 0.5 mM Gd (Luchette et al., 2014).
1.2.2. Survival Fraction at 4Gy (SF4Gy) response when increasing AGuIX® treatment
time:
Following these experiments, the impact of this longer incubation time with AGuIX® was
checked with the SF4Gy assay and a full clonogenic survival curve was performed.
✓ SF4Gy assay
Figure 71 shows the SF4Gy obtained for the different concentrations of AGuIX® tested
while Table 21 shows the enhanced biological response (EBR).
Figure 71: Survival fraction at 4Gy at 0.8mM Gd following different AGuIX® treatment times (1h-4h-12h-24h). The values are the mean ± SD of three independent experiments.
As depicted in Figure 71, a significant decrease of the SF4Gy was obtained only after a 24h
incubation time with AGuIX®. This result is perfectly correlated with the ICP-AES experiments
and underline the fact that a minimum amount of internalized Gd can result in a significant
biological effect.
The EBR values were calculated and are enumerated in Table 21.

Results & Discussion Chapter I. Characterization of the radiosensitizing effects of AGuIX®
169
Treatment time (H) EBR (4Gy)
1 1.076
4 1.173
12 1.018
24 1.436
Table 21: Calculated Enhanced Biological Response (EBR) at 4Gy for the four different incubation times at 0.8mM Gd in serum-free DMEM-Glutamax.
The treatment time of 24 hours was retained as the optimal time of treatment at a
concentration of 0.8 mM Gd in serum-free DMEM-Glutamax with a SF4Gy of 0.37 compared
to 0.53 for untreated cells. This represented an EBR of 1.436.
✓ Full clonogenic survival curve assay
The experimental conditions reported above were then validated with the clonogenic
survival curve. Figure 72 shows a significant radiosensitizing effect of 0.8 mM AGuIX® when
incubated for 24h before irradiation in DMEM-Glutamax. A summary of the parameters
evaluating the radiosensitizing effect of AGuIX® under these treatment conditions is
reported in Table 22.
Figure 72: Clonogenic survival assay 0-10 Gy following a 24h AGuIX® treatment in serum-free DMEM-Glutamax at a concentration of 0.8mM Gd. Blue: 0mM Gd, red: 0,8mM Gd. This result is the mean ± SD of three independent experiments. (***, p<0.005 vs. irradiated SQ20B cells).

Results & Discussion Chapter I. Characterization of the radiosensitizing effects of AGuIX®
170
[Gd] (mM) α β 10% 50% EBR-10% EBR-50%
0 0.1593 0.0079 9.75 3.65 1.281 1.377
0.8 0.2357 0.0088 7.61 2.65
Table 22: Summary of parameters evaluating the radiosensitizing effect of the addition of AGuIX® for 24 hours at 0.8mM Gd in serum-free DMEM-Glutamax.
Radiosensitization with NPs can occur after various conditions of treatment
(concentration, incubation time …) depending on the cell line and the type of nanoparticles
used. For example, Townley et al. studied X-ray-activable titania nanoparticles on two
rhabdomyosarcoma and MCF-7 cells and incubated them at 225 nmoles per well overnight
(Townley et al., 2012), while gold nanoparticles have been used in varying concentration
going from 1 nM (14 nm gold nanoparticles coated with citrate used on HeLa cells in
combination with a photon energy of 220 kVp Chithrani et al., 2010) to 1 mM on BAEC cells
using a 150 kVp irradiator with an observed DEF of 4 (Rahman et al., 2009). There are many
different kinds of gold nanoparticles developed as radiosensitizers, different sized
nanoparticles, with different coatings, used in a variety of cell lines and with different types
of irradiation, all of which are summarized in Coulter et al., 2013. Even in the study of
AGuIX® as radiosensitizers, different concentrations varying from 0.05 mM to 1.0 mM and
incubation times have been used to observe a radiosensitizing effect in different cell lines as
can be seen in Table 11 of the bibliography review. (Sancey et al., 2014)
Our radiosensitizing conditions with AGuIX® and SQ20B J.L. cells were finally
determined to be 0.8 mM Gd for 24 hours in serum-free DMEM-Glutamax. In these
conditions, the SF4Gy is 1.382 and we have a 50% Enhanced Biological Factor (EBR) of 1.377.
This 50% EBR was calculated following the clonogenic survival curve assay (and therefore the
nine irradiation doses were taken into account when calculating the value), whereas in Table
21, we have an EBR (4Gy) at 1.436, value which was calculated with only two points. This
EBR is in the same range compared to what is currently published in studies using AGuIX®
nanoparticles as radiation sensitizer whether in HeLa (cervical cancer), Panc-1 (pancreatic
cancer), U87 (glioblastoma), and B16F10 (melanoma), with DEFs varying from 1.17 (Panc-1)
to 1.54 (HeLa).
In 2014, Štefančíková et al. reported an enhancement factor close to 23% in U87 cells
treated with 0.5 mM Gd for 6 hours which corresponds to a decrease of the SF2Gy to 0.24
compared to 0.31 in untreated cells. Moreover, they showed an increase in the α-parameter
(with an α of 0.4 in untreated cells vs 0.71 in treated cells respectively), a result slightly
higher than our (0.16 in untreated cells vs 0.24 in treated cells). Two years later, they
published another study where U87 cells were treated with 1 mM Gd for one hour, which
resulted in an EBR of 1.47. In HeLa cells, Berbeco et al. (2014) have tested two irradiation
sources: 220 kV and 6 MV (to see their potential in a clinical setting). When treating HeLa
cells with 0.5 mM Gd for one hour, they observed a SER4Gy of 1.54 when irradiating at 220

Results & Discussion Chapter I. Characterization of the radiosensitizing effects of AGuIX®
171
kVp and 1.28 after exposure to at 6 MV. The average DEF was calculated to be 1.54 at 220
kVp while it was a little lower for the 6 MV irradiation source: 1.15.
Collectively, these results and ours suggest that the extent of radiosensitization with
AGuIX® depends essentially on the cellular model used. Indeed, whatever the time of
incubation or the concentration of AGuIX® used in these different cellular models,
radiosensitization occurs with an EBR fairly comparable.
Prior to definitively use the experimental conditions defined above for the rest of the
work, we wanted to verify the impact of using a full medium (containing 10% FBS) on the
radiosensitizing effect of AGuIX® since previous work in the lab demonstrated that an
agglomeration of DTPA-based nanoparticles have occurred in the presence of FCS.
Figure 73 and Table 23 show the results obtained by the clonogenic survival assay when
treating SQ20B J.L. cells with the conditions previously determined for AGuIX®, but in full
media (in the presence of 10% FCS).
Figure 73: Clonogenic survival assay 0-6 Gy following a 24h AGuIX® treatment in full media at a concentration of 0.8mM Gd. Blue: 0mM Gd, red: 0,8mM Gd.
[Gd] (mM) α β 10% 50% EBR-10% EBR-50%
0 0.1906 0.0241 6.58 2.7 1.079 1.059
0.8 0.1979 0.0293 6.1 2.55
Table 23: Summary of parameters evaluating the radiosensitizing effect of the addition of AGuIX® in full media.

Results & Discussion Chapter I. Characterization of the radiosensitizing effects of AGuIX®
172
In the presence of 10% FCS (full SQ20B J.L. medium) using the radiosensitizing conditions
determined in serum-free DMEM-Glutamax, no radiosensitizing effect was observed as
assessed by the survival curve assay (Figure 73) and the various radiobiological parameters
reported in Table 23. In addition, the α and β values are also the same, as can be seen in
Table 23.
After testing different AGuIX® concentrations in different media using the SF4Gy and the
clonogenic survival curve assays, as well as quantifying the gadolinium intake of SQ20B J.L.
cells, the following radiosensitizing conditions with AGuIX® for SQ20B J.L. cells were
therefore determined to be a concentration of 0.8 mM Gd for 24 hours in serum-free
DMEM-Glutamax this for the rest of the work presented below.
2. Toxicity study
Once the radiosensitizing conditions treatment were determined, we checked about the
treatment toxicity of AGuIX® in the absence of irradiation. In this study, three tests were
used: a proliferation assay, the trypan blue assay and the MTT assay, respectively.
2.1. Proliferation assay: % confluency measurements by IncuCyte
The IncuCyte live imaging allows an optimized in vitro microscope based on the
proliferation of SQ20B cells, taking a picture in phase contrast every two hours for up to
seven days. This assay was realized up to 168h after treatment with AGuIX®. As depicted in
Figure 74, SQ20B cells continue to proliferate, whatever the incubation time with AGuIX®.
Figure 74: Proliferation assay measuring the percentage confluency using the IncuCyte Live Cell Analysis (n=2).

Results & Discussion Chapter I. Characterization of the radiosensitizing effects of AGuIX®
173
2.2. Cell viability: Trypan Blue assay
Trypan blue assay is a dye exclusion test widely used to monitor cellular toxicity: as viable
cells have intact cell membranes which do not allow trypan blue to enter, nonviable cell will
have a blue cytoplasm. The percent viability was calculated by dividing the number of viable
cells by the number of total cells (live + dead cells).
Figure 75: Percentage of viability using the blue trypan assay (n=3).
As can be observed in Figure 75, the percent viability of SQ20B J.L. cells with or without AGuIX® treatment remains unchanged, thus demonstrating the absence of toxicity of AGuIX®.
2.3. Mitochondrial activity: MTT assay
A third assay was performed in order to validate the absence of toxicity following AGuIX®
treatment: the MTT assay is a colorimetric assay for assessing cell metabolic activity.
NAD(P)H-dependent cellular oxidoreductase enzymes may, under defined conditions, reflect
the number of viable cells present. These enzymes are capable of reducing the tetrazolium
dye MTT 3-(4,5-dimethylthiazol-2-yl)-2,5-diphenyltetrazolium bromide to its
insoluble formazan, which has a purple color. Mitochondrial activity was measured starting
48 hours after treatment (the time 24 hours was used as a reference), until 7 days after
AGuIX® treatment. As seen in Figure 76, AGuIX® treatment does not affect significantly
mitochondrial activity.

Results & Discussion Chapter I. Characterization of the radiosensitizing effects of AGuIX®
174
Figure 76: Percent (%) of proliferation measured by the MTT assay.
Using these three different assays, we have clearly demonstrated that AGuIX® treatment
conditions were not toxic to cells, at the cellular level (blue trypan assay) nor at the
mitochondrial level (MTT assay).
These same tests were also performed with an additional control, i.e. SQ20B J.L. cells in
their full medium (in the presence of 10% FCS). No significant differences were noted
between cells that were always in full media compared to cells that had been in serum-free
DMEM for 24 hours.
3. Subcellular localization of AGuIX® in SQ20B J.L. cells
Nanoparticles localization inside cells once internalized is of great interest as it can help in
the understanding of the cellular mechanisms by which radiosensitization could occur. We
therefore focused on their localization with respect to the nucleus, mitochondria, and
lysosomes, using AGuIX® bound to Cya5.5 for an application in confocal microscopy.
3.1. With respect to the nucleus
After twenty-four hours of incubation with AGuIX®, cells were fixed in 4% PFA and the
nuclei stained with DAPI.

Results & Discussion Chapter I. Characterization of the radiosensitizing effects of AGuIX®
175
Figure 77: Three separate planes of the localization of AGuIX®-Cya5.5 nanoparticles in SQ20B J.L. cell line in respect to the nucleus with a confocal spinning-disk microscope (µLife Platform, CEA-Grenoble). a. DAPI (nucleus); b. AGuIX® -Cya5,5; c. Merge. Experiments realized on fixed cells (4% PFA); 60X, with S. Gerbaud- team Biomics.
As shown in Figure 77, no co-localization of AGuIX® nanoparticles with the nucleus
occurred, a result which is in accordance with previous published worked (Štefančíková et
al., 2014; Kobt et al., 2016), whether with AGuIX® or other types of nanoparticles.
3.2. With respect to mitochondria
After twenty-four hours of incubation with AGuIX®, cells were put in a humidified
chamber kept at 37°C and 5% CO2 to visualize live cells, without fixing them. The cells were
stained with Mitotracker-Green prior to the incubation with AGuIX®-Cya5.5. Thirty-one

Results & Discussion Chapter I. Characterization of the radiosensitizing effects of AGuIX®
176
slices were taken (Z-positions). The pictures taken shown in Figure 78 is representative of
more than 100 cells that were imaged.
Figure 78: Three separate planes of the localization of AGuIX® nanoparticles in SQ20B J.L. cell line with respect to mitochondria with a confocal spinning-disk microscope (µLife Platform, CEA-Grenoble). a. Mitotracker-green; b. AGuIX® -Cya5,5; c. Merge. Experiments realized on live cells; 60X, with S. Gerbaud- team Biomics.
As can be observed in Figure 78, no co-localization of AGuIX® nanoparticles with
mitochondria was obtained. This is in accordance with Štefančíková et al. (2014), who had
also done co-localization studies between mitochondria and AGuIX®-Cya5.5.
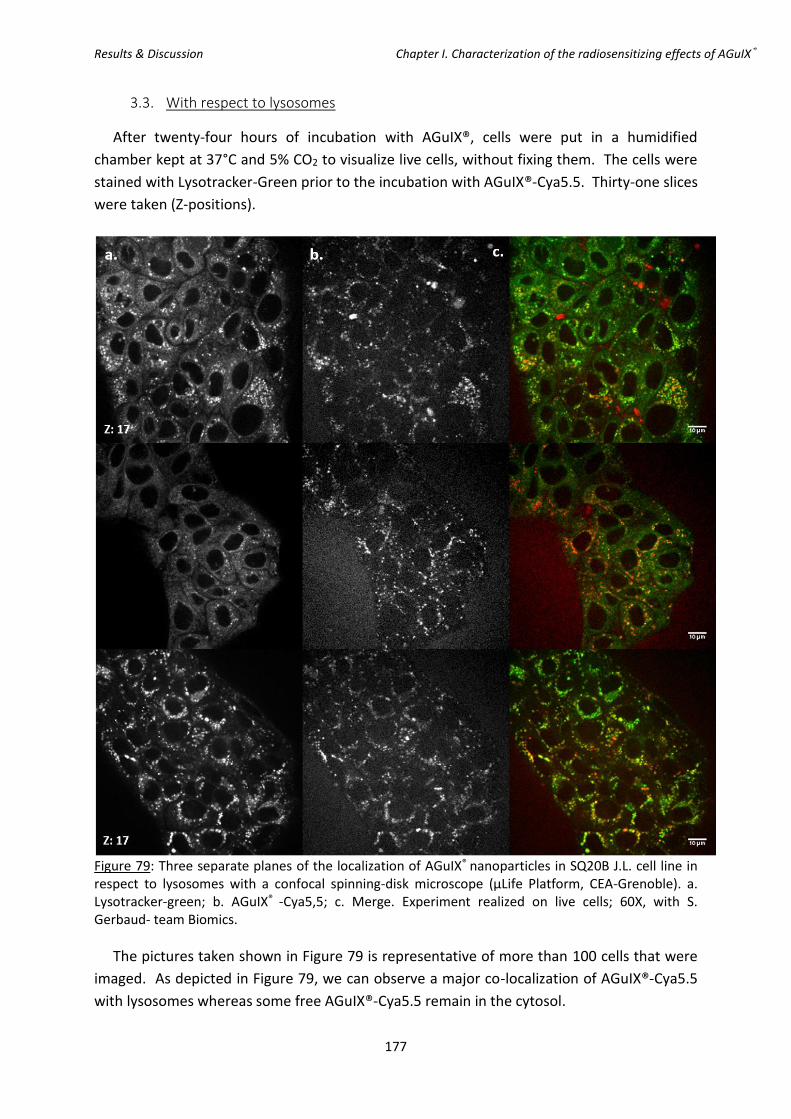
Results & Discussion Chapter I. Characterization of the radiosensitizing effects of AGuIX®
177
3.3. With respect to lysosomes
After twenty-four hours of incubation with AGuIX®, cells were put in a humidified
chamber kept at 37°C and 5% CO2 to visualize live cells, without fixing them. The cells were
stained with Lysotracker-Green prior to the incubation with AGuIX®-Cya5.5. Thirty-one slices
were taken (Z-positions).
Figure 79: Three separate planes of the localization of AGuIX® nanoparticles in SQ20B J.L. cell line in respect to lysosomes with a confocal spinning-disk microscope (µLife Platform, CEA-Grenoble). a. Lysotracker-green; b. AGuIX® -Cya5,5; c. Merge. Experiment realized on live cells; 60X, with S. Gerbaud- team Biomics.
The pictures taken shown in Figure 79 is representative of more than 100 cells that were
imaged. As depicted in Figure 79, we can observe a major co-localization of AGuIX®-Cya5.5
with lysosomes whereas some free AGuIX®-Cya5.5 remain in the cytosol.

Results & Discussion Chapter I. Characterization of the radiosensitizing effects of AGuIX®
178
3.4. Kinetic study of the internalization of AGuIX® by confocal microscopy: 1h-2h-4h-
6h, with respect to the lysosomes
This next section will illustrate the kinetics of the internalization of AGuIX® nanoparticles
inside SQ20B J.L. cells.
Indeed, in Figure 80, we can observe that very few nanoparticles are internalized after
one hour of treatment, and that as time goes by, more nanoparticles appear in the cells. In
addition, we observe that after 1 and 2 hours of incubation, the internalized nanoparticles
are free in the cytoplasm as there is no co-localization between AGuIX®-Cya5.5 and
lysosomes. However, starting at the time point of 4 hours, we start observing some co-
localization. We can therefore speculate that the internalization of nanoparticles by the
lysosomes is a slow process. Figure 80 shows one set x-and y-locations, however more than
ten photos were taken for each time points with more than ten cells per microscopic field
and the same pattern was observed.

Results & Discussion Chapter I. Characterization of the radiosensitizing effects of AGuIX®
179
Figure 80: Kinetic study (1-2-4-6 hours) of the localization of AGuIX® nanoparticles in SQ20B J.L. cell line in respect to lysosomes with a confocal spinning-disk microscope (µLife Platform, CEA-Grenoble). a. Lysotracker-green; b. AGuIX® -Cya5,5; c. Merge. Experiment realized on live cells, on the same x and y location, and Z= 16; 60X, with S. Gerbaud- team Biomics.
Collectively, our results clearly indicate that under our experimental conditions, AGuIX®
are not targeted to the nucleus nor to mitochondria. AGuIX® mostly co-localize with
lysosomes although some free AGuIX® stay freely in the cytosol. Our results are in accordance
with those published by Štefančíková et al. (2014) which used confocal microscopy and
transmission electron microscopy (TEM) to observe the localization of AGuIX® in U87 cells

Results & Discussion Chapter I. Characterization of the radiosensitizing effects of AGuIX®
180
(human glioblastoma cells). In a first experiment, using label-free AGuIX® and SR-DUV
microscopy, they showed that AGuIX® nanoparticles (free of dye) enter the cells and remain
located exclusively in the cytoplasm. TEM experiments confirmed these results, namely that
no electron dense regions were found in the cell nucleus but NPs clusters appeared vesicles
with average diameters between 400-800 nm which corresponds to endosomes and
lysosomes (Huotari and Helenius; 2011). Moreover, membrane invagination was observed
which would suggest that AGuIX® enter U87 cells via endocytosis. Using confocal
microscopy, the intra-lysosomal localization of AGuIX® was definitely proven. This
observation was also obtained with AGuIX® in Chinese Hamster Ovary (CHO) cells (Porcel et
al., 2014). AGuIX® clusters of sizes between 400-900 nm was observed regardless of the
concentration used, 0.6 or 1 mM Gd or the incubation time (1 hour, 6 hours, and 12 hours).
The authors observed AGuIX® in U87 cells for up to 37 hours (end time of their observation).
After 1 hour of incubation, TEM images revealed an AGuIX® localization in vacuoles in the
cytoplasm in Panc-1 cells (Detappe et al., 2015).
Using FITC-labeled particles AGuIX® and confocal microscopy, Kobt et al. (2016) recently
reported that nanoparticles were inside vesicles, a result confirmed by TEM images. (Kobt et
al., 2016).
All these studies demonstrated that AGuIX® enter the cells mainly via the endocytic
pathway and remain in vesicular structures such as lysosomes. As some AGuIX® seem to stay
freely in the cytosol, they might enter the cells independently of the endocytic pathway or
might have been released after lysosome leakage. However, they are never found within the
nucleus nor mitochondria.
CHAPTER I TAKE-HOME MESSAGE:
The conditions for the radiosensitization of SQ20B J.L. cells with AGuIX® were determined
as follows: 0.8mM Gd for 24 hours in serum-free DMEM-Glutamax; this corresponds to
0.11 pg of gadolinium internalized per cell. These conditions are not toxic to cells whether
at the cellular or the mitochondrial level. In addition, it was demonstrated that AGuIX®
are exclusively localized in the cytoplasm: there is no co-localization between AGuIX®
nanoparticles and the nucleus, nor do they co-localize with the mitochondria. AGuIX®
nanoparticles were found to be either free in the cytosol or internalized by lysosomes.
This internalization by the lysosomes seemed to be a slow process as assessed by the
microscopy kinetic study.

Results & Discussion Chapter II. Study of the Oxidative Stress
181
Chapter II. Study of the Oxidative Stress Induced by the combined
treatment of AGuIX® + I.R. and its functional consequences on
mitochondria
wing to the physical properties of high-Z metal nanoparticles, the over-production
of radical oxygen species (ROS), is the most widespread hypothesis for the
molecular mechanisms underlying the expected radiosensitizing effect when used in
combination with ionizing radiation. This hypothesis has therefore been translated for
AGuIX® in cellular models, although this has not always been proven in vitro.
In addition to damages to the nucleus which will be studied in the next chapter, ionizing
radiations can induce damages to the plasma membrane, as well as cellular organelles such
as the mitochondria. Mitochondria are the power-houses of a eukaryotic cell, and damage to
the mitochondria can be an indicator of cells undergoing stress which could lead to cellular
death.
Therefore, the following chapter of the Results & Discussion section is therefore devoted to
the kinetic study of both cytosolic (cROS) and mitochondrial (mROS) ROS in order to check if
ROS and oxidative stress are indeed the initiating mechanisms leading to radiosensitization.
Two subcellular oxidative stress markers, i.e. the mitochondrial membrane potential and the
common deletion of mitochondrial DNA have been investigated.
O

Results & Discussion Chapter II. Study of the Oxidative Stress
182

Results & Discussion Chapter II. Study of the Oxidative Stress
183
1. Study of the oxidative stress (mitochondrial and cytosolic reactive oxygen
species) induced by the the combined treatment of AGuIX® + I.R.
Besides theoretical data concerning nanoparticles irradiated in water, such information in
cellular models is lacking. The generation of both cytosolic and mitochondrial ROS was
therefore investigated by flow cytometry using the fluorescent probes CM-H2DCFDA and
Mitosox for cROS (cytosolic ROS) and mROS (mitochondrial ROS), respectively.
1.1. Cytosolic Radical Oxygen Species (cROS)
In order to quantify the production of cROS after the combined treatment, a kinetic study
starting right after until five days post-irradiation was performed. A representative graph
obtained by flow cytometry using CM-H2DCFDA is shown in Figure 81. CM-H2CDFDA is a
fluorescent probe allowing for the measurement of cytosolic reactive oxygen species. This
probe is better retained in cells and diffused passively into the cells, where its acetate groups
are cleaved by the intracellular esterases and its thiols-reactive chloromethyl group reacts
with intracellular glutathione and other thiols. The resulting oxidation produces a
fluorescent adduct.
Figure 81: Kinetic study of cytosolic ROS (cROS) production, 0 to 120 hours after a 10 Gy irradiation measured by flow cytometry as a function of the mean fluorescence intensity. This figure is representative of one of three independent experiments, with triplicate samples for each condition.
Under our experimental conditions, Figure 81 shows that the addition of AGuIX® did not
induce a significant increase of cROS production compared to irradiation alone, regardless of
the time after irradiation except immediately after irradiation where we had a 35% increase
of cROS with after treatment with AGuIX® combined with irradiation. As previously reported
in SQ20B cells (Alphonse et al., 2002; Bionda et al., 2008), the increase of cROS is late

Results & Discussion Chapter II. Study of the Oxidative Stress
184
following exposure to radiation but incubation with AGuIX® did not induce any additional
effect for the times tested starting at 15 min post-irradiation.
1.2. Mitochondrial ROS (mROS)
As mitochondria are an important source of ROS within most mammalian cells (Turrens,
2003), the same kinetic experiment was performed for mROS production. A representative
graph obtained by flow cytometry using the MitoSox as a specific probe is shown in Figure
82.
Figure 82: Kinetic study of mitochondrial ROS (mROS) production, 0 to 120 hours after a 10 Gy irradiation measured by flow cytometry as a function of the mean fluorescence intensity. This figure is representative of three independent experiments, with triplicate samples for each condition.
As observed with cROS, the addition of AGuIX® does not induce any significant additional
mROS compared to radiation alone (Figure 82), regardless the time after irradiation. As
mentioned previously, the increase of mROS after radiation alone is delayed in time, starting
at 24 hours after irradiation (+14% AGuIX® + irradiation versus irradiation alone) and a peak
at 48 hours (+19%) which then decreases 72 and 120 hours after irradiation (the increase
between the two treatments is less important). Collectively, these results are surprising
because incubation with AGuIX® prior to radiation was expected to enhance massively the
production of ROS in SQ20B cells.
However, it is well known that some cancer cells with upregulated redox and antioxidant
ability can escape from the damaging effects of radiation by scavenging ROS, leading to
radioresistance (Lee et al, 2004; Diehn et al., 2009). This is particularly true for the SQ20B

Results & Discussion Chapter II. Study of the Oxidative Stress
185
cell line (Boivin et al, 2011) which exhibits a very high endogenous level of reduced
glutathione, the major non-enzymatic cellular anti-oxidant. By transiently inhibiting this anti-
oxidant system (4-hour treatment with DMF and BSO prior to irradiation), we were able to
trigger apoptosis in this radio-resistant cancer cell line. Indeed, GSH is a major ROS-
scavenging system in cells and important redox modulating enzymes such as including the
peroxidases, peroxiredoxins and thiol reductases rely on the pool of reduced GSH as their
source of reducing equivalents (Forman et al., 2009; Boivin et al., 2011).
2. Kinetic study of the mitochondrial membrane potential (Ψm) after AGuIX® +
I.R.
The mitochondrial membrane potential is a biological marker of mitochondrial
dysfunction which occurs before the cells enter apoptosis. The different treatment
conditions were studied, to see whether the combination treatment of AGuIX® + I.R. induced
a bigger percentage drop of the mitochondrial membrane potential which would reflect a
mitochondrial stress.
Figure 83: Kinetic study 24-240 hours post-irradiation of the percentage drop in the mitochondrial membrane potential (Ψm) depending on the treatment conditions. This figure is representative of three independent experiments. All samples were normalized to the control (0mM Gd 0Gy), and the statistics was done on 0.8mM Gd 0Gy versus 0.8mM Gd 10Gy, and 0mM Gd 10Gy vs. 0.8mM Gd 10Gy. Statistical analysis was realized with the Student’s t test. Significant results have a p value <0.05 (*), <0.01 (**), or <0.005 (***).
As can be observed in Figure 83, we can first conclude that the addition of AGuIX® alone
does not induce a drop in the mitochondrial membrane potential, while 72 hours post-
irradiation, we start observing a drop of the mitochondrial membrane potential which is
persistent through 10 days post-irradiation. Indeed, 72 hours post-irradiation, the cells will
have a 74% drop in their mitochondrial membrane potential compared to 63.4% with the
addition of AGuIX® (representing a greater drop by 15%), which was not significant.
Results & Discussion Chapter II. Study of the Oxidative Stress
186
However, this small difference is even less at T= 120 and 240 hours post-irradiation which
leads to the conclusion that we cannot report any significant differences between irradiated
only cells and those treated with AGuIX® prior to irradiation. Although the drop of Ψm has
already been reported in SQ20B cells following irradiation (Alphonse et al, 2002), the
combined treatment did not have any additional effect on the alteration of the
mitochondrial transmembrane potential (except at 72h post IR).
3. Study of the mitochondrial DNA (mtDNA) common deletion after AGuIX® +
I.R.
Mitochondrial DNA (mtDNA) is also known as a target of oxidative stress and thus a
cellular marker indicating that the cell is undergoing an oxidative attack. In this next section,
the common deletion of mtDNA was quantified at two different irradiation time points: 24
and 72 hours. 24 hours was chosen in order to observe the “initial” level of damages, and 72
hours allowed for the cells to in part recover from the irradiation and allow for replication. It
is important to note that mtDNA deletions induced by radiation are not immediately present
after treatment because their formation requires mtDNA replication (Prithivirajsingh et al.,
2004; Kubota et al., 1997). In addition, in many other assays throughout this PhD work, we
started observing an effect of irradiation 72 hours post-irradiation, which can be explained
by the high resistance to irradiation of these cells. Two different irradiation doses were
studied: 4 and 10 Gy. The results are expressed as the ratio of deleted mtDNA over the total
mtDNA.

Results & Discussion Chapter II. Study of the Oxidative Stress
187
Figure 84: Deleted mtDNA/total mtDNA ratio for SQ20B J.L. cells following different treatment conditions. a. 24 hours post-irradiation. b. 72 hours post-irradiation. Representative data of two independent experiments with biological triplicates.
As can be seen in Figure 84, we did not observe any differences 24 hours post-irradiation
in accordance with what is found in the literature. Seventy-two hours after irradiation
alone, there is no effect after a 4 Gy irradiation (deleted mtDNA/total mtDNA ratio = 1.16)
while this ratio increased after a 10 Gy exposure (ratio deleted mtDNA/total mtDNA = 1.67.
Irradiation alone does not induce the common deletion of the mitochondrial DNA. The
treatment with AGuIX® had no influence on the deleted mtDNA/total mtDNA ratio, 24h after
radiation, whatever the dose applied. However, 72h after a 4 Gy irradiation, we observed an
increase in the amount of deleted mitochondrial DNA with a ratio of deleted mtDNA/total
mtDNA of 2.93 which is statistically significant, using the Student test, compared to
irradiated only cells. It is interesting to note that there are no differences detected after the
combined treatment of nanoparticles with the 10 Gy irradiation. One of the hypothesis
emitted was that there is a higher death rate of the cells that received 10 Gy and in turn had
a damaged mtDNA, which therefore led to the measurements of cells that were able to
resist the treatment.

Results & Discussion Chapter II. Study of the Oxidative Stress
188
4. Radiosensitization after the addition of DMF/BSO treatment
In order to bypass the antioxidant ability of SQ20B cells, we lowered their GSH content
before incubation with AGuIX® and irradiation. Under these conditions, we hypothesized
that a significant increase of ROS caused by the addition of AGuIX® prior to radiation should
be highlighted.
4.1. Quantification of the endogenous GSH content in SQ20B cells
According to Boivin et al (2011), we first incubated SQ20B cells for 4h with a mixture of
100 µM dimethylfumarate (DMF, solubilized in DMSO), a GSH-depleting agent, and 100 µM
L-buthionine sulfoximine (BSO, solubilized in PBS) an inhibitor of GSH biosynthesis before
measuring their endogenous GSH content.
As shown in Figure 85a, control experiments show that no major difference in the GSH
content occurred between non-treated and AGuIX® treated cells. As shown in Figure 85b,
the endogenous GSH content was measured immediately after a 10Gy irradiation. Exposure
to radiation alone led to a decrease of the GSH content (276 µmol/l vs 312 µmol/l in control
cells), a decrease even more marked for cells treated with AGuIX® before irradiation (203
µmol/l vs 312 µmol/l in control cells) was noted. Although these values indicate that a
significant amount of GSH was consumed after irradiation, with all the more after AGuIX®
treatment, there remains a sufficient quantity to scavenge ROS.

Results & Discussion Chapter II. Study of the Oxidative Stress
189
Figure 85: Glutathione (GSH) concentration (µmol/l) measured in SQ20B J.L. cells with or without DMF/BSO treatment. a. Samples collected right after DMF/BSO treatment, cells were not irradiated. b. 24 hours after a 10Gy irradiation (n=2).
Figure 85b shows that after incubation of SQ20B cells with DMF/BSO before radiation
and/or treatment with AGuIX®, the levels of endogenous GSH were undetectable.
4.2. Comparative study of cytosolic ROS produced with or without the addition of
DMF/BSO
In view of the results reported above, the kinetic study of both cROS and mROS
production was evaluated up to four hours following a 10 Gy irradiation ± AGuIX®, with and
without DMF/BSO. (Note: Since we had to trypsinize and re-seed the cells starting with
samples 24 hours post-irradiation and the cells would therefore be in the absence of
DMF/BSO, we decided to look at the prior kinetic points, up to 4 hours after irradiation, to
see if there was an early boost of cROS post-irradiation with AGuIX® in the presence of
DMF/BSO. The same was done for the mROS experiment).

Results & Discussion Chapter II. Study of the Oxidative Stress
190
When compared to Figure 87a, (without DMF/BSO treatment), the results presented in
Figure 87b show a huge increase of cROS immediately after irradiation which is reinforced by
AGuIX®. This increase dropped at fifteen and thirty minutes until a second increase in cROS
started after one hour and peaked four hours after irradiation. In both cases, treatment with
AGuIX® led to boost of cROS compared to radiation alone. This will be further explained in
the discussion section.
Figure 86: Example of a flow cytometry CM-H2DCFDA analysis. a. 0mM Gd 0Gy; b. 0.8mM Gd 0Gy; c. 0mM Gd 10Gy; d. 0.8mM Gd 10Gy; with DMF/BSO treatment prior to a 10 Gy irradiation.

Results & Discussion Chapter II. Study of the Oxidative Stress
191
Figure 87: Kinetic study (0-4hours) of cytosolic ROS (cROS) measured by the LSRII flow cytometer (BD Biosciences) using the CM-H2DCFDA assay, normalized to the non-treated non-irradiated cells. a. Without DMF/BSO treatment. b. With DMF/BSO treatment 4 hours prior to the 10 Gy irradiation. These results are representative of two independent experiments with triplicates in each. (p-value *: <0.05; **<0.01; ***: <0.005).

Results & Discussion Chapter II. Study of the Oxidative Stress
192
4.3. Comparative study of mitochondrial ROS produced with or without the addition of
DMF/BSO
Compared to Figure 88a in which no differences were observed between 10Gy versus
10Gy + AGuIX®, depletion of cells from its GSH content resulted in a burst in mROS
immediately after irradiation without any significant difference between irradiated cells and
irradiated cells treated with AGuIX®. This increase is not maintained over time. It should also
be noted that this initial burst of mROS is much lower quantitatively than that obtained for
cROS. This can be in part explained by the fact that the initial ROS produced after water
radiolysis within mitochondria should escape the organelle rapidly. As AGuIX® did not enter
mitochondria (see Chapter I), this could explain the absence of difference between mROS
obtained after radiation alone vs radiation + AGuIX®.
Figure 88: Kinetic study (0- 4hours) of mitochondrial ROS (mROS) measured by the LSRII flow cytometer (BD Biosciences) using the Mitosox assay, normalized to the non-treated non-irradiated cells. a. Without DMF/BSO treatment. b. With DMF/BSO treatment 4 hours prior to the 10 Gy irradiation. Representative results of two independent experiments with triplicates in each. (p-value *: <0.05; **<0.01; ***: <0.005).
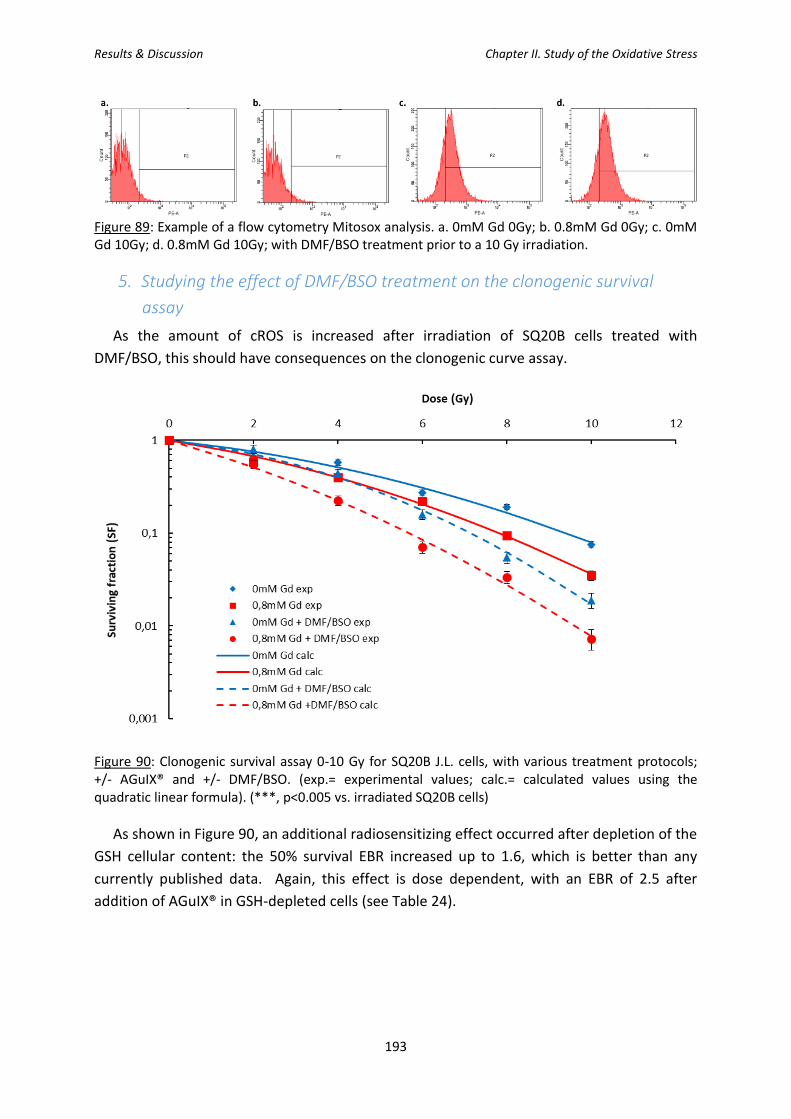
Results & Discussion Chapter II. Study of the Oxidative Stress
193
Figure 89: Example of a flow cytometry Mitosox analysis. a. 0mM Gd 0Gy; b. 0.8mM Gd 0Gy; c. 0mM Gd 10Gy; d. 0.8mM Gd 10Gy; with DMF/BSO treatment prior to a 10 Gy irradiation.
5. Studying the effect of DMF/BSO treatment on the clonogenic survival
assay
As the amount of cROS is increased after irradiation of SQ20B cells treated with
DMF/BSO, this should have consequences on the clonogenic curve assay.
Figure 90: Clonogenic survival assay 0-10 Gy for SQ20B J.L. cells, with various treatment protocols; +/- AGuIX® and +/- DMF/BSO. (exp.= experimental values; calc.= calculated values using the quadratic linear formula). (***, p<0.005 vs. irradiated SQ20B cells)
As shown in Figure 90, an additional radiosensitizing effect occurred after depletion of the
GSH cellular content: the 50% survival EBR increased up to 1.6, which is better than any
currently published data. Again, this effect is dose dependent, with an EBR of 2.5 after
addition of AGuIX® in GSH-depleted cells (see Table 24).

Results & Discussion Chapter II. Study of the Oxidative Stress
194
DMF/BSO WITHOUT WITH [Gd] (mM) 0 0,8 EBR 0 0,8 EBR
0 Gy 1 1 - 1 1 - 2Gy 0.76 0.67 1.134 0.71 0.51 1.392 4Gy 0.51 0.40 1.275 0.40 0.22 1.818 6 Gy 0.31 0.20 1.550 0.18 0.08 2.250 8 Gy 0.17 0.09 1.889 0.06 0.03 2.000
10 Gy 0.08 0.04 2.000 0.02 0.008 2.500
Table 24: Calculated survival fractions at different irradiation doses (0-10 Gy) depending on the different treatments (+/- AGuIX® and +/- DMF/BSO).
DMF/BSO WITHOUT WITH [Gd] (mM) 0 0,8 0 0,8
α 0.11 0.164 0.1134 0.2995 β 0.0143 0.168 0.0293 0.0187
10% 9.3 7.8 7.1 5.7 50% 4.1 3.2 3.3 2.1
EBR-10% 1.192 1.246 EBR-50% 1.281 1.571
Table 25: Summary of parameters evaluating the radiosensitizing effect of the addition of AGuIX® and/or DMF + BSO.
Collectively, our results strongly suggest that the addition of the AGuIX® treatment in
combination with irradiation is not sufficient to overflow the total anti-oxidant defenses of
SQ20B J.L. cells, despite a significant radiosensitizing effect. However, when cells are
depleted from their glutathione content, the combined treatment results in an excess of
oxidative stress when compared to radiation alone, thereby resulting in an improvement of
radiosensitization.
CHAPTER II TAKE-HOME MESSAGE:
In this second chapter of Results & Discussion, we have demonstrated that no statistical
differences in terms of cROS and mROS were produced between irradiated only and
AGuIX® + irradiation samples. However, when depleting SQ20B J.L. cells from its
glutathione content prior to irradiation, a huge increase of cROS and a moderate increase
of mROS can occur right after irradiation, increase that is reinforced with AGuIX®. Under
these experimental conditions, a significant improvement of the EBR (close to 1.6) could
be obtained.
Results & Discussion Chapter III. Study of the different types of cellular deaths
195
Chapter III. Study of the different types of cellular deaths induced by
the combination of AGuIX® + I.R.
he clonogenic survival assay demonstrated an EBR of 1.3 when treating cells for 24
hours with 0.8mM AGuIX® implying that the combined treatment AGuIX®/ionizing
irradiation leads to an increase in cell death or a decrease in cell proliferation.
However, one question remains: which type of cell death or cellular death pathway(s) is (are)
activated with the addition of AGuIX®?
In this next chapter, we will therefore study the five main types of radiation-induced cell
death: apoptosis (via total caspases activation and the Annexin V/P.I. assays), necrosis (via
the Annexin V/P.I. assay), mitotic catastrophe (via the cell cycle distribution), senescence and
autophagy (via Western Blot analysis of p16 and p21 for senescence and LC3B for
autophagy).
T

Results & Discussion Chapter III. Study of the different types of cellular deaths
196
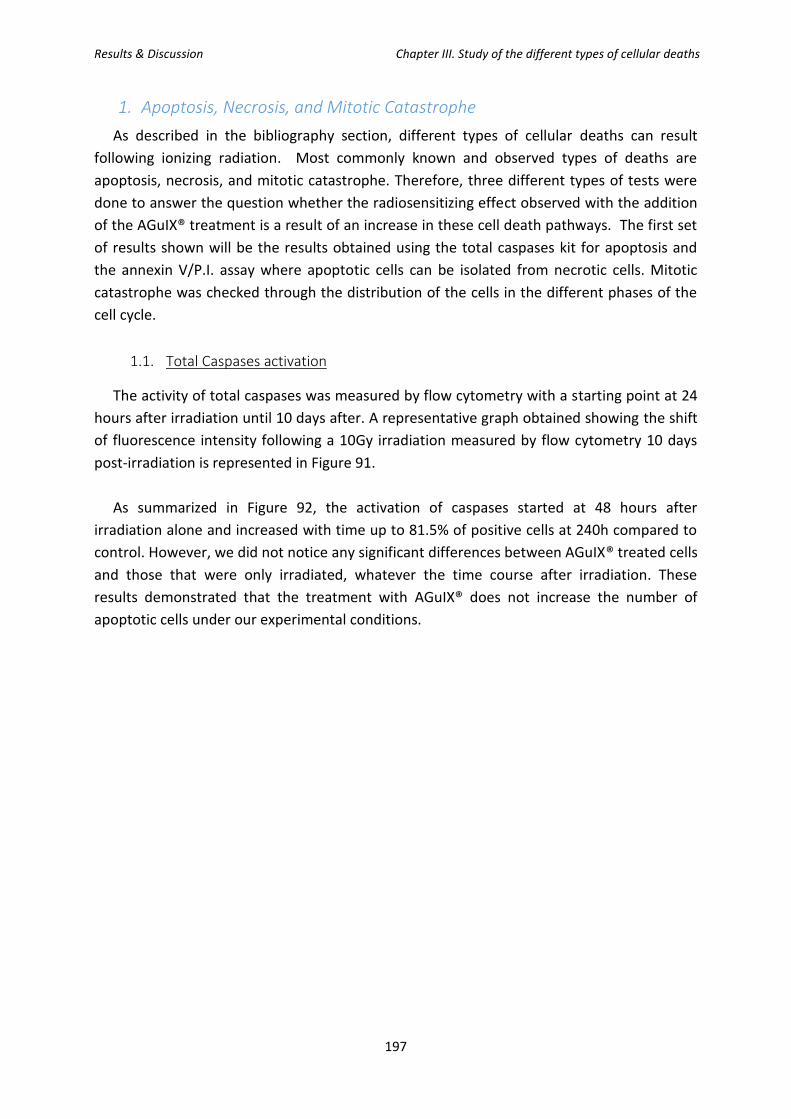
Results & Discussion Chapter III. Study of the different types of cellular deaths
197
1. Apoptosis, Necrosis, and Mitotic Catastrophe
As described in the bibliography section, different types of cellular deaths can result
following ionizing radiation. Most commonly known and observed types of deaths are
apoptosis, necrosis, and mitotic catastrophe. Therefore, three different types of tests were
done to answer the question whether the radiosensitizing effect observed with the addition
of the AGuIX® treatment is a result of an increase in these cell death pathways. The first set
of results shown will be the results obtained using the total caspases kit for apoptosis and
the annexin V/P.I. assay where apoptotic cells can be isolated from necrotic cells. Mitotic
catastrophe was checked through the distribution of the cells in the different phases of the
cell cycle.
1.1. Total Caspases activation
The activity of total caspases was measured by flow cytometry with a starting point at 24
hours after irradiation until 10 days after. A representative graph obtained showing the shift
of fluorescence intensity following a 10Gy irradiation measured by flow cytometry 10 days
post-irradiation is represented in Figure 91.
As summarized in Figure 92, the activation of caspases started at 48 hours after
irradiation alone and increased with time up to 81.5% of positive cells at 240h compared to
control. However, we did not notice any significant differences between AGuIX® treated cells
and those that were only irradiated, whatever the time course after irradiation. These
results demonstrated that the treatment with AGuIX® does not increase the number of
apoptotic cells under our experimental conditions.

Results & Discussion Chapter III. Study of the different types of cellular deaths
198
Figure 91: Representative graphs at 10 days after irradiation of flow cytometry analysis measuring the fluorescence intensity of Alexa Fluor 488. a. 0mM Gd 0Gy; b. 0.8mM Gd 0Gy; c. 0mM Gd 10Gy; d. 0.8mM Gd 10Gy.
Figure 92: Kinetic study of apoptosis from 24 hours to 10 days following a 10 Gy irradiation in SQ20B J.L. cells using the CaspACETM FITC-VAD-FMK kit to observe the activation of total caspases following the different treatment conditions. An increase in the activation of caspases appears starting at 48 hours post-irradiation (between 0.8mM Gd and 0.8mM Gd 10Gy), however, we do not observe any statistical differences between irradiated only and the cells that received prior AGuIX® treatment. Representative results of three independent experiments with triplicates in each. (p-value *: <0.05; **<0.01; ***: <0.005).
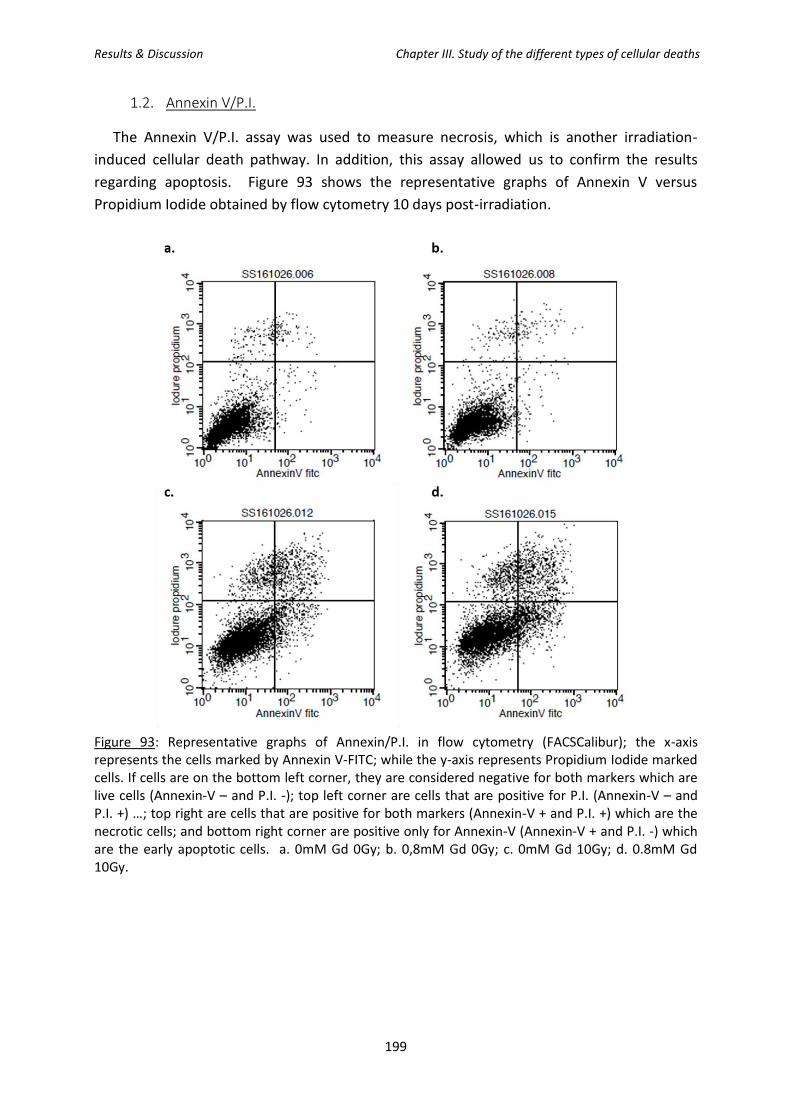
Results & Discussion Chapter III. Study of the different types of cellular deaths
199
1.2. Annexin V/P.I.
The Annexin V/P.I. assay was used to measure necrosis, which is another irradiation-
induced cellular death pathway. In addition, this assay allowed us to confirm the results
regarding apoptosis. Figure 93 shows the representative graphs of Annexin V versus
Propidium Iodide obtained by flow cytometry 10 days post-irradiation.
Figure 93: Representative graphs of Annexin/P.I. in flow cytometry (FACSCalibur); the x-axis represents the cells marked by Annexin V-FITC; while the y-axis represents Propidium Iodide marked cells. If cells are on the bottom left corner, they are considered negative for both markers which are live cells (Annexin-V – and P.I. -); top left corner are cells that are positive for P.I. (Annexin-V – and P.I. +) …; top right are cells that are positive for both markers (Annexin-V + and P.I. +) which are the necrotic cells; and bottom right corner are positive only for Annexin-V (Annexin-V + and P.I. -) which are the early apoptotic cells. a. 0mM Gd 0Gy; b. 0,8mM Gd 0Gy; c. 0mM Gd 10Gy; d. 0.8mM Gd 10Gy.

Results & Discussion Chapter III. Study of the different types of cellular deaths
200
Figure 94: Kinetic study of apoptosis versus necrosis in SQ20B J.L. cells using the Annexin/P.I. kit the cellular death pathways after the different treatment conditions. a. Early apoptosis. b. Late apoptosis/necrosis (n=1).
As shown in Figure 94, the addition of AGuIX® to irradiation did not induce any significant
increase of both apoptotic and necrotic cells and this, regardless of the time after irradiation.
Concerning apoptosis, this result confirmed those obtained with the total caspase assay
reported above.
1.3. Study of the cell cycle
By studying the cell cycle, we are able to observe whether cells are undergoing apoptosis
(sub-G1) or mitotic catastrophe (polyploid cells) as well as the number of cells in the G2/M
phase (phase where DNA damage is repaired). Indeed, radioresistant cells have often been

Results & Discussion Chapter III. Study of the different types of cellular deaths
201
shown to have an increased number of cells in the G2/M phase. Figure 95 shows the raw
results obtained from the Diva Software analysis.
Figure 95: Representative graphs of the cell cycle analysis 240 hours post-irradiation, using the Diva Software analysis after flow cytometry. a. 0mM Gd 0Gy; b. 0.8mM Gd 0Gy; c. 0mM Gd 10Gy; d. 0.8mM Gd 10Gy. Phases of the cell cycle: sub-G1 (P3); G1 (P4); S (P5); G2/M (P6); Polyploid (P7).
As it can be observed in Figure 96, we did not observe any significant differences between
AGuIX®-treated/irradiated cells compared to irradiated cells, whatever the phase of the cell
cycle. Concerning the sub-G1 phase (apoptosis), the results confirm those obtained with the
caspases assay as well as the P.I./Annexin reported above. Concerning the G2/M phase,
besides a transient increase obtained at 24h after irradiation alone, no significant differences
between the different treatment conditions were obtained. Finally, the percentage of
polyploid cells remained low (around 10% for AGuIX® treated and irradiated cells), even 10
days after irradiation.
Collectively, our results allow us to conclude that the treatment with AGuIX® before
irradiation does not induce any additional increase in apoptosis compared to irradiation only
(confirmed with 3 different assays), nor mitotic catastrophe, nor necrosis.

Results & Discussion Chapter III. Study of the different types of cellular deaths
202
Figure 96: Kinetic study of the different stages of the cell cycle after a 10 Gy irradiation (n= 3)

Results & Discussion Chapter III. Study of the different types of cellular deaths
203
Therefore, two other cellular deaths pathways potentially induced by ionizing radiation,
namely senescence and autophagy, were investigated by Western Blot analysis, using p16, p21,
and LC3B specific antibodies. For p16, results were normalized using GAPDH, which is an
ubiquitous protein often used for normalization purposes whereas total proteins were used for
the normalization of p21 and LC3B.
2. Kinetic study of senescence
The analysis of the expression of two proteins, namely p16 and p21, are conventionally used
to monitor cells undergoing senescence (Stein et al, 1999).
2.1. p16
p16, also known as cyclin-dependent kinase inhibitor 2A, is a tumor suppressor protein as it
slows down the cell cycle by prohibiting the progression of the cell from the G1 phase to the S
phase. As previously mentioned, homozygous deletion of p16 are frequently found in HNSCC.
p16 is extensively used as a biomarker which is associated with a more favorable prognosis as
measured by cancer-specific survival, recurrence-free survival, locoregional control…
Figure 97: p16 protein expression analysis by Western Blot. a. W/B membrane for p16 normalized by GAPDH. b. Calculated ratio p16/GAPDH (arbitrary units).

Results & Discussion Chapter III. Study of the different types of cellular deaths
204
As shown in Figure 97, p16 expression is very low or even absent in SQ20B J.L. cells,
independent of the time after irradiation. The pre-treatment with AGuIX® did not increase the
expression of p16, whatever the time course studied.
2.2. p21
p21Cip1 (also known as p21Waf1), known as cyclin dependent kinase inhibitor 1, represents a
major target of p53 activity, thus linking DNA damage to cell cycle arrest.
Figure 98: p21 protein expression analysis by Western Blot. a. W/B membrane for p21. b. Membrane of total proteins used for normalization purposes. c. Calculated ratio p21/total proteins (arbitrary units).
As can be seen in Figure 98, there is a small increase of p21 expression in SQ20B J.L. which
started 72h after irradiation and peaked after 120h before decreasing. Nevertheless, no
differences were observed after treatment with AGuIX® compared to irradiated cells alone. We

Results & Discussion Chapter III. Study of the different types of cellular deaths
205
can conclude that the enhanced biological effect obtained by the addition of AGuIX® does not
involve senescence.
3. Kinetic study of autophagy
Autophagy was studied by Western Blot using the LC3-B antibody. The microtubule-
associated protein 1A/1B-light chain 3 (LC3) is a soluble protein with a molecular mass of
approximately 17 kDa that is distributed ubiquitously in mammalian tissues and cultured cells
(Tanida et al, 2008). LC3 is the most widely used marker of autophagosomes, with the
identification of the two isoforms: LC3B-I and LC3B-II.
Figure 99: LC3B protein expression analysis via Western Blot. a. W/B membrane for LC3B (I+II). b. Membrane of total proteins used for normalization purposes. c. Calculated ratio LC3B/total proteins (arbitrary units). This figure is representative of two independent experiments.

Results & Discussion Chapter III. Study of the different types of cellular deaths
206
As shown in Figure 99, although no differences in LC3B protein expression occurred up to 72
hours after irradiation, a significant increase was obtained starting at 120h after irradiation with
a significant difference after addition of AGuIX® compared to irradiation alone (+62.5 %). 192h
after irradiation, the increase of LC3B expression reached + 114% compared to radiation alone
and + 350% compared to AGuIX® alone. In addition, we can also note, that there is no
difference in LC3B expression between non-treated and treated cells in the absence of
irradiation, which indicates that AGuIX® alone did not induce autophagy.
From these results, we can conclude that AGuIX® combined to radiation induce autophagy in
SQ20B J.L. cells, a result which could explain the increase of EBR obtained in Chapter 1 of the
Results section.
The objective of this chapter was to determine by which mechanism AGuIX® sensitize SQ20B
cells to radiation therapy. Although radiation alone has been previously reported to trigger late
apoptosis and mitotic catastrophe (Alphonse et al, 2013) our results demonstrate that neither
apoptosis, necrosis, mitotic catastrophe nor senescence are involved in the radio-enhancing
effect of AGuIX®. Autophagy was the only cell death pathway that has been specifically found
to be triggered after AGuIX® treatment combined with radiation.
Although the radiosensitizing effect of AGuIX® was previously reported to occur in different
cellular models (Kotb et al., 2016; Štefančíková et al., 2014; Štefančíková et al., 2016; Porcel et
al., 2014; Detappe et al., 2015…), none of these have presented evidence for the involvement
of one particular type of cellular death pathway in the radiosensitizing effect obtained. Only
one study using DTPA-based gadolinium nanoparticles showed that the combined treatment
led to mitotic catastrophe followed by late apoptosis. These results were confirmed either with
TEM microscopy and caspase-2 activation. Besides radiosensitization, the use of gadolinium
oxide (Gd2O3) NPs has been very recently reported to regulate apoptosis through upregulation
of Bax/Bcl-2 gene expression (Alarifi et al, 2017) while the induction of apoptosis in MCF-7 cells
was demonstrated to occur after ER stress (Wang et al, 2014) induced by gadolinium
endohedral metallofullerenol ([Gd@C82(OH)22]n) NPs.
Apart from gadolinium NPs, many reports have been published concerning the effect of
other type of NPs in the triggering of apoptosis whether in association with radiotherapy or not.
In association with radiotherapy, one can cite the effect of gold nanorods on melanoma cells
(Xu et al, 2012), the effect of thio-glucose-bound gold nanoparticles (Glu-GNPs) on lung cancer
cells (Wang et al, 2013) or the effect of silver NPs on glioma cells (Liu et al, 2013; Liu et al,
2016).

Results & Discussion Chapter III. Study of the different types of cellular deaths
207
Concerning autophagy, it was demonstrated that some NPs are able to trigger autophagy
independently of radiation exposure: this is the case for oleic acid-coated iron oxide NPs,
TiO2 NPs (Kenzaoui et al, 2012), silica NPs (Wei et al, 2017) or glycan-coated silver NPs
(Panzarini et al, 2015). Combined with radiation, recent reports presented also evidence for a
radiosensitizing effect involving autophagy: with AgNPS in glioma cells at clinically relevant
megavoltage energies (Liu et al, 2016), copper cysteamine NPs in colorectal carcinoma (Liu et
al, 2017) or selenium NPs in breast cancer cells (Cheng et al, 2017). At the opposite, no
triggering of autophagy was obtained in glioblastoma following treatment with titanate
nanotubes combined or not with radiation (Mirjolet et al, 2013). All these results presented
clearly suggest that the cell death pathways involved either in radiosensitization or in anti-
cancer toxicity is dependent on the type of nanoparticle, its physic-chemical characteristics as
well as the cellular model studied.
CHAPTER III TAKE-HOME MESSAGE:
In this third chapter of Results & Discussion, we overviewed the various types of cellular
deaths pathways induced by ionizing radiation. We have concluded that the enhanced
biological response observed with the clonogenic survival assay with AGuIX® treatment was
due to autophagy since no significant differences were noted after treatment with AGuIX®
combined with irradiation compared to radiation in terms of apoptosis, necrosis, mitotic
catastrophe, nor senescence.

Results & Discussion Chapter III. Study of the different types of cellular deaths
208

Results & Discussion Chapter IV. Study of the DNA-damage
209
Chapter IV. Study of the DNA-damage induced by AGuIX® combined with
radiation
s reviewed in the second chapter of the bibliography section, the main cellular target of
ionizing radiation is DNA. The track of a charged particle (an electron or an ion) may
pass through and ionize DNA directly (direct action) or ionize water molecules in the
vicinity, thereby producing highly reactive ROS, which can diffuse to DNA and react with the
target molecule (indirect action). Chemical reactions in DNA induced either by direct or indirect
action may result in DNA damage such as base oxidation, single strand breaks (SSBs) or double
strand breaks (DSBs). Although base damage and SSB are of minor relevance for cell survival,
since these lesions are essentially all repaired, a fraction of DSBs (which increases with
radioresistance) cannot be repaired because of their higher complexity and constitute the most
severe DNA damage after irradiation leading to cell death, senescence, mutations or genomic
instability.
Even though AGuIX® nanoparticles did not enter the nucleus, as seen previously seen in Chapter
1, it was however possible that AGuIX® combined to radiation might have an effect on the
cellular DNA repair capacities.
In this next chapter, we have therefore studied three types of DNA-damage potentially induced
by AGuIX® combined with radiation. Single-strand breaks (SSBs) and oxidative DNA damage
have been assessed by the comet assay and double-strand breaks (DSBs) by the γH2Ax foci
assay. Additionally, an experiment focusing on the quantification of base oxidation (namely
guanine) has been assessed via HPLC coupled to MS/MS.
A

Results & Discussion Chapter IV. Study of the DNA-damage
210

Results & Discussion Chapter IV. Study of the DNA-damage
211
1. Detection of DNA single-strand-breaks (SSBs) and DNA oxidative damage
Single-strand breaks were studied via the comet assay at four different time points (t= 0, t=
30, t=120 min and t= 24h) and after a 4Gy irradiation (black bars). As shown in Figure 100,
(panel a), right after irradiation (0’), the initial peak (maximum) of SSBs induced by radiation
alone or the combined treatment is very low as these breaks are usually repaired rapidly. No
further increase of SSBs was obtained, whatever the time (panels b, c and d) after radiation or
combined treatment.
Figure 100: Kinetic study of single-strand breaks (-FPG) and oxidative damage (+FPG) following a 4 Gy irradiation +/- AGuIX® expressed in terms of the mean % tail intensity. a. 0 min post-irradiation ; b. 30min post-irradiation ; c. 2 hours post-irradiation ; d. 24h post-irradiation. This figure represents biological triplicates of an independent experiment, but is representative of three independent experiments (n=3).
After treatment with formamidopyrimidine DNA glycosylase (FPG enzyme, red bars), which
led us to quantify the oxidation of the guanine base, an increase of base oxidation was
observed immediately after irradiation (panel a) which remained sustained until 120 min (panel
c) and then decreased under the control values after 24h. AGuIX® treatment combined to
radiation led to a slight increase of 8-oxo-guanine (+ 13%) at t=0, compared to radiation alone,

Results & Discussion Chapter IV. Study of the DNA-damage
212
whereas no differences are observed at t= 30 minutes, two hours, and twenty-four hours post-
irradiation.
2. Quantitative measurement of 8-oxo-guanine by HPLC-MS/MS
In view of the results that were obtained by the comet assay (+FPG), it seemed that the
oxidative damage occurred after the combined treatment, this immediately after irradiation.
As the comet assay is only a semi-quantitative method, we have sought to further quantify 8-
oxo-guanine damages by HPLC coupled to MS/MS.
Samples were therefore prepared using two irradiation doses, 4 and 10 Gy, at the same time
points. As can be observed in Table 26, no differences were noted between the different
treatments as for each sample we remain in the background noise of the apparatus and we are
therefore unable to conclude about 8-oxo-guanine damages.
However, this experiment was only done once. Most likely, the irradiation doses are too low
and increasing the irradiation dose would have allowed the observation of some differences.
Treatment conditions
Time after irradiation (H) 0 0.5 2 24
0mM Gd 0Gy 0.38 0.35 0.38 0.28 0.8mM Gd 0Gy 1.00 0.93 0.49 0.17 0mM Gd 4Gy 0.74 0.38 0.33 0.35 0.8mM Gd 4Gy 0.78 0.32 0.55 0.38 0mM Gd 10Gy 0.17 0.35 0.20 0.48 0.8mM Gd 10Gy 0.69 0.54 0.27 0.88
Table 26: Quantitative measurement by HPLC-MS/MS of 8-oxo-guanine DNA damage expressed in terms of 8-oxodGuo/106 normal bases for different time points post-irradiation dependent on the treatment conditions. a. Irradiation dose: 4 Gy. b. Irradiation dose: 10 Gy. (Biological triplicates).
3. Detection of DNA double-stranded breaks (DSBs)
The γH2AX assay exploits the phosphorylation of the histone variant H2AX (resulting in
γH2AX) in response to the induction of DNA DSBs. This event can be visualized microscopically
within a cell using a specific fluorescent antibody and present an important advantage of
measuring the number of foci in situ, thus allowing quantitation of the radiation response in
individual cells and building the distribution of cells with respect to this response.
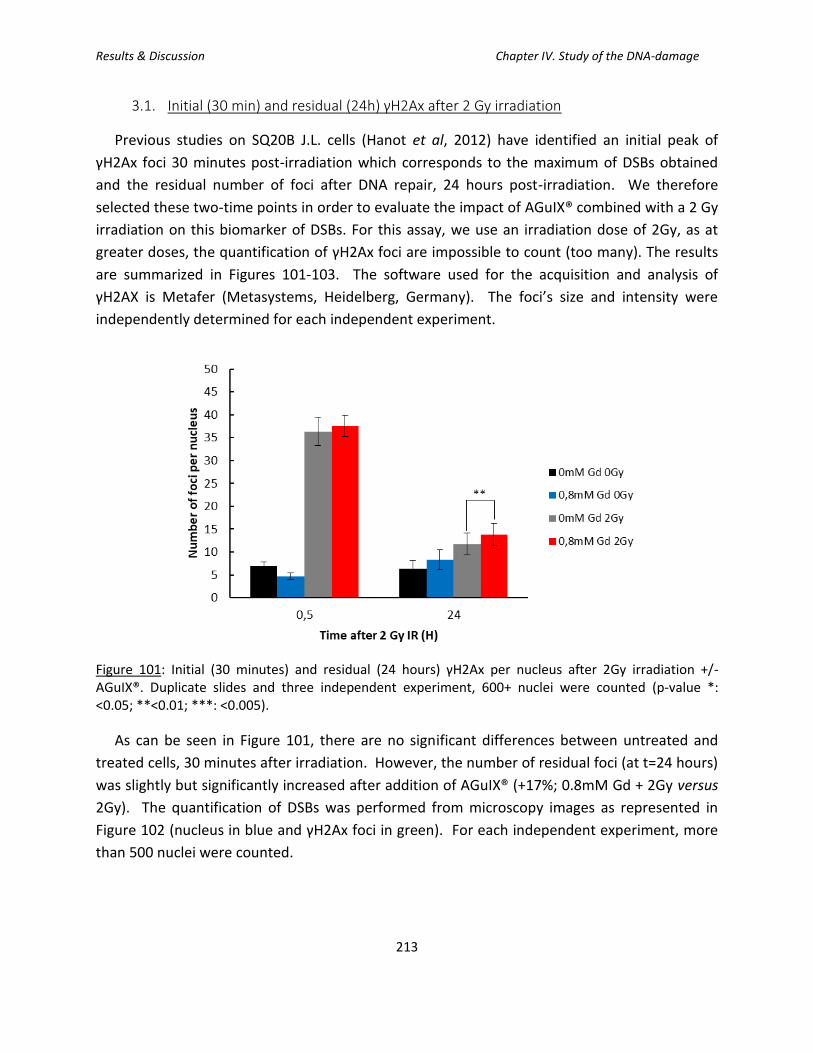
Results & Discussion Chapter IV. Study of the DNA-damage
213
3.1. Initial (30 min) and residual (24h) γH2Ax after 2 Gy irradiation
Previous studies on SQ20B J.L. cells (Hanot et al, 2012) have identified an initial peak of
γH2Ax foci 30 minutes post-irradiation which corresponds to the maximum of DSBs obtained
and the residual number of foci after DNA repair, 24 hours post-irradiation. We therefore
selected these two-time points in order to evaluate the impact of AGuIX® combined with a 2 Gy
irradiation on this biomarker of DSBs. For this assay, we use an irradiation dose of 2Gy, as at
greater doses, the quantification of γH2Ax foci are impossible to count (too many). The results
are summarized in Figures 101-103. The software used for the acquisition and analysis of
γH2AX is Metafer (Metasystems, Heidelberg, Germany). The foci’s size and intensity were
independently determined for each independent experiment.
Figure 101: Initial (30 minutes) and residual (24 hours) γH2Ax per nucleus after 2Gy irradiation +/- AGuIX®. Duplicate slides and three independent experiment, 600+ nuclei were counted (p-value *: <0.05; **<0.01; ***: <0.005).
As can be seen in Figure 101, there are no significant differences between untreated and
treated cells, 30 minutes after irradiation. However, the number of residual foci (at t=24 hours)
was slightly but significantly increased after addition of AGuIX® (+17%; 0.8mM Gd + 2Gy versus
2Gy). The quantification of DSBs was performed from microscopy images as represented in
Figure 102 (nucleus in blue and γH2Ax foci in green). For each independent experiment, more
than 500 nuclei were counted.

Results & Discussion Chapter IV. Study of the DNA-damage
214
Besides the global analysis of the number of γH2Ax foci, one can also follow cell to cell
variability of radiation-induced foci by looking at the distribution of the nuclei plotted as a
function of the number of foci per nucleus (Figure 103).
Thirty minutes after irradiation (Figure 103a), no significant differences were obtained in the
distribution of γH2Ax foci after treatment with AGuIX® compared to radiation alone.
In Figure 103b, which represents the distribution of γH2Ax foci, 6h after irradiation, no
significant differences were obtained in the distribution of nuclei displaying γH2Ax foci after
treatment with AGuIX® compared to radiation alone. However, for the residual γH2Ax foci (24
hours after irradiation), we can observe that the number of cells displaying less than 5 foci per
nucleus and between 25-36 foci is greater for untreated, irradiated cells compared to AGuIX®-
treated cells (Figure 103c). The main result of this analysis was obtained with cells displaying
more than 50 foci per nucleus that were significantly increased after treatment with AGuIX®
prior to radiation compared to radiation alone.
Figure 102: Representative nuclei depending on the treatment conditions and the time post-irradiation. Blue: nucleus (DAPI); green: γH2Ax (Alexa-Fluor 488).

Results & Discussion Chapter IV. Study of the DNA-damage
215
Figure 103: Distribution classes of the number of foci/nucleus as a function of the number of nucleus included in the class: irradiated only cells (2Gy) versus AGuIX® + irradiated cells (0.8mM Gd 2Gy). a. 30 minutes post-irradiation (initial number of γH2Ax). b. 6 hours post-irradiation c. 24 hours post-irradiation (residual γH2Ax). 300+ nuclei were counted for each condition.
Collectively, these results indicate that the global analysis of the residual γH2Ax foci reported
in Figure 101 did not reflect some interesting results such as the presence of nuclei displaying a
very high number of residual foci which have been thus highlighted and which probably
represent very complex and clustered DSBs induced specifically after treatment with AGuIX®.
Moreover, one must keep in mind that SQ20B cells do not necessarily internalize the same
number of AGuIX® which can result in a variability of residual DSBs after irradiation.
3.2. Kinetic study of the formation and repair of DSBs
To study whether the combination treatment of AGuIX® + irradiation had an influence on the
dynamics of DNA repair in SQ20B cells, we decided to perform a kinetic study with intermediate
time points including one, two, four, and six hours post-irradiation.
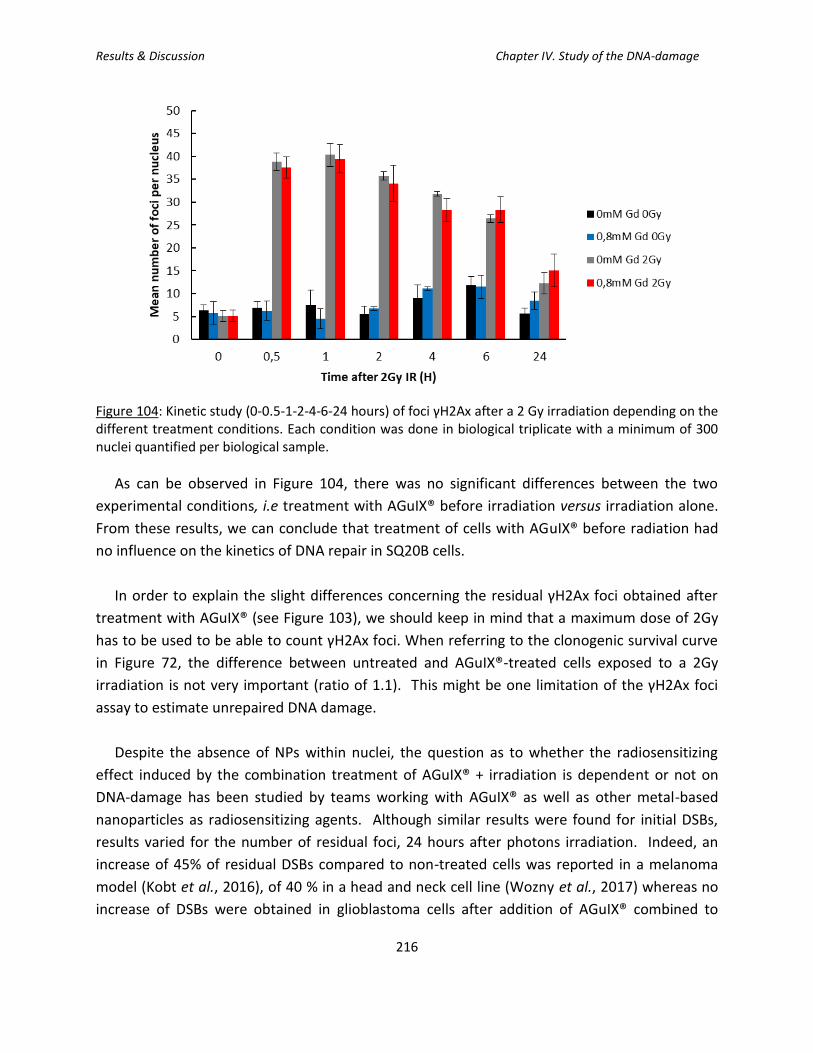
Results & Discussion Chapter IV. Study of the DNA-damage
216
Figure 104: Kinetic study (0-0.5-1-2-4-6-24 hours) of foci γH2Ax after a 2 Gy irradiation depending on the different treatment conditions. Each condition was done in biological triplicate with a minimum of 300 nuclei quantified per biological sample.
As can be observed in Figure 104, there was no significant differences between the two
experimental conditions, i.e treatment with AGuIX® before irradiation versus irradiation alone.
From these results, we can conclude that treatment of cells with AGuIX® before radiation had
no influence on the kinetics of DNA repair in SQ20B cells.
In order to explain the slight differences concerning the residual γH2Ax foci obtained after
treatment with AGuIX® (see Figure 103), we should keep in mind that a maximum dose of 2Gy
has to be used to be able to count γH2Ax foci. When referring to the clonogenic survival curve
in Figure 72, the difference between untreated and AGuIX®-treated cells exposed to a 2Gy
irradiation is not very important (ratio of 1.1). This might be one limitation of the γH2Ax foci
assay to estimate unrepaired DNA damage.
Despite the absence of NPs within nuclei, the question as to whether the radiosensitizing
effect induced by the combination treatment of AGuIX® + irradiation is dependent or not on
DNA-damage has been studied by teams working with AGuIX® as well as other metal-based
nanoparticles as radiosensitizing agents. Although similar results were found for initial DSBs,
results varied for the number of residual foci, 24 hours after photons irradiation. Indeed, an
increase of 45% of residual DSBs compared to non-treated cells was reported in a melanoma
model (Kobt et al., 2016), of 40 % in a head and neck cell line (Wozny et al., 2017) whereas no
increase of DSBs were obtained in glioblastoma cells after addition of AGuIX® combined to

Results & Discussion Chapter IV. Study of the DNA-damage
217
radiation (Štefančíková et al., 2016). These results strongly underline the large variations in the
results obtained, depending on the conditions of treatment as well as the cellular type studied.
For other metal-based NPs, such as gold nanoparticles, similar contradictory results have
been reported. As an example, the use of 1.9 nm gold nanoparticles did not enhance radiation-
induced DSBs formation nor inhibit DNA repair in MDA-MB-231 breast cancer cells irradiated
with MV electrons (Jain et al., 2011). At the opposite, the combination of 50 nm citrate-coated
gold NPs with 6 MV photons resulted in an increase of DSBs in HeLa cells (Chitrani et al., 2010;
Berbeco et al., 2012). For gold NPs, It would seem that bigger diameter NPs tend to induce DNA
damages, whereas smaller ones do not.
CHAPTER IV TAKE-HOME MESSAGE:
In this chapter focusing on the DNA-damage induced by the combination of AGuIX® with
irradiation, it appears that despite the absence of AGuIX® within nuclei, the radiosensitization
obtained by AGuIX® nanoparticles also involves DNA-damage. Although only slight
differences in the average number of residual DSBs were obtained after treatment with
AGuIX® prior to irradiation, some significant differences were noticed in some cells that
displayed a high number of foci per nucleus (>50) as a reflection of unrepairable complex
damages.

Results & Discussion Chapter IV. Study of the DNA-damage
218
Results & Discussion Chapter V. Shotgun/Bottom-up Proteomics study
219
Chapter V. Shotgun/Bottom-up Proteomics study: preliminary
experiments
lthough the cellular experiments that were undertaken in this work (measurement of
ROS production, study of the different types of I.R-induced cell deaths, DNA-damage …)
are commonly used for the studies on the radiosensitizing effects of nanoparticles, the
complexity of the molecular mechanisms implemented requires more efficient and informative
experimental approaches. Among these, proteomics was chosen because the proteome reflects
more accurately on the dynamic state of a cell, and can help identify a molecular signature on
the cell’s behavior based on protein pathways as well as signaling cascades.
The goal of this preliminary analysis was therefore to observe the change of the proteomic
profile of SQ20B J.L. cells after AGuIX® + photon irradiation using the shotgun proteomics
technique. This type of analysis was initiated to provide more in-depth analysis of potential
protein targets and signaling pathways that would be modulated following this combined
treatment.
It is important to keep in mind, that this project could be in itself a thesis topic, but here, it was
undertaken during the last months of our work to open into a new perspective that should lead
to future work. In addition, this study should create new opportunities and challenges for those
seeking to gain greater understanding of the mode of action of NPs at the subcellular level.
A

Results & Discussion Chapter V. Shotgun/Bottom-up Proteomics study
220
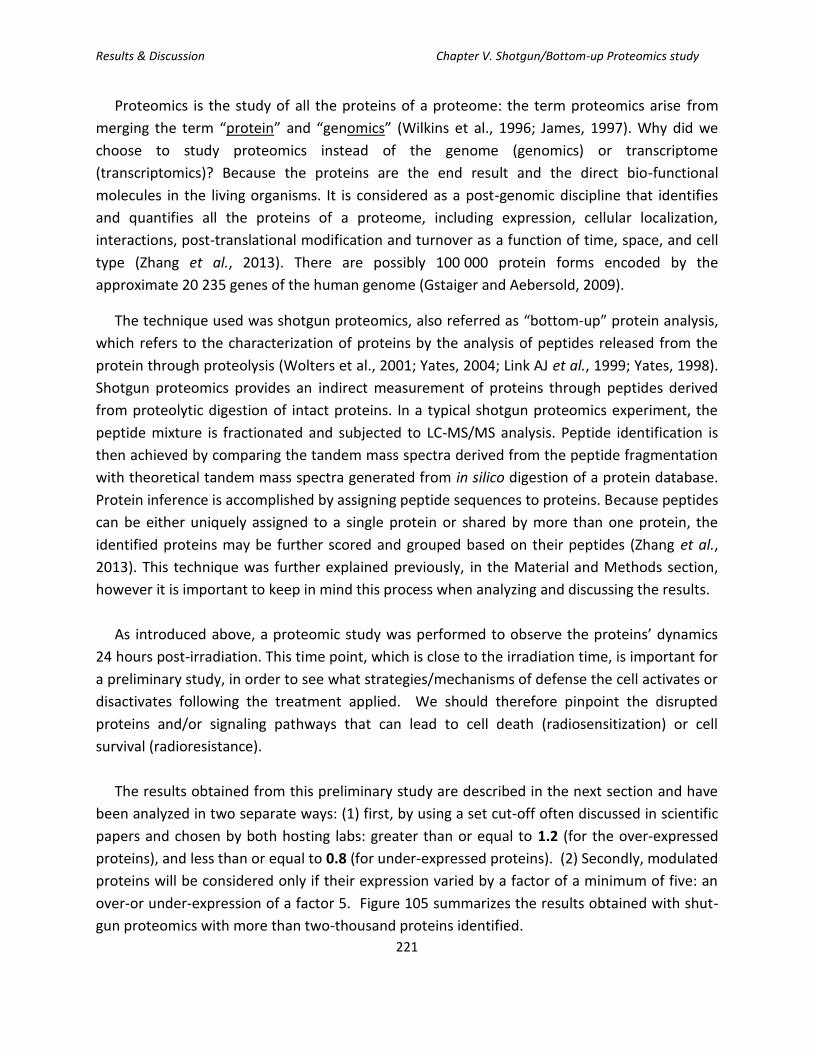
Results & Discussion Chapter V. Shotgun/Bottom-up Proteomics study
221
Proteomics is the study of all the proteins of a proteome: the term proteomics arise from
merging the term “protein” and “genomics” (Wilkins et al., 1996; James, 1997). Why did we
choose to study proteomics instead of the genome (genomics) or transcriptome
(transcriptomics)? Because the proteins are the end result and the direct bio-functional
molecules in the living organisms. It is considered as a post-genomic discipline that identifies
and quantifies all the proteins of a proteome, including expression, cellular localization,
interactions, post-translational modification and turnover as a function of time, space, and cell
type (Zhang et al., 2013). There are possibly 100 000 protein forms encoded by the
approximate 20 235 genes of the human genome (Gstaiger and Aebersold, 2009).
The technique used was shotgun proteomics, also referred as “bottom-up” protein analysis,
which refers to the characterization of proteins by the analysis of peptides released from the
protein through proteolysis (Wolters et al., 2001; Yates, 2004; Link AJ et al., 1999; Yates, 1998).
Shotgun proteomics provides an indirect measurement of proteins through peptides derived
from proteolytic digestion of intact proteins. In a typical shotgun proteomics experiment, the
peptide mixture is fractionated and subjected to LC-MS/MS analysis. Peptide identification is
then achieved by comparing the tandem mass spectra derived from the peptide fragmentation
with theoretical tandem mass spectra generated from in silico digestion of a protein database.
Protein inference is accomplished by assigning peptide sequences to proteins. Because peptides
can be either uniquely assigned to a single protein or shared by more than one protein, the
identified proteins may be further scored and grouped based on their peptides (Zhang et al.,
2013). This technique was further explained previously, in the Material and Methods section,
however it is important to keep in mind this process when analyzing and discussing the results.
As introduced above, a proteomic study was performed to observe the proteins’ dynamics
24 hours post-irradiation. This time point, which is close to the irradiation time, is important for
a preliminary study, in order to see what strategies/mechanisms of defense the cell activates or
disactivates following the treatment applied. We should therefore pinpoint the disrupted
proteins and/or signaling pathways that can lead to cell death (radiosensitization) or cell
survival (radioresistance).
The results obtained from this preliminary study are described in the next section and have
been analyzed in two separate ways: (1) first, by using a set cut-off often discussed in scientific
papers and chosen by both hosting labs: greater than or equal to 1.2 (for the over-expressed
proteins), and less than or equal to 0.8 (for under-expressed proteins). (2) Secondly, modulated
proteins will be considered only if their expression varied by a factor of a minimum of five: an
over-or under-expression of a factor 5. Figure 105 summarizes the results obtained with shut-
gun proteomics with more than two-thousand proteins identified.

Results & Discussion Chapter V. Shotgun/Bottom-up Proteomics study
222
Figure 105: Summary of the raw data obtained following shot-gun proteomics for SQ20B J.L. cells and how the analysis can be done.
We will first mention the different signaling pathways that were put in evidence when using
two different bioinformatics tools (Database for Annotation, Vizualization, and Integrated
Discovery (DAVID) software and Ingenuity Pathway Analysis (IPA)) with the proteins that were
modulated by a minimum of 20%, which represented, as can be seen in Figure 105, more than
30% of the total number of identified proteins.
1. Analysis of proteins with a fold-change ≥ 1.2 (over-expression) or ≤0.8
(under-expression) using the DAVID software
1.1. DAVID Software Analysis
When applying the cut-off ≤0.8 or ≥1.2, more than 800 proteins were identified as
modulated. In order to analyze such a list of proteins, the software DAVIDS Bioinformatics
Genomics was used, as described in the Materials and Methods section. By using this software,
the following pathways were identified (see list below, with the number of genes identified in
the corresponding pathway):
✓ Metabolic pathways (15 genes)
✓ Valine, leucine, and isoleucine degradation (5 genes)

Results & Discussion Chapter V. Shotgun/Bottom-up Proteomics study
223
✓ Carbon metabolism (6 genes)
✓ Butanoate metabolism (3 genes)
✓ Propanoate metabolism (3 genes)
✓ Beta-Alanine metabolism (3 genes)
✓ Fatty acid degradation (3 genes)
✓ Oxidative phosphorylation (4 genes)
✓ Fatty acid metabolism (3 genes)
✓ Glycolysis/Gluconeogenesis (3 genes)
✓ Fatty acid elongation (2 genes)
The metabolic pathway seems to be implicated in the cells’ reaction to the combined
treatment, as 15 genes are modulated within the pathway. It is also interesting to note that
some of the identified pathways have a direct implication with the energy metabolism of a
eukaryotic cell, such as oxidative phosphorylation, glycolysis/gluconeogenesis. Since a cell
needs energy in order to survive, and the main organelle where ATP production is produced in
the mitochondria, these results seem to correlate with previous results obtained during the
course of the PhD.
These pathways are summarized in Figure 106 with the most affected metabolic pathway
(with the most modulated proteins) being the glycan biosynthesis and metabolism as well as
the lipid metabolism, as can be observed in Figure 106. The names of the corresponding
modulated genes are listed in Table 27. Genes implicated in the other identified pathways by
the DAVIDS software are listed in Table 28-31.

Results & Discussion Chapter V. Shotgun/Bottom-up Proteomics study
224
Figure 106: Modulated proteins in the metabolic pathways, with 15 genes being affected. Analysis performed with the DAVID Software. (*Note: the red stars represent the modulated proteins).

Results & Discussion Chapter V. Shotgun/Bottom-up Proteomics study
225
Modulated genes
OVER- or UNDER-expressed in 0.8mM Gd 10Gy
3-hydroxyisobutyrate dehydrogenase (HIBADH) UNDER
3-hydroxymethyl-3-methylglutaryl-CoA lyase (HMGCL) UNDER
ATP synthase, H+ transporting, mitochondrial Fo complex subunit G(ATP5L)
OVER
NADH: ubiquinone oxidoreductase core subunit S3 (NDUFS3) OVER
NADH: ubiquinone oxidoreductase subunit A12 (NDUFA12) OVER
Acyl-CoA dehydrogenase, C-4 to C-12 straight chain (ACADM) OVER
Aldehyde dehydrogenase 1 family member A1 (ALDH1A1) OVER
Aldehyde dehydrogenase 3 family member A1 (ALDH3A1) OVER
Aldehyde dehydrogenase 4 family member A1 (ALDH4A1) OVER
Dihydrolipoamide S-acetyltransferase (DLAT) OVER
Enoyl-CoA hydratase, short chain 1 (ECHS1) OVER
Hydroxyacyl-CoA dehydrogenase (HADH) UNDER
Pyruvate dehydrogenase (lipoamide) alpha 1 (PDHA1) UNDER
Serine hydroxymethyltransferase 2 (SHMT2) OVER
Succinate-CoA ligase ADP-forming beta subunit (SUCLA2) UNDER
Table 27: Modulated genes within the metabolic pathways.
Table 28 summarizes the genes modulated in the carbon metabolism, while Table 29 lists
modulated genes from the citrate cycle.
Modulated genes OVER- or UNDER-expressed in
0.8mM Gd 10Gy
Acyl-CoA dehydrogenase, C-4 to C-12 straight chain (ACADM) OVER
Dihydrolipoamide S-acetyltransferase (DLAT) OVER
Enoyl-CoA hydratase, short chain 1 (ECHS1) OVER
Pyruvate dehydrogenase (lipoamide) alpha 1 (PDHA1) OVER
Serine hydroxymethyltransferase 2 (SHMT2) OVER
Succinate-CoA ligase ADP forming beta subunit (SUCLA2) UNDER
Table 28: Modulated genes in the carbon metabolism.

Results & Discussion Chapter V. Shotgun/Bottom-up Proteomics study
226
Modulated genes OVER- or UNDER-expressed in
0.8mM Gd 10Gy
Dihydrolipoamide S-acetyltransferase (DLAT) OVER
Pyruvate dehydrogenase (lipoamide) alpha 1 (PDHA1) OVER
Succinate-CoA ligase ADP-forming beta subunit (SUCLA2) UNDER
Table 29: Modulated genes in the citrate cycle (TCA Cycle).
Figure 107 schematizes the mitochondrial transport chain and the modulated proteins with
Table 30 enumerating them.
Figure 107: Illustration of the mitochondrial Electron Transport Chain (ETC) where oxidative phosphorylation occurs. (*Note: the red stars represent the modulated proteins).

Results & Discussion Chapter V. Shotgun/Bottom-up Proteomics study
227
Modulated genes OVER- or UNDER-expressed in
0.8mM Gd 10Gy
ATP synthase, H+ transporting, mitochondrial Fo complex subunit G (ATP5L)
OVER
NADH: ubiquinone oxidoreductase core subunit S3 (NDUFS3) OVER
NADH: ubiquinone oxidoreductase subunit A12 (NDUFA12) OVER
Cytochrome c oxidase subunit 7A2 (COX7A2) OVER
Table 30: Modulated genes in the oxidative phosphorylation.
Modulated genes OVER- or UNDER-expressed in
0.8mM Gd 10Gy
Aldehyde dehydrogenase 3 family member A1 (ALDH3A1) OVER
Dihydrolipoamide S-acetyltransferase (DLAT) OVER
Pyruvate dehydrogenase (lipoamide) alpha 1 (PDHA1) OVER
Table 31: Modulated genes in the glycolysis/gluconeogenesis pathway.
Observing the modulated genes within a signaling pathway is one way to analyze the results.
With the DAVIDS software, we can also classify the proteins by their location and/or their
biological functions. Since throughout this PhD work, we, in part, wanted to observe the
mitochondrial consequences of the combined treatment, as well as the oxido-reduction state of
the cells, Table 32 lists the modulated mitochondrial proteins (72 proteins were identified as
mitochondrial proteins), while Table 33 lists the modulated oxidoreductase proteins (37
proteins).

Results & Discussion Chapter V. Shotgun/Bottom-up Proteomics study
228
Gene Name Fold change
(IR/IR + AGuIX®)
OVER- or UNDER-expressed in
0.8mM Gd 10Gy
2,4-dienoyl-CoA reductase 1, mitochondrial(DECR1) - UNDER
3-hydroxyisobutyrate dehydrogenase(HIBADH) 2.000 UNDER
3-hydroxymethyl-3-methylglutaryl-CoA lyase(HMGCL) 2.000 UNDER
5-phosphohydroxy-L-lysine phospho-lyase(PHYKPL) - UNDER
ATP synthase, H+ transporting, mitochondrial Fo complex subunit D(ATP5H)
- OVER
ATP synthase, H+ transporting, mitochondrial Fo complex subunit G(ATP5L)
0.500 OVER
ATPase family, AAA domain containing 3B(ATAD3B) - OVER
BCL2 like 1(BCL2L1) - OVER
BRI3 binding protein(BRI3BP) - OVER
G elongation factor mitochondrial 1(GFM1) 2.000 UNDER
NADH:ubiquinone oxidoreductase core subunit S3(NDUFS3) 0.333 OVER
NADH:ubiquinone oxidoreductase subunit A12(NDUFA12) 0.500 OVER
NADH:ubiquinone oxidoreductase subunit A6(NDUFA6) - OVER
NADH:ubiquinone oxidoreductase subunit S5(NDUFS5) - UNDER
NDUFA4, mitochondrial complex associated(NDUFA4) - UNDER
OPA1, mitochondrial dynamin like GTPase(OPA1) - UNDER
SAMM50 sorting and assembly machinery component(SAMM50)
- UNDER
TP53 induced glycolysis regulatory phosphatase(TIGAR) 0.500 OVER
Acyl-CoA dehydrogenase family member 9(ACAD9) 2.000 UNDER
Acyl-CoA dehydrogenase, C-4 to C-12 straight chain(ACADM) 0.500 OVER
Acyl-CoA thioesterase 9(ACOT9) 0.500 OVER
Adenylate kinase 4(AK4) - UNDER
Aldehyde dehydrogenase 4 family member A1(ALDH4A1) 0.500 OVER
Apolipoprotein O(APOO) - OVER
Biphenyl hydrolase like(BPHL) - OVER
caseinolytic mitochondrial matrix peptidase proteolytic subunit(CLPP)
2.000 UNDER

Results & Discussion Chapter V. Shotgun/Bottom-up Proteomics study
229
Clusterin(CLU) - UNDER
Coproporphyrinogen oxidase(CPOX) - OVER
Cytochrome b5 reductase 3(CYB5R3) 0.500 OVER
Cytochrome c oxidase subunit 7A2(COX7A2) 0.500 OVER
Cytochrome c1(CYC1) - UNDER
Dihydrolipoamide S-acetyltransferase(DLAT) 0.500 OVER
Dynamin 1 like(DNM1L) - UNDER
Enoyl-CoA delta isomerase 1(ECI1) - UNDER
Enoyl-CoA hydratase, short chain 1(ECHS1) 0.200 OVER
Ferredoxin reductase(FDXR) - UNDER
Glycerol-3-phosphate dehydrogenase 2(GPD2) - UNDER
Holocytochrome c synthase(HCCS) - OVER
Hydroxyacyl-CoA dehydrogenase(HADH) 2.000 UNDER
Leucine zipper and EF-hand containing transmembrane protein 1(LETM1)
1.500 UNDER
Mitochondrial antiviral signaling protein(MAVS) 0.500 OVER
Mitochondrial carrier 2(MTCH2) - OVER
Mitochondrial ribosomal protein L24(MRPL24) - UNDER
Mitochondrial ribosomal protein L37(MRPL37) 0.500 OVER
Mitochondrial ribosomal protein L39(MRPL39) - OVER
Mitochondrial ribosomal protein L4(MRPL4) - OVER
Mitochondrial ribosomal protein L46(MRPL46) - UNDER
Mitochondrial ribosomal protein S15(MRPS15) - UNDER
Mitochondrial ribosomal protein S22(MRPS22) 2.000 UNDER
Mitochondrial ribosomal protein S23(MRPS23) 0.500 OVER
Mitochondrial ribosomal protein S25(MRPS25) - UNDER
Mitochondrial ribosomal protein S28(MRPS28) 1.500 OVER
Mitochondrial ribosomal protein S9(MRPS9) 2.000 UNDER
Monoamine oxidase A(MAOA) - UNDER
Peptidyl-tRNA hydrolase 2(PTRH2) - UNDER
Peptidylprolyl cis/trans isomerase, NIMA-interacting 4(PIN4) - OVER
Polyribonucleotide nucleotidyltransferase 1(PNPT1) - OVER
Protein kinase cAMP-activated catalytic subunit - OVER

Results & Discussion Chapter V. Shotgun/Bottom-up Proteomics study
230
alpha(PRKACA)
Pseudouridylate synthase 1(PUS1) - OVER
Pyruvate carboxylase(PC) - OVER
Pyruvate dehydrogenase (lipoamide) alpha 1(PDHA1) 0.500 UNDER
Queuine tRNA-ribosyltransferase catalytic subunit 1(QTRT1) - UNDER
Ras homolog family member T2(RHOT2) - OVER
Serine hydroxymethyltransferase 2(SHMT2) 0.445 OVER
Solute carrier family 25 member 13(SLC25A13) 0.200 OVER
Solute carrier family 25 member 4(SLC25A4) - OVER
Succinate-CoA ligase ADP-forming beta subunit(SUCLA2) 2.000 OVER
Synaptojanin 2 binding protein(SYNJ2BP) - OVER
Thioredoxin reductase 2(TXNRD2) 0.667 UNDER
Translocase of outer mitochondrial membrane 40(TOMM40) 0.250 OVER
Transmembrane protein 126A(TMEM126A) - OVER
Tyrosyl-tRNA synthetase 2(YARS2) - OVER
Table 32: Modulated mitochondrial genes.

Results & Discussion Chapter V. Shotgun/Bottom-up Proteomics study
231
Gene Name Fold change
(IR/IR + AGuIX®)
OVER- or UNDER-expressed in
0.8mM Gd 10Gy
2,4-dienoyl-CoA reductase 1, mitochondrial(DECR1) - UNDER
3-hydroxyisobutyrate dehydrogenase(HIBADH) 2.000 UNDER
C-terminal binding protein 1(CTBP1) - UNDER
C-terminal binding protein 2(CTBP2) - UNDER
NAD(P)H quinone dehydrogenase 1(NQO1) 2.000 UNDER
NADH:ubiquinone oxidoreductase core subunit S3(NDUFS3) 0.333 OVER
Acyl-CoA dehydrogenase family member 9(ACAD9) 2.000 UNDER
Acyl-CoA dehydrogenase, C-4 to C-12 straight chain(ACADM) 0.500 OVER
Aldehyde dehydrogenase 1 family member A1(ALDH1A1) 0.500 OVER
Aldehyde dehydrogenase 3 family member A1(ALDH3A1) 0.500 OVER
Aldehyde dehydrogenase 4 family member A1(ALDH4A1) 0.500 OVER
Aldo-keto reductase family 7 member A2(AKR7A2) 0.500 OVER
AlkB homolog 5, RNA demethylase(ALKBH5) - OVER
Biliverdin reductase B(BLVRB) 2.000 UNDER
Carbonyl reductase 3(CBR3) - OVER
Coproporphyrinogen oxidase(CPOX) - OVER
Cytochrome P450 family 51 subfamily A member 1(CYP51A1) - UNDER
Cytochrome b5 reductase 1(CYB5R1) - UNDER
Cytochrome b5 reductase 3(CYB5R3) 0.500 OVER
Dehydrogenase/reductase 7(DHRS7) - OVER
Dihydrofolate reductase(DHFR) - UNDER
Ferredoxin reductase(FDXR) - UNDER
Glycerol-3-phosphate dehydrogenase 2(GPD2) - UNDER
Hydroxyacyl-CoA dehydrogenase(HADH) 2.000 UNDER
Hydroxysteroid dehydrogenase like 2(HSDL2) - OVER
Inosine monophosphate dehydrogenase 1(IMPDH1) - OVER
Monoamine oxidase A(MAOA) - OVER
Procollagen-lysine,2-oxoglutarate 5-dioxygenase 3(PLOD3) - UNDER
Prolyl 3-hydroxylase 1(P3H1) - UNDER
Pyruvate dehydrogenase (lipoamide) alpha 1(PDHA1) 0.500 OVER
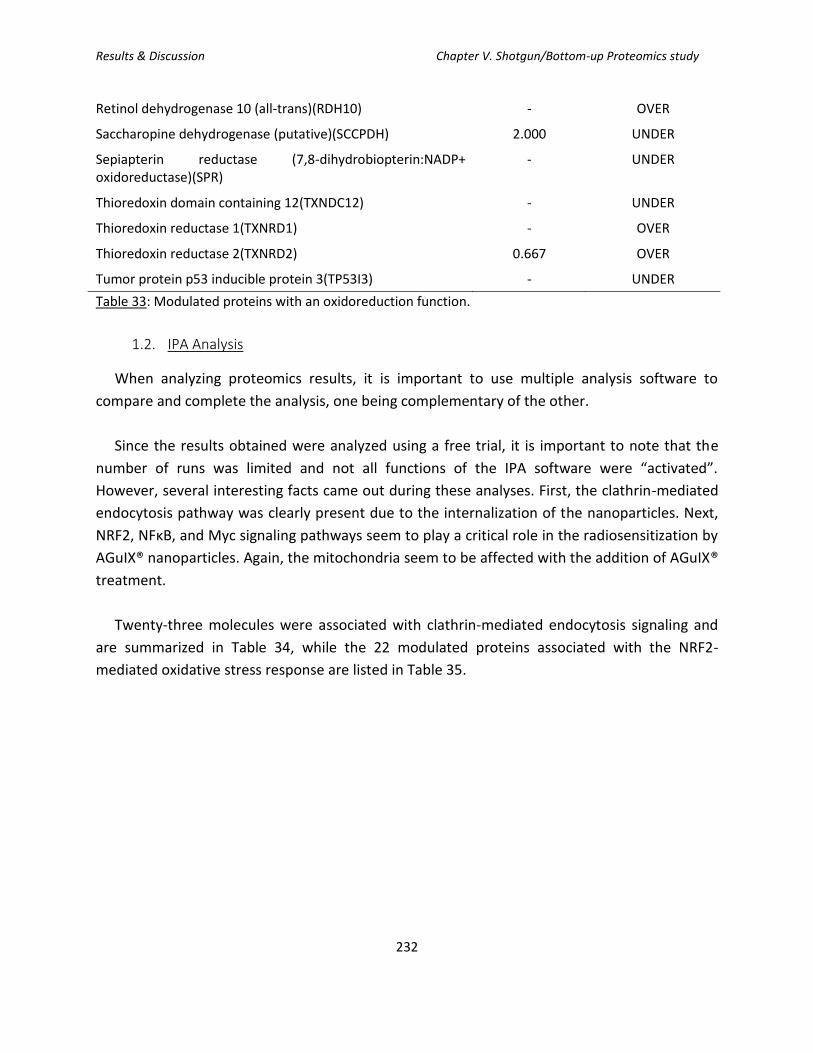
Results & Discussion Chapter V. Shotgun/Bottom-up Proteomics study
232
Retinol dehydrogenase 10 (all-trans)(RDH10) - OVER
Saccharopine dehydrogenase (putative)(SCCPDH) 2.000 UNDER
Sepiapterin reductase (7,8-dihydrobiopterin:NADP+ oxidoreductase)(SPR)
- UNDER
Thioredoxin domain containing 12(TXNDC12) - UNDER
Thioredoxin reductase 1(TXNRD1) - OVER
Thioredoxin reductase 2(TXNRD2) 0.667 OVER
Tumor protein p53 inducible protein 3(TP53I3) - UNDER
Table 33: Modulated proteins with an oxidoreduction function.
1.2. IPA Analysis
When analyzing proteomics results, it is important to use multiple analysis software to
compare and complete the analysis, one being complementary of the other.
Since the results obtained were analyzed using a free trial, it is important to note that the
number of runs was limited and not all functions of the IPA software were “activated”.
However, several interesting facts came out during these analyses. First, the clathrin-mediated
endocytosis pathway was clearly present due to the internalization of the nanoparticles. Next,
NRF2, NFκB, and Myc signaling pathways seem to play a critical role in the radiosensitization by
AGuIX® nanoparticles. Again, the mitochondria seem to be affected with the addition of AGuIX®
treatment.
Twenty-three molecules were associated with clathrin-mediated endocytosis signaling and
are summarized in Table 34, while the 22 modulated proteins associated with the NRF2-
mediated oxidative stress response are listed in Table 35.

Results & Discussion Chapter V. Shotgun/Bottom-up Proteomics study
233
Gene Name
OVER or UNDER-
expressed in
0.8mM Gd 10Gy
Localization Type(s)
Actin gamma 1 OVER Cytoplasm Other
ARP3 actin related protein 3
homolog
UNDER Plasma membrane Other
Adaptor related protein complex 1
beta
OVER Cytoplasm Transporter
Adaptor related protein complex 2 UNDER Cytoplasm Transporter
Adaptor related protein complex 2
beta
UNDER Plasma membrane Transporter
Apolipoprotein A1 UNDER Extracellular Space Transporter
ADP ribosvlation factor 6 OVER Plasma Membrane Transporter
Actin related protein 2/3 complex OVER Cytoplasm Other
Cell division cycle 42 UNDER Cytoplasm Enzyme
Clathrin light chain B OVER Plasma membrane Other
Clusterin UNDER Cytoplasm Other
Casein kinase 2 alpha 2 OVER Cytoplasm Kinase
Casein kinase 2 beta UNDER Cytoplasm Kinase
Cortactin UNDER Plasma Membrane Other
Dynamin 1 like UNDER Cytoplasm Enzyme
Hepatocyte growth factor-regulated OVER Cytoplasm Other
Heat shock protein family A (Hsp70) UNDER Cytoplasm Enzyme
Integrin subunit beta 1 UNDER Plasma Membrane Transmembrane
Receptor
Myosin VI OVER Cytoplasm Other
Myosin IE OVER Cytoplasm Enzyme
Prenylcysteine Oxidase 1 OVER Cytoplasm Enzyme
Phosphatidylinositol binding clathrin UNDER Cytoplasm Other
Ras-related C3 botulinum toxin OVER Plasma Membrane Enzyme
Table 34: List of the 23 modulated proteins associated with clathrin-mediated endocytosis signaling. Gene name, over-or under-expressed, cell localization, and corresponding type.

Results & Discussion Chapter V. Shotgun/Bottom-up Proteomics study
234
Gene Name
OVER or UNDER-
expressed in
0.8mM Gd 10Gy
Localization Type(s)
Actin gamma 1 OVER Cytoplasm Other
Aldo-keto reductase family 7 member A2
UNDER Cytoplasm Enzyme
Caseinolytic mitochondrial matrix
OVER Cytoplasm Peptidase
CREB binding protein UNDER Nucleus Transcription regulator
Cullin 3 OVER Nucleus Enzyme
DnaJ heat shock protein family (Hsp40) Member A2
UNDER Nucleus Enzyme
DnaJ heat shock protein family (Hsp40) Member A3
OVER Cytoplasm Other
DnaJ heat shock protein family (Hsp40) Member JB11
OVER Cytoplasm Other
DnaJ heat shock protein family (Hsp40) Member C8
UNDER Nucleus Other
DnaJ heat shock protein family (Hsp40) Member C9
OVER Nucleus Other
DnaJ heat shock protein family (Hsp40) Member C10
UNDER Cytoplasm Enzyme
Epoxide hydrolase 1 OVER Cytoplasm Peptidase
FK506 binding protein 5 UNDER Nucleus Enzyme
Glutathione S-transferase theta 1 OVER Cytoplasm Enzyme
3-hydroxyacyl-CoA dehydratase 3
UNDER Cytoplasm Enzyme
Mitogen-activated protein kinase kinase 1
UNDER Cytoplasm Kinase
Microsomal glutathione S-transferase 2
UNDER Cytoplasm Enzyme
NAD(P)H quinone dehydrogenase 1
OVER Cytoplasm Enzyme
NRAS proto-oncogene GTPase OVER Plasma Membrane
Enzyme
Protein kinase C iota OVER Cytoplasm Kinase
Thioredoxin UNDER Cytoplasm Enzyme
Thioredoxin reductase 1 OVER Cytoplasm Enzyme
Table 35: List of the 22 modulated proteins associated with NRF2-mediated oxidative stress response. Gene name, over-or under-expressed, cell localization, and corresponding type.

Results & Discussion Chapter V. Shotgun/Bottom-up Proteomics study
235
Although one might argue that an over- or under- expression of 20% is small, in biology, a
small variation can have an important biological impact. This is why we thought it was
interesting to analyze the proteomic results obtained using these low cut-off values.
2. Analysis of proteins with a fold change of 5X over or under-expressed: the
identification of 16 modulated proteins
The analysis was then focused by restricting even more the cut-off of what was considered
significant: the cut-off was therefore set by taking into account a change in protein expression
starting at 5 times over or under-expressed: in this case, sixteen proteins were identified and
are summarized in the table below (Table 35).
Protein
OVER or UNDER-
expressed in
0.8mM Gd 10Gy
Localization
Heterogeneous nuclear ribonucleoprotein L UNDER Nucleus/Cytoplasm
S-formylglutathione hydrolase OVER Cytoplasm
Crk-like protein OVER Cytoplasm
Calcium-binding mitochondrial carrier protein Aralar2
OVER Mitochondria
Proteasome subunit beta type OVER Nucleus/Cytoplasm
cDNA FLI78268, highly similar to homo sapiens fusion
OVER Nucleus
cDNA FLI78655, highly similar to Homo sapiens exportin 5 (XPO5)
OVER Nucleus
Urindine phosphorylase 1 OVER Cytoplasm, association with cytoskeleton
FACT complex subunit SPT16 UNDER Nucleus
Nuclear cap binding protein subunit 1 UNDER Cytosol, mitochondrion nuclear cap binding complex, nucleoplasm
AP-2 complex subunit beta UNDER Plasma membrane
Polyadenylate-binding protein UNDER Cytosol/nucleus
Low-molecular weight phosphotyrosine protein phosphatase
UNDER Cytosol
H.Sapiens ras-related Hrab1A protein UNDER Endoplasmic reticulum
Nuclear pore complex protein Nup205 UNDER Nuclear membrane
Ribonucleoside-diphospate reductase UNDER Cytoplasm
Table 36: List of proteins with an over- or under- expression of at least 5 times with its cellular localization.

Results & Discussion Chapter V. Shotgun/Bottom-up Proteomics study
236
After reviewing the literature on the above-cited proteins, we focused on the
ribonucleoside-diphosphate reductase (RNR) as a potential promising target, which was found
to be under-expressed after treatment with AGuIX® nanoparticles in addition to the irradiation.
Indeed, RNR has already been identified, and serves as a prognostic and predictive biomarker in
many different types of cancers (i.e. in hepatocellular carcinoma, thyroid carcinoma, colorectal
cancers, pancreatic cancers, nasopharyngal carcinoma, …) Moreover, an elevated RNR activity
and/or the over-expression of this protein has been related to an increase of drug resistance as
well as an increase of both the angiogenic and invasive potential of the cancer cells.
Ribonucleotide-reductase (RNR) is a unique enzyme, because it is responsible for reducing
ribonucleotides to their corresponding deoxyribonucleotides, which are the building blocks
required for DNA replication and repair. Dysregulated RR activity is therefore associated with
genomic instability, malignant transformation, and cancer development. RNR is composed of
two sub-units: RRM1 and RRM2, containing two homodimers. RRM1 contains allosteric
regulatory sites and catalytic domain while RRM2 contains two irons for catalytic activity.
RRM2 is inducible by p53 and is necessary for DNA repair as well as mitochondrial DNA
maintenance for example.
This protein has already been the topic of several studies for its potential as a therapeutic
target in some cancers via the use, in particular of siRNA directed against RNR. Studies include
its inhibition via an siRNA to reverse tamoxifen resistance in breast cancer (Shah et al., 2014),
the suppression of oral squamous cell carcinoma (OSCC) cell growth (Iwamoto et al., 2015), the
induction of autophagy in hepatocellular carcinoma (Chen et al., 2014), as well as the or
reduction of cell proliferation and invasion via apoptosis induction in gastric adenocarcinoma
(Kang et al., 2014). Moreover, two studies by Rahman et al., using siRNA nanoparticles
targeting RRM2, demonstrated an induction of apoptosis, the suppression of cell proliferation,
and an inhibition of tumors’ growth (Rahman et al., 2012), regulated via an increase of Bcl-2
degradation (Rahman et al., 2013). The use of gemcitabine, an RNR inhibitor, allowed the
restoration of docetaxel sensitivity in OSCC. The targeting of RNR with a microRNA inhibited
glioma proliferation (Jiang et al., 2017), and the combination of clofarabine and the inhibition of
RNR with a siRNA caused the reduction of xenografts in multiple myeloma (Sagawa et al.,
2017).
The study of RNR as a potential target in HNSCC has also been extensively studied, in vitro, in
vivo and in clinical trials. Indeed, an in vitro and in vivo efficacy of the combined treatment of
hydroxyurea, an RNR inhibitor, with a histone deacetylase inhibitor (valproic acid, VPA) on
HNSCC cell lines freshly established from human tumors, was demonstrated. This effect was

Results & Discussion Chapter V. Shotgun/Bottom-up Proteomics study
237
shown to be induced by BIM induction and EGFR down-regulation (Stauber et al., 2012). We
can also cite two clinical trials using RNR inhibitors. First, there is an ongoing Phase II assay on
27 grade III and grade IV patients studying the radiosensitizing effect of gemcitabine, an RNR
inhibitor, however important side effects remain a hold-back (Agular-Ponce et al., 2004).
Secondly, a phase II assay on 32 patients with recurrent and metastatic HNSCC was undertaken
with 3-AP Triapine, a RNR inhibitor, but showed only a modest effect (Nutting et al., 2009).
Western Blot analysis was needed to be performed in order to validate this under-
expression of RNR when SQ20B J.L. cells are treated with AGuIX®. RRM1 and RRM2 specific
antibodies were therefore used. Our first experiments with anti-RRM1 antibody did not give
any results, in terms of expression following the combined treatment. Actually, the modulation
of RRM2 expression, via the validation by Western Blot experiments, is still in progress. One
must keep in mind that the analysis of the proteome under our experimental conditions
constitute preliminary experiments that need to be strengthened in the near future.
At the time point-chosen, twenty-four hours post-irradiation, we are able to observe, not
only proteins that would in the long-term lead to cell death, but also proteins that could help
the cells to resist cell death (those radioresistant mechanisms activated by the cells). It would
have been interesting to do a kinetic study in time, perhaps up to 240 hours post-irradiation
(end-point of the clonogenic survival curve assay), to observe what proteins were still over- or
under-expressed. We would expect that after the combined treatment of AGuIX® and I.R.,
proteins leading to cell survival (resistance) would be under-expressed, while those leading to
cell death would be over-expressed. It is clear from this preliminary proteomic study that the
resulting cell death by the radiosensitization of AGuIX® is the result of multiple signaling
pathways.
In this chapter, we have shown that proteomics is certainly a very powerful and useful
approach in our problematic. This technique could also allow us to understand the link between
lysosome, autophagy, and complex DNA damage highlighted in this work after the combined
treatment of AGuIX® and radiation.

Results & Discussion Chapter V. Shotgun/Bottom-up Proteomics study
238
CHAPTER V TAKE-HOME MESSAGE:
Shot-Gun Proteomics is a powerful approach which allowed us to isolate 2000 + proteins with
more that 800 proteins modulated when the fold-change IR/0.8mM Gd + IR cut-off was set at
≥1.2 or ≤0.8. When using bioinformatics tools, it was observed that the energetic metabolism
of the cell was probably affected.
When the cut-off was set at 5X OVER- or UNDER- expressed, 16 proteins were modulated,
among which the ribonucleoside-disphosphate reductase caught our attention as it impacts
cancer susceptibility, and can serve as a target for anti-cancer therapies.

General Discussion
239
General Discussion

General Discussion
240

General Discussion
241
Head and neck cancer represents a major worldwide health concern, with 90% classified as
squamous cell carcinoma. These cancers arise from the epithelial lining of the oral cavity,
oropharynx, larynx and hypopharynx (Jemal et al., 2007; Boyle and Levin, 2008), and is strongly
associated with certain lifestyle risk factors including tobacco, alcohol consumption. More
recently, the infection by HPV 16 or 18 was also identified as a risk factor (Kreimer et al., 2005).
The five-year overall survival rate of HNSCC patients is quite low, as it remains between 40 and
50%. This low 5-year survival rate can be, in part, attributed to the fact that 2/3rd of patients
present Stage III, IVa/b at diagnosis, which is advanced and therefore requires a much harsher
treatment, yet less effective. Indeed, the remaining one-third of the patients diagnosed at an
early stage of the disease (Stage I or II) has a rather optimal survival rate, and the treatment
usually involves a single treatment modality with either surgery or radiation, as chemotherapy
or a combination of chemotherapy and radiation is not indicated in these cases. For Stage III/IV
patients, postoperative concomitant chemo-radiation, which is a much heavier treatment plan,
has huge impacts on the patients’ quality of life associated with a low survival rate. For all
these reasons, HNSCC remains an important worldwide health concern, ranked amongst the
top cancer in terms of diagnostics as well as for cancer-related deaths, due to its high
recurrence and radioresistance.
While radiation therapy plays an essential role in HNSCC treatment, its therapeutic efficacy is
hindered by treatment-associated toxicity and tumor recurrence. The use of radiotherapy in
HNSCC has one main limitation which is the close proximity of numerous radiation-sensitive
organs in the head and neck area. Careful radiation planning is needed in order to preserve the
organs’ function and the patients’ quality of life, while keeping in mind that the
radiotherapeutic dose delivered must be maximized in order to achieve loco-regional tumor
control and patient survival. Indeed, toxicity to surrounding healthy tissues limits the dose
deliverable to the patient. In order to reduce this toxicity, conventional RT is based on a
fractionated regime, (Joiner, 2009) (for HNSCC, doses of 2Gy 5 times a week for 7 weeks,
totaling a dose of 70Gy). This fractionation allows for the recovery of healthy tissues to sub-
lethal irradiation doses (known as the optimal therapeutic window) (Baskar et al., 2012; Kim
and Tannock, 2005). In addition, HNSCC tumors include a high degree of heterogeneity in
genotype, phenotype, and microenvironment, leading to a variability in their radiation
sensitivity and responses in different populations of tumor cells (Meacham and Morrison, 2013;
Burrell et al., 2013, Junttila and de Sauvage, 2013).
In order to counteract radioresistance and overcome its limitations, it is necessary to
combine radiotherapy with an agent that will increase the dose delivered to the tumor while
sparing the healthy tissue, which defines a performing radiosensitizing agent. Up to now, the

General Discussion
242
only recent radiosensitizing agent approved by the FDA, is cetuximab, an EGFR antibody but its
success remains disappointing. In order to develop efficient radiosensitizing agents for HNSCC,
it is important to improve our understanding on the different mechanisms underlying HNSCC
radioresistance.
One thoroughly studied pathway is the DNA damage response (DDR). Alterations of the DDR
in cancer cells strongly contribute to radioresistance by preventing mutations and/or cell death.
A strong link has been identified between Ku80 and radioresistance, as its overexpression has
been linked with markedly worsened locoregional recurrence and overall survival (Moeller et
al., 2011; Chang et al., 2006; Nimura et al., 2007; Chang et al., 2008). Two additional proteins
were identified for their implication in radioresistance due to their involvement in NHEJ DDR
are PARP (poly-(ADP-ribose) polymerase) (Nowsheen et al., 2011) and the enzyme TRIP 13
(Scheckenbach et al., 2014). The overexpression and mutation of Rad-51, a homologous
recombination (HR) factor was associated with worse clinical outcomes for chemoradiation.
Therefore, both NHEJ and HR were identified as pathways that play an important role in
radioresistance. ATM and ATR are two proteins particularly vital in the initiation of DDR, and
their subsequent promotion of DNA repair through HR and NHEJ. These proteins play a role in
the regulation of the cell cycle progression using checkpoint kinases 1/2 (CHEK1/2) to control
cyclin dependent kinase (CDK) activity in order to delay the cell cycle and allow time to repair
the cells. The understanding of these mechanisms led to effectively elicit radiosensitization of
HNSCC if the ATM-CHEK2 and ATR-CHEK1 pathways were disrupted (Sankunny et al., 2014;
Mansour et al., 2013). However, the knockdown of CDK2 sensitized HNSCC cell to radiation in
monolayer culture, but failed to significantly do so in a physiologically representation cell
culture model which used a 3D extracellular matrix (ECM) (Soffar et al., 2013).
A well-known protein, with a role as a central regulator of many cellular processes and which
has a very important role and influence in the radioresistance of HNSCC by contributions to the
DDR and cell death, is p53. Indeed, mutant p53 is thought to contribute to radiation failure in
HNSCC (Alsner et al., 2001; Koch et al., 1996; Alsner et al., 2001). The use of metformin
potentialized radiotherapy both in vitro and in vivo on TP53 mutational status, while no
influence was observed on wild-type TP53. In an effort to understand this phenomenon, the
authors hypothesized that cells with mutated TP53 favor the glycolytic metabolic pathway for
energy production, which would explain their sensitivity to metformin (Sandulache et al., 2012).
Patients receiving post-operative radiation therapy and are concurrently treated with
metformin had less locoregional recurrence and improved survival compared with matched
controls (85% vs. 41%) (Skinner et al., 2012). A Phase I dose-finding study in HNSCC to examine
the addition of metformin to chemoradiation is underway (NCT02325401).
General Discussion
243
Cell cycle modulators such as SAR-020106, a CHEK1 inhibitor, promoted mitotic entry of cells
after radiation-induced G2/M arrest, which in turn led to an increased apoptosis in p53-
deficient HNSCC cells. In this study, reduced tumor growth with no evidence of metastasis nor
toxicity were observed in a mouse xenograft model that had received the combined treatment
of SAR-020106 with irradiation (Borst et al., 2013). No clinical trials are ongoing for SAR-020106,
but a phase I trial for CCT245737, another isolated CHEK1 inhibitor is underway. Another
compound of interest is P276-00 which inhibits the cyclin-d/CD4/P16/pRB/E2F axis and can
induce apoptosis by triggering G1/S arrest (Mishra et al., 2013). Other agents include Olaparib,
a PARP inhibitor, which showed an additive effect when treated in combination with PF-
0477736, a CHEK1 inhibitor on HPV-positive HNSCC cell lines. A phase I trial combining Olaparib
and cetuximab, with RT in advanced HNSCC is currently ongoing (NCT01758731).
Other radioresistant features of HNSCC include for example the tumor’s microenvironment,
the interplay of immune response to radiation therapy, the cancer stem cell paradigm and the
dysfunction of pathways leading to apoptotic cell death. Indeed, the epidermal growth factor
receptor is responsible for an aberrant signaling which can mediate resistance to radiation by
modifying the induction of apoptosis. Pathways downstream of EGFR, such as PI3K/Akt/mTOR
or MAPK/ERK, may also contribute to the radioresistance by mitigating apoptosis (Ettl et al.,
2015; Nakagawa et al., 2012). We already mentioned that Cetuximab, an anti-EGFR drug
approved by the FDA was disappointing in terms of efficacy. Focus therefore turned to fully-
humanized monoclonal EGFR antibodies such as Panitumumab. However, Panitumumab plus
RT had similar outcomes to chemoradiotherapy in locoregional control at two-year follow-up
(51% versus 61%, respectively) with the regimens showing a similar toxicity profile (Giralt et al.,
2015). Nevertheless, it was demonstrated that the inhibition of EGFR in HNSCC can actually
trigger a tumor promoting inflammatory response via NOX4, which could partly explain the
disappointing results obtained with Cetuximab and Panitumumab. In addition, therapeutic
failure of EGFR inhibition may occur due to the superfluous effects of EGFR’s downstream
pathways MAPK/ERK and PI3K/Akt/mTOR, which promote NHEJ DNA repair via DNA-PKs (Saki
et al., 2013; Toulany et al., 2005; Minjgee et al., 2011; Gupta et al., 2002). Therefore, another
approach was the development of tyrosine kinase inhibitors (TKIs) such as gefitinib and
erlotinib, which can act on the intracellular portion of the receptor to inhibit phosphorylation of
downstream effectors. Up to now, an ongoing Phase II trial did not show any improvements in
term of outcomes and an increased toxicity was observed (Rodriguez et al., 2012).
As both cetuximab and TKIs have encountered low response rates in clinical practice, EGFR
antisense DNA has also been investigated as another way to target EGFR signaling (Lai et al.,
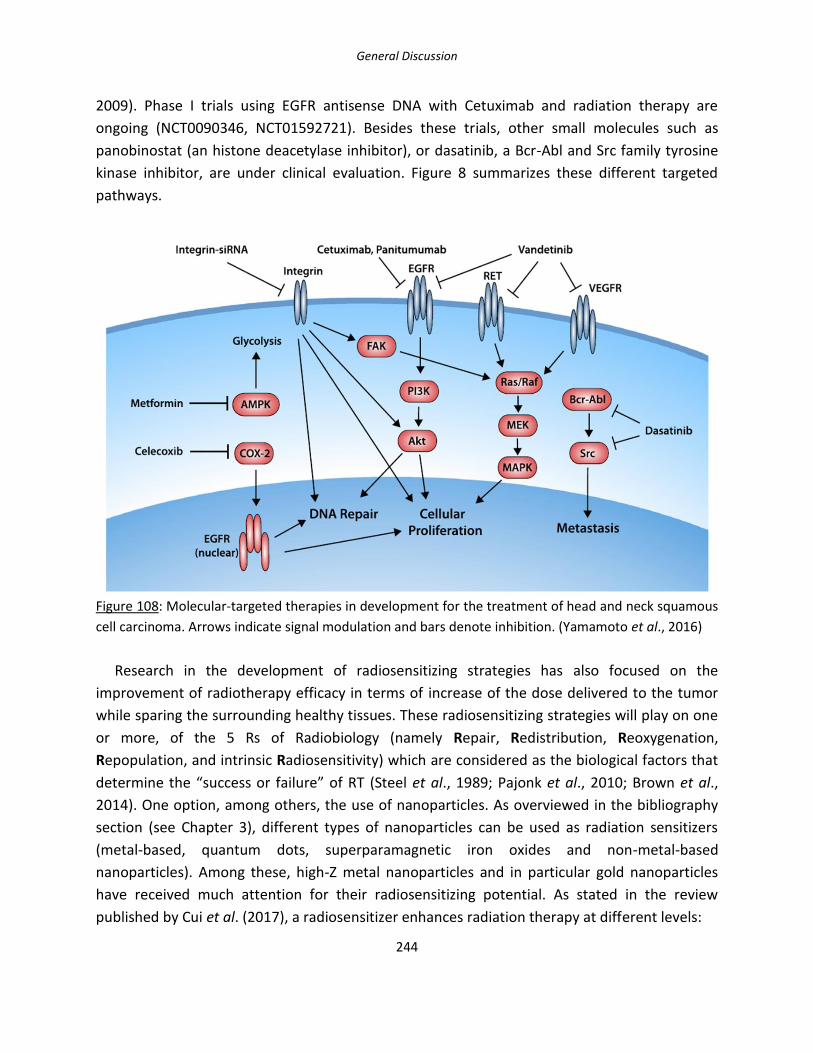
General Discussion
244
2009). Phase I trials using EGFR antisense DNA with Cetuximab and radiation therapy are
ongoing (NCT0090346, NCT01592721). Besides these trials, other small molecules such as
panobinostat (an histone deacetylase inhibitor), or dasatinib, a Bcr-Abl and Src family tyrosine
kinase inhibitor, are under clinical evaluation. Figure 8 summarizes these different targeted
pathways.
Figure 108: Molecular-targeted therapies in development for the treatment of head and neck squamous
cell carcinoma. Arrows indicate signal modulation and bars denote inhibition. (Yamamoto et al., 2016)
Research in the development of radiosensitizing strategies has also focused on the
improvement of radiotherapy efficacy in terms of increase of the dose delivered to the tumor
while sparing the surrounding healthy tissues. These radiosensitizing strategies will play on one
or more, of the 5 Rs of Radiobiology (namely Repair, Redistribution, Reoxygenation,
Repopulation, and intrinsic Radiosensitivity) which are considered as the biological factors that
determine the “success or failure” of RT (Steel et al., 1989; Pajonk et al., 2010; Brown et al.,
2014). One option, among others, the use of nanoparticles. As overviewed in the bibliography
section (see Chapter 3), different types of nanoparticles can be used as radiation sensitizers
(metal-based, quantum dots, superparamagnetic iron oxides and non-metal-based
nanoparticles). Among these, high-Z metal nanoparticles and in particular gold nanoparticles
have received much attention for their radiosensitizing potential. As stated in the review
published by Cui et al. (2017), a radiosensitizer enhances radiation therapy at different levels:

General Discussion
245
- at the molecular and cellular levels, by modifying pathways involved in DNA repair, cell
cycle checkpoint and progression, as well as cellular death and proliferation (to achieve
higher levels of cell death by irradiation).
- at the tissue level, by preventing the tumor regrowth by killing subpopulations of cancer
cells that would normally be radioresistant (i.e. those under hypoxia or in the S phase),
by inhibiting tumor angiogenesis or reducing tumor hypoxia prior to irradiation, by
regulating the function of tumor blood vessels as well as diminishing oxygen and nutrient
supply and by damaging tumor blood vessels post irradiation (Seiwert et al., 2007: Ma et
al., 2003).
Moreover, during the developmental stage of any kind of drug, one must keep in mind the
requirements for its clinical translation. As stated by Coleman and Mitchell (1999) and
Wardman (Wardmann, 2007), there are a number of key items that must be examined
including (1) the identification of targets of the radiosensitizer; (2) the accessibility of
radiosensitizer targets for radiosensitization; (3) the stability of the targets and finally, the (4)
toxicity of the radiosensitizer enhanced RT to tumor relative to normal tissues. These
identified steps for gold nanoparticles can be translated to all types of NPs, such as the
gadolinium-based nanoparticles used in this study.
Although the use of nanoparticles, as radiosensitizers has been extensively studied, the
translation into clinics is still insufficient. As reviewed by Brun and Sicard-Roselli (2016), many
unanswered questions remain among which the lack of consensus between the different
studies. As an example, the cell line, radiation energy, physicochemical properties of the NPs
(size, shape, and surfactant used), concentrations, incubation times have varied significantly in
the different studies which makes it near to impossible to make comparisons which in turn
would lead to meaningful conclusions (since we are not comparing the exact same things) (Jain
et al., 2011; Coulter et al., 2012). However, consistent findings concerning AuNPs
radiosensitization between these studies led to interesting points:
(1) AuNPs enhance the effects of high energy photon RT where the Compton effect
dominates (Kong et al., 2008; Rahman et al., 2009; Chithrani et al., 2010), providing evidence
that they can be used at clinically relevant energies;
(2) their cellular localization in close proximity to biological components has a great impact
on their radiosensitization capabilities;
(3) they are found to be sequestered as clusters in endosomal and lysosomal vacuoles
following cell entry. The impact of the nanoparticle’s size is influenced at the level of the

General Discussion
246
cellular uptake, rather than an influence on the biological impact once internalized, and the
manner of energy deposition of electrons generated following NPs + IR (Chithrani et al., 2010;
Chithrani et al., 2010); and lastly
(4) hypoxia has been reported to diminish radiosensitization by AuNPs, due to the important
roles of oxygen in RT (Cui et al., 2014; Jain et al., 2014).
These different observations on AuNPs should be translated to other types of nanoparticles,
although this remains to be demonstrated. (Cui et al., 2017). For a successful translation to
clinics, the understanding of the different mechanisms that underpin its effectiveness should
involve multidisciplinary collaborations between chemists, radiation oncologists, radiation
physicists, and molecular biologists.
In this work, AGuIX® nanoparticles were used to evaluate their potential as a radiosensitizing
agent while trying to understand their potential mechanism of action at the cellular level.
AGuIX® are gadolinium-based nanoparticles that have been developed mainly for imaging due
to their magnetic resonance contrast properties but they also have a potential role in radiation
therapy as a radiosensitizer (Le Duc et al., 2011; Porcel et al., 2010; Le Duc et al., 2014; Sancey
et al., 2014; Mignot et al., 2013; Kotb et al., 2016; Mowat et al., 2011; Štefančíková et al., 2014;
Miladi et al., 2015). In order to improve the effectiveness of gadolinium chelators as MRI
contrast agents (Frullano and Caravan, 2011), the formulation of AGuIX® has moved towards a
macrocyclic chelator (DOTA) instead of a linear gadolinium chelator (DTPA). In the present
study, the radiosensitizing potential of this new formulation of AGuIX® in the HNSCC cell model
SQ20B J.L. was demonstrated, resulting in a SF4Gy of 1.382 with an Enhanced Biological Factor
(EBR) of 1.3 which is similar to what is currently published for other studies using AGuIX®,
namely in HeLa (cervical cancer) (Luchette et al., 2014), Panc-1 (pancreatic cancer) (Detappe et
al., 2015), U87 (glioblastoma) (Štefančíková et al., 2014; Štefančíková et al., 2016), and B16F10
(melanoma) cells (Kotb et al., 2016), with DEFs varying from 1.17 to 1.54.
Regarding AGuIX®, and more generally high-Z NPs, one question that is often raised concerns
whether there is a preferential localization of AGuIX® for radiosensitization. In accordance with
Štefančíková et al. (2014) in glioblastoma, we showed that AGuIX® are not targeted to the
nucleus nor the mitochondria but are mostly located in lysosomes, while a few AGuIX® remain
free in the cytosol. Similar results were also obtained in CHO cells for example, where NP
clusters of sizes between 400-900 nm were observed in the cytoplasm regardless of the
concentration used or incubation time (Porcel et al., 2014).
One other main question addressed during this PhD was to further understand which
connections may exist between the physical and biological effects of AGuIX®. The hypothetical

General Discussion
247
mechanism behind the use of metal-based nanoparticles is based on the over-production of
secondary electrons leading to an increase of cellular ROS which in turn would lead to cell
death. Evidence obtained to date suggests that the generation of ROS as well as oxidative stress
strongly contribute to the biological impact of gold nanoparticles (Taggart et al., 2014;
Butterworth et al., 2012; Nel et al., 2006; Xia et al., 2006; Cui et al., 2013; Pan et al., 2009; Mroz
et al., 2008; Rim et al., 2013; Berbeco et al., 2012). However, only a few data are up to now
available in vitro. As pointed out in this work, and despite of radiosensitization, the increase of
ROS production following the combined treatment was lower than expected. One possible
explanation was that SQ20B cells, as many other radioresistant cancer cells, exhibit upregulated
antioxidant systems (see Zhou et al., as a review). Previous work from our lab effectively
reported that SQ20B cells display a high endogenous glutathione (GSH) content which largely
contributes to their radioresistant properties. Although GSH is a major ROS-scavenging system
in cells, the important redox modulating enzymes including the peroxidases, peroxiredoxins,
and thiol reductases also rely on the pool of reduced GSH as their source of reducing
equivalents (Boivin et al., 2011; Forman et al., 2009). In view of these elements, a transient
GSH-depleting strategy was previously investigated which resulted in the radiosensitization of
the SQ20B cell line used in this study (Boivin et al., 2011). Using the same experimental
approach, i.e after GSH depletion, we clearly demonstrated that the pretreatment of cells with
AGuIX® resulted in a net increase of cellular ROS after radiation thereby strongly suggesting a
ROS-mediated radiosensitizing effect of AGuIX®. No increase of ROS was obtained in
mitochondria under the same experimental conditions, probably because AGuIX® did not enter
mitochondria. The increase of cellular ROS was further evidenced through the clonogenic
survival curve by an increase of the EBR from 1.3 to 1.6. Nevertheless, one must keep in mind
that it still remains very difficult, if not impossible, to discriminate for sure a direct production
of ROS by AGuIX® as a consequence of irradiation, from an overproduction of ROS as a cellular
response and therefore to conclude about an additive or a synergetic effect of irradiation and
AGuIX®. Anyway, our results suggest that lowering endogenous antioxidant defenses could be
an interesting strategy to optimize the radiosensitizing effect of AGuIX®.
However, radical oxygen species also play a central role in carcinogenesis and a strong link
exists between mitochondria and ROS. Indeed, ROS, in the form of superoxide, hydroxyl free
radicals and hydrogen peroxide are produced from physiological metabolic reactions.
Mitochondria are major contributors to cellular ROS and multiple antioxidant pathways are
present to neutralize excess of ROS including superoxide dismutase (SOD2), glutathione,
thioredoxin, and peroxiredoxins. The early observation that cancer cells have a high ROS levels
compared to normal cells let to an overly simple hypothesis that inhibiting ROS could be a
successful therapeutic strategy. However, a more complex picture was emerging, where ROS
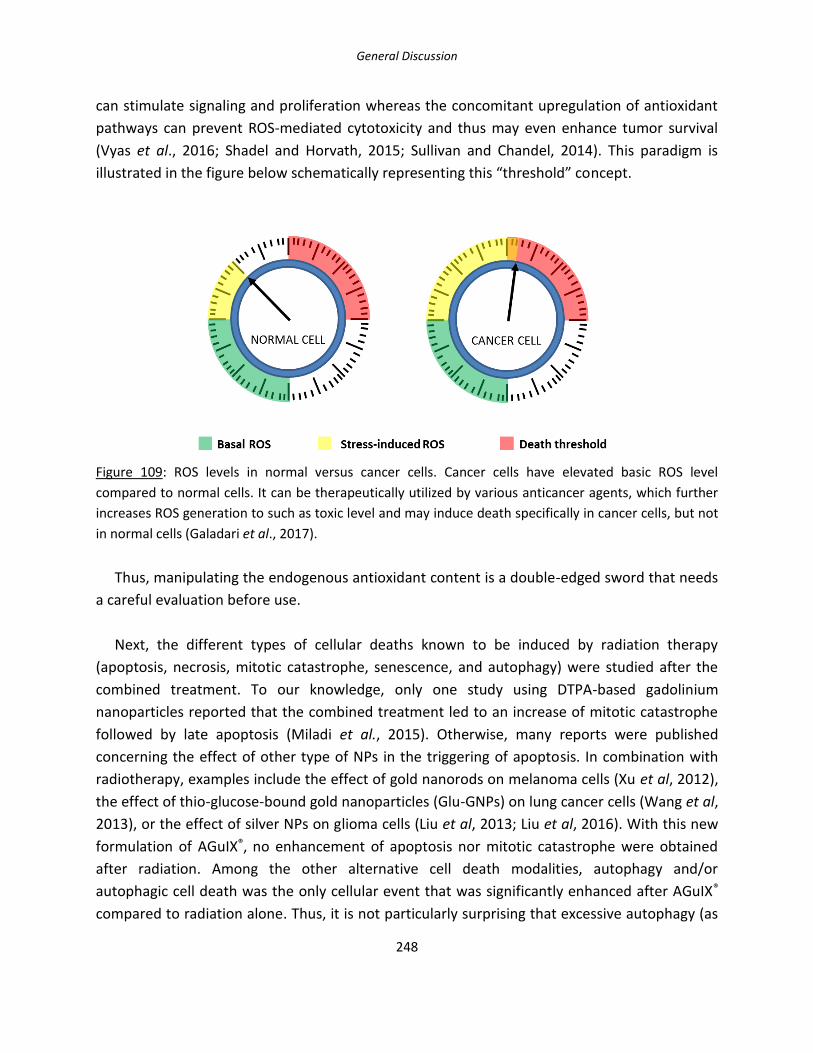
General Discussion
248
can stimulate signaling and proliferation whereas the concomitant upregulation of antioxidant
pathways can prevent ROS-mediated cytotoxicity and thus may even enhance tumor survival
(Vyas et al., 2016; Shadel and Horvath, 2015; Sullivan and Chandel, 2014). This paradigm is
illustrated in the figure below schematically representing this “threshold” concept.
Figure 109: ROS levels in normal versus cancer cells. Cancer cells have elevated basic ROS level
compared to normal cells. It can be therapeutically utilized by various anticancer agents, which further
increases ROS generation to such as toxic level and may induce death specifically in cancer cells, but not
in normal cells (Galadari et al., 2017).
Thus, manipulating the endogenous antioxidant content is a double-edged sword that needs
a careful evaluation before use.
Next, the different types of cellular deaths known to be induced by radiation therapy
(apoptosis, necrosis, mitotic catastrophe, senescence, and autophagy) were studied after the
combined treatment. To our knowledge, only one study using DTPA-based gadolinium
nanoparticles reported that the combined treatment led to an increase of mitotic catastrophe
followed by late apoptosis (Miladi et al., 2015). Otherwise, many reports were published
concerning the effect of other type of NPs in the triggering of apoptosis. In combination with
radiotherapy, examples include the effect of gold nanorods on melanoma cells (Xu et al, 2012),
the effect of thio-glucose-bound gold nanoparticles (Glu-GNPs) on lung cancer cells (Wang et al,
2013), or the effect of silver NPs on glioma cells (Liu et al, 2013; Liu et al, 2016). With this new
formulation of AGuIX®, no enhancement of apoptosis nor mitotic catastrophe were obtained
after radiation. Among the other alternative cell death modalities, autophagy and/or
autophagic cell death was the only cellular event that was significantly enhanced after AGuIX®
compared to radiation alone. Thus, it is not particularly surprising that excessive autophagy (as
General Discussion
249
obtained after our combined treatment) can promote cell death rather than cell survival.
Although the specific mechanism that links between radiation and autophagy has not been well
established, some studies have connected the mTOR pathway to radiation-induced cell death,
as radiation could cause decreased phosphorylation of the autophosphorylation site of p-mTOR
(decreased p-mTOR/mTOR ratio) (Paglin et al, 2005). Up to now, many trials have been
conducted to modulate autophagy for improving the outcome of cancer treatment in
combination with currently used treatment modalities such as radiotherapy in different cancer
types (Tam et al, 2017). Among these, some studies using different types of nanoparticles
combined with radiation presented evidence for a radiosensitizing effect involving autophagy:
AgNPS in glioma cells at clinically relevant megavoltage energies (Liu et al, 2016), copper
cysteamine NPs in colorectal carcinoma (Liu et al, 2017) or selenium NPs in breast cancer cells
(Cheng et al, 2017).
Apoptosis only accounts for 20% or less of radiation-induced cell death, strongly supporting
the involvement of other types of I.R. induced cell-death (Schleicher et al., 2010). In our case,
the only type of death that resulted in an enhancement between irradiation alone and the
combined treatment was autophagy. Autophagy, derived from “auto” (self) and “phagos” (to
eat), is a catabolic process in which the cells digest and recycle their own cytoplasmic contents,
to ensure healthy cellular homeostasis by eliminating waste and long-lived or damaged cellular
constituents. Indeed, autophagy is an augmented cellular protein recycling pathway in some
cancer cell death (PCD) type II under certain circumstances. Autophagy has a dual role in
cancer, as autophagy help cancer cells survive under nutrient-limiting conditions by recycling
protein and protecting cancer cells from cellular damage caused by anti-cancer drugs or ionizing
radiation, possibly by removing damaged macromolecules or organelles. Additionally, some
anti-cancer therapy typically induces autophagy in proportion to noxious stimuli, and defective
or excessive autophagy leads to autophagic cell death (Shintani et al., 2004; Lambert et al.,
2008). It would seem that autophagy occurs more under apoptosis-defective conditions
(Yousefi et al., 2006; Luo et al., 2007), and therefore, autophagy after irradiation plays different
roles according to the dose of radiation and propensity of cells to undergo apoptosis after lethal
damage (Jo et al., 2015). The authors concluded that radiation-induced apoptosis occurs later
than autophagy and is caspase-independent, which could explain the results that were
obtained during this PhD work as no significant differences were observed between irradiation
alone versus irradiation + AGuIX® treatment. Autophagy plays an important role in cancer
because of its tumor suppressing and tumor protecting functions (Tam et al., 2017). The
phosphatidylinositol-3-kinase (PI3K)-protein kinase B (Akt)-mTOR pathway is one of the most
important autophagy signaling pathways in cancer growth and progression (Nagelkerke et al.,
2015), and as it was discussed in the bibliography review, the PI3Ks, AKT, and mTOR signaling
networks are aberrant in HNSCC (Molinolo et al., 2009).
General Discussion
250
Increased autophagic cell-death induced by the combined treatment was an interesting
result, as the role of autophagy in radiation therapy is an ongoing debate, as to whether it has a
cytoprotective role or a cytotoxic one (Jaboin et al., 2007). Autophagy induced by radiation
plays a bi-directional effect in the cell’s fate decision since survival or death may depend on the
severity and duration of the stress (Li et al., 2016; Hu et al., 2016). When the stress is mild,
autophagy can degrade and recycle damaged or unwanted cellular constituents in
autophagolysosomal vesicles to provide additional energy supply during stress, which has an
essential effect in the quality of control of organelles and cellular adaptation to stress (Ito et al.,
2005; Hu et al., 2016). Indeed, the cytoprotective function of autophagy induced by radiation is
considered to reflect the cell’s capacity to eliminate toxic species such as free radicals and
damaged and unwanted proteins or organelles to generate energy and metabolic precursors
(Yang et al., 2015). Although some studies have shown that autophagy enhanced the anticancer
effects of radiotherapy on patients affected by oral squamous cell carcinoma and glioblastoma
(Wu et al., 2014; Saglar et al., 2014), other studies have shown that tumor resistance to
radiation therapy is linked to the upregulation of autophagy (colon cancer, prostate cancer,
glioma, nasopharyngeal, breast cancer) (Sun et al., 2015; Yang et al., 2015). These contradictory
results therefore call for an ongoing debate on the real role of autophagy in cancer therapy.
Cytotoxic autophagy is named autophagic cell death and can be also called type II apoptosis
(Gewirtz et al., 2009). Studies have shown that several proteins involved in the DNA damage
repair signaling pathways or in the oxidative stress signaling pathways participate in the
modulation of autophagy. Reactive oxygen/nitrogen species generated in the context of
radiation exposure are essential activators of cytoplasmic signaling cascades such as p38 MAPK,
JNK, HIF-1α, which play essential roles in the regulation of autophagy (Liu et al., 2014).
Autophagy is therefore a double-edged sword that can either promote the destruction or
the protection of tumor cells, based on the different tumor types and stage, and may interact
with current treatment modalities. Figure 110 demonstrates the different outcomes of
autophagy on cancer cells.

General Discussion
251
Figure 110: Effects of efficient or deregulated autophagy in cancer development (Inspired from Aredia et
al., 2012).
In this work, evidence is presented for an enhancement of autophagy with AGuIX® after
radiation. As visualized with fluorescence microscopy, AGuIX® could trigger autophagic cell
death or autosis an autophagy-dependent non-apoptotic form of cell death, characterized by
unique morphological changes such as focal swelling of the perinuclear space or ER
disappearance (Liu and Levine, 2015). However, at this stage of our work, our results do not
really allow us to distinguish for sure between cell death accompanied by signs of autophagy
(i.e cell death with autophagy) from cell death as a consequence of autophagy (autophagic cell
death, such as autosis) (Liu and Levine, 2015). Further exploration of the crosstalk between
increased autophagy due to AGuIX® treatment with irradiation should be further studied.
Another interesting fact to note is the potential link that exists between lysosomes and
autophagy, as the lysosome has an important role in this process, as shown in Figure 111.
Lysosomes are actors of autophagy as these organelles are part of the autophagosome
composition, without which, autophagy would not occur. In addition, it has been very recently
suggested that one unique and defining aspect of regulated autophagic cell death is the
absolute requirement for lysosome membrane permeabilization (LMP) (Karch et al., 2017).
Although the authors demonstrated the requirement of the Bax/Bak proteins to increase LMP,
LMP is known to occur in response to a large variety of stimuli (Johansson et al., 2010), among
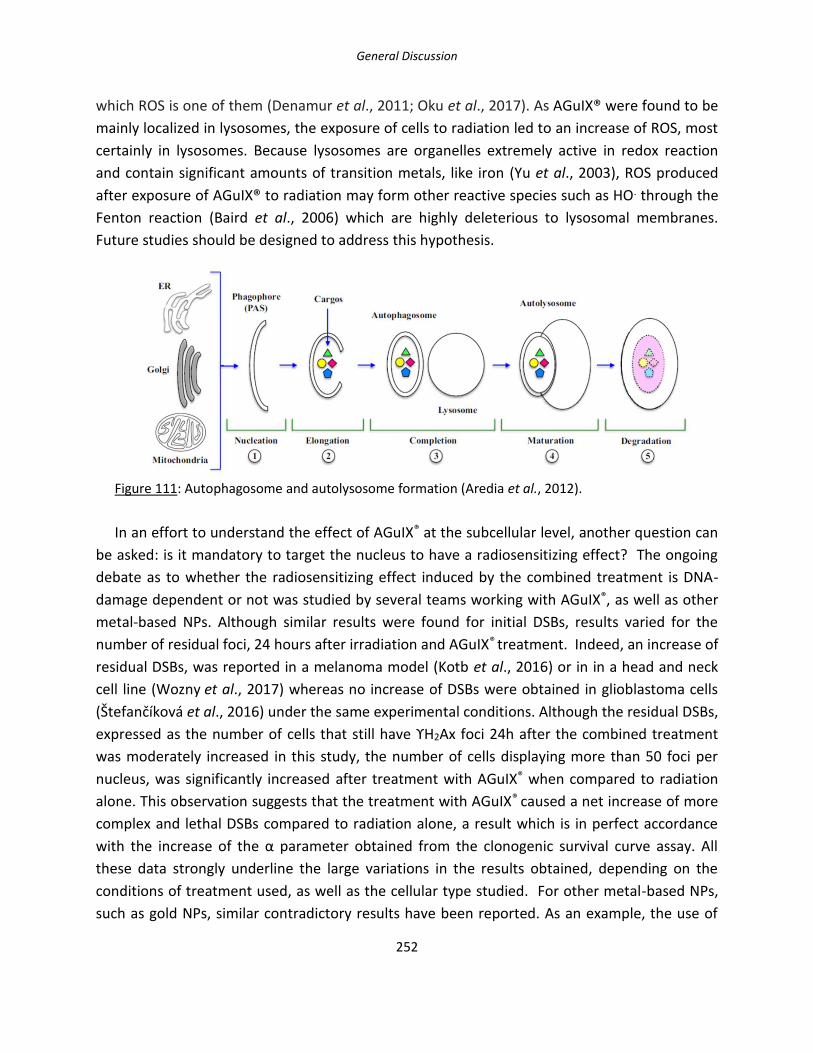
General Discussion
252
which ROS is one of them (Denamur et al., 2011; Oku et al., 2017). As AGuIX® were found to be
mainly localized in lysosomes, the exposure of cells to radiation led to an increase of ROS, most
certainly in lysosomes. Because lysosomes are organelles extremely active in redox reaction
and contain significant amounts of transition metals, like iron (Yu et al., 2003), ROS produced
after exposure of AGuIX® to radiation may form other reactive species such as HO. through the
Fenton reaction (Baird et al., 2006) which are highly deleterious to lysosomal membranes.
Future studies should be designed to address this hypothesis.
Figure 111: Autophagosome and autolysosome formation (Aredia et al., 2012).
In an effort to understand the effect of AGuIX® at the subcellular level, another question can
be asked: is it mandatory to target the nucleus to have a radiosensitizing effect? The ongoing
debate as to whether the radiosensitizing effect induced by the combined treatment is DNA-
damage dependent or not was studied by several teams working with AGuIX®, as well as other
metal-based NPs. Although similar results were found for initial DSBs, results varied for the
number of residual foci, 24 hours after irradiation and AGuIX® treatment. Indeed, an increase of
residual DSBs, was reported in a melanoma model (Kotb et al., 2016) or in in a head and neck
cell line (Wozny et al., 2017) whereas no increase of DSBs were obtained in glioblastoma cells
(Štefančíková et al., 2016) under the same experimental conditions. Although the residual DSBs,
expressed as the number of cells that still have ϒH2Ax foci 24h after the combined treatment
was moderately increased in this study, the number of cells displaying more than 50 foci per
nucleus, was significantly increased after treatment with AGuIX® when compared to radiation
alone. This observation suggests that the treatment with AGuIX® caused a net increase of more
complex and lethal DSBs compared to radiation alone, a result which is in perfect accordance
with the increase of the α parameter obtained from the clonogenic survival curve assay. All
these data strongly underline the large variations in the results obtained, depending on the
conditions of treatment used, as well as the cellular type studied. For other metal-based NPs,
such as gold NPs, similar contradictory results have been reported. As an example, the use of
General Discussion
253
1.9 nm gold nanoparticles did not enhance radiation-induced DSBs formation nor inhibit DNA
repair in MDA-MB-231 breast cancer cells irradiated with MV electrons (Jain et al., 2011), while
the combination of 50 nm citrate-coated gold NPs with 6 MV photons resulted in an increase of
DSBs in HeLa cells (Chithrani et al., 2010; Berbeco et al., 2012).
In this study, we demonstrated that AGuIX® were able to radiosensitize SQ20B, an HNSCC
cell line, via the induction of intracellular ROS which strengthened the radiation effect. Once
taken up by cells, AGuIX® largely accumulated in lysosomes and resulted in the generation of
further complex DNA damage. Moreover, autophagy and/or autophagic cell death appeared to
mediate the effectiveness of this treatment combination. However, future studies are required
to understand the mechanisms linking lysosomes-entrapped AGuIX® with the upregulation of
autophagy/autophagic cell death after radiation. There seems to be a strong link between the
regulation of ROS, autophagy, and the lysosomal metabolism, with a very fine regulation of
these three factors which will make the balance lean to either the side of cell death or cell
survival. The end result of radiosensitization using AGuIX® is the result of a combination of
pathways, and does not rely on only one mechanism. As discussed, the notion of balance and
threshold is very important in the radiosensitizing effect of AGuIX® nanoparticles in HNSCC.

254

255
Conclusion & Perspectives

256

Conclusion & Perspectives
257
Head and Neck cancer remains a huge health burden, ranked 6th most common cancer
worldwide. This is in particular due to its high radioresistance against which the development of
new performing therapeutic sensitizing strategies is needed. By definition, a radiosensitizing
agent should increase the radiation dose received by the tumor and increase lethal damages
while sparing the healthy tissue in order to avoid recurrence and improve the patients’ quality
of life. Among the different options of radiosensitizing strategies, one is high-Z metal
nanoparticles has recently been the subject of growing interest. Nanotechnology has been
proposed as a novel experimental field since the early 2000s and gave rise to nanomedicine,
with much promise being shown with regards to a potential transition into clinical practice.
In this study, we have used a novel formulation of gadolinium-based nanoparticles, named
AGuIX®, as a potential radiosensitizing agent on an in vitro HNSCC radioresistant cell line model,
SQ20B J.L. The first aim of this study was to determine the best radiosensitizing conditions of
AGuIX® in this model and to characterize them in terms of potential toxicity and to look for
their cellular localization once internalized. We successfully demonstrated that
radiosensitization occurred in SQ20B cells when treated with 0.8 mM Gd for 24 hours in serum-
free DMEM-Glutamax. This concentration and time of incubation resulted in a SF4Gy of 1.382
and a 50% Enhanced Biological Factor (EBR) of 1.4. Internalized AGuIX® nanoparticles
amounted to about 0.11 pg of Gd per cell, as measured by ICP-OES, and were demonstrated by
confocal microscopy to mostly co-localize with lysosomes but not with the nucleus nor
mitochondria. Toxicity assays showed that the treatment did not induce any toxicity to SQ20B
cells in the absence of ionizing irradiation, whether at the cellular or the mitochondrial level.
The second aim of this work was to understand the mechanisms through which the
radiosensitizing effects of SQ20B cells with AGuIX® could occur. Indeed, one main question
remains in the field of radiosensitization by nanoparticles: what links exist between the
physical, chemical, and biological phases? To answer these questions, we firstly investigated the
involvement of the oxidative stress potentially resulting from the combination of AGuIX® to
radiation therapy. Secondly, the different types of radiation-induced cell death pathways were
investigated to bring an explanation of what was obtained with the clonogenic survival assay.
Thirdly, DNA-damage and repair were measured after the combined treatment, as DNA is
known to be the primary target of radiotherapy.
The increase in cytosolic and mitochondrial ROS was minimal when cells were treated with
AGuIX® prior to irradiation. As radioresistant cells are most of the time overprotected against
oxidative stress (as previously demonstrated in our lab for SQ20B cells) which in part explains
their radioresistance capacities, we used a pharmacological approach (DMF + BSO) to deplete
the cells from their high endogenous reduced glutathione content, four hours prior to

Conclusion & Perspectives
258
irradiation and after AGuIX® treatment. Under these experimental conditions, a clear increase
in cROS right after irradiation occurred, reinforced by the prior treatment with AGuIX® before
irradiation. This phenomenon is observed again, one and four-hours post-irradiation. In terms
of mROS, a significant increase was observed immediately after irradiation which was not
maintained over time. This should be explained by the fact that AGuIX® do not co-localize with
mitochondria, the initial burst probably resulting from water radiolysis products. After
glutathione depletion, the amount of ROS was significantly increased which had an impact on
the clonogenic survival curve, with the 50% EBR increasing from 1.281 to 1.571. Altogether,
these results strongly suggested that the initial effect of AGuIX® was in part subdued by the
endogenous high level of antioxidant defenses of SQ20B cells. In view of the results obtained
and with regards to the involvement of oxidative stress in the radiosensitization process, a
simultaneous antioxidant treatment with AGuIX® and radiation should perhaps be evaluated in
vivo to improve this radiosensitizing strategy. However, this should be done with extreme
caution since we may keep in mind that antioxidant activity can have divergent effects on
cancer cells depending on the cellular context.
Concerning mitochondria, no significant differences were observed after the combined
treatment versus radiation alone, either through the loss of in the mitochondrial membrane
potential or the amount of mROS generated. Another functional test was the measurement of
the common deletion of mtDNA, an early oxidative stress marker for which an increase was
obtained, 72 hours after a 4 Gy irradiation.
Considering DNA damage, although no differences were noted for the amount of initial
double strand breaks (DSBs), i.e 30 minutes after a 2Gy irradiation, a significant increase of
residual complex DSBs was obtained after the combined treatment as evidenced by the number
of cells displaying more than 50 foci/nucleus which was significantly increased after AGuIX®
treatment compared to radiation alone (45 nuclei with 50 or more foci/nucleus versus 23 nuclei
with 50 or more foci/nucleus). These results confirm those obtained through the clonogenic
survival curve (see the increase of the α parameter) namely that AGuIX® treatment results in
the persistence of more complex and lethal DSBs compared to radiation alone.
Apoptosis, necrosis, mitotic catastrophe, senescence, and autophagy are classically the five
types of cell deaths involved after radiation exposure. Our results showed that apoptosis,
necrosis, mitotic catastrophe and senescence remained unchanged after the combined
treatment compared to radiation alone. Autophagy/autophagic cell death was only cell death
pathway that was specifically triggered after pre-treatment with of AGuIX® before radiation.
This result is intriguing, as autophagy is a double-edged sword in radiotherapy and cancer in

Conclusion & Perspectives
259
general, with cytotoxic as well as cytoprotective roles. Further investigations should be
undertaken for a better understanding of this finding.
In order to investigate more deeply how radiosensitization via AGuIX® could occur, a
preliminary proteomic approach was initiated in order to highlight some subcellular targets
potentially involved. After setting a selective cut-off, this approach allowed us to highlight 16
proteins that were at least 5 times over- or under-expressed when SQ20B cells were treated
with AGuIX®. Among these, the ribonucleoside-diphosphate reductase (RNR) also known
as ribonucleoside diphosphate reductase (rNDP) caught our attention because it is
an enzyme that catalyzes the formation of deoxyribonucleotides from ribonucleotides and that
play a fundamental role in the maintenance of a constant deoxyribonucleotides cellular content
for cell division and DNA repair. Moreover, this protein has already been suggested as a
promising prognostic and predictive biomarker in many different types of cancer: generally, its
over-expression is attributed to a bad prognosis (increase of drug resistance, increase in
angiogenic and invasive potential of cancer cells). Therefore, it’s under-expression after AGuIX®
+ radiation, could be a hypothesis to explain how AGuIX® combined to radiation can
radiosensitize SQ20B cells. Confirmation of these results by Western blotting experiments is
currently under investigation.
To summarize the results obtained during the course of this study, we can state the
following: we have demonstrated that the new formulation of AGuIX® designed with DOTA as a
chelating agent are able to radiosensitize SQ20B, an HNSCC cell line, via the induction of
intracellular ROS which strengthens the radiation effect. Once taken up by cells, AGuIX® largely
accumulated in lysosomes and resulted in the generation of complex DNA damage. Moreover,
autophagy and/or autophagic cell death appears to mediate the effectiveness of this treatment
combination. The proteomic analysis allowed the isolation of a potential target with great
promise, the ribonucleoside-diphosphate reductase. It clearly seems that the radiosensitizing
effect observed results from a combination of events. The results obtained during this PhD
thesis are summarized in the figure below. However, future studies are required to understand
the mechanisms linking lysosomes-entrapped AGuIX® with the upregulation of
autophagy/autophagic cell death after radiation. It clearly seems that the effect observed
results from a combination of events leading to the radiosensitization of HNSCC and certainly
not only via one mechanism. These results should also be confirmed in other radioresistant
HNSCC cell lines before in vivo studies. The proteomic study should also be strengthened by
taking into account the other over- and under-expressed proteins in this radiosensitizing
protocol.

Conclusion & Perspectives
260
Figure 112: Schematic representations of results obtained following irradiation versus irradiation +
AGuIX® treatment.
Although there are still many questions remaining unclear and needing further investigation,
this PhD shed, at least some light, into the potential mechanisms involved in the
radiosensitization of SQ20B by AGuIX® nanoparticles, an essential step to move towards more
clinical trials.

261
Résumé Français

262
Résumé Français
263
Introduction
Les cancers des Voies Aérodigestives Supérieures (VADS) représentent un souci majeur de
santé, classés au 6eme rang par ordre de fréquence. Près de 600 000 nouveaux cas sont
diagnostiqués par an, et ceux-ci sont responsables de 350 000 morts au niveau mondial. Leurs
taux de survie à 5 ans est inférieur à 50% : ce faible taux est dû à leur radioresistance
intrinsèque et leur forte probabilité de récurrence. La majorité des cas de ces cancers
représente des carcinomes de cellules squameuses et regroupe l’ensemble des cancers de la
cavité buccale, l’oropharynx, hypopharynx ainsi que les sinus de la face. Les principaux facteurs
de risques de ces cancers incluent notamment le tabac, l’alcool, et plus récemment, l’infection
par le virus HPV (Human Papilloma Virus) a été identifié comme cause. Les traitements en
vigueur incluent la chimiothérapie, la radiothérapie, ou la chirurgie, ou une combinaison entre
ces différents traitements. Le choix du traitement dépendra de la phase à laquelle le patient est
diagnostiqué (Stade I/II versus stades plus avancés du cancer). Les avancées récentes visent
donc le développement de stratégies radiosensibilisantes, les nanotechnologies représentant
actuellement un axe de recherche prometteur.
Parmi ces nanotechnologies, l’utilisation de nanoparticules comme agent radiosensibilisant
est très étudié, du fait de leurs très intéressantes propriétés physico-chimiques. Tout d’abord,
leur petite taille et leur rapport surface/volume permettent d’augmenter la dose d’irradiation
reçue par les cellules tumorales tout en épargnant les tissus sains avoisinants. Au cours de ce
travail, nous avons utilisé des nanoparticules à base de gadolinium, les AGuIX®, qui sont
composées d’un squelette de silice, avec des fonctions amine (NH2) sur lesquelles sont greffées
des ions de gadolinium avec une molécule hautement chélatrice, le DOTAGA. Elles possèdent
de multiples propriétés, essentielles pour être utilisées comme agent radiosensibilisant : une
petite taille (entre 2-5 nm de diamètre hydrodynamique), une stabilité colloïdale élevée, une
bonne chélation du gadolinium, une absence de toxicité in vivo ainsi qu’une excellente
excrétion rénale. De plus, ces nanoparticules sont biocompatibles et peuvent être injectées par
voie intra-veineuse. Leur petite taille devrait optimiser leur pouvoir radiosensibilisant par un
effet EPR élevé, ce qui permet d’augmenter la dose locale dans la tumeur tout en épargnant le
tissu sain. De plus, les AGuIX® peuvent être utilisées en tant qu’agent de contraste pour l’IRM,
ce qui en fait un excellent agent théranostique (utilisation pour le diagnostic et la thérapie).
L’hypothèse mécanistique sur laquelle se base l’effet radiosensibilisant des nanoparticules à
base de Z élevé est la suivante : les AGuIX® étant composées de nombreux atomes de
gadolinium, entre 7 et 10 par nanoparticules, l’irradiation devrait entraîner une surproduction
d’électrons secondaires ainsi que des cascades d’électrons Auger, et donc un dépôt dose locale
très élevé (de l’ordre de centaines de Gray) à proximité des AGuIX®. Ceci se traduit ensuite par
une forte augmentation des radicaux libres oxygénés (RLO), qui exerceront leur effet délétère

Résumé Français
264
sur de multiples cibles subcellulaires (protéines, lipides, ADN …) avec pour conséquence
l’activation de diverses voies de mort cellulaires. Cette hypothèse se base pour l’instant
essentiellement sur des résultats obtenus à l’aide de modèles théoriques et il est donc
important de les valider tout d’abord sur des modèles cellulaires tumoraux. Le but de cette
thèse a donc été est donc de démontrer l’efficacité des AGuIX® en tant qu’agent
radiosensibilisant dans les cancers des VADS tout en essayant de comprendre les mécanismes
de réponse de la cellule à ce traitement.
Ce travail a été réalisé sur une lignée cellulaire des cancers des VADS radiorésistante (SF2Gy=
0.72), les SQ20B J.L. Les nanoparticules utilisées sont donc les AGuIX®, et un irradiateur X-Rad
320 (Energie : 250 kV, 2Gy/min, intensité : 15 mA) pour l’irradiation photonique a été utilisé. Ce
travail a été divisé en quatre parties. La première a consisté à déterminer et valider sur notre
modèle les conditions expérimentales optimales de radiosensibilisation par les AGuIX® et de
préciser leur localisation subcellulaire après internalisation. Dans la suivante, nous avons voulu
vérifier sur ce modèle cellulaire si le traitement combiné génère effectivement une
surproduction de RLO, ceci à l’échelle de la mitochondrie mais également de la cellule entière.
Une optimisation du traitement combiné AGuIX®/irradiation a également été testée, la lignée
résistante SQ20B étant particulièrement bien protégée contre le stress oxydant. Ensuite, nous
avons recherché si un type de mort cellulaire radio-induite apoptose, nécrose, catastrophe
mitotique, senescence, ou autophagie) était augmenté ou bien spécifiquement déclenché par le
traitement combiné. Comme conséquences de l’irradiation, différents dommages de l’ADN ont
été étudiés et quantifiés : les cassures simples brins, les dommages oxydatifs (mesure de la 8-
oxo-guanine) ainsi que les cassures doubles brins qui sont les cassures les plus létales. Enfin,
une approche préliminaire de protéomique a été initiée afin d’identifier des cibles moléculaires
potentielles impliquées dans cette radiosensibilisation.
Les résultats obtenus sont divisés en cinq chapitres, avec des explications condensées qui
sont accompagnés, pour certains chapitres, par une figure récapitulative des résultats majeurs
obtenus.
Chapitre I : Caractérisation de l’effet radiosensibilisant des AGuIX®
Après avoir testé différents temps d’incubation et différentes concentrations d’AGuIX®, un
traitement des cellules SQ20B avec à une concentration de 0.8 mM de Gd pendant 24 heures
s’est révélé être celui donnant l’effet radiosensibilisant le plus satisfaisant. De plus, en absence
d’irradiation, les AGuIX® ne sont pas toxiques, ni à l’échelle cellulaire, ni à l’échelle
mitochondriale. Une fois internalisées, les AGuIX® sont presque exclusivement localisées dans
les lysosomes ; aucune colocalisation avec le noyau ou bien les mitochondries n’ayant été

Résumé Français
265
observée par microscopie confocale. Ces résultats sont représentés dans la Figure 114 ci-
dessous.
Figure 113: Effet radiosensibilisant des AGuIX® et leurs localisations subcellulaires. A. Courbe de survie clonogénique des SQ20B J.L. 0-10 Gy suite à un traitement de 0.8mM Gd pendant 24h dans du DMEM-Glutamax sans sérum de veau fœtal. (Bleu : 0mM Gd ; rouge : 0.8 mM Gd) ; B-D : Internalisation des AGuIX®-Cya5.5 (rouge) en microscopie confocal de fluorescence, 60X par rapport aux B. noyaux (DAPI : bleue) ; C. mitochondries (Mitotracker-Vert) ; et D. lysosomes (Lysotracker-Vert). Ces images sont représentatives de plus de 200 cellules.
Chapitre II : Etude du stress oxydant induit par le traitement combiné AGuIX® + I.R. et ses
conséquences fonctionnelles sur l’activité mitochondriale.
Une étude cinétique des radicaux libres oxygénées (RLO) cytosoliques (RLOc) et
mitochondriaux (RLO)m a ensuite été réalisée après une irradiation à 10Gy pour vérifier si

Résumé Français
266
l’hypothèse mécanistique évoquée précédemment au cours des études théoriques permettait
d’expliquer l’effet radiosensibilisant, ou son déclenchement, obtenu après traitement par les
AGuIX®. Nous avons montré que la différence entre l’irradiation seul et le traitement combiné
(AGuIX® + irradiation) était minime à la fois pour les RLOc et RLOm. Ces résultats nous ont
surpris, compte-tenu de l’effet radiosensibilisant obtenu. Cependant, il est bien connu que les
cellules cancéreuses radiorésistantes sont le plus souvent très bien protégées par un
équipement anti-oxydant très performant qui leur permet de détoxifier tout ou partie des RLO
radio-induits. En ce sens, une étude, faite préalablement au sein du laboratoire, avait démontré
que les cellules SQ20B possède un taux endogène de glutathion très élevé. A l’aide d’un
traitement pharmacologique (association DMF + BSO) permettant de dépléter la cellule de son
contenu en glutathion après traitement avec les nanoparticules, 4 heures avant irradiation. Une
étude cinétique de la production de RLO à des temps courts, de 0 minute à 4 heures, puis plus
longs jusqu’à 72 heures, a ensuite été réalisée. Dans ces conditions, nous avons mettre en
évidence une nette augmentation des RLOc a été observée juste après irradiation,
augmentation encore plus nette avec le après pré-traitement par les AGuIX®. Après diminution
une deuxième vague de RLOc apparait une heure et quatre heures après irradiation.
Concernant les RLOm, l’augmentation est nette, tout de suite après irradiation mais aucune
différence n’a été obtenue entre l’irradiation seule et le traitement combiné. Cela vient
probablement du fait que les nanoparticules ne sont pas internalisées par les mitochondries, les
RLO mesurés provenant uniquement de la radiolyse de l’eau. Grâce à ses expériences de
déplétion, nous pouvons donc conclure, que les RLO jouent bien un rôle dans la
radiosensibilisation observée, celle-ci étant minimisée dans la cellule en conditions basales, du
fait de ses défenses antioxydantes élevées. Une courbe de survie cellulaire clonogénique a été
faite après déplétion en glutathion : les résultats montrent que, le 50% EBR passe de 1.281 à
1.571. Les résultats obtenus pour les RLOc sont représentés dans la Figure 115.
Les tests fonctionnels mitochondriales n’ont montré aucun changement significatif entre
irradiation seule et AGuIX® + irradiation, comme en témoigne la chute du potentiel
membranaire mitochondrial obtenue après irradiation Par contre, en ce qui concerne la
délétion commune de l’ADN mitochondrial, 72 heures après une irradiation de 4Gy, le ratio
ADNmt délété/ADNmt total a augmenté de 2.93, ce qui est une différence significative entre
l’irradiation seule et le traitement combiné. Ce résultat est donc un élément supplémentaire
confirmant l’implication des RLO dans l’effet radiosensibilisant des AGuIX®.

Résumé Français
267
Figure 114: Etude cinétique (0-72h) des RLO cytosolique (RLOc) mesurée en cyrtométrie de flux (LSRII flow cytometer, BD Biosciences) en utilisant la sonde CM-H2DCFA, normalisée par rapport aux cellules non-traitées et non-irradiées. A. Sans déplétion de glutathion. B. Avec déplétion de glutathion.
Chapitre III : Etude des différents types de mort cellulaires radio-induites par le traitement
combiné AGuIX® + I.R.
Comme il a été démontré avec la courbe de survie clonogénique, le traitement des SQ20B
J.L. avec les nanoparticules AGuIX® combiné à l’irradiation photonique augmente la mort des

Résumé Français
268
cellules SQ20B, dont le type était à préciser. Cinq types de morts radio-induites ont été étudiés
au cours de cette thèse : l’apoptose, la nécrose, la catastrophe mitotique, la senescence, et
enfin l’autophagie. Aucune différence significative n’a été trouvée entre l’irradiation seule et le
traitement combiné pour ces différents types de mort à l’exception de l’autophagie. Nous
avons donc démontré que le traitement par les AGuIX® avant irradiation augmente de façon
spécifique l’autophagie et/ou la mort cellulaire autophagique. La Figure 116 illustre ce résultat
(quantification du Western Blot du LC3B et confirmation par microscopie confocale).
Figure 115: Augmentation de la mort cellulaire par autophagie suite au traitement combiné (AGuIX® + irradiation). A. Quantification par Western Blot de l’expression de LC3B en fonction des protéines totales de 24 à 192 heures après une irradiation de 10Gy. B. Photo de microscopie, a 10X, 10 Gy versus 10 Gy + 0.8mM Gd 0, 24, et 192 après irradiation. (Bleu : DAPI ; Vert : LC3B-Alexa Fluor 488).

Résumé Français
269
Chapitre IV : Etude des dommages induit à l’ADN par les AGuIX® combinées à l’irradiation.
Au cours de cette thèse, plusieurs dommages radio-induits ont été étudiés : les cassures
simples brins, les dommages oxydatifs (8-oxo-guanine, de façon qualitative avec le test des
comets + FPG et de façon quantitative en HPLC MS/MS) ainsi que les cassures double-brins. En
ce qui concerne les cassures simple-brin, aucune différence entre l’irradiation seul et le
traitement combiné n’a été relevée. Pour la mesure des 8-oxo-guanines, alors qu’une
augmentation de ces dernières avaient été mise en évidence avec l’enzyme FPG, nous n’avons
valider quantitativement ces résultats par HPLC-MS. Enfin, en ce qui concerne les cassures
double-brins, aucune différence n’a été obtenue pour les cassures initiales (T=30 min). Pour les
cassures résiduelles à 24h, une augmentation importante des CDBs résiduelles complexes
(présentant plus de 50 foci par noyau) a été observée après pré-traitement par les AGuIX®, un
résultat parfaitement corrélé avec l’augmentation du paramètre α obtenu par la courbe de
survie clonogénique. Ces résultats sont représentés dans la Figure 117B.

Résumé Français
270
Figure 116: Mesure des cassures doubles brins de l’ADN (γH2Ax). A. Image représentative des CDBs suite aux différents traitements, bleu : noyau (DAPI), vert : γH2Ax. B. Quantification du nombre de CDBs complexes résiduelles (24h après irradiation), suite à 2Gy, 0 (gris) vs. 0.8 mM Gd, exprimée en fonction du nombre de noyau contenant x nombre de foci.
Chapitre V : Etude Protéomique- expériences préliminaires
L’étude protéomique, quoique préliminaire, s’est révélée montrée très informative. Selon le
cut-off choisi, et avec les outils de bio-informatiques, plusieurs voies de signalisation se sont
révélées comme étant potentiellement modulées après traitement par les AGuIX® et
l’irradiation. Une des voies avec plusieurs protéines impliquées (sur- ou sous-expression de
20%) concerne le métabolisme cellulaire. En outre, 72 protéines mitochondriales et 39

Résumé Français
271
protéines impliquées dans les défenses antioxydantes ont été modulées. Avec un cut-off
beaucoup plus sélectif (facteur minimum de 5), l’étude a permis de mettre en évidence 16
protéines différentiellement exprimées après traitement combiné. Parmi elles, une a retenu
notre attention : la ribonucléotide réductase qui est significativement sous-exprimée dans nos
conditions expérimentales. En effet, la surexpression de cette protéine est connue comme
étant la plupart du temps liée à un mauvais pronostic, ceci dans de nombreux cancers. Du fait
de sa fonction biologique, à savoir la fourniture de désoxyribonucléotides pour la synthèse
et/ou la réparation de l’ADN, sa sous-expression suite au traitement combiné serait une piste
permettant de mieux comprendre la radiosensibilisation par les AGuIX®.
Conclusion
L’utilisation de nanoparticules AGuIX® en tant qu’agent radiosensibilisant a été démontrée
et validée sur une lignée radiorésistance des cancers VADS, les SQ20B. Cette effet
radiosensibilisant est le résultat d’une induction de RLO qui a renforcé l’effet de l’irradiation.
Les AGuIX® internalisées sont localisées majoritairement dans les lysosomes et l’effet combiné
du traitement des AGuIX® avec l’irradiation a induit des cassures double brins de l’ADN
résiduelles et plus complexes. L’autophagie et/ou la mort autophagique expliquerait
l’augmentation de l’effet délétère de l’irradiation induit par les AGuIX®. Le lien entre
l’internalisation des AGuIX® dans les lysosomes et le déclenchement de la mort par autophagie
sera la prochaine étape dans la compréhension des résultats déjà obtenus. De plus, l’étude
protéomique initiée au cours cette étude, a permis d’isoler une protéine en particulier, la
ribonucléotide réductase, qui semblerait jouer un rôle important dans la radiosensibilisation
des AGuIX® dans les cancers des VADS. La confirmation des résultats obtenus par d’autres
méthodes (WB) constitue également un axe majeur dans la poursuite de ce travail.

272

273
Bibliography References

274

Bibliography References
275
A Alarifi S, Ali H, Alkahtani S, Alessia MS. Regulation of apoptosis through bcl-2/bax proteins
expression and DNA damage by nano-sized gadolinium oxide. Int J Nanomedicine
2017;12:4541–51.
Alevizos I, Mahadevappa M, Zhang X, Ohyama H, Kohno Y, Posner M, et al. Oral cancer in vivo
gene expression profiling assisted by laser capture microdissection and microarray analysis.
Oncogene 2001;20:6196-204.
Alexeyev M, Shokolenko I, Wilson G, Ledoux S. The maintenance of mitochondrial DNA integrity—critical analysis and update. Cold Spring Harb Perspect Biol 2013;5:a012641. Alphonse G, Aloy MT, Broquet P, Gerard JP, Louisot P, Rousson R, et al. Ceramide induces activation of the mitochondrial/caspases pathway in Jurkat and SCC61 cells sensitive to gamma-radiation but activation of this sequence is defective in radioresistant SQ20B cells. Int J Radiat Biol 2002;78:821-35. Alphonse G, Bionda C, Aloy MT, Ardail D, Rousson R, Rodriguez-Lafrasse C. Overcoming resistance to gamma-rays in squamous carcinoma cells by poly-drug elevation of ceramide levels. Oncogene 2004;23:2703-15. Alphonse G, Maalouf M, Battiston-Montagne P, Ardail D, Beuve M, Rousson R, et al. p53-independent early and late apoptosis mediated by ceramde after exposure of tumor cells to photon or carbon ion irradiation. BMC Cancer 2013;13:151. Al-Sarraf M. Chemotherapeutic management of head and neck cancer. Cancer Metast Rev
1987;6:191-8.
Ames BN, Shigenaga MK, Gold LS. DNA lesions, inducible DNA repair, and cell division: three key factors in mutagenesis and carcinogenesis. Environ Health Perspect 1993;101 Suppl 5:35-44. Andtbacka RHI, Collichio FA, Amatruda T, Senzer NN, Chesney J, Delman KA, et al. OPTiM : a
randomized phase III trial of talimogene laherparepvec (T-VEC) versus subcutaneous (SC)
granulocyte-macrophage colony-stimulating factor (GM-CSF) for the treatment (tx) of
unresected stage IIIB/C and IV melanoma. J Clin Oncol 2013;31.
Ang KK, Berkey BA, Tu X, Zhang HZ, Katz R, Hammond EH, et al. Impact of epidermal growth
factor receptor expression on survival and pattern of relapse in patients with advanced head
and neck carcinoma. Cancer Res 2002;62:7350-6.
Bibliography References
276
Ang KK, Zhang Q, Rosenthal DI, Nguyen-Tan PF, Sherman EJ, Weber RS, et al. Randomized phase III trial of concurrent accelerated radiation plus cisplatin with or without cetuximab for stage III to IV head and neck carcinoma: RTOG 0522. J Clin Oncol 2014;32:2940-2950. Aredia F, Guaman Ortiz LM, Giansanti V, Scovassi AI. Autophagy and Cancer. Cells 2012;1:520-
34.
Armand JP, Couteau C. Chemotherapy in head and neck cancer. Eur J Cancer 1995 ;31:819-22.
Azzam EI, Jay-Gerin JP, Pain D. Ionizing radiation-induced metabolic oxidative stress and prolonged cell injury. Cancer Lett 2012;327:48–60.
B Baird SK, Kurz T, Brunk UT. Metallothionein protects against oxidative stress induced lysosomal
destabilization. Biochem J 2006;394:275–83.
Barazzuol L, Jeynes JC, Merchant MJ, Wéra AC, Barry MA, Kirkby KJ, et al. Radiosensitization of glioblastoma cells using a histone deacetylase inhibitor (SAHA) comparing carbon ions with X-rays. Int J Radiat Biol 2015;91:90-8. Barenholz Y. Doxil®—the first FDA-approved nano-drug: lessons learned. J Control Release 2012;160:117–34. Barton KL, Misuraca K, Cordero F, Dobrikova E, Min HD, Gromeier M, Kirsch DG, et al. PD-0332991, a CDK4/6 inhibitor, significantly prolongs survival in a genetically engineered mouse model of brainstem glioma. PLoS ONE 2013;8:e77639. Baskar R et al. Cancer and radiation therapy: current advances and future directions. Int J Med
Sci 2012;9:193-9.
Belcaid Z, Phallen JA, Zeng J, See AP, Mathios D, Gottschalk C, et al. Focal radiation therapy
combined with 4-1BB activation and CTLA-4 blockade yields long-term survival and a protective
antigen-specific memory response in a murine glioma model. PLoS One 2014;9:e101764.
Berbeco RI, Korideck H, Ngwa W, Kumar R, Patel J, Sridhar S, et al. DNA damage enhancement from gold nanoparticles for clinical MV photon beams. Radiat Res 2012;178:604-8.

Bibliography References
277
Berghauser Pont LM, Spoor JK, Venkatesan S, Swagemakers S, Kloezeman JJ, Dirven CM, et al. The Bcl-2 inhibitor Obatoclax overcomes resistance to histone deacetylase inhibitors SAHA and LBH589 as radiosensitizers in patient-derived glioblastoma stem-like cells. Genes Cancer 2014;5:445-59. Bergs JW, Wacker MG, Hehlgans S, Piiper A, Multhoff G, Rödel G, et al. The role of recent nanotechnology in enhancing the efficacy of radiation therapy. Biochim Biophys Acta 2015;1856:130-43. Bernier J, Domenge C, Ozsahin M, Matuszewska K, Lefèbvre JL, Greiner RH, et al. Postoperative
irradiation with or without concomitant chemotherapy for locally advanced head and neck
cancer. N Engl J Med 2004;350:1945-52.
Berroud A, Le Roy A, Voisin P. Membrane oxidative damage induced by ionizing radiation detected by fluorescence polarization. Radiat Environ Biophys 1996;35:289-95. Bertrand G, Maalouf M, Boivin A, Battiston-Montagne P, Beuve M, Levy A, et al. Targeting head and neck cancer stem cells to overcome resistance to photon and carbon ion radiation. Stem Cell Rev 2014;10:114-26. Beuve M, Alphonse G, Maalouf M, Colliaux A, Battiston-Montagne P, Jalade P, et al. Radiobiologic parameters and local effect model predictions for head-and-neck squamous cell carcinomas exposed to high linear energy transfer ions. Int J Radiat Oncol Biol Phys 2008;71:635-42. Bhandarkar SS, Jaconi M, Fried LE, Bonner MY, Lefkove B, Govindarajan B, et al. Fulvene-5 potently inhibits NADPH oxidase 4 and blocks the growth of endothelial tumors in mice. J Clin Invest 2009;119:2359-65. Bharali DJ, Lucey DW, Jayakumar H, Pudavar HE, Prasad PN. Folate-receptor-mediated delivery of InP quantum dots for bioimaging using confocal and two-photon microscopy. J Am Chem Soc 2005;127:11364–71. Biagi BA, Enyeart JJ. Gadolinium blocks low-and high-threshold calcium currents in pituitary cells. Am J Physiol 1990;259:C515-20. Bianchi A, Dufort S, Lux F, Courtois A, Tillement O, Coll JL, et al. Quantitative biodistribution and
pharmacokinetics of multimodal gadolinium-based nanoparticles for lungs using ultrashort TE
MRI. MAGMA 2014;27:303-16.
Bibliography References
278
Biddlestone-Thorpe L, Sajjad M, Rosenberg E, Beckta JM, Valerie NC, Tokarz M, et al. ATM kinase inhibition preferentially sensitizes p53-mutant glioma to ionizing radiation. Clin Cancer Res 2013;19:3189-200. Bienert GP, Møller AL, Kristiansen KA, Schulz A, Møller IM, Schjoerring JK et al. Specific aquaporins facilitate the diffusion of hydrogen peroxide across membranes. J Biol Chem 2007;282:1183-92. Bier H, Hoffmann T, Hauser U, Wink M, Ochler M, Kovar A, et al. Clinical trial with escalating
doses of the antiepidermal growth factor receptor humanized monoclonal antibody EMD
72 000 in patients with advanced squamous cell carcinoma of the larynx and hypopharynx.
Cancer Chemother Pharmacol 2001;47:519-24.
Bindhu OS, Ramadas K, Sebastian P, Pillai MR. High expression levels of nuclear factor kappa B
and gelatinases in the tumorigenesis of oral squamous cell carcinoma. Head Neck 2006;28:916-
25.
Bionda C, Athias A, Poncet D, Alphonse G, Guezquez A, Gambert P, et al. Differential regulation of cell death in head and neck cell carcinoma through alteration of cholesterol levels in lipid rafts microdomains. Biochem Pharmacol 2008;75:761-72. Biskup S and Moore DJ. Detrimental deletions: mitochondria, aging and Parkinson's disease. Bioessays 2006;28:963–7. Blasco MA, Svider PF, Raza SN, Jacobs JR, Folbe AJ, Saraf P, et al. Systemic therapy for head and
neck squamous cell carcinoma: Historical perspectives and recent breakthroughs. Laryngoscope
2017;127:2565-69.
Boeckx C, Baay M, Wouters A, Specenier P, Vermorken JB, Peeters M, et al. Anti-epidermal
growth factor receptor therapy in Head and Neck Squamous Cell Carcinoma: Focus on potential
molecular mechanisms of drug resistance. Oncologist 2013;18:850-64.
Boivin A, Hanot M, Malesys C, Maalouf M, Rousson R, Rodriguez-Lafrasse C, et al. Transient alteration of cellular redox buffering before irradiation triggers apoptosis in head and neck carcinoma stem and non-stem cells. PLoS One 2011;6:e14558. Bonner JA, Harari PM, Giralt J, Azarnia N, Shin DM, Cohen RB, et al. Radiotherapy plus
cetuximab for squamous-cell carcinoma of the head and neck. N Engl J Med 2006;354:567-78.
Bonner JA, Harari PM, Giralt J, Cohen RB, Jones CU, Sur RK, et al. Radiotherapy plus cetuximab
for locoregionally advanced head and neck cancer: 5-year survival data from a phase 3
Bibliography References
279
randomized trial, and relation between cetuximab-induced rash and survival. Lancet Oncol
2010;11:21-8.
Bonner JA, Trummell HQ, Willey CD, Plants BA, Raisch KP. Inhibition of STAT-3 results in radiosensitization of human squamous cell carcinoma. Radiother Oncol 2009;92:339-44. Borst GR, McLaughlin M, Kyula JN, Neijenhuis S, Khan A, Good J, et al. Targeted radiosensitization by the Chk1 inhibitor SAR-020106. Int J Radiat Oncol Biol Phys 2013;85:1110-8. Bourhis J, Overgaard J, Audry H, Ang KK, Saunders M, Bernier J, et al. Hyperfractionated or
accelerated radiotherapy in head and neck cancer: a meta-analysis. Lancet 2006;368:843-54.
Boveris A, Cadenas E, Stoppani AO. Role of ubiquinone in the mitochondrial generation of hydrogen peroxide. Biochem J 1976;156:435–44. Boyle JO, Hakim J, Koch W, van der Riet P, Hruban RH, Roa RA, et al. The incidence of p53
mutations increases with progression of head and neck cancer. Cancer Res 1993;53:4477-80.
Bradley JD, Paulus R, Komaki R, Masters G, Blumenschein G, Schild S, et al. Standard-dose versus high-dose conformal radiotherapy with concurrent and consolidation carboplatin plus paclitaxel with or without cetuximab for patients with stage iiia or iiib non-small-cell lung cancer (RTOG 0617): a randomised, two-by-two factorial phase 3 study. Lancet Oncol 2015;16:187-199. Brand MP. The sites and topology of mitochondrial superoxide production. Exp Gerontol 2010;45:466-72. Breitbach CJ, Burke J, Jonker D, Stephenson J, Haas AR, Chow LQM et al. Intra-venous delivery
of a multi-mechanistic cancer-targeted oncolytic poxyvirus in humans. Nature 2011;477:99-102.
Brown EJ, Baltimore D. Essential and dispensable roles of ATR in cell cycle arrest and genome
maintenance. Genes Dev 2003;17:615-28.
Brown JM, Carlson DJ, Brenner DJ. The tumor radiobiology of SRS and SBRT: are more than the
5 Rs involved? Int J Radiat Oncol Biol Phys 2014;88:254-62.
Bibliography References
280
Budach V, Stuschke M, Budach W, Baumann M, Geismar D, Grabenbauer G, et al.
Hyperfractionated accelerated chemoradiation with concurrent fluorouracil-mitomycin is more
effective than dose-escalated hyperfractionated accelerated radiation therapy alone in locally
advanced head and neck cancer: final results of the radiotherapy cooperative clinical trials
group of the German Cancer Society 95-06 Prospective Randomized Trial. J Clin Oncol
2005;23:1125-35.
Burma S, Chen DJ. Role of DNA-PK in the cellular response to DNA double-strand breaks. DNA
Repair (Amst) 2004;3:909-18.
Butterworth KT, Coulter JA, Jain S, Forker J, McMahon SJ, Schettino G, et al. Evaluation of cytotoxicity and radiation enhancement using 1.9 nm gold particles: potential application for cancer therapy. Nanotechnology 2010;21:295101. Butterworth KT, McMahon SJ, Currell FJ, Prise KM. Physical basis and biological mechanisms of
gold nanoparticle radiosensitization. Nanoscale 2012;4:4830-8.
C Cabodi S, del Pilar Camacho-Leal M, Di Stefano P, Defilippi P. Integrin signaling adaptors: not only figurants in the cancer story. Nat Rev Cancer 2010;10:858–70. Cadenas E, Davies KJ. Mitochondrial free radical generation, oxidative stress, and aging. Free Radic Biol Med 2000;29:222–30. Cain K, Bratton SB, Langlais C, Walker G, Brown DG, Sun XM, et al. APAF-1 oligomerizes into biologically active approximately 700-kDa and inactive approximately 1.4-MDa apoptosome complexes. J Biol Chem 2000;275:6067–70. Cain K, Brown DG, Langlais C, Cohen GM. Caspase activation involves the formation of the aposome, a large (approximately 700 kDa) caspase-activating complex. J Biol Chem 1999;274:22686–92. Califano J, van der Riet P, Westra W, Nawroz H, Clayman G, Piantadosi S, et al. Genetic
progression model for head and neck cancer: implications for field cancerization. Cancer Res
1996;56:2488-92.
Campus France (campusfrance.org) La recherche en nanosciences en France. 2013.

Bibliography References
281
Canetta R, Rozencweig M, Carter SK. Carboplatin: the clinical spectrum to date. Cancer Treat
Rev 1985:12:125-36.
Cantley LC. The phosphoinositide 3-kinase pathway. Science 2002;296:1655-7. Carducci MA, Musib L, Kies MS, Pili R, Truong M, Brahmer JR, et al. Phase I dose escalation and
pharmacokinetic study of enzastaurin, an oral protein kinase C beta inhibitor, in patients with
advanced cancer. J Clin Oncol 2006;24:4092-9.
Carter JD, Cheng NN, Qu Y, Suarez GD, Guo T. Nanoscale energy deposition by X-ray absorbing nanostructures. J Phys Chem, B 2007;111:11622–11625. Castedo M, Perfettini JL, Roumier T, Andreau K, Medema R, Kroemer G. Cell death by mitotic catastrophe: A molecular definition. Oncogene 2004;23:2825–37. Cen L, Carlson BL, Schroeder MA, Ostrem JL, Kitange GJ, Mladek AC, et al. p16-CDK4-RB axis controls sensitivity to a cyclin-dependent kinase inhibitor. PD0332991 in glioblastoma xenograft cells. Neuro Oncol 2012;14:870–881. Chan S, Davidson N, Juozaityte E, Erdkamp F, Pluzanska A, Azarnia N, et al. Phase III trial of liposomal doxorubicin and cyclophosphamide compared with epirubicin and cyclophosphamide as first-line therapy formetastatic breast cancer. Ann Oncol 2004;15:1527–1534. Chang HW, Kim SY, Yi SL, Son SH, Song DY, Moon SY, et al. Expression of Ku80 correlates with
sensitivities to radiation in cancer cell lines of the head and neck. Oral Oncol 2006;42:979-86.
Chang MY, Shiau AL, Chen YH, Chang CJ, Chen HH, Wu CL. Increased apoptotic potential and dose-enhancing effect of gold nanoparticles in combination with single-dose clinical electron beams on tumor-bearing mice. Cancer Sci 2008;99:1479–84. Chang HW, Roh JL, Jeong EJ, Lee SQ, Kim SW, Choi SH, et al. Wnt signaling controls
radiosensitivity via cyclooxygenase-2-mediated Ku expression in head and neck cancer. Int J
Cancer 2008;122:100-7.
Chattopadhyay N, Cai Z, Kwon YL, Lechtman E, Pignol JP, Reilly RM. Molecularly targeted gold nanoparticles enhance the radiation response of breast cancer cells and tumor xenografts to X-radiation. Breast Cancer Res Treat 2013;137:81–91. Chen F, Zhang XH, Hu XD, Liu PD, Zhang HQ. The effects of combined selenium nanoparticles and radiation therapy on breast cancer cells in vitro. Artif Cells Nanomed Biotechnol 2017;7:1-12.

Bibliography References
282
Chen N, Yang WT, Bao Y, Xu HL, Qin SB, Tu Y. Bsa capped Au nanoparticle as an efficient sensitizer for glioblastoma tumor radiation therapy. RSC Adv. 2015;5:40514–20. Chen WS, Yu YC, Lee YJ, Chen JH, Hsu HY, Chiu SJ. Depletion of securin induces senescence after irradiation and enhances radiosensitivity in human cancer cells regardless of functional p53 expression. Int J Radiat Oncol Biol Phys 2010;77:566–74. Chinot OL, Wick W, Mason W, Henriksson R, Sara F, Nishikawa R, et al. Bevacizumab plus radiotherapy-temozolomide for newly diagnosed glioblastoma. N Engl J Med 2014;370:709-722. Chithrani DB, Jelveh S, Jalali F, van Prooijen M, Allen C, Bristow RG, et al. Gold nanoparticles as radiation sensitizers in cancer therapy. Radiat Res 2010;173:719–28. Cho YS, Challa S, Moquin D, Genga R, Ray TD, Guildford M, et al. Phosphorylation-driven assembly of the RIP1–RIP3 complex regulates programmed necrosis and virus-induced inflammation. Cell 2009;137:1112–23. Chithrani BD, Jelveh S, Jalai F, van Prooijen M, Allen C, Bristow RG, et al. Gold nanoparticles as
radiation sensitizers in cancer therapy. Radiat Res 2010;173:719-28.
Chithrani DB, Dunne M, Stewart J, Allen C, Jaffray DA. Cellular uptake and transport of gold
nanoparticles incorporated in a liposomal carrier. Nanomedicine 2010;6:161-9.
Christmann M, Tomicic MT, Roos WP, Kaina B. Mechanisms of human DNA repair: an update.
Toxicology 2003;193:3-34.
Chun SG, Park H, Pandita RK, Horikoshi N, Pandita TK, Schwartz DL, et al. Targeted inhibition of histone deacetylases and hedgehog signaling suppress tumor growth and homologous recombination in aerodigestive cancers. Am J Cancer Res 2015;5:1337-52. Chung EJ, Brown AP, Asano H, Mandler M, Burgan WE, Carter D, et al. In vitro and in vivo radiosensitization with AZD6244 (ARRY-142886), an inhibitor of mitogen-activated protein kinase/extracellular signal-regulated kinase 1/2 kinase. Clin Cancer Res 2009;15:3050-7. Clarke RH, Moosa S, Anzivino M, Wang Y, Floyd DH, Purow BW, et al. Sustained radiosensitization of hypoxic glioma cells after oxygen pretreatment in an animal model of glioblastoma and in vitro models of tumor hypoxia. PLoS One 2014;9:e111199. Coelho T, Adams D, Silva A, Lozeron P, Hawkins PN, Mant T, et al. Safety and efficacy of RNAi therapy for transthyretin amyloidosis, N Engl J Med 2013;369:819–29.
Bibliography References
283
Cohen EE, Sharma MR, Janisch L, Llobrera M, House L, Wu K, et al. A phase I study of sirolimus
and bevacizumab in patients with advanced malignancies. Eur J Cancer 2011;47:1484-9.
Collado M, Blasco MA, Serrano M. Cellular senescence in cancer and aging. Cell 2007;130:223-
33.
Coleman CN, Mitchell JB. Clinical radiosensitization: why it does and does not work. J Clin Oncol
1999;17:1-3.
Conklin KA. Chemotherapy-associated oxidative stress: impact on chemotherapeutic effectiveness. Integr Cancer Ther 2004;3:294-300. Cooper JS, Pajak TF, Forastiere AA, Jacobs J, Campbell BH, Saxman SB, et al. Postoperative
concurrent radiotherapy and chemotherapy for high-risk squamous-cell carcinoma of the head
and neck. N Engl J Med 2004;350:1937-44.
Cordes N, Meineke V. Cell adhesion-mediated radioresistance (CAM-RR): extracellular matrix-dependent improvement of cell survival in human tumor and normal cells in vitro. Strahlenther Onkol 2003;179:337–344. Cordes N, Park CC. beta1 integrin as a molecular therapeutic target, Int J Radiat Biol 2007;83:753–60. Cordes N, Seidler J, Durzok R, Geinitz H., Brakebusch C. beta1-integrinmediated signaling essentially contributes to cell survival after radiation-induced genotoxic injury. Oncogene 2006;25:1378–90. Cordes N. Integrin-mediated cell-matrix interactions for prosurvival and antiapoptotic signaling after genotoxic injury. Cancer Lett 2006;242:11–19.
Cory S, Adams JM. The BCL2 family: Regulators of the cellular life-or-death switch. Nat Rev Cancer 2002;2:647–56. Coulter JA, Jain S, Butterworth KT, Taggart LE, Dickson GR, McMahon SJ, et al. Cell type-dependent uptake, localization, and cytotoxicity of 1.9 nm gold nanoparticles. Int J Nanomedicine 2012;7:2673–85. Couvreur P, Stella B, Reddy LH, Hillaireau H, Dubernet C, Desmaële D, et al. Squalenoyl nanomedicines as potential therapeutics. Nano Lett 2006;6:2544–48.

Bibliography References
284
Cui L, Zahedi P, Saraceno J, Bristow R, Jaffray D, Allen C. Neoplastic cell response to tiopronin-
coated gold nanoparticles. Nanomedicine 2013;9:264-73.
Cui L, Tse K, Zahedi P, Harding SM, Zafarana G, Jaffray DA, et al. Hypoxia and cellular localization influence the radiosensitizing effect of gold nanoparticles (aunps) in breast cancer cells. Radiat Res 2014;182:475–88. Cui L, Her S, Borst GR, Bristow RG, Jaffray DA, Allen C. Radiosensitization by gold nanoparticles:
Will they ever make it to the clinic? Radiother Oncol 2017;124:344-56.
D Dalby KN, Tekedereli I, Lopez-Berestein G, Ozpolat B. Targeting the prodeath and prosurvival functions of autophagy as novel therapeutic strategies in cancer. Autophagy 2010;6:322-29. Damiano JS, Hazlehurst LA, Dalton WS. Cell adhesion-mediated drug resistance (CAM-DR) protects the K562 chronicmyelogenous leukemia cell line from apoptosis induced by BCR/ABL inhibition, cytotoxic drugs, and gamma irradiation. Leukemia 2001;15:1232–9. Deen WM. What determines glomerular capillary permeability? J Clin Invest 2004;114:1412-14. Dejean LM, Martinez-Caballero S, Manon S, Kinnally KW. Regulation of the mitochondrial apoptosis-induced channel, MAC, by BCL-2 family proteins. Biochim Biophys Acta 2006;1762:191–201. Delehanty JB, Medintz IL, Pons T, Brunel FM, Dawson PE, Mattoussi H. Self-assembled quantum dot-peptide bioconjugates for selective intracellular delivery. Bioconjug Chem 2006;17:920–27. Demaria S, Kawashima N, Yang AM, Devitt ML, Babb JS, Allison JP, et al. Immune-mediated
inhibition of metastases after treatment with local radiation and CTLA-4 blockade in a mouse
model of breast cancer. Clin Cancer Res 2005;11:728–34.
Denamur S, Tyteca D, Marchand-Brynaert J, Van Bambeke F, Tulkens PM, Courtoy PJ, et al. Role
of oxidative stress in lysosomal membrane permeabilization and apoptosis induced by
gentamicin, an aminoglycoside antibiotic. Free Radic Biol Med 2011;51:1656–65.
Deng L, Liang H, Burnette B, Beckett M, Darga T, Weichselbaum RR, et al. Irradiation and anti-
PD-L1 treatment synergistically promote antitumor immunity in mice. J Clin Invest
2014;124:687–95.
Bibliography References
285
Desouky O, Ding N, Zhou G. Targeted and non-targeted effects of ionizing radiation. Journal of
Radiation Research and Applied Sciences 2015;8:247-54.
Detappe A, Kunjachan S, Rottmann J, Robar J, Tsiamas P, Korideck H, et al. AGuIX nanoparticles as a promising platform for image-guided radiation therapy. Cancer Nanotechnol 2015;6:4. Detappe A, Thomas E, Tibbitt MW, Kinjachan S, Zavidij O, Parnandi N, et al. Ultrasmall Silica-Based Bismuth Gadolinium Nanoparticles for Dual Magnetic Resonance-Computed Tomography Image Guided Radiation Therapy. Nano Lett 2017;17:1733-40. Dickreuter E, Eke I, Krause M, Borgmann K, van Vugt MA, Cordes N. Targeting of b1 integrins impairs DNA repair for radiosensitization of head and neck cancer cells. Oncogene 2015;35:1353-62. Diehn M, Cho RW, Lobo NA, Kalisky T, Dorie MJ, Kulp AN, et al. Association of reactive oxygen species levels and radioresistance in cancer stem cells. Nature 2009;458:780–3. Dikomey E, Dahm-Daphi J, Brammer I, Martensen R, Kaina B. Correlation between cellular
radiosensitivity and non-repaired double-strand breaks studied in nine mammalian cell lines. Int
J Radiat Biol 1998;73:269-78.
Dohmen AJC, Qiao X, Duursma A, Wijdeven RH, Lieftink C, Hageman F, et al. Identification of a novel ATM inhibitor with cancer cell specific radiosensitization activity. Oncotarget 2017;8:73925-73937. Dolman ME, van der Ploeg I, Koster J, Bate-Eya LT, Versteeg R, Caron HN, et al. DNA-Dependent Protein Kinase As Molecular Target for Radiosensitization of Neuroblastoma Cells. PLoS One 2015;10:e0145744. Dovedi SJ, Adlard AL, Lipowska-Bhalla G, McKenna C, Jones S, Cheadle EJ, et al. Acquired
resistance to fractionated radiotherapy can be overcome by concurrent PD-L1 blockade. Cancer
Res 2014;74:5458–68.
Dreyfuss AI, Clark JR, Norris CM, Rossi RM, Lucarini JW, Busse PM, et al. Docetaxel: an active
drug for squamous cell carcinoma of the head and neck. J Clin Oncol 1996:14:1672-8.
Droge W. Free radicals in the physiological control of cell function. Physiol Rev 2002;82:47–95. Du L, Zhou LJ, Pan XJ, Wang YX, Xu QZ, Yang ZH, et al. Radiosensitization and growth inhibition of cancer cells mediated by an scFv antibody gene against DNA-PKcs in vitro and in vivo. Radiat Oncol 2010;5:70.
Bibliography References
286
Duangmano S, Sae-Lim P, Suksamrarn A, Patmasiriwat P, Domann FE. Cucurbitacin B Causes Increased Radiation Sensitivity of Human Breast Cancer Cells via G2/M Cell Cycle Arrest. J Oncol 2012;2012:601682. Dudek AZ, Lesniewski-Kmak K, Shehadeh NJ, Pandey ON, Franklin M, Kratzke RA, et al. Phase I
study of bortezomib and cetuximab in patients with solid tumours expressing epidermal growth
factor receptor. Br J Cancer 2009;100:1379-84.
Dufort S, Le Duc G, Salomé M, Bentivegna V, Sancey L, Bräuer-Krisch E, et al. The High Radiosensitizing Efficiency of a Trace Gadolinium-Based Nanoparticles in Tumors. Sci Rep 2016;6:29678. Duncan R, Vicent MJ, Greco F, Nicholson RI/ Polymer-drug conjugates: towards a novel approach for the treatment of endocrine-related cancer. Endocr Relat Cancer 2005;12(Suppl. 1):S189–S199. Duncan R. Polymer conjugates as anticancer nanomedicines. Nat Rev Cancer 2006;6:688–701.
E Eke I, Cordes N. Focal adhesion signaling and therapy resistance in cancer. Semin Cancer Biol 2015;31:65-75. Eke I, Deuse Y, Hehlgans S, Gurtner K, Krause M, Baumann M, et al. beta(1)Integrin/FAK/cortactin signaling is essential for human head and neck cancer resistance to radiotherapy. J Clin Invest 2012;122:1529–40. Eke I, Dickreuter E, Cordes N. Enhanced radiosensitivity of head and neck squamous cell carcinoma cells by beta1 integrin inhibition. Radiother Oncol 2012;104:235–42. Eke I, Schneider L, Förster C, Zips D, Kunz-Schughart LA, Cordes N. EGFR/JIP-4/JNK2 signaling attenuates cetuximab-mediated radiosensitization of squamous cell carcinoma cells. Cancer Res 2013;73:297–306. Eke I, Zscheppang K, Dickreuter E, Hickmann L, Mazzeo E, Unger K, et al. Simultaneous β1 integrin-EGFR targeting and radiosensitization of human head and neck cancer. J Natl Cancer Inst 2015;107:dju419. Eke I, Zscheppang K, Dickreuter E, Hickmann L, Mazzeo E, Unger K. Simultaneous b1 integrin-EGFR targeting and radiosensitization of human head and neck cancer. J Natl Cancer Inst 2015;107.pii:dju419.

Bibliography References
287
El-Mir MY, Nogueira V, Fontaine E, Averet N, Rigoulet M, Leverve X. Dimethylbiguanide inhibits cell respiration via an indirect effect targeted on the respiratory chain complex I. J Biol Chem 2000;275:223-28. Eriksson D, Lofroth PO, Johansson L, Riklund KA, Stigbrand T. Cell cycle disturbances and mitotic catastrophes in HeLa Hep2 cells following 2.5 to 10 Gy of ionizing radiation. Clin Cancer Res 2007;13:5501s–08s. Ettl T, Viale-Bouroncle S, Hautmann MG, Gosau M, Kolbl O, Reichert TE, et al. AKT and MET
signalling mediates antiapoptotic radioresistance in head and neck cancer cell lines. Oral Oncol
2015;51:158-63.
Evans CH. Biochemistry of the lanthanides, Plenum Press, New York, 1990. Evans MD, Dizdaroglu M, Cooke MS. Oxidative DNA damage and disease: induction, repair and significance. Mutat Res, 2004;567:1-61.
F Fei P and El-Deiry WS. P53 and radiation responses. Oncogene 2003;22:5774-83. Ferradini C and Jay-Gerin JP. Radiolysis of water and aqueous solutions: history and present state of the science. Can J Chem 1999;77:1542–75. Fokas E, Prevo R, Pollard JR, Reaper PM, Charlton PA, Cornelissen B, et al. Targeting ATR in vivo using the novel inhibitor VE-822 results in selective sensitization of pancreatic tumors to radiation. Cell Death Dis. 2012;3:e441. Forastiere A, Koch W, Trotti A, Sidransky D. Head and neck cancer. N Engl J Med 2001;345:1890-
900.
Forastiere AA, Goepfert H, Maor M, Pajak TF, Weber R, Morrison W, et al. Concurrent
chemotherapy and radiotherapy for organ preservation in advanced laryngeal cancer. N Engl J
Med 2003;349:2091-8.
Forde JC, Maginn EN, McNamara G, Martin LM, Campiani G, Williams DC, et al. Microtubule-targeting-compound. PBOX-15 radiosensitizes cancer cells in vitro. Cancer Biol Ther 2011;11:421-8.

Bibliography References
288
Forman HJ, Zhang H, Rinna A. Glutathione: overview of its protective roles, measurement, and biosynthesis. Mol Aspects Med 2009;30:1-12. Frampton JE. Mifamurtide: a review of its use in the treatment of osteosarcoma. Paediatr Drugs 2010;12:141–53. Frosina G. DNA repair and resistance of gliomas to chemotherapy and radiotherapy. Mol Cancer
Res 2009;7:989-99.
Fuereder T. Immunotherapy for head and neck squamous cell carcinoma. memo 2016;9:66-69.
Fulda S and Debatin KM. Extrinsic versus intrinsic apoptosis pathways in anticancer chemotherapy. Oncogene 2006;25:4798–811. Fulton DJ. Nox 5 and the regulation of cellular function. Antioxid Redox Signal 2009;11:2243-523.
G Galadari S, Rahman A, Pallichankandy S, Thayyullathil F. Reactive oxygen species and cancer
paradox: To promote or to suppress? Free Rad Biol Med 2017;104:144-64.
Gao H, Peng C, Liang B, Shahbaz M, Liu S, Wang B, et al. β6 integrin induces the expression of metalloproteinase-3 and metalloproteinase-9 in colon cancer cells via ERK-ETS1 pathway. Cancer Lett 2014;354:427–37. Gelbert LM, Cai S, Lin X, Sanchez-Martinez C, del Prado M, Lallena MJ, et al. Preclinical characterization of the CDK4/6 inhibitor LY2835219: In vivo cell cycle-dependent/independent anti-tumor activities alone/in combination with gemcitabine. Investig New Drugs 2014;32:825–837. Geng F, Song K, Xing JZ, Yuan C, Yan S, Yang Q, et al. Thio-glucose bound gold nanoparticles enhance radio-cytotoxic targeting of ovarian cancer. Nanotechnology 2011;22:285101. Gewirtz DA, Hilliker ML, Wilson EN. Promotion of autophagy as a mechanism for radiation
sensitization of breast tumor cells. Radiother Oncol 2009;92:323-8.
Gill PS, Wernz J, Scadden DT, Cohen P, Mukwaya GM, von Roenn JH, et al. Randomized phase III trial of liposomal daunorubicin versus doxorubicin, bleomycin, and vincristine in AIDS-related Kaposi's sarcoma. J Clin Oncol 1996;14:2353–64.
Bibliography References
289
Gilormini M, Malesys C, Armandy E, Manas P, Guy JB, Magné N, et al. Preferential targeting of cancer stem cells in the radiosensitizing effect of ABT-737 on HNSCC. Oncotarget 2016;7:16731-44. Giralt J, Trigo J, Nuyts S, Ozsahin M, Skladowski K, Hatoum G, et al. Panitumumab plus radiotherapy versus chemoradiotherapy in patients with unresected, locally advanced squamous-cell carcinoma of the head and neck (CONCERT-2): a randomised, controlled, open-label phase 2 trial. Lancet Oncol 2015;16:221-32. Gökbuget N, Hartog CM, Bassan R, Derigs HG, Dombret H, Greil R, et al. Liposomal cytarabine is effective and tolerable in the treatment of central nervous system relapse of acute lymphoblastic leukemia and very aggressive lymphoma. Haematologica 2011;96:238–44. Gorrini C, Harris IS, Mak TW. Modulation of oxidative stress as an anticancer strategy. Nature revies Drug discovery 2013;12:931-47. Gradishar WJ, Tjulandin S, Davidson N, Shaw H, Desai N, Bhar P, et al. Phase III trial of nanoparticle albumin-bound paclitaxel compared with polyethylated castoroil-based paclitaxel in women with breast cancer. J Clin Oncol 2005;23:7794–7803. Graham J, Muhsin M, Kirkpatrick P. Nat Rev Drug Discov 2004;3:549-50.
Graham KA, Kulawiec M, Owens KM, Li X, Desouki MM, Chandra D, et al. NADPH oxidase 4 is an onco-protein localized to mitochondria. Cancer Biol Ther 2010;10:223-31. Grandis JR, Tweardy DJ. Elevated levels of transforming growth factor alpha and epidermal
growth factor receptor messenger RNA are early markers of carcinogenesis in head and neck
cancer. Cancer Res 1993;53:3579-84.
Gstaiger M, Aebersold R. Applying mass spectrometry-based proteomics to genetics, genomics
and network biology. Nat Rev Genet 2009;10:617-27.
Gudkov AV, Komarova EA. The role of p53 in determining sensitivity to radiotherapy. Nat Rev Cancer 2003;3:117–29. Gupta A, Probst HC, Vuong V, Landshammer A, Muth S, Yagita H, et al. Radiotherapy promotes
tumor-specific effector CD8+ T cells via dendritic cell activation. J Immunol 2012;189:558–66.
Gupta AK, McKenna WG, Weber CN, Feldman MD, Goldsmith JD, Mick R, et al. Local recurrence
in head and neck cancer: relationship to radiation resistance and signal transduction. Clin
Cancer Res 2002;8:885-92.
Bibliography References
290
H Hainfeld JF, Dilmanian FA, Slatkin DN, Smilowitz HM. Radiotherapy enhancement with gold
nanoparticles. J Pharm Pharmacol 2008;60: 977-85.
Hainfeld JF, Dilmanian FA, Zhong Z, Slatkin DN, Kalef-Ezra JA, Smilowitz HM. Gold nanoparticles enhance the radiation therapy of a murine squamous cell carcinoma. Phys Med Biol 2010;55:3045–59. Hainfeld JF, Smilowitz HM, O'Connor MJ, Dilmanian FA, Slatkin DN. Gold nanoparticle imaging and radiotherapy of brain tumors in mice. Nanomedicine 2013;8:1601–09. Halliwell B and Gutteridge JMC. Free Radicals in Biology and Medicine. 4th. Oxford University Press; Oxford: 2007. Han YK, Lee JH, Park GY, Chun SH, Han JY, Kim SD, et al. A possible usage of a CDK4 inhibitor for breast cancer stem cell-targeted therapy. Biochem Biophys Res Commun 2013;430:1329-33. Hanahan D, Weinberg RA. Hallmarks of cancer: the next generation. Cell 2011;144:646-74.
Handy DE and Loscalzo J. Redox regulation of mitochondrial function. Antioxid Redox Signal 2012;16:1323-67. Harrington K, Jankowska P, Hingorani M. Molecular biology for the radiation oncologist: the 5Rs of radiobiology meet the hallmarks of cancer. Clin Oncol (R Coll Radiol) 2007;19:561–71. Harrison M, Tomlinson D, Stewart S. Liposomal-entrapped doxorubicin: an active agent in AIDS-related Kaposi's sarcoma. J Clin Oncol 1995;13:914–20. Hawe A, Hulse WL, Jiskoot W, Forbes RT. Taylor dispersion analysis compared to dynamic light scattering for the size analysis of therapeutic peptides and proteins and their aggregates Pharm Res 2011;28:2302–2310. He QY, Chen J, Kung HF, Yuen AP, Chiu JF. Identification of tumor-associated proteins in oral
tongue squamous cell carcinoma by proteomics. Proteomics 2004;4:271-8.
Hehlgans S, Haase M, Cordes N. Signalling via integrins: implications for cell survival and anticancer strategies. Biochim Biophys Acta - Rev Cancer 2007;1775:163–80. Hehlgans S, Storch K, Lange I, Cordes N. The novel HDAC inhibitor NDACI054 sensitizes human cancer cells to radiotherapy. Radiother Oncol 2013;109:126-32.

Bibliography References
291
Her S, Jaffray DA, Allen C. Gold nanoparticles for applications in cancer radiotherapy: Mechanisms and recent advancements. Adv Drug Deliv Rev 2017;109:84-101. Hirai T, Shirai H, Fujimori H, Okayasu R, Sasai K, Masutani M. Radiosensitization effect of poly(ADP-ribose) polymerase inhibition in cells exposed to low and high liner energy transfer radiation. Cancer Sci 2012;103:1045-50. Hoeijmakers JH. Genome maintenance mechanisms for preventing cancer. Nature
2001;411:366-74.
Hoff DDV, Ervin TJ, Arena FP, Chiorean EG, Infante JR, Moore MJ, et al. Results of a randomized phase III trial (MPACT) of weekly nab-paclitaxel plus gemcitabine versus gemcitabine alone for patients withmetastatic adenocarcinoma of the pancreas with PET and CA19-9 correlates. J Clin Oncol 2013;31 Hoffmann TK. Systemic Therapy strategies for head-neck carcinumos: Current status. GMS Curr
Top Otorhinollaryngol Head Neck Surg 2012;11:Doc03.
Hofstetter B, Vuong V, Broggini-Tenzer A, Bodis S, Ciernik IF, Fabbro D, et al. Patupilone acts as radiosensitizing agent in multidrug-resistant cancer cells in vitro and in vivo. Clin Cancer Res 2005;11:1588-1596. https://clinicaltrials.gov/ct2/show/NCT02820454?term=AGuIX&recrs=a&rank=1 Hu L, Wang H, Huang L, Zhao Y, Wang J. Crosstalk between autophagy and intracellular radiation response (Review). Int J Oncol 2016;49:2217-26. Huang HC, Barua S, Sharma G, Dey SK, Rege K. Inorganic nanoparticles for cancer imaging and therapy. J Control Release 2011;155:344–57. Huang HC, Barua S, Sharma G, Dey SK, Rege K. Inorganic nanoparticles for cancer imaging and therapy. J Control Release 2011;155:344–57. Huang YH, Yang PM, Chuah QY, Lee YJ, Hsieh YF, Peng CW et al. Autophagy promotes radiation-induced senescence but inhibits bystander effects in human breast cancer cells. Autophagy 2014;10:1212-28. Huguet F, Fernet M, Giocanti N, Favaudon V, Larsen AK. Afatinib, an Irreversible EGFR Family Inhibitor, Shows Activity Toward Pancreatic Cancer Cells, Alone and in Combination with Radiotherapy, Independent of KRAS Status. Target Oncol 2016;11:371-81. Huotari J, Helenius A. Endosome maturation. EMBA J 2011 ;30 :3481-500.
Bibliography References
292
Huwyler J, Drewe J, Krähenbuhl S. Tumor targeting using liposomal antineoplastic drugs. Int J Nanomedicine 2008;3:21–29. Huwyler J, Wu D, Pardridge WM. Brain drug delivery of small molecules using immunoliposomes. Proc Natl Acad Sci U. S. A. 1996;93:14164–69.
I Ianzini F, Bertoldo A, Kosmacek EA, Phillips SL, Mackey MA. Lack of p53 function promotes radiation-induced mitotic catastrophe in mouse embryonic fibroblast cells. Cancer Cell Int 2006;6,11. Ianzini F, Mackey MA. Spontaneous premature chromosome condensation and mitotic catastrophe following irradiation of HeLa S3 cells. Int J Radiat Biol 1997;72:409–21. Idée JM, Port M, Raynal I, Schaefer M, Le Greneur S, Corot C. Clinical and biological consequences of transmetallation induced by contrast agents for magnetic resonance imaging: a review. Fundam Clin Pharmacol 2006;20:563-76. Invest in France Agency. Les Nanotechnologies en France. http://www.thenewfrance.com
Ito H, Daido S, Kanzawa T, Kondo S, Kondo Y. Radiation-induced autophagy is associated with
LC3 and its inhibition sensitizes malignant glioma cells. Int J Oncol 2005;26:1401-10.
Itoh N, Kawakita M. Characterization of Gd3+ and Tb3+ binding sites on Ca2+, Mg2+-adenosine triphosphatase of sarcoplasmic reticulum. J Biochem 1984;95:661-9.
J Jaboin JJ, Shinohara ET, Moretti L, Yang ES, Kaminski JM, Lu B. The role of mTOR inhibition in augmenting radiation induced autophagy. Technol Cancer Res Treat 2007;6:443-7. Jain S, Coulter JA, Butterworth KT, Hounsell AR, McMahon SJ, Hyland WB, et al. Gold nanoparticle cellular uptake, toxicity and radiosensitisation in hypoxic conditions. Radiother Oncol 2014;110:342–47. Jain S, Coulter JA, Hounsell AR, Butterworth KT, McMahon SJ, Hyland WB, et al. Cell-specific radiosensitization by gold nanoparticles at megavoltage radiation energies. Int J Radiat Oncol Biol Phys 2011;79:531–39.

Bibliography References
293
James P. Protein identification in the post-genome era: the rapid rise of proteomics. Q Rev
Biophys 1997;30:279-331
Jeppesen DK, Bohr VA, Stevnsner T. DNA repair deficiency in neurodegeneration. Prog
Neurobiol 2011;94:166-200.
Jiang W and Ogretmen B. Autophagy paradox and ceramide. Biochim Biophys Acta 2014;1841:783-92. Jin Z and Hilderbrandt N. Semiconductor quantum dots for in vitro diagnostics and cellular imaging. Trends Biotechnol 2012;30:394-403. Jin Z, Aixi Y, Baiwen Q, Zonghuan L, Xiang H. Inhibition of hypoxia-inducible factor-1 alpha radiosensitized MG-63 human osteosarcoma cells in vitro. Tumori 2015;101:578-84. Joh DY, Sun L, Stangl M, Al Zaki A, Murty S, Santoiemma PP, et al. Selective targeting of brain tumors with gold nanoparticle-induced radiosensitization. PLoS One 2013;8:e62425. Joiner M, editor. Basic clinical radiobiology. London: Hodder Arnold; 2009. p. 1-10. Jordan BF, Sonveaux P. Targeting tumor perfusion and oxygenation to improve the outcome of
anticancer therapy. Front Pharmacol 2012;3:94.
Jordan RC, Catzavelos GC, Barrett AW, Speight PM. Differential expression of bcl-2 and bax in
squamous cell carcinomas of the oral cavity. Eur J Cancer B Oral Oncol 1996;32B:394-400.
Jossen R, Bermejo R. The DNA damage checkpoint response to replication stress: A Game of
Forks. Front Genet 2013;4:26.
Junttila MR, de Sauvage FJ. Influence of tumour micro-environment heterogeneity on
therapeutic response. Nature 2013;501:346-54.
Juzenas P, Chen W, Sun YP, Choelho M, Generalov R, Generalova N, et al. Quantum dots and nanoparticles for photodynamic and radiation therapies of cancer. Adv Drug Deliv Rev 2008;60:1600-14.

Bibliography References
294
K Kabakov AE, Kudryavtsev VA, Gabai VL. Hsp90 inhibitors as promising agents for radiotherapy. J Mol Med (Berl) 2010;88:241-7. Kahn J, Hayman TJ, Jamal M, Rath BH, Kramp T, Camphausen K, et al. The mTORC1/mTORC2 inhibitor AZD2014 enhances the radiosensitivity of glioblastoma stem-like cells. Neuro Oncol 2014;16:29-37. Kamaly N, Xiao Z, Valencia PM, Radovic-Moreno AF, Farokhzad OC. Targeted polymeric therapeutic nanoparticles: design, development and clinical translation. Chem Soc Rev 2012;41:2971–3010. Karin M, Greten FR. NF-kappaB: linking inflammation and immunity to cancer development and
progression. Nat Rev Immunol 2005;5:749-59.
Karch J, Schips TG, Maliken BD, Brody MJ, Sargent MA, Kanisicak O, et al. Autophagic cell death
is dependent on lysosomal membrane permeability through Bax and Bak. eLife 2017; 6. Pii:
e30543.
Kaur H, Pujari G, Semwal MK, Sarma A, Avasthi DK. In vitro studies on radiosensitization effect of glucose capped gold nanoparticles in photon and ion irradiation of Hela cells. Nucl Instrum Methods Phys Res, Sect B 2013;301:7–11. Kendziorra E, Ahlborn K, Spitzner M, Rave-Fränk M, Emons G, Gaedcke J, et al. Silencing of the Wnt transcription factor TCF4 sensitizes colorectal cancer cells to (chemo-) radiotherapy. Carcinogenesis 2011;32:1824-31. Kenzaoui BH, Bernasconi CC, Guney-Ayra S, Juillerat-Jeannere L. Induction of oxidative stress, lysosome activation and autophagy by nanoparticles in human brain-derived endothelial cells. Biochem J 2012;441:813-21.
Kessler J, Hahnel A, Wichmann H, Rot S, Kappler M, Bache M, et al. HIF-1α inhibition by siRNA or chetomin in human malignant glioma cells: effects on hypoxic radioresistance and monitoring via CA9 expression. BMC Cancer 2010;10:605. Khoshgard K, Hashemi B, Arbabi A, Rasaee MJ, Soleimani M. Radiosensitization effect of folate-conjugated gold nanoparticles on HeLa cancer cells under orthovoltage superficial radiotherapy techniques. Phys Med Biol 2014;59:2249–63.

Bibliography References
295
Kim BH, Yin CH, Guo Q, Bach EA, Lee H, Sandoval C, et al. A small-molecule compound identified through a cell-based screening inhibits JAK ⁄ STAT pathway signaling in human cancer cells. Mol Cancer Ther 2008;7:2672–80. Kim BM, Hong Y, Lee S, Liu P, Lim JH, Lee YH, et al. Therapeutic Implications for Overcoming Radiation Resistance in Cancer Therapy. Int J Mol Sci 2015;16:26880-913. Kim BY, Kim KA, Kwon O, Kim SO, Kim MS, Kim BS, et al. NF-kappaB inhibition radiosensitizes Ki-Ras-transformed cells to ionizing radiation. Carcinogenesis 2005;26:1395-403. Kim J, Kundu M, Viollet B, Guan KL. AMPK and mTOR regulate autophagy through direct phosphorylation of Ulk1. Nat Cell Biol 2011;13:132-41. Kim JJ, Tannock IF. Repopulation of cancer cells during therapy: an important cause of
treatment failure. Nat Rev Cancer 2005;5:516-25.
King HO, Brend T, Payne HL, Wright A, Ward TA, Patel K, et al. RAD51 Is a Selective DNA Repair Target to Radiosensitize Glioma Stem Cells. Stem Cell Reports 2017;8:125-139. King HO, Brend T, Payne HL, Wright A, Ward TA, Patel K, et al. RAD51 Is a Selective DNA Repair Target to Radiosensitize Glioma Stem Cells. Stem Cell Reports 2017;8:125-139. Klein EA, Thompson IM Jr, Tangen CM, Crowley JJ, Luda MS, Goodman PJ, et al. Vitamin E and the risk of prostate cancer: the selenium and vitamin E cancer prevetion trial (SELECT). JAMA 2011;306:1549-56. Klein S, Dell’Arciprete ML, Wegmann M, Distel LV, Neuhuber W, Gonzalez MC, et al. Oxidized silicon nanoparticles for radiosensitization of cancer and tissue cells. Biochem Biophys Res Commun 2013;434:217-22. Klein S, Sommer A, Distel LVR, Neuhuber W, Kryschi C. Superparamagnetic iron oxide nanoparticles as radiosensitizer via enhanced reactive oxygen species formation. Biochem Biophys Res Commun 2012;425:393-7. Kobashigawa S, Morikawa K, Mori H, Kashino G. Gemcitabine
Induces Radiosensitization Through Inhibition of RAD51-dependent Repair for DNA Double-
strand Breaks. Anticancer Res 2015;35:2731-7. Kolesnick R. The therapeutic potential of modulating the ceramide/sphingomyelin pathway. J Clin Investig 2002;110:3–8.

Bibliography References
296
Kong T, Zeng J, Wang XP, Yang XY, Yang J, McQuarrie S, et al. Enhancement of radiation cytotoxicity in breast-cancer cells by localized attachment of gold nanoparticles. Small 2008;4:1537–43. Koppenhagen P, Dickreuter E, Cordes N. Head and neck cancer cell radiosensitization upon dual targeting of c-Abl and beta1-integrin. Radiother Oncol 2017;124:370-8. Koritzinsky M. Metformin: A Novel Biological Modifier of Tumor Response to Radiation Therapy. Int J Radiat Oncol Biol Phys. 2015 Oct 1;93(2):454-64. Koshkaryev A, Sawant R, Deshpande M, Torchilin V. Immunoconjugates and long circulating systems: origins, current state of the art and future directions. Adv Drug Deliv Rev 2013;65:24–35. Kotb S, Detappe A, Lux F, Appaix F, Barbier EL, Tran VL, et al. Gadolinium-Based Nanoparticles
and Radiation Therapy for Multiple Brain Melanoma Metastases: Proof of Concept before
Phase I Trial. Theranostics 2016;6:418-27.
Kovalainen M, Mönkäre J, Kaasalainen M, Riikonen J, Lehto VP, Salonen J, et al. Development of porous silicon nanocarriers for parenteral peptide delivery. Mol Pharm 2013;10:353–59. Kryza D, Taleb J, Janier M, Marmuse L, Miladi I, Bonazza P, et al. Study of nanometric hybrid gadolinium oxide particles as a multimodel SPECT/MR/Optical Imaging and theragnostic agent. Bioconjugate Chem 2011;22:1145-52. Kubota N, Hayashi J, Inada T, Iwamura Y. Induction of a particular deletion in mitochondrial DNA by X rays depends on the inherent radiosensitivity of the cells. Radiat Res 1997;148:395-8. Kuger S, Graus D, Brendtke R, Günther N, Katzer A, Lutyj P, et al. Radiosensitization of Glioblastoma Cell Lines by the Dual PI3K and mTOR Inhibitor NVP-BEZ235 Depends on Drug-Irradiation Schedule. Transl Oncol 2013;6:169-79. Kumar P, Bacchu V, Wiebe LI. The chemistry and radiochemistry of hypoxia-specific, radiohalogenated nitroaromatic imaging probes. Semin Nucl Med 2015;45:122-35. Kuribayashi K, Finnberg N, Jeffers JR, Zambetti GP, El-Deiry WS. The relative contribution of pro-apoptotic p53-target genes in the triggering of apoptosis following DNA damage in vitro and in vivo. Cell Cycle 2011;10:2380–9. Kwatra D, Veugopal A, Anant S. Nanoparticles in radiation therapy : a summary of various
approaches to enhance radiosensitization in cancer. Transl Cancer Res 2013;2:330-42.
Bibliography References
297
L Lai SY, Koppikar P, Thomas SM, Childs EE, Egloff AM, Seethala RR, et al. Intratumoral epidermal
growth factor receptor antisense DNA therapy in head and neck cancer: first human application
and potential antitumor mechanisms. J Clin Oncol 2009;27:1235-42.
Lambert LA, Qiao N, Hunt KK, Lambert DH, Mills GB, Meijer L, et al. Autophagy : a novel
mechanism of synergistic cytotoxicity between doxorubicin and roscovitine in a sarcoma model.
Cancer Res 2008;68:7966-74.
Lansman JB. Blockade of current through single calcium channels by trivalent lanthanide cations. Effect if ionic radius on the rates of ion entry and exit. J Gen Physiol 1990;95:679-96. Lapierre LR, Kumsta C, Sandri M, Ballabio A, Hansen M. Transcriptional and epigenetic regulation of autophagy in aging. Autophagy 2015;11:867-80. Larsen NB, Rasmussen M, Rasmussen LJ. Nuclear and mitochondrial DNA repair: similar pathways? Mitochondrion 2005;5:89–108. Le Duc G, Miladi I, Alric C, Mowat P, Bräuer-Krisch E, Bouchet A, et al. Toward an image-guided microbeam radiation therapy using gadolinium-based nanoparticles. ACS Nano 2011;5:9566-74. Le Duc G, Roux S, Paruta-Tuarez A, Dufort S, Brauer E, Marais A, et al. Advantages of gadolinium
based ultrasmall nanoparticles vs molecular gadolinium chelates for radiotherapy guided by
MRI for glioma treatment. Cancer Nanotechnol. 2014;5:4.
Lee ES, Lee HJ, Lee YJ, Jeong JH, Kang S, Lim YB. Chemical chaperones reduce ionizing radiation-indcued endoplasmic reticulum stress and cell death in IEC-6 cells. Biochem Biophys Res Commun 2014;450:1005-9. Lee HC, Kim DW, Jung KY, Park IC, Park MJ, Kim MS, et al. Increased expression of antioxidant enzymes in radioresistant variant from U251 human glioblastoma cell line. Int J Mol Med 2004;13:883–7. Lee JH, Paull TT. Activation and regulation of ATM kinase activity in response to DNA double-
strand breaks. Oncogene 2007;26:7741-8.
Leemans CR, Braakhuis BJ, Brakenhoff RH. The molecular biology of head and neck cancer. Nat
Rev Cancer 2011;11:9-22.

Bibliography References
298
Leethanakul C, Patel V, Gillespie J, Pallente M, Ensley JF, Koontongkaew S, et al. Distinct pattern
of expression of differentiation and growth-related genes in squamous cell carcinomas of the
head and neck revealed by the use of laser capture microdissection and cDNA arrays. Oncogene
2000;19:3220-4.
Li Y, Han N, Yin T, Huang L, Liu S, Liu D, et al. Lentivirus-mediated Nox4 shRNA invasion and angiogenesis and enhances radiosensitivity in human glioblastoma. Oxid Med Cell Longev 2014;2014:581732. Li Z, Rana TM. Therapeutic targeting of microRNAs: current status and future challenges. Nat Rev Drug Discov 2014;13:622-38. Libutti SK, Paciotti GF, Byrnes AA, Alexander HR, Gannon WE, Walker M, et al. Phase I and pharmacokinetic studies of CYT-6091, a novel PEGylated colloidal gold-rhTNF nanomedicine. Clin Cancer Res 2010;16:6139–49. Lim YC, Roberts TL, Day BW, Stringer BW, Kozlov S, Fazry S, et al. Increased sensitivity to ionizing radiation by targeting the homologous recombination pathway in glioma initiating cells. Mol Oncol 2014;8:1603-15. Link AJ, Eng J, Schieltz DM, Carmack E, Mize GJ, Morris DR, et al. Direct analysis of protein
complexes using mass spectrometry. Nat Biotechnol 1999;17:676-82.
Liu CJ, Wang CH, Chen ST, Chen HH, Leng WH, Chien CC, et al. Margaritondo, Enhancement of cell radiation sensitivity by PEGylated gold nanoparticles, Phys Med Biol 2010;55:931–45. Liu CJ, Wang CH, Chien CC, Yang TY, Chen ST, Leng WH, et al. Enhanced Xray irradiation-induced cancer cell damage by gold nanoparticles treated by a new synthesis method of polyethylene glycol modification. Nanotechnology 2008;19:295104. Liu P, Huang Z, Chen Z, Xu R, Wu H, Zang F, et al. Silver nanoparticles: a novel radiation sensitizer for glioma? Nanoscale 2013;5:11829-36. Liu Y, Cui Y, Shi M, Zhang Q, Wang Q, Chen X. Deferoxamine promotes MDA-MB-231 cell
migration and invasion through increased ROS-dependent HIF-1α accumulation. Cell Physiol
Biochem 2014;33:1036-46.
Liu Y, Levine B. Autosis and autophagic cell death: the dark side of autophagy. Cell Death Differ
2015;22:367–376.

Bibliography References
299
Liu P, Jin H, Guo Z, Ma J, Zhao J, Li D, et al. Silver nanoparticles outperform gold nanoparticles in radiosensitizing U251 cells in vitro and in an intracranial mouse model of glioma. Int J Nanomedicine 2016;11:5003-14. Liu Y, Cui B, Qiao Y, Zhang Y, Tian Y, Jiang J, et al. Phosphoinositide-3-kinase inhibition enhances radiosensitization of cervical cancer in vivo. Int J Gynecol Cancer 2011;21:100-5. Liu Y, Cui Y, Shi M, Zhang Q, Wang Q, Chen X. Deferoxamine promotes MDA-MB-231 cell migration and invasion through increased ROS-dependent HIF-1α accumulation. Cell Physiol Biochem 2014;33:1036-46. Liu Y, Liu X, Jin X, He P, Zheng X, Dai Z, et al. The dependence of radiation enhancement effect on the concentration of gold nanoparticles exposed to low- and high-LET radiations. Phys Med 2015;31:210–18. Liu Z, Xiong L, Ouyang G, Ma L, Sahi S, Wang K, et al. Investigation of Copper Cysteamine Nanoparticles as a New Type of Radiosensitiers for Colorectal Carcinoma Treatment. Scientific Reports 2017;7:9290. Lohse I, Kumareswaran R, Cao P, Pitcher B, Gallinger S, Bristow RG, et al. Effects of Combined Treatment with Ionizing Radiation and the PARP Inhibitor Olaparib in BRCA Mutant and Wild Type Patient-Derived Pancreatic Cancer Xenografts. PLoS One 2016;11:e0167272. Lomax ME, Folkes LK, O’Neill P. Biological consequences of radiation-induced DNA damage:
relevance to radiotherapy. Clin Oncol (R Coll Radiol) 2013;25:578-85.
Loriot Y, Mordant P, Dugue D, Geneste O, Gombos A, Opolon P, et al. Radiosensitization by a novel Bcl-2 and Bcl-XL inhibitor S44563 in small-cell lung cancer. Cell Death Dis 2014;5:e1423. Lorusso V, Pascolo L, Fernetti C, Anelli PL, Uggeri F, Tiribelli C. Magnetic resonance contrast agents: from the bench to the patient. Curr Pharm Des 2005;11:4079-98. Lu H, Liang K, Lu Y, Fan Z. The anti-EGFR antibody cetuximab sensitizes human head and neck squamous cell carcinoma cells to radiation in part through inhibiting radiation-induced upregulation of HIF-1α. Cancer Lett 2012;322:78-85. Luchette M, Korideck H, Makrigiorgos M, Tillement O, Berbeco R. Radiation dose enhancement
of gadolinium-based AGuIX nanoparticles on HeLa cells. Nanomedicine 2014;10:1751-5.
Luo S, Rubinsztein DC. Atg5 and Bcl-2 provide novel insights into the interplay between
apoptosis and autophagy. Cell Death Differ 2007;14:1247-50.

Bibliography References
300
Luo H, Yount C, Lang H, Yang A, Riemer EC, Lyons K, et al. Activation of p53 with Nutlin-3a radiosensitizes lung cancer cells via enhancing radiation-induced premature senescence. Lung Cancer 2013;81:167–73. Lux F, Mignot A, Mowat P, Louis C, Dufort S, Bemhard C, et al. Ultrasmall rigid particles as multimodal probes for medical applications. Angew Chem Int Ed Engl 2011;50:12299-303.
M Madoc-Jones H, Mauro F. Interphase action of vinblastine and vincristine: differences in their
lethal action through the mitotic cycle of cultured mammalian cells. J Cell Physiol 1968;72:185-
96.
Maggioreela L, Barouch G, Devaux C, Pottier A, Deutsch E, Bourhis J, et al. Nanoscale radiotherapy with hafnium oxide nanoparticles. Future Oncol 2012;8:1167-81. Maggiorella L, Aubel C, Haton C, Milliat F, Connault E, Opolon P, et al. Cooperative effect of roscovitine and irradiation targets angiogenesis and induces vascular destabilization in human breast carcinoma. Cell Prolif 2009;42:38-48. Maity A, Cerniglia GJ, Karar J.Radiosensitization by the Dual PI3K/mTOR Inhibitor NVP-BEZ235. Int J Rad Oncol 2011;81:S84-S85. Mamo T, Mladek AC, Shogren KL, Gustafson C, Gupta SK, Riester SM, et al. Inhibiting DNA-PKCS radiosensitizes human osteosarcoma cells. Biochem Biophys Res Commun 2017;486:307-313. Mamot C, Drummond DC, Greiser U, Hong K, Kirpotin DB, Marks JD, et al. Epidermal growth factor receptor (EGFR)-targeted immunoliposomesmediate specific and efficient drug delivery to EGFR- and EGFRvIII-overexpressing tumor cells. Cancer Res 2003;63:3154–61. Mamot C, Drummond DC, Noble CO, Kallab V, Guo Z, Hong K, et al. Epidermal growth factor receptor-targeted immunoliposomes significantly enhance the efficacy of multiple anticancer drugs in vivo. Cancer Res 2005;65:11631–38. Mamot C, Ritschard R, Wicki A, Küng W, Schuller J, Herrmann R, et al. Immunoliposomal delivery of doxorubicin can overcome multidrug resistance mechanisms in EGFR-overexpressing tumor cells. J Drug Target 2012;20:422–32.
Bibliography References
301
Mansour WY, Bogdanova NV, Kasten-Pisula U, Rieckmann T, Kocher S, Borgmann K, et al.
Aberrant overexpression of miR-421 downregulates ATM and leads to a pronounced DSB repair
defect and clinical hypersensitivity in SKX squamous cell carcinoma. Radiother Oncol
2013;106:147-54.
Mantoni TS, Lunardi S, Al-Assar O, Masamune A, Brunner TB. Pancreatic stellate cells radioprotect pancreatic cancer cells through β1-integrin signaling. Cancer Res 2011;71:3453–8. Martins RG, Parvathaneni U, Bauman JE, Sjar,a AL. Raez LE, Papagikos MA, et al. Cisplatin and radiotherapy with or without erlotinib in locally advanced squamous cell carcinoma of the head and neck: a randomized phase II trial. J Clin Oncol 2013;31:1415-21. Matsumura Y, Gotoh M, Muro K, Yamada Y, Shirao K, Shimada Y, et al. Phase I and pharmacokinetic study of MCC-465, a doxorubicin (DXR) encapsulated in PEG immunoliposome, in patients with metastatic stomach cancer, Ann Oncol 2004;15:517–25. Meacham CE, Morrison SJ. Tumour heterogeneity and cancer cell plasticity. Nature
2013;501:328-37.
Meitzler JL, Antony S, Wu Y, Juhasz A, Liu H, Jiang G, et al. NADPH Oxidases: A Perspective on Reactive Oxygen Species Production in Tumor Biology. Antioxid Redox Signal 2014;20:2837-89. Mesia R, Henke M, Fortin A, Minn H, Yunes Ancona AC, Cmelak A, et al. Chemoradiotherapy with or without panitumumab in patients with unresected, locally advanced squamous-cell carcinoma of the head and neck (CONCERT- 1): a randomised, controlled, open-label phase 2 trial. Lancet Oncol 2015;16:208-20. Meyers PA, Schwartz CL, Krailo MD, Healey JH, Bernstein ML, Betcher D, et al. Osteosarcoma: the addition of muramyl tripeptide to chemotherapy improves overall survival—a report from the Children's Oncology Group, J Clin Oncol 2008;26:633–38. Michaud K, Solomon DA, Oermann E, Kim JS, Zhong WZ, Prados MD, et al. Pharmacologic inhibition of cyclin-dependent kinases 4 and 6 arrests the growth of glioblastoma multiforme intracranial xenografts. Cancer Res 2010;70:3228–3238. Mignot A, Truillet C, Lux F, Sancey L, Louis C, Denat F, et al. A top-down synthesis route to
ultrasmall multifunctional Gd-based silica nanoparticles for theranostic applications. Chemistry
2013;19:6122-36.
Mikhaylov G, Vasiljeva O. Promising approaches I using magnetic nanoparticles in oncology. Biol Chem 2011;392:955-60.

Bibliography References
302
Mikkelsen RB, Wardman P. Biological chemistry of reactive oxygen and nitrogen and radiation-induced signal transduction mechanisms. Oncogene 2003;22:5734–54. Miladi I, Aloy MT, Armandy E, Mowat P, Kryza D, Magne N, et al. Combining ultrasmall
gadolinium-based nanoparticles with photon irradiation overcomes radioresistance of head
neck squamous cell carcinoma. Nanomedicine 2015;11:247-57.
Minjgee M, Toulany M, Kehlbach R, Giel K, Rodemann HP. K-RAS(V12) induces autocrine
production of EGFR ligands and mediates radioresistance through EGFR-dependent Akt
signaling and activation of DNA-PKcs. Int J Radiat Oncol Biol Phys 2011;81:1506-14.
Mirjolet C, Papa AL, Créhange G, Raguin O, Seignez C, Paul C, et al. The radiosensitization effect of titanate nanotubes as a new tool in radiation therapy for glioblastoma: A proof-of-concept. Radiother Oncol 2013;108:136-42. Mirzayans R, Scott A, Cameron M, Murray D. Induction of accelerated senescence by gamma radiation in human solid tumor-derived cell lines expressing wild-type TP53. Radiat Res 2005;163:53–62. Mishra A, Bharti AC, Varghese P, Saluja D, Das BC. Differential expression and activation of NF-
kappB family proteins during oral carcinogenesis: Role of high risk human papillomavirus
infection. Int J Cancer 2006;119:2840-50.
Mishra BP, Lobo AS, Joshi KS, Rathos MJ, Kumar GA, Padigaru M. Molecular mechanisms of anti-
tumor properties of P276-00 in head and neck squamous cell carcinoma. J Transl Med
2013;11:42.
Mitrakas AG, Kalamida D, Koukourakis MI. Effect of mitochondrial metabolism-interfering agents on cancer cell mitochondrial function and radio/chemosensitivity. Anticancer Drugs 2014;25:1182-91. Mo N, Lu YK, Xie WM, Liu Y, Zhou WX, Wang HX, et al. Inhibition of autophagy enhances the radiosensitivity of nasopharyngeal carcinoma by reducing Rad51 expression. Oncol Rep 2014;32:1905-12. Mochizuki T, Furuta S, Mitsushita J, Shang WH, Ito M, Yokoo Y, et al. Inhibition of NADPH oxidase 4 activates apoptosis via the AKT/apoptosis signal-regulating kinase 1 pathway in pancreatic cancer PANC-1 cells. Oncogene 2006;25:3699-3707.
Bibliography References
303
Moeller BJ, Yordy JS, Williams MD, Giri U, Raju U, Mokentine DP, et al. DNA repair biomarker
profiling of head and neck cancer: Ku80 expression predicts locoregional failure and death
following radiotherapy. Clin Cancer Res 2011;17:2035-43.
Molinolo AA, Amornphimoltham P, Squarize CH, Castilho RM, Patel V, Gutkind JS. Dysregulated
Molecular Networks in Head and Neck Carcinogenesis. Oral Oncol 2009;45:324-34.
Morad SA, Levin JC, Tan SF, Fox TE, Feith DJ, Cabot MC. Novel off-target effect of tamoxifen—inhibitio n of acid ceramidase activity in cancer cells. Biochim Biophys Acta 2013;1831:1657-64. Moretti L, Cha YI, Niermann KJ, Lu B. Switch between apoptosis and autophagy: radiation-induced endoplasmic reticulum stress? Cell Cycle 2007;6:793-8. Mowat P, Mignot A, Rima W, Lux F, Tillement O, Roulin C, et al. In Vitro radiosensitizing effects
of ultrasmall gadolinium based particles on tumour cells. J Nanosci Nanotechnol 2011;11:7833-
9.
Mroz RM, Schins RP, Li H, Jimenez LA, Drost EM, Holownia A, et al. Nanoparticle-driven DNA
damage mimics irradiation-related carcinogenesis pathways. Eur Respir J 2008;31:241-51.
Munson JM, Fried L, Rowson SA, Bonner MY, Karumbaja L, Diaz B, et al. Anti-invasive adjuvant therapy with imipramine blue enhances chemotherapeutic efficacy against glioma. Sci Transl Med 2012;4:127ra36. Murphy PM. How mitochondria produce reactive oxygen species. Biochem J 2009;417:1-13. Nakanishi C, Toi M. Nuclear factor-kappaB inhibitors as sensitizers to anticancer drugs. Nat Rev
Cancer 2005;5:297-309.
N Nagelkerke A, Bussink J, Geurts-Moespot A, Sweep FC, Span PN. Therapeutic targeting of
autophagy in cancer. Part II: pharmacological modulation of treatment-induced autophagy.
Semin Cancer Biol 2015;31:99-105.
Nakayama M, Sasaki R, Ogino C, Tanaka T, Morita K, Umetsu M, et al. Titanium peroxide nanoparticles enhanced cytotoxic effects of X-ray irradiation against pancreatic cancer model through reactive oxygen species generation in vitro and in vivo. Radiat Oncol 2016;11:91. Nanotechnol 2008;8:1312–15.

Bibliography References
304
Nakagawa Y, Takahashi A, Kajihara A, Yamakawa N, Imai Y, Ota I, et al. Depression of p53-
independent Akt survival signals in human oral cancer cells bearing mutated p53 gene after
exposure to high-LET radiation. Biochem Biophys Res Commun 2012;423:654-60.
Nam JM, Onodera Y, Bissell MJ, Park CC. Breast cancer cells in three dimensional culture display an enhanced radio response after coordinate targeting of integrin alpha5beta1 and fibronectin. Cancer Res 2010;70:5238–48. Neh MA, Lin CI, Kozono DE, Whang EE, Cho NL, Zhu K, et al. Necroptosis is a novel mechanism of radiation-induced cell death in anaplastic thyroid and adrenocortical cancers. Surgery 2011;150:1032–39. Nel A, Xia T, Madler L, Li N. Toxic potential of materials at the nanolevel. Science 2006;311:622-
7.
Niazi MT, Mok G, Heravi M, Lee L, Vuong T, Aloyz R, et al. Effects of dna-dependent protein kinase inhibition by NU7026 on dna repair and cell survival in irradiated gastric cancer cell line N87. Curr Oncol 2014;21:91-6. Nimura Y, Kawata T, Uzawa K, Okamura J, Liu C, Saito M et al. Silencing Ku80 using small
interfering RNA enhanced radiation sensitivity in vitro and in vivo. Int J Oncol 2007;30:1477-84.
Noto H, Goto A, Tsujimoto T, Noda M. Cancer risk in diabetic patients treated with metformin: a systemic review and meta-analysis. PloS One 2012;7:e33411. Nowsheen S, Bonner JA, Yang ES. The poly(ADP-Ribose) polymerase inhibitor ABT-888 reduces
radiation-induced nuclear EGFR and augments head and neck tumor response to radiotherapy.
Radiother Oncol 2011;99:331-8.
O O'Brien S, Schiller G, Lister J, Damon L, Goldberg S, Aulitzky W, et al. High-dose vincristine sulfate liposome injection for advanced, relapsed, and refractory adult Philadelphia chromosome-negative acute lymphoblastic leukemia. J Clin Oncol 2013;31:676–83. Ogura A, Oowada S, Kon Y, Hirayama A, Yasui H, Meike S, et al. Redox regulation in radiation-induced cytochrome c release from mitochondria of human lung carcinoma A549 cells. Cancer Lett 2009;277:64–71.

Bibliography References
305
Oku Y, Murakami K, Irie K, Hoseki J, Sakai Y. Synthesized Aβ42 Caused Intracellular Oxidative
Damage, Leading to Cell Death, via Lysosome Rupture. Cell Struct Funct 2017;42:71-79.
Omenn GS, Goodman GE, Thomquist MD, Balmes J, Cullen MR, Glass A, et al. Effects of a combination of beta carotene and vitamin A on lung cancer and cardiovascular disease. N Engl J Med 1996;334:1150-55. Ondrey FG, Dong G, Sunwoo J, Chen Z, Wolf JS, Crowl-Bancroft CV, et al. Constitutive activation
of transcription factors NF-(kappa)B, AP-1, and NF-IL6 in human head and neck squamous cell
carcinoma cell lines that express pro-inflammatory and proangiogenic cytokines. Mol Carcinog
1999;26:119-29.
Ongoing clinical trials with NBTXR3 (hafnium oxide nanoparticles) as radiosensitizing agent in several different cancer types (clinicaltrials.gov) Ott M, Gogvadze V. Orrenius S, Zhivotovsky B. Mitochondria, oxidative stress and cell death. Apoptosis 2007;12:913–22. Ouédraogo ZG, Müller-Barthélémy M, Kemeny JL, Dedieu V, Biau J, Khalil T, et al. STAT3 Serine 727 Phosphorylation: A Relevant Target to Radiosensitize Human Glioblastoma. Brain Pathol 2016;26:18-30. Owen MR, Doran E, Halestrap AP. Evidence that metformin exerts its anti-diabetic effects through inhibition of complex 1 of the mitochondrial respiratory chain. Biochem J 2000;348:607-14. Ozben T. Oxidative stress and apoptosis: impact on cancer therapy. J Pharm Sci 2007;96:2181-96.
P Paglin S, Lee NY, Nakar C, Fitzgeral M, Plotkin J, Deuel B, et al. Rapamycin-sensitive pathway
regulates mitochondrial membrane potential, autophagy, and survival in irradiated MCF-7 cells.
Cancer Res 2005;65:11061-70.
Pajonk F, Vlashi E, McBride WH. Radiation resistance of cancer stem cells: the 4R’s of
radiobiology revisited. Stem Cells 2010;28:639-48.

Bibliography References
306
Pan Y, Leifert A, Ruau D, Neuss S, Bornemann J, Schmid G, et al. Gold nanoparticles of diameter
1.4nm trigger necrosis by oxidative stress and mitochondrial damage. Small 2009;5:2067-76.
Panzarini E, Mariano S, DiniVie L. Glycans coated silver nanoparticles induces autophagy and necrosis in HeLa cells. AIP Conference Proceedings 2015;1667:020017. Paradies G, Petrosillo G, Paradies V, Ruggiero FM. Oxidative stress, mitochondrial bioenergetics, and cardiolipin in aging. Free Radic Biol Med 2010;48:1286-95. Parikh F, Duluc D, Imai N, Clark A, Misiukiewicz K, Bonomi M, et al. Chemoradiotherapy-induced
upregulation of PD-1 antagonizes immunity to HPV-related oropharyngeal cancer. Cancer Res
2014;74:7205–16.
Park BH, Hwang TC, Liu DY, Sze HS, Kim JS, Kwon HC, et al. Use of a targeted oncolytic
poxyvirus, JX-594, in patients with refractory primary or metastatic liver cancer: a phase I trial.
Lancet Oncol 2008;9:533-42.
Park JW, Hong K, Kirpotin DB, Colbern G, Shalaby R, Baselga J, et al. Anti-HER2 immunoliposomes: enhanced efficacy attributable to targeted delivery. Clin Cancer Res 2002;8:1172–81. Park SJ, Heo K, Choi C, Yang K, Adachi A, Okada H, et al. Carbon ion irradiation abrogates Lin28B-induced X-ray resistance in melanoma cells. J Radiat Res 2017;8:1-7. Park YS, Liz-Marzan LM, Kasuya A, Kobayashi Y, Nagao D, Konno M, Mamykin S, Dmytruk A, Parsons JL, Dianov GL. Co-ordination of base excision repair and genome stability. DNA Repair
(Amst) 2013;12:326-33.
Patel LN, Zaro JL, Shen WC. Cell penetrating peptides: intracellular pathways and pharmaceutical perspectives. Pharm Res 2007;24:1977–92. Paull R, Wolfe J, Hébert P, Sinkula M. Investing in nanotechnology. Nat Biotechnol
2003;21:1144-7.
Pchejetski D, Bohler T, Brizuela L, Sauer L, Doumerc N, Golzio M, et al. FTY720 (fingolimod) sensitizes prostate cancer cells to radiotherapy by inhibition of sphingosine kinase-1. Cancer Res 2010;70:8651-61. Pecot CV, Calin GA, Coleman RL, Lopez-Berestein G, Sood AK. RNA interference in the clinic: challenges and future directions. Nat Rev Cancer 2011;11:59–67.

Bibliography References
307
Peinnequin A, Poyot T, Dib A, Aubourg A, Mouret C, Demeilliers C. Direct quantification of mitochondrial DNA and its 4.9-kb common deletion without DNA purification. Anal Biochem 2011;409:298-300. Peng TI, Yu PR, Chen JY, Wang HL, Wu HY, Wei YH, et al. Visualizing common deletion of mitochondrial DNA-augmented mitochondrial reactive oxygen species generation and apoptosis upon oxidative stress. Biochim Biophys Acta 2006;1762:241-55. Persson HL, Kurz T, Eaton JW, Brunk UT. Radiation-induced cell death : importance of lysosomal destabilization. Biochem J 2005;389:877-84. Petrosillo G, Ruggiero FM, Pistolese M, Paradies G. Reactive oxygen species generated from the mitochondrial electron transport chain induce cytochrome c dissociation from beef-heart submitochondrial particles via cardiolipin peroxidation: possible role in the apoptosis. FEBS Lett 2001;509:435–8. Pettus BJ, Chalfant CE, Hannun YA. (2002) Ceramide in apoptosis: an overview and current perspectives. Biochim Biophys Acta 2002;1585:114–25. Pignon JP, le Maître A, Maillard E, Bourhis J. Metaanalysis of chemotherapy in head and neck
cancer (MACH-NC): an update on 93 randomized trials and 17,346 patients. Radiother Oncol
2009;92:4-14.
Poeta ML, Manola J, Goldwasser MA, Forastiere A, Benoit N, Califano JA, et al. TP53 mutations
and survival in squamous-cell carcinoma of the head and neck. N Engl J Med 2007;357:2552-61.
Porcel E, Liehn S, Remita H, Usami N, Kobayashi K, Furusawa Y, et al. Platinum nanoparticles: a
promising material for future cancer therapy? Nanotechnology 2010;21:85103.
Porcel E, Tillement O, Lux F, Mowat P, Usami N, Kobayashi K, et al. Gadolinium-based nanoparticles to improve the hadrontherapy performances. Nanomedicine 2014;10:1601-8.
Posner MR, Hershock DM, Blajman CR, Mickiewicz E, Winquist E, Gorbounova V, et al. Cisplatin
and fluorouracil alone or with docetaxel in head and neck cancer. N Engl J Med 2007;357:1705-
15.
Potiron VA, Abderrahmani R, Giang E, Chiavassa S, Di Tomaso E, Maira SM, et al. Radiosensitization of prostate cancer cells by the dual PI3K/mTOR inhibitor BEZ235 under normoxic and hypoxic conditions. Radiother Oncol 2013;106:138-46.
Bibliography References
308
Prados MD, Chang SM, Butowski N, DeBoer R, Parvataneni R, Carliner H, et al. Phase II study of erlotinib plus temozolomide during and after radiation therapy in patients with newly diagnosed glioblastoma multiforme or gliosarcoma. J Clin Oncol 2009;27:579-584. Predescu D, Vogel SM, Malik AB. Functional andmorphological studies of protein transcytosis in continuous endothelia. Am J Physiol Lung Cell Mol Physiol 2004;287:L895–L901. Prime SS, Davies M, Pring M, Paterson IC. The role of TGF-beta in epithelial malignancy and its
relevance to the pathogenesis of oral cancer (part II). Crit Rev Oral Biol Med 2004;15:337-47.
Prithivirajsingh S, Story MD, Bergh SA, Geara FB, Ang KK, Ismail SM, et al. Accumulation of the common mitochondrial DNA deletion induced by ionizing radiation. FEBS Lett 2004;571:227-32.
Q Qu W, Chen WH, Kuang Y, Zeng X, Cheng SX, Zhou X, et al. Avidin–biotin interaction mediated peptide assemblies as efficient gene delivery vectors for cancer therapy. Mol Pharm 2013;10:261–69. Qin H, Luo J, Zhu YP, Xi HL, Yang WQ, Lei WB. Combination of taxanes, cisplatin and fluorouracil
as induction chemotherapy for locally advanced head and neck cancer: a meta-analysis. PLoS
One 2012;7:e51526.
Quinlan CL, Treberg JR, Perevoshchikova IV, Orr AL, Brand MD. Native rates of superoxide production from multiple sites in isolated mitochondria measured using endogenous reporters. Free Radic Biol Med 2012;53:1807-17.
R Raben D, Helfrich B, Chan DC, Ciardiello F, Zhao L, Franklin W, et al. The effects of cetuximab alone and in combination with radiation and/or chemotherapy in lung cancer. Jr Clin Cancer Res 2005;11:795-805. Raghavan P, Tumati V, Yu L, Chan N, Tomimatsu N, Burma S, et al. AZD5438, an inhibitor of Cdk1, 2, and 9, enhances the radiosensitivity of non-small cell lung carcinoma cells. Int J Radiat Oncol Biol Phys 2012;84(4):e507-14.
Bibliography References
309
Rahman WN, Bishara N, Ackerly T, He CF, Jackson P, Wong C, et al. Enhancement of radiation effects by gold nanoparticles for superficial radiation therapy. Nanomed Nanotechnol Biol Med 2009;5:136–42. Rainaldi G, Ferrante A, Indovina PL, Santini MT. Induction of apoptosis or necrosis by ionizing radiation is dose-dependent in MG-63 osteosarcoma multicellular spheroids. Anticancer Res 2003;23:2505–18. Raybaud-Diogène H, Fortin A, Morency R, Roy J, Monteil RA, Têtu B. Markers of radioresistance in squamous cell carcinomas of the head and neck: a clinocopathologic and immunohistochemical study. J Clin Oncol 1997;15:1030-8. Reits EA, Hodge JW, Herberts CA, Groothuis TA, Chakraborty M, Wansley EK, et al. Radiation
modulates the peptide repertoire, enhances MHC class I expression, and induces successful
antitumor immunotherapy. J Exp Med 2006;203:1259–71.
Retif P, Pinel S, Toussaint M, Frochot, Chouikrat R, Bastogne T et al. Nanoparticles for Radiation Therapy Enhancement : the Key Parameters. Theranostics 2015;5:1030-45. Richards GM, Mehta MP. Motexafin gadolinium in the treatment of brain metastases. Expert Opin Pharmacother 2007;8:351-9. Riesterer O, Matsumoto F, Wang L, Pickett J, Molkentine D. Giri U, et al. A novel Chk inhibitor, XL-844, increases human cancer cell radiosensitivity through promotion of mitotic catastrophe. Investig New Drugs 2011;29:514–522. Rim KT, Song SW, Kim HY. Oxidative DNA damage from nanoparticle exposure and its
application to workers’ health: a literature review. Saf Health Work 2013;4:177-86.
Rima W, Sancey L, Aloy MT, Armandy E, Alcantara GB, Epicier T, et al. Internalization pathways
into cancer cells of gadolinium-based radiosensitizing nanoparticles. Biomaterials 2013;34:181-
95
Rivera Gil P, Hühn D, del Mercato LL, Sasse D, Parak WJ. Nanopharmacy: inorganic nanoscale devices as vectors and active compounds. Pharmacol Res 2010;62:115–25. Roa W, Zhang X, Guo L, Shaw A, Hu X, Xiong Y, et al. Gold nanoparticle sensitize radiotherapy of prostate cancer cells by regulation of the cell cycle. Nanotechnology 2009;20:375101. Rodriguez CP, Adelstein DJ, Rybicki LA, Saxton JP, Lorenz RR, Wood BG, et al. Single-arm phase II
study of multiagent concurrent chemoradiotherapy and gefitinib in locoregionally advanced
squamous cell carcinoma of the head and neck. Head Neck 2012;34:1517-23.

Bibliography References
310
Rodríguez-Vargas JM, Ruiz-Magaña MJ, Ruiz-Ruiz C, Majuelos, Melguizo J, Peralta-Leal A, et al. ROS-induced DNA damage and PARP-1 are required for optimal induction of starvation-induced autophagy. Cell Res 2012;22:1181-98. Rogosnitzky M, Branch S. Gadolinium-based contrast agent toxicity: a review of known and
proposed mechanisms. Biometals 2016;29:365-76.
Rohrer M, Bauer H, Mintorovitch J, Requardt M, Weinmann HG. Comparison of magnetic properties of MRI contrast media solutions at different magnetic field strengths. Invest Radiol 2005;40:715-24. Ross RW, Zietman AL, Xie W, Coen JJ, Dahl DM, Shipley WU, et al. Lymphotropic nanoparticle-enhancedmagnetic resonance imaging (LNMRI) identifies occult lymph node metastases in prostate cancer patients prior to salvage radiation therapy. Clin Imaging 2009;33:301–05. Ruvolo PP. Intracellular signal transduction pathways activates by ceramide and its metabolites. Pharm Res 2003;47:383 – 92.
S Sabharwal SS and Schumacker PT. Mitochondrial ROS in cancer: initiators, amplifiers or an Achilles’ heel? Nat Rev Cancer 2014;14:709-21. Sacco AG, Cohen EE. Current treatment options for recurrent or metastatic head and neck
squamous cell carcinoma. J Clin Oncol 2015;33:3305–13.
Saftig, P. Lysosomal membrane proteins. In: Saftig, P., editor. Lysosomes, Eurekah, Landes Bioscience. Springer Science and Business Media; New York: 2005. p. 37-49. Georgetown. Saglar E, Unlu S, Babalioglu I, Gokce SC, Mergen H. Assessment of ER stress and autophagy
induced by ionizing radiation in both radiotherapy patients and ex vivo irradiated samples. J
Biochem Mol Toxicol 2014;28:413-17.
Saki M, Toulany M, Rodemann HP. Acquired resistance to cetuximab is associated with the
overexpression of Ras family members and the loss of radiosensitization in head and neck
cancer cells. Radiother Oncol 2013;108:473-8.
Šalovská B, Fabrik I, Ďurišová K, Link M, Vávrová J, Řezáčová M, et al. Radiosensitization of human leukemic HL-60 cells by ATR kinase inhibitor (VE-821): phosphoproteomic analysis. Int J Mol Sci. 2014;15:12007-26.

Bibliography References
311
Sancey L, Kotb S, Truillet C, Appaix F, Marais A, Thomas E, et al. Long-term in vivo clearance of gadolinium-based AGuIX nanoparticles and their biocompatibility after systemic injection. ACS Nano 2015;9:2477-88. Sancey L, Lux F, Kotb S, Roux S, Dufort S, Bianchi A, et al. The use of theranostic gadolinium-
based nanoprobes to improve radiotherapy efficacy. Br J Radiol 2014;87:20140134.
Sandulache VC, Skinner HD, Ow TJ, Zhang A, Xia X, Luchak JM, et al. Individualizing
antimetabolic treatment strategies for head and neck squamous cell carcinoma based on TP53
mutational status. Cancer 2012;118:711-21.
Sankunny M, Rarikh RA, Lewis DW, Gooding WE, Saunders WS, Gollin SM. Targeted inhibition of
ATR or CHEK1 reverses radioresistance in oral squamous cell carcinoma cells with distal
chromosome arm 11q loss. Genes Chromosomes Cancer 2014;53:129-43.
Santivasi WL, Xia F. Ionizing radiation-induced DNA damage, response, and repair. Antioxid
Redox Signal 2014;21:251-9.
Sawhney M, Rohatgi N, Kaur J, Shishodia S, Sethi G, Gupta SD, et al. Expression of NF-kappaB
parallels COX-2 expression in oral precancer and cancer: association with smokeless tobacco.
Int J cancer 2007;120:2545-56.
Sayes CM, Gobin AM, Ausman KD, Mendez J, West JL, Colvin VL. Nano-C60 cytotoxicity is due to lipid peroxidation. Biomaterials 2005;26:7587-95. Schilling D, Garrido C, Combs SE, Multhoff G. The Hsp70 inhibiting peptide aptamer A17 potentiates radiosensitization of tumor cells by Hsp90 inhibition. Cancer Lett 2017;390:146-152. Schleicher SM, Moretti L. Varki V, Lu B. Progress in the unraveling of the endoplasmic reticulum stress/autophagy pathway and cancer: implications for future therapeutic approaches. Drug Resist Updat 2010;13:79-86. Schmidt B, Lee HJ, Ryeom S, Yoon SS. Combining bevacizumab with radiation or chemoradiation for solid tumors: a review of the scientific rationale, and clinical trials. Curr Angiogenes 2012;1:169-179. Schroeder JE, Shweky I, Shmeeda H, Banin U, Gabizon A. Folate-mediated tumor cell uptake of quantum dots entrapped in lipid nanoparticles. J Control Release 2007;124:28–34. Seeta Rama Raju G, Benton L, Pavitra E, Su Yu J. Multifunctional nanoparticles : recent progress in cancer therapeutics. Chem Commun 2015;51:13248.
Bibliography References
312
Semenza GL. Targeting HIF-1 for cancer therapy. Nat Rev Cancer 2003;3:721-32. Sena LA, Li S, Jairaman A, Prakriya M, Ezponda T, Hildeman DA, et al. Mitochondria are required for antigen-specific T cell activation through reactive oxygen species signaling. Immunity 2013;38:225-36. Sentelle RD, Senkal CE, Jiang W, Ponnusamy S, Gencer S, Selvam SP, et al. Ceramide targets autophagosomes to mitochondria and induces lethal mitophagy. Nat Chem Biol 2012;8:831-8. Seymour LW, Ferry DR, Kerr DJ, Rea D, Whitlock M, Poyner R, et al. Phase II studies of polymer-doxorubicin (PK1, FCE28068) in the treatment of breast, lung and colorectal cancer. Int J Oncol 2009;34:1629–1636. Shadel GS, Horvath TL. Mitochondrial ROS signaling in organismal homeostasis. Cell
2015;163:560-9.
Sharabi AB, Nirschl CJ, Kochel CM, Nirschl TR, Francica BJ, Velarde E, et al. Stereotactic radiation
therapy augments antigen-specific PD-1 mediated anti-tumor immune responses via cross-
presentation of tumor antigen. Cancer Immunol Res 2015;3:345–55.
Sheard MA. Ionizing radiation as a response-enhancing agent for CD95-mediated apoptosis. Int J Cancer 2001;96:213-20. Shen L, Fang H, Chen T, He J, Zhang M, Wei X, et al. Evaluating mitochondrial DNA in cancer occurrence and development. Ann N Y Acad Sci 2010;1201:26-33. Shen LF, Chen J, Zeng S, Zhou RR, Zhu H, Zhong MZ, et al. The superparamagnetic nanoparticles carrying the E1A gene enhance the radiosensitivity of human cervical carcinoma in nude mice. Mol Cancer Ther 2010;9:2123-30. Shintani T, Klionsky DJ. Autophagy in health and disease: a double-edged sword. Science
2004;306:990-5.
Siegel RL, Miller KD, Jemal A. Cancer statistics, 2016. CA Cancer J Clin 2016;66:7–30.
Silver J, Ou W. Photoactivation of quantum dot fluorescence following endocytosis. Nano Lett 2005;5:1445–49. Skinner HD, Sandulache VC, Ow TJ, Meyn RE, Yordy JS, Beadle BM, et al. TP53 disruptive
mutations lead to head and neck cancer treatment failure through inhibition of radiation-
induced senescence. Clin Cancer Res 2012;18:290-300.

Bibliography References
313
Small W, Jr., Mulcahy MF, Rademaker A, Bentrem DJ, Benson AB, Weitner BB, et al. Phase II trial of full-dose gemcitabine and bevacizumab in combination with attenuated three-dimensional conformal radiotherapy in patients with localized pancreatic cancer. Int J Radiat Oncol Biol Phys 2011;80:476-482. Soffar A, Storch K, Aleem E, Cordes N. CDK2 knowckdown enhances head and neck cancer cell
radiosensitivity. Int J Radiat Biol 2013;89:523-31.
Sommer A, Santi DV. Purification and amino acid analysis of an active site peptide from
thymidylate synthetase containing covalently bound 5’-fluoro-2’-deoxyuridylate and methylene
tetrachloride. Biochem Biophys Res Commun 1974;57:689-96.
Stanimirovic DB, Wong J, Ball R, Durkin JP. Free radical-induced endothelial membrane dysfunction at the site of blood-brain barrier: relationship between lipid peroxidation, Na, K-ATPase activity, and 51Cr release. Neurochem Res 1996;20:1417-27. Stauber RH, Knauer SK, Habtemichael N, Bier C, Unruhe B, Weisheit S, et al. A combination of a
ribonucleotide reductase inhibitor and histone deacetylase inhibitors downregulates EFGR and
triggers BIM-dependent apoptosis in head and neck cancer. Oncotarget 2012;3:31-43.
Steel GG, McMillan TJ, Peacock JH. The 5Rs of radiobiology. Int J Radiat Biol 1989;56:1045-8.
Štefančíková L, Lacombe S, Salado D, Porcel E, Pagáčová E, Tillement O, et al. Effect of
gadolinium-based nanoparticles on nuclear DNA damage and repair in glioblastoma tumor cells.
J Nanobiotechnology 2016;14:63.
Štefančíková L, Porcel E, Eustache P, Li S, Salado D, Marco S, et al. Cell localization of gadolinium-based nanoparticles and related radiosensitizing efficacy in glioblastoma cells. Cancer Nanotechnol 2014;5:6. Steglich A, Vehlow A, Eke I, Cordes N. α integrin targeting for radiosensitization of three-dimensionally grown human head and neck squamous cell carcinoma cells. Cancer Lett 2015;357:542-8. Stein GH, Drullinger LF, Soulard A, Dulić V. Differential roles for cyclin-dependent kinase inhibitors p21 and p16 in the mechanisms of senescence and differentiation in human fibroblasts. Mol Cell Biol 1999;19:2109-17. Stewart VC and Heales SJ. Nitric oxide-induced mitochondrial dysfunction implications for neurodegeneration. Free Radic Biol Med 2003;34:287–303.

Bibliography References
314
Sullivan LB and Chandel NS. Mitochondrial reactive oxygen species and cancer. Cancer Metab 2014;2:17. Sun C, Wang ZH, Liu XX, Yang LN, Wang Y, Liu Y, et al. Disturbance of redox status enhances radiosensitivity of hepatocellular carcinoma. Am J Cancer Res 2015;5:1368-81. Sun Q, Liu T, Yuan Y, Guo Z, Xie G, Du S, et al. MiR-200c inhibits autophagy and enhances
radiosensitivity in breast cancer cells by targeting UBQLN1. Int J Cancer 2015;136:1003-12.
Szatrowski TP, Nathan CF. Production of large amounts of hydrogen peroxide by human tumor cells. Cancer Res 1991;51:794-8.
T Taggart LE, McMahon SJ, Currell FJ, Prise KM, Butterworth KT. The role of mitochondrial function in gold nanoparticle mediated radiosensitization. Cancer Nanotechnol 2014;5:5. Takasawa R, Nakamura H, Mori T, Tanuma S. Differential apoptotic pathways in human keratinocyte HaCaT cells exposed to UVB and UVC. Apoptosis 2005;10:1121–30. Takeda M, Ohuchi N. X-ray absorption of gold nanoparticles with thin silica shell. J Nanosci Nanotechnol 2006;6:3503–06. Tam SY, Wu VW, Law HK. Influence of autophagy on the efficacy of radiotherapy. Radiat Oncol
2017;12:57.
Tanida I, Ueno T, Kominami E. LC3 and Autophagy. Methods Mol Biol 2008;445:77-88. Temam S, Kawaguchi H, El-Naggar AK, Jelinek J, Tang H, Liu DD, et al. Epidermal growth factor
receptor copy number alterations correlate with poor clinical outcome in patients with head
and neck squamous cancer. J Clin Oncol 2007;25:2164-70.
Tenopoulou M, Doulias PT, Barbouti A, Brunk U, Galaris D. Role of compartmentalized redox-active iron in hydrogen peroxide-induced DNA damage and apoptosis. Biochem J 2005;387:703-10. Thorley AJ, Tetley TD. New perspectives in nanomedicine. Pharmacol Ther 2013;140:176-85.
Tian D, Shi Y, Chen D, Liu Q, Fan F. The Wnt inhibitor LGK-974 enhances radiosensitivity of HepG2 cells by modulating Nrf2 signaling. Int J Oncol 2017;51:545-54.

Bibliography References
315
Todd R, Hinds PW, Munger K, Rustgi AK, Opitz OG, Suliman Y, et al. Cell cycle dysregulation in
oral cancer. Crit Rev Oral Biol Med 2002;13:51-61.
Toulany M, Dittmann K, Kruger M, Baumann M, Rodemann HP. Radioresistance of K-Ras
mutated human tumor cells is mediated through EGFR-dependent activation of PI3K-AKT
pathway. Radiother Oncol 2005;76:143-50.
Townley HE, Kim J, Dobson P. In vivo demonstration of enhanced radiotherapy using rare earth doped titania nanoparticles. Nanoscale 2012:4:5043-50. Tsai YC, Yeh CH, Tzen KY, Ho PY, Tuan TF, Pu YS, et al. Targeting epidermal growth factor receptor/human epidermal growth factor receptor 2 signalling pathway by a dual receptor tyrosine kinase inhibitor afatinib for radiosensitisation in murine bladder carcinoma. Eur J Cancer 2013;49:1458-66. Turrens JF. Mitochondrial formation of reactive oxygen species. J Physiol 2003;552:335-44.
V Valko M, Leibfritz D, Moncol J, Cronin MT, Mazur M, Telser J. Free radicals and antioxidants in normal physiological functions and human disease. Int J Biochem Cell Biol 2007;39:44-84. Vávrová J, Zárybnická L, Lukášová E, Řezáčová M, Novotná E, Sinkorová Z, et al. Inhibition of ATR kinase with the selective inhibitor VE-821 results in radiosensitization of cells of promyelocytic leukaemia (HL-60). Radiat Environ Biophys 2013;52:471-9. Vecchio D, Daga A, Carra E, Marubbi D, Baio G, Neumaier CE, et al. Predictability, efficacy and safety of radiosensitization of glioblastoma-initiating cells by the ATM inhibitor KU-60019. Int J Cancer 2014;135:479-91. Veeraraghavan J, Natarajan M, Lagisetty P, Awasthi V, Herman TS, Aravindan N. Impact of curcumin, raspberry extract, and neem leaf extract on rel protein-regulated cell death/radiosensitization in pancreatic cancer cells. Pancreas 2011;40:1107-19. Velic D, Couturier AM, Ferreira MR, Rodrigue A, Poirier GG, Fleury F, et al. DNA damage signaling and repair inhibitors: the long-sought-after Achilles’ heel of cancer. Biomol 2015;5:3204-59. Verma S, Miles D, Gianni L, Krop IE, Welslau M, Baselga J, et al. Trastuzumab emtansine for HER2 positive advanced breast cancer. N Engl J Med 2012;367:1783–1791.

Bibliography References
316
Verma V. Relationship and interactions of curcumin with radiation therapy. World J Clin Oncol 2016;7:275-83. Vermoken JB, Trigo J, Hitt R, Koralewski P, Diaz-Rubio E, Rolland F, et al. Open-label
uncontrolled, multicenter phase II study to evaluate the efficacy and toxicity of cetuximab as a
single agent in patients with recurrent and/or metastatic squamous cell carcinoma of the head
and neck who failed to respond to platinum-based therapy. J Clin Oncol 2007;25:2171-7.
Vermorken JB, Remenar E, van Herpen C, Gorlia T, Mesia R, Degardin M, et al. Cisplatin,
fluorouracil, and docetaxel in unresectable head and neck cancer. N Engl J Med 2007;357:1695-
704.
Vile R, Ando D, Kirn D. The oncolytic virotherapy treatment platform for cancer: Unique biological and biosafety points to consider. Cancer Gene Ther 2002;9:1062–1067. Vousden KH, Lane DP. P53 in health and disease. Nat Rev Mol Cell Biol 2007;8:275-83.
Vyas S, Zaganjor E, Haigis MC. Mitochondria and cancer. Cell 2016;166:555-66.
W Wang C, Li X, Wang Y, Liu Z, Fu L, Hu L. Enhancement of radiation effect and increase of apoptosis in lung cancer cells by thio-glucose-bound gold nanoparticles at megavoltage radiation energies. J Nanopart Res 2013;15:1642. Wang CH, Jiang YH, Li XH, Hu LK. Thioglucose-bound gold nanoparticles increase the radiosensitivity of a triple-negative breast cancer cell line (MDA-MB-231). Breast Cancer 2015;22:413–20. Wang CH, Li XH, Wang Y, Liu Z, Fu L, Hu LK. Enhancement of radiation effect and increase of apoptosis in lung cancer cells by thio-glucose-bound gold nanoparticles at megavoltage radiation energies. J Nanoparticle Res 2013;15:1642. Wang L, Meng J, Cao W, Li Q, Qiu Y, Sun B, et al. Induction of apoptosis through ER stress and TP53 in MCF-7 cells by the nanoparticle [Gd@C82(OH)22]n: A systems biology study. Methods 2014;67:394-406.
Bibliography References
317
Wang M, Morsbach F, Sander D, Gheorghiu L, Nanda A, Benes C, et al. EGF receptor inhibition radiosensitizes NSCLC cells by inducing senescence in cells sustaining DNA double-strand breaks. Cancer Res 2011;71:6261-9. Wang X, Ma Z, Xiao Z, Liu H, Dou Z, Feng X, et al. Chk1 knockdown confers radiosensitization in prostate cancer stem cells. Oncol Rep 2012;28:2247-54. Wang Y, Sun C, Mao A, Zhang X, Zhou X, Wang Z, et al. Radiosensitization to X-ray radiation by telomerase inhibitor MST-312 in human hepatoma HepG2 cells. Life Sci 2015;123:43-50. Wang YH, Chen Z, Zhou XQ. Synthesis and photoluminescence of ZnS quantum dots. J Nanosci Nanotechnol 2008;8:1312-5. Wardman P. Chemical radiosensitizers for use in radiotherapy. Clin Oncol (R Coll Radiol)
2007;19:397-417.
Watson C, Miller DA, Chin-Sinex H, Losch A, Hughes W, Sweeney C, et al. Suppression of NF-kappaB activity by parthenolide induces X-ray sensitivity through inhibition of split-dose repair in TP53 null prostate cancer cells. Radiat Res 2009;171:389-96. Weaver VM, Lelièvre S, Lakins JN, Chrenek MA, Jones JCR, Giancotti F, et al. beta4 integrin-dependent formation of polarized three-dimensional architecture confers resistance to apoptosis in normal and malignant mammary epithelium. Cancer Cell 2002;2:205–16. Wegner KD and Hildebrandt N. Quantum dots: bright and versatile in vitro and in vivo fluorescence imaging biosensors. Chem Soc Rev 2015;44:4792-834. Wei F, Wang Y, Luo Z, Li Y, Duan Y. New findings of silica nanoparticles induced ER autophagy in human colon cancer cell. Sci Rep 2017;7:42591. Wei-Lin L, Ming G, Kai-Yuan T, Chiao-Ling T, Feng-Ming H, Ann-Lii C, et al. Targeting Phosphatidylinositide3-Kinase/Akt pathway by BKM120 for radiosensitization in hepatocellular carcinoma. Oncotarget 2014;5:3662–3672. Weiss GJ, Chao J, Neidhart JD, Ramanathan RK, Bassett D, Neidhart JA, et al. First-in-human phase 1/2a trial of CRLX101, a cyclodextrin-containing polymercamptothecin nanopharmaceutical in patients with advanced solid tumor malignancies. Invest New Drugs 2013;31:986–1000. Wener ME, Copp JA, Karve S, Cummings ND, Sukumar R, Li C, et al. Folate-targeted polymeric nanoparticle formulation of docetaxel is an effective molecularly targeted radiosensitizer with efficacy dependent on the timing of radiotherapy. ACS Nano 2011;5:8990-8.
Bibliography References
318
Werner ME, Cummings ND, Sethi M, Wang EC, Sukumar R, Moore DT, et al. Preclinical evaluation of Genexo-PM, a nanoparticle formulation of paclitaxel, as a novel radiosensitizer for the treatment of non-small cell lung cancer. Int J Radiat Oncol Biol Phys 2013;86:463-68. Weterings E, Chen DJ. The endless tale of non-homologous end-joining. Cell Res 2008;18:114-
24.
Wicki A, Rochlitz C, Orleth A, Ritschard R, Albrecht I, Herrmann R, et al. Targeting tumor-associated endothelial cells: anti-VEGFR2 immunoliposomes mediate tumor vessel disruption and inhibit tumor growth. Clin Cancer Res 2012;18:454–64. Wicki A, Witzigmann D, Balasubramanian V, Huwyler J. Nanomedicine in cancer therapy:
Challenges, opportunities, and clinical applications. J Control Release 2015;200:138-57.
Wilkins MR, Pasquali C, Appel RD, Ou K, Golaz O, Sanchez JC, et al. From proteins to
proteomes : large scale protein identification by two-dimentional electrophoresis and amino
acid analysis. Biotechnology (NY) 1996;14:61-5.
Williams TM, Flecha AR, Keller P, Ram A, Karnak D, Galbán S, et al. Cotargeting MAPK and PI3K signaling with concurrent radiotherapy as a strategy for the treatment of pancreatic cancer. J Mol Cancer Ther 2012;11:1193-202. Wolfe T, Chatterjee D, Lee J, Grant JD, Bhattarai S, Tailor R, et al. Targeted gold nanoparticles enhance sensitization of prostate tumors to megavoltage radiation therapy in vivo. Nanomedicine 2015;11:1277–83. Wolters DA, Washburn MP, Yates JR 3rd. An automated multidimensional protein identification
technology for shotgun proteomics. Anal Chem 2001;73:5683-90.
Wozny AS, Lauret A, Battiston-Montagne P, Guy JB, Beuve M, Cunha M, et al. Differential pattern of HIF-1α expression in HNSCC cancer stem cells after carbon ion or photon irradiation: one molecular explanation of the oxygen effect. Br J Cancer 2017;116:1340-1349. Wu CC and Bratton SB.Regulation of the Intrinsic Apoptosis Pathway by Reactive Oxygen Species. ANTIOXIDANTS & REDOX SIGNALING 2013, Volume 19, Number 6, 546-558. Wu SY, Liu YW, Wang YK, Lin TH, Li YZ, Chen SH et al. Ionizing radiation induces autophagy in human oral squamous cell carcinoma. J BUON 2014;19:137-44. Wu X, Zhang J, Yang S, Kuang Z, Tan G, Yang G, et al. Telomerase antagonist imetelstat increases radiation sensitivity in esophageal squamous cell carcinoma. Oncotarget 2017;8:13600-13619.
Bibliography References
319
Wurster S, Hennes F, Parplys AC, Seelbach JI, Mansour WY, Zielinski A, et al. PARP1 inhibition radiosensitizes HNSCC cells deficient in homologous recombination by disabling the DNA replication fork elongation response. Oncotarget. 2016;7:9732-41.
X Xia T, Kovochich M, Brant J, Hotze M, Sempf J, Oberley T, et al. Comparison of the abilities of
ambient and manufactured nanoparticles to induce cellular toxicity according to an oxidative
stress paradigm. Nano Lett 2006;6:1794-807.
Xu W, Teng L, Pang B, Li P, Zhou C, Huang P, et al. The Radiosensitization Of Melanoma Cells By Gold Nanorods Irradiated With MV X-Ray. Nano Biomed Eng 2012;4:6-11. Xu WH, Han M, Dong Q, Fu ZX, Dia YY, Liu H, et al. Doxorubicin-mediated radiosensitivity in multicellular spheroids from a lung cancer cell line is enhanced by composite micelle encapsulation. Int J Nanomedicine 2012;7:2661-71. Xu Y, Fang F, Miriyala S, Crooks PA, Oberley TD, Chaiswing L, et al. KEAP1 is a redox sensitive target that arbitrates the opposing radiosensitive effects of parthenolide in normal and cancer cells. Cancer Res 2013;73:4406-17. Xu Y, Fang F, Miriyala S, Crooks PA, Oberley TD, Chaiswing L, et al. KEAP1 is a redox sensitive target that arbitrates the opposing radiosensitive effects of parthenolide in normal and cancer cells. Cancer Res 2013;73:4406-17.
Y Yamamoto VN, Thylur DS, Bauschard M, Schmale I, Sinha UK. Overcoming radioresistance in
head and neck squamous cell carcinoma. Oral Oncol 2016;63:44-51.
Yang W, Shen Y, Wei J, Liu F. MicroRNA-153/Nrf-2/GPx1 pathway regulates radiosensitivity and stemness of glioma stem cells via reactive oxygen species. Oncotarget 2015;6:22006-27. Yang Y, Yang Y, Yang X, Whu H, Guo W , Chen X, et al. Autophagy and its function in
radiosensitivity. Tumour Biol 2015;36:4079-87.
Yang X, Zhu H, Ge Y, Liu J, Cai J, Qin Q, et al. Melittin enhances radiosensitivity of hypoxic head and neck squamous cell carcinoma by suppressing HIF-1α. Tumour Biol 2014;35:10443-8.
Bibliography References
320
Yates JR 3rd. Mass spectral analysis in proteomics. Annu Rev Biophys Biomol Struct 2004;33:297-
316.
Yates JR 3rd. Mass spectrometry and the age of the proteome. J Mass Spectrom 1998;33:1-19.
Ye H, Yu T, Teman S, Ziober BL, Wang J, Schwarz JL, et al. Transcriptomic dissection of tongue
squamous cell carcinoma. BMC Genomics 2008;9-69.
Yin L, Gao Y, Zhang X, Wang J, Ding D, Zhang Y, et al. Niclosamide sensitizes triple-negative breast cancer cells to ionizing radiation in association with the inhibition of Wnt/β-catenin signaling. Oncotarget 2016;7:42126-42138. Yong Y, Cheng X, Bao T, Zu M, Yan L, Yin W, et al. Tungsten Sulfide Quantum Dots as Multifunctional Nanotheranostics for In Vivo Dual-Modal Image-Guided Photothermal/Radiotherapy Synergistic Therapy. ACS Nano 2015;9:12451-63. Yoshimoto Y, Suzuki Y, Mimura K, Ando K, Oike T, Sato H, et al. Radiotherapy-induced anti-
tumor immunity contributes to the therapeutic efficacy of irradiation and can be augmented by
CTLA-4 blockade in a mouse model. PLoS One 2014;9:e92572.
Younes A, Bartlett NL, Leonard JP, Kennedy DA, Lynch CM, Sievers EL, et al. Brentuximab vedotin (SGN-35) for relapsed CD30-positive lymphomas, N Engl J Med 2010;363:1812–1821. Yousefi S, Perozzo R, Schmid I, Ziemiecki A, Schaffner T, Scapozza L, et al. Calpain-mediated
cleavage of Atg5 switches autophagy to apoptosis. Nat Cell Biol 2006;8:1124-32.
Yu Z., Persson HL, Eaton JW, Brunk UT. Intralysosomal iron: a major determinant of oxidant-
induced cell death. Free Radic Biol Med 2003;34:1243–52.
Z Zeng J, See AP, Phallen J, Jackson CM, Belcaid Z, Ruzevick J, et al. Anti-PD-1 blockade and
stereotactic radiation produce long-term survival in mice with intracranial gliomas. Int J Radiat
Oncol Biol Phys 2013;86:343–49.
Zerp SF, Stoter TR, Hoebers FJ, van den Brekel MW, Dubbelman R, Kuipers GK, et al. Targeting anti-apoptotic Bcl-2 by AT-101 to increase radiation efficacy: data from in vitro and clinical pharmacokinetic studies in head and neck cancer. Radiat Oncol 2015;10:158.

Bibliography References
321
Zhang J, Chiu J, Zhang H, Qi T, Tang Q, Ma K, et al. Autophagic cell death induced by resveratrol depends on the Ca(2+)/AMPK/mTOR pathway in A549 cells. Biochem Pharmacol 2013;86:317-28. Zhang Q, Yang W, Man N, Zheng F, Shen Y, Sun K, et al. Autophagy-mediated chemosensitization in cancer cells by fullerene C60 nanocrystal. Autophagy 2009;5:1107-17. Zhang Q, Zhang C, He J, Guo Q, Hu D, Yang X, et al. STAT3 inhibitor stattic enhances radiosensitivity in esophageal squamous cell carcinoma. Tumour Biol 2015;36:2135-42. Zhang X, Xing JZ, Chen J, Ko L, Amanie J, Gulavita S, et al. Enhanced radiation sensitivity in prostate cancer by gold-nanoparticles. Clin Invest Med 2008;31:E160–E167. Zhang XD, Chen J, Luo Z, Wu D, Shen X, Song SS, et al. Enhanced tumor accumulation of Sub-2 nm gold nanoclusters for cancer radiation therapy. Adv Healthcare Mater 2014;3:133–41. Zhang XD, Wu D, Shen X, Chen J, Sun YM, Liu PX, et al. Size-dependent radiosensitization of PEG-coated gold nanoparticles for cancer radiation therapy. Biomaterials 2012;33:6408–19. Zhang Y, Fonslow BR, Shan B, Baek MC, Yates JR 3rd. Protein analysis by Shotgun/Bottom-Up
Proteomics. Chem Rev 2013;113:2343-94.
Zhang Y, Yao B, Delikat S, Bayoumy S, Lin XH, Basu S, et al. Kinase suppressor of Ras is ceramide-activated protein kinase. Cell 1997;89:63–72. Zhao D, Sun X, Tong J, Ma J, Bu X, Xu R, et al. A novel multifunctional nanocomposite C225-conjugated Fe3O4/Ag enhances the sensitivity of nasopharyngeal carcinoma cells to radiotherapy. Acta Biochim Biophys Sin (Shangai) 2012;44:678-84. Zheng Q, Yang H, Wei J, Tong JL, Shu YQ. The role and mechanisms of nanoparticles to enhance radiosensitivity in hepatocellular cell. Biomed Pharmacother 2013;67:569-75. Zhou M, Ghosh I. Quantum dots and peptides: a bright future together. Biopolymers 2007;88:325– 39. Zhou S, Ye W, Shao Q, Zhang M, Liang J. Nrf2 is a potential therapeutic target radioresistance in
human cancer. Crit Rev Oncol Hematol 2013;88:706-15.
Zhu Y, Shi LY, Lei YM, Bao YH, Li ZY, Ding F, et al. Radiosensitization effect of hsa-miR-138-2-3p on human laryngeal cancer stem cells. PeerJ 2017;5:e3233. Zhu Y1, Shi LY2, Lei YM3, Bao YH3, Li ZY4, Ding F4, et al. Radiosensitization effect of hsa-miR-138-2-3p on human laryngeal cancer stem cells. PeerJ 2017;5:e3233.
Bibliography References
322
Ziober AF, Patel KR, Alawi F, Gimotty P, Weber RS, Feldman MM, et al. Identification of a gene
signature for rapid screening of oral squamous cell carcinoma. Clin Cancer Res 2006;23:5960.
Zorov DB, Juhaszova M, Sollott SJ. Mitochondrial reactive oxygen species (ROS) and ROS-induced ROS release. Physiol Rev 2014;94:909-50. Zou J, Qiao X, Ye H, Yang Y, Zheng X, Zhao H, et al. Antisense inhibition of ATM gene enhances the radiosensitivity of head and neck squamous cell carcinoma in mice. J Exp Clin Cancer Res 2008;27:56.

323
Annexes

324

325
Annex 1: The DNA damage response pathways and its inhibitors. Ongoing
clinical trials and targets. (Velic et al., 2015)

326
Annex 2: AGuIX® synthesis and characterization during the synthesis
Gadolinium-based nanoparticles are synthesized in five main steps:
- The first step consists in the synthesis of the oxide core Gd2O3: GdCl3 is dissolved in diethylene glycol (DEG) and reacts with concentrated sodium hydroxide (10 M) to form the Gd2O3 core.
- In the second one, the Gd2O3 core is englobed by a polysiloxane layer by adding TEOS (tetraethyl orthosilicate) and APTES (3-aminopropyl)triethoxysilane). A mix of DEG, ultra-pure dH2O and the catalyzer TEA (triethylamine) is added in parallel. The “coating” is followed by measuring the nanoparticles’ size by DLS (Dynamic Light Scattering) every 24 hours. At the end of the reaction, the temperature as well as the agitation are decreased and the solution must stay at room temperature for at least 72 hours.
- The third step, performed at room temperature for 48 to 72 hours, is grafting the DOTAGA which consists in the reaction between the anhydride present on the DOTAGA anhydride and the amines present at the surface of the nanoparticle to create amide bonds.
- In the fourth step, the nanoparticles are precipitated in acetone, filtrated under vacuum and then re-dispersed in ultra-pure dH2O. The solution is left to mature for one hour prior to evaporating the acetone under a ventilated hood. The solution is then purified by tangential filtration at 5 kDa and left to rest for a minimum of 12 hours: this purification/rest step is repeated three times. The particles’ purity is then verified by HPLC: if the ratio area of the principal peak/total area of all peaks is superior or equal to 90%, the solution is filtered through a 1.2 µm followed by a 0.2 µm filter.
- Finally, in order to store the nanoparticles’ solution, the last step consists in the lyophilization and conditioning of the nanoparticles. For it, the solution is first divided in pilulier and frozen at -80°C for more than 2h prior to being lyophilized (in the next 7 days after freezing, the pressure is of 0.041 mbar, for a time of 48 hours or more). The samples are then conditioned and labeled. Figure 29 represents all the synthesis steps described for the formulation of AGuIX® (Mignot et al., 2013)

327
Figure 29: Scheme of SRP synthesis a) core synthesis; b) polysiloxane shell synthesis; c) DOTAGA grafting; d)
transfer to water; e) core dissolution, f) polysiloxane fragmentation (Mignot et al., 2013)
Throughout the synthesis steps, the nanoparticles are characterized with different techniques: their size is controlled using DLS followed by HPLC. At the end of the fourth step, a measure by relaxometry is done to determine the T1- relaxation time value. The concentrations in gadolinium (bound and free) are measured, as well as the synthesis yield.

328
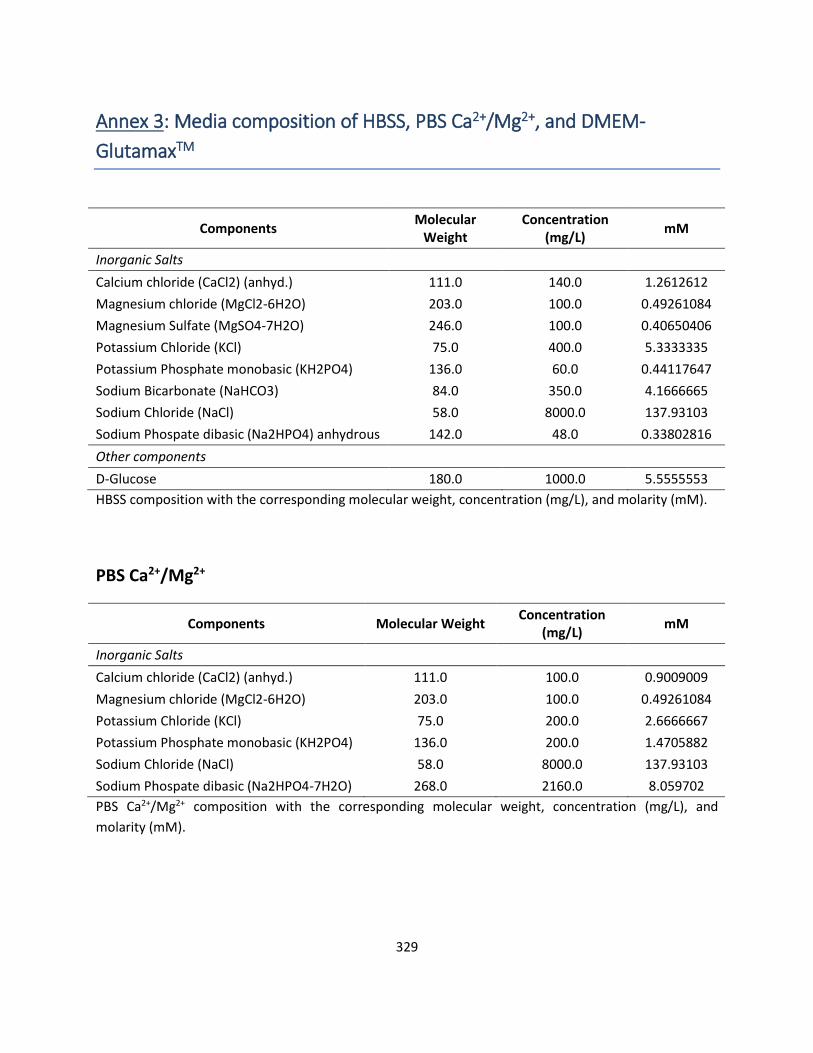
329
Annex 3: Media composition of HBSS, PBS Ca2+/Mg2+, and DMEM-
GlutamaxTM
Components Molecular
Weight Concentration
(mg/L) mM
Inorganic Salts
Calcium chloride (CaCl2) (anhyd.) 111.0 140.0 1.2612612
Magnesium chloride (MgCl2-6H2O) 203.0 100.0 0.49261084
Magnesium Sulfate (MgSO4-7H2O) 246.0 100.0 0.40650406
Potassium Chloride (KCl) 75.0 400.0 5.3333335
Potassium Phosphate monobasic (KH2PO4) 136.0 60.0 0.44117647
Sodium Bicarbonate (NaHCO3) 84.0 350.0 4.1666665
Sodium Chloride (NaCl) 58.0 8000.0 137.93103
Sodium Phospate dibasic (Na2HPO4) anhydrous 142.0 48.0 0.33802816
Other components
D-Glucose 180.0 1000.0 5.5555553
HBSS composition with the corresponding molecular weight, concentration (mg/L), and molarity (mM).
PBS Ca2+/Mg2+
Components Molecular Weight Concentration
(mg/L) mM
Inorganic Salts
Calcium chloride (CaCl2) (anhyd.) 111.0 100.0 0.9009009
Magnesium chloride (MgCl2-6H2O) 203.0 100.0 0.49261084
Potassium Chloride (KCl) 75.0 200.0 2.6666667
Potassium Phosphate monobasic (KH2PO4) 136.0 200.0 1.4705882
Sodium Chloride (NaCl) 58.0 8000.0 137.93103
Sodium Phospate dibasic (Na2HPO4-7H2O) 268.0 2160.0 8.059702
PBS Ca2+/Mg2+ composition with the corresponding molecular weight, concentration (mg/L), and
molarity (mM).

330
DMEM-GlutamaxTM composition with the corresponding molecular weight, concentration (mg/L), and
molarity (mM).
Components Molecular Weight Concentration
(mg/L) mM
Amino Acids
Glycine 75.0 30.0 0.4
L-Alalanyl L Glutamine 217.0 862.0 3.9723501
L-arginine hydrochloride 211.0 84.0 0.39810428
L-Cystine 2HCl 313.0 63.0 0.20127796
L-Histidine hydrochloride-H2O 210.0 42.0 0.2
L-Isoleucine 131.0 105.0 0.8015267
L-Leucine 131.0 105.0 0.8015267
L-Lysine hydrochloride 183.0 146.0 0.7978142
L-Methionine 149.0 30.0 0.20134228
L-Phenylalanine 165.0 66.0 0.4
L-Serine 105.0 42.0 0.4
L-Threonine 119.0 95.0 0.79831934
L-Tryptophan 204.0 16.0 0.078431375
L-Tyrosine 181.0 72.0 0.39779004
L-Valine 117.0 94.0 0.8034188
Vitamins
Choline chloride 140.0 4.0 0.028571429
D-Calcium pantothenate 477.0 4.0 0.008385744
Folic Acid 441.0 4.0 0.009070295
Niacinamide 122.0 4.0 0.032786883
Pyridoxine hydrochloride 206.0 4.0 0.019417476
Riboflavin 376.0 0.4 0.0010638298
Thiamine hydrochloride 337.0 4.0 0.011869436
i-Inositol 180.0 7.2 0.04
Inorganic Salts
Calcium Chloride (CaCl2-2H2O) 147.0 264.0 1.7959183
Ferric Nitrate (Fe(NO3)3"9H2O) 404.0 0.1 2.4752476E-4
Magnesium Sulfate (MgSO4-7H2O) 246.0 200.0 0.8130081
Potassium Chloride (KCl) 75.0 400.0 5.3333335
Sodium Bicarbonate (NaHCO3) 84.0 3700.0 44.04762
Sodium Chloride (NaCl) 6400.0 6400.0 110.344826
Sodium Phosphate monobasic (NaH2PO4-2H2O)
154.0 141.0 0.91558444
Other Components
D-Glucose (Dextrose) 180.0 4500.0 25.0
Phenol Red 376.4 15.0 0.039851222

331
Oral and Poster Communications
Oral Communications Stephanie Simonet*, Marie Therese Aloy, Emma Armandy, Marc Janier, Olivier Tillement,
Francois Lux, Michael Beuve, Jean Luc Ravanat, Walid Rachidi, Claire Rodriguez-Lafrasse,
Dominique Ardail. The use of gadolinium-based nanoparticles to improve radiation therapy
efficacy in HNSCC. 15th International Congress of Radiation Research (ICRR 2015). May 25-29,
2015. Kyoto, Japan.
S Simonet*, MT Aloy, E Armandy, O Tillement, F Lux, JL Ravanat, W Rachidi, C Rodriguez-
Lafrasse, D Ardail. Les nanoparticules à base de gadolinium associées à la radiothérapie : intérêt
dans le traitement des cancers des Voies Aérodigestives Supérieures. SIRLaF CIRFA 13- 13ème
Colloque International de Radiobiologie Fondamentale et Appliquée. November 8-12, 2015.
Obernai, France.
Stephanie Simonet*, Dominique Ardail, Walid Rachidi. The use of gadolinium-based
nanoparticles to improve radiation therapy in HNSCC. Journée LabEx. October 10th, 2016.
Villeurbanne, France.
Stephanie Simonet*, Dominique Ardail, Walid Rachidi. The use of gadolinium-based
nanoparticles to improve radiation therapy in HNSCC. Journée EDISS. October 13th, 2016.
Villeurbanne, France.
Stephanie Simonet*, Dominique Ardail, Walid Rachidi. The use of gadolinium-based
nanoparticles to improve radiation therapy in HNSCC. February 20th, 2017. Grenoble, France.
Stephanie Simonet, Dominique Ardail, Walid Rachidi. Modulation of the proteomic profile in
SQ20B HNSCC cell line after Gd-nanoparticles radiosensitization. Nanohybrides 14- May 29th-
June 2nd, 2017. Bastia, Corsica, France.
Poster S Simonet*, E Armandy, C Malesys, D Beal, S Gerbaud, O Tillement, F Lux, JL Ravanat, W
Rachidi, C Rodriguez-Lafrasse, D Ardail. The use of the gadolinium-based AGuIX nanoparticles to
improve radiation therapy efficacy in Head and Neck Squamous Cell Carcinoma (HNSCC). LabEx
presentation, December 2016. Lyon, France.

Submitted; Simonet et al.
332

Submitted; Simonet et al.
333
The use of gadolinium-based nanoparticles (AGuIX®) to counteract the
radioresistance of HNSCC: from cellular uptake to subcellular damage
S. Simoneta,b, C. Rodriguez-Lafrassea,c, D. Bealb, S. Gerbaudd, C. Malesysa, O. Tillemente,
F. Luxe, W. Rachidib,f* and D. Ardaila*
a Institut de Physique Nucléaire de Lyon, Laboratoire de Radiobiologie Cellulaire et Moléculaire,
CNRS UMR 5822, Université de Lyon, Faculté de Médecine Lyon-Sud, Pierre Bénite, France.
b Commissariat à l’énergie atomique et aux énergies alternatives (CEA)/Institut Nanosciences et
Cryogénie (INAC)/Systèmes Moléculaires et nanoMatériaux pour l’Energie et la Santé
(SyMMES)/Chimie Interface Biologie pour l’Environnement, la Santé, et la Toxicologie (CIBEST).
17 avenue des martyrs, F-38054 Grenoble CEDEX.
c Unité Médicale d’Oncologie Moléculaire et Transfert, Hospices Civils de Lyon, Laboratoire de
Biochimie et Biologie Moléculaire, Centre Hospitalier Lyon-Sud, Pierre Bénite, France
d Laboratoire BGE U1038- Biomics, Bioscience and Biotechnology Institute of Grenoble. CEA-
DRF. Grenoble, France.
e Institut Lumière Matière, UMR 5306 CNRS, Université de Lyon, Université Lyon 1, Villeurbanne
cedex, France.
f Université Grenoble Alpes, F-38000 Grenoble, France.
*: co-corresponding authors
Authors to whom correspondence should be addressed are Dr. Dominique Ardail
([email protected]) and Dr Walid Rachidi ([email protected])
Abstract: 148 words
Manuscript: 4839 words
Number of references : 58
Competing interests: F. Lux, and O. Tillement have to disclose the patent WO2011/135101. O.
Tillement has to disclose the patent WO2009/053644. These patents protect the AGuIX®
nanoparticles described in this publication.
This work was supported by France Hadron (ANR-11-INBS-0007) and Labex Primes (ANR-11-
LABX-0063). Stéphanie Simonet was supported by a grant from Labex Primes

Submitted; Simonet et al.
334
Abstract
Resistance of tumor cells to radiation therapy remains a serious concern, therefore the study of
radiosensitizers has emerged as a persistent hotspot in radiation oncology, particularly in head
and neck carcinoma. Considering the drawbacks of conventional chemo-radiotherapy, the use
of gadolinium-based nanoparticles as radiosensitizers has shown great promise in pre-clinical
research. However, the translation to clinics is hindered by disparities in observed in vitro
biological responses, with sometimes contradictory results. This study was aimed to determine
the radiosensitizing potential of AGuIX® after cellular uptake, and the resulting subcellular
events in a radioresistant HNSCC cellular model. Our results demonstrated that once taken up,
AGuIX® accumulated in lysosomes. After photons exposure, AGuIX® increased intracellular
oxidative stress leading to complex DNA damage. Although radiation triggered late apoptosis
and mitochondrial impairment, pre-treatment with AGuIX® radiosensitized cells by specifically
increasing autophagic cell death. Collectively, these results provide insights into the complexity
of nanomedicine.
Keywords: Radiotherapy, Head and Neck Cancer, radiosensitization, gadolinium-based
nanoparticles (AGuIX®), Lysosomes, DNA damage
Background
Head and neck squamous cell carcinoma (HNSCC) is the sixth-most common cancer, accounting
for over 600,000 new cases and 350,000 deaths worldwide per year1. Despite advances in new
radiotherapeutic or chemoradiation strategies for the treatment of HNSCC, patient prognosis
has not improved2,3 as the development of radioresistance, in particular in recurrent tumors,
remains a major clinically unresolved problem. Thus, for an effective patient management,
there is still an urgent need to identify and develop novel agents to radiosensitize HNSCC
tumors. Despite its critical role in cancer therapy, there are additional challenges associated
with radiotherapy. Firstly, the toxicity to surrounding normal tissues often limits the maximum
dose of irradiation (IR) that can be delivered to tumors4. In addition, tumors include a high
degree of heterogeneity in their genotype, phenotype, and microenvironment, leading to
variability in radiation sensitivity and responses in different tumor cell populations5,6,7.
For over a decade, nanomedicine has been proposed as a new strategy to improve
radiotherapy treatments. Studies have been devoted to the development of tumor-targeting
nanodrugs with the aim to improve the radiation effects in the tumor, while diminishing the
exposure of healthy tissues to cytotoxic, and genotoxic effects8,9,10. High-Z atoms, such as
metallic (gold, platinum), and oxide (hafnium, gadolinium) nanoparticles (NPs), have been
proposed as potential nanodrugs to amplify radiation-based therapies11,12,13. The activation of

Submitted; Simonet et al.
335
these nanoparticles by radiation should lead to an electron burst and consequently to oxidative
stress which will in turn lead to damages to biomolecules. Among these, gadolinium-based
nanoparticles (GBNs) have been shown to hold significant potential as theranostic agents14, the
presence of gadolinium allowing them to be used as contrast agents for magnetic resonance
imaging (MRI)15. Among these, AGuIX® (Activation and Guidance of Irradiation by X-ray) are
ultrasmall (< 5 nm) gadolinium-based nanoparticles which have been characterized by a safe
behavior14,16, a renal clearance13, and a preferential accumulation in tumors17 by the enhanced
permeability and retention (EPR) effect. Therefore, owing to their physicochemical properties,
AGuIX® exposed to radiation are expected to produce extra radical oxygen species (ROS) in
addition to the primary water radiolysis products.
Up to now, a significant in vitro radiosensitizing effect of GBNs has been reported following
different experimental conditions such as varying the energy of the irradiation from keV to
MeV, different concentrations of nanoparticles (from 0.1 to 1 mM), and times of incubation
(from 1h to 24h), as well as different types of tumor cell lines, or the nature of irradiation
(photons, neutrons or ions)14. Indeed, several in vitro studies have demonstrated the
radiosensitizing effect of GBNs nanoparticles combined to photon irradiation in glioblastoma
cells18,19, cervical carcinoma HeLa cells20, HNSCC21, and prostate cancer cells (K. Butterworth,
personal communication). Apart from the work of Miladi et al., where the involvement of
mitotic catastrophe and late apoptosis was demonstrated21 in HNSCC, little is known about the
subcellular effects of GBNs, the organelles involved in their radiosensitizing effect, and the
connection between the physical, chemical, and biological effects of GBNs. Moreover, although
GBNs were never found to be localized within nuclei22, γ-H2AX or 53BP1 foci have been
generally quantified to reflect DNA double strand breaks (DSBs) and contradictory results have
been reported with the same GBNs in different cell lines. While an increase of residual DSBs
have been demonstrated in HNSCC, 1h after treatment with GBNs combined to radiation21,
opposite results have been reported with AGuIX® in glioblastoma19.
Given the variety of experimental conditions and cells involved in the studies mentioned above,
as well as for other high-Z NPs, it seems impossible that all induce the same cellular response.
Moreover, in the direction of a better understanding of the radiosensitization process, the
clonogenic survival curve assay cannot be the only way to probe the cellular responses which
therefore should be investigated in more details. This work has been undertaken with AGuIX®
which contain DOTAGA as a macrocyclic Gd3+ chelate which is a more stable and better
chelator15 compared to the acyclic ligand DTPA that could release toxic gadolinium23.
Despite AGuIX®’s potential to induce radiosensitization in cancer cells, the complexity of the
phenomenon in the current state justifies that only a few clinical trials have been undertaken

Submitted; Simonet et al.
336
(NCT02820454: NANO-RAD and NCT03308607: NANOCOL) to date. The objective of this work
was therefore to better understand the mechanisms of action mediating the biological effects
of this new formulation of AGuIX® and the subcellular targets in cells in order to move towards
clinical applications in a more robust way.
Methods
Cellular Culture The SQ20B J.L. cell line was derived from a human larynx radioresistant carcinoma obtained from the John Little Laboratory (Harvard School of Public Health, Boston, USA) with an SF2Gy of 72%. Cells were cultured as previously reported24. AGuIX® treatment and irradiation AGuIX® nanoparticles14 are resuspended in dH2O and further diluted to the appropriate concentration in DMEM alone. SQ20B J.L. cells were seeded at a density of 40 000 cells/cm2 16 hours prior to AGuIX® treatment and incubated with 0.8mM Gd for 24 hours in DMEM-Glutamax. Nanoparticles were removed by washing with PBS before irradiation with an X-Rad 320 irradiator (Precision X-ray Inc., North Branford, CT): Energy: 250 kV, intensity: 15 mA, and 2Gy/min dose rate.
DMF/BSO treatment After treatment with AGuIX® and washing with PBS, cells were incubated for 4 hours prior to irradiation with 100 µM dimethylfumarate (DMF), a GSH-depleting agent, and 100 µM L-buthionine sulfoximine (BSO), a GSH biosynthesis inhibitor. Clonogenic Cell Survival Assay After treatment with or without AGuIX® and irradiation, clonogenic cell survival curves were performed as previously described25. After coloration with Giemsa, clones with 64 cells or more were counted using COLCOUNTTM (Oxford Optronix). Clonogenic survival curves were fitted according to the linear quadratic equation (SF= e-[α●D + β●D●D]) where SF is the surviving fraction, α represents the probability of lethal events and β the sublethal events; and D the irradiation dose. The survival fraction at 4Gy (SF4Gy) was first used to assess the radiosensitizing concentration of AGuIX® nanoparticles (AGuIX® treatment of 1 hour). Inductively Coupled Plasma-Optical Emission Spectrometry (ICP-OES) After treatment with 0.8mM AGuIX® for 1, 4, 12, and 24 hours and trypsination, cells were centrifuged, rinsed with PBS before adding ultrapure water and 4-5 mL of aqua regia (mix of nitric acid and hydrochloric acid (1:3)). The samples were kept at 80°C for three hours, filtered through a 0.2 µm filter and analyzed with a Varian 710-ES (Varian, Les Ullis, France).

Submitted; Simonet et al.
337
Toxicity Assays Trypan blue toxicity assay After treatment with AGuIX®, cells were trypsinized (for incubation times over 24h) and re-plated as to not exceed an 80% confluency. After addition of 10 µL of trypan blue solution to 10 µL of the cell suspension, viability was measured using the Countess automated cell counter (Invitrogen). MTT toxicity assay After trypsination and re-plating, 200 µL of a 0.5 g/ml of MTT solution (Sigma, St-Quentin-Fallavier, France) was added to each well. The plate was incubated for two hours at 37°C and 5% CO2 and rinsed with PBS. 100 µL of DMSO were added to each well and left for 30 minutes under agitation before reading at 560 nm using the SpectraMax M2 spectrophotometer (Molecular Devices). Proliferation assay: confluency percentage measurements by Incucyte After treatment with AGuIX®, cells were trypsinized and re-seeded in a 96-well plate at a density of 5 000 cells per well. Pictures were taken in phase contrast by the Incucyte (Essen Biosciences, Ann Arbor, MI, U.S.A.) every two hours for 7 days. Comet Assay +/- FPG Alkaline single-cell gel electrophoresis (Comet Assay) was performed as described by De Rosa et al.26 and Forestier et al.27. The study of the damage’s extent was done for time after irradiation 0, 30, and 120 minutes and was evaluated as the average of the triplicate values of the percent tail intensity. γH2Ax Immunofluorescence Assay The method used was described by Wozny et al24. Each slide was counted for a minimum of 300 nuclei per slide using the Metafer (MetaSystemsTM, Heidelberg, Germany) analysis system which uses the size and intensity as parameters to distinguish a foci under a 63X objective. Fluorescence Confocal Microscopy Cells were plated in two-chambers LabTek®II Chambered #1.5 German Coverglass System (Dutscher, Brumath, France) and AGuIX®-Cya5.5 were used. For co-localization studies with the nucleus, cells were fixed in 4% PFA for 20 minutes, and exposed to DAPI (1µM) for 15 minutes. The cells were kept in 1 mL of PBS for observation under the confocal spinning disk microscope. For the co-localization studies with the mitochondria or
Submitted; Simonet et al.
338
lysosomes, live-cell imaging was performed. SQ20B J.L. cells were incubated with either 200 nM Mitotracker-Green (ThermoFischer, Saint-Aubin, France) or 75 nM Lysotracker-green (ThermoFischer) for 45 minutes in culture medium prior to AGuIX®-Cya5.5 treatment. The probes were then washed out with PBS before treatment with AGuIX®-Cya5.5 for 24 hours, cells were observed using the confocal spinning disk. AGuIX®-Cya5.5 were excited with a laser at 642 nm, while Lysotracker and Mitotracker-Green were excited at 491 nm. Images were taken in 60X oil objective on a z-width of 15 µm with step-sizes of 0,5 µm. Autophagy was visualized under the microscope using the LC3B primary antibody diluted at 1/500 (BioTechne, Lille, France) and the secondary antibody, rabbit IgG-Alexa Fluor 488 (1/500 dilution). Images were taken using the Isis software under the 10X objective. Study of the cellular death pathways The CaspACETM FITC-VAD-FMK in situ Marker (Promega, Charbonnières Les Bains, France) was used to quantify total caspase activity by flow cytometry, as previously described by Gilormini et al28. Necrosis was studied using the Annexin V/P.I. assay (Life Technologies, Courtaboeuf, France). The cells were trypsinized and marked for 15 minutes with annexin and P.I. per tube in 1X buffer. After centrifugation, cells were re-suspended in PBS and analyzed using the FACSCalibur (Becton Dickinson). The excitation/emission wavelength were 488/530 for Annexin FITC and 585/45 for P.I. For autophagy, LC3B protein expression was studied via Western Blot analysis using the LC3B primary antibody at 1:2000 (BioTechne, Lille, France) and the secondary antibody, rabbit IgG HRP-conjugated at 1:20 000. 20µg of proteins was deposited on a 12% polyacrylamide gel. Reactive oxygen species assay
MitoSOXTM (Life Technologies) and CM-H2DCFDA (Thermo Fischer) were used to detect mitochondrial and cellular ROS respectively. MitoSOXTM was used at 5µM, while CM-H2DCFDA was used at 2.5µM in HBSS for 10 minutes. The fluorescence intensity was measured by flow cytometry at an excitation/emission wavelength of 488/575 nm (MitosoxTM) and 488/525 nm (CM-H2DCFDA). Mitochondrial membrane potential The mitochondrial membrane potential was measured using the JC-1 dye (Sigma) as previously reported28. Measurement of the common mitochondrial DNA (mtDNA) deletion

Submitted; Simonet et al.
339
mtDNA extraction was done without DNA purification as described in Peinnequin et al.29. qPRC was done using three primers: total mtDNA, deleted mtDNA, and GAPDH. Statistical analysis Each experiment was done in triplicates. Statistical analysis was realized with the Student's t test. Significant results have a p value < 0.05 (*), < 0.01 (**) or < 0.001 (***).
Results AGuIX® treatment and subcellular localization Preliminary experiments aimed to assess the best experimental conditions (AGuIX®
concentration, time of incubation) to radiosensitize SQ20B J.L. cells. As summarized in Supplemental Figure 1, a concentration of 0.8 mM AGuIX® after 24h of treatment was selected for further investigations. AGuIX® uptake was linear with time (Supplemental Figure 1B) with an intracellular amount of 0.11pg Gd internalized by SQ20B cells, 24h after treatment. Without radiation, AGuIX® nanoparticles are not cytotoxic at the cellular (Supplemental Figure 2A and 2B) nor at the mitochondrial level (Supplemental Fig 2C). Confocal microscopy showed that AGuIX® co-localized in large quantities with lysosomal structures throughout the cytoplasm. AGuIX® were not visualized in mitochondria nor in the nucleus (Figure 1). In vitro assessment of AGuIX®’s radiosensitization in SQ20B J.L. cells As depicted in Figure 2A, the survival curve of SQ20B cells demonstrates an enhanced sensitivity to radiation in the presence of AGuIX®. The sensitivity enhancement ratio (SER) was 1.4 at 4Gy (Figure 2B) and the dose enhancement factor (DEF) was 1.3. The α-parameter (reflecting direct lethal damage) was increased from 0.1593 to 0.2357 with AGuIX® whereas the β-parameter (sub-lethal damage) did not change. As shown in Figure 3, no differences were observed in the single-strand breaks (SSBs) at all time points (Figure 3 A-D) whereas an increase of oxidized purines (8-oxo-G) was observed right after a 4 Gy irradiation (t=0), following AGuIX®
treatment (Figure 3A). Considering the initial peak of γH2Ax foci (t=30 min), there were no significant differences between untreated and treated cells (Figure 3E). For the residual γH2Ax foci (t=24h), Figure 3G shows that the number of cells displaying more than 50 foci/nucleus is significantly increased after AGuIX® treatment compared to radiation alone (45 nuclei with 50 or more foci/nucleus versus 23 nuclei with 50 or more foci/nucleus thus confirming that the treatment with AGuIX® results in the persistence of more complex and lethal DSBs compared to radiation alone.
Submitted; Simonet et al.
340
Cellular death pathways induced by AGuIX® treatment As demonstrated by the clonogenic survival curve, AGuIX® combined to radiation increased SQ20B cell death. But one question remains: what kind of death? When considering apoptosis and necrosis, no significant differences were obtained between AGuIX® treated and untreated SQ20B cells, even 192h post-irradiation (Supplemental Figure 3). Mitotic catastrophe and senescence were also investigated but no differences between AGuIX®-treated cells compared to radiation alone were obtained (data not shown). Autophagy was then studied using LC3B as a specific autophagosomes’ antibody. Although no differences in LC3B protein expression occurred up to 72 hours after irradiation, an increase was obtained starting 120h up to 192h (Figure 4A and B). Interestingly, a more important increase was obtained after treatment with AGuIX® compared to radiation alone: +62.5% at 120 h and +114%, 192h after the combined treatment, respectively. This result was confirmed by confocal microscopy using the same LC3B antibody (Fig 4C). Collectively, these results demonstrated that the treatment of SQ20B cells with AGuIX® before irradiation significantly strengthened autophagy and/or autophagic cell death in SQ20B.
Involvement of oxidative stress in the radiosensitizing effect of AGuIX® A kinetic study of ROS production was performed up to 4 hours post-irradiation either at the cytosolic (cROS) or the mitochondrial level (mROS). As can be seen in Figure 5A and 5B, we were not able to highlight any significant differences in mROS nor cROS between AGuIX®-treated cells and irradiated cells, a result that seemed surprising considering the radiosensitizing effect obtained. SQ20B J.L. cells are known to be highly radioresistant and we previously demonstrated that these cells are over-protected against oxidative stress due to their high endogenous glutathione (GSH) content30. We therefore depleted SQ20B cells from their GSH content using DMF + BSO30 after AGuIX® treatment but prior to irradiation. Under these experimental conditions, flow cytometry studies with ROS specific probes allowed us to show a burst of mROS immediately after irradiation, which is not maintained over time, and without any significant differences between irradiated cells and irradiated cells treated with AGuIX® (Figure 5C). This result is consistent with the fact that we did not obtain any co-localization of AGuIX® with mitochondria (Figure 1). This initial burst of mROS was probably solely related to the consequences of water radiolysis after irradiation. At the whole cellular level, the initial burst of ROS, immediately after irradiation (Figure 5D), was much more important quantitatively compared to that obtained for mROS, and was significantly reinforced by AGuIX®. This burst of ROS then dropped at 15 and 30 min after irradiation until a second increase in cROS started after one hour and peaked four hours post- irradiation. In both cases, the pretreatment of SQ20B cells with AGuIX® led to a significant enhancement of cROS compared to radiation alone. Since the amount of ROS was increased, the consequences in terms of radiosensitization were ascertained by the clonogenic survival curve depicted in Figure 5E. Under these experimental conditions, i.e after GSH depletion, the 50% EBR increased from 1.281 to 1.571 and the α parameter from 0.113 to 0.299 (see Table 1). Collectively, these

Submitted; Simonet et al.
341
results strongly suggest that the initial effect of AGuIX® was somewhat subdued by the endogenous high level of antioxidant defenses. Mitochondrial subcellular damage induced by the addition of AGuIX® nanoparticles In addition to nuclear damage (Figure 3), we further focused on the potential mitochondrial damage after the combined treatment. As can be observed on Figure 6A, we started observing a decrease of the mitochondrial membrane potential 72h after irradiation. This trend increased with time to reach - 30% (irradiated-only cells) versus - 36% (AGuIX® treated cells) 240h post irradiation which was not significant. These results demonstrated that AGuIX® had no influence on the decrease of the ΔΨm obtained after radiation. Figures 6B represents the ratio of deleted mtDNA/total mtDNA 24h and 72h post-irradiation. As shown, no significant differences are observed 24 hours post-irradiation while at 72h post-irradiation, there is no effect after a 4Gy irradiation alone (deleted mtDNA/total mtDNA ratio = 1.16) while we can observe an increase in the amount of deleted mitochondrial DNA with a ratio of deleted mtDNA/total mtDNA of 2.93 which is statistically significant compared to irradiated only cells.
Discussion
Radiation therapy plays an essential role in the treatment of HNSCC, yet the therapeutic efficacy is hindered by the treatment-associated toxicity and tumor recurrence. Recent radiosensitization research has focused on therapeutic strategies involving, among others, nanoparticles to enhance radiation damage to cancer cells while limiting the radiation effects on normal tissues. Despite promising results obtained in terms of radiosensitization by high-Z nanoparticles, the absence of the precise cellular targets and connection between the physical, chemical, and biological effects is slowing down the translation to more clinical trials. AGuIX® are gadolinium-based nanoparticles developed mainly for imaging due to their magnetic resonance contrast properties, but also have a potential role in radiation therapy as a radiosensitizer9,12-15,17-19,21. Moving towards the improvement of gadolinium chelators as MRI contrast agents31, the formulation of AGuIX® has moved towards a macrocyclic chelator (DOTA) instead of a linear gadolinium chelator (DTPA). In the present study, the radiosensitizing potential of this new formulation of AGuIX® in the HNSCC cell model SQ20B J.L. was demonstrated, resulting in a SF4Gy of 1.382 with an Enhanced Biological Factor (EBR) of 1.3 which is similar to what is currently published for studies using AGuIX®, namely in HeLa (cervical cancer)20, Panc-1 (pancreatic cancer)32, U87 (glioblastoma)19,33, and B16F10 (melanoma) cells17, with DEFs varying from 1.17 to 1.54. Regarding AGuIX®, and more generally high-Z NPs, an open question remains: is there a preferential localization of AGuIX® for radiosensitization? In accordance with Štefančíková et al.
Submitted; Simonet et al.
342
in glioblastoma33, we showed that AGuIX® are not targeted to the nucleus nor the mitochondria but are mostly located in lysosomes, while a few AGuIX® remaining free in the cytosol. Similar results were also obtained in CHO cells for example, where these NPs clusters of sizes between 400-900 nm were observed in the cytoplasm regardless of the concentration used or incubation time 34. In an effort to understand the effect of AGuIX® at the subcellular level, the results reported above raise the following questions: is there a biological effect and is this effect mandatory to target the nucleus? The debate as to whether the radiosensitizing effect induced by the combined treatment is dependent or not on DNA-damage has been studied by several teams working with AGuIX®, as well as other metal-based NPs. Although similar results were found for initial DSBs, results varied for the number of residual foci, 24 hours after irradiation and AGuIX®
treatment. Indeed, an increase of residual DSBs, was reported in a melanoma model17 or in in a head and neck cell line35 whereas no increase of DSBs were obtained in glioblastoma cells19 under the same experimental conditions. Although the residual DSBs, expressed as the number of cells that still have ϒH2Ax foci 24h after the combined treatment was moderately increased in this study, the number of cells displaying more than 50 foci/nucleus was significantly increased after treatment with AGuIX® compared to radiation alone. This observation suggests that the treatment with AGuIX® caused a net increase of more complex and lethal DSBs compared to radiation alone, a result which is in perfect accordance with the increase of the α parameter obtained from the clonogenic survival curve. All these data strongly underline the large variations in the results obtained, depending on the conditions of treatment used, as well as the cellular type studied. For other metal-based NPs, such as gold NPs, similar contradictory results have been reported. As an example, the use of 1.9 nm gold nanoparticles did not enhance radiation-induced DSBs formation nor inhibit DNA repair in MDA-MB-231 breast cancer cells irradiated with MV electrons36, while the combination of 50 nm citrate-coated gold NPs with 6 MV photons resulted in an increase of DSBs in HeLa cells37,38. The next question that needed to be clarified was: which connections exist between the physical and biological effects of AGuIX®? The hypothetical mechanism behind the use of metal-based nanoparticles is based on the over-production of secondary electrons leading to an increase of cellular ROS which in turn would lead to cell death. However, only a few data are up to now available in vitro. As pointed out in this work, and despite of radiosensitization, the increase of ROS production following the combined treatment was lower than expected. One possible explanation was that SQ20B cells, as many other radioresistant cancer cells, exhibit upregulated antioxidant systems (see Zhou et al., as a review)39. Previous work from our lab effectively reported that SQ20B cells display a high endogenous glutathione (GSH) content which largely contributes to their radioresistant properties. Although GSH is a major ROS-scavenging system in cells, the important redox modulating enzymes including the peroxidases, peroxiredoxins, and thiol reductases also rely on the pool of reduced GSH as their source of reducing equivalents30,40. In view of these elements, a transient GSH-depleting strategy was previously investigated which resulted in the radiosensitization of the SQ20B cell line used in this study30. Using the same experimental approach, i.e after GSH depletion, we clearly

Submitted; Simonet et al.
343
demonstrated that the pretreatment of cells with AGuIX® resulted in a net increase of ROS after radiation thereby strongly suggesting a ROS-mediated radiosensitizing effect of AGuIX®. This increase of ROS was further evidenced through the clonogenic survival curve by an increase of the EBR from 1.3 to 1.6. Nevertheless, one must keep in mind that it still remains very difficult, if not impossible, to discriminate for sure a direct production of ROS by AGuIX® as a consequence of irradiation, from an overproduction of ROS as a cellular response and therefore to conclude about an additive or a synergetic effect of irradiation and AGuIX®. Up to now, another recurring question persists: what kind of cell death and/or biological effect is induced after the pre-treatment of cells with AGuIX®? To our knowledge, only one study using DTPA-based gadolinium nanoparticles reported an increase of mitotic catastrophe followed by late apoptosis21. Otherwise, many reports were published concerning the effect of other type of NPs in the triggering of apoptosis. In combination with radiotherapy, examples include the effect of gold nanorods on melanoma cells41, the effect of thio-glucose-bound gold nanoparticles (Glu-GNPs) on lung cancer cells42, or the effect of silver NPs on glioma cells43,44. With AGuIX®, no enhancement of apoptosis nor mitotic catastrophe was obtained after radiation. Autophagy and/or autophagic cell death was the only cellular event that was significantly enhanced after AGuIX® compared to radiation alone. Although autophagy is predominantly cytoprotective, even in response to radiation45,46, excessive or persistent autophagy can also be cytotoxic47,48. Indeed, many biological responses, among which cell death pathways, are governed by threshold effects, above and below which either no response occurs or a qualitatively different response is initiated. Thus, it is not particularly surprising that excessive autophagy (as obtained after our combined treatment) can promote cell death rather than cell survival. Up to now, many trials were conducted to modulate autophagy to improve the outcome of cancer treatment in combination with radiotherapy49. Among these, some studies using nanoparticles combined with radiation presented evidence for a radiosensitizing effect involving autophagy: AgNPS in glioma cells at clinically relevant megavoltage energies44, copper cysteamine NPs in colorectal carcinoma50, or selenium NPs in breast cancer cells51. In this work, evidence is presented for an enhancement of autophagy with AGuIX® after radiation. As visualized by fluorescence microscopy (see Figure 4C), AGuIX® could trigger autophagic cell death or potentially autosis52, an autophagy-dependent non-apoptotic form of cell death, characterized by unique morphological changes. However, at this stage of our work, our results do not really allow us to distinguish for sure between cell death accompanied by signs of autophagy (i.e cell death with autophagy) from cell death as a consequence of autophagy (autophagic cell death)52.
Nevertheless, it has been very recently suggested that one unique and defining aspect of regulated autophagic cell death is the absolute requirement for lysosome membrane permeabilization (LMP)53. Although the authors demonstrated the requirement of the Bax/Bak proteins to increase LMP, LMP is known to occur in response to a large variety of stimuli54, among which ROS55,56 is one of them. As AGuIX® were found to be mainly localized in lysosomes (Figure 1), the exposure of cells to radiation led to an increase of ROS, most certainly in lysosomes. Because lysosomes are organelles extremely active in redox reaction and contain

Submitted; Simonet et al.
344
significant amounts of transition metals, like iron57, ROS produced after exposure of AGuIX® to radiation may form other reactive species such as HO. through the Fenton reaction58 which are highly deleterious to lysosomal membranes. Future studies should be designed to address this hypothesis.
Concerning mitochondria, our results show that the pretreatment of cells with AGuIX® did not change the impact of radiation on this organelle, a result that could potentially be explained by the fact that AGuIX® did not get into mitochondria due to inner membrane impermeability.
In this study, we demonstrated that AGuIX® were able to radiosensitize SQ20B, an HNSCC cell line, via the induction of intracellular ROS which strengthened the radiation effect. Once taken up by cells, AGuIX® largely accumulated in lysosomes and resulted in the generation of complex DNA damage. Moreover, autophagy and/or autophagic cell death appeared to mediate the effectiveness of this treatment combination. However, future studies are required to understand the mechanisms linking lysosomes-entrapped AGuIX® with the upregulation of autophagy/autophagic cell death after radiation.
Acknowledgments
We acknowledge the contribution of the flow cytometry platform of the SFR BioSciences-
Gerland-Lyon-Sud (UMS3444/US8) and of the CRCL. This work was supported by France Hadron
(ANR-11-INBS-0007) and Labex Primes (ANR-11-LABX-0063). We would also like to thank G.
Alphonse for irradiation support, and P. Montagne for flow cytometry support.

Submitted; Simonet et al.
345
Figure Legends
Figure 1: Subcellular localization of AGuIX®-Cya5,5 (red) in SQ20B J.L. cells observed in
fluorescence confocal microscopy, 60X, with respect to A. the nucleus (DAPI: blue); B.
mitochondria (Mitotracker-Green) and C. lysosomes. (Lysotracker-Green). Representative data
of 200+ cells.
Figure 2: Radio-sensitization of SQ20B J.L. cells with AGuIX® nanoparticles. A. Clonogenic cell
survival curve 0-10Gy: untreated (0 mM Gd) versus treated cells (0.8mM Gd). The survival at
4Gy was 0.49 (+/- 0.03) for untreated cells and decreased to 0.34 (+/- 0.03) after treatment of
cells with 0,8 mM AGuIX® for 24h. Experimental (exp) values are the numbers obtained with
ColCount, while the calculated (calc) values are obtained with the linear quadratic formula.
Each value represents the mean +/- SD of 3 experiments performed in triplicate (***, p<0,005
vs. irradiated SQ20B cells). B. Table with radiation response of SQ20B J.L. cells untreated or
treated with AGuIX®.
Figure 3: DNA-damage induced by AGuIX® combined to ionizing radiation. A-D: Kinetic study of
single-strand breaks (+/- FPG) measured by the comet assay following a 4Gy irradiation: A. 0 h;
B. 0.5 h; C. 2h; D. 24h. E-G: Kinetic study of double-strand breaks measured by the γH2Ax assay
following a 2Gy irradiation: E. 0.5 h; F. 6 h; G. 24 h. Representative data of 300+ nucleus.
Figure 4: Kinetic study of autophagy using LC3B antibody A. Western Blot analysis 24-192 h
post-irradiation and total proteins. B. Quantification of LC3B protein (total proteins were used
for the normalization). C. Representative images of LC3B expression by fluorescence
microscopy: nucleus (blue, DAPI); autophagosomes (green, LC3B antibody) 0, 24, and 192 hours
post-irradiation; 10X objective. Representative data of two independent experiments.
Figure 5: Study of the mitochondrial and cytosolic oxidative stress induced after AGuIX® +
radiation. Values were normalized as a function of the non-treated and non-irradiated cells. A-
B: Kinetic study of mitochondrial ROS (mROS) (A) and cytosolic ROS (cROS) (B) 0 - 4 hours post-
irradiation (10 Gy). C-D Kinetic study of mROS (C) and cROS (D) 0 - 4 hours post-irradiation (10
Gy) after glutathione depletion. Mean average intensity measured by flow cytometry in
triplicates. E. SQ20B J.L. clonogenic survival curve varying treatment conditions (+/- AGuIX®
and/or +/- DMF/BSO). Representative data of two independent experiments with biological
triplicates.
Table 1: Summary of the parameters evaluating the radiosensitizing effect of the addition of
AGuIX® and/or DMF + BSO.

Submitted; Simonet et al.
346
Figure 6: Functional consequences of the combined treatment on mitochondria. A. Kinetic
study 24-240h post-irradiation (10 Gy) of the percentage drop in the mitochondrial membrane
potential (ΔΨm). B. Deleted mtDNA/total mtDNA ratio for SQ20B J.L. cells following a 4Gy
irradiation with or without AGuIX®. Representative data of two independent experiments with
biological triplicates.

Submitted; Simonet et al.
347
References
1. Parkin DM, Bray F, Ferlay J, Pisani P. Global cancer statistics, 2002. CA Cancer J Clin
2005;55:74-108.
2. Haddad RI, Shin DM. Recent advances in head and neck cancer. N Engl J Med
2008;359:1143-54.
3. Begg AC. Predicting recurrence after radiotherapy in head and neck cancer. Semin
Radiat Oncol 2012;22:108-18.
4. Stone HB, Coleman CN, Anscher MS, McBride WH. Effects of radiation on normal tissue:
consequences and mechanisms. Lancet Oncol 2003;4:529-36.
5. Meacham CE, Morrison SJ. Tumour heterogeneity and cancer cell plasticity. Nature
2013;501:328-37.
6. Burrell RA, McGranahan N, Bartek J, Swanton C. The causes and consequences of
genetic heterogeneity in cancer evolution. Nature 2013;501:338-45.
7. Junttila MR, de Sauvage FJ. Influence of tumour micro-environment heterogeneity on
therapeutic response. Nature 2013;501:346-54.
8. Excorcia FE, McDevitt MR, Villa CH, Scheinberg DA. Targeted nanomaterials for
radiotherapy. Nanomedicine (Lond) 2007;2:805-15.
9. Le Duc G, Miladi I, Alric C, Mowat P, Brauer-Krisch E, Bouchet A, et al. Toward an image-
guided microbeam radiation therapy using gadolinium-based nanoparticles. ACS Nano
2011;5:9566-74.
10. Yhee JY, Lee S, Kim K. Advances in targeting strategies for nanoparticles in cancer
imaging and therapy. Nanoscale 2014;6:13383-90.
11. Hainfeld JF, Dilmanian FA, Slatkin DN, Smilowitz HM. Radiotherapy enhancement with
gold nanoparticles. J Pharm Pharmacol 2008;60: 977-85.
12. Porcel E, Liehn S, Remita H, Usami N, Kobayashi K, Furusawa Y, et al. Platinum
nanoparticles: a promising material for future cancer therapy? Nanotechnology
2010;21:85103.
13. Le Duc G, Roux S, Paruta-Tuarez A, Dufort S, Brauer E, Marais A, et al. Advantages of
gadolinium based ultrasmall nanoparticles vs molecular gadolinium chelates for
radiotherapy guided by MRI for glioma treatment. Cancer Nanotechnol. 2014;5:4.
14. Sancey L, Lux F, Kotb S, Roux S, Dufort S, Bianchi A, et al. The use of theranostic
gadolinium-based nanoprobes to improve radiotherapy efficacy. Br J Radiol
2014;87:20140134.
15. Mignot A, Truillet C, Lux F, Sancey L, Louis C, Denat F, et al. A top-down synthesis route
to ultrasmall multifunctional Gd-based silica nanoparticles for theranostic applications.
Chemistry 2013;19:6122-36.

Submitted; Simonet et al.
348
16. Bianchi A, Dufort S, Lux F, Courtois A, Tillement O, Coll JL, et al. Quantitative
biodistribution and pharmacokinetics of multimodal gadolinium-based nanoparticles for
lungs using ultrashort TE MRI. MAGMA 2014;27:303-16.
17. Kotb S, Detappe A, Lux F, Appaix F, Barbier EL, Tran VL, et al. Gadolinium-Based
Nanoparticles and Radiation Therapy for Multiple Brain Melanoma Metastases: Proof of
Concept before Phase I Trial. Theranostics 2016;6:418-27.
18. Mowat P, Mignot A, Rima W, Lux F, Tillement O, Roulin C, et al. In Vitro radiosensitizing
effects of ultrasmall gadolinium based particles on tumour cells. J Nanosci Nanotechnol
2011;11:7833-9.
19. Štefančíková L, Lacombe S, Salado D, Porcel E, Pagáčová E, Tillement O, et al. Effect of
gadolinium-based nanoparticles on nuclear DNA damage and repair in glioblastoma
tumor cells. J Nanobiotechnology 2016;14:63.
20. Luchette M, Korideck H, Makrigiorgos M, Tillement O, Berbeco R. Radiation dose
enhancement of gadolinium-based AGuIX nanoparticles on HeLa cells. Nanomedicine
2014;10:1751-5.
21. Miladi I, Aloy MT, Armandy E, Mowat P, Kryza D, Magne N, et al. Combining ultrasmall
gadolinium-based nanoparticles with photon irradiation overcomes radioresistance of
head neck squamous cell carcinoma. Nanomedicine 2015;11:247-57.
22. Rima W, Sancey L, Aloy MT, Armandy E, Alcantara GB, Epicier T, et al. Internalization
pathways into cancer cells of gadolinium-based radiosensitizing nanoparticles.
Biomaterials 2013;34:181-95
23. Rogosnitzky M, Branch S. Gadolinium-based contrast agent toxicity: a review of known
and proposed mechanisms. Biometals 2016;29:365-76.
24. Wozny A-S, Alphonse G, Battiston-Montagne P, Simonet S, Poncet D, Testa E, et al.
Influence of Dose Rate on the Cellular Response to Low- and High-LET Radiations. Front
Oncol 2016; 6:58.
25. Beuve M, Alphonse G, Maalouf M, Colliaux A, Battiston-Montagne P, Jalade P, et al.
Radiobiologic parameters and local effect model predictions for head-and-neck
squamous cell carcinomas exposed to high linear energy transfer ions. Int J Radiat Oncol
Biol Phys 2008;71:635-42.
26. De Rosa V, Lu PE, Forestier A, Favier A, Hincal F, Dimaond AM, et al. Low doses of
selenium specifically stimulate the repair of oxidative DNA damage in LNCaP prostate
cancer cells. Free Radic Res 2012;46:105-16.
27. Forestier A, Douki T, Sauvaigo S, Do Rosa V, Demeilliers C, Rachidi W. Alzheimer’s
disease-associated neurotoxic peptide amyloid-β impairs base excision repair in human
neuroblastoma cells. Int J Mol Sci 2012;13:14766-87.

Submitted; Simonet et al.
349
28. Gilormini M, Malesys C, Armandy E, Manas P, Guy JB, Magné N, et al. Preferential
targeting of cancer stem cells in the radiosensitizing effect of ABT-737 on HNSCC.
Oncotarget 2016;7:16731-44.
29. Peinnequin A, Poyot T, Dib A, Aubourg A, Mouret C, Demeilliers C. Direct quantification
of mitochondrial DNA and its 4.9-kb common deletion without DNA purification. Anal
Biochem 2011;409:298-300.
30. Boivin A, Hanot M, Malesys C, Maalouf M, Rousson R, Rodriguez-Lafrasse C, et al.
Transient alteration of cellular redox buffering before irradiation triggers apoptosis in
head and neck carcinoma stem and non-stem cells. Plos One 2011;6;e1455.
31. Frullano L, Caravan P. Strategies for the preparation of bifunctional gadolinium(III)
chelators. Curr Org Synth 2011;8:535-65.
32. Detappe A, Kunjachan S, Rottmann J, Robar J, Tsiamas P, Korideck H, et al. AGuIX
nanoparticles as a promising platform for image-guided radiation therapy. Cancer
Nanotechnol 2015;6:4.
33. Štefančíková L, Porcel E, Eustache P, Li S, Salado D, Marco S, et al. Cell localization of
gadolinium-based nanoparticles and related radiosensitizing efficacy in glioblastoma
cells. Cancer Nanotechnol 2014;5:6.
34. Porcel E, Tillement O, Lux F, Mowat P, Usami N, Kobayashi K, et al. Gadolinium-based
nanoparticles to improve the hadrontherapy performances. Nanomedicine
2014;10:1601-8.
35. Wozny AS, Aloy MT, Alphonse G, Magné N, Janier M, Tillement O, et al. Gadolinium-
based nanoparticles as sensitizing agents to carbon ions in head and neck tumor cells.
Nanomedicine 2017;13:2655-60.
36. Jain S, Coulter JA, Hounsell AR, Butterworth KT, McMahon SJ, Hyland WB, et al. Cell-
specific radiosensitization by gold nanoparticles at megavoltage radiation energies. Int J
Radiat Oncol Biol Phys 2011;79:531-39.
37. Chithrani DB, Jelveh S, Jalali F, van Prooijen M, Allen C, Bristow RG, et al. Gold
nanoparticles as radiation sensitizers in cancer therapy. Radiat Res 2010;173:719-28.
38. Berbeco RI, Korideck H, Ngwa W, Kumar R, Patel J, Sridhar S, et al. DNA damage
enhancement from gold nanoparticles for clinical MV photon beams. Radiat Res
2012;178:604-8.
39. Zhou S, Ye W, Shao Q, Zhang M, Liang J. Nrf2 is a potential therapeutic target
radioresistance in human cancer. Crit Rev Oncol Hematol 2013;88:706-15.
40. Forman HJ, Zhang H, Rinna A. Glutathione: overview of its protective roles,
measurement, and biosynthesis. Mol Aspects Med 2009;30:1-12.

Submitted; Simonet et al.
350
41. Xu W, Luo T, Li P, Zhou C, Cui D, Pang B, et al. RGD-conjugated gold nanorods induce
radiosensitization in melanoma cancer cells by downregulating α(v)β3 expression. Int J
Nanomedicine 2012;7:915-24. (43)
42. Wang C, Li X, Wang Y, Liu Z, Fu L, Hu L. Enhancement of radiation effect and increase of
apoptosis in lung cancer cells by thio-glucose-bound gold nanoparticles at megavoltage
radiation energies. J Nanopart Res 2013; 15:1642.
43. Liu P, Huang Z, Chen Z, Xu R, Wu H, Zang F, et al. Silver nanoparticles : a novel radiation
sensitizer for glioma ? Nanoscale 2013;5:11829-36.
44. Liu P, Jin H, Guo Z, Ma J, Zhao J, Li D, et al. Silver nanoparticles outperform gold
nanoparticles in radiosensitizing U251 cells in vitro and in an intracranial mouse model
of glioma. Int J Nanomedicine 2016;11:5003-14.
45. Lomonaco SL, Finniss S, Xiang C, Decarvalho A, Umansky F, Kalkanis SN, et al. The
induction of autophagy by gamma-radiation contributes to the radioresistance of glioma
stem cells. Int J Cancer 2009;125:717–22.
46. Ko A, Kanehisa A, Martins I, Senovilla L, Chargari C, Dugue D, et al. Autophagy inhibition
radiosensitizes in vitro, yet reduces radioresponses in vivo due to deficient
immunogenic signalling. Cell Death Differ 2014;21:92–9.
47. Daido S, Yamamoto A, Fujiwara K, Sawaya R, Kondo S, Yondo Y. Inhibition of the DNA-
dependent protein kinase catalytic subunit radiosensitizes malignant glioma cells by
inducing autophagy. Cancer Res 2005;65:4368-75.
48. Jo GH, Bögler O, Chwae Y-J, Yoo H, Lee SH, Park JB, et al. Radiation-induced autophagy
contributes to cell death and induces apoptosis partly in malignant glioma cells. Cancer
Res and Treat 2015;47:221-41.
49. Tam SY, Wu VW, Law HK. Influence of autophagy on the efficacy of radiotherapy. Radiat
Oncol 2017;12:57.
50. Liu Z, Xiong Lk, Ouyang G, Ma L, Sahi S, Wang K, et al. Investigation of copper cysteamine
nanoparticles as a new type of radiosensitiers for colorectal carcinoma treatment. Sci
Rep 2017; 7:9290.
51. Chen F, Zhang XH, Hu XD, Liu PD, Zhang HQ. The effects of combined selenium
nanoparticles and radiation therapy on breast cancer cells in vitro. Artif Cells Nanomed
Biotechnol 2017;7:1-12.
52. Liu Y, Levine B. Autosis and autophagic cell death: the dark side of autophagy. Cell Death
Differ 2015;22:367–376.
53. Karch J, Schips TG, Maliken BD, Brody MJ, Sargent MA, Kanisicak O, et al. Autophagic cell
death is dependent on lysosomal membrane permeability through Bax and Bak. eLife
2017; 6. Pii: e30543.

Submitted; Simonet et al.
351
54. Johansson AC, Appelqvist H, Nilsson C, Kågedal K, Roberg K, Öllinger K. Regulation of
apoptosis-associated lysosomal membrane permeabilization. Apoptosis 2010;15:527-40.
55. Denamur S, Tyteca D, Marchand-Brynaert J, Van Bambeke F, Tulkens PM, Courtoy PJ, et
al. Role of oxidative stress in lysosomal membrane permeabilization and apoptosis
induced by gentamicin, an aminoglycoside antibiotic. Free Radic Biol Med
2011;51:1656–65.
56. Oku Y, Murakami K, Irie K, Hoseki J, Sakai Y. Synthesized Aβ42 Caused Intracellular
Oxidative Damage, Leading to Cell Death, via Lysosome Rupture. Cell Struct
Funct 2017;42:71-79.
57. Yu Z., Persson HL, Eaton JW, Brunk UT. Intralysosomal iron: a major determinant of
oxidant-induced cell death. Free Radic Biol Med 2003;34:1243–52.
58. Baird SK, Kurz T, Brunk UT. Metallothionein protects against oxidative stress induced
lysosomal destabilization. Biochem J 2006;394:275–83.

Submitted; Simonet et al.
352
Figure 1
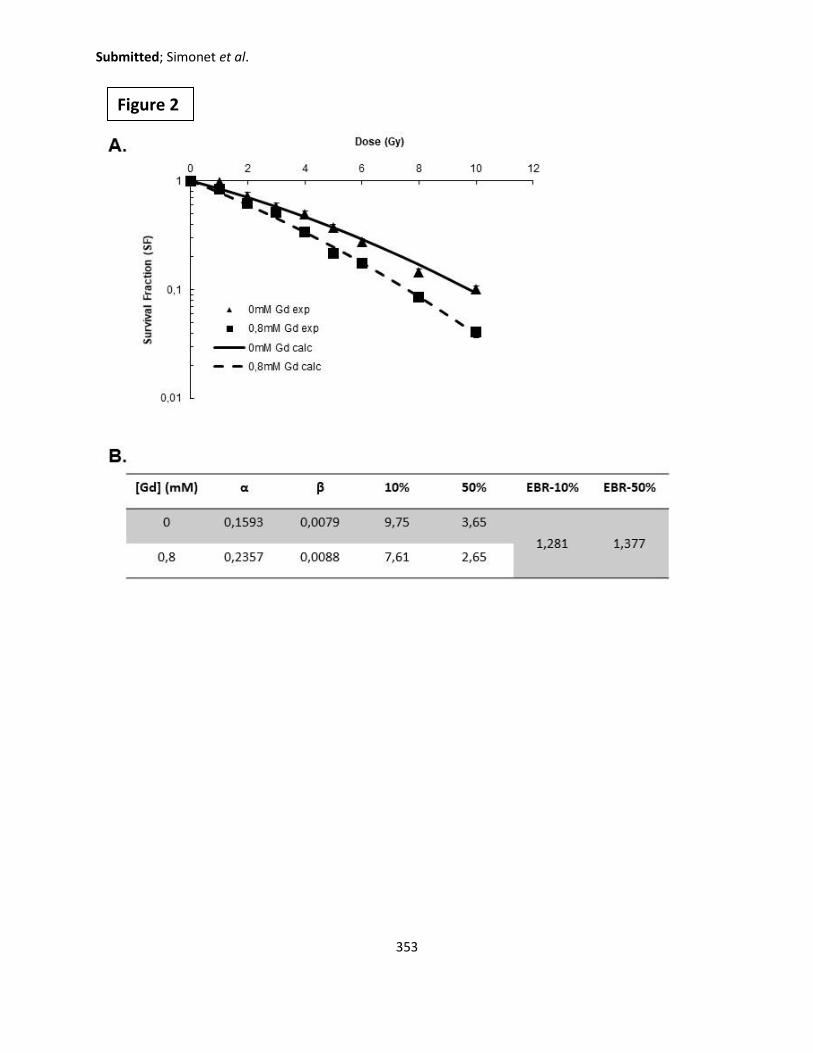
Submitted; Simonet et al.
353
Figure 2

Submitted; Simonet et al.
354
Figure 3
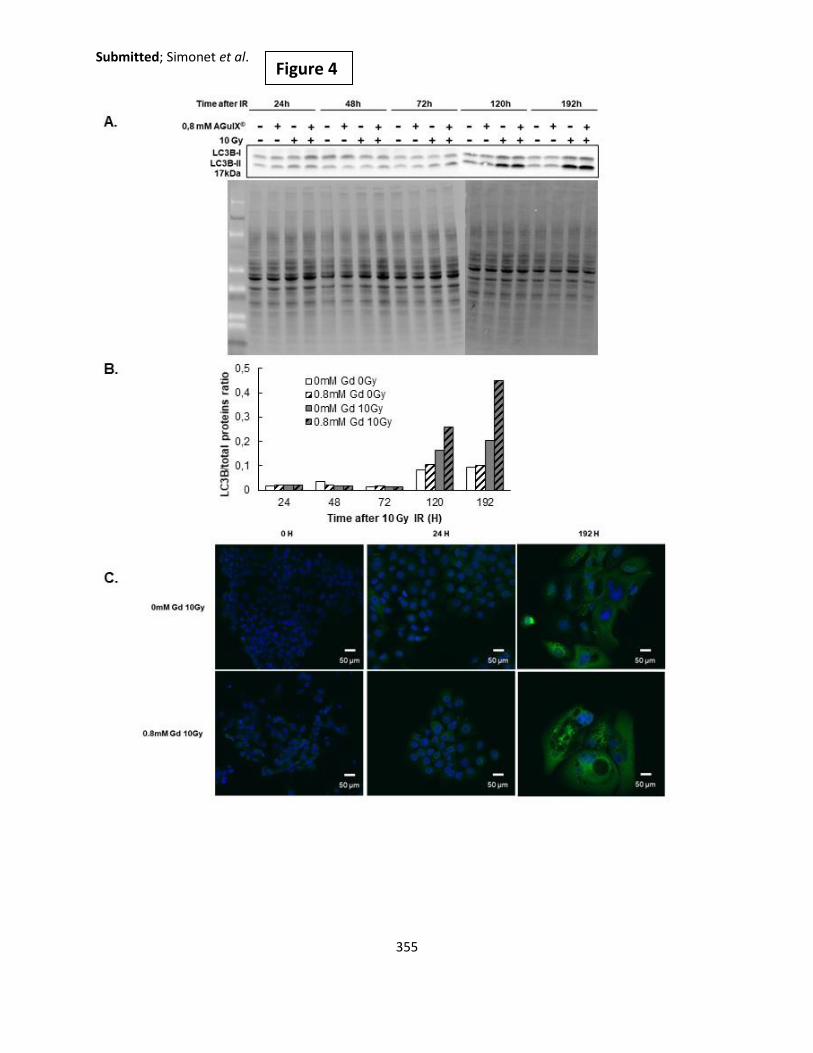
Submitted; Simonet et al.
355
Figure 4
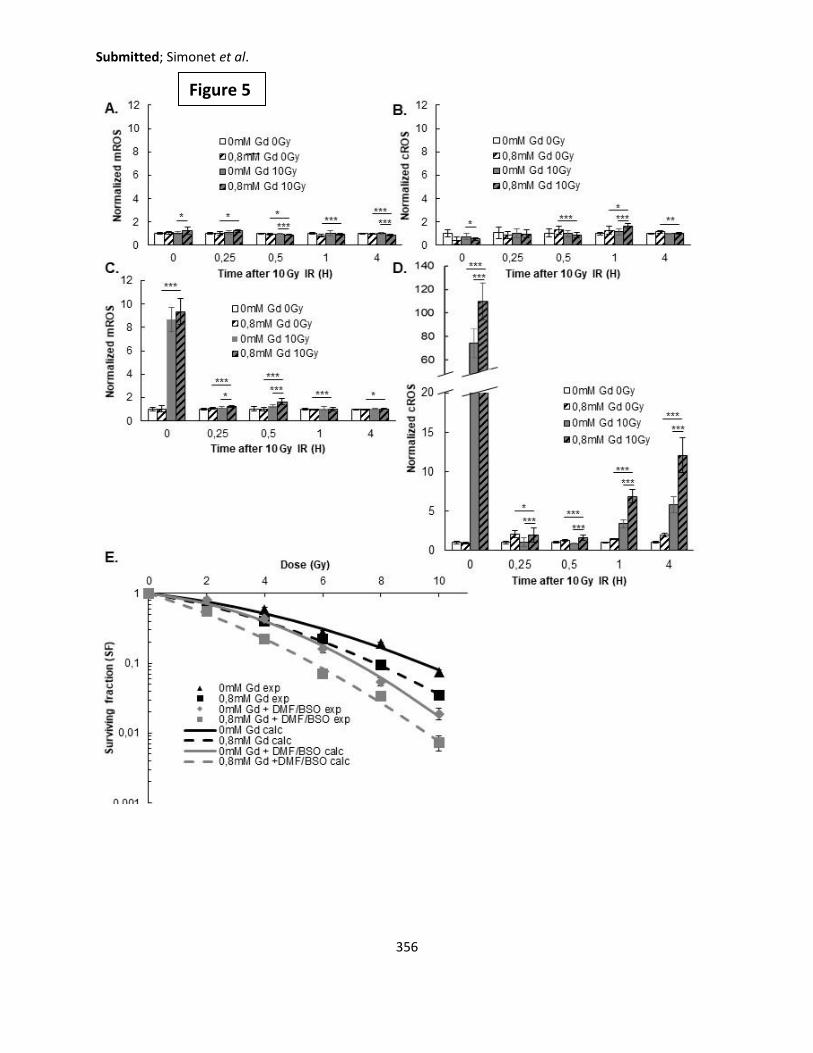
Submitted; Simonet et al.
356
Figure 5

Submitted; Simonet et al.
357
Figure 6
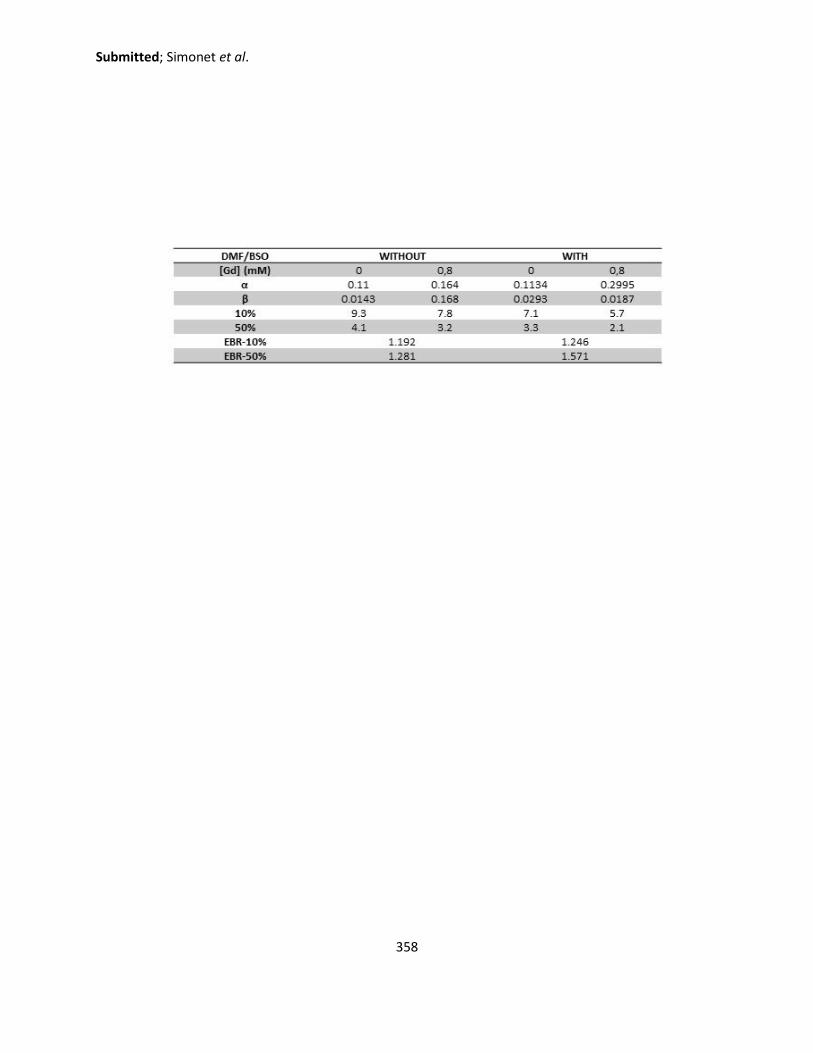
Submitted; Simonet et al.
358

Submitted; Simonet et al.
359
Legends for Supplemental Figures
Supplemental Figure 1: Determination of the radiosensitizing conditions. A. Survival fraction at
4Gy with varying AGuIX concentration from 0 to 3 mM in DMEM without fetal bovine serum. B.
Quantity of gadolinium internalized by SQ20B J.L. cells as a function of treatment time (1-4-12-
24 hours of exposure to AGuIX® treatment) in serum-free DMEM-Glutamax (0.8mM Gd)
quantified by ICP-AES. The three wavelengths of gadolinium are represented (342, 336, and
332 nm). This is a mean of 2 independent experiments with 3 flasks for each, and 3 separate
readings from the ICP.
Supplemental Figure 2: Toxicity assays. A. Proliferation assay measuring the percentage
confluency using the IncuCyte Live Cell Analysis. B. Percentage viability using the blue trypan
assay. C. Percent (%) proliferation measured by the MTT assay. Representative data of two
independent experiments with biological triplicates.
Supplemental Figure 3: Study of cellular deaths pathways. A. Caspase activation 24-240 h post-
irradiation using the CaspACETM FITC-VAD-FMK in situ Marker (Promega) and measured by flow
cytometry. Representative data of three independent experiments with biological triplicates. B.
Study of necrosis 24-192h post-irradiation using the Annexin V/P.I. assay measured by flow
cytometry.

Submitted; Simonet et al.
360
Supplemental Figure 1
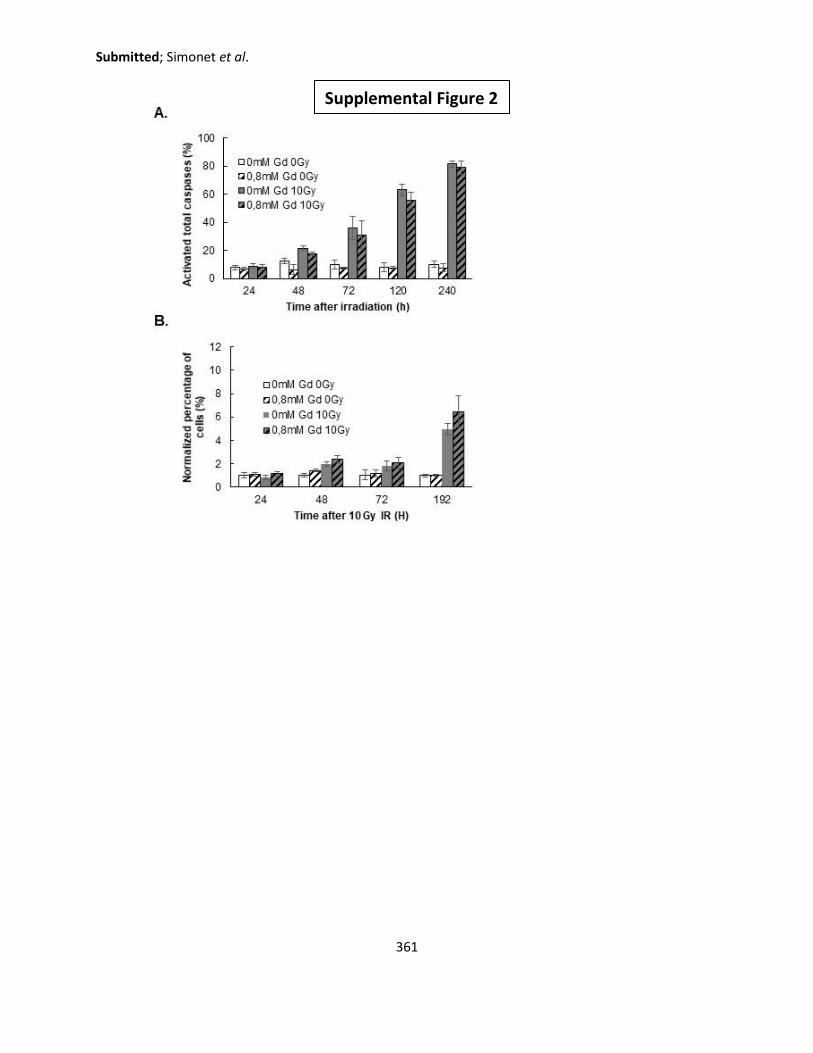
Submitted; Simonet et al.
361
Supplemental Figure 2

Submitted; Simonet et al.
362
Supplemental Figure 3

363

364
Abstract
Head and Neck Squamous Cell Carcinoma is ranked among the top ten deadliest cancers due to its high radioresistance and recurrence. One radiosensitizing strategy is the use of high-Z metal nanoparticles. In this study, ultrasmall gadolinium-based nanoparticles, AGuIX®, were used for their potential as a radiosensitizing agent. The objectives of this work were to determine the radiosensitizing conditions of AGuIX® in an HNSCC cell model, their localization after uptake, and the biological consequences generated at the subcellular level after the combined treatment. A preliminary proteomic approach was initiated in order to identify potential molecular targets involved in radiosensitization. The treatment of SQ20B cells with 0.8mM Gd for 24h resulted in a dose enhancement factor (DEF) of 1.3. AGuIX® were predominantly localized in lysosomes. The overproduction of radical oxygen species following AGuIX® + radiation was intimately involved in the radiosensitization, although largely subdued by the high level of endogenous antioxidant defenses. Autophagy was specifically triggered after the combined treatment, while other irradiation-induced cell deaths remained unchanged. The number of complex, residual double strand breaks (DSBs) was specifically increased with AGuIX® combined to radiation. Lastly, our preliminary proteomic analysis allowed the isolation of potential molecular targets with great promise. Collectively, it seems that the radiosensitizing effect observed in this work may result from a combination of events.
Future work is required to understand the mechanisms linking lysosomes-entrapped AGuIX® with the upregulation of autophagic cell death after radiation. Keywords: Head and Neck Squamous Cell Carcinoma (HNSCC); ionizing radiation; nanomedicine;
radiosensitizing strategies; nanoparticles; AGuIX®; Radical Oxygen Species (ROS)
Résumé
Les cancers des Voies Aérodigestives Supérieures sont classés parmi les dix cancers les plus agressifs du fait de leur radioresistance intrinsèque et leur forte probabilité de récurrence. L’objectif de ce travail a été d’étudier le potentiel radiosensibilisant de nanoparticules à base de gadolinium, AGuIX®, sur un modèle cellulaire de cancer des VADS. Après avoir déterminé et validé les conditions optimales de radiosensibilisation de notre modèle par les AGuIX®, leur localisation après internalisation ainsi que les conséquences biologiques générées à l’échelle subcellulaire ont été successivement étudiées. Enfin, une approche préliminaire protéomique a été initiée afin d’identifier des cibles moléculaires potentielles impliquées dans cette radiosensibilisation.
Le traitement des cellules SQ20B avec 0.8mM Gd pendant 24h se sont révélées être optimales avec un DEF (dose enhancement factor) de 1.3. Les AGuIX® sont localisées presque exclusivement dans les lysosomes après internalisation. La radiosensibilisation est liée à une surproduction de radicaux libres oxygénés, minimisée toutefois par des défenses antioxydantes endogènes élevées. Le traitement combiné (AGuIX®+ irradiation) déclenche spécifiquement la mort cellulaire autophagique et s’accompagne d’une augmentation significative du nombre de cassures double brins résiduelles complexes. L’étude protéomique préliminaire a permis d’identifier une cible moléculaire potentiellement impliquée dans cette radiosensibilisation (la ribonucléotide réductase), cible qui fera l’objet d’une suite à ce travail. De plus, la prochaine étape sera de comprendre les mécanismes qui relient les AGuIX® internalisées dans les lysosomes avec l’augmentation de la mort cellulaire autophagique après irradiation.
Mots clés: Cancers des Voies Aéro-Digestives Supérieurs (VADS); irradiation ionisante; nanomédicine; stratégie radiosensibilisante; nanoparticules; AGuIX®; Radicaux Libres Oxygénés (RLO)
Copyright © 2022 FDOKUMEN