Quinua biosystematics II: Free-living populations
17
Quinua Biosystematics II: Free-living Populations I HUGH D. WILSON 2 South American Chenopodium assignable to sect. Chenopodium subsect. Cel- lulata (Chenopodiaceae) have been classified on the basis of fruit and leaf blade morphology. Samples representing 99 free-living and domesticated populations were included in a comparative study based on electrophoretic and morphometric data. The resulting patterns of variation indicate that past reliance on the fruit for diagnostic characters has obscured biological relationships. Domesticated and free- living populations of the high Andes, distributed from northwestern Argentina to Colombia, are closely allied and clearly separate from domesticated populations of coastal Chile and free-living populations of Argentina. Circumscription of the Argentine C. hircinum to include Andean populations is rejected. Specific differ- entiation among Andean populations, polyphyletic origins for C. quinoa, and the presence of different ploidy levels are not indicated. Free-living Andean types sym- patric with C. quinoa are provisionally placed within that species as subsp, mil- leanum. While the coastal quingua domesticate is clearly distinct from the Andean weed~crop complex, it is provisionally placed within subsp, quinoa to conserve established nomenclature. The overall pattern of morphogenetic variation among South American populations suggests a co-evolutionary relationship between do- mesticated and free-living populations of the high Andes, with a center of diversity at the southern extreme of the Andean range. Populations of C. hircinum represent a logical link to the progenitor of the quinua complex, although firm phyletic and systematic alignments will require more information concerning populations of south-central Chile, and further definition of relative affinities among North and South American elements of subsection Cellulata. La biosistemfitica de la quinua II: Poblaciones indomesticadas. Las especies de Chenopodium sudamericanas asignadas a la secci6n Chenopodium subsecci6n Cellulata se han clasificado en base a la morfolgfa del fruto y de la hoja. Se hizo un estudio comparativo que incluy6 99 poblaciones de indomesticadas y domes- ticadas utilizando datos morfom~tricos y electrofor~ticos. Los patrones de variaci6n resultantes indican que el uso de las caracterfsticas del fruto como diagn6stico ha oscurecido las relaciones biol6gicas existentes. Las poblaciones provenientes de los altos Andes entre el noroeste Argentino y Colombia son muy relacionados y cla- ramente separados de las poblaciones domesticadas de Chile y las indomesticadas de Argentina. Se descarta la inclusi6n de las poblaciones andinas dentro de la especie argentina C. hircinum. No se encuentra la evidencia para diferenciaci6n especffica dentro de las poblaciones andinas," para el origen polifil~tico de C. quinoa, y para la presencia de diferentes niveles deploidia. Los tipos andinos indomesticados simpatricos con C. quinoa se ubican provisionalmente en la subespecie milleanum. Aunque la quingua costega domesticada es claramente diferente del complejo an- dino maleza/cultivo se ubica provisionalmente en la subespecie quinoa para con- servar la nomenclatura establecida. El patr6n general de distribuci6n morfogen~tica ' Received 22 August 1987; accepted 28 March 1988. 2 Department of Biology, Texas A&M University, College Station, TX 77843. Economic Botany, 42(4), 1988, pp. 478-494 1988, by the New York Botanical Garden, Bronx, NY 10458
-
Upload
independent -
Category
Documents
-
view
0 -
download
0
Transcript of Quinua biosystematics II: Free-living populations

Quinua Biosystematics II: Free-living Populations I
HUGH D. WILSON 2
South American Chenopodium assignable to sect. Chenopodium subsect. Cel- lulata (Chenopodiaceae) have been classified on the basis of fruit and leaf blade morphology. Samples representing 99 free-living and domesticated populations were included in a comparative study based on electrophoretic and morphometric data. The resulting patterns of variation indicate that past reliance on the fruit for diagnostic characters has obscured biological relationships. Domesticated and free- living populations of the high Andes, distributed from northwestern Argentina to Colombia, are closely allied and clearly separate from domesticated populations of coastal Chile and free-living populations of Argentina. Circumscription of the Argentine C. hircinum to include Andean populations is rejected. Specific differ- entiation among Andean populations, polyphyletic origins for C. quinoa, and the presence of different ploidy levels are not indicated. Free-living Andean types sym- patric with C. quinoa are provisionally placed within that species as subsp, mil- leanum. While the coastal quingua domesticate is clearly distinct from the Andean weed~crop complex, it is provisionally placed within subsp, quinoa to conserve established nomenclature. The overall pattern of morphogenetic variation among South American populations suggests a co-evolutionary relationship between do- mesticated and free-living populations of the high Andes, with a center of diversity at the southern extreme of the Andean range. Populations of C. hircinum represent a logical link to the progenitor of the quinua complex, although firm phyletic and systematic alignments will require more information concerning populations of south-central Chile, and further definition of relative affinities among North and South American elements of subsection Cellulata.
La biosistemfitica de la quinua II: Poblaciones indomesticadas. Las especies de Chenopodium sudamericanas asignadas a la secci6n Chenopodium subsecci6n Cellulata se han clasificado en base a la morfolgfa del fruto y de la hoja. Se hizo un estudio comparativo que incluy6 99 poblaciones de indomesticadas y domes- ticadas utilizando datos morfom~tricos y electrofor~ticos. Los patrones de variaci6n resultantes indican que el uso de las caracterfsticas del fruto como diagn6stico ha oscurecido las relaciones biol6gicas existentes. Las poblaciones provenientes de los altos Andes entre el noroeste Argentino y Colombia son muy relacionados y cla- ramente separados de las poblaciones domesticadas de Chile y las indomesticadas de Argentina. Se descarta la inclusi6n de las poblaciones andinas dentro de la especie argentina C. hircinum. No se encuentra la evidencia para diferenciaci6n especffica dentro de las poblaciones andinas," para el origen polifil~tico de C. quinoa, y para la presencia de diferentes niveles deploidia. Los tipos andinos indomesticados simpatricos con C. quinoa se ubican provisionalmente en la subespecie milleanum. Aunque la quingua costega domesticada es claramente diferente del complejo an- dino maleza/cultivo se ubica provisionalmente en la subespecie quinoa para con- servar la nomenclatura establecida. El patr6n general de distribuci6n morfogen~tica
' Received 22 August 1987; accepted 28 March 1988. 2 Department of Biology, Texas A&M University, College Station, TX 77843.
Economic Botany, 42(4), 1988, pp. 478-494 �9 1988, by the New York Botanical Garden, Bronx, NY 10458

1988] WILSON: QUINUA BIOSYSTEMATICS II 479
entre las poblaciones sudamericanas sugiere una relaci6n coevolutiva entre po- blaciones domesticadas y las indomesticadas de los Andes altos con un centro de diversidad en el extremo sur de la distribuci6n en los Andes. Las poblaciones de C. hircinum representan una uni6n 16gica al progenitos del complejo quinua aunque se necesitan mayor informacirn sobre las poblaciones del centro-sur de Chile para tener evidencia filogen~tica y sistem(ltica md.s firme. Tambi~n es necesaria una definicirn de las afinidades relativas entre los elementos de Norte y Suram~rica en la subseccirn Cellulata.
Chenopodium quinoa Willd. (Chenopodiaceae) is generally described as a re- lictual South American grain crop (Simmonds 1976) that has possible linkage to both basal seed agriculture in the New World (Sauer 1969) and development of a more diverse world agricultural system in the future (Cusack 1984). It is asso- ciated, both biologically and culturally, with cultivars of C. berlandieri Moq. subsp. nuttalliae (Safford) Wilson & Heiser of central Mexico (Simmonds 1965; Wilson and Heiser 1979) and an extinct cultigen from the eastern United States (Smith 1984). The latter represents either pre-Columbian dispersal of subsp, nuttalliae to the northeast from Mexico (Wilson 198 lb) or independent domestication of C. berlandieri subsp, j ones ianum Smith (Smith 1985; Smith and Funk 1985).
This description, however, is incomplete. Chenopodium quinoa (s.1.) includes free-living (wild, weedy, spontaneous) populations that have been placed as subsp. mil leanum (Aellen) Aellen or var. melanospermum Hunziker. While morpholog- ically distinct from cultivars, especially with regard to traditionally critical char- acters of the fruit (Aellen and Just 1943; Hunziker 1952), conspecific treatment of free-living populations has been supported by comparative examination of crossing relationships (Wilson 1980; Wilson and Heiser 1979) and electrophoretic variation (Wilson 1976, 1981 a; Wilson et al. 1983). Thus, C. quinoa subsp, quinoa (quinua) occurs within a biological and geographical matrix of closely related, free-living Chenopodium, a situation that also exists with C. berlandieri subsp. nuttalliae and possibly existed with C. berlandieri subsp, j ones ianum (Wilson 1981b).
A better understanding of the domesticated chenopods in terms of genetic and systematic structure, and clarification of problems associated with their origins and dispersal, will require examination of each as a single biological entity that includes both domesticated and free-living elements, and assessment of relation- ships between those elements. This study deals with such an examination of C. quinoa (s.1.). It centers on the determination of relative affinity between C. quinoa subsp, quinoa and free-living South American populations of subsection Cellulata. Recent biosystematic analysis of the latter (Wilson 1988a), using both morpho- metric and electrophoretic data, revealed two fundamental elements: a relatively uniform assemblage of populations from throughout the Andes, and an array of populations from lower elevations in Argentina that are characterized by distinctive isozyme polymorphisms, leaf lamina, and small, rotund fruits. Domesticated populations were not included in the comparative sample, although variation in fruit morphology and past electrophoretic work indicated that the free-living Andean element, known as ajara, is closely associated with quinua. A test of this hypothesis, the objective of this study, first required an overview of morphogenetic variation among domesticated populations. Comparative exam-

480 ECONOMIC BOTANY [VOL. 42
ination of quinua (Wilson 1988b), using identical methods, also produced a bi- modal pattern consisting of Andean populations (quinua) and a distinctive group distributed at lower elevations along the coast of Chile (quingua). The Andean element showed weak but discernible differentiation into northern and southern population systems. Relationships among domesticated and free-living popula- tions are examined here by comparative analysis of morphometric and electro- phoretic data from both groups.
METHODS AND MATERIALS
Electrophoretic and morphometric data sets were taken from those developed in previous studies of free-living populations (Wilson 1988a) and cultivated pop- ulations (Wilson 1988b). Eleetrophoretic methods and those associated with au- tomated measurement of leaf blades and fruit are described in those studies. Electrophoretic variation at 21 gene loci was analyzed using BIOSYS-1 (Swofford and Selander 1981). The MPCA (single group, standardized) routine of BIOSTAT II (Pimentel and Smith 1986) was used for principal component analysis of 10 variables derived from leaf blade measurements and nine direct measurements of fruit image interval areas.
Sample selection from the two data sets was prioritized according to maximal geographic representation, maximum number of locally sympatric quinua/ajara pairs, and maximal electrophoretic sample. The sample, listed in the appendix, includes 5 populations (1-5) of C. hircinum (s. str.), 44 populations of ajara (6- 49), 5 populations of quingua (50-54), and 45 populations of quinua. The 89 Andean samples include 24 pairs (quinua/ajara) taken from the same field. Sam- ples are listed in the appendix by sample number (column AA) and arranged into two groups, free-living (1--49) and domesticated (50-99). Sequence within these groups is by country, state, and elevation of the collecting site. Reference to the original data sets is by collection number and prior sample number. Prior sample number (column BB) for samples 1-49 can be found in the appendix (column A) of Wilson (1988a), whereas samples 50-99 can be referenced to the appendix (column A) of Wilson (1988b).
RESULTS
Isozymes
A total of 44 allelic variants was detected at 21 isozyme loci (16 polymorphic). Comparative relationships derived from allozyme frequencies are reflected by cluster analysis of Rogers' (1972) genetic distance (Fig. 1) and matrices of Nei's (1978) mean genetic identity (I) among selected groups of samples (Tables 1 and 2). Relative levels of variation among sample groups are reflected by data in Table 3.
As indicated by Fig. 1, electrophoretic differentiation within the total sample is clearly bimodal. Samples representing C. hircinum (cluster A) are well separated from samples representing the quinua complex (cluster B-quinua, ajara, and quin- gua). Samples of quingua (cluster C) show clear but relatively weak distinction from the Andean complex (quinua and ajara) and, as compared to quinua and ajara, closest affinity with C. hircinum. Linkage between quingua and the Andean complex appears to be through the free-living populations (Table 1), both northern

1988] W I L S O N : Q U I N U A B I O S Y S T E M A T I C S II 481
0,24 0,20 0+16 0 12
�9 C. hircinum �9 'ajara' (South) �9 'ajara' (North) gx 'Quinua' {South) o 'quinua' (Nottll) 13 'quingua'
O08 0.04 0.00 t
mS
114 �9
I - , 3
A55 A61 ~62 ~78 ~77
~ _ ~ ~65 ~$6 ~79 ATS .~
f _ ~ e 4 6 029 027 024 034 e26 044 e25 D47 ~80 039 e48 e49 o95 o93 ~96 oa6 o83 o84
I ~JO91 E 085 087 030 o90 o92 O99 O89 082
- - ~ A21 - - - - A12
~ . 5 9
A67 o53 ~ ai2 o50 o51
C - - 054
' ' ~ ' ' ' i 0.24 0.20 0. 6 0.12 0.08 0.04 0 00
Dis tance
Fig. 1. Cluster analysis (UPGMA), based on a matrix of Rogers' (1972) coefficient of genetic distance, of 99 Chenopodium samples (appendix). Cophenetic correlation = 0.933.

482 ECONOMIC BOTANY
TabLe 1+ Natrix of Nei's (1978) Genetic Identity by Chenopodium sample group (see appendix),
[VOL. 42
sample Group # Samples 1 2 3 4
I hircinum 5 0,~9 (samples I-5) (0.939-0.~4)
2 ajara 44 0.813 0.9~
(S~t~ 6-49) [0.~8-0.851) (0,~- 1.000) 3 ~Jinua 45 0.820 0.963 0.952
(sampLes 55-99) (0.723-0.880) (0.857-1.000) (0.831-1,000) 4 quingua 5 0.836 0.933 0.912
(sampLes 50-54) (0,766-0.863) (0.857-0,964) (0.010-0,964) 0.981
(0.952-1.000)
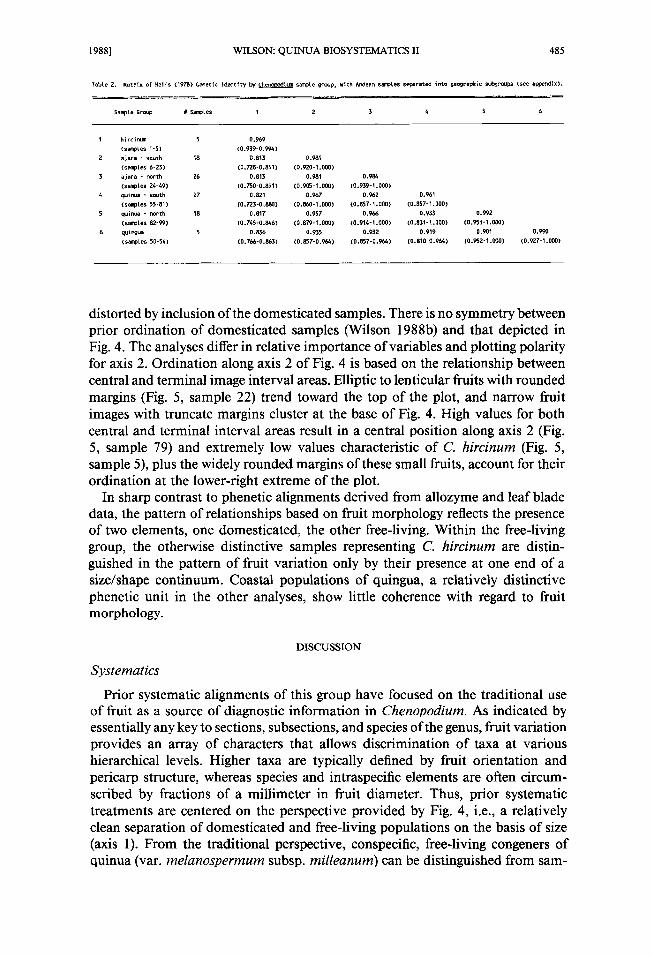
and southern (Table 2). Analysis of genetic affinities among the Andean samples is complicated by the presence of common allozymes in high frequency with only sporadic occurrence of variants. As indicated by Fig. 1, the first level of differ- entiation within the Andean complex centers on samples from the south, which are mostly domesticates from Argentina and southern Peru (cluster D, sample range 67 to 21). The remainder of the sample, with the exception of cluster E, is characterized by a low level of electrophoretic differentiation and minimal sys- tematic/geographic structure. Overall electrophoretic affinities (Table 1) reflect an interesting relationship between ajara and quinua in that quinua populations are more similar to populations of ajara than they are to each other. As indicated by Table 2, this appears to be based on a pattern of north/south differentiation in quinua (I = 0.933) that is not present in ajara (I = 0.981). Examination of Fig. 1 and Table 2 suggests that electrophoretic association between ajara and quinua is closest in the more variable (Table 3) southern populations, although weed/ crop identities are high in both areas and domesticated populations from the north and south show a slightly increased affinity to free-living populations that are locally sympatric. Again, associations at high levels of genetic identity, based on variation at few loci, can be more a function of sample size than true genetic distance or similarity. It appears, however, that ajara is slightly more variable than quinua (Table 3), although the pattern of variation between free-living and domesticated populations is not congruent when northern and southern compo- nents of the Andean complex are compared. The general similarity of ajara pop- ulations, as opposed to covariance with Andean quinua, is also reflected by the equal affinity of both northern and southern ajara to populations ofquingua (Table 2).
Leaf blades
Samples are ordinated in Fig. 2 by component scores resulting from principal component analysis. Plotting parameters associated with this PCA are presented in Table 4. Leaf blade images representing extremes in the pattern of variation are depicted in Fig. 3.
Prior analyses involving these samples (Wilson 1988a, b [table 3, fig. 2, 3]) show general congruence with this PCA with regard to relative importance of variables and plotting polarity. Leaf lamina with high sinus values (relatively deep lobing or toothing) and acute angles are positioned toward the left of the plot along axis 1. Axis 2 centers on the relationship between lamina area intervals,

1988] WILSON: QUINUA BIOSYSTEMATICS II 483
4.5
4.0
3.5
3.0
2,5
2.0
1.5
1.0
0.5
0.0
-0.5
-1.0
-1.5
-2.0
-2.5
-3.0
I I I I F I I I I I I I I I I I I I I I I
C. hircinum
A 'ajara' (South)
'alara' (North)
, ~ 'quinua' (South)
Q 'quinua' (North)
] 'quingua'
I I
i
A A O
| �9
A
[] [] A [] |
A
-4.0 y m
f L I U i t J i ~ J i t I t L I i i t t i -6.0 -5.0 -4.0 -3.0 -2.0 -1.0 0.0 1.0 2.0 3.0
F i g . 2. P l o t o f s a m p l e ( a p p e n d i x ) scores f r o m the f i rst t w o p r i n c i p a l c o m p o n e n t axes d e r i v e d f r o m variables associated with Chenopodium leaf blade image measurement (Fig. 3, Table 4). Overprinted points (10) are placed adjacent to the original point and to the right.
with samples showing high basal areas plotted toward the base of Fig. 2. This rough symmetry is reflected by the position of C. hircinum and quingua along axis 1 on all three plots. Both taxa show acute basal and terminal leaf blade angles and high sinus areas, although the latter are the result of deep lobing in C. hircinum (Fig. 3, sample 5) and deep toothing in quingua (Wilson 1988b, fig. 3, sample 7). The tendency for northern populations of the Andean complex to occupy the opposite pole of axis 1, with southern samples in an intermediate position (Wilson 1988b, fig. 2), is also reflected in Fig. 2. However, the relatively distinct phenetic coherence of northern quinua (Wilson 1988b, fig. 2) is obscured by intergradation with southern ajara (Fig. 2, samples 19, 22, 16, 20), and some samples representing northern ajara (Fig. 2, samples 25, 27, 31) grade into the central zone of axis 1.

484 ECONOMIC BOTANY [VOL. 42
TAREA MAREA ~ . BAREA ]'- "~'\
\\\ /
i sw/, r,.oLE m_
I ~ / ~ TSINUS I / , " 1 __ 1 ,~, MSINUS
I:'ER]M'E:I[/'w~A"ER 6g ~ \\
~ ~ N U S lcm Fig. 3. Leaf blade images representing Chenopodium samples at extremes of axes 1 (5 vs. 85) and
2 (17 vs. 69) in Fig. 2. Indicated interval areas and angles represent base data for a portion of the variables used in PCA (see Table 4, text).
Thus, phenetic associations derived from leaf blade morphology are similar to those based on electrophoretic data in that both C. hircinum and quingua are separated from the Andean complex, although distinction between the lowland taxa is not indicated. Andean material from the south shows the greatest range of variation and there is some indication of geographic affinity between free-living and domesticated samples. This is also congruent with the pattern of electropho- retic variation. Finally, both patterns of variation show a low level of differen- tiation between ajara and quinua as separate elements of the Andean complex.
Fruit
Samples are plotted by component scores resulting from principal component analysis in Fig. 4. Plotting parameters associated with this PCA are presented in Table 5. Fruit images representing extremes in the pattern of variation are depicted in Fig. 5.
The ordination of samples in Fig. 4 is comparable to prior analyses involving these data in that dispersion along axis 1 is essentially a function of size (Fig. 5, sample 79 vs. sample 5), whereas axis 2 is a "shape" component that functions to contrast differences in selected interval areas (Fig. 5, sample 22 vs. sample 94). However, in contrast with analysis of the combined leaf blade data, this combined data set includes radically different elements with regard to overall size of the fruit images. Thus, axis 1 includes a larger portion of the total sample variation, and relative sample position along axis 2 reflects a plotting polarity that is unique to this PCA. In terms of relative importance of fruit interval areas, this analysis is similar to that performed on data from free-living populations (Wilson 1988a), although the plotting polarity is reversed. Relative position of the free-living samples is roughly congruent between the two analyses in that the range of samples extending from C. hircinum to the lower left in Fig. 5 of the earlier study is comparable to the range extending to the upper left from the C. hircinum samples in Fig. 4. Ordination of the wild types is, however, compressed and partially
1988] WILSON: QUINUA BIOSYSTEMATICS II 485
TabLe Z. Natr ix of Neils (1978) Get,eric Ident i ty I~ Chenopodium sample group, with Ar~dearl sataptes separated into geographic st~agroups (see apper~ix).
SampLe Group # SampLes 1 2 3 4 5 6
1 hircinum 5 0.969
(samples 1-5) (0,939-0.994)
Z a j a r a - south 18 0.813 0.981
(s~ies 6-23) (0.728-0.851) (0,920-1.000) 3 a j a r a - north 26 0.813 0.981 0.984
(s~tes 24-49) (0.~0-0.851) (0.905-I,000) (0.939-I.000) 4 quinua - south 27 0.821 0.967 0.962
(samptes 55-01) (0.723-0.880} (0.860-1.000) (0.057-1.000) 5 quirtcla - north 18 0.817 0.957 0.966
(saepLes 82-99) (0.745-0.846) (0.879-1.000) (0.914-1.000) 6 c~Jingua $ 0.8,t6 0.935 0.932
(samples 50"54) (0. 766-0.863) (0.8w (0.857-0.964)
0.961 (0.057-I ,000)
0.733 0.992 (0.831-I.000) (0.~3-1.800)
0.919 0.901 (0.810-0.964) (0.952-1.000)
0.990 (0.927-1.000)
distorted by inclusion of the domesticated samples. There is no symmetry between prior ordination of domesticated samples (Wilson 1988b) and that depicted in Fig. 4. The analyses differ in relative importance of variables and plotting polarity for axis 2. Ordination along axis 2 of Fig. 4 is based on the relationship between central and terminal image interval areas. Elliptic to lenticular fruits with rounded margins (Fig. 5, sample 22) trend toward the top of the plot, and narrow fruit images with truncate margins cluster at the base of Fig. 4. High values for both central and terminal interval areas result in a central position along axis 2 (Fig. 5, sample 79) and extremely low values characteristic of C. hircinum (Fig. 5, sample 5), plus the widely rounded margins of these small fruits, account for their ordination at the lower-right extreme of the plot.
In sharp contrast to phenetic alignments derived from allozyme and leaf blade data, the pattern of relationships based on fruit morphology reflects the presence of two elements, one domesticated, the other free-living. Within the free-living group, the otherwise distinctive samples representing C. hircinum are distin- guished in the pattern of fruit variation only by their presence at one end of a size/shape continuum. Coastal populations of quingua, a relatively distinctive phenetic unit in the other analyses, show little coherence with regard to fruit morphology.
DISCUSSION
Systematics
Prior systematic alignments of this group have focused on the traditional use of fruit as a source of diagnostic information in Chenopodium. As indicated by essentially any key to sections, subsections, and species of the genus, fruit variation provides an array of characters that allows discrimination of taxa at various hierarchical levels. Higher taxa are typically defined by fruit orientation and pericarp structure, whereas species and intraspecific elements are often circum- scribed by fractions of a millimeter in fruit diameter. Thus, prior systematic treatments are centered on the perspective provided by Fig. 4, i.e., a relatively clean separation of domesticated and free-living populations on the basis of size (axis 1). From the traditional perspective, conspecific, free-living congeners of quinua (var. melanosperrnum subsp, rnilleanum) can be distinguished from sam-

486 ECONOMIC BOTANY [VOL. 42
Tabte ~~ Heterozygosity data aversge~ by Chet-~oodium $~pte group and subgro~ (see appendix).
SampLe ~eterozygos~ty k L [e[es Percent Loci Gvo~a~ ~oserved/Expected Per Locus Polymorp~ ~ r
h i r c i n m 0,012/0.054 1,26 Z1.9 ajara-south 0.00810.024 1.05 7.9 ajara-nor th 0.008/0.021 1.05 7.3 ~JinUa-South 0.003/0.D17 1,04 6.2 qaJi rvJa - i~ r t h 0.005/0.0G9 1.02 ] . 7 ~ir~ua D.O00/O.O05 1o00 1.9 totat saemte 0.006/0,019 1,05 6.9
pies allied with C. hircinum by phenetic association with quinua (Fig. 4, sample range 31-49).
This pattern of relationships is not, however, consistent within the broader comparative context provided by isozymes and leaf blade morphology (Fig. 1, 2, Tables 1, 2). These results clearly separate C. hircinum (s. str.) from the quinua complex and, in addition, dissociate populations of coastal quingua from the Andean complex of quinua and ajara. The broader perspective, in terms of both comparative data and taxa, provides little support for either biological or taxo- nomic differentiation between ajara and quinua. Indeed, these comparisons clearly indicate that some small-fruited populations ofajara show higher affinity to nearby stands of quinua than to other free-living populations occurring further afield.
The unique and disparate perspective provided by the pattern of fruit variation, as opposed to allozymes or leaf blade morphology, may be based on the selective importance of fruit morphology in Chenopodium. The fruit is the unit of con- sumption in quinua and thereby the primary unit of human selection. Polymor- phisms involving size, shape, and color are a natural product of American Indian selection, comparable to those found in squash, beans, and maize. As an index to the degree of variation in quinua, the range of fruit diameters among 98 samples examined by Wilson (1988b) is 1.00 mm (min. = 1.60, max. = 2.60), with a standard deviation of 0.20. In contrast, the range of fruit diameters among 20 populations of C. hircinum (s. str.) is 0.27 mm (min. = 1.29, max. = 1.56) with a standard deviation of 0.05 (Wilson 1988a). The lack of much intraspecific fruit size variation in C. hircinum, and other free-living species of the genus (Herron 1953) is probably associated with the fruit as the unit of dispersal (West 1967) and the center of control for germination dormancy (Williams and Harper 1965). Given the critical importance of these factors for colonizing annuals, the conser- vative nature of fruit variation in free-living Chenopodium species is reasonably linked to selective constraints that are not present in domesticates.
The range of fruit diameters in 69 samples of ajara (Wilson 1988a) is 0.68 mm (min. = 1.30, max. = 1.98), with a standard deviation of 0.13. It is this wide range of variation, clearly defined by the dispersed ordination of ajara samples in Fig. 4, that reflects the close affinity between free-living and domesticated Andean populations, an association that is well established by other comparative data. The symmetrical pattern of variation in ajara and quinua along axis 2 of Fig. 4 reflects variation in shape, especially at the fruit image margin, that has been shown to be linked to variation in testa thickness (Smith 1985; Wilson 198 l b). Reduction of the testa apparently releases constraints on embryonic de-

1988] WILSON: QUINUA BIOSYSTEMATICS II 487
TabLe 4, PLott ing c r i t e r i a associated wLth the f i r s t two pr inc ipa l cor axes of the Chenooedfum Leaf analysis, component scores are plot ted i n
F i g . 2, VariabLes are described in ~/ilson (1988a;1988b) and depicted i n Fig, 3.
Mot p~ l l e t r i c Eigenvector Percent C r ~ l p ~ t Total
VariabLe Coef f ic ients Variance Correlat ion
AXIS: 1 2 1 2 1 2 AXIS: I 2
TOTSlN -0.331 -0.227 /,1.557 14.584 -0.645 -0.382
BAREA 0,185 -0.542 12.972 83.327 0.360 -0,913
HAREA -0.324 0.413 39.746 ~ .427 -0,630 0.696
TAREA 0.166 0./*25 10.494 51.212 0,324 0.716
LENUlO -Q.302 0.304 34.601 26.228 -0.588 0.512
BSlk~S 0 , 0 ~ 0.170 2.422 8.166 0.156 0.286
NSIIIUS -0.360 -0,300 49.(k~5 25,615 -0.71J0 -0.506
TSIWJS -O.3(Y~ -O.ZO0 58.272 11.339 -0,763 -0.337
BANGLE "0.455 0,170 78./*96 8.249 - 0 . 8 ~ 0,287
TANGLE -0,368 -0,156 51,390 6,953 -0.717 -0_264
Eigenvatue 3.790 2.841
Z variance 37.902 28.412 Ctmutative X 37.902 66.314
velopment, allowing fruit morphology to be influenced by structural features of the embryo, especially the peripheral cotyledons. Full reduction of the testa to a thin membrane, producing a pale-colored fruit with truncated margins, is a di- agnostic character for domesticated Chenopodium (Wilson 198 lb).
These considerations suggest that the pattern of variation depicted in Fig. 4 reveals the source of taxonomic problems surrounding free-living relatives of quinua, i.e., reliance on fruit diameter as a diagnostic character. It also reflects an intriguing phenetic association between ajara and quinua. If fruit polymorphism in quinua is linked to release from selective constraints imposed on free-living Chenopodium, then phenetically congruent polymorphism found among popu- lations of ajara must be associated with a similar release. Ajara populations are, however, free-living plants not influenced by direct human selection. They are well adapted to a wide array of disturbed Andean habitats, including cultivated fields of quinua. Parallel patterns of fruit variation demonstrated in Fig. 4 could signal a history of genetic interaction between cultivated populations and their companion weeds. The four ajara samples showing closest phenetic affinity to quinua (Fig. 4, sample range 31-49) were all taken from quinua fields (see Wilson 1988a, fig. 5). This group of four also shows either a complete absence (31, 49) or a low level (8, 31) of genetic distance from associated populations of quinua (Fig. 1). Thus, difficulties with taxonomic circumscription ofajara as a unit distinct from quinua may be based on varying levels of genetic differentiation between free-living and domesticated populations.
The overall pattern of variation among samples examined here suggests the presence of two fundamental tetraploid elements of subsection Cellulata in South America, C. quinoa (s.1.) and C. hircinum (sensu Schrader). Plants representing these taxa will hybridize to produce a fully fertile F] showing normal segregation of allozymes (Wilson et al. 1983) among F2 plants that are also fully fertile. Thus, all South American populations occur within a primary gene pool that, as indicated by electrophoretic variation, shows a clear center of genetic diversity in C. hir- cinum of the Argentine lowlands. Specific distinction between these two elements is based on apparent reproductive isolation, as reflected by strong morphogenetic discontinuity, and the need to retain taxonomic categories for classification within each element at lower levels.

488 ECONOMIC BOTANY [VOL. 42
I I I I t I I I I I I I
-1.0
-2.0
-3.0
-4.0
-5.0
6.0
50i ~ A
A @ A ~|174 ,0 [] S** 3,0 /~xgX
20 AkAk ~ ,0 & Ak | e ~
o.o | 0
L A A t
2 [] [] 1 ~ z ~ x
L I I l I I ~ 1 J I I I I -6.0 -5,0 -4.0 -3.0 -2.0 -1.0 0.0 1.0 2.0 3.0 4.0
Fig. 4. Plot of sample (appendix) scores from the first two principal component axes derived from Chenopodium fruit interval areas (Fig. 5, Table 5). See legend in Fig. 1 and 2 for symbol code. Overprinted points (4) are placed adjacent to the original point and to the right.
A primary division of C. quinoa into Andean and coastal Chilean elements would produce a classification system that reflects the pattern of variation observed here. This, however, would require considerable change in the established no- menclature. Analysis of newly "discovered" quingua populations occurring well south of populations sampled in this study, evidently sympatric with free-living populations assignable to subsection Cellulata (Erich Forster, pers. comm. 1986), may justify such a change. However, pending a better understanding of variation within the coastal element, it is provisionally placed at the varietal level within subsp, quinoa. Free-living populations that are sympatric with Andean quinua and referred to here by the Andean name, ajara, are clearly conspecific with the domesticate and tentatively placed as subsp, milleanum (Aellen) Aellen. Formal nomenclatural assignments await more comparative data on possible linkage be-

1988] WILSON: QUINUA BIOSYSTEMATICS II 489
Table 5. P lo t t ing c r i t e r i a associated with the f i r s t two pr inc ipa l component axes the Chenopodium f r u i t analysis. Variables are depicted in Fig. 5,
compa~ent scores are plot ted i n Fig. 4.
Norphometric Eigenvector Percent Ccmponent Total
Variable Coeff icients Variance CorreLation
AXIS: 1 2 1 2 1 2 AXIS: 1 2
EO -0.328 -0.572 95.172 2.986 -0.076 -0,173 EP -0.335 -0,103 99.220 0,098 -0.996 -0.031
EQ -0.335 0.157 99.299 0.225 -0.996 0.1)47 ER -0.334 0.322 98.806 0,949 -0.994 0.097
ES -0.334 0.405 98.360 1.500 -0.992 0.122 EU -0.335 0.2~2 98.966 0,777 -0.995 0.088 EV -0.335 0.114, 99.355 0.119 -0.997 0.035
EW -0,334 -0.126 98.824 0,145 -0.994 - 0 . 0 ~ EX "0.330 -0.506 96.253 2.341 -0.981 -0.153
Eigenvatue 8.843 0.091
variance 98,250 1.016 Cumulative ~ 98.250 99.266
tween North and South American tetraploids, populations of south-central Chile, and rare, prostrate elements of the subsection in Argentina (C. hircinum subsp. catamarcense Aellen) and highland Chile (C. philippianum Aellen).
Phylogenetics
Phyletic scenarios reconstructing the origin of quinua under human selection involve two fundamental options: (1) tetraploidy in South America with subse- quent domestication from South American wild types (Gandarillas 1984) vs. (2) original tetraploidy in North America with either original domestication in Mexico (southward diffusion of C. berlandieri subsp, nuttalliae) or independent domes- tication in South America based on wild migrants from North America (Aellen 1929; Wilson and Heiser 1979). Requirements of the first option, allied Andean diploid species and specific differentiation among Andean tetraploids, were not evident in this study. Free-living diploids, readily identified by both electropho- retic and morphometric characters (Walters 1985), were not detected, and differ- entiation among all Andean samples, both free-living and domesticated, is min- imal. However, this question cannot be fully clarified until material representing both North and South American elements of the Cellulata complex is subjected to comparative analysis.
With regard to origin and differentiation within South America, diffusion from a northern center is suggested by vague reports of early quinua cultivation by the Chibcha Indians in northern Colombia (Risi and Galwey 1984; Tapia 1979), and Aellen's (1929) linkage of Ecuadorian ajara (subsp. milleanum) with the North American C. berlandieri subsp, zschackei (Murr) Zobel. While this possibility cannot be excluded, the predominant hypothesis of an original center in southern Peru and Bolivia (Gandarillas 1984; Risi and Galwey 1984), with mid-elevation Valle types representing the archaic form (M. Tapia, pers. comm. 1984), is con- sistent with observed patterns of morphogenetic variation in quinua (Wilson 1988b) and data presented here. This consistency is, however, based on the as- sumption of a direct relationship between centers of diversity and centers of origin. This relationship, if applied to the free-living taxa, clearly points to an alliance between C. hircinum (s. str.) and the basal progenitor of the quinua complex (quinua, quingua, and ajara). Within this complex, ajara (subsp. milleanum) is

490 ECONOMIC BOTANY [VOL. 42
EV EU 79 ES ER
EP
I I
1ram
22
Fig. 5. Marginal fruit images taken from Chenopodium samples at extremes in the pattern of variation as reflected by PCA ordination (Fig. 4). Variables for PCA (EO to EX) were derived from areas of marked image intervals.
logically placed as a central and perhaps basal element with regard to relative levels of both genetic diversity and affinity to quinua and quingua. Thus, a phyletic sequence that begins with hircinum-like plants and moves through ajara-like plants to quinua, suggested by Aellen (1929, 1960) and Hunziker (1952), is at least roughly compatible with data presented here. A North American connection to the base of this sequence could be associated with elements of the C. berlandieri complex [subsp. boscianum (Moq.) Aellen and subsp, berlandieri] inhabiting the southern Great Plains of the United States and the Gulf Coast. These taxa share with C. hircinum its small, rotund fruits, acute, deeply-lobed leaf blades, diffuse inflorescences, and a distinctive, fetid odor.
The working hypothesis mentioned above places both quingua and ajara in anomalous positions. If quingua is a derived form of Andean quinua, then why does it show a closer affinity to the putative ancestral types (Table 1, 2)? Assuming that these minor differences in genetic identity are significant, one explanation could involve the antiquity of quingna on the coastal lowlands of central Chile. Recent work (Briicher 1987) suggests that this area, a Vavilovian subcenter of New World domestication, may actually be more of a refugium for taxa domes- ticated elsewhere. As indicated above, quingua is clearly linked to Andean quinua. The uniform presence of translucent perisperm and the glomerate inflorescence in quingua, both archaic features associated with free-living forms, suggest that extant coastal populations were founded from Andean quinua prior to the de- velopment of floury pefisperm and amarantiform inflorescences in the highlands. This, plus its affinity to free-living taxa and its association with the unusual ethnoflora of the Chilo6 subcenter, suggests that quingua is a archaic form of quinua, anciently derived from a parent population that has since undergone significant differentiation in the Andean highlands.
While ajara, as a unit (subsp. milleanum), is logically placed as a phyletic

1988] WILSON: QUINUA BIOSYSTEMATICS I! 491
intermediate between C. hircinum and quinua, individual populations of this free- living form are anomalous with regard to their distribution and varying levels of morphogenetic affinity to domesticated populations in the uplands.
Available evidence (Wilson 1988b) indicates that quinua is monophyletic with an original center of domestication in the uplands of Bolivia and Peru. Phenetic coherence and relative uniformity of populations from the northern Andes suggest diffusion northward from the southern center of origin. Total sympatry between extant populations of ajara and quinua indicates that the human-mediated dis- persal of quinua was linked to a similar dispersal of ajara. While natural agents, probably birds (West 1967), could have mediated dispersal of the free-living form, the common presence ofajara fruits in quinua harvests suggests that Homo sapiens is responsible for this sympatry between the putative progenitor and its derivative. As indicated by data presented here, morphogenetic differentiation that once must have distinguished the free-living progenitor from its derived domesticate is not clearly detectable in extant populations. Some free-living populations are more closely aligned with domesticates than with other populations of ajara and vice versa.
The anomalous position ofajara within the total context of the South American Cellulata complex suggests that the relationship between ajara and C. hircinum may be comparable to that proposed for Andean quinua and quingua. The low elevation taxa (quingua and C. hircinum) may be archaic elements, isolated in conservative selective environments and thereby buffered from relatively rapid evolutionary change mediated by Native Americans in the Andean highlands. Congruence between ajara and Andean quinua with regard to electrophoretic and leaf variation, in conjunction with atypical fruit variation in ajara, may reflect the presence of a co-evolutionary weed/crop unit (Harlan 1965) in the Andes. As a possible expression of past weed/crop hybridization-differentiation cycles, quin- ua and its companion weed may therefore reflect both the result and a causal foundation for human-mediated differentiation of the Cellulata complex in the Andean highlands.
CONCLUSIONS
Morphogenetic variation among South American elements of subsection Cel- lulata reveals two primary elements; C. hircinum (s. str.) and C. quinoa (s. lat.). Chenopodium hircinum, distributed in the low plains of southeastern South Amer- ica and at mid-elevations in the eastern Andean slopes of Argentina, is charac- terized by unique allozyme frequencies, a high level ofintraspecific variation, and distinctive morphology of both the leaf blade and fruit. Chenopodium quinoa, distributed throughout western South America, includes two elements well sep- arated by electrophoretic, leaf, and fruit characters. The Andean element includes both free-living and domesticated populations; the coastal Chilean element ap- pears to include only domesticates. Phyletic hypotheses, as well as formal clas- sification of the group, must remain provisional until more information is avail- able concerning populations from southern Chile and possible linkage with North American taxa of subsection Cellulata. It is clear, however, that diversity in C. quinoa is centered in the southern Andes. The pattern of relative morphogenetic affinity among free-living and domesticated populations of the Andean highlands appears to reflect a history of genetic exchange between weed and crop.

492 ECONOMIC BOTANY [VOL. 42
ACKNOWLEDGMENTS
T h a n k s to Miguel Hol le a n d Pau l Fryxel l for p r o v i d i n g the Span i sh abstract .
The research was suppor t ed by grants f rom the N a t i o n a l Science F o u n d a t i o n
(BSR-8207180) a n d the U .S .D .A. ( 8 3 - C R C R - 1 - 1 2 6 7 ) . S u p p l e m e n t a l suppor t for
image analys is software d e v e l o p m e n t was p r o v i d e d by the T A M U College o f
Science a n d Office o f U n i v e r s i t y Research.
LITERATURE CITED
Aellen, P. 1929. Beitrag zur Systematik der Chenopodium-Arten Amerikas, vorweigend auf Grund der Sammlung des United States National Museum in Washington, D.C. Repert. Spec. Nov. Regni Veg. 26:31-64, 119-160.
1960. Chenopodium. Pages 533--657 in G. Hegi, ed., Illustrierte Hora von Mitteleuropa. 2nd ed. Vol. 3. C. Hanser, Munich. , and T. Just. 1943. Key and synopsis of the American species of the genus Chenopodium L. Amer. Midl. Naturalist 30:47-67.
Briicher, H. 1987. The Isthmus of Panama as a crossroad for prehistoric migration of domesticated plants. Geojoumal 14:121-122.
Cusack, D.F. 1984. Quinua: grain of the Incas. The Ecologist 14:21-31. Gandarillas, H. 1984. Obtenci6n experimental de Chenopodium quinoa Willd. Instituto Boliviano
de Tecnologla Agropecuaria, La Paz. Harlan, J.R. 1965. The possible role of weed races in the evolution of cultivated plants. Euphytica
14:177-188. Herron, J.W. 1953. Study of seed production, seed identification, and seed germination of Che-
nopodium spp. Mem. New York Agric. Exp. Sta. 321:3-24. Hunziker, A.T. 1952. Los pseudocereales de la agricultura indigena de Amrrica. ACME Agency,
Buenos Aires�9 Nei, M. 1978. Estimation of average heterozygosity and genetic distance from a small number of
individuals. Genetics 89:583-590�9 Pimentel, R. A., and J. D. Smith. 1986. BIOSTAT II--a multivariate statistical toolbox. Sigma Soft,
Placentia, CA. Risi, J. C., and N. W. Galwey. 1984. The Chenopodium grains of the Andes: Inca crops for modem
agriculture. Adv. Appl. Biol. 10:145-216. Rogers, J. S. 1972. Measures of genetic similarity and genetic distance. Studies in Genetics. Univ.
Texas Publ. 7213:145-153. Sauer, C.O. 1969. Agricultural origins and dispersals�9 MIT Press, Cambridge, MA. Simmonds, N.W. 1965. The grain chenopods of the tropical American highlands. Econ. Bot. 19:
223-235�9 �9 1976. Quinoa and relatives�9 Pages 29-30 in N. W. Simmonds, ed., Evolution of crop plants�9 Longman, New York.
Smith, B.D. 1984. Chenopodiurn as a prehistoric domesticate in eastern North America: evidence from Russell Cave, Alabama. Science 226:165-167.
1985. Chenopodium berlandieri ssp. jonesianum: evidence for a Hopewellian domesticate from Ash Cave, Ohio. Southe. Archaeol. 4:107-133. , and V. A. Funk. 1985. A newly described subfossil cultivar of Chenopodiurn (Chenopodi- aceae). Phytologia 57:445--448.
Swofford, D. L., and R. B. Selander. 1981. BIOSYS-1, a computer program for the analysis ofallelic variation in genetics. User's manual. Univ. Illinois, Urbana.
Tapia, M. 1979. Historia y distribuci6n geogrfifica. Pages 11-19 in M. Tapia, ed., Quinua y kafiiwa: cultivos andinos. CIID, Bogota�9
Waiters, T. W. 1985. Analysis of systematic and phyletic relationships among alveolate-fmited Chenopodiurn of western North America�9 Ph.D. dissertation, Texas A&M University, College Station.
West, G.C. 1967. Nutrition of tree sparrows during winter in central Illinois. Ecology 48:58-67. Williams, J. T., and J. L. Harper. 1965. Seed polymorphism and germination I. The influence of

1988] WILSON: QUINUA BIOSYSTEMATICS II 493
nitrates and low temperatures on the germination of Chenopodium album. Weed Res. 5:141- 150.
Wilson, H. D. 1976. Genetic control and distribution of leucine aminopeptidase in the cultivated chenopods and related weed taxa. Biochem. Genet. 14:913-919.
1980. Artificial hybridization among species of Chenopodium section Chenopodium. Syst. Bot. 5:253-263.
1981a. Genetic variation among tetraploid Chenopodium populations of southern South America (sect. Chenopodium subsect. Cellulata). Syst. Bot. 6:380-398.
1981 b. Domesticated Chenopodium of the Ozark Bluff Dwellers. Econ. Bot. 35:233-239. 1988a. AUozyme variation and morphological relationships of Chenopodium hircinum (s.1.).
Syst. Bot. 13:215-228. - - . 1988b. Quinua biosystematics I: domesticated populations. Econ. Bot. 42:461-477.
, and C. B. Heiser, Jr. 1979. The origin and evolutionary relationships of 'Huauzontle ' (Che- nopodium nuttalliae Safford), domesticated chenopod of Mexico. Amer. J. Bot. 66:198-206. , S. C. Barber, and T. W. Walters. 1983. Loss of duplicate gene expression in tetraploid Chenopodium. Biochem. Syst. & Ecol. 11:7-13.

494 ECONOMIC BOTANY [VOL. 42
Appendix. SampLe ident i f i ca t ion (AA), cottect ion data (cotmtry, state, coLLection number [HDW]), and sample
ident i f i ca t ion (BE) from appendices of pr ior studies (1-49 Wilson 1988a; 50-99 Ui[son 1988b).
Free-Living Domesticated
AA COU STAT COL# BB
1 ARG MEND 3999 10
2 ARG SLUI 3987 12
3 ARG SJUA 4016 13
4 ARG CATA 39"79 18
5 ARG rATA 3972 20
6 ARG SALT 3306 21
7 BOL ORLIR 4070 23
8 BOL ORUR 4071 24
9 BOL COCH 4078 25
10 BOI COCH 4088 27
11 BOL COCH 4085 28
12 BOL COCH 4076 29
13 BOL LAPA 4056 30
14 BOL LAPA 4094 31
15 BOL LAPA 4039 32 16 BOL LAPA 4052 33
17 BOL LAPA 4066A 35
18 BOL LAPA 4067A 36
19 PER CUSC 5147 37
20 PER CLISC 5142 38
21 PER CUSC 5159 41
22 PER CUSC 5165 + 42
23 PER CUSC 5131 45
24 PER CAJA 5167 48
25 PER CAJA 5185 52
26 PER CAJA 5187 54
27 PER CAJA 5173 55
28 PER CAJA 5191 56
29 PER CAJA 5189 57
30 PER CAJA 5175 58
31 PER CAJA 5174' 59
32 ECO CHIN 5295 60
33 ECU CHIN 5293 61
34 ECU CHIN 5291 64
35 EQJ TUNG 5296 66
36 ECU TUNG 5282 68
37 ECU COTO 5281 ~ TO
38 ECU COTO 5271] 71
39 ECU COTO 5266 74
40 ECU COTO 5260 75
41 ECU COTO 5276 76
42 ECU PICH 5252 TO
43 ECU PICH 5258 79
44 ECU IMBA 5239 80
45 ECU ]NBA 5233 81
46 ECU IHBA 5124 82
47 COL NARI 5222 85
48 COL NAR] 5227 88
49 COL NARI 5219
AA COLI STAT COL# BB
50 CHI LAGO 3227 1
51 CHI ARAU 3237 4
52 CHI ARAU 3241 5
53 CHI B iOB 3224 7
54 CHI NAUL 3238 9
55 ARG JUJU 3305 10
56 ARG JUJU 3331 11
57 ARG JUJU 3332 12
58 ARG JUJU 3297 13
59 ARG JUJU 3298 14
60 ARG JUJU 3336 15
61 ARG JUJU 3345 16
62 ARG JUJU 3346 17
63 BOL ORUR 4071 28
64 BOL ORUR 4073 29
65 SOL COCH 4091 30
66 BOL COCH 4084 33
67 BOL LAPA 5540 34
68 BOL LAPA 4040 35
69 BOL LAPA 4036 37
TO BOL LAPA 4037 38
71 BOL LAPA 4053 39
72 BOL LAPA 4066 41
73 BOL LAPA 4067 42
74 BOL LAPA 4096 43
75 PER CUSC 5146 47
76 PER CUSC 5143 50
77" PER CUSC 5157 54
78 PER CUSC 5160 55
79 PER CUSC 5165 57
80 PER CUSC 5137 59
81 PER CUSC 5139 60 82 PER CAJA 5184 65
83 PER CAJA 5186 68
84 PER CAJA 5181 69
85 PER CAJA 5192 70
86 PER CAJA 5188 71
87 PER CAJA 5174 72
88 ECU CHIN 5291 75
89 ECU COTO 5281 78
90 ECU COTO 5268 79
91 ECU COTO 5267 82
92 ECU COTO 5259 83
93 ECU ]MGA 5238 85
94 ECU ]MBA 5232 87
95 ECU ]NBA 5240 88
96 COL NAR I 5229 93
97 COL NAR] 5226 94
98 COL NAR[ 5219 95
99 COL HARI 5207 96