QuEChERS Method Combined with Gas- and Liquid ... - MDPI
20
Citation: Tong, K.; Xie, Y.; Huang, S.; Liu, Y.; Wu, X.; Fan, C.; Chen, H.; Lu, M.; Wang, W. QuEChERS Method Combined with Gas- and Liquid-Chromatography High Resolution Mass Spectrometry to Screen and Confirm 237 Pesticides and Metabolites in Cottonseed Hull. Separations 2022, 9, 91. https:// doi.org/10.3390/separations9040091 Academic Editor: Chiara Emilia Cordero Received: 8 March 2022 Accepted: 31 March 2022 Published: 2 April 2022 Publisher’s Note: MDPI stays neutral with regard to jurisdictional claims in published maps and institutional affil- iations. Copyright: © 2022 by the authors. Licensee MDPI, Basel, Switzerland. This article is an open access article distributed under the terms and conditions of the Creative Commons Attribution (CC BY) license (https:// creativecommons.org/licenses/by/ 4.0/). separations Article QuEChERS Method Combined with Gas- and Liquid-Chromatography High Resolution Mass Spectrometry to Screen and Confirm 237 Pesticides and Metabolites in Cottonseed Hull Kaixuan Tong 1 , Yujie Xie 1 , Siqi Huang 2 , Yongcheng Liu 2 , Xingqiang Wu 1 , Chunlin Fan 1 , Hui Chen 1, *, Meiling Lu 3 and Wenwen Wang 3 1 Key Laboratory of Food Quality and Safety for State Market Regulation, Chinese Academy of Inspection and Quarantine, Beijing 100176, China; [email protected] (K.T.); [email protected] (Y.X.); [email protected] (X.W.); [email protected] (C.F.) 2 Laboratory of Heilongjiang Feihe Dairy Co., Ltd., Qiqihar 164800, China; [email protected] (S.H.); [email protected] (Y.L.) 3 Agilent Technologies (China) Limited, Beijing 100102, China; [email protected] (M.L.); [email protected] (W.W.) * Correspondence: [email protected] Abstract: Cottonseed hull is a livestock feed with large daily consumption. If pesticide residues exceed the standard, it is easy for them to be introduced into the human body through the food chain, with potential harm to consumer health. A method for multi-residue analysis of 237 pesti- cides and their metabolites in cottonseed hull was developed by gas-chromatography and liquid- chromatography time-of-flight mass spectrometry (GC-QTOF/MS and LC-QTOF/MS). After being hydrated, a sample was extracted with 1% acetic acid in acetonitrile, then purified in a clean-up tube containing 400 mg MgSO 4 , 100 mg PSA, and 100 mg C18. The results showed that this method has a significant effect in removing co-extracts from the oily matrix. The screening detection limit (SDL) was in the range of 0.2–20 μg/kg, and the limit of quantification (LOQ) was in the range of 0.2–20 μg/kg. The recovery was verified at the spiked levels of 1-, 2-, and 10-times LOQ (n = 6), and the 237 pesticides were successfully verified. The percentages of pesticides with recovery in the range of 70–120% were 91.6%, 92.8%, and 94.5%, respectively, and the relative standard deviations (RSDs) of all pesticides were less than 20%. This method was successfully applied to the detection of real samples. Finally, this study effectively reduced the matrix effect of cottonseed hull, which provided necessary data support for the analysis of pesticide residues in oil crops. Keywords: QuEChERS; gas-chromatography high resolution mass spectrometry; liquid-chromatography high resolution mass spectrometry; pesticide residues; cottonseed hull 1. Introduction The composition of cottonseed hull is similar to that of soybean concentrate, with a high content of cellulose that can enhance the digestive systems of ruminants. Cottonseed hull has been widely used as an alternative feed for ruminants, due to its low price, easy availability, and excellent mixing performance [1–3]. The excessive and illegal use of pesticides during forage planting makes it easy for pesticides to enter the food chain and accumulate in animal adipose tissue [4], and human consumers may indirectly experience food safety problems through contact with livestock products. The composition of the oily matrix is complex: in addition to fat, it contains polysaccharides, proteins, pigments, and other substances. In the process of residue analysis, problems such as matrix enhancement, matrix inhibition, and retention-time shifts may occur in the detection of pesticides, which Separations 2022, 9, 91. https://doi.org/10.3390/separations9040091 https://www.mdpi.com/journal/separations
-
Upload
khangminh22 -
Category
Documents
-
view
2 -
download
0
Transcript of QuEChERS Method Combined with Gas- and Liquid ... - MDPI
�����������������
Citation: Tong, K.; Xie, Y.; Huang, S.;
Liu, Y.; Wu, X.; Fan, C.; Chen, H.; Lu,
M.; Wang, W. QuEChERS Method
Combined with Gas- and
Liquid-Chromatography High
Resolution Mass Spectrometry to
Screen and Confirm 237 Pesticides
and Metabolites in Cottonseed Hull.
Separations 2022, 9, 91. https://
doi.org/10.3390/separations9040091
Academic Editor: Chiara
Emilia Cordero
Received: 8 March 2022
Accepted: 31 March 2022
Published: 2 April 2022
Publisher’s Note: MDPI stays neutral
with regard to jurisdictional claims in
published maps and institutional affil-
iations.
Copyright: © 2022 by the authors.
Licensee MDPI, Basel, Switzerland.
This article is an open access article
distributed under the terms and
conditions of the Creative Commons
Attribution (CC BY) license (https://
creativecommons.org/licenses/by/
4.0/).
separations
Article
QuEChERS Method Combined with Gas- andLiquid-Chromatography High Resolution Mass Spectrometry toScreen and Confirm 237 Pesticides and Metabolites inCottonseed HullKaixuan Tong 1 , Yujie Xie 1, Siqi Huang 2, Yongcheng Liu 2, Xingqiang Wu 1, Chunlin Fan 1, Hui Chen 1,*,Meiling Lu 3 and Wenwen Wang 3
1 Key Laboratory of Food Quality and Safety for State Market Regulation, Chinese Academy of Inspection andQuarantine, Beijing 100176, China; [email protected] (K.T.); [email protected] (Y.X.);[email protected] (X.W.); [email protected] (C.F.)
2 Laboratory of Heilongjiang Feihe Dairy Co., Ltd., Qiqihar 164800, China; [email protected] (S.H.);[email protected] (Y.L.)
3 Agilent Technologies (China) Limited, Beijing 100102, China; [email protected] (M.L.);[email protected] (W.W.)
* Correspondence: [email protected]
Abstract: Cottonseed hull is a livestock feed with large daily consumption. If pesticide residuesexceed the standard, it is easy for them to be introduced into the human body through the foodchain, with potential harm to consumer health. A method for multi-residue analysis of 237 pesti-cides and their metabolites in cottonseed hull was developed by gas-chromatography and liquid-chromatography time-of-flight mass spectrometry (GC-QTOF/MS and LC-QTOF/MS). After beinghydrated, a sample was extracted with 1% acetic acid in acetonitrile, then purified in a clean-uptube containing 400 mg MgSO4, 100 mg PSA, and 100 mg C18. The results showed that this methodhas a significant effect in removing co-extracts from the oily matrix. The screening detection limit(SDL) was in the range of 0.2–20 µg/kg, and the limit of quantification (LOQ) was in the range of0.2–20 µg/kg. The recovery was verified at the spiked levels of 1-, 2-, and 10-times LOQ (n = 6), andthe 237 pesticides were successfully verified. The percentages of pesticides with recovery in the rangeof 70–120% were 91.6%, 92.8%, and 94.5%, respectively, and the relative standard deviations (RSDs)of all pesticides were less than 20%. This method was successfully applied to the detection of realsamples. Finally, this study effectively reduced the matrix effect of cottonseed hull, which providednecessary data support for the analysis of pesticide residues in oil crops.
Keywords: QuEChERS; gas-chromatography high resolution mass spectrometry; liquid-chromatographyhigh resolution mass spectrometry; pesticide residues; cottonseed hull
1. Introduction
The composition of cottonseed hull is similar to that of soybean concentrate, with ahigh content of cellulose that can enhance the digestive systems of ruminants. Cottonseedhull has been widely used as an alternative feed for ruminants, due to its low price, easyavailability, and excellent mixing performance [1–3]. The excessive and illegal use ofpesticides during forage planting makes it easy for pesticides to enter the food chain andaccumulate in animal adipose tissue [4], and human consumers may indirectly experiencefood safety problems through contact with livestock products. The composition of the oilymatrix is complex: in addition to fat, it contains polysaccharides, proteins, pigments, andother substances. In the process of residue analysis, problems such as matrix enhancement,matrix inhibition, and retention-time shifts may occur in the detection of pesticides, which
Separations 2022, 9, 91. https://doi.org/10.3390/separations9040091 https://www.mdpi.com/journal/separations

Separations 2022, 9, 91 2 of 20
will hinder the detection of target compounds [5,6]. Therefore, it is urgent to develop adetection technique for the oily matrix to solve these problems.
The analysis of pesticide residue usually includes the following steps: (1) extractionof the target compound; (2) removal of interference from the extract; and (3) qualitativeand quantitative detection of the target compound [4]. Lipophilic pesticides tend to beconcentrated in fat. Improper pretreatment will affect the detection sensitivity, recov-ery, and sample throughput [7]. The current pretreatment methods for plant-derived oilsubstrates mainly include dispersion liquid-liquid micro-extraction (DLLME) [8], matrixsolid phase dispersion (MSPD) [9,10], low temperature fat precipitation (LTFP) [11], solidphase extraction (SPE) [5], and QuEChERS [12–16]. The QuEChERS method requires fewerreagent consumables and short pretreatment time, so it is accepted by more and moreexperimenters [17]. Theurillat et al. established the QuEChERS method to determinethe residues of various pesticides and verified the method for 176 pesticides in six oilymatrices [12]. Rutkowska et al. investigated the matrix effect and recovery of four seedsamples of cress, fennel, flax, and hemp. The final method verified 248 pesticides, and theLOQs reached 0.005 mg/kg [14]. Banerjee et al. used the QuEChERS method to analyzemore than 220 pesticide residues in sesame seeds. This method can effectively reduce theinterference of the matrix effect by freezing and degreasing at −80 ◦C and then purifyingthe oil.
The current trend of separation science is to develop new chromatographic massspectrometry methods that can detect multiple compounds at the same time after a singleinjection, thereby reducing analysis time and cost [18]. The current detection technologyfor the detection of pesticide residues in oily matrices is mainly triple quadrupole massspectrometry (MS/MS) [13,19–21]. The data was collected according to the specific nucleo-cytoplasmic ratio of the specified compound, but other compounds that were not in thelist could not be identified. When analyzing a large number of compounds, the sensitivityand selectivity are limited. Due to their high resolution, precise mass accuracy, outstandingfull-scan sensitivity, and complete mass spectrometry information, high-resolution massspectrometry (HRMS), such as time-of-flight mass spectrometry (TOF/MS) and quadrupoleOrbitrap mass spectrometry (Obitrap/MS), can be used without additional sample injection.Under retrospective analysis, with these advantages, HRMS has been widely used in thefield of food analysis [22,23]. Lehotay et al. used GC-TOF to analyze 34 pesticides inflaxseed, dough, and peanuts [15]. Amadeo et al. used GC-QTOF to verify 166 pesticideresidues in avocados and almonds [24].
To ensure the safety of livestock feed and to prevent pesticide residues from beingintroduced into the human body through the food chain, this work established a QuEChERSmulti-residue analysis method, and used GC- and LC-QTOF/MS techniques to verify237 pesticides in cottonseed hull. By optimizing the hydration volume, extraction solvent,salting-out agent, and clean-up sorbents, the influence of the matrix effect was reduced andthe pesticide recovery was optimized. Finally, this method was successfully applied to theanalysis of actual samples, providing data support for the risk of pesticide residues in oilysubstrate monitoring.
2. Materials and Methods2.1. Chemicals and Reagents
Pesticide standards (purity ≥ 98%) were obtained from Tianjin Alta Scientific (Tianjin,China). Sodium chloride, magnesium sulfate, and sodium sulfate (analytical purity) wereobtained from Tianjin Fuchen Chemical Reagent Ltd. (Tianjin, China). Primary secondaryamine (PSA) and C18 were purchased from Agilent Technologies (Santa Clara, CA, USA).Methanol, acetonitrile, and toluene (chromatographic purity) were obtained from AnpelLaboratory Technology (Shanghai, China). Formic acid and ammonium acetate (massspectrometry grade) were obtained from Honeywell (Muskegon, MI, USA).

Separations 2022, 9, 91 3 of 20
2.2. Apparatus
HPLC-QTOF/MS Agilent 1290 and Agilent 6550 equipped with Agilent Dual JetStream ESI and GC-QTOF/MS Agilent 7890B and Agilent 7200 were obtained from AgilentTechnologies (Santa Clara, CA, USA). A Milli-QTM Ultrapure Water System was obtainedfrom Millipore (Milford, MA, USA). An N-EVAP112 Nitrogen Blowing Concentrator wasobtained from Organomation Associates (Worcester, MA, USA). An AH-30 Automatichomogenizer was obtained from RayKol Group Corp., Ltd. (Xiamen, China). An MS204SElectronic Analytical Balance was obtained from Mettler Toledo (Shanghai, China).
2.3. Standard Solution
Ten mg of the standard substance was accurately weighed into a 10 mL brown volu-metric flask. a suitable reagent was selected according to the solubility of the compound inthe organic reagent. It was dissolved by ultrasound and diluted to the mark to a standardsolution of 1 mg/L. The standard solution was stored at −18 ◦C in the dark. As needed,a pipette with an appropriate amount of the standard stock solution was diluted withmethanol to prepare a working solution of appropriate concentration, and stored at 4 ◦C inthe dark.
2.4. Sample Preparation Method
Based on other oily matrix sample preparation methods [12,16], a modified QuEChERSmethod was used for the detection of cottonseed hull. Two g (accurate to ±0.01 g) of samplewere transferred into a 50 mL centrifuge tube; 2 mL of ultrapure water were added forhydration and then extracted with 10 mL of 1% acetic acid in acetonitrile. The homogenizerwas used to homogenize the sample for 1 min at 13,500× g; then, 4 g MgSO4, 1 g NaCl anda ceramic homoproton were added. The mixture was shaken for 10 min and centrifuged at3155× g for 5 min; then, 3 mL of supernatant was transferred to a clean-up tube containing400 mg MgSO4, 100 mg PSA, and 100 mg C18. After shaking for 10 min and beingcentrifuged at 3155× g for 5 min, 1 mL of supernatant was dried under nitrogen, thenultrasonically redissolved with ethyl acetate containing internal heptachlor-exo-epoxide forGC-QTOF/MS analysis, and ultrasonically redissolved with acetonitrile aqueous solution(2:3, v/v) containing internal standard atrazine D5 for LC-QTOF/MS analysis.
2.5. Instrument Parameters
The instrument parameters of LC-QTOF/MS and GC-QTOF/MS were configuratedaccording to a previous paper published by our laboratory [25].
An LC-QTOF/MS: ZORBAX SB-C18 column (100 mm × 2.1 mm, 3.5 µm, AgilentTechnologies) was used for separation at 40 ◦C; 5 mmol/L ammonium acetate with 0.1%(v/v) formic acid aqueous solution and acetonitrile were applied as phase A and phase B.The flow rate was set at 0.4 mL/min. The gradient program was set as follows: 0 min, 1%B; 3 min, 30% B; 6 min, 40% B; 9 min, 40% B; 15 min, 60% B; 19 min, 90% B; 23 min, 90% B;23.01 min, 1% B. The equilibrium time was 4 min. The injection volume was 5 µL.
The Agilent Dual Jet Stream (AJS) ESI source (Agilent Technologies) was set in positivefull scan (m/z 50–1000) mode; the capillary voltage was 4 kV; nitrogen was used as thenebulizer gas at 0.14 MPa; the sheath gas temperature was set at 375 ◦C with 11.0 L/min;the drying gas flow rate was 12.0 L/min; the drying gas temperature was 225 ◦C; thefragmentation voltage was 345 V. In all ions Mass/Mass mode, the collision energy was0 V at 0 min, and 0, 15, and 35 V at 0.5 min, respectively. The total program duration was27.01 min.
GC-QTOF/MS: HP-5 MS UI (30 m × 0.25 mm, 0.25 µm, Agilent Technologies) wasused for separation at 40 ◦C. The oven temperature gradient was started at 40 ◦C for 1 min,increased at 30 ◦C/min to 130 ◦C, heated at 5 ◦C/min to 250 ◦C, ramped to 300 ◦C at10 ◦C/min, and maintained for 7 min. Helium (purity > 99.999%) was used as the carriergas with a constant flow rate of 1.2 mL/min. The injection temperature was set to 270 ◦C

Separations 2022, 9, 91 4 of 20
and the injection volume was 1 µL. The injection mode was not split injection, and thepurge valve was opened after 1 min.
The ion source was an electronic ionization source (70 eV, 280 ◦C), and the temperaturesof the transfer line and the quadrupole were 250 ◦C and 180 ◦C, respectively. Solvent delaywas set to 3 min; the ion monitoring mode was full scan; scanning ranged (m/z) from 45 to550; the scan rate was 5 Hz. The total program duration was 42 min.
Mass calibration was required before sample acquisition, and the instrument wastuned at intervals to ensure stability.
2.6. Method Validation
The screening method of high-resolution mass spectrometry can be validated throughscreening detection limits (SDL), and the quantitative method can be validated through limitof quantitation (LOQ). The SDL, LOQ, linearity, recovery, and precision of this experimentwere verified by SANTE/12682/2019 guidelines. SDL is the minimum concentration atwhich more than 95% of a series of concentration levels meets the detection requirements(20 additional experiments were conducted in parallel for each concentration). When theSDL and recovery were validated, all the target pesticides were spiked to the sample andthe spiked samples were placed at room temperature for 30 min, then treated accordingto the above method. After the 10-point matrix matching calibration was constructed,its linearity was evaluated with the coefficient of determination (R2). The recovery andprecision were investigated in three different levels of spiked blank samples with 1-, 2-, and10-times LOQ.
The matrix effect (ME) is the interference of other components in the matrix with thetarget compounds. The formula is:
ME (%) = (bm − bs)/bs × 100% (1)
where bm is the slope of the matrix standard curve and bs is the slope of the solventstandard curve.
Based on previous studies, we established several hundred kinds of pesticide databaseson gas and liquid high resolution mass spectrometry, respectively [25]. According to therecovery and precision, 237 pesticides were divided into pesticides suitable for GC orLC detection.
3. Results3.1. Optimization of Hydration Volume
For the oily matrix, adding an appropriate amount of water for hydration duringsample pretreatment was conducive to the softening of the matrix epidermis, making iteasier for residual pesticides in the matrix to be extracted. This experiment explored theeffect of different hydration volumes on the recovery of multiple pesticides. The experimentresults show that the proportion of pesticides that met the recovery requirements (70–120%)under a non-hydration condition was 74.9%, which was less than under the conditionswith water additions of 2 mL and 5 mL. Under the condition of a 2 mL water addition,the number of pesticides meeting the recovery requirements was the most numerous,accounting for 83.5%. As shown in Figure 1, the average recovery under the 2 mL conditionwas 88.3%, which was higher than that under the other two conditions. The results werein line with our expectations. The oil-water partition coefficient (logP) is an importantparameter for the solubility of compounds, which is a simulated value based on the soilsorption coefficient normalized to organic carbon content (log Koc) [26]. The smaller thelogP value, the better the water solubility of the compound. The effect of hydration volumeon recovery with different logP was investigated, showing that hydration had a greatimpact on recovery with a low logP. The overall recovery of 54 pesticides with hydrophiliccompounds (logP < 2.0) was low under a non-hydration condition, with the pesticidesmeeting the requirements accounting for 42.6%. When the hydration volume was 5 mL, thepores were opened due to the increase in the hydration volume, and multiple interferents

Separations 2022, 9, 91 5 of 20
in the matrix could be extracted together. The matrix promotion effect was enhanced, sothat the overall recovery of pesticides with logP < 2.0 was higher than the recovery underthe other two conditions. When the hydration volume was 2 mL, the pesticides that metthe requirements of recovery were most numerous, accounting for 70.4%; therefore, 2 mLwas finally selected as the optimal hydration volume.
Separations 2022, 9, x FOR PEER REVIEW 5 of 21
pesticides with hydrophilic compounds (logP < 2.0) was low under a non-hydration
condition, with the pesticides meeting the requirements accounting for 42.6%. When the
hydration volume was 5 mL, the pores were opened due to the increase in the hydration
volume, and multiple interferents in the matrix could be extracted together. The matrix
promotion effect was enhanced, so that the overall recovery of pesticides with logP < 2.0
was higher than the recovery under the other two conditions. When the hydration volume
was 2 mL, the pesticides that met the requirements of recovery were most numerous,
accounting for 70.4%; therefore, 2 mL was finally selected as the optimal hydration
volume.
Figure 1. Effects of hydration volumes on pesticide recovery.
3.2. Optimization of Extraction Solvent Volume
The extraction of target compounds is a critical step in pesticide residue analysis. Mol
et al. [27] tested a series of solvents for extraction and found that methanol usually extracts
too many compounds in the matrix, and further matrix removal steps were required.
Acetonitrile has low solubility in fat and a low matrix effect when extracting from complex
matrices. Therefore, acetonitrile was selected as the extraction solvent of cottonseed hull
in this experiment. Three different extraction volumes of 10 mL, 16 mL, and 20 mL (i.e., a
hydration volume and extraction volume ratio of 1:5, 1:8, and 1:10) were compared to
explore the effect of different extraction volumes on the recovery of pesticide residues.
The results are shown in Figure 2. It was found that when the extract volume was 10 mL,
16 mL, and 20 mL, the proportion of pesticides meeting the recovery requirements was
similar, at 81.0%, 80.7% and 81.3% respectively. However, at the spiked level, the volume
of the extraction solution decreased, the pesticide concentration per unit volume
increased, and more pesticide compounds had better peak shapes. In addition, a lower
organic reagent amount was recommended from the perspective of green environmental
protection, so the final extraction volume was 10 mL.
85.6
88.3
87.6
85
85.5
86
86.5
87
87.5
88
88.5
0
20
40
60
80
100
120
140
160
180
Av
era
ge
Rec
ov
ery
(%)
Rec
ov
ery(%
)
Water Volume(mL)
0 mL 2 mL 5 mL Average
Figure 1. Effects of hydration volumes on pesticide recovery.
3.2. Optimization of Extraction Solvent Volume
The extraction of target compounds is a critical step in pesticide residue analysis.Mol et al. [27] tested a series of solvents for extraction and found that methanol usuallyextracts too many compounds in the matrix, and further matrix removal steps were required.Acetonitrile has low solubility in fat and a low matrix effect when extracting from complexmatrices. Therefore, acetonitrile was selected as the extraction solvent of cottonseed hullin this experiment. Three different extraction volumes of 10 mL, 16 mL, and 20 mL (i.e.,a hydration volume and extraction volume ratio of 1:5, 1:8, and 1:10) were compared toexplore the effect of different extraction volumes on the recovery of pesticide residues. Theresults are shown in Figure 2. It was found that when the extract volume was 10 mL, 16 mL,and 20 mL, the proportion of pesticides meeting the recovery requirements was similar,at 81.0%, 80.7% and 81.3% respectively. However, at the spiked level, the volume of theextraction solution decreased, the pesticide concentration per unit volume increased, andmore pesticide compounds had better peak shapes. In addition, a lower organic reagentamount was recommended from the perspective of green environmental protection, so thefinal extraction volume was 10 mL.
3.3. Optimization of Salting-Out Agent
The salting-out agents commonly used in pesticide residue screening were EN buffersalt (4 g MgSO4, 1 g NaCl, 0.5 g disodium hydrogen citrate, and 1 g sodium citrate), theQuEChERS method for fruits and vegetables (4 g MgSO4 and 1 g NaCl), and AOAC buffersalt (6 g MgSO4 and 1.5 g NaAc). In this work, the effects of the above three salting-outagents on the recovery of pesticides were compared. As shown in Figure 3, although EN orAOAC salt forms a buffer system in the solution state, the results showed that the recoveryusing an MgSO4 + NaCl combination best met the requirements, accounting for 78%. Thereason for this result was that the volume of the extract from the QuEChERS method wasrelatively small. If the amount of extraction salt was too large, the heat emitted duringwater absorption destroys the structure of thermally unstable pesticides and affects their

Separations 2022, 9, 91 6 of 20
recovery. Therefore, 4 g MgSO4 and 1 g NaCl with less salt consumption were finallyselected as the salting-out agents.
Separations 2022, 9, x FOR PEER REVIEW 6 of 21
12.5 12.8 12.5
81.0 80.7 81.3
6.4 6.4 6.1
10mL 16mL 20mL0%
10%
20%
30%
40%
50%
60%
70%
80%
90%
100%
Perc
enta
ge o
f pes
ticid
es
Extracting Solvent
<70% 70%–120% >120%
Figure 2. Effect of extraction solvent volume on pesticide recovery.
3.3. Optimization of Salting-Out Agent The salting-out agents commonly used in pesticide residue screening were EN buffer
salt (4 g MgSO4, 1 g NaCl, 0.5 g disodium hydrogen citrate, and 1 g sodium citrate), the QuEChERS method for fruits and vegetables (4 g MgSO4 and 1 g NaCl), and AOAC buffer salt (6 g MgSO4 and 1.5 g NaAc). In this work, the effects of the above three salting-out agents on the recovery of pesticides were compared. As shown in Figure 3, although EN or AOAC salt forms a buffer system in the solution state, the results showed that the re-covery using an MgSO4 + NaCl combination best met the requirements, accounting for 78%. The reason for this result was that the volume of the extract from the QuEChERS method was relatively small. If the amount of extraction salt was too large, the heat emit-ted during water absorption destroys the structure of thermally unstable pesticides and affects their recovery. Therefore, 4 g MgSO4 and 1 g NaCl with less salt consumption were finally selected as the salting-out agents.
Figure 2. Effect of extraction solvent volume on pesticide recovery.
Separations 2022, 9, x FOR PEER REVIEW 7 of 21
20.5
15.6
20.2
73.7
78.0
73.4
5.8 6.4 6.4
EN MgSO4+NaCl AOAC0%
10%
20%
30%
40%
50%
60%
70%
80%
90%
100%
Perc
enta
ge o
f pes
ticid
es
Salting-out Agent
<70% 70%–120% >120%
Figure 3. Effect of salting-out agents on pesticide recovery.
3.4. Optimization of Types and Amounts of Clean-Up Sorbents A clean-up procedure was a key step in the pretreatment of the oily matrix. Its pur-
pose was to effectively purify the analyzed matrix, and most of target pesticides had ac-ceptable recovery, precision, and matrix effect [14]. Although acetonitrile had low lipo-solubility, which can slightly reduce the interference of a fat-soluble matrix on target com-pounds [15], in order to effectively reduce the influence of high-fat matrix co-extraction on the detection sensitivity of pesticides, as well as instrument loss, the clean-up proce-dure was necessary. Theurillat established a d-SPE clean-up method containing 150 mg C18 and 150 mg PSA to determine 176 pesticide residues in fatty foods [12]. Therefore, this study was optimized on this basis.
In this work, the ability of MgSO4 + PSA + C18 + Z-sep and MgSO4 + PSA + C18 sorbents were compared. The structure of PSA had -NH2, which can form a strong hydro-gen bond with -COOH, so it was often used to adsorb polar compounds, such as fatty acids, lipids, and carbohydrates. C18 was often used to adsorb non-polar compounds, such as long-chain aliphatic compounds and sterols [8,25]. Z-sep was a new adsorbent, based on zirconia, which can be used for the adsorption of hydrophobic compounds in the fat matrix [28]. It was seen that the bottom of the purification tube after Z-sep purifi-cation was dark yellow, while the sample without Z-sep purification was light yellow, indicating that Z-sep had an obvious effect on degreasing.
In order to further verify the ability of sorbents, the spiked experiments were carried out. As shown in Figure 4, A was the sorbent combination of MgSO4 + PSA + C18 + Z-sep, and B was the sorbent combination of MgSO4 + PSA + C18. As a result, the sorbent combi-nation without Z-sep accounted for more pesticides that meet the requirements, reaching 81.04%. The reason for this result was that Z-sep adsorbs some target pesticides while removing lipids. According to the Lewis theory, the affinities of Z-sep on the analyte con-taining different substituent characteristics can be sorted in the following order: chloride < formate < acetate < sulphate< citrate < fluoride < phosphate < hydroxide [25]. In this work, a variety of pesticides, such as trinexapac-ethyl, abamectin containing -OH, fenam-iphos sulfoxide containing phosphate, and sulfoxaflor containing sulphate, had
Figure 3. Effect of salting-out agents on pesticide recovery.
3.4. Optimization of Types and Amounts of Clean-Up Sorbents
A clean-up procedure was a key step in the pretreatment of the oily matrix. Its purposewas to effectively purify the analyzed matrix, and most of target pesticides had acceptablerecovery, precision, and matrix effect [14]. Although acetonitrile had low liposolubility,which can slightly reduce the interference of a fat-soluble matrix on target compounds [15],in order to effectively reduce the influence of high-fat matrix co-extraction on the detectionsensitivity of pesticides, as well as instrument loss, the clean-up procedure was necessary.

Separations 2022, 9, 91 7 of 20
Theurillat established a d-SPE clean-up method containing 150 mg C18 and 150 mg PSA todetermine 176 pesticide residues in fatty foods [12]. Therefore, this study was optimizedon this basis.
In this work, the ability of MgSO4 + PSA + C18 + Z-sep and MgSO4 + PSA + C18sorbents were compared. The structure of PSA had -NH2, which can form a strong hydrogenbond with -COOH, so it was often used to adsorb polar compounds, such as fatty acids,lipids, and carbohydrates. C18 was often used to adsorb non-polar compounds, such aslong-chain aliphatic compounds and sterols [8,25]. Z-sep was a new adsorbent, basedon zirconia, which can be used for the adsorption of hydrophobic compounds in the fatmatrix [28]. It was seen that the bottom of the purification tube after Z-sep purification wasdark yellow, while the sample without Z-sep purification was light yellow, indicating thatZ-sep had an obvious effect on degreasing.
In order to further verify the ability of sorbents, the spiked experiments were carriedout. As shown in Figure 4, A was the sorbent combination of MgSO4 + PSA + C18 +Z-sep, and B was the sorbent combination of MgSO4 + PSA + C18. As a result, the sorbentcombination without Z-sep accounted for more pesticides that meet the requirements,reaching 81.04%. The reason for this result was that Z-sep adsorbs some target pesticideswhile removing lipids. According to the Lewis theory, the affinities of Z-sep on the analytecontaining different substituent characteristics can be sorted in the following order: chloride< formate < acetate < sulphate< citrate < fluoride < phosphate < hydroxide [25]. In this work,a variety of pesticides, such as trinexapac-ethyl, abamectin containing -OH, fenamiphossulfoxide containing phosphate, and sulfoxaflor containing sulphate, had substituents witha strong affinity to Z-sep. Therefore, the recovery of sorbent combinations with Z-sep wassignificantly lower than that without Z-sep. Although Z-sep was more efficient in removinglipid compounds, the sorbent combination of MgSO4 + PSA + C18 was finally selected asthe purification filler in this work, from the perspective of method versatility.
Separations 2022, 9, x FOR PEER REVIEW 8 of 21
substituents with a strong affinity to Z-sep. Therefore, the recovery of sorbent
combinations with Z-sep was significantly lower than that without Z-sep. Although Z-sep
was more efficient in removing lipid compounds, the sorbent combination of MgSO4 +
PSA + C18 was finally selected as the purification filler in this work, from the perspective
of method versatility.
The amount of PSA and C18 was also optimized. The effects of PSA (50–150 mg) and
C18 (100–300 mg) on the recovery of various pesticides were optimized by controlling
other variables. The results showed that when the amount of PSA was 100 mg, the greatest
number of pesticides with satisfactory recovery was obtained, accounting for 73.7%. With
the increase in PSA amount, the recovery of organic nitrogen pesticides, such as propanil
and fenbuconazole, and carbamate pesticides, such as aldicarb-sulfone and thiophanate-
methyl, gradually decreased. When the amount of C18 was 100 mg, the proportion of
pesticides that met satisfactory recovery was 82.0%. With an increase in the C18 amount,
the recovery of various organic nitrogen pesticides obviously decreased, especially the
chlorides with a benzene ring structure, such as monolinuron, novaluron, propanil, and
pretilachlor. Therefore, 100 mg PSA and 100 mg C18 were finally selected as the optimal
amounts of clean-up sorbents.
REC:>120%
11.01%
REC:70%-120%
76.76%
REC:<70%
12.23%
A
REC:>120%
10.09%
REC:70%-120%
81.04%
REC:<70%
8.87%
B
Figure 4. Effect of clean-up sorbents on pesticide recovery. (A) MgSO4 + PSA + C18 + Z-sep; (B)
MgSO4 + PSA + C18.
3.5. Evaluation of Matrix Effect
Analysis of pesticide residues in the oil matrix may be adversely affected by the
matrix effect. The main result of the matrix effect is to increase or decrease the analyte
signal when the same analyte exists in the solvent [29]. The methods for eliminating or
reducing the matrix effect include: (1) optimizing the sample preparation method and
reducing co-extraction; (2) changing the chromatographic mass spectrometry conditions;
Figure 4. Effect of clean-up sorbents on pesticide recovery. (A) MgSO4 + PSA + C18 + Z-sep;(B) MgSO4 + PSA + C18.
Separations 2022, 9, 91 8 of 20
The amount of PSA and C18 was also optimized. The effects of PSA (50–150 mg) andC18 (100–300 mg) on the recovery of various pesticides were optimized by controllingother variables. The results showed that when the amount of PSA was 100 mg, the greatestnumber of pesticides with satisfactory recovery was obtained, accounting for 73.7%. Withthe increase in PSA amount, the recovery of organic nitrogen pesticides, such as propaniland fenbuconazole, and carbamate pesticides, such as aldicarb-sulfone and thiophanate-methyl, gradually decreased. When the amount of C18 was 100 mg, the proportion ofpesticides that met satisfactory recovery was 82.0%. With an increase in the C18 amount,the recovery of various organic nitrogen pesticides obviously decreased, especially thechlorides with a benzene ring structure, such as monolinuron, novaluron, propanil, andpretilachlor. Therefore, 100 mg PSA and 100 mg C18 were finally selected as the optimalamounts of clean-up sorbents.
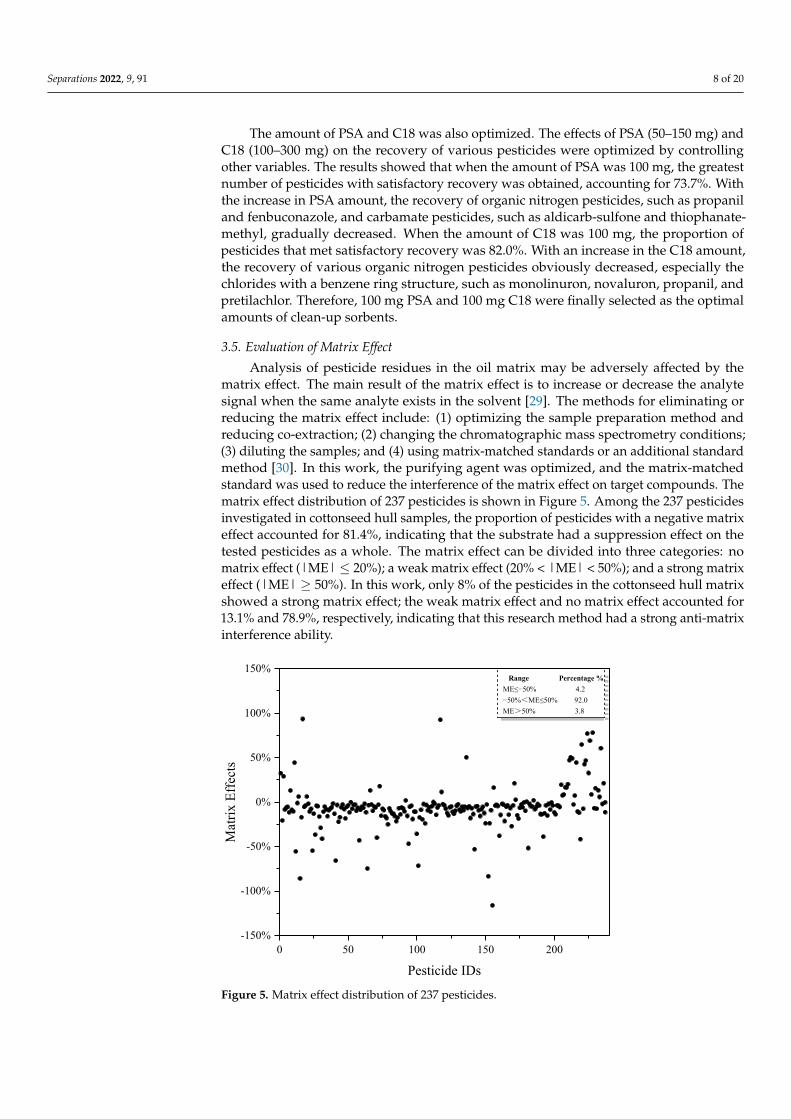
3.5. Evaluation of Matrix Effect
Analysis of pesticide residues in the oil matrix may be adversely affected by thematrix effect. The main result of the matrix effect is to increase or decrease the analytesignal when the same analyte exists in the solvent [29]. The methods for eliminating orreducing the matrix effect include: (1) optimizing the sample preparation method andreducing co-extraction; (2) changing the chromatographic mass spectrometry conditions;(3) diluting the samples; and (4) using matrix-matched standards or an additional standardmethod [30]. In this work, the purifying agent was optimized, and the matrix-matchedstandard was used to reduce the interference of the matrix effect on target compounds. Thematrix effect distribution of 237 pesticides is shown in Figure 5. Among the 237 pesticidesinvestigated in cottonseed hull samples, the proportion of pesticides with a negative matrixeffect accounted for 81.4%, indicating that the substrate had a suppression effect on thetested pesticides as a whole. The matrix effect can be divided into three categories: nomatrix effect (|ME| ≤ 20%); a weak matrix effect (20% < |ME| < 50%); and a strong matrixeffect (|ME| ≥ 50%). In this work, only 8% of the pesticides in the cottonseed hull matrixshowed a strong matrix effect; the weak matrix effect and no matrix effect accounted for13.1% and 78.9%, respectively, indicating that this research method had a strong anti-matrixinterference ability.
Separations 2022, 9, x FOR PEER REVIEW 9 of 21
the samples; and (4) using matrix-matched standards or an additional standard method [30]. In this work, the purifying agent was optimized, and the matrix-matched standard was used to reduce the interference of the matrix effect on target compounds. The matrix effect distribution of 237 pesticides is shown in Figure 5. Among the 237 pesticides inves-tigated in cottonseed hull samples, the proportion of pesticides with a negative matrix effect accounted for 81.4%, indicating that the substrate had a suppression effect on the tested pesticides as a whole. The matrix effect can be divided into three categories: no matrix effect (|ME| ≤ 20%); a weak matrix effect (20% < |ME| < 50%); and a strong matrix effect (|ME| ≥ 50%). In this work, only 8% of the pesticides in the cottonseed hull matrix showed a strong matrix effect; the weak matrix effect and no matrix effect accounted for 13.1% and 78.9%, respectively, indicating that this research method had a strong anti-ma-trix interference ability.
0 50 100 150 200-150%
-100%
-50%
0%
50%
100%
150%
Mat
rix E
ffect
s
Pesticide IDs
Range Percentage % ME≤−50% 4.2 −50%<ME≤50% 92.0 ME>50% 3.8
Figure 5. Matrix effect distribution of 237 pesticides.
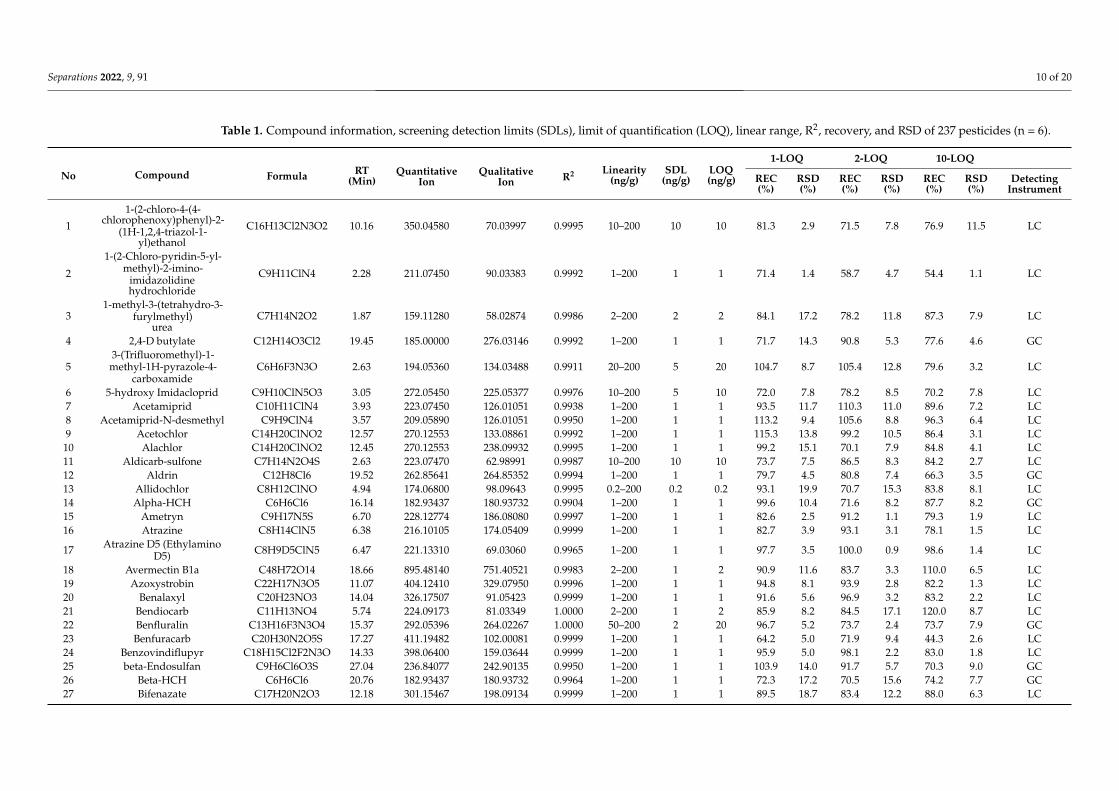
3.6. Method Validation and Method Performance 3.6.1. SDL, LOQ, and Standard Curve
The method validation was carried out under the optimal sample preparation proce-dure, and the results are shown in Table 1. The typical extraction ion chromatograms of GC-Q TOF/MS and LC-Q TOF/MS are shown in Figures 6 and 7, respectively. The SDLs were in the range of 0.2–20 μg/kg, of which 224 pesticides (accounting for 94.5%) were in the range of 0.2–5 μg/kg. The LOQs were in the range of 0.2–20 μg/kg; 215 pesticides (ac-counting for 90.7%) had an LOQ range of 0.2–5 μg/kg. Shinde developed and verified 222 and 220 multi-pesticides residue analysis methods in sesame seeds, using LC-MS/MS and GC-MS/MS, respectively, and most pesticides offered an LOQ of 10 μg/kg for most com-pounds [16]. Kuzukiran et al. developed an SPE sample preparation method, combined with GC-MS, GC-MS/MS and LC-MS/MS, to analyze the residues of 322 organic pollutants in bats [31]. The LOQ of the method was in the range of 0.27–19.26 μg/kg, which was similar to that in our work; however, they paid more attention to environmental pollu-tants. This indicated that this method had high sensitivity in the detection of pesticide residues in cottonseed hull matrix. It is noteworthy that due to the large number of
Figure 5. Matrix effect distribution of 237 pesticides.

Separations 2022, 9, 91 9 of 20
3.6. Method Validation and Method Performance3.6.1. SDL, LOQ, and Standard Curve
The method validation was carried out under the optimal sample preparation proce-dure, and the results are shown in Table 1. The typical extraction ion chromatograms ofGC-Q TOF/MS and LC-Q TOF/MS are shown in Figures 6 and 7, respectively. The SDLswere in the range of 0.2–20 µg/kg, of which 224 pesticides (accounting for 94.5%) werein the range of 0.2–5 µg/kg. The LOQs were in the range of 0.2–20 µg/kg; 215 pesticides(accounting for 90.7%) had an LOQ range of 0.2–5 µg/kg. Shinde developed and verified222 and 220 multi-pesticides residue analysis methods in sesame seeds, using LC-MS/MSand GC-MS/MS, respectively, and most pesticides offered an LOQ of 10 µg/kg for mostcompounds [16]. Kuzukiran et al. developed an SPE sample preparation method, combinedwith GC-MS, GC-MS/MS and LC-MS/MS, to analyze the residues of 322 organic pollutantsin bats [31]. The LOQ of the method was in the range of 0.27–19.26 µg/kg, which wassimilar to that in our work; however, they paid more attention to environmental pollutants.This indicated that this method had high sensitivity in the detection of pesticide residuesin cottonseed hull matrix. It is noteworthy that due to the large number of pesticidesspiked, the retention time of some pesticides may overlap or be very close; for example, theRTs of Chloridazon and Mevinphos were 3.62 min. However, the excellent resolution ofhigh-resolution mass spectrometry was sufficient to separate compounds that had a similarRT but a different mass (the quantitative ion mass of Chloridazon and that of Mevinphoswere 222.04287 and 225.05230, respectively).
Separations 2022, 9, x FOR PEER REVIEW 10 of 21
large number of pesticides spiked, the retention time of some pesticides may overlap or
be very close; for example, the RTs of Chloridazon and Mevinphos were 3.62 min.
However, the excellent resolution of high-resolution mass spectrometry was sufficient to
separate compounds that had a similar RT but a different mass (the quantitative ion mass
of Chloridazon and that of Mevinphos were 222.04287 and 225.05230, respectively).
Figure 6. Overlay extraction ion chromatograms of GC-Q TOF/MS of cottonseed hull sample at
spiking level of 200 μg/kg. Figure 6. Overlay extraction ion chromatograms of GC-Q TOF/MS of cottonseed hull sample atspiking level of 200 µg/kg.
Separations 2022, 9, 91 10 of 20
Table 1. Compound information, screening detection limits (SDLs), limit of quantification (LOQ), linear range, R2, recovery, and RSD of 237 pesticides (n = 6).
No Compound Formula RT(Min)
QuantitativeIon
QualitativeIon R2 Linearity
(ng/g)SDL
(ng/g)LOQ(ng/g)
1-LOQ 2-LOQ 10-LOQ
REC(%)
RSD(%)
REC(%)
RSD(%)
REC(%)
RSD(%)
DetectingInstrument
1
1-(2-chloro-4-(4-chlorophenoxy)phenyl)-2-
(1H-1,2,4-triazol-1-yl)ethanol
C16H13Cl2N3O2 10.16 350.04580 70.03997 0.9995 10–200 10 10 81.3 2.9 71.5 7.8 76.9 11.5 LC
2
1-(2-Chloro-pyridin-5-yl-methyl)-2-imino-
imidazolidinehydrochloride
C9H11ClN4 2.28 211.07450 90.03383 0.9992 1–200 1 1 71.4 1.4 58.7 4.7 54.4 1.1 LC
31-methyl-3-(tetrahydro-3-
furylmethyl)urea
C7H14N2O2 1.87 159.11280 58.02874 0.9986 2–200 2 2 84.1 17.2 78.2 11.8 87.3 7.9 LC
4 2,4-D butylate C12H14O3Cl2 19.45 185.00000 276.03146 0.9992 1–200 1 1 71.7 14.3 90.8 5.3 77.6 4.6 GC
53-(Trifluoromethyl)-1-methyl-1H-pyrazole-4-
carboxamideC6H6F3N3O 2.63 194.05360 134.03488 0.9911 20–200 5 20 104.7 8.7 105.4 12.8 79.6 3.2 LC
6 5-hydroxy Imidacloprid C9H10ClN5O3 3.05 272.05450 225.05377 0.9976 10–200 5 10 72.0 7.8 78.2 8.5 70.2 7.8 LC7 Acetamiprid C10H11ClN4 3.93 223.07450 126.01051 0.9938 1–200 1 1 93.5 11.7 110.3 11.0 89.6 7.2 LC8 Acetamiprid-N-desmethyl C9H9ClN4 3.57 209.05890 126.01051 0.9950 1–200 1 1 113.2 9.4 105.6 8.8 96.3 6.4 LC9 Acetochlor C14H20ClNO2 12.57 270.12553 133.08861 0.9992 1–200 1 1 115.3 13.8 99.2 10.5 86.4 3.1 LC
10 Alachlor C14H20ClNO2 12.45 270.12553 238.09932 0.9995 1–200 1 1 99.2 15.1 70.1 7.9 84.8 4.1 LC11 Aldicarb-sulfone C7H14N2O4S 2.63 223.07470 62.98991 0.9987 10–200 10 10 73.7 7.5 86.5 8.3 84.2 2.7 LC12 Aldrin C12H8Cl6 19.52 262.85641 264.85352 0.9994 1–200 1 1 79.7 4.5 80.8 7.4 66.3 3.5 GC13 Allidochlor C8H12ClNO 4.94 174.06800 98.09643 0.9995 0.2–200 0.2 0.2 93.1 19.9 70.7 15.3 83.8 8.1 LC14 Alpha-HCH C6H6Cl6 16.14 182.93437 180.93732 0.9904 1–200 1 1 99.6 10.4 71.6 8.2 87.7 8.2 GC15 Ametryn C9H17N5S 6.70 228.12774 186.08080 0.9997 1–200 1 1 82.6 2.5 91.2 1.1 79.3 1.9 LC16 Atrazine C8H14ClN5 6.38 216.10105 174.05409 0.9999 1–200 1 1 82.7 3.9 93.1 3.1 78.1 1.5 LC
17 Atrazine D5 (EthylaminoD5) C8H9D5ClN5 6.47 221.13310 69.03060 0.9965 1–200 1 1 97.7 3.5 100.0 0.9 98.6 1.4 LC
18 Avermectin B1a C48H72O14 18.66 895.48140 751.40521 0.9983 2–200 1 2 90.9 11.6 83.7 3.3 110.0 6.5 LC19 Azoxystrobin C22H17N3O5 11.07 404.12410 329.07950 0.9996 1–200 1 1 94.8 8.1 93.9 2.8 82.2 1.3 LC20 Benalaxyl C20H23NO3 14.04 326.17507 91.05423 0.9999 1–200 1 1 91.6 5.6 96.9 3.2 83.2 2.2 LC21 Bendiocarb C11H13NO4 5.74 224.09173 81.03349 1.0000 2–200 1 2 85.9 8.2 84.5 17.1 120.0 8.7 LC22 Benfluralin C13H16F3N3O4 15.37 292.05396 264.02267 1.0000 50–200 2 20 96.7 5.2 73.7 2.4 73.7 7.9 GC23 Benfuracarb C20H30N2O5S 17.27 411.19482 102.00081 0.9999 1–200 1 1 64.2 5.0 71.9 9.4 44.3 2.6 LC24 Benzovindiflupyr C18H15Cl2F2N3O 14.33 398.06400 159.03644 0.9999 1–200 1 1 95.9 5.0 98.1 2.2 83.0 1.8 LC25 beta-Endosulfan C9H6Cl6O3S 27.04 236.84077 242.90135 0.9950 1–200 1 1 103.9 14.0 91.7 5.7 70.3 9.0 GC26 Beta-HCH C6H6Cl6 20.76 182.93437 180.93732 0.9964 1–200 1 1 72.3 17.2 70.5 15.6 74.2 7.7 GC27 Bifenazate C17H20N2O3 12.18 301.15467 198.09134 0.9999 1–200 1 1 89.5 18.7 83.4 12.2 88.0 6.3 LC

Separations 2022, 9, 91 11 of 20
Table 1. Cont.
No Compound Formula RT(Min)
QuantitativeIon
QualitativeIon R2 Linearity
(ng/g)SDL
(ng/g)LOQ(ng/g)
1-LOQ 2-LOQ 10-LOQ
REC(%)
RSD(%)
REC(%)
RSD(%)
REC(%)
RSD(%)
DetectingInstrument
28 Bifenthrin C23H22ClF3O2 28.81 181.10118 166.07770 0.9939 10–200 10 10 106.6 16.2 45.7 2.6 82.8 2.0 GC29 Bioresmethrin C22H26O3 19.09 339.19550 143.08553 0.9978 20–200 20 20 84.9 17.6 71.6 6.6 77.7 6.0 LC30 Bitertanol C20H23N3O2 12.68 338.18630 70.03997 0.9928 5–200 5 5 77.1 10.6 79.2 10.2 75.8 14.2 LC31 Boscalid C18H12Cl2N2O 11.18 343.03994 271.08658 0.9997 2–200 1 2 100.9 9.9 91.1 10.5 88.0 7.9 LC32 Bromobutide C15H22BrNO 13.75 312.09575 119.08553 0.9998 1–200 1 1 91.3 18.0 92.3 14.9 70.3 7.0 LC33 Bromophos-methyl C8H8BrCl2O3PS 21.82 330.87753 328.87982 0.9941 1–200 1 1 75.4 15.6 81.2 10.8 78.4 14.3 GC34 Bromopropylate C17H16Br2O3 29.69 340.89948 342.89755 0.9989 1–200 1 1 87.1 10.5 90.6 6.9 76.6 7.2 GC35 Bupirimate C13H24N4O3S 12.61 317.16419 44.04948 0.9998 1–200 1 1 95.0 8.2 95.3 2.6 82.3 1.0 LC36 Buprofezin C16H23N3OS 17.38 306.16346 57.06988 0.9975 1–200 1 1 101.4 3.6 101.9 17.7 78.7 3.1 LC37 Butachlor C17H26ClNO2 17.47 312.17250 57.06988 0.9987 1–200 1 1 115.3 19.9 95.0 19.9 80.4 6.5 LC38 Butamifos C13H21N2O4PS 16.45 333.10350 95.96675 0.9981 1–200 1 1 86.8 14.4 110.6 9.5 74.7 6.5 LC39 Butylate C11H23NOS 16.60 218.15731 57.06988 0.9992 10–200 5 10 61.4 10.4 82.4 6.5 70.4 15.9 LC40 Cadusafos C10H23O2PS2 14.61 271.09498 96.95076 0.9998 1–200 1 1 73.3 9.4 86.1 9.1 77.3 1.8 LC41 Carbaryl C12H11NO2 6.21 202.08626 127.05423 0.9927 10–200 10 10 102.3 17.1 112.5 16.9 107.1 17.2 LC42 Carbendazim C9H9N3O2 2.67 192.07675 160.05054 0.9999 1–200 1 1 111.8 19.1 79.8 9.6 71.5 12.1 LC43 Carbofuran C12H15NO3 5.80 222.11247 123.04406 0.9944 1–200 1 1 107.5 3.6 91.3 6.1 112.5 2.4 LC44 Carbofuran-3-Hydroxy C12H15NO4 3.55 238.10738 107.04914 0.9997 0.2–200 0.2 0.2 82.7 17.6 70.6 11.0 86.9 9.3 LC45 Carbosulfan C20H32N2O3S 19.82 381.22064 76.02155 0.9994 2–200 2 2 79.8 18.9 34.2 11.0 51.7 12.0 LC46 Carfentrazone-ethyl C15H14Cl2F3N3O3 14.18 412.04350 345.99561 0.9998 1–200 1 1 115.9 14.3 85.8 7.5 84.7 4.0 LC47 Chlorantraniliprole C18H14BrCl2N5O2 8.23 481.97807 283.92160 1.0000 1–200 1 1 93.0 16.9 99.8 10.3 81.1 4.9 LC48 Chlorfenapyr C15H11BrClF3N2O 27.57 363.94073 361.94278 0.9913 1–200 1 1 85.1 6.6 109.8 17.5 112.4 13.6 GC49 Chlorfenvinphos C12H14Cl3O4P 13.67 358.97681 98.98434 0.9999 1–200 1 1 89.8 10.9 103.8 9.8 86.5 4.2 LC50 Chloridazon C10H8ClN3O 3.62 222.04287 77.03857 0.9977 1–200 1 1 77.7 6.2 84.4 4.1 79.2 3.4 LC51 Chlormequat C5H12ClN 0.70 122.07310 58.06512 0.9983 1–200 1 1 90.8 14.7 93.6 4.7 113.3 8.4 LC52 Chloroneb C8H8Cl2O2 11.81 190.96611 192.96324 0.9945 2–200 2 2 127.8 19.3 54.8 13.8 69.5 8.8 GC53 Chlorotoluron C10H13ClN2O 6.10 213.07892 72.04488 0.9998 1–200 1 1 96.1 6.1 102.1 5.0 82.2 2.2 LC54 Chlorpropham C10H12ClNO2 15.92 127.01833 213.05511 0.9989 5–200 5 5 138.2 19.7 88.1 15.8 84.0 8.3 GC55 Chlorpyrifos C9H11Cl3NO3PS 17.72 349.93356 96.95076 0.9998 5–200 1 5 100.9 19.3 84.9 8.9 85.1 5.3 LC56 Chlorpyrifos-methyl C7H7Cl3NO3PS 19.32 285.92557 287.92316 0.9949 1–200 1 1 93.6 7.9 79.4 10.6 78.7 13.1 GC57 Cis-Chlordane (alpha) C10H6Cl8 23.58 372.82544 374.82251 0.9996 1–200 1 1 85.7 7.4 83.5 6.9 70.5 6.5 GC58 Clodinafop-propargyl C17H13ClFNO4 15.05 350.05899 91.05423 0.9999 1–200 1 1 109.5 7.4 94.4 4.1 83.1 3.0 LC59 Clofentezine C14H8Cl2N4 15.32 303.01988 102.03383 0.9997 5–200 5 5 81.2 17.4 72.2 12.4 104.2 7.5 LC60 Clomazone C12H14ClNO2 7.91 240.07858 125.01525 0.9999 1–200 1 1 112.3 18.4 99.8 12.7 78.5 3.6 LC61 Clothianidin C6H8ClN5O2S 3.50 250.01600 131.96692 0.9995 2–200 1 2 101.9 19.4 103.9 15.1 89.4 6.9 LC62 Cyanazine C9H13ClN6 5.16 241.09630 214.08540 0.9998 1–200 1 1 78.9 11.9 89.0 8.2 85.9 13.9 LC63 Cyanofenphos C15H14NO2PS 29.06 156.98715 169.04129 0.9996 1–200 1 1 77.3 14.9 100.8 13.9 81.2 6.1 GC

Separations 2022, 9, 91 12 of 20
Table 1. Cont.
No Compound Formula RT(Min)
QuantitativeIon
QualitativeIon R2 Linearity
(ng/g)SDL
(ng/g)LOQ(ng/g)
1-LOQ 2-LOQ 10-LOQ
REC(%)
RSD(%)
REC(%)
RSD(%)
REC(%)
RSD(%)
DetectingInstrument
64 Cycloate C11H21NOS 15.35 216.14166 55.05423 0.9998 2–200 2 2 117.4 15.3 85.0 16.2 79.6 5.7 LC65 Cycloxydim C17H27NO3S 16.22 326.17844 107.04914 0.9996 1–200 1 1 62.6 11.6 100.4 5.7 74.1 4.2 LC66 Cyprodinil C14H15N3 22.15 224.11823 225.12605 0.9999 1–200 1 1 92.3 15.9 89.1 4.1 75.3 5.9 GC67 Cyromazine C6H10N6 0.75 167.10400 85.05087 0.9927 5–200 1 5 58.2 6.0 56.2 10.1 51.5 5.8 LC68 Delta-HCH C6H6Cl6 21.60 180.93732 182.93437 0.9943 2–200 2 2 158.1 19.5 162.4 19.8 181.8 19.4 GC69 Desmetryn C8H15N5S 5.21 214.11209 172.06514 0.9994 1–200 1 1 84.7 3.7 93.5 0.7 78.6 1.9 LC70 Diallate C10H17Cl2NOS 16.66 270.04810 86.06004 0.9992 10–200 5 10 70.6 19.0 107.5 9.7 85.9 19.9 LC71 Diazinon C12H21N2O3PS 14.97 305.10833 96.95076 0.9998 1–200 1 1 89.5 3.6 87.7 3.4 78.5 1.5 LC72 Dichlofenthion C10H13Cl2O3PS 18.86 279.00061 222.93800 0.9938 1–200 1 1 76.6 17.7 82.0 10.5 73.0 7.0 GC73 Dichlorvos C4H7Cl2O4P 7.85 184.97650 109.00491 0.9954 10–200 1 10 116.2 12.6 108.9 17.6 78.1 16.0 GC74 Dicloran C6H4Cl2N2O2 18.20 205.96443 207.96156 0.9946 2–200 2 2 89.3 15.9 89.7 14.5 86.0 8.9 GC75 Difenoconazole C19H17Cl2N3O3 14.63 406.07200 251.00250 0.9998 1–200 1 1 77.3 4.8 94.0 2.8 79.6 2.2 LC76 Diflubenzuron C14H9ClF2N2O2 12.11 311.03934 141.01465 0.9938 10–200 10 10 64.8 5.6 83.7 10.3 92.2 10.0 LC77 Dimethenamid C12H18ClNO2S 9.58 276.08195 244.05574 0.9997 1–200 1 1 90.6 3.6 84.8 5.5 82.8 4.6 LC78 Dimethoate C5H12NO3PS2 3.78 230.00690 198.96469 0.9941 2–200 1 2 70.4 10.0 89.8 9.0 84.7 6.0 LC79 Dimethylvinphos (Z) C10H10Cl3O4P 10.47 330.94550 127.01547 0.9999 1–200 1 1 92.1 16.9 80.7 10.3 108.7 7.9 LC80 Diniconazole C15H17Cl2N3O 12.97 326.08210 70.03997 1.0000 2–200 1 2 89.1 4.0 84.2 7.1 85.5 5.5 LC81 Dinotefuran C7H14N4O3 2.31 203.11387 58.05255 0.9994 20–200 20 20 80.0 5.6 86.8 4.5 77.1 3.3 LC82 Dioxabenzofos C8H9O3PS 10.47 217.00830 77.03857 1.0000 2–200 1 2 97.3 5.0 88.0 5.7 87.0 2.9 LC83 Dipropetryn C11H21N5S 11.46 256.15904 102.01205 0.9999 1–200 1 1 74.3 5.0 94.6 4.2 76.3 3.1 LC84 Diuron C9H10Cl2N2O 6.63 233.02429 72.04488 0.9989 1–200 1 1 105.7 17.6 124.8 11.1 70.6 5.3 LC85 Edifenphos C14H15O2PS2 13.46 311.03238 109.01065 0.9998 1–200 1 1 92.6 4.6 93.3 3.6 81.5 0.8 LC86 Emamectin B1a C49H75NO13 16.88 886.53112 158.11755 0.9996 1–200 1 1 83.1 12.3 82.3 6.6 75.2 10.3 LC87 Endosulfan-sulfate C9H6Cl6O4S 29.05 271.80963 273.80667 0.9999 1–200 1 1 61.7 7.1 61.1 6.0 51.4 2.7 GC88 Ethalfluralin C13H14F3N3O4 14.96 276.05905 316.09036 0.9981 1–200 1 1 93.0 9.6 106.1 16.4 73.9 9.5 GC89 Ethion C9H22O4P2S4 17.95 384.99489 199.00108 1.0000 1–200 1 1 119.9 8.3 89.1 16.0 78.1 3.3 LC90 Ethoprophos C8H19O2PS2 10.86 243.06368 96.95076 0.9998 1–200 1 1 90.3 11.8 87.3 6.6 78.7 1.5 LC91 Etrimfos C10H17N2O4PS 14.56 293.07194 124.98206 0.9999 1–200 1 1 76.9 4.5 92.3 4.6 81.6 3.0 LC92 Fenamidone C17H17N3OS 30.72 268.09030 238.11006 0.9994 1–200 1 1 77.7 11.7 89.6 17.0 87.1 6.1 GC93 Fenamiphos C13H22NO3PS 10.46 304.11308 201.98480 0.9998 1–200 1 1 83.6 2.6 96.2 2.9 84.2 0.9 LC94 Fenamiphos-sulfone C13H22NO5PS 5.59 336.10291 266.02466 0.9999 1–200 1 1 94.6 18.1 91.1 4.4 83.4 2.0 LC95 Fenamiphos-sulfoxide C13H22NO4PS 4.61 320.10799 108.05727 0.9999 1–200 1 1 90.3 5.0 100.2 6.5 83.9 1.1 LC96 Fenarimol C17H12Cl2N2O 10.59 331.03994 81.04472 0.9998 2–200 1 2 102.8 11.0 90.7 9.7 76.6 6.8 LC97 Fenbuconazole C19H17ClN4 12.38 337.12150 70.03997 0.9999 1–200 1 1 116.4 11.7 74.0 19.3 75.1 7.0 LC98 Fenchlorphos C8H8Cl3O3PS 19.80 284.93033 286.92749 0.9968 1–200 1 1 86.2 7.0 102.3 6.6 75.3 9.4 GC99 Fenobucarb C12H17NO2 8.80 208.13321 77.03857 0.9982 5–200 5 5 87.9 12.4 104.7 8.0 84.0 2.7 LC

Separations 2022, 9, 91 13 of 20
Table 1. Cont.
No Compound Formula RT(Min)
QuantitativeIon
QualitativeIon R2 Linearity
(ng/g)SDL
(ng/g)LOQ(ng/g)
1-LOQ 2-LOQ 10-LOQ
REC(%)
RSD(%)
REC(%)
RSD(%)
REC(%)
RSD(%)
DetectingInstrument
100 Fenpropimorph C20H33NO 18.52 128.10699 129.11012 0.9948 5–200 5 5 66.6 19.4 70.7 16.3 76.9 3.2 GC101 Fensulfothion C11H17O4PS2 7.42 309.03786 140.02904 0.9996 1–200 1 1 87.9 2.9 94.5 1.5 84.0 1.2 LC102 Fenthion-sulfoxide C10H15O4PS2 6.02 295.02221 109.00491 0.9998 1–200 1 1 87.3 3.7 93.5 3.7 84.1 1.1 LC103 Fipronil C12H4Cl2F6N4OS 28.19 366.94296 368.94003 0.9970 1–200 1 1 80.1 19.1 75.7 11.4 72.0 7.6 GC104 Fipronil Desulfinyl C12H4Cl2F6N4 25.54 332.99609 387.97116 0.9951 2–200 2 2 107.4 12.3 67.2 18.7 117.8 19.5 GC105 Fipronil-sulfide C12H4Cl2F6N4S 27.81 350.94803 352.94510 0.9999 1–200 1 1 75.5 2.9 75.5 3.0 71.2 2.0 GC106 Fluacrypyrim C20H21F3N2O5 16.67 427.14753 145.06479 0.9992 1–200 1 1 109.3 15.5 111.5 6.5 77.6 6.8 LC107 Fluazifop-butyl C19H20F3NO4 17.62 384.14172 91.05423 0.9999 1–200 1 1 76.7 5.6 91.6 3.3 80.5 3.0 LC108 Flubendiamide C23H22F7IN2O4S 14.52 705.01250 530.97986 0.9999 1–200 1 1 88.5 3.1 93.2 3.4 83.2 1.7 LC109 Flumiclorac-pentyl C21H23ClFNO5 17.47 441.15930 308.04843 0.9973 2–200 1 2 26.4 19.5 75.0 19.5 79.0 18.1 LC110 Fluopicolide C14H8Cl3F3N2O 11.85 382.97271 172.95555 0.9999 1–200 1 1 90.7 9.5 95.1 6.7 83.8 2.4 LC111 Fluquinconazole C16H8Cl2FN5O 11.40 376.01630 306.98358 0.9996 5–200 5 5 82.4 6.4 88.9 6.3 94.9 4.3 LC112 Fluridone C19H14F3NO 9.19 330.11003 309.09598 0.9989 1–200 1 1 92.3 8.5 94.2 1.4 84.3 2.0 LC113 Flusilazole C16H15F2N3Si 12.36 316.10761 165.06967 0.9997 1–200 1 1 82.1 6.5 97.4 9.5 79.8 2.3 LC114 Flutriafol C16H13F2N3O 6.40 302.10994 70.03997 0.9996 1–200 1 1 89.3 9.1 96.2 5.3 76.0 3.2 LC115 Fluxapyroxad C18H12F5N3O 11.39 382.09730 342.08487 1.0000 1–200 1 1 93.0 7.8 94.4 4.5 84.2 3.4 LC116 Fonofos C10H15OPS2 15.23 247.03747 80.95585 0.9976 5–200 1 5 72.0 1.5 100.3 16.0 105.8 4.3 LC117 Fosthiazate C9H18NO3PS2 6.37 284.05385 104.01646 0.9998 1–200 1 1 96.0 11.1 94.6 4.3 87.1 2.2 LC118 Furathiocarb C18H26N2O5S 17.26 383.16352 195.04742 0.9999 1–200 1 1 74.3 6.7 82.6 4.4 64.9 1.2 LC119 Haloxyfop C15H11ClF3NO4 23.54 316.03467 375.04797 0.9997 20–200 1 20 96.0 4.8 77.0 6.3 73.3 6.9 GC120 Haloxyfop-2-ethoxyethyl C19H19ClF3NO5 17.06 434.09766 91.05423 0.9983 1–200 1 1 92.3 2.4 110.3 3.5 83.7 3.2 LC121 Haloxyfop-methyl C16H13ClF3NO4 16.23 376.05460 272.00845 0.9985 1–200 1 1 91.7 11.5 90.2 5.9 83.0 2.6 LC122 Heptachlor C10H5Cl7 18.48 271.80963 273.80667 0.9979 1–200 1 1 106.4 18.9 76.3 6.1 74.9 10.0 GC123 Hexachlorobenzene C6Cl6 14.03 283.80963 285.80670 0.9918 1–200 1 1 61.6 2.1 60.1 4.1 54.3 6.4 GC124 Hexaconazole C14H17Cl2N3O 12.19 314.08250 70.03997 0.9996 2–200 1 2 98.4 11.4 85.7 9.5 97.2 10.8 LC125 Hexythiazox C17H21ClN2O2S 17.70 353.10850 168.05696 0.9992 2–200 1 2 70.6 10.4 120.0 9.3 82.0 4.1 LC126 Imazalil C14H14Cl2N2O 25.76 172.95555 215.00250 0.9998 1–200 1 1 92.1 6.8 73.2 7.6 84.1 3.9 GC127 Imazapyr C13H15N3O3 3.07 262.11862 69.06988 0.9998 5–200 5 5 24.8 2.0 23.1 11.0 25.3 6.7 LC128 Imidacloprid C9H10ClN5O2 3.68 256.05958 209.05885 0.9967 1–200 1 1 117.5 0.2 181.6 6.6 87.1 12.1 LC129 Imidacloprid-Olefin C9H8ClN5O2 3.07 254.04390 171.06653 0.9997 10–200 5 10 94.8 13.7 91.1 7.3 78.1 9.6 LC130 Iprobenfos C13H21O3PS 12.36 289.10218 91.05423 0.9994 2–200 1 2 104.1 14.5 100.1 15.0 101.6 5.7 LC131 Iprovalicarb C18H28N2O3 10.44 321.21727 119.08553 0.9999 1–200 1 1 111.8 13.5 106.4 9.2 89.1 2.3 LC132 Isazofos C9H17ClN3O3PS 13.62 314.04895 119.99574 0.9998 1–200 1 1 86.0 4.6 91.2 3.4 83.4 2.0 LC133 Isofenphos C15H24NO4PS 16.48 346.12364 121.02872 0.9996 5–200 2 5 76.4 15.6 80.4 17.8 108.1 16.7 LC134 Isoproturon C12H18N2O 6.66 207.14919 72.04439 0.9990 0.5–200 0.5 0.5 96.2 7.9 89.2 1.7 84.0 2.2 LC135 Isopyrazam C20H23F2N3O 15.58 360.18950 320.17575 0.9998 1–200 1 1 86.9 5.8 96.8 4.1 79.9 1.2 LC

Separations 2022, 9, 91 14 of 20
Table 1. Cont.
No Compound Formula RT(Min)
QuantitativeIon
QualitativeIon R2 Linearity
(ng/g)SDL
(ng/g)LOQ(ng/g)
1-LOQ 2-LOQ 10-LOQ
REC(%)
RSD(%)
REC(%)
RSD(%)
REC(%)
RSD(%)
DetectingInstrument
136 Kresoxim-methyl C18H19NO4 14.26 314.13868 116.04948 0.9998 5–200 2 5 72.0 15.1 79.3 12.3 89.8 4.7 LC137 Lactofen C19H15ClF3NO7 17.70 479.08210 343.99319 0.9972 20–200 20 20 90.5 5.1 111.6 17.1 77.7 12.5 LC138 Lindane C6H6Cl6 17.74 180.93732 182.93437 0.9989 1–200 1 1 62.9 16.7 116.5 18.3 110.8 7.9 GC139 Linuron C9H10Cl2N2O2 9.10 249.01921 132.96063 0.9990 5–200 2 5 73.1 10.3 84.4 8.9 94.2 3.2 LC140 Malaoxon C10H19O7PS 5.72 315.06619 99.00767 0.9998 1–200 1 1 74.4 17.4 93.9 12.3 89.4 10.2 LC141 Malathion C10H19O6PS2 12.53 331.04334 99.00767 0.9983 1–200 1 1 82.9 11.0 83.7 10.3 77.8 3.4 LC142 Mepanipyrim C14H13N3 24.48 222.10257 223.11040 0.9998 5–200 1 5 84.5 9.9 77.6 8.7 79.4 4.8 GC143 Metaflumizone C24H16F6N4O2 17.39 507.12502 178.04628 0.9973 10–200 2 10 80.3 4.6 86.7 16.9 82.8 8.0 LC144 Metalaxyl C15H21NO4 6.70 280.15433 45.03349 0.9993 1–200 1 1 95.0 8.6 98.4 2.2 81.8 1.1 LC145 Metconazole C17H22ClN3O 12.66 320.15242 70.03997 0.9998 2–200 1 2 80.5 8.7 86.5 5.8 86.1 6.8 LC146 Methiocarb C11H15NO2S 8.73 226.08960 121.06479 0.9939 20–200 5 20 84.1 15.4 86.1 16.2 85.3 5.1 LC147 Methiocarb-sulfoxide C11H15NO3S 3.42 242.08454 122.07262 0.9980 1–200 1 1 101.1 14.8 87.6 6.8 84.0 4.0 LC148 Metolachlor C15H22ClNO2 12.32 284.14118 252.11497 0.9999 1–200 1 1 97.1 9.1 105.6 3.2 84.0 1.4 LC149 Metrafenone C19H21BrO5 16.24 409.06451 209.08084 0.9998 1–200 1 1 91.0 4.6 92.7 3.6 79.1 1.9 LC150 Metribuzin C8H14N4OS 5.26 215.09611 49.01065 0.9999 5–200 2 5 87.5 13.9 80.6 3.0 93.6 1.2 LC151 Mevinphos C7H13O6P 3.62 225.05230 127.01547 0.9992 2–200 1 2 70.3 11.8 118.8 10.5 90.0 7.6 LC152 Mirex C10Cl12 29.05 271.80963 273.80667 0.9999 1–200 1 1 64.6 2.1 62.6 6.0 57.1 2.9 GC153 Monocrotophos C7H14NO5P 2.77 224.06824 58.02874 0.9995 1–200 1 1 99.3 17.3 110.1 12.7 81.7 3.4 LC154 Myclobutanil C15H17ClN4 10.56 289.12145 70.03997 0.9996 5–200 1 5 110.7 15.3 93.8 6.3 83.1 5.2 LC155 Napropamide C17H21NO2 11.63 272.16451 171.08044 0.9999 1–200 1 1 84.6 2.7 94.7 2.1 83.9 1.6 LC156 Norflurazon C12H9ClF3N3O 7.06 304.04590 140.03062 0.9998 1–200 1 1 87.7 2.8 95.0 2.7 82.4 1.0 LC157 Omethoate C5H12NO4PS 2.08 214.02974 182.98755 0.9988 1–200 1 1 85.5 8.5 92.2 5.6 80.2 2.7 LC158 Oxadiazon C15H18Cl2N2O3 25.39 174.95862 258.03214 0.9999 2–200 2 2 98.2 15.3 81.3 17.4 84.2 2.1 GC159 Oxadixyl C14H18N2O4 4.99 279.13393 132.08078 0.9999 1–200 1 1 84.8 19.7 117.3 11.0 93.9 3.3 LC160 Paclobutrazol C15H20ClN3O 25.79 236.05852 125.01525 0.9996 2–200 1 2 86.4 2.7 82.0 9.3 81.8 2.6 GC161 Pentachloroaniline C6H2Cl5N 18.83 264.85950 266.85657 0.9975 1–200 1 1 72.1 6.9 70.9 5.6 71.5 1.6 GC162 Pentachloroanisole C7H3Cl5O 14.82 264.83569 279.85919 0.9945 1–200 1 1 72.6 9.2 71.0 2.6 71.2 1.5 GC163 Penthiopyrad C16H20F3N3OS 14.47 360.13620 256.03506 0.9998 1–200 1 1 97.1 8.3 91.1 4.1 83.4 1.1 LC164 Phenthoate C12H17O4PS2 14.95 321.03786 79.05423 0.9999 2–200 2 2 84.7 11.0 74.6 18.2 100.6 7.8 LC165 Phorate-Sulfone C7H17O4PS3 8.56 293.00970 96.95076 0.9933 5–200 5 5 76.4 0.5 70.5 11.2 70.3 11.8 LC166 Phorate-Sulfoxide C7H17O3PS3 6.30 277.01502 96.95076 0.9998 1–200 1 1 99.7 7.2 97.6 5.5 85.6 1.2 LC167 Phosalone C12H15ClNO4PS2 15.96 367.99414 110.99960 0.9929 20–200 20 20 118.3 12.9 116.0 11.7 88.8 2.4 LC168 Phosphamidon C10H19ClNO5P 4.68 300.07621 127.01547 0.9997 1–200 1 1 88.2 7.1 91.8 3.1 84.7 1.2 LC169 Phoxim C12H15N2O3PS 15.98 299.06138 77.03889 0.9917 10–200 5 10 71.1 10.9 74.2 17.6 110.9 14.9 LC170 Picoxystrobin C18H16F3NO4 14.65 368.11042 145.06479 0.9993 1–200 1 1 101.0 16.6 94.6 8.8 84.0 5.2 LC171 Piperonyl butoxide C19H30O5 17.06 356.24230 119.08553 0.9994 1–200 1 1 93.5 10.4 82.4 7.7 78.2 1.6 LC

Separations 2022, 9, 91 15 of 20
Table 1. Cont.
No Compound Formula RT(Min)
QuantitativeIon
QualitativeIon R2 Linearity
(ng/g)SDL
(ng/g)LOQ(ng/g)
1-LOQ 2-LOQ 10-LOQ
REC(%)
RSD(%)
REC(%)
RSD(%)
REC(%)
RSD(%)
DetectingInstrument
172 Pirimicarb C11H18N4O2 4.41 239.15025 72.04439 0.9975 1–200 1 1 78.3 14.4 95.3 4.3 78.0 3.7 LC173 Pirimiphos-methyl C11H20N3O3PS 15.87 306.10358 67.02908 0.9999 1–200 1 1 86.0 4.2 91.7 1.1 80.5 0.8 LC174 Pretilachlor C17H26ClNO2 16.17 312.17248 252.11497 0.9999 1–200 1 1 116.7 4.8 88.7 9.4 82.8 3.9 LC175 Prochloraz C15H16Cl3N3O2 13.20 376.03809 70.02874 0.9998 1–200 1 1 82.4 6.7 97.2 7.6 79.0 2.6 LC176 Profenofos C11H15BrClO3PS 16.14 372.94242 96.95094 0.9984 2–200 2 2 94.5 15.6 92.5 6.5 98.6 3.3 LC177 Prometryn C10H19N5S 8.73 242.14339 68.02432 0.9997 1–200 1 1 82.1 2.7 89.7 1.9 79.7 2.0 LC178 Propamocarb C9H20N2O2 2.18 189.15975 74.02366 0.9983 1–200 1 1 69.3 17.2 90.3 13.7 79.9 8.3 LC179 Propanil C9H9Cl2NO 7.97 218.01340 127.01784 0.9996 5–200 2 5 71.1 6.8 70.4 7.0 88.1 1.7 LC180 Propaphos C13H21O4PS 13.10 305.09709 44.97935 0.9998 1–200 1 1 83.3 5.4 83.7 2.8 81.4 1.5 LC181 Propargite C19H26O4S 18.28 368.18860 57.06988 0.9910 5–200 5 5 84.8 15.8 96.3 12.5 116.2 19.9 LC182 Propazine C9H16ClN5 8.11 230.11670 146.02280 0.9992 1–200 1 1 82.0 1.8 99.6 4.1 80.8 2.7 LC183 Propiconazole C15H17Cl2N3O2 13.23 342.07706 69.06988 0.9999 1–200 1 1 85.5 5.2 87.0 5.8 77.6 3.4 LC184 Propyzamide C12H11Cl2NO 11.01 256.02905 189.98210 0.9989 5–200 1 5 82.8 4.2 82.3 10.9 92.2 4.1 LC185 Prothioconazole C14H15Cl2N3OS 12.48 344.03860 102.01205 0.9942 5–200 5 5 70.2 0.8 117.9 18.9 70.4 10.6 LC186 Prothioconazole-desthio C14H15Cl2N3O 10.35 312.06640 70.03997 0.9999 1–200 1 1 87.0 6.6 89.6 5.0 80.2 1.7 LC187 Pymetrozine C10H11N5O 2.04 218.10364 105.04472 0.9943 1–200 1 1 113.0 9.8 81.7 8.7 71.3 11.5 LC188 Pyraclostrobin C19H18ClN3O4 15.40 388.10586 194.08118 0.9999 0.2–200 0.2 0.2 105.8 18.2 104.8 13.2 84.5 2.4 LC189 Pyridaben C19H25ClN2OS 18.83 365.14489 147.11682 0.9988 1–200 1 1 114.4 19.2 80.5 9.1 70.2 2.5 LC190 Pyridaphenthion C14H17N2O4PS 11.59 341.07194 92.04979 0.9998 1–200 1 1 72.5 9.5 92.7 6.8 85.6 1.5 LC191 Pyrimethanil C12H13N3 7.56 200.11822 77.03857 0.9995 5–200 1 5 84.9 6.6 76.3 2.2 90.8 3.4 LC192 Pyriproxyfen C20H19NO3 17.50 322.14377 96.04439 0.9998 1–200 1 1 87.7 15.8 86.4 3.4 76.5 3.5 LC193 Quinalphos C12H15N2O3PS 14.00 299.06138 96.95076 0.9999 1–200 1 1 90.3 10.2 100.0 2.9 79.9 2.4 LC194 Quinoxyfen C15H8Cl2FNO 16.79 308.00397 196.97887 0.9998 1–200 1 1 72.8 1.8 79.1 3.8 70.2 4.3 LC195 Quintozene C6Cl5NO2 16.21 236.84077 294.83371 0.9972 1–200 1 1 82.3 18.0 73.6 10.0 82.5 16.0 GC196 Quizalofop-ethyl C19H17ClN2O4 16.62 373.09496 91.05423 0.9997 1–200 1 1 105.5 15.8 103.8 9.9 76.0 0.9 LC197 Saflufenacil C17H17ClF4N4O5S 10.90 501.06170 348.99976 0.9994 1–200 1 1 112.6 17.7 83.8 17.3 82.7 6.0 LC198 Simazine C7H12ClN5 5.00 202.08540 68.02432 0.9997 1–200 1 1 93.1 1.7 96.5 5.2 84.2 2.3 LC199 Spinosyn D C42H67NO10 15.36 746.48377 142.12263 0.9998 1–200 1 1 88.0 8.6 98.9 9.1 80.1 5.2 LC200 Spirodiclofen C21H24Cl2O4 18.97 411.11244 71.08553 0.9992 0.5–200 0.5 0.5 73.9 19.9 119.8 12.3 103.1 13.8 LC201 Spirotetramat C21H27NO5 10.10 374.19620 302.17508 0.9996 5–200 2 5 81.0 12.2 70.5 7.6 77.3 5.3 LC202 Spirotetramat-enol C18H23NO3 5.29 302.17580 216.10190 0.9996 1–200 1 1 84.6 7.0 83.2 2.8 75.5 3.0 LC
203 Spirotetramat-enol-glucoside C24H33NO8 2.86 464.22790 216.10190 0.9926 1–200 1 1 120.8 8.5 134.3 2.0 185.9 11.2 LC
204 Spiroxamine C18H35NO2 8.76 298.27406 100.11208 0.9990 1–200 1 1 91.3 12.4 80.9 3.1 78.2 3.5 LC205 Sulfentrazone C11H10Cl2F2N4O3S 6.34 386.98915 306.99435 0.9988 5–200 5 5 76.7 5.3 83.6 4.9 94.0 4.3 LC206 Sulfotep C8H20O5P2S2 15.67 322.02219 237.92828 1.0000 1–200 1 1 95.4 16.1 91.2 9.3 79.1 9.5 GC

Separations 2022, 9, 91 16 of 20
Table 1. Cont.
No Compound Formula RT(Min)
QuantitativeIon
QualitativeIon R2 Linearity
(ng/g)SDL
(ng/g)LOQ(ng/g)
1-LOQ 2-LOQ 10-LOQ
REC(%)
RSD(%)
REC(%)
RSD(%)
REC(%)
RSD(%)
DetectingInstrument
207 Sulfoxaflor C10H10F3N3OS 4.48 278.05690 154.04628 0.9983 2–200 2 2 91.0 8.9 72.7 5.3 100.7 5.8 LC208 Sulprofos C12H19O2PS3 17.99 323.03575 218.96979 0.9997 2–200 1 2 72.4 14.0 89.1 10.9 86.6 5.5 LC209 Tebuconazole C16H22ClN3O 11.75 308.15240 70.03997 0.9999 2–200 1 2 95.8 5.9 80.8 6.7 87.3 6.0 LC210 Tebufenozide C22H28N2O2 13.92 353.22235 133.06479 0.9984 2–200 1 2 113.1 9.4 58.5 18.1 85.0 17.5 LC211 Terbufos C9H21O2PS3 17.05 289.05141 57.06988 0.9981 10–200 2 10 88.5 16.1 90.9 7.5 85.0 15.4 LC212 Terbufos-Sulfone C9H21O4PS3 11.57 321.04120 275.05353 0.9982 2–200 2 2 114.0 16.7 92.9 9.6 98.1 3.4 LC213 Terbufos-Sulfoxide C9H21O3PS3 8.23 305.04650 130.93848 0.9999 1–200 1 1 114.9 13.2 106.3 12.6 79.7 5.2 LC214 Terbumeton C10H19N5O 17.40 210.13493 169.09581 0.9986 1–200 1 1 111.8 18.6 79.2 6.9 85.4 2.4 GC215 Terbuthylazine C9H16ClN5 8.82 230.11670 174.05409 0.9998 1–200 1 1 89.3 18.9 98.2 8.4 79.8 3.4 LC216 Terbutryn C10H19N5S 9.10 242.14339 186.08080 0.9992 1–200 1 1 82.3 3.6 90.0 2.3 76.2 4.4 LC217 Tetramethrin C19H25NO4 17.04 332.18560 164.07060 0.9988 5–200 2 5 97.8 13.0 92.4 4.4 98.6 5.5 LC218 Thiabendazole C10H7N3S 2.90 202.04334 131.06038 0.9999 1–200 1 1 74.3 3.9 82.4 5.1 73.1 1.8 LC219 Thiacloprid C10H9ClN4S 4.51 253.03092 126.00867 0.9993 1–200 1 1 87.3 5.1 98.5 1.7 82.0 2.0 LC220 Thiamethoxam C8H10ClN5O3S 3.13 292.02656 131.96643 0.9950 1–200 1 1 79.4 11.6 81.3 5.6 74.7 6.9 LC221 Thiobencarb C12H16ClNOS 15.15 258.07139 125.01525 0.9985 2–200 2 2 84.6 18.6 89.5 13.2 90.6 1.3 LC222 Thiophanate-methyl C12H14N4O4S2 5.43 343.05292 151.03244 0.9992 1–200 1 1 102.4 5.6 82.9 2.0 73.9 3.0 LC223 Tolfenpyrad C21H22ClN3O2 16.91 384.14770 197.09608 0.9998 1–200 1 1 82.0 13.2 79.0 3.6 76.3 8.1 LC224 Trans-Chlordane C10H6Cl8 23.38 372.82544 374.82251 0.9997 1–200 1 1 78.6 6.2 71.2 6.4 70.6 4.5 GC225 Triadimefon C14H16ClN3O2 11.17 294.10038 57.06988 0.9996 1–200 1 1 90.9 10.0 85.9 8.2 83.1 3.9 LC226 Triadimenol C14H18ClN3O2 8.54 296.11580 70.03997 0.9998 5–200 5 5 90.6 14.0 74.5 11.0 84.3 4.3 LC227 Triazophos C12H16N3O3PS 12.72 314.07228 119.06037 0.9980 1–200 1 1 84.1 2.2 61.2 2.3 83.3 1.9 LC228 Trichlorfon C4H8Cl3O4P 3.33 256.92985 78.99452 0.9992 10–200 5 10 77.3 13.4 91.6 8.5 84.2 7.1 LC229 Trifloxystrobin C20H19F3N2O4 16.67 409.13697 145.02596 0.9992 1–200 1 1 88.2 3.8 89.0 3.7 81.4 1.3 LC230 Triflumizole C15H15ClF3N3O 14.98 346.09290 69.04472 1.0000 1–200 1 1 88.5 6.5 90.9 4.6 80.5 2.0 LC231 Trifluralin C13H16F3N3O4 15.26 264.02267 306.06961 0.9981 2–200 2 2 79.1 7.0 71.3 11.1 80.3 6.4 GC232 Trinexapac-ethyl C13H16O5 7.54 253.10705 69.03349 0.9996 5–200 5 5 75.4 9.5 60.1 12.4 73.4 3.4 LC233 Uniconazole C15H18ClN3O 10.58 292.12130 70.03997 0.9999 1–200 1 1 60.9 16.4 84.6 8.3 79.7 1.7 LC234 Vinclozolin C12H9Cl2NO3 20.63 212.00284 186.95862 0.9962 2–200 2 2 67.7 12.7 80.4 4.4 83.7 4.9 GC235 Warfarin C19H16O4 8.91 309.11214 163.03897 0.9997 0.5–200 0.5 0.5 98.7 15.0 99.5 6.0 91.0 6.7 LC236 Zoxamide C14H16Cl3NO2 14.92 336.03194 186.97119 0.9997 1–200 1 1 92.8 7.1 96.0 4.2 83.0 2.0 LC237 Endrin C12H8Cl6O 25.22 316.90341 262.85641 0.9962 5–200 5 5 63.7 19.8 76.5 5.5 78.2 4.5 GC
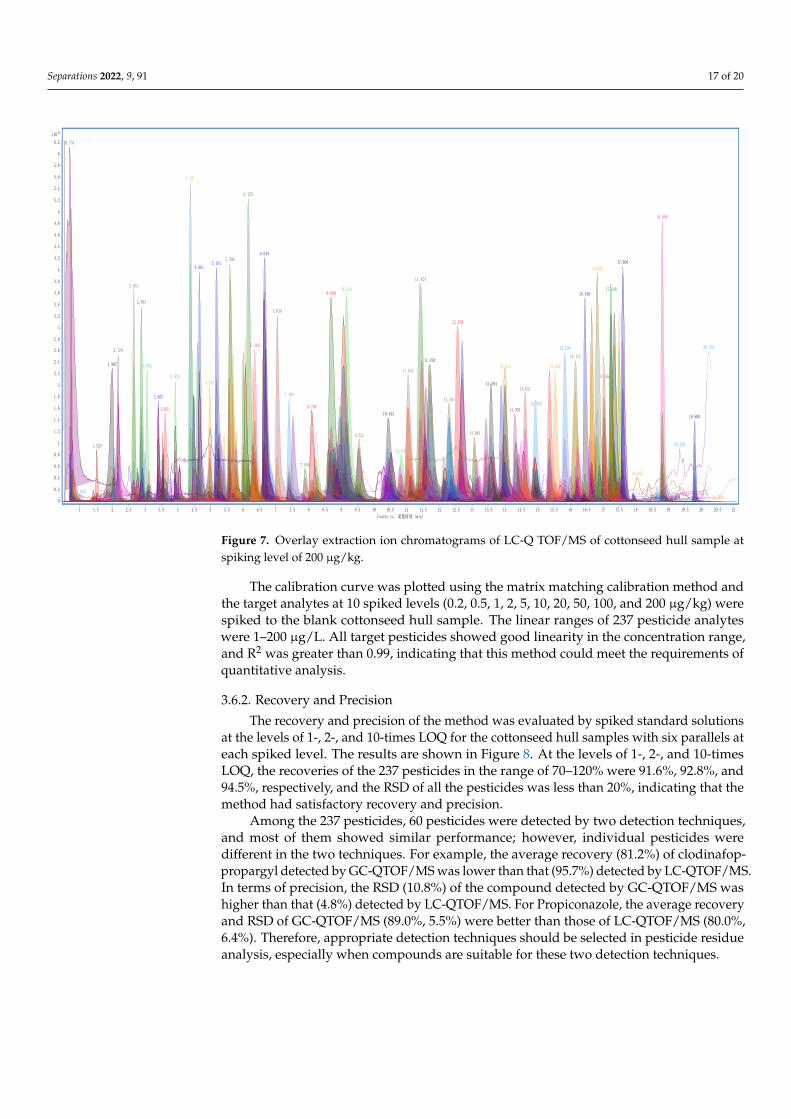
Separations 2022, 9, 91 17 of 20Separations 2022, 9, x FOR PEER REVIEW 11 of 21
Figure 7. Overlay extraction ion chromatograms of LC-Q TOF/MS of cottonseed hull sample at
spiking level of 200 μg/kg.
The calibration curve was plotted using the matrix matching calibration method and
the target analytes at 10 spiked levels (0.2, 0.5, 1, 2, 5, 10, 20, 50, 100, and 200 μg/kg) were
spiked to the blank cottonseed hull sample. The linear ranges of 237 pesticide analytes
were 1–200 μg/L. All target pesticides showed good linearity in the concentration range,
and R2 was greater than 0.99, indicating that this method could meet the requirements of
quantitative analysis.
Table 1. Compound information, screening detection limits (SDLs), limit of quantification (LOQ),
linear range, R2, recovery, and RSD of 237 pesticides (n = 6).
No Compound Formula RT
(Min)
Quantitati
ve Ion
Qualitativ
e Ion R2
Linearit
y
(ng/g)
SDL
(ng/g)
LOQ
(ng/g)
1-LOQ 2-LOQ 10-LOQ
REC
(%)
RSD
(%)
REC
(%)
RSD
(%)
REC
(%)
RSD
(%)
Detecting
Instrumen
t
1
1-(2-chloro-4-(4-
chlorophenoxy)phe
nyl)-2-(1H-1,2,4-
triazol-1-yl)ethanol
C16H13Cl2
N3O2 10.16 350.04580 70.03997 0.9995 10–200 10 10 81.3 2.9 71.5 7.8 76.9 11.5 LC
2
1-(2-Chloro-
pyridin-5-yl-
methyl)-2-imino-
imidazolidine
hydrochloride
C9H11ClN4 2.28 211.07450 90.03383 0.9992 1–200 1 1 71.4 1.4 58.7 4.7 54.4 1.1 LC
3
1-methyl-3-
(tetrahydro-3-
furylmethyl) urea
C7H14N2O
2 1.87 159.11280 58.02874 0.9986 2–200 2 2 84.1 17.2 78.2 11.8 87.3 7.9 LC
4 2,4-D butylate C12H14O3C
l2 19.45 185.00000 276.03146 0.9992 1–200 1 1 71.7 14.3 90.8 5.3 77.6 4.6 GC
5
3-
(Trifluoromethyl)-
1-methyl-1H-
C6H6F3N3
O 2.63 194.05360 134.03488 0.9911 20–200 5 20 104.7 8.7 105.4 12.8 79.6 3.2 LC
Figure 7. Overlay extraction ion chromatograms of LC-Q TOF/MS of cottonseed hull sample atspiking level of 200 µg/kg.
The calibration curve was plotted using the matrix matching calibration method andthe target analytes at 10 spiked levels (0.2, 0.5, 1, 2, 5, 10, 20, 50, 100, and 200 µg/kg) werespiked to the blank cottonseed hull sample. The linear ranges of 237 pesticide analyteswere 1–200 µg/L. All target pesticides showed good linearity in the concentration range,and R2 was greater than 0.99, indicating that this method could meet the requirements ofquantitative analysis.
3.6.2. Recovery and Precision
The recovery and precision of the method was evaluated by spiked standard solutionsat the levels of 1-, 2-, and 10-times LOQ for the cottonseed hull samples with six parallels ateach spiked level. The results are shown in Figure 8. At the levels of 1-, 2-, and 10-timesLOQ, the recoveries of the 237 pesticides in the range of 70–120% were 91.6%, 92.8%, and94.5%, respectively, and the RSD of all the pesticides was less than 20%, indicating that themethod had satisfactory recovery and precision.
Among the 237 pesticides, 60 pesticides were detected by two detection techniques,and most of them showed similar performance; however, individual pesticides weredifferent in the two techniques. For example, the average recovery (81.2%) of clodinafop-propargyl detected by GC-QTOF/MS was lower than that (95.7%) detected by LC-QTOF/MS.In terms of precision, the RSD (10.8%) of the compound detected by GC-QTOF/MS washigher than that (4.8%) detected by LC-QTOF/MS. For Propiconazole, the average recoveryand RSD of GC-QTOF/MS (89.0%, 5.5%) were better than those of LC-QTOF/MS (80.0%,6.4%). Therefore, appropriate detection techniques should be selected in pesticide residueanalysis, especially when compounds are suitable for these two detection techniques.

Separations 2022, 9, 91 18 of 20
Separations 2022, 9, x FOR PEER REVIEW 19 of 21
in pesticide residue analysis, especially when compounds are suitable for these two de-tection techniques.
16
217
4
119 118
13
220
4
161
76
11
224
2
205
32
<70% 70−120% >120% 丨 <10% 10−20%0
50
100
150
200
250
RSD
Num
ber o
f pes
ticid
es
1-LOQ 2-LOQ 10-LOQ
REC
Figure 8. The recovery and RSD of the target pesticides at three spiked levels.
3.7. Analysis of Real Samples The established method was applied to the analysis of 11 real cottonseed hull samples
collected from several domestic pastures. The results showed that three pesticide residues were found in 11 cottonseed hull samples (butylate (three times), fenbuconazole (three times), and Diuron (two times)), with concentrations ranging from 10 to 28 μg/kg and above the LOQ. The determined three pesticides were slightly hazardous, according to WHO [32]. This method can be used for high-throughput trace detection of pesticide res-idues in cottonseed hull samples and improve the ability of risk-screening.
4. Conclusions In this work, GC-QTOF/MS and LC-QTOF/MS were used to develop a high through-
put method for qualitative screening and quantitative analysis of 237 pesticides in the cot-tonseed hull matrix. The modified QuEChERS extraction process seems to effectively eliminate the interference caused by the oily matrix, and the SDL, LOQ, recovery, and precision of the analysis method were verified under optimal conditions. In addition, compared with other methods for the oily matrix, this method has the advantages of being fast and simple, with high throughput and low solvent consumption. The results showed that the developed method could be applied to the screening of pesticide residues in the cottonseed hull matrix, effectively and generally.
Author Contributions: Conceptualization, H.C. and C.F.; methodology, H.C.; validation, K.T., Y.X. and X.W.; investigation, S.H. and Y.L.; resources, K.T.; data curation, Y.X.; writing—original draft preparation, K.T.; writing—review and editing, H.C., X.W. and C.F.; supervision, M.L. and W.W.; project administration, H.C. All authors have read and agreed to the published version of the man-uscript.
Funding: This work was financially supported by the Science and Technology Project of the State Administration for Market Regulation (2021MK165).
Figure 8. The recovery and RSD of the target pesticides at three spiked levels.
3.7. Analysis of Real Samples
The established method was applied to the analysis of 11 real cottonseed hull samplescollected from several domestic pastures. The results showed that three pesticide residueswere found in 11 cottonseed hull samples (butylate (three times), fenbuconazole (threetimes), and Diuron (two times)), with concentrations ranging from 10 to 28 µg/kg andabove the LOQ. The determined three pesticides were slightly hazardous, according toWHO [32]. This method can be used for high-throughput trace detection of pesticideresidues in cottonseed hull samples and improve the ability of risk-screening.
4. Conclusions
In this work, GC-QTOF/MS and LC-QTOF/MS were used to develop a high through-put method for qualitative screening and quantitative analysis of 237 pesticides in thecottonseed hull matrix. The modified QuEChERS extraction process seems to effectivelyeliminate the interference caused by the oily matrix, and the SDL, LOQ, recovery, andprecision of the analysis method were verified under optimal conditions. In addition,compared with other methods for the oily matrix, this method has the advantages of beingfast and simple, with high throughput and low solvent consumption. The results showedthat the developed method could be applied to the screening of pesticide residues in thecottonseed hull matrix, effectively and generally.
Author Contributions: Conceptualization, H.C. and C.F.; methodology, H.C.; validation, K.T.,Y.X. and X.W.; investigation, S.H. and Y.L.; resources, K.T.; data curation, Y.X.; writing—originaldraft preparation, K.T.; writing—review and editing, H.C., X.W. and C.F.; supervision, M.L. andW.W.; project administration, H.C. All authors have read and agreed to the published version ofthe manuscript.
Funding: This work was financially supported by the Science and Technology Project of the StateAdministration for Market Regulation (2021MK165).
Institutional Review Board Statement: Not applicable.
Informed Consent Statement: Not applicable.
Data Availability Statement: Not applicable.
Conflicts of Interest: The authors declare no conflict of interest.

Separations 2022, 9, 91 19 of 20
References1. Moretti, D.B.; Jimenez, C.R.; Trinca, H.M.; Machado-Neto, R.; Louvandini, H. Cottonseed feeding changes oxidative stress
markers in ewes during the peripartum period and increases the quality of colostrum. Vet. J. 2019, 247, 32–37. [CrossRef][PubMed]
2. Eiras, C.E.; Guerrero, A.; Valero, M.V.; Pardo, J.A.; Ornaghi, M.G.; Rivaroli, D.C.; Sanudo, C.; Prado, I.N. Effects of cottonseed hulllevels in the diet and ageing time on visual and sensory meat acceptability from young bulls finished in feedlot. Animal 2017, 11,529–537. [CrossRef] [PubMed]
3. Machado, P.A.S.; Valadares, S.D.; Valadares, R.F.D.; Paulino, M.F.; Pina, D.D.; Paixao, M.L. Nutritional and productive parametersof beef cattle on pasture fed different amounts of supplement Parâmetros nutricionais e produtivos em bovinos de corte a pastoalimentados com diferentes quantidades de suplemento. Rev. Bras. Zootec. 2011, 40, 1303–1312. [CrossRef]
4. Buah-Kwofie, A.; Humphries, M.S. Validation of a modified QuEChERS method for the analysis of organochlorine pesticides infatty biological tissues using two-dimensional gas chromatography. J. Chromatogr. B 2018, 1105, 85–92. [CrossRef]
5. Shi, Z.H.; Zhang, S.L.; Huai, Q.R.; Xu, D.; Zhang, H.Y. Methylamine-modified graphene-based solid phase extraction combinedwith UPLC-MS/MS for the analysis of neonicotinoid insecticides in sunflower seeds. Talanta 2017, 162, 300–308. [CrossRef]
6. Walorczyk, S.; Drozdzynski, D. Improvement and extension to new analytes of a multi-residue method for the determinationof pesticides in cereals and dry animal feed using gas chromatography–tandem quadrupole mass spectrometry revisited. J.Chromatogr. A 2012, 1251, 219–231. [CrossRef]
7. David, F.; Devos, C.; Dumont, E.; Yang, Z.; Sandra, P.; Huertas-Perez, J.F. Determination of pesticides in fatty matrices using gelpermeation clean-up followed by GC-MS/MS and LC-MS/MS analysis: A comparison of low- and high-pressure gel permeationcolumns. Talanta 2017, 165, 201–210. [CrossRef]
8. Xue, J.Y.; Li, H.C.; Liu, F.M.; Jiang, W.Q.; Chen, X.C. Determination of strobilurin fungicides in cotton seed by combination ofacetonitrile extraction and dispersive liquidliquid microextraction coupled with gas chromatography. J. Sep. Sci. 2014, 37, 845–852.[CrossRef]
9. Zhan, J.; Li, J.D.; Liu, D.H.; Liu, C.; Yang, G.G.; Zhou, Z.Q.; Wang, P. A simple method for the determination of organochlorinepollutants and the enantiomers in oil seeds based on matrix solid-phase dispersion. Food Chem. 2016, 194, 319–324. [CrossRef]
10. Piao, H.L.; Jiang, Y.X.; Li, X.P.; Ma, P.Y.; Wang, X.H.; Song, D.Q.; Sun, Y. Matrix solid-phase dispersion coupled with hollow fiberliquid phase microextraction for determination of triazine herbicides in peanuts. J. Sep. Sci. 2019, 42, 2123–2130. [CrossRef]
11. Jiang, Y.P.; Li, Y.J.; Jiang, Y.T.; Li, J.G.; Pan, C.P. Determination of multiresidues in rapeseed, rapeseed oil, and rapeseed meal byacetonitrile extraction, low-temperature cleanup, and detection by liquid chromatography with tandem mass spectrometry. J.Agric. Food Chem. 2012, 60, 5089–5098. [CrossRef] [PubMed]
12. Theurillat, X.; Dubois, M.; Huertas-Pérez, J.F. A multi-residue pesticide determination in fatty food commodities by modifiedQuEChERS approach and gas chromatography-tandem mass spectrometry. Food Chem. 2021, 353, 129039. [CrossRef] [PubMed]
13. Guan, W.B.; Li, Z.N.; Zhang, H.Y.; Hong, H.J.; Rebeyev, N.; Ye, Y.; Ma, Y.Q. Amine modified graphene as reversed-dispersivesolid phase extraction materials combined with liquid chromatography–tandem mass spectrometry for pesticide multi-residueanalysis in oil crops. J. Chromatogr. A 2013, 1286, 1–8. [CrossRef] [PubMed]
14. Rutkowska, E.; Ozowicka, B.; Kaczynski, P. Compensation of matrix effects in seed matrices followed by gas chromatography-tandem mass spectrometry analysis of pesticide residues. J. Chromatogr. A 2020, 1614, 460738. [CrossRef]
15. Koesukwiwat, U.; Lehotay, S.J.; Mastovska, K.; Dorweiler, K.J.; Leepipatpiboon, N. Extension of the QuEChERS Method forPesticide Residues in Cereals to Flaxseeds, Peanuts, and Doughs. J. Agric. Food Chem. 2010, 58, 5950–5958. [CrossRef]
16. Shinde, R.; Pardeshi, A.; Dhanshetty, M.; Anastassiades, M.; Banerjee, K. Development and validation of an analytical method forthe multiresidue analysis of pesticides in sesame seeds using liquid- and gas chromatography with tandem mass spectrometry. J.Chromatogr. A 2021, 1652, 462346. [CrossRef]
17. Gonzalez-Curbelo, M.A.; Socas-Rodriguez, B.; Herrera-Herrera, A.V.; Gonzalez-Salamo, J.; Hernandez-Borges, J.; Rodriguez-Delgado, M.A. Evolution and applications of the QuEChERS method. TrAC Trends Anal. Chem. 2015, 71, 169–185. [CrossRef]
18. Farre, M.; Kantiani, L.; Petrovic, M.; Perez, S.; Barcelo, D. Achievements and future trends in the analysis of emerging organiccontaminants in environmental samples by mass spectrometry and bioanalytical techniques. J. Chromatogr. A 2012, 1259, 86–99.[CrossRef]
19. Dankyi, E.; Carboo, D.; Gordon, C.; Fomsgaard, I.S. Application of the QuEChERS Procedure and LC-MS/MS for the Assessmentof Neonicotinoid Insecticide Residues in Cocoa Beans and Shells. J. Food Compos. Anal. 2016, 44, 149–157. [CrossRef]
20. Chawla, S.; Patel, H.K.; Vaghela, K.M.; Pathan, F.K.; Gor, H.N.; Patel, A.R.; Shah, P.G. Development and validation of mul-tiresidue analytical method in cotton and groundnut oil for 87 pesticides using low temperature and dispersive cleanup on gaschromatography and liquid chromatography-tandem mass spectrometry. Anal. Bioanal. Chem. 2016, 408, 983–997. [CrossRef]
21. Naik, R.H.; Pallavi, M.S.; Bheemanna, M.; PavanKumar, K.; Reddy, V.C.S.; Nidoni, R.U.; Paramasivam, M.; Yadav, S. Simultaneousdetermination of 79 pesticides in pigeonpea grains using GC-MS/MS and LC-MS/MS. Food Chem. 2021, 347, 128986. [CrossRef]
22. Elbashir, A.A.; Aboul-Enein, H.Y. Application of gas and liquid chromatography coupled to time-of-flight mass spectrometry inpesticides: Multiresidue analysis. Biomed. Chromatogr. 2018, 32, e4038. [CrossRef] [PubMed]
23. Wang, J.; Chow, W.; Leung, D. Applications of LC/ESI-MS/MS and UHPLC QqTOF MS for the determination of 148 pesticides infruits and vegetables. J. AOAC Int. 2011, 396, 1513–1538. [CrossRef] [PubMed]

Separations 2022, 9, 91 20 of 20
24. Lozano, A.; Rajski, L.; Ucles, S. Evaluation of zirconium dioxide-based sorbents to decrease the matrix effect in avocado andalmond multiresidue pesticide analysis followed by gas chromatography tandem mass spectrometry. Talanta 2014, 118, 68–83.[CrossRef]
25. Pang, G.F.; Chang, Q.Y.; Bai, R.B.; Fan, C.L.; Zhang, Z.J.; Yan, H.Y.; Wu, X.Q. Simultaneous Screening of 733 Pesticide Residues inFruits and Vegetables by a GC/LC-Q-TOFMS Combination Technique. Engineering 2020, 6, 432–441. [CrossRef]
26. Dos-Reis, R.R.; Sampaio, S.C.; De Melo, E.B. The effect of different log P algorithms on the modeling of the soil sorption coefficientof nonionic pesticides. Water Res. 2013, 47, 5751–5759. [CrossRef]
27. Mol, H.G.J.; Plaza-BolanOs, P.; Zomer, P.; De Rijk, T.C.; Stolker, A.A.M.; Mulder, P.P.J. Toward a generic extraction method forsimultaneous determination of pesticides, mycotoxins, plant toxins, and veterinary drugs in feed and food matrixes. Anal. Chem.2008, 80, 9450–9459. [CrossRef]
28. Tuzimski, T.; Rejczak, T. Application of HPLC-DAD after SPE/QuEChERS with ZrO2-based sorbent in d-SPE clean-up step forpesticide analysis in edible oils. Food Chem. 2016, 190, 71–79. [CrossRef]
29. Lagunas-Allue, L.; Sanz-Asensio, J.; Martínez-Soria, M.T. Comparison of four extraction methods for the determination offungicide residues in grapes through gas chromatography-mass spectrometry. J. Chromatogr. A 2012, 1270, 62–71. [CrossRef]
30. Ucles, S.; Lozano, A.; Sosa, A.; Vazquez, P.P.; Valverde, A.; Fernandez-Alba, A.R. Matrix interference evaluation employing GCand LC coupled to triple quadrupole tandem mass spectrometry. Talanta 2017, 174, 72–81. [CrossRef]
31. Kuzukiran, O.; Simsek, I.; Yorulmaz, T.; Yurdakok-Dikmen, B.; Ozkan, O.; Filazi, A. Multiresidues of environmental contaminantsin bats from Turkey. Chemosphere 2021, 282, 131022. [CrossRef] [PubMed]
32. World Health Organization. The WHO Recommended Classification of Pesticides by Hazard and Guidelines to Classification 2019; WorldHealth Organization: Geneva, Switzerland, 2020.