Comparison of Sin-QuEChERS Nano and d-SPE Methods for ...
12
molecules Article Comparison of Sin-QuEChERS Nano and d-SPE Methods for Pesticide Multi-Residues in Lettuce and Chinese Chives Yanjie Li 1 , Quanshun An 2 , Changpeng Zhang 1 , Canping Pan 2, * and Zhiheng Zhang 1, * 1 Institute of Quality and Standard for Agro-Products, Zhejiang Academy of Agricultural Sciences, Hangzhou 310021, China; [email protected] (Y.L.); [email protected] (C.Z.) 2 Department of Applied Chemistry, College of Science, China Agricultural University, Beijing 100193, China; [email protected] * Correspondence: [email protected] (C.P.); [email protected] (Z.Z.); Tel.: +86-10-62731978 (C.P.); +86-571-86419053 (Z.Z.) Received: 28 June 2020; Accepted: 22 July 2020; Published: 27 July 2020 Abstract: In this study, a new rapid cleanup method was developed for the analysis of 111 pesticide multi-residues in lettuce and Chinese chives by GC–MS/MS and LC–MS/MS. QuEChERS (quick, easy, cheap, effective, rugged and safe)-based sample extraction was used to obtain the extracts, and the cleanup procedure was carried out using a Sin-QuEChERS nano cartridge. Comparison of the cleanup effects, limits of quantification and limits of detection, recoveries, precision and matrix effects (MEs) between the Sin-QuEChERS nano method and the classical dispersive solid phase extraction (d-SPE) method were performed. When spiked at 10 and 100 μg/kg, the number of pesticides with recoveries between 90% to 110% and relative standard deviations < 15% were greater when using the Sin-QuEChERS nano method. The MEs of Sin-QuEChERS nano and d-SPE methods ranged between 0.72 to 3.41 and 0.63 to 3.56, respectively. The results verified that the Sin-QuEChERS nano method was significantly more effective at removing pigments and more convenient than the d-SPE method. The developed method with the Sin-QuEChERS nano cleanup procedure was applied successfully to determine pesticide residues in market samples. Keywords: Sin-QuEChERS nano; d-SPE; matrix effect; pesticide residue 1. Introduction Pesticides prevent and control pests, diseases and weeds and are used to improve vegetable production levels and quality. However, the application of pesticides often leaves pesticide residues in vegetables, which represent a health risk to humans and animals. Measuring trace levels of pesticides in vegetables is becoming a challenging task because of the increasing number and variety of pesticides, and the presence of sample matrix components. In the past few decades, many extraction and cleanup methods for removing pesticide residues in vegetables have been developed, such as matrix solid-phase dispersion [1,2], solid phase extraction [3,4] and QuEChERS (quick, easy, cheap, effective, rugged and safe) [5]. The QuEChERS method consists of three main steps: extraction with organic solvent, partition with salts and cleanup by dispersive solid phase extraction (d-SPE) with a small quantity of sorbents. In the d-SPE procedure, primary secondary amine (PSA), graphitized carbon black (GCB) and octadecyl-silane (C 18 ) are the main sorbents used to adsorb organic acids, and to some extent adsorb various pigments and sugars [5]. Since development, many government and organizations have used the QuEChERS method extensively because this is the most efficient method to remove pesticide multi-residues, especially from vegetables, fruits and many other matrices [6–10]. Nonetheless, development of more efficient and reliable Molecules 2020, 25, 3391; doi:10.3390/molecules25153391 www.mdpi.com/journal/molecules
-
Upload
khangminh22 -
Category
Documents
-
view
0 -
download
0
Transcript of Comparison of Sin-QuEChERS Nano and d-SPE Methods for ...
molecules
Article
Comparison of Sin-QuEChERS Nano and d-SPEMethods for Pesticide Multi-Residues in Lettuce andChinese Chives
Yanjie Li 1 , Quanshun An 2, Changpeng Zhang 1, Canping Pan 2,* and Zhiheng Zhang 1,*1 Institute of Quality and Standard for Agro-Products, Zhejiang Academy of Agricultural Sciences,
Hangzhou 310021, China; [email protected] (Y.L.); [email protected] (C.Z.)2 Department of Applied Chemistry, College of Science, China Agricultural University, Beijing 100193, China;
[email protected]* Correspondence: [email protected] (C.P.); [email protected] (Z.Z.); Tel.: +86-10-62731978 (C.P.);
+86-571-86419053 (Z.Z.)
Received: 28 June 2020; Accepted: 22 July 2020; Published: 27 July 2020�����������������
Abstract: In this study, a new rapid cleanup method was developed for the analysis of 111 pesticidemulti-residues in lettuce and Chinese chives by GC–MS/MS and LC–MS/MS. QuEChERS (quick, easy,cheap, effective, rugged and safe)-based sample extraction was used to obtain the extracts, and thecleanup procedure was carried out using a Sin-QuEChERS nano cartridge. Comparison of thecleanup effects, limits of quantification and limits of detection, recoveries, precision and matrix effects(MEs) between the Sin-QuEChERS nano method and the classical dispersive solid phase extraction(d-SPE) method were performed. When spiked at 10 and 100 µg/kg, the number of pesticides withrecoveries between 90% to 110% and relative standard deviations < 15% were greater when using theSin-QuEChERS nano method. The MEs of Sin-QuEChERS nano and d-SPE methods ranged between0.72 to 3.41 and 0.63 to 3.56, respectively. The results verified that the Sin-QuEChERS nano methodwas significantly more effective at removing pigments and more convenient than the d-SPE method.The developed method with the Sin-QuEChERS nano cleanup procedure was applied successfully todetermine pesticide residues in market samples.
Keywords: Sin-QuEChERS nano; d-SPE; matrix effect; pesticide residue
1. Introduction
Pesticides prevent and control pests, diseases and weeds and are used to improve vegetableproduction levels and quality. However, the application of pesticides often leaves pesticide residues invegetables, which represent a health risk to humans and animals. Measuring trace levels of pesticidesin vegetables is becoming a challenging task because of the increasing number and variety of pesticides,and the presence of sample matrix components.
In the past few decades, many extraction and cleanup methods for removing pesticide residues invegetables have been developed, such as matrix solid-phase dispersion [1,2], solid phase extraction [3,4]and QuEChERS (quick, easy, cheap, effective, rugged and safe) [5]. The QuEChERS method consists ofthree main steps: extraction with organic solvent, partition with salts and cleanup by dispersive solidphase extraction (d-SPE) with a small quantity of sorbents. In the d-SPE procedure, primary secondaryamine (PSA), graphitized carbon black (GCB) and octadecyl-silane (C18) are the main sorbents used toadsorb organic acids, and to some extent adsorb various pigments and sugars [5].
Since development, many government and organizations have used the QuEChERS methodextensively because this is the most efficient method to remove pesticide multi-residues, especially fromvegetables, fruits and many other matrices [6–10]. Nonetheless, development of more efficient and reliable
Molecules 2020, 25, 3391; doi:10.3390/molecules25153391 www.mdpi.com/journal/molecules

Molecules 2020, 25, 3391 2 of 12
methods for determining multi-class and multi-residue pesticides in vegetables continues. The QuEChERSmethod has been modified to increase its efficiency and effectiveness, especially the sorbents of d-SPEand cleanup methods. Multi-walled carbon nanotubes (MWCNTs) were used as alternative d-SPEsorbents in pesticide multi-residue analysis with the QuEChERS method [11–14]. Many advanced cleanuptechniques were developed or modified, such as disposable pipette extraction [15], multiplug filtrationcleanup (m-PFC) [16] and automated m-PFC [17,18]. The Sin-QuEChERS nano cleanup method is anewly developed cleanup technique, which has been used for detecting pesticide residues in tea [19],wolfberry [20], pepper and chili pepper [21] and other matrices [22,23]. In the Sin-QuEChERS nanocleanup method, MWCNTs mixed with PSA, anhydrous magnesium sulfate (MgSO4) and other sorbentsare packed into a cartridge. The Sin-QuEChERS nano cartridge is inserted into a 50 mL centrifuge tube, andthe extract is purified as the cartridge is pressed downward. The Sin-QuEChERS nano cleanup method isfound to be very easy and rapid because it reduces the transfer and vortex steps in the cleanup procedure.
Among the different vegetables, lettuce (Lactuca sativa L.) and Chinese chives (Allium tuberosumRottler ex Spreng.) are representatives of simple and complex vegetable matrices, respectively. Lettuce isa kind of widely consumed leafy vegetable; however, the presence of residual pesticides is a concern toconsumers [24]. Chinese chives are a complex matrix in pesticide residue analysis because they arerich in sulfur-containing compounds and pigments that may cause matrix interference during massspectrometry analysis [25,26]. In the current study, a method with QuEChERS-based extraction andthe Sin-QuEChERS nano cleanup was established and validated for determining 111 pesticides in tworepresentative vegetables. The 111 pesticides were selected based on the registration and the routinemonitoring in lettuce and Chinese chives by the Chinese government. Tandem mass spectrometry(MS/MS) combined with gas chromatography (GC) and liquid chromatography (LC) was used forqualitative and quantitative analysis of the 111 pesticides. In addition, the performance, cleanup effectsand matrix effect of the Sin-QuEChERS nano and classical d-SPE methods were compared. We alsoaimed to simplify the pretreatment procedure, improve the efficiency of the method and extend theapplication of the Sin-QuEChERS nano cleanup method.
2. Results and Discussion
2.1. Optimization of Sin-QuEChERS nano Cleanup Procedures
The schematic diagram of the Sin-QuEChERS nano cleanup procedure is presented in Figure 1.PSA, MWCNTs, C18 and GCB are common adsorbents used to adsorb impurities in the cleanupprocedure. Cartridge A packed with 90 mg PSA and 15 mg MWCNTs was used for the lettuce sample(simple matrix), and cartridge B packed with 15 mg MWCNTs, 90 mg PSA, 80 mg GCB and 80 mg C18
was used for the Chinese chives sample (complex matrix). Because the amount of absorbents is fixed,the volume of purified extract influences the purification effect and recovery directly. Thus, differentvolumes (1 to 8 mL) of extract were purified at a spiking level of 100 µg/kg. The results showed thatrecoveries of most analytes increased as the purified volume increased up to 4 mL and then graduallyreached a steady level above a 4 mL loading. The recoveries of most target pesticides were in anacceptable range of 70%–120% when the purified volume reached 4 mL. At purified volumes greaterthan 4 mL, the color of the purified extract deepened as the volume increased above 4 mL. Therefore,the optimum volume of the purified extract was set at 4 mL for further examination.

Molecules 2020, 25, 3391 3 of 12Molecules 2020, 25, x FOR PEER REVIEW 3 of 12
Figure 1. Schematic of the Sin-QuEChERS nano cleanup method.
2.2. Method Validation and Comparison of Sin-QuEChERS nano and d-SPE Cleanup Methods
2.2.1. Linearity, Limits of Quantification (LOQs) and Limits of Detection (LODs)
Linearity was evaluated at five concentrations (10, 50, 100, 200 and 500 μg/L) by matrix-matched standard calibration. Good linearity was achieved for most pesticides with determination coefficients (R2) greater than 0.99, except for parathion-methyl and methomy.
The limits of quantification (LOQs) and limits of detection (LODs) are presented in Supplementary Materials Table S2. For the sin-QuEChERS nano method, the LOQs and LODs of the 111 pesticides present in lettuce and Chinese chives were in the range of 0.3–10 μg/kg and 0.1–3.0 μg/kg, respectively. For the d-SPE method, the LOQs and LODs of the 111 pesticides present in lettuce and Chinese chives were in the range of 0.4–10 μg/kg and 0.1–3.0 μg/kg, respectively. Thus, there were negligible differences between the two cleanup methods based on the LOQs and LODs values.
2.2.2. Recovery and Precision
Recovery and repeatability experiments were performed at two levels (10 and 100 μg/kg) with three replicates at each level to evaluate the accuracy and precision of the methods. Supplementary Materials Table S1 shows the results of average recoveries and relative standard deviations (RSDs) of pesticides. The recoveries were calculated using the matrix-matched standard calibration curves, according to the external standard method. In general, the recoveries of most pesticides for the two methods met the European (EU) Commission's guidance requirements. For the sin-QuEChERS nano method, the recoveries of most pesticides were in the range of 73% to 136% (75%–136% for lettuce and 73%–119% for Chinese chives) except for cyprodinil, which was in the range of 25%–45%. This result was in agreement with Zou et al. [25] and Qin et al. [27], who concluded that the cleanup procedures with MWCNTs were not suitable for pesticides containing a plane polycyclic structure. For the d-SPE method, the recoveries of analyzed pesticides were in the range of 70% to 132% (70%–128% for lettuce and 70%–132% for Chinese chives). As shown by the recoveries and RSDs, the sin-QuEChERS nano method performed slightly better than the d-SPE method. A larger number of pesticides with recoveries between 90% to 110% and RSDs < 15% was achieved when using the sin-QuEChERS nano method.
2.2.3. Cleanup Effect
As shown in Figure 2, the extracts of lettuce and Chinese chives samples purified by the Sin-QuEChERS nano cleanup method were almost colorless. The Sin-QuEChERS nano method displayed better performance in removing pigments than the d-SPE method, because of the excellent ability of the MWCNTs to adsorb interference substances. Figure 3 shows total ion chromatograms (TIC) of GC–MS/MS and LC–MS/MS for the blank lettuce using the two cleanup methods. The results demonstrate that the Sin-QuEChERS nano cleanup method performed better than d-SPE
Figure 1. Schematic of the Sin-QuEChERS nano cleanup method.
2.2. Method Validation and Comparison of Sin-QuEChERS nano and d-SPE Cleanup Methods
2.2.1. Linearity, Limits of Quantification (LOQs) and Limits of Detection (LODs)
Linearity was evaluated at five concentrations (10, 50, 100, 200 and 500 µg/L) by matrix-matchedstandard calibration. Good linearity was achieved for most pesticides with determination coefficients(R2) greater than 0.99, except for parathion-methyl and methomy.
The limits of quantification (LOQs) and limits of detection (LODs) are presented in SupplementaryMaterials Table S2. For the sin-QuEChERS nano method, the LOQs and LODs of the 111 pesticidespresent in lettuce and Chinese chives were in the range of 0.3–10 µg/kg and 0.1–3.0 µg/kg, respectively.For the d-SPE method, the LOQs and LODs of the 111 pesticides present in lettuce and Chinesechives were in the range of 0.4–10 µg/kg and 0.1–3.0 µg/kg, respectively. Thus, there were negligibledifferences between the two cleanup methods based on the LOQs and LODs values.
2.2.2. Recovery and Precision
Recovery and repeatability experiments were performed at two levels (10 and 100 µg/kg) withthree replicates at each level to evaluate the accuracy and precision of the methods. SupplementaryMaterials Table S1 shows the results of average recoveries and relative standard deviations (RSDs)of pesticides. The recoveries were calculated using the matrix-matched standard calibration curves,according to the external standard method. In general, the recoveries of most pesticides for the twomethods met the European (EU) Commission’s guidance requirements. For the sin-QuEChERS nanomethod, the recoveries of most pesticides were in the range of 73% to 136% (75%–136% for lettuce and73%–119% for Chinese chives) except for cyprodinil, which was in the range of 25%–45%. This resultwas in agreement with Zou et al. [25] and Qin et al. [27], who concluded that the cleanup procedureswith MWCNTs were not suitable for pesticides containing a plane polycyclic structure. For the d-SPEmethod, the recoveries of analyzed pesticides were in the range of 70% to 132% (70%–128% for lettuceand 70%–132% for Chinese chives). As shown by the recoveries and RSDs, the sin-QuEChERS nanomethod performed slightly better than the d-SPE method. A larger number of pesticides with recoveriesbetween 90% to 110% and RSDs < 15% was achieved when using the sin-QuEChERS nano method.
2.2.3. Cleanup Effect
As shown in Figure 2, the extracts of lettuce and Chinese chives samples purified by theSin-QuEChERS nano cleanup method were almost colorless. The Sin-QuEChERS nano methoddisplayed better performance in removing pigments than the d-SPE method, because of the excellentability of the MWCNTs to adsorb interference substances. Figure 3 shows total ion chromatograms(TIC) of GC–MS/MS and LC–MS/MS for the blank lettuce using the two cleanup methods. The resultsdemonstrate that the Sin-QuEChERS nano cleanup method performed better than d-SPE method withfewer and lower levels of chromatographic interference substances.

Molecules 2020, 25, 3391 4 of 12Molecules 2020, 25, x FOR PEER REVIEW 4 of 12
method with fewer and lower levels of chromatographic interference substances.
Figure 2. Comparison of the pigment-cleanup effects between Sin-QuEChERS nano and d-SPE methods. (a) Extract of lettuce (1) without cleanup, (2) cleaned-up by d-SPE and (3) cleaned-up by Sin-QuEChERS nano. (b) Extract of Chinese chives (1) without cleanup, (2) cleaned-up by d-SPE and (3) cleaned-up by Sin-QuEChERS nano.
Figure 3. Total ion chromatograms (TIC) for a blank lettuce extract with different cleanup procedures. (a) TIC of GC–MS/MS with d-SPE cleanup, (b) TIC of GC–MS/MS with Sin-QuEChERS nano cleanup, (c) TIC of LC–MS/MS with d-SPE cleanup and (d) TIC of LC–MS/MS with Sin-QuEChERS nano cleanup.
2.2.4. Matrix Effect
Matrix effects (MEs) are very common in both GC–MS/MS and LC–MS/MS methods and should be assessed at the method validation stage. Because of the co-extracted analytes, MEs are regarded as a signal enhancement (ME > 1) or suppression (ME < 1) of the analyte. MEs were estimated via the ratio of the calibration curve slopes of matrix to solvent. Studies recommend that MEs can be ignored when the ME values are in the range of 0.9 to 1.1 [11]. If the ME cannot be ignored, using a matrix-matched standard is the most effective way to compensate for MEs.
The MEs in this study are listed in Supplementary Materials Table S2. The MEs of the Sin-QuEChERS nano method were in the range of 0.72–3.41 (0.88–2.05 for lettuce and 0.72–34 for Chinese chives), and the MEs of the d-SPE method ranged between 0.63 and 3.56 (0.80–2.68 for lettuce and 0.63–3.56 for Chinese chives). Figure 4 shows that the MEs were more obvious in the GC–MS/MS analysis and primarily acted as a signal enhancement. The MEs are also matrix dependent. The MEs of Chinese chives are more robust when compared with that of lettuce. The Sin-QuEChERS nano method reduced the matrix effect more efficiently than the d-SPE method because of the better cleanup capacity.
Figure 2. Comparison of the pigment-cleanup effects between Sin-QuEChERS nano and d-SPE methods.(a) Extract of lettuce (1) without cleanup, (2) cleaned-up by d-SPE and (3) cleaned-up by Sin-QuEChERSnano. (b) Extract of Chinese chives (1) without cleanup, (2) cleaned-up by d-SPE and (3) cleaned-up bySin-QuEChERS nano.
Figure 3. Total ion chromatograms (TIC) for a blank lettuce extract with different cleanup procedures.(a) TIC of GC–MS/MS with d-SPE cleanup, (b) TIC of GC–MS/MS with Sin-QuEChERS nano cleanup,(c) TIC of LC–MS/MS with d-SPE cleanup and (d) TIC of LC–MS/MS with Sin-QuEChERS nano cleanup.
2.2.4. Matrix Effect
Matrix effects (MEs) are very common in both GC–MS/MS and LC–MS/MS methods and shouldbe assessed at the method validation stage. Because of the co-extracted analytes, MEs are regarded as asignal enhancement (ME > 1) or suppression (ME < 1) of the analyte. MEs were estimated via the ratioof the calibration curve slopes of matrix to solvent. Studies recommend that MEs can be ignored whenthe ME values are in the range of 0.9 to 1.1 [11]. If the ME cannot be ignored, using a matrix-matchedstandard is the most effective way to compensate for MEs.
The MEs in this study are listed in Supplementary Materials Table S2. The MEs of theSin-QuEChERS nano method were in the range of 0.72–3.41 (0.88–2.05 for lettuce and 0.72–34 forChinese chives), and the MEs of the d-SPE method ranged between 0.63 and 3.56 (0.80–2.68 for lettuceand 0.63–3.56 for Chinese chives). Figure 4 shows that the MEs were more obvious in the GC–MS/MSanalysis and primarily acted as a signal enhancement. The MEs are also matrix dependent. The MEs ofChinese chives are more robust when compared with that of lettuce. The Sin-QuEChERS nano methodreduced the matrix effect more efficiently than the d-SPE method because of the better cleanup capacity.

Molecules 2020, 25, 3391 5 of 12Molecules 2020, 25, x FOR PEER REVIEW 5 of 12
Figure 4. Comparison of the matrix effects (MEs) for all pesticides in lettuce and Chinese chives using the different cleanup procedures. (a) pesticides in lettuce analyzed by LC–MS/MS, (b) pesticides in Chinese chives analyzed by LC–MS/MS, (c) pesticides in lettuce analyzed by GC–MS/MS and (d) pesticides in Chinese chives analyzed by GC–MS/MS.
2.3. Application to the Monitoring of Real Samples
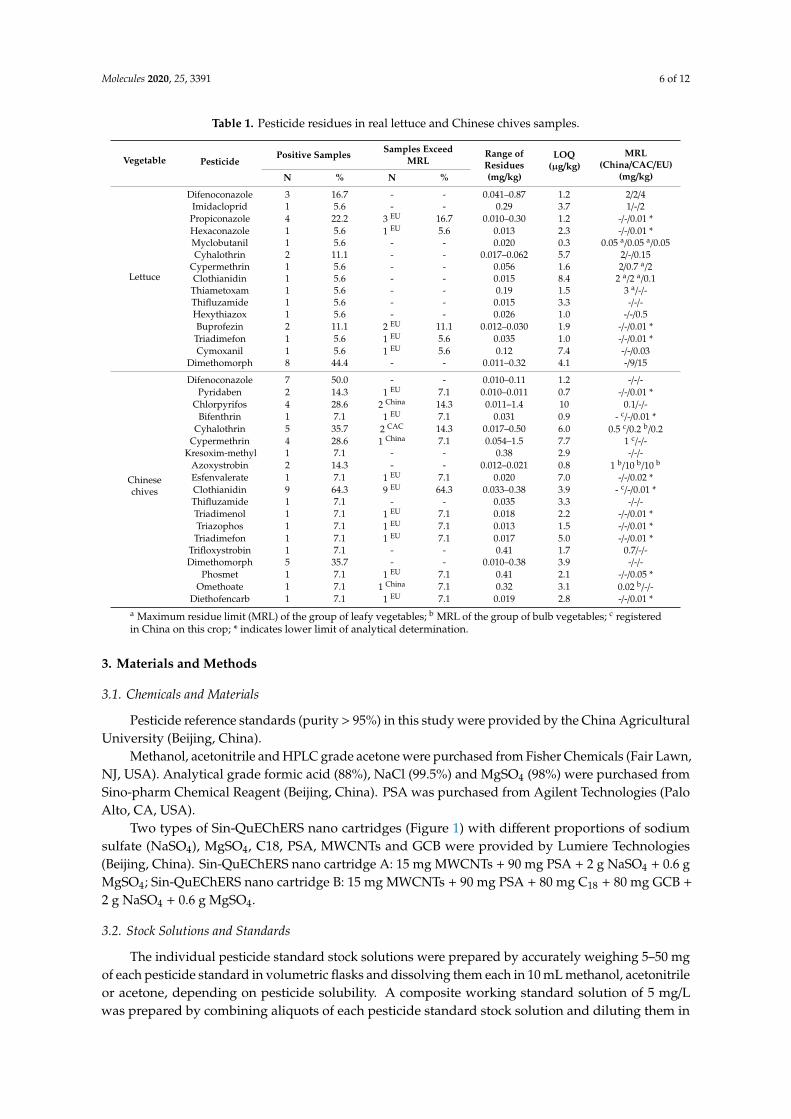
The development of the QuEChERS-based extraction method with the Sin-QuEChERS nano cleanup method was used in real sample analysis. Fourteen Chinese chives samples and eighteen lettuce samples were purchased from supermarkets, farmer’s markets or local vegetable-production factories in Beijing. All samples were extracted and cleaned up according to Sections 3.5 and 3.6. Pesticide residues encountered in the analyzed samples are shown in Table 1. Fifteen pesticide residues were detected in 12 lettuce samples in the range of 0.010–0.87 mg/kg. Nineteen pesticide residues were detected in 12 Chinese chives samples with the residues in the range of 0.01–1.5 mg/kg. Among all the detected pesticides, dimethomorph and clothianidin had the highest detection rate at 44.4% and 64.3% in lettuce and Chinese chives, respectively.
Table 1 list the maximum residue limits (MRLs) of the detected pesticides established by China [28], the Codex Alimentarius Commission (CAC) [29] and the EU [30]. Compared to the lowest MRLs, the residues of 5 pesticides in lettuce and 13 pesticides in Chinese chives were above the MRLs. The residues of dimethomorph in lettuce with a detection frequency of 44.4% were lower the lowest MRL (9 mg/kg) established by the CAC. The detection frequency of difenoconazole and dimethomorph in Chinese chives was up to 50% and 35.7%; however, China, CAC and EU have not set the MRLs. From this test, the developed method was confirmed to be suitable for determination of pesticide multi-residues in a variety of vegetables.
Table 1. Pesticide residues in real lettuce and Chinese chives samples.
Vegetable Pesticide Positive Samples
Samples Exceed MRL
Range of Residues (mg/kg)
LOQ (μg/kg)
MRL (China/CAC/EU)
(mg/kg) N % N %
Lettuce
Difenoconazole 3 16.7 - - 0.041–0.87 1.2 2/2/4 Imidacloprid 1 5.6 - - 0.29 3.7 1/-/2
Propiconazole 4 22.2 3 EU 16.7 0.010–0.30 1.2 -/-/0.01 * Hexaconazole 1 5.6 1 EU 5.6 0.013 2.3 -/-/0.01 * Myclobutanil 1 5.6 - - 0.020 0.3 0.05 a/0.05 a/0.05
Figure 4. Comparison of the matrix effects (MEs) for all pesticides in lettuce and Chinese chivesusing the different cleanup procedures. (a) pesticides in lettuce analyzed by LC–MS/MS, (b) pesticidesin Chinese chives analyzed by LC–MS/MS, (c) pesticides in lettuce analyzed by GC–MS/MS and(d) pesticides in Chinese chives analyzed by GC–MS/MS.
2.3. Application to the Monitoring of Real Samples
The development of the QuEChERS-based extraction method with the Sin-QuEChERS nanocleanup method was used in real sample analysis. Fourteen Chinese chives samples and eighteenlettuce samples were purchased from supermarkets, farmer’s markets or local vegetable-productionfactories in Beijing. All samples were extracted and cleaned up according to Sections 3.5 and 3.6.Pesticide residues encountered in the analyzed samples are shown in Table 1. Fifteen pesticide residueswere detected in 12 lettuce samples in the range of 0.010–0.87 mg/kg. Nineteen pesticide residues weredetected in 12 Chinese chives samples with the residues in the range of 0.01–1.5 mg/kg. Among all thedetected pesticides, dimethomorph and clothianidin had the highest detection rate at 44.4% and 64.3%in lettuce and Chinese chives, respectively.
Table 1 list the maximum residue limits (MRLs) of the detected pesticides established by China [28],the Codex Alimentarius Commission (CAC) [29] and the EU [30]. Compared to the lowest MRLs,the residues of 5 pesticides in lettuce and 13 pesticides in Chinese chives were above the MRLs.The residues of dimethomorph in lettuce with a detection frequency of 44.4% were lower the lowestMRL (9 mg/kg) established by the CAC. The detection frequency of difenoconazole and dimethomorphin Chinese chives was up to 50% and 35.7%; however, China, CAC and EU have not set the MRLs.From this test, the developed method was confirmed to be suitable for determination of pesticidemulti-residues in a variety of vegetables.
Molecules 2020, 25, 3391 6 of 12
Table 1. Pesticide residues in real lettuce and Chinese chives samples.
Vegetable PesticidePositive Samples Samples Exceed
MRLRange ofResidues(mg/kg)
LOQ(µg/kg)
MRL(China/CAC/EU)
(mg/kg)N % N %
Lettuce
Difenoconazole 3 16.7 - - 0.041–0.87 1.2 2/2/4Imidacloprid 1 5.6 - - 0.29 3.7 1/-/2
Propiconazole 4 22.2 3 EU 16.7 0.010–0.30 1.2 -/-/0.01 *Hexaconazole 1 5.6 1 EU 5.6 0.013 2.3 -/-/0.01 *Myclobutanil 1 5.6 - - 0.020 0.3 0.05 a/0.05 a/0.05Cyhalothrin 2 11.1 - - 0.017–0.062 5.7 2/-/0.15
Cypermethrin 1 5.6 - - 0.056 1.6 2/0.7 a/2Clothianidin 1 5.6 - - 0.015 8.4 2 a/2 a/0.1
Thiametoxam 1 5.6 - - 0.19 1.5 3 a/-/-Thifluzamide 1 5.6 - - 0.015 3.3 -/-/-Hexythiazox 1 5.6 - - 0.026 1.0 -/-/0.5Buprofezin 2 11.1 2 EU 11.1 0.012–0.030 1.9 -/-/0.01 *
Triadimefon 1 5.6 1 EU 5.6 0.035 1.0 -/-/0.01 *Cymoxanil 1 5.6 1 EU 5.6 0.12 7.4 -/-/0.03
Dimethomorph 8 44.4 - - 0.011–0.32 4.1 -/9/15
Chinesechives
Difenoconazole 7 50.0 - - 0.010–0.11 1.2 -/-/-Pyridaben 2 14.3 1 EU 7.1 0.010–0.011 0.7 -/-/0.01 *
Chlorpyrifos 4 28.6 2 China 14.3 0.011–1.4 10 0.1/-/-Bifenthrin 1 7.1 1 EU 7.1 0.031 0.9 - c/-/0.01 *
Cyhalothrin 5 35.7 2 CAC 14.3 0.017–0.50 6.0 0.5 c/0.2 b/0.2Cypermethrin 4 28.6 1 China 7.1 0.054–1.5 7.7 1 c/-/-
Kresoxim-methyl 1 7.1 - - 0.38 2.9 -/-/-Azoxystrobin 2 14.3 - - 0.012–0.021 0.8 1 b/10 b/10 b
Esfenvalerate 1 7.1 1 EU 7.1 0.020 7.0 -/-/0.02 *Clothianidin 9 64.3 9 EU 64.3 0.033–0.38 3.9 - c/-/0.01 *Thifluzamide 1 7.1 - - 0.035 3.3 -/-/-Triadimenol 1 7.1 1 EU 7.1 0.018 2.2 -/-/0.01 *Triazophos 1 7.1 1 EU 7.1 0.013 1.5 -/-/0.01 *
Triadimefon 1 7.1 1 EU 7.1 0.017 5.0 -/-/0.01 *Trifloxystrobin 1 7.1 - - 0.41 1.7 0.7/-/-Dimethomorph 5 35.7 - - 0.010–0.38 3.9 -/-/-
Phosmet 1 7.1 1 EU 7.1 0.41 2.1 -/-/0.05 *Omethoate 1 7.1 1 China 7.1 0.32 3.1 0.02 b/-/-
Diethofencarb 1 7.1 1 EU 7.1 0.019 2.8 -/-/0.01 *a Maximum residue limit (MRL) of the group of leafy vegetables; b MRL of the group of bulb vegetables; c registeredin China on this crop; * indicates lower limit of analytical determination.
3. Materials and Methods
3.1. Chemicals and Materials
Pesticide reference standards (purity > 95%) in this study were provided by the China AgriculturalUniversity (Beijing, China).
Methanol, acetonitrile and HPLC grade acetone were purchased from Fisher Chemicals (Fair Lawn,NJ, USA). Analytical grade formic acid (88%), NaCl (99.5%) and MgSO4 (98%) were purchased fromSino-pharm Chemical Reagent (Beijing, China). PSA was purchased from Agilent Technologies (PaloAlto, CA, USA).
Two types of Sin-QuEChERS nano cartridges (Figure 1) with different proportions of sodiumsulfate (NaSO4), MgSO4, C18, PSA, MWCNTs and GCB were provided by Lumiere Technologies(Beijing, China). Sin-QuEChERS nano cartridge A: 15 mg MWCNTs + 90 mg PSA + 2 g NaSO4 + 0.6 gMgSO4; Sin-QuEChERS nano cartridge B: 15 mg MWCNTs + 90 mg PSA + 80 mg C18 + 80 mg GCB +
2 g NaSO4 + 0.6 g MgSO4.
3.2. Stock Solutions and Standards
The individual pesticide standard stock solutions were prepared by accurately weighing 5–50 mgof each pesticide standard in volumetric flasks and dissolving them each in 10 mL methanol, acetonitrileor acetone, depending on pesticide solubility. A composite working standard solution of 5 mg/Lwas prepared by combining aliquots of each pesticide standard stock solution and diluting them in

Molecules 2020, 25, 3391 7 of 12
acetonitrile. Three series of calibration standards with five concentrations (10, 50, 100, 200, 500 µg/L)were diluted in acetonitrile, lettuce and Chinese chives extracts. The stock standard solutions andworking standard solution were stored at −20 ◦C.
One hundred and eleven pesticides were analyzed, among which 75 were analyzed by GC–MS/MS,60 pesticides were analyzed by LC–MS/MS and 24 were analyzed by GC–MS/MS and LC–MS/MS.
3.3. GC–MS/MS Analytical Conditions
A Thermo Scientific TSQ Quantum XLS triple quadrupole mass spectrometer coupled with aThermo Scientific Trace 1300 GC (San Jose, CA, USA) was used for GC–MS/MS analysis. An Rxi®-5SiLMS column (20 m × 0.18 mm I.D., 0.18 µm film thickness) from Restek Corporation (Bellefonte, PA,USA) was used for the chromatographic separation of the compounds. The column temperatureprogram started from 40 ◦C (hold 0.6 min), increased to 180 ◦C at the rate of 30 ◦C/min, then increasedto 280 ◦C at the rate of 10 ◦C/min, then increased to 290 ◦C at the rate of 20 ◦C/min, and held at this finaltemperature for 5 min. The temperature of the injector port was 250 ◦C, and a 1 µL volume was injectedinto the splitless mode with a split flow of 50 mL/min and a splitless time of 1.0 min. The helium carriergas flow rate was 0.85 mL/min. The ion source and transfer line temperature were 280 ◦C. The MS wasoperated in the electron ionization mode at 70 eV with the selective reaction monitoring (SRM) dataacquisition mode. The MS/MS parameters are shown in Supplementary Materials Table S3.
3.4. LC–MS/MS Analytical Conditions
The LC system was a Dionex UltiMate 3000 liquid chromatograph system (Dionex, CA, USA) witha quaternary pump (HPG-3400RS), autosampler (WPS-3000) and column oven (TCC-3000) equippedwith a reversed-phase Syncronis C18 column (100 mm × 2.1 mm I.D., 1.7 µm particle size) from ThermoScientific (San Jose, CA, USA). The column temperature was maintained at 40 ◦C, and the injectionvolume was 5 µL. Mobile phase A was water with 0.1% formic acid, and mobile phase B was acetonitrile.The separation was performed at a flow rate of 0.4 mL/min, and the gradient elution was 0–18 min,linear gradient 20%–100% B, held for 2 min; 20–21 min, linear gradient 100%–20% B, held for 2 min.
The LC system was connected to a Thermo Scientific TSQ Quantum Access MAS triple stageMS/MS (San Jose, CA, USA) equipped with an electrospray ionization (ESI) source in the positiveand negative ion mode. The SRM mode was used, and the m/z ratios of all target pesticides arelisted in Supplementary Materials Table S4, along with the tube lens voltage and the collision energy.The capillary temperature, vaporizer temperature, aux gas (N2) pressure and sheath gas (N2) pressurewere set to 300 ◦C, 300 ◦C, 15 Arb and 35 Arb, respectively. The spray voltage for positive and negativepolarity was set to 3500 V and 2300 V, respectively.
3.5. Sample Preparation
The lettuce and Chinese chives samples were homogenized with a blender for 30 s. The homogenizedlettuce and Chinese chives samples were then extracted as described by Lehotay [5] with somemodifications. Briefly, the sample was weighed into a 50 mL Teflon centrifuge tube. After adding 4 ganhydrous MgSO4 and 1 g NaCl and shaking for 1 min, the tube was cooled in an ice-water bath for5 min and then centrifuged for 5 min at 3800 rpm. The supernatant was used for further cleanup.
For recovery experiments, the homogenized blank samples (10± 0.1 g) were spiked by the additionof the working standard solution at two concentration levels of 10 and 100 µg/kg and left for at least30 min before extraction.
3.6. Sin-QuEChERS nano and d-SPE Cleanup Procedures
For the Sin-QuEChERS nano cleanup procedure, the schematic of the steps used is presented inFigure 1. The Sin-QuEChERS nano cartridge was inserted into the 50 mL Teflon centrifuge tube andpressed down at a steady speed of ~1 mm/s until 4 mL purified extract was achieved. Finally, 1 mL
Molecules 2020, 25, 3391 8 of 12
purified extract was filtered through a 0.22-µm membrane and placed into an auto-sampler vial forGC–MS/MS or LC–MS/MS analysis.
For the dispersive-SPE cleanup procedure, 1 mL extract was transferred into a 2-mL microcentrifugevial containing 50 mg PSA and 150 mg MgSO4. The mixture was eddied with a vortex mixer for 30 sand centrifuged for 1 min at 10,000 rpm. Finally, the purified extract was filtered through a 0.22-µmmembrane and placed into an auto-sampler vial for GC–MS/MS or LC–MS/MS analysis.
3.7. Method Validation
The methods were validated according to the EC guidance document SANTE/11813/2017 [31].Analytical parameters evaluated were linearity, accuracy and precision, LOD, LOQ and ME. The LODand LOQ were calculated by the lowest concentration that produced signal-to-noise ratios of 3 and10, respectively. Matrix effects were estimated by comparing the calibration curves slopes of matrixand solvent.
3.8. Confirmation Criteria
The MS coupled GC or LC separation system can provide the retention time (Rt), m/z ratio andrelative abundance data simultaneously. For identification of the analytes in the extract, the Rt andrelative ion ratio criterion were used. According to the EC guidance document [31], the Rt of theanalyte from the sample extract should correspond to the calibration standard with a tolerance of±0.1 min, and the relative ion ratio from sample extracts should be within ± 30% of the average of thecalibration standard.
4. Conclusions
In this study, a rapid and sensitive method for the analysis of pesticide multi-residues in lettuceand Chinese chives was developed using the Sin-QuEChERS nano cleanup method combined with theQuEChERS-based sample extraction method. The method was validated through linearity, LODs andLOQs, accuracy and precision and matrix effect. The recoveries of 110 pesticides were in the range of73% to 136% (75%–136% for lettuce and 73%–119% for Chinese chives) except for cyprodinil, which wasin the range of 25%–45%. The LODs and LOQs for the 111 pesticides were in the range of 0.3–10 µg/kgand 0.1–3.0 µg/kg, respectively. Fourteen Chinese chives samples and eighteen lettuce samples wereanalyzed by the developed method. The results indicated that the proposed method to determinevarious classes of pesticide residues is sensitive.
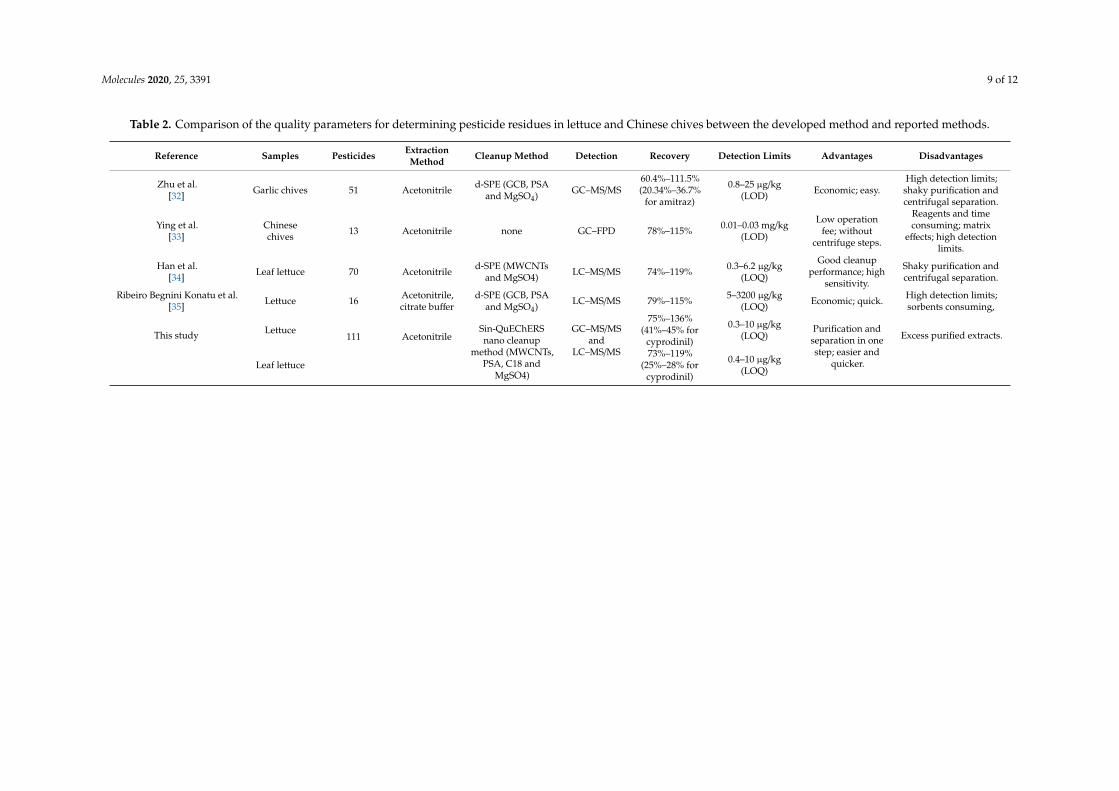
Meanwhile, comparison of the cleanup effects, limits of quantification and limits of detection,recoveries, precision and MEs between the Sin-QuEChERS nano method and the classical d-SPEmethod were performed; comparison of the cleanup method, detection limit, recovery, advantages anddisadvantages between the Sin-QuEChERS nano method reported in this study and the publishedmethods were made (as shown in Table 2). The results verified that the Sin-QuEChERS nano methodperformed better with respect to the cleanup effect, especially for the removal of pigments, and is asimplified and efficient extract purification procedure.
Molecules 2020, 25, 3391 9 of 12
Table 2. Comparison of the quality parameters for determining pesticide residues in lettuce and Chinese chives between the developed method and reported methods.
Reference Samples Pesticides ExtractionMethod Cleanup Method Detection Recovery Detection Limits Advantages Disadvantages
Zhu et al.[32] Garlic chives 51 Acetonitrile d-SPE (GCB, PSA
and MgSO4) GC–MS/MS60.4%–111.5%(20.34%–36.7%
for amitraz)
0.8–25 µg/kg(LOD) Economic; easy.
High detection limits;shaky purification andcentrifugal separation.
Ying et al.[33]
Chinesechives 13 Acetonitrile none GC–FPD 78%–115% 0.01–0.03 mg/kg
(LOD)
Low operationfee; without
centrifuge steps.
Reagents and timeconsuming; matrix
effects; high detectionlimits.
Han et al.[34] Leaf lettuce 70 Acetonitrile d-SPE (MWCNTs
and MgSO4) LC–MS/MS 74%–119% 0.3–6.2 µg/kg(LOQ)
Good cleanupperformance; high
sensitivity.
Shaky purification andcentrifugal separation.
Ribeiro Begnini Konatu et al.[35] Lettuce 16 Acetonitrile,
citrate bufferd-SPE (GCB, PSA
and MgSO4) LC–MS/MS 79%–115% 5–3200 µg/kg(LOQ) Economic; quick. High detection limits;
sorbents consuming,
This study Lettuce111 Acetonitrile
Sin-QuEChERSnano cleanup
method (MWCNTs,PSA, C18 and
MgSO4)
GC–MS/MSand
LC–MS/MS
75%–136%(41%–45% for
cyprodinil)
0.3–10 µg/kg(LOQ)
Purification andseparation in onestep; easier and
quicker.
Excess purified extracts.
Leaf lettuce73%–119%
(25%–28% forcyprodinil)
0.4–10 µg/kg(LOQ)

Molecules 2020, 25, 3391 10 of 12
Supplementary Materials: The following are available online: Table S1: Average recoveries (%) and relativestandard deviation (RSDs, %) of 111 pesticides at two spiked levels (10 and 100 µg/kg, n = 3) in lettuce andChinese chives; Table S2: MEs, LOQs and LODs of the studied pesticides in lettuce and Chinese chives; Table S3:GC–MS/MS quantification and qualitative transitions, collision energy and retention times (Rts) used for thestudied pesticides; Table S4: LC–MS/MS quantification and qualitative transitions, collision energy, tube lensvoltages and retention times (Rts) used for the studied pesticides.
Author Contributions: Conceptualization, Y.L. and C.P.; method validation and sample analysis, Y.L. and Q.A.;data analysis, Y.L.; writing—original draft preparation, Y.L.; writing—review and editing, C.Z. and Z.Z.; projectadministration and funding acquisition, C.P. and C.Z. Both C.P. and Z.Z. are corresponding authors. All authorshave read and agreed to the published version of the manuscript.
Funding: This research was funded by the National Key Research and Development Program of China(No. 2016YFD0200204 and No. 2016YFD0200206).
Conflicts of Interest: The authors declare no conflict of interest.
Abbreviations
CAC Codex Alimentarius Commissiond-SPE dispersive solid phase extractionEU EuropeanESI electrospray ionizationGC gas chromatographyGCB graphitized carbon blackLC liquid chromatographyLOD limit of detectionLOQ limit of quantificationME matrix effectm-PFC multiplug filtration cleanupMRL maximum residue limitMS/MS tandem mass spectrometryMWCNT multi-walled carbon nanotubePSA primary secondary amineQuEChERS quick, easy, cheap, effective, rugged and safeRSD relative standard deviationSRM selective reaction monitoringTIC total ion chromatograms
References
1. Fernandez, M.; Pico, Y.; Manes, J. Determination of carbamate residues in fruits and vegetables by matrixsolid-phase dispersion and liquid chromatography-mass spectrometry. J. Chromatogr. A 2000, 871, 43–65.[CrossRef]
2. Cristina, B.; Yolanda, P.; Guillermina, F. Monitoring of Five Postharvest Fungicides in Fruit and Vegetablesby Matrix Solid-Phase Dispersion and Liquid Chromatography/Mass Spectrometry. J. AOAC Int. 2019, 85,704–711.
3. Obana, H.; Okihashi, M.; Akutsu, K.; Kitagawa, Y.; Hori, S. Determination of Neonicotinoid Pesticide Residuesin Vegetables and Fruits with Solid Phase Extraction and Liquid Chromatography Mass Spectrometry. J. Agric.Food Chem. 2003, 51, 2501. [CrossRef] [PubMed]
4. Stajnbaher, D.; Zupancic-Kralj, L. Multiresidue method for determination of 90 pesticides in fresh fruits andvegetables using solid-phase extraction and gas chromatography-mass spectrometry. J. Chromatogr. A 2003,1015, 185–198. [CrossRef]
5. Anastassiades, M.; Lehotay, S.J.; Štajnbaher, D.; Schenck, F.J. Fast and Easy Multiresidue Method EmployingAcetonitrile Extraction/Partitioning and “Dispersive Solid-Phase Extraction” for the Determination ofPesticide Residues in Produce. J. AOAC Int. 2003, 86, 412–431. [CrossRef]
6. Orso, D.; Floriano, L.; Ribeiro, L.C.; Bandeira, N.M.G.; Prestes, O.D.; Zanella, R. Simultaneous Determinationof Multiclass Pesticides and Antibiotics in Honey Samples Based on Ultra-High Performance LiquidChromatography-Tandem Mass Spectrometry. Food Anal. Methods 2016, 9, 1638–1653. [CrossRef]
Molecules 2020, 25, 3391 11 of 12
7. Hall, M.J.; Dang, V.; Bradbury, S.P.; Coats, J.R. Optimization of QuEChERS Method for SimultaneousDetermination of Neonicotinoid Residues in Pollinator Forage. Molecules 2020, 25, 2732. [CrossRef]
8. Lehotay, S.J.; Son, K.A.; Kwon, H.; Koesukwiwat, U.; Fu, W.; Mastovska, K.; Hoh, E.; Leepipatpiboon, N.Comparison of QuEChERS sample preparation methods for the analysis of pesticide residues in fruits andvegetables. J. Chromatogr. A 2010, 1217, 2548–2560. [CrossRef]
9. Pinto, C.G.; Laespada, M.E.F.; Martín, S.H.; Ferreira, A.M.C.; Pavón, J.L.P.; Cordero, B.M. SimplifiedQuEChERS approach for the extraction of chlorinated compounds from soil samples. Talanta 2010, 81,385–391. [CrossRef]
10. Wilkowska, A.; Biziuk, M. Determination of pesticide residues in food matrices using the QuEChERSmethodology. Food Chem. 2011, 125, 803–812. [CrossRef]
11. Zhao, P.Y.; Wang, L.; Zhou, L.; Zhang, F.Z.; Kang, S.; Pan, C.P. Multi-walled carbon nanotubes as alternativereversed-dispersive solid phase extraction materials in pesticide multi-residue analysis with QuEChERSmethod. J. Chromatogr. A 2012, 1225, 17–25. [CrossRef] [PubMed]
12. Zhao, P.Y.; Wang, L.; Luo, J.H.; Li, J.G.; Pan, C.P. Determination of pesticide residues in complex matricesusing multi-walled carbon nanotubes as reversed-dispersive solid-phase extraction sorbent. J. Sep. Sci. 2012,35, 153–158. [CrossRef] [PubMed]
13. Wu, Y.L.; Chen, R.X.; Zhu, Y.; Zhao, J.; Yang, T. Simultaneous determination of sixteen amide fungicidesin vegetables and fruits by dispersive solid phase extraction and liquid chromatography–tandem massspectrometry. J. Chromatogr. B 2015, 989, 11–20. [CrossRef] [PubMed]
14. Zhao, H.X.; Ding, M.Y.; Gao, Y.B.; Wei, D. Determination of Sulfonamides in Pork, Egg, and Chicken UsingMultiwalled Carbon Nanotubes as a Solid-Phase Extraction Sorbent Followed by Ultra-Performance LiquidChromatography/Tandem Mass Spectrometry. J. AOAC Int. 2019, 97, 1481–1488. [CrossRef]
15. Guan, H.X.; Brewer, W.E.; Morgan, S.L. New Approach to Multiresidue Pesticide Determination in Foods withHigh Fat Content Using Disposable Pipette Extraction (DPX) and Gas Chromatography-Mass spectrometry(GC-MS). J. Agric. Food Chem. 2009, 57, 10531–10538. [CrossRef]
16. Zhao, P.Y.; Fan, S.F.; Yu, C.S.; Zhang, J.Y.; Pan, C.P. Multiplug filtration clean-up with multiwalled carbonnanotubes in the analysis of pesticide residues using LC-ESI-MS/MS. J. Sep. Sci. 2013, 36, 3379–3386. [CrossRef]
17. Qin, Y.H.; Zhang, J.R.; He, Y.N.; Han, Y.T.; Zou, N.; Li, Y.J.; Chen, R.H.; Li, X.S.; Pan, C.P. AutomatedMultiplug Filtration Cleanup for Pesticide Residue Analyses in Kiwi Fruit (Actinidia chinensis) and KiwiJuice by Gas Chromatography-Mass Spectrometry. J. Agric. Food Chem. 2016, 64, 6082–6090. [CrossRef]
18. Qin, Y.H.; Zhang, J.R.; Li, Y.F.; Wang, Q.X.; Wu, Y.L.; Xu, L.S.; Jin, X.J.; Pan, C.P. Automated multi-filtrationcleanup with nitrogen-enriched activated carbon material as pesticide multi-residue analysis method inrepresentative crop commodities. J. Chromatogr. A 2017, 1515, 62–68. [CrossRef]
19. Lan, T.; Chu, Q.; Hao, D.Y.; Liu, S.N.; Xi, X.J.; Pan, C.P.; Zhang, W.B. Simultaneously Detection of10 Organophosphorus Pesticides residues in Tea by Sin-QuEChERS with UPLC-MS/MS. J. Chin. MassSpectrom. Soc. 2019, 40, 268–279.
20. Chen, J.N.; Lian, Y.J.; Zhou, Y.R.; Wang, M.H.; Zhang, X.Q.; Wang, J.H.; Wu, Y.N.; Wang, M.L. Determinationof 107 Pesticide Residues in Wolfberry with Acetate-buffered Salt Extraction and Sin-QuEChERS NanoColumn Purification Coupled with Ultra Performance Liquid Chromatography Tandem Mass Spectrometry.Molecules 2019, 24, 2918. [CrossRef]
21. Song, L.; Han, Y.T.; Yang, J.; Qin, Y.H.; Zeng, W.B.; Xu, S.Q.; Pan, C.P. Rapid single-step cleanup method foranalyzing 47 pesticide residues in pepper, chili peppers and its sauce product by high performance liquidand gas chromatography-tandem mass spectrometry. Food Chem. 2019, 279, 237–245. [CrossRef] [PubMed]
22. Zhou, Y.R.; Lian, Y.J.; Sun, X.; Fu, L.; Duan, S.R.; Shang, C.F.; Jia, X.X.; Wu, Y.N.; Wang, M.L. Determination of 20perfluoroalkyl substances in greenhouse vegetables with a modified one-step pretreatment approach coupledwith ultra performance liquid chromatography tandem mass spectrometry(UPLC-MS-MS). Chemosphere2019, 227, 470–479. [CrossRef] [PubMed]
23. Hua, J.; Fayyaz, A.; Song, H.; Tufail, M.R.; Gai, Y. Development of a method Sin-QuEChERS for the determinationof multiple pesticide residues in oilseed samples. Qual. Assur. Saf. Crop. 2019, 11, 1–6. [CrossRef]
24. Ribeiro Begnini Konatu, F.; Sales Fontes Jardim, I.C. Development and validation of an analytical method formultiresidue determination of pesticides in lettuce using QuEChERS-UHPLC-MS/MS. J. Sep. Sci. 2018, 41,1726–1733. [CrossRef] [PubMed]
Molecules 2020, 25, 3391 12 of 12
25. Zou, N.; Han, Y.; Li, Y.; Qin, Y.; Gu, K.; Zhang, J.; Pan, C.; Li, X. Multiresidue Method for Determination of183 Pesticide Residues in Leeks by Rapid Multiplug Filtration Cleanup and Gas Chromatography-TandemMass Spectrometry. J. Agric. Food Chem. 2016, 64, 6061–6070. [CrossRef] [PubMed]
26. Guan, W.; Li, C.; Liu, X.; Zhou, S.; Ma, Y. Graphene as dispersive solidphase extraction materials forpesticides LC-MS/MS multi-residue analysis in leek, onion and garlic. Food Add. Contam. A 2014, 31, 250–261.[CrossRef]
27. Qin, Y.; Zhao, P.; Fan, S.; Han, Y.; Li, Y.; Zou, N.; Song, S.; Zhang, Y.; Li, F.; Li, X.; et al. The comparison ofdispersive solid phase extraction and multi-plug filtration cleanup method based on multi-walled carbonnanotubes for pesticides multi-residue analysis by liquid chromatography tandem mass spectrometry.J. Chromatogr. A 2015, 1385, 1–11. [CrossRef]
28. China, National Food Safety Standard—Maximum Residue Limits for Pesticides in Food (GB 2763-2019); ChinaAgriculture Press: Beijing, China, 2019.
29. Codex Allimentarius Commission. Pesticide Database—Maximum Residue Limits. Available online: http://www.fao.org/fao-who-codexalimentarius/codex-texts/dbs/pestres/pesticides/en/ (accessed on 17 July 2020).
30. European Commission. EU Pesticides Database—Pesticide Residues. Available online: https://ec.europa.eu/food/plant/pesticides/eu-pesticides-database/public/?event=pesticide.residue.selection&language=EN(accessed on 17 July 2020).
31. Guidance Document on Analytical Quality Control and Method Validation Procedures for Pesticide Residues andAnalysis in Food and Feed, SANTE/11813/2017; European Commission Directorate General for Health and FoodSafety: Brussels, Belgium, 22 November 2017.
32. Zhu, Z.W.; Zhang, W.Z.; Chen, S.; Huang, Z.L.; Tang, L.J.; Cao, J.; Luo, C.Y. Determination of 51 kinds ofpesticide residues in 3 kinds of substrates (rice, garlic chives and tea) by gas chromatography-tandem massspectrometry. J. Food Saf. Qual. 2018, 9, 1297–1307.
33. Ying, X.H.; Xu, X.; Hu, M.J.; Zhu, Z.W.; Min, J.; Shi, J.H. Determination of Thirteen OrganophosphatePesticides Residue in Chinese Chive by Capillary Gas Chromatography. J. Instrum. Anal. 2009, 28, 1185–1188.
34. Han, Y.; Zou, N.; Song, L.; Li, Y.; Qin, Y.; Liu, S.; Li, X.; Pan, C. Simultaneous determination of 70pesticide residues in leek, leaf lettuce and garland chrysanthemum using modified QuEChERS method withmulti-walled carbon nanotubes as reversed-dispersive solid-phase extraction materials. J. Chromatogr. BAnalyt. Technol. Biomed. Life Sci. 2015, 1005, 56–64. [CrossRef]
35. Ribeiro Begnini Konatu, F.; Breitkreitz, M.C.; Sales Fontes Jardim, I.C. Revisiting quick, easy, cheap, effective,rugged, and safe parameters for sample preparation in pesticide residue analysis of lettuce by liquidchromatography-tandem mass spectrometry. J. Chromatogr. A 2017, 1482, 11–22. [CrossRef] [PubMed]
Sample Availability: Samples of the compounds are not available from the authors.
© 2020 by the authors. Licensee MDPI, Basel, Switzerland. This article is an open accessarticle distributed under the terms and conditions of the Creative Commons Attribution(CC BY) license (http://creativecommons.org/licenses/by/4.0/).