Multi-class veterinary drugs analyses of QuEChERS extracts ...
13
APPLICATION NOTE 66000 Multi-class veterinary drugs analyses of QuEChERS extracts using an automated online μSPE cleanup coupled to LC-MS/MS A sample preparation approach often applied to veterinary drug screening in animal tissues is QuEChERS (quick, easy, cheap, effective, rugged, and safe) extraction. 1 This process involves a liquid-solid extraction of the sample with acetonitrile and salts. After the extraction, sample cleanup is often preferred. One common cleanup approach is dispersive solid phase extraction (dSPE), which involves adding a fixed amount of a powdered reagent (such as C18 or PSA) to the extract, vortexing for several minutes, then centrifugation and transfer into an autosampler vial. A second approach is solid phase extraction (SPE), in which the extract is passed through a sorbent material contained in a cartridge using a vacuum manifold. The goal of both cleanup approaches is to avoid the loss of target analytes whilst removing as many matrix co-extractives as possible, since they can cause ionization suppression and faster contamination of the LC-MS/MS detection system. Authors: Dwayne Schrunk, Laura E. Burns, Veterinary Diagnostic Laboratory, Iowa State University; Ed George, Charles Yang, Cristina Jacob, Thermo Fisher Scientific, San Jose, CA, USA; Jonathan Beck, Tom Flug, CTC Analytics Keywords: Veterinary drug residue analysis, QuEChERS, Online µSPE, LC-MS/MS, TSQ Altis, Automation, Solvent Sandwich Injection Technique, Auto Calibration Standard Preparation Goal To demonstrate an automated online sample cleanup solution coupled to LC-MS/MS for rapid and robust screening and quantitation of veterinary drug residues in animal tissues. Introduction Veterinary drugs are administered to animals to ensure animal welfare. It is necessary to screen food products for veterinary drug residues at the maximum residue limits (MRL) set by global regulatory agencies. This screening typically involves both identification and quantification of veterinary drugs using LC-MS/MS.
-
Upload
khangminh22 -
Category
Documents
-
view
3 -
download
0
Transcript of Multi-class veterinary drugs analyses of QuEChERS extracts ...

APPLICATION NOTE 66000
Multi-class veterinary drugs analyses of QuEChERS extracts using an automated online μSPE cleanup coupled to LC-MS/MS
A sample preparation approach often applied to veterinary drug screening in animal tissues is QuEChERS (quick, easy, cheap, effective, rugged, and safe) extraction.1 This process involves a liquid-solid extraction of the sample with acetonitrile and salts. After the extraction, sample cleanup is often preferred. One common cleanup approach is dispersive solid phase extraction (dSPE), which involves adding a fixed amount of a powdered reagent (such as C18 or PSA) to the extract, vortexing for several minutes, then centrifugation and transfer into an autosampler vial. A second approach is solid phase extraction (SPE), in which the extract is passed through a sorbent material contained in a cartridge using a vacuum manifold. The goal of both cleanup approaches is to avoid the loss of target analytes whilst removing as many matrix co-extractives as possible, since they can cause ionization suppression and faster contamination of the LC-MS/MS detection system.
Authors: Dwayne Schrunk, Laura E. Burns, Veterinary Diagnostic Laboratory, Iowa State University; Ed George, Charles Yang, Cristina Jacob, Thermo Fisher Scientific, San Jose, CA, USA; Jonathan Beck, Tom Flug, CTC Analytics
Keywords: Veterinary drug residue analysis, QuEChERS, Online µSPE, LC-MS/MS, TSQ Altis, Automation, Solvent Sandwich Injection Technique, Auto Calibration Standard Preparation
GoalTo demonstrate an automated online sample cleanup solution coupled to LC-MS/MS for rapid and robust screening and quantitation of veterinary drug residues in animal tissues.
IntroductionVeterinary drugs are administered to animals to ensure animal welfare. It is necessary to screen food products for veterinary drug residues at the maximum residue limits (MRL) set by global regulatory agencies. This screening typically involves both identification and quantification of veterinary drugs using LC-MS/MS.

2
The dSPE technique requires laboratory technicians to deal with weighing and dispensing reagents into labeled tubes, vortexing, centrifugation, and finally filtration. If using SPE, the extraction flow rate must be carefully controlled by constant monitoring with a manual vacuum manifold. As a result, errors will be made and the overall method extraction precision can be impacted, especially for novice technicians learning the procedure in the lab. An automated, online workflow to address the cleanup procedure required for QuEChERS extract will reduce the potential for errors, save time as well as allow use of lower volumes of solvents and materials compared to manual approaches.2
This application note describes a fully automated approach to online cleanup of QuEChERS extracts of animal tissues for LC-amenable veterinary drugs, based on the use of μSPE cartridges. These μSPE cartridges are compatible with the Thermo Scientific™ TriPlus™ RSH μSPE autosampler, which was coupled to a Thermo Scientific™ Vanquish™ Flex binary UHPLC system interfaced with a Thermo Scientific™ TSQ Altis™ triple quadrupole mass spectrometer. Bovine muscle, liver, and kidney extracts were selected as matrices for evaluation of the automated μSPE-LC-MS/MS methods. A total of 103 veterinary drug residues representing a variety of compound classes were spiked into bovine muscle, liver or kidney extracts to evaluate the automated µSPE-LC-MS/MS method.
ExperimentalSamples and extractionBovine muscle samples were purchased at a local grocery store. Bovine liver and kidney samples were obtained through the Veterinary Diagnostic Laboratory at Iowa State University (ISU VDL). All tissues were homogenized using a laboratory blender. Five grams of tissue was added to a 50 mL Falcon tube. Next, 0.5 mL of 0.2 M ammonium oxalate/EDTA solution was added to the tube followed by acetonitrile to bring the total volume to 15 mL. The tubes were shaken at 2500 rpm on a Fisherbrand™ Digital MultiTube Vortexer for 10 minutes. Matrix extracted standards (MES) were prepared by spiking a mix of 103 veterinary drug residues prior to QuEChERS extraction into bovine muscle, kidney, and liver at different concentration levels. Matrix matched standards (MMS) were prepared by spiking the same mixture of veterinary drugs into extracts after the cleanup step. The concentration levels investigated were from 1 to 100 ng/g. All standards were cleaned up using either a manual dSPE and/or two different automated µSPE workflows. Samples were transferred to LC-MS/MS autosampler vials prior to analysis.
Dispersive SPE (dSPE) and Micro SPE (µSPE) CleanupExtract cleanup approaches included manual dispersive solid phase extraction (dSPE), as well as two fully automated online µSPE cartridge cleanups utilizing the robotic TriPlus RSH μSPE autosampler. For the dSPE experiments, 500 mg CEC18 was added to the supernatant and shaken on a vortexer for 15 minutes, and then centrifuged at 3000 rpm for 10 minutes. These were then placed into the autosampler for injection.
Automated μSPE cleanup was performed using the robotic TriPlus RSH μSPE autosampler system (P/N C0950-01-00611), based on a PAL3-RTC autosampler from CTC Analytics (CTC Analytics AG, Zwingen, Switzerland). The configuration of the system modules required to perform the automated μSPE cleanup is shown in Figure 1. Thermo Scientific™ TraceFinder™ software was used for system control. Two miniaturized SPE cartridges, each with a different sorbent, were developed and optimized based upon experiments performed earlier at Iowa State University or the PAL System North America Regional Office laboratory located in Lake Elmo, MN. The result were two µSPE cartridges for further evaluation as described in this application note: a) μSPE, QuEChERS blend for LC, P/N 60101-15VDC18 containing 15 mg CEC18 and b) μSPE, QuEChERS blend for LC, P/N 60101-10VDHPR containing 10 mg Thermo Scientific™ HyperSep™ Retain-PEP material (HRP). A new μSPE cartridge design used in these experiments is described in Figure 2. A leak-proof seal is obtained when the needle is compressed by the PAL into the cartridge, which allows the syringe to push sample extracts or solvents through the sorbent bed with a constant force. Essentially, the syringe replaces the vacuum system of the classical SPE methodology working at defined flow rates. Procedurally, uncleaned QuEChERS extracts were transferred into 2 mL autosampler vials and placed into a 54-position tray (sample tray). The corresponding number of collection vials [500 μL, fused insert snap-top (P/N C4011-LV1) sealed with star-slit snap-it caps (P/N C4011-59)] were placed into a second 54-position tray (eluate tray). Uncleaned extracts were loaded onto the cartridges according to the steps shown in Tables 1 and 2 for the CEC18 and HRP μSPE cartridges, respectively, and the extracted samples were injected directly into the LC-MS/MS system.

3
LC-MS/MS analysisThe LC-MS/MS system comprised a Vanquish Flex UHPLC binary system interfaced with a TSQ Altis triple quadrupole mass spectrometer equipped with a H-ESI ionization probe. Chromatographic separation was carried out on a Thermo Scientific™ Accucore™ VDX column, 100 mm × 2.1 mm × 2.6 μm (P/N VDX-102130) at a temperature of 40 ˚C, using a gradient elution of 0.05 % formic acid in water (mobile phase A) and 1:1 methanol : acetonitrile with 0.05% formic acid and 5% water (mobile phase B). Table 3 shows HPLC gradient conditions. The mass spectrometer was operated in both positive and negative ionization modes, with the optimized parameters shown in Table 4. A solvent sandwich injection technique (Figure 3a) was used for injection of all samples, which greatly improved the LC peak shapes of the early eluting compounds in the analysis. The sandwich injection contained 20 µL of mobile phase A on each side of a 2 µL volume of sample that is in pure acetonitrile. A rear air gap of 3 µL and a front air gap of 1 µL was used.
Figure 2. Automated μSPE cartridge. The leak-proof concept shown here requires no rubber seals, minimized dead volume and increases sorbent bed pressure rating.
Figure 1. TriPlus RSH with μSPE capabilities system: a) TriPlus RSH modules required to perform the μSPE cleanup procedure and b) coupled to LC-MS/MS for automated on-line injection.
Needle Guide
Sorbent Bed
A B
Table 1. Steps for automated online μSPE cleanup method with LC injection using the CEC18 cartridge
Step Action
1 Aspirate 300 µL of QuECheRS extract into the syringe
2 Move μSPE cartridge to elution tray
3 Load 300 μL QuECheRS extract onto μSPE cartridge
4 Perform μSPE -push extract through cartridge
5 Move-dispose of cartridge to waste bucket
6 Change to LC/MS injection tool
7 Perform sandwich injection
8 Change to prep syringe for next sample
9 Proceed with prep-ahead for next extract sample upon ready Signal
Table 2. Steps for automated online μSPE cleanup method with LC injection using the HyperSep Retain-PEP cartridge
Step Action
1 Prep syringe with elution solvent
2 Condition μSPE with 300 μL methanol
3 Condition μSPE with 300 μL water
4 Condition μSPE with 100 μL QuEChERS extract
5 Move μSPE cartridge to elution tray
6 Load 300 μL QuEChERS extract onto μSPE cartridge
7 Perform μSPE-push extract through cartridge
8 Move-dispose of cartridge to waste bucket
9 Change to LC/MS injection tool
10 Perform sandwich injection
11 Change to prep syringe for next sample
12Proceed with prep-ahead for next extract sample upon ready Signal
Table 3. LC Gradient Conditions
Time (min) %B Flow rate (mL/min)
0 2 0.3
2 2 0.3
3 20 0.3
11 100 0.3
13 100 0.4
14.4 100 0.4
14.5 2 0.35
16 2 0.3
20 2 0.3

4
Figure 3. a) Solvent sandwich is an injection procedure which dilutes/mixes the sample in the needle/capillary with two segments of solvent; b) Peak shapes with solvent sandwich injection technique; c) Peak shapes for a 2 µL pure acetonitrile injection.
A B
C
Data ProcessingThe acquired data were processed using TraceFinder software and Thermo Scientific™ Freestyle™ software was used for qualitative analysis.
Table 4. MS Parameter Settings
Parameter Setting
Spray voltage 3500 V, positive ionization mode2500 V, negative ionization mode
Sheath gas 50 arb
Auxiliary gas 13 arb
Sweep gas 1 arb
Ion transfer tube temperature 310 °C
Vaporizer temperature 350 °C
Cycle time for scheduled SRM transitions 0.35 s
Q1 resolution 0.7 Da
Q3 resolution 1.2 Da
CID gas 1.5 mTorr
5
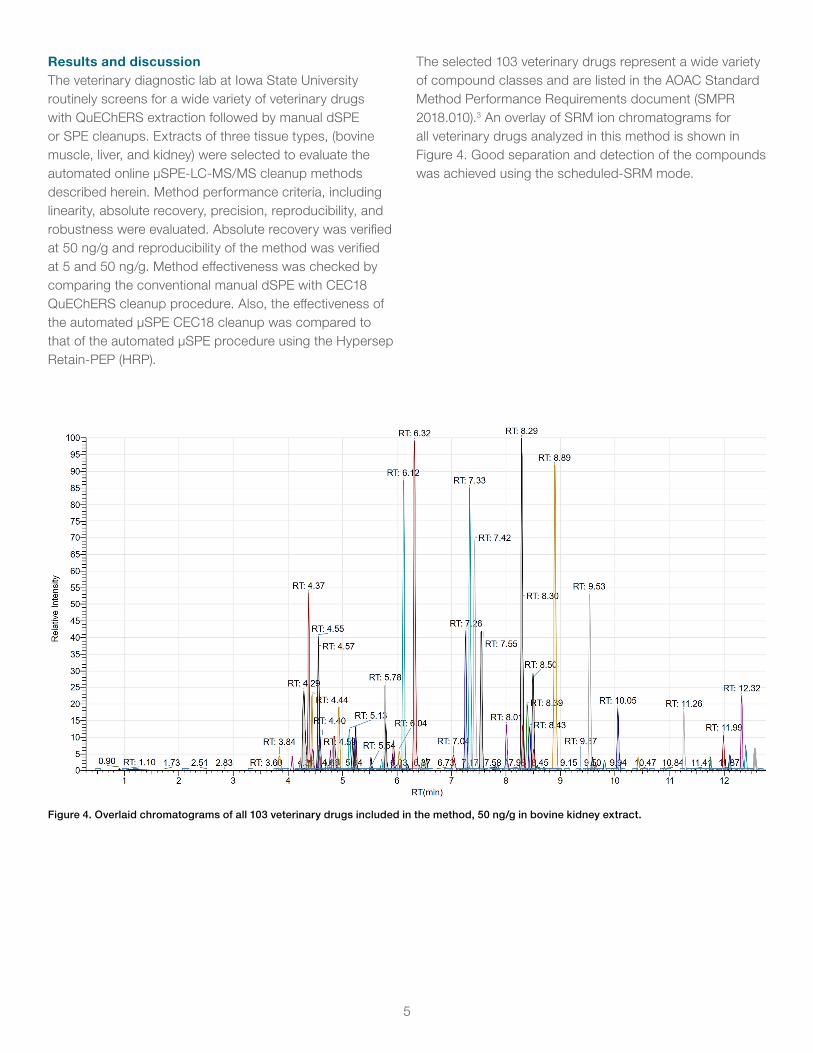
Results and discussionThe veterinary diagnostic lab at Iowa State University routinely screens for a wide variety of veterinary drugs with QuEChERS extraction followed by manual dSPE or SPE cleanups. Extracts of three tissue types, (bovine muscle, liver, and kidney) were selected to evaluate the automated online μSPE-LC-MS/MS cleanup methods described herein. Method performance criteria, including linearity, absolute recovery, precision, reproducibility, and robustness were evaluated. Absolute recovery was verified at 50 ng/g and reproducibility of the method was verified at 5 and 50 ng/g. Method effectiveness was checked by comparing the conventional manual dSPE with CEC18 QuEChERS cleanup procedure. Also, the effectiveness of the automated μSPE CEC18 cleanup was compared to that of the automated μSPE procedure using the Hypersep Retain-PEP (HRP).
The selected 103 veterinary drugs represent a wide variety of compound classes and are listed in the AOAC Standard Method Performance Requirements document (SMPR 2018.010).3 An overlay of SRM ion chromatograms for all veterinary drugs analyzed in this method is shown in Figure 4. Good separation and detection of the compounds was achieved using the scheduled-SRM mode.
Figure 4. Overlaid chromatograms of all 103 veterinary drugs included in the method, 50 ng/g in bovine kidney extract.

6
μSPE cleanup effectiveness and matrix effectsMatrix effects in electrospray ionization are typically manifested by a lower signal of the analyte in the matrix than in pure solvent.4 Signal suppression occurs due to competition for charge between molecules during the ionization process. Therefore, fewer molecules of the analyte are ionized than in a pure solvent. Matrix co-extractives from tissue extracts can also passivate the analytical column, and in some cases enhance the signal of analytes relative to those in pure solvents. Ionized matrix components not monitored in the SRM chromatograms, but present in the background, can affect accuracy and sensitivity not only for the current injection, but also carry over into subsequent injections. As an example, LC-high resolution accurate mass (HRAM) data was acquired in full scan for a bovine muscle extract to compare a non-cleaned up sample total ion chromatogram (TIC) to the same sample cleaned up with the automated CEC18 μSPE procedure. As can be seen in Figure 5, a large amount of matrix is removed between 11 and 13 minutes by the cleanup.
Matrix effects were also evaluated by comparing the responses of veterinary drug standards prepared in solvent (neat solution) and in the different sample matrices. Figure 6 is a comparison of % matrix effect (ME) across the various tissue extract types and cleanup techniques. Percent matrix effect is rated as low (ME<20%), medium (20<ME<50), or high (ME>50). For all combinations, most analytes showed low to moderate ME (70–80% of compounds). For ME>50%, matrix enhancement was observed to be the primary cause (over 95% of compounds in this category).
Figure 5. Bovine muscle extract analyzed by LC-HRAM MS in full scan. Top trace is extract injected without cleanup, bottom is extract cleaned up with the automated µSPE procedure containing CEC 18.
Figure 6: Summary of % matrix effects (ME) for the three tissue types and applied cleanup techniques.
01020304050607080
Kidney uCEC18 Kidney dSPE Kidney HRP Liver uCEC18 Liver dSPE Liver HRP Muscle uCEC18 Muscle dSPE Muscle HRP
% V
eter
inar
y D
rugs
Tissue Type/Cleanup Technique
Matrix E�ect in Tissue Samples
ME < 20% 20<ME<50 ME>50

7
Calibration linearityFor screening and quantitation of the veterinary drugs, calibration levels using matrix extracted standards (MES) and/or matrix matched standards (MMS) were prepared in all three tissue types. Calibration standards ranging from 1 to 100 ng/g were analyzed and excellent linearity was achieved, with coefficient of determination R2>0.99 for most compounds in the three different extracts. For screening workflow, the Veterinary Diagnostic Lab at Iowa State University created calibration curves using an automatic calibration script on the TriPlus RSH μSPE system. In this case, the analyst prepared a stock standard in solvent and used the blank QuEChERS matrix as a diluent. The system proceeds to prepare all specified standard levels and mixes them before passing them through the μSPE cartridge and subsequent injection into the LC-MS/MS system. This saves time and reduces potential handling and labeling errors in the lab. Figure 7 shows representative calibration curves for sarafloxacin and sulfamethazine in bovine extract. The MES curves were prepared manually outside of the autosampler (procedural calibration) and the MMS curves were prepared using the automated calibration script.
μSPE method performanceThe absolute recoveries of 103 veterinary drugs using the cleanups described above (manual dSPE, CEC18-μSPE, and HRP-μSPE) were evaluated in bovine muscle, liver, and kidney tissues. For each experiment, five biological replicates were prepared as matrix-extracted spikes (MES) containing all the target residues at 50 ng/g. The MES were compared to standards spiked into the cleaned samples (MMS) for each of the different cleanups at the same concentrations. Recovery was calculated as the ratio of the average peak area response of the MES to the average peak area response of the MMS. Absolute recoveries within 30–140% with corresponding %RSDs less than or equal to 20% are required for satisfactory method validation according to the EU SANTE 12682/2019 document for pesticides.5
Figure 7. MES and MMS curves in bovine muscle with µSPE CEC18. The MES curves on the left side of the figure were prepared manually by the lab technician. The MMS curves on the right right side of the figure were prepared using the automated calibration script in the TriPlus RHS autosampler.
MES Manual Prep
MES Manual Prep
MMS Auto Prep
MMS Auto Prep

8
Recoveries within this range were achieved for over 95% of the target veterinary drugs in the three tissue extract types for both the manual CEC18 dSPE procedure and the automated online cleanup using the miniaturized CEC18 μSPE cartridges. (Figures 8 and 9). Table 5 summarizes the absolute % spike recoveries and %RSD values for all three cleanup techniques in all three matrices. Using the HRP material, it was noted that the recoveries of rafoxanide, closantel, and lasalocid are very poor (typically less than 5%). This is likely due to retention of these analytes on the sorbent during the cleanup, and we are undergoing further study to determine the root cause. Some of the compounds also demonstrated low sporadic recoveries with high %RSD in some matrices. However, these are easily detected at less than 5 ng/g in the bovine extracts.
A precision study was also carried out using the CEC18 μSPE miniaturized cartridge cleanup in all three tissue types. MES calibration curves were prepared at calibration levels of 0.5, 1, 5, 10, 25, 50, 70, and 100 ng/g, along with five biological replicates of each matrix prepared at 5 and 50 ng/g. Excellent precision of less than 20% RSD and recovery between 70 and 120% were obtained for over 90% of the veterinary drugs in each matrix at both concentration levels. An example is shown in Figure 10, with recoveries and %RSD for bovine kidney tissue extracts cleaned up with the CEC18-μSPE miniaturized cartridges.
0.0
10.0
20.0
30.0
40.0
50.0
0 10 20 30 40 50 60 70 80 90 100 110 120 130 140 150 160 170 180 190 200
% R
SD
% Recovery
CEC18-dSPE Muscle
0.0
10.0
20.0
30.0
40.0
50.0
0 10 20 30 40 50 60 70 80 90 100 110 120 130 140 150 160 170 180 190 200
% R
SD
% Recovery
CEC18-dSPE Liver
0.0
10.0
20.0
30.0
40.0
50.0
0 10 20 30 40 50 60 70 80 90 100 110 120 130 140 150 160 170 180 190 200
% R
SD
% Recovery
CEC18-dSPE Kidney
0.0
10.0
20.0
30.0
40.0
50.0
0 10 20 30 40 50 60 70 80 90 100 110 120 130 140 150 160 170 180 190 200
% R
SD
% Recovery
CEC18-µSPE Muscle
0.0
10.0
20.0
30.0
40.0
50.0
0 10 20 30 40 50 60 70 80 90 100 110 120 130 140 150 160 170 180 190 200
% R
SD
% Recovery
CEC18-µSPE Liver
0.0
10.0
20.0
30.0
40.0
50.0
0 10 20 30 40 50 60 70 80 90 100 110 120 130 140 150 160 170 180 190 200
% R
SD
% Recovery
CEC18-µSPE Kidney
Figure 8. % Absolute recoveries vs %RSD in bovine muscle, liver, and kidney tissue extracts at 50 ng/g (N=5). The red boxes represent recoveries within 30–140% with %RSD <20%.
Figure 9. % Absolute recoveries vs %RSD in bovine muscle, liver, and kidney tissue extracts at 50 ng/g (N=5). The red boxes represent recoveries within 30–140% with %RSD <20%.

9
Table 5. LC-MS/MS % absolute spike recoveries in different animal tissues at 50 ng/g using both automated μSPE and manual d-SPE. Procedural standard spikes (MES) were compared to standards spiked into the cleaned samples (MMS) for each of the different cleanups at 50 ng/g.
Compound
Bovine Muscle Bovine Liver Bovine Kidney
dSPE-CEC18 µSPE-CEC18 µSPE-HRP dSPE-CEC18 µSPE-CEC18 µSPE-HRP dSPE-CEC18 µSPE-CEC18 µSPE-HRP
% Rec %RSD % Rec %RSD % Rec %RSD % Rec %RSD % Rec %RSD % Rec %RSD % Rec %RSD % Rec %RSD % Rec %RSD
5-hydroxyflunixin 71 3.4 66 8.4 ** 23.2 81 3.3 79 3.6 58 1.3 86 2.4 78 3.5 74 8.1
Abamectin B1a 85 11.5 103 8.6 112 9.7 83 7.9 74 11.4 89 4.9 80 8.2 54 8.3 111 13.4
Albendazole 97 5.2 90 4.7 81 4.8 83 6.6 78 3.8 82 4.1 100 2.8 81 2.4 94 11.5
Albendazole 2-aminosulfone
93 3.8 85 4.3 92 3.3 85 2.2 81 8.5 85 2.9 93 2.7 81 5.8 98 7.5
Albendazole sulfone 115 11.2 105 3.6 101 5.2 93 1.4 105 0.7 89 1.9 96 18.3 93 2.1 104 9.0
Albendazole sulfoxide
96 14.5 101 2.5 108 3.5 79 15.0 105 1.0 99 1.1 87 12.4 92 1.1 112 7.6
Amoxicillin 30 7.8 28 7.3 23 8.6 39 4.5 42 3.9 42 6.5 35 10.5 53 3.1 57 5.1
Ampicillin 48 8.3 47 8.5 40 5.2 52 3.4 54 4.2 57 3.2 54 9.6 60 5.0 74 6.5
Betamethazone 100 4.1 87 9.3 97 10.0 89 7.7 84 2.9 84 2.2 92 6.7 84 4.3 100 9.6
Carazolol 97 4.3 90 4.0 105 4.9 85 5.2 96 1.3 96 1.8 94 1.2 92 2.5 109 7.0
Carprofen 88 4.8 91 3.8 107 4.6 79 5.1 83 2.3 98 3.5 87 2.5 79 2.3 107 7.7
Cefalexin 44 14.8 44 19.4 58 13.4 48 4.7 59 10.1 81 8.4 46 6.2 83 12.7 107 4.7
Cefapirin 78 5.6 75 3.7 94 3.5 79 2.3 88 4.9 93 3.3 87 4.2 76 5.8 106 11.5
Cefazolin 82 9.2 83 9.2 98 9.1 87 7.5 81 4.1 109 9.3 91 7.1 67 33.2 127 13.8
Cefoperazone 82 7.2 83 10.7 118 2.9 93 6.4 105 6.9 114 11.2 95 7.0 86 7.2 111 13.5
Cefquinome 92 17.9 80 6.1 161 25.3 75 10.5 67 8.8 132 7.5 95 11.9 86 16.2 136 34.8
Ceftiofur 86 6.8 75 7.2 91 4.1 85 2.4 89 1.5 91 3.6 92 3.6 77 1.2 107 8.3
Chlortetracycline 61 8.6 60 10.6 67 10.3 69 4.6 73 13.9 74 5.1 71 6.6 77 5.3 78 9.2
Ciprofloxacin 74 2.4 68 7.8 78 2.9 70 3.9 80 1.7 79 7.0 77 4.4 81 3.9 94 7.5
Clenbuterol 96 4.6 90 4.6 108 1.4 83 3.0 86 2.8 100 2.1 94 3.3 87 2.5 108 3.9
Clopidol 94 4.9 82 5.0 103 5.7 85 3.4 85 9.9 99 4.2 93 3.4 83 8.7 108 2.7
Clorsulon 92 3.1 86 4.5 108 3.5 90 2.7 102 1.5 96 2.4 99 4.3 91 1.6 108 4.0
Closantel 71 11.9 71 13.7 0 0.0 92 20.1 86 2.0 2 NA 99 20.7 66 2.7 0 NA
Cloxacillin 92 4.6 90 3.2 93 2.4 80 2.5 88 3.7 89 3.3 92 2.9 88 6.2 102 5.0
Danofloxacin 79 6.0 65 11.6 74 7.9 77 3.9 83 2.9 60 2.1 84 3.9 79 0.8 79 20.7
Decoquinate 77 10.6 74 8.1 106 12.4 80 18.9 52 14.5 122 2.6 91 16.7 43 13.9 100 18.9
Dexamethasone 93 2.1 92 5.8 94 2.9 89 2.7 87 3.1 93 3.1 95 2.8 92 3.3 106 8.2
Diclazuril 94 4.2 88 4.3 125 3.9 90 8.5 97 1.3 108 1.6 98 8.8 89 1.5 111 10.4
Diclofenac 90 5.0 82 6.9 71 6.8 78 6.6 58 5.3 97 3.8 88 4.5 62 4.2 89 3.8
Dicloxacillin 94 5.0 89 4.1 97 3.7 83 4.1 93 2.0 92 2.3 94 2.3 92 1.4 103 6.8
Difloxacin 91 4.0 94 5.6 92 3.5 85 3.6 83 4.4 86 3.8 92 3.5 77 3.0 86 8.2
Doramectin 89 8.5 98 15.5 89 10.4 91 15.9 63 16.0 99 8.0 83 3.7 43 14.6 99 12.8
Doxycycline 62 3.6 58 7.1 61 3.5 63 4.5 70 1.4 62 2.9 67 5.5 70 0.9 84 7.6
Emamectin B1a 91 10.2 85 6.7 112 8.5 89 12.3 56 12.1 92 1.5 94 20.6 62 5.7 105 25.4
Enrofloxacin 87 3.8 78 6.0 83 4.5 81 2.8 80 4.9 81 1.9 89 4.1 70 1.9 97 7.1
Eprinomectin B1a 92 11.2 107 13.7 107 7.0 94 12.9 62 3.8 105 2.1 87 25.5 63 4.8 109 16.7
Erythromycin 90 4.8 85 7.7 105 9.0 80 4.2 90 0.5 98 2.4 99 4.4 89 0.8 112 12.7
Febantel 100 7.2 90 5.0 112 9.3 89 2.5 89 1.0 105 3.3 101 3.1 79 1.3 109 11.8
Fenbendazole 94 4.5 86 7.1 90 2.4 88 3.2 78 1.8 91 3.3 100 8.2 78 2.3 97 10.1
Fluazuron 82 11.3 90 15.2 91 9.1 95 13.7 82 3.0 92 4.8 80 8.6 75 3.5 81 22.9
Flubendazole 98 3.0 90 4.9 94 2.5 88 3.8 94 1.8 90 1.9 103 3.1 84 2.2 106 11.5
Flumequine 97 3.2 85 6.7 84 5.2 91 2.3 93 3.0 81 2.1 99 2.8 79 1.8 96 22.9
Flunixin 94 4.5 90 2.2 30 23.0 86 1.9 85 1.7 90 3.0 94 3.6 89 0.8 76 3.3
Gamithromycin 95 6.8 92 8.0 103 11.1 79 15.2 84 4.3 98 3.2 97 7.8 88 2.1 103 8.3
Halofuginone 78 4.6 74 3.2 81 8.1 66 2.1 74 3.7 80 4.4 75 1.9 77 3.1 89 8.2
Ivermectin B1a 72 14.3 75 19.8 106 12.9 86 4.8 56 16.0 102 6.1 85 19.0 91 13.5 107 22.2
Josamycin 102 14.7 93 9.2 105 4.1 97 11.0 92 2.2 107 3.9 104 10.7 69 2.6 109 13.8

10
Table 5. Continued
Compound
Bovine Muscle Bovine Liver Bovine Kidney
dSPE-CEC18 µSPE-CEC18 µSPE-HRP dSPE-CEC18 µSPE-CEC18 µSPE-HRP dSPE-CEC18 µSPE-CEC18 µSPE-HRP
% Rec %RSD % Rec %RSD % Rec %RSD % Rec %RSD % Rec %RSD % Rec %RSD % Rec %RSD % Rec %RSD % Rec %RSD
Ketoprofen 93 3.5 84 4.0 98 2.7 83 3.9 91 2.2 93 2.4 93 1.7 87 1.1 106 6.4
Lasalocid 61 11.7 91 13.6 0 0.0 77 4.7 42 17.0 80 NA 79 16.9 52 16.0 40 NA
Levamisole 93 3.1 85 4.4 106 2.3 84 1.8 80 7.9 104 1.4 93 3.4 83 7.4 104 2.9
Lincomycin 68 3.3 64 4.1 68 3.4 69 2.3 79 13.4 73 1.9 74 5.7 82 11.9 87 4.5
Maduramicin 62 11.4 77 13.6 100 8.8 57 7.2 21 43.1 80 7.5 56 20.3 24 19.4 95 34.0
Marbofloxacin 82 6.2 74 9.0 89 4.4 75 2.9 70 11.8 87 2.9 86 4.2 64 6.1 97 2.6
Mebendazole 98 2.8 89 3.3 95 3.1 87 2.6 94 0.8 90 2.4 100 3.8 86 0.8 106 10.6
Meloxicam 97 3.9 58 3.6 80 9.8 102 4.1 104 3.6 89 3.2 118 5.7 91 1.4 107 4.8
Monensin 79 13.2 93 18.9 125 15.8 86 10.4 58 35.5 172 7.3 59 10.6 69 15.5 107 22.6
Moxidectin 76 8.2 85 7.7 91 9.1 87 21.0 57 19.8 128 5.6 86 16.5 64 14.5 89 12.5
Nafcillin 93 4.5 84 3.9 91 2.0 84 3.3 96 1.7 88 1.9 95 1.4 96 1.6 102 8.9
Nitroxynil 89 7.1 82 5.6 38 18.6 84 1.8 95 1.9 91 2.7 95 3.0 83 1.4 72 8.8
Oxacillin 91 9.8 94 6.4 100 4.3 89 14.3 93 15.5 96 6.7 88 17.1 97 6.1 113 9.2
Oxibendazole 97 4.5 89 5.6 96 6.0 86 4.5 88 3.8 92 1.7 99 4.6 85 0.9 104 2.7
Oxolinic acid 97 5.2 86 7.5 87 9.8 90 3.7 95 1.0 88 3.2 98 4.1 83 1.0 101 10.0
Oxytetracycline 56 7.5 46 10.6 52 7.4 59 1.7 66 3.0 64 6.2 63 3.7 72 2.9 87 9.1
Penicillin G 81 3.1 80 2.2 86 1.8 84 4.8 91 2.3 84 2.4 90 3.0 87 1.8 95 9.6
Penicillin V 88 4.2 87 4.2 83 4.1 82 2.3 94 1.6 82 3.7 90 4.9 88 1.1 98 11.4
Pirlimycin 62 3.9 58 4.6 71 4.9 59 2.5 68 1.5 71 3.1 70 2.9 77 2.1 85 3.8
Ractopamine 87 5.9 86 6.9 102 5.7 85 2.7 98 1.7 96 4.8 103 4.1 91 1.7 106 4.7
Rafoxanide 56 13.5 51 16.1 0 0.0 87 12.9 64 8.3 1 NA 93 16.8 55 7.5 0 NA
Rifaximin 89 12.9 83 9.7 14 31.9 88 9.3 90 0.7 77 13.5 99 7.8 87 1.2 108 14.0
Sarafloxacin 86 6.1 89 6.6 89 4.1 81 2.8 86 1.8 87 2.3 88 4.3 82 3.9 85 7.1
Spiramycin 90 3.2 87 11.6 102 3.5 139 9.9 83 3.3 113 7.1 109 4.8 19 19.7 104 19.0
Sulfachlorpyridazine 97 6.5 103 4.8 96 3.6 86 2.7 106 3.8 85 3.7 80 0.0 93 2.4 100 9.2
Sulfadiazine 94 1.9 89 5.3 32 3.6 92 4.9 94 11.9 27 2.7 98 4.9 85 13.9 30 12.4
Sulfadimethoxine 97 5.3 84 5.7 71 6.0 95 2.5 98 2.3 68 4.3 102 4.6 88 2.0 83 13.1
Sulfadoxine 88 6.1 84 6.9 93 8.0 89 2.0 96 1.9 84 1.5 100 3.8 88 1.8 95 8.8
Sulfaguanidine 91 2.9 74 4.4 89 3.6 87 2.0 91 1.2 75 2.3 95 1.8 73 2.0 84 5.1
Sulfamerazine 93 12.9 105 2.8 88 6.4 82 20.6 108 4.2 85 3.9 77 11.5 100 2.0 107 6.1
Sulfamethazine 95 3.3 86 5.8 96 3.7 88 1.5 102 2.3 91 2.3 100 5.9 93 1.5 131 14.1
Sulfamethizole 88 6.5 103 3.5 90 4.1 83 2.5 101 4.1 79 3.2 107 8.1 94 2.8 80 16.2
Sulfamethoxazole 94 2.5 87 6.1 86 1.0 89 3.6 112 4.3 83 3.7 100 4.1 125 3.6 110 13.1
Sulfamethoxy-pyridazine
96 4.0 86 4.2 96 3.4 87 1.7 98 3.8 88 2.5 99 3.1 94 2.9 116 1.5
Sulfamonomethoxine 96 4.1 86 4.2 96 3.4 87 1.7 107 3.2 88 2.5 99 3.1 99 5.2 116 1.5
Sulfamoxole 91 7.7 92 2.9 85 2.1 111 12.7 96 3.8 92 2.0 78 4.6 86 1.7 108 5.3
Sulfanilamide 88 4.7 83 5.8 100 1.4 88 1.9 95 1.6 98 1.3 95 3.1 82 1.7 100 2.3
Sulfapyridine 90 2.7 83 5.4 111 4.7 90 2.1 103 3.7 102 2.5 99 6.6 94 8.4 111 7.5
Sulfaquinoxaline 90 4.9 85 4.4 86 4.1 87 2.4 97 1.6 81 1.8 87 2.0 88 1.7 98 10.5
Sulfathiazole 99 5.9 86 3.8 93 2.2 87 2.2 87 15.4 87 2.5 94 4.3 85 18.7 103 4.3
Sulfisoxazole 91 7.7 92 2.9 85 2.2 88 2.4 96 3.8 92 2.0 78 4.6 86 1.7 108 5.3
Teflubenzuron 83 6.8 105 10.7 95 11.2 95 15.0 84 5.9 84 6.0 100 8.5 66 2.7 85 17.4
Epitetracycline 79 10.1 66 6.2 40 11.2 63 8.5 71 2.9 52 9.0 62 8.2 72 2.5 78 20.5
Tetracycline 64 5.2 67 6.2 59 3.5 66 5.7 68 5.3 70 3.8 69 6.0 76 3.3 83 5.9
Thiabendazole 99 2.5 85 7.8 111 2.8 88 2.9 95 13.1 104 3.4 97 5.0 80 12.9 111 1.9
Thiamphenicol 99 5.8 90 11.1 119 4.1 96 4.2 106 6.9 116 8.6 104 7.1 90 12.9 114 7.9
Tildipirosin 49 5.6 46 19.1 59 7.6 50 12.7 45 21.5 75 6.1 58 8.9 62 5.7 89 11.1
Tilmicosin 92 9.7 93 10.7 106 11.9 80 14.9 81 5.3 98 4.5 98 8.1 89 2.3 104 11.4
Tolfenamic acid 85 7.2 86 9.4 31 16.6 85 14.1 84 3.3 75 5.2 96 17.1 73 1.4 59 29.2

11
Table 5. Continued
Compound
Bovine Muscle Bovine Liver Bovine Kidney
dSPE-CEC18 µSPE-CEC18 µSPE-HRP dSPE-CEC18 µSPE-CEC18 µSPE-HRP dSPE-CEC18 µSPE-CEC18 µSPE-HRP
% Rec %RSD % Rec %RSD % Rec %RSD % Rec %RSD % Rec %RSD % Rec %RSD % Rec %RSD % Rec %RSD % Rec %RSD
Triclabendazole 92 6.3 86 8.1 101 8.1 91 10.3 81 4.5 117 5.0 98 16.6 72 2.7 87 16.3
Trimethoprim 88 3.8 76 11.5 95 7.8 82 4.0 100 8.3 91 2.3 92 6.2 99 9.6 111 8.6
Tulathromycin 61 6.3 48 19.0 77 15.7 49 25.6 28 9.2 84 7.5 58 10.7 63 5.7 87 11.9
Tylosin A 103 10.0 87 10.0 101 14.3 123 9.9 92 0.8 103 5.9 108 5.3 37 12.8 97 9.5
Tylvalosin 102 14.0 98 8.4 115 0.5 100 9.2 93 1.8 127 1.2 110 5.6 66 5.8 115 16.3
Virginiamycin M1 101 6.9 56 4.3 82 8.1 101 5.0 99 1.9 83 3.5 114 4.0 89 2.0 87 12.6
Zilpaterol 66 4.9 60 3.9 67 2.6 67 2.1 72 2.1 75 2.5 71 3.9 76 2.2 89 3.9
Figure 10. a) Recoveries and %RSD for bovine kidney tissue extracts cleaned up with CEC18-μSPE miniaturized cartridges; b) %RSD for bovine kidney tissue extracts cleaned up with CEC18-μSPE miniaturized cartridges. Data represents 5 biological replicates calculated against procedural calibration curves (MES).
0
10
20
30
40
50
0 10 20 30 40 50 60 70 80 90 100 110 120 130 140 150 160 170 180 190 200
Bovine Kidney 5 ng/g CEC18-µSPE
0
10
20
30
40
50
0 10 20 30 40 50 60 70 80 90 100 110 120 130 140 150 160 170 180 190 200
Bovine Kidney 50 ng/g CEC18-µSPE Bovine Kidney 50 ng/g CEC18-µSPE
Bovine Kidney 5 ng/g CEC18-µSPE
0–4.9 5.0–9.9 10.0–19.9 20.0–30.0 >30
0–4.9 5.0–9.9 10.0–19.9 20.0–30.0 >30
A B

12
Overall time savings and μSPE method robustnessThe online automated approach to cleanup QuEChERS extracts using the TriPlus RSH μSPE autosampler saves a tremendous amount of labor, especially for large batches of samples. At the Iowa State Veterinary Diagnostic lab, measurements were made to determine the operator time saved during a batch preparation of 50 samples. For the μSPE-CEC18 workflow, a time savings of up to 4 hours was achieved as compared to the manual dSPE method. For the HRP method, which normally is an SPE procedure requiring a vacuum manifold, over 5 hours is saved. The operators noticed that labeling and moving vials around the lab costs time and is prone to errors. The time savings noted here can even be improved by the autocalibration function mentioned earlier, as this is clearly another key advantage of the system. Finally, this automation provides an easy way to evaluate different cleanup sorbents packed into the miniaturized cartridges, since control of flow rates is crucial, and these settings are easily adjusted in an automated experiment.
The TSQ Altis triple quadrupole mass spectrometer has been operating routinely in the Iowa State Veterinary Diagnostic laboratory for over three years analyzing veterinary drugs in animal tissues and biological fluids. Method robustness enabling increased uptime is the main reason extract cleanup is so important. Figure 11 is an example for two compounds, levamisole and albendazole-2-aminosulfone in bovine muscle extract, cleaned up using the µSPE CEC18 cartridges. The data shows that the response was well within the expected ±20% range for at least 100 consecutive injections without maintenance. At injection 50, the system was set to stand-by for 24 hours to simulate the start-up of a new batch, then resumed to complete the 100 injections, which demonstrates excellent day-to-day reliability and repeatability.
1500000
2500000
3500000
4500000
5500000
6500000
7500000
1 3 5 7 9 11 13 15 17 19 21 23 25 27 29 31 33 35 37 39 41 43 45 47 49 51 53 55 57 59 61 63 65 67 69 71 73 75 77 79 81 83 85 87 89 91 93 95 97 99
Pea
k A
rea
Injection Number
Levamisole in Bovine Muscle–RSD 4.39%
2000000
3000000
4000000
5000000
6000000
7000000
1 3 5 7 9 11 13 15 17 19 21 23 25 27 29 31 33 35 37 39 41 43 45 47 49 51 53 55 57 59 61 63 65 67 69 71 73 75 77 79 81 83 85 87 89 91 93 95 97 99
peak
Are
a
Injection Number
Albendazole-2-aminosulfone in Bovine Muscle—RSD 4.56%
Figure 11. An example for two compounds, levamisole and albendazole 2-aminosulfone in bovine muscle extract, cleaned up using the µSPE CEC18 cartridges. The blue bar represents the point where the system was set into standby for 24 hours, then resuming the analysis of the batch.

ConclusionThe fully automated and online μSPE cleanup workflow with LC-MS/MS described in this application note is a reliable, accurate, reproducible, and robust solution for multi-class veterinary drug screening and quantitation in a variety of animal tissues (muscle, liver, and kidney).
• On-line automation with the μSPE miniaturized cartridges saves time by reducing labor, saving hours during batch sample preparation over manual methods, and reduces the possibility of technician errors. In addition, lab material costs are reduced in terms of lower solvent usage and elimination the dSPE powdered reagents and/or larger SPE extraction cartridges.
• The sandwich injection technique, incorporated in the workflow will reduce sample handling and enable generation of excellent chromatography for analytes present in pure elution solvents, thus avoiding sample dilution or solvent exchange of extracts.
• The automated μSPE cleanup afforded spike recoveries within 30–140% with corresponding %RSDs below 20% for over 95% of the target veterinary drugs in the tissue extracts, and also demonstrated excellent precision and accuracy when calibrating with procedural standards (MES).
• The autocalibration routine for screening veterinary tissue samples described here is included in the workflow script and saves time, labor, and solvent usage.
• Analyte responses were stable for 100 consecutive injections without maintenance.
References and acknowledgments1. 1. Anastassiades M, Lehotay SJ, Stajnbaher D, Schenck FJ (2003) Fast and easy
multiresidue method employing acetonitrile extraction/partitioning and “dispersive solid-phase extraction” for the determination of pesticide residues in produce. J AOAC Int 86:412–431.
2. Automated Mini-Column Solid-Phase Extraction Cleanup for High-Throughput Analysis of Chemical Contaminants in Foods by Low-Pressure Gas Chromatography—Tandem Mass Spectrometry, Steven J. Lehotay, Lijun Han, Yelena Sapozhnikova, Chromatographia, DOI 10.1007/s10337-016-3116-y
3. AOAC SMPR 2018.010 https://www.aoac.org/wp-content/uploads/2019/09/SMPR2018_010.pdf
4. A. Furey, M. Moriarty, V. Bane, B. Kinsella, M. Lehane, Ion suppression; a critical review on causes, evaluation, prevention and applications, Talanta 115 (2013) 104–122.
5. Publications Office of the European Union. https://ec.europa.eu/food/sites/food/files/plant/docs/pesticides_mrl_guidelines_wrkdoc_2019-12682.pdfhttps://op.europa.eu/en/publication-detail/-/publication/ed928116-a955-4a84-b10acf7a82bad858/
For Research Use Only. Not for use in diagnostic procedures. © 2021 Thermo Fisher Scientific Inc. All rights reserved. All trademarks are the property of Thermo Fisher Scientific and its subsidiaries. This information is presented as an example of the capabilities of Thermo Fisher Scientific Inc. products. It is not intended to encourage use of these products in any manners that might infringe the intellectual property rights of others. Specifications, terms, and pricing are subject to change. Not all products are available in all countries. Please consult your local sales representative for details. AN66000-EN 0521M
Find out more at thermofisher.com/VetDrugTesting