magyar, angol, francia, német, spanyol leggyakoribb 6000 szava
Upload
sorbonne-frCategory
view
0download
0
Quantitative reconstructions of annual rainfall in Africa 6000 years
ago: Model-data comparison
Odile Peyron,1 Dominique Jolly,2 Pascale Braconnot,3 Raymonde Bonnefille,4 Joel Guiot,4
Denis Wirrmann,5 and Francoise Chalie4
Received 12 April 2006; revised 16 June 2006; accepted 28 August 2006; published 23 December 2006.
[1] This paper provides the first set of quantitative reconstructions of annualprecipitation for mid-Holocene Africa, based on pollen data. The estimates ofprecipitation are based on 85 pollen sites 14C dated at 6000 ± 500 years B.P anddistributed over the whole of Africa. To improve the reliability of the pollen-basedclimate reconstruction, two methods are used: the ‘‘modern analogues technique’’(MAT) and the ‘‘plant functional types’’ (PFT) methods. We then conduct a model-datacomparison for five distinct regions, allowing an evaluation of model outputs (theSahara-Sahel, the eastern Sahara, western equatorial Africa, East Africa, andMadagascar). The pollen-inferred reconstructions are compared with 21 mid-Holocenesimulations yielded by Atmospheric General Circulation Models (AGCMs), and coupledocean-atmosphere-vegetation models (OAVGCMs). The large-scale feature of thehydrological changes is shown to be well captured by most of the models. Data show thatduring the mid-Holocene, the Sahara was considerably wetter than today (+200 to+700 mm/yr). The results reinforce the conclusion that the AGCMs significantlyunderestimate this precipitation increase in the Sahara whereas the OAVGCMsimulations are in accordance with the data. Our results show that vegetation and oceanfeedbacks do not have a strong impact in the intertropical zone and that models fail toproperly reproduce the climatic conditions in East Africa and Madagascar. The model-datacomparison also suggests that the lengthening of the dry season during boreal winterin the west equatorial region is a robust feature although the pollen-basedreconstruction shows no change or only slight drying there.
Citation: Peyron, O., D. Jolly, P. Braconnot, R. Bonnefille, J. Guiot, D. Wirrmann, and F. Chalie (2006), Quantitative reconstructions
of annual rainfall in Africa 6000 years ago: Model-data comparison, J. Geophys. Res., 111, D24110, doi:10.1029/2006JD007396.
1. Introduction
[2] The climate of Africa has varied considerably duringthe last 20,000 years [Gasse, 2000; Bonnefille and Chalie,2000], and during the mid-Holocene period [deMenocal etal., 2000] strong environmental changes occurred in theSahara. The region was densely vegetated with grasses andshrubs [Jolly et al., 1998a; Prentice et al., 2000], and nu-merous lakes extended beyond their present level [Hoelzmannet al., 2004]. Paleolake Chad had a surface area of
340,000 km2 instead of its current 21,000 km2 [Servantand Servant-Vildary, 1980; Hoelzmann et al., 2000], andneolithic civilizations flourished in the Sahara where manyelephants, antelopes, giraffes and hippopotami lived [Petit-Maire et al., 1993]. In contrast with the Saharan pattern, theamplitude of the climate changes in west and east equatorialAfrica seems almost negligible compared to the present sit-uation [Elenga et al., 2004; Bonnefille and Chalie, 2000].The greening of the Sahara may be explained by the inten-sification of the African summer monsoon, due to Earthorbital changes. Indeed, experiments with atmospheric gen-eral circulation models (AGCMs) show that all modelssimulate a strengthening of the African monsoon whenmid-Holocene insolation is applied as a boundary condi-tion [COHMAP Members, 1988; Joussaume et al., 1999;Braconnot et al., 2000a]. However, several studies havereported that vegetation and ocean feedbacks were neededto strengthen the initial signal [Braconnot et al., 2004]. Theimportance of the feedbacks have been investigated throughsensitivity studies which examined the response to changesin (1) land surface [Texier et al., 1997, 2000; Claussen et al.,1999, 2003; Brostrom et al., 1998; Doherty et al., 2000; DeNoblet-Ducoudre et al., 2000], (2) desert albedo [Bonfils et al.,2001], and (3) ocean surface [Kutzbach and Liu, 1997;
JOURNAL OF GEOPHYSICAL RESEARCH, VOL. 111, D24110, doi:10.1029/2006JD007396, 2006ClickHere
for
FullArticle
1Laboratoire de Chrono-Ecologie, UMR CNRS 6565, Universite deFranche-Comte, Besancon, France.
2Institut des Sciences de l’Evolution, UMR CNRS 5554, UniversiteMontpellier II, Montpellier, France.
3Laboratoire des Sciences du Climat et de l’Environnement/InstitutPierre-Simon Laplace, Unite mixte CEA-CNRS-UVSQ, Gif-sur-Yvette,France.
4Centre Europeen de Recherche et d’Enseignement des Geosciences del’Environnement, CNRS UMR 6635, Universite Paul Cezanne, Aix-en-Provence, France.
5UR055 Paleotropique, Institut de Recherche pour le Developpement,Noumea, New Caledonia.
Copyright 2006 by the American Geophysical Union.0148-0227/06/2006JD007396$09.00
D24110 1 of 9

Hewitt and Mitchell, 1998; Braconnot et al., 2000b, 2004;Liu et al., 2004]. All these experiments showed that, eventhough the exact location and magnitude of the changes inprecipitation at 6000 years B.P. vary substantially from oneset of model results to another, land surface and oceanfeedbacks significantly increase precipitation in the Sahara.In addition Braconnot et al. [1999] showed that oceanfeedback further increases the large vegetation feedback inthe Sahel regions.[3] Recent reconstructions of mid-Holocene paleoenviron-
ments focusing on biomes [Jolly et al., 1998a; Prentice et al.,2000] and lake levels [Kohfeld and Harrison, 2000] havebeen used as benchmarks for model evaluation [Joussaume etal., 1999; Liu et al., 2004; Braconnot et al., 2004]. A furtherstep for model-data comparison would be to develop quan-titative reconstructions of climate variables based on pollendata, such as those done for Europe [Cheddadi et al., 1997] orEast Africa [Peyron et al., 2000]. In this study, we provide thefirst pollen-based quantitative reconstruction of annual rain-fall over the whole of Africa for the mid-Holocene. This datawill then serve as a benchmark to evaluate the results of19 AGCMs and 2 coupled model simulations (OAGCMs)for different regions of Africa. We investigate to determinewhether the coupled simulations performed with the IPSL(Institut de Physique Simon Laplace) coupled model takinginto account both changes in ocean circulation and invegetation cover [Braconnot et al., 1999] are in betteragreement with data than the atmospheric simulations ofthe Paleoclimate Modeling Intercomparison Project ‘‘PMIP’’[Joussaume et al., 1999].
2. Climate Reconstructions and ModelSimulations
[4] To improve the reliability of the pollen-inferred pale-oclimate reconstruction, two distinct methods are used[Peyron et al., 2000, 2005; Bonnefille et al., 2004]. In the‘‘modern analogues technique’’ (MAT) method [Overpecket al., 1985; Guiot, 1990], a dissimilarity index calculatedbetween each fossil sample and each modern sample leads toa selection of the ten ‘‘best’’ modern pollen analogues forwhich the chord distance (i.e., a sum of differences betweensquare root-transformed percentages of the 178 selected taxa)shows the lowest values. The climatic parameter recon-structed value is the weighted average of the climatic param-eter at the site of these 10 analogues, according to the inversedistance. The error is defined as the lower and upper extremeclimate among these ten analogues. The second method,already tested with success in East Africa [Peyron et al.,2000; Bonnefille et al., 2004] is based on the ‘‘plant func-tional types’’ (PFT)-climate relationship. Basically, a PFT isdefined in terms of functional characteristics (tree/grass, leafform, phenology) and bioclimatic tolerance. Both methodsare based on a modern pollen data set which includes 761modern pollen samples from Africa and the Arabian Penin-sula collected between 17�Wand 60�E, 30�N and 33�S at analtitude ranging from 0 to 4000 m [Jolly et al., 1998a]. The178 pollen taxa identified in the modern data set are eachassigned to a PFT, and then for each PFT, a numerical score iscalculated following the biomization procedure [Prentice etal., 2000]. The PFT scores derived from modern pollen dataare calibrated in terms of climate parameters using an
artificial neural network technique [Caudill and Butler,1992; Peyron et al., 1998]. Then, to infer mid-Holoceneprecipitation values, MAT and PFT methods are applied tothe fossil pollen data set including 85 samples from Africacompiled by Jolly et al. [1998a].[5] Our climate reconstructions are used to evaluate model
results for five large regions of Africa, where the datacoverage is sufficient. The regions includes the Sahara/Sahel,the Intertropical zone (west and east), and Madagascar, overwhich the precipitation values produced by the model sim-ulations are averaged. For each of these regions, we considerthe 19 AGCM simulations of the mid-Holocene climateperformed during the first phase of the PMIP (PMIP1[Joussaume and Taylor, 1995]). Since model resolutionvaries from 1 to 4 degrees in these regions, depending onthe model, we designed the regions to include several gridpoints. Model results were averaged over several seasonalcycles so that error bars for each simulation do not exceed50 mm/yr. For these PMIP simulations, the Earth’s orbitalparameters correspond to the values valid for 6000 years ago[Berger and Loutre, 1991]. The vegetation and the annualmean cycle of sea surface temperature (SST) are fixed tomodern conditions using modern climatology (see http://www-lsce.cea.fr for more information on the experimentalprotocol). Furthermore, we take into consideration here theOAGCM and the OAVGCM simulations of Braconnot et al.[1999] performed with the IPSL model [Braconnot et al.,2000b], so as to test whether ocean and vegetation feedbacksproduce results different from the PMIP ones, and whetherthey are in better agreement with the data. Since AOGCMsare not able to properly reproduce all aspects of the character-istics of modern SST [Davey et al., 2002], the differences inthe changes in precipitation simulated with the OAGCMmay arise from (1) bias in the simulation of SST for themodern climate and (2) the SST response to the 6ka in-solation. To ensure discussion of the impact of the oceanresponse in our comparisons, we add two additional simu-lations with the atmospheric component of the coupledmodel. The first, following the PMIP protocol, is a PMIPsimulation for which SST are prescribed to the modernclimatology estimated from observations. The second is aPMIP- type simulation for which the SST are prescribed tothe SST simulated for the modern climate by the OAGCM.This indicates the impact of the reference SST on the resultsof the mid-Holocene simulations and also provides informa-tion as to how the atmospheric model performs in comparisonto the whole of PMIP simulations.
3. Results and Discussion
3.1. Sahara and Sahel
[6] Results indicate that the annual precipitations recon-structed by MAT and PFT methods are similar, showing thesame pattern across the Sahara: at 6000 years B.P. (Figures 1and 2) it was far wetter than today. Figure 3c shows that thechord distances of the modern analogues selected for the6000 years B.P. climate reconstruction are very low for thisarea. It implies that these analogues may be considered ‘‘verygood analogues’’ to the 6000 years B.P. pollen samples, andthus that the climatic reconstruction is particularly robust forthe Sahara-Sahel.
D24110 PEYRON ET AL.: CLIMATE OF AFRICA—MODEL-DATA COMPARISON
2 of 9
D24110
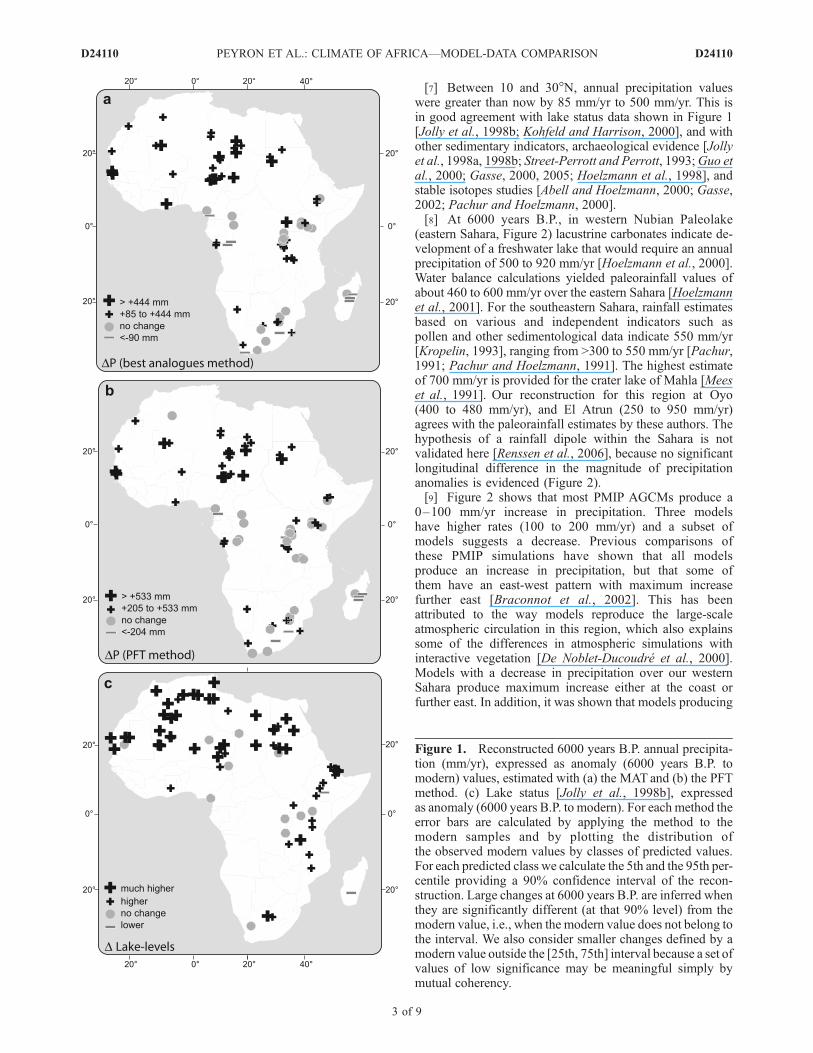
[7] Between 10 and 30�N, annual precipitation valueswere greater than now by 85 mm/yr to 500 mm/yr. This isin good agreement with lake status data shown in Figure 1[Jolly et al., 1998b; Kohfeld and Harrison, 2000], and withother sedimentary indicators, archaeological evidence [Jollyet al., 1998a, 1998b; Street-Perrott and Perrott, 1993;Guo etal., 2000; Gasse, 2000, 2005; Hoelzmann et al., 1998], andstable isotopes studies [Abell and Hoelzmann, 2000; Gasse,2002; Pachur and Hoelzmann, 2000].[8] At 6000 years B.P., in western Nubian Paleolake
(eastern Sahara, Figure 2) lacustrine carbonates indicate de-velopment of a freshwater lake that would require an annualprecipitation of 500 to 920 mm/yr [Hoelzmann et al., 2000].Water balance calculations yielded paleorainfall values ofabout 460 to 600 mm/yr over the eastern Sahara [Hoelzmannet al., 2001]. For the southeastern Sahara, rainfall estimatesbased on various and independent indicators such aspollen and other sedimentological data indicate 550 mm/yr[Kropelin, 1993], ranging from >300 to 550 mm/yr [Pachur,1991; Pachur and Hoelzmann, 1991]. The highest estimateof 700 mm/yr is provided for the crater lake of Mahla [Meeset al., 1991]. Our reconstruction for this region at Oyo(400 to 480 mm/yr), and El Atrun (250 to 950 mm/yr)agrees with the paleorainfall estimates by these authors. Thehypothesis of a rainfall dipole within the Sahara is notvalidated here [Renssen et al., 2006], because no significantlongitudinal difference in the magnitude of precipitationanomalies is evidenced (Figure 2).[9] Figure 2 shows that most PMIP AGCMs produce a
0–100 mm/yr increase in precipitation. Three modelshave higher rates (100 to 200 mm/yr) and a subset ofmodels suggests a decrease. Previous comparisons ofthese PMIP simulations have shown that all modelsproduce an increase in precipitation, but that some ofthem have an east-west pattern with maximum increasefurther east [Braconnot et al., 2002]. This has beenattributed to the way models reproduce the large-scaleatmospheric circulation in this region, which also explainssome of the differences in atmospheric simulations withinteractive vegetation [De Noblet-Ducoudre et al., 2000].Models with a decrease in precipitation over our westernSahara produce maximum increase either at the coast orfurther east. In addition, it was shown that models producing
Figure 1. Reconstructed 6000 years B.P. annual precipita-tion (mm/yr), expressed as anomaly (6000 years B.P. tomodern) values, estimated with (a) the MAT and (b) the PFTmethod. (c) Lake status [Jolly et al., 1998b], expressedas anomaly (6000 years B.P. to modern). For each method theerror bars are calculated by applying the method to themodern samples and by plotting the distribution ofthe observed modern values by classes of predicted values.For each predicted class we calculate the 5th and the 95th per-centile providing a 90% confidence interval of the recon-struction. Large changes at 6000 years B.P. are inferred whenthey are significantly different (at that 90% level) from themodern value, i.e., when the modern value does not belong tothe interval. We also consider smaller changes defined by amodern value outside the [25th, 75th] interval because a set ofvalues of low significance may be meaningful simply bymutual coherency.
D24110 PEYRON ET AL.: CLIMATE OF AFRICA—MODEL-DATA COMPARISON
3 of 9
D24110

Figure 2
D24110 PEYRON ET AL.: CLIMATE OF AFRICA—MODEL-DATA COMPARISON
4 of 9
D24110

a modern ITCZ too far north in the simulation of the modernclimate also produce precipitation changes further northwhen compared to the other models. This explains in partwhy four models produce larger increases in precipitation.[10] The model-data comparison confirms that all the
PMIP simulations consistently underestimate the precipita-tion increase shown by the data in the Sahara (Figure 2), asfound in previous comparisons with pollen or lake data[Joussaume et al., 1999; Jolly et al., 1998b; Harrison etal., 1998; Coe and Harrison, 2002]. At 6000 years B.P. thebiome distribution shows that steppe vegetation replacesdesert as far north as 23�N [Jolly et al., 1998a]. An increaseof 200 to 300 mm/yr of precipitation is required for mostPMIP models to sustain steppe at 23�N [Joussaume et al.,1999], and here we show that at least an additional amount of100 to 400 mm/yr of precipitation is required to concur withour reconstruction for this area. This discrepancy underscoresthe fact that the biome-based estimates of climate change areminimum values only [Joussaume et al., 1999].[11] The results of the coupled simulations show that
although the ocean feedback helps to enhance the Africanmonsoon, only the ocean and vegetation feedbacks produce aprecipitation increase in good agreement with the pollen data(Figure 2). The comparison of the two PMIP-type simula-tions with the atmospheric component of the IPSL modelsuggests that errors in the simulation of modern SSTwith theOAGCM do not alter the response of the atmospheric modelto insolation forcing. It also shows that this atmosphericmodel substantially amplifies the monsoon rain compared toother PMIP simulations. The ocean feedback alone onlyslightly increases the precipitation change. Results includingboth the vegetation and ocean feedbacks are clearly differentfrom the other simulations and in better agreement with data.[12] In the eastern Sahara all PMIP simulations produce a
precipitation increase of 0–100 mm/yr, which is also insuf-ficient compared to our reconstruction. In this region differ-ent SST for the control simulation have no impact on themodel results, and ocean feedback marginally increasesthe precipitation amount. The only simulation that matchesthe pollen-inferred climatic reconstruction is the oneincluding ocean and vegetation feedbacks. It is also note-worthy that this is the only simulation able to produce anincrease both in the eastern and western parts of theSahelian band.
3.2. Intertropical Zone
[13] The reconstructed climate is comparable to the presentone (Figures 1 and 2). However, between 10�N and 20�S, andfrom west to east the results are more contrasted than in theSahara.3.2.1. East Africa[14] To check the reliability of the reconstruction, the
rainfall values estimated here have been compared, inFigure 2, to two spatial climate reconstructions available
for East Africa, also based on the MAT and/or the PFTmethod [Peyron et al., 2000; Bonnefille and Chalie, 2000].These studies show similar climatic patterns in East Africaat 6000 years B.P. It is to be noted that the climate is slightlywetter in the MAT-inferred reconstruction. Nevertheless,Peyron et al. [2000] have shown that the results are morespatially homogeneous with the PFT method than with theMAT for East Africa.[15] Results show that in East Africa, the amplitude of
rainfall increase is almost negligible compared to the presentsituation and in contrast with the Saharan pattern (Figures 1and 2). This conclusion is in good agreement with previousprecipitation estimates inferred from several peat bogsequences in equatorial East Africa [Bonnefille and Chalie,2000; Chalie, 1995; Beuning and Russell, 2004], and fromoxygen isotope data fromMounts Kenya [Barker et al., 2001]and Kilimanjaro [Thompson et al., 2002].[16] All but two of the PMIP simulations indicate drier
conditions in East Africa, from 0 to –400mm/yr. This patternmay be in agreement with the data located north of 4�S.However, in central southeast Africa, pollen data and highlake levels (Figure 1) indicate unambiguously humid con-ditions [Vincens et al., 2005] confirmed by the overflow ofLakes Tanganyika, Victoria, Albert and Kivu during the mid-Holocene period [Gasse, 2000].[17] One reason explaining this mismatch between model
and data and the wide spread in model results might be theunderestimation of the topography in this region, given thespatial resolution of the atmospheric model used here. Thisunderestimation is such that most of the monsoon flowpenetrates far to the east over the ocean and is only poorlyaffected by mountains, or that it produces a local increase inprecipitation over high elevations to the north of the equator(not shown). Our results also show that SST of the controlsimulation has an impact on the simulated change in precip-itation, and that the vegetation feedback tends to dry theclimate, at least in the model used here. These results suggestthat the models do not accurately reproduce east Africanprecipitation and that including ocean and vegetation feed-backs does not improve model performance.3.2.2. West Africa[18] In western equatorial Africa, mid-Holocene hydro-
logical conditions reconstructed by the PFT method weresimilar to or wetter than now, while the MAT-based recon-structions depict the occurrence of similar to or drier con-ditions than today (Figure 2). To understand such a surprisingpattern, and to check whether the discrepancies observed inFigure 2 can be explained by a bias induced by the moderndata, we have plotted the actual precipitation values (calcu-lated at each modern pollen site) versus the values inferredfrom the modern pollen samples belonging to the dominantbiomes in West Africa, namely the ‘‘tropical seasonal forest’’and ‘‘tropical rain forest’’ biomes (Figure 3a). Figure 3ashows that today in West Africa the PFT method under-
Figure 2. Data-model comparison of the mid-Holocene climate for five African key areas. Simulations of annualprecipitation based on 19 PMIP models, 1 coupled ocean-atmosphere and 1 coupled ocean-atmosphere-vegetation model[Braconnot et al., 1999] are plotted together with pollen-based annual precipitation estimates (MAT and the PFT methods).Additional simulations with the atmospheric component of the coupled model are shown. The first is a PMIP simulation, andthe second is a PMIP-type simulation for which the SSTare prescribed to the SSTsimulated for the modern climate. All resultsare expressed as anomaly (6000 years B.P. to modern) values. Pollen-based annual precipitation estimated for East Africa withthe MAT and/or the PFT methods [Peyron et al., 2000; Bonnefille and Chalie, 2000] are also plotted for comparison.
D24110 PEYRON ET AL.: CLIMATE OF AFRICA—MODEL-DATA COMPARISON
5 of 9
D24110

estimates precipitation values above 2000 mm, and thatneither method is capable of reproducing modern precipita-tion around 3000 mm/yr. At 6000 years B.P., the MAT-basedspatial reconstruction of the West Africa climate thus seemsmore reliable. However, our results should be interpretedwith caution because they are characterized by deteriorationin the quality of the analogues (an increase in chord distance)as well as by numerous ‘‘no-analogue’’ situations (Figure 3c).These deviations generally correspond to features of pollenassemblages interpreted in different ways by the two meth-ods. It is also noteworthy that in contrast to west Africa, thescatterplot of the MAT versus PFT precipitation reconstruc-tions for the entire African continent (Figure 3b) demon-strates that the PFT method does not underestimate themagnitude of the precipitation relative to the MAT methodfor the mid-Holocene period.[19] Elenga et al. [2004] showed that in western equato-
rial Africa, the greatest extension of dense forest occurredduring the interval 10,500–4000 years B.P. However, nu-merous pollen sequences in west Africa suffer from chro-nology uncertainties for this time period (bad dating control,low sedimentation rate. . .). The attribution of the 6000 yearsB.P. age is then very problematic, except for the well-datedsequence of Lake Barombi Mbo [Maley and Brenac, 1998].Nevertheless, the reconstruction of climatic conditions sim-ilar to today’s is actually in agreement with the occurrence ofthe tropical seasonal forests in almost all the sites fromwestern equatorial Africa [Jolly et al., 1998b]. This patternalso agrees with the beginning of sedimentation from6000 years B.P. in small basins lying in theGuineo-Congolianrealm [Reynaud-Farrera, 1995], with a low sedimentationrate at Ngamakala in the Congo from 6500 years B.P. [Elengaet al., 1994], and with an SST decrease in the Guinean Gulfbetween 6500 and 4000 years B.P. [Morley and Dworetsky,1993]. In southwest Cameroon [Reynaud-Farrera, 1995;Giresse et al., 2005], like-today conditions are consistent alsowith low percentages of mature rain forest taxa (Caesalpinia-ceae, Sapotaceae) associated with relatively high percentagesof Alchornea (heliophilous element linked to disturbed rainforest), and Afromontane elements (Podocarpus and Oleacapensis) recognized in Lake Ossa sediments. In the westernCameroon highlands, the lake Bambili record showed that,the precipitation minus evaporation balance was low at 6000years B.P [Stager and Anfang-Sutter, 1999]. For Lake Bar-ombi Mbo, a lower elevation site in western Cameroon, ourreconstruction does not show any significant climaticchange when compared with today (Figure 1).This resultagrees with the lake status inferred by Talbot et al. [1984] and
Figure 3. Validation of the pollen-based climatic recon-struction performed on (a) the modern pollen data set. Thefigure shows, for the modern pollen records belonging to the‘‘tropical seasonal forest’’ and ‘‘tropical rain forest’’equatorial biomes, the pollen-derived annual precipitation(in mm/yr) estimated with the PFT and the MAT methodsversus observed precipitation values. (b and c) The 6000 B.Ppollen data. Figure 3b is a scatterplot of the MAT versus PFTprecipitation reconstruction (in mm/yr) for all sites. InFigure 3c, for the five African key areas, the calculated chorddistance of the closer and the less close of the 10 best modernanalogues selected by the MAT is plotted.
D24110 PEYRON ET AL.: CLIMATE OF AFRICA—MODEL-DATA COMPARISON
6 of 9
D24110
with the observed low frequencies of the main taxa of theBiafran evergreen forest at 6000 years B.P. [Maley andBrenac, 1998].[20] The contradiction between the MAT and PFT results
certainly deserves more investigation. Additional modernsamples will be required from equatorial Africa to improvethe reconstruction of the complex climatic conditions occur-ring during this period.[21] A previous model-data comparison [Jolly et al.,
1998b] has concluded that the model simulation at6000 years B.P. was not reliable in central Africa becausesimulated annual precipitation values were 300 mm/yr lowerthan the modern ones over Cameroon, Gabon, and theCongo. Here, all PMIP simulations show that annual precip-itation was lower than today by 0–200 mm/yr (Figure 2).Furthermore, the OAGCM and OAVGCM simulations showsimilar results, suggesting that the precipitations of thisregion are only poorly affected by the ocean and vegetationfeedbacks. The whole response is thus dominated by theresponse of atmospheric circulation to insolation forcing.[22] A more detailed analysis of the model results suggests
that it appears reasonable to find no change or a slight dryingin this region. The climate of the tropical zone is governed bythe seasonal movement of the Intertropical ConvergenceZone (ITCZ) in response to changes in the location ofmaximum solar heating. Lower rainfall in West Africa maybe due to the extent of the ITCZ migration northward
during the northern hemisphere summer and southwardduring the corresponding winter. This hypothesis mightimply that the ITCZ will not be blocked for some monthswithin the intertropical area like today. This should lead to alonger dry season in winter or/and in summer.[23] This hypothesis of a longer dry season inwinter or/and
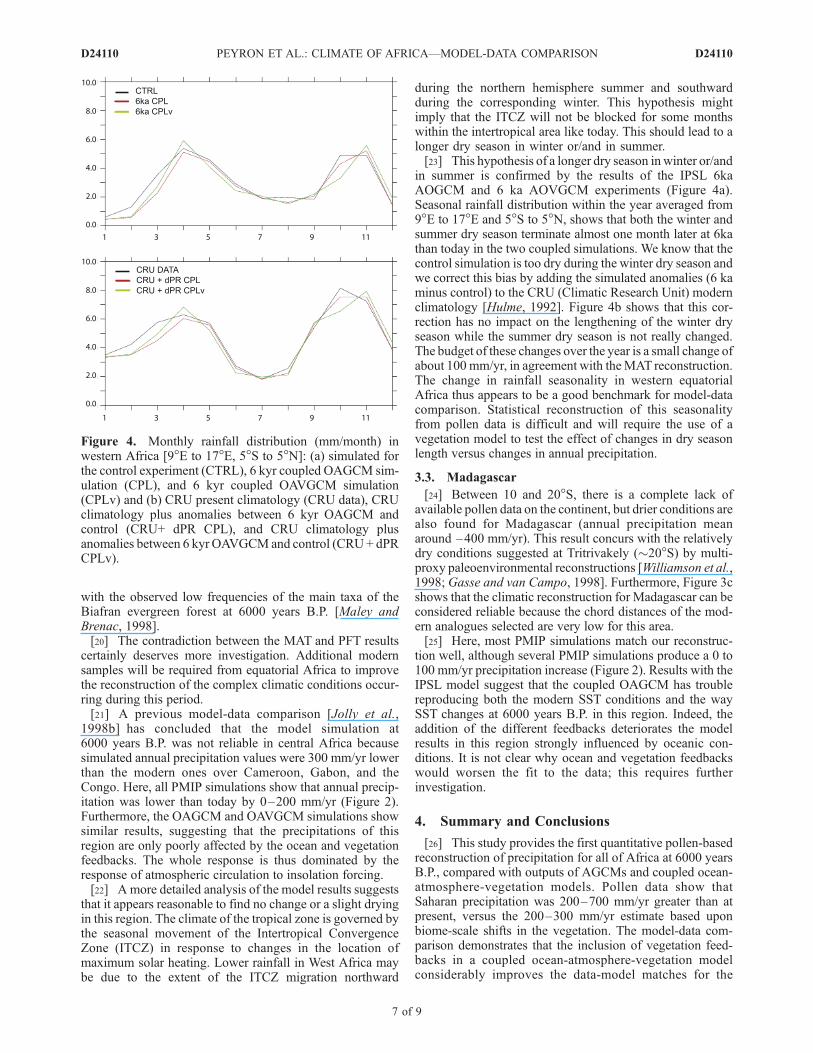
in summer is confirmed by the results of the IPSL 6kaAOGCM and 6 ka AOVGCM experiments (Figure 4a).Seasonal rainfall distribution within the year averaged from9�E to 17�E and 5�S to 5�N, shows that both the winter andsummer dry season terminate almost one month later at 6kathan today in the two coupled simulations. We know that thecontrol simulation is too dry during the winter dry season andwe correct this bias by adding the simulated anomalies (6 kaminus control) to the CRU (Climatic Research Unit) modernclimatology [Hulme, 1992]. Figure 4b shows that this cor-rection has no impact on the lengthening of the winter dryseason while the summer dry season is not really changed.The budget of these changes over the year is a small change ofabout 100 mm/yr, in agreement with theMAT reconstruction.The change in rainfall seasonality in western equatorialAfrica thus appears to be a good benchmark for model-datacomparison. Statistical reconstruction of this seasonalityfrom pollen data is difficult and will require the use of avegetation model to test the effect of changes in dry seasonlength versus changes in annual precipitation.
3.3. Madagascar
[24] Between 10 and 20�S, there is a complete lack ofavailable pollen data on the continent, but drier conditions arealso found for Madagascar (annual precipitation meanaround –400 mm/yr). This result concurs with the relativelydry conditions suggested at Tritrivakely (�20�S) by multi-proxy paleoenvironmental reconstructions [Williamson et al.,1998; Gasse and van Campo, 1998]. Furthermore, Figure 3cshows that the climatic reconstruction for Madagascar can beconsidered reliable because the chord distances of the mod-ern analogues selected are very low for this area.[25] Here, most PMIP simulations match our reconstruc-
tion well, although several PMIP simulations produce a 0 to100 mm/yr precipitation increase (Figure 2). Results with theIPSL model suggest that the coupled OAGCM has troublereproducing both the modern SST conditions and the waySST changes at 6000 years B.P. in this region. Indeed, theaddition of the different feedbacks deteriorates the modelresults in this region strongly influenced by oceanic con-ditions. It is not clear why ocean and vegetation feedbackswould worsen the fit to the data; this requires furtherinvestigation.
4. Summary and Conclusions
[26] This study provides the first quantitative pollen-basedreconstruction of precipitation for all of Africa at 6000 yearsB.P., compared with outputs of AGCMs and coupled ocean-atmosphere-vegetation models. Pollen data show thatSaharan precipitation was 200–700 mm/yr greater than atpresent, versus the 200–300 mm/yr estimate based uponbiome-scale shifts in the vegetation. The model-data com-parison demonstrates that the inclusion of vegetation feed-backs in a coupled ocean-atmosphere-vegetation modelconsiderably improves the data-model matches for the
Figure 4. Monthly rainfall distribution (mm/month) inwestern Africa [9�E to 17�E, 5�S to 5�N]: (a) simulated forthe control experiment (CTRL), 6 kyr coupled OAGCM sim-ulation (CPL), and 6 kyr coupled OAVGCM simulation(CPLv) and (b) CRU present climatology (CRU data), CRUclimatology plus anomalies between 6 kyr OAGCM andcontrol (CRU+ dPR CPL), and CRU climatology plusanomalies between 6 kyr OAVGCMand control (CRU+ dPRCPLv).
D24110 PEYRON ET AL.: CLIMATE OF AFRICA—MODEL-DATA COMPARISON
7 of 9
D24110

Sahara. In contrast to previous studies, this analysis also tookother regions of Africa into account. Our results show that themodels considered here fail to properly represent the changesin precipitation in eastern equatorial Africa. Results with theIPSL model where ocean and vegetation feedback are intro-duced show that these feedbacks are not well reproduced ineastern equatorial Africa or Madagascar. A poor representa-tion of the topography in East Africa and the difficulties inproperly simulating SST in the Indian Ocean may be thecause of these model drawbacks. In western equatorialAfrica, the apparent contradiction between the results in-ferred by the MAT and the PFT methods certainly deservesfurther investigation so as to improve the reconstruction ofcomplex climatic conditions occurring during this period.However, model results show that the lengthening of the dryseason during the boreal winter in the west equatorial regionseems to be a robust feature across model simulations. It isattributed to the fact that the ITCZ is located further northcompared to modern conditions during boreal summer andfurther south during boreal winter. Thus the time spent by theITCZ in west equatorial Africa is reduced, thereby increasingthe length of the dry season.[27] Our paleoclimatic data set can now be used to evaluate
further model simulations on the scale of the entire Africancontinent. It is crucial to provide such climatic information inseveral regions of Africa to be able to evaluate the consis-tency of the simulated climate, not only its local features, butalso its potential longitudinal and latitudinal gradients orcontrasts. Although the spatial distribution of the data needsto be improved, particularly in the intertropical region, thisdata set will be used, in the future, to fully test coupled modelsimulations (PMIP2) and help to better infer the role of theocean and vegetation feedbacks on this continent. This willbe completely achieved by a better evaluation of data, as wellas model simulations, in particular concerning the monthlydistribution of precipitation.
[28] Acknowledgments. Financial support was provided by the Euro-pean Union through the MOTIF project (EVK2-CT-2002-00153) and by theFrench (INSU/CNRS) PNEDC through the ECHO project. This workis a contribution to PMIP, IGBP GAIM/GCTE/PAGES/BIOME 6000.The authors express their sincere thanks to John Olsen for his helpwith the English language, and ollen contributors: A. Ballouche, P. Brenac,G. Buchet, D. Burney, R. Cheddadi, A.C. Hamilton, H. Elenga, H. Lamb,A.M. Lezine, J. Maley, M. Reille, G. Riollet, L. Scott, I. Ssemmanda,H. Straka, D. Taylor, M. Umer, E. Van Campo, A. Vincens, and M. Waller.
ReferencesAbell, P., and P. Hoelzmann (2000), Holocene palaeoclimates in north-western Sudan: Stable isotope studies on molluscs, Global Planet.Change, 26, 1–12.
Barker, P. A., F. A. Street-Perrott, M. J. Leng, P. B. Greenwood, D. L.Swain, R. A. Perrott, R. J. Telford, and K. J. Ficken (2001), A 14,000-yearoxygen isotope record from diatom silica in two alpine lakes onMt. Kenya,Science, 292, 2307–2310.
Berger, A., and M. F. Loutre (1991), Insolation values for the climate of thelast 10 million years, Quat. Sci. Rev., 10, 297–317.
Beuning, K. R. M., and J. M. Russell (2004), Vegetation and sedimentationin the Lake Edward Basin, Uganda-Congo during the late Pleistocene andearly Holocene, J. Paleolimnol., 32, 1–18.
Bonfils, C., N. de Noblet-Ducoudre, P. Braconnot, and S. Joussaume(2001), Hot desert albedo and climate change: Mid-Holocene monsoonin north Africa, J. Clim., 14, 3724–3737.
Bonnefille, R., and F. Chalie (2000), Pollen-inferred precipitation time-series from equatorial mountains, Africa, the last 40 kyr B.P., GlobalPlanet. Change, 26, 25–50.
Bonnefille, R., R. Potts, F. Chalie, D. Jolly, and O. Peyron (2004), High-resolution vegetation and climate change associated with Pliocene Aus-
tralopithecus afarensis, Proc. Natl. Acad. Sci. U. S. A., 101, 12,125–12,129.
Braconnot, P., S. Joussaume, O. Marti, and N. de Noblet (1999), Synergisticfeedbacks from ocean and vegetation on the African monsoon response tomid-Holocene insolation, Geophys. Res. Lett., 26, 2481–2484.
Braconnot, P., S. Joussaume, N. de Noblet, and G. Ramstein (2000a), Mid-Holocene and Last Glacial Maximum African monsoon changes as simu-lated within the Paleoclimate Modelling Intercomparison Project, GlobalPlanet. Change, 26, 51–66.
Braconnot, P., O. Marti, S. Joussaume, and Y. Leclainche (2000b), Oceanfeedback in response to 6 kyr B.P. insolation, J. Clim., 13, 1537–1553.
Braconnot, P., M. F. Loutre, B. Dong, S. Joussaume, and P. Valdes (2002),How the simulated change in monsoon at 6 ka B.P. is related to thesimulation of the modern climate: Results from the Paleoclimate Model-ing Intercomparison Project, Clim. Dyn., 19, 107–121.
Braconnot, P., S. P. Harrison, S. Joussaume, C. D. Hewitt, A. Kitoh, J. E.Kutzbach, Z. Liu, B. Otto-Bliesner, J. Syktus, and N. Weber (2004),Evaluation of PMIP coupled ocean-atmosphere simulations of the mid-Holocene, in Past Climate Variability Through Europe and Africa, editedby R. W. Battarbee, F. Gasse, and C. E. Stickley, pp. 515–533, Springer,New York.
Brostrom, A., M. Coe, S. P. Harrison, R. Gallimore, J. E. Kutzbach, J. Foley,I. C. Prentice, and P. Behling (1998), Land surface feedbacks and palaeo-monsoons in northern Africa, Geophys. Res. Lett., 25, 3615–3618.
Caudill, M., and C. Butler (1992), Understanding Neural Networks 1, BasicNetworks, MIT Press, Cambridge, Mass.
Chalie, F. (1995), Paleoclimats du bassin Tanganyika Sud au cours des 25derniers mille ans: reconstitution quantitative par le traitement statistiquedes donnees polliniques, C. R. Acad. Sci. Ser. 2a Sci. Terre Planetes, 320,205–210.
Cheddadi, R., G. Yu, J. Guiot, S. P. Harrison, and I. C. Prentice (1997), Theclimate of Europe 6000 years ago, Clim. Dyn., 13(1), 1–9.
Claussen, M., C. Kubatzki, V. Brovkin, A. Ganopolski, P. Hoelzmann, andH. J. Pachur (1999), Simulation of an abrupt change in Saharan vegeta-tion in the mid-Holocene, Geophys. Res. Lett., 26, 2037–2040.
Claussen, M., V. Brovkin, A. Ganopolski, C. Kubatzki, and V. Petoukhov(2003), Climate change in northern Africa: The past is not the future,Clim. Change, 57(1), 99–118.
Coe, M. T., and S. P. Harrison (2002), The water balance of northern Africaduring the mid-Holocene: An evaluation of the 6 ka B.P. PMIP simula-tions, Clim. Dyn., 19, 155–166.
COHMAP Members (1988), Climatic changes of the last 18,000 years:Observations and model simulations, Science, 241, 1043–1052.
Davey, M. K., et al. (2002), STOIC: A study of coupled model climatologyand variability in tropical ocean regions, Clim. Dyn., 18, 403–420.
deMenocal, P., J. Ortiz, T. Guilderson, J. Adkins, M. Sarnthein, L. Baker,and M. Yarusinsky (2000), Abrupt onset and termination of the AfricanHumid Period: Rapid climate responses to gradual insolation forcing,Quat. Sci. Rev., 19, 347–361.
De Noblet-Ducoudre, N., M. Claussen, and I. C. Prentice (2000), Mid-Holocene greening of the Sahara: First results of the GAIM 6000 yearB.P. experiment with two asynchronously coupled atmosphere/biomemodels, Clim. Dyn., 16, 643–659.
Doherty, R., J. Kutzbach, J. Foley, and D. Pollard (2000), Fully coupledclimate/dynamical vegetation model simulations over northern Africaduring the mid-Holocene, Clim. Dyn., 16, 561–573.
Elenga, H., D. Schwartz, and A. Vincens (1994), Pollen evidence of lateQuaternary vegetation and inferred climate changes in Congo, Palaeo-geogr. Palaeoclimatol. Palaeoecol., 109, 345–356.
Elenga, H., J. Maley, A. Vincens, and I. Farrera (2004), Palaeoenvironn-ments, palaeoclimates and landscapes development in Atlantic equatorialAfrica: A review of key sites covering the last 25 kyrs, in Past ClimateVariability Through Europe and Africa, edited by R. W. Battarbee,F. Gasse, and C. E. Stickley, pp. 181–198, Springer, New York.
Gasse, F. (2000), Hydrological changes in the African tropics since the lastglacial maximum, Quat. Sci. Rev., 19, 189–211.
Gasse, F. (2002), Diatom-inferred salinity and carbonate oxygen isotopes inHolocene waterbodies of the western Sahara and Sahel (Africa), Quat.Sci. Rev., 21, 737–767.
Gasse, F. (2005), Continental palaeohydrology and palaeoclimate duringthe Holocene, C. R. Geosci., 337, 79–86.
Gasse, F., and E. van Campo (1998), A 40,000-yr pollen and diatom recordfrom Lake Tritrivakely, Madagascar, in the southern tropics, Quat. Res.,49, 299–311.
Giresse, P., J. Maley, and A. Kossoni (2005), Sedimentary environmentalchanges and millennial climatic variability in a tropical shallow lake(Lake Ossa, Cameroon) during the Holocene, Palaeogeogr. Palaeoclima-tol. Palaeoecol., 218, 257–285.
Guiot, J. (1990), Methodology of palaeoclimatic reconstruction from pollenin France, Palaeogeogr. Palaeoclimatol. Palaeoecol., 80, 49–69.
D24110 PEYRON ET AL.: CLIMATE OF AFRICA—MODEL-DATA COMPARISON
8 of 9
D24110
Guo, Z., N. Petit-Maire, and S. Kropelin (2000), Holocene non-orbitalclimatic events in present-day arid areas of northern Africa and China,Global Planet. Change, 26, 97–103.
Harrison, S. P., et al. (1998), Intercomparison of simulated global vegeta-tion distributions in response to 6 kyr B.P. orbital forcing, J. Clim., 11,2721–2742.
Hewitt, C. D., and J. F. B. Mitchell (1998), A fully coupled GCM simula-tion of the climate of the mid-Holocene, Geophys. Res. Lett., 25, 361–364.
Hoelzmann, P., D. Jolly, S. P. Harrison, F. Laarif, R. Bonnefille, and H. J.Pachur (1998), Mid-Holocene land-surface conditions in northern Africaand the Arabian peninsula: A data set for the analysis of biogeophysicalfeedbacks in the climate system, Global Biochem. Cycles, 12, 35–52.
Hoelzmann, P., H. J. Kruse, and F. Rottinger (2000), Precipitation estimatesfor the eastern Saharan palaeomonsoon based on a water balance modelof the West Nubian palaeolake basin, Global Planet. Change, 26, 105–120.
Hoelzmann, P., B. Keding, H. Berke, S. Kropelin, and H. J. Kruse (2001),Environmental change and archaeology: Lake evolution and humanoccupation in the eastern Sahara during the Holocene, Palaeogeogr.Palaeoclimatol. Palaeoecol., 169, 193–217.
Hoelzmann, P., F. Gasse, L. Dupont, U. Salzmann, M. Staubwasser,D. Leuschner, and F. Sirocko (2004), Palaeoenvironmental changes inthe arid and subarid belt (Sahara-Sahel-Arabian peninsula) from 150 kyrto present, in Past Climate Variability through Europe and Africa,R. W. Battarbee, F. Gasse, and C. E. Stickley, pp. 219–256, Springer,New York.
Hulme, M. (1992), A 1951–80 global land precipitation climatology for theevaluation of General Circulation Models, Clim. Dyn., 7, 57–72.
Jolly, D., et al. (1998a), Biome reconstruction from pollen and plant macro-fossil data for Africa and the Arabian peninsula at 0 and 6000 years,J. Biogeogr., 25, 1007–1027.
Jolly, D., S. P. Harrison, B. Damnati, and R. Bonnefille (1998b), Simulatedclimate and biomes of Africa during the late Quaternary: comparison withpollen and lake status data, Quat. Sci. Rev., 17, 629–657.
Joussaume, S., and K. E. Taylor (1995), Status of the Paleoclimate Model-ing Intercomparison Project (PMIP), WCRP-92, WMO/TD 732, pp. 425–430, World Clim. Res. Programme, Geneva, Switzerland.
Joussaume, S., et al. (1999), Monsoon changes for 6000 years ago: Resultsof 18 simulations from the Paleoclimate Modeling Intercomparison Pro-ject (PMIP), Geophys. Res. Lett., 26, 859–862.
Kohfeld, K. E., and S. P. Harrison (2000), How well can we simulate pastclimates? Evaluating the models using global palaeoenvironmental data-sets, Quat. Sci. Rev., 19, 321–346.
Kropelin, S. (1993), Zur Rekonstruktion der spatquartaren Umwelt amUnteren Wadi Howar Sudostliche Sahara/NW Sudan, Berl. Geogr.Abh., 54, 1–293.
Kutzbach, J. E., and Z. Liu (1997), Response of the African monsoon toorbital forcing and ocean feedbacks in the middle Holocene, Science,278, 440–443.
Liu, Z., S. P. Harrison, J. E. Kutzbach, and B. Otto-Bliesner (2004), Globalmonsoons in the mid-Holocene and oceanic feedback, Clim. Dyn., 22,157–182.
Maley, J., and P. Brenac (1998), Vegetation dynamics, palaeoenvironmentsand climatic changes in the forests of western Cameroon during the last28,000 years B.P., Rev. Palaeobot. Palynol., 99, 157–187.
Mees, F., R. Nijs, and H. Dumont (1991), Holocene evolution of the craterlake at Malha, northwestern Sudan, J. Paleolimnol., 5, 227–253.
Morley, J. J., and B. A. Dworetsky (1993), Holocene temperature patternsin the South Atlantic, Southern, and Pacific oceans, in Global ClimatesSince the Last Glacial Maximum, edited by H. E. Wright et al., pp. 125–135, Univ. of Minn. Press, Minneapolis.
Overpeck, J. T., T. Webb III, and I. C. Prentice (1985), Quantitative inter-pretation of fossil pollen spectra: Dissimilarity coefficients and the meth-od of modern analogs, Quat. Res., 23, 87–108.
Pachur, H.-J. (1991), Tethering stones as palaeoenvironmental indicators,Sahara, 4, 13–32.
Pachur, H.-J., and P. Hoelzmann (1991), Paleoclimatic implications of lateQuaternary lacustrine sediments in Western Nubia, Sudan, Quat. Res., 36,257–276.
Pachur, H.-J., and P. Hoelzmann (2000), Late Quaternary palaeoecologyand palaeoclimates of the eastern Sahara, J. Afr. Earth Sci., 30, 929–939.
Petit-Maire, N., N. Page, and J. Marchand (1993), The Sahara in the Ho-locene, map 1/5.000.000, U. N. Educ., Sci. and Cult. Organ./Comm. forthe Geol. Map of the World, Paris, France.
Peyron, O., J. Guiot, R. Cheddadi, P. E. Tarasov, M. Reille, J. L. de Beaulieu,S. Bottema, and V. Andrieu (1998), Climatic reconstruction in Europe for18,000 yr B.P. from pollen data, Quat. Res., 49, 183–196.
Peyron, O., D. Jolly, R. Bonnefille, A. Vincens, and J. Guiot (2000), Cli-mate of East Africa 6000 14C yr B.P., as inferred from pollen data, Quat.Res., 54, 90–101.
Peyron, O., C. Begeot, S. Brewer, O. Heiri, M. Magny, L. Millet, P. Ruffaldi,E. Van Campo, and G. Yu (2005), Late glacial climatic changes in easternFrance (Lake Lautrey) from pollen, lake-levels, and chironomids, Quat.Res., 64, 197–211.
Prentice, I. C., D. Jolly, and BIOME 6000 Participants (2000), Mid-Holocene and glacial-maximum vegetation geography of the northerncontinents and Africa, J. Biogeogr., 27, 507–519.
Renssen, H., V. Brovkin, T. Fichefet, and H. Goosse (2006), Simulation ofthe Holocene climate evolution in northern Africa: The termination of theAfrican Humid Period, Quat. Int., 150, 95–102.
Reynaud-Farrera, I. (1995), Histoire des paleoenvironnements forestiers duSud-Cameroun a partir d’analyses palynologiques et statistiques de de-pots holocenes et actuels, Ph.D. thesis, 198 pp., Univ. Montpellier 2,Montpellier, France.
Servant, M., and S. Servant-Vildary (1980), L’environnement quaternairedu bassin du Tchad, in The Sahara and the Nile, edited by M. A. J.Williams and H. Faure, pp. 133–162, A. A. Balkema, Brookfield, Vt.
Stager, J. C., and R. Anfang-Sutter (1999), Preliminary evidence of envir-onmental changes at Lake Bambili (Cameroon, West Africa) since 24,000B.P., J. Paleolimnol., 22, 319–330.
Street-Perrott, F. A., and R. A. Perrott (1993), Holocene vegetation, lakelevels and climate of Africa, in Global Climates Since the Last GlacialMaximum, edited by H. E. Wright et al., pp. 318–356, Univ. of Minn.Press, Minneapolis.
Talbot, M. R., D. A. Livingstone, P. G. Palmer, J. Maley, J. M. Melack,G. Delibrias, and S. Gulliksen (1984), Preliminary results from sedimentcores from Lake Bosumtwi, Ghana, in Palaeoecology of Africa and theSurrounding Islands, vol. 16, edited by J. A. Coetzee and E. M. VanZinderen Bakker, pp. 173–192, A. A. Balkema, Brookfield, Vt.
Texier, D., N. de Noblet, S. P. Harrison, A. Haxeltine, D. Jolly, S. Joussaume,F. Laarif, I. C. Prentice, and P. Tarasov (1997), Quantifying the role ofbiosphere-atmosphere feedbacks in climate change: coupled model simu-lation for 6000 years B.P. and comparison with palaeodata for northernEurasia and northern Africa, Clim. Dyn., 13, 865–882.
Texier, D., N. de Noblet, and P. Braconnot (2000), Sensitivity of the Africanand Asian monsoons to mid-Holocene insolation and data-inferred sur-face changes, J. Clim., 13, 164–181.
Thompson, L. G., et al. (2002), Kilimanjaro ice core records: Evidence ofHolocene climate change in tropical Africa, Science, 298, 589–593.
Vincens, A., G. Buchet, D. Williamson, and M. Taieb (2005), A 23,000 yrpollen record from Lake Rukwa (8�S, SW Tanzania): New data on ve-getation dynamics and climate in central eastern Africa, Rev. Palaeobot.Palynol., 137, 147–162.
Williamson, D., A. Jelinowska, C. Kissel, P. Tucholka, E. Gibert, F. Gasse,M.Massault, M. Taieb, E. VanCampo, andK.Wiekowski (1998),Mineral-magnetic proxies of erosion/oxidation cycles in tropical maar-lake sedi-ments (Lake Tritrivakely, Madagascar): Paleoenvironmental implications,Earth Planet. Sci. Lett., 155, 205–219.
�����������������������R. Bonnefille, F. Chalie, and J. Guiot, Centre Europeen de Recherche et
d’Enseignement des Geosciences de l’Environnement, CNRS UMR 6635,Universite Paul Cezanne, BP 80, F-13545 Aix-en-Provence cedex 04,France. ([email protected]; [email protected]; [email protected])P. Braconnot, Laboratoire des Sciences du Climat et de l’Environnement/
Institut Pierre-Simon Laplace, Unite mixte CEA-CNRS-UVSQ, F-91191Gif-sur-Yvette Cedex, France. ([email protected])D. Jolly, Institut des Sciences de l’Evolution, Case 61, UMR CNRS
5554, Universite Montpellier II, F-34095 Montpellier cedex 5, France.([email protected])O. Peyron, Laboratoire de Chrono-Ecologie, UMR CNRS 6565,
Universite de Franche-Comte, F-25030 Besancon, France. ([email protected])D. Wirrmann, UR055 Paleotropique, Institut de Recherche pour le
Developpement, BP A5, F-98848 Noumea cedex, New Caledonia.([email protected])
D24110 PEYRON ET AL.: CLIMATE OF AFRICA—MODEL-DATA COMPARISON
9 of 9
D24110
Copyright © 2022 FDOKUMEN