Prefrontal cortex and schizophrenia: A quantitative magnetic resonance imaging study
Upload
khangminh22Category
view
1download
0
QUANTITATIVE MAGNETIC
RESONANCE IMAGING IN TRAUMATIC
BRAIN INJURY
Christopher James Andrew Cowie MRCSEd
Doctor of Medicine
Newcastle Magnetic Resonance Centre
Institute of Cellular Medicine
Newcastle University
November 2011
i
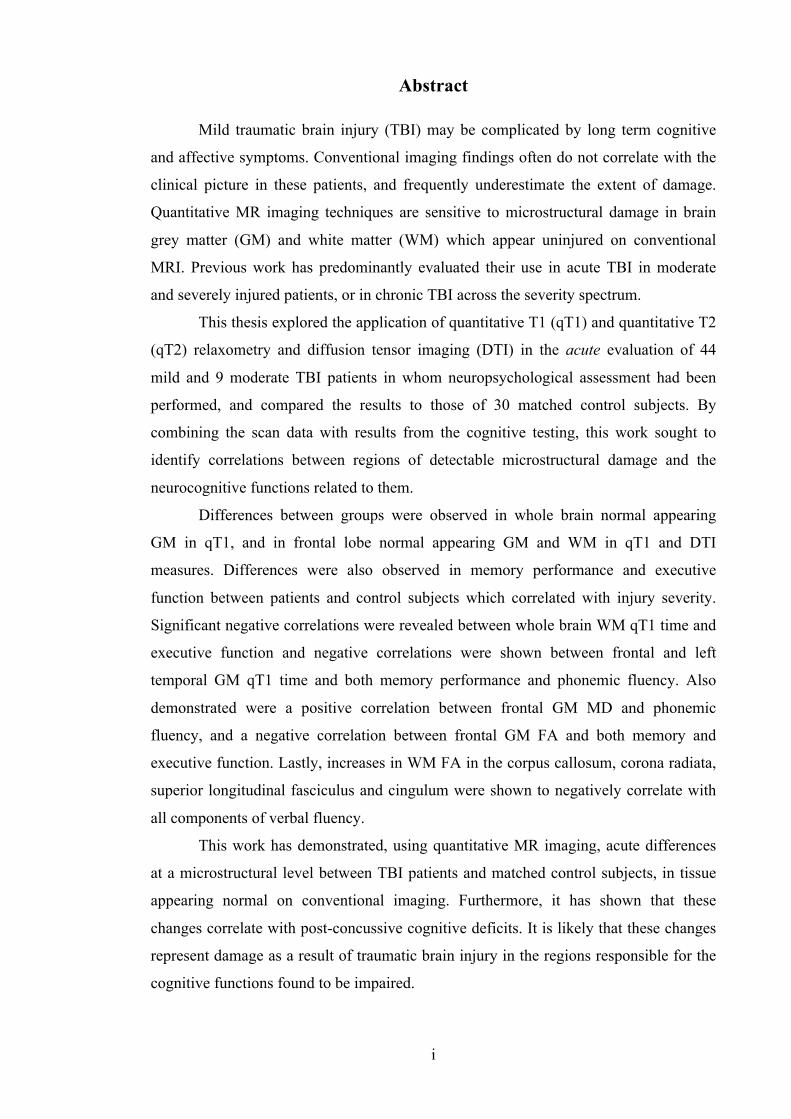
Abstract
Mild traumatic brain injury (TBI) may be complicated by long term cognitive
and affective symptoms. Conventional imaging findings often do not correlate with the
clinical picture in these patients, and frequently underestimate the extent of damage.
Quantitative MR imaging techniques are sensitive to microstructural damage in brain
grey matter (GM) and white matter (WM) which appear uninjured on conventional
MRI. Previous work has predominantly evaluated their use in acute TBI in moderate
and severely injured patients, or in chronic TBI across the severity spectrum.
This thesis explored the application of quantitative T1 (qT1) and quantitative T2
(qT2) relaxometry and diffusion tensor imaging (DTI) in the acute evaluation of 44
mild and 9 moderate TBI patients in whom neuropsychological assessment had been
performed, and compared the results to those of 30 matched control subjects. By
combining the scan data with results from the cognitive testing, this work sought to
identify correlations between regions of detectable microstructural damage and the
neurocognitive functions related to them.
Differences between groups were observed in whole brain normal appearing
GM in qT1, and in frontal lobe normal appearing GM and WM in qT1 and DTI
measures. Differences were also observed in memory performance and executive
function between patients and control subjects which correlated with injury severity.
Significant negative correlations were revealed between whole brain WM qT1 time and
executive function and negative correlations were shown between frontal and left
temporal GM qT1 time and both memory performance and phonemic fluency. Also
demonstrated were a positive correlation between frontal GM MD and phonemic
fluency, and a negative correlation between frontal GM FA and both memory and
executive function. Lastly, increases in WM FA in the corpus callosum, corona radiata,
superior longitudinal fasciculus and cingulum were shown to negatively correlate with
all components of verbal fluency.
This work has demonstrated, using quantitative MR imaging, acute differences
at a microstructural level between TBI patients and matched control subjects, in tissue
appearing normal on conventional imaging. Furthermore, it has shown that these
changes correlate with post-concussive cognitive deficits. It is likely that these changes
represent damage as a result of traumatic brain injury in the regions responsible for the
cognitive functions found to be impaired.

ii
To my wife Emma,
and our beautiful boy, Thomas
iii
Acknowledgements
I wish to acknowledge and thank the following people:
Professor Andrew Blamire, Professor of MRI physics, University of Newcastle upon Tyne. For the idea behind the work and for submitting the applications for funding and ethical approval, without which this thesis would not have been possible. For the design of the MR scan sequences used in the study, for his assistance with data pre-processing by writing a number of software programs, for guidance with statistical analysis and lastly for his supervision, support and most importantly, his patience.
Professor David Mendelow, Professor of Neurosurgery, University of Newcastle upon Tyne and Honorary Consultant Neurosurgeon, Newcastle upon Tyne Hospitals Trust. For his supervision and guidance. I am pleased to be able to have proved wrong the last of Nick Todd’s three great lies: “the thesis is almost finished…”
Mr Patrick Mitchell, Consultant Neurosurgeon, Newcastle upon Tyne Hospitals Trust and Honorary Clinical Senior Lecturer, University of Newcastle upon Tyne. For his supervision and helpful support.
Josh Wood and Anna Peel, Neuropsychology Research Assistants, University of Newcastle upon Tyne. For assistance with the neuropsychology testing, data recording, scan booking, control subject and patient recruitment, guidance in matters neuropsychological and for moral support.
Dr Benjamin Aribisala, Research Associate, University of Newcastle upon Tyne. For the design of the 14 automated region of interest analysis technique, for assistance with data extraction and pre-processing by writing software programs and for his guidance and patience in assisting me with the use of those programs.
Dr Jiabao He, Research Fellow, University of Newcastle upon Tyne. For the design of the MR scan sequences used in the study and for his relentless encouragement.
Carol Smith, Louise Morris, Tamsin Gaudie and Tim Hodgson, Senior Research Radiographers at the Newcastle Magnetic Resonance Centre, University of Newcastle upon Tyne. For assistance with scanning.
Helen Hastie, Head Injury Clinical Nurse Specialist, Newcastle upon Tyne Hospitals Trust. For assistance with patient recruitment.
Dr Thomas Kelly, and Dr David Millar, Consultant Neuropsychologists, Newcastle upon Tyne Hospitals Trust. For their guidance with the selection of the neuropsychology test battery, and assistance with the interpretation of the results.
Iain Croall, PhD student, University of Newcastle upon Tyne. For performing the tract-based spatial statistics (TBSS) analysis.

iv
The Sir Jules Thorn Charitable Trust, for providing the funding for the study through their award for biomedical research, for providing the funding for this doctorate as part of that award and for having the foresight to recognise the need for further research in this field.
…and lastly my father, whose enthusiasm for neurosurgery ignited my own interest and encouraged me to learn it for myself.

v
Declaration
All of the work in this thesis is my own except for: the design of the MR scan sequences
used in the study (Professor Blamire and Dr He), the writing of the software programs
required for data extraction and pre-processing (Professor Blamire and Dr Aribisala),
the design of the 14 automated region of interest analysis technique (Dr Aribisala) and
the analysis of the data using tract-based spatial statistics (Mr Croall).
vi
List of Presentations and Publications
Presentations made to learned societies based on research presented in this thesis:
Cowie CJA, Aribisala BS, He J, Peel A, Wood J, Mendelow AD, Mitchell P, Blamire AM. DTI findings in normal appearing grey and white matter correlate with deficits in cognitive function after mild and moderate traumatic brain injury. 159th Meeting of the Society of British Neurological Surgeons. Aberdeen, April 2012.
Cowie CJA, Aribisala BS, He J, Peel A, Wood J, Mendelow AD, Mitchell P, Blamire AM. Grey matter analysis using diffusion tensor imaging after mild and moderate traumatic brain injury and correlations with deficits in cognitive function. British Neurosurgical Research Group annual meeting. Darlington, March 2012.
Aribisala BS, Cowie CJA, He J, Mendelow D, Mitchell P, Blamire AM. A histogram based method for detecting brain injury using quantitative T1 MR scans. ESMRMB Congress, Leipzig, Germany. October 2011.
Kenyon S, Cowie CJA, Aribisala B, He J, Mitchell P, Mendelow D, Blamire AM. Chronic hyperaemia in deep grey matter following mild and moderate traumatic brain injury. ESMRMB Congress, Leipzig, Germany. October 2011.
Smith FE, Croall I, Cowie CJA, He J, Aribisala A, Peel A, Mendelow D, Mitchell P, Blamire AM. Proton MR spectroscopic imaging and DTI following acute traumatic brain injury. ESMRMB Congress, Leipzig, Germany. October 2011.
Cowie CJA, Aribisala BS, He J, Wood J, Mendelow AD, Mitchell P, Blamire AM. MR relaxometry and diffusion tensor imaging of normal appearing white matter in mild traumatic brain injury. Congress of Neurological Surgeons, San Francisco, USA. October 2010.
Aribisala BS, Cowie CJA, He J, Wood J, Mendelow AD, Mitchell P, Blamire AM. Multi-parametric evaluation of mild traumatic brain injury patients using a support vector machine. British Chapter ISMRM 16, Nottingham. September 2010.
Cowie CJA, Aribisala BS, He J, Wood J, Mendelow AD, Mitchell P, Blamire AM. Diffusion tensor imaging detects frontal lobe changes in normal appearing white matter after mild TBI. International Conference on Recent Advances in Neurotraumatology, St. Petersburg, Russia. June 2010.
Cowie CJA, Aribisala BS, He J, Wood J, Mendelow AD, Mitchell P, Blamire AM. MR relaxometry and diffusion tensor imaging of normal appearing white matter in mild traumatic brain injury. ISMRM 18, Stockholm, Sweden. May 2010.
Aribisala BS, Cowie CJA, He J, Wood J, Mendelow AD, Mitchell P, Blamire AM. Detection of tissue changes in traumatic brain injury patients using automatic regional analysis of quantitative MR scans. ISMRM 18, Stockholm, Sweden. May 2010.
vii
Cowie CJA, Aribisala BS, He J, Wood J, Mendelow AD, Mitchell P, Blamire AM. Quantitative MRI reveals abnormalities in normal appearing white matter following mild head injury. 155th Meeting of the Society of British Neurological Surgeons. Cambridge, March 2010.
Cowie CJA, Aribisala BS, He J, Wood J, Mendelow AD, Mitchell P, Blamire AM. Detection of abnormalities in normal appearing white matter after mild TBI. British Neurosurgical Research Group annual meeting. Winchester, March 2010.
Aribisala BS, Cowie CJA, He J, Wood J, Mendelow AD, Mitchell P, Blamire AM. Detection of abnormalities in traumatic brain injury patients using automatic regional analysis of quantitative MR Scans. British Chapter ISMRM 15, Cardiff September 2009.
Publication based on research presented in this thesis:
Aribisala BS, Cowie CJA, He J, Wood J, Mendelow AD, Mitchell P, Blamire AM. (2010) Multi-parametric Classification of Traumatic Brain Injury Patients Using Automatic Analysis of Quantitative MRI Scans. Lecture Notes in Computer Science, 6326, Medical Imaging and Augmented Reality, 51-59.
viii
Table of Contents
page
Abstract ........................................................................................................................... i
Acknowledgements ....................................................................................................... iii
Declaration ..................................................................................................................... v
List of Presentations and Publications ....................................................................... vi
Table of Contents ....................................................................................................... viii
List of Abbreviations ................................................................................................... xv
List of Figures ........................................................................................................... xviii
List of Tables ............................................................................................................. xxii
Chapter 1: Traumatic Brain Injury ............................................................................ 1
1.1 Background ................................................................................................. 1
1.2 Definition of Head Injury ............................................................................ 1
1.3 Incidence of Head Injury ............................................................................ 2
1.4 Age .............................................................................................................. 4
1.5 Sex ............................................................................................................... 4
1.6 Prevalence of Head Injury .......................................................................... 5
1.7 Classification ............................................................................................... 6
1.8 Definition and Classification of Mild TBI .................................................. 6
1.9 Aetiology ..................................................................................................... 7
1.10 Pathology: Primary Brain Injury ............................................................... 8
1.10.1 Focal TBI ...................................................................................... 8
1.10.2 Diffuse injury ................................................................................ 9
1.10.3 Diffuse axonal injury .................................................................... 9
1.10.4 Diffuse vascular injury ............................................................... 10
1.10.5 Pathophysiology of acute TBI .................................................... 11
1.10.6 Pathophysiology: glucose metabolism ....................................... 11
1.10.7 Pathophysiology: lactate metabolism ......................................... 11
1.10.8 Pathophysiology: calcium influx and glutamate release ............ 12
1.10.9 Pathophysiology: production of reactive oxygen species .......... 12
1.10.10 Pathophysiology: N-acetyl aspartate synthesis ........................ 12
1.10.11 Pathophysiology: choline and acetylcholine synthesis ............ 13
ix
1.11 Pathology: Secondary Brain Injury ......................................................... 14
1.11.1 Ischaemia .................................................................................... 14
1.11.2 Oedema ....................................................................................... 14
1.12 Symptoms in TBI .................................................................................... 15
1.12.1 Headaches .................................................................................. 16
1.12.2 Cranial nerve symptoms ............................................................. 16
1.12.3 Affective symptoms ..................................................................... 17
1.12.4 Cognitive symptoms .................................................................... 17
1.13 Mortality ................................................................................................. 17
1.14 Summary ................................................................................................. 18
Chapter 2: Imaging in Head Injury .......................................................................... 19
2.1 Computed Tomography Scanning ............................................................ 19
2.2 MRI Basic Principles ................................................................................ 20
2.3 MRI in Head Injury ................................................................................... 22
2.4 Structural MRI .......................................................................................... 23
2.4.1 T1 and T2 anatomical sequences ................................................. 23
2.4.2 FLAIR ........................................................................................... 25
2.4.3 T2* GRE ....................................................................................... 25
2.4.4 Quantitative T1 and T2 relaxometry ............................................ 26
2.5 Diffusion Weighted Imaging ................................................................... 28
2.5.1 DWI principles .............................................................................. 28
2.5.2 DWI in brain injury ...................................................................... 29
2.6 Diffusion Tensor Imaging ......................................................................... 30
2.6.1 DTI principles ............................................................................... 30
2.6.2 DTI analysis techniques ............................................................... 32
2.6.3 DTI in brain injury ....................................................................... 33
2.6.4 DTI white matter analysis in chronic TBI .................................... 33
2.6.5 DTI white matter analysis in acute and sub-acute
TBI ......................................................................................................... 35
2.6.6 DTI grey matter analysis in TBI ................................................... 37
2.6.7 DTI correlation with clinical outcome and
neuropsychology performance .............................................................. 38
2.7 Summary ................................................................................................... 40
x
Chapter 3: Neuropsychology in Head Injury ........................................................... 42
3.1 Background ............................................................................................... 42
3.2 Detectable Cognitive Symptoms ............................................................... 42
3.2.1 Attention/concentration ................................................................ 43
3.2.2 Memory ......................................................................................... 43
3.2.3 Executive function ........................................................................ 45
3.3 Neuropsychological Tests used in TBI ..................................................... 45
3.3.1 National adult reading test (NART) ............................................. 46
3.3.2 The BIRT memory and information processing
battery (BMIPB) .................................................................................... 46
3.3.3 Speed of information processing .................................................. 47
3.3.4 Design learning ............................................................................ 47
3.3.5 List learning .................................................................................. 49
3.3.6 Paced auditory serial addition test (PASAT) ............................... 49
3.3.7 Digit span backwards ................................................................... 51
3.3.8 Spatial span backwards ................................................................ 52
3.3.9 Verbal fluency (letter and category) ............................................. 53
3.3.10 D-KEFS colour-word interference test ...................................... 54
3.4 Summary ................................................................................................... 56
Chapter 4: Investigation of Structural MRI in Mild and Moderate
Traumatic Brain Injury: Methodology ..................................................................... 58
4.1 Rationale for the Study ............................................................................. 58
4.2 Study Aims ................................................................................................ 58
4.3 Study Hypotheses ...................................................................................... 59
4.4 Study Type ................................................................................................ 59
4.5 Study Design ............................................................................................. 59
4.6 Patient Recruitment Strategy .................................................................... 60
4.7 Inclusion Criteria ...................................................................................... 62
4.7.1 Age ................................................................................................ 62
4.7.2 GCS ............................................................................................... 63
4.7.3 Time from injury to scan ............................................................... 63
4.7.4 Previous medical history .............................................................. 64
4.7.5 Coexisting injuries ........................................................................ 64
4.7.6 Language barriers ........................................................................ 64
xi
4.7.7 Contraindications to MR scanning ............................................... 64
4.8 Control Subject Recruitment ..................................................................... 65
4.9 Data Collected ........................................................................................... 65
4.10 Scan Data Acquisition ............................................................................. 66
4.10.1 Anatomical images ..................................................................... 66
4.10.2 T1 mapping .................................................................................. 66
4.10.3 T2 mapping .................................................................................. 67
4.10.4 Diffusion tensor imaging (DTI) .................................................. 67
4.10.5 B0 field mapping ......................................................................... 67
4.11 Scan Data Processing .............................................................................. 68
4.11.1 Format conversion ...................................................................... 68
4.11.2 Brain extraction .......................................................................... 68
4.11.3 Movement correction .................................................................. 69
4.11.4 Fitting ......................................................................................... 69
4.11.5 Unwarping .................................................................................. 69
4.11.6 Registration ................................................................................ 70
4.11.7 Visible lesion removal ............................................................... 70
4.11.8 Tissue segmentation .................................................................... 71
4.12 Scan Data Analysis ................................................................................ 72
4.12.1 Method 1: Five regions of interest technique ............................. 73
4.12.2 Method 2: Fourteen automated regions of interest .................... 76
4.12.3 Method 3: Tractography based regions of interest .................... 78
4.12.4 Method 4: Tract based spatial statistics (TBSS) ........................ 80
4.13 Statistical Analysis of Scan Data ............................................................ 81
4.14 Neuropsychological Testing ................................................................... 82
4.15 Statistical Analysis of Neuropsychology Data ....................................... 84
4.16 Analysis of Scan Data with Reference to the
Neuropsychological Data ................................................................................ 84
Chapter 5: Results: Demographics and Quantitative MR Imaging Findings ....... 85
5.1 Demographics ........................................................................................... 85
5.1.1 Recruitment ................................................................................... 85
5.1.2 Patient group demographics ........................................................ 85
5.1.3 Injury characteristics .................................................................... 87
5.1.4 Control group matching ............................................................... 91
S4
xii
5.1.5 Time from injury to scan ............................................................... 92
5.1.6 Scan data obtained ....................................................................... 92
5.2 Method 1: Five Regions of Interest Technique ......................................... 96
5.2.1 Test for normality ......................................................................... 96
5.2.2 Group comparison – whole brain grey and white
matter data ............................................................................................. 97
5.2.3 Sub-group comparison – mild TBI assessed
by AAN grade ...................................................................................... 100
5.2.4 Sub-group comparison – ROIs remote from
any visible lesion ................................................................................. 101
5.2.5 Sub-group comparison – ROIs adjacent to
any visible lesion ................................................................................. 103
5.2.6 Further analysis – correlation with GCS, LOC and PTA .......... 106
5.3 Method 2: Fourteen Automated Regions of Interest ............................... 109
5.3.1 Test for normality ....................................................................... 109
5.3.2 Group comparison by region – qT1 data in white
and grey matter .................................................................................... 111
5.3.3 Group comparison by region – qT2 data in white
and grey matter .................................................................................... 114
5.3.4 Group comparison by region – MD data in white
and grey matter .................................................................................... 114
5.3.5 Group comparison by region – FA data in white
and grey matter .................................................................................... 117
5.4 Method 3: Tractography Based Regions of Interest ............................... 118
5.4.1 Test for normality ....................................................................... 118
5.4.2 Group comparison – mean diffusivity ........................................ 119
5.4.3 Group comparison – fractional anisotropy and eigenvalues ..... 119
5.4.4 Sub-group comparison – mild TBI assessed by AAN grade ....... 120
5.5 Method 4: Tract Based Spatial Statistics (TBSS) ................................... 121
5.5.1 Group comparison – white matter tract fractional
anisotropy ............................................................................................ 121
5.6 Discussion ............................................................................................... 123
5.6.1 Whole brain analysis .................................................................. 123
5.6.2 Analysis by AAN grade ............................................................... 124
5.6.3 Analysis of regions remote from any visible lesion .................... 124
xiii
5.6.4 Analysis of regions adjacent to any visible lesion ...................... 125
5.6.5 Fourteen automated ROI technique findings ............................. 125
5.6.6 Findings in qT1 and qT2 data .................................................... 127
5.6.7 Findings in DTI data .................................................................. 128
5.7 Limitations .............................................................................................. 133
5.8 Conclusions ............................................................................................. 135
5.8.1 Ability of quantitative MR scanning to detect
microstructural changes ...................................................................... 135
5.8.2 Relationship between detectable microstructural changes and brain
injury severity ...................................................................................... 136
Chapter 6: Results: Neuropsychology Findings and the Relationship Between
Impaired Cognitive Function and Imaging Abnormalities ................................... 138
6.1 Neuropsychology Test Result Group Comparisons ................................ 138
6.1.1 Test for normality ....................................................................... 138
6.1.2 National adult reading test (NART) ........................................... 139
6.1.3 Speed of information processing ................................................ 139
6.1.4 Design learning .......................................................................... 140
6.1.5 List learning ................................................................................ 141
6.1.6 Paced auditory serial addition test (PASAT) ............................. 142
6.1.7 Digit span backwards (DSPAN back) ........................................ 143
6.1.8 Spatial span backwards .............................................................. 144
6.1.9 Verbal fluency ............................................................................. 145
6.1.10 D-KEFS colour-word interference test .................................... 147
6.2 Analysis of Scan Data with Reference to the
Neuropsychology Data .................................................................................. 148
6.2.1 Correlation between speed of information processing
score and scan data ............................................................................. 149
6.2.2 Correlation between design learning scores and
scan data .............................................................................................. 151
6.2.3 Correlation between list learning scores and scan data ............ 153
6.2.4 Correlation between paced auditory serial addition
test scores and scan data ..................................................................... 155
6.2.5 Correlation between digit span backwards test
scores and scan data ........................................................................... 157
xiv
6.2.6 Correlation between verbal fluency test scores and
scan data .............................................................................................. 157
6.2.7 Correlation between colour-word interference test
scores and scan data ........................................................................... 165
6.3 Discussion ............................................................................................... 168
6.3.1 Group comparison of predicted IQ ............................................ 168
6.3.2 Group comparison of the neuropsychology results by
cognitive function ................................................................................ 168
6.3.3 Analysis of the scan data with reference to cognitive
function ................................................................................................ 171
6.3.4 Neuropsychology test score correlations with the
qT1 data ............................................................................................... 172
6.3.5 Neuropsychology test score correlations with the
DTI data ............................................................................................... 174
6.3.6 Analysis of significant correlations ............................................ 175
6.4 Limitations .............................................................................................. 179
6.5 Conclusions ............................................................................................. 181
Chapter 7: Summary ................................................................................................ 183
7.1 Main Findings ......................................................................................... 183
7.1.1 Quantitative MR scan findings ................................................... 183
7.1.2 Neuropsychology findings .......................................................... 185
7.1.3 Correlations between quantitative MR data and
neuropsychology test scores ................................................................ 186
7.2 Limitations .............................................................................................. 188
7.3 Future Work ............................................................................................ 190
7.4 Conclusion .............................................................................................. 192
Appendix A ................................................................................................................ 193
Appendix B ................................................................................................................ 194
Appendix C ................................................................................................................ 195
Appendix D ................................................................................................................ 196
References .................................................................................................................. 197
xv
List of Abbreviations
2D two dimensional
3D three dimensional
3T 3 tesla
AAN American Academy of Neurology
AC-PC line a line between the anterior and posterior commissure
ADC apparent diffusion coefficient
AMIPB Adult Memory and Information Processing Battery
APP amyloid precursor protein
ASL arterial spin labelling
BET brain extraction tool
BIRT Brain Injury Rehabilitation Trust
BMIPB BIRT Memory and Information Processing Battery
D-KEFS Delis-Kaplan Executive Function System
DSPAN back digit span backwards
CDC Centers for Disease Control
CLEAR coupled and linked equations algorithm
CNS central nervous system
CSF cerebro-spinal fluid
CT computed tomography
DAI diffuse axonal injury
DTI diffusion tensor imaging
DTIFIT FMRIB’s diffusion tensor model fitting tool
DVI diffuse vascular injury
DWI diffusion weighted imaging
EPI echo planar image
FA fractional anisotropy
FLAIR fluid attenuated inversion recovery
FLIRT FMRIB’s linear image registration tool
fMRI functional magnetic resonance imaging
FMRIB Oxford Centre for Functional MRI of the Brain
FUGUE FMRIB’s utility for geometrically unwarping EPIs
GCS Glasgow Coma Scale
GCSE General certificate of secondary education

xvi
GM grey matter
GOS Glasgow Outcome Scale
GP General Practitioner
GRASE gradient spin echo
GRE gradient recalled echo
HES hospital episode statistics
ICD-10 International classification of diseases (10th edition)
ICP intra-cranial pressure
IQ intelligence quotient
IR inversion recovery
LOC loss of consciousness
MD mean diffusivity
MPRAGE magnetisation prepared rapid gradient echo
MR magnetic resonance
MRI magnetic resonance imaging
MRS magnetic resonance spectroscopy
mTBI mild traumatic brain injury
MVA motor vehicle accident
NART national adult reading test
NICE National Institute for Clinical Excellence
PASAT paced auditory serial addition test
PCS post-concussive symptom(s)
PGSE pulsed gradient spin echo
PRELUDE FMRIB’s phase region expanding labeller for unwrapping
discrete estimates
PTA post-traumatic amnesia
qT1 quantitative T1
qT2 quantitative T2
RANDOMISE FMRIB’s permutation-based nonparametric inference tool
RAVLT Rey Auditory Verbal Learning Test
RCFT Rey Complex Figure Test
ROI region of interest
RTA road traffic accident
SD standard deviation
SENSE factor sensitivity encoding
xvii
SPECT single photon emission computed tomography
SoIP speed of information processing
TBI traumatic brain injury
TBSS tract based spatial statistics
TE echo time
TI inversion time
TR repetition time
UK United Kingdom
US United States
WAIS Wechsler Adult Intelligence Scale
WHO World Health Organisation
WM white matter
WNV Wechsler Non-Verbal scale of ability
xviii
List of Figures page
Chapter 1
1.1: Plot of age specific TBI incidence data ............................................................ 4
Chapter 2
2.1: Examples of TBI on axial CT scans ............................................................... 19
2.2: Behaviour of nuclei within a magnetic field ................................................... 20
2.3: Behaviour of nuclei after an applied radiofrequency pulse ............................ 21
2.4: Graph showing the T1 relaxation .................................................................... 23
2.5: TBI on conventional anatomical MRI scans ................................................... 24
2.6: T2 and FLAIR images showing a right subacute subdural haematoma ......... 25
2.7: T2 and T2*GRE images showing a right subacute subdural haematoma ...... 26
2.8: A model of anisotropic diffusion of water molecules ..................................... 30
Chapter 3
3.1: The BIRT design learning test ........................................................................ 48
3.2: The ‘spatial span backwards’ testing board .................................................... 52
3.3: Examples of the colour-word interference test ............................................... 55
Chapter 4
4.1: Formula to determine study sample size ......................................................... 60
4.2: T1 weighted MR scan showing brain extraction ............................................ 68
4.3: Lesion masking ............................................................................................... 71
4.4: Tissue segmentation maps .............................................................................. 71
4.5: ROIs from the 5 ROI method ......................................................................... 74
4.6: 3D renders of the ROIs from the 5 ROI method ............................................. 74
4.7: Data extraction process in the 5 ROI method ................................................. 75
4.8: 2D images and 3D renders of the ROIs from the 14 automated
ROI method ............................................................................................................ 77
4.9: Data extraction process in the 14 automated ROI method ............................. 78
4.10: Examples of the tract-based ROIs ................................................................. 79
4.11: Creation of the tractography based ROIs ...................................................... 79
4.12: Examples of TBSS images ............................................................................ 81

xix
Chapter 5
5.1: Graph showing age distribution of recruited TBI patients .............................. 86
5.2: Chart showing injury causes in the TBI group ............................................... 86
5.3: Graph showing the time from TBI to scan ...................................................... 92
5.4: Examples of the scan sequences obtained in each patient .............................. 93
5.5: An example of lesion masking in a mild TBI patient ..................................... 94
5.6: Box plots showing whole brain white matter qT1, qT2, MD and
FA means ............................................................................................................... 97
5.7: Box plots showing whole brain grey matter qT1, qT2, MD and
FA means ............................................................................................................... 98
5.8: Box plots showing paired comparison of whole brain grey matter
qT1 means ............................................................................................................. 99
5.9: Box plots showing whole brain white matter qT1, qT2, MD and
FA means by AAN grade ..................................................................................... 100
5.10: Box plots showing whole brain grey matter qT1, qT2, MD and FA
means by AAN grade ........................................................................................... 101
5.11: Box plot showing hemisphere grey matter qT1 contralateral to any
visible lesion ........................................................................................................ 103
5.12: Box plots showing ipsilateral hemisphere and frontal lobe grey
matter qT1 and MD .............................................................................................. 104
5.13: Box plots showing paired comparison of ipsilateral hemisphere
grey matter qT1 .................................................................................................... 105
5.14: Box plots showing ipsilateral hemisphere and frontal lobe grey
matter MD ............................................................................................................ 106
5.15: Scatter plots of whole brain white matter qT1 and GCS score ................... 107
5.16: Box plots showing white matter qT1 means from 14 ROI method ............ 112
5.17: Box plots showing grey matter qT1 means from 14 ROI method .............. 113
5.18: Box plots showing white matter MD means from 14 ROI method ............ 116
5.19: Box plots showing grey matter MD means from 14 ROI method .............. 116
5.20: Box plots showing grey matter FA means from 14 ROI method ............... 117
5.21: Box plots showing white matter MD means from tractography
defined ROIs ........................................................................................................ 119
5.22: Box plots showing white matter FA means from tractography
defined ROIs ........................................................................................................ 120
xx
5.23: TBSS images showing FA differences between the whole TBI
group and controls ................................................................................................ 122
5.24: TBSS images showing FA differences between the mild TBI
group and controls ................................................................................................ 122
Chapter 6
6.1: Box plot comparing SoIP test scores between groups .................................. 140
6.2: Box plot comparing a design learning test score between groups ................ 141
6.3: Box plots comparing list learning test scores between groups ..................... 142
6.4: Box plot comparing PASAT scores between groups .................................... 143
6.5: Box plot comparing DSPAN back test scores between groups .................... 144
6.6: Box plot comparing spatial span backwards test scores between
groups ................................................................................................................... 145
6.7: Box plots comparing verbal fluency test scores between groups ................. 146
6.8: Box plots comparing colour – word interference test times between
groups ................................................................................................................... 147
6.9: Scatter plot showing the relationship between frontal lobe grey
matter FA and SoIP adjusted total score .............................................................. 150
6.10: Scatter plot showing the relationship between the interference
design ‘B’ recall score and frontal grey matter qT1 ............................................ 151
6.11: Scatter plots showing the relationships between frontal grey
matter FA and design learning scores .................................................................. 152
6.12: Scatter plots showing relationships between frontal grey matter
FA a design learning score ................................................................................... 153
6.13: Scatter plot showing the relationship between left superior frontal
lobe grey matter FA and a list learning score ...................................................... 154
6.14: Scatter plots showing relationships between whole brain white
matter qT1 and PASAT scores ............................................................................. 155
6.15: Scatter plot showing the relationship between frontal grey
matter FA and a PASAT score ............................................................................. 156
6.16: Scatter plots showing correlations between letter fluency scores
and frontal grey matter qT1 and MD ................................................................... 158
6.17: Scatter plots showing correlations between category fluency
scores and frontal grey matter MD and FA .......................................................... 159
xxi
6.18: Scatter plots showing correlations between switching scores and
frontal grey matter MD and FA ........................................................................... 160
6.19: Scatter plots showing correlations between switching scores and
frontal white matter FA. ....................................................................................... 160
6.20: Scatter plot showing a correlation between left temporal grey
matter qT1 and letter fluency score. ..................................................................... 161
6.21: Scatter plot showing a correlation between corpus callosum
genu white matter FA and the letter fluency score .............................................. 162
6.22: Scatter plot showing a correlation between letter fluency test
scores and corpus callosum splenium white matter MD. ..................................... 162
6.23: Scatter plots showing correlations between letter fluency test
scores and corpus callosum splenium eigen values ............................................. 163
6.24: TBSS images showing FA differences after regression analysis
between letter fluency scores and the whole patient group ................................. 164
6.25: TBSS images showing FA differences after regression analysis
between letter fluency scores and the mild TBI patient group ............................ 164
6.26: TBSS images showing FA differences after regression analysis
between category fluency scores and the whole patient group ............................ 165
6.27: Scatter plot showing a correlation between colour-word interference
test part 4 time and frontal lobe white matter qT1 ............................................... 166
6.28: Scatter plots showing a correlation between colour-word interference
test times for parts 3 and 4 and frontal lobe grey matter FA ............................... 166
6.29: Scatter plot showing a correlation between colour-word interference
test part 4 time and left superior frontal white matter qT1 .................................. 167
xxii
List of Tables
page
Chapter 1
1.1: WHO ICD-10 codes most likely to indicate brain injury ................................. 3
1.2: Outcome for patients with mild TBI at 1 year .................................................. 5
1.3: The Glasgow Coma Scale ................................................................................. 6
1.4: The AAN concussion grading system ............................................................... 7
1.5: Sequelae of mild TBI ...................................................................................... 15
Chapter 2
2.1: Appearance of haemorrhage on T1 and T2 weighted scans ........................... 24
Chapter 3
3.1: Cognitive symptoms associated with brain lesion locations ........................... 43
Chapter 4
4.1: Study inclusion criteria ................................................................................... 62
4.2: Groups of educational achievement used ....................................................... 65
4.3: Brodmann areas combined to create the 14 ROI method regions .................. 76
4.4: Neuropsychological tests used in the study .................................................... 83
Chapter 5
5.1: Mild TBI patients grouped by AAN grade ..................................................... 87
5.2: Demographic data for the mild TBI patient group (Over two pages) ........ 88-89
5.3: Demographic data for the moderate TBI patient group .................................. 90
5.4: Comparison of patient group and control group characteristics ..................... 91
5.5: Laterality of visible lesions present in the patient groups ............................... 95
5.6: Lobar location of visible lesions present in the patient groups ....................... 95
5.7: Five ROI data tested for normality ................................................................. 96
5.8: Comparison of hemisphere ROI means contralateral to visible lesions ....... 102
5.9: Correlation between whole brain white matter qT1 mean and GCS ............ 107
5.10: Numbers assigned to each region for purposes of analysis ........................ 109
5.11: Fourteen ROI data tested for normality ...................................................... 110
5.12: Difference in the qT1 between groups in white and grey matter regions ... 111

xxiii
5.13: No significant differences in the qT2 between groups ............................... 114
5.14: Difference in the MD between groups in white and grey matter regions ... 115
5.15: Difference in the FA between groups in two grey matter regions .............. 117
5.16: Tract-based ROI data tested for normality .................................................. 118
Chapter 6
6.1: Numbers completing each neuropsychology test ......................................... 138
6.2: Data from the neuropsychology test scores tested for normality .................. 139
1
Chapter 1. Traumatic Brain Injury
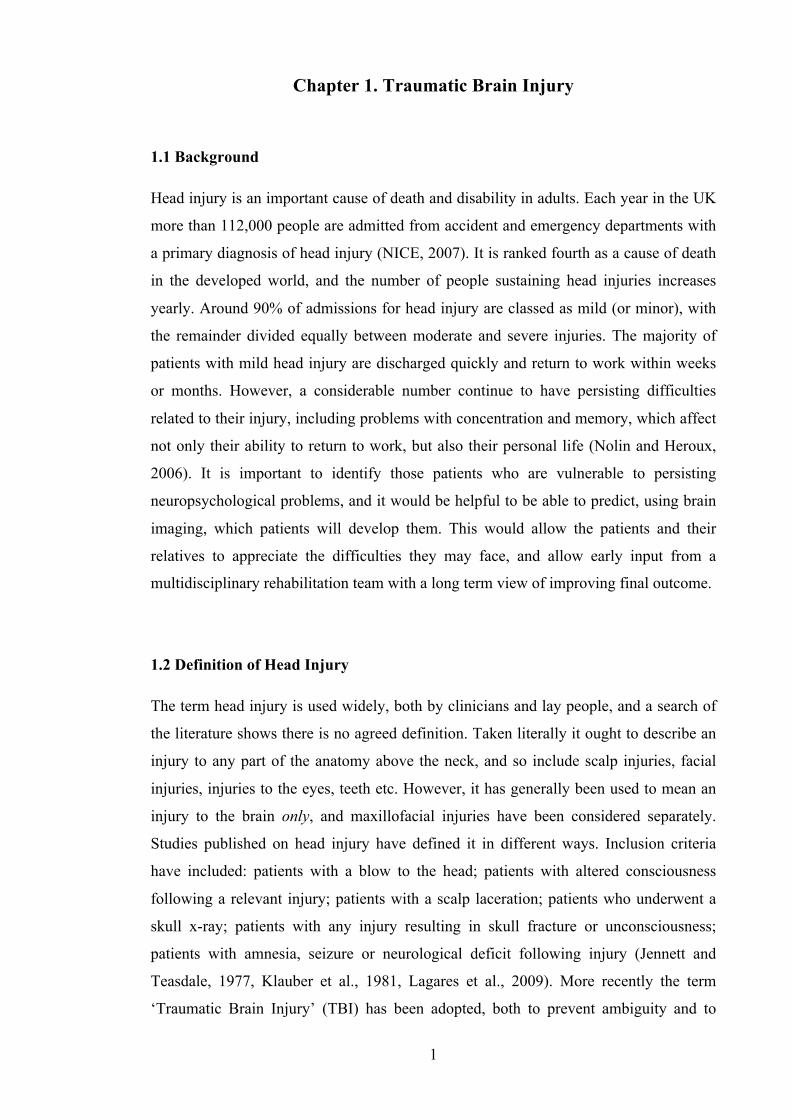
1.1 Background
Head injury is an important cause of death and disability in adults. Each year in the UK
more than 112,000 people are admitted from accident and emergency departments with
a primary diagnosis of head injury (NICE, 2007). It is ranked fourth as a cause of death
in the developed world, and the number of people sustaining head injuries increases
yearly. Around 90% of admissions for head injury are classed as mild (or minor), with
the remainder divided equally between moderate and severe injuries. The majority of
patients with mild head injury are discharged quickly and return to work within weeks
or months. However, a considerable number continue to have persisting difficulties
related to their injury, including problems with concentration and memory, which affect
not only their ability to return to work, but also their personal life (Nolin and Heroux,
2006). It is important to identify those patients who are vulnerable to persisting
neuropsychological problems, and it would be helpful to be able to predict, using brain
imaging, which patients will develop them. This would allow the patients and their
relatives to appreciate the difficulties they may face, and allow early input from a
multidisciplinary rehabilitation team with a long term view of improving final outcome.
1.2 Definition of Head Injury
The term head injury is used widely, both by clinicians and lay people, and a search of
the literature shows there is no agreed definition. Taken literally it ought to describe an
injury to any part of the anatomy above the neck, and so include scalp injuries, facial
injuries, injuries to the eyes, teeth etc. However, it has generally been used to mean an
injury to the brain only, and maxillofacial injuries have been considered separately.
Studies published on head injury have defined it in different ways. Inclusion criteria
have included: patients with a blow to the head; patients with altered consciousness
following a relevant injury; patients with a scalp laceration; patients who underwent a
skull x-ray; patients with any injury resulting in skull fracture or unconsciousness;
patients with amnesia, seizure or neurological deficit following injury (Jennett and
Teasdale, 1977, Klauber et al., 1981, Lagares et al., 2009). More recently the term
‘Traumatic Brain Injury’ (TBI) has been adopted, both to prevent ambiguity and to
2
indicate that the injury has the potential to cause neurological deficit. TBI has become
recognised as a form of brain injury that differs from ischaemic and other causes of
brain injury. So, although the words “traumatic” and “injury” are duplication, they serve
to focus on trauma. Traumatic brain injury is defined as an insult to the brain caused
by an external mechanical force, and one which is not the result of congenital or
degenerative damage.
1.3 Incidence of Head Injury
In 2001 a review paper on head injury in the United Kingdom was published (Kay and
Teasdale), stating that over 1 million patients are estimated to attend accident and
emergency departments in the UK with a ‘head injury’ each year. Of these, the authors
comment that approximately 20% are thought to require admission, with only 5%
ultimately requiring neurosurgical care. However, the 2003 NICE guidelines on head
injury state that there were 112,978 admissions to hospitals in England with a primary
diagnosis of head injury recorded in the 2000/2001 annual dataset (NICE, 2007). If, as
stated by Kay and Teasdale, 20% of hospital attendees require admission, then even
taking into account admissions in Wales, Scotland and Northern Ireland, 1 million is a
slight overestimation of the incidence of head injury, and the figure would be more
likely to be approximately 600,000 or 700,000.
The figure of 112,978 admissions quoted by NICE was obtained from hospital episode
statistics (HES) by collating total admission numbers for those with a primary diagnosis
code of S00 – S09 using the ICD-10 classification of the World Health Organization
(WHO). However, these primary diagnosis codes encompass a number of other injuries;
including those to the scalp, ligaments, face, eyes, ears and teeth, and none of these
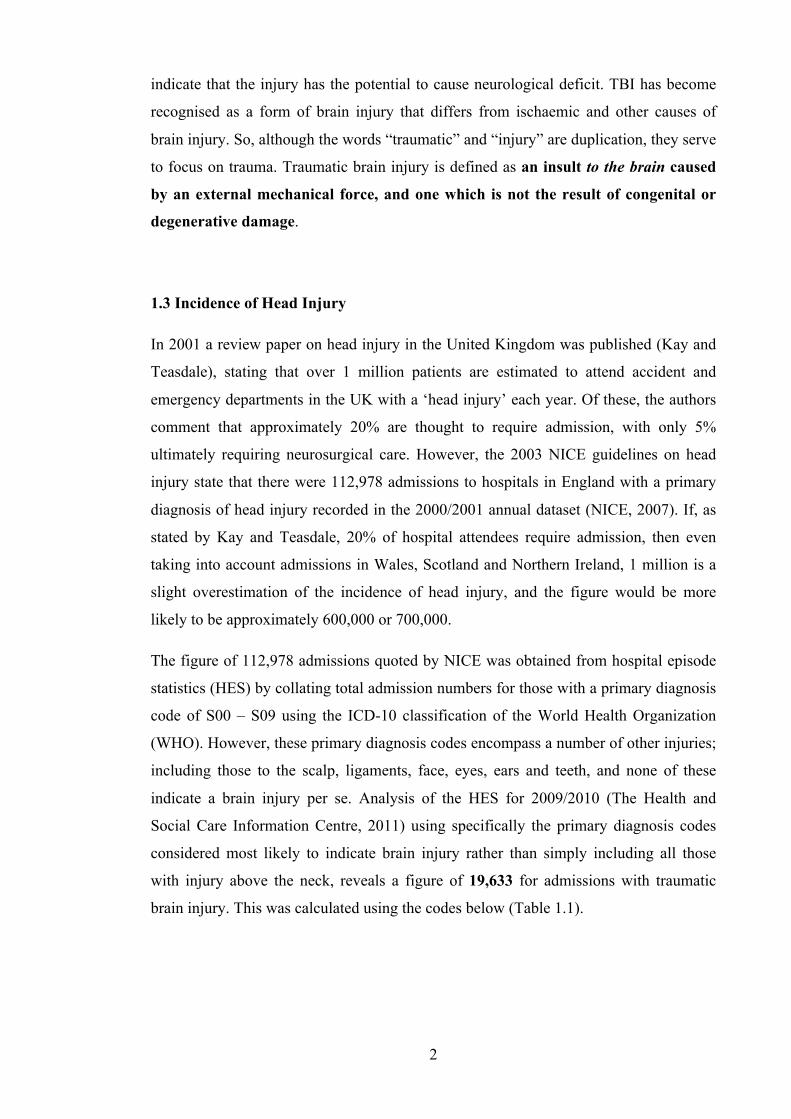
indicate a brain injury per se. Analysis of the HES for 2009/2010 (The Health and
Social Care Information Centre, 2011) using specifically the primary diagnosis codes
considered most likely to indicate brain injury rather than simply including all those
with injury above the neck, reveals a figure of 19,633 for admissions with traumatic
brain injury. This was calculated using the codes below (Table 1.1).
3
Another recent review of traumatic brain injury epidemiology (Bruns and Hauser, 2003)
comments that incidence specifically of traumatic brain injury is quoted as being
approximately 200 in every 100,000 people in developed countries, although the authors
do note that this estimate is typically based only upon admissions figures. Extrapolating
this to the current population of 62 million would make the UK incidence of TBI
124,000 per year, which is similar to the figure quoted by NICE, but as shown above
this may be a slight overestimate.
As can be seen from the evidence above, incidence of brain injury is difficult to
quantify, and this is due to a number of factors. In epidemiological studies, data on total
numbers of head injuries is obtained from different sources: death certificates, coded
hospital admission records and GP records. Data from one of these sources alone may
underestimate the total number: if the injury is mild, the sufferer may not present to an
accident and emergency department at all. In cases which are admitted to hospital
where the brain injury is in conjunction with other injuries, the hospital coding on
discharge may not record the ‘minor’ head injury and only reflect the other injuries
sustained. Death certificates may also omit a reference to brain injury in cases where the
patient dies as a result of other injuries. If studies combine data from multiple sources
they risk overestimating the total number of head injuries. Brain injuries referred to a
ICD-‐10 code
Primary diagnosis code + suffix
Description Admissions:
S06 Intracranial injury S060 Concussion 2,383 S061 Traumatic cerebral oedema 110 S062 Diffuse brain injury 1,826 S063 Focal brain injury 1,152 S064 Epidural haemorrhage 1,052 S065 Traumatic subdural haemorrhage 5,887 S066 Traumatic subarachnoid haemorrhage 1,776 S067 Intracranial injury with prolonged coma 0 S068 Other intracranial injuries 1,289 S069 Intracranial injury, unspecified 469
S02 Fracture of skull and facial bones
S020 Fracture of vault of skull 1,150 S021 Fracture of base of skull 1,644 S027 Multiple fractures involving skull & facial
bones 433
S029 Fracture of skull & facial bones unspecified 361 S04 Injury of cranial
nerves 88
S07 Crushing injury of head
13
Total: 19,633
Table 1.1: World Health Organisation ICD-10 codes most likely to indicate brain injury and the numbers of those admitted with that code in England in the year 2009/2010. Source: HES Online 2010 (re-used with the permission of The Health and Social Care Information Centre.)
4
hospital by a general practitioner may be counted twice if both GP and hospital records
are being used to obtain data (Evans, 2006).
1.4 Age
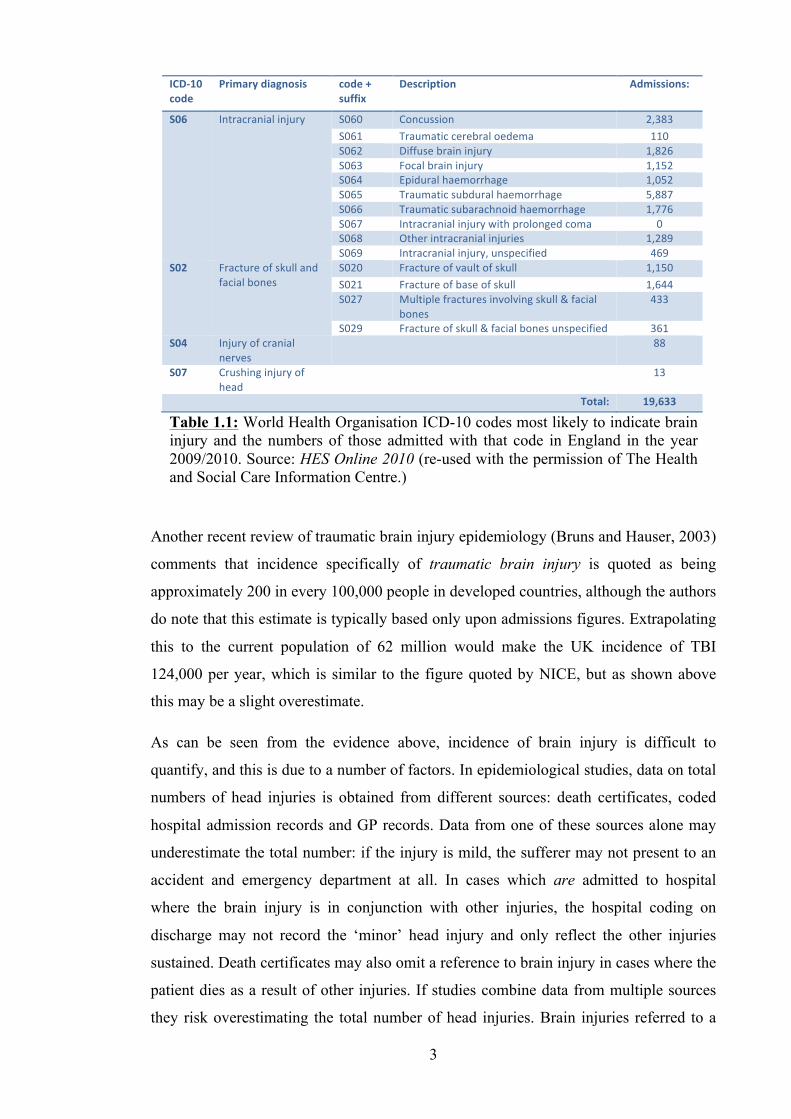
Incidence of TBI evaluated by age typically shows a trimodal distribution, with peaks in
young children, in adolescents/young adults and also in the elderly (Bruns and Hauser,
2003). The peak in the elderly is accounted for by the high rate of falls in this
population sub-group (Rickels et al., 2010), whilst the peak in adolescents/young adults
(predominantly male) is explained by the large percentage of this group that are
involved in sports and recreational activities, and the high rate of RTAs (both motor
vehicle and bicycle accidents) involving people this age (Crowe et al., 2010). TBI in
young children is due in the majority to falls before the age of 4 and RTAs above the
age of 4, but in contrast to adolescents, the sufferers are usually pedestrians or
bicyclists, rather than vehicle occupants (Durkin et al., 1998).
1.5 Sex
Head injury is more common in men than in women, with 72% of the quoted 112,978
admissions in England in the year 2000/2001 being male (NICE, 2007). A recent
analysis of death certificate data from 1997-2007 from the Centers for Disease Control
(CDC) in the US, shows that the rate of TBI deaths was three times higher in males than
Figure 1.1: Plot of age specific TBI incidence data from seven TBI studies included in a recent review. The vertical axis represents incidence per 100,000 and age is shown on the horizontal axis (Bruns and Hauser, 2003).
5
in females, with males making 28.8 per 100,000, compared to 9.1 females per 100,000
(Coronado et al., 2011). Interestingly, when that data is stratified by age, the
preponderance of TBI in males increases to greater than four times that of females in the
20-24 age range.
1.6 Prevalence of Head Injury
In 2005 there were approximately 3.5 million people surviving a head injury with a
disability in the US (Reilly and Bullock, 2005). Estimating the prevalence of TBI is also
complicated. Depending upon the severity of the injury, the resulting symptoms and
sequelae can last for a few hours, or for a lifetime. As such, calculation of prevalence
must take into account not only patients in hospital, but those in rehabilitation units,
nursing homes and their own homes. These patients may have a wide variety of
symptoms and disabilities, ranging from those in a persistent vegetative state following
survival of a severe injury to those with features of ‘concussion’ in mild TBI. In patients
with mild TBI, the symptoms are typically short-lived, but can last for months and even
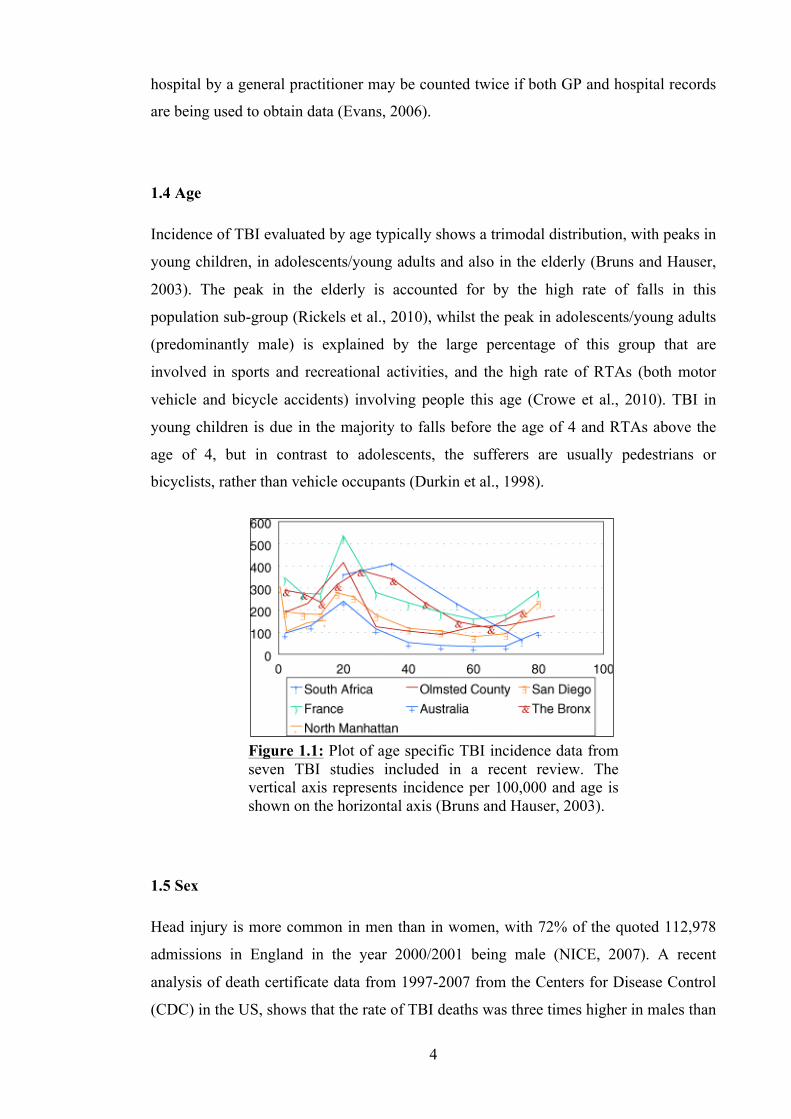
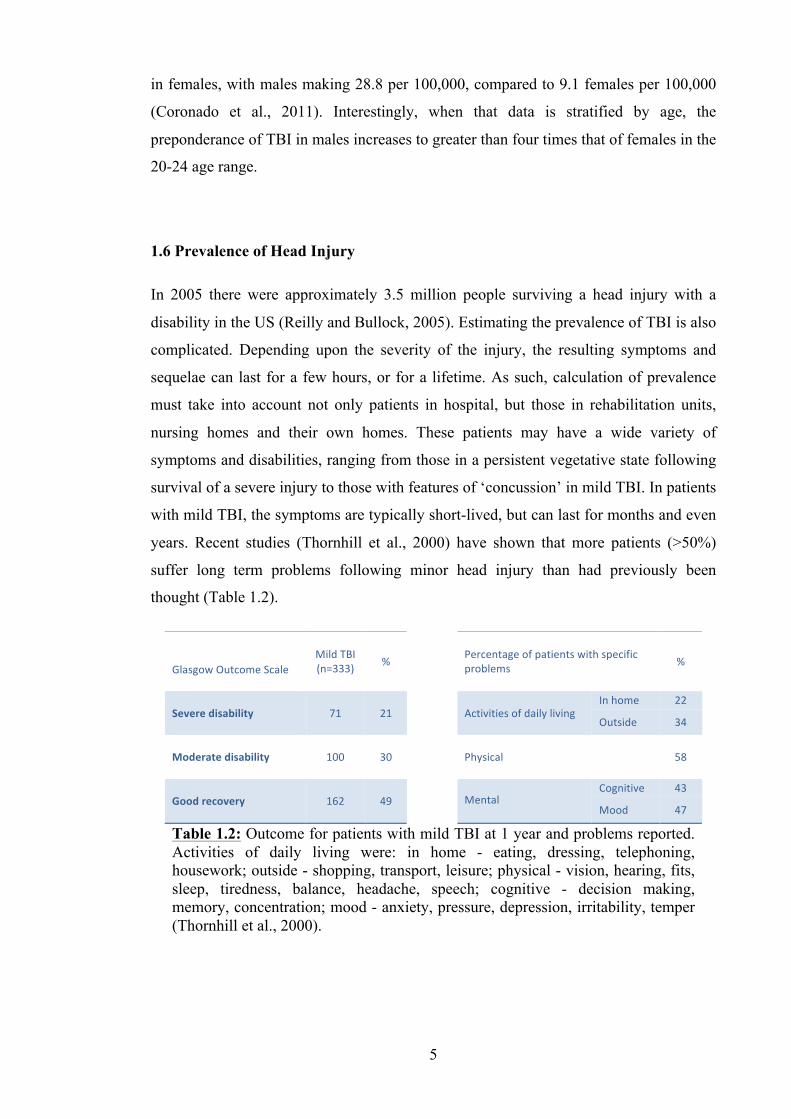
years. Recent studies (Thornhill et al., 2000) have shown that more patients (>50%)
suffer long term problems following minor head injury than had previously been
thought (Table 1.2).
Glasgow Outcome Scale
Mild TBI (n=333) %
Percentage of patients with specific problems %
Severe disability
71 21
Activities of daily living In home 22
Outside 34
Moderate disability
100 30
Physical 58
Good recovery
162 49
Mental Cognitive 43
Mood 47
Table 1.2: Outcome for patients with mild TBI at 1 year and problems reported. Activities of daily living were: in home - eating, dressing, telephoning, housework; outside - shopping, transport, leisure; physical - vision, hearing, fits, sleep, tiredness, balance, headache, speech; cognitive - decision making, memory, concentration; mood - anxiety, pressure, depression, irritability, temper (Thornhill et al., 2000).

6
1.7 Classification
The most common method of classifying traumatic brain injury in the clinical setting is
by severity. This is usually performed using the Glasgow coma scale (GCS) which was
devised by Teasdale and Jennett (1974). Assessments are made, typically 30 minutes
post-injury, of the best scores from verbal, eye and motor assessments of the head
injured patient, and a total is calculated between 3 and 15 (Table 1.3). The brain injury
is then classed as mild (GCS 13-15), moderate (GCS 9-12) or severe (GCS 3-8). The
GCS provides an objective assessment that is reproducible, it allows for easy
monitoring of deterioration or improvement and it is a useful standard when describing
the patient’s neurological state.
1.8 Definition and Classification of Mild TBI
As described above, the standard definition of mild traumatic brain injury (mTBI) uses
the Glasgow coma scale, and includes those having a score between 13 and 15.
However, some published work considers those with a GCS score of 13 as having had a
moderate TBI and classifies mild TBI as having a score of 14 or 15 only. The standard
definition was used in this work. There are many other definitions and diagnostic
criteria for mild TBI in use, and these have been drawn up by various groups with an
interest in mild TBI. The latest definition by the WHO includes a GCS from 13-15 and
one or more of confusion or disorientation, loss of consciousness (LOC) for 30 minutes
or less, post-traumatic amnesia (PTA) for less than 24 hours and transient neurological
abnormalities (Carroll et al., 2004, Fayol et al., 2009).
The Glasgow Coma Scale Score
Eye opening Spontaneous eye opening 4 Eye opening to voice 3 Eye opening to pain 2 No eye opening 1 Verbal response Normal speech, orientated 5 Normal speech, disorientated 4 Abnormal speech 3 Incomprehensible sounds 2 No verbal response 1 Motor response Obeys commands 6 Localises to pain 5 Flexion withdrawal to pain 4 Abnormal flexion to pain / Decorticate posturing 3 Extension to pain / Decerebrate posturing 2 No response 1
Table 1.3: The Glasgow Coma Scale (Teasdale and Jennett, 1974).
7
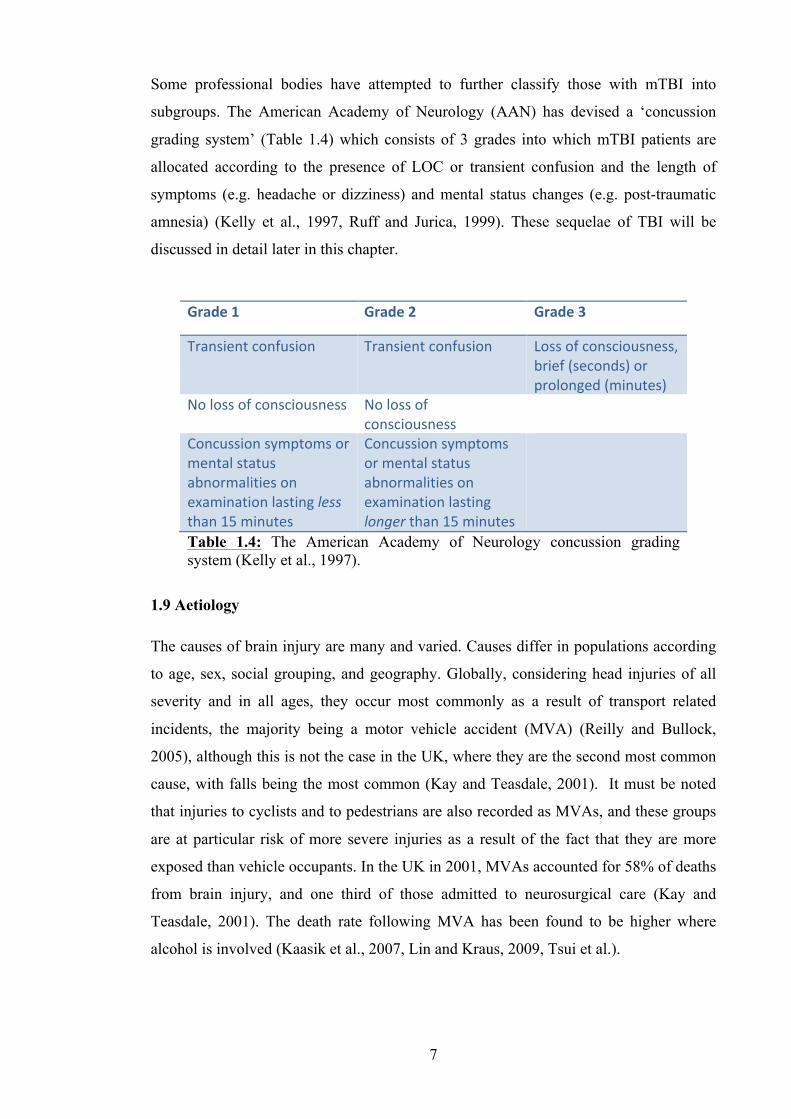
Some professional bodies have attempted to further classify those with mTBI into
subgroups. The American Academy of Neurology (AAN) has devised a ‘concussion
grading system’ (Table 1.4) which consists of 3 grades into which mTBI patients are
allocated according to the presence of LOC or transient confusion and the length of
symptoms (e.g. headache or dizziness) and mental status changes (e.g. post-traumatic
amnesia) (Kelly et al., 1997, Ruff and Jurica, 1999). These sequelae of TBI will be
discussed in detail later in this chapter.
1.9 Aetiology
The causes of brain injury are many and varied. Causes differ in populations according
to age, sex, social grouping, and geography. Globally, considering head injuries of all
severity and in all ages, they occur most commonly as a result of transport related
incidents, the majority being a motor vehicle accident (MVA) (Reilly and Bullock,
2005), although this is not the case in the UK, where they are the second most common
cause, with falls being the most common (Kay and Teasdale, 2001). It must be noted
that injuries to cyclists and to pedestrians are also recorded as MVAs, and these groups
are at particular risk of more severe injuries as a result of the fact that they are more
exposed than vehicle occupants. In the UK in 2001, MVAs accounted for 58% of deaths
from brain injury, and one third of those admitted to neurosurgical care (Kay and
Teasdale, 2001). The death rate following MVA has been found to be higher where
alcohol is involved (Kaasik et al., 2007, Lin and Kraus, 2009, Tsui et al.).
Grade 1 Grade 2 Grade 3
Transient confusion Transient confusion Loss of consciousness, brief (seconds) or prolonged (minutes)
No loss of consciousness No loss of consciousness
Concussion symptoms or mental status abnormalities on examination lasting less than 15 minutes
Concussion symptoms or mental status abnormalities on examination lasting longer than 15 minutes
Table 1.4: The American Academy of Neurology concussion grading system (Kelly et al., 1997).

8
Injuries as a result of falls are the second highest cause of head injury in most
populations. When the cause of injury is grouped according to age, this becomes the
most significant cause of head injury in the elderly (Evans, 2006).
Other frequent causes of head injury include sports and recreational activities and
assaults. This includes gunshot wounds to the head, both in areas at war and in those
with high levels of gun-crime, such as the US, where they are much more prevalent than
in the UK (NICE, 2007).
While head injuries caused by sports and recreational activities are a relatively small
group, the numbers attributed to them are increasing as high energy sports such as
riding, skiing and snowboarding become more accessible to a greater percentage of the
population (Wasden et al., 2009, Loder, 2008, Ball et al., 2007). However, the recent
increase in the use of helmets while taking part in alpine sports has been found to
reduce the severity of head injury (Greve et al., 2009, Benson et al., 2009).
When head injury causes are grouped according to age, in the UK falls are the most
common cause in children and the elderly, whereas, in the 15-24 age group, the most
common cause is motor vehicle accidents, the majority of sufferers being male.
1.10 Pathology: Primary Brain Injury
Head injury can be classified according to whether the damage to the brain has resulted
from the mechanical forces at the time of injury, or whether it has resulted from the
continuing pathological changes within the brain that occur after injury. These two
types of injury are termed primary and secondary traumatic brain damage respectively.
Primary traumatic brain damage can occur in a focal or diffuse (multifocal) pattern.
Damage may occur to any of the tissues within and around the brain. The skull,
meninges and vasculature are often involved, and on a microscopic level the glial cells
and neurons themselves are at risk of damage.
1.10.1 Focal TBI
Focal brain damage as a result of head injury includes vascular damage, contusions in
the brain parenchyma and lacerations. As a result of vascular injury, haemorrhage can
occur in the brain itself, termed intracerebral haemorrhage, and between all of the
meningeal layers covering it, causing one or a combination of subdural, extradural and
9
subarachnoid haemorrhage, although usually they expand secondarily and are therefore
also classified as causes of secondary brain damage.
1.10.2 Diffuse injury
Diffuse injury is a term used to describe areas of damage where there are no specific
lesions, such as haematomas or fractures, but where the damage has taken place at a
microscopic level. Diffuse and focal injury can co-exist in the same patient after TBI,
for instance, there may be an overlying subdural haematoma, with underlying diffuse
axonal injury (section 1.10.3). Patients with diffuse injury alone may have significant
damage at a microstructural or cellular level, without any easily identifiable lesions seen
on brain imaging or macroscopically at post-mortem. Two types of diffuse injury are
described; diffuse axonal injury and diffuse vascular injury. Diffuse injury is also used
to describe diffuse brain swelling and diffuse hypoxic-ischaemic damage, both of which
are features of secondary traumatic brain injury (section 1.11).
1.10.3 Diffuse axonal injury
Axons are particularly susceptible to shearing or rotational forces acting upon the brain,
as a result of their long fixed paths, and can be damaged even in mild TBI. Diffuse
damage to axons following trauma has been studied widely, as observers have come to
realise that it may account for a number of the sequelae seen in the whole spectrum of
TBI; from the subtle neuropsychological changes in patients with mild injury, to the
persistent vegetative state following on from severe TBI (Povlishock and Christman,
1995, Adams et al., 1999). This widespread type of axonal damage has been termed
diffuse axonal injury or DAI.
In DAI the pathological processes that occur are a result of shearing forces applied to
the brain when an angular acceleration/deceleration, or rotation type injury, takes place.
The shearing forces have greatest impact at the areas where there is a difference in
density of the tissue, such as at the subcortical interface between grey and white matter,
and also in midline structures such as the corpus callosum, and the dorsolateral parts of
the upper brainstem (Smith et al., 2003). Axonal damage immediately following shear
injury may not be complete, although those axons which have remained structurally
intact may show evidence of functional disturbance for some time after the injury, and
microscopic damage to the axoplasmic membrane may cause impairment of
intracellular transport.
10
An example of this functional disturbance is illustrated by the measurement of amyloid
precursor protein (APP). APP is normally transported along axons in immeasurable
quantities in healthy neural tissue, but collects in damaged axonal fibres and can be
detected immunocytochemically with antibodies 2 hours after the initial injury
(McKenzie et al., 1996). The same is true of neurofilament proteins which have also
been shown to act as markers for axonal injury (Reilly and Bullock, 2005, cited
Maxwell et al., 1997).
Axons sustaining incomplete damage either undergo cytoskeleton remodelling or
progress to secondary delayed axotomy through axoplasmic swelling, division and the
formation of a retraction ball or axonal bulb, which occurs 8-24 hours post-injury
(Povlishock et al., 1992). These axons then undergo Wallerian degeneration, a process
that takes place in the end of the axon distal to the area of trauma. After the breakdown
of the axoplasm and axolemma, degradation of the myelin sheath and subsequent
invasion of macrophages occurs (Beirowski et al., 2005, cited Stoll et al., 2002). These
macrophages, together with Schwann cells, phagocytose the debris. Time from injury to
the initiation of Wallerian degeneration depends upon a number of factors, including the
age of the patient, the type of nerve lesion (axotomy or crush injury) and on the type of
nerve fibre, whether thick or thin, myelinated or unmyelinated (Beirowski et al., 2005).
The process also occurs more slowly in the CNS than in peripheral nerves and may take
up to several days in humans (Vargas and Barres, 2007).
DAI has been classified into three grades according to severity (Adams et al., 1989).
The least severe, grade 1, describes axonal injury in the corpus callosum, brainstem and
white matter of the cerebral hemispheres. Grade 2 DAI describes the same axonal
damage as in grade 1 with additional haemorrhages in the corpus callosum, and grade 3,
the most severe, includes the presence of haemorrhages in the rostral brainstem.
1.10.4 Diffuse vascular injury
Diffuse vascular injury (DVI) describes multiple small haemorrhages throughout the
brain that are a direct result of the shearing forces acting upon small capillaries and
venules. It is typically observed post-mortem in patients who die soon after brain injury,
as DVI is often incompatible with life. It is associated with severe DAI (grades 2 and 3),
and is likely to occur as a result of the same mechanism, with DVI accompanying DAI
after injuries with the greatest degrees of head acceleration/deceleration, such as high
speed RTAs (Pittella and Gusmao, 2003).

11
1.10.5 Pathophysiology of acute TBI
There are extensive effects of trauma upon the brain at a cellular and neurochemical
level, as well as those at a structural level. Data from measurements in human brain
injury populations, using microdialysis, MR spectroscopy and positron emission
tomography (PET), coupled with data from animal models, has demonstrated
extracellular and intracellular metabolic changes as a result of the primary injury alone.
The processes outlined below are the principle effects of brain trauma at a cellular level.
1.10.6 Pathophysiology: glucose metabolism
Brain function relies predominantly upon aerobic metabolism, with oxygen and glucose
the necessary substrates. In TBI, the delivery of these substrates may be affected by
direct disruption of the intracranial vasculature or by a reduction in cerebral perfusion as
a result of a localised mass lesion or a global increase in intracranial pressure due to
brain swelling. Through these different mechanisms, brain injury reduces the delivery of
oxygen and glucose substrates to the parenchyma, resulting in metabolic disturbance.
Glucose is used, through aerobic metabolism, to generate adenosine triphosphate (ATP)
within neuronal tissues. The physical forces in TBI cause membrane depolarisation and
loss of the resting potential, which in turn causes release of neurotransmitters from the
synaptic endplates. Reuptake of the neurotransmitters then occurs through ion pumping,
an energy dependent step that uses ATP. This increased demand for ATP leads to a
measurable decrease in extra cellular glucose, as it used up in ATP synthesis.
1.10.7 Pathophysiology: lactate metabolism
Astrocytes and glial cells have been shown to use coupled lactate metabolism, as well as
glucose metabolism, to meet their energy requirements. Coupled lactate metabolism
describes the process where lactate is anaerobically metabolised from glucose by
astrocytes and then released into the extra cellular space. There it is taken up by the
neurons and used to synthesise ATP aerobically. As the delivery of oxygen to neural
tissue is impaired in TBI, this aerobic metabolism is reduced, and as a result there is an
extracellular build up of lactate. Using this hypothesis of coupled lactate metabolism, it
follows that a decrease in neuronal function after TBI may be represented by increasing
cerebral lactate levels (Reilly and Bullock, 2005).
12
1.10.8 Pathophysiology: calcium influx and glutamate release
Intracellular calcium (as Ca2+ ion) is involved in a number of neuronal functions,
including synaptic neurotransmitter release, protein phosphorylation, and gene
expression (McIntosh et al., 1997). In animal models, intracellular free calcium ions
have been shown to be increased after TBI, both acutely and up to 1 month after injury
(Sun et al., 2008). This influx of calcium occurs within minutes of the administered
injury (Nilsson et al., 1993). The principle mechanisms for this massive movement of
calcium into the neurons are both a direct and indirect result of membrane
depolarisation initiated by shearing forces acting on axons. Membrane depolarisation
causes activation of voltage dependent membrane channels and leads to direct calcium
uptake. The same membrane depolarisation also triggers glutamate release from the
presynaptic membrane, which in turn causes overstimulation of glutamate receptors in
the postsynaptic membrane, leading to the opening of glutamate receptor gated ion
channels, and calcium influx. The massive resultant increase in intracellular calcium
then leads to cell swelling, necrosis and eventually programmed cell death (McIntosh et
al., 1997).
1.10.9 Pathophysiology: production of reactive oxygen species
Reactive oxygen species (ROS) refers to any free radical (an atom with at least one
unpaired electron) with an oxygen centre. Oxygen centred free radicals contain two
unpaired electrons in the outer shell, and have an extremely high chemical reactivity.
They are formed in vivo as a result of aerobic metabolism in mitochondria, and studies
have shown increases in levels of these ROS after TBI. Increased levels of ROS give
rise to oxidative stress, a state where antioxidant cell defences are depleted with
consequent irreversible modification of biologically important macromolecules (Wilson
and Gelb, 2002). Signoretti et al. (2010) demonstrated in a rat model, that cerebral ROS
production occurs directly as a result of the shearing force of TBI, in the absence of any
ischaemic or hypoxic state, and Smith et al. (1994) confirmed these results showing
increased levels of hydroxyl radicals (the most oxidising and reactive ROS) within 5
minutes of unilateral cortical impact.
1.10.10 Pathophysiology: N-acetyl aspartate synthesis
N-acetyl aspartate (NAA) is an amino acid synthesised specifically by neuronal
mitochondria, implicated in osmoregulation where it may be involved in removing
intracellular water from myelinated neurons (Baslow, 2003). The formation of NAA is
13
an energy dependent process, directly coupled to glucose metabolism, and relies on the
presence of pyruvate as a source of acetyl coenzyme-A for its production (Baslow,
2003, Signoretti et al., 2010). Its use as a indicator for neuronal damage is based firstly
upon the finding that NAA is reduced in conditions causing neuronal degeneration, such
as dementia, stroke, multiple sclerosis and tumours, and secondly upon the findings in
Canavan disease, a hereditary genetic condition where an error in NAA metabolism
results in water imbalance and loss of oligodendrocyte myelin covering in neurons
(Baslow, 2003, De Stefano et al., 1995, Lee et al., 2000, Signoretti et al., 2010). NAA is
one of the most easily detected compounds in MR spectroscopy of the brain (Signoretti
et al., 2010). Numerous papers have studied the effect of TBI on NAA, observing the
difference in levels according to the time from injury, and the severity of the injury
(Belli et al., 2006, Cohen et al., 2007, Garnett et al., 2000a, Garnett et al., 2000b,
Mamere et al., 2009, Marino et al., 2007). NAA has been shown to be reduced in both
the acute and subacute phase of traumatic brain injury, in patients with both mild and
severe injuries (Belli et al., 2006, Blamire et al., 2002, Cohen et al., 2007, Garnett et al.,
2000b). It has also been found to be decreased particularly in areas known to be
susceptible to the shearing forces which lead to DAI, such as corpus callosum and
midbrain, indicating a link between DAI and reduced NAA (Cecil et al., 1998).
1.10.11 Pathophysiology: choline and acetylcholine synthesis
Choline is an amine present in cell membranes and used in the synthesis of the
neurotransmitter acetylcholine. It has been shown to be elevated during disease states
with increased membrane turnover (e.g. tumours), and following tissue breakdown and
inflammation (Brooks et al., 2001, Zauner et al., 2002). Studies have reported elevated
choline after TBI, and propose that the increased levels are due to membrane breakdown
and neuronal injury (Brooks et al., 2000, Garnett et al., 2000b).
Choline levels may also be increased as a result of a reduction in choline
acetyltransferase activity which has been observed post-mortem in TBI patients (Dewar
and Graham, 1996, Murdoch et al., 1998). Choline acetyltransferase is an enzyme
present within neurons, which synthesises acetylcholine from choline and acetyl
coenzyme A. As cholinergic neurones are involved in learning, sleep, memory and
arousal, disruption to this network, due to TBI induced reduction in the synthesis of
acetylcholine, may be responsible in part for the affective and cognitive symptoms seen
in these patients (Oda, 1999, Reilly and Bullock, 2005).
14
1.11 Pathology: Secondary Brain Injury
Secondary brain injury occurs as a result of multiple ongoing pathological processes
which may complicate primary brain damage. It can be a combination of ischaemia
leading to hypoxic injury and oedema, raised intracerebral pressure (ICP) as a result of
oedema, or due to the mass effect of a large haematoma. Secondary brain injury can be
further complicated by other post-injury sequelae, such as infection, hypothermia and
seizures.
The emphasis put upon swift management of secondary brain trauma is as a result of the
fact that some of the processes are preventable and reversible. Little can be done in
terms of preventing damage from primary brain injury, other than taking preventative
steps to reduce the incidence of that injury type within the community. However,
speedy recognition of processes which result in secondary brain injury, and rapid
intervention with the appropriate management and treatment, can dramatically improve
clinical outcomes. Guidelines have been developed to direct imaging, monitoring and
treatment of secondary brain injury (Bratton et al., 2007a, Cushman et al., 2001, NICE,
2007).
1.11.1 Ischaemia
Ischaemia can occur as a result of primary vascular injury which produces focal
ischaemia, or as a sequelae of brain swelling and increase in ICP which results in
reduced cerebral perfusion pressure and a global reduction in cerebral blood flow. The
reduction in cerebral blood flow impacts brain tissue oxygen availability and there is an
increase in tissue lactate which has been shown to correlate with unfavourable outcomes
(Reilly and Bullock, 2005, Robertson et al., 1999). An ability to monitor cerebral blood
flow is therefore of importance, and current guidelines recommend further development
of minimally invasive techniques to do this (Bratton et al., 2007a).
1.11.2 Oedema
Cerebral oedema post-TBI can be as a result of both vasogenic oedema and/or cytotoxic
oedema. Vasogenic oedema describes a process whereby damage to the blood brain
barrier results in an increase of protein in the extracellular space, which creates an
osmotic gradient and consequently localised swelling, as excess water is transported
into tissue from vessels and is subsequently not cleared. Cytotoxic oedema describes the
swelling that occurs after hypoxia, where disturbance of the ionic gradients causes water
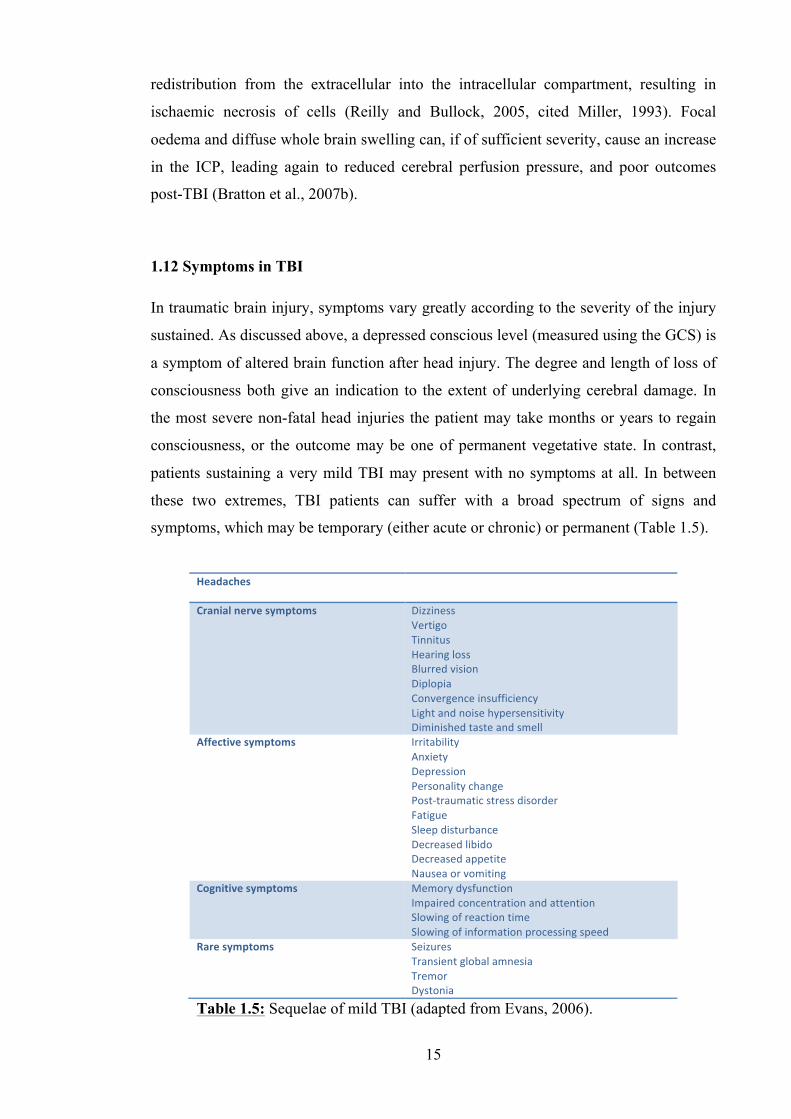
15
redistribution from the extracellular into the intracellular compartment, resulting in
ischaemic necrosis of cells (Reilly and Bullock, 2005, cited Miller, 1993). Focal
oedema and diffuse whole brain swelling can, if of sufficient severity, cause an increase
in the ICP, leading again to reduced cerebral perfusion pressure, and poor outcomes
post-TBI (Bratton et al., 2007b).
1.12 Symptoms in TBI
In traumatic brain injury, symptoms vary greatly according to the severity of the injury
sustained. As discussed above, a depressed conscious level (measured using the GCS) is
a symptom of altered brain function after head injury. The degree and length of loss of
consciousness both give an indication to the extent of underlying cerebral damage. In
the most severe non-fatal head injuries the patient may take months or years to regain
consciousness, or the outcome may be one of permanent vegetative state. In contrast,
patients sustaining a very mild TBI may present with no symptoms at all. In between
these two extremes, TBI patients can suffer with a broad spectrum of signs and
symptoms, which may be temporary (either acute or chronic) or permanent (Table 1.5).
Headaches
Cranial nerve symptoms Dizziness Vertigo Tinnitus Hearing loss Blurred vision Diplopia Convergence insufficiency Light and noise hypersensitivity Diminished taste and smell
Affective symptoms Irritability Anxiety Depression Personality change Post-‐traumatic stress disorder Fatigue Sleep disturbance Decreased libido Decreased appetite Nausea or vomiting
Cognitive symptoms Memory dysfunction Impaired concentration and attention Slowing of reaction time Slowing of information processing speed
Rare symptoms Seizures Transient global amnesia Tremor Dystonia
Table 1.5: Sequelae of mild TBI (adapted from Evans, 2006).
16
Post-concussion symptoms occur in over 50% of patients with mild TBI (Thornhill et
al., 2000), and the common symptoms are a combination of physical, cognitive and
affective problems.
1.12.1 Headaches
Headache after traumatic brain injury can be due to many causes. Raised intracranial
pressure, as a result of cerebral contusions, traumatic subarachnoid haemorrhage or an
extra-axial haematoma will cause not only headache, but also nausea, vomiting and in
severe cases coma. Irritation of the meninges as a result of an extra-axial haematoma or
depressed skull fracture will also give rise to headache, which can be accompanied by
signs of meningism (e.g. photophobia, neck stiffness). Headaches may also be due to
injuries concurrent with the brain injury, such as cervical pathology (e.g. radicular pain
from cervical disc damage, occipital neuralgia, carotid or vertebral artery dissection) or
facial pathology (e.g. temporomandibular joint injury, myofascial injury, supra- or
infra-orbital neuralgia) (Evans, 2006 p100-102). TBI may also stimulate the onset of
migraine, cluster or tension headache, and the treatment of TBI with analgesia can also
induce analgesic rebound headache. ‘Headache’ may even be used incorrectly by the
TBI patient to describe localised pain as a result of lacerations or contusions of the
scalp.
1.12.2 Cranial nerve symptoms
Cranial nerve damage, whether temporary or permanent, may be associated with TBI
even in mild cases (Coello et al., 2010). The incidence of TBI associated cranial nerve
injury reported in the literature varies greatly depending upon the severity of the injury.
Jin et al. (2010) examined 3417 patients of varying injury severity and identified 312
(9%) patients with a cranial nerve injury, the majority of whom fell into the moderate
and severe groups. However, a study looking specifically at fatal cases of TBI post-
mortem, reported much higher rates of cranial nerve injury (Mariak et al., 1997).
Symptoms are directly related to the nerve or pathways injured. Head injury is the
leading cause of anosmia; olfactory nerve damage presents not only with a reduced or
absent sense of smell, but also affects the ability to taste (Costanzo and Miwa, 2006).
Injury to the optic nerve and the visual pathways may result in a reduction in visual
acuity, blurred vision or even blindness. Diplopia occurs when one or more of the
oculomotor, trochlear and abducens nerves are damaged. Dizziness, vertigo, tinnitus and
hearing loss can all occur with injury to the vestibulocochlear nerve. Hearing loss and
17
noise hypersensitivity may also be a result of damage to the external or internal auditory
apparatus. Injuries to the lower cranial nerves are more likely to be associated with a
fatal injury (Jin et al., 2010).
1.12.3 Affective symptoms
Irritability, anxiety, depression and sleep disturbance, along with reduced libido and
appetite, are common features after head injury, and have been shown to persist in mild
TBI longer than had previously been thought. At 1 year post-injury, Thornhill et al.
(2000) found that 14% of 333 patients with mild TBI were still suffering with one or
more of these symptoms. Fatigue is a persistent post-concussion problem, occurring
acutely in almost 75% of 263 adults with mild TBI studied by Norrie et al. (2010) which
found that fatigue was exacerbated by depression and that it diminished in the first 3
months and then stabilised. It was found to be persistent in 34% of their patient group at
6 months.
1.12.4 Cognitive symptoms
Cognitive symptoms include problems with concentration, memory loss and reduced
speed of information processing. These symptoms are detectable, and to an extent
measurable with neuropsychological testing, and have been the subject of numerous
studies examining TBI patients of all severities, both acutely and in the chronic phase
(Hartikainen et al., 2010, O'Jile et al., 2006, Ashton et al., 2005, Draper and Ponsford,
2008, Hughes et al., 2004). A detailed discussion of the symptoms themselves, along
with the tests used to identify and quantify them is presented in Chapter 3 of this thesis.
1.13 Mortality
In the UK, the actual number of deaths from head injury is relatively small (6-10 per
100,000 population, 0.2% of all hospital admissions with a head injury) (NICE, 2007).
This low mortality rate is due to the fact that the majority (around 90%) of head injury
admissions are classed as mild, and fatalities are more likely to be an outcome following
moderate and severe head injury (Swann and Teasdale, 1999).
18
1.14 Summary
Traumatic brain injury (TBI) is a complex condition affecting a large percentage of the
global population every day. The term TBI encompasses a variety of intracranial
pathologies, which may each be caused by differing degrees of force in any number of
different modes and mechanisms. If left unchecked, this heterogeneous group of
primary injuries may then lead on to secondary brain injury, which has the potential to
cause more harm. Even in its most mild form, TBI has been shown to have an effect on
those that suffer it, causing physical, cognitive and mental symptoms that persist well
beyond the time of injury, and can affect performance at work, relationships at home
and every aspect of daily life. Early detection of damage caused by TBI allows for the
input of timely management strategies, and can lessen the impact of any persistent
symptoms. The following chapter outlines how current MRI techniques are utilised
towards this end, and introduces advanced techniques, which are currently being
investigated in the TBI setting.
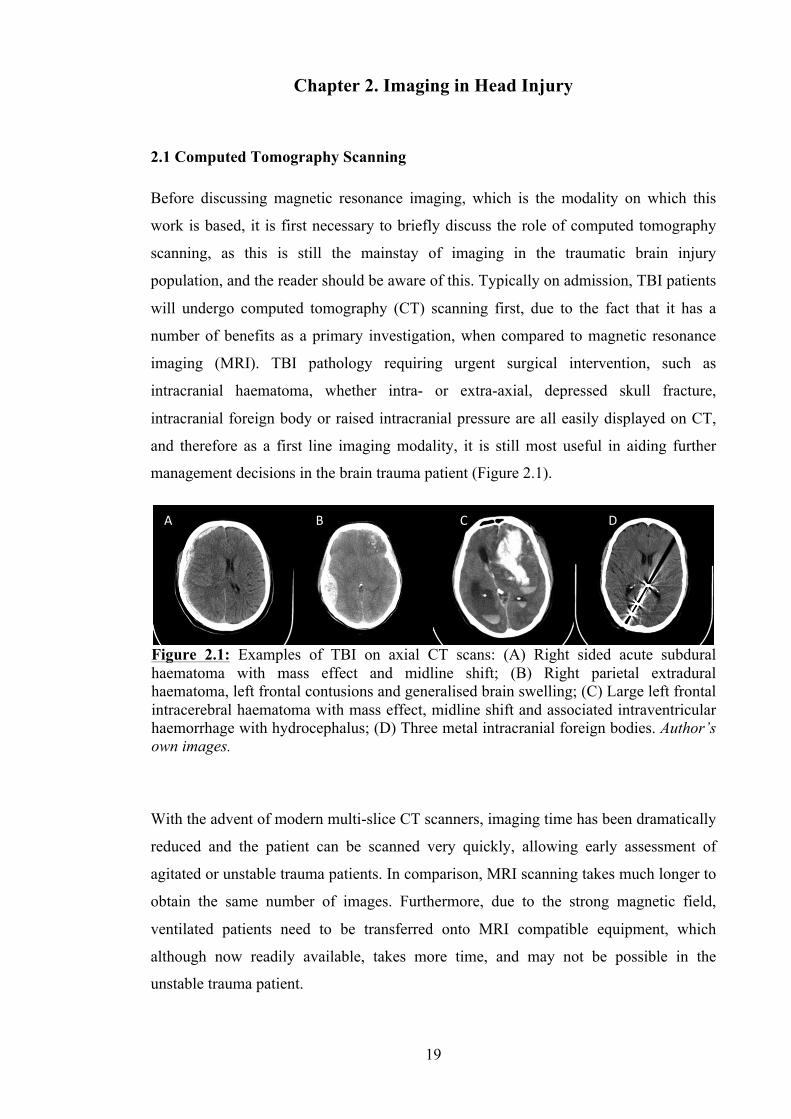
19
Chapter 2. Imaging in Head Injury
2.1 Computed Tomography Scanning
Before discussing magnetic resonance imaging, which is the modality on which this
work is based, it is first necessary to briefly discuss the role of computed tomography
scanning, as this is still the mainstay of imaging in the traumatic brain injury
population, and the reader should be aware of this. Typically on admission, TBI patients
will undergo computed tomography (CT) scanning first, due to the fact that it has a
number of benefits as a primary investigation, when compared to magnetic resonance
imaging (MRI). TBI pathology requiring urgent surgical intervention, such as
intracranial haematoma, whether intra- or extra-axial, depressed skull fracture,
intracranial foreign body or raised intracranial pressure are all easily displayed on CT,
and therefore as a first line imaging modality, it is still most useful in aiding further
management decisions in the brain trauma patient (Figure 2.1).
With the advent of modern multi-slice CT scanners, imaging time has been dramatically
reduced and the patient can be scanned very quickly, allowing early assessment of
agitated or unstable trauma patients. In comparison, MRI scanning takes much longer to
obtain the same number of images. Furthermore, due to the strong magnetic field,
ventilated patients need to be transferred onto MRI compatible equipment, which
although now readily available, takes more time, and may not be possible in the
unstable trauma patient.
Figure 2.1: Examples of TBI on axial CT scans: (A) Right sided acute subdural haematoma with mass effect and midline shift; (B) Right parietal extradural haematoma, left frontal contusions and generalised brain swelling; (C) Large left frontal intracerebral haematoma with mass effect, midline shift and associated intraventricular haemorrhage with hydrocephalus; (D) Three metal intracranial foreign bodies. Author’s own images.
A B C D
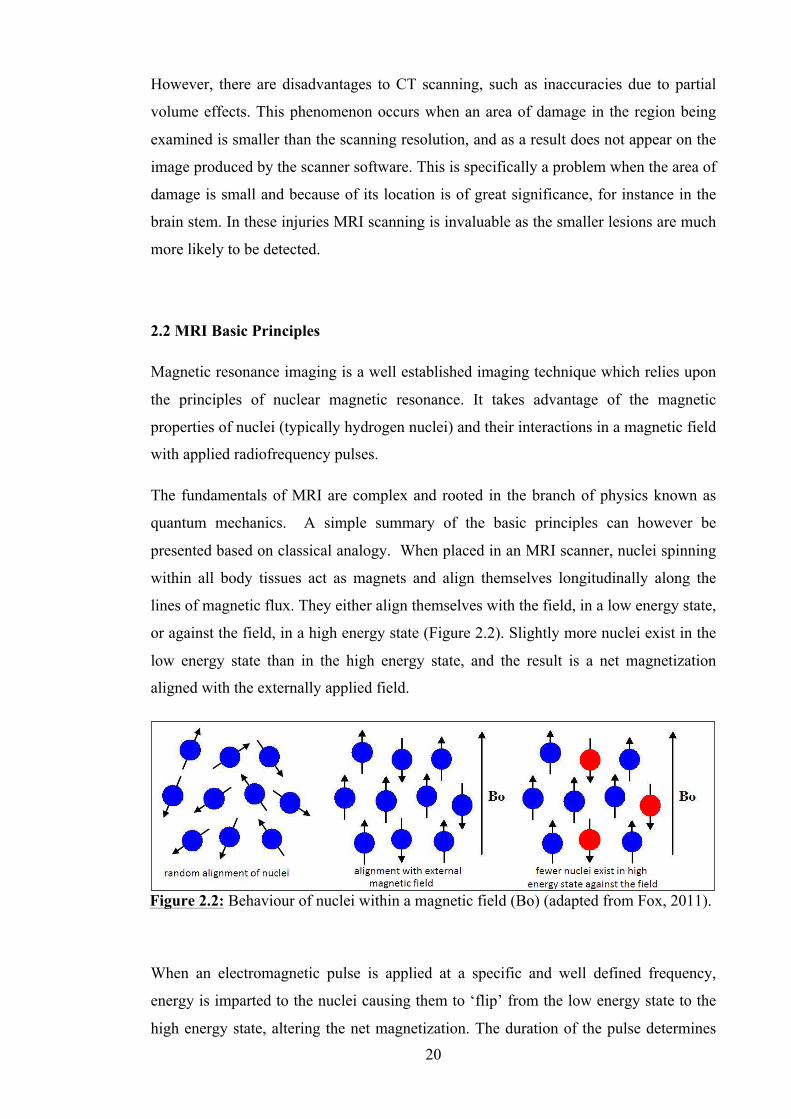
20
However, there are disadvantages to CT scanning, such as inaccuracies due to partial
volume effects. This phenomenon occurs when an area of damage in the region being
examined is smaller than the scanning resolution, and as a result does not appear on the
image produced by the scanner software. This is specifically a problem when the area of
damage is small and because of its location is of great significance, for instance in the
brain stem. In these injuries MRI scanning is invaluable as the smaller lesions are much
more likely to be detected.
2.2 MRI Basic Principles
Magnetic resonance imaging is a well established imaging technique which relies upon
the principles of nuclear magnetic resonance. It takes advantage of the magnetic
properties of nuclei (typically hydrogen nuclei) and their interactions in a magnetic field
with applied radiofrequency pulses.
The fundamentals of MRI are complex and rooted in the branch of physics known as
quantum mechanics. A simple summary of the basic principles can however be
presented based on classical analogy. When placed in an MRI scanner, nuclei spinning
within all body tissues act as magnets and align themselves longitudinally along the
lines of magnetic flux. They either align themselves with the field, in a low energy state,
or against the field, in a high energy state (Figure 2.2). Slightly more nuclei exist in the
low energy state than in the high energy state, and the result is a net magnetization
aligned with the externally applied field.
When an electromagnetic pulse is applied at a specific and well defined frequency,
energy is imparted to the nuclei causing them to ‘flip’ from the low energy state to the
high energy state, altering the net magnetization. The duration of the pulse determines
Figure 2.2: Behaviour of nuclei within a magnetic field (Bo) (adapted from Fox, 2011).
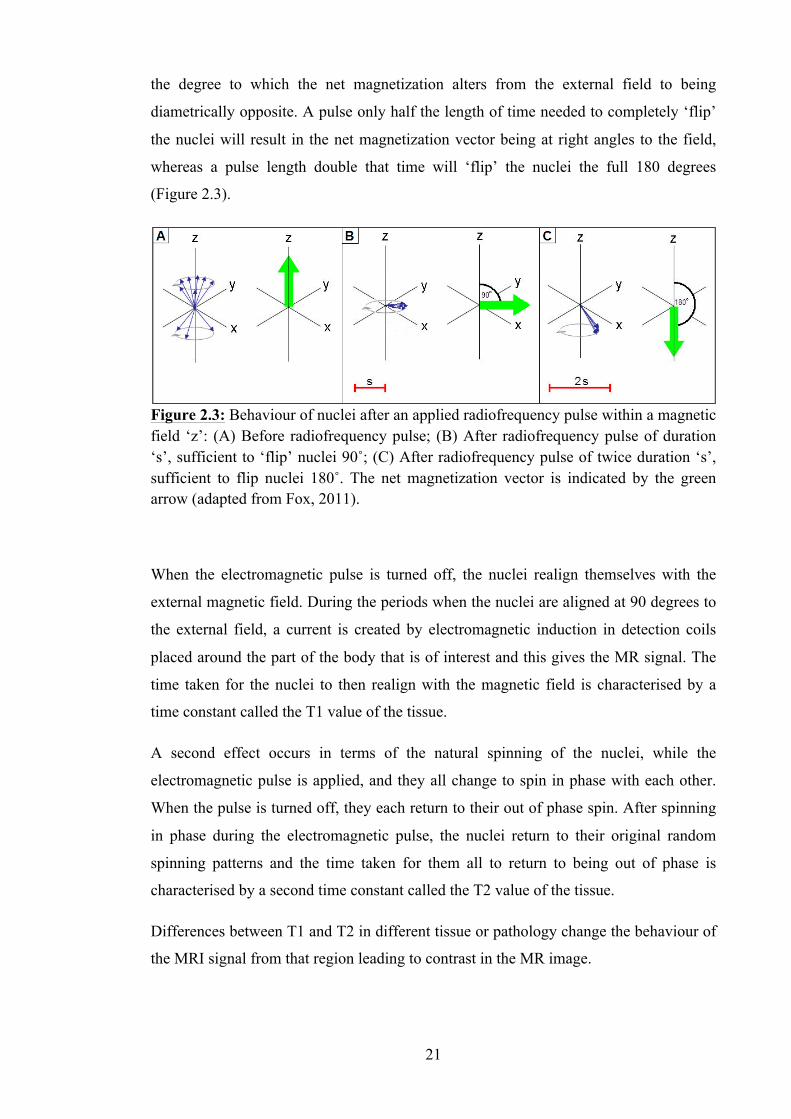
21
the degree to which the net magnetization alters from the external field to being
diametrically opposite. A pulse only half the length of time needed to completely ‘flip’
the nuclei will result in the net magnetization vector being at right angles to the field,
whereas a pulse length double that time will ‘flip’ the nuclei the full 180 degrees
(Figure 2.3).
When the electromagnetic pulse is turned off, the nuclei realign themselves with the
external magnetic field. During the periods when the nuclei are aligned at 90 degrees to
the external field, a current is created by electromagnetic induction in detection coils
placed around the part of the body that is of interest and this gives the MR signal. The
time taken for the nuclei to then realign with the magnetic field is characterised by a
time constant called the T1 value of the tissue.
A second effect occurs in terms of the natural spinning of the nuclei, while the
electromagnetic pulse is applied, and they all change to spin in phase with each other.
When the pulse is turned off, they each return to their out of phase spin. After spinning
in phase during the electromagnetic pulse, the nuclei return to their original random
spinning patterns and the time taken for them all to return to being out of phase is
characterised by a second time constant called the T2 value of the tissue.
Differences between T1 and T2 in different tissue or pathology change the behaviour of
the MRI signal from that region leading to contrast in the MR image.
Figure 2.3: Behaviour of nuclei after an applied radiofrequency pulse within a magnetic field ‘z’: (A) Before radiofrequency pulse; (B) After radiofrequency pulse of duration ‘s’, sufficient to ‘flip’ nuclei 90˚; (C) After radiofrequency pulse of twice duration ‘s’, sufficient to flip nuclei 180˚. The net magnetization vector is indicated by the green arrow (adapted from Fox, 2011).
22
2.3 MRI in Head Injury
Numerous imaging techniques provide information into the sequelae of brain injury, but
magnetic resonance imaging (MRI) in particular is useful in assessing the extent of mild
brain injury and its recovery, both in the subacute and chronic injury stages (Lagares et
al., 2009). Over the past 30 years advances in MRI scanning techniques have allowed
detailed examination of the microscopic changes that take place following TBI and have
enabled their progression to be evaluated over time. MRI sequences have been
developed to allow multiple quantitative factors to be assessed in brain injury, such as
cerebral blood flow and blood volume, water diffusion patterns, integrity of white
matter tracts, the amounts of certain biochemical compounds present and the activity of
targeted areas of brain (Garnett et al., 2001a, Garnett et al., 2001b, Ge et al., 2009,
Hergan et al., 2002).
Despite having been shown to be more sensitive in the detection of acute traumatic
lesions caused by head injury (Firsching et al., 2001, Paterakis et al., 2000), MRI
scanning does not typically play a major role in diagnosis or clinical management of
these patients. The long image acquisition times of MRI and the need to transfer the
patient onto non-ferrous support equipment render it unsuitable in the emergency
management of acute injury, when the patient may be clinically unstable (e.g. on
ventilator support). In most cases CT scanning, which is fast and easy to acquire,
provides images which are more than adequate to allow initial assessment and
management planning in acute TBI (Manolakaki et al., 2009). CT is therefore entirely
satisfactory for the diagnosis of acute sub-dural haematomas and extra-dural
haematomas for example. However, the more detailed images provided by MRI are
useful in the acute stage of injury if the CT findings do not correlate with the clinical
neurological picture.
MRI is the preferred mode of scanning in the subacute and chronic phases of head
injury, due to its enhanced resolution and level of detail when compared to CT scanning
(Le and Gean, 2009). There are a number of different sequences available, each of
which provides valuable information in the head injured patient.
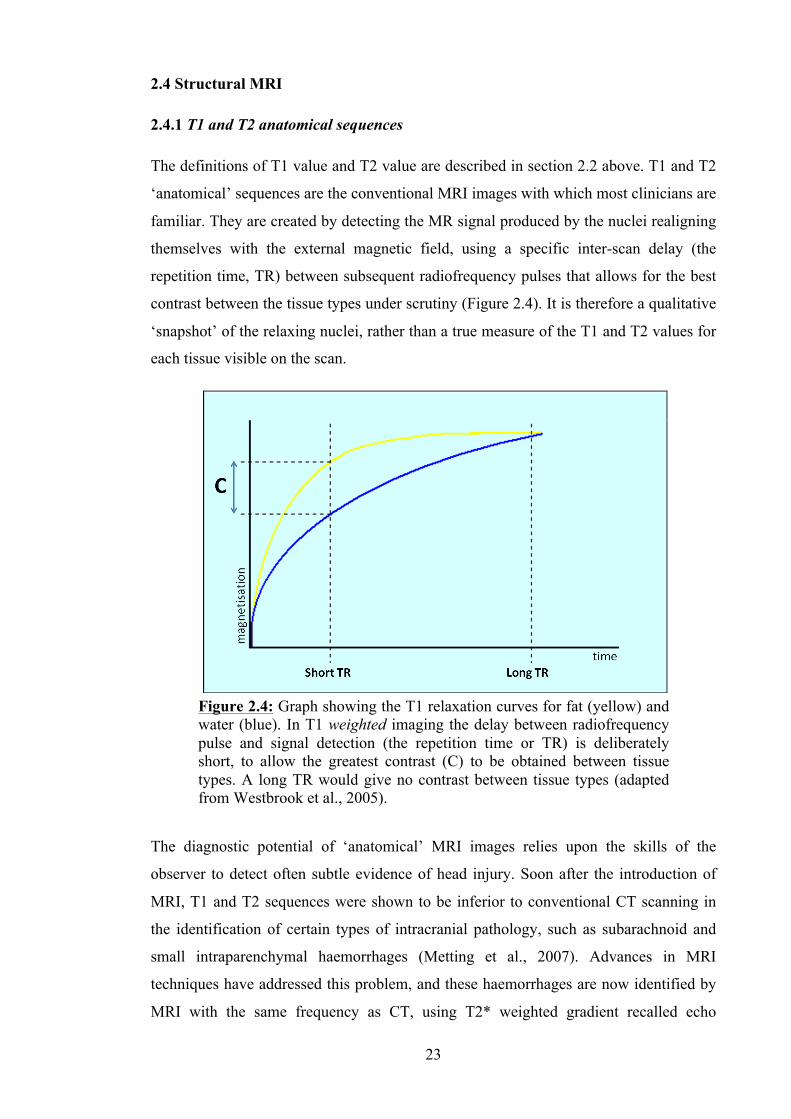
23
2.4 Structural MRI
2.4.1 T1 and T2 anatomical sequences
The definitions of T1 value and T2 value are described in section 2.2 above. T1 and T2
‘anatomical’ sequences are the conventional MRI images with which most clinicians are
familiar. They are created by detecting the MR signal produced by the nuclei realigning
themselves with the external magnetic field, using a specific inter-scan delay (the
repetition time, TR) between subsequent radiofrequency pulses that allows for the best
contrast between the tissue types under scrutiny (Figure 2.4). It is therefore a qualitative
‘snapshot’ of the relaxing nuclei, rather than a true measure of the T1 and T2 values for
each tissue visible on the scan.
The diagnostic potential of ‘anatomical’ MRI images relies upon the skills of the
observer to detect often subtle evidence of head injury. Soon after the introduction of
MRI, T1 and T2 sequences were shown to be inferior to conventional CT scanning in
the identification of certain types of intracranial pathology, such as subarachnoid and
small intraparenchymal haemorrhages (Metting et al., 2007). Advances in MRI
techniques have addressed this problem, and these haemorrhages are now identified by
MRI with the same frequency as CT, using T2* weighted gradient recalled echo
Figure 2.4: Graph showing the T1 relaxation curves for fat (yellow) and water (blue). In T1 weighted imaging the delay between radiofrequency pulse and signal detection (the repetition time or TR) is deliberately short, to allow the greatest contrast (C) to be obtained between tissue types. A long TR would give no contrast between tissue types (adapted from Westbrook et al., 2005).
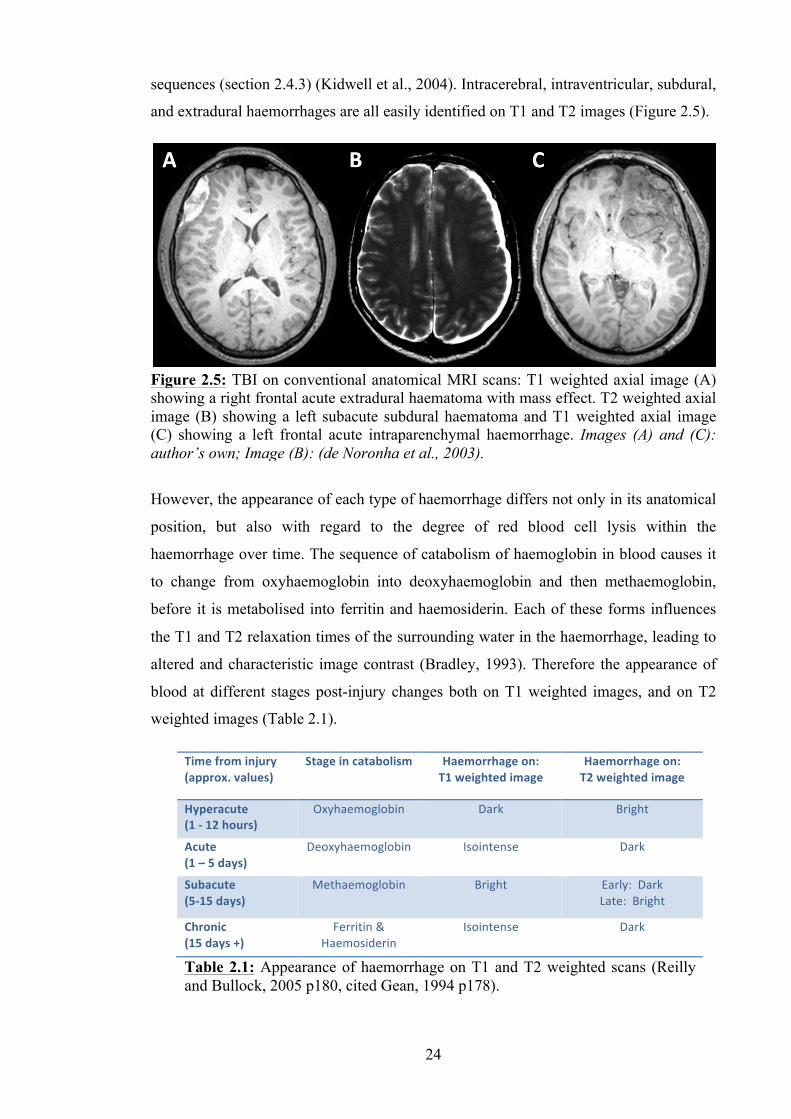
24
sequences (section 2.4.3) (Kidwell et al., 2004). Intracerebral, intraventricular, subdural,
and extradural haemorrhages are all easily identified on T1 and T2 images (Figure 2.5).
However, the appearance of each type of haemorrhage differs not only in its anatomical
position, but also with regard to the degree of red blood cell lysis within the
haemorrhage over time. The sequence of catabolism of haemoglobin in blood causes it
to change from oxyhaemoglobin into deoxyhaemoglobin and then methaemoglobin,
before it is metabolised into ferritin and haemosiderin. Each of these forms influences
the T1 and T2 relaxation times of the surrounding water in the haemorrhage, leading to
altered and characteristic image contrast (Bradley, 1993). Therefore the appearance of
blood at different stages post-injury changes both on T1 weighted images, and on T2
weighted images (Table 2.1).
Figure 2.5: TBI on conventional anatomical MRI scans: T1 weighted axial image (A) showing a right frontal acute extradural haematoma with mass effect. T2 weighted axial image (B) showing a left subacute subdural haematoma and T1 weighted axial image (C) showing a left frontal acute intraparenchymal haemorrhage. Images (A) and (C): author’s own; Image (B): (de Noronha et al., 2003).
Time from injury (approx. values)
Stage in catabolism Haemorrhage on: T1 weighted image
Haemorrhage on: T2 weighted image
Hyperacute (1 -‐ 12 hours)
Oxyhaemoglobin Dark Bright
Acute (1 – 5 days)
Deoxyhaemoglobin Isointense Dark
Subacute (5-‐15 days)
Methaemoglobin Bright Early: Dark Late: Bright
Chronic (15 days +)
Ferritin & Haemosiderin
Isointense Dark
Table 2.1: Appearance of haemorrhage on T1 and T2 weighted scans (Reilly and Bullock, 2005 p180, cited Gean, 1994 p178).
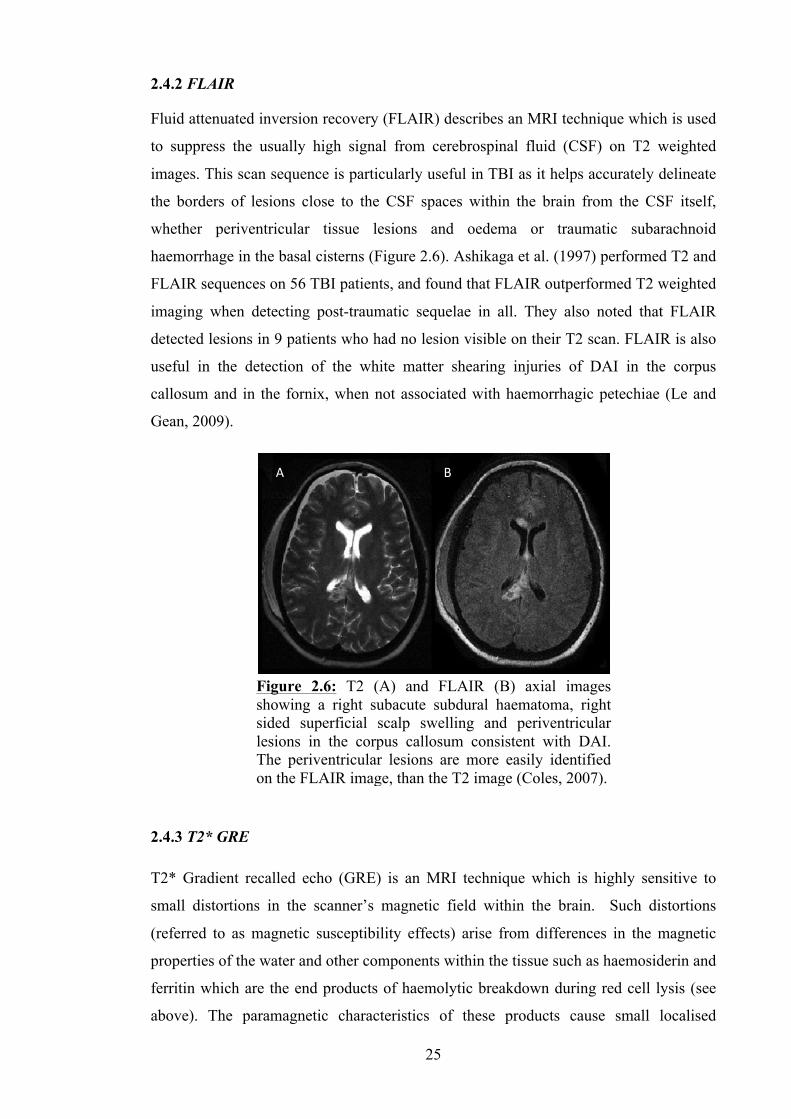
25
2.4.2 FLAIR
Fluid attenuated inversion recovery (FLAIR) describes an MRI technique which is used
to suppress the usually high signal from cerebrospinal fluid (CSF) on T2 weighted
images. This scan sequence is particularly useful in TBI as it helps accurately delineate
the borders of lesions close to the CSF spaces within the brain from the CSF itself,
whether periventricular tissue lesions and oedema or traumatic subarachnoid
haemorrhage in the basal cisterns (Figure 2.6). Ashikaga et al. (1997) performed T2 and
FLAIR sequences on 56 TBI patients, and found that FLAIR outperformed T2 weighted
imaging when detecting post-traumatic sequelae in all. They also noted that FLAIR
detected lesions in 9 patients who had no lesion visible on their T2 scan. FLAIR is also
useful in the detection of the white matter shearing injuries of DAI in the corpus
callosum and in the fornix, when not associated with haemorrhagic petechiae (Le and
Gean, 2009).
2.4.3 T2* GRE
T2* Gradient recalled echo (GRE) is an MRI technique which is highly sensitive to
small distortions in the scanner’s magnetic field within the brain. Such distortions
(referred to as magnetic susceptibility effects) arise from differences in the magnetic
properties of the water and other components within the tissue such as haemosiderin and
ferritin which are the end products of haemolytic breakdown during red cell lysis (see
above). The paramagnetic characteristics of these products cause small localised
Figure 2.6: T2 (A) and FLAIR (B) axial images showing a right subacute subdural haematoma, right sided superficial scalp swelling and periventricular lesions in the corpus callosum consistent with DAI. The periventricular lesions are more easily identified on the FLAIR image, than the T2 image (Coles, 2007).
A B
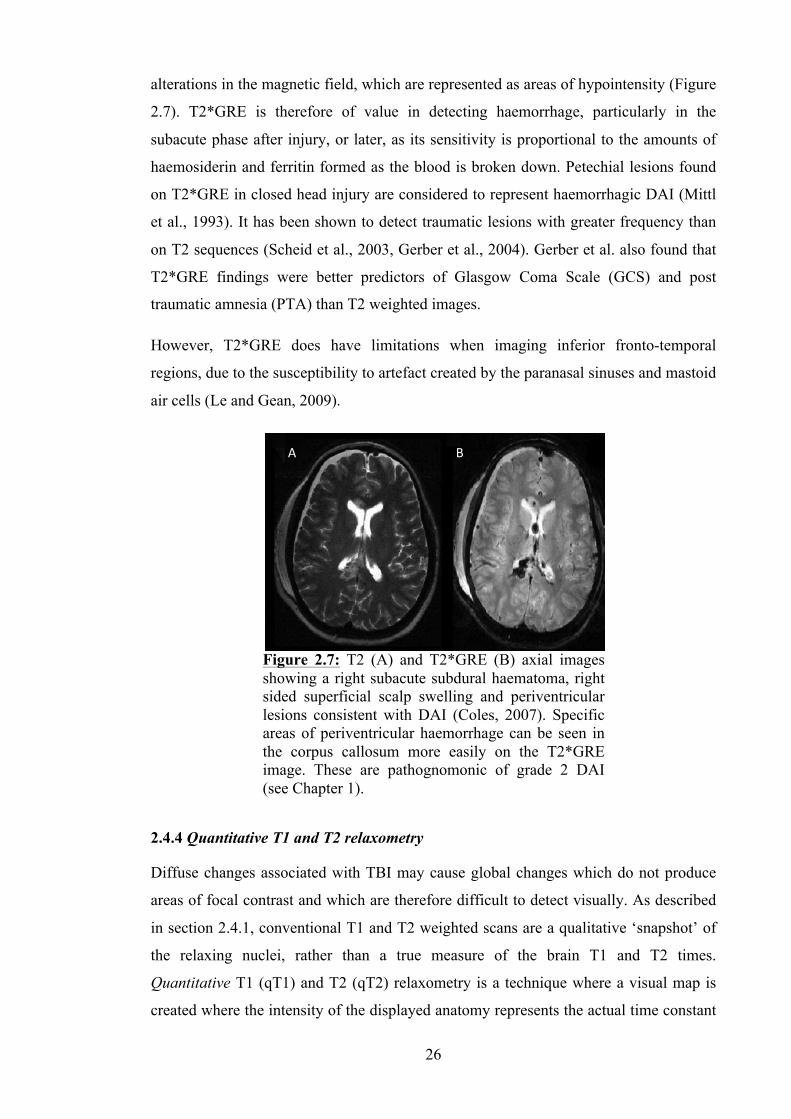
26
alterations in the magnetic field, which are represented as areas of hypointensity (Figure
2.7). T2*GRE is therefore of value in detecting haemorrhage, particularly in the
subacute phase after injury, or later, as its sensitivity is proportional to the amounts of
haemosiderin and ferritin formed as the blood is broken down. Petechial lesions found
on T2*GRE in closed head injury are considered to represent haemorrhagic DAI (Mittl
et al., 1993). It has been shown to detect traumatic lesions with greater frequency than
on T2 sequences (Scheid et al., 2003, Gerber et al., 2004). Gerber et al. also found that
T2*GRE findings were better predictors of Glasgow Coma Scale (GCS) and post
traumatic amnesia (PTA) than T2 weighted images.
However, T2*GRE does have limitations when imaging inferior fronto-temporal
regions, due to the susceptibility to artefact created by the paranasal sinuses and mastoid
air cells (Le and Gean, 2009).
2.4.4 Quantitative T1 and T2 relaxometry
Diffuse changes associated with TBI may cause global changes which do not produce
areas of focal contrast and which are therefore difficult to detect visually. As described
in section 2.4.1, conventional T1 and T2 weighted scans are a qualitative ‘snapshot’ of
the relaxing nuclei, rather than a true measure of the brain T1 and T2 times.
Quantitative T1 (qT1) and T2 (qT2) relaxometry is a technique where a visual map is
created where the intensity of the displayed anatomy represents the actual time constant
Figure 2.7: T2 (A) and T2*GRE (B) axial images showing a right subacute subdural haematoma, right sided superficial scalp swelling and periventricular lesions consistent with DAI (Coles, 2007). Specific areas of periventricular haemorrhage can be seen in the corpus callosum more easily on the T2*GRE image. These are pathognomonic of grade 2 DAI (see Chapter 1).
A B
27
for decay of that tissue. It can therefore be used to make a quantitative assessment of
these values within the tissue, and may reveal more details of underlying pathology than
the conventional visual analysis of T1 and T2 weighted scans (Clare and Jezzard, 2001).
There has been relatively little examination of TBI using analysis of quantitative T1 and
quantitative T2 relaxation times. Naruse et al. (1982) studied the effects of vasogenic
and cytotoxic oedema on qT1 and qT2 times in a rat model. They found that in
vasogenic oedema there was an increase in qT1 time at 3 hours after injury in grey
matter and 6 hours after injury in white matter. The increase persisted for 6 days and
peaked at 24 hours. They also observed an increase in qT2 time with vasogenic oedema,
but in the white matter only after 2 hours. Again the values peaked at 24 hours, but were
faster to return to normal, and did so by 4 days. In cytotoxic oedema, they found that
qT1 and qT2 values were again increased, but only in white matter. Interestingly the
increase in each took longer to appear, occurring 3 days after injury in both qT1 and
qT2. The effects of cytotoxic oedema also lasted for much longer than the effects of
vasogenic oedema: they did not return to normal until 49 days after the injury. Sibson et
al. (2008) have also demonstrated an increase in quantitative T1 time in the acute phase
of injury in their animal model of TBI. They found similar increases in both cases of
low-flow ischaemia and in excitotoxicity. The morphologic feature common to both of
these pathological processes was the acute activation of astrocytes, and it was this that
the authors hypothesised was the cause of the increased qT1.
Clinical studies have also been conducted; Goetz et al. (2004) performed quantitative
MRI in 23 TBI patients of mixed severity in the acute phase after their injuries and
included measurement of qT1 and qT2 in their scan sequences. They found no
significant change in either value when the data from the patient group was compared to
data from 13 control subjects. They also found no correlation between injury severity
and either qT1 or qT2.
Quantitative T2 relaxation time has also been evaluated in TBI patients in the chronic
phase of injury. Mamere et al. (2009) studied 9 moderate and severely injured patients a
mean of 3.1 years after trauma, and found an increase in T2 relaxation time in normal
appearing brain white matter and specifically in the corpus callosum. They hypothesised
that the observed qT2 changes reflected an increase in water concentration secondary to
axonal loss.
28
Further experimental studies measuring T2 relaxation times in rat cortical lesions were
conducted in 2009 (Kharatishvili et al., 2009, Immonen et al., 2009). Kharatishvili et al.
found not only that T2 values in the brain injured animals increased within 3 days post
injury, but that the increase correlated with lesion volume and was able to differentiate
between moderate and severe TBI. Immonen et al. observed that qT1 and qT2 increased
in the peri-lesional area after 9 and 3 days post-injury respectively. They attributed their
finding of raised qT2 time to the increase in extracellular fluid due to vasogenic
oedema, and the delayed increase in qT1 time to the accumulation of macromolecules as
necrosis and cell death occurs. Zhang et al. (2011) have also studied T2 relaxometry in
rats, 5 days after inducing Wallerian degeneration by unilateral cortical ablation (see
section 1.10.3). They found no difference in T2 relaxation time between affected cortex
and healthy cortex.
2.5 Diffusion Weighted Imaging
2.5.1 DWI principles
Magnetic resonance techniques have been developed which allow quantitative
evaluation of water diffusion patterns at a microscopic level. The ability to make
measurements of molecular self-diffusion by nuclear magnetic resonance has been
recognised since 1965, but it was not until 1990 that it was first employed as a clinical
tool to identify areas of brain where localised water diffusion had been affected by
ischaemic stroke (Stejskal and Tanner, 1965, Neil, 2008).
The diffusion image is obtained by first encoding the location of water molecules within
the brain with one magnetic gradient pulse, and then locating them again with a second
magnetic gradient pulse after a delay of around 60 milliseconds. Movement of the water
molecules between these two pulses affects the MR signal allowing quantitative data
about the overall direction and degree of molecular water movement in the tissue being
examined to be calculated. This data is the diffusion coefficient, and is a measure of
how far, on average, molecules move due to random “Brownian” motion. However,
water may not move as far in a structured environment than it may in a uniform one. If
there are many structural barriers to its movement, the distance the molecule moves is
much lower than it should be due to true diffusion alone. Therefore, the data collected is
given the term apparent diffusion coefficient (ADC) to acknowledge this.
29
2.5.2 DWI in brain injury
ADC has been studied in relation to brain tissue injury. The overwhelming finding in
clinical trials using DWI in acute stroke has been a reduction in localised ADC in areas
of ischaemic brain (Kloska et al., 2010, Saur et al., 2003, Schlaug et al., 1997). It is
hypothesised that this is due to the presence of cytotoxic oedema in which the net
movement of water is from the extracellular space to the intracellular compartment.
This is thought to increase cell volume and decrease the net movement of extracellular
free water, and this is represented by a reduced ADC. This process happens within 6-12
hours of the onset of stroke, and the ADC subsequently increases slowly over the next
3-6 days, at which point it pseudo-normalises. More recently, in some cases ADC has
also been found to be reduced post TBI, and it is suspected that this is due to areas of
ischaemic brain tissue secondary to trauma (Ito et al., 1996, Hergan et al., 2002, Blamire
et al., 2002). Theories have been proposed to explain the mechanism; firstly that the
diffusion coefficient is reduced due to hypoxia and simultaneous cerebral hypotension,
and secondly, that diffusion is reduced as a result of the formation of retraction balls
following axotomy after shearing injury (Ito et al., 1996, Povlishock and Christman,
1995, Schaefer et al., 2004). A decrease in ADC has also been shown to occur in the
presence of inflammatory mediators, and with trauma induced cytotoxic oedema
(Blamire et al., 2000, Barzo et al., 1997).
Other studies report an increase in ADC in traumatic brain injury, both in areas
susceptible to diffuse axonal injury, and in whole brain white matter analysis (Goetz et
al., 2004, Newcombe et al., 2007). Alongside the macroscopic changes that occur in
grade 2 and 3 DAI mentioned above, grade 1 DAI describes widespread axonal damage
without the focal evidence of haemorrhagic petechiae that allow it to be visualised on
T1 and T2 weighted anatomical scans. Given that it is the presence of haemorrhage that
is most readily detected in the anatomical T1 and T2 imaging sequences, grade 1 DAI is
not well demonstrated by those techniques, and is best identified using diffusion
weighted imaging (Huisman et al., 2003).
A number of pathological processes have been shown to be linked to a rise in ADC.
Firstly it has been observed in experimental models that ADC increases in areas with
vasogenic oedema, after localised disruption of the blood-brain barrier (Barzo et al.,
1997). Secondly, it has been noted in rodent models, that a rise in ADC is associated
with features of chronic ischaemia, and within areas of infarcted brain (Granziera et al.,
2007). Thirdly, it has been suggested that the observed increase in ADC is as a result of

30
a reduction in obstruction to water diffusion, as a consequence of tissue cytostructure
damage, as axonal collapse follows on from Wallerian degeneration in the subacute
phase of brain injury. Furthermore, a proportional link between degree of increase in
ADC and severity of head injury has been reported (Goetz et al., 2004).
2.6 Diffusion Tensor Imaging
2.6.1 DTI principles
Diffusion tensor imaging (DTI) is an advanced MRI application which allows
quantification of localised water diffusion properties within the brain, and is an
extension of DWI making the method more robust.
If we consider a population of water molecules in a beaker of water which are allowed
to diffuse freely, there is no restriction to their motion in any direction and their
movement over time can be modelled by a perfect sphere. This is termed isotropic
diffusion. This however is not the case in vivo where, in the brain, this diffusion is
restricted in one or more planes by both intracellular and extracellular barriers (such as
myelin sheaths and axon fibres). In this situation the movement of water molecules can
be described by an ellipsoid, and is termed anisotropic diffusion (Figure 2.8).
Figure 2.8: A model of anisotropic diffusion of water molecules and its representation by a tensor. Left: Diffusion is restricted in the transverse plane by the fibres, and but is less restricted parallel to them in the longitudinal plane. Right: Principal axis (λ1) of the ellipsoid reflects diffusion in the longitudinal plane, the mean of the shorter axes of the ellipsoid (λ2 and λ3) equate to radial diffusivity and reflect diffusion in the transverse plane (adapted from Chanraud et al., 2010).
31
In order to define this ellipsoid mathematically we must make a number of
measurements of water diffusion in varying directions and apply a diffusion tensor
model to their analysis. This quantifies the magnitude of diffusion in three
perpendicular planes (x, y and z) and these magnitudes are termed ‘eigenvalues’ (λ1, λ2
and λ3). Using this same model we can describe the orientation of the ellipsoid in 3D
space using ‘eigenvectors’ (v1, v2 and v3). In brain white matter, where myelinated
axons are running in a particular direction, and water movement across them is
restricted, it follows that the greatest eigenvector is parallel to the axon fibres
themselves. Using eigenvector values we can calculate rotationally invariant indices of
diffusion across the entire brain image. Examples of which would include mean
diffusivity (MD) as a marker of isotropy and fractional anisotropy (FA) which
quantifies restricted diffusion. FA values range from 0 to 1, with 0 representing total
isotropy, or free diffusion in all directions, and 1 representing total anisotropy, or
diffusion perfectly restricted to one plane only.
It has been proposed that detection of patterns of anisotropy in the brain may provide
further information about the underlying tissue micro-architecture. In particular,
patterns of local anisotropy have been shown to delineate axon fibre orientation and
white matter tract pathways by applying a technique called tractography.
FA has been measured in a number of studies into the use of DTI in head injury. The
majority of papers looking at TBI in the acute phase (within 7 days of injury) have
shown there to be a decrease in white matter fractional anisotropy post TBI. Arfanakis
et al. (2002) show a decrease in FA in normal appearing whole brain white matter, when
compared to control groups. Huisman et al. (2004) show a reduced FA in the regions of
white matter known to be susceptible to diffuse axonal injury. Newcombe et al. (2007)
show reduced FA in both these susceptible regions and whole brain white matter when
compared to a control group. The fact that the authors of the above papers have been
able to show that reduced white matter FA exists in TBI patients in regions known to be
most susceptible to DAI has led them to postulate that these FA reductions indicate
diffuse axonal injury – the reduction in FA being caused by disruption of axons and
their myelin sheaths thereby causing less restriction to water movement across them.
Of the studies that looked both at FA and outcome from TBI, no relationship was found
when analysing whole brain white matter, and only the FA in the cerebral peduncle
32
correlated with the Glasgow outcome scale (GOS) in 30 patients with severe brain
injury (Newcombe et al., 2007, Sidaros et al., 2008).
Fractional anisotropy values can be used to map tissue structures in vivo. In the brain,
FA values allow mapping of axonal tracts in white matter. As described above, the
movement of water molecules within brain white matter is anisotropic, with the largest
eigenvector parallel to the axon fibres. Using this information, a map of axonal tracts
within the brain can be produced and rendered in 2 and 3 dimensions. This technique of
mapping white matter tracts is called tractography. It follows that using tractography,
individual patients can be studied to ascertain whether their white matter tracts show
evidence of shearing after traumatic brain injury (Gold and Lipton, 2008).
2.6.2 DTI analysis techniques
Given that the MD and FA values obtained using DTI describe the micro-movement of
water molecules, and these are hypothesised to be different depending upon the tissue
type under scrutiny, to simply obtain a mean MD or FA value for the whole brain (grey
and white matter values combined in one analysis) would be meaningless. Studies using
DTI have therefore used a number of different techniques to obtain the values for the
different structures they have been investigating.
The most popular technique employed involves the placement of regions of interest
(ROIs) according to anatomical features on a conventional T1 or T2 weighted MR scan
co-registered to the DTI data. Mean MD and FA values are then extracted for those
regions and compared, either between patient groups, or with values from the same
regions in controls (Levin et al., 2008, Matsushita et al., 2011, Newcombe et al., 2011,
Niogi et al., 2008a). Other methods of data extraction involve automatically segmenting
the data into tissue type (e.g. white matter or grey matter) and obtaining mean data
values for each, or using a tractography software program to define tracts of axonal
fibres within white matter and extracting MD and FA values from those three
dimensional structures (Chu et al., 2009, Goetz et al., 2004, Hong et al., 2009,
Newcombe et al., 2008).
Analysis can be performed by translating all available patient and control data into a
‘standard space’, which allows a direct comparison of like for like regions within the
brain, or it can be performed in the ‘patient’s space’ or ‘real space’, which some groups
feel gives a more accurate representation of the true values being examined in each
subject (Aribisala et al., 2011).
33
Analysis can also be performed at the level of individual voxels, a technique called
Voxel Based Morphometry, which is performed by translating the data for each subject
into a standard space template, and running the data through a software program which
highlights voxels where the data of the subjects being examined differs from that of the
population it is being compared against.
2.6.3 DTI in brain injury
As DTI is a relatively new application, there have been a large number of recent studies
examining its use in many different cerebral diseases and pathological states. The use of
DTI in traumatic brain injury has expanded as the technology has become more readily
available in the clinical centres that manage this patient group. Analysis of DTI data has
for the most part concentrated on white matter regions and the fibre tracts therein. This
is of particular interest to the field, as it is hypothesised that damage to those axonal
tracts will cause a detectable alteration in both MD and FA, when compared to control
subjects without the damage. Initial work has predominantly examined patients in the
chronic stages of brain injury, as these patients are typically the least difficult to recruit
and to scan. As discussed previously, patients with an acute brain injury are often not
stable from a clinical perspective, and therefore are less suitable to undergo scans with
the often lengthy acquisition times needed for DTI. That said, a small number of studies
have still managed to examine patients in the acute and sub-acute stages of TBI.
2.6.4 DTI white matter analysis in chronic TBI
In patients who are months to years from their brain injury, the majority of studies using
DTI have described a statistically significant long term increase in the apparent
diffusion coefficient (ADC) and in the mean diffusivity (MD) of the white matter areas
examined. Popular regions of interest under scrutiny include the corpus callosum,
internal and external capsule, inferior and superior longitudinal fasciculus and the
fornix, along with less well defined ROIs looking at lobar white matter. These regions
have been chosen for study, not only because they contain long axonal fibres known to
be disrupted in diffuse axonal injury, but also because these structures are known to be
involved in memory, information processing and cognition (see Chapter 3), which are
affected in post-concussive syndrome. All of the authors of these studies have
postulated a link between the significant findings in their DTI data, where they exist,
and the post-concussion symptoms suffered by the subjects they have analysed. In 2005,
Inglese et al. (2005) examined 26 mild TBI patients a mean of 5.7 years after their
34
injury, and compared their DTI findings to those in 29 healthy volunteers. They showed
significant increases in mean diffusivity in the splenium of the corpus callosum and in
the internal capsule posterior limb in the patient group, when analysed using ROIs
selected in normal appearing white matter. Two other studies have demonstrated an
increase in apparent diffusion coefficient in similar regions in chronic TBI; Lo et al.
(2009) showed an ADC increase in the genu of the corpus callosum in a small number
of severe TBI patients examined, and Newcombe et al. (2011) found an increase in
anterior and posterior corpus callosum ADC in 68 patients of mixed injury severity
when those with a good outcome score were compared to those with a poor outcome.
In the chronic stage after traumatic brain injury, a number of studies measuring
fractional anisotropy in these specific white matter tract regions have demonstrated a
significant decrease in patients when compared to control groups (Nakayama et al.,
2006, Palacios et al., 2011, Xu et al., 2007). In 9 patients with chronic severe TBI Xu et
al. (2007) showed a significant decrease in FA in anterior and posterior corpus callosum
ROIs, and in the posterior limb of the internal capsule. Nakayama et al. (2006)
examined 23 patients who had recovered from coma after severe TBI, and compared
them with 23 matched control subjects. They demonstrated a significant reduction in FA
within the corpus callosum, not only with anatomically placed ROIs, but also when they
performed a voxel-based analysis in standard space. The most recent work in this
patient group has been published in 2011 (Palacios et al.) where rather than using ROIs
placed according to anatomical landmarks, the authors’ analysis used ‘tract-based
spatial statistics’ to compare FA values in the white matter fibre tracts involved with
memory, between 15 chronic severe TBI patients and 16 matched controls. Their
findings were in keeping with earlier research, and showed a reduction in FA in the
corpus callosum, superior and inferior longitudinal fasciculi and in the inferior fronto-
occipital fasciculi.
This picture of reduced FA in the fibre tracts of chronic severe TBI patients is also
reflected in the mild and moderate brain injury population. The study in 2005 by Inglese
et al. showed reduced FA in the corpus callosum, internal capsule and centrum
semiovale in 26 mild TBI patients compared to the 29 controls, as well as the increases
in MD mentioned above. Kraus et al. (2007) investigated 20 mild TBI patients
separately from 17 moderate/severe patients and compared the two groups with 18
control subjects. They not only found a reduction of FA in the moderate/severe patient
group in all thirteen regions they analysed, but also demonstrated a significant FA

35
decrease between the controls and the mild patient group in the cortico-spinal tract,
sagittal stratum and superior longitudinal fasciculus. In 2008, a number of studies were
performed looking exclusively at mild TBI populations in the chronic phase of injury,
and each demonstrated a reduction in FA in the patient groups when compared to
control groups (Lipton et al., Niogi et al., Rutgers et al.). Furthermore, in 43 chronic
mild TBI patients with persistent symptoms, Niogi et al. (2008a) were able to
demonstrate a correlation between the number of examined ROIs showing reduced FA
and the mean reaction time in a simple cognitive task, adding weight to the hypothesis
that the detectable changes in FA are indicative of underlying tissue damage causing
persistent cognitive deficits.
Analysis of lobar or whole brain white matter has shown fewer consistent findings in
the chronic stages after brain injury. The lack of significant findings can, in part, be
attributed to the dilutional effect of taking mean MD and FA values for all of the white
matter voxels in the lobe under scrutiny, or in the case of whole brain examination, the
mean values of every white matter voxel in the brain. As we know that some areas of
the brain are more susceptible to diffuse axonal injury, it stands to reason that if those
areas are grouped together with areas that are less likely to be affected, then the mean
values calculated will have a lower likelihood of showing significance. That said,
Benson et al. (2007) found a global reduction in whole brain white matter FA in a
heterogeneous TBI patient group scanned a mean of 35 months after injury and Lipton
et al. (2008) were able to demonstrate a small but significant reduction in whole brain
white matter FA in 17 mild TBI patients. Both of these studies used a whole brain
histogram analysis and compared the TBI patients to matched control groups.
2.6.5 DTI white matter analysis in acute and sub-acute TBI
The majority of papers looking at TBI in the acute phase (within 14 days of injury) have
shown an increase in mean diffusivity and a decrease in fractional anisotropy, mirroring
the findings in the chronic phase. In 2002, Arfanakis et al. showed a decrease in FA in
normal appearing whole brain white matter, in patients with mild TBI less than 24 hours
from injury, when compared to control groups. However, the power of their work was
reduced by the fact that they only studied 5 patients. Inglese et al. (2005) observed an
increase in the MD and a reduction in FA in the splenium of the corpus callosum when
performing ROI analysis on 20 mild TBI patients, a mean of 4 days from injury. More
recently, Kumar et al. (2009) studied 26 mild and 57 moderate TBI patients within 14
days of injury and again showed a significant increase in MD in the genu of the corpus
36
callosum and a corresponding decrease in FA, both in the genu and splenium of the
corpus callosum. They used ROI analysis and compared the patient groups separately
against 33 matched control subjects. In 2011 Ljungqvist et al. published their findings
from a longitudinal study in severe TBI, where they examined 8 TBI patients a mean of
7 days from injury, and then again 6 months later. They observed a significant acute
reduction in corpus callosum FA which was still present at 6 month follow up, using a
tractography-based ROI analysis. They were also able to demonstrate a correlation
between the reduction in FA and with TBI outcome, after measuring the extended
Glasgow Outcome Scale score at 6 months. These results are being further substantiated
by work currently published online and awaiting publication in print: Matsushita et al.
(2011) are publishing their findings of a reduction in FA in the splenium of the corpus
callosum in 20 patients with a mix of mild and moderate acute TBI, having used an ROI
analysis.
However, while the results from most papers follow this pattern of increased MD and
reduced FA, a number of studies have demonstrated differing results. In particular, the
work of some centres has shown an increase in FA in the acute phase of injury
(Bazarian et al., 2007, Chu et al., 2009, Hartikainen et al., 2010, Mayer et al., 2010,
Wilde et al., 2008). Between 2007 and 2008, two groups published data on acute mild
TBI. Bazarian et al. (2007) performed ROI analysis of 6 patients and 6 matched controls
within 72 hours of injury, and found an increase in FA in the splenium of the corpus
callosum which correlated with post-concussive symptom (PCS) assessment score as
well as with neuropsychological test scores in visual motor speed and impulse control.
Wilde et al. (2008) also showed an increase in corpus callosum FA along with a
reduction in ADC in 10 mTBI patients less than 6 days from injury. They too found a
correlation between the increase in FA and PCS severity. More recently Chu et al.
(2009) examined 10 mild TBI patients and scanned them at a mean of 2.7 days from
injury. Using voxel-based analysis, they demonstrated a number of white matter regions
with reduced ADC. An increase in FA was also shown, but the authors note that this
finding was in injury-affected regions, rather than in normal appearing white matter
remote from any lesion. The increase in FA may therefore not only be due to altered
anisotropy as a result of axonal disruption, but may also reflect underlying cytotoxic
oedema.
In the sub acute time frame (2-8 weeks) from brain injury, the literature over the last 5
years has shown consistent findings of a reduction in FA in all regions examined, and in
37
the complete spectrum of TBI severity. Sidaros et al. (2008) and Tollard et al. (2009)
both exclusively examined patients with severe TBI within 3 months of injury. Their
patient groups numbered 30 and 43 respectively and both studies made comparisons
with matched control groups. Sidaros showed a reduction in FA in all white matter
regions investigated, which included the corpus callosum, internal capsule, centrum
semiovale and cerebral peduncle, and Tollard found a similar reduction in both
supratentorial and infratentorial FA, after a mean had been calculated from the FA
values for supratentorial ROIs placed in the midbrain, temporal and occipital white
matter, internal and external capsule and centrum semiovale, and infratentorial ROIs in
the pons. Tollard et al. do note that their results may be affected by partial volume error,
as the ROIs in the external capsule and pons contained grey matter values that they were
unable to separate out.
Mild and moderate TBI patients have also been studied in the sub-acute injury phase,
with similar findings of a decrease in FA, in studies with small patient populations.
However, Lange et al. published in 2011 their work on 60 mild TBI patients who were
6-8 weeks post injury, by far the largest mild TBI study cohort yet examined. They
found no significant differences in either MD or FA in the corpus callosum, when
comparing the entire patient group to 34 control subjects, and no significant differences
when they separately analysed the patients in subgroups according to whether or not
they were suffering from post-concussive symptoms.
2.6.6 DTI grey matter analysis in TBI
Examination of grey matter using DTI has been less widespread, and in the case of
cortical grey matter this may be due to difficulties during data processing; the
intervolutions of grey and white matter within the gyri and sulci of the cortex make the
MR data more susceptible to partial volume effects. It may also be the case that
investigators have found it more difficult to hypothesise as to the cause of any identified
difference in MD or FA in grey matter regions where there are no long fibre tracts
restricting diffusion. However, diffuse axonal injury is not only limited to brain areas
containing long axonal tracts, but also occurs at junctions between areas of differing
density, such as at the grey-white matter interface (Hou et al., 2007). Here the
acceleration/deceleration forces have the greatest impact, as the less dense grey matter
moves more rapidly than the denser white matter underlying it. This movement causes
focal alteration, leading to delayed disconnection of axons connecting the grey and
white matter. Therefore, it can be hypothesised that any observed MD or FA differences
38
in cortical grey matter may represent these progressive structural and sub-cellular
consequences of mechanical deformation (Büki and Povlishock, 2006).
Those studies that have analysed cortical grey matter have shown significant differences
in ADC, MD and FA between patients with brain injury and matched controls, both in
the acute and chronic phase of injury (Hou et al., 2007, Kim et al., 2011, Newcombe et
al., 2011). In a heterogeneous group of acute TBI patients compared to controls Hou et
al. found an increase in ADC in deep grey matter structures (along with both deep and
cortical white matter), and a decrease in ADC within peripheral grey matter. The
authors postulate that this reduction in ADC in the peripheral grey matter could reflect
differences in diffusional characteristics of contusional versus axonal injury.
2.6.7 DTI correlation with clinical outcome and neuropsychology performance
In chronic TBI across the spectrum of severity, a number of studies have shown a
correlation between their findings of increased ADC or MD and decreased FA, and
clinical outcome. The hypothesis being that these findings indicate underlying structural
damage to axonal tracts which causes impairment of higher mental function in those
who maintain or regain consciousness after TBI, and may be implicated in the
pathological mechanisms in those who do not, resulting in persistent vegetative state or
death.
In 2006, Wilde et al. found that a higher FA in the corpus callosum of their 16 children
with chronic TBI was related to a better functional outcome measured using the
Glasgow Outcome Scale (GOS), while Newcombe et al. published in 2011 their
findings of a significant trend of increasing ADC in all regions of interest (grey matter
and white matter) with worse outcome, again categorised by the GOS. Newcombe et al.
also found that a worse clinical outcome corresponded with significant trends of
decreasing FA, but only in white matter ROIs.
In the acute TBI population a correlation was found between both a reduction in ADC,
and an increase in FA, and post-concussive symptoms by Chu et al. (2009) using the
Rivermead Post-Concussion Symptoms Questionnaire. Perlbarg et al. (2009) scanned
30 patients a mean of 23 days from injury, and then grouped them according to GOS
score at 1 year into unfavourable (GOS 1-3) or favourable outcome (GOS 4-5). They
found that there was no correlation between ADC and outcome at 1 year, but that FA
measured in the inferior longitudinal fasciculus, cerebral peduncle, posterior limb of the
internal capsule and posterior corpus callosum was specifically decreased in the
39
unfavourable outcome group compared to the favourable one. In 2008, Sidaros et al.
were able to demonstrate that FA in the cerebral peduncle correlated with 1 year GOS
score in 30 patients with severe TBI scanned within 12 weeks of injury.
Many studies have further tried to narrow down a relationship between differences in
MD or FA that they have observed, and the specific neuropsychological functions that
those brain areas may relate to. In cross-sectional studies, authors have postulated that
the differences in diffusion markers indicate structural damage that is causing the
ongoing cognitive symptoms, and these findings have prompted longitudinal studies,
hypothesising that DTI might have a prognostic role in TBI, by being able to predict
who will have these ongoing symptoms, and what those symptoms will be.
In the chronic stages of TBI a reduction in FA in the left posterior cingulate, left
hippocampal formation and left frontal, temporal and occipital cortex was found by
Salmond et al. (2006) to be correlated with impaired learning and memory. In 14
children with TBI, 6-12 months post-injury, Wozniak et al. (2007) found that FA in the
frontal and supracallosal regions was correlated with executive functioning, and that
supracallosal FA was also correlated with motor speed, when tested using a number of
neurocognitive evaluations. Niogi et al. (2008b) demonstrated a correlation between
attentional control and FA in the left hemisphere anterior corona radiata, and a
correlation between memory performance and FA in the uncinate fasciculus in 43
patients with chronic mild TBI.
Correlations with cognitive performance have also been found acutely after TBI; Lipton
et al. (2009) showed a correlation with lower FA in the dorsolateral pre-frontal cortex
and worse executive function in 20 mild TBI patients less than 2 weeks from injury, and
a correlation was found by Wu et al. (2010) between FA in the left cingulum bundle and
with 30 minute delayed recall in 12 adolescents with mild TBI. Niogi et al. (2008a)
found that the number of ROIs with decreased FA compared to controls was
significantly correlated with mean reaction time in 34 adults with persistent post-
concussive symptoms after mild TBI.
Unsurprisingly, the authors of these papers state that their findings support the
hypothesis that diffusion anisotropy measurement can be used as a quantitative
biomarker for neurocognitive function and dysfunction, and therefore may contribute
additional diagnostic information.
40
2.7 Summary
MRI has an important role in traumatic brain injury which is increasing in line with
current development of MRI techniques. Purely structural MRI imaging techniques
have already been shown to be superior to other forms of conventional imaging in the
detection of almost all of the heterogeneous features of brain injury (Newcombe et al.,
2007, Garnett et al., 2001b, Lagares et al., 2009, Le and Gean, 2009, Lee and Newberg,
2005, Metting et al., 2007). In the clinical setting these are now becoming augmented
by sequences such as DTI which generate large quantities of data on the whole brain of
head injured patients. It is hoped that with more information about local tissue
characteristics at the site of injury it will enable greater insight into the
pathophysiological changes caused by traumatic injury. This paves the way, not only for
their use in detection of such changes, but also for their role in prognosis and decisions
on management in brain injury in the future.
From the review of the literature in each of the MRI techniques above, it can be seen
that a large amount of research has been performed on patients who have suffered
severe TBI, both in the subacute and chronic stages of their injury (Benson et al., 2007,
Blamire et al., 2002, Di et al., 2008, Garnett et al., 2001b, Lagares et al., 2009, Mamere
et al., 2009, Newcombe et al., 2007, Robertson et al., 1999, Sanchez-Carrion et al.,
2008a, Sidaros et al., 2008, Sidaros et al., 2009, Tollard et al., 2009, Weiss et al., 2008,
Belli et al., 2006, Cadoux-Hudson et al., 1990, Carpentier et al., 2006, Hillary et al.,
2007). The unstable nature of acute severe TBI accounts for the relative lack of research
involving this patient group. They are usually too unwell, either as a direct result of
their brain injury, or as a result of coexisting injury to other organ systems, to allow safe
transfer to the MRI scanner and the long image acquisition times involved.
The use of the different available MRI techniques on patients with mild head injury, has
also been well researched, with one paper assessing mild TBI within 24 hours of injury
(Arfanakis et al., 2002). However, the numbers of patients recruited into studies on mild
TBI tends to be directly related to the time from injury at which they are examined; the
largest cohort of mild TBI patients found was 60, in the recent study performed by
Lange et al. (2011) where the patients were examined between 6 and 8 weeks post-
injury. In contrast the largest cohort found of mild TBI patients studied within 2 weeks
of injury was 26, in the study performed by Kumar et al. (2009) into the correlation
between neuropsychometric test performance and DTI findings in the corpus callosum.
41
The largest cohort of mild TBI patients scanned within just 7 days of injury numbered
only 10 (Wilde et al., 2008).
While it is understandably important to study patients with severe injuries and the
effects that this has upon the brain, it must be noted that patients with an injury this
severe make up only 5% of all those who suffer a TBI, and furthermore, those who
sustain a severe primary injury, are those least likely to make a meaningful recovery.
The author anticipates that by attempting to overcome the barriers to recruitment, and
focusing further study on acute mild and moderate brain injury, using quantitative MRI
techniques, there is the potential to significantly add to the research already performed
in this field, and to have greater impact on a larger number of patients.
42
Chapter 3. Neuropsychology in Head Injury
3.1 Background
The use of neuropsychological testing is well established in the management of head
injury. Numerous studies have previously recommended that neuropsychological
assessment should be a routine component in the investigation of acute and chronic mild
TBI, and as a result various groups, authorities and governing bodies have included this
requirement for neuropsychological assessment in published guidelines for the
management of concussion (Hunt and Asplund, 2009, Sheedy et al., 2009, Gioia et al.,
2009, Tsaousides and Gordon, 2009, Riggio and Wong, 2009, Jaffee et al., 2009,
Lovell, 2009, McCrory et al., 2009).
Neuropsychological testing after TBI provides the ability to identify subtle cognitive
deficits which may otherwise have been missed by routine clinical assessment and
observation. Early identification of these deficits allows for the timely organisation of
rehabilitation input, if needed, and can provide information on prognosis in individual
cases. Furthermore, information and education about the likely impact that these
symptoms will have during their recovery may be passed on to the patient and their
relatives.
3.2 Detectable Cognitive Symptoms
As mentioned briefly in Chapter 1, there are a number of cognitive symptoms which
may be experienced by patients who have suffered a brain injury. They are more
prevalent in those with moderate and severe TBI, but can be present even in those with
the mildest injury (Thornhill et al., 2000). Cognitive symptoms associated with
concussion include slowed information processing, deficits of learning and memory,
problems with attention and concentration and with higher executive functions, such as
planning, switching parameters, organising and sequencing (Vanderploeg et al., 2005,
Riggio and Wong, 2009). Patients may find that tasks which were routine before their
injury have become difficult or impossible to carry out. Even at their most subtle, these
symptoms can become evident with focused neuropsychological testing.
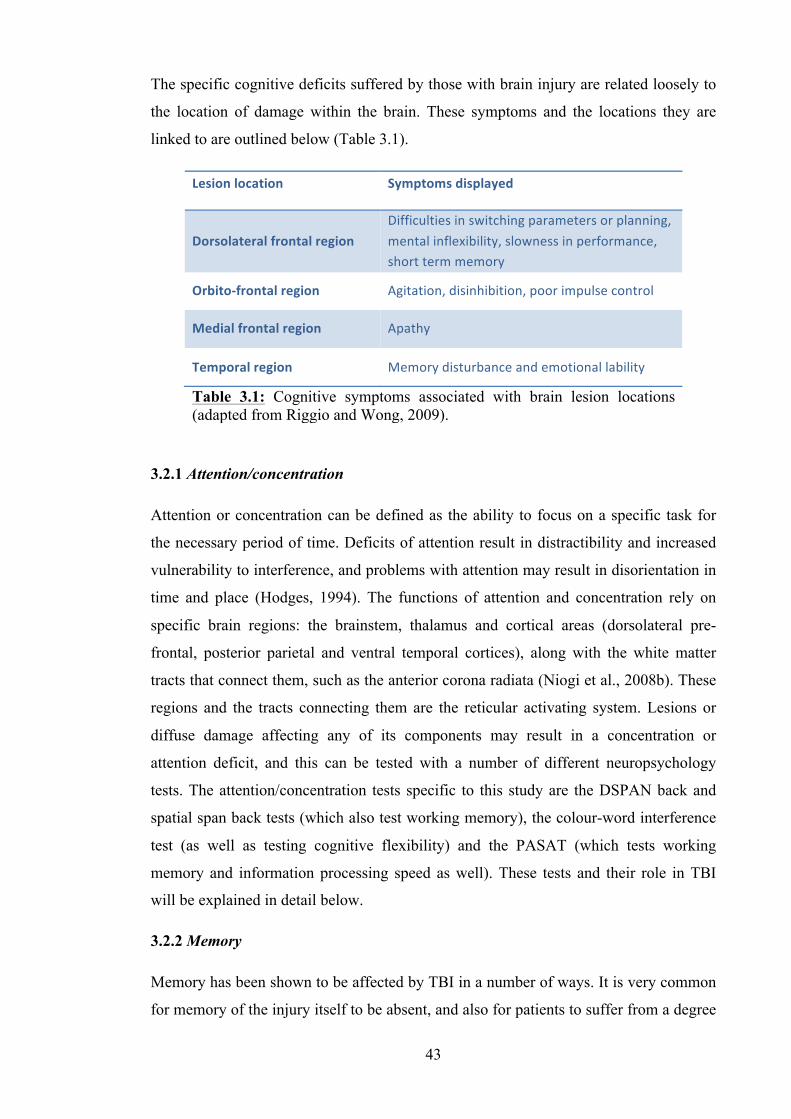
43
The specific cognitive deficits suffered by those with brain injury are related loosely to
the location of damage within the brain. These symptoms and the locations they are
linked to are outlined below (Table 3.1).
3.2.1 Attention/concentration
Attention or concentration can be defined as the ability to focus on a specific task for
the necessary period of time. Deficits of attention result in distractibility and increased
vulnerability to interference, and problems with attention may result in disorientation in
time and place (Hodges, 1994). The functions of attention and concentration rely on
specific brain regions: the brainstem, thalamus and cortical areas (dorsolateral pre-
frontal, posterior parietal and ventral temporal cortices), along with the white matter
tracts that connect them, such as the anterior corona radiata (Niogi et al., 2008b). These
regions and the tracts connecting them are the reticular activating system. Lesions or
diffuse damage affecting any of its components may result in a concentration or
attention deficit, and this can be tested with a number of different neuropsychology
tests. The attention/concentration tests specific to this study are the DSPAN back and
spatial span back tests (which also test working memory), the colour-word interference
test (as well as testing cognitive flexibility) and the PASAT (which tests working
memory and information processing speed as well). These tests and their role in TBI
will be explained in detail below.
3.2.2 Memory
Memory has been shown to be affected by TBI in a number of ways. It is very common
for memory of the injury itself to be absent, and also for patients to suffer from a degree
Lesion location Symptoms displayed
Dorsolateral frontal region Difficulties in switching parameters or planning, mental inflexibility, slowness in performance, short term memory
Orbito-‐frontal region Agitation, disinhibition, poor impulse control
Medial frontal region Apathy
Temporal region Memory disturbance and emotional lability
Table 3.1: Cognitive symptoms associated with brain lesion locations (adapted from Riggio and Wong, 2009).
44
of post-traumatic amnesia: an inability to remember events for a period after the injury,
which may last hours or days. However, these memory problems are short lived and
closely related to the time of injury. The most debilitating memory symptom reported
after TBI is an impairment of short term and working memory function long after the
injury. This affects the patient’s ability to recover by interfering with every facet of life,
from relationships to performance at work and all activities of daily living in the home.
It is theorised that distinct separate types of memory exist, but there is some controversy
as to the number of these memory types and where their definitions lie. It is generally
agreed that long-term memory exists, and does so separately from other types of
memory; it would be hard to deny that each person has a vast store of knowledge and a
record of prior events, that in normal circumstances can be accessed and reiterated
without difficulty (Cowan, 2008). Long-term memory is also referred to as semantic
memory, and can be further subdivided into declarative memory (e.g.: memory for
events and factual knowledge) and procedural memory (memory about how an object is
used or how a task is performed). The ability to lay down long term memories is
dependent on the hippocampus, and storage of long term memory is thought to be
associated with the temporal neocortex, predominantly in the left (dominant)
hemisphere (Eichenbaum, 2000).
Current thinking is that aside from long-term memory, two other memory types exist:
short-term memory and working memory. Scientific opinion differs as to whether these
are actually separate from each other, or to what degree there is crossover between the
two. Short-term memory is commonly defined as the facet of memory that holds a small
amount of information in an easily available state for a limited period of time, and is
associated with the frontal lobes, in particular the dorsolateral prefrontal cortex.
Working memory however, is defined by different authors in different ways. Some use
it to refer to the part of memory used to plan and carry out behaviour, others to refer
only to the aspects of short-term memory related to attention. Generally speaking
however, working memory is taken to be the combination of multiple components of
memory working together (Cowan, 2008). Working memory can be likened to the
clipboard facility on a personal computer, where information can be ‘copied to’ and
‘pasted from’ to allow for problem solving. An example would be remembering
locations to pass and turns to take when given directions by a stranger, and then using
the information to follow the instructions to the correct location. The executive
component of working memory is associated with bilateral frontal lobe function, while
45
the component responsible for repetition of words and numbers is located specifically in
the posterior inferior frontal gyrus in the dominant hemisphere (Broca’s area). Damage
to these areas therefore may cause deficiencies in working memory. This is tested for
verbally using the list learning test and the DSPAN back test, and non-verbally using
the design learning test and spatial span back test.
3.2.3 Executive function
Executive function broadly refers to the control of aspects of attention and future
planning and decision making. It is involved in decision making processes when those
decisions are not automatic responses based on learnt behaviours and previous
experience. It encompasses a number of functions: adaptive behaviour, abstract
conceptual ability, mental flexibility, problem solving, planning, initiation, sequencing
of behaviour and aspects of personality involved in drive, motivation and inhibition.
Executive function is associated almost exclusively with the frontal lobes, more
specifically with the prefrontal cortex, although in order to orchestrate higher
intellectual function, it has abundant connections to almost all other cortical and
subcortical structures (Hodges, 1994). Tests for assessing a participant’s executive
function include the Colour-Word interference test and parts of the verbal fluency test.
3.3 Neuropsychological Tests used in TBI
A vast range of neuropsychological tests exist, some are applicable for use in a variety
of conditions, including TBI, while others have been adapted or designed specifically
for use in head injury. The neuropsychology test battery used in this work was compiled
from established tests selected after discussion with two consultant neuropsychologists
in the centre where the research was to be performed. The areas of function we wanted
to test were attention, concentration, short term memory and executive function, all of
which have been shown to be affected by mild head injury (Smits et al., 2009, Hall et
al., 2005). The tests used are examined in the context of head injury below.
Performance in neuropsychological tests is affected by the education level and
intelligence of the participant taking the test. In some cases it might affect their ability
to understand the test instructions, or if the test involves thinking of words starting with
a particular letter, such as in the verbal fluency test (section 3.3.9), the extent of the
participant’s vocabulary will have a direct effect on the result. It is important to take this
46
into account when assumptions about the effects of brain injury are being based on the
results of the tests. When comparing results between a patient and control subject it is
necessary to obtain an indication of the patient’s premorbid IQ and education level, and
to match the control subject accordingly, to allow for a fair comparison.
3.3.1 National adult reading test (NART)
The national adult reading test allows assessment of the participant’s intelligence
quotient (IQ). The test consists of 50 words which do not conform to normal
grammatical rules. This ensures that when they are read aloud by the participant, the
correct pronunciation depends upon them having been seen and heard previously. There
exists a high correlation between reading ability and intelligence in the normal
population, and as such the NART has been shown to be a good measure of pre-injury
IQ (Crawford et al., 1989). Performance is linked to the level of education and to social
class. Performance is not affected by age, gender and ethnicity. Previous work has
shown that NART scores represent premorbid intelligence and are generally resistant to
neurological insults such as mild head injury (Crawford et al., 2001, Crawford et al.,
1988). However, other studies testing patients within 12 months of injury have shown
that the results can be affected by severe TBI, and in such cases using the NART may
significantly underestimate the premorbid IQ (Riley and Simmonds, 2003).
In order to calculate the participant’s IQ the NART error score is used along with a
published table. The mean IQ for each group was compared to ensure similarity
between groups.
3.3.2 The BIRT memory and information processing battery (BMIPB)
This test battery, published by the Brain Injury Rehabilitation Trust (BIRT), is widely
used in the assessment of patients with traumatic brain injury. Compiled in 2007 by
Coughlan, Oddy, & Crawford, it is based upon the adult memory and information
processing battery (AMIPB) which has been in use since its development in 1985. It is
described as a ‘revision and extension’ of the tests therein, and has been designed
specifically for use with the brain injured patient. While large numbers of studies refer
to the AMIPB, relatively few have referenced the BMIPB. This is probably due to the
fact that it was only published 3 years ago. Three of the BMIPB tests were utilised in
this study, speed of information processing, design learning and list learning.
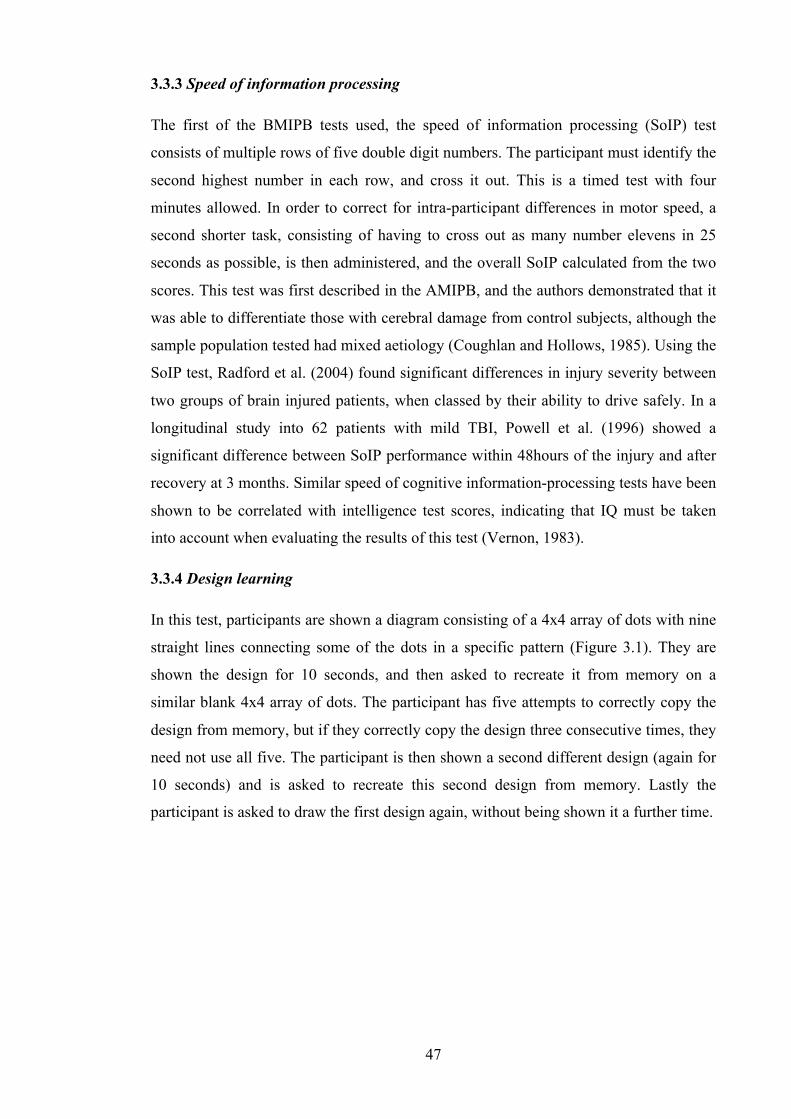
47
3.3.3 Speed of information processing
The first of the BMIPB tests used, the speed of information processing (SoIP) test
consists of multiple rows of five double digit numbers. The participant must identify the
second highest number in each row, and cross it out. This is a timed test with four
minutes allowed. In order to correct for intra-participant differences in motor speed, a
second shorter task, consisting of having to cross out as many number elevens in 25
seconds as possible, is then administered, and the overall SoIP calculated from the two
scores. This test was first described in the AMIPB, and the authors demonstrated that it
was able to differentiate those with cerebral damage from control subjects, although the
sample population tested had mixed aetiology (Coughlan and Hollows, 1985). Using the
SoIP test, Radford et al. (2004) found significant differences in injury severity between
two groups of brain injured patients, when classed by their ability to drive safely. In a
longitudinal study into 62 patients with mild TBI, Powell et al. (1996) showed a
significant difference between SoIP performance within 48hours of the injury and after
recovery at 3 months. Similar speed of cognitive information-processing tests have been
shown to be correlated with intelligence test scores, indicating that IQ must be taken
into account when evaluating the results of this test (Vernon, 1983).
3.3.4 Design learning
In this test, participants are shown a diagram consisting of a 4x4 array of dots with nine
straight lines connecting some of the dots in a specific pattern (Figure 3.1). They are
shown the design for 10 seconds, and then asked to recreate it from memory on a
similar blank 4x4 array of dots. The participant has five attempts to correctly copy the
design from memory, but if they correctly copy the design three consecutive times, they
need not use all five. The participant is then shown a second different design (again for
10 seconds) and is asked to recreate this second design from memory. Lastly the
participant is asked to draw the first design again, without being shown it a further time.
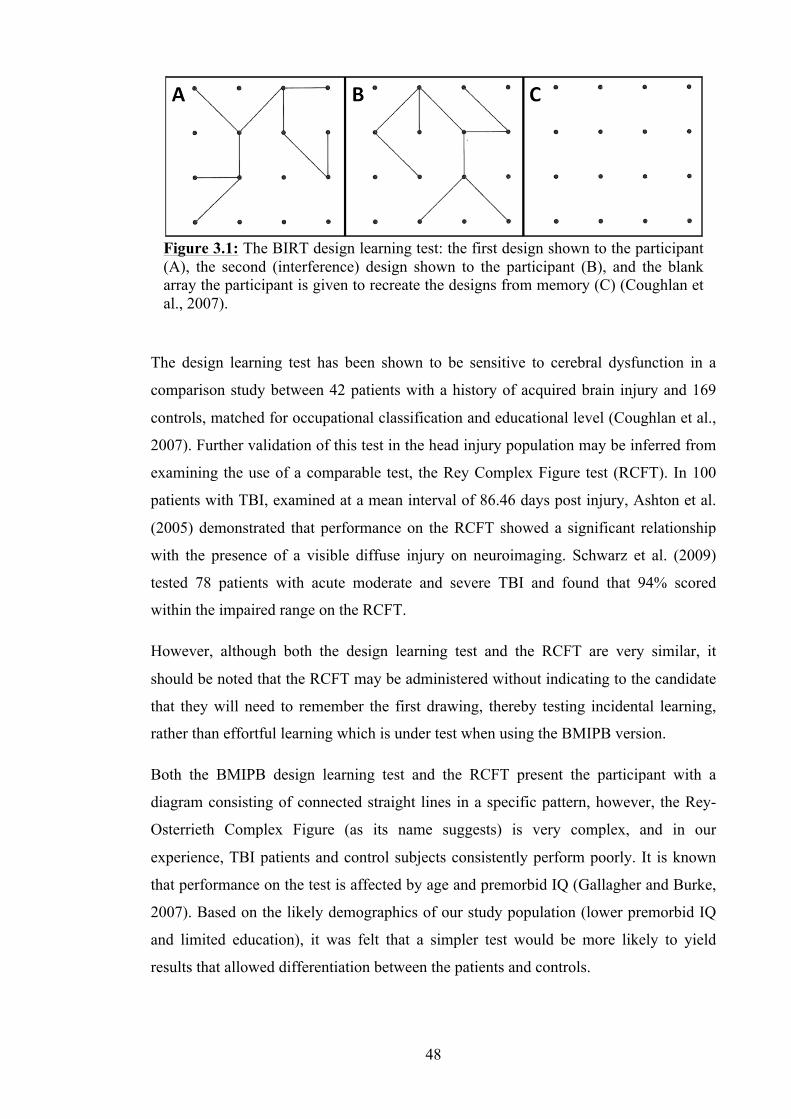
48
The design learning test has been shown to be sensitive to cerebral dysfunction in a
comparison study between 42 patients with a history of acquired brain injury and 169
controls, matched for occupational classification and educational level (Coughlan et al.,
2007). Further validation of this test in the head injury population may be inferred from
examining the use of a comparable test, the Rey Complex Figure test (RCFT). In 100
patients with TBI, examined at a mean interval of 86.46 days post injury, Ashton et al.
(2005) demonstrated that performance on the RCFT showed a significant relationship
with the presence of a visible diffuse injury on neuroimaging. Schwarz et al. (2009)
tested 78 patients with acute moderate and severe TBI and found that 94% scored
within the impaired range on the RCFT.
However, although both the design learning test and the RCFT are very similar, it
should be noted that the RCFT may be administered without indicating to the candidate
that they will need to remember the first drawing, thereby testing incidental learning,
rather than effortful learning which is under test when using the BMIPB version.
Both the BMIPB design learning test and the RCFT present the participant with a
diagram consisting of connected straight lines in a specific pattern, however, the Rey-
Osterrieth Complex Figure (as its name suggests) is very complex, and in our
experience, TBI patients and control subjects consistently perform poorly. It is known
that performance on the test is affected by age and premorbid IQ (Gallagher and Burke,
2007). Based on the likely demographics of our study population (lower premorbid IQ
and limited education), it was felt that a simpler test would be more likely to yield
results that allowed differentiation between the patients and controls.
Figure 3.1: The BIRT design learning test: the first design shown to the participant (A), the second (interference) design shown to the participant (B), and the blank array the participant is given to recreate the designs from memory (C) (Coughlan et al., 2007).
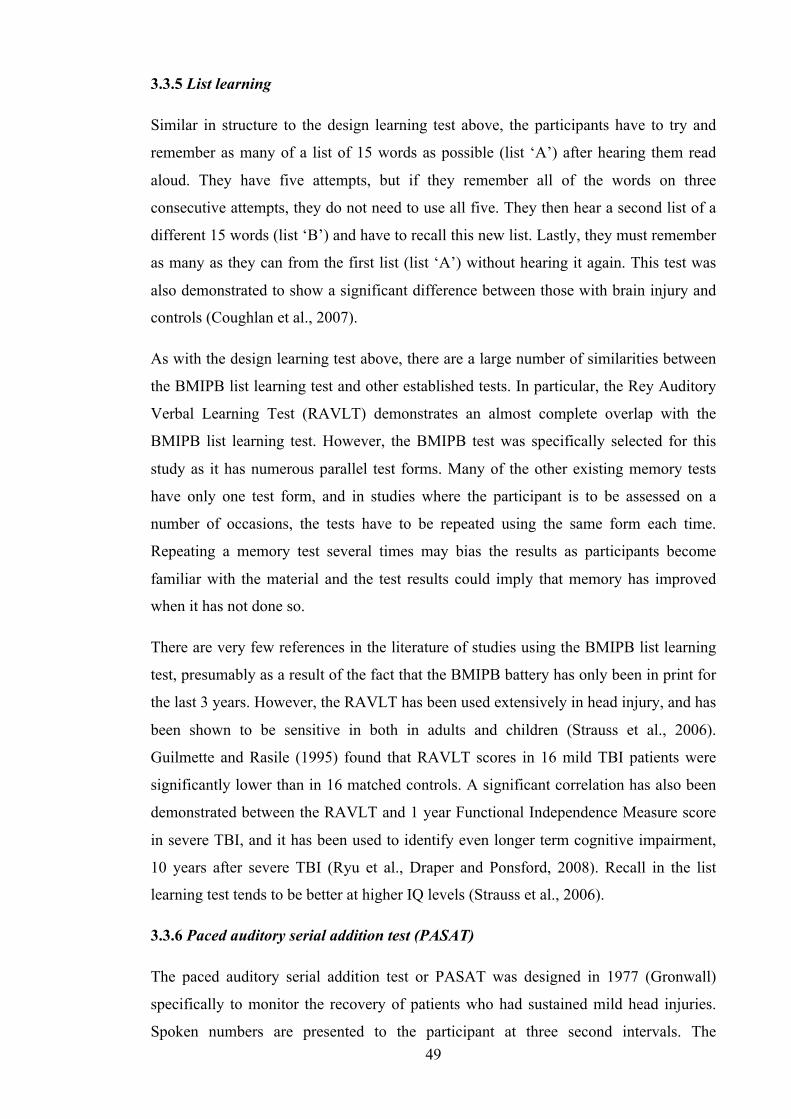
49
3.3.5 List learning
Similar in structure to the design learning test above, the participants have to try and
remember as many of a list of 15 words as possible (list ‘A’) after hearing them read
aloud. They have five attempts, but if they remember all of the words on three
consecutive attempts, they do not need to use all five. They then hear a second list of a
different 15 words (list ‘B’) and have to recall this new list. Lastly, they must remember
as many as they can from the first list (list ‘A’) without hearing it again. This test was
also demonstrated to show a significant difference between those with brain injury and
controls (Coughlan et al., 2007).
As with the design learning test above, there are a large number of similarities between
the BMIPB list learning test and other established tests. In particular, the Rey Auditory
Verbal Learning Test (RAVLT) demonstrates an almost complete overlap with the
BMIPB list learning test. However, the BMIPB test was specifically selected for this
study as it has numerous parallel test forms. Many of the other existing memory tests
have only one test form, and in studies where the participant is to be assessed on a
number of occasions, the tests have to be repeated using the same form each time.
Repeating a memory test several times may bias the results as participants become
familiar with the material and the test results could imply that memory has improved
when it has not done so.
There are very few references in the literature of studies using the BMIPB list learning
test, presumably as a result of the fact that the BMIPB battery has only been in print for
the last 3 years. However, the RAVLT has been used extensively in head injury, and has
been shown to be sensitive in both in adults and children (Strauss et al., 2006).
Guilmette and Rasile (1995) found that RAVLT scores in 16 mild TBI patients were
significantly lower than in 16 matched controls. A significant correlation has also been
demonstrated between the RAVLT and 1 year Functional Independence Measure score
in severe TBI, and it has been used to identify even longer term cognitive impairment,
10 years after severe TBI (Ryu et al., Draper and Ponsford, 2008). Recall in the list
learning test tends to be better at higher IQ levels (Strauss et al., 2006).
3.3.6 Paced auditory serial addition test (PASAT)
The paced auditory serial addition test or PASAT was designed in 1977 (Gronwall)
specifically to monitor the recovery of patients who had sustained mild head injuries.
Spoken numbers are presented to the participant at three second intervals. The
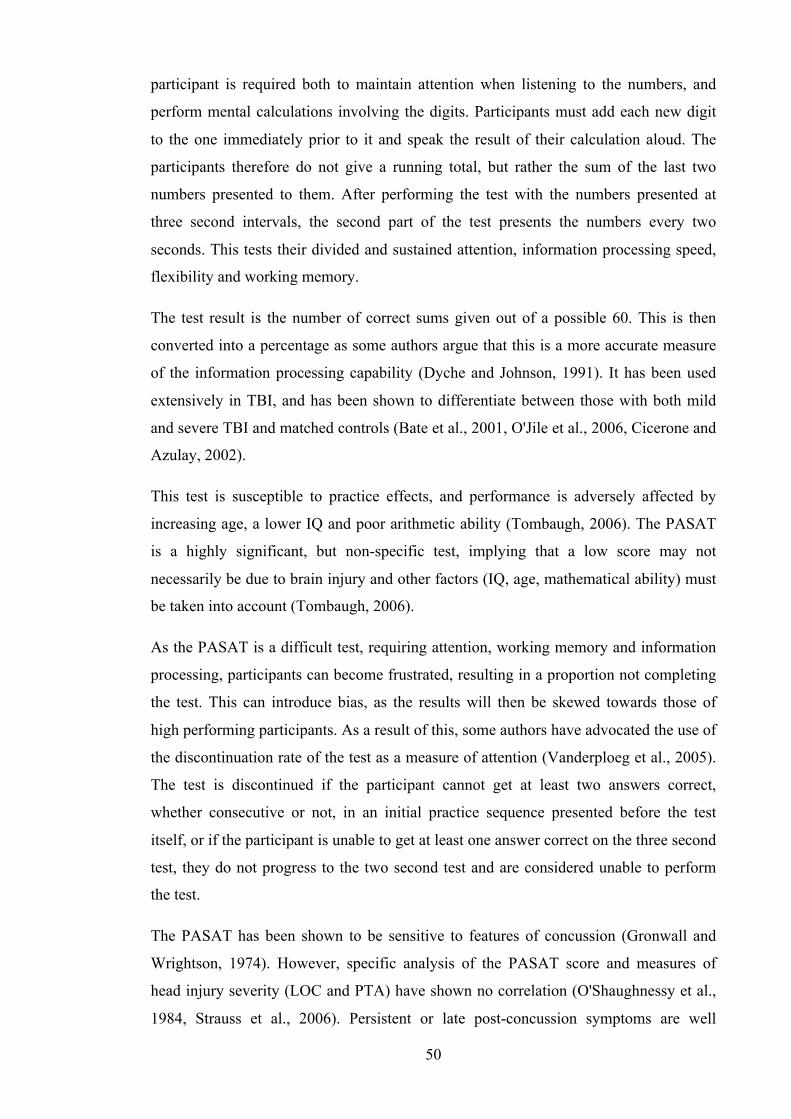
50
participant is required both to maintain attention when listening to the numbers, and
perform mental calculations involving the digits. Participants must add each new digit
to the one immediately prior to it and speak the result of their calculation aloud. The
participants therefore do not give a running total, but rather the sum of the last two
numbers presented to them. After performing the test with the numbers presented at
three second intervals, the second part of the test presents the numbers every two
seconds. This tests their divided and sustained attention, information processing speed,
flexibility and working memory.
The test result is the number of correct sums given out of a possible 60. This is then
converted into a percentage as some authors argue that this is a more accurate measure
of the information processing capability (Dyche and Johnson, 1991). It has been used
extensively in TBI, and has been shown to differentiate between those with both mild
and severe TBI and matched controls (Bate et al., 2001, O'Jile et al., 2006, Cicerone and
Azulay, 2002).
This test is susceptible to practice effects, and performance is adversely affected by
increasing age, a lower IQ and poor arithmetic ability (Tombaugh, 2006). The PASAT
is a highly significant, but non-specific test, implying that a low score may not
necessarily be due to brain injury and other factors (IQ, age, mathematical ability) must
be taken into account (Tombaugh, 2006).
As the PASAT is a difficult test, requiring attention, working memory and information
processing, participants can become frustrated, resulting in a proportion not completing
the test. This can introduce bias, as the results will then be skewed towards those of
high performing participants. As a result of this, some authors have advocated the use of
the discontinuation rate of the test as a measure of attention (Vanderploeg et al., 2005).
The test is discontinued if the participant cannot get at least two answers correct,
whether consecutive or not, in an initial practice sequence presented before the test
itself, or if the participant is unable to get at least one answer correct on the three second
test, they do not progress to the two second test and are considered unable to perform
the test.
The PASAT has been shown to be sensitive to features of concussion (Gronwall and
Wrightson, 1974). However, specific analysis of the PASAT score and measures of
head injury severity (LOC and PTA) have shown no correlation (O'Shaughnessy et al.,
1984, Strauss et al., 2006). Persistent or late post-concussion symptoms are well
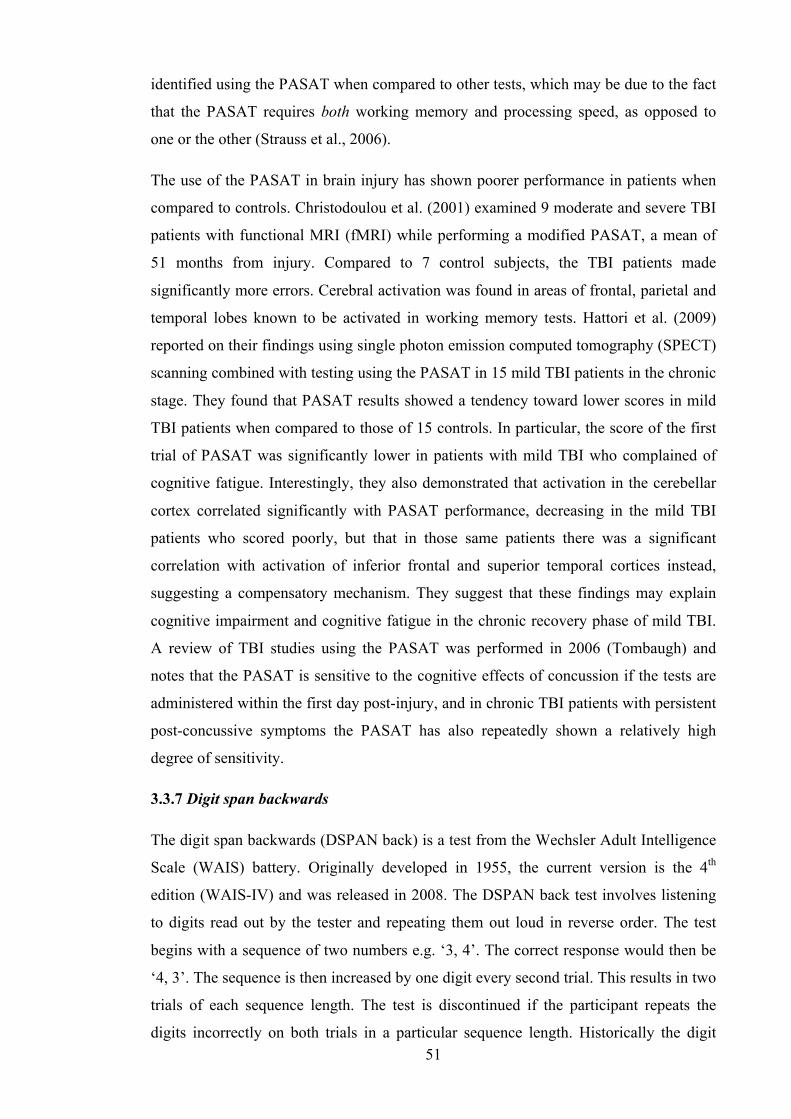
51
identified using the PASAT when compared to other tests, which may be due to the fact
that the PASAT requires both working memory and processing speed, as opposed to
one or the other (Strauss et al., 2006).
The use of the PASAT in brain injury has shown poorer performance in patients when
compared to controls. Christodoulou et al. (2001) examined 9 moderate and severe TBI
patients with functional MRI (fMRI) while performing a modified PASAT, a mean of
51 months from injury. Compared to 7 control subjects, the TBI patients made
significantly more errors. Cerebral activation was found in areas of frontal, parietal and
temporal lobes known to be activated in working memory tests. Hattori et al. (2009)
reported on their findings using single photon emission computed tomography (SPECT)
scanning combined with testing using the PASAT in 15 mild TBI patients in the chronic
stage. They found that PASAT results showed a tendency toward lower scores in mild
TBI patients when compared to those of 15 controls. In particular, the score of the first
trial of PASAT was significantly lower in patients with mild TBI who complained of
cognitive fatigue. Interestingly, they also demonstrated that activation in the cerebellar
cortex correlated significantly with PASAT performance, decreasing in the mild TBI
patients who scored poorly, but that in those same patients there was a significant
correlation with activation of inferior frontal and superior temporal cortices instead,
suggesting a compensatory mechanism. They suggest that these findings may explain
cognitive impairment and cognitive fatigue in the chronic recovery phase of mild TBI.
A review of TBI studies using the PASAT was performed in 2006 (Tombaugh) and
notes that the PASAT is sensitive to the cognitive effects of concussion if the tests are
administered within the first day post-injury, and in chronic TBI patients with persistent
post-concussive symptoms the PASAT has also repeatedly shown a relatively high
degree of sensitivity.
3.3.7 Digit span backwards
The digit span backwards (DSPAN back) is a test from the Wechsler Adult Intelligence
Scale (WAIS) battery. Originally developed in 1955, the current version is the 4th
edition (WAIS-IV) and was released in 2008. The DSPAN back test involves listening
to digits read out by the tester and repeating them out loud in reverse order. The test
begins with a sequence of two numbers e.g. ‘3, 4’. The correct response would then be
‘4, 3’. The sequence is then increased by one digit every second trial. This results in two
trials of each sequence length. The test is discontinued if the participant repeats the
digits incorrectly on both trials in a particular sequence length. Historically the digit
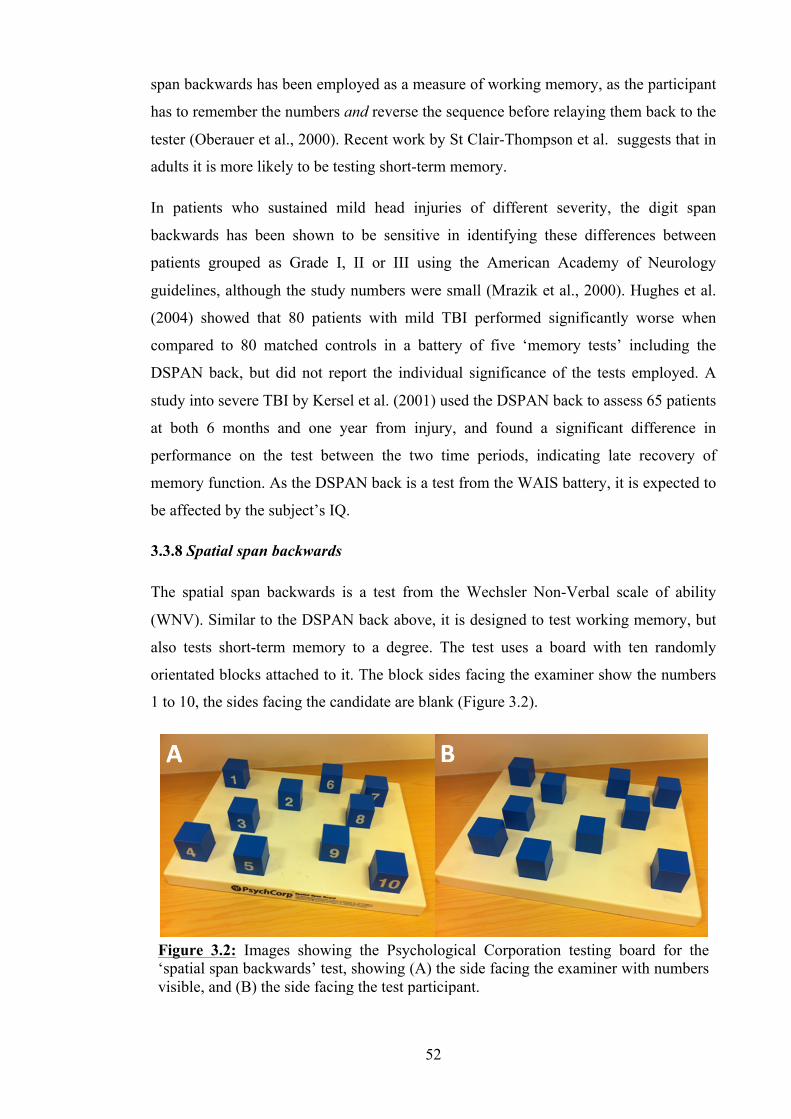
52
span backwards has been employed as a measure of working memory, as the participant
has to remember the numbers and reverse the sequence before relaying them back to the
tester (Oberauer et al., 2000). Recent work by St Clair-Thompson et al. suggests that in
adults it is more likely to be testing short-term memory.
In patients who sustained mild head injuries of different severity, the digit span
backwards has been shown to be sensitive in identifying these differences between
patients grouped as Grade I, II or III using the American Academy of Neurology
guidelines, although the study numbers were small (Mrazik et al., 2000). Hughes et al.
(2004) showed that 80 patients with mild TBI performed significantly worse when
compared to 80 matched controls in a battery of five ‘memory tests’ including the
DSPAN back, but did not report the individual significance of the tests employed. A
study into severe TBI by Kersel et al. (2001) used the DSPAN back to assess 65 patients
at both 6 months and one year from injury, and found a significant difference in
performance on the test between the two time periods, indicating late recovery of
memory function. As the DSPAN back is a test from the WAIS battery, it is expected to
be affected by the subject’s IQ.
3.3.8 Spatial span backwards
The spatial span backwards is a test from the Wechsler Non-Verbal scale of ability
(WNV). Similar to the DSPAN back above, it is designed to test working memory, but
also tests short-term memory to a degree. The test uses a board with ten randomly
orientated blocks attached to it. The block sides facing the examiner show the numbers
1 to 10, the sides facing the candidate are blank (Figure 3.2).
Figure 3.2: Images showing the Psychological Corporation testing board for the ‘spatial span backwards’ test, showing (A) the side facing the examiner with numbers visible, and (B) the side facing the test participant.

53
Starting with a sequence of two, the blocks are tapped in a specific order. For example,
the examiner would touch the block with the number ‘3’ on it and then touch the block
with the number ‘4’ on it. The test participant observes the examiner tapping the blocks
in turn, but does not see the numbers written on the blocks. The participant is then asked
to tap the blocks in reverse order from memory. As with the DSPAN back, the sequence
is then increased by one block every second trial. This results in two trials of each
sequence length. The test is discontinued if the participant touches the blocks in the
incorrect order on both trials in a particular sequence length.
The spatial span back test is a useful test of memory in combination with the DSPAN
back test. It does not rely on any numeracy or vocabulary skills, as there is no verbal
content, and therefore its results are even less likely to be affected by bias. In 46
patients in the chronic phase after severe TBI, Ferri et al. (2004) found that 36 (85.6%)
showed a deficit in their working memory as tested using the spatial span back test as
part of the Wechsler adult intelligence scale test battery.
3.3.9 Verbal fluency (letter and category)
The verbal fluency test has been in use in various forms for the last 20 years, and
examines the participant’s ability to ‘word-find’ under restricted search conditions,
testing executive function. The most common version of this test, and the one used in
this study, uses phonemic and semantic cues. The phonemic cues are the letters ‘F’, ‘A’
and ‘S’; the participant is asked to produce as many words beginning with the letter
given in 60 seconds, without using proper nouns, numbers or multiple words with a
common stem. The next section of the verbal fluency test uses semantic cues. The
participant is restricted not by initial letter, but by category. The participant is required
firstly to name as many animals as possible within 60 seconds, and secondly to produce
as many boys’ names as possible within 60 seconds. The last section of the test uses a
‘switching format’: asking the participant to name alternately a piece of fruit and then a
furniture object, again as many times as possible within 60 seconds. This last section
further increases the demands on the participant’s executive function.
The performance of the participant can be assessed not only by recording how many
appropriate words are supplied within the 60 second period, but also by observing the
types of errors that are made by the participant, and also by examining the order of
words produced. Effective verbal fluency relies upon the existence of an intact semantic
store for supplying a knowledge base of related words, and also upon an effective
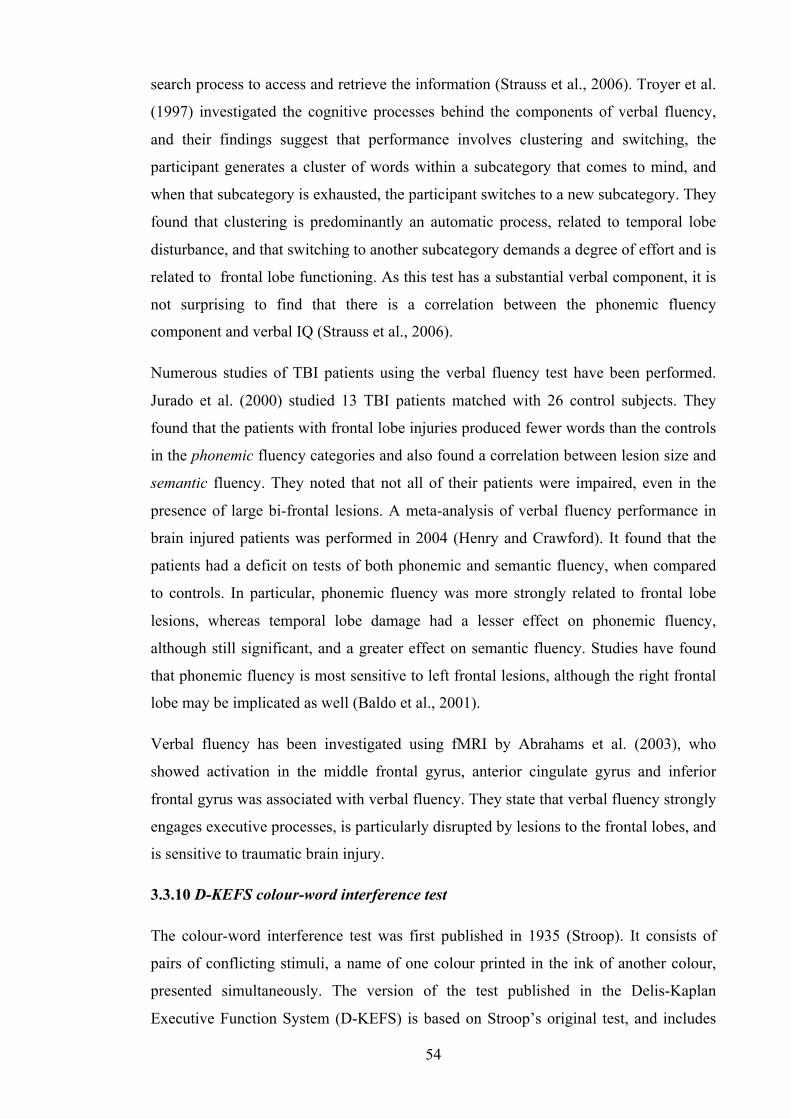
54
search process to access and retrieve the information (Strauss et al., 2006). Troyer et al.
(1997) investigated the cognitive processes behind the components of verbal fluency,
and their findings suggest that performance involves clustering and switching, the
participant generates a cluster of words within a subcategory that comes to mind, and
when that subcategory is exhausted, the participant switches to a new subcategory. They
found that clustering is predominantly an automatic process, related to temporal lobe
disturbance, and that switching to another subcategory demands a degree of effort and is
related to frontal lobe functioning. As this test has a substantial verbal component, it is
not surprising to find that there is a correlation between the phonemic fluency
component and verbal IQ (Strauss et al., 2006).
Numerous studies of TBI patients using the verbal fluency test have been performed.
Jurado et al. (2000) studied 13 TBI patients matched with 26 control subjects. They
found that the patients with frontal lobe injuries produced fewer words than the controls
in the phonemic fluency categories and also found a correlation between lesion size and
semantic fluency. They noted that not all of their patients were impaired, even in the
presence of large bi-frontal lesions. A meta-analysis of verbal fluency performance in
brain injured patients was performed in 2004 (Henry and Crawford). It found that the
patients had a deficit on tests of both phonemic and semantic fluency, when compared
to controls. In particular, phonemic fluency was more strongly related to frontal lobe
lesions, whereas temporal lobe damage had a lesser effect on phonemic fluency,
although still significant, and a greater effect on semantic fluency. Studies have found
that phonemic fluency is most sensitive to left frontal lesions, although the right frontal
lobe may be implicated as well (Baldo et al., 2001).
Verbal fluency has been investigated using fMRI by Abrahams et al. (2003), who
showed activation in the middle frontal gyrus, anterior cingulate gyrus and inferior
frontal gyrus was associated with verbal fluency. They state that verbal fluency strongly
engages executive processes, is particularly disrupted by lesions to the frontal lobes, and
is sensitive to traumatic brain injury.
3.3.10 D-KEFS colour-word interference test
The colour-word interference test was first published in 1935 (Stroop). It consists of
pairs of conflicting stimuli, a name of one colour printed in the ink of another colour,
presented simultaneously. The version of the test published in the Delis-Kaplan
Executive Function System (D-KEFS) is based on Stroop’s original test, and includes
55
an additional test requiring the participant to switch back and forth between naming the
ink colour and reading the conflicting words (Delis et al., 2001).
When presented to the candidate, the test consists of four parts. Part one assesses basic
naming skills by measuring the speed at which the candidate is able to say aloud the
colour of printed blocks as quickly as possible. Part two assesses the participant’s
ability to read repeating words at speed (the names of colours printed in black ink). In
part three the candidate is shown the names of colours, where the ink is a different
colour from that spelled by the word, and they must say the colour of the ink, and not
read the word. In part four they must switch between reading the word, and saying the
colour of the ink, depending upon whether the word is surrounded by a black box
(Figure 3.3).
The time taken for the participant to complete each part of the test is recorded in
seconds. The difference in time taken to read the words printed in colours and the same
words printed in black is the measure of the interference of colour stimuli upon reading
words. The difference in time for naming the colours in which the words are printed and
the same colours printed in squares is the measure of interference of conflicting word
stimuli upon naming colours (Stroop, 1935).
Figure 3.3: Lines 1-4 are shortened examples of the individual parts of the colour-word interference test. In part 1 the participant says the colour of each block aloud; in part 2 the participant reads the words; in part 3 the participant says the colour of the ink each word is written in and does not read the words themselves; in part 4 the participant reads aloud the words in the boxes, but says the ink colour of the words not in boxes.
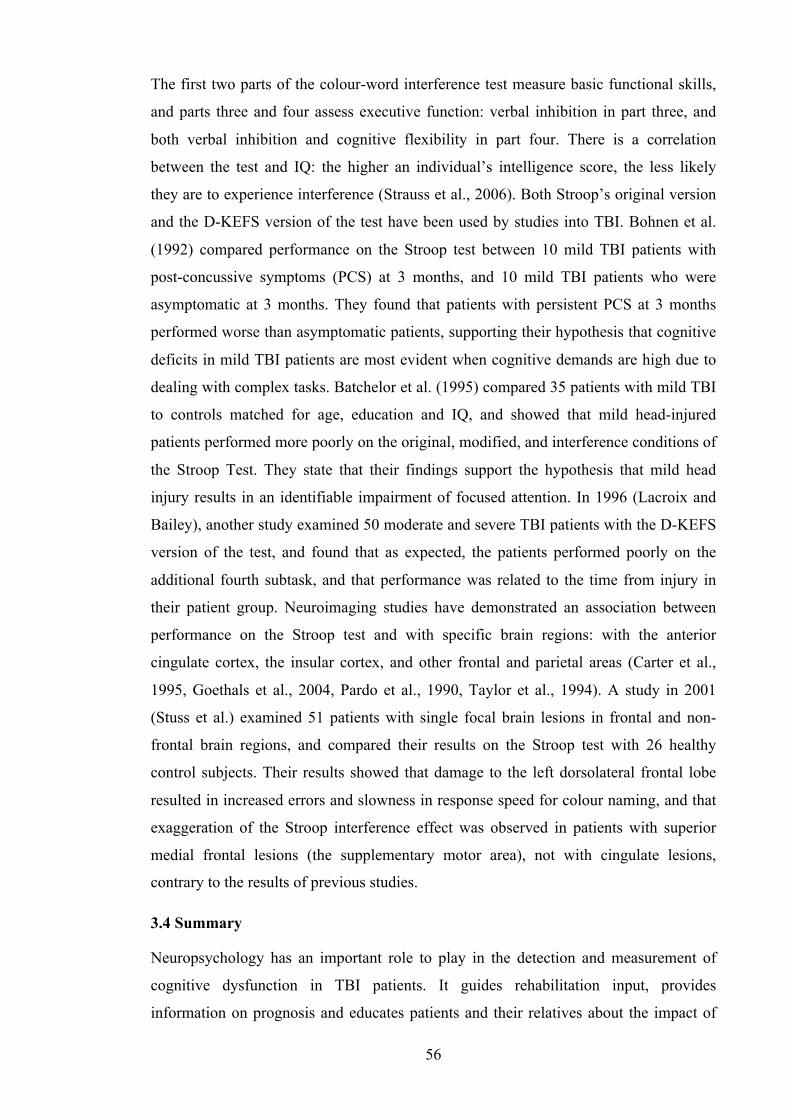
56
The first two parts of the colour-word interference test measure basic functional skills,
and parts three and four assess executive function: verbal inhibition in part three, and
both verbal inhibition and cognitive flexibility in part four. There is a correlation
between the test and IQ: the higher an individual’s intelligence score, the less likely
they are to experience interference (Strauss et al., 2006). Both Stroop’s original version
and the D-KEFS version of the test have been used by studies into TBI. Bohnen et al.
(1992) compared performance on the Stroop test between 10 mild TBI patients with
post-concussive symptoms (PCS) at 3 months, and 10 mild TBI patients who were
asymptomatic at 3 months. They found that patients with persistent PCS at 3 months
performed worse than asymptomatic patients, supporting their hypothesis that cognitive
deficits in mild TBI patients are most evident when cognitive demands are high due to
dealing with complex tasks. Batchelor et al. (1995) compared 35 patients with mild TBI
to controls matched for age, education and IQ, and showed that mild head-injured
patients performed more poorly on the original, modified, and interference conditions of
the Stroop Test. They state that their findings support the hypothesis that mild head
injury results in an identifiable impairment of focused attention. In 1996 (Lacroix and
Bailey), another study examined 50 moderate and severe TBI patients with the D-KEFS
version of the test, and found that as expected, the patients performed poorly on the
additional fourth subtask, and that performance was related to the time from injury in
their patient group. Neuroimaging studies have demonstrated an association between
performance on the Stroop test and with specific brain regions: with the anterior
cingulate cortex, the insular cortex, and other frontal and parietal areas (Carter et al.,
1995, Goethals et al., 2004, Pardo et al., 1990, Taylor et al., 1994). A study in 2001
(Stuss et al.) examined 51 patients with single focal brain lesions in frontal and non-
frontal brain regions, and compared their results on the Stroop test with 26 healthy
control subjects. Their results showed that damage to the left dorsolateral frontal lobe
resulted in increased errors and slowness in response speed for colour naming, and that
exaggeration of the Stroop interference effect was observed in patients with superior
medial frontal lesions (the supplementary motor area), not with cingulate lesions,
contrary to the results of previous studies.
3.4 Summary
Neuropsychology has an important role to play in the detection and measurement of
cognitive dysfunction in TBI patients. It guides rehabilitation input, provides
information on prognosis and educates patients and their relatives about the impact of

57
their TBI. However, it is also a useful adjunct to any imaging study assessing TBI. In
the following methodological chapter, the techniques by which the data was analysed
according to the neuropsychological test results are outlined, and in Chapter 6 the group
findings of the neuropsychology results are presented and their impact on the scan data
analysis discussed.
58
Chapter 4. Investigation of Structural MRI in Mild and Moderate
Traumatic Brain Injury: Methodology
4.1 Rationale for the Study
Around 113,000 patients with head injury are admitted from accident and emergency
departments in England each year (NICE, 2007). Mild traumatic brain injury (TBI)
accounts for approximately 90% of these attendees and recovery may be complicated by
long term cognitive and affective symptoms (Kay and Teasdale, 2001). Thornhill et al.
(2000) have shown that the incidence of these sequelae in patients admitted with mild
injury is higher than had previously been recognised. Conventional computed
tomography (CT) and magnetic resonance (MR) imaging findings often do not correlate
well with the clinical picture in these patients, and often underestimate the extent of
damage (Lee et al., 2008). Quantitative MR imaging is a term encompassing a number
of established MR techniques which have been used previously in patients with TBI.
The techniques are sensitive to microstructural damage in areas of brain white matter
which appear uninjured on conventional MRI (Goetz et al., 2004). However, studies
have predominantly evaluated its use in acute TBI in moderate and severely injured
patients, or in chronic TBI across the severity spectrum. It has been little used in the
acute evaluation of mild TBI. Furthermore, studies that have used quantitative imaging
in this patient group have suffered from limited patient numbers, and have often been
restricted to one or two quantitative measures (Benson et al., 2007, Goetz et al., 2004,
Hou et al., 2007, Inglese et al., 2005, Kumar et al., 2009).
4.2 Study Aims
The aims of this study were therefore:
To ascertain whether damage exists at a microstructural level and is detectable acutely
after injury using advanced MR quantitative imaging by examining the mild and
moderate TBI population.
To ascertain whether any such observable changes in tissue microstructure are
proportional to injury severity, as assessed by the Glasgow Coma Scale.
59
If damage exists, to determine whether it correlates with post-concussive cognitive
symptoms, detectable on neuropsychological assessment, and hence ascertain whether
these MR techniques have a potential role in the clinical evaluation of such patients.
4.3 Study Hypotheses
1. Acute differences exist at a microstructural level between patients with traumatic
brain injury and matched control subjects that are detectable using quantitative
MR scanning, in tissue appearing normal on conventional anatomical MR
imaging.
2. Detectable microstructural changes in the TBI population are proportional to the
severity of the brain injury sustained, as defined by GCS.
3. Detectable microstructural changes in the TBI population correlate with post-
concussive cognitive deficits when assessed using the appropriate
neuropsychological tests.
4.4 Study Type
A prospective cross sectional study comparing a patient population with a matched
control group.
4.5 Study Design
Patients were recruited according to the protocols outlined below, and were scanned
using a 3T MRI scanner. A number of different scan sequences were performed,
obtaining data on microstructural changes within the brain as described in detail in
section 4.10. Patients were also subjected to a battery of neuropsychological tests,
selected specifically to examine the executive functions known to be affected by brain
injury. Control subjects were subsequently recruited matched to the age, sex and level
of education of the patient cohort. They underwent the same scan protocol and
neuropsychological test battery, and the results were then collated and compared
between the two groups.
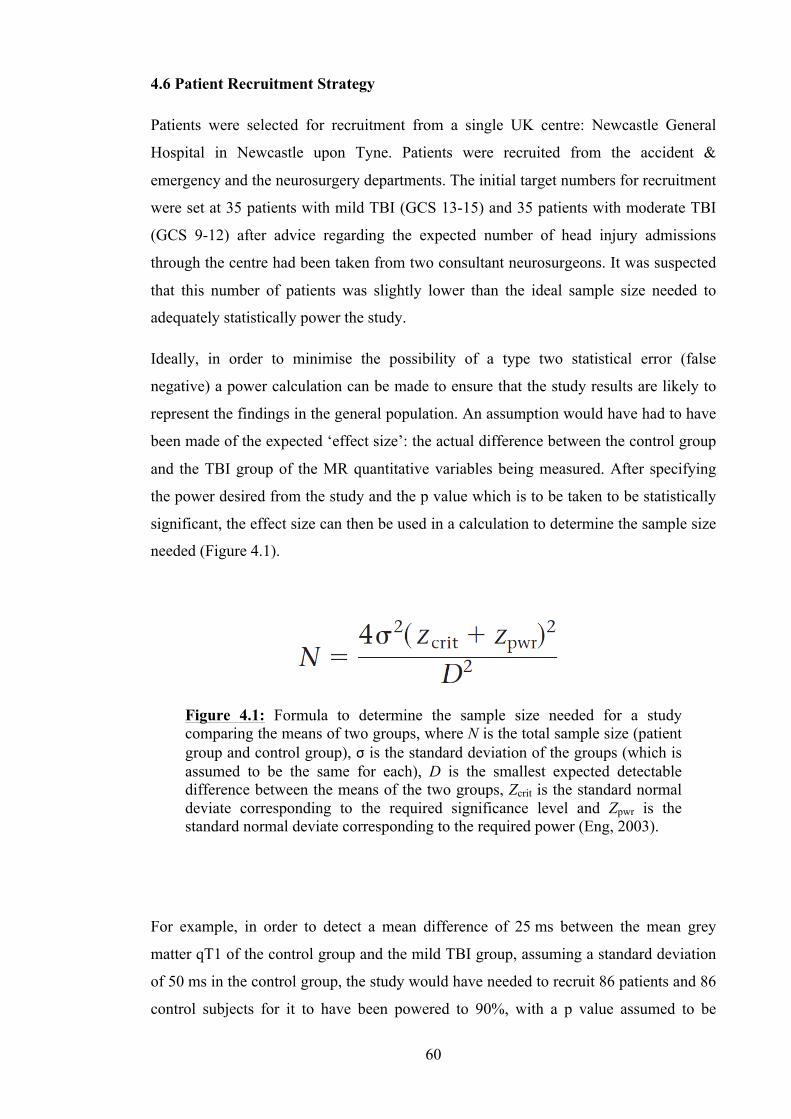
60
4.6 Patient Recruitment Strategy
Patients were selected for recruitment from a single UK centre: Newcastle General
Hospital in Newcastle upon Tyne. Patients were recruited from the accident &
emergency and the neurosurgery departments. The initial target numbers for recruitment
were set at 35 patients with mild TBI (GCS 13-15) and 35 patients with moderate TBI
(GCS 9-12) after advice regarding the expected number of head injury admissions
through the centre had been taken from two consultant neurosurgeons. It was suspected
that this number of patients was slightly lower than the ideal sample size needed to
adequately statistically power the study.
Ideally, in order to minimise the possibility of a type two statistical error (false
negative) a power calculation can be made to ensure that the study results are likely to
represent the findings in the general population. An assumption would have had to have
been made of the expected ‘effect size’: the actual difference between the control group
and the TBI group of the MR quantitative variables being measured. After specifying
the power desired from the study and the p value which is to be taken to be statistically
significant, the effect size can then be used in a calculation to determine the sample size
needed (Figure 4.1).
For example, in order to detect a mean difference of 25 ms between the mean grey
matter qT1 of the control group and the mild TBI group, assuming a standard deviation
of 50 ms in the control group, the study would have needed to recruit 86 patients and 86
control subjects for it to have been powered to 90%, with a p value assumed to be
Figure 4.1: Formula to determine the sample size needed for a study comparing the means of two groups, where N is the total sample size (patient group and control group), σ is the standard deviation of the groups (which is assumed to be the same for each), D is the smallest expected detectable difference between the means of the two groups, Zcrit is the standard normal deviate corresponding to the required significance level and Zpwr is the standard normal deviate corresponding to the required power (Eng, 2003).
61
significant at 0.05 (Eng, 2003). However, in view of the time frame available to recruit
to this study, and after comparison with other published work in this field it was felt that
the study’s target numbers were a suitable compromise and would yield relevant data,
albeit at a slightly lower power.
Patients were notified to the study investigators in a number of ways. They were either
referred by accident & emergency staff, by neurosurgery staff and by the head injury
specialist nurse, or they were identified by the study’s clinical research associate (the
author) from direct contact with the ward staff, or by scrutinising the online
neurosurgery on-call referral log.
Patients were approached in person, while they were still inpatients, to allow the study
information to be given to them and to determine their suitability as a participant by
application of the inclusion criteria (section 4.7). They were provided with the study
information sheet and left to read through it for a minimum of 24 hours. They were then
re-contacted the following day, and if they had agreed to participate, informed consent
was taken. Full ethics and research and development approval was in place, and the 24
hour period between being given the information and being asked whether they wished
to participate was a requirement of the research ethics committee. This delay period
allowed the patients sufficient time to read the information, reflect on the content and if
necessary discuss it with relatives before making a decision as to whether to participate.
A scan appointment was obtained and the details given to the patient. In some cases,
they were still inpatients in the hospital when the scan appointment occurred, and these
patients were then transported to the scanner by a member of the study team. Those that
had been discharged after agreeing to participate but before their scan appointment,
were provided with transport to and from the site to enable them to take part.
Wherever possible, the neuropsychology tests were performed before the MR scan, to
ensure that any feelings of disorientation, drowsiness and dizziness, which some
patients reported after their scan, did not affect the outcome of the neuropsychology
tests. In those cases where this was not possible a short break was provided after the
MRI scan, before the neuropsychology testing.
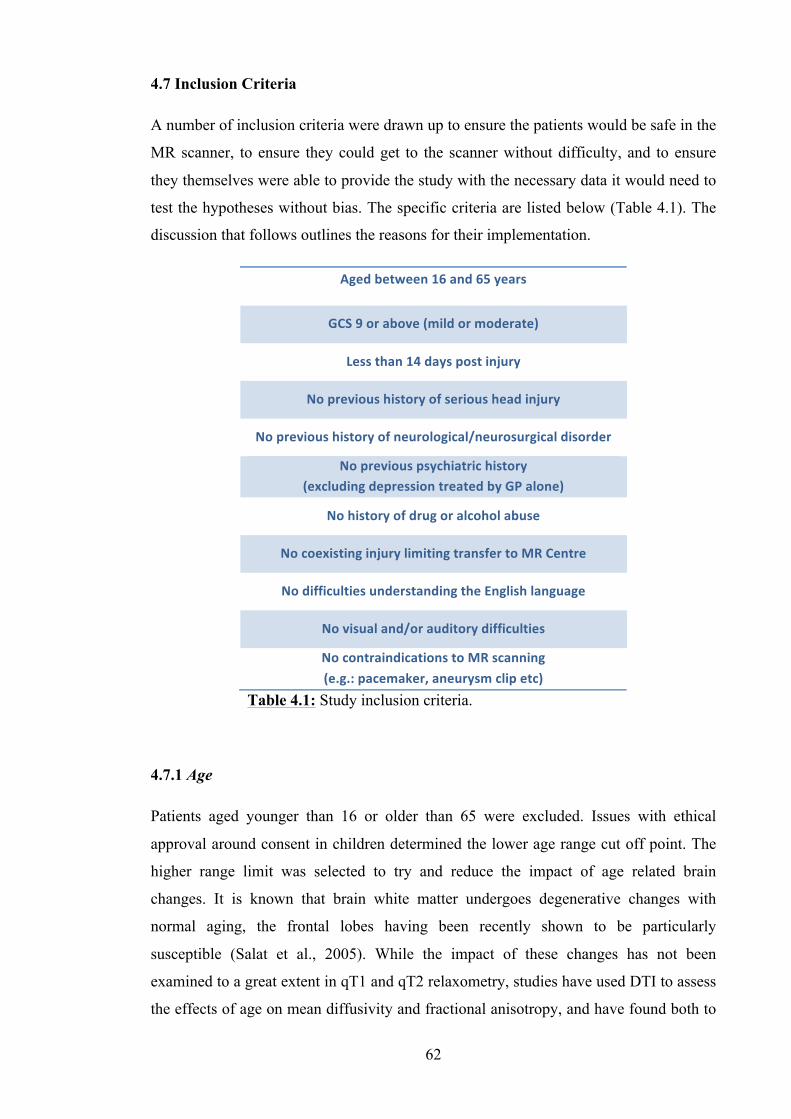
62
4.7 Inclusion Criteria
A number of inclusion criteria were drawn up to ensure the patients would be safe in the
MR scanner, to ensure they could get to the scanner without difficulty, and to ensure
they themselves were able to provide the study with the necessary data it would need to
test the hypotheses without bias. The specific criteria are listed below (Table 4.1). The
discussion that follows outlines the reasons for their implementation.
4.7.1 Age
Patients aged younger than 16 or older than 65 were excluded. Issues with ethical
approval around consent in children determined the lower age range cut off point. The
higher range limit was selected to try and reduce the impact of age related brain
changes. It is known that brain white matter undergoes degenerative changes with
normal aging, the frontal lobes having been recently shown to be particularly
susceptible (Salat et al., 2005). While the impact of these changes has not been
examined to a great extent in qT1 and qT2 relaxometry, studies have used DTI to assess
the effects of age on mean diffusivity and fractional anisotropy, and have found both to
Aged between 16 and 65 years
GCS 9 or above (mild or moderate)
Less than 14 days post injury
No previous history of serious head injury
No previous history of neurological/neurosurgical disorder
No previous psychiatric history (excluding depression treated by GP alone)
No history of drug or alcohol abuse
No coexisting injury limiting transfer to MR Centre
No difficulties understanding the English language
No visual and/or auditory difficulties
No contraindications to MR scanning (e.g.: pacemaker, aneurysm clip etc)
Table 4.1: Study inclusion criteria.
63
be affected (Zhang et al., 2008). In order to avoid this effect introducing bias into the
results, the higher age limit of 65 was selected. However, as this upper age limit was a
relatively arbitrary figure, during the progression of the study one patient over the limit
was recruited (67 years old) as it was felt that their injuries and cognitive symptoms
fitted into the study remit.
4.7.2 GCS
Head injured patients were selected initially by severity, using the GCS score obtained
at approximately 30 minutes after injury. This slight delay between injury and
assessment ensured that the GCS accurately represented the severity of the brain injury,
as an assessment of the GCS too soon after injury can lead to an overestimation of the
severity due to a transient loss of consciousness. Our interest in the mild/moderate end
of the injury spectrum, as discussed in chapter 1, led us to restrict recruitment
specifically to those patients with a GCS between 9 and 15. As the study progressed it
became clear that the recruitment targets were not being met. At this stage it was
decided that in order to recruit sufficient patients, the GCS criteria would be relaxed,
and instead any patient with a head injury who was fit to participate in the study within
the allotted time period would be included. In fact, in spite of this alteration to the
inclusion criteria, by the time recruitment was halted, only one patient with a GCS of
lower than 9 had been included in the study.
4.7.3 Time from injury to scan
Initially the time from injury to scan was set at 6 days. Previous research into localised
changes in brain parenchyma following head injury, as well as studies observing
ischaemic change after stroke, demonstrate that DWI can show very low apparent
diffusion coefficient (ADC) values within the first 2-3 days, which then rebound
through normal to elevated values. We aimed not to scan very acutely in case such
effects were detected and confounded our observations. Furthermore, the earliest time
points at which patients with mild and moderate TBI can safely be scanned are by
definition different; the moderate patients being more likely to take longer to be
clinically stable enough to undergo scanning as a result of their having the more serious
injury. After considering these two factors, we set the window from injury to scan at 3-7
days. As recruitment started it soon became apparent that this was overly ambitious due
to a number of limitations, some of which were true of studying the brain injured
64
population generally, while others were specifically related to the local organisation in
our research building. Limitations from a logistical point of view, in terms of the
scanner location being away from the immediate clinical area, coupled with the lack of
medical support and equipment in its vicinity, meant that patients with a moderate
injury were more difficult to recruit in the initial 3-7 day injury-to-scan window than we
had anticipated. In order to allow for these moderately injured patients to become more
stable, and therefore to be fit enough to be transferred to the scanner and back to the
ward, the maximum time allowed from injury to scan was increased, firstly to 10 days,
and latterly to 14 days. All patients scanned were within 14 days of their injury.
4.7.4 Previous medical history
In order to reduce the impact of existing conditions on the study results, patients were
screened with regard to their past medical history. Neurological conditions, previous
serious head injury, previous neurosurgery and drug or alcohol abuse all increase the
possibility of having an abnormal brain scan, and these patients were excluded to ensure
that bias was not introduced into the scan data. Similarly, those with a past history of
psychiatric disease were excluded in case this caused a negative impact on their
performance in the neuropsychological testing.
4.7.5 Coexisting injuries
It is not unusual for head injured patients to sustain other injuries concurrently,
depending upon their mechanism of injury. In each case patients were assessed to
ensure that they could be safely transferred to the MR scanner without subjecting them
to unnecessary discomfort or danger.
4.7.6 Language barriers
Patients without adequate understanding of the English language, and patients with
visual or auditory difficulties were also excluded, to ensure no bias was introduced into
the neuropsychology results.
4.7.7 Contraindications to MR scanning
All patients were screened by the study radiographers, to ensure that they would be safe
within the scanner.

65
4.8 Control Subject Recruitment
A number of strategies were used to recruit control subjects for the study. Posters
advertising for healthy volunteers were distributed around the local community in
public libraries, sports centres, newsagents, supermarkets etc. Flyers were also left at
suitable locations. Specific groups of people were approached, such as a local young
mothers group, workers on building sites, and pupils at a sixth form college (via their
physics teacher). Members of university staff within the offices where the study was run
were also asked whether they knew people who were suitably matched and who may be
interested in participating.
Control subjects were matched as closely as possible to patients who had already been
recruited into the head injury group. Age, sex and level of education were matched as
closely as possible (section 4.9). An assessment of educational level was performed to
ensure that no bias was introduced into the neuropsychology results. Patients were
asked what age they left school, and the highest qualification level they had attained to
date. Education level was divided into four groups (Table 4.2).
4.9 Data Collected
Simple demographic data for each patient and control subject was recorded: age at time
of scan, sex, employment status/occupation and educational level.
Each patient was asked whether they were currently taking any medication. This data
was used to help ensure each participant met the inclusion criteria, for example: a
patient would have been excluded if they were taking medication for a psychiatric
disease, even if they had not disclosed having such an illness.
Group 1 No qualifications
Group 2 GCSE or equivalent
Group 3 A level / Diploma
Group 4 Degree / Higher degree
Table 4.2: Groups defined by level of educational achievement used to allow matching of patients with control subjects.

66
Specific data related to the injury was also collected for each patient: the circumstances
and mechanism of the injury, the Glasgow Coma Scale score on admission, whether
there had been any loss of consciousness (LOC) or post-traumatic amnesia (PTA) and
for how long each had lasted, and whether the patient had headache, had been vomiting
or had had a seizure. Any other injuries besides their head injury were recorded. Lastly,
it was noted whether the patient had undergone a CT scan as part of their clinical
management, and if one had been performed the findings were also documented.
4.10 Scan Data Acquisition
MR scans were performed on a 3T whole body Philips Achieva System (Philips
Medical Systems, Best, Netherlands) using an 8 channel head coil as receiver and body
coil as transmitter. The anatomical images were positioned parallel to the AC-PC line,
with the entire brain covered. All the MR scans were co-centred and squared with the
anatomical images. The resolution and matrix sizes for each scan sequence were
selected to be multiples of one another. They were also each aligned to a common set of
angles and origin. The sequences were set up in this way to simplify comparison of the
data between scans. Scanning was performed by four senior radiographers employed by
the research centre, and the scans were downloaded from the scanner to the computers
required for processing by a clinical research associate (the author). The total scan time
for this investigation was 25 minutes.
4.10.1 Anatomical images
Standard clinical T1 weighted anatomical images were acquired using 3D MPRAGE
sequence, with Echo Time (TE) of 4.6 ms and Repetition Time (TR) of 9.6 ms. The
volume was scanned in sagittal orientation with 1 mm isotropic resolution and a matrix
size of 240 (anterior-posterior) x 240 (superior-inferior) x 180 (right-left). The scan was
accelerated with a SENSE factor of 2 in the right-left direction and the standard image
intensity correction was applied using the CLEAR reconstruction algorithm.
4.10.2 T1 mapping
Quantitative T1 maps were acquired using a rapid inversion recovery (IR) sequence with
segmented inversion slab method and multi-slice single shot EPI readout. The image
volumes were scanned in transverse orientation with 2 mm isotropic resolution and a
matrix size of 128 (anterior-posterior) x 128 (right-left) x 72 (superior-inferior). The 72
slices were divided into 6 segments with corresponding adiabatic inversion slab width
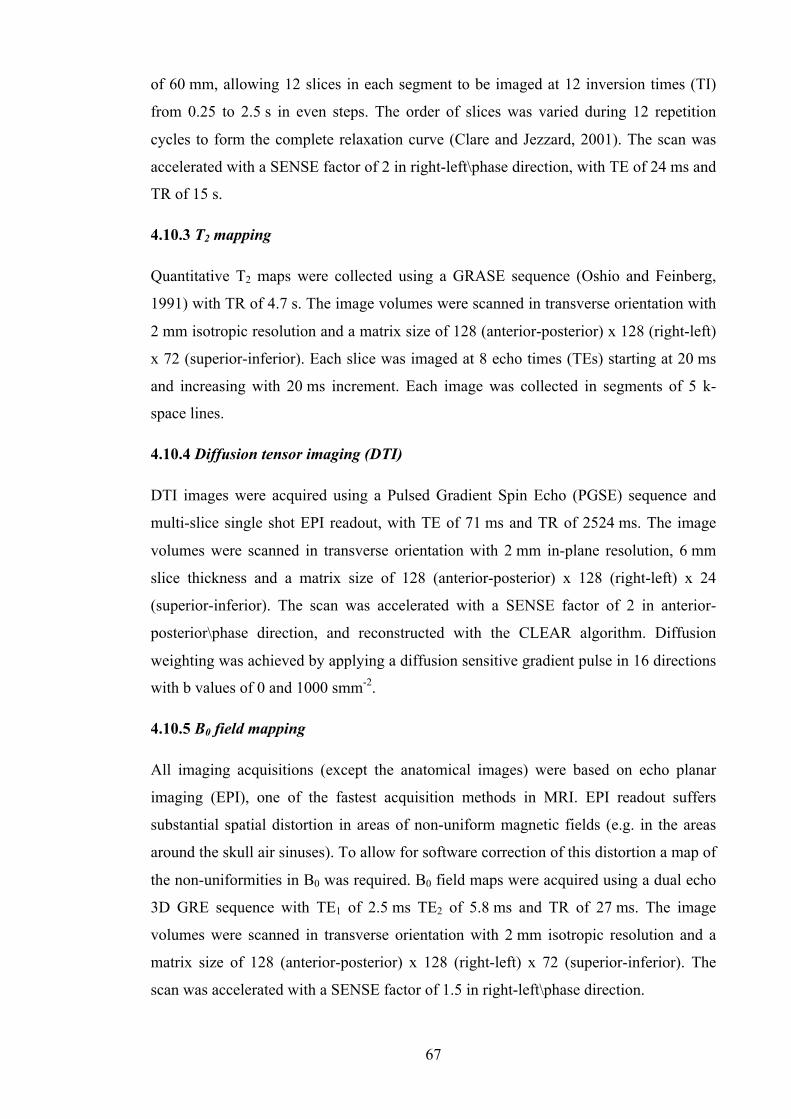
67
of 60 mm, allowing 12 slices in each segment to be imaged at 12 inversion times (TI)
from 0.25 to 2.5 s in even steps. The order of slices was varied during 12 repetition
cycles to form the complete relaxation curve (Clare and Jezzard, 2001). The scan was
accelerated with a SENSE factor of 2 in right-left\phase direction, with TE of 24 ms and
TR of 15 s.
4.10.3 T2 mapping
Quantitative T2 maps were collected using a GRASE sequence (Oshio and Feinberg,
1991) with TR of 4.7 s. The image volumes were scanned in transverse orientation with
2 mm isotropic resolution and a matrix size of 128 (anterior-posterior) x 128 (right-left)
x 72 (superior-inferior). Each slice was imaged at 8 echo times (TEs) starting at 20 ms
and increasing with 20 ms increment. Each image was collected in segments of 5 k-
space lines.
4.10.4 Diffusion tensor imaging (DTI)
DTI images were acquired using a Pulsed Gradient Spin Echo (PGSE) sequence and
multi-slice single shot EPI readout, with TE of 71 ms and TR of 2524 ms. The image
volumes were scanned in transverse orientation with 2 mm in-plane resolution, 6 mm
slice thickness and a matrix size of 128 (anterior-posterior) x 128 (right-left) x 24
(superior-inferior). The scan was accelerated with a SENSE factor of 2 in anterior-
posterior\phase direction, and reconstructed with the CLEAR algorithm. Diffusion
weighting was achieved by applying a diffusion sensitive gradient pulse in 16 directions
with b values of 0 and 1000 smm-2.
4.10.5 B0 field mapping
All imaging acquisitions (except the anatomical images) were based on echo planar
imaging (EPI), one of the fastest acquisition methods in MRI. EPI readout suffers
substantial spatial distortion in areas of non-uniform magnetic fields (e.g. in the areas
around the skull air sinuses). To allow for software correction of this distortion a map of
the non-uniformities in B0 was required. B0 field maps were acquired using a dual echo
3D GRE sequence with TE1 of 2.5 ms TE2 of 5.8 ms and TR of 27 ms. The image
volumes were scanned in transverse orientation with 2 mm isotropic resolution and a
matrix size of 128 (anterior-posterior) x 128 (right-left) x 72 (superior-inferior). The
scan was accelerated with a SENSE factor of 1.5 in right-left\phase direction.
68
4.11 Scan Data Processing
In order for quantitative MR scan data to be compared between one subject and another,
a number of processes must first be applied to each subject’s dataset. As all subjects
differ from one another in terms of brain size, anatomical variance and position within
the scanner, no one scan set is the same as any other.
4.11.1 Format conversion
All data was saved from the scanner in Philips’ own data format (.PAR and .REC file
extensions). These were first converted to the more standard ‘Analyse’ format (.hdr and
.img file extensions) to enable the data to be processed by a range of standard and
locally developed tools.
4.11.2 Brain extraction
The first step in processing the data was to remove the brain tissue of interest from the
encompassing skull bone and cerebrospinal fluid (Figure 4.2). This process is referred
to as “brain extraction” and was performed using a brain extraction tool (BET) available
as part of the FMRIB Software Library from the University of Oxford (Smith, 2002).
The BET uses a surface model approach to accurately segment the data into brain and
non-brain classes.
Figure 4.2: An axial T1 weighted MR scan as it is acquired (A), and after brain extraction (B).
69
4.11.3 Movement correction
Each set of scan data was acquired through a number of separate sequences acquired
over a period of time. Small movements of the patients during this time, even if only as
a result of breathing, would alter their head position within the scanner, and result in
each diffusion volume occupying a different space from one another. In order for them
to be analysed correctly, this movement was corrected for by registering each image to
the first. This process was performed using a linear image registration tool (FLIRT)
available as part of the FMRIB Software Library from the University of Oxford
(Jenkinson et al., 2002). This tool uses 12 parameter registration: translation, rotation,
stretch/compress and skew in each of the 3 axes, and results in each scan being
registered to one another. This then allows the application of the same ROI to each of
the scan sequences in the ‘patient’s space’.
4.11.4 Fitting
This process fits data from each data type (qT1, qT2 & DTI) to the expected known
distribution curves for that specific data type. Raw data was subjected to fitting routines
to extract the quantitative parameters. In the qT1 and qT2 data, this was performed by
using in house software developed by a research associate. This software found the line
of best fit to the data using relevant standard equations for T1 and T2 relaxation. In the
DTI data this process was performed by using a fitting tool (DTIFIT) available as part
of the FMRIB Software Library from the University of Oxford (Basser et al., 1994).
4.11.5 Unwarping
Unwarping was performed to correct distortion due to inhomogeneity in the magnetic
field. As mentioned above (section 4.10.5) the quantitative image acquisitions were
based on EPI, which suffers substantial spatial distortion in areas of non-uniform
magnetic fields (e.g. in the areas around the skull air sinuses). The acquired fieldmap
was used to create a map of the field distortion and this was then used to correct the
quantitative data. This process used two tools from the FMRIB Software Library from
the University of Oxford: the first (PRELUDE) performed 3D phase unwrapping of the
field map (Jenkinson, 2003) and the second (FUGUE) used the fieldmap data to unwarp
the EPI acquired quantitative data (Jenkinson, 2004).
70
4.11.6 Registration
To allow a region of interest to be defined and applied to each of the datasets, it was
necessary to ensure that all scans were aligned with each other. It should be noted that
as the scans were acquired in one sitting, they had already been acquired in the same
space, assuming there had been no subject movement between each sequence. This
registration step was a safeguard to ensure that if there had been any movement, it was
accounted for. To achieve this the quantitative T1map was taken as the reference image
and each dataset was registered to that image, resulting in all the datasets in the same
‘real space’.
4.11.7 Visible lesion removal
As outlined above, the aim of this study was to assess tissue which appeared as normal
on conventional anatomical MR imaging after TBI. To ensure that this was the case, we
first had to individually examine each patient’s scan for evidence of any haemorrhagic
lesion or associated oedema. In a number of patients no visible lesion could be found.
However, in the majority of those recruited, there was evidence of one or more discrete
lesions either within the brain parenchyma (contusions, intra-cerebral haemorrhage or
oedema) or extra-axial haematoma between the skull and the underlying brain tissue
(sub-dural, sub arachnoid or extradural haematomas). As well as examining the T1
weighted anatomical image for each patient, every quantitative dataset was also
scrutinised, and any gross, focal abnormalities from any of the scans were targeted for
removal. These areas of visible lesion were removed from the data by first manually
drawing a binary mask over them in the MRIcro software (Centre for Advanced Brain
Imaging, Atlanta GA), and saving that mask as a reversed region of interest, giving the
mask over the lesion itself a value of ‘0’ and the mask over the surrounding brain a
value of ‘1’. Each dataset was then multiplied by this mask, resulting in the area where
the lesion had been having a value of zero, and the rest of the data retaining its original
value (Figure 4.3). This process was applied on every slice where lesions were seen.
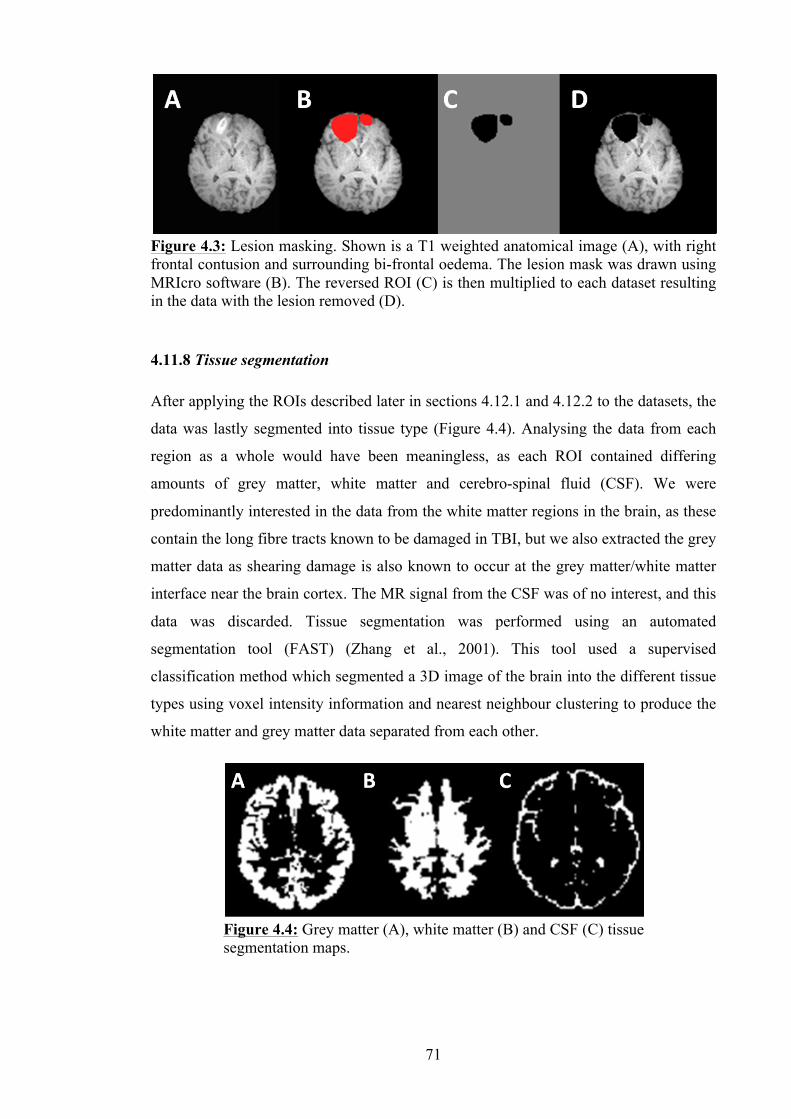
71
4.11.8 Tissue segmentation
After applying the ROIs described later in sections 4.12.1 and 4.12.2 to the datasets, the
data was lastly segmented into tissue type (Figure 4.4). Analysing the data from each
region as a whole would have been meaningless, as each ROI contained differing
amounts of grey matter, white matter and cerebro-spinal fluid (CSF). We were
predominantly interested in the data from the white matter regions in the brain, as these
contain the long fibre tracts known to be damaged in TBI, but we also extracted the grey
matter data as shearing damage is also known to occur at the grey matter/white matter
interface near the brain cortex. The MR signal from the CSF was of no interest, and this
data was discarded. Tissue segmentation was performed using an automated
segmentation tool (FAST) (Zhang et al., 2001). This tool used a supervised
classification method which segmented a 3D image of the brain into the different tissue
types using voxel intensity information and nearest neighbour clustering to produce the
white matter and grey matter data separated from each other.
Figure 4.3: Lesion masking. Shown is a T1 weighted anatomical image (A), with right frontal contusion and surrounding bi-frontal oedema. The lesion mask was drawn using MRIcro software (B). The reversed ROI (C) is then multiplied to each dataset resulting in the data with the lesion removed (D).
Figure 4.4: Grey matter (A), white matter (B) and CSF (C) tissue segmentation maps.
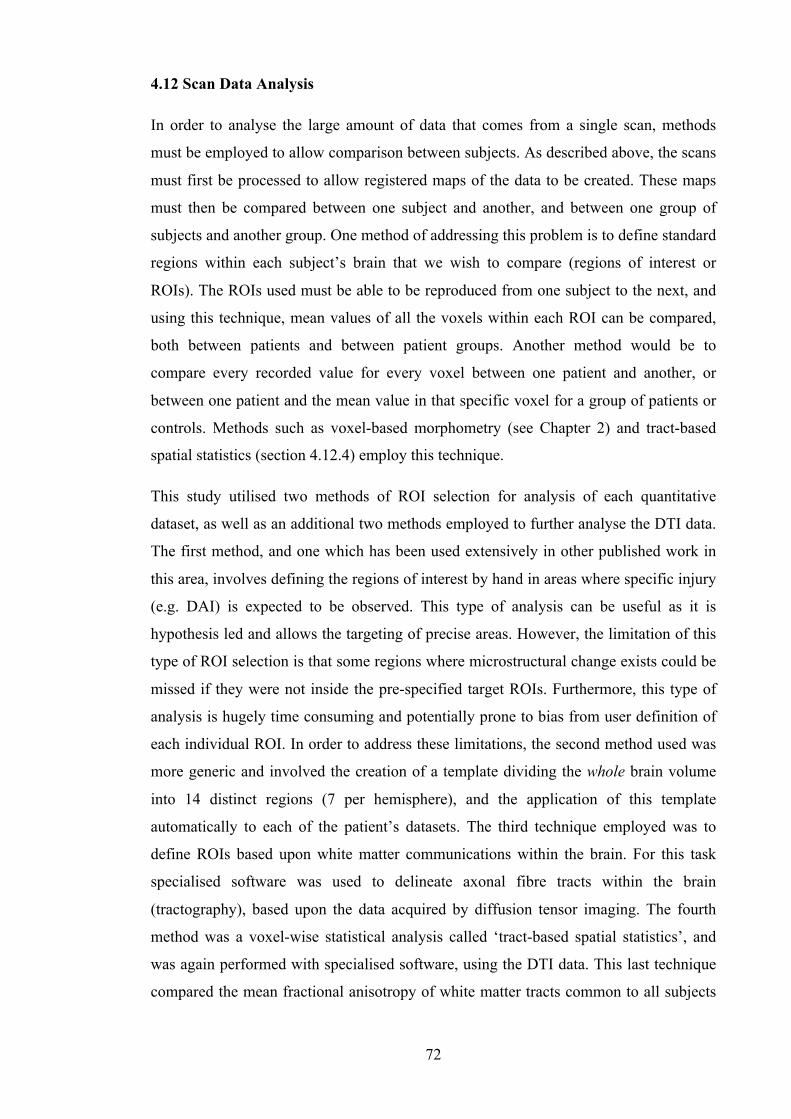
72
4.12 Scan Data Analysis
In order to analyse the large amount of data that comes from a single scan, methods
must be employed to allow comparison between subjects. As described above, the scans
must first be processed to allow registered maps of the data to be created. These maps
must then be compared between one subject and another, and between one group of
subjects and another group. One method of addressing this problem is to define standard
regions within each subject’s brain that we wish to compare (regions of interest or
ROIs). The ROIs used must be able to be reproduced from one subject to the next, and
using this technique, mean values of all the voxels within each ROI can be compared,
both between patients and between patient groups. Another method would be to
compare every recorded value for every voxel between one patient and another, or
between one patient and the mean value in that specific voxel for a group of patients or
controls. Methods such as voxel-based morphometry (see Chapter 2) and tract-based
spatial statistics (section 4.12.4) employ this technique.
This study utilised two methods of ROI selection for analysis of each quantitative
dataset, as well as an additional two methods employed to further analyse the DTI data.
The first method, and one which has been used extensively in other published work in
this area, involves defining the regions of interest by hand in areas where specific injury
(e.g. DAI) is expected to be observed. This type of analysis can be useful as it is
hypothesis led and allows the targeting of precise areas. However, the limitation of this
type of ROI selection is that some regions where microstructural change exists could be
missed if they were not inside the pre-specified target ROIs. Furthermore, this type of
analysis is hugely time consuming and potentially prone to bias from user definition of
each individual ROI. In order to address these limitations, the second method used was
more generic and involved the creation of a template dividing the whole brain volume
into 14 distinct regions (7 per hemisphere), and the application of this template
automatically to each of the patient’s datasets. The third technique employed was to
define ROIs based upon white matter communications within the brain. For this task
specialised software was used to delineate axonal fibre tracts within the brain
(tractography), based upon the data acquired by diffusion tensor imaging. The fourth
method was a voxel-wise statistical analysis called ‘tract-based spatial statistics’, and
was again performed with specialised software, using the DTI data. This last technique
compared the mean fractional anisotropy of white matter tracts common to all subjects
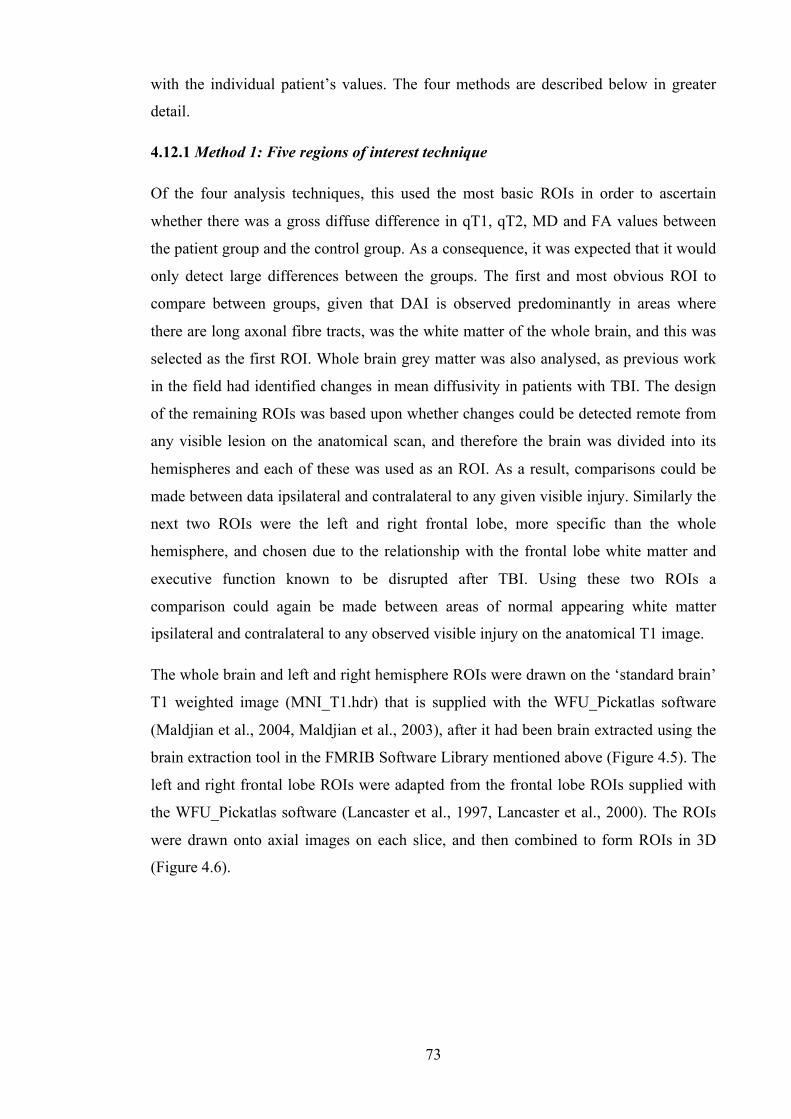
73
with the individual patient’s values. The four methods are described below in greater
detail.
4.12.1 Method 1: Five regions of interest technique
Of the four analysis techniques, this used the most basic ROIs in order to ascertain
whether there was a gross diffuse difference in qT1, qT2, MD and FA values between
the patient group and the control group. As a consequence, it was expected that it would
only detect large differences between the groups. The first and most obvious ROI to
compare between groups, given that DAI is observed predominantly in areas where
there are long axonal fibre tracts, was the white matter of the whole brain, and this was
selected as the first ROI. Whole brain grey matter was also analysed, as previous work
in the field had identified changes in mean diffusivity in patients with TBI. The design
of the remaining ROIs was based upon whether changes could be detected remote from
any visible lesion on the anatomical scan, and therefore the brain was divided into its
hemispheres and each of these was used as an ROI. As a result, comparisons could be
made between data ipsilateral and contralateral to any given visible injury. Similarly the
next two ROIs were the left and right frontal lobe, more specific than the whole
hemisphere, and chosen due to the relationship with the frontal lobe white matter and
executive function known to be disrupted after TBI. Using these two ROIs a
comparison could again be made between areas of normal appearing white matter
ipsilateral and contralateral to any observed visible injury on the anatomical T1 image.
The whole brain and left and right hemisphere ROIs were drawn on the ‘standard brain’
T1 weighted image (MNI_T1.hdr) that is supplied with the WFU_Pickatlas software
(Maldjian et al., 2004, Maldjian et al., 2003), after it had been brain extracted using the
brain extraction tool in the FMRIB Software Library mentioned above (Figure 4.5). The
left and right frontal lobe ROIs were adapted from the frontal lobe ROIs supplied with
the WFU_Pickatlas software (Lancaster et al., 1997, Lancaster et al., 2000). The ROIs
were drawn onto axial images on each slice, and then combined to form ROIs in 3D
(Figure 4.6).
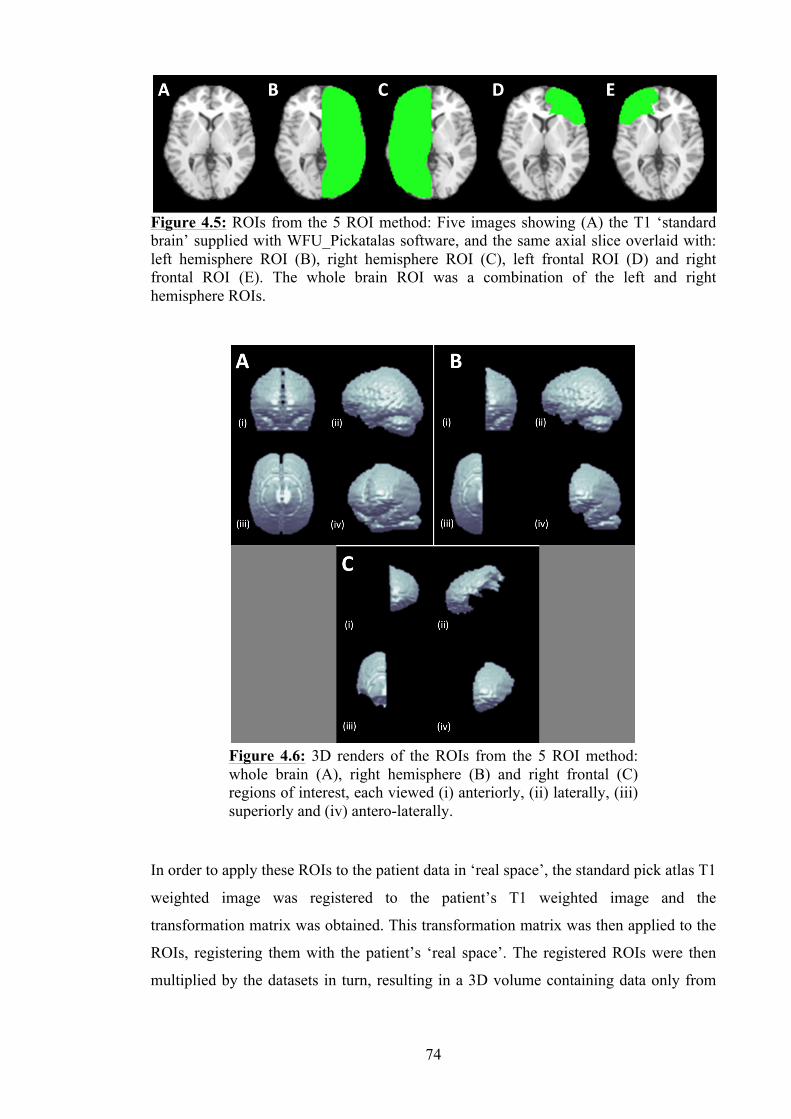
74
In order to apply these ROIs to the patient data in ‘real space’, the standard pick atlas T1
weighted image was registered to the patient’s T1 weighted image and the
transformation matrix was obtained. This transformation matrix was then applied to the
ROIs, registering them with the patient’s ‘real space’. The registered ROIs were then
multiplied by the datasets in turn, resulting in a 3D volume containing data only from
Figure 4.5: ROIs from the 5 ROI method: Five images showing (A) the T1 ‘standard brain’ supplied with WFU_Pickatalas software, and the same axial slice overlaid with: left hemisphere ROI (B), right hemisphere ROI (C), left frontal ROI (D) and right frontal ROI (E). The whole brain ROI was a combination of the left and right hemisphere ROIs.
Figure 4.6: 3D renders of the ROIs from the 5 ROI method: whole brain (A), right hemisphere (B) and right frontal (C) regions of interest, each viewed (i) anteriorly, (ii) laterally, (iii) superiorly and (iv) antero-laterally.
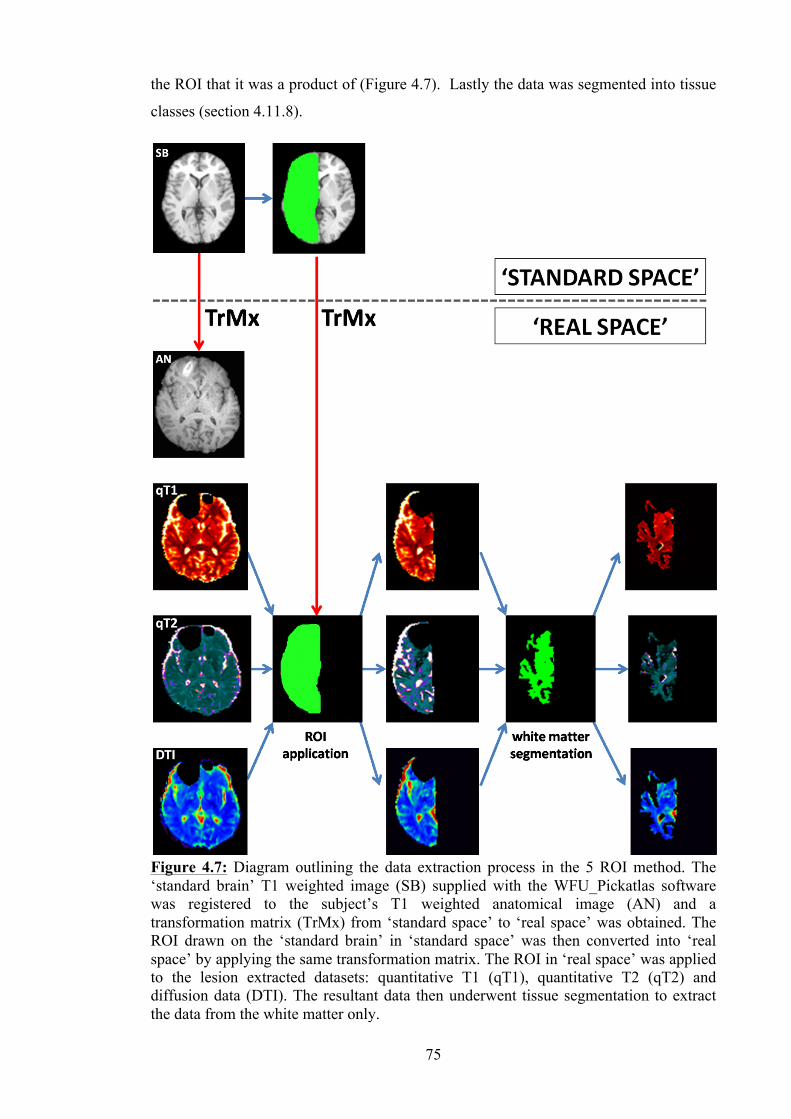
75
the ROI that it was a product of (Figure 4.7). Lastly the data was segmented into tissue
classes (section 4.11.8).
Figure 4.7: Diagram outlining the data extraction process in the 5 ROI method. The ‘standard brain’ T1 weighted image (SB) supplied with the WFU_Pickatlas software was registered to the subject’s T1 weighted anatomical image (AN) and a transformation matrix (TrMx) from ‘standard space’ to ‘real space’ was obtained. The ROI drawn on the ‘standard brain’ in ‘standard space’ was then converted into ‘real space’ by applying the same transformation matrix. The ROI in ‘real space’ was applied to the lesion extracted datasets: quantitative T1 (qT1), quantitative T2 (qT2) and diffusion data (DTI). The resultant data then underwent tissue segmentation to extract the data from the white matter only.
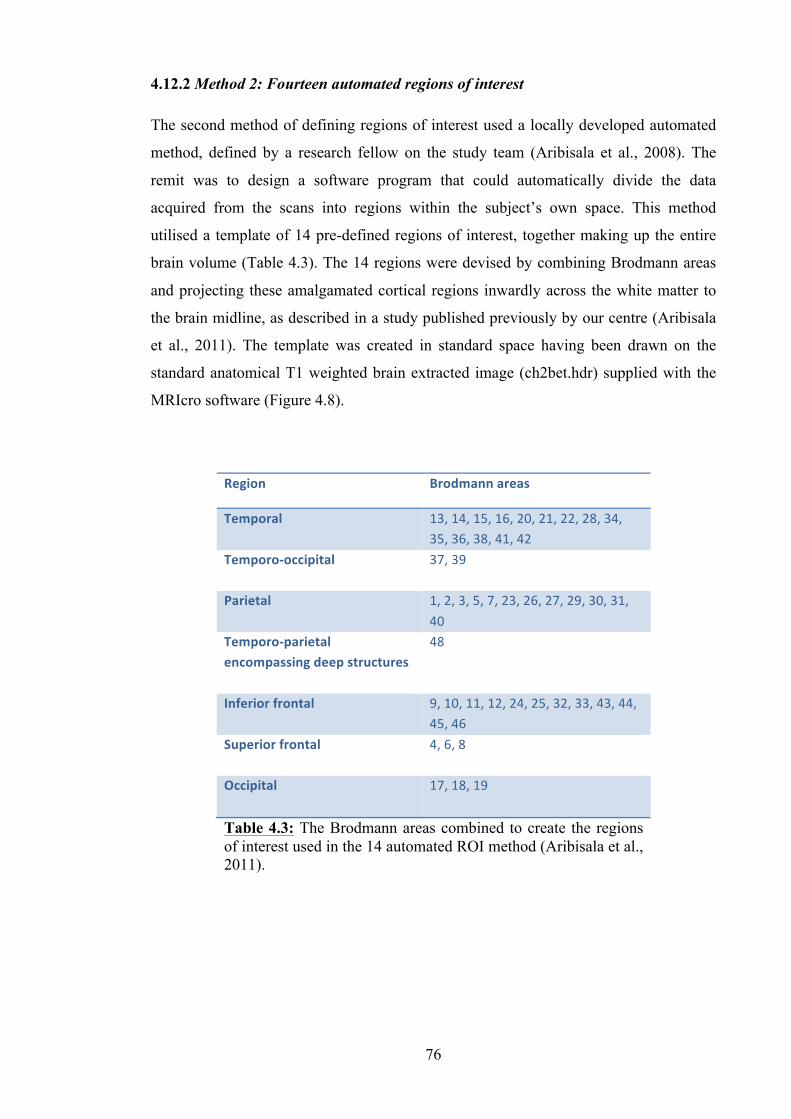
76
4.12.2 Method 2: Fourteen automated regions of interest
The second method of defining regions of interest used a locally developed automated
method, defined by a research fellow on the study team (Aribisala et al., 2008). The
remit was to design a software program that could automatically divide the data
acquired from the scans into regions within the subject’s own space. This method
utilised a template of 14 pre-defined regions of interest, together making up the entire
brain volume (Table 4.3). The 14 regions were devised by combining Brodmann areas
and projecting these amalgamated cortical regions inwardly across the white matter to
the brain midline, as described in a study published previously by our centre (Aribisala
et al., 2011). The template was created in standard space having been drawn on the
standard anatomical T1 weighted brain extracted image (ch2bet.hdr) supplied with the
MRIcro software (Figure 4.8).
Region Brodmann areas
Temporal 13, 14, 15, 16, 20, 21, 22, 28, 34, 35, 36, 38, 41, 42
Temporo-‐occipital
37, 39
Parietal 1, 2, 3, 5, 7, 23, 26, 27, 29, 30, 31, 40
Temporo-‐parietal encompassing deep structures
48
Inferior frontal 9, 10, 11, 12, 24, 25, 32, 33, 43, 44, 45, 46
Superior frontal
4, 6, 8
Occipital
17, 18, 19
Table 4.3: The Brodmann areas combined to create the regions of interest used in the 14 automated ROI method (Aribisala et al., 2011).
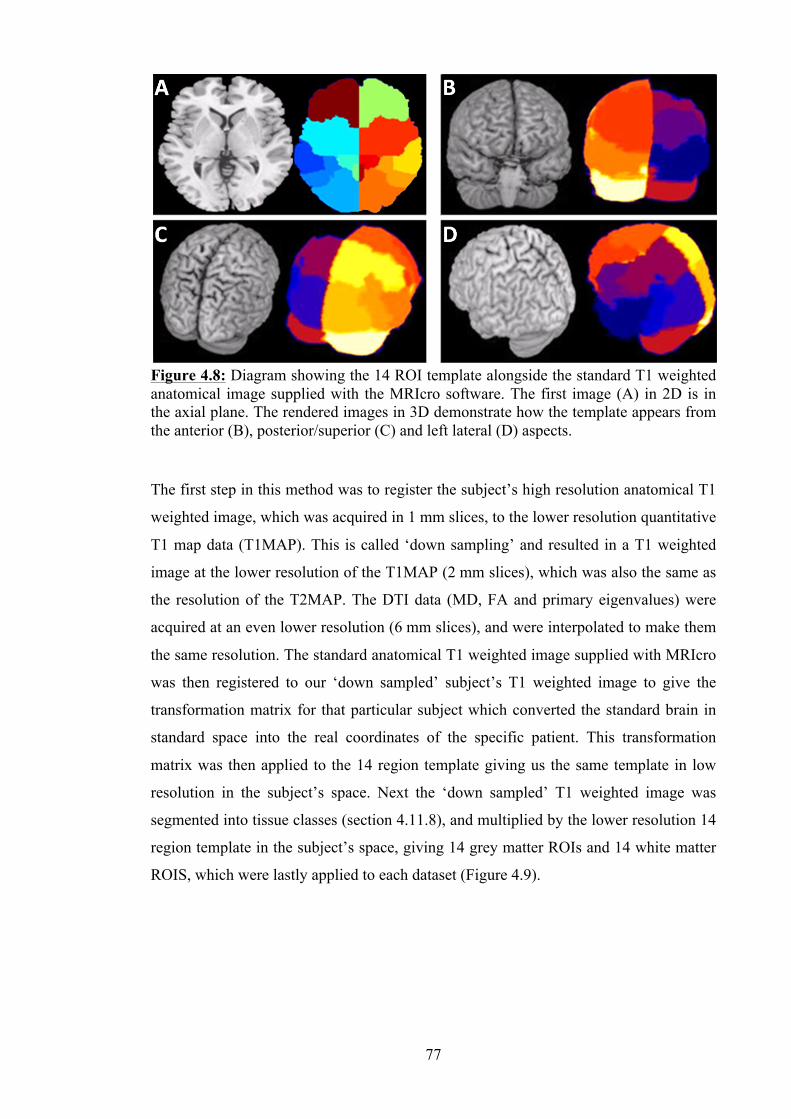
77
The first step in this method was to register the subject’s high resolution anatomical T1
weighted image, which was acquired in 1 mm slices, to the lower resolution quantitative
T1 map data (T1MAP). This is called ‘down sampling’ and resulted in a T1 weighted
image at the lower resolution of the T1MAP (2 mm slices), which was also the same as
the resolution of the T2MAP. The DTI data (MD, FA and primary eigenvalues) were
acquired at an even lower resolution (6 mm slices), and were interpolated to make them
the same resolution. The standard anatomical T1 weighted image supplied with MRIcro
was then registered to our ‘down sampled’ subject’s T1 weighted image to give the
transformation matrix for that particular subject which converted the standard brain in
standard space into the real coordinates of the specific patient. This transformation
matrix was then applied to the 14 region template giving us the same template in low
resolution in the subject’s space. Next the ‘down sampled’ T1 weighted image was
segmented into tissue classes (section 4.11.8), and multiplied by the lower resolution 14
region template in the subject’s space, giving 14 grey matter ROIs and 14 white matter
ROIS, which were lastly applied to each dataset (Figure 4.9).
Figure 4.8: Diagram showing the 14 ROI template alongside the standard T1 weighted anatomical image supplied with the MRIcro software. The first image (A) in 2D is in the axial plane. The rendered images in 3D demonstrate how the template appears from the anterior (B), posterior/superior (C) and left lateral (D) aspects.
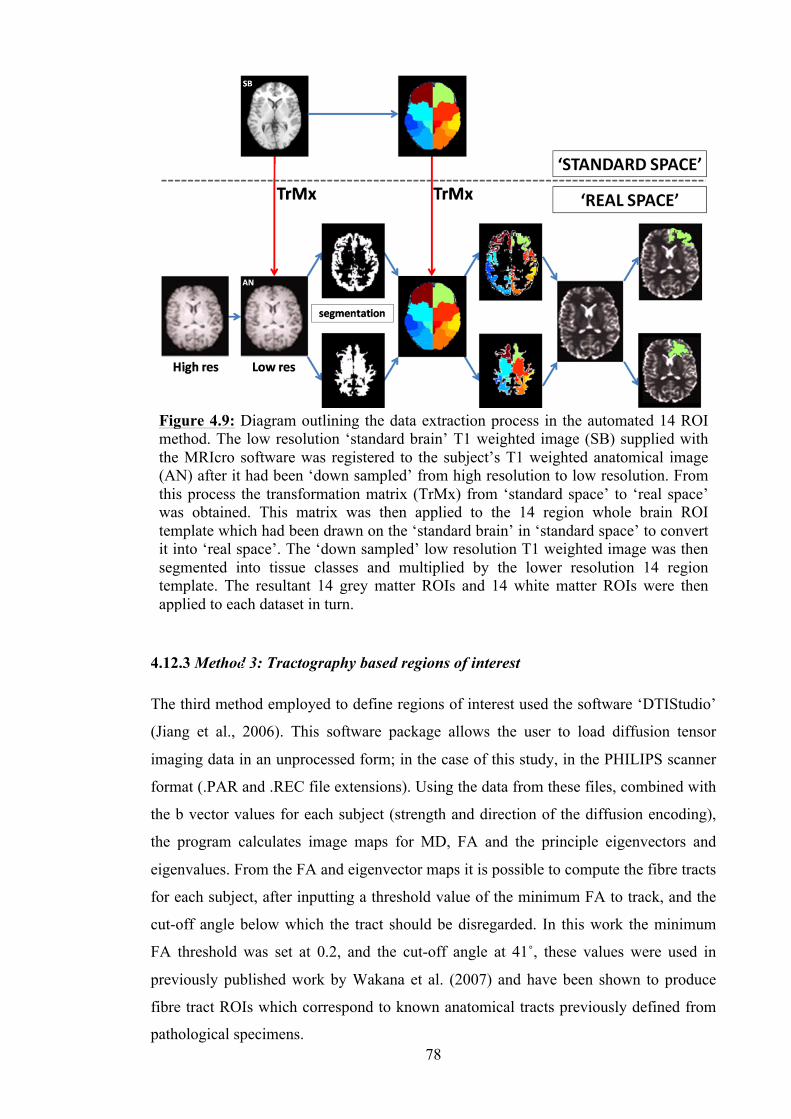
78
4.12.3 Method 3: Tractography based regions of interest
The third method employed to define regions of interest used the software ‘DTIStudio’
(Jiang et al., 2006). This software package allows the user to load diffusion tensor
imaging data in an unprocessed form; in the case of this study, in the PHILIPS scanner
format (.PAR and .REC file extensions). Using the data from these files, combined with
the b vector values for each subject (strength and direction of the diffusion encoding),
the program calculates image maps for MD, FA and the principle eigenvectors and
eigenvalues. From the FA and eigenvector maps it is possible to compute the fibre tracts
for each subject, after inputting a threshold value of the minimum FA to track, and the
cut-off angle below which the tract should be disregarded. In this work the minimum
FA threshold was set at 0.2, and the cut-off angle at 41˚, these values were used in
previously published work by Wakana et al. (2007) and have been shown to produce
fibre tract ROIs which correspond to known anatomical tracts previously defined from
pathological specimens.
Figure 4.9: Diagram outlining the data extraction process in the automated 14 ROI method. The low resolution ‘standard brain’ T1 weighted image (SB) supplied with the MRIcro software was registered to the subject’s T1 weighted anatomical image (AN) after it had been ‘down sampled’ from high resolution to low resolution. From this process the transformation matrix (TrMx) from ‘standard space’ to ‘real space’ was obtained. This matrix was then applied to the 14 region whole brain ROI template which had been drawn on the ‘standard brain’ in ‘standard space’ to convert it into ‘real space’. The ‘down sampled’ low resolution T1 weighted image was then segmented into tissue classes and multiplied by the lower resolution 14 region template. The resultant 14 grey matter ROIs and 14 white matter ROIs were then applied to each dataset in turn.
SB
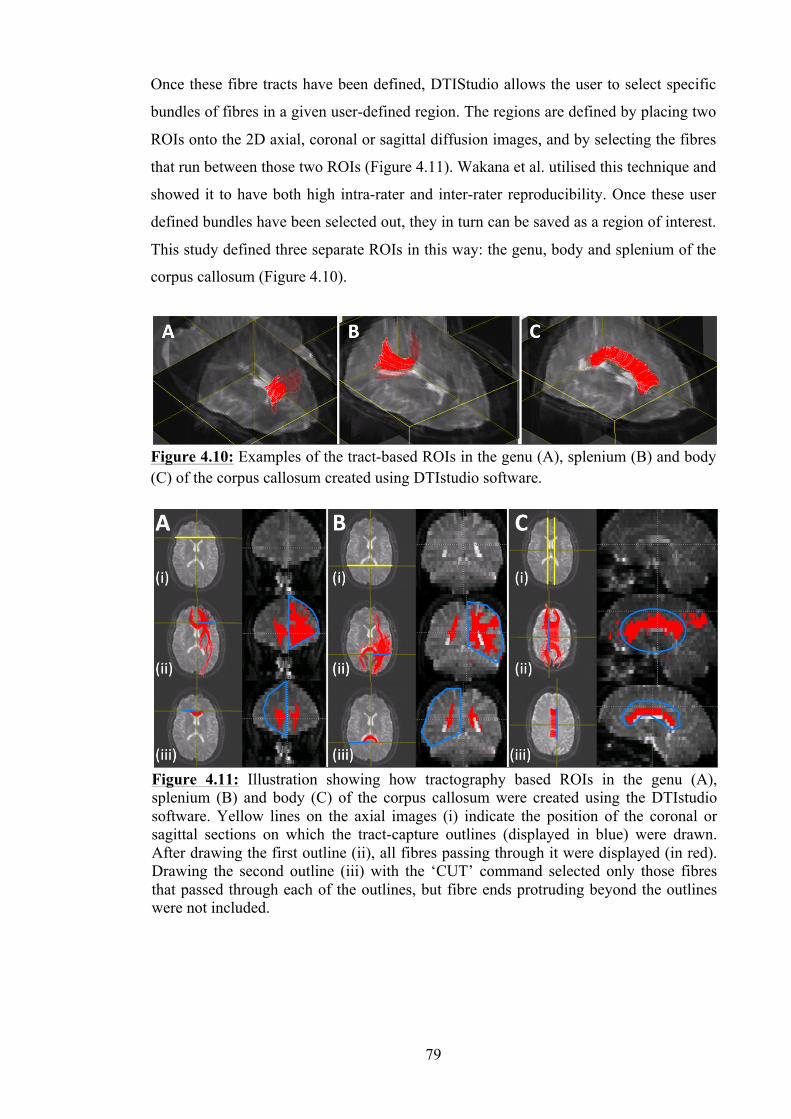
79
Once these fibre tracts have been defined, DTIStudio allows the user to select specific
bundles of fibres in a given user-defined region. The regions are defined by placing two
ROIs onto the 2D axial, coronal or sagittal diffusion images, and by selecting the fibres
that run between those two ROIs (Figure 4.11). Wakana et al. utilised this technique and
showed it to have both high intra-rater and inter-rater reproducibility. Once these user
defined bundles have been selected out, they in turn can be saved as a region of interest.
This study defined three separate ROIs in this way: the genu, body and splenium of the
corpus callosum (Figure 4.10).
Figure 4.11: Illustration showing how tractography based ROIs in the genu (A), splenium (B) and body (C) of the corpus callosum were created using the DTIstudio software. Yellow lines on the axial images (i) indicate the position of the coronal or sagittal sections on which the tract-capture outlines (displayed in blue) were drawn. After drawing the first outline (ii), all fibres passing through it were displayed (in red). Drawing the second outline (iii) with the ‘CUT’ command selected only those fibres that passed through each of the outlines, but fibre ends protruding beyond the outlines were not included.
Figure 4.10: Examples of the tract-based ROIs in the genu (A), splenium (B) and body (C) of the corpus callosum created using DTIstudio software.

80
The genu fibre bundles were created by placing the two ROIs on the coronal slice of the
diffusion weighted image, at a specific point in the frontal lobe. This point was defined
by first choosing the axial image containing the most anterior projection of the lateral
ventricles. On this image, the coronal slice would then be placed at the most posterior
point of the grey matter in the anterior central sulcus. One ROI would be drawn around
each cerebral hemisphere on this coronal image using the ‘CUT’ command, which
resulted in the fibres within the genu of the corpus callosum being selected out.
The splenium fibre tracts were selected out using a similar method. The same axial slice
used in the creation of the genu ROI was used, but with the coronal slice placed at the
most posterior point of the posterior horns of the lateral ventricles. As above, one ROI
would be drawn around each side of the cerebral hemispheres on this coronal image
using the ‘CUT’ command, which resulted in the fibres within the splenium of the
corpus callosum being selected out.
The corpus callosum body ROI was designed by first selecting the DWI axial slice with
the basal ganglia visible. The sagittal image was placed at the medial border of the basal
ganglia on the right side. The first ROI was then drawn around the corpus callosum on
the sagittal image, before returning to the axial image to place the sagittal slice at the
medial border of the basal ganglia on the left. The second ROI was drawn around the
corpus callosum on this second image. The ‘CUT’ feature was again used, resulting in
the fibres of the body of the corpus callosum being selected.
The final step in this method is to utilise these fibre bundle ROIs by applying them to
the original data, and extracting the mean values for the MD and FA from each.
A limitation of the DTIstudio software was that only the diffusion data in its original
form could be loaded into the program, and therefore the ROIs designed using it could
only be applied to this original unregistered data. In its original state this data had not
undergone visible lesion removal. In order to ensure that the MD and FA data extracted
using this technique came only from normal appearing brain, the DTI maps were
examined at the time of ROI creation for any visible lesion, and tract selection in such
regions was avoided.
4.12.4 Method 4: Tract based spatial statistics (TBSS)
The last analysis technique used was tract-based spatial statistics or TBSS (Smith et al.,
2006), which is a voxel-wise statistical analysis method. TBSS analysis is performed in
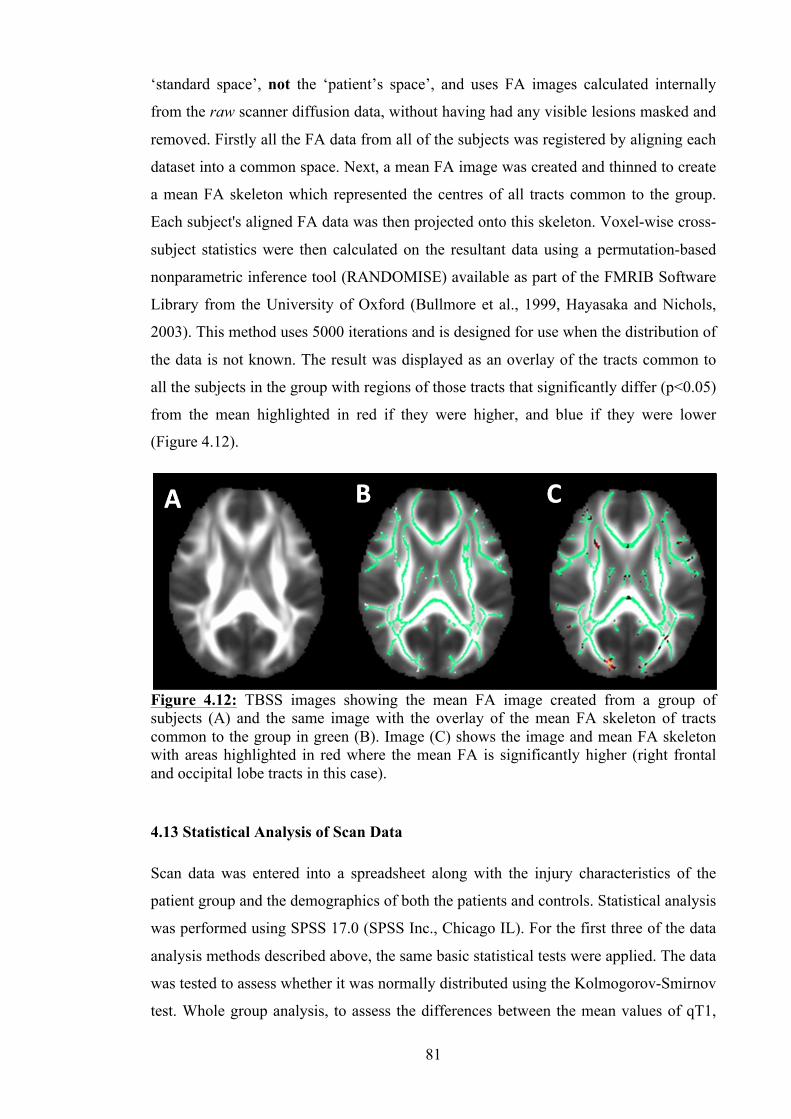
81
‘standard space’, not the ‘patient’s space’, and uses FA images calculated internally
from the raw scanner diffusion data, without having had any visible lesions masked and
removed. Firstly all the FA data from all of the subjects was registered by aligning each
dataset into a common space. Next, a mean FA image was created and thinned to create
a mean FA skeleton which represented the centres of all tracts common to the group.
Each subject's aligned FA data was then projected onto this skeleton. Voxel-wise cross-
subject statistics were then calculated on the resultant data using a permutation-based
nonparametric inference tool (RANDOMISE) available as part of the FMRIB Software
Library from the University of Oxford (Bullmore et al., 1999, Hayasaka and Nichols,
2003). This method uses 5000 iterations and is designed for use when the distribution of
the data is not known. The result was displayed as an overlay of the tracts common to
all the subjects in the group with regions of those tracts that significantly differ (p<0.05)
from the mean highlighted in red if they were higher, and blue if they were lower
(Figure 4.12).
4.13 Statistical Analysis of Scan Data
Scan data was entered into a spreadsheet along with the injury characteristics of the
patient group and the demographics of both the patients and controls. Statistical analysis
was performed using SPSS 17.0 (SPSS Inc., Chicago IL). For the first three of the data
analysis methods described above, the same basic statistical tests were applied. The data
was tested to assess whether it was normally distributed using the Kolmogorov-Smirnov
test. Whole group analysis, to assess the differences between the mean values of qT1,
Figure 4.12: TBSS images showing the mean FA image created from a group of subjects (A) and the same image with the overlay of the mean FA skeleton of tracts common to the group in green (B). Image (C) shows the image and mean FA skeleton with areas highlighted in red where the mean FA is significantly higher (right frontal and occipital lobe tracts in this case).
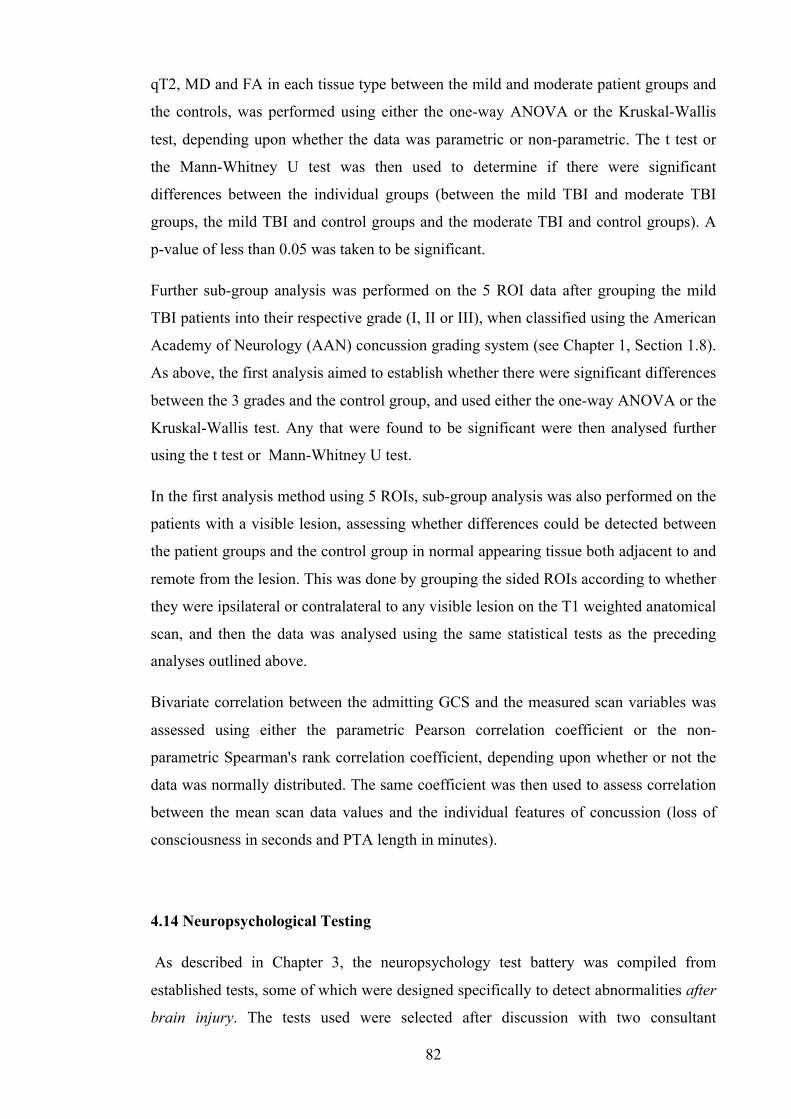
82
qT2, MD and FA in each tissue type between the mild and moderate patient groups and
the controls, was performed using either the one-way ANOVA or the Kruskal-Wallis
test, depending upon whether the data was parametric or non-parametric. The t test or
the Mann-Whitney U test was then used to determine if there were significant
differences between the individual groups (between the mild TBI and moderate TBI
groups, the mild TBI and control groups and the moderate TBI and control groups). A
p-value of less than 0.05 was taken to be significant.
Further sub-group analysis was performed on the 5 ROI data after grouping the mild
TBI patients into their respective grade (I, II or III), when classified using the American
Academy of Neurology (AAN) concussion grading system (see Chapter 1, Section 1.8).
As above, the first analysis aimed to establish whether there were significant differences
between the 3 grades and the control group, and used either the one-way ANOVA or the
Kruskal-Wallis test. Any that were found to be significant were then analysed further
using the t test or Mann-Whitney U test.
In the first analysis method using 5 ROIs, sub-group analysis was also performed on the
patients with a visible lesion, assessing whether differences could be detected between
the patient groups and the control group in normal appearing tissue both adjacent to and
remote from the lesion. This was done by grouping the sided ROIs according to whether
they were ipsilateral or contralateral to any visible lesion on the T1 weighted anatomical
scan, and then the data was analysed using the same statistical tests as the preceding
analyses outlined above.
Bivariate correlation between the admitting GCS and the measured scan variables was
assessed using either the parametric Pearson correlation coefficient or the non-
parametric Spearman's rank correlation coefficient, depending upon whether or not the
data was normally distributed. The same coefficient was then used to assess correlation
between the mean scan data values and the individual features of concussion (loss of
consciousness in seconds and PTA length in minutes).
4.14 Neuropsychological Testing
As described in Chapter 3, the neuropsychology test battery was compiled from
established tests, some of which were designed specifically to detect abnormalities after
brain injury. The tests used were selected after discussion with two consultant
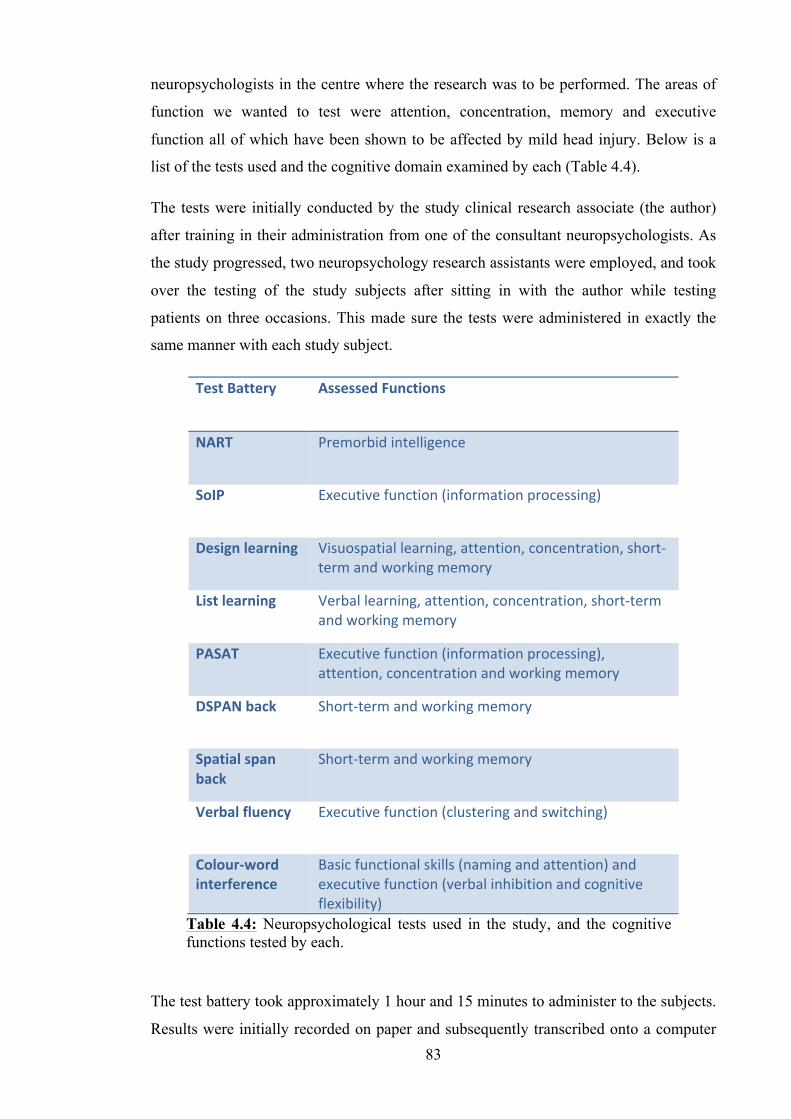
83
neuropsychologists in the centre where the research was to be performed. The areas of
function we wanted to test were attention, concentration, memory and executive
function all of which have been shown to be affected by mild head injury. Below is a
list of the tests used and the cognitive domain examined by each (Table 4.4).
The tests were initially conducted by the study clinical research associate (the author)
after training in their administration from one of the consultant neuropsychologists. As
the study progressed, two neuropsychology research assistants were employed, and took
over the testing of the study subjects after sitting in with the author while testing
patients on three occasions. This made sure the tests were administered in exactly the
same manner with each study subject.
The test battery took approximately 1 hour and 15 minutes to administer to the subjects.
Results were initially recorded on paper and subsequently transcribed onto a computer
Test Battery Assessed Functions
NART Premorbid intelligence
SoIP Executive function (information processing)
Design learning Visuospatial learning, attention, concentration, short-‐term and working memory
List learning Verbal learning, attention, concentration, short-‐term and working memory
PASAT Executive function (information processing), attention, concentration and working memory
DSPAN back Short-‐term and working memory
Spatial span back
Short-‐term and working memory
Verbal fluency Executive function (clustering and switching)
Colour-‐word interference
Basic functional skills (naming and attention) and executive function (verbal inhibition and cognitive flexibility)
Table 4.4: Neuropsychological tests used in the study, and the cognitive functions tested by each.
84
database on the same day, to enable statistical analysis. At the start of the study this was
performed by the author and in the latter part by the neuropsychology research
assistants. The scoring and totalling of the test results was also performed by one of the
neuropsychology research assistants.
4.15 Statistical Analysis of Neuropsychology Data
The neuropsychological data collected was examined using the Kolmogorov-Smirnov
test for normality. As a consequence, the analysis was performed using either non-
parametric or parametric statistical tests, depending upon whether they were shown to
be normally distributed or not. For a comparison of the means of each test result in each
group (mild TBI, moderate TBI and controls), the ANOVA or Kruskal-Wallis test was
used. The test means that showed a significant difference between groups were then
further analysed using the independent samples t test or the bivariate Mann-Whitney U
test to ascertain where that significance lay; whether between the mild TBI group and
the controls, the moderate TBI group and the controls, or between the mild and
moderate TBI groups. A p-value of less than 0.05 was taken to be significant.
4.16 Analysis of Scan Data with Reference to the Neuropsychological Data
The last set of statistical analysis performed evaluated the scan data with reference to
the neuropsychology test results. Correlations were assessed between quantitative data
(qT1, qT2, MD and FA) obtained using the 5 ROI and 14 ROI methods and the
neuropsychology test results, using either the Pearson correlation coefficient or the
Spearman’s rho coefficient, depending upon whether the scan data had previously been
shown to be normally distributed. The same method was also used to assess any
correlation between the diffusion data (MD, FA and eigen values) obtained using the
tract-based and TBSS methods and the neuropsychology test results. The p-values taken
to be significant differed in each analysis, as Bonferroni corrections were made for
multiple comparisons (see section 6.2).
85
Chapter 5. Results: Demographics and Quantitative MR Imaging
Findings
5.1 Demographics
5.1.1 Recruitment
The study actively recruited for 24 months, from 17th December 2008 until 16th
December 2010. A total of 44 patients with mild TBI and 9 patients with moderate TBI
were admitted to the study, making a total number of 53 patients. During the same
period, a total of 30 control subjects were recruited, matched to the age and educational
level of the patient group.
During recruitment, the enrolment rate of entrants into the study was approximately
30% of those identified to the study team. The 70% of patients who were not entered
into the study were divided almost equally between those who did not meet the
inclusion criteria after a more detailed review, and those who would have been suitable,
but declined to participate.
5.1.2 Patient group demographics
The age range of the TBI patients recruited was between 16 years and 67 years old. The
mean age of the patients was 34 years (SD 14.6 years). The age distribution reflected
that of the TBI population in the developed world (see Chapter 1) with the greatest peak
occurring in the adolescent/young adult age bracket (Figure 5.1).
Sex of the patient group was predominantly male, again a reflection of the pattern seen
worldwide, with 44 (83%) men and 9 (17%) women recruited. A complete description
of all the patient details is provided in tables 5.2 and 5.3. Some of the important
features of the group are summarised here.
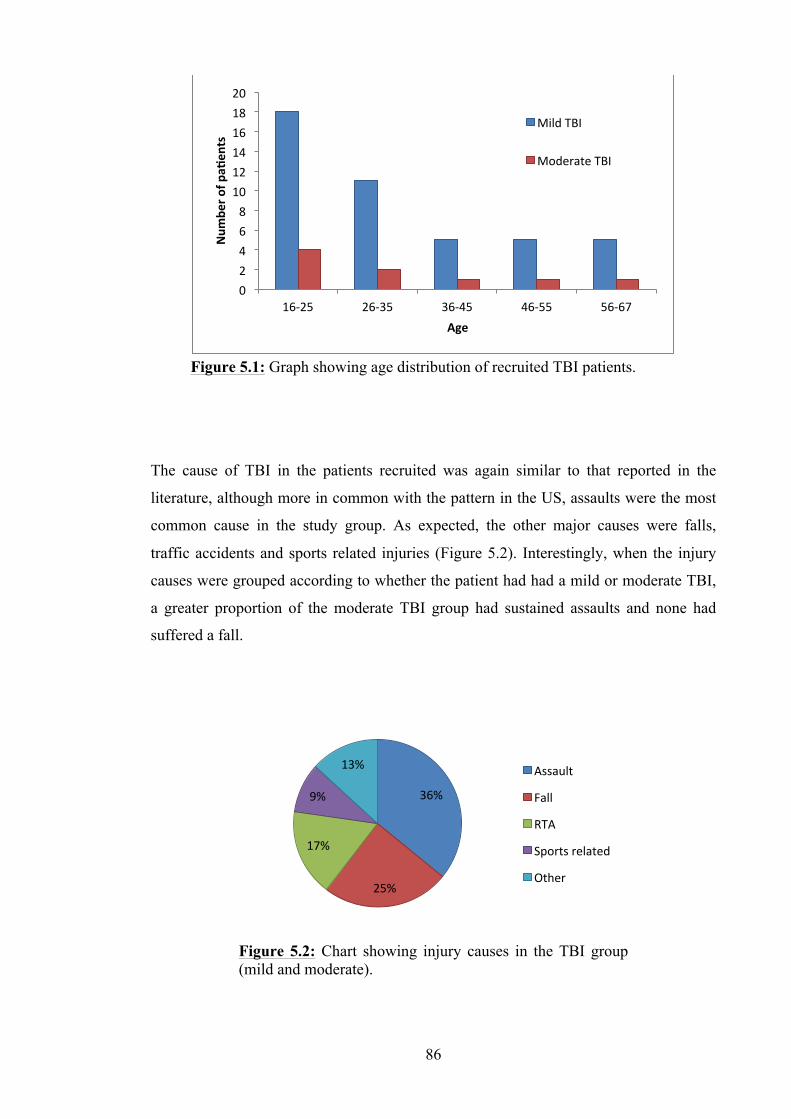
86
The cause of TBI in the patients recruited was again similar to that reported in the
literature, although more in common with the pattern in the US, assaults were the most
common cause in the study group. As expected, the other major causes were falls,
traffic accidents and sports related injuries (Figure 5.2). Interestingly, when the injury
causes were grouped according to whether the patient had had a mild or moderate TBI,
a greater proportion of the moderate TBI group had sustained assaults and none had
suffered a fall.
Figure 5.1: Graph showing age distribution of recruited TBI patients.
Figure 5.2: Chart showing injury causes in the TBI group (mild and moderate).
0 2 4 6 8 10 12 14 16 18 20
16-‐25 26-‐35 36-‐45 46-‐55 56-‐67
Num
ber o
f pa_
ents
Age
Mild TBI
Moderate TBI
36%
25%
17%
9%
13% Assault
Fall
RTA
Sports related
Other
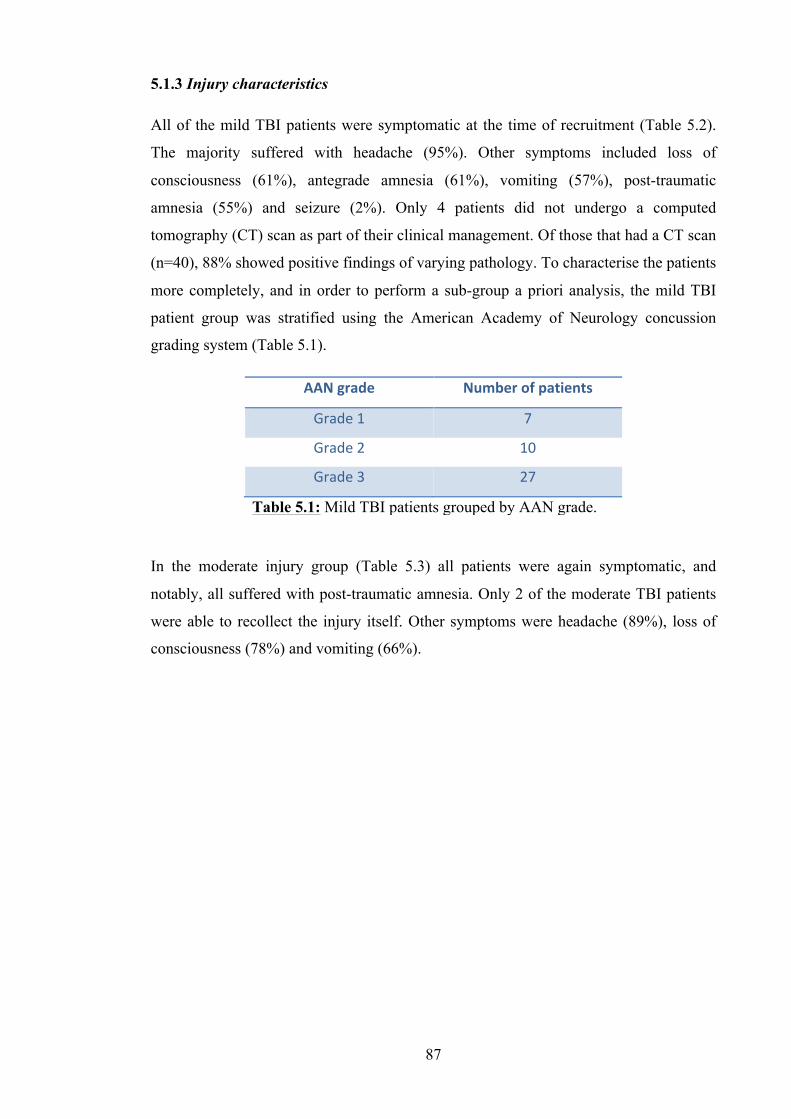
87
5.1.3 Injury characteristics
All of the mild TBI patients were symptomatic at the time of recruitment (Table 5.2).
The majority suffered with headache (95%). Other symptoms included loss of
consciousness (61%), antegrade amnesia (61%), vomiting (57%), post-traumatic
amnesia (55%) and seizure (2%). Only 4 patients did not undergo a computed
tomography (CT) scan as part of their clinical management. Of those that had a CT scan
(n=40), 88% showed positive findings of varying pathology. To characterise the patients
more completely, and in order to perform a sub-group a priori analysis, the mild TBI
patient group was stratified using the American Academy of Neurology concussion
grading system (Table 5.1).
In the moderate injury group (Table 5.3) all patients were again symptomatic, and
notably, all suffered with post-traumatic amnesia. Only 2 of the moderate TBI patients
were able to recollect the injury itself. Other symptoms were headache (89%), loss of
consciousness (78%) and vomiting (66%).
AAN grade Number of patients
Grade 1 7
Grade 2 10
Grade 3 27
Table 5.1: Mild TBI patients grouped by AAN grade.
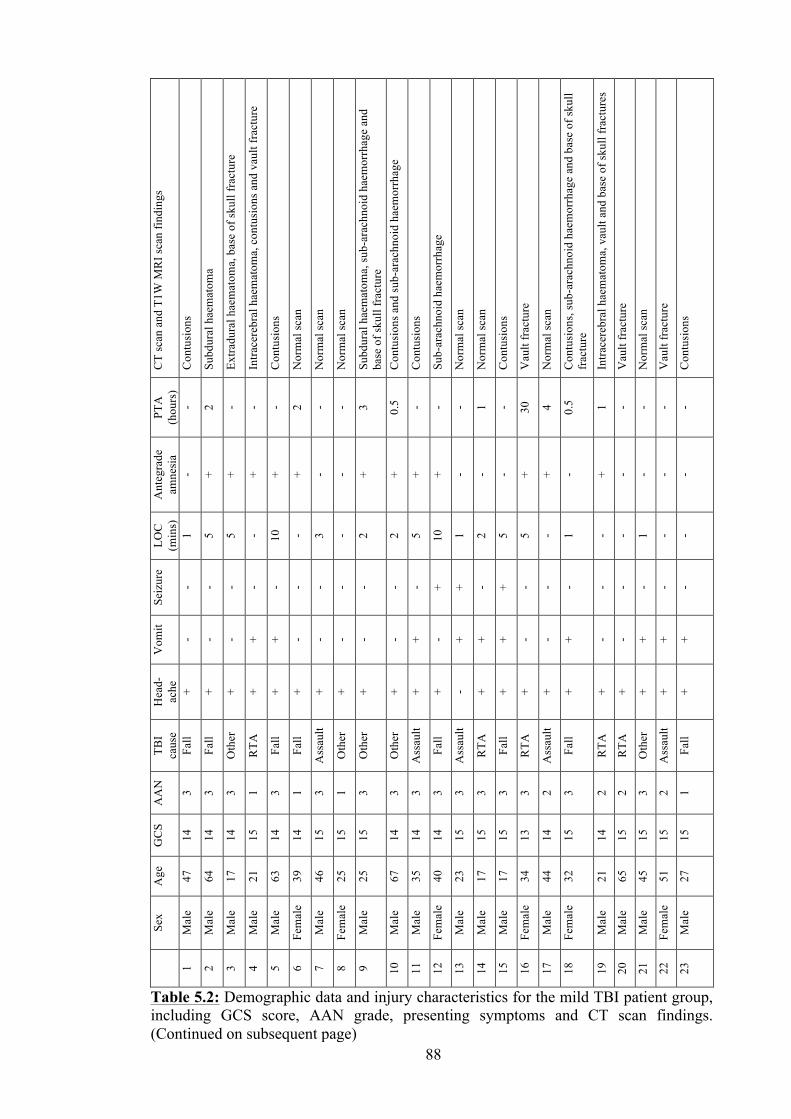
88
CT
scan
and
T1W
MR
I sca
n fin
ding
s
Con
tusi
ons
Subd
ural
hae
mat
oma
Extra
dura
l hae
mat
oma,
bas
e of
skul
l fra
ctur
e
Intra
cere
bral
hae
mat
oma,
con
tusi
ons a
nd v
ault
frac
ture
Con
tusi
ons
Nor
mal
scan
Nor
mal
scan
Nor
mal
scan
Subd
ural
hae
mat
oma,
sub-
arac
hnoi
d ha
emor
rhag
e an
d ba
se o
f sku
ll fr
actu
re
Con
tusi
ons a
nd su
b-ar
achn
oid
haem
orrh
age
Con
tusi
ons
Sub-
arac
hnoi
d ha
emor
rhag
e
Nor
mal
scan
Nor
mal
scan
Con
tusi
ons
Vau
lt fr
actu
re
Nor
mal
scan
Con
tusi
ons,
sub-
arac
hnoi
d ha
emor
rhag
e an
d ba
se o
f sku
ll fr
actu
re
Intra
cere
bral
hae
mat
oma,
vau
lt an
d ba
se o
f sku
ll fr
actu
res
Vau
lt fr
actu
re
Nor
mal
scan
Vau
lt fr
actu
re
Con
tusi
ons
PTA
(h
ours
) - 2 - - - 2 - - 3 0.5 - - - 1 - 30
4 0.5 1 - - - -
Ant
egra
de
amne
sia
- + + + + + - - + + + + - - - + + - + - - - -
LOC
(m
ins)
1 5 5 - 10
- 3 - 2 2 5 10
1 2 5 5 - 1 - - 1 - -
Seiz
ure
- - - - - - - - - - - + + - + - - - - - - - -
Vom
it
- - - + + - - - - - + - + + + - - + - - + + +
Hea
d-ac
he
+ + + + + + + + + + + + - + + + + + + + + + +
TBI
caus
e Fa
ll
Fall
Oth
er
RTA
Fall
Fall
Ass
ault
Oth
er
Oth
er
Oth
er
Ass
ault
Fall
Ass
ault
RTA
Fall
RTA
Ass
ault
Fall
RTA
RTA
Oth
er
Ass
ault
Fall
AA
N
3 3 3 1 3 1 3 1 3 3 3 3 3 3 3 3 2 3 2 2 3 2 1
GC
S
14
14
14
15
14
14
15
15
15
14
14
14
15
15
15
13
14
15
14
15
15
15
15
Age
47
64
17
21
63
39
46
25
25
67
35
40
23
17
17
34
44
32
21
65
45
51
27
Sex
Mal
e
Mal
e
Mal
e
Mal
e
Mal
e
Fem
ale
Mal
e
Fem
ale
Mal
e
Mal
e
Mal
e
Fem
ale
Mal
e
Mal
e
Mal
e
Fem
ale
Mal
e
Fem
ale
Mal
e
Mal
e
Mal
e
Fem
ale
Mal
e
1 2 3 4 5 6 7 8 9 10
11
12
13
14
15
16
17
18
19
20
21
22
23
Table 5.2: Demographic data and injury characteristics for the mild TBI patient group, including GCS score, AAN grade, presenting symptoms and CT scan findings. (Continued on subsequent page)
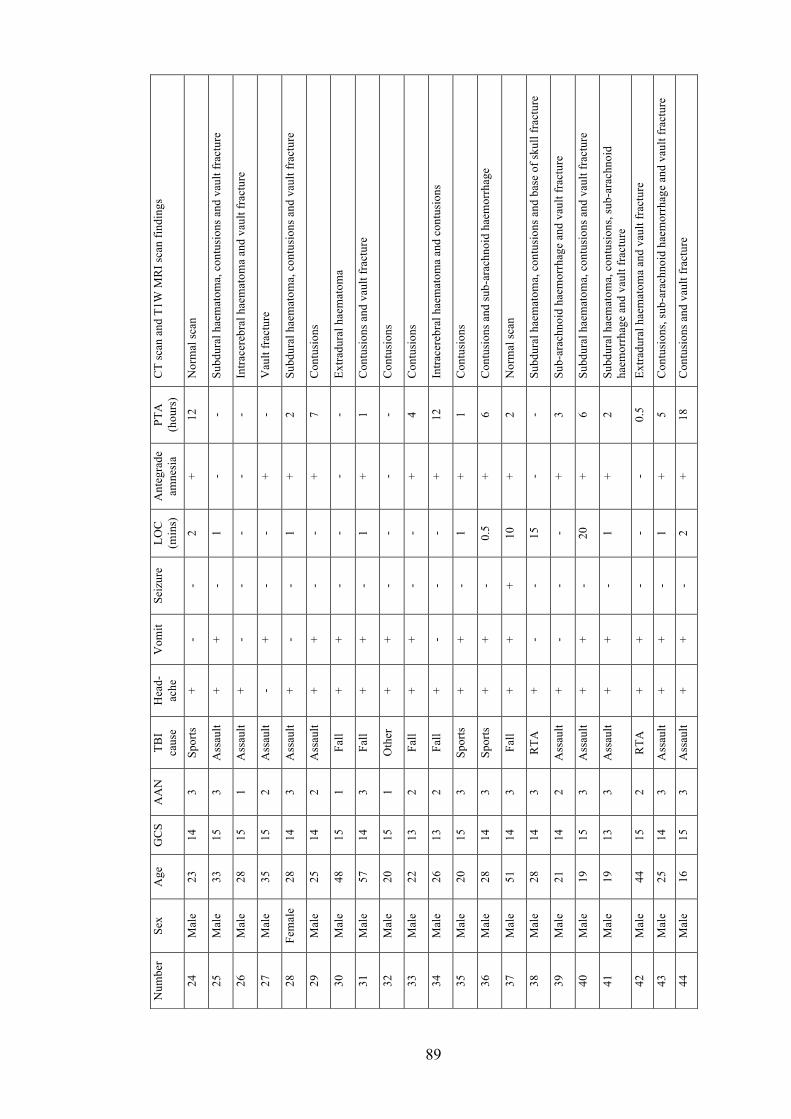
89
CT
scan
and
T1W
MR
I sca
n fin
ding
s
Nor
mal
scan
Subd
ural
hae
mat
oma,
con
tusi
ons a
nd v
ault
frac
ture
Intra
cere
bral
hae
mat
oma
and
vaul
t fra
ctur
e
Vau
lt fr
actu
re
Subd
ural
hae
mat
oma,
con
tusi
ons a
nd v
ault
frac
ture
Con
tusi
ons
Extra
dura
l hae
mat
oma
Con
tusi
ons a
nd v
ault
frac
ture
Con
tusi
ons
Con
tusi
ons
Intra
cere
bral
hae
mat
oma
and
cont
usio
ns
Con
tusi
ons
Con
tusi
ons a
nd su
b-ar
achn
oid
haem
orrh
age
Nor
mal
scan
Subd
ural
hae
mat
oma,
con
tusi
ons a
nd b
ase
of sk
ull f
ract
ure
Sub-
arac
hnoi
d ha
emor
rhag
e an
d va
ult f
ract
ure
Subd
ural
hae
mat
oma,
con
tusi
ons a
nd v
ault
frac
ture
Subd
ural
hae
mat
oma,
con
tusi
ons,
sub-
arac
hnoi
d ha
emor
rhag
e an
d va
ult f
ract
ure
Extra
dura
l hae
mat
oma
and
vaul
t fra
ctur
e
Con
tusi
ons,
sub-
arac
hnoi
d ha
emor
rhag
e an
d va
ult f
ract
ure
Con
tusi
ons a
nd v
ault
frac
ture
PTA
(h
ours
)
12
- - - 2 7 - 1 - 4 12
1 6 2 - 3 6 2 0.5 5 18
Ant
egra
de
amne
sia
+ - - + + + - + - + + + + + - + + + - + +
LOC
(m
ins)
2 1 - - 1 - - 1 - - - 1 0.5 10
15
- 20
1 - 1 2
Seiz
ure
- - - - - - - - - - - - - + - - - - - - -
Vom
it
- + - + - + + + + + - + + + - - + + + + +
Hea
d-ac
he
+ + + - + + + + + + + + + + + + + + + + +
TBI
caus
e
Spor
ts
Ass
ault
Ass
ault
Ass
ault
Ass
ault
Ass
ault
Fall
Fall
Oth
er
Fall
Fall
Spor
ts
Spor
ts
Fall
RTA
Ass
ault
Ass
ault
Ass
ault
RTA
Ass
ault
Ass
ault
AA
N
3 3 1 2 3 2 1 3 1 2 2 3 3 3 3 2 3 3 2 3 3
GC
S
14
15
15
15
14
14
15
14
15
13
13
15
14
14
14
14
15
13
15
14
15
Age
23
33
28
35
28
25
48
57
20
22
26
20
28
51
28
21
19
19
44
25
16
Sex
Mal
e
Mal
e
Mal
e
Mal
e
Fem
ale
Mal
e
Mal
e
Mal
e
Mal
e
Mal
e
Mal
e
Mal
e
Mal
e
Mal
e
Mal
e
Mal
e
Mal
e
Mal
e
Mal
e
Mal
e
Mal
e
Num
ber
24
25
26
27
28
29
30
31
32
33
34
35
36
37
38
39
40
41
42
43
44
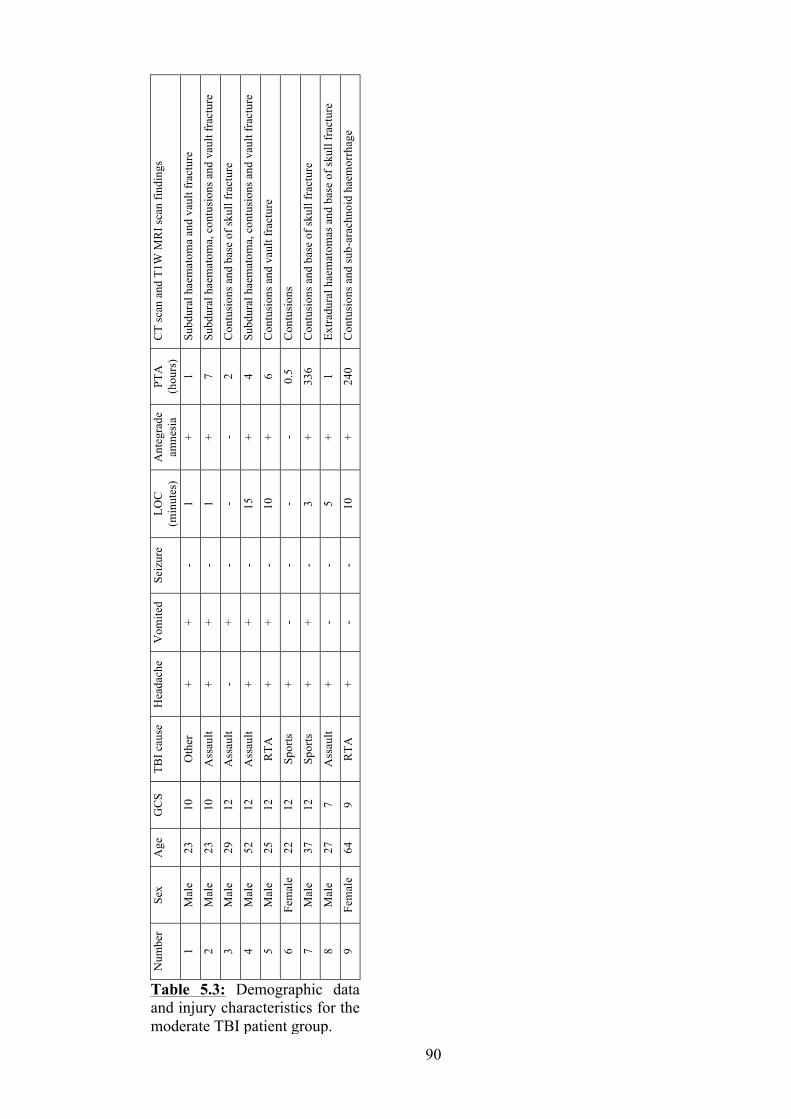
90
CT
scan
and
T1W
MR
I sca
n fin
ding
s
Subd
ural
hae
mat
oma
and
vaul
t fra
ctur
e
Subd
ural
hae
mat
oma,
con
tusi
ons a
nd v
ault
frac
ture
Con
tusi
ons a
nd b
ase
of sk
ull f
ract
ure
Subd
ural
hae
mat
oma,
con
tusi
ons a
nd v
ault
frac
ture
Con
tusi
ons a
nd v
ault
frac
ture
Con
tusi
ons
Con
tusi
ons a
nd b
ase
of sk
ull f
ract
ure
Extra
dura
l hae
mat
omas
and
bas
e of
skul
l fra
ctur
e
Con
tusi
ons a
nd su
b-ar
achn
oid
haem
orrh
age
PTA
(h
ours
) 1 7 2 4 6 0.5
336 1 240
Ant
egra
de
amne
sia
+ + - + + - + + +
LOC
(m
inut
es)
1 1 - 15
10
- 3 5 10
Seiz
ure
- - - - - - - - -
Vom
ited
+ + + + + - + - -
Hea
dach
e
+ + - + + + + + +
TBI c
ause
Oth
er
Ass
ault
Ass
ault
Ass
ault
RTA
Spor
ts
Spor
ts
Ass
ault
RTA
GC
S
10
10
12
12
12
12
12
7 9
Age
23
23
29
52
25
22
37
27
64
Sex
Mal
e
Mal
e
Mal
e
Mal
e
Mal
e
Fem
ale
Mal
e
Mal
e
Fem
ale
Num
ber
1 2 3 4 5 6 7 8 9
Table 5.3: Demographic data and injury characteristics for the moderate TBI patient group.
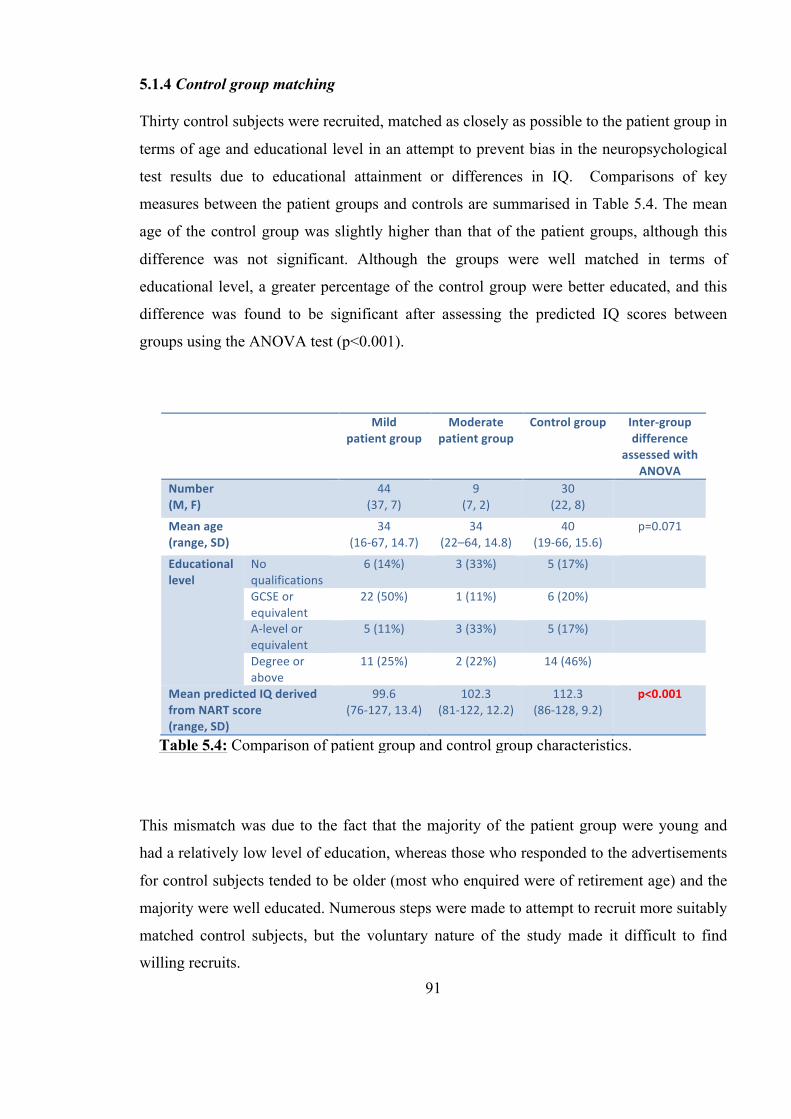
91
5.1.4 Control group matching
Thirty control subjects were recruited, matched as closely as possible to the patient group in
terms of age and educational level in an attempt to prevent bias in the neuropsychological
test results due to educational attainment or differences in IQ. Comparisons of key
measures between the patient groups and controls are summarised in Table 5.4. The mean
age of the control group was slightly higher than that of the patient groups, although this
difference was not significant. Although the groups were well matched in terms of
educational level, a greater percentage of the control group were better educated, and this
difference was found to be significant after assessing the predicted IQ scores between
groups using the ANOVA test (p<0.001).
This mismatch was due to the fact that the majority of the patient group were young and
had a relatively low level of education, whereas those who responded to the advertisements
for control subjects tended to be older (most who enquired were of retirement age) and the
majority were well educated. Numerous steps were made to attempt to recruit more suitably
matched control subjects, but the voluntary nature of the study made it difficult to find
willing recruits.
Mild patient group
Moderate patient group
Control group Inter-‐group difference
assessed with ANOVA
Number (M, F)
44 (37, 7)
9 (7, 2)
30 (22, 8)
Mean age (range, SD)
34 (16-‐67, 14.7)
34 (22–64, 14.8)
40 (19-‐66, 15.6)
p=0.071
Educational level
No qualifications
6 (14%) 3 (33%) 5 (17%)
GCSE or equivalent
22 (50%) 1 (11%) 6 (20%)
A-‐level or equivalent
5 (11%) 3 (33%) 5 (17%)
Degree or above
11 (25%) 2 (22%) 14 (46%)
Mean predicted IQ derived from NART score (range, SD)
99.6 (76-‐127, 13.4)
102.3 (81-‐122, 12.2)
112.3 (86-‐128, 9.2)
p<0.001
Table 5.4: Comparison of patient group and control group characteristics.
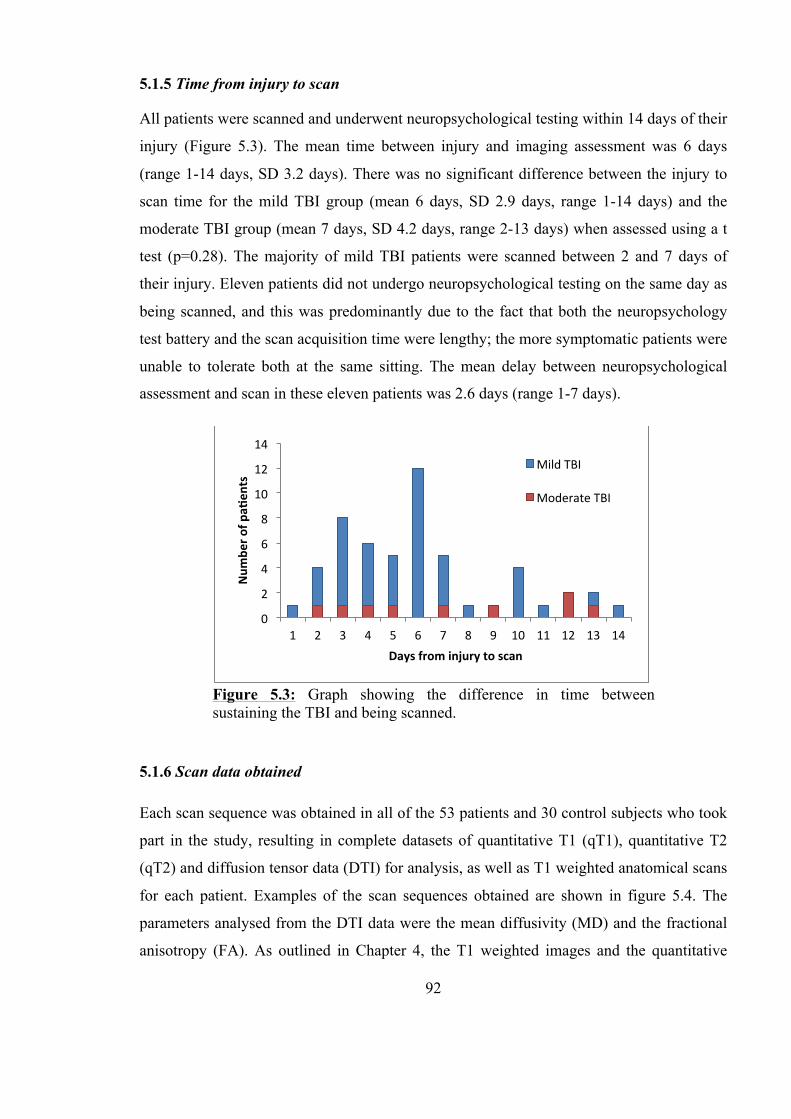
92
5.1.5 Time from injury to scan
All patients were scanned and underwent neuropsychological testing within 14 days of their
injury (Figure 5.3). The mean time between injury and imaging assessment was 6 days
(range 1-14 days, SD 3.2 days). There was no significant difference between the injury to
scan time for the mild TBI group (mean 6 days, SD 2.9 days, range 1-14 days) and the
moderate TBI group (mean 7 days, SD 4.2 days, range 2-13 days) when assessed using a t
test (p=0.28). The majority of mild TBI patients were scanned between 2 and 7 days of
their injury. Eleven patients did not undergo neuropsychological testing on the same day as
being scanned, and this was predominantly due to the fact that both the neuropsychology
test battery and the scan acquisition time were lengthy; the more symptomatic patients were
unable to tolerate both at the same sitting. The mean delay between neuropsychological
assessment and scan in these eleven patients was 2.6 days (range 1-7 days).
5.1.6 Scan data obtained
Each scan sequence was obtained in all of the 53 patients and 30 control subjects who took
part in the study, resulting in complete datasets of quantitative T1 (qT1), quantitative T2
(qT2) and diffusion tensor data (DTI) for analysis, as well as T1 weighted anatomical scans
for each patient. Examples of the scan sequences obtained are shown in figure 5.4. The
parameters analysed from the DTI data were the mean diffusivity (MD) and the fractional
anisotropy (FA). As outlined in Chapter 4, the T1 weighted images and the quantitative
Figure 5.3: Graph showing the difference in time between sustaining the TBI and being scanned.
0
2
4
6
8
10
12
14
1 2 3 4 5 6 7 8 9 10 11 12 13 14
Num
ber o
f pa_
ents
Days from injury to scan
Mild TBI
Moderate TBI
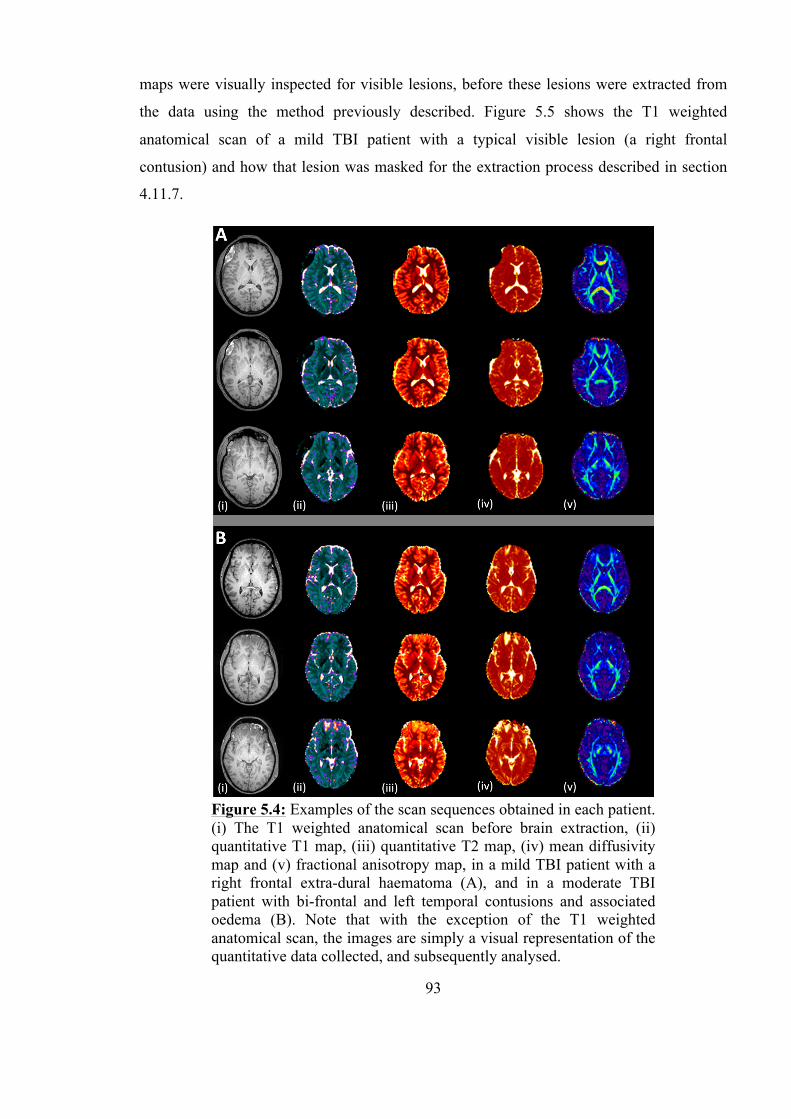
93
maps were visually inspected for visible lesions, before these lesions were extracted from
the data using the method previously described. Figure 5.5 shows the T1 weighted
anatomical scan of a mild TBI patient with a typical visible lesion (a right frontal
contusion) and how that lesion was masked for the extraction process described in section
4.11.7.
Figure 5.4: Examples of the scan sequences obtained in each patient. (i) The T1 weighted anatomical scan before brain extraction, (ii) quantitative T1 map, (iii) quantitative T2 map, (iv) mean diffusivity map and (v) fractional anisotropy map, in a mild TBI patient with a right frontal extra-dural haematoma (A), and in a moderate TBI patient with bi-frontal and left temporal contusions and associated oedema (B). Note that with the exception of the T1 weighted anatomical scan, the images are simply a visual representation of the quantitative data collected, and subsequently analysed.
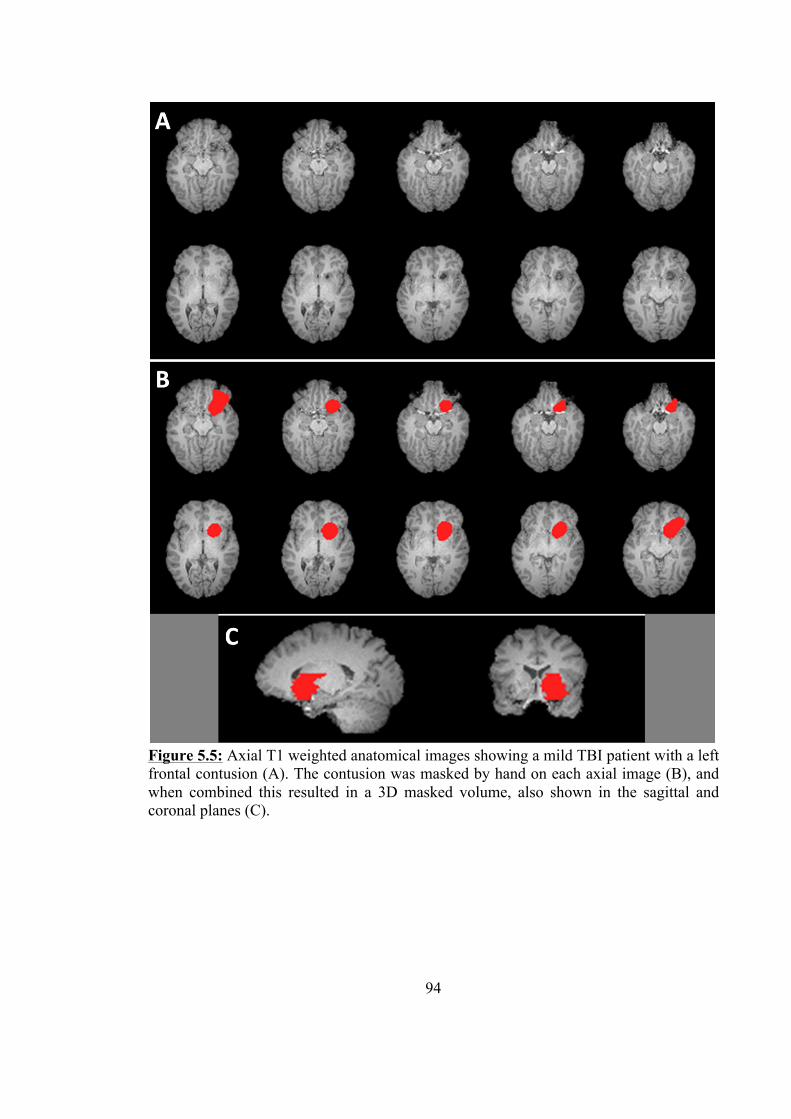
94
Figure 5.5: Axial T1 weighted anatomical images showing a mild TBI patient with a left frontal contusion (A). The contusion was masked by hand on each axial image (B), and when combined this resulted in a 3D masked volume, also shown in the sagittal and coronal planes (C).
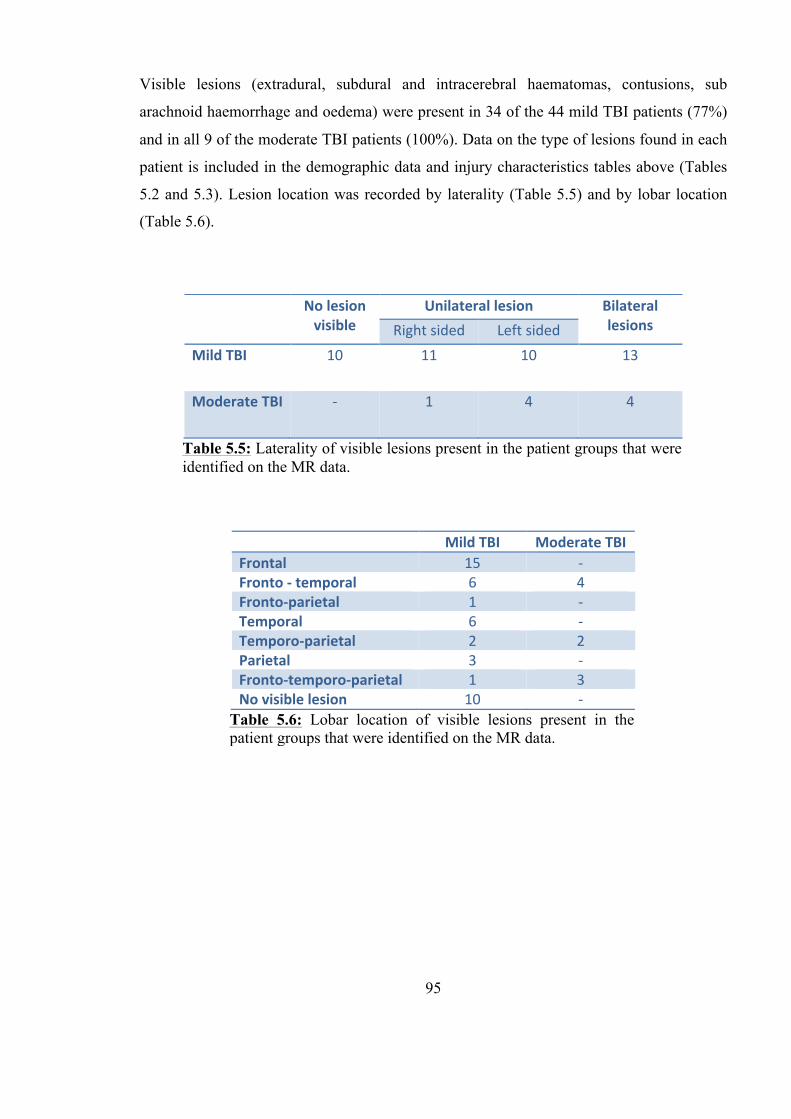
95
Visible lesions (extradural, subdural and intracerebral haematomas, contusions, sub
arachnoid haemorrhage and oedema) were present in 34 of the 44 mild TBI patients (77%)
and in all 9 of the moderate TBI patients (100%). Data on the type of lesions found in each
patient is included in the demographic data and injury characteristics tables above (Tables
5.2 and 5.3). Lesion location was recorded by laterality (Table 5.5) and by lobar location
(Table 5.6).
No lesion visible
Unilateral lesion Bilateral lesions Right sided Left sided
Mild TBI 10 11 10 13
Moderate TBI -‐ 1 4 4
Table 5.5: Laterality of visible lesions present in the patient groups that were identified on the MR data.
Mild TBI Moderate TBI Frontal 15 -‐ Fronto -‐ temporal 6 4 Fronto-‐parietal 1 -‐ Temporal 6 -‐ Temporo-‐parietal 2 2 Parietal 3 -‐ Fronto-‐temporo-‐parietal 1 3 No visible lesion 10 -‐
Table 5.6: Lobar location of visible lesions present in the patient groups that were identified on the MR data.
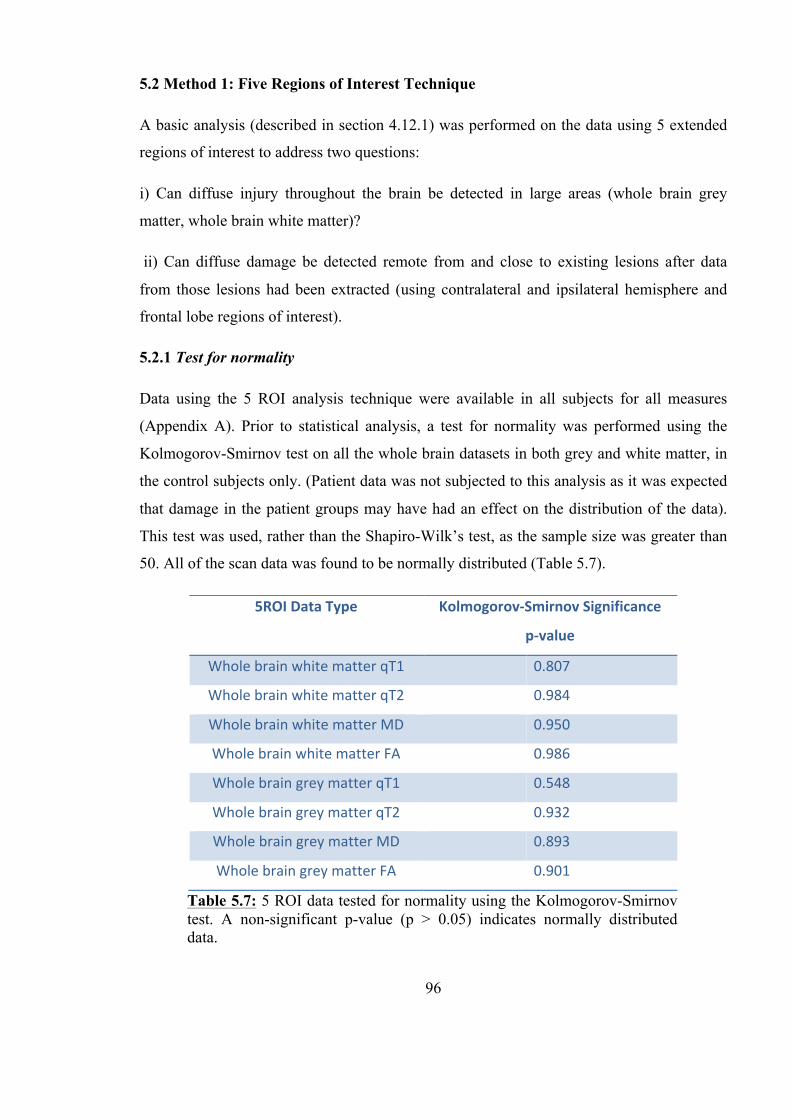
96
5.2 Method 1: Five Regions of Interest Technique
A basic analysis (described in section 4.12.1) was performed on the data using 5 extended
regions of interest to address two questions:
i) Can diffuse injury throughout the brain be detected in large areas (whole brain grey
matter, whole brain white matter)?
ii) Can diffuse damage be detected remote from and close to existing lesions after data
from those lesions had been extracted (using contralateral and ipsilateral hemisphere and
frontal lobe regions of interest).
5.2.1 Test for normality
Data using the 5 ROI analysis technique were available in all subjects for all measures
(Appendix A). Prior to statistical analysis, a test for normality was performed using the
Kolmogorov-Smirnov test on all the whole brain datasets in both grey and white matter, in
the control subjects only. (Patient data was not subjected to this analysis as it was expected
that damage in the patient groups may have had an effect on the distribution of the data).
This test was used, rather than the Shapiro-Wilk’s test, as the sample size was greater than
50. All of the scan data was found to be normally distributed (Table 5.7).
5ROI Data Type Kolmogorov-‐Smirnov Significance
p-‐value
Whole brain white matter qT1 0.807
Whole brain white matter qT2 0.984
Whole brain white matter MD 0.950
Whole brain white matter FA 0.986
Whole brain grey matter qT1 0.548
Whole brain grey matter qT2 0.932
Whole brain grey matter MD 0.893
Whole brain grey matter FA 0.901
Table 5.7: 5 ROI data tested for normality using the Kolmogorov-Smirnov test. A non-significant p-value (p > 0.05) indicates normally distributed data.
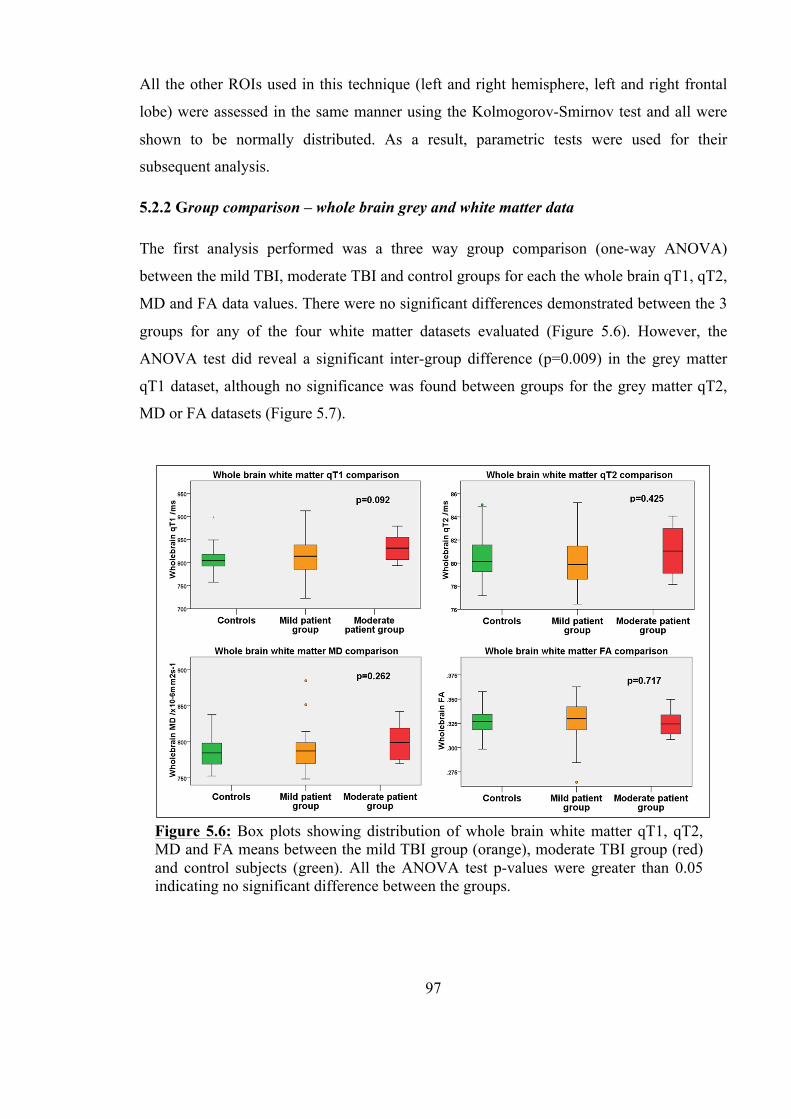
97
All the other ROIs used in this technique (left and right hemisphere, left and right frontal
lobe) were assessed in the same manner using the Kolmogorov-Smirnov test and all were
shown to be normally distributed. As a result, parametric tests were used for their
subsequent analysis.
5.2.2 Group comparison – whole brain grey and white matter data
The first analysis performed was a three way group comparison (one-way ANOVA)
between the mild TBI, moderate TBI and control groups for each the whole brain qT1, qT2,
MD and FA data values. There were no significant differences demonstrated between the 3
groups for any of the four white matter datasets evaluated (Figure 5.6). However, the
ANOVA test did reveal a significant inter-group difference (p=0.009) in the grey matter
qT1 dataset, although no significance was found between groups for the grey matter qT2,
MD or FA datasets (Figure 5.7).
Figure 5.6: Box plots showing distribution of whole brain white matter qT1, qT2, MD and FA means between the mild TBI group (orange), moderate TBI group (red) and control subjects (green). All the ANOVA test p-values were greater than 0.05 indicating no significant difference between the groups.

98
To analyse the significant difference found in the whole group comparison, post hoc t test
analysis was performed on the whole brain grey matter qT1 between each pair of groups;
mild TBI and controls, moderate TBI and controls, and mild TBI and moderate TBI. This
was performed using the t test for independent samples showed a significant increase in the
mean whole brain grey matter qT1 value between the mild TBI group and the controls
(p=0.018) and between the moderate TBI group and controls (p=0.001), but there was no
significant difference found between the mild TBI group and the moderate TBI group
(Figure 5.8).
Figure 5.7: Box plots showing distribution of whole brain grey matter qT1, qT2, MD and FA means between the mild TBI group (orange), moderate TBI group (red) and control subjects (green). The ANOVA test p-value of 0.009 for the qT1 data indicates a significant difference between the groups for that dataset only.
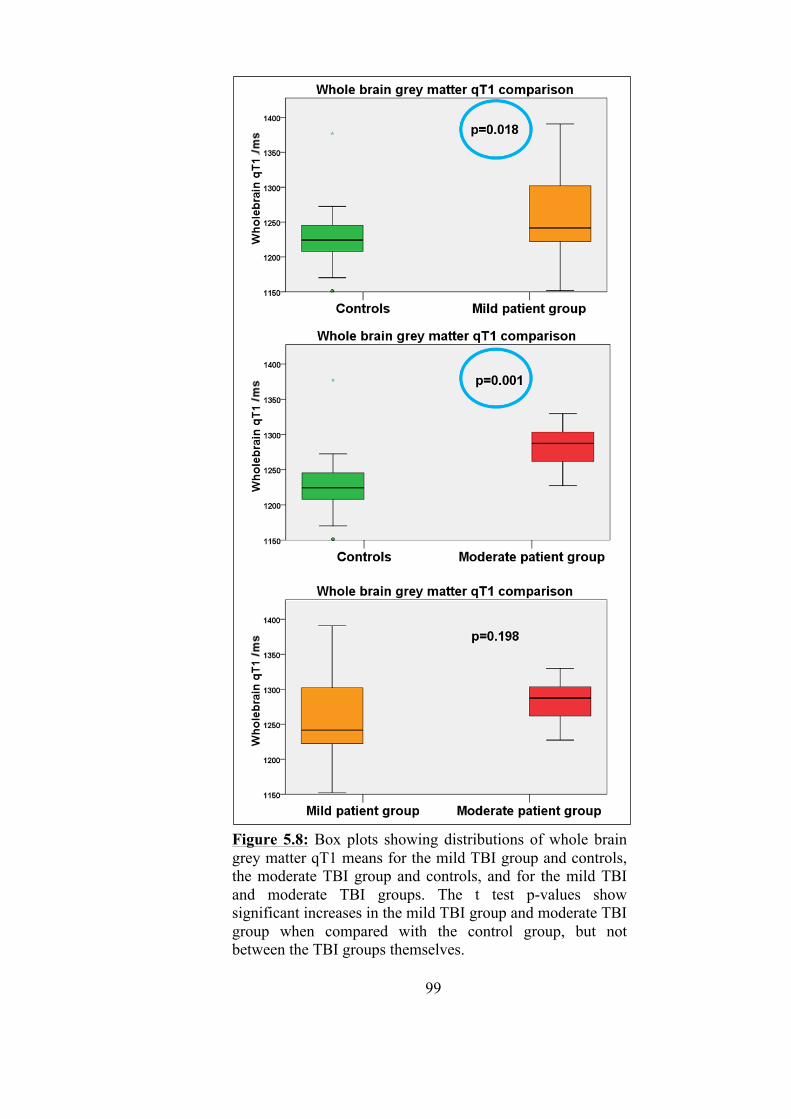
99
Figure 5.8: Box plots showing distributions of whole brain grey matter qT1 means for the mild TBI group and controls, the moderate TBI group and controls, and for the mild TBI and moderate TBI groups. The t test p-values show significant increases in the mild TBI group and moderate TBI group when compared with the control group, but not between the TBI groups themselves.
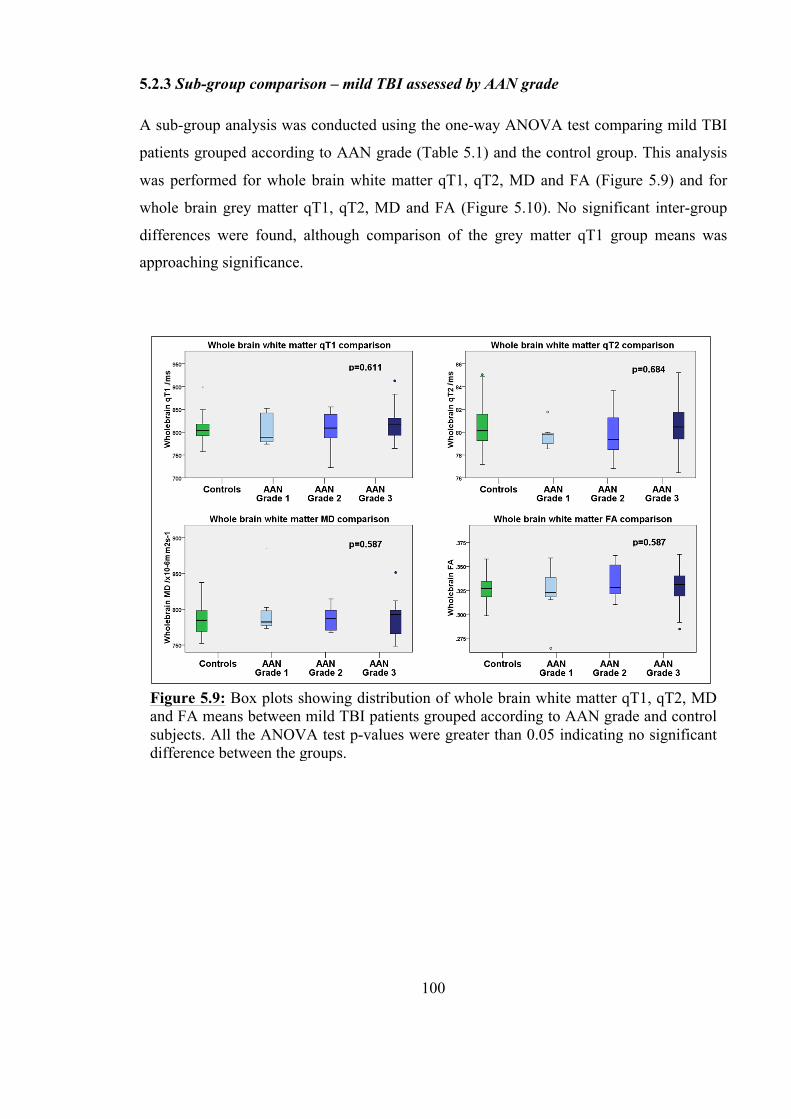
100
5.2.3 Sub-group comparison – mild TBI assessed by AAN grade
A sub-group analysis was conducted using the one-way ANOVA test comparing mild TBI
patients grouped according to AAN grade (Table 5.1) and the control group. This analysis
was performed for whole brain white matter qT1, qT2, MD and FA (Figure 5.9) and for
whole brain grey matter qT1, qT2, MD and FA (Figure 5.10). No significant inter-group
differences were found, although comparison of the grey matter qT1 group means was
approaching significance.
Figure 5.9: Box plots showing distribution of whole brain white matter qT1, qT2, MD and FA means between mild TBI patients grouped according to AAN grade and control subjects. All the ANOVA test p-values were greater than 0.05 indicating no significant difference between the groups.
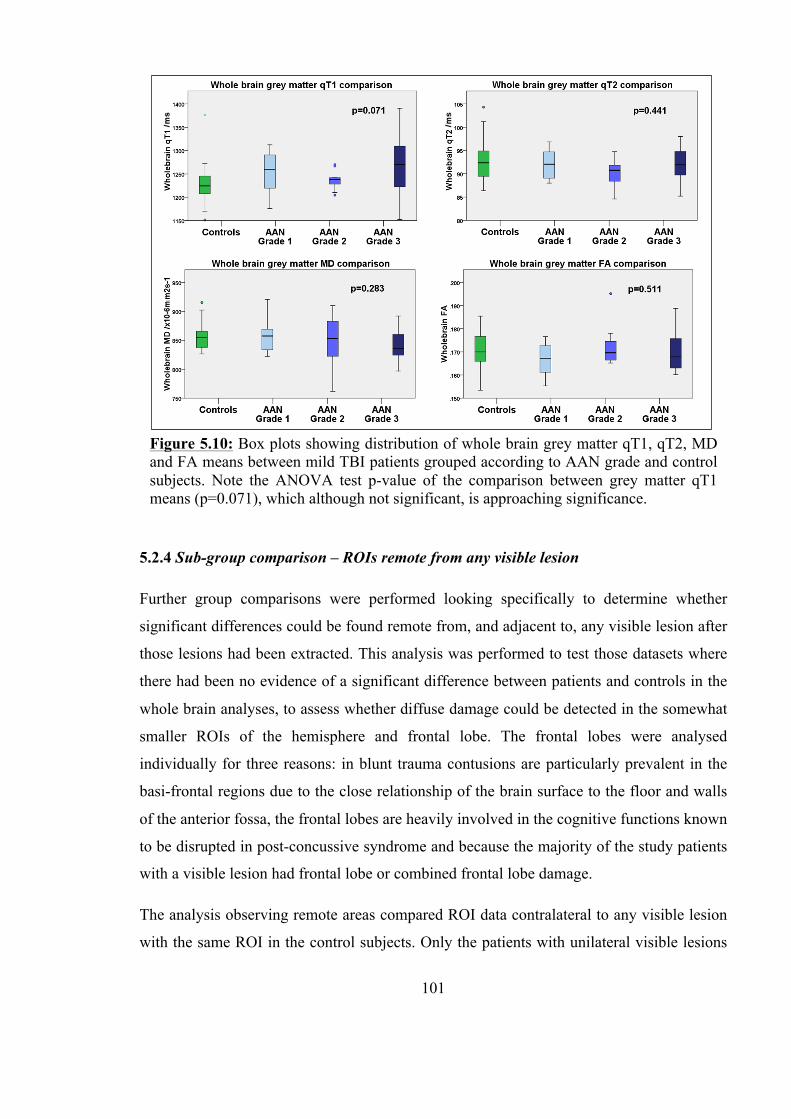
101
5.2.4 Sub-group comparison – ROIs remote from any visible lesion
Further group comparisons were performed looking specifically to determine whether
significant differences could be found remote from, and adjacent to, any visible lesion after
those lesions had been extracted. This analysis was performed to test those datasets where
there had been no evidence of a significant difference between patients and controls in the
whole brain analyses, to assess whether diffuse damage could be detected in the somewhat
smaller ROIs of the hemisphere and frontal lobe. The frontal lobes were analysed
individually for three reasons: in blunt trauma contusions are particularly prevalent in the
basi-frontal regions due to the close relationship of the brain surface to the floor and walls
of the anterior fossa, the frontal lobes are heavily involved in the cognitive functions known
to be disrupted in post-concussive syndrome and because the majority of the study patients
with a visible lesion had frontal lobe or combined frontal lobe damage.
The analysis observing remote areas compared ROI data contralateral to any visible lesion
with the same ROI in the control subjects. Only the patients with unilateral visible lesions
Figure 5.10: Box plots showing distribution of whole brain grey matter qT1, qT2, MD and FA means between mild TBI patients grouped according to AAN grade and control subjects. Note the ANOVA test p-value of the comparison between grey matter qT1 means (p=0.071), which although not significant, is approaching significance.
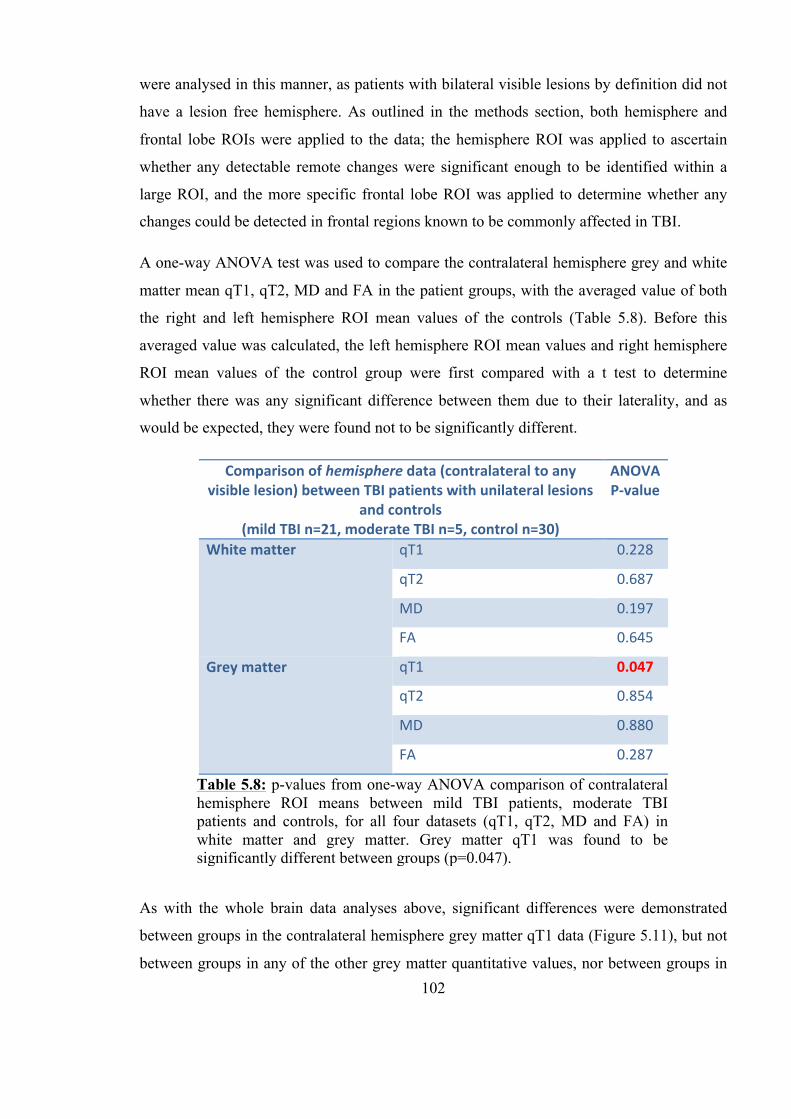
102
were analysed in this manner, as patients with bilateral visible lesions by definition did not
have a lesion free hemisphere. As outlined in the methods section, both hemisphere and
frontal lobe ROIs were applied to the data; the hemisphere ROI was applied to ascertain
whether any detectable remote changes were significant enough to be identified within a
large ROI, and the more specific frontal lobe ROI was applied to determine whether any
changes could be detected in frontal regions known to be commonly affected in TBI.
A one-way ANOVA test was used to compare the contralateral hemisphere grey and white
matter mean qT1, qT2, MD and FA in the patient groups, with the averaged value of both
the right and left hemisphere ROI mean values of the controls (Table 5.8). Before this
averaged value was calculated, the left hemisphere ROI mean values and right hemisphere
ROI mean values of the control group were first compared with a t test to determine
whether there was any significant difference between them due to their laterality, and as
would be expected, they were found not to be significantly different.
As with the whole brain data analyses above, significant differences were demonstrated
between groups in the contralateral hemisphere grey matter qT1 data (Figure 5.11), but not
between groups in any of the other grey matter quantitative values, nor between groups in
Comparison of hemisphere data (contralateral to any visible lesion) between TBI patients with unilateral lesions
and controls (mild TBI n=21, moderate TBI n=5, control n=30)
ANOVA P-‐value
White matter qT1 0.228
qT2 0.687
MD 0.197
FA 0.645
Grey matter qT1 0.047
qT2 0.854
MD 0.880
FA 0.287
Table 5.8: p-values from one-way ANOVA comparison of contralateral hemisphere ROI means between mild TBI patients, moderate TBI patients and controls, for all four datasets (qT1, qT2, MD and FA) in white matter and grey matter. Grey matter qT1 was found to be significantly different between groups (p=0.047).

103
any of the white matter datasets. Further post hoc analysis between the three groups was
performed using the t test between the individual pairs (mild TBI and controls, moderate
TBI and controls and mild and moderate TBI) but p-values were all non-significant.
Analysis of the frontal lobe ROI data contralateral to any visible lesion, using the one-way
ANOVA test, revealed no significant differences between groups in any of the quantitative
data in either white matter or grey matter.
5.2.5 Sub-group comparison – ROIs adjacent to any visible lesion
In the same manner, the hemisphere and frontal lobe ROI data was used to determine
whether any differences could be detected adjacent to any visible lesion seen in the patient
groups, when compared to the control group. In this analysis ROI data ipsilateral to visible
lesions was compared using the one-way ANOVA test with the averaged data from both
left and right ROIs in the controls, as used in section 5.2.4 above.
Analysis of the datasets with respect to the white matter in the hemispheres and frontal
lobes containing extracted visible lesions revealed no statistically significant differences
between TBI patients and controls. However, a significant difference was shown to exist
between TBI groups and controls in the hemisphere ipsilateral to any visible lesion in both
Figure 5.11: Box plot showing distribution of hemisphere grey matter qT1, contralateral to any visible lesion in the mild and moderate TBI groups and mean values for the left and right hemispheres in control subjects. An ANOVA test on the qT1 data indicates a significant difference between the groups (p=0.047).
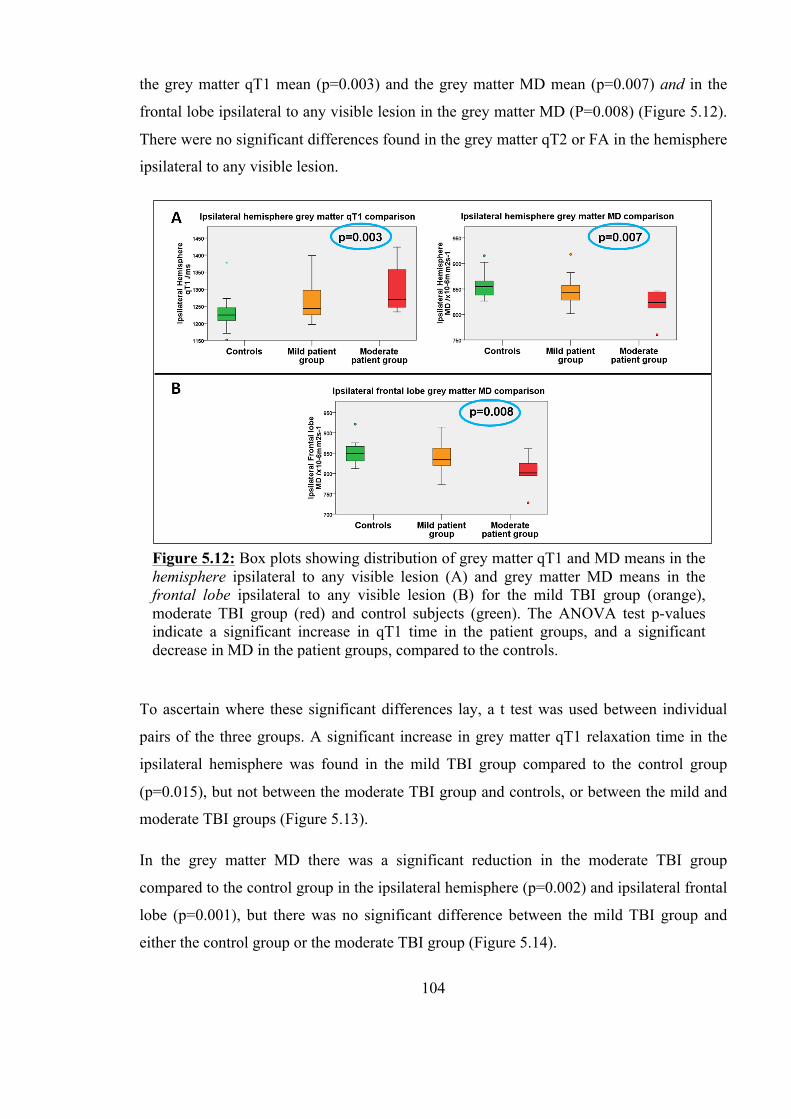
104
the grey matter qT1 mean (p=0.003) and the grey matter MD mean (p=0.007) and in the
frontal lobe ipsilateral to any visible lesion in the grey matter MD (P=0.008) (Figure 5.12).
There were no significant differences found in the grey matter qT2 or FA in the hemisphere
ipsilateral to any visible lesion.
To ascertain where these significant differences lay, a t test was used between individual
pairs of the three groups. A significant increase in grey matter qT1 relaxation time in the
ipsilateral hemisphere was found in the mild TBI group compared to the control group
(p=0.015), but not between the moderate TBI group and controls, or between the mild and
moderate TBI groups (Figure 5.13).
In the grey matter MD there was a significant reduction in the moderate TBI group
compared to the control group in the ipsilateral hemisphere (p=0.002) and ipsilateral frontal
lobe (p=0.001), but there was no significant difference between the mild TBI group and
either the control group or the moderate TBI group (Figure 5.14).
Figure 5.12: Box plots showing distribution of grey matter qT1 and MD means in the hemisphere ipsilateral to any visible lesion (A) and grey matter MD means in the frontal lobe ipsilateral to any visible lesion (B) for the mild TBI group (orange), moderate TBI group (red) and control subjects (green). The ANOVA test p-values indicate a significant increase in qT1 time in the patient groups, and a significant decrease in MD in the patient groups, compared to the controls.
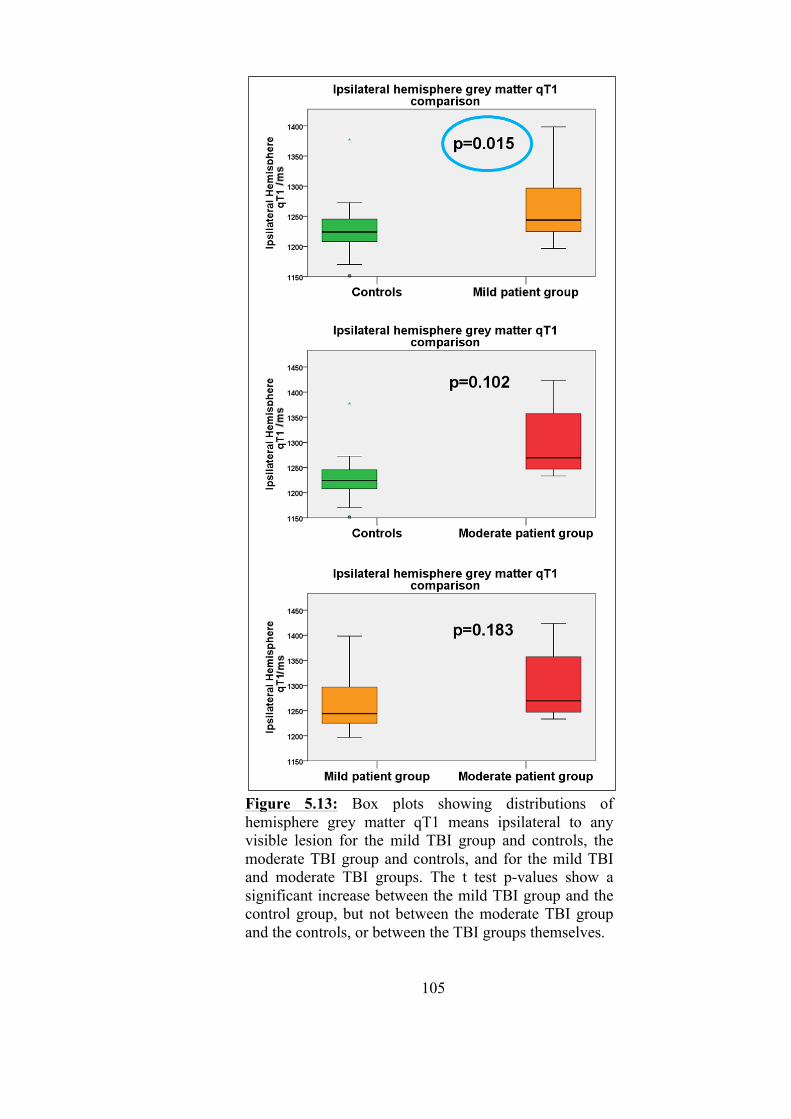
105
Figure 5.13: Box plots showing distributions of hemisphere grey matter qT1 means ipsilateral to any visible lesion for the mild TBI group and controls, the moderate TBI group and controls, and for the mild TBI and moderate TBI groups. The t test p-values show a significant increase between the mild TBI group and the control group, but not between the moderate TBI group and the controls, or between the TBI groups themselves.
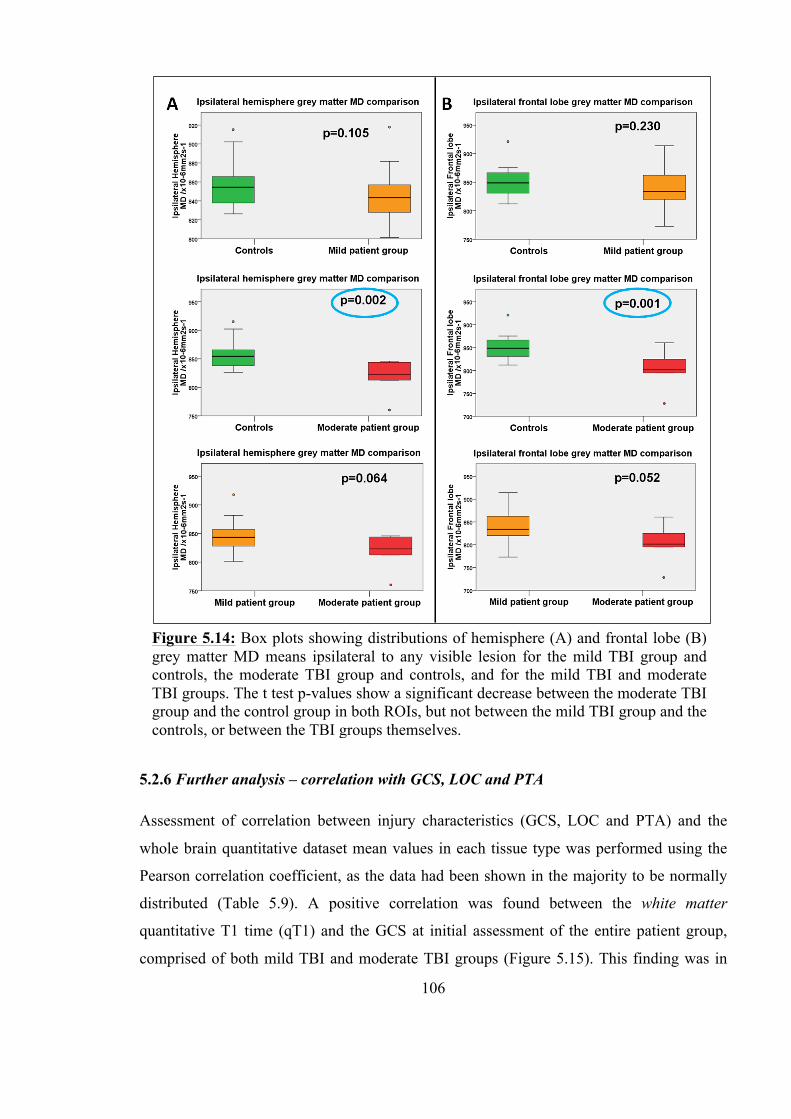
106
5.2.6 Further analysis – correlation with GCS, LOC and PTA
Assessment of correlation between injury characteristics (GCS, LOC and PTA) and the
whole brain quantitative dataset mean values in each tissue type was performed using the
Pearson correlation coefficient, as the data had been shown in the majority to be normally
distributed (Table 5.9). A positive correlation was found between the white matter
quantitative T1 time (qT1) and the GCS at initial assessment of the entire patient group,
comprised of both mild TBI and moderate TBI groups (Figure 5.15). This finding was in
Figure 5.14: Box plots showing distributions of hemisphere (A) and frontal lobe (B) grey matter MD means ipsilateral to any visible lesion for the mild TBI group and controls, the moderate TBI group and controls, and for the mild TBI and moderate TBI groups. The t test p-values show a significant decrease between the moderate TBI group and the control group in both ROIs, but not between the mild TBI group and the controls, or between the TBI groups themselves.
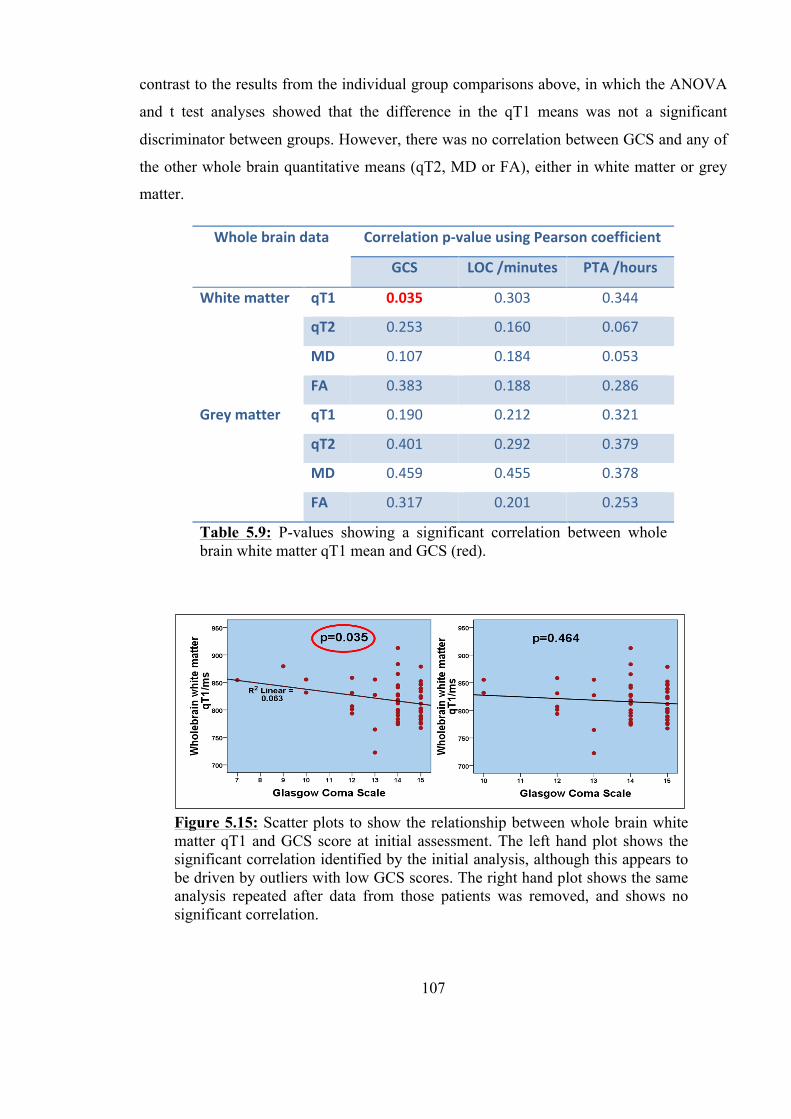
107
contrast to the results from the individual group comparisons above, in which the ANOVA
and t test analyses showed that the difference in the qT1 means was not a significant
discriminator between groups. However, there was no correlation between GCS and any of
the other whole brain quantitative means (qT2, MD or FA), either in white matter or grey
matter.
Whole brain data Correlation p-‐value using Pearson coefficient
GCS LOC /minutes PTA /hours
White matter qT1 0.035 0.303 0.344
qT2 0.253 0.160 0.067
MD 0.107 0.184 0.053
FA 0.383 0.188 0.286
Grey matter qT1 0.190 0.212 0.321
qT2 0.401 0.292 0.379
MD 0.459 0.455 0.378
FA 0.317 0.201 0.253
Table 5.9: P-values showing a significant correlation between whole brain white matter qT1 mean and GCS (red).
Figure 5.15: Scatter plots to show the relationship between whole brain white matter qT1 and GCS score at initial assessment. The left hand plot shows the significant correlation identified by the initial analysis, although this appears to be driven by outliers with low GCS scores. The right hand plot shows the same analysis repeated after data from those patients was removed, and shows no significant correlation.
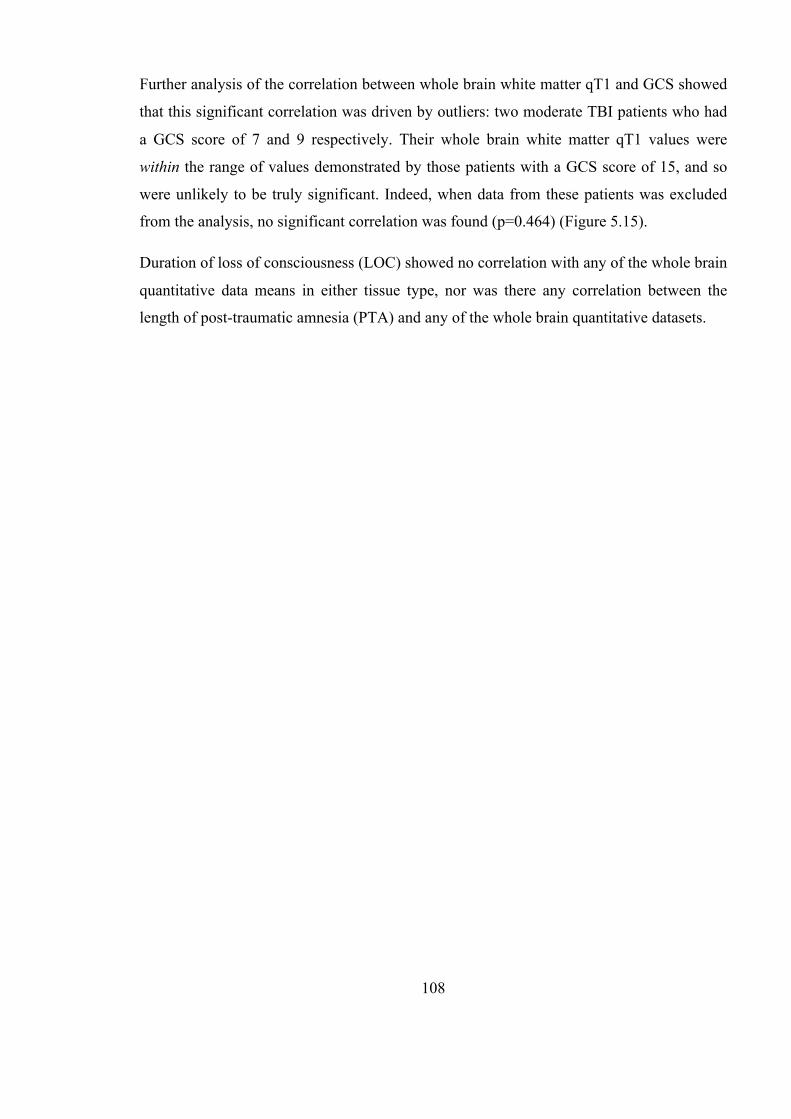
108
Further analysis of the correlation between whole brain white matter qT1 and GCS showed
that this significant correlation was driven by outliers: two moderate TBI patients who had
a GCS score of 7 and 9 respectively. Their whole brain white matter qT1 values were
within the range of values demonstrated by those patients with a GCS score of 15, and so
were unlikely to be truly significant. Indeed, when data from these patients was excluded
from the analysis, no significant correlation was found (p=0.464) (Figure 5.15).
Duration of loss of consciousness (LOC) showed no correlation with any of the whole brain
quantitative data means in either tissue type, nor was there any correlation between the
length of post-traumatic amnesia (PTA) and any of the whole brain quantitative datasets.
109
5.3 Method 2: Fourteen Automated Regions of Interest
As discussed in Chapter 4, user-defined ROI analysis as performed on the data above is
useful as it allows the targeting of specific areas of interest and is hypothesis led: whole
brain ROI to test whether diffuse changes could be detected in the entire grey or white
matter, and lateralised ROIs to test whether changes could be detected remote from or
adjacent to extracted visible regions of damage. However, it has a number of disadvantages.
When selecting large ROIs, small areas of subtle damage may not be detected, as a result of
the diluting effect of the surrounding normal areas contained within the same ROI. Another
limitation of this type of ROI selection is that some regions where microstructural change
exists could be missed if they were not inside the pre-specified target ROIs and lastly the
analysis itself is hugely time consuming and potentially prone to bias from user definition
of each individual ROI. In order to address this limitation, an automated method was used
which involved the creation of a template dividing the whole brain volume into 14 distinct
smaller regions, 7 per hemisphere (Table 5.10), and the application of this template
automatically to each of the patient’s datasets.
5.3.1 Test for normality
Data using the 14 automated ROI analysis technique (section 4.12.2) were available in all
subjects for all measures (Appendix B and Appendix C). The Kolmogorov-Smirnov test
was performed on all the datasets in both white and grey matter for each region in the
Region Number assigned for analysis
Right Left
Inferior frontal 1 8
Superior frontal 2 9
Temporal 3 10
Parieto-‐occipital 4 11
Occipital 5 12
Temporo-‐parietal 6 13
Parietal 7 14
Table 5.10: Number (1-14) assigned to each region, right and left, for purposes of analysis.
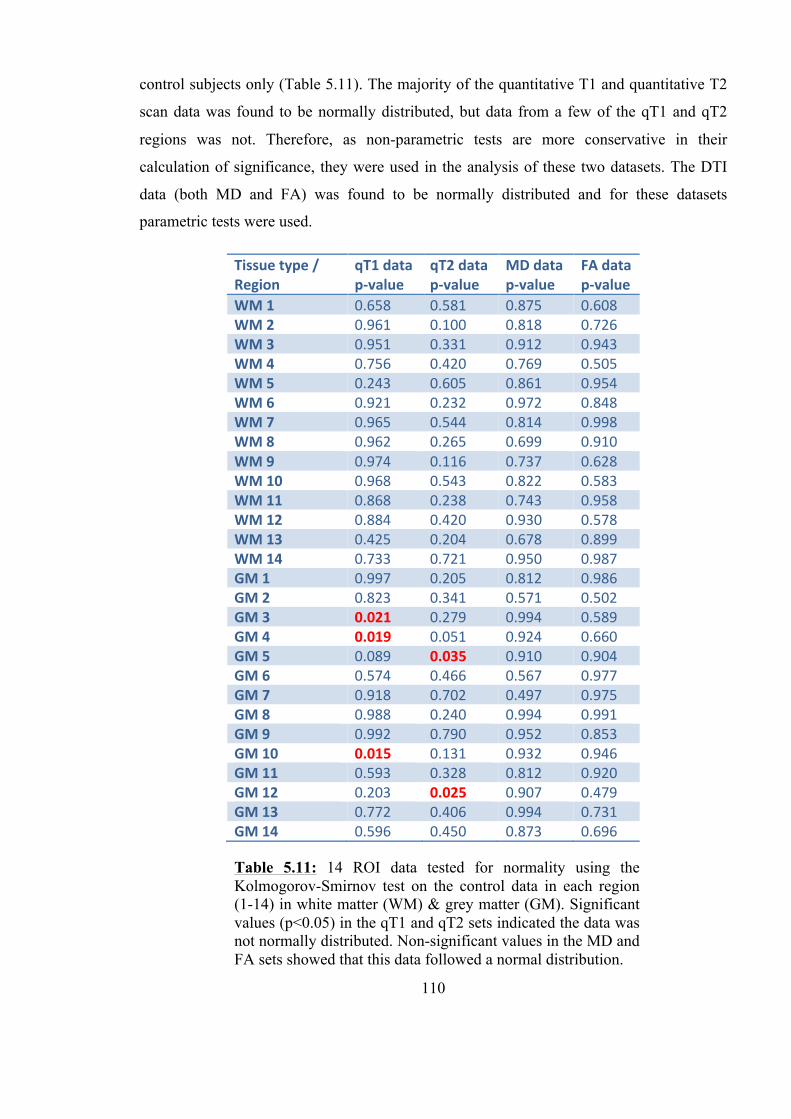
110
control subjects only (Table 5.11). The majority of the quantitative T1 and quantitative T2
scan data was found to be normally distributed, but data from a few of the qT1 and qT2
regions was not. Therefore, as non-parametric tests are more conservative in their
calculation of significance, they were used in the analysis of these two datasets. The DTI
data (both MD and FA) was found to be normally distributed and for these datasets
parametric tests were used.
Tissue type / Region
qT1 data p-‐value
qT2 data p-‐value
MD data p-‐value
FA data p-‐value
WM 1 0.658 0.581 0.875 0.608 WM 2 0.961 0.100 0.818 0.726 WM 3 0.951 0.331 0.912 0.943 WM 4 0.756 0.420 0.769 0.505 WM 5 0.243 0.605 0.861 0.954 WM 6 0.921 0.232 0.972 0.848 WM 7 0.965 0.544 0.814 0.998 WM 8 0.962 0.265 0.699 0.910 WM 9 0.974 0.116 0.737 0.628 WM 10 0.968 0.543 0.822 0.583 WM 11 0.868 0.238 0.743 0.958 WM 12 0.884 0.420 0.930 0.578 WM 13 0.425 0.204 0.678 0.899 WM 14 0.733 0.721 0.950 0.987 GM 1 0.997 0.205 0.812 0.986 GM 2 0.823 0.341 0.571 0.502 GM 3 0.021 0.279 0.994 0.589 GM 4 0.019 0.051 0.924 0.660 GM 5 0.089 0.035 0.910 0.904 GM 6 0.574 0.466 0.567 0.977 GM 7 0.918 0.702 0.497 0.975 GM 8 0.988 0.240 0.994 0.991 GM 9 0.992 0.790 0.952 0.853 GM 10 0.015 0.131 0.932 0.946 GM 11 0.593 0.328 0.812 0.920 GM 12 0.203 0.025 0.907 0.479 GM 13 0.772 0.406 0.994 0.731 GM 14 0.596 0.450 0.873 0.696
Table 5.11: 14 ROI data tested for normality using the Kolmogorov-Smirnov test on the control data in each region (1-14) in white matter (WM) & grey matter (GM). Significant values (p<0.05) in the qT1 and qT2 sets indicated the data was not normally distributed. Non-significant values in the MD and FA sets showed that this data followed a normal distribution.
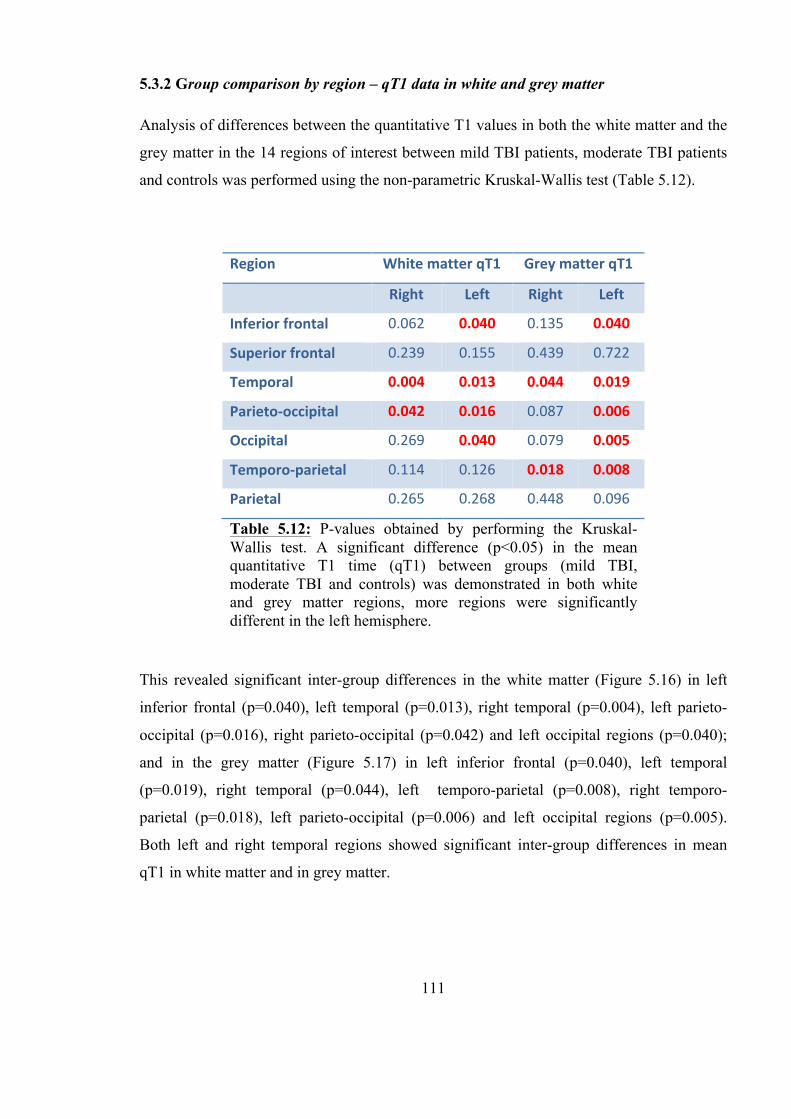
111
5.3.2 Group comparison by region – qT1 data in white and grey matter
Analysis of differences between the quantitative T1 values in both the white matter and the
grey matter in the 14 regions of interest between mild TBI patients, moderate TBI patients
and controls was performed using the non-parametric Kruskal-Wallis test (Table 5.12).
This revealed significant inter-group differences in the white matter (Figure 5.16) in left
inferior frontal (p=0.040), left temporal (p=0.013), right temporal (p=0.004), left parieto-
occipital (p=0.016), right parieto-occipital (p=0.042) and left occipital regions (p=0.040);
and in the grey matter (Figure 5.17) in left inferior frontal (p=0.040), left temporal
(p=0.019), right temporal (p=0.044), left temporo-parietal (p=0.008), right temporo-
parietal (p=0.018), left parieto-occipital (p=0.006) and left occipital regions (p=0.005).
Both left and right temporal regions showed significant inter-group differences in mean
qT1 in white matter and in grey matter.
Region White matter qT1 Grey matter qT1
Right Left Right Left
Inferior frontal 0.062 0.040 0.135 0.040
Superior frontal 0.239 0.155 0.439 0.722
Temporal 0.004 0.013 0.044 0.019
Parieto-‐occipital 0.042 0.016 0.087 0.006
Occipital 0.269 0.040 0.079 0.005
Temporo-‐parietal 0.114 0.126 0.018 0.008
Parietal 0.265 0.268 0.448 0.096
Table 5.12: P-values obtained by performing the Kruskal-Wallis test. A significant difference (p<0.05) in the mean quantitative T1 time (qT1) between groups (mild TBI, moderate TBI and controls) was demonstrated in both white and grey matter regions, more regions were significantly different in the left hemisphere.
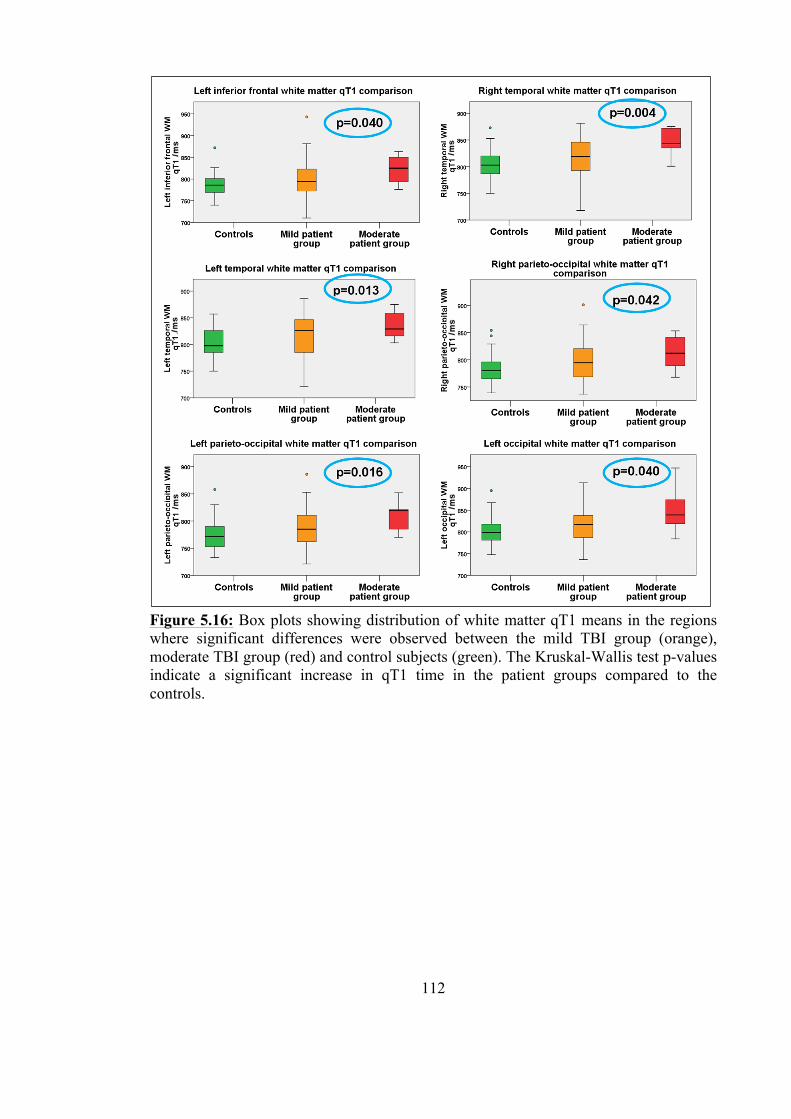
112
Figure 5.16: Box plots showing distribution of white matter qT1 means in the regions where significant differences were observed between the mild TBI group (orange), moderate TBI group (red) and control subjects (green). The Kruskal-Wallis test p-values indicate a significant increase in qT1 time in the patient groups compared to the controls.
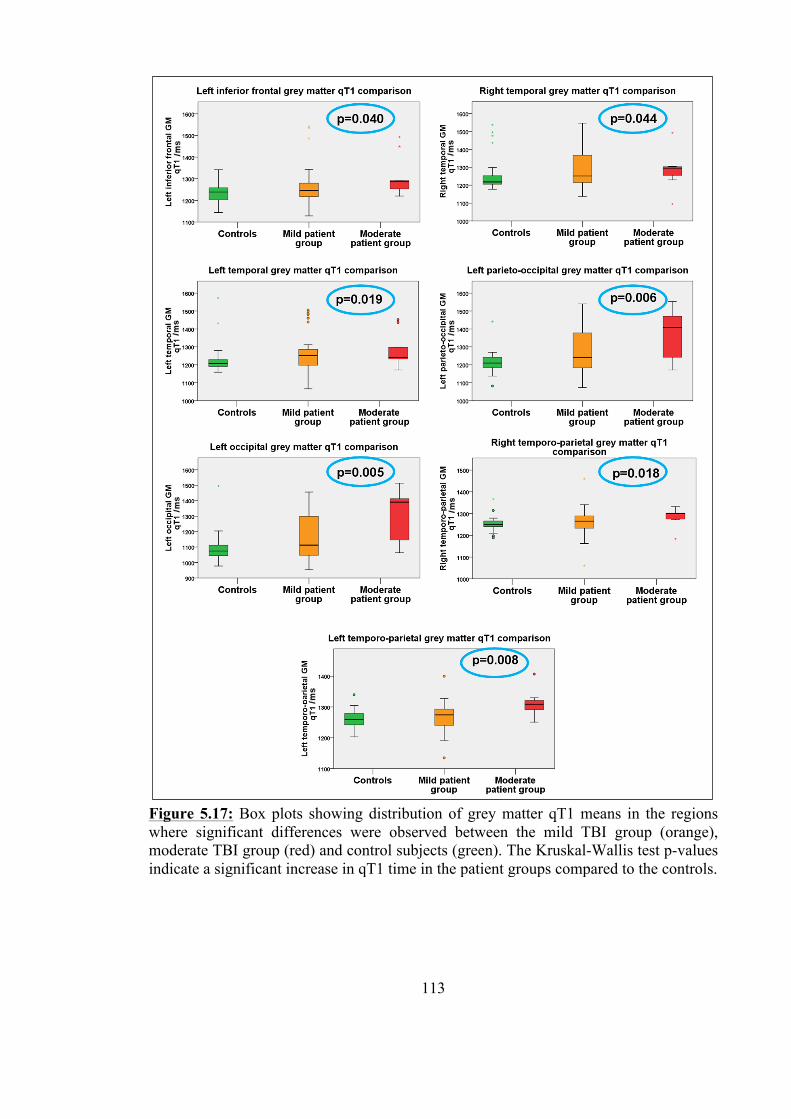
113
Figure 5.17: Box plots showing distribution of grey matter qT1 means in the regions where significant differences were observed between the mild TBI group (orange), moderate TBI group (red) and control subjects (green). The Kruskal-Wallis test p-values indicate a significant increase in qT1 time in the patient groups compared to the controls.
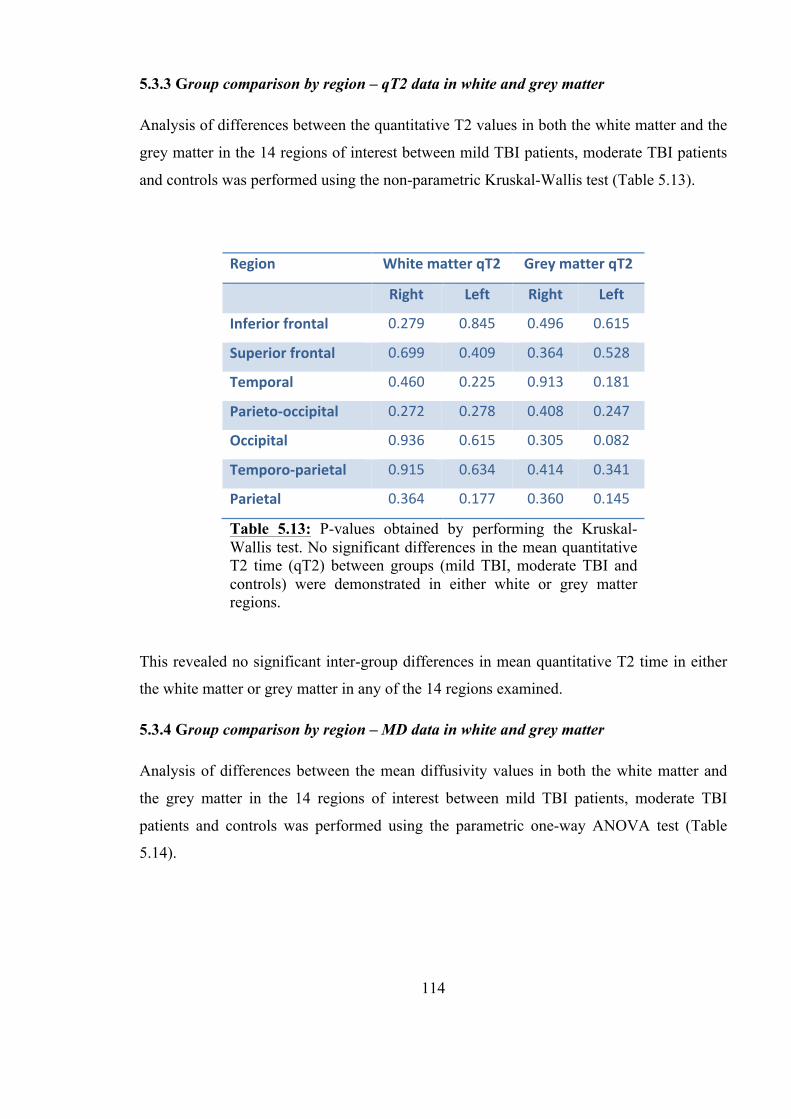
114
5.3.3 Group comparison by region – qT2 data in white and grey matter
Analysis of differences between the quantitative T2 values in both the white matter and the
grey matter in the 14 regions of interest between mild TBI patients, moderate TBI patients
and controls was performed using the non-parametric Kruskal-Wallis test (Table 5.13).
This revealed no significant inter-group differences in mean quantitative T2 time in either
the white matter or grey matter in any of the 14 regions examined.
5.3.4 Group comparison by region – MD data in white and grey matter
Analysis of differences between the mean diffusivity values in both the white matter and
the grey matter in the 14 regions of interest between mild TBI patients, moderate TBI
patients and controls was performed using the parametric one-way ANOVA test (Table
5.14).
Region White matter qT2 Grey matter qT2
Right Left Right Left
Inferior frontal 0.279 0.845 0.496 0.615
Superior frontal 0.699 0.409 0.364 0.528
Temporal 0.460 0.225 0.913 0.181
Parieto-‐occipital 0.272 0.278 0.408 0.247
Occipital 0.936 0.615 0.305 0.082
Temporo-‐parietal 0.915 0.634 0.414 0.341
Parietal 0.364 0.177 0.360 0.145
Table 5.13: P-values obtained by performing the Kruskal-Wallis test. No significant differences in the mean quantitative T2 time (qT2) between groups (mild TBI, moderate TBI and controls) were demonstrated in either white or grey matter regions.
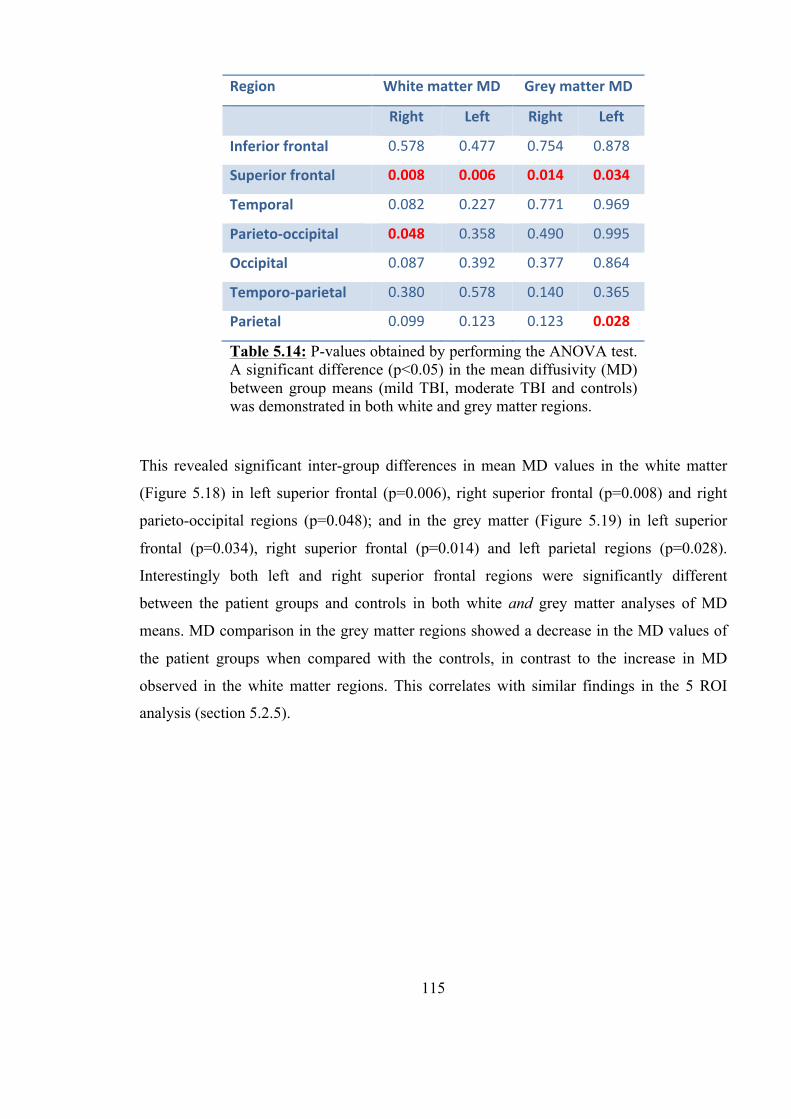
115
This revealed significant inter-group differences in mean MD values in the white matter
(Figure 5.18) in left superior frontal (p=0.006), right superior frontal (p=0.008) and right
parieto-occipital regions (p=0.048); and in the grey matter (Figure 5.19) in left superior
frontal (p=0.034), right superior frontal (p=0.014) and left parietal regions (p=0.028).
Interestingly both left and right superior frontal regions were significantly different
between the patient groups and controls in both white and grey matter analyses of MD
means. MD comparison in the grey matter regions showed a decrease in the MD values of
the patient groups when compared with the controls, in contrast to the increase in MD
observed in the white matter regions. This correlates with similar findings in the 5 ROI
analysis (section 5.2.5).
Region White matter MD Grey matter MD
Right Left Right Left
Inferior frontal 0.578 0.477 0.754 0.878
Superior frontal 0.008 0.006 0.014 0.034
Temporal 0.082 0.227 0.771 0.969
Parieto-‐occipital 0.048 0.358 0.490 0.995
Occipital 0.087 0.392 0.377 0.864
Temporo-‐parietal 0.380 0.578 0.140 0.365
Parietal 0.099 0.123 0.123 0.028
Table 5.14: P-values obtained by performing the ANOVA test. A significant difference (p<0.05) in the mean diffusivity (MD) between group means (mild TBI, moderate TBI and controls) was demonstrated in both white and grey matter regions.
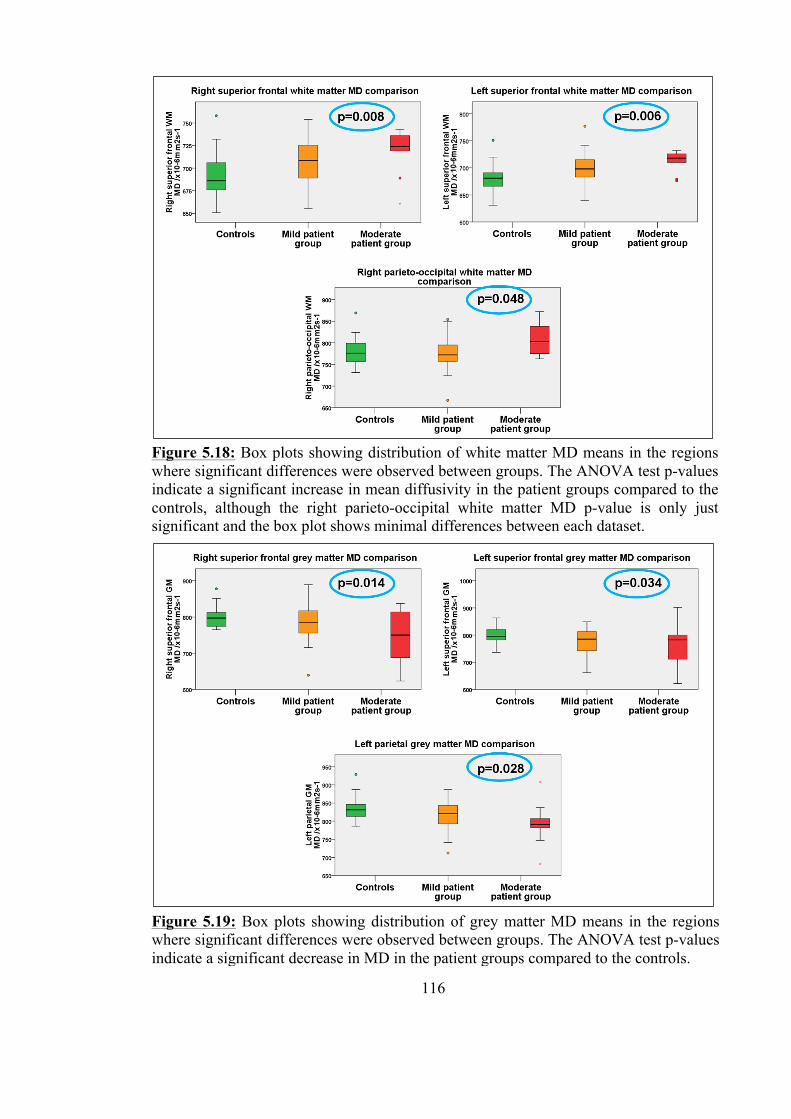
116
Figure 5.18: Box plots showing distribution of white matter MD means in the regions where significant differences were observed between groups. The ANOVA test p-values indicate a significant increase in mean diffusivity in the patient groups compared to the controls, although the right parieto-occipital white matter MD p-value is only just significant and the box plot shows minimal differences between each dataset.
Figure 5.19: Box plots showing distribution of grey matter MD means in the regions where significant differences were observed between groups. The ANOVA test p-values indicate a significant decrease in MD in the patient groups compared to the controls.
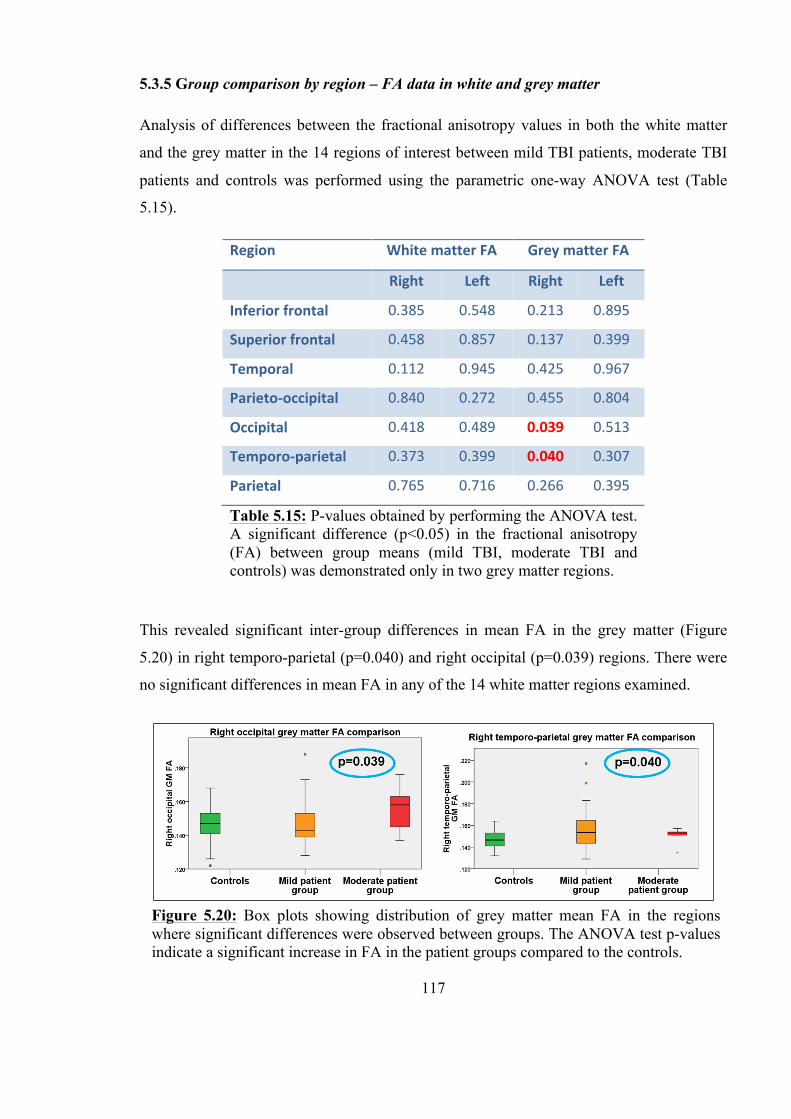
117
5.3.5 Group comparison by region – FA data in white and grey matter
Analysis of differences between the fractional anisotropy values in both the white matter
and the grey matter in the 14 regions of interest between mild TBI patients, moderate TBI
patients and controls was performed using the parametric one-way ANOVA test (Table
5.15).
This revealed significant inter-group differences in mean FA in the grey matter (Figure
5.20) in right temporo-parietal (p=0.040) and right occipital (p=0.039) regions. There were
no significant differences in mean FA in any of the 14 white matter regions examined.
Region White matter FA Grey matter FA
Right Left Right Left
Inferior frontal 0.385 0.548 0.213 0.895
Superior frontal 0.458 0.857 0.137 0.399
Temporal 0.112 0.945 0.425 0.967
Parieto-‐occipital 0.840 0.272 0.455 0.804
Occipital 0.418 0.489 0.039 0.513
Temporo-‐parietal 0.373 0.399 0.040 0.307
Parietal 0.765 0.716 0.266 0.395
Table 5.15: P-values obtained by performing the ANOVA test. A significant difference (p<0.05) in the fractional anisotropy (FA) between group means (mild TBI, moderate TBI and controls) was demonstrated only in two grey matter regions.
Figure 5.20: Box plots showing distribution of grey matter mean FA in the regions where significant differences were observed between groups. The ANOVA test p-values indicate a significant increase in FA in the patient groups compared to the controls.
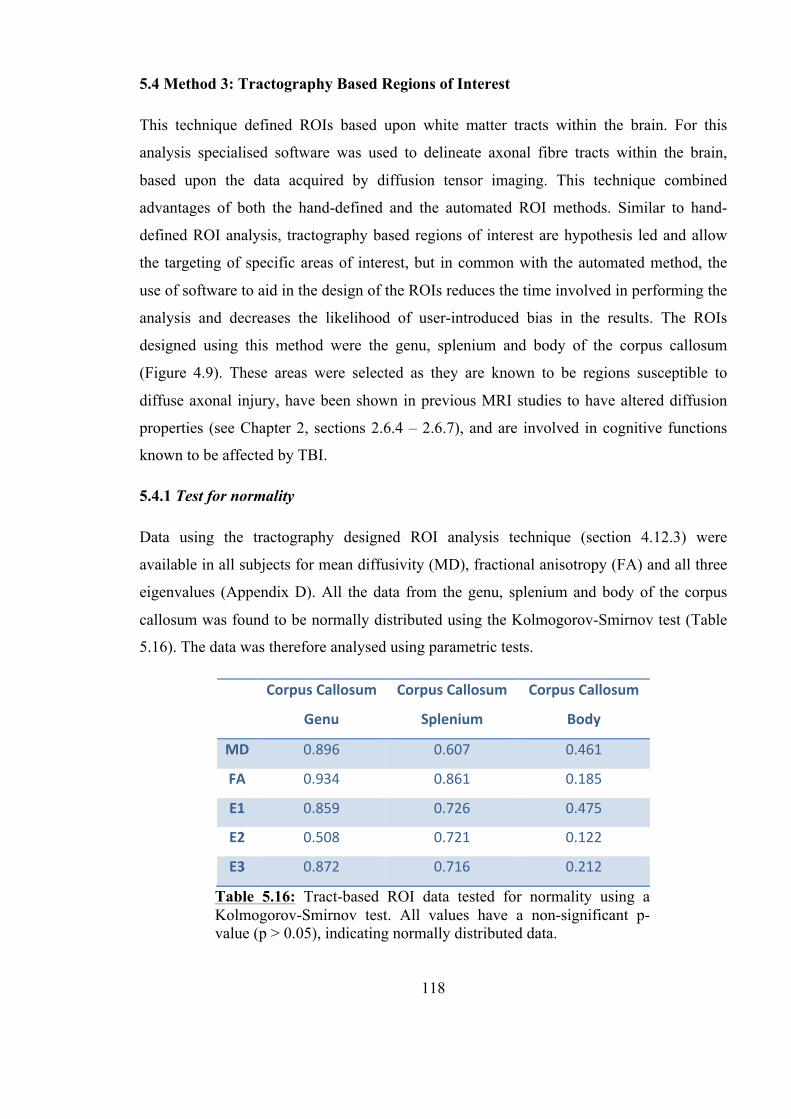
118
5.4 Method 3: Tractography Based Regions of Interest
This technique defined ROIs based upon white matter tracts within the brain. For this
analysis specialised software was used to delineate axonal fibre tracts within the brain,
based upon the data acquired by diffusion tensor imaging. This technique combined
advantages of both the hand-defined and the automated ROI methods. Similar to hand-
defined ROI analysis, tractography based regions of interest are hypothesis led and allow
the targeting of specific areas of interest, but in common with the automated method, the
use of software to aid in the design of the ROIs reduces the time involved in performing the
analysis and decreases the likelihood of user-introduced bias in the results. The ROIs
designed using this method were the genu, splenium and body of the corpus callosum
(Figure 4.9). These areas were selected as they are known to be regions susceptible to
diffuse axonal injury, have been shown in previous MRI studies to have altered diffusion
properties (see Chapter 2, sections 2.6.4 – 2.6.7), and are involved in cognitive functions
known to be affected by TBI.
5.4.1 Test for normality
Data using the tractography designed ROI analysis technique (section 4.12.3) were
available in all subjects for mean diffusivity (MD), fractional anisotropy (FA) and all three
eigenvalues (Appendix D). All the data from the genu, splenium and body of the corpus
callosum was found to be normally distributed using the Kolmogorov-Smirnov test (Table
5.16). The data was therefore analysed using parametric tests.
Corpus Callosum
Genu
Corpus Callosum
Splenium
Corpus Callosum
Body
MD 0.896 0.607 0.461
FA 0.934 0.861 0.185
E1 0.859 0.726 0.475
E2 0.508 0.721 0.122
E3 0.872 0.716 0.212
Table 5.16: Tract-based ROI data tested for normality using a Kolmogorov-Smirnov test. All values have a non-significant p-value (p > 0.05), indicating normally distributed data.

119
5.4.2 Group comparison – mean diffusivity
Mean diffusivity data was obtained for each of the three tractography defined ROIs: the
genu, splenium and body of the corpus callosum. The mean MD values for each ROI in the
mild TBI, moderate TBI and control groups were compared using the ANOVA test (Figure
5.21). No significant difference was observed between the MD means of each group in any
of the three ROIs analysed.
5.4.3 Group comparison – fractional anisotropy and eigenvalues
Fractional anisotropy data and data for each of the three eigenvalues was obtained for each
of the three tractography defined ROIs: the genu, splenium and body of the corpus
callosum. The mean FA values for each ROI in the mild TBI, moderate TBI and control
groups were compared using the ANOVA test (Figure 5.22). No significant difference was
observed between the FA means of each group in any of the three ROIs analysed.
Figure 5.21: Box plots showing distribution of white matter mean MD between the mild TBI group (orange), moderate TBI group (red) and control subjects (green). The ANOVA test p-values indicate no significant differences in MD in the patient groups compared to the controls in any of the three tractography defined ROIs.

120
The mean values for each eigenvalue in each ROI in the mild TBI, moderate TBI and
control groups were also compared using the ANOVA test and again there were no
significant differences found between the groups in any of the three ROIs analysed.
5.4.4 Sub-group comparison – mild TBI assessed by AAN grade
A sub-group analysis was conducted comparing mild TBI patients grouped according to
AAN grade (Table 5.1) and the control group, using the ANOVA test in the MD and FA
data and in the eigenvalue data. This analysis was performed for each of the three
tractography designed ROIs in white matter. No significant inter-group differences were
demonstrated.
Figure 5.22: Box plots showing distribution of white matter mean FA between the mild TBI group (orange), moderate TBI group (red) and control subjects (green). The ANOVA test p-values indicate no significant differences in FA in the patient groups compared to the controls in any of the three tractography defined ROIs.

121
5.5 Method 4: Tract Based Spatial Statistics (TBSS)
The fourth method used was a voxel-wise statistical analysis called ‘tract-based spatial
statistics’, and was again performed with specialised software, using the DTI data. This last
technique compared the mean fractional anisotropy of white matter tracts common to all
subjects with the individual patient’s values. TBSS combines the benefits of an automated
technique: it encompasses the whole brain white matter reducing the likelihood of missing
any areas where there is microstructural change and reduces the time required to analyse
the data. To a degree it is also hypothesis led, as TBSS examines white matter tracts, and
these commonly show damage as a result of the shearing forces of TBI (Chapter 1, section
1.10.3).
5.5.1 Group comparison – white matter tract fractional anisotropy
TBSS was used to carry out a voxel-wise t test comparison of mean white matter tract
fractional anisotropy (FA) values. It was not possible to perform an analysis with three
variables (ie: between the mild TBI patients, moderate TBI patients and control group) and
therefore this analysis was performed firstly between all TBI patients grouped together and
the controls subjects, and secondly between the mild TBI patients and the control subjects.
Comparison using the moderate group alone was not performed as the group size was felt
to be too small for this style of analysis. T test comparison of white matter tract FA means
of the whole TBI patient group with the control subjects revealed significant increases only
in small areas in the left superior region of the corona radiata (Figure 5.23). Further
analysis using a t test between mild TBI patients only and the control subjects revealed
similar significant increases in small areas in the left superior region of the corona radiata
(Figure 5.24).

122
Figure 5.23: Axial images created using TBSS showing the mean FA tract skeleton (green) and voxels in which the t test showed a significant difference (p<0.05) between the whole TBI patient group and the control group (red).
Figure 5.24: Axial images created using TBSS showing the mean FA tract skeleton (green) and voxels in which the t test showed a significant difference (p<0.05) between the mild TBI patient group and the control group (red).
123
5.6 Discussion
Analysis of the quantitative scan data in both grey and white matter revealed significant
findings in the TBI patient groups when compared to the control group. This was true of
data obtained using both the 5 ROI method and the 14 automated ROI method.
The first analysis method, using the 5 hand defined regions of interest was the most basic of
the analysis techniques. Used extensively in published work in this field, it had the benefit
of being hypothesis driven, and despite the method being a very time consuming process,
the ROIs were straight forward to create as they were simply drawn on to the scan slices
using specialised software.
5.6.1 Whole brain analysis
The largest and most crude of the 5 ROIs was the whole brain ROI; three-way group
comparison of the data obtained from this region showed no differences in the white matter
in any of the quantitative datasets being examined: qT1, qT2, MD or FA. For there to have
been detectable inter-group differences in these very large ROIs, the majority of the tissue
within the brains of the TBI patients would have had to have had differing quantitative
values, or the magnitude of existing values would have to have been different to such an
extent that the diluting effect of including the entire brain would have been cancelled out.
With this in mind, the fact that the 3-way group comparison of whole brain grey matter qT1
data showed a significant inter-group difference implies that there was sufficient change in
qT1 time in the patient groups compared with that in the control group to allow a difference
to be observed. This was not the case however, in any of the other grey matter quantitative
datasets under scrutiny (qT2, MD or FA).
Analysis of this whole brain grey matter qT1 finding to assess where the inter-group
significance lay revealed that there was a detectable increase in both patient groups when
compared to the control group, but that there was no significant difference between the mild
and moderate patient groups. This suggests that if the observed qT1 increase was due to the
TBI sustained, that the increase may not be proportional to the severity of injury sustained.
Of course, other explanations may be either that the moderate TBI group sample size may
have been too small for a difference between that group and the mild TBI patients to have
been significant, or it may be that the patient group classification method: mild or moderate
124
according to admitting GCS may not have accurately represented the true severity of
microstructural damage sustained.
5.6.2 Analysis by AAN grade
Sub-group analysis of the mild TBI patient group after classifying them using the American
Academy of Neurology concussion grading scale revealed no significant inter-group
differences in whole brain grey matter or white matter in any of the quantitative scan
datasets. While it appeared that the increase in grey matter quantitative T1 time in the mild
TBI patients compared to the control group was reaching significance (p=0.071), the trend
of the group means was not consistent: the mean whole brain grey matter qT1 value in the
AAN grade II mild TBI patients was lower than that of the mean in the AAN grade I group
(Figure 5.10). If the observed increase in qT1 time in the grade I patients compared to the
controls was a result of underlying changes in the grey matter due to the sustained TBI, and
if as hypothesised those changes were linked to the symptoms experienced by the patients,
it would not fit that the grade II patients with longer lasting symptoms had a lower mean
qT1 time than grade I patients whose symptoms had all resolved by 15 minutes. This
unexpected disparity could not be explained by a difference in group numbers, as the mild
TBI patients classed as grade I numbered 7, and those classed as grade II numbered 10.
However, this highlights the fact that the numbers in each group were small, and it may be
that with greater numbers, the trend would have been of a consistent increase in qT1 time in
proportion to AAN grade severity.
5.6.3 Analysis of regions remote from any visible lesion
When brain tissue was analysed in ROIs remote from any visible lesions, after those lesions
had been extracted from the data, once again it was only the grey matter qT1 mean that
showed significant inter-group differences using the 3-way ANOVA analysis. Further
examination of the box plot showed that although the mild TBI group mean was greater
than that of the control group, the moderate TBI group mean and inter-quartile range were
lower than that of the mild TBI group, and almost identical to the mean and inter-quartile
range of the control group (Figure 5.10). Interestingly, post hoc paired analysis performed
using a t test showed no inter-group differences at all. These results either indicate that no
damage existed in brain tissue remote from any visible lesion in these patients or, perhaps
125
more likely, that the 5 ROI analysis technique was not sensitive enough to identify existing
microstructural damage remote from visible lesions.
5.6.4 Analysis of regions adjacent to any visible lesion
Unsurprisingly, analysis of areas close to the extracted visible lesions revealed differences
in more than one quantitative dataset: both in grey matter qT1 and in grey matter MD. It is
reasonable to assume that the most likely visually normal regions to have detectable
quantitative abnormalities would be those regions adjacent to existing visible damage.
These ‘ipsilateral to visible damage’ ROIs showed an increase in grey matter qT1 time and
a decrease in grey matter mean diffusivity, although these differences were not consistently
found between the same groups. The hemisphere grey matter qT1 increase was only
significant between the mild TBI group and the controls; once again this may be due to the
small moderate TBI group sample size, although the difference between the hemisphere
grey matter qT1 values between the moderate TBI group and the control group was
sufficient for the inter-quartile ranges of each group not to overlap (Figure 5.12). The
significant decrease in grey matter mean diffusivity was observed only in the moderate TBI
patient group, and although the box plots indicated a reduction in MD values between the
mild TBI group and the controls, this did not reach significance (Figure 5.13 A).
5.6.5 Fourteen automated ROI technique findings
The 14 automated ROI technique, while still dividing the brain into relatively arbitrary
regions, showed a number of benefits. Firstly, as the process was automated, the analysis
took less time than when using the 5 ROI technique. Secondly, when the 14 regions were
combined, they covered the entire brain volume ensuring that no regions were left
unexamined. Lastly, the ROIs themselves were smaller and less crude than those in the 5
ROI analysis. This meant that they were more likely to yield significant findings, where
they existed, by reducing the data ‘dilution’. However, there was also a theoretical
disadvantage to using this method, in that by moving to smaller ROIs, the analysis risked
not identifying features common to the whole brain, since local variations near the site of
impact would become more prominent. A further disadvantage to using this technique, and
one addressed in the chapter reporting the scan data findings in relation to the
126
neuropsychology test scores, is the issue of multiple analyses. When the number of ROIs
under analysis increases, Bonferroni corrections should be made to ensure that any
significant findings are not a result of chance alone. If a very large number of ROIs are
being analysed, the adjusted significant p-value can become so low, that none of the
findings appear significant.
Analysis of the data using the automated 14 ROI method revealed similar findings to the 5
ROI method: significant differences between TBI patients and the control group in ROIs in
the qT1 and MD datasets. In addition, there were also significant findings in the grey matter
FA in two of the fourteen regions. There were no significant findings in the qT2 data, in
either grey matter or white matter, or in the white matter FA.
Contrary to the findings in the 5 ROI analysis, the differences observed in qT1 and MD
were present in the white matter regions as well as in the grey matter. Both white and grey
matter qT1 datasets showed significant differences in around half of the 14 ROIs, six
regions were significant in the white matter qT1 comparison, and seven regions were
significant in the grey matter qT1 comparison. Five of these ROIs were the same in each
tissue type, ie: they showed significant increases in both grey matter and white matter qT1.
The significant ROIs were also predominantly left sided, which correlates with the
laterality of the majority of the visible lesions in both the mild and moderate TBI groups,
and suggests that at the very least, the 14 automated ROI technique was sufficiently
sensitive to detect changes in normal appearing tissue adjacent to lesions detected by visual
analysis of the T1 weighted anatomical scans.
The mean diffusivity data showed differences between the TBI patient groups and the
control group in left-sided and right-sided superior frontal regions in both white and grey
matter. The significant grey matter FA findings were in the right occipital and right
temporo-parietal regions. These regions together project into the centre of the brain and
include the majority of the deep grey matter structures.
The fact that white matter changes were observed between groups in the 14 ROI analysis,
and not from data obtained using the larger user-defined 5 ROI method may be due to the
fact that the diluting effect of calculating a mean value from all the voxels within larger
ROIs would have been reduced by calculating the mean from fewer voxels in the smaller
ROIs in the automated method. By employing the automated 14 ROI method which
127
reduced the size of the ROIs into which the whole brain was divided, smaller regions of
microstructural change have been identified where using the 5 ROI technique they had not
been evident.
5.6.6 Findings in qT1 and qT2 data
The findings of increased grey matter and white matter qT1 values in this study support
other work which has found similar increases in both experimental and clinical TBI. Naruse
et al. (1982) studied the effects of vasogenic and cytotoxic oedema on qT1 and qT2 times
in a rat model and found that in vasogenic oedema there was an increase in qT1 time in
grey and white matter, and in cytotoxic oedema an increase in qT1 time in white matter
only. The increase in qT1 they observed in vasogenic oedema occurred after 24 hours and
was detectable for 6 days. Although the work by Naruse et al. was performed in rats, the
findings of this study are similar: an increase in grey matter qT1 within the acute and
subacute phase of TBI. Therefore, the observed difference in this work may have been due
to the presence of vasogenic oedema, although if such a consistent qT1 increase in both
grey and white matter frontal regions were due to oedema, one might expect to see visible
evidence of this on the T1 weighted anatomical images, and this was not the case; any areas
with visible oedema had deliberately been masked off and extracted from the data. It
follows that if vasogenic oedema was the cause of the rise in tissue qT1 time in this work, it
would have had to have been at a level undetectable by visual T1 image evaluation.
Sibson et al. (2008) put forward the idea that qT1 increases they observed both in low-flow
ischaemia and separately in induced excitotoxicity in an experimental animal model, were
due to the acute activation of astrocytes, as this process had been found to be common to
both pathological processes. Astrocyte activation is known to occur in brain injury within
the acute phase, and is therefore likely to be a contributory factor to the observed qT1
increase in this work (Morganti-Kossmann et al., 2007). This finding would support the
conclusions in a paper by Garnett et al. (2001b) which examined seven patients in the
subacute stage after moderate and severe TBI using MR spectroscopy. The authors found
that there was a decrease in N-acetylaspartate and an increase in choline compounds in the
brain injured patients, and attributed these changes to a reduction in neuronal population
and an increase in the astrocyte population respectively, as choline compounds had
128
previously been shown to be increased in regions with greater numbers of astrocytes
(Garnett et al., 2001b, cited McBride et al., 1995).
There were no significant differences in the quantitative T2 time in any of the ROIs
evaluated in this work, whether in grey or white matter. This finding was in contrast to the
experimental work by Naruse et al. who found an increase in white matter qT2 with
induced TBI causing vasogenic and cytotoxic oedema, and also in contrast to work by
Mamere et al. (2009) who found an increase in T2 relaxation time in normal appearing
brain white matter and in the corpus callosum in patients with moderate and severe TBI.
They hypothesised that the observed qT2 changes reflected an increase in water
concentration secondary to axonal loss, and claimed that this theory was supported by their
associated finding of an increased apparent diffusion coefficient in the same regions.
However, it must be noted that they studied moderate and severe TBI patients a mean of 3
years after injury, and it is therefore possible that their observed qT2 values are a feature
only of more severe TBI in the chronic phase, and do not occur in mild TBI acutely.
The absence of T2 findings in this work is supported by the study by Goetz et al (2004).
They studied 23 patients of mixed TBI severity within an injury to scan time comparable to
that in this study (mean 7.6 days), and found no significant increase in qT2 relaxation time
in the patient group when compared to 13 controls, and no correlation between qT2 time
and injury severity. They explained the lack of qT2 findings on the fact that T2 relaxation
changes after diffuse axonal injury were known to be small and inconsistent (Goetz et al.,
2004, cited Pierpaoli et al., 2001). If this were the case, positive findings might have been
expected in the 14 automated ROI analysis, as the ROIs used in that method were smaller.
Given that there were no significant findings, even the ROIs in this method may have been
too large to detect qT2 changes.
5.6.7 Findings in DTI data
The majority of studies using DTI in TBI have shown an increase (although some observed
an initial reduction) in mean diffusivity or apparent diffusion coefficient in white matter
post TBI. However, in keeping with the results from this work, two studies extending their
analyses to include cortical grey matter have observed a reduction in localised diffusion, in
TBI patients with a similar injury to scan time as in this study (Hou et al., 2007, Newcombe
et al., 2008). Hou et al. observed a significant decrease in peripheral grey matter apparent
129
diffusion coefficient (a similar value to mean diffusivity, see Chapter 2, section 2.5) when
they compared 35 mild, moderate and severe TBI patients with 35 control subjects,
although they showed an increase in all other regions examined. They were uncertain as to
the cause of this reduction, but suggested that it may be a result of contusional rather than
axonal injury, perhaps implying that localised peri-contusional oedema was responsible for
their results. Newcombe et al. also observed a significant decrease in ADC in the cortical
grey matter of 22 moderate and severe TBI patients scanned within a mean of 28 hours of
injury, when compared to 25 matched controls. They attribute this reduction in diffusion to
the presence of cytotoxic oedema which may have increased the volume of intracellular
fluid, thereby restricting the diffusion of the extracellular fluid. As extracellular fluid is
more easily diffusible than intracellular fluid, this would have resulted in a net reduction in
diffusion, and therefore account for the decrease in ADC. It should be noted that the
findings of both these studies were in TBI patients with moderate and severe injuries, and
despite the fact that the significant reduction in grey matter MD was only present in the
moderate TBI patients in this study, the box plots in figure 5.12 show that the mean and
inter-quartile range of the mild TBI group was also below those of the control group. This
may indicate that there are similar, but less severe changes occurring in mild TBI patients.
In the 5 ROI analysis this decrease in grey matter mean diffusivity was only observed in the
analysis of ROIs adjacent to any visible lesions, and therefore it may indicate that existing
TBI damage extends at a microstructural level beyond the visible boundaries of contusions
or oedema seen on conventional imaging, into the surrounding normal appearing tissue.
This may signify more extensive tissue disruption than had previously been appreciated in
such TBI cases; possibly the debated ‘penumbra’ around an intracerebral haematoma which
describes a circumference of disrupted but viable tissue around the visible central area of
irrecoverable cell damage (Kirkman, 2011). It has been shown previously in an MRI study
of spontaneous intracerebral haematoma (ICH), that the apparent diffusion coefficient
(ADC) was not altered around the ICH compared to normal tissue in the contralateral
hemisphere (Schellinger et al., 2003), and although the cause of the ICH in their study
group was spontaneous and not traumatic, it is unlikely that this difference in aetiology
alone would account for a measurable difference in mean diffusivity in our study group,
where none had been shown in their patients.
130
The 5 ROI analysis method produced no white matter changes of significant magnitude
that they were detectable using these large ROIs, and this is in contrast to the expected
results, and those published by other authors using similar analysis techniques. Newcombe
et al. (2007) studied 33 moderate and severe TBI patients within 1 week of their injury, and
compared the scan data to that of 28 matched controls. They used a whole brain white
matter ROI and found a significant increase in ADC (the measurement comparable to mean
diffusivity) and a reduction in fractional anisotropy (FA). There were no such significant
whole brain white matter findings in this work, despite having similar study numbers and
scanning within a similar time-frame. This may be due to the less severe injuries sustained
by the predominantly mild TBI patient group. However, analysis of the 14 automated ROI
data showed that there were significant white matter differences in the patient groups when
compared to the control subjects, both in the quantitative T1 values and in the mean
diffusivity. As mentioned above, this pointed to the lack of results in the 5ROI data being
due simply to the fact that those ROIs had been too large to detect the changes.
In the data analysed using the automated 14 ROI technique, the increase in white matter
MD in both superior frontal regions is supported by previously published work in the field,
although the lack of any observed change in FA in similar regions, specifically no decrease
in FA, was unusual. A number of papers have analysed TBI using diffusion tensor imaging,
and irrespective of the type of analysis technique employed involved, whether user defined
ROIs, whole brain ROIs, or voxel-based morphometry, have found an increase in MD and
an associated decrease in FA. Lipton et al. (2009) performed a voxel-wise analysis on 20
mild TBI patients within two weeks of injury, and observed an increased MD and
decreased FA in a number of white matter regions, five of which were in the frontal lobes,
compared to 20 matched control subjects. Inglese et al. (2005) performed DTI in 20 mild
TBI patients a mean of 4 days after injury, and 26 mild TBI patients a mean of 5.7 years
after injury, using whole brain histogram analysis and manual ROI placement. While they
did not report any significant findings in their whole brain data, they found an increased
MD and reduced FA in the corpus callosum and internal capsule in both the acute and
chronic TBI patients, and postulated that the findings were due to a loss of axonal structural
integrity caused by diffuse axonal injury. Similar findings were published in 2009, where
Kumar et al. (2009) reported increased MD and decreased FA in the genu of the corpus
callosum in moderate TBI patients analysed a mean of 8.9 days after injury using a semi-
131
automated analysis technique. The authors also found a positive correlation between genu
MD and cognitive performance in both mild TBI and in moderate TBI patients; although
they note that their findings were less widespread in the mild TBI patients.
Although some of these papers have included frontal white matter ROIs and whole brain
analysis, as can be seen from the descriptions of the findings above, the majority of
previous analysis has been targeted on the white mater tracts known to be affected by the
shearing forces involved in TBI: the corpus callosum, internal and external capsule. For this
reason, the tractography designed ROIs of the genu, splenium and body of the corpus
callosum were included in the data analysis in this work. Based on the hypothesis that these
areas are particularly susceptible to damage, examination of the ROIs ought to have
revealed positive findings, but they did not. MD and FA values in the genu, splenium and
body of the corpus callosum showed no difference between the mild and moderate TBI
groups and the control subjects. This finding was not altogether unexpected, as diffusion
studies in these regions have shown conflicting results in similar patient groups to those in
this work. A number of papers have demonstrated a decrease in FA in the genu, body and
splenium of the corpus callosum (Huisman et al., 2004, Inglese et al., 2005, Kumar et al.,
2009, Lipton et al., 2009, Ljungqvist et al., 2011, Matsushita et al., 2011, Perlbarg et al.,
2009) attributed to shearing injuries to the axons causing tract disruption. This FA
reduction has been shown to correlate with outcome at discharge (Huisman et al., 2004),
outcome at 1 year (Perlbarg et al., 2009) and with executive function (Lipton et al., 2009).
Other papers have shown the opposite: an increase in FA in the corpus callosum, attributed
to the presence of axonal cytotoxic oedema as a result of TBI (Bazarian et al., 2007, Chu et
al., 2009, Mayer et al., 2010, Wilde et al., 2008). One recent paper e-published ahead of
print (Lange et al., 2011) reports no significant MD or FA differences in the corpus
callosum in 60 mild TBI patients compared with 34 control subjects, and no correlation
between corpus callosum diffusion measures and post-concussive symptoms. The work by
Lange et al. is perhaps most similar to this work in terms of patient population studied, and
supports the findings in this study in the corpus callosum ROIs. It must be noted that there
were methodological differences, both regarding the type of data analysis performed and in
the time from injury to scan, which was subacute (6 to 8 weeks post-injury).
It is difficult to explain why there was an observed increase in frontal white matter MD, but
no associated observed decrease in the FA. It is possible that the MD increase was due to
132
axonal disruption, but that the disruption occurred in areas where fibres were not rigidly
arranged in straight tracts, perhaps in regions where fibre bundles were crossing one
another, or turning through larger angles. Shearing of axons in these areas would still give
an increase in MD, as water molecules would be free to traverse regions where there had
previously been intact myelin sheaths, and MD is a measure of an average change in
diffusion, not a directional measure. However, as FA is calculated from eigenvectors which
are direction dependant, if there were sufficient crossing fibres then any change in FA in
one direction as a result of axonal shearing would be cancelled out by a similar FA change
in another direction. The ROIs in which the white matter MD increases were detected
included both superior frontal regions, which include not only projection fibres (between
the cortex and sub-cortical structures) such as the corticopontine and corticobulbar tracts,
the anterior region of the corona radiata, the superior thalamic radiation and the cingulum,
but also the commissural fibres (between one hemisphere and another) of the genu of the
corpus callosum and short association fibres between adjacent areas of cortex . It is entirely
feasible that even if a number of fibres within those tracts were disrupted, causing a small
change in FA values, crossing fibres from other tracts may have cancelled out these
differences. The findings in the corpus callosum ROIs would support this theory as they
showed neither significant MD nor FA findings. As the tracts in those areas are not crossed
by others and run a relatively straight course, if there had been an increase in MD observed
in these regions without an observed decrease in FA, it would have implied that the lack of
FA findings was due to some other reason. The fact that there were no corpus callosum DTI
findings in this work indicated that in this predominantly mild TBI patient group, there was
not a sufficient degree of damage in these regions to allow detection.
The last section of this discussion concerns the results from the TBSS voxel-wise analysis,
which was the most targeted of all the analysis techniques employed. By restricting the
regions under observation to fibre skeletons in the centre of the white matter tracts common
to all subjects, this method was most likely to identify significant findings if they existed.
Inter-group comparison between the entire TBI patient group and the control subjects
revealed only a very small significant area of increased FA in the left superior region of the
corona radiata. This finding was also observed when only the mild TBI patients were
compared to the control group. These observations underline the results from the other
analysis techniques employed, and explain why there were no changes observed in FA in
133
the other ROIs. A significant FA increase in such a small region would have been rendered
undetectable by the averaging of the surrounding FA values in all but the smallest and most
precisely placed of ROIs. The fact that there was a detectable FA increase using this
method, implies that in the mild TBI group, even though the injuries sustained were
insufficient to severely affect the conscious level of the patients, they still involved
sufficient force to cause microstructural change in the corpus callosum. Indeed, it is likely
that there were other white matter tract regions affected in individual patients within the
group, but that any change in quantitative values was cancelled out by the lack of such
detectable change in others.
5.7 Limitations
The main limitations in the scan data analysis section of the study were due to the size of
the ROIs, both in the 5 ROI and 14 automated ROI methods. They were large and relatively
crude, able only to detect difference in quantitative values sufficient to alter the means in
those ROIs by a significant degree. As a result, it may be that more subtle or localised
quantitative findings have been missed. This failing would hold true of the qT1 and qT2
data, as these were not obtained in the tract-based ROIs and nor were they available from
the voxel-wise analysis. This problem was addressed in part for the MD and FA data,
which were analysed using the tract-based ROIs, although again, the MD data was not
available from the voxel-wise analysis. The tract-based ROIs, while more targeted, still
required user-input and therefore were susceptible to bias during their design.
It must be noted that a greater number of the visible lesions identified either on CT or T1
weighted anatomical MR were left sided, and although all visible lesions were masked out
and extracted from the data, this discrepancy may have introduced bias into the results in
the 14 automated ROI analysis, as a greater number of significant inter-group differences in
the qT1 data were observed in the regions on the left side, although the opposite was in fact
true of the FA data, which only showed significant differences in right sided regions, and
significant findings in the MD data were divided equally between the left and right
hemispheres. It is even less likely to have affected the other analyses, as the 5 ROI data
was analysed according to whether it was ipsilateral or contralateral to any extracted visible
134
lesion, and the tractography designed ROI analysis only involved regions in the centre of
the brain.
It is also possible that the data was affected by the difference in injury to scan time in the
patient group. As discussed in section 4.7.3, the window from injury to scan was initially
set at 3-7 days, but as recruitment started it became apparent that this was overly ambitious,
predominantly as a result of the scanner location being away from the immediate clinical
area, which meant that patients were often still too unwell to be scanned. In order to allow
for these moderately injured patients to become more stable, and therefore to be fit enough
to be transferred to the scanner and back to the ward, the maximum time allowed from
injury to scan was increased to 14 days. However, all of the patients were scanned within
the allowed 14 days, the majority much sooner in fact, and the result was still a patient
group scanned within a relevant acute time period where changes ought to have been
detectable.
135
5.8 Conclusions
5.8.1 Ability of quantitative MR scanning to detect microstructural changes
This study has revealed an increase in quantitative T1 relaxation time in whole brain
normal appearing grey matter in mild and moderate TBI patients within two weeks of
injury, when compared to matched control subjects. The ROI analysis findings have also
demonstrated frontal lobe changes in normal appearing tissue in the patient groups,
specifically an increase in both grey and white matter qT1 time, an increase in white matter
mean diffusivity, a decrease in grey matter mean diffusivity, and a small area in the left
superior region of the corona radiata that was shown to have an increased FA. There were
no observed differences in quantitative T2 relaxation time. These findings support the first
of the study hypotheses:
“Acute differences exist at a microstructural level between
patients with traumatic brain injury and matched control subjects that
are detectable using quantitative MR scanning, in tissue appearing
normal on conventional anatomical MR imaging.”
Although it cannot be said for definite what these observed changes in the quantitative
values represent, based on the discussion of previous work in the field, it is possible that the
increase in grey and white matter qT1 time is indicative of ongoing diffuse vasogenic
oedema and astrocyte activation as part of the autoimmune response following traumatic
brain injury. The reduction in grey matter MD may represent peri-contusional damage, as
the majority of visible damage seen on the T1 weighted scans (and then extracted) was
cortical, whether as a result of an extra-axial haematoma pressing on the brain surface, or
due to contusions in the cortex itself. The reduction in grey matter MD may therefore be
due to areas of ongoing ischaemia and cell necrosis adjacent to these cortical lesions, or
possibly cytotoxic oedema, where the relative increase in intracellular fluid and reduction
in extracellular fluid would cause reduced free diffusion. The increase in white matter MD
is most likely to be due to axonal disruption causing a reduction in the restriction of micro-
136
movement of water molecules, although the lack of associated FA findings weakens this
theory.
It is likely that if data from each individual patient had been analysed with respect to the
mean values from the control group, that more significant differences would have been
found, particularly with respect to those with mild TBI. By grouping all of the mild TBI
patients together, the data from those with less severe injuries may have cancelled out the
findings in those with more severe injuries. By performing further analysis, assessing
correlations between the scan data and the neuropsychology test results, it was hoped that
the data would not be affected by those mild TBI patients whose injury was so mild as to
render them asymptomatic.
5.8.2 Relationship between detectable microstructural changes and brain injury severity
Post-hoc inter-group analysis using a t test on the data obtained using the 5 ROI analysis
method, revealed that different quantitative datasets were able to differentiate between
different study groups. For instance, the whole brain grey matter qT1 data showed
significant differences between the control group and each of the TBI groups (mild and
moderate), but was not able to differentiate between the patient groups themselves. The
grey matter qT1 time in the hemisphere ipsilateral to any extracted visible injury showed a
significant difference between the mild TBI group and control subjects, but not between the
moderate TBI group and controls.
In contrast, the grey matter mean diffusivity in the hemisphere ipsilateral to any extracted
visible injury showed no significant difference between the mild TBI group and control
subjects, but did show a difference between the moderate TBI group and controls. No data
from any of the regions in the 5 ROI analysis was able to differentiate between the mild
TBI and moderate TBI groups, presumably due to the small number of moderate TBI
patients, and due to the relatively broad range of injury severity seen in the mild TBI group:
from those patients who were almost asymptomatic to a number who displayed a large
number of post-concussive symptoms.
Therefore, although the trends shown in the data suggest that with a greater number of
moderate TBI patients a significant difference between patient groups would be apparent,
as a result of the lack of significant differences shown between the quantitative scan data
137
values in the mild and moderate TBI patient groups, the findings do not support the second
of the study hypotheses:
“Detectable microstructural changes in the TBI population are
proportional to the severity of the brain injury sustained, as defined by GCS.”
It must be noted that this hypothesis is based upon the severity of brain injury according to
the GCS score of the patients upon admission, which although easily reproducible and
known to correlate with TBI outcome, does not necessarily reflect the degree of post-
concussive symptoms suffered by those with mild TBI. By examining the scan data for
correlations with scores from the neuropsychology tests, it was anticipated that detected
microstructural changes would, in fact, be related to the severity of cognitive function
impairment, and this is the topic of the next chapter.
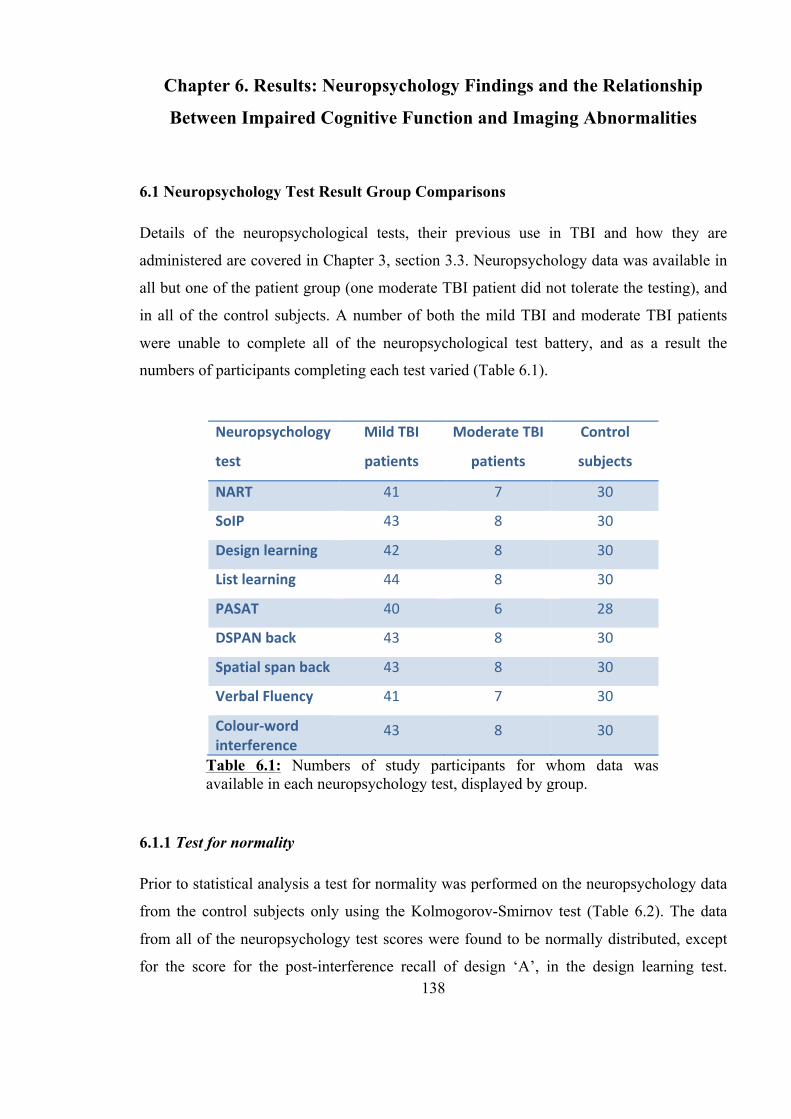
138
Chapter 6. Results: Neuropsychology Findings and the Relationship
Between Impaired Cognitive Function and Imaging Abnormalities
6.1 Neuropsychology Test Result Group Comparisons
Details of the neuropsychological tests, their previous use in TBI and how they are
administered are covered in Chapter 3, section 3.3. Neuropsychology data was available in
all but one of the patient group (one moderate TBI patient did not tolerate the testing), and
in all of the control subjects. A number of both the mild TBI and moderate TBI patients
were unable to complete all of the neuropsychological test battery, and as a result the
numbers of participants completing each test varied (Table 6.1).
6.1.1 Test for normality
Prior to statistical analysis a test for normality was performed on the neuropsychology data
from the control subjects only using the Kolmogorov-Smirnov test (Table 6.2). The data
from all of the neuropsychology test scores were found to be normally distributed, except
for the score for the post-interference recall of design ‘A’, in the design learning test.
Neuropsychology
test
Mild TBI
patients
Moderate TBI
patients
Control
subjects
NART 41 7 30
SoIP 43 8 30
Design learning 42 8 30
List learning 44 8 30
PASAT 40 6 28
DSPAN back 43 8 30
Spatial span back 43 8 30
Verbal Fluency 41 7 30
Colour-‐word interference
43 8 30
Table 6.1: Numbers of study participants for whom data was available in each neuropsychology test, displayed by group.
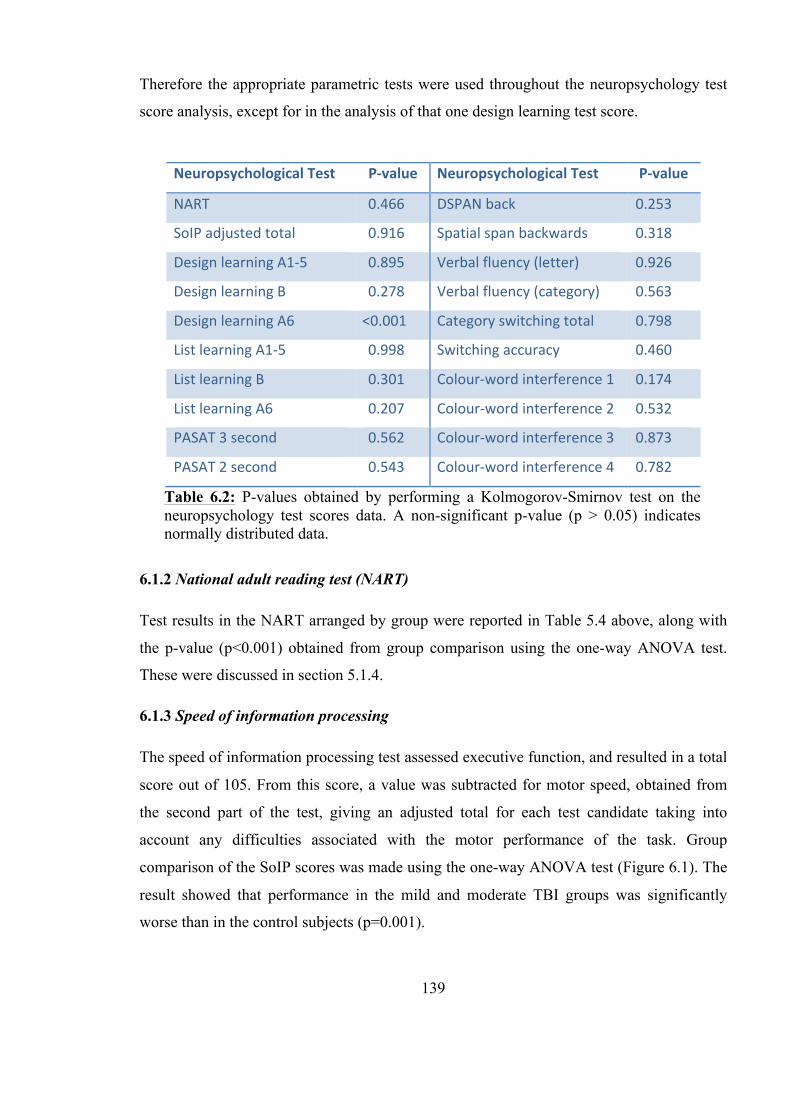
139
Therefore the appropriate parametric tests were used throughout the neuropsychology test
score analysis, except for in the analysis of that one design learning test score.
6.1.2 National adult reading test (NART)
Test results in the NART arranged by group were reported in Table 5.4 above, along with
the p-value (p<0.001) obtained from group comparison using the one-way ANOVA test.
These were discussed in section 5.1.4.
6.1.3 Speed of information processing
The speed of information processing test assessed executive function, and resulted in a total
score out of 105. From this score, a value was subtracted for motor speed, obtained from
the second part of the test, giving an adjusted total for each test candidate taking into
account any difficulties associated with the motor performance of the task. Group
comparison of the SoIP scores was made using the one-way ANOVA test (Figure 6.1). The
result showed that performance in the mild and moderate TBI groups was significantly
worse than in the control subjects (p=0.001).
Neuropsychological Test P-‐value Neuropsychological Test P-‐value
NART 0.466 DSPAN back 0.253
SoIP adjusted total 0.916 Spatial span backwards 0.318
Design learning A1-‐5 0.895 Verbal fluency (letter) 0.926
Design learning B 0.278 Verbal fluency (category) 0.563
Design learning A6 <0.001 Category switching total 0.798
List learning A1-‐5 0.998 Switching accuracy 0.460
List learning B 0.301 Colour-‐word interference 1 0.174
List learning A6 0.207 Colour-‐word interference 2 0.532
PASAT 3 second 0.562 Colour-‐word interference 3 0.873
PASAT 2 second 0.543 Colour-‐word interference 4 0.782
Table 6.2: P-values obtained by performing a Kolmogorov-Smirnov test on the neuropsychology test scores data. A non-significant p-value (p > 0.05) indicates normally distributed data.
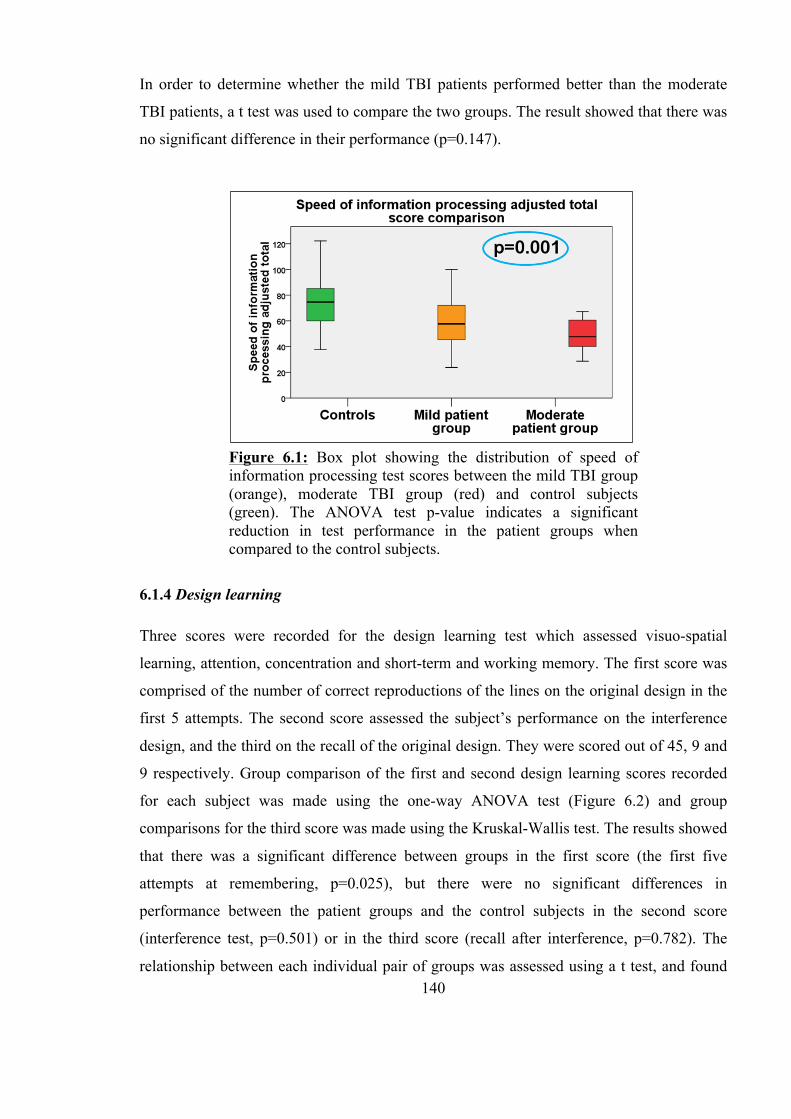
140
In order to determine whether the mild TBI patients performed better than the moderate
TBI patients, a t test was used to compare the two groups. The result showed that there was
no significant difference in their performance (p=0.147).
6.1.4 Design learning
Three scores were recorded for the design learning test which assessed visuo-spatial
learning, attention, concentration and short-term and working memory. The first score was
comprised of the number of correct reproductions of the lines on the original design in the
first 5 attempts. The second score assessed the subject’s performance on the interference
design, and the third on the recall of the original design. They were scored out of 45, 9 and
9 respectively. Group comparison of the first and second design learning scores recorded
for each subject was made using the one-way ANOVA test (Figure 6.2) and group
comparisons for the third score was made using the Kruskal-Wallis test. The results showed
that there was a significant difference between groups in the first score (the first five
attempts at remembering, p=0.025), but there were no significant differences in
performance between the patient groups and the control subjects in the second score
(interference test, p=0.501) or in the third score (recall after interference, p=0.782). The
relationship between each individual pair of groups was assessed using a t test, and found
Figure 6.1: Box plot showing the distribution of speed of information processing test scores between the mild TBI group (orange), moderate TBI group (red) and control subjects (green). The ANOVA test p-value indicates a significant reduction in test performance in the patient groups when compared to the control subjects.
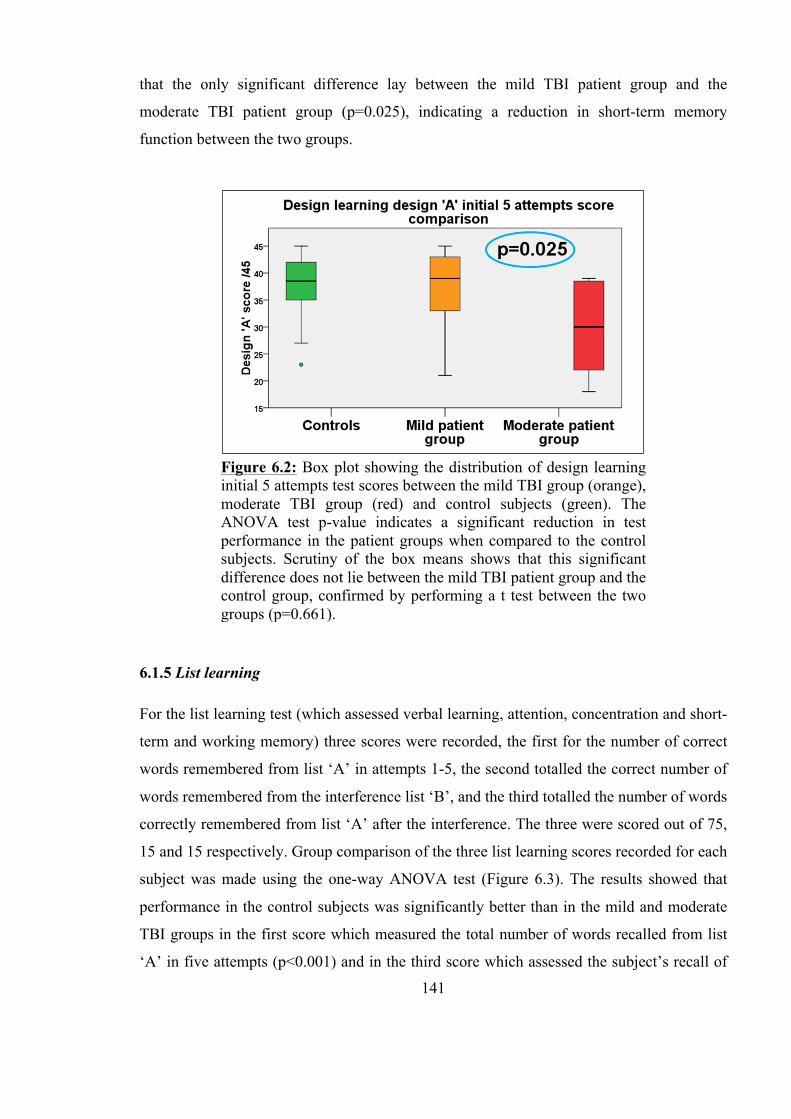
141
that the only significant difference lay between the mild TBI patient group and the
moderate TBI patient group (p=0.025), indicating a reduction in short-term memory
function between the two groups.
6.1.5 List learning
For the list learning test (which assessed verbal learning, attention, concentration and short-
term and working memory) three scores were recorded, the first for the number of correct
words remembered from list ‘A’ in attempts 1-5, the second totalled the correct number of
words remembered from the interference list ‘B’, and the third totalled the number of words
correctly remembered from list ‘A’ after the interference. The three were scored out of 75,
15 and 15 respectively. Group comparison of the three list learning scores recorded for each
subject was made using the one-way ANOVA test (Figure 6.3). The results showed that
performance in the control subjects was significantly better than in the mild and moderate
TBI groups in the first score which measured the total number of words recalled from list
‘A’ in five attempts (p<0.001) and in the third score which assessed the subject’s recall of
Figure 6.2: Box plot showing the distribution of design learning initial 5 attempts test scores between the mild TBI group (orange), moderate TBI group (red) and control subjects (green). The ANOVA test p-value indicates a significant reduction in test performance in the patient groups when compared to the control subjects. Scrutiny of the box means shows that this significant difference does not lie between the mild TBI patient group and the control group, confirmed by performing a t test between the two groups (p=0.661).
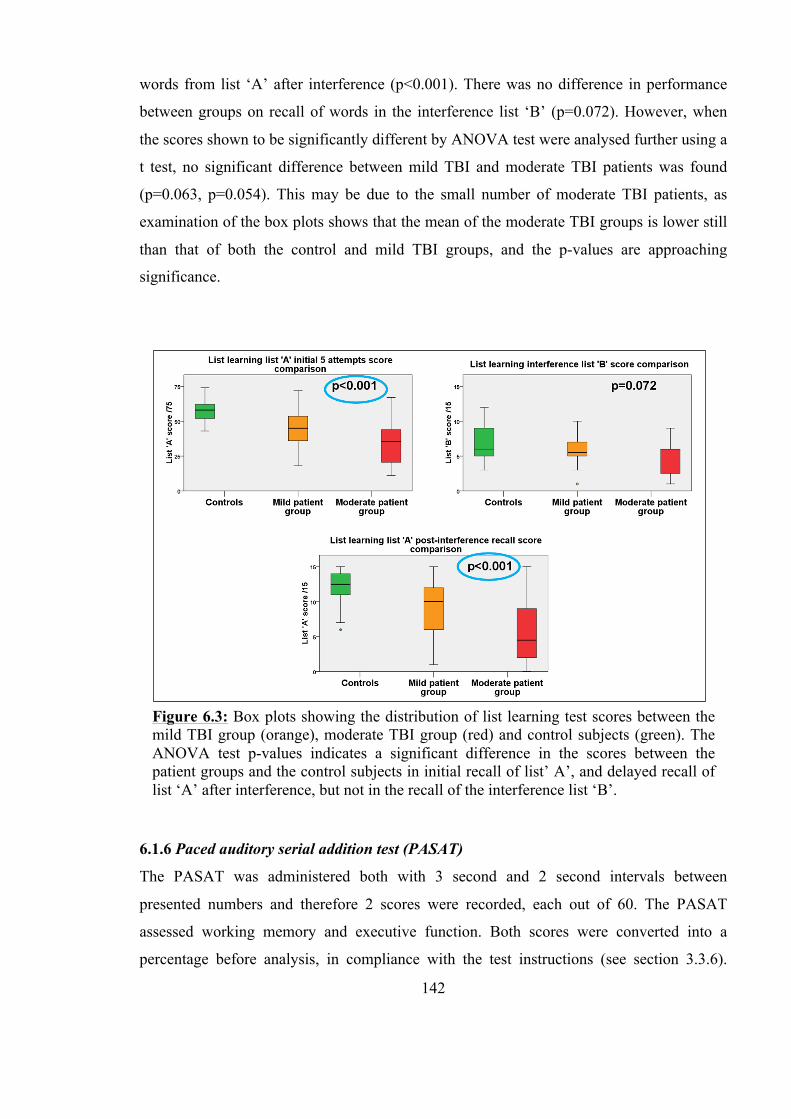
142
words from list ‘A’ after interference (p<0.001). There was no difference in performance
between groups on recall of words in the interference list ‘B’ (p=0.072). However, when
the scores shown to be significantly different by ANOVA test were analysed further using a
t test, no significant difference between mild TBI and moderate TBI patients was found
(p=0.063, p=0.054). This may be due to the small number of moderate TBI patients, as
examination of the box plots shows that the mean of the moderate TBI groups is lower still
than that of both the control and mild TBI groups, and the p-values are approaching
significance.
6.1.6 Paced auditory serial addition test (PASAT)
The PASAT was administered both with 3 second and 2 second intervals between
presented numbers and therefore 2 scores were recorded, each out of 60. The PASAT
assessed working memory and executive function. Both scores were converted into a
percentage before analysis, in compliance with the test instructions (see section 3.3.6).
Figure 6.3: Box plots showing the distribution of list learning test scores between the mild TBI group (orange), moderate TBI group (red) and control subjects (green). The ANOVA test p-values indicates a significant difference in the scores between the patient groups and the control subjects in initial recall of list’ A’, and delayed recall of list ‘A’ after interference, but not in the recall of the interference list ‘B’.

143
Group comparison of the two PASAT scores recorded for each subject was made using the
ANOVA test (Figure 6.4). The result showed that performance in the control subjects was
significantly better than in the mild and moderate TBI groups in both the 3 second PASAT
score (p<0.001) and the 2 second PASAT score (p<0.001). A t test analysis between the
individual pairs of groups (control subjects and mild TBI, control subjects and moderate
TBI, and mild TBI and moderate TBI) showed significant differences between the mean
scores of the control subjects and the mild TBI patients (PASAT3 p<0.001, PASAT 2
p=0.002) and between the control subjects and the moderate TBI patients (PASAT 3
p=0.014, PASAT 2 p<0.001) but not between the mild TBI patients and moderate TBI
patients (PASAT 3 p=0.101, PASAT 2 p=0.082).
6.1.7 Digit span backwards (DSPAN back)
The DSPAN back test assessed short-term and working memory, and produced a single
score (out of 14): a total of the number of correct sequences relayed by the participant.
Group comparison of the DSPAN back score recorded for each subject was made using the
ANOVA test (Figure 6.5). The result showed that performance in the control subjects was
significantly better than in the mild and moderate TBI groups (p=0.025).
Figure 6.4: Box plots showing the distribution of PASAT scores between the mild TBI group (orange), moderate TBI group (red) and control subjects (green). The ANOVA test p-values indicate a significant difference in the scores between the patient groups and the control subjects in both the 3 second and the 2 second tests.
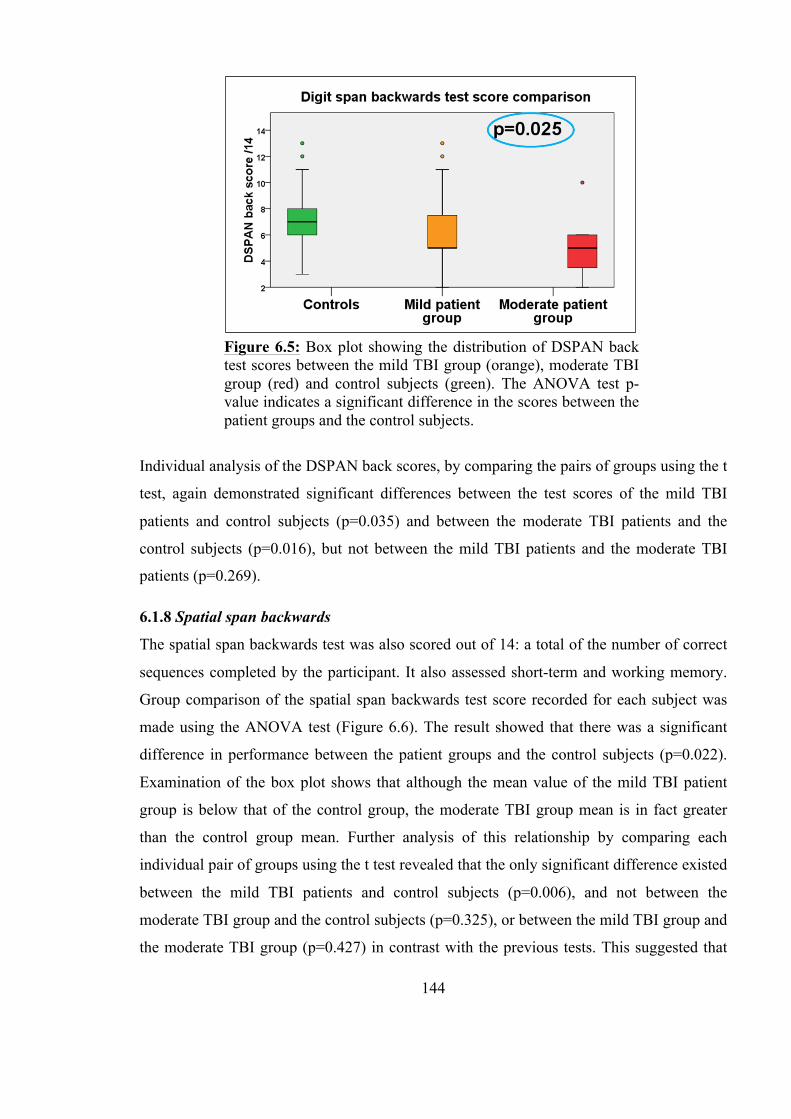
144
Individual analysis of the DSPAN back scores, by comparing the pairs of groups using the t
test, again demonstrated significant differences between the test scores of the mild TBI
patients and control subjects (p=0.035) and between the moderate TBI patients and the
control subjects (p=0.016), but not between the mild TBI patients and the moderate TBI
patients (p=0.269).
6.1.8 Spatial span backwards
The spatial span backwards test was also scored out of 14: a total of the number of correct
sequences completed by the participant. It also assessed short-term and working memory.
Group comparison of the spatial span backwards test score recorded for each subject was
made using the ANOVA test (Figure 6.6). The result showed that there was a significant
difference in performance between the patient groups and the control subjects (p=0.022).
Examination of the box plot shows that although the mean value of the mild TBI patient
group is below that of the control group, the moderate TBI group mean is in fact greater
than the control group mean. Further analysis of this relationship by comparing each
individual pair of groups using the t test revealed that the only significant difference existed
between the mild TBI patients and control subjects (p=0.006), and not between the
moderate TBI group and the control subjects (p=0.325), or between the mild TBI group and
the moderate TBI group (p=0.427) in contrast with the previous tests. This suggested that
Figure 6.5: Box plot showing the distribution of DSPAN back test scores between the mild TBI group (orange), moderate TBI group (red) and control subjects (green). The ANOVA test p-value indicates a significant difference in the scores between the patient groups and the control subjects.
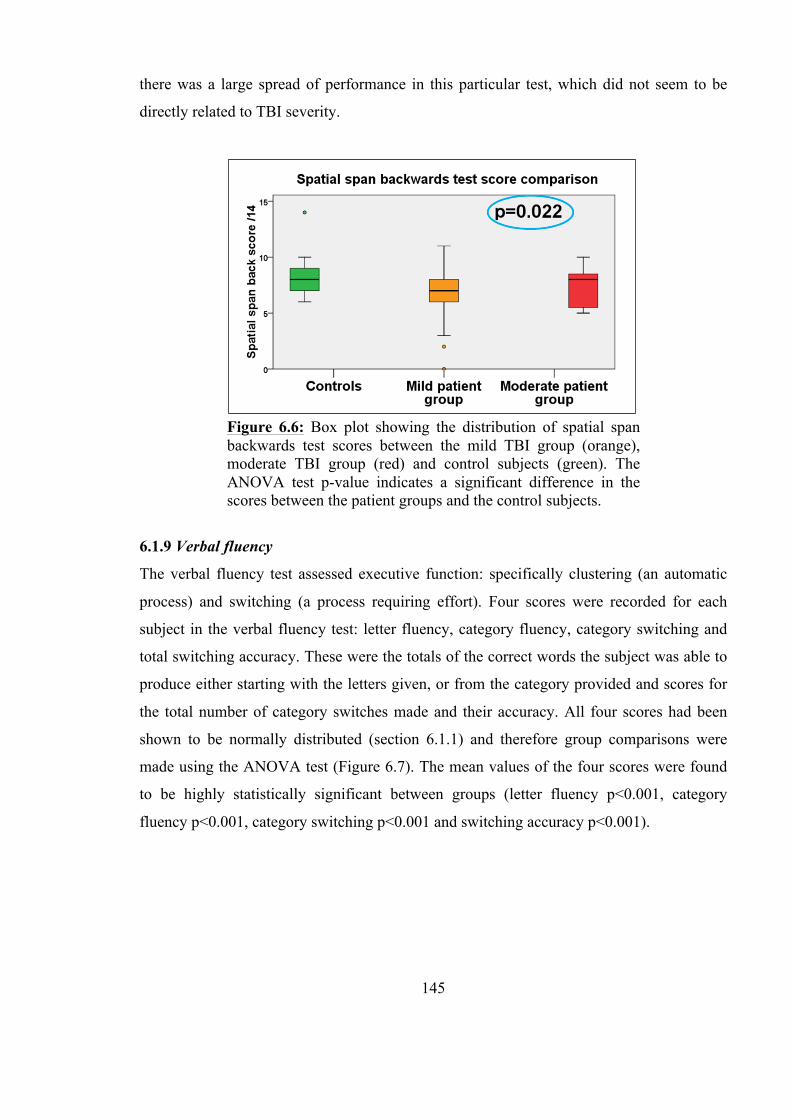
145
there was a large spread of performance in this particular test, which did not seem to be
directly related to TBI severity.
6.1.9 Verbal fluency
The verbal fluency test assessed executive function: specifically clustering (an automatic
process) and switching (a process requiring effort). Four scores were recorded for each
subject in the verbal fluency test: letter fluency, category fluency, category switching and
total switching accuracy. These were the totals of the correct words the subject was able to
produce either starting with the letters given, or from the category provided and scores for
the total number of category switches made and their accuracy. All four scores had been
shown to be normally distributed (section 6.1.1) and therefore group comparisons were
made using the ANOVA test (Figure 6.7). The mean values of the four scores were found
to be highly statistically significant between groups (letter fluency p<0.001, category
fluency p<0.001, category switching p<0.001 and switching accuracy p<0.001).
Figure 6.6: Box plot showing the distribution of spatial span backwards test scores between the mild TBI group (orange), moderate TBI group (red) and control subjects (green). The ANOVA test p-value indicates a significant difference in the scores between the patient groups and the control subjects.
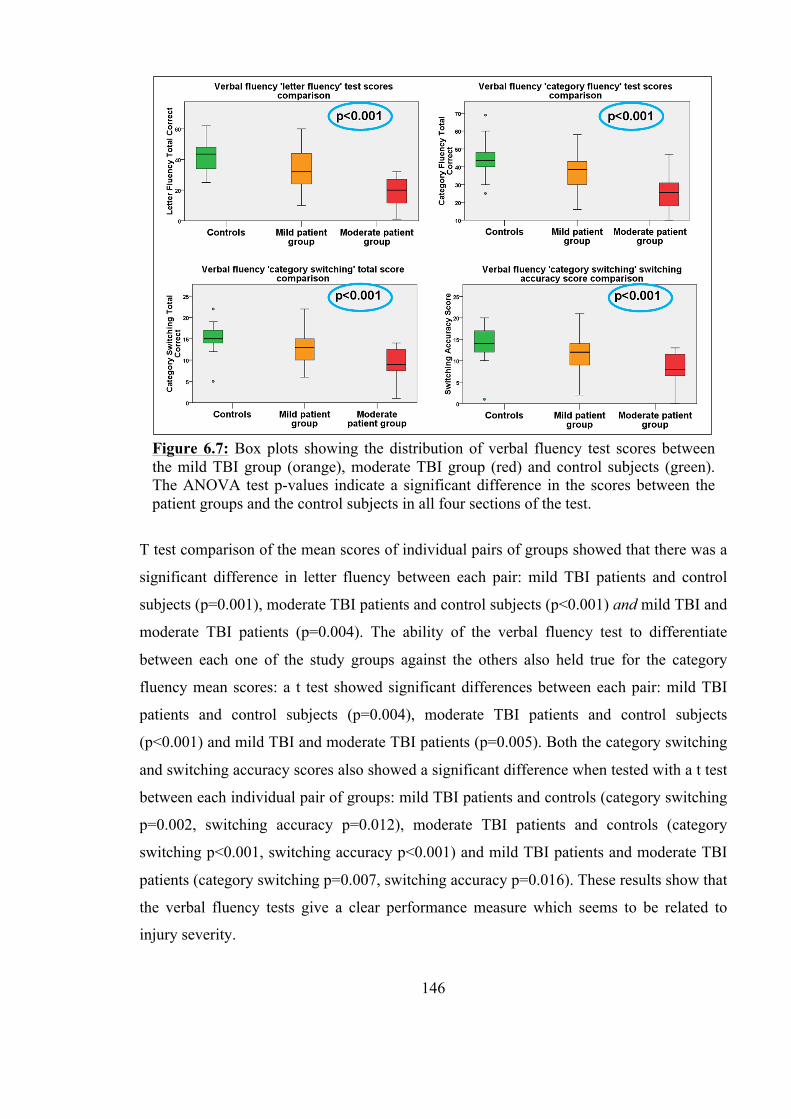
146
T test comparison of the mean scores of individual pairs of groups showed that there was a
significant difference in letter fluency between each pair: mild TBI patients and control
subjects (p=0.001), moderate TBI patients and control subjects (p<0.001) and mild TBI and
moderate TBI patients (p=0.004). The ability of the verbal fluency test to differentiate
between each one of the study groups against the others also held true for the category
fluency mean scores: a t test showed significant differences between each pair: mild TBI
patients and control subjects (p=0.004), moderate TBI patients and control subjects
(p<0.001) and mild TBI and moderate TBI patients (p=0.005). Both the category switching
and switching accuracy scores also showed a significant difference when tested with a t test
between each individual pair of groups: mild TBI patients and controls (category switching
p=0.002, switching accuracy p=0.012), moderate TBI patients and controls (category
switching p<0.001, switching accuracy p<0.001) and mild TBI patients and moderate TBI
patients (category switching p=0.007, switching accuracy p=0.016). These results show that
the verbal fluency tests give a clear performance measure which seems to be related to
injury severity.
Figure 6.7: Box plots showing the distribution of verbal fluency test scores between the mild TBI group (orange), moderate TBI group (red) and control subjects (green). The ANOVA test p-values indicate a significant difference in the scores between the patient groups and the control subjects in all four sections of the test.
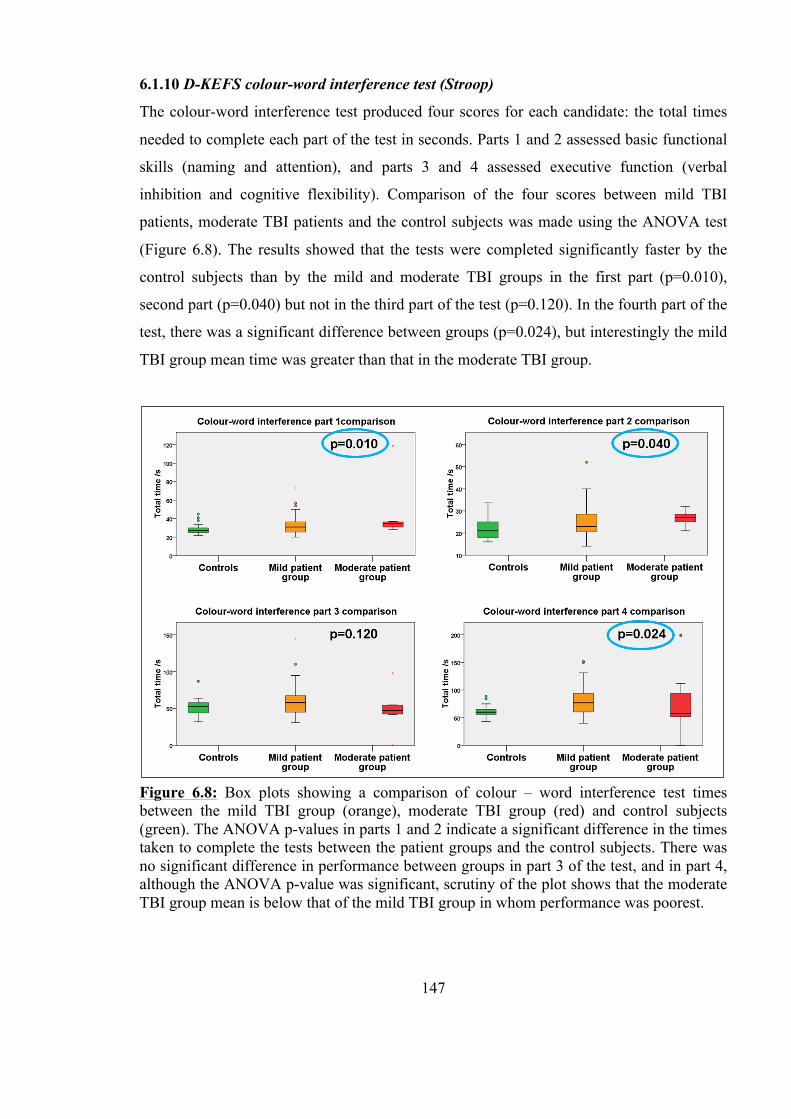
147
6.1.10 D-KEFS colour-word interference test (Stroop)
The colour-word interference test produced four scores for each candidate: the total times
needed to complete each part of the test in seconds. Parts 1 and 2 assessed basic functional
skills (naming and attention), and parts 3 and 4 assessed executive function (verbal
inhibition and cognitive flexibility). Comparison of the four scores between mild TBI
patients, moderate TBI patients and the control subjects was made using the ANOVA test
(Figure 6.8). The results showed that the tests were completed significantly faster by the
control subjects than by the mild and moderate TBI groups in the first part (p=0.010),
second part (p=0.040) but not in the third part of the test (p=0.120). In the fourth part of the
test, there was a significant difference between groups (p=0.024), but interestingly the mild
TBI group mean time was greater than that in the moderate TBI group.
Figure 6.8: Box plots showing a comparison of colour – word interference test times between the mild TBI group (orange), moderate TBI group (red) and control subjects (green). The ANOVA p-values in parts 1 and 2 indicate a significant difference in the times taken to complete the tests between the patient groups and the control subjects. There was no significant difference in performance between groups in part 3 of the test, and in part 4, although the ANOVA p-value was significant, scrutiny of the plot shows that the moderate TBI group mean is below that of the mild TBI group in whom performance was poorest.
148
6.2 Analysis of Scan Data with Reference to the Neuropsychology Data
In the final set of statistical analysis performed the scan data was evaluated by assessing
correlations between neuropsychological test performance and quantitative scan data values
in brain regions known to be involved in the functions tested. This correlation analysis was
only performed in the neuropsychological tests where a difference had been shown between
groups. All of the neuropsychology tests used have been previously shown to be correlated
to the premorbid IQ of test subjects to some degree (section 3.3). Therefore all correlations
between scan data and neuropsychology test scores were assessed with the predicted IQ
from the NART as a covariant of no interest.
Specific ROIs were selected for analysis with reference to each neuropsychology score,
according to the anatomical brain regions known to be associated with each particular test
(section 3.3). Quantitative data was analysed with the appropriate parametric (Pearson) or
non-parametric (Spearman’s rho) correlation coefficient according to whether it had been
found to be normally or not normally distributed in section 5.2.1 (5 ROI method), section
5.3.1 (14 automated ROI method) or section 5.4.1 (tractography designed ROI method).
Quantitative T2 data was not included in this analysis as no significant inter-group
differences had been shown in the group comparison in either grey or white matter (section
5.3.3).
All correlations were performed separately in the control subjects and then again in the
whole patient group, this was done to ensure that any significant correlations revealed were
attributable to changes in the patient group, and not simply representations of a pre-existing
relationship in the general population.
Given that in this section, a large number of correlations were to be assessed between each
neuropsychology test score and each functionally related ROI from three different analysis
techniques, each in 3 different quantitative datasets (qT1, MD and FA) and in both grey and
white matter, the likelihood that some of the significant results would be due to chance was
high. In order to correct for this, the p-value below which a correlation was deemed to be
significant was determined using the Bonferroni correction to adjust for multiple
comparisons. It was therefore necessary in each analysis to correct for the total number of
ROIs being examined, in both grey and white matter. However, as the qT1, MD and FA
values each reported on different aspects of tissue microstructure, they were considered
149
individually, and accepting this premise, it was not necessary to correct for performing
these three measurements.
For example, in the analysis of the speed of information processing (SoIP) adjusted total
score, the ROIs examined from the 14 automated ROI method were the left and right
superior and inferior frontal regions. Each of these 4 ROIs was examined with respect to
grey and white matter, making 8 assessments in total. The Bonferroni correction was made
by dividing the existing significant p-value (p<0.05) by 8, giving 0.006. Therefore, a
significant p-value from this analysis (relating specifically to the SoIP adjusted total score
analysed using the data from the 14 automated ROI method) was taken to be p≤0.006.
6.2.1 Correlation between speed of information processing score and scan data
The speed of information processing (SoIP) test predominantly assesses executive function.
As discussed in section 3.2.3, executive function is associated almost exclusively with the
frontal lobes. A correlation analysis was therefore performed between the SoIP adjusted
total scores and frontal lobe data from all 4 of the analysis techniques: 5 ROI, 14 automated
ROI, tractography based ROI and TBSS.
Executive function is not known to be related to anatomical laterality, and therefore
combined frontal lobe data from the 5 ROI technique was assessed, to ascertain whether
diffuse frontal lobe changes could be detected and were important in performance of the
SoIP task; the four frontal regions from the 14 automated ROI method serving to assess the
same area broken down into smaller regions to allow for detection of more focal damage.
This combined frontal lobe ROI was created by taking the mean value of the left and right
frontal ROIs in each dataset. Correlation between these ‘bilateral frontal lobe’ ROI datasets
and the SoIP adjusted total was then assessed using a significant p-value of p<0.025 after
performing a Bonferroni correction, taking into account that the same ROI was being
assessed in white and grey matter.
In the control group, no correlation was demonstrated between the SoIP adjusted total and
qT1, MD or FA in any of the selected regions in either grey or white matter. The only
significant correlation seen in the patient group was between frontal lobe grey matter FA
and the adjusted SoIP total score (p=0.004) (Figure 6.9). No other correlations were
demonstrated.

150
Frontal lobe data from the 14 automated ROI technique consisted of 4 of the 14 regions:
left inferior frontal, left superior frontal, right inferior frontal and right superior frontal.
Quantitative datasets from these four regions in both grey and white matter were analysed
by assessing a correlation with SoIP adjusted total scores. After a Bonferroni correction, a
p-value of p<0.006 was taken to be significant. No significant correlations between any of
the quantitative datasets and the adjusted SoIP score were demonstrated in either the
control group or the patient group, which may have been a result of the more severe
Bonferroni correction.
Quantitative scan data obtained from the genu of the corpus callosum using the
tractography designed ROI technique was analysed in relation to the SoIP adjusted total but
also showed no significant correlation in MD, FA or any of the eigenvalues. A significant
p-value was taken as p<0.05 in this analysis.
A voxel-wise regression analysis was performed on the TBSS data separately for the
control subjects and for the whole patient group. There was no significant relationship
between white matter tract FA in either the control group or the patient group and SoIP
adjusted total score.
Figure 6.9: Scatter plot to show the significant relationship between frontal lobe grey matter FA and speed of information processing adjusted total score in the combined patient group (mild TBI and moderate TBI).

151
6.2.2 Correlation between design learning scores and scan data
The design learning test assesses short-term and working memory. As discussed in section
3.2.2, short-term memory is associated with the frontal lobes and in particular the
dorsolateral prefrontal cortex, while the executive component of working memory is
associated with frontal lobe function in general. Therefore the first correlation was assessed
in the bilateral frontal lobe ROI from the 5 ROI method. As this was analysed in both grey
and white matter, the p-value taken to be significant was p<0.025.
This analysis demonstrated significant correlations in the patient group between frontal
lobe grey matter qT1 means and the interference design ‘B’ recall score (p=0.013) (Figure
6.10). A correlation was also shown between frontal lobe grey matter FA and both the score
for the initial 5 attempts at recall of design ’A’ (p=0.022) and the score for post-
interference recall of design ‘A’ (p=0.016) (Figure 6.11). There were no significant
correlations in the control group.
Figure 6.10: Scatter plot showing the significant relationship between the interference design ‘B’ recall score and frontal grey matter qT1.
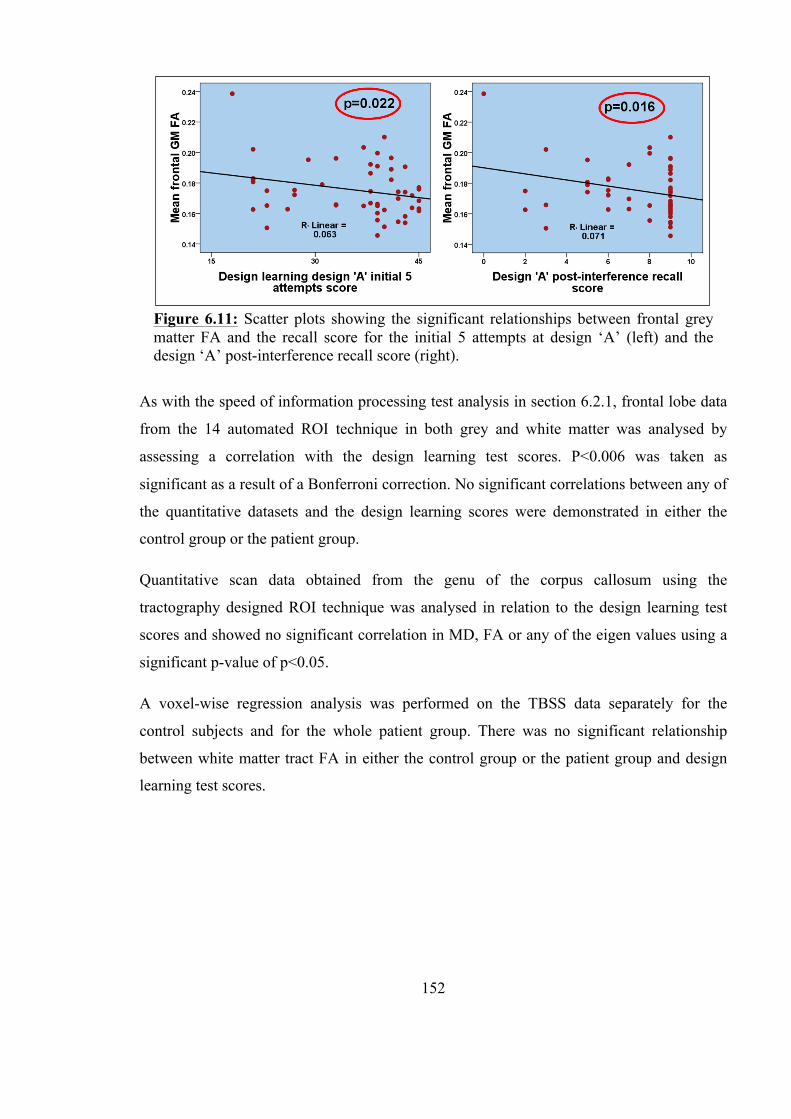
152
As with the speed of information processing test analysis in section 6.2.1, frontal lobe data
from the 14 automated ROI technique in both grey and white matter was analysed by
assessing a correlation with the design learning test scores. P<0.006 was taken as
significant as a result of a Bonferroni correction. No significant correlations between any of
the quantitative datasets and the design learning scores were demonstrated in either the
control group or the patient group.
Quantitative scan data obtained from the genu of the corpus callosum using the
tractography designed ROI technique was analysed in relation to the design learning test
scores and showed no significant correlation in MD, FA or any of the eigen values using a
significant p-value of p<0.05.
A voxel-wise regression analysis was performed on the TBSS data separately for the
control subjects and for the whole patient group. There was no significant relationship
between white matter tract FA in either the control group or the patient group and design
learning test scores.
Figure 6.11: Scatter plots showing the significant relationships between frontal grey matter FA and the recall score for the initial 5 attempts at design ‘A’ (left) and the design ‘A’ post-interference recall score (right).
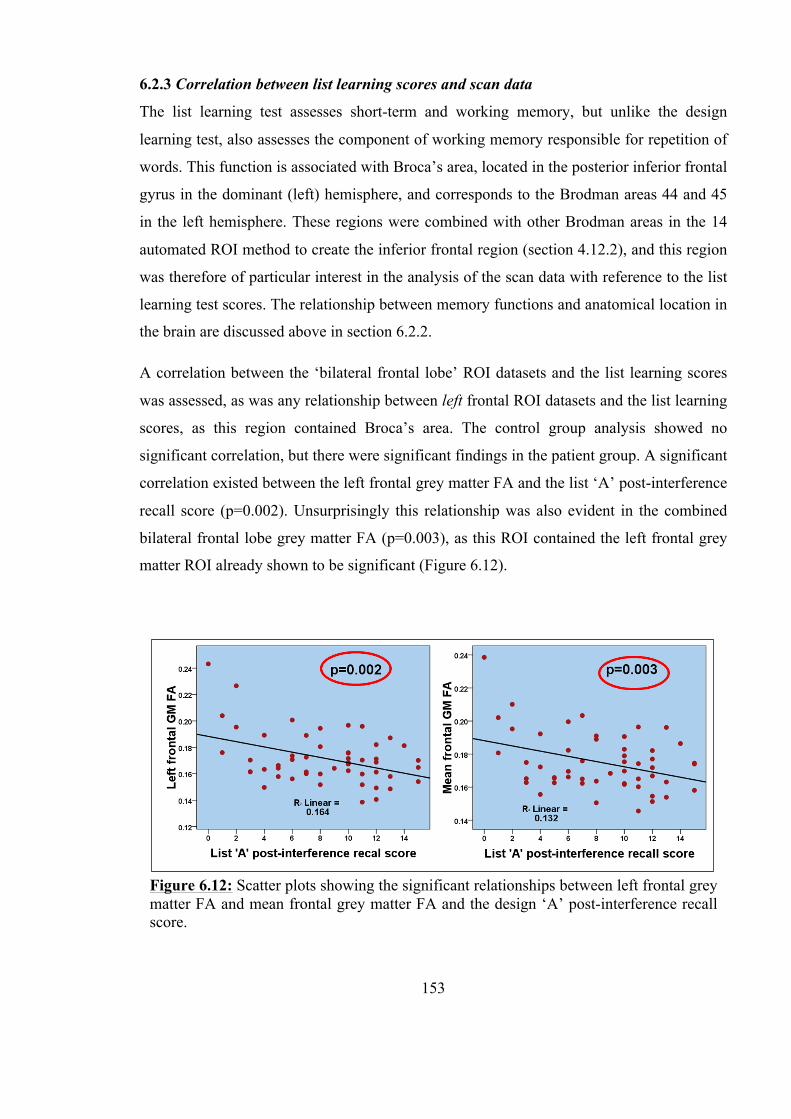
153
6.2.3 Correlation between list learning scores and scan data
The list learning test assesses short-term and working memory, but unlike the design
learning test, also assesses the component of working memory responsible for repetition of
words. This function is associated with Broca’s area, located in the posterior inferior frontal
gyrus in the dominant (left) hemisphere, and corresponds to the Brodman areas 44 and 45
in the left hemisphere. These regions were combined with other Brodman areas in the 14
automated ROI method to create the inferior frontal region (section 4.12.2), and this region
was therefore of particular interest in the analysis of the scan data with reference to the list
learning test scores. The relationship between memory functions and anatomical location in
the brain are discussed above in section 6.2.2.
A correlation between the ‘bilateral frontal lobe’ ROI datasets and the list learning scores
was assessed, as was any relationship between left frontal ROI datasets and the list learning
scores, as this region contained Broca’s area. The control group analysis showed no
significant correlation, but there were significant findings in the patient group. A significant
correlation existed between the left frontal grey matter FA and the list ‘A’ post-interference
recall score (p=0.002). Unsurprisingly this relationship was also evident in the combined
bilateral frontal lobe grey matter FA (p=0.003), as this ROI contained the left frontal grey
matter ROI already shown to be significant (Figure 6.12).
Figure 6.12: Scatter plots showing the significant relationships between left frontal grey matter FA and mean frontal grey matter FA and the design ‘A’ post-interference recall score.
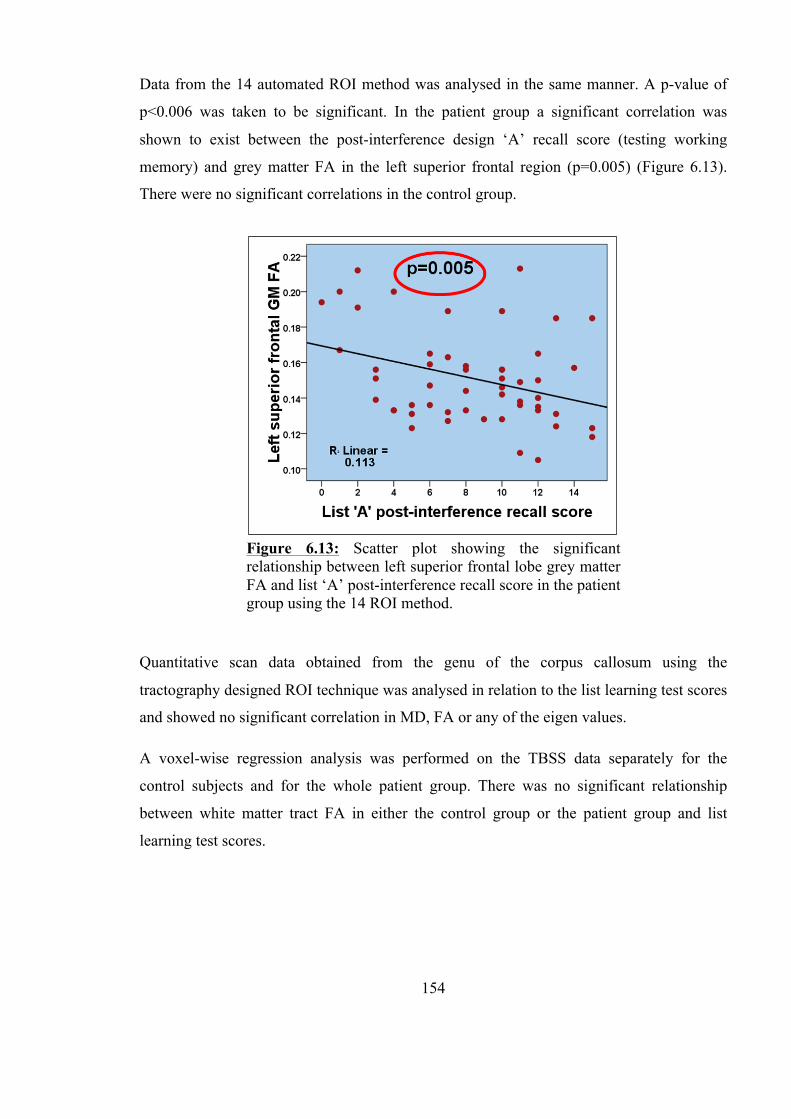
154
Data from the 14 automated ROI method was analysed in the same manner. A p-value of
p<0.006 was taken to be significant. In the patient group a significant correlation was
shown to exist between the post-interference design ‘A’ recall score (testing working
memory) and grey matter FA in the left superior frontal region (p=0.005) (Figure 6.13).
There were no significant correlations in the control group.
Quantitative scan data obtained from the genu of the corpus callosum using the
tractography designed ROI technique was analysed in relation to the list learning test scores
and showed no significant correlation in MD, FA or any of the eigen values.
A voxel-wise regression analysis was performed on the TBSS data separately for the
control subjects and for the whole patient group. There was no significant relationship
between white matter tract FA in either the control group or the patient group and list
learning test scores.
Figure 6.13: Scatter plot showing the significant relationship between left superior frontal lobe grey matter FA and list ‘A’ post-interference recall score in the patient group using the 14 ROI method.
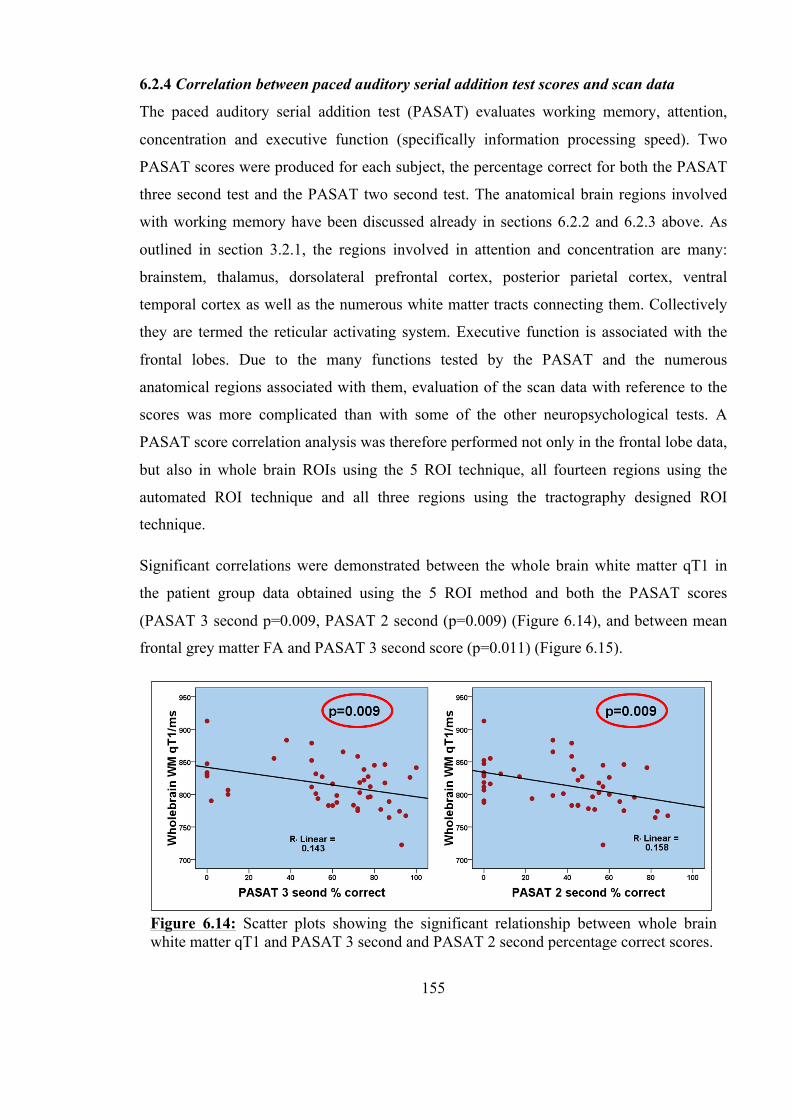
155
6.2.4 Correlation between paced auditory serial addition test scores and scan data
The paced auditory serial addition test (PASAT) evaluates working memory, attention,
concentration and executive function (specifically information processing speed). Two
PASAT scores were produced for each subject, the percentage correct for both the PASAT
three second test and the PASAT two second test. The anatomical brain regions involved
with working memory have been discussed already in sections 6.2.2 and 6.2.3 above. As
outlined in section 3.2.1, the regions involved in attention and concentration are many:
brainstem, thalamus, dorsolateral prefrontal cortex, posterior parietal cortex, ventral
temporal cortex as well as the numerous white matter tracts connecting them. Collectively
they are termed the reticular activating system. Executive function is associated with the
frontal lobes. Due to the many functions tested by the PASAT and the numerous
anatomical regions associated with them, evaluation of the scan data with reference to the
scores was more complicated than with some of the other neuropsychological tests. A
PASAT score correlation analysis was therefore performed not only in the frontal lobe data,
but also in whole brain ROIs using the 5 ROI technique, all fourteen regions using the
automated ROI technique and all three regions using the tractography designed ROI
technique.
Significant correlations were demonstrated between the whole brain white matter qT1 in
the patient group data obtained using the 5 ROI method and both the PASAT scores
(PASAT 3 second p=0.009, PASAT 2 second (p=0.009) (Figure 6.14), and between mean
frontal grey matter FA and PASAT 3 second score (p=0.011) (Figure 6.15).
Figure 6.14: Scatter plots showing the significant relationship between whole brain white matter qT1 and PASAT 3 second and PASAT 2 second percentage correct scores.

156
Data from the 14 automated ROI method revealed no significant correlations in the control
group or in the patient group. This may have been due to the large number of correlations
assessed in this analysis; after a Bonferroni correction, the p-value taken to be significant
was p<0.0018.
Analysis of correlations with the PASAT scores and the tractography designed ROIs
showed no significant findings in either the control group or the patient group at a
significance level of p<0.017.
A voxel-wise regression analysis was performed on the TBSS data separately for the
control subjects and for the whole patient group. There was no significant relationship
between white matter tract FA in either the control group or the patient group and PASAT
scores, which is unsurprising given that there were no white matter FA correlations shown
in either the 5 ROI or 14 automated ROI analysis.
Figure 6.15: Scatter plot showing the significant relationship between frontal grey matter FA and PASAT 3 second percentage correct score.
157
6.2.5 Correlation between digit span backwards test scores and scan data
The digit span backwards test (DSPAN back) produced one score, marked out of a possible
14. The test involved the participant’s attention, concentration and short term verbal
memory. The brain regions involved in the functions assessed by this test are many, and
therefore as with the analysis of the PASAT above (section 6.2.4) correlations were
evaluated between the test scores and the frontal lobe data and whole brain ROIs using the
5 ROI technique, all fourteen regions using the automated ROI technique and all three
regions using the tractography designed ROI technique.
No significant correlations were demonstrated in any of the datasets in either the control
group or the patient group, examining ROIs from the 5 ROI method (significant p-value
taken to be p<0.013), the 14 automated ROI method (significant p-value taken to be
p<0.0018), the tractography designed ROI method (significant p-value taken to be p<0.017)
or the TBSS voxel-wise analysis.
6.2.6 Correlation between verbal fluency test scores and scan data
The verbal fluency test is an executive function test that gives four scores per participant.
The test consists of two parts, the first tests phonemic or letter fluency and the second tests
semantic or category fluency. The first part produces one score, and the second three
scores, as it not only assesses the candidate’s ability to name objects from within a
category, but also their ability to switch between categories. As described in section 3.3.9
phonemic fluency has been shown to be related to frontal lobe function, while semantic
fluency is reduced in individuals with temporal lobe lesions. The executive processes
involved in semantic fluency are clustering and switching, which are linked to temporal
lobe function and frontal lobe function respectively. As a result of these known anatomical
relations, the ROIs analysed with respect to the verbal fluency scores were the combined
frontal lobe ROI from the 5 ROI method, the left and right temporal lobe ROIs from the 14
automated ROI method, and all three ROIs (genu, splenium and body of the corpus
callosum) from the tractography designed ROI technique.
The combined frontal lobe ROI from the 5 ROI technique showed no significant
correlations with the verbal fluency scores when assessed in the control group, but did
show a number of significant findings in the patient group, after a Bonferroni correction
was performed and a p-value of p<0.025 was taken to be significant. There were

158
correlations shown between letter fluency and both frontal lobe grey matter qT1 (p=0.006)
and frontal lobe grey matter MD (p=0.014) (Figure 6.16) and between category fluency and
both frontal lobe grey matter MD (p=0.010) and frontal lobe grey matter FA (p=0.007)
(Figure 6.17). For interest, these scatter plots show the patients grouped by TBI severity
according to the admitting GCS score. While the moderate TBI patients (red markers) tend
to score poorly in both the letter fluency and category fluency, a number of the mild TBI
patients (blue markers) perform equally poorly, indicating a significant reduction in
executive function in these mild TBI patients. This highlights the fact that while the
admitting GCS is undoubtedly a useful clinical tool for guiding management, it is not a
suitable indicator of the severity of cognitive symptoms suffered after brain injury.
Figure 6.16: Scatter plots showing significant correlations between letter fluency scores and frontal grey matter qT1 and frontal grey matter MD. Patients with mild TBI are represented with a blue marker, and those with a moderate TBI with a red marker.
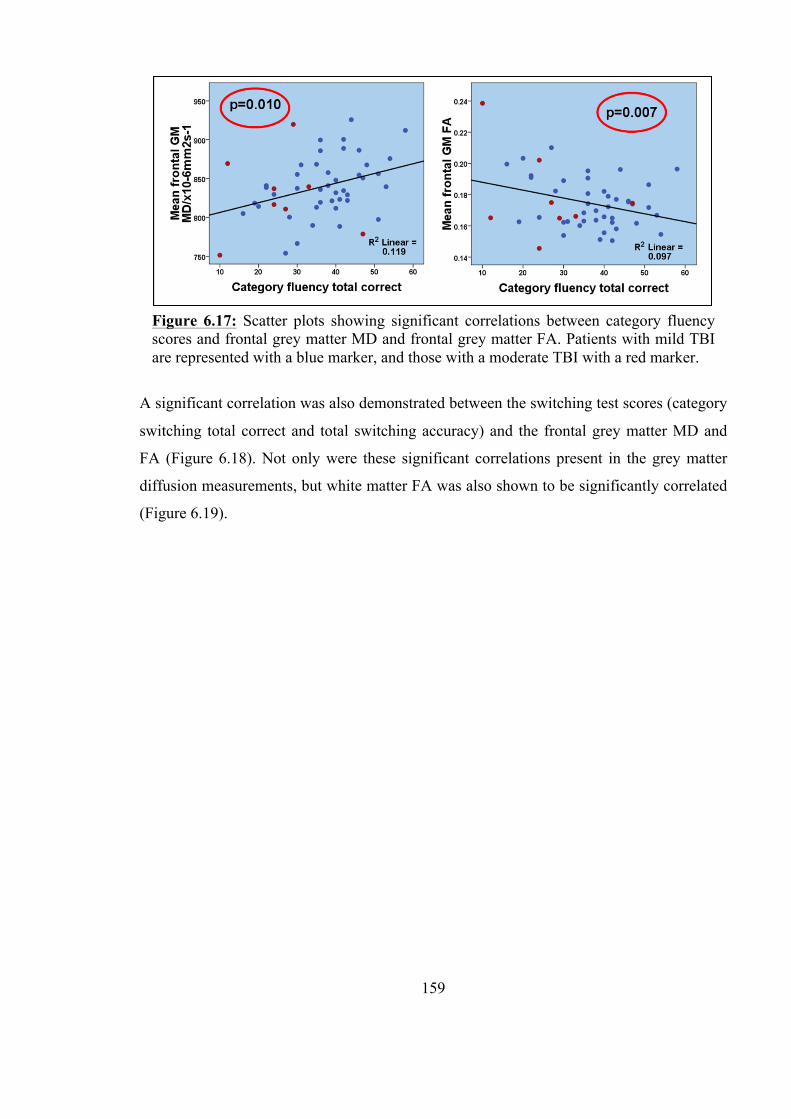
159
A significant correlation was also demonstrated between the switching test scores (category
switching total correct and total switching accuracy) and the frontal grey matter MD and
FA (Figure 6.18). Not only were these significant correlations present in the grey matter
diffusion measurements, but white matter FA was also shown to be significantly correlated
(Figure 6.19).
Figure 6.17: Scatter plots showing significant correlations between category fluency scores and frontal grey matter MD and frontal grey matter FA. Patients with mild TBI are represented with a blue marker, and those with a moderate TBI with a red marker.
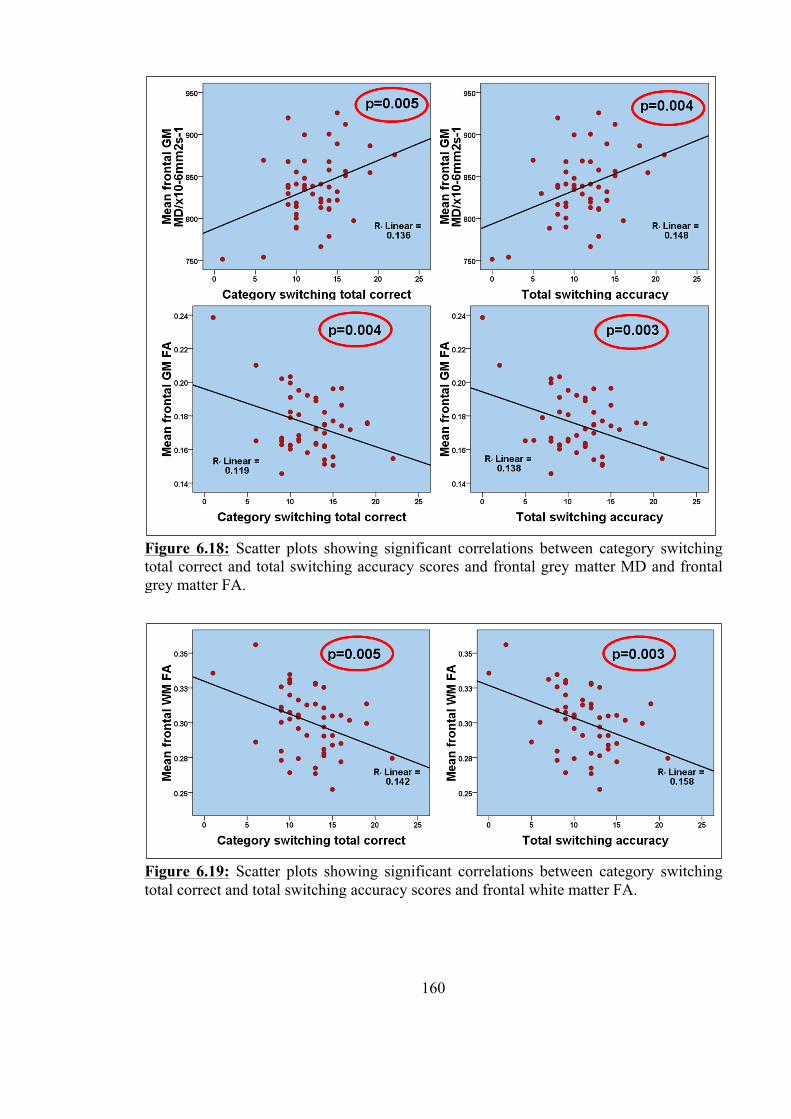
160
Figure 6.18: Scatter plots showing significant correlations between category switching total correct and total switching accuracy scores and frontal grey matter MD and frontal grey matter FA.
Figure 6.19: Scatter plots showing significant correlations between category switching total correct and total switching accuracy scores and frontal white matter FA.
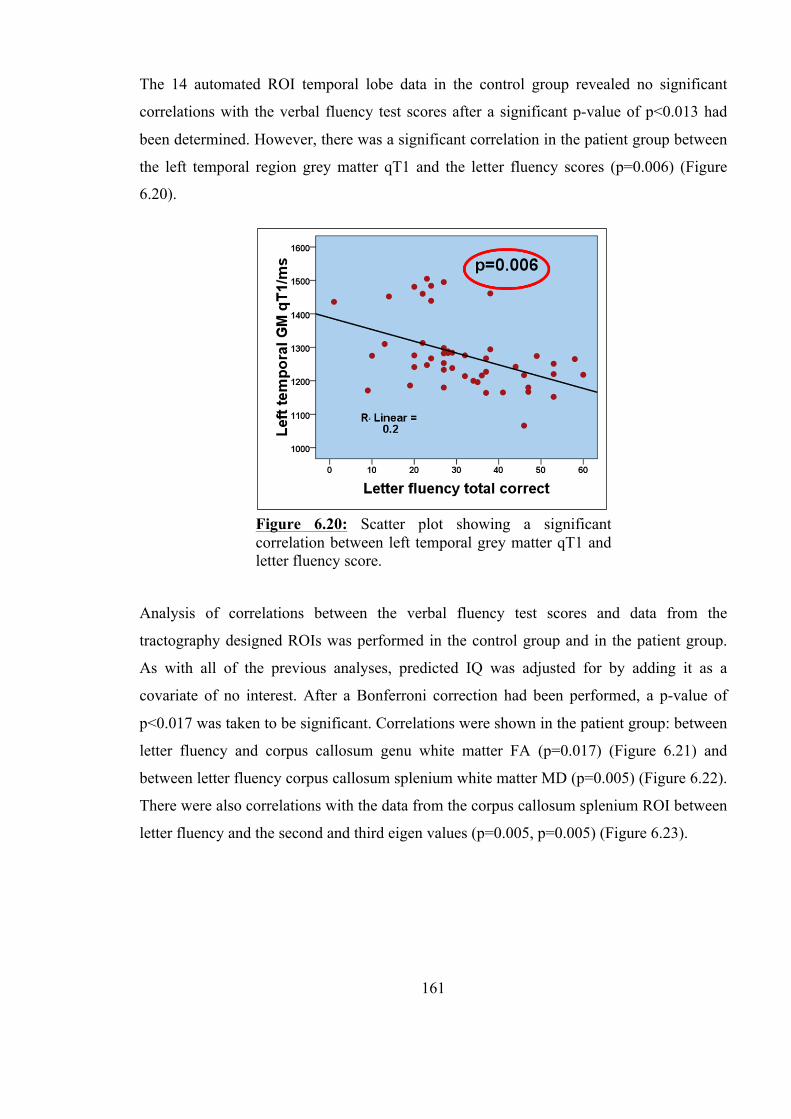
161
The 14 automated ROI temporal lobe data in the control group revealed no significant
correlations with the verbal fluency test scores after a significant p-value of p<0.013 had
been determined. However, there was a significant correlation in the patient group between
the left temporal region grey matter qT1 and the letter fluency scores (p=0.006) (Figure
6.20).
Analysis of correlations between the verbal fluency test scores and data from the
tractography designed ROIs was performed in the control group and in the patient group.
As with all of the previous analyses, predicted IQ was adjusted for by adding it as a
covariate of no interest. After a Bonferroni correction had been performed, a p-value of
p<0.017 was taken to be significant. Correlations were shown in the patient group: between
letter fluency and corpus callosum genu white matter FA (p=0.017) (Figure 6.21) and
between letter fluency corpus callosum splenium white matter MD (p=0.005) (Figure 6.22).
There were also correlations with the data from the corpus callosum splenium ROI between
letter fluency and the second and third eigen values (p=0.005, p=0.005) (Figure 6.23).
Figure 6.20: Scatter plot showing a significant correlation between left temporal grey matter qT1 and letter fluency score.
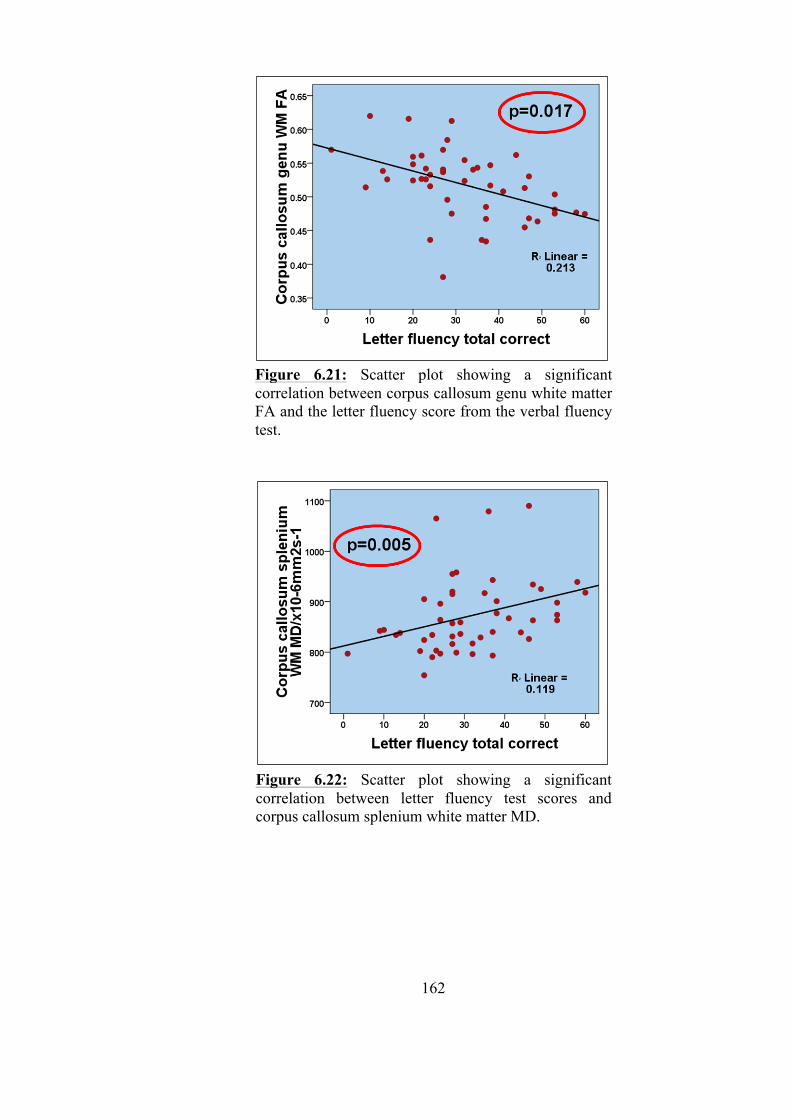
162
Figure 6.21: Scatter plot showing a significant correlation between corpus callosum genu white matter FA and the letter fluency score from the verbal fluency test.
Figure 6.22: Scatter plot showing a significant correlation between letter fluency test scores and corpus callosum splenium white matter MD.
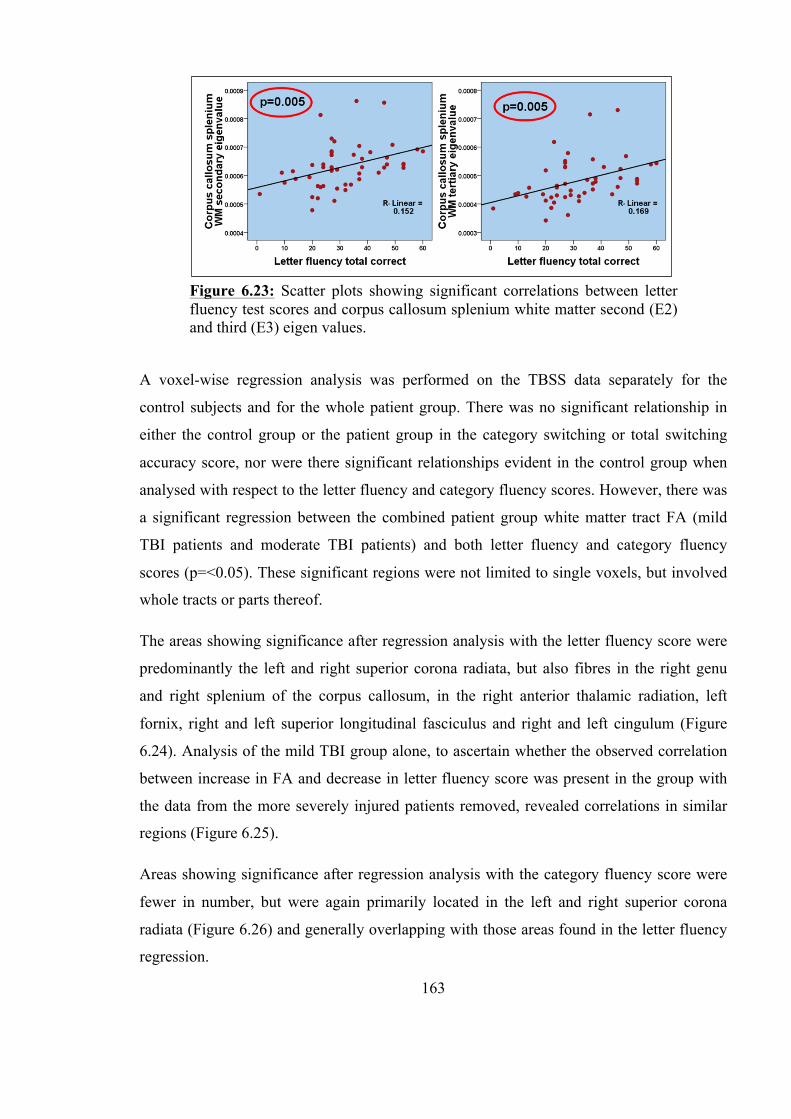
163
A voxel-wise regression analysis was performed on the TBSS data separately for the
control subjects and for the whole patient group. There was no significant relationship in
either the control group or the patient group in the category switching or total switching
accuracy score, nor were there significant relationships evident in the control group when
analysed with respect to the letter fluency and category fluency scores. However, there was
a significant regression between the combined patient group white matter tract FA (mild
TBI patients and moderate TBI patients) and both letter fluency and category fluency
scores (p=<0.05). These significant regions were not limited to single voxels, but involved
whole tracts or parts thereof.
The areas showing significance after regression analysis with the letter fluency score were
predominantly the left and right superior corona radiata, but also fibres in the right genu
and right splenium of the corpus callosum, in the right anterior thalamic radiation, left
fornix, right and left superior longitudinal fasciculus and right and left cingulum (Figure
6.24). Analysis of the mild TBI group alone, to ascertain whether the observed correlation
between increase in FA and decrease in letter fluency score was present in the group with
the data from the more severely injured patients removed, revealed correlations in similar
regions (Figure 6.25).
Areas showing significance after regression analysis with the category fluency score were
fewer in number, but were again primarily located in the left and right superior corona
radiata (Figure 6.26) and generally overlapping with those areas found in the letter fluency
regression.
Figure 6.23: Scatter plots showing significant correlations between letter fluency test scores and corpus callosum splenium white matter second (E2) and third (E3) eigen values.
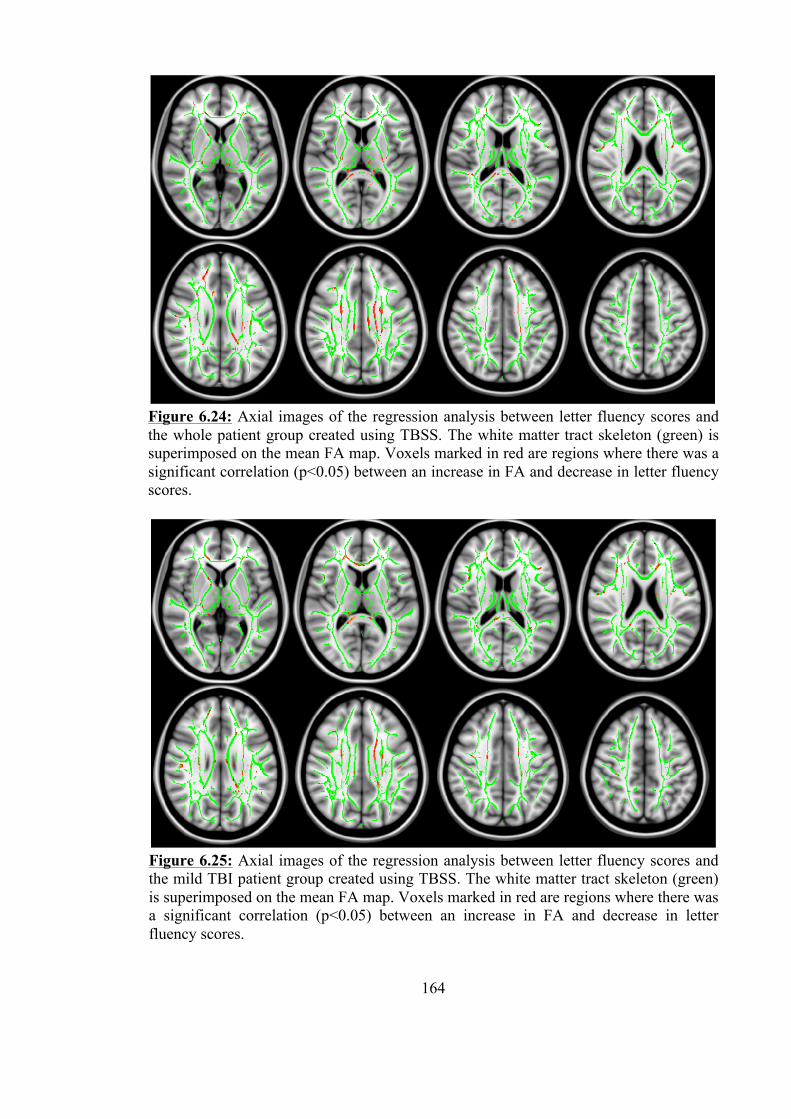
164
Figure 6.24: Axial images of the regression analysis between letter fluency scores and the whole patient group created using TBSS. The white matter tract skeleton (green) is superimposed on the mean FA map. Voxels marked in red are regions where there was a significant correlation (p<0.05) between an increase in FA and decrease in letter fluency scores.
Figure 6.25: Axial images of the regression analysis between letter fluency scores and the mild TBI patient group created using TBSS. The white matter tract skeleton (green) is superimposed on the mean FA map. Voxels marked in red are regions where there was a significant correlation (p<0.05) between an increase in FA and decrease in letter fluency scores.
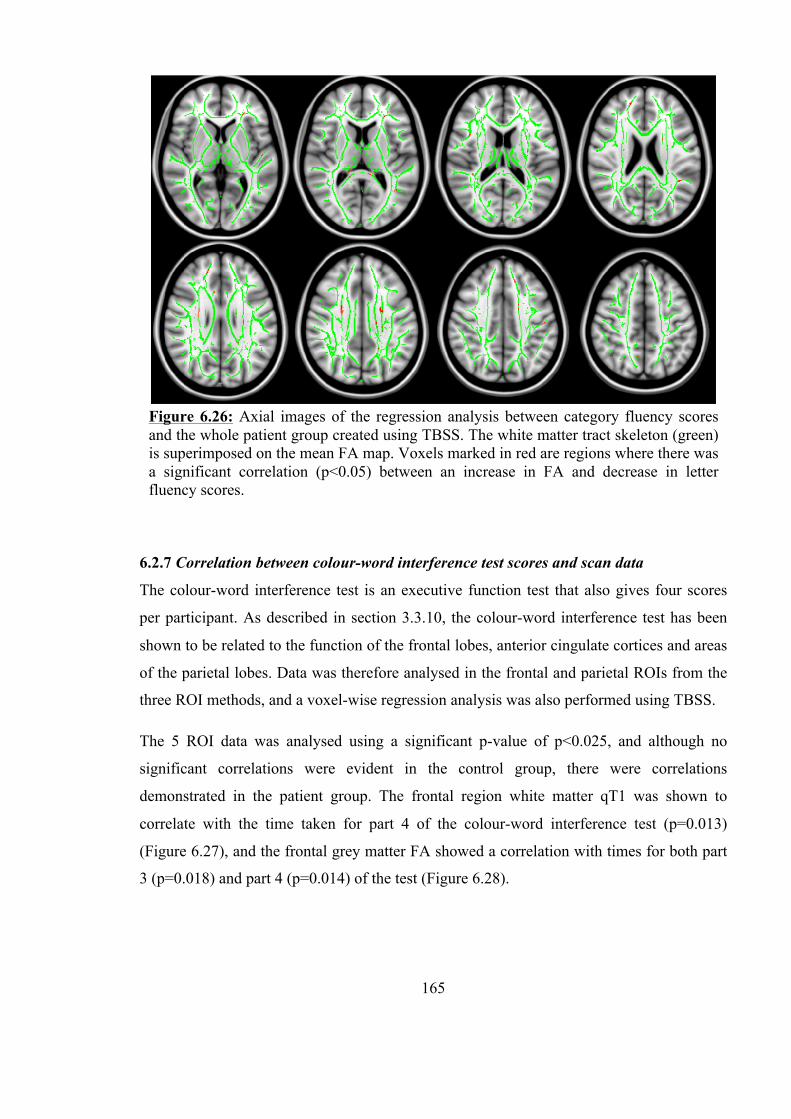
165
6.2.7 Correlation between colour-word interference test scores and scan data
The colour-word interference test is an executive function test that also gives four scores
per participant. As described in section 3.3.10, the colour-word interference test has been
shown to be related to the function of the frontal lobes, anterior cingulate cortices and areas
of the parietal lobes. Data was therefore analysed in the frontal and parietal ROIs from the
three ROI methods, and a voxel-wise regression analysis was also performed using TBSS.
The 5 ROI data was analysed using a significant p-value of p<0.025, and although no
significant correlations were evident in the control group, there were correlations
demonstrated in the patient group. The frontal region white matter qT1 was shown to
correlate with the time taken for part 4 of the colour-word interference test (p=0.013)
(Figure 6.27), and the frontal grey matter FA showed a correlation with times for both part
3 (p=0.018) and part 4 (p=0.014) of the test (Figure 6.28).
Figure 6.26: Axial images of the regression analysis between category fluency scores and the whole patient group created using TBSS. The white matter tract skeleton (green) is superimposed on the mean FA map. Voxels marked in red are regions where there was a significant correlation (p<0.05) between an increase in FA and decrease in letter fluency scores.

166
A significant p-value of p<0.004 was calculated for the 14 automated ROI method analysis,
as 6 regions were analysed, each in grey and white matter. Only one dataset in one region
showed a significant correlation: left superior frontal white matter qT1 with colour-word
interference test part 4 time (p=0.002) (Figure 6.29).
Figure 6.27: Scatter plot showing a significant correlation between colour-word interference test part 4 time and frontal lobe white matter qT1.
Figure 6.28: Scatter plots showing a significant correlation between colour-word interference test times for parts 3 and 4 and frontal lobe grey matter FA.
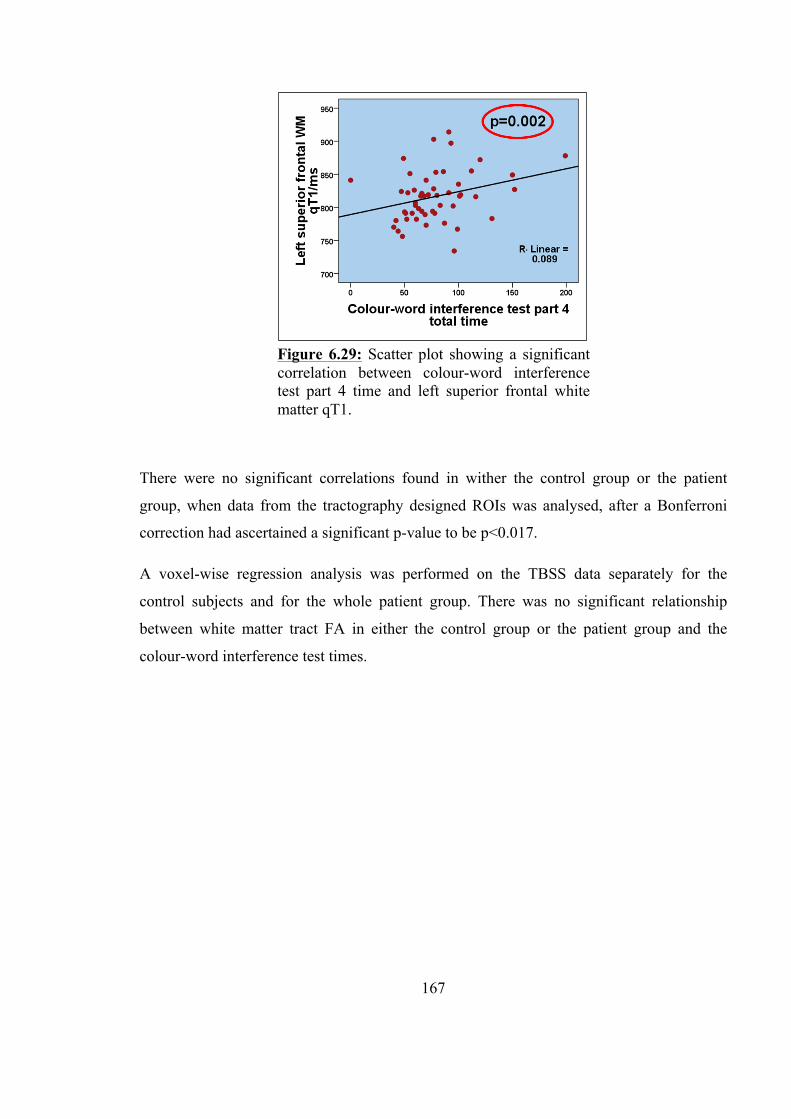
167
There were no significant correlations found in wither the control group or the patient
group, when data from the tractography designed ROIs was analysed, after a Bonferroni
correction had ascertained a significant p-value to be p<0.017.
A voxel-wise regression analysis was performed on the TBSS data separately for the
control subjects and for the whole patient group. There was no significant relationship
between white matter tract FA in either the control group or the patient group and the
colour-word interference test times.
Figure 6.29: Scatter plot showing a significant correlation between colour-word interference test part 4 time and left superior frontal white matter qT1.
168
6.3 Discussion
The neuropsychology test results showed that the majority of the test battery used in the
study was fit for purpose; each test revealed significant differences between the three
groups: mild TBI patients, moderate TBI patients and control subjects. The results
highlighted that our study population was representative of the TBI population as a whole,
displaying deficits in short-term and working memory, attention, concentration and
executive function.
A more detailed examination of the comparison of the test results between groups revealed
that some of the tests were only able to differentiate between the control group and the
patient groups, but not between the mild and moderate patient groups themselves. Other
tests however, such as the verbal fluency test, were clearly related to injury severity and
were able to discriminate between the patients who had sustained a mild TBI and those
with a moderate TBI.
6.3.1 Group comparison of predicted IQ
The first neuropsychology test in the battery was the NART test, which was performed in
order to determine the premorbid predicted IQ of the study subjects, and has been shown
previously to be generally resistant to mild head injury (Crawford et al., 2001, Crawford et
al., 1988). There was a significant difference found between the patient groups and the
controls, which indicated that in spite of the author’s best efforts at recruiting and matching
suitable control subjects by age and educational level, the control group still had a
significantly higher predicted IQ than either of the patient groups. This was therefore taken
into account in the analysis of correlations between the neuropsychology test scores and the
scan data, by including predicted IQ as a covariant of no interest. This ensured that any
significant correlations that were uncovered were not biased by the higher IQ of the control
group.
6.3.2 Group comparison of the neuropsychology results by cognitive function
The remaining tests in the neuropsychology battery could be divided into groups according
to the functions tested, although there was a degree of overlap, as participation in most of
the tests involved more than one cognitive function. Executive function was tested by the
Speed of Information Processing (SoIP) test, the PASAT, the Verbal Fluency test, and the

169
third and fourth parts of the colour-word interference test. Memory, both short-term and
working memory, were tested by the design learning and list learning tests, the DSPAN
back and spatial span back tests, and by the PASAT. Attention and concentration were most
necessary for the PASAT, list learning and design learning tests, but it could be argued that
these cognitive functions were needed for the entire test battery, and as so were measured to
a degree by every test.
The results from the 3-way group comparisons of the tests assessing executive function
showed there to be a significant reduction in executive function performance in the patient
groups compared to the control subjects. This was true of the SoIP test, PASAT and verbal
fluency test, but did not hold true for the third and fourth parts of the colour-word
interference test. This latter finding was in contrast to previous use of the colour-word
interference test in TBI studies (Batchelor et al., 1995, Bohnen et al., 1992, Lacroix and
Bailey, 1996) where performance on parts 3 and 4 has been shown to be worse in
symptomatic mild TBI patients compared to those who were asymptomatic, and
performance in part 4 has been shown to be significantly poorer in moderate and severe
TBI patients when compared to controls. In this study, the ANOVA analysis of the colour-
word interference test showed no significant inter-group differences in the third part of the
test, and although there was a significant inter-group difference in the fourth part, analysis
of the box plot revealed that the mean time taken by the moderate TBI patient group was
actually lower than that of the mild TBI patient group. This would have indicated that
executive function showed an improvement in the more severely injured patients, which
was unlikely to have been the case, as it was not supported by the findings in the other three
tests used to assess executive function. Each of these other tests showed a significant
reduction in executive function between the moderate TBI group and the control subjects,
but more importantly, a significantly poorer performance in the moderate TBI group than
in the mild TBI group in the case of the verbal fluency test. This ability of the verbal
fluency test to differentiate not only between patients and control subjects, but also between
groups classified according to injury severity has also been shown by other studies (Levin
et al., 2001, Wilson et al., 1991), although both assessed TBI patients in the chronic stages
of injury. While the SoIP and PASAT tests did not show a significant difference in
performance between the mild TBI and moderate TBI group when assessed with a t test, the
box plots revealed that the mean score and inter-quartile range of the moderate group was
170
below that of the mild TBI group in both cases, indicating a trend towards poorer executive
function as measured by these tests as well.
A reduction in memory function in the patient groups compared to the controls was also
evident, albeit less so than the differences in executive function discussed above. The
design learning test showed a significant difference in memory function on the first part of
the test (5 attempts at copying a design from memory) between the mild TBI and moderate
TBI groups. This demonstrated a difference in short-term memory performance, related to
injury severity, although there was no significant difference shown between either of the
patient groups and the control subjects. The list learning test however, was able to
differentiate between the control group and the two patient groups, but not between the
patient groups themselves. This was true not only of the first part of the test which assessed
short-term memory, but was also true in the post-interference recall score which
specifically tested working memory. Likewise, the score from the digit span backwards test
showed a significant difference between each of the patient groups and the control subjects,
but it also did not demonstrate any difference in memory performance related to the
severity of injury. These results contrast with findings in the literature, where studies have
demonstrated a correlation between injury severity as measured by GCS and severity of
memory deficits observed, both in the acute phase and chronic stages after TBI (Perlstein et
al., 2004, Ponsford et al., 2004). The results of the spatial span backwards test revealed a
large degree of overlap between the three groups, with very similar inter-quartile ranges
and means in each group. This suggested that there was a large spread of performance in
this particular test, and the results did not seem to be directly related to TBI severity. The
PASAT, besides assessing executive function, also relied heavily on working memory, and
therefore the results from this test were relevant in determining whether memory function
was affected by TBI in this study. As described above, the PASAT results showed
significant differences between the two patient groups and the control subjects, but not
between the patient groups themselves. This inability of the PASAT test to differentiate
between less severely and more severely injured patients is consistent with previous
findings in the literature: while studies have shown a difference in PASAT scores between
TBI patients and control subjects, they have not been able to show a correlation with
measures of injury severity (Bate et al., 2001, O'Jile et al., 2006, O'Shaughnessy et al.,
1984, Strauss et al., 2006). Overall, it seems that these tests consistently showed a reduction
171
in memory performance in the patient groups compared to the control subjects, but the
observed reduction in performance was not shown to be related to injury severity, which
may again have been due to the very small numbers in the moderate TBI group.
As attention and concentration are cognitive functions required for all of the tests in the
neuropsychology battery, and as all of the tests showed significant differences in at least
one of their scores, attention and concentration could therefore be assumed to have been
reduced in the patient groups compared to the control subjects. However, it is impossible to
tease out the reason for the differences in test results and categorically state that it was
solely due to a deficit in attention or concentration, when in fact it may have been poorer
performance in memory or executive function that was the reason for the significant
differences observed. It must be noted that fewer of the TBI patients than the control
subjects were able to complete all of the tests in the battery, and this in itself may be an
indication of a reduced ability to concentrate or remain attentive in those particular cases.
6.3.3 Analysis of the scan data with reference to cognitive function
The third aim of the study was to determine whether existing damage detectable by
quantitative MR scanning correlated with any post-concussive cognitive symptoms that had
been demonstrated on neuropsychological assessment. In the section above, it has been
shown that differences in cognitive function were evident between the patient groups and
control subjects, and in the previous chapter such inter-group differences were also shown
to have been detectable in the quantitative MR data. This section discusses correlations
between the scan findings and the neuropsychology findings.
Before analysis of any correlations could be made, three factors needed to be taken into
account. The first was the fact that while the majority of patients completed the
neuropsychology test battery, the patient numbers completing the tests in the moderate TBI
group were so small (between 6 and 8 in each test) that separate analysis of this group, by
examining correlations with the scan data, would have been meaningless. The moderate
TBI group was therefore combined with the mild TBI group, and served to strengthen any
significant correlations demonstrated in the analysis. The second factor was the impact of
the difference in premorbid predicted IQ between the control subjects and the patient
groups. Premorbid IQ is known to be correlated with almost all of the neuropsychology
tests used in this study, and therefore as mentioned in section 6.3.1, the predicted IQ was
172
used as a covariant of no interest, so as to take into account any bias which may have been
introduced by this difference. The third factor was that scan data from all of the analysis
methods was analysed with respect to the neuropsychology test scores, and as this involved
a large number of correlations, a Bonferroni correction was performed to ensure that any
significant results observed were less likely to be a result of chance, and more likely to be
representative of a true correlation.
Analysis of correlations between the MR values and the neuropsychology test scores
revealed significant differences in data from each of the four analysis methods used. The
greatest number of significant correlations existed in the 5 ROI data, in both the whole
brain and the frontal lobe regions. One reason for this is likely to be the Bonferroni
corrections made; the increased number of regions analysed when data from the 14
automated ROI method was examined led to a very low p-value having to be taken as
significant, and there is no doubt that if this strict correction had not been made, more
significant correlations would have become apparent. However, such strict Bonferroni
corrections were not necessary in the tractography designed ROI datasets, as there were
only 3 regions in that method, analysed with respect to only one tissue type: white matter,
and although the Bonferroni corrections in this analysis did not reduce the significance
level of the p-value at all in some cases (where only one region was examined) there were
still very few significant correlations between data from the tractography ROIs and the
neuropsychology test scores.
6.3.4 Neuropsychology test score correlations with the qT1 data
Interestingly, although the results discussed in Chapter 5 outlined that the only
whole brain quantitative dataset to show differences in the group comparison was the grey
matter qT1 data, it was the whole brain white matter qT1 time that demonstrated significant
correlations with the PASAT 3 second and 2 second scores (PASAT 3 R2= 0.143, PASAT
2 R2= 0.158). The PASAT requires attention, working memory and information processing,
and the score is therefore reduced when any of these functions is affected. The fact that the
group comparison of whole brain white matter qT1 time did not show significant
differences could be due to the fact that injury may have caused a wide spread of
differences in white matter qT1 values, making the group variance (the standard deviation)
173
higher in the patients and confounding the group statistics, whereas the correlation analysis
uses that very variance to explain the individual performance of each patient.
The only other neuropsychology test score found to correlate with white matter qT1, in the
frontal lobes in the 5 ROI data, and in the superior left frontal region in the 14 ROI data,
was the time taken for the fourth part of the colour-word interference test, although the R2
value for the correlations with these two ROIs were only 0.052 and 0.089 respectively. This
part of the colour-word interference test assesses both verbal inhibition and cognitive
flexibility, and has been shown previously to differentiate between symptomatic and
asymptomatic mild TBI patients (Bohnen et al., 1992). When assessed purely by group
comparison in section 6.1.10, the results, although significant, showed the unexpected
finding of poorer performance in the mild TBI group compared to the moderate TBI group.
This subsequent finding of a significant correlation between the time taken for the fourth
part of the colour-word interference test and white matter qT1 values underlines the
importance of evaluating the scan findings in the context of cognitive function, as it appears
that by stratifying the patients according to their performance, a relationship with possible
microstructural damage has become evident.
Significant correlations were also observed between frontal lobe grey matter qT1 time and
both the recall score for the interference design in the design learning test (R2= 0.107),
which assesses visuospatial learning and short-term and working memory, and the letter
fluency score in the verbal fluency test (R2= 0.168), which assesses the phonemic fluency
component of executive function. The letter fluency score also showed a significant
correlation with grey matter qT1 in the left temporal region data from the 14 automated
ROI analysis. Of these correlations, the most interesting relationship lay between the
temporal lobe grey matter qT1 and the letter fluency score; the R2 value of 0.2 indicating a
stronger correlation than in other regions. Although temporal lobe damage has been shown
to most strongly affect semantic fluency (Henry and Crawford, 2004), the effect of
temporal lobe damage on phonemic fluency has still previously been shown to be
significant, and this is therefore backed up by the findings of this study: a significant
correlation between increase in temporal lobe grey matter qT1 and decrease in letter
fluency.
174
6.3.5 Neuropsychology test score correlations with the DTI data
As with the stand-alone analysis of the scan data, the majority of significant findings when
correlated with the neuropsychology test scores were found to be in the grey matter DTI
datasets. Frontal lobe grey matter MD was found to correlate with all of the separate scores
from the verbal fluency test: specifically a reduction in MD correlated with a poorer verbal
fluency test performance. This indicated a relationship between the diffusion properties of
water molecules within the frontal lobe cortices and both the clustering and switching
components of executive function.
However, the most striking finding in all of this section of the data analysis was the
consistent finding of significant correlations between frontal lobe grey matter FA and the
neuropsychology test scores. Significant correlations were revealed with both the initial 5
recall attempts and post-interference recall design learning scores, the initial 5 attempts list
learning score and the PASAT 3 second score, all indicating a link between an increase in
frontal grey matter FA and a reduction in memory performance.
There were also significant correlations shown between frontal grey matter FA and the
speed of information processing adjusted total, the category fluency and both switching
scores from the verbal fluency test, the colour-word interference test (both part 3 time and
part 4 time) and as mentioned above, the PASAT 3 second score. These correlations all
signify an association between an increase in frontal grey matter FA and a deficit in a
number of components of executive function.
In the data from the tractography designed corpus callosum ROIs significant correlations
were shown between the letter fluency score from the verbal fluency test and the genu FA
and splenium MD. An increase in the genu white matter FA was found to correlate with a
decrease in letter fluency score, and a decrease in splenium white matter MD was also
found to correlate with a decreased letter fluency score. There were significant correlations
between the letter fluency score and the secondary and tertiary eigenvalues, the mean of
which gives a value for radial diffusivity, perpendicular to the primary eigenvalue, which
indicates axial diffusivity (section 2.6.1, Figure 2.8). A decrease in the radial diffusivity in
the splenium of the corpus callosum correlated with a reduction in letter fluency.
175
The last set of correlations to outline were those revealed by the TBSS analysis, which
showed a correlation between a poorer score in the verbal fluency test, and increased FA in
the left and right superior corona radiata, and to a lesser extent in fibres in the right genu
and right splenium of the corpus callosum, in the right anterior thalamic radiation, left
fornix, right and left superior longitudinal fasciculus and right and left cingulum. This
correlation was evident not only in the whole patient group, but also in the mild TBI group
when it was analysed independently. In the TBSS analysis, there was also a correlation
demonstrated between a reduced category fluency score and an increase in FA, and
although this was present in fewer voxels than the correlation with letter fluency, the
significant regions were again primarily located in the left and right superior corona radiata
and generally overlapped with the areas where the correlation with letter fluency had been
shown.
6.3.6 Analysis of significant correlations
Not only have the inter-group comparisons of the neuropsychology test scores (section 6.1)
shown that the patient groups in this study suffered with memory and executive function
deficits, but the analysis of the scan data with reference to the neuropsychological data
(section 6.2) has demonstrated that those deficits correlate with quantitative MR values,
both in grey matter and in white matter in a number of regions within the brain. These
correlations been shown to exist in the frontal lobes and white matter tracts, and have also
been observed in the temporal lobe data and in the whole brain analysis.
The cognitive functions shown to correlate with the scan findings in sections 6.3.4 and
6.3.5 above, are known to be dependent on frontal lobe function, and have been shown
previously in studies into TBI to be affected by damage to the frontal lobes (Hartikainen et
al., 2010, Kersel et al., 2001, Kim et al., 2009, Kim et al., 2010, Kinnunen et al., 2011,
Lipton et al., 2009, McDowell et al., 1997, Sanchez-Carrion et al., 2008b). Likewise, the
quantitative scan findings in this study, reported in chapter 5, support findings in previous
MR studies of TBI, where similar changes have been thought to represent microstructural
damage in tissue appearing normal on conventional CT or MRI (Hou et al., 2007, Naruse et
al., 1982, Newcombe et al., 2008, Sibson et al., 2008). The fact that the same cognitive
deficits shown in the TBI patient group in this study correlate with differences in the
quantitative scan data, makes it likely that the these differences in the data represent
176
damage in the areas responsible for the cognitive functions seen to be affected, or in
networks connecting regions implicit in their function.
In this study, an increase in whole brain white matter qT1 time was found to negatively
correlate with executive function, while an increase in frontal and left temporal grey matter
qT1 time was found to correlate with both poorer short-term and working memory and a
deficit in the phonemic fluency component of executive function. As discussed in section
5.6.6, an increase in grey and white matter qT1 time may be indicative of ongoing diffuse
vasogenic oedema and astrocyte activation as part of the autoimmune response following
traumatic brain injury (Morganti-Kossmann et al., 2007, Naruse et al., 1982, Sibson et al.,
2008). These correlations therefore make it possible that the observed disruptions in
cognitive function are caused by these pathophysiological responses to injury. Reasons why
this correlation was not demonstrated in comparisons with other neuropsychological tests
which examined the same cognitive functions may be that the other tests were less
sensitive, or that they utilised different interconnecting pathways and brain networks which
had remained undamaged (Kinnunen et al., 2011). No studies have been identified
correlating quantitative T1 relaxometry with post-concussive deficits in cognitive function
and as a result no comment can be made as to whether the observed correlations can be
supported by previous work in the field.
The findings observed in the frontal lobe grey matter DTI data were a correlation between a
reduction in frontal lobe MD and a deficit in the phonemic fluency component of executive
function, and a negative correlation between FA and both memory performance and a
number of components of executive function, namely: clustering (with respect to semantic
fluency), switching, information processing, verbal inhibition and cognitive flexibility. As
outlined in section 5.6.7, previous studies have observed a reduction in localised grey
matter diffusion in TBI patients with a similar injury to scan time as in this study (Hou et
al., 2007, Newcombe et al., 2008), and attribute the decrease in grey matter MD to the
presence of peri-contusional cytotoxic oedema. In this hypothesis, the increased volume of
intracellular fluid as a result of the cytotoxic oedema is thought to limit localised
extracellular space, thereby restricting the diffusion of extracellular fluid. As extracellular
fluid is more easily diffusible than intracellular fluid, this would result in a net reduction in
diffusion, and therefore account for a reduction in grey matter MD.
177
It is however, difficult to explain the correlations between the poorer neuropsychology test
scores and the increase in grey matter FA. Fractional anisotropy is a measure thought to be
most relevant in brain white matter, as the movement of water molecules is restricted by the
myelin sheaths of the axons within the fibre bundles of this tissue type. FA has therefore
been used predominantly as a measure of white matter tract integrity, and significant
alterations in FA have been hypothesised to indicate white matter damage. The author has
not been able to identify any DTI studies that have looked specifically at FA changes in
grey matter after TBI, which may be due to the fact that as there are no myelinated axons
within grey matter it has not been considered useful or practical to analyse, nor would there
be a simple hypothesis to explain any observed changes. We do know from a study
examining grey matter FA in acute stroke, that the microstructure of normal grey matter,
although not as restrictive as that of white matter, still has an FA value twice that of the
almost completely isotropic CSF spaces, although the grey matter under scrutiny was in the
deep grey structures and not in the cortex (Sorensen et al., 1999). In that paper however, the
authors found there was no significant difference between the FA measurements in
ischaemic grey matter and normal grey matter, and it is therefore unlikely that the finding
of increased grey matter FA in this study is due to underlying ischaemia. Another study
which observed grey matter FA as part of a combined tissue FA histogram analysis in
multiple sclerosis (Cercignani et al., 2001), found that there was a difference in the
histogram between patients and matched controls, but attributed this change to differences
in white matter FA only.
A possible explanation for the increase seen in grey matter FA draws on findings made by
previous studies in white matter DTI measurements. A number of papers have reported on a
relationship between increased white matter FA and decreased white matter MD,
hypothesising that anisotropy increases due to axonal swelling as a result of cytotoxic
oedema which further restricts free movement of water molecules in the extracellular space,
in turn decreasing the mean diffusivity as a result (Chu et al., 2009, Hartikainen et al.,
2010, Wilde et al., 2008). If the same relationship exists between MD and FA in grey
matter, then the possible explanation of the reduction in grey matter MD being due to the
presence of cytotoxic oedema reducing the extracellular water diffusion may also be the
explanation behind the increase seen in grey matter FA. We know that fractional anisotropy
increases as diffusion becomes more restricted. Therefore as the extracellular spaces are
178
compressed by the cellular swelling that occurs in cytotoxic oedema, movement of water
molecules may become much more restricted in some directions, and have a predilection
for others, mimicking the environment within brain white matter fibre tracts within each
grey matter voxel. If this hypothesis were true, then an increase in frontal grey matter FA
could indicate cortical damage in the frontal lobes, and as the frontal cortex and especially
the prefrontal cortex are implicated in short-term memory function and executive function,
damage in this region would explain the multiple correlations evident between frontal grey
matter FA and the features of PCS seen in the patient group. The author is not aware of any
studies that have looked at correlations between grey matter diffusion properties and post-
TBI deficits in cognitive function, and therefore it is not possible to say whether these
correlations support or contrast previous findings.
Lastly, it is necessary to discuss the correlations between white matter FA and MD, and the
neuropsychology test results. Increases in the FA in a number of white matter tracts and in
frontal lobar white matter were shown to correlate with all components of executive
function measured by the verbal fluency test, while a decrease in white matter MD in the
splenium of the corpus callosum correlated specifically with poorer phonemic fluency.
These findings support those reported by Hartikainen et al. (2010) who examined 18
patients 3 weeks after injury and divided them into symptomatic and asymptomatic groups.
They found that the symptomatic group had a significantly poorer performance on
executive function tests, and also showed a significantly increased FA and decreased ADC
in the midbrain. These correlations are perhaps the most easily explained, as executive
function is heavily associated with the frontal lobes, and in order to orchestrate higher
intellectual function, also relies upon abundant connections to almost all other cortical and
subcortical structures (Hodges, 1994). It is known that a reduction in radial diffusivity
(perpendicular to the axonal diffusivity which is in line with the axons) can cause an
increase in FA, and in the splenium of the corpus callosum there was an observed
correlation between a reduction in phonemic fluency and the secondary and tertiary
eigenvalues, the mean of which gives the radial diffusivity. Therefore, the pattern of
increased FA and reduced MD in these regions so necessary for executive function is likely
to represent underlying axonal swelling due to cytotoxic oedema, which in turn has caused
the observed deficit in cognitive function.
179
An interesting observation to be made regarding the analysis of the scan data with the
neuropsychology test scores is the difference between the quantitative measures found to
have significant correlations and the quantitative measures shown to be significant in
simple inter-group analysis. For instance, in the inter-group analysis there were no
significant differences in white matter FA, and the only significant differences observed
between groups in the grey matter FA were in the right occipital and right temporo-parietal
regions. However, by assessing the correlations between white and grey matter FA and the
neuropsychology test scores, it became immediately apparent that frontal grey matter FA
was significantly correlated with poorer memory performance and multiple deficits in
executive function in the patients suffering with PCS. The lack of significant findings when
the group comparisons were made may be explained by the fact that the mild TBI group
contained patients with a range of PCS, at one end of the spectrum there were patients who
by the time they were scanned and tested were asymptomatic, with no visible abnormalities
on their CT or T1 weighted anatomical scan, and at the opposite end there were those with
ongoing headache, dizziness and nausea, who had a history of LOC at the time of injury
and PTA for a period of time afterwards, and whose CT and T1 weighted anatomical MRI
scans had shown positive findings. It is likely that the patients with the most mild injury
would have had quantitative scan data values very similar to those in the control group, and
by grouping all of the mild patients together, it is possible that any significant differences
in the more symptomatic patients were diluted to a non-significant level. It could be argued
that if this explanation were true, the analysis of the quantitative data after grouping the
mild TBI patients by AAN grade would have allowed those results to become evident, but
by dividing the mild TBI group into three subgroups, the numbers being compared were
then so small that a meaningful analysis demonstrating significant results was unlikely.
6.4 Limitations
The first and most important limitation to mention with regard to the neuropsychology
results is the fact that there was a significant difference in the premorbid predicted IQ of the
patient groups, compared to that of the control subjects. During the course of recruitment to
the study, every effort was made to attempt to match each of the TBI patients to a suitable
control subject. However, it would seem that the demographic of those who are willing and
180
have the time to volunteer (unpaid) as control subjects in an MRI study, is not the same as
the demographic of those who are typically brought in to the accident and emergency
department in the small hours of the morning with a head injury. While this is obviously in
part a generalisation, the TBI patients and control subjects were unfortunately both self-
selecting groups with little overlap. This limitation was addressed in the section on analysis
of correlations between the neuropsychology test scores and the scan data, by adjusting for
predicted IQ as measured by the NART test, but was still potentially a source of bias, not
only due to the fact that the neuropsychology test battery was known to be sensitive to IQ,
but in some cases the lower predicted IQ of the patient group may even have led to an
inability to correctly understand the test instructions.
Another limitation in the analysis of the correlations in this chapter is the variability of the
fit of the points on the scatter plots with the line of best fit. While all of the correlations
examined in the discussion section were significant, even after Bonferroni corrections had
been made, scrutiny of the plots themselves, along with their R2 values, showed that some
of the correlations were stronger than others. It may well be the case that some of the
correlations were driven by two or three outliers, particularly in those observed in the
colour-word interference test, and were the data from these patients to have been removed,
there may not have been a significant correlation. Larger group sizes, specifically a greater
number of moderate TBI patients would have strengthened any significant correlations
shown.
As in the limitations of the quantitative scan data analysis in section 5.7, the variability in
time from injury to neuropsychology testing may have introduced bias into the results.
Ideally patients would have all been tested within a shorter time frame from their injury, but
as explained previously, a number of factors, such as the clinical state of the TBI patients
and the fact that the MR scanner and facility for neuropsychology testing were in a separate
non-clinical area, meant that this was not possible.
181
6.5 Conclusions
The neuropsychology test results showed that each test within the battery revealed
significant differences between the three groups: mild TBI patients, moderate TBI patients
and control subjects. The results highlighted that our study population was representative of
the TBI population as a whole, displaying deficits in short-term and working memory,
attention, concentration and executive function. Some of the tests were only able to
differentiate between the control group and the patient groups, but not between the mild
and moderate patient groups themselves. Other tests however, such as the verbal fluency
test, were related to injury severity and discriminated between the patients who had
sustained a mild TBI and those with a moderate TBI.
The results from the 3-way group comparisons of the tests assessing executive function
(Speed of Information Processing (SoIP) test, the PASAT, the Verbal Fluency test, and the
third and fourth parts of the colour-word interference test) showed there to be a significant
reduction in executive function performance in the patient groups compared to the control
subjects, and in the case of the verbal fluency test, as mentioned above, there was a
significant correlation between test performance and injury severity.
A reduction in memory function in the patient groups compared to the controls was also
evident, albeit less so than the differences in executive function discussed above. Short-
term and working memory function was tested by the design learning and list learning tests,
the DSPAN back and spatial span back tests, and by the PASAT. Overall, it seems that
these tests consistently showed a reduction in memory performance in the patient groups
compared to the control subjects, but the observed reduction in performance was not shown
to be related to injury severity, which may have been due to the very small numbers in the
moderate TBI group.
The neuropsychology results were then used in the analysis of the scan data, and revealed
correlations between post-concussive deficits in cognitive function measured and
microstructural changes detected using quantitative MR scan techniques in patients with
mild and moderate traumatic brain injury. Significant correlations were shown between an
increase in both white matter and grey matter quantitative T1 time and a reduction in
performance in working memory and executive function. Similar cognitive deficits in
memory and executive function were also shown to correlate with a decrease in frontal grey
182
matter MD and an increase in frontal grey matter FA. Lastly, white matter FA increases in
the genu and splenium of the corpus callosum, corona radiata, superior longitudinal
fasciculus and cingulum were observed to negatively correlate with all components of
verbal fluency. These findings support the third of the study hypotheses:
“Detectable microstructural changes in the TBI population
correlate with post-concussive cognitive deficits when assessed using the
appropriate neuropsychological tests.”
The observed correlations between the neuropsychology test scores and the differences in
quantitative MR values indicate that the cognitive deficits seen in mild and moderate TBI
patients are related to detectable grey and white matter micro-structural changes in brain
tissue that appear normal on conventional anatomical imaging. It is likely that these
changes represent damage as a result of traumatic brain injury in the regions responsible for
the cognitive functions seen to be affected.
183
Chapter 7. Summary
7.1 Main Findings
This thesis explored the use of quantitative MR scanning techniques in mild and moderate
traumatic brain injury. These techniques allowed the measurement of a number of
parameters: quantitative T1 (qT1) and quantitative T2 (qT2) relaxation times and the mean
diffusivity (MD) and fractional anisotropy (FA), the latter two of which were calculated
from diffusion tensor imaging (DTI) data. The qT1 and qT2 have previously been shown to
reflect underlying pathophysiological changes in brain injury, and MD and FA are known
to represent the diffusion properties of water molecules, and have also been found to be
altered in TBI. These quantitative measurements were made using four different analysis
techniques: a basic 5 regions of interest (ROI) method, an automated 14 ROI method, a
tractography-designed ROI method and a voxel-wise comparison: tract-based spatial
statistics (TBSS). The first three of these analysis techniques were performed in the
‘patient’s space’ and the latter in ‘standard space’. In addition to performing the analysis on
the whole brain (5 ROI method) and the divided whole brain volume (14 automated ROI
method), specific regions were analysed that had previously been shown to be susceptible
to diffuse damage in TBI, namely the frontal lobes, corpus callosum and white matter
tracts.
The main aims of this work were to ascertain whether detectable damage existed at a
microstructural level after acute mild and moderate TBI and if such damage existed,
whether it was proportional to injury severity as assessed by the Glasgow Coma Scale, and
whether it correlated with post-concussive cognitive symptoms detected by
neuropsychological assessment.
7.1.1 Quantitative MR scan findings
This study has revealed an increase in quantitative T1 relaxation time in whole brain
normal appearing grey matter in mild and moderate TBI patients within two weeks of
injury, when compared to matched control subjects. The ROI analysis findings have also
demonstrated frontal lobe changes in normal appearing tissue in both patient groups when
compared to the controls; specifically an increase in both grey and white matter qT1 time,
184
an increase in white matter mean diffusivity, a decrease in grey matter mean diffusivity,
and a small area in the left superior region of the corona radiata that was shown to have an
increased FA. All of these findings were in normal appearing brain tissue, after any visible
lesions had been masked off and extracted from the data. There were no observed
differences in quantitative T2 relaxation time in any of the datasets in grey or white matter
regions. These findings supported the first study hypothesis: that acute differences exist at a
microstructural level between patients with traumatic brain injury and matched control
subjects that are detectable using quantitative MR scanning, in tissue appearing normal on
conventional anatomical MR imaging.
What these observed changes in the quantitative values represent is still not fully known,
but previous work in the field has demonstrated an increased grey and white matter qT1
time in relation to diffuse vasogenic oedema and astrocyte activation as part of the
autoimmune response following traumatic brain injury, and it is possible that these
pathophysiological responses to TBI were behind the increases in grey and white matter
qT1 seen in this study.
Reductions in grey matter MD have been shown in other published work to be related to
peri-contusional cortical damage and cytotoxic oedema, and it is possible that the finding of
reduced grey matter MD in this work also represents such damage, reflecting ongoing
ischaemia and cell necrosis adjacent to cortical lesions, or possibly cytotoxic oedema,
where the relative increase in intracellular fluid and reduction in extracellular fluid would
cause reduced free diffusion. The increase seen in white matter MD was most likely to be
due to axonal disruption causing a reduction in the restriction of micro-movement of water
molecules.
Inter-group paired analysis of the data revealed that although different quantitative datasets
were able to differentiate between different study groups, no data from any of the regions in
the 5 ROI analysis was able to differentiate between the mild TBI and moderate TBI
groups, presumably due to the small number of moderate TBI patients, and due to the
relatively broad range of injury severity seen in the mild TBI group: a spread between
patients who were almost asymptomatic to those with large numbers of post-concussive
symptoms. This lack of significant differences shown between the quantitative scan data
values in the mild and moderate TBI patient groups demonstrated that the findings in the
185
scan data were not proportional to injury severity as assessed by the Glasgow Coma Scale.
This finding did not support the second study hypothesis: that detectable microstructural
changes in the TBI population are proportional to the severity of the brain injury sustained.
However, by examining the scan data for correlations with scores from the
neuropsychology tests, it was anticipated that detected microstructural changes would, in
fact, be related to the severity of cognitive function impairment, a better measure of mild
TBI severity than the GCS score on admission.
7.1.2 Neuropsychology findings
The neuropsychology test results showed that each test within the battery revealed
significant differences between the three groups: mild TBI patients, moderate TBI patients
and control subjects. The results highlighted that our study population was representative of
the general TBI population, displaying deficits in short-term and working memory,
attention, concentration and executive function. Some of the tests were only able to
differentiate between the control group and the patient groups, but not between the mild
and moderate patient groups themselves. Other tests however, such as the verbal fluency
test, were related to injury severity and discriminated between the patients who had
sustained a mild TBI and those with a moderate TBI.
In terms of the individual cognitive functions assessed, the results from the 3-way group
comparisons of the tasks assessing executive function (Speed of Information Processing
(SoIP) test, the PASAT, the Verbal Fluency test, and the third and fourth parts of the
colour-word interference test) showed there to be a significant reduction in executive
function performance in the patient groups compared to the control subjects, and in the case
of the verbal fluency test, as mentioned above, there was a significant correlation between
test performance and injury severity. The components of executive function found to be
affected were: information processing, verbal inhibition and cognitive flexibility, and both
clustering and switching with regard to phonemic and semantic fluency.
The 3-way group comparison also demonstrated a reduction in memory function in the
patient groups compared to the controls, albeit to a lesser degree than the differences in
executive function discussed above. Short-term and working memory function was tested
by the design learning and list learning tests, the DSPAN back and spatial span back tests,
186
and by the PASAT. Overall, it seems that these tests consistently showed a reduction in
memory performance in the patient groups compared to the control subjects, but the
observed reduction in performance was not shown to be related to injury severity, which
may have been due to the very small numbers in the moderate TBI group.
Attention and concentration were measured in part by all of the neuropsychology test
battery, but were functions specifically required for the list learning and design learning
tests, and for the PASAT. The results from the group comparisons showed that it was likely
that there was a reduction in attention and concentration in the patient groups compared to
the control subjects. However, as mentioned above, it is impossible to tease out the reason
for the differences in test results and categorically state that poorer performance in a
particular test was solely due to a deficit in attention or concentration. A point to note is
that fewer of the TBI patients than the control subjects were able to complete all of the tests
in the battery, and this in itself may have been an indication of a reduced ability to
concentrate or remain attentive in those particular cases.
7.1.3 Correlations between quantitative MR data and neuropsychology test scores
The final part of the study analysis involved assessing the scan data using the
neuropsychology test scores. This revealed correlations between the post-concussive
deficits in cognitive function and the microstructural changes that had been detected using
quantitative MR scan techniques in the normal appearing tissues of patients with mild and
moderate TBI. Significant correlations were shown between an increase in both white
matter and grey matter quantitative T1 time and a reduction in performance in working
memory and executive function. Similar cognitive deficits in memory and executive
function were also shown to correlate with a decrease in frontal grey matter MD and an
increase in frontal grey matter FA. Lastly, white matter FA increases in the genu and
splenium of the corpus callosum, corona radiata, superior longitudinal fasciculus and
cingulum were found to negatively correlate with all components of verbal fluency. These
findings support the third of the study hypotheses: that detectable microstructural changes
in the TBI population correlate with post-concussive cognitive deficits when assessed using
the appropriate neuropsychological tests.
In this study, an increase in whole brain white matter qT1 time was found to negatively
correlate with executive function, while an increase in frontal and left temporal grey matter

187
qT1 time was found to correlate with both poorer short-term and working memory and a
deficit in the phonemic fluency component of executive function. As discussed previously,
a possible explanation for these correlations might be that ongoing diffuse vasogenic
oedema and astrocyte activation, both of which are known to cause an increase in grey and
white matter qT1, have caused disruption to the function of the frontal lobes and the
interconnecting afferent and efferent fibre tracts on which executive function relies.
The findings observed in the frontal lobe grey matter DTI data were: a correlation between
a reduction in frontal lobe MD and a deficit in the phonemic fluency component of
executive function, and a negative correlation between FA and both memory performance
and a number of components of executive function, namely: clustering (with respect to
semantic fluency), switching, information processing, verbal inhibition and cognitive
flexibility. The observed decrease in grey matter MD may be attributable to the presence of
peri-contusional cytotoxic oedema. A possible explanation for the increase seen in the grey
matter FA may also be underlying cytotoxic oedema, resulting in axonal swelling with
further restriction of free movement of water molecules in the extracellular space. This
increase in frontal grey matter FA could therefore have indicated cortical damage in the
frontal lobes, and as the frontal cortex and especially the prefrontal cortex are implicated in
short-term memory function and executive function, damage in this region would explain
the multiple correlations evident between frontal grey matter FA and the features of PCS
seen in the patient group.
The final correlations observed were between increases in the FA in a number of white
matter tracts and in frontal lobar white matter, and all components of executive function
measured by the verbal fluency test. A decrease in white matter MD in the splenium of the
corpus callosum also correlated specifically with poorer phonemic fluency. These
correlations are perhaps the most easily explained, as executive function is heavily
associated with the frontal lobes, and in order to orchestrate higher intellectual function,
also relies upon abundant connections to almost all other cortical and subcortical structures
It is known that a reduction in radial diffusivity (perpendicular to the axonal diffusivity
which is in line with the axons) can cause an increase in FA, and in the splenium of the
corpus callosum there was an observed correlation between a reduction in phonemic
fluency and the secondary and tertiary eigenvalues, the mean of which gives the radial
diffusivity. Therefore, the pattern of increased FA and reduced MD in these regions so
188
necessary for executive function is likely to represent underlying axonal swelling due to
cytotoxic oedema, which in turn has caused the observed deficit in cognitive function.
The observed correlations between the neuropsychology test scores and the differences in
quantitative MR values indicate that the cognitive deficits seen in mild and moderate TBI
patients are related to detectable grey and white matter micro-structural changes in brain
tissue that appears normal on conventional anatomical imaging. It is likely that these
changes represent damage as a result of traumatic brain injury in the regions responsible for
the cognitive functions seen to be affected or in the white matter pathways and networks
that interconnect between those regions.
7.2 Limitations
A number of limitations specific to either the quantitative scan data analysis methods or to
the aspects of the study that involved neuropsychology testing are mentioned in detail in
sections 5.7 and 6.4 above, but will be briefly reiterated here.
With regard to the quantitative MR data acquisition, pre-processing and subsequent
analysis, there were a number of limitations recognised by the author as a source of
possible bias. The first of these was the discrepancy in the numbers of patients recruited to
the mild TBI and moderate TBI groups. Ideally, in order to be able to more accurately
assess correlations with injury severity, a greater number of moderate TBI patients would
have been desirable. The fact that the time window from injury to scan had to be increased
from that originally outlined, to a period double that length (7 days to 14 days), may have
introduced bias into the scan data, as some patients may have been scanned after acute
microstructural changes had resolved. However, it must be noted that the time window was
still very narrow compared to other published work in the field, and was still likely to allow
the majority of acute changes to have been identified, if not all. Also mentioned above are
the inherent problems associated with ROI size and selection with the possibility that subtle
findings may have been ‘diluted’ to a level that was non-significant or missed altogether,
and the fact that there was a slight predominance of left sided visible lesions, although this
limitation is discussed in detail previously, and is unlikely to have had an impact on the
results.
189
There are two important factors that may have affected the data which have not previously
been discussed. The first of these was the fact that the analysis of the T1 weighted
anatomical scans and the quantitative imaging maps were examined for abnormalities only
by the author, a senior specialist registrar in neurosurgery. While it was felt by the study
team that this was appropriate, given the author’s experience in assessing neuroimaging
particularly in the setting of neurotrauma, it is possible that very subtle areas of damage
may have been missed, and therefore not masked off and extracted from the quantitative
datasets. In such cases the services of a second observer to analyse the scans may have been
beneficial. With this in mind, a post hoc analysis of the visible scan abnormalities was
performed by a senior radiographer blinded to the reports created by the author, and their
observations were found to match the original findings. It should also be noted, that in
those patients in whom CT scans had been performed as part of their clinical management,
a formal report was available from a clinical radiologist, and the data from those reports
was taken into account when the anatomical and quantitative MR images were being
assessed.
The second factor not previously mentioned was the fact that the majority of patients
included in the study had visible evidence of TBI on their conventional CT or MR scans. A
reason for this may have been that most of the patients had been referred to the
neurosurgical department, and would have therefore been identified by the referring doctors
as patients whose TBI might necessitate more management than a simple overnight stay for
observation in a district general hospital. Although these decisions are based in part on the
clinical status of the patient, scan findings also heavily influence such decisions, and
therefore more of the patients who are transferred to neurosurgery will have abnormal
scans. Given that the aim of the work was to identify microstructural damage in normal
appearing tissue and correlate it with observed deficits in cognitive function, it could be
argued that this high rate of visible scan findings may have undermined the study findings.
It is possible that the cognitive deficits in the patient group were caused by the visible
injuries, and that they were not related to the detected changes in normal appearing tissue at
all. In order to address this potential criticism, one only needs to scrutinise the reports of the
scan findings in the individual patients in Tables 5.2 and 5.3. This shows that although a
large percentage of patients had visible abnormalities, the number of those that displayed
intra-parenchymal injuries, as opposed to extra-axial haematomas and skull fractures, was
190
only 31 (58%), and of those, the majority had only very small basi-frontal or temporal
contusions which did not explain their cognitive deficits. This made these patients
representative of the very TBI population this work had set out to examine, and makes it
less likely that any reductions in cognitive function were due to visible brain injuries.
With regard to the neuropsychology results, the first limitation was the fact that there was a
significant difference in the premorbid predicted IQ of the patient groups, compared to that
of the control subjects. This was addressed by adjusting for predicted IQ, by including it as
a covariant of no interest in the analysis of correlations between the scan data and
neuropsychology test scores, but was still potentially a source of bias. Another limitation in
the analysis of the correlations was the variability of the fit of the points on the scatter plots
with the line of best fit; scrutiny of the plots themselves and their R2 values, showed that
some of the correlations were stronger than others. However, all of the correlations
examined in the discussion section had been found to be significant, even after Bonferroni
corrections had been made. Larger group sizes and a greater number of moderate TBI
patients would have strengthened any significant correlations shown. The variability in time
from injury to neuropsychology testing may also have introduced bias into the results;
ideally patients would have all been tested within a shorter time frame from their injury, but
as explained previously, a number of factors, such as the clinical state of the TBI patients
and the fact that the MR scanner and facility for neuropsychology testing were in a separate
non-clinical area, meant that this was not possible.
Finally, the mismatch between the number of patients recruited and the number of matched
control subjects ought to be mentioned, due to the fact that ideally a control subject should
have been recruited for each patient. Difficulties recruiting suitable control subjects meant
that this was unfortunately not possible, but it was felt that sufficient numbers of control
subjects had been recruited to enable robust comparisons.
7.3 Future Work
As discussed in the rationale for the study, there have been very few quantitative MR
studies evaluating mild TBI in the acute stage after injury, and therefore the scope for
further work in this area is great. The findings from cross-sectional studies, such as the
191
work presented in this thesis may be better understood in the context of a longitudinal data,
and indeed, to address this, a proportion of the patient group whose results are presented in
this thesis have agreed to return for a follow up scan and further neuropsychology testing
using the same scan protocol and test battery. We hope to present the findings from the
analysis of this data in due course.
There are other existing MR scan techniques known to provide even more information in
brain injury, particularly on the pathophysiological changes that occur. Arterial spin
labelling, or ASL, is a technique that measures perfusion using arterial water flowing into
the cerebral vasculature as the contrast agent. This is performed by magnetically labelling
the inflowing hydrogen nuclei within the arterial blood, and therefore removes the necessity
for an exogenous contrast agent and is completely non-invasive. Magnetic resonance
spectroscopy (MRS) is another technique which takes advantage of the properties of nuclei
to align with a strong applied magnetic field, and has been developed to allow
differentiation between the relative concentrations of chemical compounds contained in
those nuclei. MRS is therefore able to give detailed data on the chemical changes after
microscopic injury within the brain after TBI. Both ASL and MRS data were also obtained
in the TBI patient group and the control subjects whose quantitative data was presented in
this work, and it is intended that the analysis of this additional data will be combined with
the findings from this thesis to provide a complete picture of the non-invasive findings in
mild and moderate TBI.
One particular further area of interest to the author, given the number of significant findings
in grey matter fractional anisotropy in this study, would be the development of non-
invasive techniques to better examine this brain region in the context of brain injury.
Currently it seems, there is little interest in the field regarding the FA properties of grey
matter and what changes in them might indicate, particularly after TBI, but this lack of grey
matter FA findings using standard DTI sequences is stimulating research into other scan
techniques. A recent paper published in Magnetic Resonance in Medicine (Shemesh and
Cohen, 2011) has examined the application of a novel DTI technique to determine whether
it can provide information on microscopic anisotropy even when the structure of the tissue
being analysed is completely randomly oriented. One of the difficulties of analysing grey
matter FA data, as mentioned above, is due to the fact that it consists not of an ordered
structure of myelinated axons, but instead of neuronal cell bodies of different shapes, along

192
with dendrites and axons extending from them in a random manner. Shemesh and Cohen
state that their findings show that the technique is able to offer microstructural information
which cannot be obtained from conventional DTI sequences and they conclude that the
technique shows promise in being able to characterise underlying microstructure in brain
grey matter. Such methods would have been extremely useful in the analysis of the data
from this study, and if used in future studies, may yet shed light on the underlying reasons
for the observed increase in grey matter FA.
7.4 Conclusion
Using quantitative MR imaging techniques, this study has demonstrated that
microstructural changes exist and are detectable in normal appearing grey and white matter,
in patients with mild and moderate traumatic brain injuries when compared to matched
control subjects. Furthermore, while the observed changes did not show a correlation with
injury severity as measured by the GCS, there were significant correlations between the
quantitative scan data and the severity of deficits in cognitive function as measured using
an appropriate battery of neuropsychology tests. There were no such correlations found in
the control subjects.
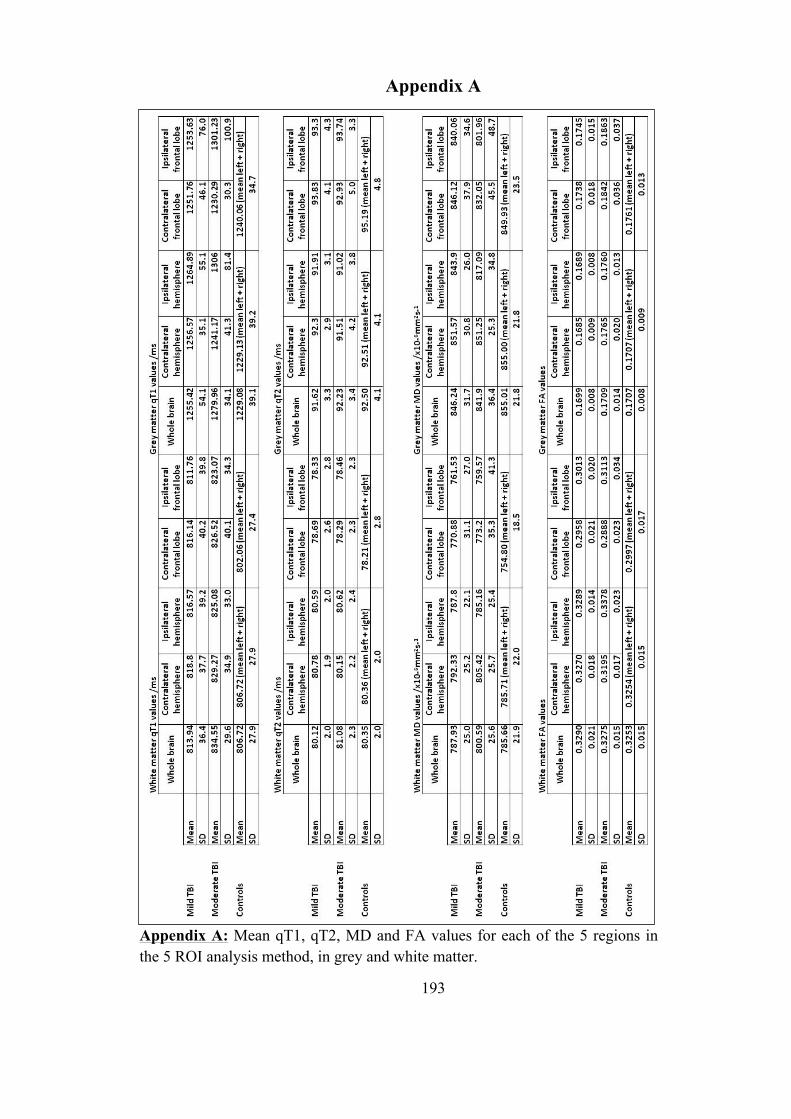
193
Appendix A
Appendix A: Mean qT1, qT2, MD and FA values for each of the 5 regions in the 5 ROI analysis method, in grey and white matter.
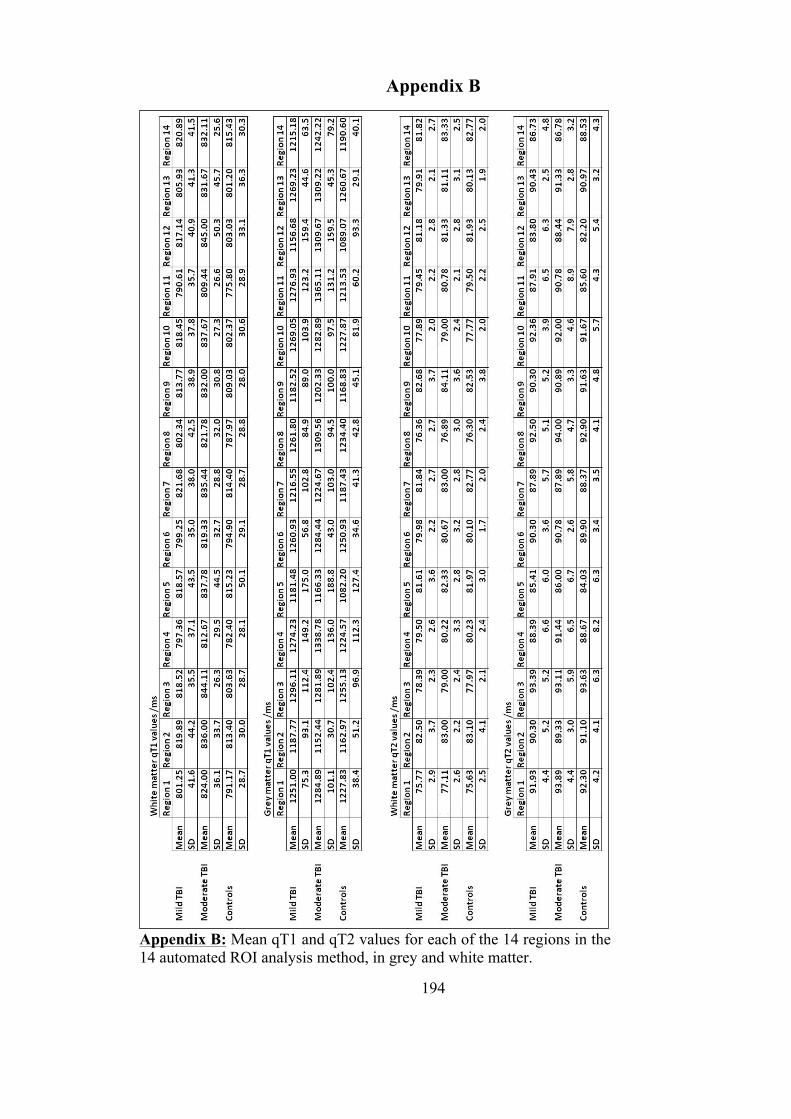
194
Appendix B
Appendix B: Mean qT1 and qT2 values for each of the 14 regions in the 14 automated ROI analysis method, in grey and white matter.
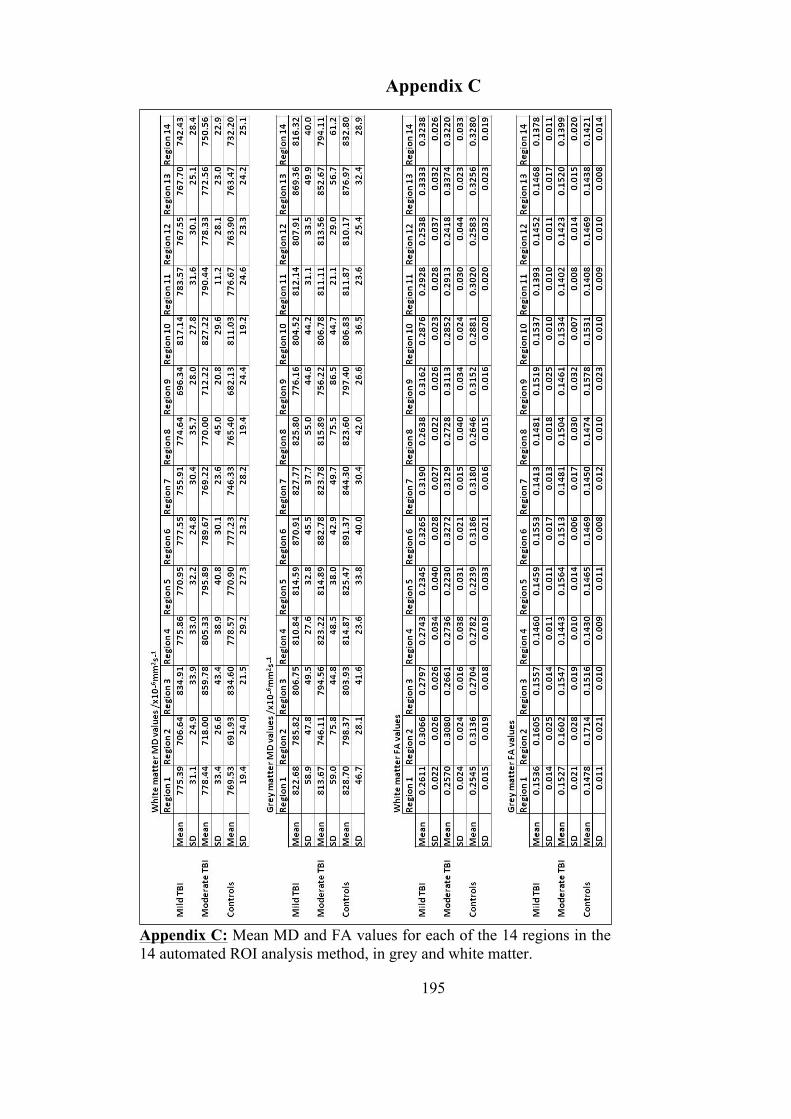
195
Appendix C
Appendix C: Mean MD and FA values for each of the 14 regions in the 14 automated ROI analysis method, in grey and white matter.

196
Appendix D
Appendix D: Mean MD, FA and eigenvalues for each of the 3 regions in the tractography designed ROI analysis in grey and white matter.
197
References
ABRAHAMS, S., GOLDSTEIN, L. H., SIMMONS, A., BRAMMER, M. J., WILLIAMS, S. C. R., GIAMPIETRO, V. P., ANDREW, C. M. & LEIGH, P. N. (2003) Functional magnetic resonance imaging of verbal fluency and confrontation naming using compressed image acquisition to permit overt responses. Human Brain Mapping, 20, 29-40.
ADAMS, J. H., DOYLE, D., FORD, I., GENNARELLI, T. A., GRAHAM, D. I. & MCLELLAN, D. R. (1989) Diffuse Axonal Injury in Head-Injury - Definition, Diagnosis and Grading. Histopathology, 15, 49-59.
ADAMS, J. H., JENNETT, B., MCLELLAN, D. R., MURRAY, L. S. & GRAHAM, D. I. (1999) The neuropathology of the vegetative state after head injury. Journal of Clinical Pathology, 52, 804-806.
ARFANAKIS, K., HAUGHTON, V. M., CAREW, J. D., ROGERS, B. P., DEMPSEY, R. J. & MEYERAND, M. E. (2002) Diffusion tensor MR imaging in diffuse axonal injury. American Journal of Neuroradiology, 23, 794-802.
ARIBISALA, B. S., HE, J. & BLAMIRE, A. M. (2011) Comparative Study of Standard Space and Real Space Analysis of Quantitative MR Brain Data. Journal of Magnetic Resonance Imaging, 33, 1503-1509.
ARIBISALA, B. S., HE, J., THELWALL, P. E., HOLLINGSWORTH, K. G. & BLAMIRE, A. M. (2008) Automatic Regional Analysis of Quantitative Relaxation Times Mapping in the Brain. International Society for Magnetic Resonance in Medicine. Toronto.
ASHIKAGA, R., ARAKI, Y. & ISHIDA, O. (1997) MRI of head injury using FLAIR. Neuroradiology, 39, 239-242.
ASHTON, V. L., DONDERS, J. & HOFFMAN, N. M. (2005) Rey Complex Figure Test performance after traumatic brain injury. Journal of Clinical and Experimental Neuropsychology, 27, 55-64.
BALDO, J. V., SHIMAMURA, A. P., DELIS, D. C., KRAMER, J. & KAPLAN, E. (2001) Verbal and design fluency in patients with frontal lobe lesions. Journal of the International Neuropsychological Society, 7, 586-596.
BALL, C. G., BALL, J. E., KIRKPATRICK, A. W. & MULLOY, R. H. (2007) Equestrian injuries: incidence, injury patterns, and risk factors for 10 years of major traumatic injuries. American Journal of Surgery, 193, 636-640.
BARZO, P., MARMAROU, A., FATOUROS, P., HAYASAKI, K. & CORWIN, F. (1997) Contribution of vasogenic and cellular edema to traumatic brain swelling measured by diffusion-weighted imaging. Journal of Neurosurgery, 87, 900-907.
BASLOW, M. H. (2003) N-acetylaspartate in the vertebrate brain: Metabolism and function. Neurochemical Research, 28, 941-953.
198
BASSER, P. J., MATTIELLO, J. & LEBIHAN, D. (1994) Estimation of the Effective Self-Diffusion Tensor from the NMR Spin Echo. Journal of Magnetic Resonance, Series B, 103, 247-254.
BATCHELOR, J., HARVEY, A. G. & BRYANT, R. A. (1995) Stroop Color-Word Test as a Measure of Attentional Deficit Following Mild Head-Injury. Clinical Neuropsychologist, 9, 180-186.
BATE, A. J., MATHIAS, J. L. & CRAWFORD, J. R. (2001) Performance on the test of everyday attention and standard tests of attention following severe traumatic brain injury. Clinical Neuropsychologist, 15, 405-422.
BAZARIAN, J. J., ZHONG, J., BLYTH, B., ZHU, T., KAVCIC, V. & PETERSON, D. (2007) Diffusion Tensor Imaging Detects Clinically Important Axonal Damage after Mild Traumatic Brain Injury: A Pilot Study. Journal of Neurotrauma, 24, 1447-1459.
BEIROWSKI, B., ADALBERT, R., WAGNER, D., GRUMME, D., ADDICKS, K., RIBCHESTER, R. & COLEMAN, M. (2005) The progressive nature of Wallerian degeneration in wild-type and slow Wallerian degeneration (WldS) nerves. BMC Neuroscience, 6, 1471.
BELLI, A., SEN, J., PETZOLD, A., RUSSO, S., KITCHEN, N., SMITH, M., TAVAZZI, B., VAGNOZZI, R., SIGNORETTI, S., AMORINI, A., M, BELLIA, F. & LAZZARINO, G. (2006) Extracellular N-acetylaspartate depletion in traumatic brain injury. Journal of Neurochemistry, 96, 861-869.
BENSON, B. W., HAMILTON, G. M., MEEUWISSE, W. H., MCCRORY, P. & DVORAK, J. (2009) Is protective equipment useful in preventing concussion? A systematic review of the literature. British Journal of Sports Medicine, 43, I56-I67.
BENSON, R. R., MEDA, S. A., VASUDEVAN, S., KOU, Z., GOVINDARAJAN, K. A., HANKS, R. A., MILLIS, S. R., MAKKI, M., LATIF, Z., COPLIN, W., MEYTHALER, J. & HAACKE, E. M. (2007) Global White Matter Analysis of Diffusion Tensor Images Is Predictive of Injury Severity in Traumatic Brain Injury. Journal of Neurotrauma, 24, 446-459.
BLAMIRE, A. M., ANTHONY, D. C., RAJAGOPALAN, B., SIBSON, N. R., PERRY, V. H. & STYLES, P. (2000) Interleukin-1 beta-induced changes in blood-brain barrier permeability, apparent diffusion coefficient, and cerebral blood volume in the rat brain: A magnetic resonance study. Journal of Neuroscience, 20, 8153-8159.
BLAMIRE, A. M., CADOUX-HUDSON, T. & RAJAGOPALAN, B. (2002) Reversible brain injury in a head-injured patient identified by magnetic resonance imaging and spectroscopy. British Journal of Neurosurgery, 16, 48 - 51.
BOHNEN, N., TWIJNSTRA, A. & JOLLES, J. (1992) Performance in the Stroop Color Word Test in Relationship to the Persistence of Symptoms Following Mild Head-Injury. Acta Neurologica Scandinavica, 85, 116-121.
BRADLEY, W. G., JR. (1993) MR appearance of hemorrhage in the brain. Radiology, 189, 15-26.
199
BRATTON, S. L., CHESTNUT, R. M., GHAJAR, J., MCCONNELL HAMMOND, F. F., HARRIS, O. A., HARTL, R., MANLEY, G. T., NEMECEK, A., NEWELL, D. W., ROSENTHAL, G., SCHOUTEN, J., SHUTTER, L., TIMMONS, S. D., ULLMAN, J. S., VIDETTA, W., WILBERGER, J. E. & WRIGHT, D. W. (2007a) Guidelines for the management of severe traumatic brain injury. IX. Cerebral perfusion thresholds. Journal of Neurotrauma, 24 Suppl 1, S59-64.
BRATTON, S. L., CHESTNUT, R. M., GHAJAR, J., MCCONNELL HAMMOND, F. F., HARRIS, O. A., HARTL, R., MANLEY, G. T., NEMECEK, A., NEWELL, D. W., ROSENTHAL, G., SCHOUTEN, J., SHUTTER, L., TIMMONS, S. D., ULLMAN, J. S., VIDETTA, W., WILBERGER, J. E. & WRIGHT, D. W. (2007b) Guidelines for the management of severe traumatic brain injury. VIII. Intracranial pressure thresholds. Journal of Neurotrauma, 24 Suppl 1, S55-8.
BROOKS, W. M., CHRISTINE, A. S., HELEN, P., REX, E. J., DAVID, C. W., SETH, D. F., MATTHEW, A. B., WILMER, L. S. & RONALD, A. Y. (2000) Metabolic and Cognitive Response to Human Traumatic Brain Injury: A Quantitative Proton Magnetic Resonance Study. Journal of Neurotrauma, 17, 629.
BROOKS, W. M., FRIEDMAN, S. D. & GASPAROVIC, C. (2001) Magnetic resonance spectroscopy in traumatic brain injury. Journal of Head Trauma Rehabilitation, 16, 149-164.
BRUNS, J. & HAUSER, W. A. (2003) The Epidemiology of Traumatic Brain Injury: A Review. Epilepsia, 44, 2-10.
BÜKI, A. & POVLISHOCK, J. T. (2006) All roads lead to disconnection? – Traumatic axonal injury revisited. Acta Neurochirurgica, 148, 181-194.
BULLMORE, E. T., SUCKLING, J., OVERMEYER, S., RABE-HESKETH, S., TAYLOR, E. & BRAMMER, M. J. (1999) Global, voxel, and cluster tests, by theory and permutation, for a difference between two groups of structural MR images of the brain. IEEE Transactions on Medical Imaging, 18, 32-42.
CADOUX-HUDSON, T. A. D., WADE, D., TAYLOR, D. J., RAJAGOPALAN, B., LEDINGHAM, J. G. G., BRIGGS, M. & RADDA, G. K. (1990) Persistent Metabolic Sequelae of Severe Head-Injury in Humans In Vivo. Acta Neurochirurgica, 104, 1-7.
CARPENTIER, A., GALANAUD, D., PUYBASSET, L., MULLER, J. C., LESCOT, T., BOCH, A. L., RIEDL, V., CORNU, P., CORIAT, P., DORMONT, D. & VAN EFFENTERRE, R. (2006) Early morphologic and spectroscopic magnetic resonance in severe traumatic brain injuries can detect "invisible brain stem damage" and predict "vegetative states". Journal of Neurotrauma, 23, 674-685.
CARROLL, L. J., CASSIDY, J. D., HOLM, L., KRAUS, J. & CORONADO, V. G. (2004) Methodological issues and research recommendations for mild traumatic brain injury: the WHO Collaborating Centre Task Force on Mild Traumatic Brain Injury. Journal of Rehabilitation Medicine, 113-25.
200
CARTER, C. S., MINTUN, M. & COHEN, J. D. (1995) Interference and facilitation effects during selective attention: An (H2O)-O-15 PET study of Stroop task performance. Neuroimage, 2, 264-272.
CECIL, K. M., HILLS, E. C., SANDEL, M. E., SMITH, D. H., MCINTOSH, T. K., MANNON, L. J., SINSON, G. P., BAGLEY, L. J., GROSSMAN, R. I. & LENKINSKI, R. E. (1998) Proton magnetic resonance spectroscopy for detection of axonal injury in the splenium of the corpus callosum of brain-injured patients. Journal of Neurosurgery, 88, 795-801.
CERCIGNANI, M., INGLESE, M., PAGANI, E., COMI, G. & FILIPPI, M. (2001) Mean Diffusivity and Fractional Anisotropy Histograms of Patients with Multiple Sclerosis. American Journal of Neuroradiology, 22, 952-958.
CHANRAUD, S., ZAHR, N., SULLIVAN, E. & PFEFFERBAUM, A. (2010) MR Diffusion Tensor Imaging: A Window into White Matter Integrity of the Working Brain. Neuropsychology Review, 20, 209-225.
CHRISTODOULOU, C., DELUCA, J., RICKER, J. H., MADIGAN, N. K., BLY, B. M., LANGE, G., KALNIN, A. J., LIU, W. C., STEFFENER, J., DIAMOND, B. J. & NI, A. C. (2001) Functional magnetic resonance imaging of working memory impairment after traumatic brain injury. Journal of Neurology Neurosurgery and Psychiatry, 71, 161-168.
CHU, Z., WILDE, E. A., HUNTER, J. V., MCCAULEY, S. R., BIGLER, E. D., TROYANSKAYA, M., YALLAMPALLI, R., CHIA, J. M. & LEVIN, H. S. (2009) Voxel-Based Analysis of Diffusion Tensor Imaging in Mild Traumatic Brain Injury in Adolescents. American Journal of Neuroradiology, 31, 340-346.
CICERONE, K. D. & AZULAY, J. (2002) Diagnostic utility of attention measures in postconcussion syndrome. Clinical Neuropsychologist, 16, 280-289.
CLARE, S. & JEZZARD, P. (2001) Rapid T-1 mapping using multislice echo planar imaging. Magnetic Resonance in Medicine, 45, 630-634.
COELLO, A. F., CANALS, A. G., GONZALEZ, J. M. & MARTIN, J. J. A. (2010) Cranial nerve injury after minor head trauma. Journal of Neurosurgery, 113, 547-555.
COHEN, B. A., INGLESE, M., RUSINEK, H., BABB, J. S., GROSSMAN, R. I. & GONEN, O. (2007) Proton MR Spectroscopy and MRI-Volumetry in Mild Traumatic Brain Injury. AJNR Am J Neuroradiol, 28, 907-913.
COLES, J. P. (2007) Imaging after brain injury. British Journal of Anaesthesia, 99, 49-60.
CORONADO, V. G., XU, L., BASAVARAJU, S. V., MCGUIRE, L. C., WALD, M. M., FAUL, M. D., GUZMAN, B. R. & HEMPHILL, J. D. (2011) Surveillance for Traumatic Brain Injury-Related Deaths-United States, 1997-2007. Morbidity and Mortality Weekly Report, 60, 1-32.
COSTANZO, R. M. & MIWA, T. (2006) Posttraumatic olfactory loss. Advances in Otorhinolaryngology, 63, 99-107.

201
COUGHLAN, A. K. & HOLLOWS, S. E. (1985) The Adult Memory and Information Processing Battery (AMIPB). St. James's University Hospital: Leeds.
COUGHLAN, A. K., ODDY, M. & CRAWFORD, J. R. (2007) Brain injury rehabilitation trust memory and information processing battery.
COWAN, N. (2008) What are the differences between long-term, short-term, and working memory? Essence of Memory. Amsterdam, Elsevier Science Bv.
CRAWFORD, J. R., DEARY, I. J., STARR, J. & WHALLEY, L. J. (2001) The NART as an index of prior intellectual functioning: a retrospective validity study covering a 66-year interval. Psychological Medicine, 31, 451-458.
CRAWFORD, J. R., PARKER, D. M. & BESSON, J. A. O. (1988) Estimation of Premorbid Intelligence in Organic Conditions. British Journal of Psychiatry, 153, 178-181.
CRAWFORD, J. R., STEWART, L. E., COCHRANE, R. H. B., PARKER, D. M. & BESSON, J. A. O. (1989) Construct-Validity of the National Adult Reading Test - A Factor Analytic Study. Personality and Individual Differences, 10, 585-587.
CROWE, L. M., ANDERSON, V., CATROPPA, C. & BABL, F. E. (2010) Head injuries related to sports and recreation activities in school-age children and adolescents: Data from a referral centre in Victoria, Australia. Emergency Medicine Australasia, 22, 56-61.
CUSHMAN, J. G., AGARWAL, N., FABIAN, T. C., GARCIA, V., NAGY, K. K., PASQUALE, M. D. & SALOTTO, A. G. (2001) Practice Management Guidelines for the Management of Mild Traumatic Brain Injury: The EAST Practice Management Guidelines Work Group.
DE NORONHA, R. J., SHARRACK, B., HADJIVASSILIOU, M. & ROMANOWSKI, C. A. J. (2003) Subdural haematoma: a potentially serious consequence of spontaneous intracranial hypotension. Journal of Neurology Neurosurgery and Psychiatry, 74, 752-755.
DE STEFANO, N., MATTHEWS, P. M. & ARNOLD, D. L. (1995) Reversible Decreases in N-Acetylaspartate after Acute Brain Injury. Magnetic Resonance in Medicine, 34, 721-727.
DELIS, D. C., KAPLAN, E. & KRAMER, J. H. (2001) Delis-Kaplan Executive Function System, San Antonio, TX, The Psychological Corporation.
DEWAR, D. & GRAHAM, D. I. (1996) Depletion of choline acetyltransferase activity but preservation of M1 and M2 muscarinic receptor binding sites in temporal cortex following head injury: A preliminary human postmortem study. Journal of Neurotrauma, 13, 181-187.
DI, H. B., BOLY, M., WENG, X. C., LEDOUX, D. & LAUREYS, S. (2008) Neuroimaging activation studies in the vegetative state: predictors of recovery? Clinical Medicine, 8, 502-507.
202
DRAPER, K. & PONSFORD, J. (2008) Cognitive functioning ten years following traumatic brain injury and rehabilitation. Neuropsychology, 22, 618-625.
DURKIN, M. S., OLSEN, S., BARLOW, B., VIRELLA, A. & CONNOLLY, E. S. (1998) The epidemiology of urban pediatric neurological trauma: Evaluation of, and implications for, injury prevention programs. Neurosurgery, 42, 300-310.
DYCHE, G. M. & JOHNSON, D. A. (1991) Information-Processing Rates Derived from CHIPASAT. Perceptual and Motor Skills, 73, 720-722.
EICHENBAUM, H. (2000) A cortical-hippocampal system for declarative memory. Nature Reviews Neuroscience, 1, 41-50.
ENG, J. (2003) Sample size estimation: How many individuals should be studied? Radiology, 227, 309-313.
EVANS, R. W. (2006) Neurology and trauma, Oxford University Press.
FAYOL, P., CARRIÈRE, H., HABONIMANA, D. & DUMOND, J. J. (2009) Preliminary questions before studying mild traumatic brain injury outcome. Annals of Physical and Rehabilitation Medicine, 52, 497-509.
FERRI, J., CHIRIVELLA, J., CABALLERO, M. C., SIMO, M., RAMIREZ, R. M. & NOE, E. (2004) Intelligence and prognosis in severe traumatic brain injury: a neuropsychological study with the Wechsler adult intelligence scale (WAIS-III). Neurologia, 19, 285-291.
FIRSCHING, R., WOISCHNECK, D., KLEIN, S., REIßBERG, S., DÖHRING, W. & PETERS, B. (2001) Classification of Severe Head Injury Based on Magnetic Resonance Imaging. Acta Neurochirurgica, 143, 263-271.
FOX, K. D. (2011) Cardiff University Experimental MRI Centre.
GALLAGHER, C. & BURKE, T. (2007) Age, gender and IQ effects on the Rey-Osterrieth Complex Figure Test. British Journal of Clinical Psychology, 46, 35-45.
GARNETT, M. R., BLAMIRE, A. M., CORKILL, R. G., CADOUX-HUDSON, T. A. D., RAJAGOPALAN, B. & STYLES, P. (2000a) Early proton magnetic resonance spectroscopy in normal-appearing brain correlates with outcome in patients following traumatic brain injury. Brain, 123, 2046-2054.
GARNETT, M. R., BLAMIRE, A. M., CORKILL, R. G., RAJAGOPALAN, B., YOUNG, J. D., CADOUX-HUDSON, T. A. D. & STYLES, P. (2001a) Abnormal cerebral blood volume in regions of contused and normal appearing brain following traumatic brain injury using perfusion magnetic resonance imaging. Journal of Neurotrauma, 18, 585-593.
GARNETT, M. R., BLAMIRE, A. M., RAJAGOPALAN, B., STYLES, P. & CADOUX-HUDSON, T. A. D. (2000b) Evidence for cellular damage in normal-appearing white matter correlates with injury severity in patients following traumatic brain injury - A magnetic resonance spectroscopy study. Brain, 123, 1403-1409.
203
GARNETT, M. R., CORKILL, R. G., BLAMIRE, A. M., RAJAGOPALAN, B., MANNERS, D. N., YOUNG, J. D., STYLES, P. & CADOUX-HUDSON, T. A. D. (2001b) Altered cellular metabolism following traumatic brain injury: A magnetic resonance spectroscopy study. Journal of Neurotrauma, 18, 231-240.
GE, Y., PATEL, M. B., CHEN, Q., GROSSMAN, E. J., ZHANG, K., MILES, L., BABB, J. S., REAUME, J. & GROSSMAN, R. I. (2009) Assessment of thalamic perfusion in patients with mild traumatic brain injury by true FISP arterial spin labelling MR imaging at 3T. Brain Injury, 23, 666-674.
GEAN, A., D. (1994) Imaging of Head Trauma. New York, NY, Raven Press.
GERBER, D. J., WEINTRAUB, A. H., CUSICK, C. P., RICCI, P. E. & WHITENECK, G. G. (2004) Magnetic resonance imaging of traumatic brain injury: relationship of T2 SE and T2*GE to clinical severity and outcome. Brain Injury, 18, 1083-1097.
GIOIA, G. A., ISQUITH, P. K., SCHNEIDER, J. C. & VAUGHAN, C. G. (2009) New Approaches to Assessment and Monitoring of Concussion in Children. Topics in Language Disorders, 29, 266-281.
GOETHALS, I., AUDENAERT, K., JACOBS, F., LANNOO, E., VAN DE WIELE, C., HAM, H., OTTE, A., OOSTRA, K. & DIERCKX, R. (2004) Cognitive neuroactivation using SPECT and the Stroop Colored Word test in patients with diffuse brain injury. Journal of Neurotrauma, 21, 1059-1069.
GOETZ, P., BLAMIRE, A., RAJAGOPALAN, B., CADOUX-HUDSON, T., YOUNG, D. & STYLES, P. (2004) Increase in apparent diffusion coefficient in normal appearing white matter following human traumatic brain injury correlates with injury severity. Journal of Neurotrauma, 21, 645-654.
GOLD, M. M. & LIPTON, M. L. (2008) Diffusion tractography of axonal degeneration following shear injury. Journal of Neurology Neurosurgery and Psychiatry, 79, 1374-1375.
GRANZIERA, C., D'ARCEUIL, H., ZAI, L., MAGISTRETTI, P. J., SORENSEN, A. G. & DE CRESPIGNY, A. J. (2007) Long-term monitoring of post-stroke plasticity after transient cerebral ischemia in mice using in vivo and ex vivo diffusion tensor MRI. Open Neuroimag J, 1, 10-7.
GREVE, M. W., YOUNG, D. J., GOSS, A. L. & DEGUTIS, L. C. (2009) Skiing and Snowboarding Head Injuries in 2 Areas of the United States. Wilderness & Environmental Medicine, 20, 234-238.
GRONWALL, D. & WRIGHTSON, P. (1974) Delayed Recovery of Intellectual Function after Minor Head-Injury. Lancet, 2, 605-609.
GRONWALL, D. M. A. (1977) Paced Auditory Serial-Addition Task - Measure of Recovery from Concussion. Perceptual and Motor Skills, 44, 367-373.
GUILMETTE, T. J. & RASILE, D. (1995) Sensitivity, Specificity, And Diagnostic-Accuracy Of 3 Verbal Memory Measures In The Assessment Of Mild Brain Injury. Neuropsychology, 9, 338-344.
204
HALL, R. C. W., HALL, R. C. W. & CHAPMAN, M. J. (2005) Definition, Diagnosis, and Forensic Implications of Postconcussional Syndrome. Psychosomatics, 46, 195-202.
HARTIKAINEN, K. M., WALJAS, M., ISOVIITA, T., DASTIDAR, P., LIIMATAINEN, S., SOLBAKK, A. K., OGAWA, K. H., SOIMAKALLIO, S., YLINEN, A. & OHMAN, J. (2010) Persistent symptoms in mild to moderate traumatic brain injury associated with executive dysfunction. Journal of Clinical and Experimental Neuropsychology, 32, 767-774.
HATTORI, N., SWAN, M., STOBBE, G. A., UOMOTO, J. M., MINOSHIMA, S., DJANG, D., KRISHNANANTHAN, R. & LEWIS, D. H. (2009) Differential SPECT Activation Patterns Associated with PASAT Performance May Indicate Frontocerebellar Functional Dissociation in Chronic Mild Traumatic Brain Injury. Journal of Nuclear Medicine, 50, 1054-1061.
HAYASAKA, S. & NICHOLS, T. E. (2003) Validating cluster size inference: random field and permutation methods. Neuroimage, 20, 2343-2356.
HENRY, J. D. & CRAWFORD, J. R. (2004) A Meta-Analytic Review of Verbal Fluency Performance Following Focal Cortical Lesions. Neuropsychology, 18, 284-295.
HERGAN, K., SCHAEFER, P. W., SORENSEN, A. G., GONZALEZ, R. G. & HUISMAN, T. A. G. M. (2002) Diffusion-weighted MRI in diffuse axonal injury of the brain. European Radiology, 12, 2536-41.
HILLARY, F. G., LIU, W. C., GENOVA, H. M., MANIKER, A. H., KEPLER, K., GREENWALD, B. D., CORTESE, B. M., HOMNICK, A. & DELUCA, J. (2007) Examining lactate in severe TBI using proton magnetic resonance spectroscopy. Brain Injury, 21, 981 - 991.
HODGES, J. R. (1994) Cognitive Assessment for Clinicians, Oxford University Press.
HONG, J. H., KIM, O. L., KIM, S. H., LEE, M. Y. & JANG, S. H. (2009) Cerebellar peduncle injury in patients with ataxia following diffuse axonal injury. Brain Research Bulletin, 80, 30-35.
HOU, D. J., TONG, K. A., ASHWAL, S., OYOYO, U., JOO, E., SHUTTER, L. & OBENAUS, A. (2007) Diffusion-Weighted Magnetic Resonance Imaging Improves Outcome Prediction in Adult Traumatic Brain Injury. Journal of Neurotrauma, 24, 1558-1569.
HUGHES, D. G., JACKSON, A., MASON, D. L., BERRY, E., HOLLIS, S. & YATES, D. W. (2004) Abnormalities on magnetic resonance imaging seen acutely following mild traumatic brain injury: correlation with neuropsychological tests and delayed recovery. Neuroradiology, 46, 550-558.
HUISMAN, T. A. G. M., SCHWAMM, L. H., SCHAEFER, P. W., KOROSHETZ, W. J., SHETTY-ALVA, N., OZSUNAR, Y., WU, O. & SORENSEN, A. G. (2004) Diffusion Tensor Imaging as Potential Biomarker of White Matter Injury in Diffuse Axonal Injury. American Journal of Neuroradiology, 25, 370-376.
205
HUISMAN, T. A. G. M., SORENSEN, A. G., HERGAN, K., GONZALEZ, R. G. & SCHAEFER, P. W. (2003) Diffusion-weighted Imaging for the evaluation of diffuse axonal injury in closed head injury. Journal of Computer Assisted Tomography, 27, 5-11.
HUNT, T. & ASPLUND, C. (2009) Concussion Assessment and Management. Clinics in Sports Medicine, 29, 5-+.
IMMONEN, R. J., KHARATISHVILI, I., GRÖHN, H., PITKÄNEN, A. & GRÖHN, O. H. J. (2009) Quantitative MRI predicts long-term structural and functional outcome after experimental traumatic brain injury. NeuroImage, 45, 1-9.
INGLESE, M., MAKANI, S., JOHNSON, G., COHEN, B. A., SILVER, J. A., GONEN, O. & GROSSMAN, R. I. (2005) Diffuse axonal injury in mild traumatic brain injury: a diffusion tensor imaging study. Journal of Neurosurgery, 103, 298-303.
ITO, J., MARMAROU, A., BARZO, P., FATOUROS, P. & CORWIN, F. (1996) Characterization of edema by diffusion-weighted imaging in experimental traumatic brain injury. Journal of Neurosurgery, 84, 97-103.
JAFFEE, M. S., HELMICK, K. M., GIRARD, P. D., MEYER, K. S., DINEGAR, K. & GEORGE, K. (2009) Acute clinical care and care coordination for traumatic brain injury within Department of Defense. Journal of Rehabilitation Research and Development, 46, 655-665.
JENKINSON, M. (2003) Fast, automated, N-dimensional phase-unwrapping algorithm. Magnetic Resonance in Medicine, 49, 193-197.
JENKINSON, M. (2004) Improving the registration of B0- distorted EPI images using calculated cost function weights. 10th International Conference on Functional Mapping of the Human Brain.
JENKINSON, M., BANNISTER, P. R., BRADY, J. M. & SMITH, S. M. (2002) Improved optimisation for the robust and accurate linear registration and motion correction of brain images. NeuroImage, 17, 825-841.
JENNETT, B. & TEASDALE, G. (1977) Aspects of Coma after Severe Head-Injury. Lancet, 1, 878-881.
JIANG, H., VAN ZIJL, P. C., KIM, J., PEARLSON, G. D. & MORI, S. (2006) DtiStudio: resource program for diffusion tensor computation and fiber bundle tracking. Comput Methods Programs Biomed, 81, 106-116.
JIN, H., WANG, S. M., HOU, L. J., PAN, C. G., LI, B., WANG, H., YU, M. K. & LU, Y. C. (2010) Clinical treatment of traumatic brain injury complicated by cranial nerve injury. Injury-International Journal of the Care of the Injured, 41, 918-923.
JURADO, M. A., MATARO, M., VERGER, K., BARTUMEUS, F. & JUNQUE, C. (2000) Phonemic and semantic fluencies in traumatic brain injury patients with focal frontal lesions. Brain Injury, 14, 789-795.
206
KAASIK, T., VALI, M. & SAAR, I. (2007) Road traffic mortality in Estonia: alcohol as the main contributing factor. International Journal of Injury Control and Safety Promotion, 14, 163-70.
KAY, A. & TEASDALE, G. (2001) Head injury in the United Kingdom. World Journal of Surgery, 25, 1210-1220.
KELLY, J. P., ROSENBERG, J. H., GREENBERG, M. K., ALTER, M., ASHWAL, S., BYRNE, T. N., CALVERLEY, J., DAUBE, J. R., FRANKLIN, G., FRENCH, J., FRISHBERG, B. M., LANSKA, D. J., MILLER, R. G., MISHRA, S., ODENHEIMER, G. L., PAULSON, G., PEARL, R. A., STEVENS, J. C., ZAHN, C. A. & GOLDSTEIN, M. L. (1997) Practice parameter: The management of concussion in sports (summary statement) - Report of the Quality Standards Subcommittee. Neurology, 48, 581-585.
KERSEL, D. A., MARSH, N. V., MARS, V., HAVILL, J. H. & SLEIGH, J. W. (2001) Neuropsychological functioning during the year following severe traumatic brain injury. Brain Injury, 15, 283-296.
KHARATISHVILI, I., SIERRA, A., IMMONEN, R. J., GRÖHN, O. H. J. & PITKÄNEN, A. (2009) Quantitative T2 mapping as a potential marker for the initial assessment of the severity of damage after traumatic brain injury in rat. Experimental Neurology, 217, 154-164.
KIDWELL, C. S., CHALELA, J. A., SAVER, J. L., STARKMAN, S., HILL, M. D., DEMCHUK, A. M., BUTMAN, J. A., PATRONAS, N., ALGER, J. R., LATOUR, L. L., LUBY, M. L., BAIRD, A. E., LEARY, M. C., TREMWEL, M., OVBIAGELE, B., FREDIEU, A., SUZUKI, S., VILLABLANCA, J. P., DAVIS, S., DUNN, B., TODD, J. W., EZZEDDINE, M. A., HAYMORE, J., LYNCH, J. K., DAVIS, U. & WARACH, S. (2004) Comparison of MRI and CT for detection of acute intracerebral hemorrhage. Journal of the American Medical Association, 292, 1823-1830.
KIM, E., SOHN, C. H., CHANG, K. H., CHANG, H. W. & LEE, D. H. (2011) Patterns of accentuated grey-white differentiation on diffusion-weighted imaging or the apparent diffusion coefficient maps in comatose survivors after global brain injury. Clinical Radiology, 66, 440-448.
KIM, J.-S., KIM, O.-L., SEO, W.-S., KOO, B.-H., JOO, Y. & BAI, D.-S. (2009) Memory Dysfunctions after Mild and Moderate Traumatic Brain Injury : Comparison between Patients with and without Frontal Lobe Injury. Journal of Korean Neurosurgical Society, 46, 459-467.
KIM, S. H., CHOE, B. M., CHONG, H. M., PARK, J. H., SEO, S. M. & CHON, H. G. (2010) Relationship between frontal hypoperfusion on brain SPECT and executive function test in patients with traumatic brain injury. International Journal of Neuropsychopharmacology, 13, 176-176.

207
KINNUNEN, K. M., GREENWOOD, R., POWELL, J. H., LEECH, R., HAWKINS, P. C., BONNELLE, V., PATEL, M. C., COUNSELL, S. J. & SHARP, D. J. (2011) White matter damage and cognitive impairment after traumatic brain injury. Brain, 134, 449-463.
KIRKMAN, M. A. (2011) Debate - does a reversible penumbra exist in intracerebral haemorrhage? British Journal of Neurosurgery, 25, 523-525.
KLAUBER, M. R., BARRETTCONNOR, E., MARSHALL, L. F. & BOWERS, S. A. (1981) The Epidemiology of Head-Injury - a Prospective-Study of an Entire Community - San-Diego-County, California, 1978. American Journal of Epidemiology, 113, 500-509.
KLOSKA, S., WINTERMARK, M., ENGELHORN, T. & FIEBACH, J. (2010) Acute stroke magnetic resonance imaging: current status and future perspective. Neuroradiology, 52, 189-201.
KRAUS, M. F., SUSMARAS, T., CAUGHLIN, B. P., WALKER, C. J., SWEENEY, J. A. & LITTLE, D. M. (2007) White matter integrity and cognition in chronic traumatic brain injury: a diffusion tensor imaging study. Brain, 130, 2508-2519.
KUMAR, R., GUPTA, R. K., HUSAIN, M., CHAUDHRY, C., SRIVASTAVA, A., SAKSENA, S. & RATHORE, R. K. S. (2009) Comparative evaluation of corpus callosum DTI metrics in acute mild and moderate traumatic brain injury: Its correlation with neuropsychometric tests. Brain Injury, 23, 675 - 685.
LACROIX, J. & BAILEY, M. (1996) Is the new interference subtask of the Stroop colour word test sensitive to recovery overtime from moderate to severe TBI? Archives of Clinical Neuropsychology, 11, 414-414.
LAGARES, A., RAMOS, A., PÉREZ-NUÑEZ, A., BALLENILLA, F., ALDAY, R., GÓMEZ, P. A., KAEN, A. & LOBATO, R. D. (2009) The role of MR imaging in assessing prognosis after severe and moderate head injury. Acta Neurochirurgica.
LANCASTER, J. L., RAINEY, L. H., SUMMERLIN, J. L., FREITAS, C. S., FOX, P. T., EVANS, A. C., TOGA, A. W. & MAZZIOTA, J. C. (1997) Automated Labeling of the Human Brain: A Preliminary Report on the Development and Evaluation of a Forward-transform method. Human Brain Mapping, 5, 238-242.
LANCASTER, J. L., WOLDORFF, M. G., PARSONS, L. M., LIOTTI, M., FREITAS, C. S., RAINEY, L., KOCHUNOV, P. V., NICKERSON, D., MIKITEN, S. A. & FOX, P. T. (2000) Automated Talairach Atlas Labels for Functional Brain Mapping. Human Brain Mapping, 10, 120-131.
LANGE, R. T., IVERSON, G. L., BRUBACHER, J. R., MÄDLER, B. & HERAN, M. K. (2011) Diffusion Tensor Imaging Findings Are Not Strongly Associated With Postconcussional Disorder 2 Months Following Mild Traumatic Brain Injury. Journal of Head Trauma Rehabilitation, Published Ahead of Print.
LE, T., H. & GEAN, A., D. (2009) Neuroimaging of traumatic brain injury. Mount Sinai Journal of Medicine: A Journal of Translational and Personalized Medicine, 76, 145-162.
208
LEE, B. & NEWBERG, A. (2005) Neuroimaging in traumatic brain imaging. NeuroRx, 2, 372-83.
LEE, H., WINTERMARK, M., GEAN, A. D., GHAJAR, J., MANLEY, G. T. & MUKHERJEE, P. (2008) Focal Lesions in Acute Mild Traumatic Brain Injury and Neurocognitive Outcome: CT versus 3T MRI. Journal of Neurotrauma, 25, 1049.
LEE, M. A., BLAMIRE, A. M., PENDLEBURY, S., HO, K. H., MILLS, K. R., STYLES, P., PALACE, J. & MATTHEWS, P. M. (2000) Axonal injury or loss in the internal capsule and motor impairment in multiple sclerosis. Archives of Neurology, 57, 65-70.
LEVIN, H. S., SONG, J., EWING-COBBS, L., CHAPMAN, S. B. & MENDELSOHN, D. (2001) Word fluency in relation to severity of closed head injury, associated frontal brain lesions, and age at injury in children. Neuropsychologia, 39, 122-131.
LEVIN, H. S., WILDE, E. A., CHU, Z., YALLAMPALLI, R. B. S., HANTEN, G. R., LI, X. M. S., CHIA, J. M. S., VASQUEZ, A. C. B. S. & HUNTER, J. V. (2008) Diffusion Tensor Imaging in Relation to Cognitive and Functional Outcome of Traumatic Brain Injury in Children. Journal of Head Trauma Rehabilitation Neuroplasticity., 23, 197-208.
LIN, M. R. & KRAUS, J. F. (2009) A review of risk factors and patterns of motorcycle injuries. Accident Analysis and Prevention, 41, 710-722.
LIPTON, M., L., GELLELLA, E., LO, C., GOLD, T., ARDEKANI, B., A., SHIFTEH, K., BELLO, J., A. & BRANCH, C., A. (2008) Multifocal White Matter Ultrastructural Abnormalities in Mild Traumatic Brain Injury with Cognitive Disability: A Voxel-Wise Analysis of Diffusion Tensor Imaging. Journal of Neurotrauma, 25, 1335-1342.
LIPTON, M. L., GULKO, E., ZIMMERMAN, M. E., FRIEDMAN, B. W., KIM, M., GELLELLA, E., GOLD, T., SHIFTEH, K., ARDEKANI, B. A. & BRANCH, C. A. (2009) Diffusion-Tensor Imaging Implicates Prefrontal Axonal Injury in Executive Function Impairment Following Very Mild Traumatic Brain Injury. Radiology, 252, 816-824.
LJUNGQVIST, J., NILSSON, D., LJUNGBERG, M., SORBO, A., ESBJORNSSON, E., ERIKSSON-RITZEN, C. & SKOGLUND, T. (2011) Longitudinal study of the diffusion tensor imaging properties of the corpus callosum in acute and chronic diffuse axonal injury. Brain Injury, 25, 370-378.
LO, C., SHIFTEH, K., GOLD, T., BELLO, J. A. & LIPTON, M. L. (2009) Diffusion Tensor Imaging Abnormalities in Patients With Mild Traumatic Brain Injury and Neurocognitive Impairment. Journal of Computer Assisted Tomography, 33, 293-297.
LODER, R. T. (2008) The demographics of equestrian-related injuries in the United States: Injury patterns, orthopedic specific injuries, and avenues for injury prevention. Journal of Trauma-Injury Infection and Critical Care, 65, 447-460.

209
LOVELL, M. (2009) The Neurophysiology and Assessment of Sports-Related Head Injuries (Reprinted from Neurologic Clinics, vol 26). Physical Medicine and Rehabilitation Clinics of North America, 20, 39-53.
MALDJIAN, J. A., LAURIENTI, P. J. & BURDETTE, J. H. (2004) Precentral Gyrus Discrepancy in Electronic Versions of the Talairach Atlas. NeuroImage, 21, 450-455.
MALDJIAN, J. A., LAURIENTI, P. J., KRAFT, R. A. & BURDETTE, J. H. (2003) An Automated Method for Neuroanatomic and Cytoarchitectonic Atlas-based Interrogation of fMRI Data Sets. NeuroImage, 19, 1233-1239.
MAMERE, A. E., SARAIVA, L. A. L., MATOS, A. L. M., CARNEIRO, A. A. O. & SANTOS, A. C. (2009) Evaluation of Delayed Neuronal and Axonal Damage Secondary to Moderate and Severe Traumatic Brain Injury Using Quantitative MR Imaging Techniques. American Journal of Neuroradiology, 30, 947-952.
MANOLAKAKI, D., VELMAHOS, G. C., SPANIOLAS, K., DE MOYA, M. & ALAM, H. B. (2009) Early magnetic resonance imaging is unnecessary in patients with traumatic brain injury. The Journal of Trauma, Injury, Infection, and Critical Care, 66, 1008-14.
MARIAK, Z., MARIAK, Z. & STANKIEWICZ, A. (1997) Cranial nerve II-VII injuries in fatal closed head trauma. European Journal of Ophthalmology, 7, 68-72.
MARINO, S., ZEI, E., BATTAGLINI, M., VITTORI, C., BUSCALFERRI, A., BRAMANTI, P., FEDERICO, A. & DE STEFANO, N. (2007) Acute metabolic brain changes following traumatic brain injury and their relevance to clinical severity and outcome. Journal of Neurology Neurosurgery and Psychiatry, 78, 501-507.
MATSUSHITA, M., HOSODA, K., NAITOH, Y., YAMASHITA, H. & KOHMURA, E. (2011) Utility of diffusion tensor imaging in the acute stage of mild to moderate traumatic brain injury for detecting white matter lesions and predicting long-term cognitive function in adults. Journal of Neurosurgery, 115, 130-139.
MAXWELL, W. L., POVLISHOCK, J. T. & GRAHAM, D. L. (1997) A mechanistic analysis of nondisruptive axonal injury: A review. Journal of Neurotrauma, 14, 419-440.
MAYER, A. R., LING, J., MANNELL, M. V., GASPAROVIC, C., PHILLIPS, J. P., DOEZEMA, D., REICHARD, R. & YEO, R. A. (2010) A prospective diffusion tensor imaging study in mild traumatic brain injury. Neurology, 74, 643-650.
MCBRIDE, D. Q., MILLER, B. L., NIKAS, D. L., BUCHTHAL, S., CHANG, L., CHIANG, F. & BOOTH, R. A. (1995) Analysis of brain tumors using H-1 magnetic resonance spectroscopy. Surgical Neurology, 44, 137-144.
MCCRORY, P., MEEUWISSE, W., JOHNSTON, K., DVORAK, J., AUBRY, M., MOLLOY, M. & CANTU, R. (2009) Consensus Statement on Concussion in Sport 3rd International Conference on Concussion in Sport Held in Zurich, November 2008. Clinical Journal of Sport Medicine, 19, 185-200.
210
MCDOWELL, S., WHYTE, J. & DESPOSITO, M. (1997) Working memory impairments in traumatic brain injury: evidence from a dual task paradigm. Neuropsychologia, 35, 1341-1353.
MCINTOSH, T. K., SAATMAN, K. E. & RAGHUPATHI, R. (1997) Calcium and the pathogenesis of traumatic CNS injury: Cellular and molecular mechanisms. Neuroscientist, 3, 169-175.
MCKENZIE, K. J., MCLELLAN, D. R., GENTLEMAN, S. M., MAXWELL, W. L., GENNARELLI, T. A. & GRAHAM, D. I. (1996) Is beta-APP a marker of axonal damage in short-surviving head injury? Acta Neuropathologica, 92, 608-613.
METTING, Z., RODIGER, L. A., DE KEYSER, J. & VAN DER NAALT, J. (2007) Structural and functional neuroimaging in mild-to-moderate head injury. Lancet Neurology, 6, 699-710.
MILLER, J. D. (1993) Traumatic brain swelling and edema. IN COOPER, P. R. (Ed.) Head Injury. Baltimore, MD, Williams and Wilkins.
MITTL, R. L., GROSSMAN, R. I., HIEHLE, J. F., HURST, R. W., KAUDER, D. R., GENNARELLI, T. A. & ALBURGER, G. W. (1993) Prevalence of MR evidence of diffuse axonal injury in patients with mild head-injury and normal head CT findings. Annual Meeting of the American Society of Neuroradiology. Vancouver, Canada.
MORGANTI-KOSSMANN, M. C., SATGUNASEELAN, L., BYE, N. & KOSSMANN, T. (2007) Modulation of immune response by head injury. Injury-International Journal of the Care of the Injured, 38, 1392-1400.
MRAZIK, M., FERRARA, M. S., PETERSON, C. L., ELLIOTT, R. E., COURSON, R. W., CLANTON, M. D. & HYND, G. W. (2000) Injury severity and neuropsychological and balance outcomes of four college athletes. Brain Injury, 14, 921-931.
MURDOCH, I., PERRY, E. K., COURT, J. A., GRAHAM, D. I. & DEWAR, D. (1998) Cortical cholinergic dysfunction after human head injury. Journal of Neurotrauma, 15, 295-305.
NAKAYAMA, N., OKUMURA, A., SHINODA, J., YASOKAWA, Y. T., MIWA, K., YOSHIMURA, S. I. & IWAMA, T. (2006) Evidence for white matter disruption in traumatic brain injury without macroscopic lesions. Journal of Neurology, Neurosurgery & Psychiatry, 77, 850-855.
NARUSE, S., HORIKAWA, Y., TANAKA, C., HIRAKAWA, K., NISHIKAWA, H. & YOSHIZAKI, K. (1982) Proton nuclear magnetic resonance studies on brain edema. Journal of Neurosurgery, 56, 747-752.
NEIL, J. J. (2008) Diffusion imaging concepts for clinicians. Journal of Magnetic Resonance Imaging, 27, 1-7.
211
NEWCOMBE, V., CHATFIELD, D., OUTTRIM, J., VOWLER, S., MANKTELOW, A., CROSS, J., SCOFFINGS, D., COLEMAN, M., HUTCHINSON, P., COLES, J., CARPENTER, T. A., PICKARD, J., WILLIAMS, G. & MENON, D. (2011) Mapping Traumatic Axonal Injury Using Diffusion Tensor Imaging: Correlations with Functional Outcome. PLoS ONE, 6, e19214.
NEWCOMBE, V. F. J., WILLIAMS, G. B., NORTJE, J., BRADLEY, P. G., CHATFLELD, D. A., OUTTRIM, J. G., HARDING, S. G., COLES, J. P., MAIYA, B., GILLARD, J. H., HUTCHINSON, P. J., PICKARD, J. D., CARPENTER, T. A. & MENON, D. K. (2008) Concordant biology underlies discordant imaging findings: diffusivity behaves differently in grey and white matter post acute neurotrauma. IN MANLEY, G., HEMPHILL, C. & STIVER, S. (Eds.) Intracranial Pressure and Brain Monitoring XIII: Mechanisms and Treatment. Vienna, Springer-Verlag Wien.
NEWCOMBE, V. F. J., WILLIAMS, G. B., NORTJE, J., BRADLEY, P. G., HARDING, S. G., SMIELEWSKI, P., COLES, J. P., MAIYA, B., GILLARD, J. H., HUTCHINSON, P. J., PICKARD, J. D., CARPENTER, T. A. & MENON, D. K. (2007) Analysis of acute traumatic axonal injury using diffusion tensor imaging. British Journal of Neurosurgery, 21, 340-348.
NICE (2007) Clinical Guideline 56. Head Injury: Full Guideline. London, National Institute for Health and Clinical Excellence.
NILSSON, P., HILLERED, L., OLSSON, Y., SHEARDOWN, M. J. & HANSEN, A. J. (1993) Regional Changes in Interstitial K+ and Ca2+ Levels Following Cortical Compression Contusion Trauma in Rats. Journal of Cerebral Blood Flow and Metabolism, 13, 183-192.
NIOGI, S. N., MUKHERJEE, P., GHAJAR, J., JOHNSON, C., KOLSTER, R. A., SARKAR, R., LEE, H., MEEKER, M., ZIMMERMAN, R. D., MANLEY, G. T. & MCCANDLISS, B. D. (2008a) Extent of Microstructural White Matter Injury in Postconcussive Syndrome Correlates with Impaired Cognitive Reaction Time: A 3T Diffusion Tensor Imaging Study of Mild Traumatic Brain Injury. AJNR Am J Neuroradiol, 29, 967-973.
NIOGI, S. N., MUKHERJEE, P., GHAJAR, J., JOHNSON, C. E., KOLSTER, R., LEE, H., SUH, M., ZIMMERMAN, R. D., MANLEY, G. T. & MCCANDLISS, B. D. (2008b) Structural dissociation of attentional control and memory in adults with and without mild traumatic brain injury. Brain, 131, 3209-3221.
NOLIN, P. & HEROUX, L. (2006) Relations Among Sociodemographic, Neurologic, Clinical, and Neuropsychologic Variables, and Vocational Status Following Mild Traumatic Brain Injury: A Follow-up Study. Journal of Head Trauma Rehabilitation, 21, 514-526.
NORRIE, J., HEITGER, M., LEATHEM, J., ANDERSON, T., JONES, R. & FLETT, R. (2010) Mild traumatic brain injury and fatigue: A prospective longitudinal study. Brain Injury, 24, 1528-1538.
212
O'JILE, J. R., RYAN, L. M., BETZ, B., PARKS-LEVY, J., HILSABECK, R. C., RHUDY, J. L. & GOUVIER, W. D. (2006) Information processing following mild head injury. Archives of Clinical Neuropsychology, 21, 293-296.
O'SHAUGHNESSY, E. J., FOWLER, R. S. & REID, V. (1984) Sequelae of Mild Closed Head-Injuries. Journal of Family Practice, 18, 391-394.
OBERAUER, K., SUSS, H. M., SCHULZE, R., WILHELM, O. & WITTMANN, W. W. (2000) Working memory capacity - facets of a cognitive ability construct. Personality and Individual Differences, 29, 1017-1045.
ODA, Y. (1999) Choline acetyltransferase: The structure, distribution and pathologic changes in the central nervous system. Pathology International, 49, 921-937.
OSHIO, K. & FEINBERG, D. A. (1991) GRASE (Gradient-and Spin-Echo) imaging: A novel fast MRI technique. Magnetic Resonance in Medicine, 20, 344-349.
PALACIOS, E., FERNANDEZ-ESPEJO, D., JUNQUE, C., SANCHEZ-CARRION, R., ROIG, T., TORMOS, J., BARGALLO, N. & VENDRELL, P. (2011) Diffusion tensor imaging differences relate to memory deficits in diffuse traumatic brain injury. BMC Neurology, 11, 24.
PARDO, J. V., PARDO, P. J., JANER, K. W. & RAICHLE, M. E. (1990) The Anterior Cingulate Cortex Mediates Processing Selection in the Stroop Attentional Conflict Paradigm. Proceedings of the National Academy of Sciences of the United States of America, 87, 256-259.
PATERAKIS, K., KARANTANAS, A. H., KOMNOS, A. & VOLIKAS, Z. (2000) Outcome of patients with diffuse axonal injury: The significance and prognostic value of MRI in the acute phase. Journal of Trauma-Injury Infection and Critical Care, 49, 1071-1075.
PERLBARG, V., PUYBASSET, L., TOLLARD, E., LEHÉRICY, S., BENALI, H. & GALANAUD, D. (2009) Relation between brain lesion location and clinical outcome in patients with severe traumatic brain injury: A diffusion tensor imaging study using voxel-based approaches. Human Brain Mapping, 30, 3924-3933.
PERLSTEIN, W. M., COLE, M. A., DEMERY, J. A., SEIGNOUREL, P. J., DIXIT, N. K., LARSON, M. J. & BRIGGS, R. W. (2004) Parametric manipulation of working memory load in traumatic brain injury: Behavioral and neural correlates. Journal of the International Neuropsychological Society, 10, 724-741.
PIERPAOLI, C., BARNETT, A., PAJEVIC, S., CHEN, R., PENIX, L., VIRTA, A. & BASSER, P. (2001) Water diffusion changes in Wallerian degeneration and their dependence on white matter architecture. Neuroimage, 13, 1174-1185.
PITTELLA, J. E. H. & GUSMAO, S. N. S. (2003) Diffuse vascular injury in fatal road traffic accident victims: Its relationship to diffuse axonal injury. Journal of Forensic Sciences, 48, 626-630.

213
PONSFORD, J., FACEM, P. C., WILLMOTT, C., ROTHWELL, A., KELLY, A. M., NELMS, R. & NG, K. T. (2004) Use of the Westmead PTA scale to monitor recovery of memory after mild head injury. Brain Injury, 18, 603-614.
POVLISHOCK, J. T. & CHRISTMAN, C. W. (1995) The Pathobiology of Traumatically Induced Axonal Injury in Animals and Humans: A Review of Current Thoughts. Journal of Neurotrauma, 12, 555-564.
POVLISHOCK, J. T., ERB, D. E. & ASTRUC, J. (1992) Axonal Response to Traumatic Brain Injury - Reactive Axonal Change, Deafferentation, and Neuroplasticity. Journal of Neurotrauma, 9, S189-S200.
POWELL, T. J., COLLIN, C. & SUTTON, K. (1996) A follow-up study of patients hospitalized after minor head injury. Disability and Rehabilitation, 18, 231-237.
RADFORD, K. A., LINCOLN, N. B. & MURRAY-LESLIE, C. (2004) Validation of the stroke drivers screening assessment for people with traumatic brain injury. Brain Injury, 18, 775-786.
REILLY, P. L. & BULLOCK, R. (2005) Head injury pathophysiology and management, Hodder Arnold.
RICKELS, E., VON WILD, K. & WENZLAFF, P. (2010) Head injury in Germany: A population-based prospective study on epidemiology, causes, treatment and outcome of all degrees of head-injury severity in two distinct areas. Brain Injury, 24, 1491-1504.
RIGGIO, S. & WONG, M. (2009) Neurobehavioral Sequelae of Traumatic Brain Injury. Mount Sinai Journal of Medicine, 76, 163-172.
RILEY, G. A. & SIMMONDS, L. V. (2003) How robust is performance on the National Adult Reading Test following traumatic brain injury? British Journal of Clinical Psychology, 42, 319-328.
ROBERTSON, C. S., VALADKA, A. B., HANNAY, J., CONTANT, C. F., GOPINATH, S. P., CORMIO, M., UZURA, M. & GROSSMAN, R. G. (1999) Prevention of secondary ischemic insults after severe head injury. Critical Care Medicine, 27, 2086-2095.
RUFF, R. M. & JURICA, P. (1999) In search of a unified definition for mild traumatic brain injury. Brain Injury, 13, 943-952.
RUTGERS, D. R., TOULGOAT, F., CAZEJUST, J., FILLARD, P., LASJAUNIAS, P. & DUCREUX, D. (2008) White Matter Abnormalities in Mild Traumatic Brain Injury: A Diffusion Tensor Imaging Study. American Journal of Neuroradiology, 29, 514-519.
RYU, W. H. A., CULLEN, N. K. & BAYLEY, M. T. (2010) Early neuropsychological tests as correlates of productivity 1 year after traumatic brain injury: a preliminary matched case-control study. International Journal of Rehabilitation Research, 33, 84-87.
214
SALAT, D. H., TUCH, D. S., GREVE, D. N., VAN DER KOUWE, A. J. W., HEVELONE, N. D., ZALETA, A. K., ROSEN, B. R., FISCHL, B., CORKIN, S., ROSAS, H. D. & DALE, A. M. (2005) Age-related alterations in white matter microstructure measured by diffusion tensor imaging. Neurobiology of Aging, 26, 1215-1227.
SALMOND, C. H., MENON, D. K., CHATFIELD, D. A., WILLIAMS, G. B., PENA, A., SAHAKIAN, B. J. & PICKARD, J. D. (2006) Diffusion tensor imaging in chronic head injury survivors: correlations with learning and memory indices. NeuroImage, 29, 117-124.
SANCHEZ-CARRION, R., FERNANDEZ-ESPEJO, D., JUNQUE, C., FALCON, C., BARGALLO, N., ROIG, T., BERNABEU, M., TORMOS, J. M. & VENDRELL, P. (2008a) A longitudinal fMRI study of working memory in severe TBI patients with diffuse axonal injury. NeuroImage, 43, 421-429.
SANCHEZ-CARRION, R., GOMEZ, P. V., JUNQUE, C., FERNANDEZ-ESPEJO, D., FALCON, C., BARGALLO, N., ROIG-ROVIRA, T., ENSENAT-CANTALLOPS, A. & BERNABEU, M. (2008b) Frontal hypoactivation on functional magnetic resonance imaging in working memory after severe diffuse traumatic brain injury. Journal of Neurotrauma, 25, 479-494.
SAUR, D., KUCINSKI, T., GRZYSKA, U., ECKERT, B., EGGERS, C., NIESEN, W., SCHODER, V., ZEUMER, H., WEILLER, C. & ROTHER, J. (2003) Sensitivity and Interrater Agreement of CT and Diffusion-Weighted MR Imaging in Hyperacute Stroke. American Journal of Neuroradiology, 24, 878-885.
SCHAEFER, P. W., HUISMAN, T., SORENSON, A. G., GONZALEZ, R. G. & SCHWAMM, L. H. (2004) Diffusion-weighted MR imaging in closed head injury: High correlation with initial Glasgow coma scale score and score on modified Rankin scale at discharge. Radiology, 233, 58-66.
SCHEID, R., PREUL, C., GRUBER, O., WIGGINS, C. & VON CRAMON, D. Y. (2003) Diffuse axonal injury associated with chronic traumatic brain injury: Evidence from T2*-weighted gradient-echo imaging at 3 T. American Journal of Neuroradiology, 24, 1049-1056.
SCHELLINGER, P. D., FIEBACH, J. B., HOFFMANN, K., BECKER, K., ORAKCIOGLU, B., KOLLMAR, R., JUTTLER, E., SCHRAMM, P., SCHWAB, S., SARTOR, K. & HACKE, W. (2003) Stroke MRI in Intracerebral Hemorrhage: Is there a perihemorrhagic penumbra? Stroke, 34, 1674-1679.
SCHLAUG, G., SIEWERT, B., BENFIELD, A., EDELMAN, R. R. & WARACH, S. M. D. (1997) Time course of the apparent diffusion coefficient (ADC) abnormality in human stroke. Neurology, 49, 113-119.
SCHWARZ, L., PENNA, S. & NOVACK, T. (2009) Factors contributing to performance on the Rey Complex Figure Test in individuals with traumatic brain injury. Clinical Neuropsychologist, 23, 255-267.
215
SHEEDY, J., HARVEY, E., FAUX, S., GEFFEN, G. & SHORES, E. A. (2009) Emergency Department Assessment of Mild Traumatic Brain Injury and the Prediction of Postconcussive Symptoms: A 3-Month Prospective Study. Journal of Head Trauma Rehabilitation, 24, 333-343.
SHEMESH, N. & COHEN, Y. (2011) Microscopic and Compartment Shape Anisotropies in Gray and White Matter Revealed by Angular Bipolar Double-PFG MR. Magnetic Resonance in Medicine, 65, 1216-1227.
SIBSON, N. R., LOWE, J. P., BLAMIRE, A. M., MARTIN, M. J., OBRENOVITCH, T. P. & ANTHONY, D. C. (2008) Acute astrocyte activation in brain detected by MRI: new insights into T-1 hypointensity. Journal of Cerebral Blood Flow and Metabolism, 28, 621-632.
SIDAROS, A., ENGBERG, A., SIDAROS, K., LIPTROT, M. G., HERNING, M., PETERSEN, P., PAULSON, O. B., JERNIGAN, T. L. & ROSTRUP, E. (2008) Diffusion tensor imaging during recovery from severe traumatic brain injury and relation to clinical outcome: a longitudinal study. Brain, 131, 559-572.
SIDAROS, A., SKIMMINGE, A., LIPTROT, M. G., SIDAROS, K., ENGBERG, A. W., HERNING, M., PAULSON, O. B., JERNIGAN, T. L. & ROSTRUP, E. (2009) Long-term global and regional brain volume changes following severe traumatic brain injury: A longitudinal study with clinical correlates. NeuroImage, 44, 1-8.
SIGNORETTI, S., VAGNOZZI, R., TAVAZZI, B. & LAZZARINO, G. (2010) Biochemical and neurochemical sequelae following mild traumatic brain injury: summary of experimental data and clinical implications. Journal of Neurosurgery, 29, E1.
SMITH, D. H., MEANEY, D. F. & SHULL, W. H. (2003) Diffuse Axonal Injury in Head Trauma. Journal of Head Trauma Rehabilitation, 18, 307-316.
SMITH, S. L., ANDRUS, P. K., ZHANG, J. R. & HALL, E. D. (1994) Direct Measurement of Hydroxyl Radicals, Lipid-Peroxidation, and Blood-Brain-Barrier Disruption Following Unilateral Cortical Impact Head-Injury in the Rat. Journal of Neurotrauma, 11, 393-404.
SMITH, S. M. (2002) Fast robust automated brain extraction. Human Brain Mapping, 17, 143-155.
SMITH, S. M., JENKINSON, M., JOHANSEN-BERG, H., RUECKERT, D., NICHOLS, T. E., MACKAY, C. E., WATKINS, K. E., CICCARELLI, O., CADER, M. Z., MATTHEWS, P. M. & BEHRENS, T. E. J. (2006) Tract-based spatial statistics: Voxelwise analysis of multi-subject diffusion data. NeuroImage, 31, 1487-1505.
SMITS, M., DIPPEL, D. W. J., HOUSTON, G. C., WIELOPOLSKI, P. A., KOUDSTAAL, P. J., HUNINK, M. G. M. & VAN DER LUGT, A. (2009) Postconcussion syndrome after minor head injury: Brain activation of working memory and attention. Human Brain Mapping, 30, 2789-2803.
216
SORENSEN, A. G., WU, O., COPEN, W. A., DAVIS, T. L., GONZALEZ, R. G., KOROSHETZ, W. J., REESE, T. G., ROSEN, B. R., WEDEEN, V. J. & WEISSKOFF, R. M. (1999) Human Acute Cerebral Ischemia: Detection of Changes in Water Diffusion Anisotropy by Using MR Imaging. Radiology, 212, 785-792.
ST CLAIR-THOMPSON, H. L. (2010) Backwards digit recall: A measure of short-term memory or working memory? European Journal of Cognitive Psychology, 22, 286-296.
STEJSKAL, E. O. & TANNER, J. E. (1965) Spin Diffusion Measurements: Spin Echoes in the Presence of a Time-Dependent Field Gradient. The Journal of Chemical Physics, 42, 288-292.
STEWART, K., ADAMS, R. A., CARROLL, J. E., FISHWICK, A. D., COWIE, C. J. A. & HUNTER, A. R. (2011) Experimental Findings in an Ethanol Saturation Model. IN POOLE, A. J. (Ed.) 11th Annual Meeting of the EOSG. Abersoch, Wales, Earl of Stamford.
STOLL, G., JANDER, S. & MYERS, R. R. (2002) Degeneration and regeneration of the peripheral nervous system: From Augustus Waller's observations to neuroinflammation. Journal of the Peripheral Nervous System, 7, 13-27.
STRAUSS, E., SHERMAN, E. M. S. & SPREEN, O. (2006) A Compendium of Neuropsychological Tests: Administration, Norms and Commentary., Oxford University Press.
STROOP, J. R. (1935) Studies of interference in serial verbal reactions. Journal of Experimental Psychology, 18, 643-662.
STUSS, D. T., FLODEN, D., ALEXANDER, M. P., LEVINE, B. & KATZ, D. (2001) Stroop performance in focal lesion patients: dissociation of processes and frontal lobe lesion location. Neuropsychologia, 39, 771-786.
SUN, D. A., DESHPANDE, L. S., SOMBATI, S., BARANOVA, A., WILSON, M. S., HAMM, R. J. & DELORENZO, R. J. (2008) Traumatic brain injury causes a long-lasting calcium (Ca2+)-plateau of elevated intracellular Ca levels and altered Ca2+ homeostatic mechanisms in hippocampal neurons surviving brain injury. European Journal of Neuroscience, 27, 1659-1672.
SWANN, I. J. & TEASDALE, G. M. (1999) Current concepts in the management of patients with so-called 'minor' or 'mild' head injury. Trauma, 1, 143-155.
TAYLOR, S. F., KORNBLUM, S., LAUBER, E., MINOSHIMA, S. & KOEPPE, R. A. (1994) A Pet Activation Study of Selective Attending During a Stroop Task. Biological Psychiatry, 35, 683-683.
TEASDALE, G. & JENNETT, B. (1974) Assessment of coma and impaired consciousness: A Practical Scale. The Lancet, 304, 81-84.
THE HEALTH AND SOCIAL CARE INFORMATION CENTRE (2011) Hospital Episode Statistics. IN HEALTH, D. O. (Ed.), Stationery Office.
217
THORNHILL, S., TEASDALE, G. M., MURRAY, G. D., MCEWEN, J., ROY, C. W. & PENNY, K. I. (2000) Disability in young people and adults one year after head injury: prospective cohort study. British Medical Journal, 320, 1631-1635.
TOLLARD, E., GALANAUD, D., PERLBARG, V., SANCHEZ-PENA, P., LE FUR, Y., ABDENNOUR, L., COZZONE, P., LEHERICY, S., CHIRAS, J. & PUYBASSET, L. (2009) Experience of diffusion tensor imaging and H-1 spectroscopy for outcome prediction in severe traumatic brain injury: Preliminary results. Critical Care Medicine, 37, 1448-1455.
TOMBAUGH, T. N. (2006) A comprehensive review of the Paced Auditory Serial Addition Test (PASAT). Archives of Clinical Neuropsychology, 21, 53-76.
TROYER, A. K., MOSCOVITCH, M. & WINOCUR, G. (1997) Clustering and switching as two components of verbal fluency: Evidence from younger and older healthy adults. Neuropsychology, 11, 138-146.
TSAOUSIDES, T. & GORDON, W. A. (2009) Cognitive Rehabilitation Following Traumatic Brain Injury: Assessment to Treatment. Mount Sinai Journal of Medicine, 76, 173-181.
TSUI, K. L., SZE, N. N., SO, F. L. & WONG, S. C. (2010) Association between drink driving and severity of crash injuries to road users. Hong Kong Journal of Emergency Medicine, 17, 34-39.
VANDERPLOEG, R. D., CURTISS, G. & BELANGER, H. G. (2005) Long-term neuropsychological outcomes following mild traumatic brain injury. Journal of the International Neuropsychological Society, 11, 228-236.
VARGAS, M. E. & BARRES, B. A. (2007) Why is Wallerian degeneration in the CNS so slow? Annual Review of Neuroscience. Palo Alto, Annual Reviews.
VERNON, P. A. (1983) Speed of information processing and general intelligence. Intelligence, 7, 53-70.
WAKANA, S., CAPRIHAN, A., PANZENBOECK, M. M., FALLON, J. H., PERRY, M., GOLLUB, R. L., HUA, K. G., ZHANG, J. Y., JIANG, H. Y., DUBEY, P., BLITZ, A., VAN ZIJL, P. & MORI, S. (2007) Reproducibility of quantitative tractography methods applied to cerebral white matter. NeuroImage, 36, 630-644.
WASDEN, C. C., MCINTOSH, S. E., KEITH, D. S. & MCCOWAN, C. (2009) An Analysis of Skiing and Snowboarding Injuries on Utah Slopes. Journal of Trauma-Injury Infection and Critical Care, 67, 1022-1026.
WEISS, N., GALANAUD, D., CARPENTIER, A., DE MONTCEL, S. T., NACCACHE, L., CORIAT, P. & PUYBASSET, L. (2008) A combined clinical and MRI approach for outcome assessment of traumatic head injured comatose patients. Journal of Neurology, 255, 217-223.
WESTBROOK, C., ROTH, C. K. & TALBOT, J. (2005) MRI In Practice, Blackwell Publishing.
218
WILDE, E. A., CHU, Z., BIGLER, E. D., HUNTER, J. V., FEARING, M. A., HANTEN, G., NEWSOME, M. R., SCHEIBEL, R. S., LI, X. & LEVIN, H. S. (2006) Diffusion Tensor Imaging in the Corpus Callosum in Children after Moderate to Severe Traumatic Brain Injury. Journal of Neurotrauma, 23, 1412-1426.
WILDE, E. A., MCCAULEY, S. R., HUNTER, J. V., BIGLER, E. D., CHU, Z., WANG, Z. J., HANTEN, G. R., TROYANSKAYA, M., YALLAMPALLI, R., LI, X., CHIA, J. & LEVIN, H. S. (2008) Diffusion tensor imaging of acute mild traumatic brain injury in adolescents. Neurology, 70, 948-955.
WILSON, B., VIZOR, A. & BRYANT, T. (1991) Predicting Severity of Cognitive Impairment after Severe Head Injury. Brain Injury, 5, 189-198.
WILSON, J. X. & GELB, A. W. (2002) Free radicals, antioxidants, and neurologic injury: Possible relationship to cerebral protection by anesthetics. Journal of Neurosurgical Anesthesiology, 14, 66-79.
WOZNIAK, J. R., KRACH, L., WARD, E., MUELLER, B. A., MUETZEL, R., SCHNOEBELEN, S., KIRAGU, A. & LIM, K. O. (2007) Neurocognitive and neuroimaging correlates of pediatric traumatic brain injury: A diffusion tensor imaging (DTI) study. Archives of Clinical Neuropsychology, 22, 555-568.
WU, T. C., WILDE, E. A., BIGLER, E. D., YALLAMPALLI, R., MCCAULEY, S. R., TROYANSKAYA, M., CHU, Z., LI, X., HANTEN, G., HUNTER, J. V. & LEVIN, H. S. (2010) Evaluating the Relationship between Memory Functioning and Cingulum Bundles in Acute Mild Traumatic Brain Injury Using Diffusion Tensor Imaging. Journal of Neurotrauma, 27, 303-307.
XU, J., RASMUSSEN, I.-A., LAGOPOULOS, J. & HABERG, A. (2007) Diffuse Axonal Injury in Severe Traumatic Brain Injury Visualized Using High-Resolution Diffusion Tensor Imaging. Journal of Neurotrauma, 24, 753-765.
ZAUNER, A., DAUGHERTY, W. P., BULLOCK, M. R. & WARNER, D. S. (2002) Brain oxygenation and energy metabolism: Part I - Biological function and pathophysiology. Neurosurgery, 51, 289-302.
ZHANG, F., LU, G. M. & ZEE, C. S. (2011) Comparative study of the sensitivity of ADC value and T(2) relaxation time for early detection of Wallerian degeneration. European Journal of Radiology, 79, 118-123.
ZHANG, Y., BRADY, M. & SMITH, S. (2001) Segmentation of brain MR images through a hidden Markov random field model and the expectation-maximization algorithm. IEEE Transactions on Medical Imaging, 20, 45-57.
ZHANG, Y., DU, A.-T., HAYASAKA, S., JAHNG, G.-H., HLAVIN, J., ZHAN, W., WEINER, M. W. & SCHUFF, N. (2008) Patterns of age-related water diffusion changes in human brain by concordance and discordance analysis. Neurobiology of aging, 31, 1991-2001.
Copyright © 2022 FDOKUMEN