![[Immunohistochemical studies of cultured cells from bone marrow and aseptic inflammation]](https://static.fdokumen.com/doc/165x107/63360d7764d291d2a302b9a2/immunohistochemical-studies-of-cultured-cells-from-bone-marrow-and-aseptic-inflammation.jpg)
[Immunohistochemical studies of cultured cells from bone marrow and aseptic inflammation]
Upload
independentCategory
view
1download
0
BioMed CentralDiagnostic Pathology
ss
Open AcceMethodologyQuantitative image analysis of immunohistochemical stains using a CMYK color modelNhu-An Pham1,2, Andrew Morrison1, Joerg Schwock1,3, Sarit Aviel-Ronen1, Vladimir Iakovlev1,3, Ming-Sound Tsao1,2,3, James Ho1 and David W Hedley*1,2,3Address: 1Division of Applied Molecular Oncology, Ontario Cancer Institute/Princess Margaret Hospital, University Health Network, Toronto, Canada, 2Department of Medical Biophysics, University of Toronto, Toronto, Canada and 3Department of Laboratory Medicine and Pathobiology, University of Toronto, Toronto, Canada
Email: Nhu-An Pham - [email protected]; Andrew Morrison - [email protected]; Joerg Schwock - [email protected]; Sarit Aviel-Ronen - [email protected]; Vladimir Iakovlev - [email protected]; Ming-Sound Tsao - [email protected]; James Ho - [email protected]; David W Hedley* - [email protected]
* Corresponding author
AbstractBackground: Computer image analysis techniques have decreased effects of observer biases, and increased thesensitivity and the throughput of immunohistochemistry (IHC) as a tissue-based procedure for the evaluation ofdiseases.
Methods: We adapted a Cyan/Magenta/Yellow/Key (CMYK) model for automated computer image analysis toquantify IHC stains in hematoxylin counterstained histological sections.
Results: The spectral characteristics of the chromogens AEC, DAB and NovaRed as well as the counterstainhematoxylin were first determined using CMYK, Red/Green/Blue (RGB), normalized RGB and Hue/Saturation/Lightness (HSL) color models. The contrast of chromogen intensities on a 0–255 scale (24-bit image file) as wellas compared to the hematoxylin counterstain was greatest using the Yellow channel of a CMYK color model,suggesting an improved sensitivity for IHC evaluation compared to other color models. An increase in activatedSTAT3 levels due to growth factor stimulation, quantified using the Yellow channel image analysis was associatedwith an increase detected by Western blotting. Two clinical image data sets were used to compare the Yellowchannel automated method with observer-dependent methods. First, a quantification of DAB-labeled carbonicanhydrase IX hypoxia marker in 414 sections obtained from 138 biopsies of cervical carcinoma showed strongassociation between Yellow channel and positive color selection results. Second, a linear relationship was alsodemonstrated between Yellow intensity and visual scoring for NovaRed-labeled epidermal growth factorreceptor in 256 non-small cell lung cancer biopsies.
Conclusion: The Yellow channel image analysis method based on a CMYK color model is independent ofobserver biases for threshold and positive color selection, applicable to different chromogens, tolerant ofhematoxylin, sensitive to small changes in IHC intensity and is applicable to simple automation procedures. Thesecharacteristics are advantageous for both basic as well as clinical research in an unbiased, reproducible and highthroughput evaluation of IHC intensity.
Published: 27 February 2007
Diagnostic Pathology 2007, 2:8 doi:10.1186/1746-1596-2-8
Received: 1 February 2007Accepted: 27 February 2007
This article is available from: http://www.diagnosticpathology.org/content/2/1/8
© 2007 Pham et al; licensee BioMed Central Ltd. This is an Open Access article distributed under the terms of the Creative Commons Attribution License (http://creativecommons.org/licenses/by/2.0), which permits unrestricted use, distribution, and reproduction in any medium, provided the original work is properly cited.
Page 1 of 10(page number not for citation purposes)
Diagnostic Pathology 2007, 2:8 http://www.diagnosticpathology.org/content/2/1/8
BackgroundImmunohistochemistry (IHC) for the evaluation of anti-gen expression as well as higher resolution methodologiesfor cytogenetic analysis are standard procedures for thediagnosis and prognosis of cancer and other diseases [1].In recent years, cancer treatment response and diseaseprogression increasingly rely on IHC to monitor changesin targeted antigens. Abundances of antigens have so farrelied primarily on visual scoring and to a lesser extentcomputer-assisted image processing techniques [2]. Amajor advantage of computer techniques is the avoidanceof inter-observer variability in interpreting subtle antigenlevel changes [3]. In addition, pattern recognition, whichhas been applied to image analysis of fluorescence in situhybridization [4], may also be applied to IHC image anal-ysis of compartmentalized antigen distributions, particu-larly with recent developments in self-learning computerprograms [5]. Most computer-based techniques for IHCimage analysis have so far had limited applicability due toseveral drawbacks including a need for specific softwaresystems, often with considerable need for user input [6-9].These image analyses have commonly been performed onthe single assessment of 3,3'-diaminobenzidine (DAB)labeling for a variety of cytoplasmic markers. Conse-quently, misclassifications were frequently encounteredwhen two or more chromogens with overlapping absorp-tion spectra were used simultaneously [6]. Specializedcolor deconvolution algorithms can be applied to dis-criminate multiple spectra [10]. Alternatively, the recentapplication of spectral imaging offers an optimal methodto capture and analyze images at multiple wavelengths[11]. However, digitally captured IHC brightfield imagesare usually stored as composites of three 8-bit monochro-matic red, green and blue channels (RGB), which can beconverted to the Cyan/Magenta/Yellow/Key (CMYK) orHue/Saturation/Lightness (HSL) color space. Previously,components of the RGB [12], their normalization (nR,nG, nB; nRGB) [6], or HSL [5,8,13] have been appliedtowards IHC quantification.
In this study, we adapted a CMYK color model as a simplemethod to quantify IHC staining with three commonlyused chromogens including 3-amino-9-ethylcarbazole(AEC), DAB, and NovaRed with hematoxylin counter-stain. For simplicity, images of color bars representingIHC staining were used to characterize the performance ofindividual channels in the color models CMYK, RGB,nRGB and HSL. These results indicated advantages withthe Yellow channel analysis, based on a CMYK colormodel. Therefore, the Yellow channel method was furthertested on three applications. First, sensitivities of imageanalysis methods were compared in the IHC staining ofphosphorylated signal transduction and transcription fac-tor-3 (p-STAT3) in tumor xenografts. Following, the per-formance of a high throughput automated Yellow
channel method was compared to observer-dependentmethods, including positive color selection for a hypoxiamarker carbonic anhydrase-IX (CA-IX)-labeled DAB andvisual scoring for epidermal growth factor receptor(EGFR)-labeled NovaRed in the second and third applica-tions, respectively.
MethodsImage acquisition and processingSlides were scanned with a ScanScope CS (Aperio Tech-nologies, Vista, CA) using brightfield imaging at 20× mag-nification. Specimen areas were selected and individualimages were saved in a 24-bit RGB TIFF file format with aresolution of 1 µm/pixel using the ImageScope software(Aperio Technologies). The automated analysis of theTIFF image files was performed using the programminglanguage IDL 6.3 (ITT Visual Information Solutions, Boul-der, Colorado) [14,15] for IHC quantification using RGB[12], normalized RGB [6], HSL [8,13], and CMYK asdescribed below.
CMYK image analysis methodWe adapted a CMYK model with maximum grey compo-nent replacement, a criterion in which the lowest bright-ness level is subtracted from all channels. This criterioneffectively discriminates color differences by subtractingout the grey level, a level of equal intensity among thethree channels (C, M, Y). Consequently, this subtractionsets one of the color channels to zero in each image. Theselection of this display criterion for an image using apopular software Adobe® Photoshop®7.0, involves the fol-lowing sequence of menu selections: Edit, Color settings,Custom CMYK and Black generation set at Maximum. Inthis study, CMYK values were derived from theCMYK_Convert library procedure in IDL 6.3 using theequations:
(* indicates multiplication)
K (black) = 255 - maximum(R, G, B)
C = 255* [1 - R/(255 - K)] (if K = 255 then C = 0)
M = 255* [1 - G/(255 - K)] (if K = 255 then M = 0)
Y = 255* [1 - B/(255 - K)] (if K = 255 then Y = 0)
Mean intensity measurements in regions of interest werecomputed without the use of positive color intensitythresholds. However, proportions of labeled area in tissuewere determined with a positive range intensity of 21+and 93+ for the Yellow and nRed channels, respectively.
Page 2 of 10(page number not for citation purposes)
Diagnostic Pathology 2007, 2:8 http://www.diagnosticpathology.org/content/2/1/8
Xenograft modelsSpectral characteristics of AEC, DAB and NovaRed weredisplayed with the different color models using color barsthat were generated from a range of representative IHCstaining derived from the xenograft studies describedbelow, as well as additional IHC archived slides thatshowed a greater range of staining intensity.
Changes in STAT3 phosphorylation (p-STAT3) levels wereassociated with different conditions, including growthfactor stimulation and sampling techniques as previouslydescribed [16]. Formalin-fixed paraffin embedded speci-mens were obtained to compare IHC staining using differ-ent chromogens AEC, DAB or NovaRed, and hematoxylincounterstain. Briefly, a tumor xenograft was excised anddivided into two equal parts. One part was further dividedand subjected to immediate formalin fixation, or proteinextraction for Western blot analysis [17]. The second partwas incubated with 50 ng/ml epidermal growth factor(EGF, Sigma-Aldrich, Oakville, ON) in PBS for 20 minutesprior to specimen analysis. The antibody S727p-STAT3 (BDBiosciences, Mississauga, ON) was used for Western blot-ting at a dilution of 1:100, and anti-GAPDH used at a dilu-tion of 1:5000 (Ambion, Foster City, CA). Protein bandswere detected with ECL plus fluorescence, imaged with aTyphoon system and their intensities were quantified(mean intensity × band area) and normalized withGAPDH using ImageQuant5.2 software (GE Healthcare,Little Chalfont, Buckinghamshire, UK).
Second, p-STAT3 levels were also quantified in formalin-fixed paraffin embedded sections of fine-needle samplesobtained from a tumor xenograft. These samples weresubjected to either immediate or delayed fixation after 5,20 or 60 minutes, which caused an increase in p-STAT3.
Clinical test sets for comparison with CMYK modelImage analysis was performed on two clinical image datasets collected for other histopathological studies. The firststudy comprised of a total of 414 sections obtained fromthree adjacent sections of 138 frozen uterine cervical car-cinoma biopsies. Carbonic anhydrase-IX-labeled DABwas previously evaluated with a positive color selectionmethod [18]. In brief, a visual selection of a range of pos-itive brown color pixels was performed using Adobe®Pho-toshop® 7.0 and batched analyzed using the IDL 6.3programming language. Image analysis was performed inareas designated by tumor masks.
The second study comprised of a total of 282 formalin-fixed and paraffin embedded NSCLC biopsies arranged in8 tissue microarrays which were IHC-stained for EGFR-labeled NovaRed [19]. Three cores of 0.6 mm diameterrepresented each case with evaluation completed on casesrepresented by at least 2 cores (n = 256). Two evaluators
visually scored with a scale 0–3 (0 for absence of mem-brane staining in cancer cells) and their scores werestrongly associated (r = 0.97). Thus, the mean of corescores was used as the final score for individual cases.Image analysis was performed in areas designated bywhole tissue core masks since anti-EGFR demonstratedhigh specificity for cancer cells.
ImmunohistochemistrySpecimens were processed with routine protocols usinganti-S727p-STAT3 (BD Biosciences), anti-CA-IX (a gener-ous gift of Dr. Adrian Harris, University of Oxford, UK)[15] and anti-EGFR (clone 31G7, Zymed Technologies,Invitrogen, Burlington, ON). The Idetect Ultra HRP Detec-tion System (ID Labs Inc, London, Ontario) was used tovisualize either DAB (Dako Corp, Carpinteria, CA),NovaRED or AEC (Vector Laboratories). Counterstainingwas performed with Gill modified hematoxylin (Har-leco®).
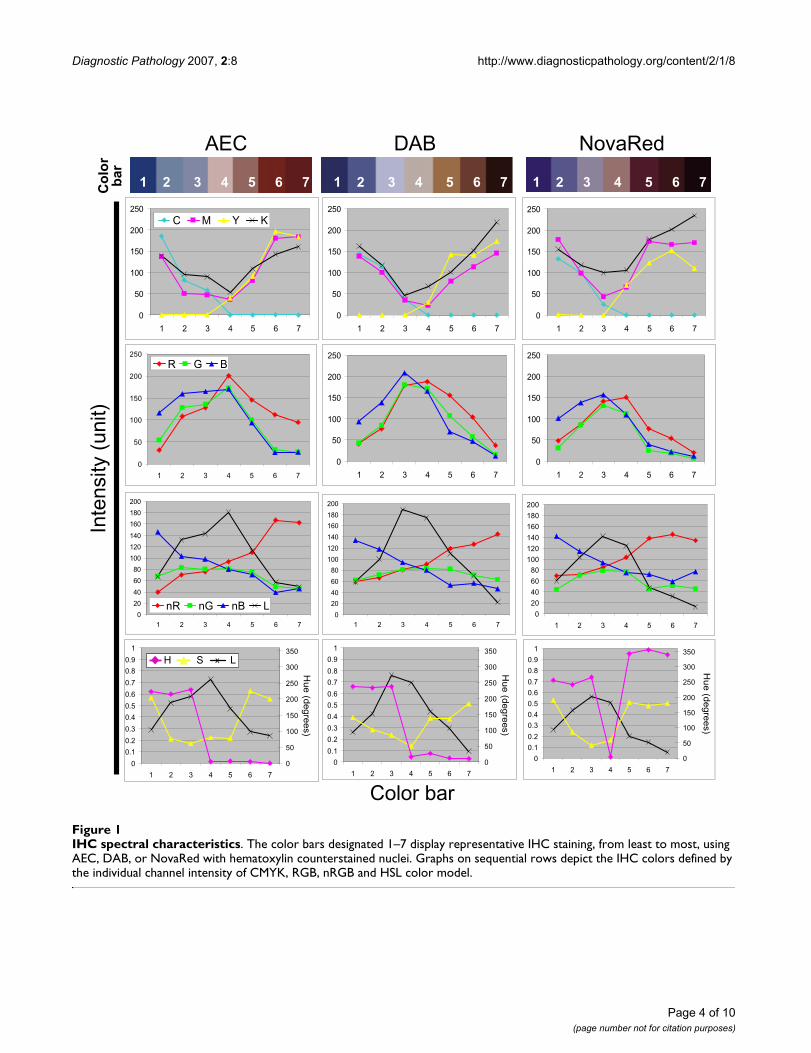
ResultsIHC spectral characteristicsFour color models, CMYK, RGB, nRGB and HSL, wereapplied to examine the spectral characteristics of AEC,DAB, NovaRed and hematoxylin counterstain (Figure 1).Chromogen staining in hematoxylin counterstained spec-imen ranged from absent (color bars 1–3, Figure 1) topresent (color bars 4 to 7, Figure 1) for the respective chro-mogens in the nuclear compartment sampled. Increasingchromogen intensity was similar to intensities obtained inthe absence of hematoxylin counterstain [See additionalfile 1]. However, in the presence of hematoxylin counter-stain (Figure 1) the intensity levels of most channels over-lapped between hematoxylin and chromogen colorsexcept for those characterized by the Yellow channel, nor-malized Red channel (nR) or normalized Blue channel(nB). Interestingly, highest chromogen intensity levelssaturated on the Yellow, nR or nB scale in either the pres-ence or absence of hematoxylin (Figure 1 and Additionalfile 1). This observation suggests that it is important toremain below chromogen saturation levels for a directcorrelation with intensity levels.
Unique features of the presented Yellow channel includedan automatic setting at zero for the hematoxylin counter-stain as well as a greater utilization of the 0–255 intensityscale compared to nR or nB. These characteristics demon-strated that the Yellow channel achieved a high contrastbetween different chromogen intensities as well asbetween the tested chromogens and the hematoxylincounterstain. The performance of the CMYK Yellow chan-nel method was further tested in three applications whichused other automated and observer-dependent methods.
Page 3 of 10(page number not for citation purposes)
Diagnostic Pathology 2007, 2:8 http://www.diagnosticpathology.org/content/2/1/8
Page 4 of 10(page number not for citation purposes)
IHC spectral characteristicsFigure 1IHC spectral characteristics. The color bars designated 1–7 display representative IHC staining, from least to most, using AEC, DAB, or NovaRed with hematoxylin counterstained nuclei. Graphs on sequential rows depict the IHC colors defined by the individual channel intensity of CMYK, RGB, nRGB and HSL color model.
AEC DAB NovaRed
Co
lor
bar
1 2 3 4 5 6 7 1 2 3 4 5 6 7 1 2 3 4 5 6 7
0
20
40
60
80
100
120
140
160
180
200
1 2 3 4 5 6 7
nR nG nB L0
20
40
60
80
100
120
140
160
180
200
1 2 3 4 5 6 7
0
50
100
150
200
250
1 2 3 4 5 6 7
R G B
0
50
100
150
200
250
1 2 3 4 5 6 7
0
50
100
150
200
250
1 2 3 4 5 6 7
C M Y K
0
50
100
150
200
250
1 2 3 4 5 6 7
0
50
100
150
200
250
1 2 3 4 5 6 7
0
0.1
0.2
0.3
0.4
0.5
0.6
0.7
0.8
0.9
1
1 2 3 4 5 6 7
0
50
100
150
200
250
300
350
Hue (degrees)
xH S L
0
0.1
0.2
0.3
0.4
0.5
0.6
0.7
0.8
0.9
1
1 2 3 4 5 6 7
0
50
100
150
200
250
300
350
Hue (degrees)
0
0.1
0.2
0.3
0.4
0.5
0.6
0.7
0.8
0.9
1
1 2 3 4 5 6 7
0
50
100
150
200
250
300
350
Hue (degrees)
0
50
100
150
200
250
1 2 3 4 5 6 7
0
20
40
60
80100
120
140
160
180
200
1 2 3 4 5 6 7
Color bar
Inte
nsity
(un
it)
Diagnostic Pathology 2007, 2:8 http://www.diagnosticpathology.org/content/2/1/8
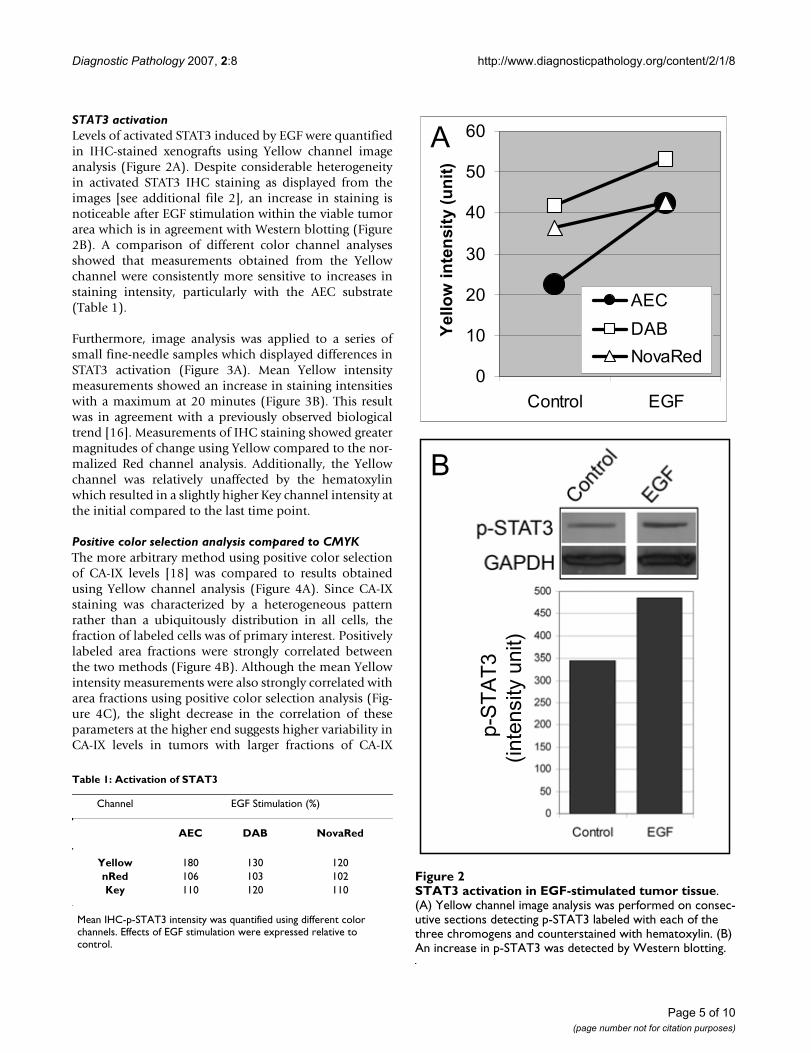
STAT3 activationLevels of activated STAT3 induced by EGF were quantifiedin IHC-stained xenografts using Yellow channel imageanalysis (Figure 2A). Despite considerable heterogeneityin activated STAT3 IHC staining as displayed from theimages [see additional file 2], an increase in staining isnoticeable after EGF stimulation within the viable tumorarea which is in agreement with Western blotting (Figure2B). A comparison of different color channel analysesshowed that measurements obtained from the Yellowchannel were consistently more sensitive to increases instaining intensity, particularly with the AEC substrate(Table 1).
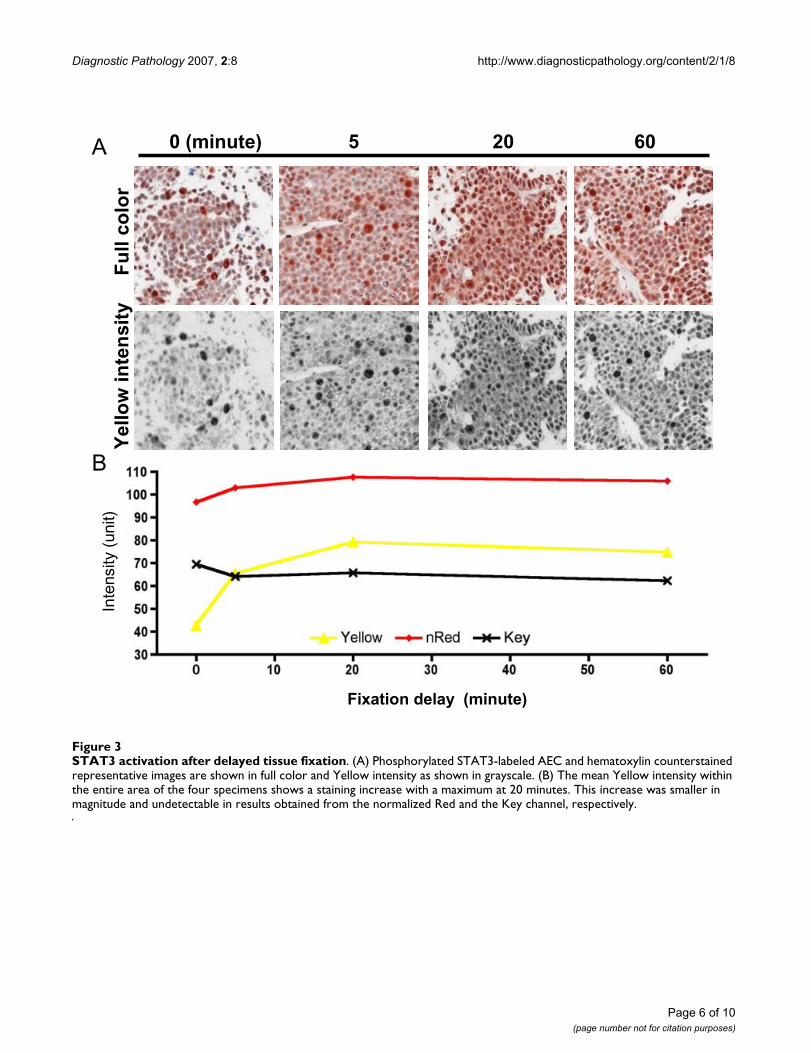
Furthermore, image analysis was applied to a series ofsmall fine-needle samples which displayed differences inSTAT3 activation (Figure 3A). Mean Yellow intensitymeasurements showed an increase in staining intensitieswith a maximum at 20 minutes (Figure 3B). This resultwas in agreement with a previously observed biologicaltrend [16]. Measurements of IHC staining showed greatermagnitudes of change using Yellow compared to the nor-malized Red channel analysis. Additionally, the Yellowchannel was relatively unaffected by the hematoxylinwhich resulted in a slightly higher Key channel intensity atthe initial compared to the last time point.
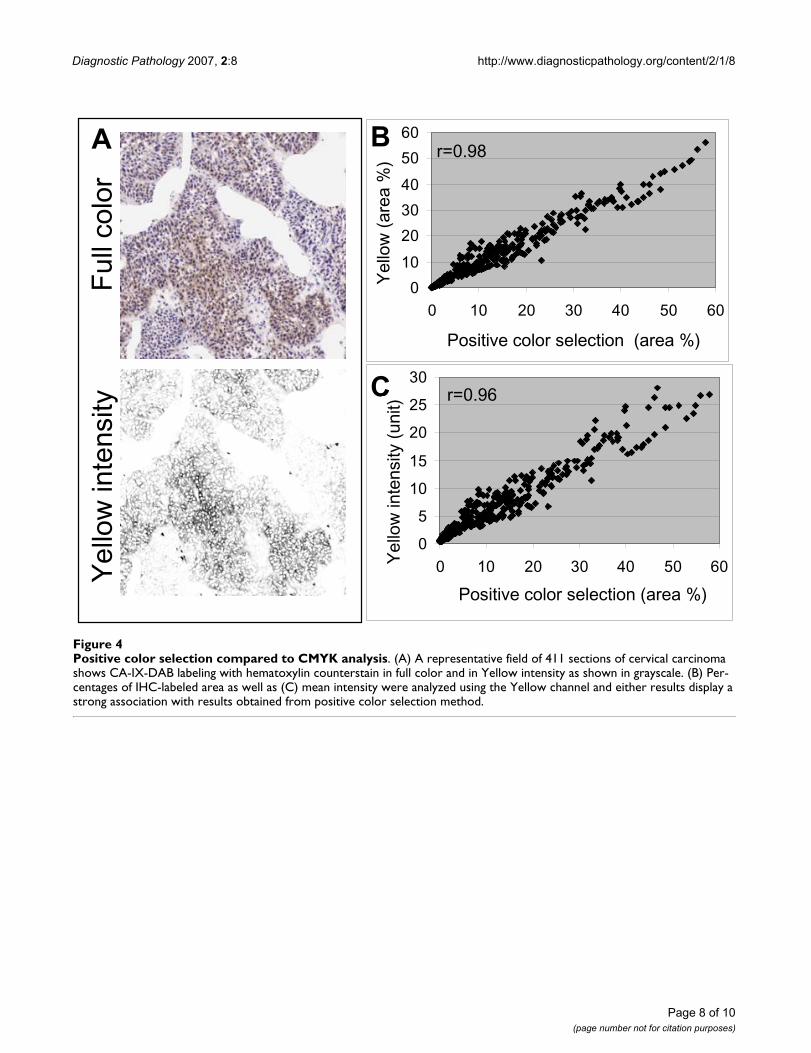
Positive color selection analysis compared to CMYKThe more arbitrary method using positive color selectionof CA-IX levels [18] was compared to results obtainedusing Yellow channel analysis (Figure 4A). Since CA-IXstaining was characterized by a heterogeneous patternrather than a ubiquitously distribution in all cells, thefraction of labeled cells was of primary interest. Positivelylabeled area fractions were strongly correlated betweenthe two methods (Figure 4B). Although the mean Yellowintensity measurements were also strongly correlated witharea fractions using positive color selection analysis (Fig-ure 4C), the slight decrease in the correlation of theseparameters at the higher end suggests higher variability inCA-IX levels in tumors with larger fractions of CA-IX
STAT3 activation in EGF-stimulated tumor tissueFigure 2STAT3 activation in EGF-stimulated tumor tissue. (A) Yellow channel image analysis was performed on consec-utive sections detecting p-STAT3 labeled with each of the three chromogens and counterstained with hematoxylin. (B) An increase in p-STAT3 was detected by Western blotting.
B
0
10
20
30
40
50
60
Control EGF
Mea
n In
ten
sity
(Yel
low
)
AEC
DAB
NovaRed
A
p-S
TA
T3
(inte
nsity
unit)
Yel
low
inte
nsi
ty (
un
it)
Table 1: Activation of STAT3
Channel EGF Stimulation (%)
AEC DAB NovaRed
Yellow 180 130 120nRed 106 103 102Key 110 120 110
Mean IHC-p-STAT3 intensity was quantified using different color channels. Effects of EGF stimulation were expressed relative to control.
Page 5 of 10(page number not for citation purposes)
Diagnostic Pathology 2007, 2:8 http://www.diagnosticpathology.org/content/2/1/8
Page 6 of 10(page number not for citation purposes)
STAT3 activation after delayed tissue fixationFigure 3STAT3 activation after delayed tissue fixation. (A) Phosphorylated STAT3-labeled AEC and hematoxylin counterstained representative images are shown in full color and Yellow intensity as shown in grayscale. (B) The mean Yellow intensity within the entire area of the four specimens shows a staining increase with a maximum at 20 minutes. This increase was smaller in magnitude and undetectable in results obtained from the normalized Red and the Key channel, respectively.
A 0 (minute) 5 20 60F
ull
colo
rY
ello
w in
ten
sity
B
Inte
nsity
(un
it)
Fixation delay (minute)

Diagnostic Pathology 2007, 2:8 http://www.diagnosticpathology.org/content/2/1/8
labeled areas. Strong associations were obtained betweenresults from positive color selection and the Yellow or thenormalized Red channel (Table 2). Measurements of per-cent of positive area showed strong associations among allmethods as was expected, since a fixed positive threshold/range intensity was used in each case. However, measure-ments from the positive color selection method have ahigher association with intensity measurements from theYellow rather than the normalized Red channel. Thisresult suggested that the Yellow intensity provides anobserver bias-free measurement with relatively high accu-racy.
Pathological visual scoring compared to CMYKThe mean IHC intensity of each biopsy based on a visualscoring performed by two pathologists (Figure 5A)showed a direct relationship (r = 0.89) with mean Yellowintensity measurements (Figure 5B). Interestingly, ahigher variability characterized the lower and the upperends of the scoring range (e.g. 0–1 and 2.5–3) comparedto the middle of the scoring categories. This result suggestssome cases at either end of the scale were misclassifiedand might be due to inconsistencies in the visual scores,or inclusion of non-specific staining with an automaticanalysis based on whole tissue core. However, the major-ity of the cases from the different scoring categories weregrouped within the non-overlapping top and bottom 25th
percentile of the Yellow intensity values.
DiscussionLevels of IHC stains are increasingly used to monitor bio-logical disease markers during cancer treatment and dis-ease progression. This image analysis study tested the useof the Yellow channel of a CMYK color model for IHCquantification. Although the programming language IDL6.3 was used to automate the analysis process here, theavailability of the CMYK model with maximum grey com-ponent replacement function in popular image processingsoftware packages makes this method readily accessible.
Spectral characterization of the chromogens AEC, DABand NovaRed in the absence of the hematoxylin counter-stain showed a relationship with at least one channel ofall color models, consistent with the RGB and HSL results
in previous reports [6,8,12]. However, in the presence ofthe hematoxylin counterstain the Yellow channel analysismethod applied here achieved the best contrast on a 0–255 scale, between chromogen and hematoxylin as well asfor different chromogen intensities. These characteristicsof the Yellow channel resulted in a higher sensitivitytowards detecting subtle IHC intensity changes relevant tomarkers associated with treatment response, prognosisand pathobiology of cancers in the examples presented inthis paper.
The least amount of observer-dependent input wasapplied to the image analysis process. Analyses were per-formed in regions of interest with the omission of obviousdark artifacts which may occur due to mixing with endog-enous pigments, debris, tissue drying and other method-dependent variables as recognized in such tissue process-ing techniques [2,20]. Although a comprise on the inten-sity scale occurs when the IHC stain is near black aspresented in the results, the saturated chromogen intensi-ties remained within the higher levels of the intensity scaleand therefore was likely negligible. Alternatively, inde-pendent of intensity levels, measurements were also eval-uated based on proportions of labeled area, but it isdependent on observer selection of positive intensityranges.
Antigen expression in tissue sections can be expressed aseither the mean staining intensity or the stained area frac-tion. The mean staining intensity measurementsdescribed in this paper show changes in relative antigenexpression when these were ubiquitously expressed, orequally distributed in compartment(s) of interest. Theseantigen characteristics suggest that other frequently IHC-labeled antigens such as proliferation and apoptosismarkers can also be quantified using image analysis meth-ods such as Yellow channel in addition to conventionalestimates of their presence or absence. These markers havebeen informative for the further sub-classification of can-cer stages identified using standard histology [21,22].However, in scenarios where differences in cellular distri-butions are important for disease profiling [23] recentdevelopments in pattern recognition programs are possi-ble solutions [5].
Table 2: A comparison of image analysis methods
Yellow channel nRed channel
Intensity (mean) % Positive area Intensity (mean) % Positive area
Positive color selection (% positive area) 0.96 0.98 0.84 0.98
Values (correlation coefficient, r) indicate strength of a linear relationship between results from positive color selection and Yellow or normalized Red analysis method, where a maximum positive is r = 1.
Page 7 of 10(page number not for citation purposes)
Diagnostic Pathology 2007, 2:8 http://www.diagnosticpathology.org/content/2/1/8
Page 8 of 10(page number not for citation purposes)
Positive color selection compared to CMYK analysisFigure 4Positive color selection compared to CMYK analysis. (A) A representative field of 411 sections of cervical carcinoma shows CA-IX-DAB labeling with hematoxylin counterstain in full color and in Yellow intensity as shown in grayscale. (B) Per-centages of IHC-labeled area as well as (C) mean intensity were analyzed using the Yellow channel and either results display a strong association with results obtained from positive color selection method.
0
10
20
30
40
50
60
0 10 20 30 40 50 60
%CAIX area (Observer)
%C
AIX
are
a (A
uto
)
0
5
10
15
20
25
30
0 10 20 30 40 50 60
%CAIX area (Observer)
CA
IX L
evel
s
Ful
l col
orY
ello
w in
tens
ity
C
Positive color selection (area %)
Positive color selection (area %)
Yel
low
inte
nsity
(un
it)
A
Yel
low
(ar
ea %
) r=0.98
r=0.96
B

Diagnostic Pathology 2007, 2:8 http://www.diagnosticpathology.org/content/2/1/8
The analysis of different IHC applications here demon-strated that the Yellow-CMYK channel method providesconsistent results as well as higher performance for IHCquantification compared to other automated and manualtechniques. The Yellow channel has several advantages,including its applicability to different chromogens, toler-ance of hematoxylin, greater utilization of the intensity
scale and readiness for automation. In particular, themean Yellow intensity measurements are independent ofarbitrary threshold selection. These advantages are impor-tant to IHC-based analysis in basic as well as clinicalresearch [24] where the biological changes as well asmethodological variances need to be quantified in anunbiased, reproducible and high throughput manner.
AbbreviationsAEC, 3-amino-9-ethylcarbazole; CMYK, cyan/magenta/yellow/black; DAB, 3,3'-diaminobenzidine; HSL, hue/sat-uration/lightness; IHC, immunohistochemistry; RGB,red/green/blue
Competing interestsThe author(s) declare that they have no competing inter-ests.
Authors' contributionsNAP conceived and performed the study. AM incorpo-rated the use of a maximum grey component replacementin the CMYK method and automated the analysis. JS par-ticipated in data acquisition and analysis of the xenograftexperiments. SAV and VI contributed the clinical imagedata sets and participated in the analysis. MST partici-pated in the coordination of the study. JH performed theimmunohistochemistry. DWH participated in the designand helped to draft the manuscript. All authors read andapproved the final manuscript.
Additional material
AcknowledgementsWe would like to thank James Jonkman and Trudey Nicklee for insightful image analysis discussions and Tim Richardson for the introduction to color spaces. Nhu-An Pham holds a Graduate Scholarships Doctoral Award from the Canada Institutes of Health Research. The work is supported by the grants from the Canadian Cancer Society, The Terry Fox Foundation and Canadian Institutes of Health Research (MOP-49585 to MST).
Additional File 1Supplementary Figure 1 Chromogen spectral characteristics without hematoxylin counterstain. Color bars representing single IHC chromogens are defined by the individual color channels from the models CMYK, RGB, nRGB and HSL.Click here for file[http://www.biomedcentral.com/content/supplementary/1746-1596-2-8-S1.pdf]
Additional File 2Supplementary Figure 2 Activated STAT3 in tumor xenograft. Represent-ative images of IHC staining for p-STAT3.Click here for file[http://www.biomedcentral.com/content/supplementary/1746-1596-2-8-S2.pdf]
Visual scoring compared to CMYK analysisFigure 5Visual scoring compared to CMYK analysis. (A) Repre-sentative images of 256 NSCLC biopsies show plasma mem-brane specific EGFR-NovaRed labeling with visual scores ranging from 0–3. (B) A box and whiskers graph (median, 25% to 75% box range, min and max whiskers) representa-tion of mean Yellow intensity of specimens shows a direct relationship with the categorical visual scores.
32
10
0 1
2 3
A
B
Yel
low
inte
nsity
(un
it)
Page 9 of 10(page number not for citation purposes)

Diagnostic Pathology 2007, 2:8 http://www.diagnosticpathology.org/content/2/1/8
Publish with BioMed Central and every scientist can read your work free of charge
"BioMed Central will be the most significant development for disseminating the results of biomedical research in our lifetime."
Sir Paul Nurse, Cancer Research UK
Your research papers will be:
available free of charge to the entire biomedical community
peer reviewed and published immediately upon acceptance
cited in PubMed and archived on PubMed Central
yours — you keep the copyright
Submit your manuscript here:http://www.biomedcentral.com/info/publishing_adv.asp
BioMedcentral
References1. Anderson JE, Hansen LL, Mooren FC, Post M, Hug H, Zuse A, Los M:
Methods and biomarkers for the diagnosis and prognosis ofcancer and other diseases: towards personalized medicine.Drug Resist Updat 2006, 9(4-5):198-210.
2. Walker RA: Quantification of immunohistochemistry-issuesconcerning methods, utility and semiquantitative assess-ment I. Histopathology 2006, 49(4):406-410.
3. Hatanaka Y, Hashizume K, Kamihara Y, Itoh H, Tsuda H, OsamuraRY, Tani Y: Quantitative immunohistochemical evaluation ofHER2/neu expression with HercepTestTM in breast carci-noma by image analysis. Pathol Int 2001, 51(1):33-36.
4. Langer S, Kraus J, Jentsch I, Speicher MR: Multicolor chromosomepainting in diagnostic and research applications. ChromosomeRes 2004, 12(1):15-23.
5. Kayser G, Radziszowski D, Bzdyl P, Sommer R, Kayser K: Theoryand implementation of an electronic, automated measure-ment system for images obtained from immunohistochemi-cally stained slides. Anal Quant Cytol Histol 2006, 28(1):27-38.
6. Brey EM, Lalani Z, Johnston C, Wong M, McIntire LV, Duke PJ, PatrickCW Jr.: Automated selection of DAB-labeled tissue forimmunohistochemical quantification. J Histochem Cytochem2003, 51(5):575-584.
7. Goedkoop AY, de Rie MA, Teunissen MB, Picavet DI, van der HallPO, Bos JD, Tak PP, Kraan MC: Digital image analysis for theevaluation of the inflammatory infiltrate in psoriasis. ArchDermatol Res 2005, 297(2):51-59.
8. Kim D, Gregory CW, Smith GJ, Mohler JL: Immunohistochemicalquantitation of androgen receptor expression using colorvideo image analysis. Cytometry 1999, 35(1):2-10.
9. Matkowskyj KA, Cox R, Jensen RT, Benya RV: Quantitative immu-nohistochemistry by measuring cumulative signal strengthaccurately measures receptor number. J Histochem Cytochem2003, 51(2):205-214.
10. Ruifrok AC, Katz RL, Johnston DA: Comparison of quantificationof histochemical staining by hue-saturation-intensity (HSI)transformation and color-deconvolution. Appl Immunohisto-chem Mol Morphol 2003, 11(1):85-91.
11. Taylor CR, Levenson RM: Quantification of immunohistochem-istry-issues concerning methods, utility and semiquantita-tive assessment II. Histopathology 2006, 49(4):411-424.
12. Leal S, Diniz C, Sa C, Goncalves J, Soares AS, Rocha-Pereira C, FrescoP: Semiautomated computer-assisted image analysis toquantify 3,3'-diaminobenzidine tetrahydrochloride-immu-nostained small tissues. Anal Biochem 2006, 357(1):137-143.
13. Lehr HA, van der Loos CM, Teeling P, Gown AM: Complete chro-mogen separation and analysis in double immunohistochem-ical stains using Photoshop-based image analysis. J HistochemCytochem 1999, 47(1):119-126.
14. Hedley D, Pintilie M, Woo J, Nicklee T, Morrison A, Birle D, Fyles A,Milosevic M, Hill R: Up-regulation of the redox mediatorsthioredoxin and apurinic/apyrimidinic excision (APE)/Ref-1in hypoxic microregions of invasive cervical carcinomas,mapped using multispectral, wide-field fluorescence imageanalysis. Am J Pathol 2004, 164(2):557-565.
15. Hedley D, Pintilie M, Woo J, Morrison A, Birle D, Fyles A, MilosevicM, Hill R: Carbonic anhydrase IX expression, hypoxia, andprognosis in patients with uterine cervical carcinomas. ClinCancer Res 2003, 9(15):5666-5674.
16. Schwock J, Ho JC, Luther E, Hedley D, Geddie WR: Detection andmeasurement of phosphorylated signaling proteins in solidtumor fine-needle biopsies by laser-scanning cytometry. Dia-gostic Molecular Pathology in press.
17. Pham NA, Jacobberger JW, Schimmer AD, Cao P, Gronda M, HedleyDW: The dietary isothiocyanate sulforaphane targets path-ways of apoptosis, cell cycle arrest, and oxidative stress inhuman pancreatic cancer cells and inhibits tumor growth insevere combined immunodeficient mice. Mol Cancer Ther 2004,3(10):1239-1248.
18. Iakovlev V, Morrison A, Pintile M, Hill R, Hedley D: Quantitativeassessment of heterogeneously expressed markers withinhistological sections. 57th Annual Meeting of the Canadian Associa-tion of Pathologists 2006, St. John, NL, Canada. 2006.
19. Aviel-Ronen S, Ling C, Lu M, Lau D, Ho JC, Liu N, Tsao MS: p16methylation and protein expression in non-small cell lung
cancer: September 16-21 2006; Montreal, Quebec Canada. Volume Modern Pathology 19: supplement 3. ; 2006.
20. Seidal T, Balaton AJ, Battifora H: Interpretation and quantifica-tion of immunostains. Am J Surg Pathol 2001, 25(9):1204-1207.
21. Kapur P, Rakheja D, Balani JP, Roy LC, Amirkhan RH, Hoang MP:Phosphorylated histone H3, Ki-67, p21, fatty acid synthase,and cleaved caspase-3 expression in benign and atypicalgranular cell tumors. Arch Pathol Lab Med 2007, 131(1):57-64.
22. Matos I, Dufloth R, Alvarenga M, Zeferino LC, Schmitt F: p63, cytok-eratin 5, and P-cadherin: three molecular markers to distin-guish basal phenotype in breast carcinomas. Virchows Arch2005, 447(4):688-694.
23. Kay EW, Walsh CJ, Cassidy M, Curran B, Leader M: C-erbB-2immunostaining: problems with interpretation. J Clin Pathol1994, 47(9):816-822.
24. Fitzgibbons PL, Murphy DA, Dorfman DM, Roche PC, Tubbs RR:Interlaboratory comparison of immunohistochemical test-ing for HER2: results of the 2004 and 2005 College of Amer-ican Pathologists HER2 Immunohistochemistry TissueMicroarray Survey. Arch Pathol Lab Med 2006,130(10):1440-1445.
Page 10 of 10(page number not for citation purposes)
Copyright © 2022 FDOKUMEN