Detection of Gait Abnormalities caused by Neurological ... - arXiv
Upload
independentCategory
view
6download
0
QWOA
Wyt
eo
c
k
rcw5sUaswk
adLatmm
R
aR
UNRt
2
ha
Kv
1007
uantitative Gait Analysis in Parkinson’s Disease: Comparisonith a Healthy Control Group
lumide Sofuwa, PT, MSc, Alice Nieuwboer, PT, PhD, Kaat Desloovere, PT, PhD,
nne-Marie Willems, PT, MSc, Fabienne Chavret, PT, MSc, Ilse Jonkers, PT, PhDGatArPnApq
iwdpsu
odisfagcanrcoppsTstTspFtg
P
wItpm1
ABSTRACT. Sofuwa O, Nieuwboer A, Desloovere K,illems AM, Chavret F, Jonkers I. Quantitative gait anal-
sis in Parkinson’s disease: comparison with a healthy con-rol group. Arch Phys Med Rehabil 2005;86:1007-13.
Objective: To compare gait parameters in Parkinson’s dis-ase (PD) during the on-phase of medication cycle with thosef healthy elderly control subjects.Design: A group-comparison study.Setting: Gait analysis laboratory of a university hospital.Participants: Fifteen patients with PD and 9 healthy elderly
ontrols.Interventions: Not applicable.Main Outcome Measures: Spatiotemporal, kinematic, and
inetic gait parameters.Results: The PD spatiotemporal results showed a significant
eduction in step length and walking velocity compared withontrols. In the kinematics, the major feature of the PD groupas a markedly reduced ankle plantarflexion excursion (at0%–60% of the gait cycle). Most important, the kineticshowed reduced ankle push-off power and hip pull-off power.nlike the control subjects, the patients with PD did not show
ny correlation between ankle generation (push-off) power andtride length (r�.19) or with gait speed (r�.29). Correction foralking velocity did not result in significant changes in theinetics between the groups.Conclusions: Reduced ankle (push-off) power generation
nd reduced hip flexion (pull-off) power persisted in PD gaitespite being tested in the on-phase of the medication cycle.ack of a correlation between ankle and hip power generationnd walking velocity suggests that peripheral and central fac-ors contribute to lack of forward progression. Patients with PDay benefit from intervention strategies that correct the kine-atic and the kinetic gait components.Key Words: Gait; Kinematics; Kinetics; Parkinson disease;
ehabilitation.© 2005 by American Congress of Rehabilitation Medicine
nd the American Academy of Physical Medicine andehabilitation
From the Department of Rehabilitation Research, University of Southampton,nited Kingdom (Sofuwa); the Departments of Rehabilitation Sciences (Sofuwa,ieuwboer, Willems, Chavret) and Ergonomics (Jonkers), Faculty of Kinesiology andehabilitation Sciences, Katholieke Universiteit, Leuven; and Gait Analysis Labora-
ory, University Hospital, Pellenberg (Desloovere), Belgium.Supported by the European Commission Framework V funding (grant no. QLRT-
001-00120).No party having a direct interest in the results of the research supporting this article
as or will confer a benefit on the author(s) or on any organization with which theuthor(s) is/are associated.
Reprint requests to Alice Nieuwboer, Dept of Rehabilitation Sciences, Faculty ofinesiology and Rehabilitation Sciences, Katholieke Universiteit, Leuven, Tervuurse-est 101, B-3000, Leuven, Belgium, e-mail: [email protected].
d0003-9993/05/8605-9300$30.00/0doi:10.1016/j.apmr.2004.08.012
AIT DISORDERS ARE COMMONLY observed in peo-ple with Parkinson’s disease1,2 (PD) and probably occur
s a result of progressive loss of dopamine-producing cells ofhe substantia nigra compacta of the central nervous system.bsence of dopamine in the basal ganglia circuit ultimately
esults in the loss of gait automaticity. Clinically, people withD usually have the hallmark features of slowness (bradyki-esia),2 cessation of movement (akinesia), or freezing of gait.3
s the disease advances, these gait disorders become moreronounced, disabling the patients and severely limiting theiruality of life.4
The reduction of stride length is considered the most prom-nent feature of PD gait and is often accompanied by loweralking speed and the tendency toward a longer duration in theouble-support phase.2,5,6 Other studies7-10 have indicated thatatients with PD are able to improve gait components, such astride length and speed, if appropriate influences, like cues, aresed.Whereas most studies document the spatiotemporal changes
f gait at baseline (no intervention level), few have focused onescribing the kinematic and the kinetic parameters, especiallyn the on-phase of the medication cycle. Data, which include atatistical analysis of the kinetic changes during gait, are there-ore lacking. However, 2 studies have described the kinematicnd kinetic features of PD gait. Morris et al9 reported on theait parameters in 1 patient with PD during various testingonditions. The patient was able to correct the spatiotemporalnd kinematic parameters through the introduction of an exter-al cue but abnormality persisted in the kinetics, such as aeduced ankle power generation at push-off. Lewis et al10
ompared 14 PD patients with 14 age-matched controls andbserved a reduced plantarflexion at toe-off and reduced ankleower generation at baseline. They also noted largely variableatterns of gait in the kinematics and kinetics. However, thetatistical analysis of this part of their data was not presented.herefore, the aim of our study was to compare statistically thepatiotemporal, kinematic, and kinetic parameters of PD gait inhe on-phase of the medication cycle with the control values.he study also investigated whether gait speed contributed toome of the observed differences, because patients are ex-ected to walk with reduced gait speed compared with controls.urthermore, the relation between observed changes in spatio-
emporal parameters and the reported kinetic changes in PDait were analyzed.
METHODS
articipantsThis study was part of a larger study in which 20 patients
ith PD and 10 healthy elderly control subjects were recruited.nformed consent was obtained according to the stipulations ofhe Declaration of Helsinki. For the purposes of this study, 15atients with PD (11 men, 4 women) and 9 control subjects (3en, 6 women) with comparable age, weight, and height (table
) and with complete spatiotemporal, kinematic, and kinetic
ata sets were selected. The control subjects were selectedArch Phys Med Rehabil Vol 86, May 2005
fswaPamsMa66tpcYHidaogUrppiSs
smIp
I
6fflossdmPesecwwm
ttu
NA*
N
NA*
1008 GAIT ANALYSIS IN PARKINSON’S DISEASE, Sofuwa
A
rom a population of healthy elderly people and were withoutensory or other medical disorders affecting gait. The patientsere diagnosed as having idiopathic PD and were referred byconsultant neurologist of the University Hospitals of Leuven.atients were excluded if they had other neurologic problems;cute medical problems that could affect gait, such as visual orusculoskeletal defects; unpredictable off-periods (making
table testing difficult); and a score below 23 on the Mini-ental State Examination (MMSE).11 The mean age, height,
nd weight were 63.14�8.4 years, 162.7�5.8m, and8.0�13.5kg, respectively, for the patients with PD and4.41�4.56 years, 163.9�8.3m, and 73.89�10.46kg, respec-ively, for the control subjects. The mean illness duration foratients with PD was 11.25�3.8 years. They were mostlylassified as stage II (n�7) and III (n�5) on the Hoehn andahr disease rating scale,12 with an average of 2.6�0.6. Theoehn and Yahr scale is a global measure of disease severity,
dentifying 5 disease stages (0–5), ranging from unilateralisease only to bedridden or wheelchair-bound mobility. Inddition, rating of the disease severity using the motor sectionf the Unified Parkinson’s Disease Rating Scale (UPDRS)13
ave a group mean score of 16.1�6.4. The motor section of thePDRS contains 14 items (speech, facial expression, tremor at
est, action tremor, rigidity, finger taps, hand movement, handronation and supination, leg agility, rising from the chair,osture, gait, postural stability, body bradykinesia). Each items scored from 0 (normal) to 4 (unable to perform task).tatistically (Wilcoxon), there was no difference in MMSEcores of the PD and the control groups (P�.735).
Our study reports on the comparison of the more-affectedide in PD patients with the left side in control subjects. Theore-affected side was determined by questioning the patient.
n 4 patients, the left side was the more-affected side but in 11atients it was the right side.
nstrumentation and ProcedureGait analysis was conducted using an 8 M-camera Vicon
12 data capturing systema set at 120Hz and 3 AMTIorceplatesb mounted midway on an 8-m walkway. Retrore-ective markers were placed on the specific anatomic pointsf the subjects’ lower limbs, enabling 3-dimensional analy-is during the gait cycle. These points were the anterioruperior iliac spines, sacrum, midthighs, lateral malleoli,orsolateral aspect of the foot between the second and thirdetatarsal heads, and on the calcaneus. Workstation andolygon softwarea were used to manually define gait cyclevents and to process kinematic and kinetic data. Anothertudy14 tested the procedure of manually defining gait cyclevents and reported good interrater reliability with intraclassorrelation coefficients, ranging from .88 to 1.0 in patientsith PD. Joint internal moments (in Nm) and powers (inatts) were normalized with respect to the subject’s body
Table 1: Group Characteristics
Characteristics PD Group Controls P (t test)
Sex (F/M) 4/11 6/3 .054*Age (y) 63.14�8.4 64.41�4.56 .787Weight (kg) 68.0�13.5 73.89�10.46 .131Height (cm) 162.7�5.8 163.9�8.3 .540
OTE. Values are n or mean � standard deviation (SD).bbreviations: F, female; M, male.�2 test.
ass (in kilograms). The gait tests were performed duringA*
rch Phys Med Rehabil Vol 86, May 2005
he on-phase of the medication cycle (1–2h after intake ofheir midday dose). Subjects were instructed to walk at theirsual self-selected comfortable speed. Patients completed 3
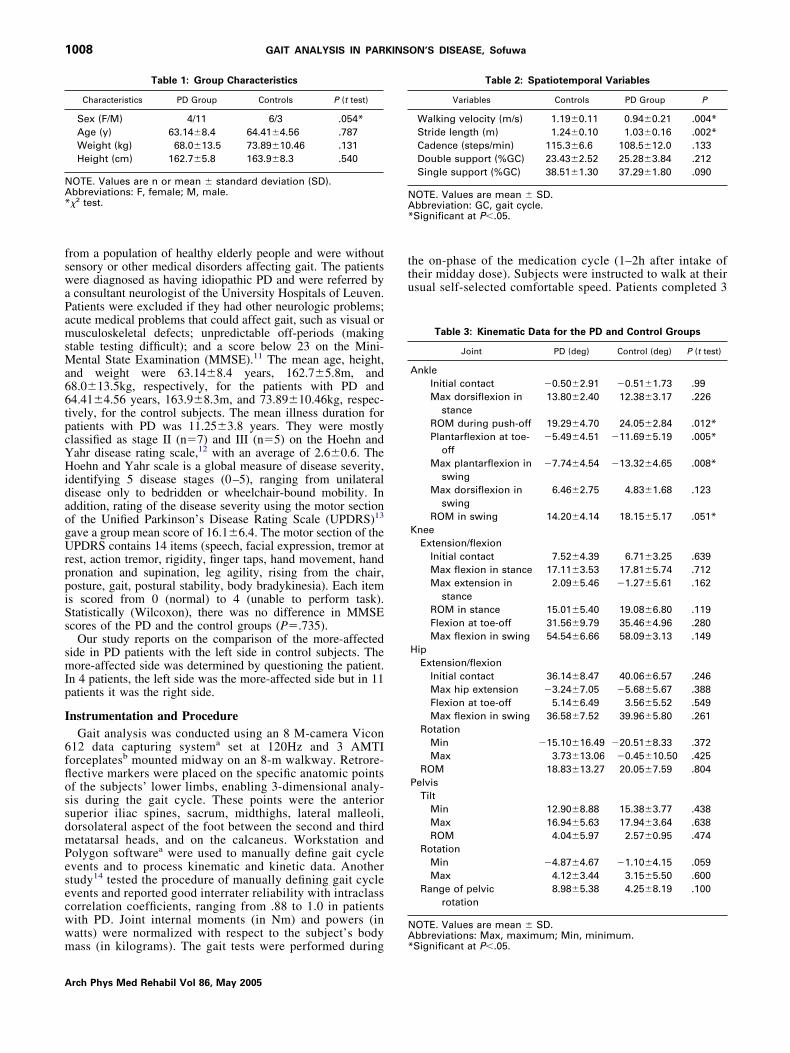
Table 2: Spatiotemporal Variables
Variables Controls PD Group P
Walking velocity (m/s) 1.19�0.11 0.94�0.21 .004*Stride length (m) 1.24�0.10 1.03�0.16 .002*Cadence (steps/min) 115.3�6.6 108.5�12.0 .133Double support (%GC) 23.43�2.52 25.28�3.84 .212Single support (%GC) 38.51�1.30 37.29�1.80 .090
OTE. Values are mean � SD.bbreviation: GC, gait cycle.Significant at P�.05.
Table 3: Kinematic Data for the PD and Control Groups
Joint PD (deg) Control (deg) P (t test)
AnkleInitial contact �0.50�2.91 �0.51�1.73 .99Max dorsiflexion in
stance13.80�2.40 12.38�3.17 .226
ROM during push-off 19.29�4.70 24.05�2.84 .012*Plantarflexion at toe-
off�5.49�4.51 �11.69�5.19 .005*
Max plantarflexion inswing
�7.74�4.54 �13.32�4.65 .008*
Max dorsiflexion inswing
6.46�2.75 4.83�1.68 .123
ROM in swing 14.20�4.14 18.15�5.17 .051*Knee
Extension/flexionInitial contact 7.52�4.39 6.71�3.25 .639Max flexion in stance 17.11�3.53 17.81�5.74 .712Max extension in
stance2.09�5.46 �1.27�5.61 .162
ROM in stance 15.01�5.40 19.08�6.80 .119Flexion at toe-off 31.56�9.79 35.46�4.96 .280Max flexion in swing 54.54�6.66 58.09�3.13 .149
HipExtension/flexion
Initial contact 36.14�8.47 40.06�6.57 .246Max hip extension �3.24�7.05 �5.68�5.67 .388Flexion at toe-off 5.14�6.49 3.56�5.52 .549Max flexion in swing 36.58�7.52 39.96�5.80 .261
RotationMin �15.10�16.49 �20.51�8.33 .372Max 3.73�13.06 �0.45�10.50 .425
ROM 18.83�13.27 20.05�7.59 .804Pelvis
TiltMin 12.90�8.88 15.38�3.77 .438Max 16.94�5.63 17.94�3.64 .638ROM 4.04�5.97 2.57�0.95 .474
RotationMin �4.87�4.67 �1.10�4.15 .059Max 4.12�3.44 3.15�5.50 .600
Range of pelvicrotation
8.98�5.38 4.25�8.19 .100
OTE. Values are mean � SD.
bbreviations: Max, maximum; Min, minimum.Significant at P�.05.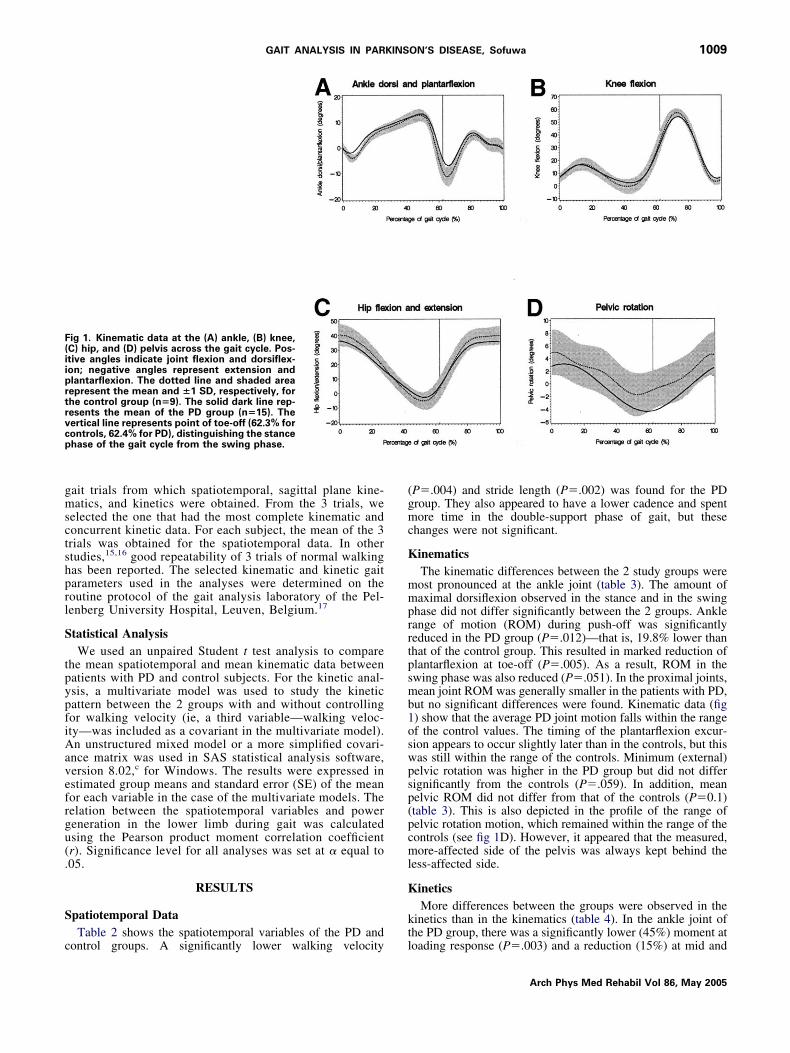
gmsctshprl
S
tpypfiAavefrgu(.
S
c
(gmc
K
mmprrtpsmb1oswpsp(pcml
K
kt
F(iiprtrvcp
1009GAIT ANALYSIS IN PARKINSON’S DISEASE, Sofuwa
ait trials from which spatiotemporal, sagittal plane kine-atics, and kinetics were obtained. From the 3 trials, we
elected the one that had the most complete kinematic andoncurrent kinetic data. For each subject, the mean of the 3rials was obtained for the spatiotemporal data. In othertudies,15,16 good repeatability of 3 trials of normal walkingas been reported. The selected kinematic and kinetic gaitarameters used in the analyses were determined on theoutine protocol of the gait analysis laboratory of the Pel-enberg University Hospital, Leuven, Belgium.17
tatistical AnalysisWe used an unpaired Student t test analysis to compare
he mean spatiotemporal and mean kinematic data betweenatients with PD and control subjects. For the kinetic anal-sis, a multivariate model was used to study the kineticattern between the 2 groups with and without controllingor walking velocity (ie, a third variable—walking veloc-ty—was included as a covariant in the multivariate model).n unstructured mixed model or a more simplified covari-
nce matrix was used in SAS statistical analysis software,ersion 8.02,c for Windows. The results were expressed instimated group means and standard error (SE) of the meanor each variable in the case of the multivariate models. Theelation between the spatiotemporal variables and powereneration in the lower limb during gait was calculatedsing the Pearson product moment correlation coefficientr). Significance level for all analyses was set at � equal to05.
RESULTS
patiotemporal DataTable 2 shows the spatiotemporal variables of the PD and
ig 1. Kinematic data at the (A) ankle, (B) knee,C) hip, and (D) pelvis across the gait cycle. Pos-tive angles indicate joint flexion and dorsiflex-on; negative angles represent extension andlantarflexion. The dotted line and shaded areaepresent the mean and �1 SD, respectively, forhe control group (n�9). The solid dark line rep-esents the mean of the PD group (n�15). Theertical line represents point of toe-off (62.3% forontrols, 62.4% for PD), distinguishing the stancehase of the gait cycle from the swing phase.
ontrol groups. A significantly lower walking velocity l
P�.004) and stride length (P�.002) was found for the PDroup. They also appeared to have a lower cadence and spentore time in the double-support phase of gait, but these
hanges were not significant.
inematicsThe kinematic differences between the 2 study groups wereost pronounced at the ankle joint (table 3). The amount ofaximal dorsiflexion observed in the stance and in the swing
hase did not differ significantly between the 2 groups. Ankleange of motion (ROM) during push-off was significantlyeduced in the PD group (P�.012)—that is, 19.8% lower thanhat of the control group. This resulted in marked reduction oflantarflexion at toe-off (P�.005). As a result, ROM in thewing phase was also reduced (P�.051). In the proximal joints,ean joint ROM was generally smaller in the patients with PD,
ut no significant differences were found. Kinematic data (fig) show that the average PD joint motion falls within the rangef the control values. The timing of the plantarflexion excur-ion appears to occur slightly later than in the controls, but thisas still within the range of the controls. Minimum (external)elvic rotation was higher in the PD group but did not differignificantly from the controls (P�.059). In addition, meanelvic ROM did not differ from that of the controls (P�0.1)table 3). This is also depicted in the profile of the range ofelvic rotation motion, which remained within the range of theontrols (see fig 1D). However, it appeared that the measured,ore-affected side of the pelvis was always kept behind the
ess-affected side.
ineticsMore differences between the groups were observed in the
inetics than in the kinematics (table 4). In the ankle joint ofhe PD group, there was a significantly lower (45%) moment at
oading response (P�.003) and a reduction (15%) at mid andArch Phys Med Rehabil Vol 86, May 2005

tgdpag
mfiem6
ec((imn
nac
ttsi
via(
f
nctncdp
S
sglacftc
K
sotsdrfl
K
nrdmdftlshflflcg
NA*
1010 GAIT ANALYSIS IN PARKINSON’S DISEASE, Sofuwa
A
erminal stance phases (P�.021) compared with the controlroup. However, at loading response, ankle power absorptionid not differ significantly from that of the controls. In thereswing phase (50%–60% of the gait cycle), the PD grouplso showed a significant reduction (28.2%) in ankle powereneration (P�.001).
At the knee joint, the maximum flexion and extension mo-ent generation in the stance phase did not significantly differ
rom that of controls. Both groups also showed no differencesn maximum knee power generated in the stance phase. How-ver, the PD group showed a reduction (43.7%) of the maxi-um power absorbed (P�.009) in the late stance phase (50%–
0% of the gait cycle).At the hip joint, maximum hip flexion moment (but not
xtension moment) was reduced (25.9%) in the PD groupompared with the control group (P�.03). Also, a reduction39%) of maximum hip power generated in the stance phaseP�.001) and a reduction (32%) of maximum power absorbedn the stance phase (P�.03) were observed. Figure 2 shows theean kinetic profiles of the PD group in contrast with the
Table 4: Kinetic Data for the PD and Control Groups
Joint PD ControlP
(ANOVA)
AnkleJoint moment (Nm/kg)
Moment at loadingresponse �0.08�0.01 �0.14�0.01 .003*
Max moment in mid andterminal stance 1.32�0.05 1.50�0.05 .021*
Minimum moment inpreswing 0.05�0.01 0.06�0.02 .922
Power (W/kg)Absorption at loading
response �0.13�0.03 �0.12�0.04 .933Generation at preswing 2.33�0.15 3.22�0.16 .001*
KneeJoint moment (Nm/kg)
Max flexion moment instance �0.32�0.05 �0.40�0.05 .301
Max extension momentin stance 0.32�0.04 0.32�0.04 .952
Power (W/kg)Max power generated in
stance 0.60�0.10 0.54�0.07 .627Max power absorbed in
late stance �0.48�0.10 �0.90�0.12 .009*Hip
Hip joint moment (Nm/kg)Max extension moment
in stance 0.71�0.12 0.83�0.12 .432Max flexion moment in
stance �0.70�0.06 �0.94�0.07 .030*Max abduction momentin stance 0.76�0.04 0.90�0.07 .097
Power (W/kg)Max power generated in
stance 0.66�0.05 1.07�0.08 .001*Max power absorbed in
stance �0.55�0.07 �0.82�0.08 .033*
OTE. Values are estimated mean � SE.bbreviation: ANOVA, analysis of variance.Significant at P�.05.
ormative range, as represented by the controls. The most a
rch Phys Med Rehabil Vol 86, May 2005
otable difference was the decreased peak ankle power gener-ted (at 57% of gait cycle) of the PD group, which was lowerompared with the control group (see fig 2D).
Statistically controlling for the effect of walking velocity onhe kinetics made no differences between the groups, except forhe significantly reduced maximum hip flexion moment in thetance phase (P�.03), which was no longer statistically signif-cant (P�.09) after correction for velocity.
No correlation was found between stride length or walkingelocity and power generation at the ankle, knee, and hip jointsn the PD group (table 5). In contrast, in the control group,nkle power generated at preswing correlated with stride lengthr�.69, P�.03) and walking velocity (r�.86, P�.002).
It should be noted that, throughout the period of testing, noreezing of gait was observed in any of the subjects with PD.
DISCUSSIONThis study describes the spatiotemporal, kinematic, and ki-
etic variables of gait in subjects with PD compared withontrol subjects, as measured in the on-phase of their medica-ion cycle. Despite being tested during the on-phase, gait ab-ormalities were still observed. Although few kinematichanges were found, possibly because of large variability in theata, pronounced differences between PD and controls wereresent in the kinetic profiles.
patiotemporalThe key spatiotemporal findings in the PD group were con-
istent with most previous studies on spatiotemporal data in PDait.2,10,18-20 These studies also documented a tendency ofonger duration in the double-support phase of the gait cyclend a normal cadence. In other studies,21,22 a reduction ofadence values was reported. The fact that no significant dif-erence was found in the double-support duration may indicatehat patients were only moderately affected by PD. The clinicalharacteristics of the patient group confirm this supposition.
inematicsPD gait was characterized by reduced joint angular excur-
ions. This was mainly true at the ankle joint but not at the kneer the hip joints. This finding is in agreement with other studieshat have reported reduced ankle joint angular excursions ofubjects with PD.9,10 Most important, plantarflexion (but notorsiflexion) was decreased in the PD group and consisted of aeduction in ROM during push-off and a reduction in plantar-exion at toe-off.
ineticsAbnormality in the pattern of the kinetics was more pro-
ounced than in the kinematics. This discrepancy may beelated to the fact that similar kinematic patterns can be pro-uced by different underlying kinetics. At the ankle joint, theoment at loading response (dorsiflexion moment) was re-
uced in the PD group. This could occur if the ground reactionorce vector remained close to the ankle joint. Hypothetically,his is possible if, at initial contact, the subjects with PD hadimited hip flexion, inadequate knee extension, or absent heeltrike. Although joint angular values at initial contact wereighly variable, the PD group had a higher mean value of kneeexion (with consequent inadequate extension) and lesser hipexion. As a result, a smaller heel rocker would ensue with aonsequent flat-footed gait pattern. The feature of a flat-footedait pattern in PD was also observed by Nieuwboer et al,23 in
study of plantar force distribution in PD gait. Nieuwboer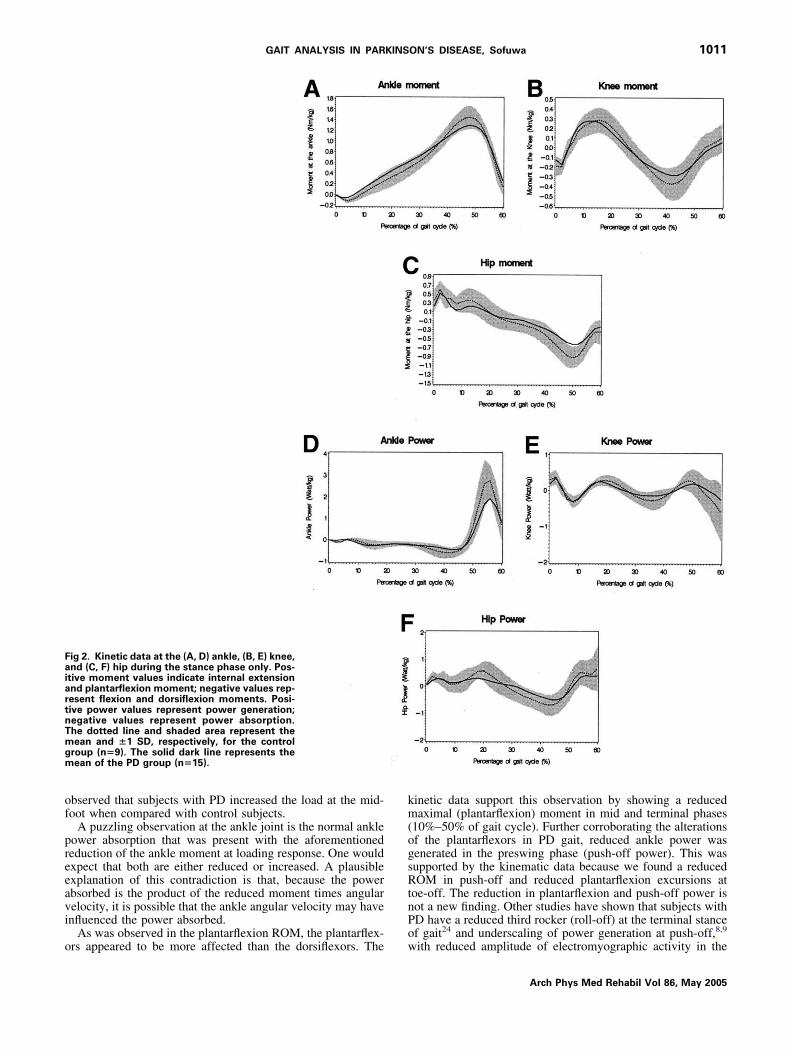
of
preeavi
o
km(ogsRtnPo
FaiartnTmgm
1011GAIT ANALYSIS IN PARKINSON’S DISEASE, Sofuwa
bserved that subjects with PD increased the load at the mid-oot when compared with control subjects.
A puzzling observation at the ankle joint is the normal ankleower absorption that was present with the aforementionededuction of the ankle moment at loading response. One wouldxpect that both are either reduced or increased. A plausiblexplanation of this contradiction is that, because the powerbsorbed is the product of the reduced moment times angularelocity, it is possible that the ankle angular velocity may havenfluenced the power absorbed.
As was observed in the plantarflexion ROM, the plantarflex-
ig 2. Kinetic data at the (A, D) ankle, (B, E) knee,nd (C, F) hip during the stance phase only. Pos-tive moment values indicate internal extensionnd plantarflexion moment; negative values rep-esent flexion and dorsiflexion moments. Posi-ive power values represent power generation;egative values represent power absorption.he dotted line and shaded area represent theean and �1 SD, respectively, for the control
roup (n�9). The solid dark line represents theean of the PD group (n�15).
rs appeared to be more affected than the dorsiflexors. The w
inetic data support this observation by showing a reducedaximal (plantarflexion) moment in mid and terminal phases
10%–50% of gait cycle). Further corroborating the alterationsf the plantarflexors in PD gait, reduced ankle power wasenerated in the preswing phase (push-off power). This wasupported by the kinematic data because we found a reducedOM in push-off and reduced plantarflexion excursions at
oe-off. The reduction in plantarflexion and push-off power isot a new finding. Other studies have shown that subjects withD have a reduced third rocker (roll-off) at the terminal stancef gait24 and underscaling of power generation at push-off,8,9
ith reduced amplitude of electromyographic activity in the
Arch Phys Med Rehabil Vol 86, May 2005
gihsilpihsr(srbtmaprrim
lanrottpas
ti(pahc5g
arphsbssbttmmcf
cp(a
nbimcwtc
aLTvisagdoasngssimc
I
pkkfl
pSccwpsg
*
1012 GAIT ANALYSIS IN PARKINSON’S DISEASE, Sofuwa
A
astrocnemius muscle.25 Furthermore, ankle power generations believed to be the strongest predictor of step length inealthy elderly subjects, as was observed from a linear regres-ion model used by Judge et al.26 Judge suggested that increas-ng ankle plantarflexor power would likely increase the stepength. Another study27 found that ankle strength (and muscleower) correlated positively with gait velocity and stride lengthn older persons. Although the control group in our study alsoad a positive correlation between ankle power generated andtride length and velocity, the PD group did not show such aelation. Factors other than ankle power generation alonepush-off power) may therefore be responsible for the reducedtep length. In the study of Lewis et al,10 the question wasaised whether patients with PD specify a normal stride lengthut fail to generate the required stride amplitude, or whetherhey specify a shortened stride length and regulate their move-ent around a smaller scale. It appears from the correlation
nalysis that no linear relation exists between stride length anderipherally reduced ankle power generation. Hence, in PD,educed stride length may be determined by complex disease-elated factors interacting with each other in a nonlinear fash-on, such as deficient central specification, rigidity, and reduceduscle power.At the knee joint, we found a lower power absorption in the
ate stance phase of the gait cycle (45%–60% of gait cycle). Instudy of gait in healthy elderly subjects, Winter27 related theormal power absorbed at this phase to the outcome of theeduction of the energy that was transferred from ankle push-ff power. Also, Judge26 interpreted this power absorption ashe natural consequence of the transfer of energy generated byhe ankle plantarflexors to the knee. This could mean, in theresent study, that a reduced power generation (push-off) at thenkle would cause a reduced knee power absorption in the latetance phase.
The significantly reduced maximum hip flexion moment inhe stance phase found in the PD group can occur because ofnadequate hip extension, as shown in the kinematic datadecreased maximum hip extension and increased hip flexionosition at toe-off). This will limit the progression of the trunknd therefore reduce the internal flexion moment as well as theip power generation in the stance phase (50%–60% of gaitycle). Indeed, hip power generation in the stance phase (at0%–60% of gait cycle) was significantly reduced in the PD
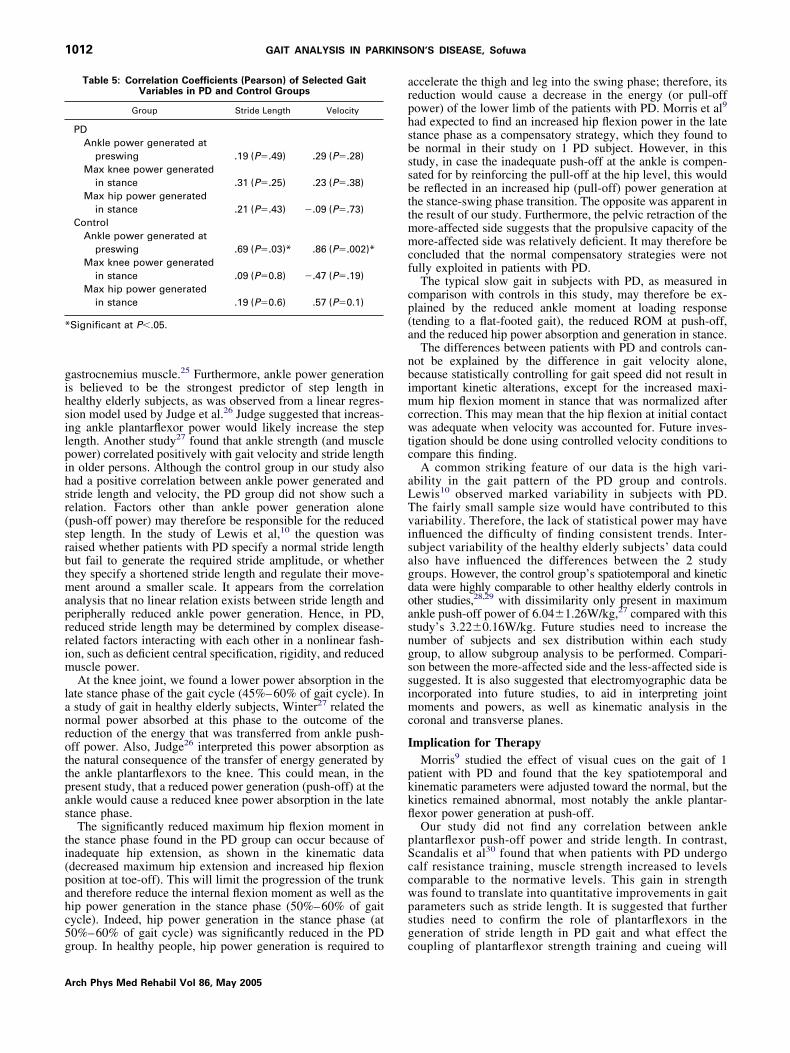
Table 5: Correlation Coefficients (Pearson) of Selected GaitVariables in PD and Control Groups
Group Stride Length Velocity
PDAnkle power generated at
preswing .19 (P�.49) .29 (P�.28)Max knee power generated
in stance .31 (P�.25) .23 (P�.38)Max hip power generated
in stance .21 (P�.43) �.09 (P�.73)Control
Ankle power generated atpreswing .69 (P�.03)* .86 (P�.002)*
Max knee power generatedin stance .09 (P�0.8) �.47 (P�.19)
Max hip power generatedin stance .19 (P�0.6) .57 (P�0.1)
Significant at P�.05.
roup. In healthy people, hip power generation is required to c
rch Phys Med Rehabil Vol 86, May 2005
ccelerate the thigh and leg into the swing phase; therefore, itseduction would cause a decrease in the energy (or pull-offower) of the lower limb of the patients with PD. Morris et al9
ad expected to find an increased hip flexion power in the latetance phase as a compensatory strategy, which they found toe normal in their study on 1 PD subject. However, in thistudy, in case the inadequate push-off at the ankle is compen-ated for by reinforcing the pull-off at the hip level, this woulde reflected in an increased hip (pull-off) power generation athe stance-swing phase transition. The opposite was apparent inhe result of our study. Furthermore, the pelvic retraction of theore-affected side suggests that the propulsive capacity of theore-affected side was relatively deficient. It may therefore be
oncluded that the normal compensatory strategies were notully exploited in patients with PD.
The typical slow gait in subjects with PD, as measured inomparison with controls in this study, may therefore be ex-lained by the reduced ankle moment at loading responsetending to a flat-footed gait), the reduced ROM at push-off,nd the reduced hip power absorption and generation in stance.
The differences between patients with PD and controls can-ot be explained by the difference in gait velocity alone,ecause statistically controlling for gait speed did not result inmportant kinetic alterations, except for the increased maxi-um hip flexion moment in stance that was normalized after
orrection. This may mean that the hip flexion at initial contactas adequate when velocity was accounted for. Future inves-
igation should be done using controlled velocity conditions toompare this finding.
A common striking feature of our data is the high vari-bility in the gait pattern of the PD group and controls.ewis10 observed marked variability in subjects with PD.he fairly small sample size would have contributed to thisariability. Therefore, the lack of statistical power may havenfluenced the difficulty of finding consistent trends. Inter-ubject variability of the healthy elderly subjects’ data couldlso have influenced the differences between the 2 studyroups. However, the control group’s spatiotemporal and kineticata were highly comparable to other healthy elderly controls inther studies,28,29 with dissimilarity only present in maximumnkle push-off power of 6.04�1.26W/kg,27 compared with thistudy’s 3.22�0.16W/kg. Future studies need to increase theumber of subjects and sex distribution within each studyroup, to allow subgroup analysis to be performed. Compari-on between the more-affected side and the less-affected side isuggested. It is also suggested that electromyographic data bencorporated into future studies, to aid in interpreting jointoments and powers, as well as kinematic analysis in the
oronal and transverse planes.
mplication for TherapyMorris9 studied the effect of visual cues on the gait of 1
atient with PD and found that the key spatiotemporal andinematic parameters were adjusted toward the normal, but theinetics remained abnormal, most notably the ankle plantar-exor power generation at push-off.Our study did not find any correlation between ankle
lantarflexor push-off power and stride length. In contrast,candalis et al30 found that when patients with PD undergoalf resistance training, muscle strength increased to levelsomparable to the normative levels. This gain in strengthas found to translate into quantitative improvements in gaitarameters such as stride length. It is suggested that furthertudies need to confirm the role of plantarflexors in theeneration of stride length in PD gait and what effect the
oupling of plantarflexor strength training and cueing will
hvnu
midtoapeiol
RWJ(c
1
1
1
1
1
1
1
1
11
2
2
2
2
2
2
2
2
2
2
3
a
b
1013GAIT ANALYSIS IN PARKINSON’S DISEASE, Sofuwa
ave on gait. In contrast to the aforementioned feed-forwardisual and auditory cueing mechanism, a feedback mecha-ism with a real-time visual or auditory display may besed, to elicit immediate gait adjustments.
CONCLUSIONSThe data of our study confirm that ankle plantarflexors areostly affected in PD gait. In addition, hip flexors appear to be
mplicated in the abnormal gait pattern in PD. Walking velocityid not largely affect the results, which suggests that it is nothe cause of the kinetic gait deviations found. Moreover, lackf correlation between stride length, gait velocity, and anklend hip power generation suggest that central factors, as well aseripheral factors, are involved in the diminished gait param-ters in PD. Patients may benefit from novel interventions thatnfluence these factors and correct the gait abnormalities notnly at spatiotemporal and kinematic levels but also at kineticevels.
Acknowledgments: This research came about as part of theESCUE project. We thank Gert Kwakkel, PhD, and Erwin Vanegen, MS, of the Vrije Universiteit of Amsterdam and Diana
ones, PhD, and Lynn Rochester, PhD, of Northumbria UniversityUK) for their contribution as collaborators within the RESCUEonsortium.
References1. Nieuwboer A, De Weerdt W, Dom R, Lesaffre E. A frequency and
correlation analysis of motor deficits in Parkinson patients. DisRehabil 1998;20:142-50.
2. Morris ME, Iansek R, Matyas TA, Summers JJ. The pathogenesisof gait hypokinesia in Parkinson’s disease. Brain 1994;117:1161-81.
3. Fahn S. The freezing phenomenon in Parkinsonism. Adv Neurol1995;67:53-63.
4. Morris ME. Movement disorders in people with Parkinson’s dis-ease: a model for physical therapy. Phys Ther 2000:80578-97.
5. Blin O, Ferrandez AM, Pailhous J, Serratrice G. Dopa-sensitiveand dopa-resistant gait parameters in Parkinson’s disease. J Neu-rol Sci 1991;103:1-54.
6. Morris ME, Iansek R, Matyas TA, Summers JJ. Stride lengthregulation in Parkinson’s disease. Normalization strategies andunderlying mechanism. Brain 1996;119(Pt 2):551-68.
7. McIntosh GC, Brown SH, Rice RR, Thaut MH. Rhythmic audi-tory-motor facilitation of gait patterns in patients with Parkinson’sdisease. J Neurol Neurosurg Psychiatry 1997;62:22-6.
8. Thaut MH, McIntosh GC, Rice RR, Miller RA, Rathburn J, BraultJM. Rhythmic auditory stimulation in gait training for Parkinson’sdisease patients. Mov Disord 1996;11:193-200.
9. Morris ME, McGinley J, Huxham F, Collier J, Iansek R. Con-straints on the kinetic, kinematic and spatiotemporal parameters ofgait in Parkinson’s disease. Hum Mov Sci 1999;18:461-83.
0. Lewis GN, Bylow WD, Walt SE. Stride length regulation inParkinson’s disease: the use of extrinsic visual cues. Brain 2000;123:2077-90.
1. Dick JPR, Ginloff RJ, Stewart A, Blackstock J, Bielawska C, PaulEA. Mini-mental state examination in neurological patients.J Neurol Neurosurg Psychiatry 1984;47:496-9.
2. Hoehn MM, Yahr MD. Parkinsonism: onset, progression, andmortality. Neurology 1967;5:427-42.
3. Fahn S, Elton RL, Members of the UPDRS Development Com-mittee. Unified Parkinson’s Disease Rating Scale. In: Fahn S,
Mardsen CD, Calne DB, Goldstein M, editors. Recent develop- cment in Parkinson’s disease. Vol 2. Florham Park: MacmillanHealth Care Information; 1987. p 153-63.
4. Nieuwboer A, Dom R, De Weerdt W, Desloovere K, Fieuws S,Broens-Kausik E. Abnormalities of the spatiotemporal character-istics of gait at the onset of freezing in Parkinson’s disease. MovDisord 2001;16:1066-75.
5. O’Sullivan JD, Said CM, Dillon LC, Hoffman M, Hughes AJ.Gait analysis in patients with Parkinson’s disease and motorfluctuation: influence of levodopa and comparison with othermeasures of motor fluctuation. Mov Disord 1998;13:900-6.
6. Schenkman M, Cutson TM, Kuchibhatla M, Chandler J, Pieper C.Reliability of impairment and physical performance measures forpersons with Parkinson’s disease. Phys Ther 1997;80:696-701.
7. Desloovere K, Molenaers G, Jonkers I, et al. A randomised studyof combined botulinum toxin type A and casting in the ambulantchild with cerebral palsy using objective outcome measures. EurJ Neurol 2001;8(Suppl 5):75-87.
8. Knuttson E. Analysis of parkinsonian gait. Brain 1972;95:475-86.9. Murray MP, Sepic SB, Gardner GM, Downs WJ. Walking pat-
terns of men with Parkinsonism. Am J Phys Med 1978;57:278-94.0. Stern GM, Franklyn SE, Imms FJ, Prestige SP. Quantitative
assessment of gait and mobility in Parkinson’s disease. J NeuralTransm Suppl 1983;19:201-14.
1. O’Shea S, Morris ME, Iansek R. Dual task interference during gaitin people with Parkinson disease: effects of motor versus cogni-tive secondary tasks. Phys Ther 2002;82:888-97.
2. Miller RA, Thaut MH, McIntosh GC, Rice RR. Components ofEMG symmetry and variability in Parkinsonian and healthy el-derly gait. Electroencephalogr Clin Neurophysiol 1996;101:1-7.
3. Nieuwboer A, De Weerdt W, Dom R, et al. Plantar force distri-bution in parkinsonian gait: a comparison between patients andage-matched control subjects. Scand J Rehabil Med 1999;31:185-92.
4. Koozekanani SH, Balmseda MT, Mohammed TF, Lowney ED.Ground reaction forces during ambulation in Parkinsonism: pilotstudy. Arch Phys Med Rehabil 1987;68:28-30.
5. Dietz V, Zijlstra W, Prokop T, Berger W. Leg muscle activationduring gait in Parkinson’s disease: adaptation and interlimb co-ordination. Electroencephalogr Clin Neurophysiol 1995;97:408-15.
6. Judge JO, Davis RB, Ounpuu S. Step length reductions in ad-vanced age: the role of ankle and hip kinetics. J Gerontol A BiolSci Med Sci 1996;51:M303-12.
7. Winter DA. The biomechanics and motor control of human walk-ing. Waterloo (ON): Univ Waterloo Pr; 1987.
8. Watelain E, Dujardin F, Babier F, Dubois D, Allard P. Pelvic andlower limb compensatory action of subject in early stage of hiposteoarthritis. Arch Phys Med Rehabil 2001;82:1705-11.
9. Riley PO, DellaCroce U, Kerrigan DC. Effect of age on lowerextremity joint moment contributions to gait speed. Gait Posture2001;14:264-70.
0. Scandalis TA, Bosak A, Berliner JC, Helman LL, Wells MR.Resistance training and gait function in patients with Parkinson’sdisease. Am J Phys Med Rehabil 2001;80:38-43; quiz 44-6.
Suppliers. Vicon Motion Systems Ltd, 14 Minns Estate, West Way, Oxford,
OX2 0JB, UK.. Advance Mechanical Technology Inc, 176 Waltham St, Water-
town, MA 02472.
. SAS Institute Inc, 100 SAS Campus Dr, Cary, NC 27513.Arch Phys Med Rehabil Vol 86, May 2005
Copyright © 2022 FDOKUMEN