Dendritic cell functional properties in a three-dimensional tissue model of human lung mucosa
Upload
independentCategory
view
0download
0
NMR IN BIOMEDICINE, VOL. 8 , 3 3 4 5 (1 996)
Quantitative and Qualitative Characterization of ‘H NMR Spectra of Colon Tumors, Normal Mucosa and their Perchloric Acid Extracts: Decreased Levels of Myo-inositol in Tumours can be Detected in Intact Biopsies
Angel Moreno* and Carles Ark? Departament de Bioqulmica i Biologia Molecular, Facultat de Citncies, Universitat Autbnoma de Barcelona, 08193 Bellaterra, Spain
Sixteen colonic tumours and 10 normal mucosa biopsies have been examined by ‘€3 NMR spectroscopy at 9.4 T. A complete characterization and quantification of the aliphatic region of PCA extract spectra and the analysis of the two-dimensional COSY spectra of five pairs of intact biopsies (tumor and control mucosa) has been carried out. The analysis of the PCA extracts demonstrated a significant increase in the concentration of the endogenous compounds: lactate, glutamate, aspartate, taurine, spermine, glutathione and glycerophosphoethanolamine, and a significant decrease of myo- and scyllo-inositol, in tumours with respect to mucosae. Among these metabolites, the high myo-inositol and taurine levels and the reciprocal changes found between them in tumours and mucosae make their resonances interesting as possible malignancy markers if they are detectable in vivu. In contrast to the easy observation of taurine in one-dimensional spectra of intact biopsies, the difficulty of observing myo-inositol prompted us to use two-dimensional COSY spectra for the detection and quantification of both these metabolites. In the two-dimensional spectra, the use of a ratio between the cross-peak volumes of both metabolites permits an excellent differentiation between tumours and normal mucosa and suggests its potential to detect malignant changes in the healthy tissue, provided a two-dimensional approach is used.
INTRODUCTION
Cancer is a heterogeneous disease manifested in more than 200 different forms. The usefulness of magnetic resonance spectroscopy for the study of this disease is a consequence of the ability of the technique to produce a ‘metabolic biopsy’ in a non-invasive manner and of the existence of important metabolic alterations in the tumoral tissues which are above the detection level of the methodology. These alterations usually involve the metabolites already encoun- tered in normal tissues, but in different concentrations as a result of the anomalous flow through many metabolic pathways. In fact, tumors act as metabolic traps of the catabolic and anabolic substrates required for their accel- erated metabolism and high proliferative ratios. ’** This behaviour can be observed by NMR spectroscopy in energy, membrane and other aspects of metabolism depending on the tumour type and normal tissue.
Colorectal cancer is an important public health problem due to its high incidence and the high rates of recurrence and metastasis after resection? the outcome of treatment being highly dependent on correct and early diagnosis: ?Author to whom correspondence should be addressed (Fax 34-3-581 1264). ’ Present address: Centre Diagnbstic Pedralbes, Chlonestir 3, 08034 Barcelona, Spain. Abbreviations used COSY, chemical-shift correlated spectroscopy; PCA, perchloric acid; FID, free induction decay; PBS, Dulbecco’s phosphate- buffered saline; PEG, polyethyleneglycol; TSP, 3-trimethyl- silyl-2,2,3,3-tetradeutero sodium propionate; PC, phosphocholine; GF‘C, glycerophosphocholine; PE, ethanolamine; GPE, glycerophosphoethanola- mine; GSH, reduced glutathione; GSSH, oxidized glutathione; GST, glutathione-S-wansferase; ODC, omithine decarboxilase.
These facts prompted us to perform a study with human biopsies’ in order to find putative malignancy markers useful in diagnosis and as tools for the monitoring of the in vivo response to therapy. In that study we showed that significantly higher levels of the amino acid taurine and of the exogenous compound polyethyleneglycol were detect- able in spin-echo spectra at long echo times and that they were highly discriminative between tumour and normal mucosa samples. The results of that study serve as the basis of our present work. Here, we report the findings of an ex vivo and in vitro MRS study in which a complete identification and quantification of proton resonances of the aliphatic region of the spectra were carried out in order to determine whether there were other metabolites observable in high resolution extract spectra which could potentially be useful in in vivo studies, and to correlate human and animal model studies for colon cancer: No analysis of the aromatic region has been done since the low intensity of the resonances appearing there makes them difficult to use in vivo.
EXPERIMENTAL
Samples
Studies were performed using surgical specimens from 16 patients (11 men and five women) from the ‘Consorci Hospitalari del Parc Tauli’ previously diagnosed by endo- scopic biopsy and radiographic studies, including eight
CCC 0952-3480/95/010033-13 0 1996 by John Wiley & Sons, Ltd.
Received 7 August 1995 Accepted (revised) 16 January 1996

34 A. MORENO AND C . AROS
patients with tumours of the cecum and colon and eight with rectal tumours. The average age was 65k 11 years (meankSD). The patients had not been treated preopera- tively with chemo- or radiotherapy and 24 h prior to the operation they ingested various amounts of the 'Pani solution': modified from the 'Golytely solution'8 contain- ing polyethyleneglycol (PEG), in order to flush the large intestine.
The colectomy specimens were surgically removed and promptly submitted to the Department of Pathology in an unfixed state within 10 min following excision. The excised portions were opened in a linear fashion with an enter- otome, washed free of fecal contaminants, and neoplasms visually identified. A sample of the neoplasm weighting approximately 0.4-1 g was removed from an area which macroscopically appeared to be the least necrotic. As a control, a second sample of non-involved colonic mucosa of similar weight and located not less than 5 cm away from the tumour was separated from the fibromuscular wall. Imme- diately after excision, samples were placed in Dulbecco's phosphate-buffered saline (PBS)' at 0-4"C, pH= 7.0, trans- ported to the NMR laboratory (20min drive) and kept at 04°C until used for the ex vivo experiments. A small piece of each sample, approximately 300 mg, was used for ex vivo spectroscopy and the remainder was stored in liquid nitrogen prior to perchloric acid extraction for the in v i m experiments. Spectroscopic measurements for the ex vivo samples were carried out within the following 12 h. The original colectomy specimen was sectioned, sampled, paraffin-embedded and microscopically examined for ana- tomic pathological diagnosis after staining with hematoxylin and eosin.
The histopathological type of the 16 tumours analysed was moderately differentiated adenocarcinoma and three of them were also classified as mucinous adenocarcinomas. By TNM classification" five tumours were classified as stage I, four as stage 11, six as stage 111 and one as stage 1V (corresponding to the A-D stages in the Dukes classifica- tion).
In vitro experiments
Tissue samples kept in liquid nitrogen were powdered and extracted with 6 mug wet weight of 3% (weight:volume) cold perchloric acid (PCA) as described except that the tissue powder was extracted three times with PCA to maximize the recovery of soluble metabolites from the tissue pellet.
Sixteen tumour and 10 mucosa extracts were analysed by 'H NMR at 25°C. The freeze-dried PCA extract powder was reconstituted in 'H,O with a ratio 1:l (initial wet sample weighvfinal extract volume). A volume of 0.4ml was placed inside the 5 mm NMR tube and a known amount of TSP (final concentration 1 mM) was added as an internal standard for chemical shift and concentration. The final p2H was adjusted to 7.0 with 'HCl and NaO'H (Aldnch Chemicals, Milwaukee, WI, USA).
In order to quantify metabolite levels, fully relaxed one- dimensional spectra were recorded with 90" pulses (10 ks), the data size was 16K data points and the spectral width was 4386 Hz, which resulted in an acquisition time of 1.87 s. The water signal was presaturated by selective irradiation for 1 s at 2 mW presaturation power (which empirically showed no saturation of metabolite resonances closest to the water, results not shown) and a total of 32 acquisitions were
collected for each spectrum with a repetition time of 30 s. This repetition time allowed full relaxation of the lactate methine protons which have the longest TI value of the resonances of interest (TI =5.2 s). Calculations of TI values in extracts were performed by using the inversion recovery pulse sequence,I3 (results not shown).
A line broadening of 0.2 Hz was applied prior to the Fourier transformation. Spectra were manually phased and the region between -0.2 and 4.2ppm was baseline flattened by means of a polynomial function provided in the Bruker software. The areas of the resonances of interest were defined by cursor demarcation between points of the resonance closest to the baseline and obtained by integration with the Bruker software.
Resonances were assigned by the following criteria: (1) Literature data on resonances in PCA extracts of
tissues from different origins. (2) Comparison of chemical shifts, multiplicity, coupling
constants and spin system patterns in two-dimensional COSY spectra between the extracts and the spectra of pure compounds recorded in 'H,O and with the p2H adjusted to 7.0.
(3) Coresonance with added standards (Sigma Chemicals, St Louis, MO, USA) specially in the case of singlets.
(4) Titration of the PCA extracts. Nineteen different p2H values in the range of 0.89-13.66 were used in the pK' calculation of the resonances in a PCA tumour extract. Measurements of p2H were carried out inside the NMR tube using a micro-combination pH probe (MI-412, Micro- electrodes Inc., Londonderry, NH, USA) and adjustments of p2H were carried out by adding small amounts of DC1 and NaOD. The p2H was measured before and after recording the NMR spectrum and spectra were used only when differences in p2H values were lower than 0.04 units.
Metabolite concentrations were determined by comparing the area underlying the resonances of interest with that of the TSP signal, correcting for the number of contributing protons and for the fresh tissue weight.
Two-dimensional COSY ~pect ra '~ . '~ were obtained with the pulse sequence (SP-D3-D1-90-DO-45-FID). SP is the saturation pulse train in the Bruker software. It generates a multipulse sequence (0.1 s in length in our case) that decreases the total experimental time by driving the spin system to equilibrium without resorting to dummy scans. The presaturation parameters, time (Dl) and presaturation power, were the same as in the one-dimensional experi- ments and the D3 relaxation delay was 1 s. The initial evolution time DO was set to 3 p, 1K data points were collected with a spectral width of 4386 Hz in the F, dimension and 16 transients were accumulated for each of the 256 time increments in the F, dimension, resulting in a total acquisition time of approximately 2.5 h. The resulting 256x 1024 matrix was zero filled to 512 x 1024, a sine-bell window function was applied in both domains and the matrix was Fourier transformed yielding a 512x512 magnitude matrix which was not symmetrized. A two- dimensional automatic fifth order baseplane correction supplied in the Bruker UXNh4R software package was applied to the resulting spectrum.
The cross-peak volumes of the different spin systems were integrated using the Bruker software and by adjusting the integration window to the peak contour at the lowest level just above the spectral noise. The volumes of cross peaks for the same connectivity on either side of the diagonal were added and a relative concentration value was calculated with respect to the alanine a-p protons con-

'H NMK SI'IX-IXA OF PCA EXTRACTS OF COLONIC BIOPSIES 35
nccrivity ;inti to the alanine concentration calculated from the cine-dimensional spectra. The formula of Relative concentration of compound ' X in arbitrary units=('X' cross peak volume/alanine cross peak volume) x alanine concentration was used. This expression is based in the theoretical linear correlation existing between cross-peak volume and concentration under the same acquisition parameters as shown in practice by previous In our case, these values do not represent absolute metabolite concentrations because no calibration with an alanine standard solution was performed, but they allow us to monitor changes in the relative amount of the same compound among different samples since the same acquisi- tion parameters were used.
Ex vivo studies
Five pairs of tumour and mucosa biopsies were used. Specimens were sliced to produce fragments which fitted easily into a 5 mm (O.D.) NMR tube (Wilmad Glass Company, Buena, NJ, USA) and immersed in the minimal amount of PBS in 'H,O (99.8% deuterium, Aldrich Chemical, Milwaukee, WI, USA) at p2H=7. The samples were then allowed to equilibrate for 10 min in the magnet. 'H NMR spectra were recorded with quadrature detection at 37"C, and chemical shifts were referenced to 50mM aqueous TSP (3-trimethylsilyl-2,2,3,3-tetradeutero sodium propionate, Wilmad Glass Company) in a reference capil- lary (1 mm O.D.) placed inside and against the wall of the NMR tube.
The magnetic field homogeneity over the tissue sample was optimized by shimming on the free induction decay (FID) to minimize the water resonance linewidth (usually ca 15 Hz at half height) and spectra were obtained without spinning.
One-dimensional fully relaxed water suppressed spectra and standard two-dimensional COSY experiments were obtained as described for extracts except that a total of 4K data points were collected during an acquisition time of 0.467 s, and a total of 16 transients were accumulated for each one-dimensional spectrum with a recycling time of 10s. A line broadening of 0.2Hz was applied prior to Fourier transformation. Two-dimensional COSY spectra were obtained as described above except that the total recycling time was 1 s (total acquisition time 1.5 h). Spectra were manually phased, baseline flattened and cross-peak volumes were integrated as described above with the Bruker software.
Spectroscopy Equipment
All 'H NMR spectra were recorded in the NMR facility of the Universitat Autbnoma de Barcelona with a Bruker AM- 400 W B spectrometer (9.4 T vertical magnet, 8.9 cm bore; Bruker SADIS, Wissembourg, France) operating at 400.135 MHz, equipped with an Aspect 3000 computer and with a selective 5 mm 'H probe.
Statistical Analysis
All quantitative parameters are presented as mean plus/ minus standard deviation (SD). Comparison between groups was performed by using the ranks signed Wilcoxon
test for paired samples in the ex vivo experiments and the U- Mann-Whitney test for unpaired samples in the in v i m experiments using in both cases the Statgraphics program package."
RESULTS
PCA Extracts
Assignments. The aliphatic region of proton NMR spectra of representative extracts of tumour and mucosa biopsies are shown in Fig. 1. Both spectra, tumour and mucosa show a large number of well resolved resonances which qual- itatively are essentially the same. Among these, the resonances of the aminoacid taurine and the exogenous compound polyethyleneglycol (PEG) have already been identified in a previous report from our In the present study, all resonances were initially assigned from literature data and from one- and two-dimensional spectra of the corresponding standards and related compounds. Specific coresonances were performed to confirm the assignments of the major components of the spectra; singlets of scyllo-inositol, glycine, PEG, choline, phos- phocholine (PC) and glycerophosphocholine (GPC) and the multiplets of myo-inositol, taurine and phosphoethanol- amhe (PE), and of the minor component spermine, a polyamine. The titration experiments showed pK' values and variations of the chemical shifts of the resonances consistent with the assignment of lactate (1.33, 4.11 pprn), taurine (3.26, 3.43 ppm) and creatine (3.04, 3.93 ppm) protons, methyl protons of threonine (1.33 ppm), alanine (1.48 ppm), glutamic acid (2.35 ppm) and glycine (3.56 ppm), methylene protons of succinic acid (2.41 ppm) and P-methylene protons of PE (4.0 ppm), and as expected, no titration of methyl proton resonances from choline (3.21 ppm), PC (3.22 ppm), GPC (3.23 ppm); methylene protons of PEG (3.71 ppm) and proton resonances from myo (4.06, 3.4-3.6 ppm) and scyllo-inositol (3.35 ppm). Most of the above mentioned compounds are rather usual in the spectral pattern of PCA extracts of tissues. In contrast, the detection of the scyllo-inositol resonance has been recently reported by Michaelis et a1." in the brain although no report has been found with respect to normal or tumoral large intestine. Figure 2 shows the coresonance experiment canied out with a mucosa extract that identifies the singlet appearing at 3.35 ppm as scyllo-inositol. Two-dimensional COSY spectra were used as an aid in the identification process of the one-dimensional resonances and these experiments also allowed the assignment of some minor components difficult to observe in the one-dimensional spectra. This was the case with the polyamine spermine, the peptide glutathione and of the probable resonances of the polyamine putrescine.
Spermine. Three lines of evidence suggested this assignment for the cross-peaks at 1.82-3.15 ppm and 2.13-3.17 ppm. First, it has been reported that in spectra from PCA extracts of different tissues and biofluids''.'* the presence of metabolites is related to the biosynthesis and breakdown of polyamines with these chemical shifts. Second, an excellent correlation (Fig. 3) exists between the volumes of both cross-peaks suggesting its origin in the same molecule or a close metabolic or physiological relationship among the responsible molecules. Third, among the polyamine path-

36 A. MORENO AND C. AR6S
way components tested (putrescine, spermidine, spermine, N-acetyl spermine, N-acetyl putrescine) the two-dimen- sional connectivity pattern of the spermine molecule (Fig. 4) was the most coincident one (number of cross-peaks, chemical shifts of them, etc.). Consequently, a coresonance experiment was performed by adding a small volume of a deuterated standard solution of spermine, which gave a final concentration of 2 m M in the NMR tube, acquiring two- dimensional COSY spectra as described at neutral (7.20), acid (2.13) and basic (13.06) p2Hs. Results obtained (not shown) demonstrated coresonance over the entire p2H range tested and confirmed the previous tentative assignment.
Glutathione. The presence in the two-dimensional COSY spectra of evident cross-peaks at 2.17-2.55, 2.98-3.32, 2.98476, 3.32-4.76 ppm, and probably at 2.17-3.78 ppm
was consistent with the presence of glutathione in the extracts. The complete assignment of the proton one- and two-dimensional spectral pattern of this compound in its oxidized and reduced forms was performed by Koga et dz3 The main differences in the proton NMR spectra of the two forms are in the methylene proton resonances of the glycine and cysteine residues that are magnetically non-equivalent in the oxidized form because of the constraint imposed by the disulphur bound. This non-equivalence, as well as the variation of the proton chemical shifts in the oxidized form with respect to the reduced one produces a spectral pattern sufficiently different to discriminate between the two forms. The biggest differences are in the cysteine methylene protons, in which, as a result of the non-equivalence, two well-separated multiplets (0.33 ppm) are produced. The coupling of these protons with the aCH ones, which appear
4 6 4.0 36 30 25 2 0 15 I 0
(ppn)
9 d \
I,
A
4.0 M 10 20 1.5 1.0
4.5 4 .0 3.5 3 .0 2.5 2.0 1 . 5 1 . 0
(PPd
, . . ! 5 .0 4.5 4.0 3 .5 3 . 0 2 .5 2.0 1.5 1 . 0
Figure 1. Aliphatic region of 'H NMR spectra of one- and two-dimensional COSY PCA extracts of colonic biopsies in deuterated PBS (p2H=7.0): (A) normal mucosa; (6) colon adenocarcinoma. One-dimensional spectra were plotted at the same scale with respect to the TSP resonance (which appears outside of the expanded region, at 0.0 ppm). Assignments are shown in Table 1 (one-dimensional spectra) and Table 2 (two-dimensional COSY spectra).

'H NMR SPECTRA OF PCA EXTRACTS OF COLONIC BIOPSIES 31
4.2 4.0 3.0 3.6 3.4 3.2 3.0 2.0
(ppm)
Figure 2. Coresonance experiment with scyllo-inositol. Expansion of the 2.9-4.2 ppm region of a mucosa PCA extract spectrum: (A) with the unassigned resonance marked with a question mark; (B) after the addition of 10 bl of the standard solution of 100 m M scyllo-inositol (pZH=7.0), where the intensity increment of the unknown resonance is marked as 'scyllo-i'.
shifted with respect to the reduced form, produces three characteristic cross-peaks for the oxidized form at 2.98-3.32, 2.98-4.76 and 3.324.76 ppm. On the other hand, the methylene protons in the reduced form are equivalent and the coupling with the aCH ones produces a single cross-peak at 2.96-4.58 ppm and consequently the two-dimensional pattern is able to differentiate between the two forms. The analysis of the two-dimensional COSY spectra of tumour and mucosa extracts showed that in all cases only the pattern from oxidized glutathione was detectable.
Putrescine. A tentative assignation of the cross-peak at 1.73-3.04 ppm in our previous work5 was to the lysine
5 - - j .
- 5 - 4 - I
m
3 - c u - c
_ I . . . . . . . 0 1 2
cross-peak h l volume Ia.u.1
Figure3. Correlation between the h2 and h l cross-peak vol- umes from two-dimensional COSY spectra of PCA extracts (Fig. 1 and Table 2). Plot shows individual values belonging to 14 tumours and mucosae. Values were fitted by using linear regression analysis; h2 cross-peak volume=2.27 X h l cross- peakvolume - 0.082, r=0.98, p<4.4X lo-', a.u. arbitrary units.
W3H,-cCH3 connectivity, due to the chemical shift values and to the presence in the spectra of the rest of the lysine spin system connectivities (KH,-aCH, 1.91-3.80 ppm; pCH2-$H2, 1.91-1.50 ppm; $H,-GCH,, 1.50- 1.73 ppm). Despite this coincidence, the visual comparison between the two-dimensional COSY spectra of a lysine standard solution and that of the biopsy PCA extracts suggested that, with respect to the rest of lysine cross-peaks, the intensity of the 1.73-3.04 ppm cross-peak in the extract spectra was clearly larger than in the standard solution and, consequently, contributed by other compounds. In order to test this hypothesis, the ratio between the cross-peak at 1.73-3.04 and the lysine aCH-WH, protons was calculated in the PCA extracts and in the standard solution. The results obtained (standard solution, 2.21; mucosa extracts, 3.18i 1.26, n=7; tumour extracts, 4.92 1.59, n=7) demon- strated the presence of contributions other than lysine to the 1.73-3.04 connectivity. Their source may be a compound of the polyamine pathway, since a good correlation was found with the spermine content (Fig. 5). The partial coresonance of putrescine with the cross-peak of interest (Fig. 6) suggests it may be one of them. A summary of the assigned resonances is shown in Fig. 2 and Tables 1 and 2.
Quantitation
Although the spectra of tumour extracts are qualitatively similar to the mucosa spectra, several quantitative differ- ences exist. These quantitative differences are summarized in Tables 3 and 4 as absolute or relative concentration of the metabolites observed in the NMR spectra of tissue extracts. Statistically significant elevation of lactate, glutamate, aspartate, taurine, spermine, putrescine, glutathione, GPE and significant decreases of myo- and scyllo-inositol were
38 A. MORENO AND C. AROS
observed in malignant tissues compared to normal mucosa. Levels of choline and ethanolamine related compounds were also increased in tumour extracts, but without statistical significance.
Biopsies
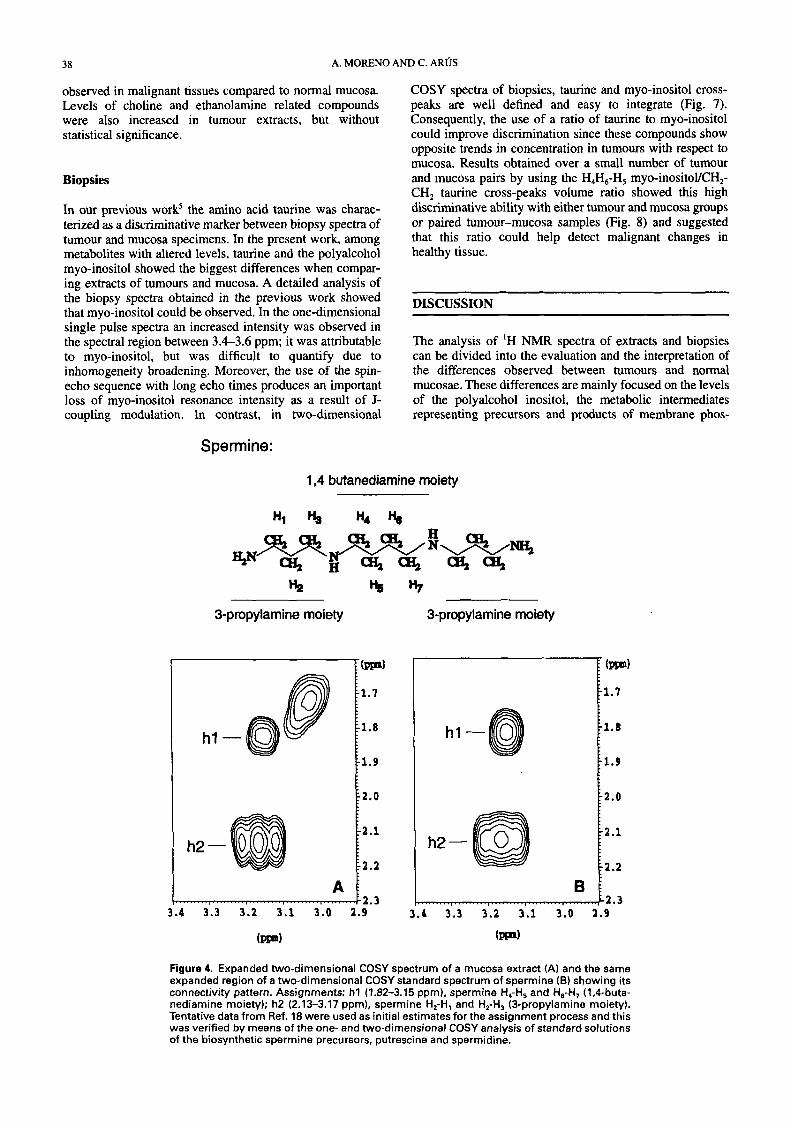
In our previous work' the amino acid taurine was charac- terized as a discriminative marker between biopsy spectra of tumour and mucosa specimens. In the present work, among metabolites with altered levels, taurine and the polyalcohol myo-inositol showed the biggest differences when compar- ing extracts of tumours and mucosa. A detailed analysis of the biopsy spectra obtained in the previous work showed that myo-inositol could be observed. In the one-dimensional single pulse spectra an increased intensity was observed in the spectral region between 3.4-3.6 ppm; it was attributable to myo-inositol, but was difficult to quantify due to inhomogeneity broadening. Moreover, the use of the spin- echo sequence with long echo times produces an important loss of myo-inositol resonance intensity as a result of J- coupling modulation. In contrast, in two-dimensional
COSY spectra of biopsies, taurine and myo-inositol cross- peaks are well defined and easy to integrate (Fig. 7). Consequently, the use of a ratio of taurine to myo-inositol could improve discrimination since these compounds show opposite trends in concentration in tumours with respect to mucosa. Results obtained over a small number of tumour and mucosa pairs by using the H,H,-H, myo-inositoYCH,- CH, taurine cross-peaks volume ratio showed this high discriminative ability with either tumour and mucosa groups or paired tumour-mucosa samples (Fig. 8) and suggested that this ratio could help detect malignant changes in healthy tissue.
DISCUSSION
The analysis of 'H NMR spectra of extracts and biopsies can be divided into the evaluation and the interpretation of the differences observed between tumours and normal mucosae. These differences are mainly focused on the levels of the polyalcohol inositol, the metabolic intermediates representing precursors and products of membrane phos-
Spermine:
1,4 butanediamine moiety
3-propylamine moiety
p . 0
1::: h2 -
2.3 4 3.3 3.2 3.1 3.0 2.9
3-propylamine moiety
12.0
1::: h2 -
2.3 4 3.3 3.2 3.1 3.0 2.9
Figure 4. Expanded two-dimensional COSY spectrum of a mucosa extract (A) and the same expanded region of a two-dimensional COSY standard spectrum of spermine (B) showing its connectivity pattern. Assignments: h l (1.82-3.15 ppm), spermine H,-H, and H,-H, (1,rl-buta- nediamine moiety); h2 (2.13-3.17 ppm), spermine H,-H, and H,-H, (3-propylamine moiety). Tentative data from Ref. 18 were used as initial estimates for the assignment process and this was verified by means of the one- and two-dimensional COSY analysis of standard solutions of the biosynthetic spermine precursors, putrescine and spermidine.

‘H NMR SPECTRA OF PCA EXTRACTS OF COLONIC BIOPSIES 39
- 1
0 1 2 3 4
spermine h l cross-peak volume (a.u.1
Figure5. Plot of the lysine d4 cross-peak volume vs the spermine h l cross-peak volume present in two-dimensional COSY spectra of PCA extracts (Fig. 1 and Table 2). The plot shows single values belonging to 14 tumours and mucosae. Values were fitted using linear regression analysis; lysine d4 cross-peak volume=0.64X spermine h l cross-peak volume +0.39, r=0.94, p<3.3x lo-’, a.u. arbitrary units.
pholipid metabolism, metabolites related to catabolic and anabolic metabolism, glutathione and polyamines.
Inositol
The major finding of the present study was that myo-inositol concentrations in primary human adenocarcinomas were significantly lower than those observed for normal mucosa. These different levels can be observed in the biopsy specimens and consequently may be useful in in vivo applications. Moreover, the existence of an inverse relation- ship between the levels of myo-inositol and those of the amino acid taurine prompted us to use a ratio between both of them as a more discriminative index. Two-dimensional
1.7
1.8
1.9
1 2 . 0
3.3 3.2 3.1 3.0
(PI
COSY spectra of biopsies allow the observation and quantitation of the resonances of these metabolites, and the experiments carried out, despite the low number of samples studied, have shown an excellent discrimination between tumour and mucosa biopsies.
Myo-inositol and its various biochemical derivatives are broadly distributed in mammalian tissues and cells. In its free state, myo-inositol occurs in significant amounts in brain, testis, secretory tissues, intestine, kidney and heart. Despite the ability of most animal cells to synthetize myo- inositol from D-Glucose-6-phosphate during embryo- genesis, the cells of the adult show little biosynthetic activity with the exception of testis and lactating mammary tissue.24 Accordingly, the myo-inositol concentration of many tissues is believed to be regulated by its uptake from blood (blood plasma concentration in normal subjects is approximately 30 p,MZ5). It is known that myo-inositol is an essential growth factor for cultured human cells and it has been suggested that increased myo-inositol requirements in proliferating cells are due to greater phospholipid bio- synthesis for increased membrane production. Its biochemical and physiological roles in mammalian cells have been mostly associated with the mediation of cellular responses to external stimuli as a source of second messengers (inositol phosphates). On the other hand, an osmoregulatory role of free myo-inositol has also been demonstrated in mammalian renal medula in non- osmotic diabetic cataracts,” in human lens epithelial cells and retinal pigment epithelium in tissue culture?’ In these cells, a close relationship has been described with taurine, which also has an osmotic function.
Possible explanations for the reduced levels of myo- inositol in primary colon tumours do not seem to be related to a change in the membrane phospholipid composition since studies by Merchant et al.29JQ showed no differences between phosphatidylinositol levels of normal mucosa and colorectal adenocarcinomas. Moreover, the high levels involved make it improbable that the observed differences
1.7
1.8 hl -
3.3 3.2 3.1 3.0
IPP)
Figure 6. Coresonance experiment with the polyamine putrescine. Expanded region of the two-dimensional COSY spectrum of a mucosa extract: (A) before the addition of putrescine (put); and (B) after the addition of a standard solution of putrescine (p2H=7.0) to give a final concentration of 1 mM. Note the evident overlap of the putrescine cross- peak with the d4 cross-peak.
40 A. MORENO AND C. AROS
are related to altered cellular signal transduction, although this process is indeed affected in colon tumour cells, with decreased levels of 1,2-sn-diacylglycerol and a suggested suppression of the protein kinase C signal transduction pa th~ay .~ ' In addition, the cellular functions of free myo- inositol are currently unknown and we may then hypothesize that the loss of differentiation produced in the tumour cells with respect to the normal mucosa may produce an alteration of the cellular functions in which myo-inositol is involved and consequently change its concentration. If these functions are related to an osmotic action, as previously mentioned, the low myo-inositol levels observed in tumours may also be a response to the increased taurine level^.^ Interestingly, such an inverse relationship has been described in an experimental encephalomyelitis mouse
Consistent findings were also found for the scyllo-inositol levels, which were significantly decreased in tumour extracts. Scyllo-inositol is the second most abundant inositol isomer occurring naturally, with a myo/scyllo ratio ranging between 1.85-50 depending on the tissue.33 Despite its ubiquitous presence in most mammalian t i s s ~ e s ~ ' , ~ ~ , ~ ~ and the close metabolic inter-relationship between scyllo- and m y o - i n o ~ i t o l , ~ ~ ~ its low concentration sometimes made it undetectable in proton spectra and when detectable its resonances remained unassigned in a large number of high- resolution NMR studies, mainly of brain extracts. It was
assigned both in PCA extracts and in human brain spectra in vivo by Michaelis et ~ 2 1 . ~ ~ Here, we also report its presence in the proton spectra of normal mucosa and of colorectal tumour extracts, with an average myo/scyllo ratio of 11.9 for normal mucosa and 12.7 for tumours.
Lactate, Aspartate and Glutamate
The higher levels of lactate, aspartate and glutamate observed in tumours are consistent with their energetic and biosynthetic needs. In fact, tumour cells are able to use virtually any substrate-glucose, lipids or amino acids, although their relative importance will vary according to the type of turnour and even the state of development of the tumour.' Since the pioneering studies of Warburg4' most tumours have been shown to metabolize glucose via glycolysis at a high rate even when oxygen is available. The higher levels of lactate are probably the result of this high glucose consumption and of the increased glucose uptake present in several tumoral The low statistical significance found may be caused by the high lactate export rate in tumours' in a similar way to muscle fibres in anoxic situations." On the other hand, the high levels of glutamate and aspartate may be due to the high glutaminase activity found in several tumour cells.'*2 Glutaminase is the first enzyme in the hydrolysis of glutamine, which is an essential
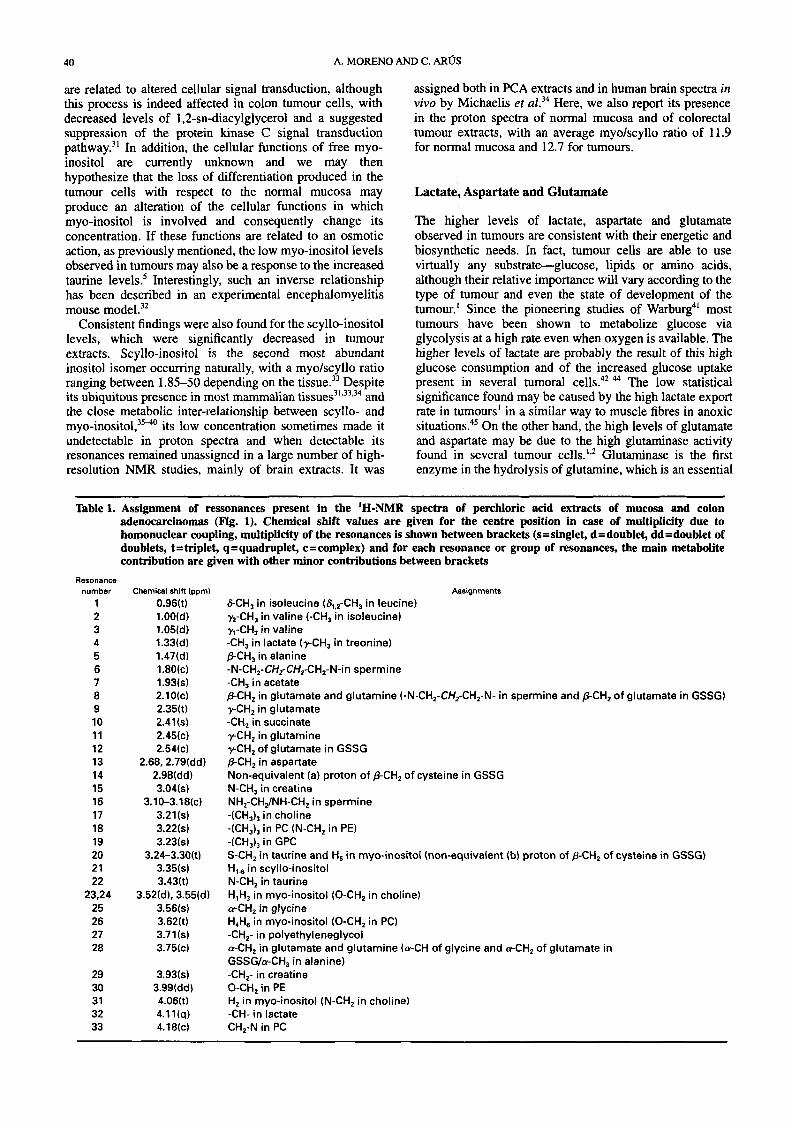
Table 1. Assignment of ressonances present in the 'H-NMR spectra of perchloric acid extracts of mucosa and colon adenocarcinomas (Fig. 1). Chemical shift values are given for the centre position in case of multiplicity due to homonuclear coupling, multiplicity of the resonances is shown between brackets (s=singlet, d = doublet, dd=doublet of doublets, t=triplet, q=quadruplet, c=complex) and for each resonance or group of resonances, the main metabolite contribution are given with other minor contributions between brackets
Resonance number
1 2 3 4 5 6 7 8 9 10 11 12 13 14 15 16 17 18 19 20 21 22
23.24 25 26 27 28
29 30 31 32 33
Chemical shift (ppml
0.96(t) 1.00(d) 1.05(d) 1.33(d) 1.47(d) 1.80(c) 1.93(s) 2.10(c) 2.35(t) 2.41(s) 2.45(c) 2.54(c)
2.68,2.79(dd) 2.98(dd) 3.04(s)
3.10-3.18(c) 3.21 (s) 3.22(s) 3.23(s)
3.24-3.30ft) 3.35(s) 3.43(t)
3.52(d), 3.55(d) 3.56(s) 3.62(t) 3.71(s) 3.7 5 ( c
Assignments
SCH, in isoleucine (8,,,-CH3 in leucine) y,-CH, in valine (-CH, in isoleucine) yl-CH, in valine -CH, in lactate (yCH, in treonine) &CH, in alanine -N-CH,-CH,-CH,CH,-N-in sperrnine -CH, in acetate PCH, in glutarnate and glutarnine (-N-CH,-CH,-CH,-N- in sperrnine and p-CH, of glutamate in GSSG) yCH, in glutarnate -CH, in succinate yCH, in glutamine yCH, of glutarnate in GSSG PCH, in aspartate Non-equivalent (a) proton of p-CH, of cysteine in GSSG N-CH, in creatine NH,-CH,/NH-CH, in sperrnine -(CH,), in choline -(CH,), in PC (N-CH, in PE) -(CH,), in GPC S-CH, in taurine and H, in myo-inositol (non-equivalent (b) proton of p-CH, of cysteine in GSSG) H,, in scyllo-inositol N-CH, in taurine H,H, in rnyo-inositol (0-CH, in choline) a-CH, in glycine H,H, in myo-inositol (0-CH, in PC) -CH,- in polyethyleneglycol a-CH, in glutarnate and glutarnine b C H of glycine and a-CH, of glutarnate in GSSGIcrCH, in alanine) -CH,- in creatine 0-CH, in PE H, in rnyo-inositol /N-CH, in choline) -CH- in lactate CH,-N in PC
'H N M R SPECTRA OF PCA EXTRACTS OF COLONIC BIOPSIES 41
amino acid for the growth of certain tumours, and the main products of its catabolism are glutamate and aspartate.2 The reasons suggested for its essential character have been that glutamine serves as one of the most important precursors in the synthesis of tumour protein and purine nucleotides, and that the carbon skeleton of this amino acid could be incorporated into citrate, giving it an anaplerotic role.'*2
Phospholipid intermediates
Higher levels of PC and PE, and not as consistently, of GPC and GPE have been observed in a wide variety of human tumours, cultured cells and tumours in animal models when compared to the tissue of Because of their relationship to the phospholipid synthesis and degradation pathways the interpretation of such higher levels in tunours has been attributed to elevated synthesis andor membrane turnover. Our results, which show higher levels of the phospholipid intermediates found in the PCA extracts, although without statistical significance except in the case of GPE, would qualitatively agree with the literature on the subject. The absence of statistical signification could be interpreted in the light of the reported relationship in some models49 between the levels of these compounds and the cellular proliferation rates, and the scattering of the cell cycle times which are estimated to be 38-128 h in human colon turnours?' similar to the high rates of normal mucosa
tissue, 72-90 h.SO On the other hand, our results disagree with those of Kasimos el ~ 1 . 5 ' which described a significant decrease in the PC concentration in PCA extracts of human tumours of colonic epithelial origin compared to normal colonic mucosa dissected to include the associated fibro- muscular wall. The explanation for this decrease given by the authors lies in the release by the malignant tissue of an alkyl-phospholipid analogue of phosphatidylcholine. This explanation is possible, but contamination by PC from the fibromuscular wall should also be considered.
Glutathione and spermine
Glutathione is ubiquitous in eucaryotic cells and, in addition to its involvement in a variety of other biochemical reactions, it participates in its reduced form (GSH) in detoxification reactions for xenobiotics and plays an important role in protection against cellular damage result- ing from exposure to oxidizing environments. The relative levels of oxidized and reduced glutathione are regulated by a series of reactions that reduce the reactive oxygen species or lipid peroxides via the glutathione reductase reaction.52 Another route for GSH depletion is via the GSH transferase reaction (GST), which catalyses glutathione conjugation with a large number of foreign compounds with electro- philic centres?' In the colon, the mucosa is in constant contact with noxious chemicals, some of which possess
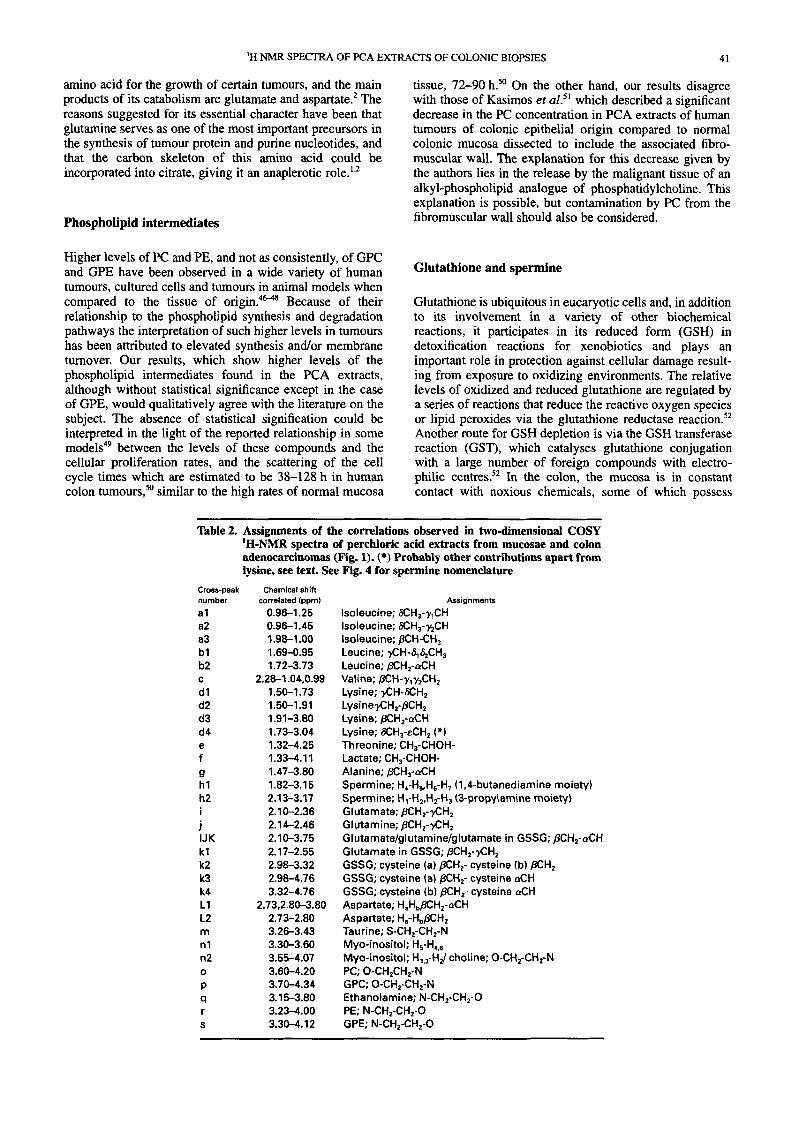
Table 2. Assignments of the correlations observed in two-dimensional COSY 'H-NMR spectra of perchloric acid extracts from mucosae and colon adenocarcinomas (Fig. 1). (*) Probably other contributions apart from lysine, see text. See Fig. 4 for spermine nomenclature
Cross-peak number
a1 a2 a3 b l b2
d l d2 d3 d4 e f 9 h l h2 i
IJK k l k2 k3 k4 L1 L2 m n l n2
P 9 r
C
i
0
S
Chemical shift correlated (ppm)
0.96-1.25 0.96-1.45 1.98-1 .oo 1.69-0.95 1.72-3.73
2.28-1.04,0.99 1.50-1.73 1.50-1.91 1.91-3.80 1.73-3.04 1.32-4.25 1.33-4.11 1.47-3.80 1.82-3.1 5 2.13-3.17 2.1 Q-2.36 2.14-2.46 2.10-3.75
2.98-3.32 2.98-4.76
2.73.2.80-3.80
3.26-3.43 3.30-3.60 3.55-4.07 3.60-4.20 3.70-4.34 3.1 5-3.80 3.23-4.00 3.30-4.1 2
2.17-2.55
3.32-4.76
2.7 3-2.80
Assignments
Isoleucine; XH,-y,CH Isoleucine; XH,-y,CH Isoleucine; &H-CH, Leucine; $H-S,&CH, Leucine; pCH,-aCH Valine; pCH-yly2CH, Lysine; $H-XH, LysineflH,-@H, Lysine; pCH,-aCH Lysine; SCH,-ECH, (*) Threonine; CH,-CHOH- Lactate; CH,-CHOH- Alanine; pCH1-aCH Spermine; H,-HS,H,-H7 (1,Cbutanediamine moiety) Spermine; Hl-H,,Hz-H3 (3-propylamine moiety) Glutamate; /3CH,-$H, Glutamine; PCH,-flH, GIutamate/gIutamine/gIutamate in GSSG; pCH,-aCH Glutamate in GSSG; PCH,-$H, GSSG; cysteine la) pCH,- cysteine (b) pCH, GSSG; cysteine (a) pCH,- cysteine aCH GSSG; cysteine (b) pCH,- cysteine aCH Aspartate; H,H,pCH,-aCH Aspartate; H,-H&CH, Taurine; S-CH,-CH,-N Myo-inositol; H,-H,,, Myo-inositol; H,,,-HJ choline; 0-CH,-CH,-N PC; 0-CHZCHZ-N GPC; 0-CHZ-CHZ-N
PE; N-CHZ-CHZ-0 GPE; N-CHZ-CHZ-0
Ethanolamine; N-CH,-CH,-O
42 A. MORENO AND C. AROS
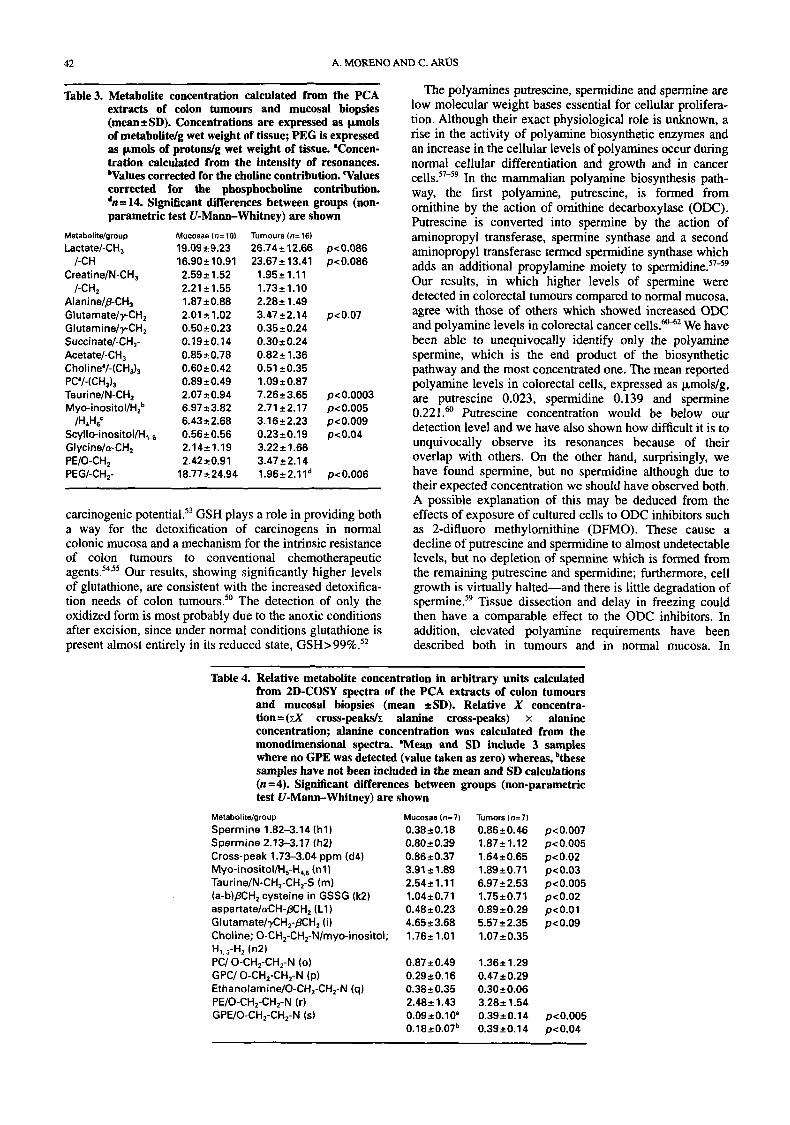
Table 3. Metabolite concentration calculated from the PCA extracts of colon tumours and mucosal biopsies (mean* SD). Concentrations are expressed as pmols of metabolitefg wet weight of tissue; PEG is expressed as pmols of protondg wet weight of tissue. Toncen- tration calculated from the intensity of resonances. bValues corrected for the choline contribution. "Values corrected for the phosphwholine contribution. dn = 14. Significant differences between groups (non- parametric test U-Mann-Whitney) are shown
Metabolitetgroup Mucosae (n=lO) Tumours (n=161
Lactatel-CH, 19.0929.23 26.74212.66 p<0.086 /-CH 16.90k10.91 23.672 13.41 pc0.086
Creatine/N-CH, 2.592 1.52 1.95+ 1.1 1 /-CH, 2.21 2 1.55 1.73+ 1.10
Alanine//.?-CH, 1.8720.88 2.282 1.49 Glutamate/yCH, 2.0121.02 3.4752.14 pc0.07 GlutaminelyCH, 0.50k0.23 0.3510.24 Succinate/-CH,- 0.19k0.14 0.302 0.24 Acetate/-CH, 0.8520.78 0.82+ 1.36 Cholinea/-(CHJ3 0.6020.42 0.51 20.35 PC"/-(CH& 0.89k0.49 1.0920.87 Taurine/N-CH, 2.0720.94 7.2623.65 pc0.0003 Myo-inositol/H,b 6.9723.82 2.7122.17 pc0.005
/H,H," 6.4322.68 3.1622.23 pcO.009 Scyllo-inositollH,, 0.56k0.56 0.2320.19 p<0.04 GI ycine/a-CH, 2.14i 1.19 3.22+ 1.66 PE/O-CH, 2.4220.91 3.4722.1 4 PEG/-CH,- 18.77224.94 1.9622.1ld pc0.006
carcinogenic potential.53 GSH plays a role in providing both a way for the detoxification of carcinogens in normal colonic mucosa and a mechanism for the intrinsic resistance of colon tumours to conventional chemotherapeutic agent^.^^.^^ Our results, showing significantly higher levels of glutathione, are consistent with the increased detoxifica- tion needs of colon turn our^.^^ The detection of only the oxidized form is most probably due to the anoxic conditions after excision, since under normal conditions glutathione is present almost entirely in its reduced state, GSH> 99%.52
The polyamines putrescine, spermidine and spermine are low molecular weight bases essential for cellular prolifera- tion. Although their exact physiological role is unknown, a rise in the activity of polyamine biosynthetic enzymes and an increase in the cellular levels of polyamines occur during normal cellular differentiation and growth and in cancer ~ e l l s . ~ ~ - ~ ~ In the mammalian polyamine biosynthesis path- way, the first polyamine, putrescine, is formed from ornithine by the action of ornithine decarboxylase (ODC). Putrescine is converted into spermine by the action of aminopropyl transferase, spermine synthase and a second aminopropyl transferase termed spermidine synthase which adds an additional propylamine moiety to per mi dine."-^^ Our results, in which higher levels of spennine were detected in colorectal tumours compared to normal mucosa, agree with those of others which showed increased ODC and polyamine levels in colorectal cancer cells.m2 We have been able to unequivocally identify only the polyamine spermine, which is the end product of the biosynthetic pathway and the most concentrated one. The mean reported polyamine levels in colorectal cells, expressed as p,mols/g, are putrescine 0.023, spermidine 0.139 and spermine 0.221 Putrescine concentration would be below our detection level and we have also shown how difficult it is to unquivocally observe its resonances because of their overlap with others. On the other hand, surprisingly, we have found spermine, but no spermidine although due to their expected concentration we should have observed both. A possible explanation of this may be deduced from the effects of exposure of cultured cells to ODC inhibitors such as 2-difluoro methylomithine (DFMO). These cause a decline of putrescine and spermidine to almost undetectable levels, but no depletion of spermine which is formed from the remaining putrescine and spermidine; furthermore, cell growth is virtually halted-and there is little degradation of per mine.^^ Tissue dissection and delay in freezing could then have a comparable effect to the ODC inhibitors. In addition, elevated polyamine requirements have been described both in tumours and in normal mucosa. In
~ ~~
Table 4. Relative metabolite concentration in arbitrary units calculated from 2D-COSY spectra of the PCA extracts of colon tumours and mucosal biopsies (mean iSD). Relative X concentra- tion = (S cross-peak& alanine cross-peaks) x alanine concentration; alanine concentration was calculated from the monodimensional spectra. 'Mean and SD include 3 samples where no GPE was detected (value taken as zero) whereas, bthese samples have not been included in the mean and SD calculations (n =4). Significant differences between groups (non-parametric test U-Mann-Whitney) are shown
Metabolitelgroup Mucosae (n=7) Tumors ( n = 7 ) Spermine 1.82-3.14 (h l ) 0.3820.18 0.8620.46 pc0.007 Spermine 2.13-3.17 (h2) 0.8020.39 1.8721.12 p<0.005 Cross-peak 1.73-3.04 ppm (d4) 0.8650.37 1.6420.65 p<0.02 Myo- i n osito Mi5- H ,,6 ( n 1 ) 3.9121.89 1.8920.71 pcO.03 Taurine/N-CH,-CH,-S (m) 2.5411.11 6.9722.53 pc0.005 (a-b)PCH, cysteine in GSSG (k2) 1.0450.7 1 1.75 k 0.7 1 pc 0.02 aspartatelcrCH-pCH, (L1) 0.48+0.23 0.8920.29 pcO.01 Glutarnate/$H,-pCH, (i) 4.6513.68 5.5722.35 p<O.O9 Choline; 0-CH,-CH,-N/myo-inositol; 1.76-+ 1.01 1.0720.35 H,,,-H, (172) PC/ 0-CHZ-CHZ-N (0 ) 0.8720.49 1.3621.29 GPC/ 0-CHZ-CHZ-N (p) 0.2910.16 0.47 10.29 Ethanolamine/O-CH,-CH,-N (q) 0.385 0.35 0.302 0.06 PE/O-CH2-CH2-N (r) 2.481 1.43 3.282 1.54 GPE/O-CH,-CH,-N (s) 0.0950.10" 0.39k0.14 pc0.005
0.18+0.07b 0.3920.1 4 pc0.04

'H NMR SPECTRA OF PCA EXTRACTS OF COLONIC BIOPSIES
3.5 -
3.0 - 0 .- c
2 2.5 - 0, c - 2 . 0 -
c 5 1.5 -
;; 1.0 - b o . 5 -
E
3 m
0 c .- c .-
0.0 -
43
In summary, our studies demonstrate the ability of 'H NMR to detect significant differences in myo-inositol concentration in PCA extracts of biopsies of colorectal tumours and normal mucosa, and suggest the usefulness of the inositolkaurine ratio to detect malignant changes in the
.. .. healthy tissue. In addition, qualitative and quantitative El.. :.:.. . . . . . . .. analysis of the spectra of PCA extracts has demonstrated
. . . . . . differences in the concentration of lactate, aspartate,
Q
I.: . . .. .. .. . . .. .. .. .. .. . . .. . . . . .. ..
. . . . . . ...... . . . *... . . . . . . . . . .
*...... .......... ...........
glutamate, glutathione and spermine consistent with the ...... ..:.:. metabolic alterations present in the malignant tissues,
although some of these differences are not observable in the intact biopsy specimens spectra.
. . . . . . . . . . . . . .
...... :.:,. .... -, 2. . '.* f
213 f 1.16 0.37 f 0.16
bpm) ( p v )
3.2 3 2
3.4 3.4
3 6 3.6
3.8 3.8
(pprn) 3.6 3.4 3.2 3.0 (ppm) 3.6 3.4 3.2
Figure 7. Expansion of the unsymmetrized two-dimensional COSY spectra of: (A) colonic mucosa; and (6) colonic adenocarcinoma, both in deuterated PBS (p2H=7.0). F2 projections are shown on top. Note the inverse relationship of cross-peak volumes between myo-inositol (Ins) and taurine (Tau).
rnucosae turnours Acknowledgements
Figure 8. Comparison of the myo-inositol (H,H,,,)/taurine (-CH,- This work was funded by CICYT SAF93-0582-CO2-01. A. Moreno held a CH,-) cross-peak volume ratio in two-dimensional COSY spectra predoctoral fellowship from the Ministerio de Educaci6n y Ciencia of tumours and colonic mucosae ex vivo. Significant differences followed by a fellowship from the Asociaci6n Espaiiola Contra el Cancer between groups were found with p 0 . 0 6 , n=5 with the non- (A.E.C.C.) during the duration of the study. We would like to thank Dr parametric Wilcoxon ranks test for paired data. Each dotted line Mercd Rey (Servei de Patologia) and Dr Josep M. MontanC (Servei de links paired samples from the same patient and mean Cirurgia), Consorci Hospitalari del Parc Tauli, Sabadell, Spain, for their values2SD are shown on the plot. collaboration in obtaining and classifying the biopsies.
REFERENCES
1. ArgilBs, J. M. and Azcon-Bieto, J. The metabolic environ- ment of cancer. Mol. Cell. Biochem. 81,3-17 (1988).
2. Medina, M. A., Sanchez-JimBnez, F., Mhrquez, J., Rodriguez Quesada, A. and Nutiez de Castro, 1. Relevance of glutamine metabolism to tumour cell growth. Mol. Cell. Biochern. 113,
3. Greenwald, I? Colon cancer overview. Cancer70.1206-1215 (1992).
4. Ahnen, D. J. Etiology of large bowel cancer. In The Large Intestine, Pathology, Pathophysiology and Disease, ed. by S. F. Phillips, J. H. Pemberton and R. G. Shorter, pp. 501-520. Raven Press, New York (1990).
5. Moreno, A., Rey, M., Montane, J. M., Alonso, J. and Arus, C. 'H NMR spectroscopy of colon tumors and normal mucosal biopsies; elevated taurine levels and reduced polyethylene- glycol absorption in tumors may have diagnostic
1-15 (1992).
significance. NMR Biomed. 6, 11 1-1 18 (1993). 6. Briere, K. M., Kuesel, A. C., Bird, R. I? and Smith, I. C. P. 'H
MR visible lipids in colon tissue from normal and carcino- gen-treated rats. NMR Biomed. 8, 33-40 (1995).
7. Rigau, J., Garcia, A., Pardo, C. and Mas, M. t? Valoracion de la solucion de polietilenglicol (PARRI) como metodo de limpieza en la exploracion endoscopica del colon. Gastro- enterol. Hepatol. 11, 129-132 (1988).
8. Davis, G. R., Santa Ana, C. A., Morawski, S. G. and Fordtran, J. S. Development of a Lavage solution associated with minimal water and electrolyte absorption or secretion. Gastroenterology, 78,991-995 (1980).
9. Dulbecco, R. and Vogt, M. Plaque formation and isolation of pure lines with poliomyelitis viruses. J. Exp. Med. 98,
10. Colon and rectum. In TNM Atlas Illustrated Guide to the 167-182 (1954).
44 A. MORENO AND C. AROS
TMN/pTNM-Classification of Malignant Tumors. Publication of the International Union Against Cancer (UICC), 3rd edn, ed. by B. Spiessl, 0. H. Beahrs, P. Hermanek, R. V. P. Hutter, 0. Scheibe, L. H. Sobin and G. Wagner, pp. 82-97. Springer- Verlag, New York (1989).
11. Arus, C. and Barany, M. Application of high field 'H NMR spectroscopy for the study of perifused amphibian and excised mammalian muscles. Biochim. Byophis. Acfa 886,
12. BBrany, M. and Glonek, T. Phosphorus-31 nuclear magnetic resonance of contractile systems. Meth. Enzymol. 858, 624-676 (1982).
13. Vold, R. L., Waugh, J. S., Klein, H. P. and Phelps, D. E. Measurements of spin relaxation in complex systems. J. Chem. Phys. 48,3831-3832 (1968).
14. Aue, W. P., Bartholdi, E. and Ernst, R. R. Two-dimensional spectroscopy. Application to nuclear magnetic resonance. J. Chern. Phys. 64,2229-2246 (1976).
15. Nagayama, K., Kumar, A., Wuthrich, K. and Ernst, R. R. Experimental techniques of two-dimensional correlated spectroscopy. J. Magn. Reson. 40,321-334 (1980).
16. Berkowitz, B. A. and Balaban S. Two-dimensional nuclear magnetic resonance studies in vivo. Mefh. Enzymol. 176, 330-494 (1989).
17. Alonso, J., Arus, C., Westler, W. M. and Markley, J. L. Two- dimensional correlated spectroscopy (COSY) of intact frog muscle: spectral pattern characterization and lactate quanti- tation. Magn. Reson. Med. 11,316-330 (1989).
18. Dingley, A. J., King, N. J. C. and King, G. F. An NMR investigation of the changes in plasma membrane triglycer- ide and phospholipid precursors during the activation of t-lymphocytes. Biochemistry 31,9098-9106 (1992).
19. Sfatgraphics Statistical Graphics System. Statistical Graph- ics Corporation. EXEC*U*STAT, Inc. and Lauer Software, Copyright 1986, STSC Inc.
20. Michaelis, T., Merboldt, K.-D., Hanicke, W., Gyngell, M. L., Bruhn, H. and Frahm, J. On the identification of cerebral metabolites in localized 'H NMR spectra of human brain in vivo. NMR Biomed. 4,90-98 (1991).
21. Cerdan, S., Kunnecke, B., Dolle, A. and Seelig, J. In situ metabolism of 1, o medium chain dicarboxylic acids in the liver of intact rats as detected by 13C and 'H NMR. J. Biol. Chem. 263,11664-11674 (1988).
22. Bell, J. D., Brown, J. C. C. and Sadler, P. J. NMR studies of body fluids. NMR Biomed. 2,246-256 (1989).
23. Koga, N., Inskeep, P. B., Harris, T. M. and Guengerich, F. P. S- 12-N7-guanyl)ethyllglutathione, the major DNA adduct formed from 1.2-dibromoethane. Biochemistry 25,
24. Holub, B. J. Metabolism and function of myeinositol and inositol phospholipids. A. Rev. Nutr. 6,567-597 (1986).
25. Holub, B. J. Nutritional, biochemical and clinical aspects of inositol and phosphatidylinositol metabolism. Can. J. Phys- iol. Pharmacol. 62, 1-8 (1985).
26. Nakanishi, T., Uyama, 0. and Sugita, M. Osmotically regulated taurine content in rat renal inner medulla. Am. J.
27. Malone, J. I., Lowitt, S. and Cook, W. R. Nonosmotic diabetic cataracts. Pediaf. Res. 27, 293-296 (1990).
28. Reddy, V. N., Lin, L.-R., Giblin, F. J., Chakrapani, 6. and Yokohama, T. Study of the polyol pathway and cell permea- bility changes in human lens and retinal pigment epithelium in tissue culture. lnvesfigative Ophthalmology and Visual Science 33,2334-2339 (1992).
29. Merchant, T. E., Kasimos, J. N., de Graaf, P. W., Minsky, B. D., Gierke, L. W. and Glonek, T. Phospholipid profiles of human colon cancer using "P magnetic resonance spectroscopy. lnt. J. Colorecf. Dis. 6, 121-126 (1991).
30. Merchant, T. E., Characiejus, D., Kasimos, J. N., Den Otter, W., Gierke, L. W. and Glonek, T. Phosphodiesters in sapo- nified extracts of human breast and colon tumors using "P magnetic resonance spectroscopy. Magn. Reson. Med. 26,
31. Phan, S. C., Morotomi, M., Guillem, J. G., LoGerfo, P. and Weinstein, 6. Decreased levels of 1.2-sn-diacylglyceroI in human colon tumors. Cancer Res. 51,1571-1573 (1991).
32. Preece, N. E., Amor, S., Baker, D., Gadian, D. G., ONeill, J. K. and Urenjak, J. Experimental encephalomyelitis modulates inositol and taurine in the spinal cord of biozzi mice. Magn. Reson. Med. 32,692-697 (1994).
41 1-424 (1986).
2192-2198 (1986).
PhySiOl. 261, F957-F962 (1991).
132-140 (1992).
33. Narumi, K., Arita, M., Kitagawa, M., Kumazawa, A. and Tsumita, T. Gas chromatographic analysis of myo- and scyllo-inositols in animal tissues. Jap. J. Exp Med. 39,
34. Michaelis, T., Helms, G., Merboldt, K.-D., Hanicke, W., Bruhn, H. and Frahm, J. Identification of scyllo-inositol in proton NMR spectra of human brain in vivo. NMR Biomed. 6, 105-109 (1993).
35. Eisenberg, F. and Parthasarathy, R. Measurement of bio- synthesis of myo-inositol from glucose 6-phosphate. Meth.
36. Sherman, W. R., Stewart, M. A., Simpson, I? C. and Goodwin, S. L. The identification of myo-inosose-2 and scyllo-inositol in mammalian tissues. Biochemistry 7, 819-824 (1968).
37. Sherman, W. R., Stewart, M. A., Kurien, M. M. and Goodwin, S. L. The measurement of myo-inosose-2 and scyllo-inositol in mammalian tissues. Biochim. Biophys. Acra 158, 197-205 (1 968).
38. Hipps, P. P., Eveland, M. R., Laird, M. H. and Sherman, W. R. The identification of myo-inositol: NAD(P)+ oxidoreductase in mammalian brain. Biochem. Biophys. Res. Common. 68, 1133-1137 (1976).
39. Hipps, P. P., Ackermann, K. E. and Sherman, W. R. lnositol epimerase-inosose reductase from bovine brain. Meth. Enzymol. 89,593-598 (1982).
40. Hipps, P. P., Sehgal, R. K., Holland, W. H. and Sherman, W. R. Identification and partial characterization of inositol: NAD' epimerase and inosose: NAD(P)H reductase from the fat body of the American cockroach, Periplanefa americana L. Biochemistry 12,4705-4712 (1973).
41. Warburg, 0. Metabolism of Tumors. Arnold Constable. London (1930).
42. Bharghava, P. M. Regulation of cell division and malignant transformation. A new model for control by uptake of nutrients. J. Theoret. Biol. 68, 101-137 (1977).
43. Holley, R. W. A unifying hypothesis concerning the nature of malignant growth. Proc. Natn. Acad. Sci. USA 69,2840-2841 (1972).
44. Weber, M. J., Nakamura, K. D. and Salter, D. W. Molecular events leading to enhanced glucose transport in Rous sarcoma virus-transformed cells. Fed. Proc. 43, 2246-2250 (1984).
45. Cori, C. F. The glucose-lactic acid cycle and gluconeogene- sis. Curr. Top. Cell. Regul. 18,377-387 (1981).
46. Daly, P. F. and Cohen, J. S. Magnetic resonance spectros- copy of tumors and potential in vivo clinical applications: a review. Cancer Res. 49,770-779 (1989).
47. Cohen, J. S. Phospholipid and energy metabolism of cancer cells monitored by 31P magnetic resonance spectro- scopy: possible clinical significance. Mayo Clin. Proc. 63,
48. Ruiz-Cabello, J. and Cohen, J. S. Phospholipid metabolites as indicators of cancer cell function. NMR Biomed. 5, 226-233 (1992).
49. Smith, T. A. D., Eccles, S., Ormerod, M. G., Tombs, A. J., Titlev, J. C. and Leach, M. 0. The phosphocholine and glycerophosphocholine content of an oestrogen-sensitive rat mammary tumor correlates strongly with growth rate. Br. J. Cancer64.821-826 (1991).
50. Deschner, E. E. Kinetics of normal, preneoplastic and neoplastic Colonic Epithelium. In Colon Cancer Cells, ed. by M. P. Moyer and H. P. Poste, pp. 41-61. Academic Press, London (1990).
51. Kasimos, J., Merchant, T. E., Gierke, L. W. and Glonek, T. "P magnetic resonance spectroscopy of human colon cancer. Cancer Res. 50,527-532 (1990).
52. Deneke, S. M. and Fanburg, B. L. Regulation of cellular glutathione. Am. J. Physiol. 257, L163-L173 (1989).
53. de Kok, T. M. C. M., Hoor, F. ten and Kleinjans, J. C. S. Identification and quantitative distribution of eight ana- logues of naturally occuring fecapentaenes in human feces by high-performance liquid chromatography. Carcinogene-
54. Moorghen, M., Cairns, J., Forrester, L. M., Hayes, J. D., Hall, A., Cattan, A. R., Wolf, C. R. and Harris, A. L. Enhanced expression of glutathione S-transferases in colorectal carci- noma compared to non-neoplastic mucosa. Carcinogenesis
55. Clapper, M. L., Hoffman, S. J. and Tew, K. D. Glutathione S-
399-407 (1969).
EnZymOl. 141,127-134 (1987).
1 199-1 207 (1988).
SiS 12, 199-205 (1991).
12,13-17 (1991).
'H NMR SPECTRA OF PCA EXTRACTS OF COLONIC BIOPSIES 45
transferases in normal and malignant human colon tissue. Biochim. Biophys. Acta 1096,209-216 (1991).
56. Keshavarzian, A., Zapeda. D., List, T. and Mobarhan, S. High levels of reactive oxygen metabolites in colon cancer tissue: analysis by chemiluminescence probe. Nu& Cancer 17, 243-249 (1992).
57. Luk, G. D. and Casero, R. A. Polyamines in normal and cancer cells. Adv. Enzyme Regul. 26,91-105 (1987).
58. Pegg, A. E. Recent advances in the biochemistn/ of poly- amines in eucariotes. Biochem. J. 234,249-262 (1986).
59. Seiler, N. Polyamine metabolism. Digestion 46, 319-330 (1990).
60. Kingsnorth, A. N., Lumsden, A. B. and Wallace, H. M.
Polyamines in colorectal cancer. Br. J. Surg. 71, 791-794 (1984).
61. Berdinskikh, N. K., Ignatenko, N. A., Zaletok, S. R, Ganina, K. P. and Chorniy, V. A. Ornithine decarboxylase activity and polyamine content in adenocarcinomas of human stomach and large intestine. Int. J. Cancer 47, 496-498 (1991).
62. Elitsur, Y., Moshier, J. A., Murthy, R., Barbish, A. and Luk, G. D. Polyamine levels, ornithine decarboxylase (ODC) activity, and ODC-mRNA expression in normal and cancerous human colonocytes. Life Sci. 50,1417-1424 (1992).
63. Wang, J.-Y. and Johnson, L. R. Role of transglutaminase and protein cross-linking in the repair of mucosal stress ero- sions. Am. J. Physiol. 262, G818-G825 (1992).
Copyright © 2022 FDOKUMEN