Quantifying the functional responses of vegetation to drought and oxygen stress in temperate...
11
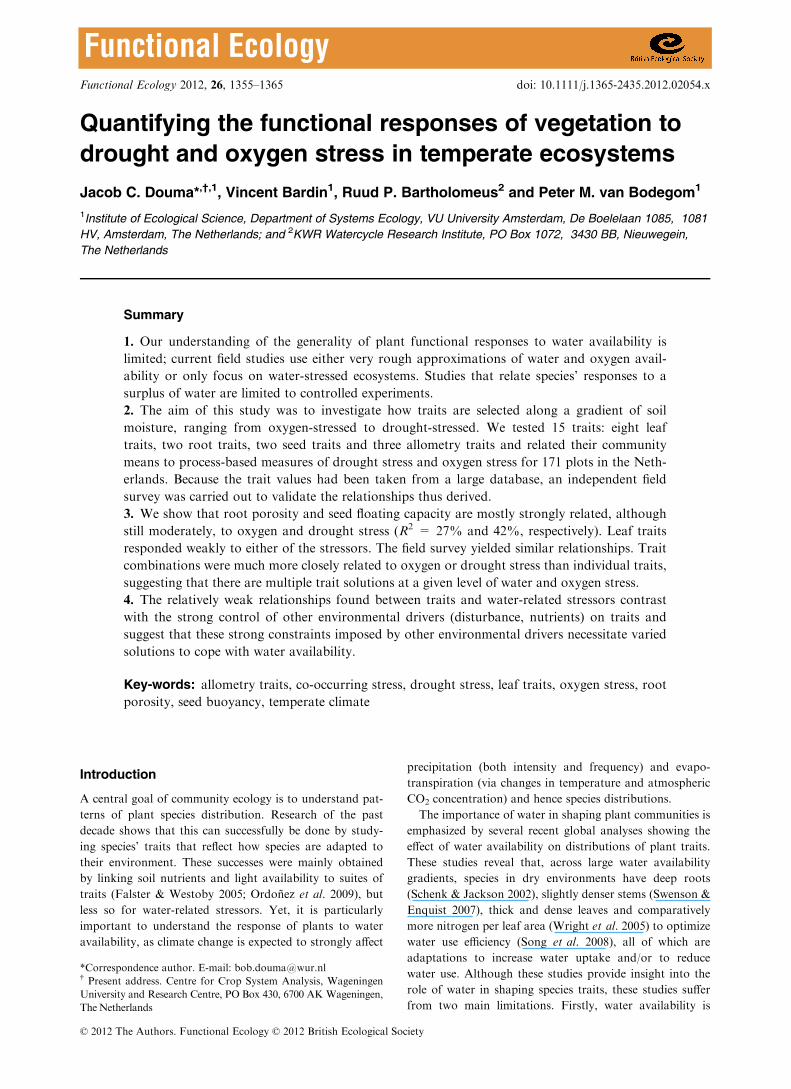
Quantifying the functional responses of vegetation to drought and oxygen stress in temperate ecosystems Jacob C. Douma* ,†,1 , Vincent Bardin 1 , Ruud P. Bartholomeus 2 and Peter M. van Bodegom 1 1 Institute of Ecological Science, Department of Systems Ecology, VU University Amsterdam, De Boelelaan 1085, 1081 HV, Amsterdam, The Netherlands; and 2 KWR Watercycle Research Institute, PO Box 1072, 3430 BB, Nieuwegein, The Netherlands Summary 1. Our understanding of the generality of plant functional responses to water availability is limited; current field studies use either very rough approximations of water and oxygen avail- ability or only focus on water-stressed ecosystems. Studies that relate species’ responses to a surplus of water are limited to controlled experiments. 2. The aim of this study was to investigate how traits are selected along a gradient of soil moisture, ranging from oxygen-stressed to drought-stressed. We tested 15 traits: eight leaf traits, two root traits, two seed traits and three allometry traits and related their community means to process-based measures of drought stress and oxygen stress for 171 plots in the Neth- erlands. Because the trait values had been taken from a large database, an independent field survey was carried out to validate the relationships thus derived. 3. We show that root porosity and seed floating capacity are mostly strongly related, although still moderately, to oxygen and drought stress (R 2 = 27% and 42%, respectively). Leaf traits responded weakly to either of the stressors. The field survey yielded similar relationships. Trait combinations were much more closely related to oxygen or drought stress than individual traits, suggesting that there are multiple trait solutions at a given level of water and oxygen stress. 4. The relatively weak relationships found between traits and water-related stressors contrast with the strong control of other environmental drivers (disturbance, nutrients) on traits and suggest that these strong constraints imposed by other environmental drivers necessitate varied solutions to cope with water availability. Key-words: allometry traits, co-occurring stress, drought stress, leaf traits, oxygen stress, root porosity, seed buoyancy, temperate climate Introduction A central goal of community ecology is to understand pat- terns of plant species distribution. Research of the past decade shows that this can successfully be done by study- ing species’ traits that reflect how species are adapted to their environment. These successes were mainly obtained by linking soil nutrients and light availability to suites of traits (Falster & Westoby 2005; Ordon˜ez et al. 2009), but less so for water-related stressors. Yet, it is particularly important to understand the response of plants to water availability, as climate change is expected to strongly affect precipitation (both intensity and frequency) and evapo- transpiration (via changes in temperature and atmospheric CO 2 concentration) and hence species distributions. The importance of water in shaping plant communities is emphasized by several recent global analyses showing the effect of water availability on distributions of plant traits. These studies reveal that, across large water availability gradients, species in dry environments have deep roots (Schenk & Jackson 2002), slightly denser stems (Swenson & Enquist 2007), thick and dense leaves and comparatively more nitrogen per leaf area (Wright et al. 2005) to optimize water use efficiency (Song et al. 2008), all of which are adaptations to increase water uptake and/or to reduce water use. Although these studies provide insight into the role of water in shaping species traits, these studies suffer from two main limitations. Firstly, water availability is *Correspondence author. E-mail: [email protected] † Present address. Centre for Crop System Analysis, Wageningen University and Research Centre, PO Box 430, 6700 AK Wageningen, The Netherlands © 2012 The Authors. Functional Ecology © 2012 British Ecological Society Functional Ecology 2012, 26, 1355–1365 doi: 10.1111/j.1365-2435.2012.02054.x
-
Upload
independent -
Category
Documents
-
view
0 -
download
0
Transcript of Quantifying the functional responses of vegetation to drought and oxygen stress in temperate...
Quantifying the functional responses of vegetation todrought and oxygen stress in temperate ecosystemsJacob C. Douma*,†,1, Vincent Bardin1, Ruud P. Bartholomeus2 and Peter M. van Bodegom1
1Institute of Ecological Science, Department of Systems Ecology, VU University Amsterdam, De Boelelaan 1085, 1081HV, Amsterdam, The Netherlands; and 2KWR Watercycle Research Institute, PO Box 1072, 3430 BB, Nieuwegein,The Netherlands
Summary
1. Our understanding of the generality of plant functional responses to water availability is
limited; current field studies use either very rough approximations of water and oxygen avail-
ability or only focus on water-stressed ecosystems. Studies that relate species’ responses to a
surplus of water are limited to controlled experiments.
2. The aim of this study was to investigate how traits are selected along a gradient of soil
moisture, ranging from oxygen-stressed to drought-stressed. We tested 15 traits: eight leaf
traits, two root traits, two seed traits and three allometry traits and related their community
means to process-based measures of drought stress and oxygen stress for 171 plots in the Neth-
erlands. Because the trait values had been taken from a large database, an independent field
survey was carried out to validate the relationships thus derived.
3. We show that root porosity and seed floating capacity are mostly strongly related, although
still moderately, to oxygen and drought stress (R2 = 27% and 42%, respectively). Leaf traits
responded weakly to either of the stressors. The field survey yielded similar relationships. Trait
combinations were much more closely related to oxygen or drought stress than individual traits,
suggesting that there are multiple trait solutions at a given level of water and oxygen stress.
4. The relatively weak relationships found between traits and water-related stressors contrast
with the strong control of other environmental drivers (disturbance, nutrients) on traits and
suggest that these strong constraints imposed by other environmental drivers necessitate varied
solutions to cope with water availability.
Key-words: allometry traits, co-occurring stress, drought stress, leaf traits, oxygen stress, root
porosity, seed buoyancy, temperate climate
Introduction
A central goal of community ecology is to understand pat-
terns of plant species distribution. Research of the past
decade shows that this can successfully be done by study-
ing species’ traits that reflect how species are adapted to
their environment. These successes were mainly obtained
by linking soil nutrients and light availability to suites of
traits (Falster & Westoby 2005; Ordonez et al. 2009), but
less so for water-related stressors. Yet, it is particularly
important to understand the response of plants to water
availability, as climate change is expected to strongly affect
precipitation (both intensity and frequency) and evapo-
transpiration (via changes in temperature and atmospheric
CO2 concentration) and hence species distributions.
The importance of water in shaping plant communities is
emphasized by several recent global analyses showing the
effect of water availability on distributions of plant traits.
These studies reveal that, across large water availability
gradients, species in dry environments have deep roots
(Schenk & Jackson 2002), slightly denser stems (Swenson &
Enquist 2007), thick and dense leaves and comparatively
more nitrogen per leaf area (Wright et al. 2005) to optimize
water use efficiency (Song et al. 2008), all of which are
adaptations to increase water uptake and/or to reduce
water use. Although these studies provide insight into the
role of water in shaping species traits, these studies suffer
from two main limitations. Firstly, water availability is
*Correspondence author. E-mail: [email protected]† Present address. Centre for Crop System Analysis, Wageningen
University and Research Centre, PO Box 430, 6700 AK Wageningen,
TheNetherlands
© 2012 The Authors. Functional Ecology © 2012 British Ecological Society
Functional Ecology 2012, 26, 1355–1365 doi: 10.1111/j.1365-2435.2012.02054.x

estimated only approximately, for example, by mean annual
precipitation or potential/actual evapotranspiration or
combinations of these, neglecting local hydrology and other
factors such as soil water-holding capacity (Schenk & Jack-
son 2002; Wright et al. 2005; Moles et al. 2009 among oth-
ers). Secondly, these global studies mainly show the effects
of drought on species traits because wetlands and wetland
species are absent in these analyses. Regional-level studies
tend to apply more accurate measures of soil moisture (such
as soil water content), but have mostly been carried out in
ecosystems with a (severe) drought period, see, for example,
Cornwell & Ackerly (2009), with a notable exception of
Ordonez et al. (2010a,b).
At the other end of the water availability gradient, that
is, where there is a surplus of water, plants have to deal with
a shortage of oxygen in the soil, which requires a rather dif-
ferent set of adaptations (known as aeration stress or oxy-
gen stress, hereafter called oxygen stress, Voesenek et al.
2006; Niinemets & Valladares 2006). As a consequence,
niche segregation takes place because different adaptations
are needed for oxygen stress and drought stress (Silvertown
et al. 1999). Important adaptations to cope with oxygen
stress are the formation of aerenchyma (both in shoots and
roots, Jackson & Armstrong 1999), enhanced shoot elonga-
tion (Voesenek et al. 2004) and increased anaerobic meta-
bolism. Most studies investigating the effect of oxygen
stress on plant traits focus on the physiological mechanisms
of adaptation (Engelaar et al. 1993; Blom & Voesenek 1996
among others) and use controlled experiments to test spe-
cies response to flooding (Visser, Blom & Voesenek 1996;
Visser et al. 2000; Mommer, Pons & Visser 2006). In con-
trast, the number of ecological field studies on trait
responses is highly limited (but see van Eck et al. 2004). As
a result, the responses of plant traits to field gradients of
water availability remain unclear.
The aim of this study is to investigate how plants
respond along a gradient of soil water availability ranging
from oxygen-stressed (waterlogged) to drought-stressed
(groundwater independent) through a suite of commonly
measured plant traits. To separate those effects, direct
measures of both oxygen and drought stress were used as
explanatory variables in this study. The response of species
to soil water and soil oxygen availability is tested on eco-
systems within the temperate biome because in this cli-
matic zone a broad gradient from drought-stressed to
water-stressed can be found.
Materials and methods
GENERAL APPROACH
We combined species composition data from plots distributed
across a broad water availability gradient with a species–traitdatabase to calculate community-level trait means for a variety of
traits. We then constructed a (linear) regression model relating
these traits (singly and in combination) to site-level measures of
drought and oxygen stress. Finally, to independently validate the
modelled relationships, we conducted a field survey of community
trait means across a water availability gradient within a single
dune–valley complex.
PLOT SELECT ION
To test the effect of water availability on the functional composi-
tion of species assemblages, one needs combined measurements of
water availability and species composition across the water gradi-
ent. The only data set available that spanned this whole range is
from Bartholomeus et al. 2011a; who simulated oxygen and
drought stress for the data of Runhaar (1989), De Jong (1997),
Jansen et al. (2000), Jansen & Runhaar (2005), Hommel et al.
(2007). Altogether, the data set contained information about spe-
cies composition, soil physical properties and water supply in 171
plots from natural ecosystems throughout the Netherlands. The
mean summer temperature in the Netherlands is 16�4 °C, the
mean winter temperature is 3�2 °C, the mean annual precipitation
is 754 mm (locally varying from 831 to 712 mm) and the precipi-
tation surplus is 191 mm (locally varying from 125 to 250 mm).
The precipitation deficit during the growing season (April–August)
is 122 mm (Royal Netherlands Meteorological Institute (KNMI);
www.knmi.nl). Together, the plots covered a range from dry to
wet, nutrient-poor to nutrient-rich and frequently disturbed to
undisturbed ecosystems. None of the plots had had experienced
any major changes in hydrological conditions in the years before
the plots were sampled.
EST IMATES OF WATER AVAILAB IL ITY : OXYGEN
STRESS AND DROUGHT STRESS
Although water is essential for plant growth, a shortage will limit
photosynthesis and plant transpiration, while a surplus limits dif-
fusion of oxygen to roots and hence limits respiration and the
metabolic activity of plants. Groundwater levels alone do not fully
represent the moisture conditions, and consequently, oxygen and
drought stress, in the root zone. Therefore, to test the effects of
each component, individual measures of oxygen and drought
stressors were applied. We calculated process-based oxygen and
drought stress for terrestrial vegetation plots from a variety of nat-
ural habitats. We used the reductions in respiration and transpira-
tion because of low oxygen and water availability, respectively, to
characterize these stresses. As a result, respiration reduction
includes effects of both extreme rainfall events and high tempera-
tures, known to affect vegetation composition (Sojka, Joseph &
Stolzy 1972; Drew 1983). Transpiration reduction accounts for the
effects of both prolonged dry periods and high atmospheric
demand for plant transpiration, that is, factors that determine
drought stress of plants (Porporato, Daly & Rodriguez-Iturbe
2004).
For an unbiased comparison of oxygen and drought stress
between sites, and following Dyer (2009), we simulated the daily
respiration and transpiration reduction for a hypothetical refer-
ence vegetation instead of the actual vegetation. By doing so, we
obtained stress measures that reflect the soil moisture and oxygen
status, independent of the actual vegetation. The use of a reference
vegetation improves the applicability of models in which stress
measures are implemented (Dyer 2009). By adaptation, the natural
vegetation reduces stress. Hence, poor relations between the actual
stress and vegetation characteristics are expected, although quanti-
fying actual stress would be useful when aiming at calculating
fluxes of, for example, water and carbon. Our reference vegetation
is defined as a temperate natural grassland not adapted to oxygen
and drought stress, that is, a grassland as defined by Van Dam
(2000) and Bartholomeus et al. (2008b).
Oxygen stress, defined as the reduction in root respiration rela-
tive to respiration under optimal soil aeration, is a function of soil
© 2012 The Authors. Functional Ecology © 2012 British Ecological Society, Functional Ecology, 26, 1355–1365
1356 J. C. Douma et al.
texture, soil organic matter content, gas-filled porosity and soil
temperature (Bartholomeus et al. 2008b, 2011b). In the Nether-
lands, with its rather shallow groundwater tables, these variables
greatly depend on the groundwater table depth, soil type and soil
temperature. Daily groundwater levels were calculated from fort-
nightly series of groundwater levels measured with piezometers
located in or closely to the plots (www.dinoloket.nl). These
observed groundwater levels were first interpolated to daily values
and then extrapolated to a 30-year period (1971–2000) with the
help of the impulse–response (impulse = precipitation and refer-
ence evapotranspiration and response = groundwater levels; cli-
mate data were taken from the KNMI) software Menyanthes
(Von Asmuth, Bierkens & Maas 2002). As is shown by Bartho-
lomeus et al. (2008a), a 30-year time frame of daily values is
needed to obtain a robust estimate of the moisture conditions of a
particular plot. These daily values were subsequently used in a
detailed soil–water–atmosphere–plant model (SWAP, Van Dam
et al. 2008) together with soil texture, air temperature, rainfall and
evapotranspiration data to calculate gas-filled porosity and soil
temperature for different layers in the soil profile. These variables
were used in an additional model to calculate actual and potential
root respiration (Bartholomeus et al. 2008b). A difference between
potential and actual root respiration under the influence of an
oxygen deficiency in the root zone indicates the potential oxygen
stress experienced by a plant. The yearly maximum respiration
reduction in a 10-day period averaged across 30 years was taken
as a measure of oxygen stress (OS–kg O2 m�2 10 day�1). For a
detailed description and justification of this procedure, see Bartho-
lomeus et al. (2011a,b)
Drought stress was calculated as the reduction in potential
plant transpiration relative to conditions where they transpire at
potential rate (sufficient supply of water to meet the demands), as
determined by global radiation, air humidity, wind speed, air tem-
perature and atmospheric CO2 concentration. The transpiration is
reduced when water becomes limited. This reduction in transpira-
tion was calculated for the same reference vegetation as used for
the OS calculations. Analogous to the OS measure, drought stress
was defined as the yearly maximum reduction in a 10-day period
averaged across 30 years (DS–m 10 day�1). For a detailed
description and justification of this procedure, see Bartholomeus
et al. (2011a).
Our measures of oxygen and drought stress have been shown to
be strongly related to the fractions of xerophytes and hygrophytes
in a vegetation plot (Bartholomeus et al. 2011a) and have been
used with success in a vegetation model to predict vegetation
distribution (Douma et al. (2012c).
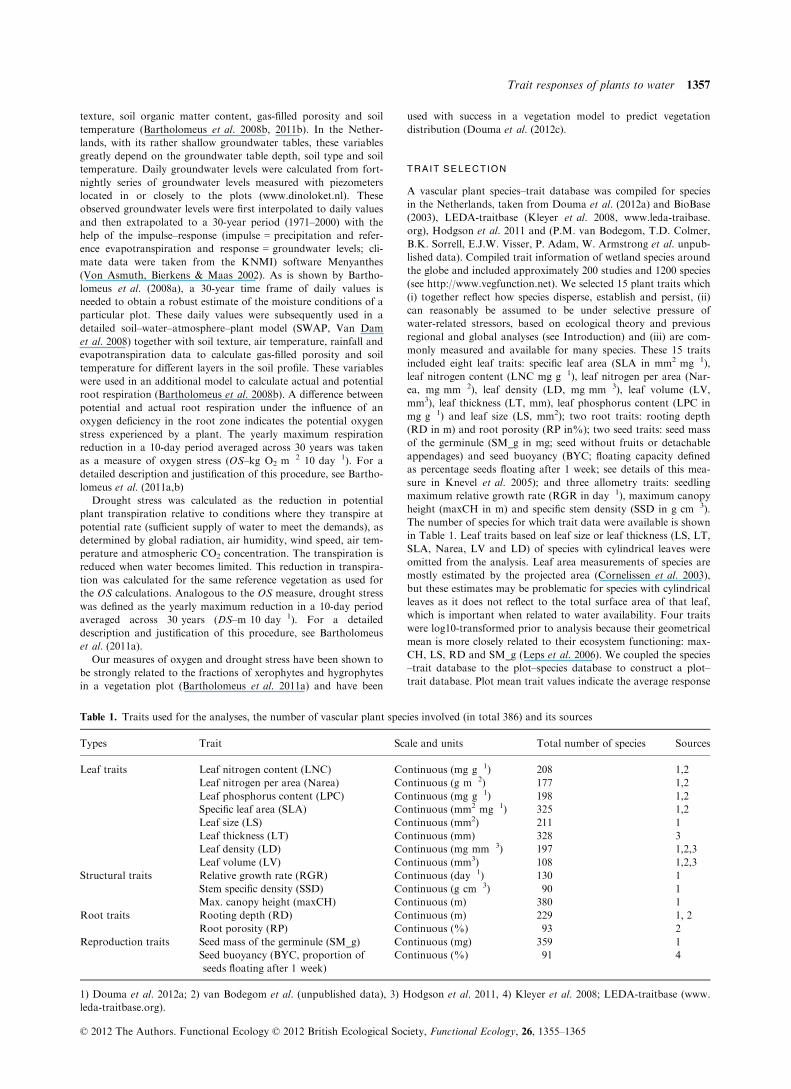
TRA IT SELECT ION
A vascular plant species–trait database was compiled for species
in the Netherlands, taken from Douma et al. (2012a) and BioBase
(2003), LEDA-traitbase (Kleyer et al. 2008, www.leda-traibase.
org), Hodgson et al. 2011 and (P.M. van Bodegom, T.D. Colmer,
B.K. Sorrell, E.J.W. Visser, P. Adam, W. Armstrong et al. unpub-
lished data). Compiled trait information of wetland species around
the globe and included approximately 200 studies and 1200 species
(see http://www.vegfunction.net). We selected 15 plant traits which
(i) together reflect how species disperse, establish and persist, (ii)
can reasonably be assumed to be under selective pressure of
water-related stressors, based on ecological theory and previous
regional and global analyses (see Introduction) and (iii) are com-
monly measured and available for many species. These 15 traits
included eight leaf traits: specific leaf area (SLA in mm2 mg�1),
leaf nitrogen content (LNC mg g�1), leaf nitrogen per area (Nar-
ea, mg mm�2), leaf density (LD, mg mm�3), leaf volume (LV,
mm3), leaf thickness (LT, mm), leaf phosphorus content (LPC in
mg g�1) and leaf size (LS, mm2); two root traits: rooting depth
(RD in m) and root porosity (RP in%); two seed traits: seed mass
of the germinule (SM_g in mg; seed without fruits or detachable
appendages) and seed buoyancy (BYC; floating capacity defined
as percentage seeds floating after 1 week; see details of this mea-
sure in Knevel et al. 2005); and three allometry traits: seedling
maximum relative growth rate (RGR in day�1), maximum canopy
height (maxCH in m) and specific stem density (SSD in g cm�3).
The number of species for which trait data were available is shown
in Table 1. Leaf traits based on leaf size or leaf thickness (LS, LT,
SLA, Narea, LV and LD) of species with cylindrical leaves were
omitted from the analysis. Leaf area measurements of species are
mostly estimated by the projected area (Cornelissen et al. 2003),
but these estimates may be problematic for species with cylindrical
leaves as it does not reflect to the total surface area of that leaf,
which is important when related to water availability. Four traits
were log10-transformed prior to analysis because their geometrical
mean is more closely related to their ecosystem functioning: max-
CH, LS, RD and SM_g (Leps et al. 2006). We coupled the species
–trait database to the plot–species database to construct a plot–trait database. Plot mean trait values indicate the average response
Table 1. Traits used for the analyses, the number of vascular plant species involved (in total 386) and its sources
Types Trait Scale and units Total number of species Sources
Leaf traits Leaf nitrogen content (LNC) Continuous (mg g�1) 208 1,2
Leaf nitrogen per area (Narea) Continuous (g m�2) 177 1,2
Leaf phosphorus content (LPC) Continuous (mg g�1) 198 1,2
Specific leaf area (SLA) Continuous (mm2 mg�1) 325 1,2
Leaf size (LS) Continuous (mm2) 211 1
Leaf thickness (LT) Continuous (mm) 328 3
Leaf density (LD) Continuous (mg mm�3) 197 1,2,3
Leaf volume (LV) Continuous (mm3) 108 1,2,3
Structural traits Relative growth rate (RGR) Continuous (day�1) 130 1
Stem specific density (SSD) Continuous (g cm�3) 90 1
Max. canopy height (maxCH) Continuous (m) 380 1
Root traits Rooting depth (RD) Continuous (m) 229 1, 2
Root porosity (RP) Continuous (%) 93 2
Reproduction traits Seed mass of the germinule (SM_g) Continuous (mg) 359 1
Seed buoyancy (BYC, proportion of
seeds floating after 1 week)
Continuous (%) 91 4
1) Douma et al. 2012a; 2) van Bodegom et al. (unpublished data), 3) Hodgson et al. 2011, 4) Kleyer et al. 2008; LEDA-traitbase (www.
leda-traitbase.org).
© 2012 The Authors. Functional Ecology © 2012 British Ecological Society, Functional Ecology, 26, 1355–1365
Trait responses of plants to water 1357
of species to environmental drivers, given that species filtering
takes place at the community level (Ackerly & Cornwell 2007).
Therefore, plot mean traits were regressed against water and oxy-
gen stress in separate single regressions and their combined effect,
including interactions, in a multiple regression. Only those plots
that had trait information for at least five species were selected.
To obtain reliable parameter estimates, a weighted regression was
applied (Quinn & Keough 2002), weighing each plot by the
fraction of species that had a trait value.
VAL IDAT ION OF TRA IT –WATER RELAT IONSH IPS BY A
F IELD SURVEY
To test the generality of the relationships between OS, DS and trait
values and to evaluate potential biases because of the use of trait
values from databases (not accounting for trait plasticity or missing
trait information for particular species), a field survey was carried
out at 10 sites along a water gradient from wet to dry. To avoid
other confounding factors such as soil type and soil nutrient status,
the validation was carried out within one ecosystem. Dune slack val-
leys are very suitable for this validation as the water-table varies by
almost 2 m (from + 0�3 m + s.s. to �1�7 m + s.s.) within a distance
of 25–50 m. They are nutrient poor, and the parent material (sand)
does not change along this gradient. In total, two dune–valleys weresampled with five plots per valley that were equally distributed over
the water gradient. Within each plot (approximately 1–4 m2), the
five most dominant species were selected, assuming these species rep-
resent the local conditions best. In total, 48 species samples from 23
different species and 10 different sites were taken.
When available, five individuals of each dominant species were
selected for each site. For these species, a selected set of traits was
measured: specific leaf area (SLA; m2 kg�1), leaf nitrogen concen-
tration (LNC; mg g�1), leaf size (LS, mm2; including petiole), leaf
thickness (mm) and stem specific density (SSD; mg mm�3) were
determined at peak biomass (from mid-July until the end of
August) and measured following standardized protocols from
Cornelissen et al. (2003). In addition, root porosity (RP;%) was
determined. For this, non-woody roots attached to the stem of the
selected individual were dug up and removed. Samples, including
adherent soil particles, were packed in a moist paper bag and
inserted in a sealed plastic bag. Samples were transported in moist
paper and stored under cooled conditions. After collection, the
roots were washed and root porosity was determined on 1–3 g of
root material using the pycnometer procedure, as described by
Burdick (1989).
Groundwater levels were measured directly adjacent to the plots
at three occasions during the growing season. Two nearby located
piezometers were used, after accounting for the differences in soil
surface height, as reference for the long term groundwater dynam-
ics in that plot. Drought stress and oxygen stress were calculated
following the same procedure as described in the section ‘Esti-
mates of water availability: Oxygen stress and drought stress’.
Nutrient availability, as approximated by C : N ratio, was homo-
geneous across the plots (results not shown).
We tested to what extent the slopes and intercepts of the regres-
sions derived from the database and the in situ trait validation dif-
fered. This was tested as follows: a dummy variable (0 and 1 for
the two data sets, respectively) was included in the regression:
Y = a*X + b + c*group + d*group*X. If the slope of the subset is
significantly different from the full set, then the parameter d will
be significantly different from zero. Likewise, significant differ-
ences in the intercept are shown by c being significantly different
from zero. Also here, plots were weighted by the fraction of spe-
cies that had a trait value. The plots from the field survey were
assigned maximal weights (1) because in situ measurements were
used. The dummy regression was only performed for oxygen stress
as drought stress did not vary sufficiently among the plots for a
meaningful analysis. Note that neither the sites, nor the in situ
trait measurements were used for the database predictions and
therefore the validation is strictly independent of the database
predictions.
Finally, to test whether oxygen stress and drought stress lead to
the selection of a suite of traits, a multiple regression was run on
the database observations with oxygen stress or drought stress as
dependent and the traits as predictor. A backward stepwise regres-
sion was run to obtain a minimal model with high predictive
power (of the models with lowest AIC, the model with highest
adjusted R2 was selected). As LNC and LPC were highly corre-
lated (r = 0�87), LPC was omitted in this analysis.
Results
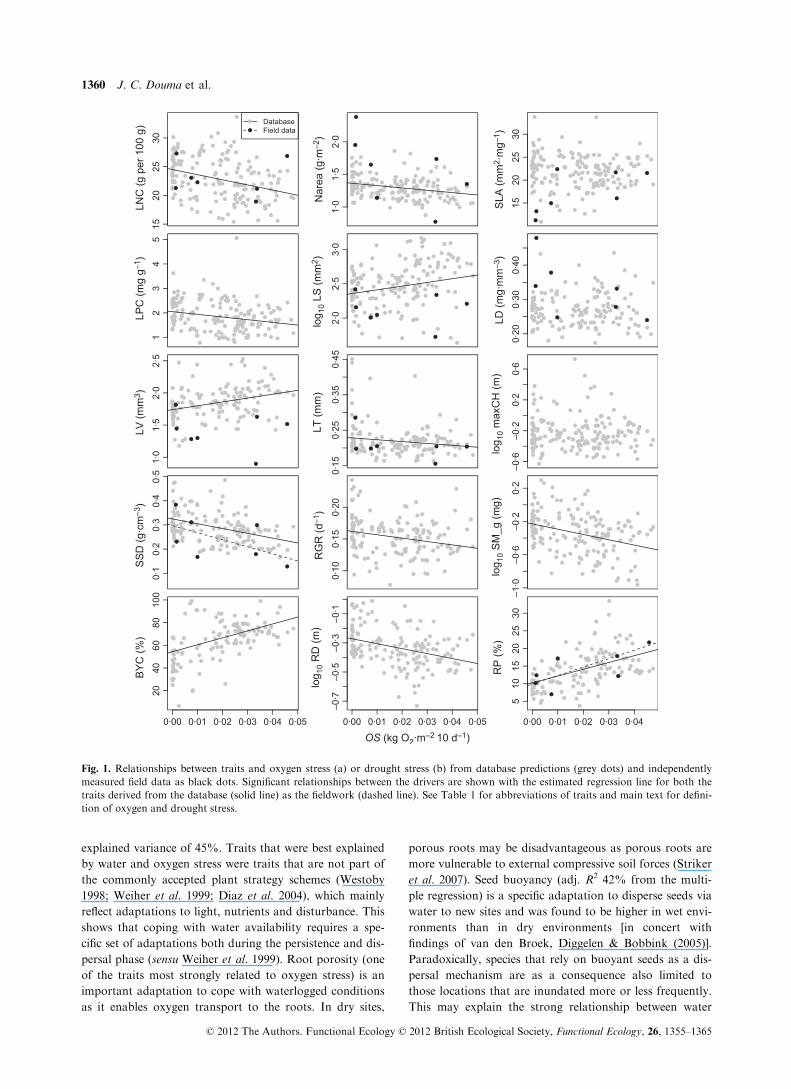
Root porosity showed the strongest correlation of all traits
to oxygen stress (R2 = 0�24), followed by seed buoyancy
(R2 = 0�22, Fig. 1a, Table 2; for full details see Appendix
S1, Tables 1 and 2 in the Supporting Information). The
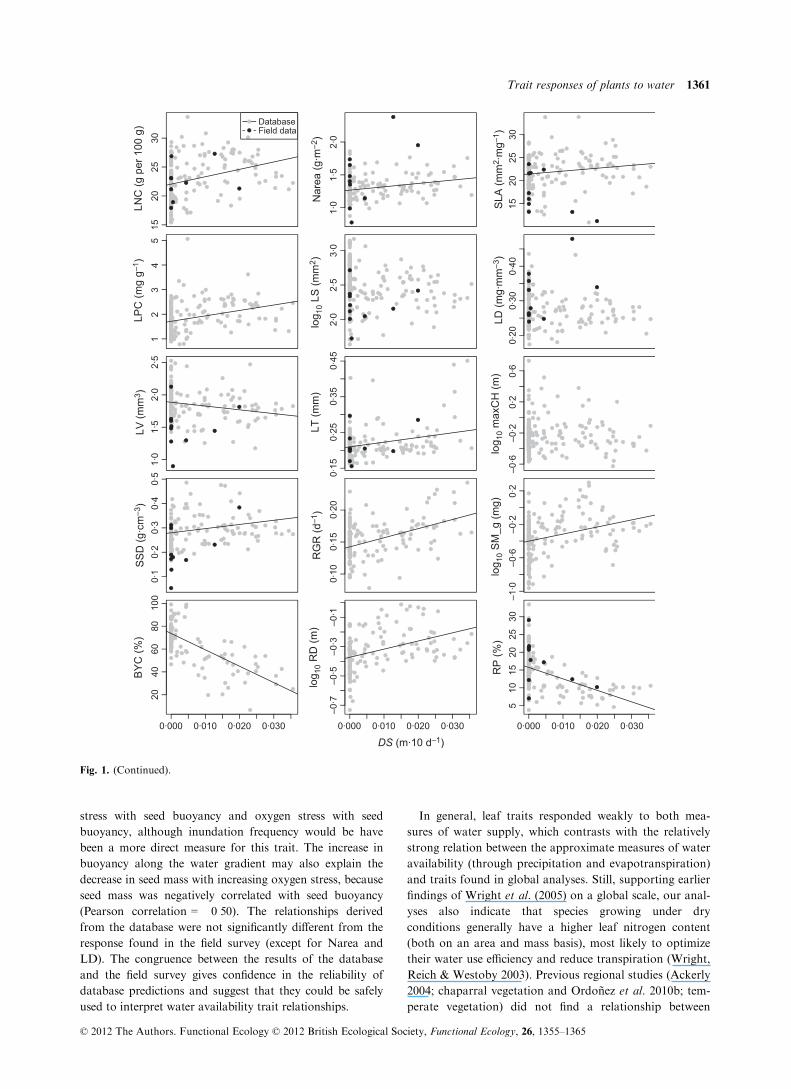
response of both traits to drought stress was even stronger
(R2 = 0�25 and 0�45, respectively, Fig. 1b, Table 2); root
porosity and seed buoyancy increased with increasing oxy-
gen stress and decreased with increasing drought stress.
Note that the results for seed buoyancy need to be inter-
preted with care; see Appendix S2, Supporting informa-
tion. In addition, rooting depth, relative growth rate and
stem specific density consistently showed a significant neg-
ative response to oxygen and a positive response to
drought stress. Leaf traits showed a much weaker response
to both of the stressors. Leaf nitrogen, both on a mass and
area basis, showed a negative response to oxygen stress
and positive to drought stress (Table 2 and Fig. 1a,b). In
contrast, SLA did not respond significantly to oxygen
stress and had a weak response to drought stress (margin-
ally significant, P = 0�04). Leaf size was consistently lower
at dry sites compared with wet sites, although this relation-
ship was rather weak for oxygen stress and not significant
for drought stress. Leaf thickness was positively related to
drought stress (a quadratic relationship between leaf thick-
ness and oxygen stress did not perform better than a linear
one). Leaf density did not respond significantly to either
stressor. Leaf volume showed a weak positive relationship
with oxygen stress. Maximum canopy height was not
related to either oxygen or drought stress. Seed mass
showed a negative, although weak, response to oxygen
stress (and the reverse relationship with drought stress).
The combination of the single effects of oxygen stress and
water stress were significant for only two traits: relative
growth rate and root porosity. (Appendix S1, Table 3, Sup-
porting information). In contrast, the interaction between
oxygen stress and drought stress was significant for many
more traits: LNC, LPC, SM_g, RD and LT. This shows
that although water and oxygen stress are highly correlated
(�0�75), their curvilinear relationship (Appendix S3, Fig. 1,
Supporting information) means that the degree of response
of species to drought stress depends on the level of oxygen
stress, and vice versa. The results suggest that at a given level
of one stressor, the response of species from sites with high
co-occurring stress, the traits are modified in the direction of
© 2012 The Authors. Functional Ecology © 2012 British Ecological Society, Functional Ecology, 26, 1355–1365
1358 J. C. Douma et al.
the response of the other stressor. For example, a high level
of oxygen stress and a co-occurring high level of drought
stress lead to higher leaf nitrogen and phosphorus content,
heavier seeds, thicker leaves and deeper roots than when
examined for oxygen stress alone.
The regression analysis of the in situ trait validation
measurements had a much smaller power (because of
lower number of observations) and was significant only for
the two traits most strongly related to oxygen stress in the
database analysis (i.e. root porosity and stem specific den-
sity, Table 3). However, in these cases the R2-values of the
regression were much higher compared with the R2-values
of the database analysis, showing a tight relationship when
accounting for potentially confounding factors.
Comparing the slopes of the regression equations for
both datasets showed that the relationships derived from
the validation set were not significantly different from the
database derived relationships, except for Narea and leaf
density (both slope and intercept) and SLA and leaf vol-
ume (intercept only), see Appendix S1, Table 4, Support-
ing information for details. All traits that had been more
strongly coupled to oxygen and drought stress (LNC, RP,
SSD) showed no significant differences.
A multiple regression to test how traits are collectively
selected by oxygen or drought stress showed that a combi-
nation of traits can explain the impacts of water and oxy-
gen availability well. The best model (AIC = �647�94, d.f. = 87), consisted of seven traits SSD, LNC, LD, RGR,
LS, RP and BYC and explained up to 67% of the varia-
tion in oxygen stress (Table 4), compared with 24% for
the single trait with the highest predictive power RP. In
contrast to what would be expected from the single regres-
sions, not RP but SSD, BYC and LNC were the most
important in explaining the variation in oxygen stress. A
model without BYC resulted in similar standardized coeffi-
cients for the other traits (Appendix S2, Table 1, Support-
ing information). The variation in drought stress (64%,
Table 5) was best explained by BYC, RP, Narea, RD,
SLA, SSD, LD and LT and was again much higher than
the predictive power of the best single trait (43%,
AIC = �1101�79, d.f. = 102). Here, BYC and RP were the
most important in explaining drought stress as they were
in the single regressions. A model without BYC resulted in
similar standardized coefficients for the other traits
(Appendix S2, Table 2, Supporting information).
As the predictors were measured at different scales, for
all regressions standardized regression coefficients were
calculated to assess the relative effects (effect sizes) of
the different predictors on the response variable (Quinn
& Keough 2002). All analyses were performed in
R (R Development Core Team 2009).
Discussion
To our knowledge, this is the first field study that simulta-
neously quantifies the role of oxygen and drought stress on
trait selection in species assemblages along a gradient of
dry to wet ecosystems. Both the database analysis and the
field survey validation consistently showed that across a
range of dry to wet ecosystems within the temperate biome
the functional characteristics of species assemblages can
partly be explained by the combined action of water and
oxygen stress. Root porosity and seed buoyancy appeared
to be particularly affected by differences in water availabil-
ity, while leaf traits responded only weakly to either stress
measure.
CONSISTENT BUT WEAK RESPONSE OF IND IV IDUAL
TRA ITS TO WATER AND OXYGEN STRESS
Individual traits showed only a moderately strong response
to water and oxygen stress: none of the traits exceeded an
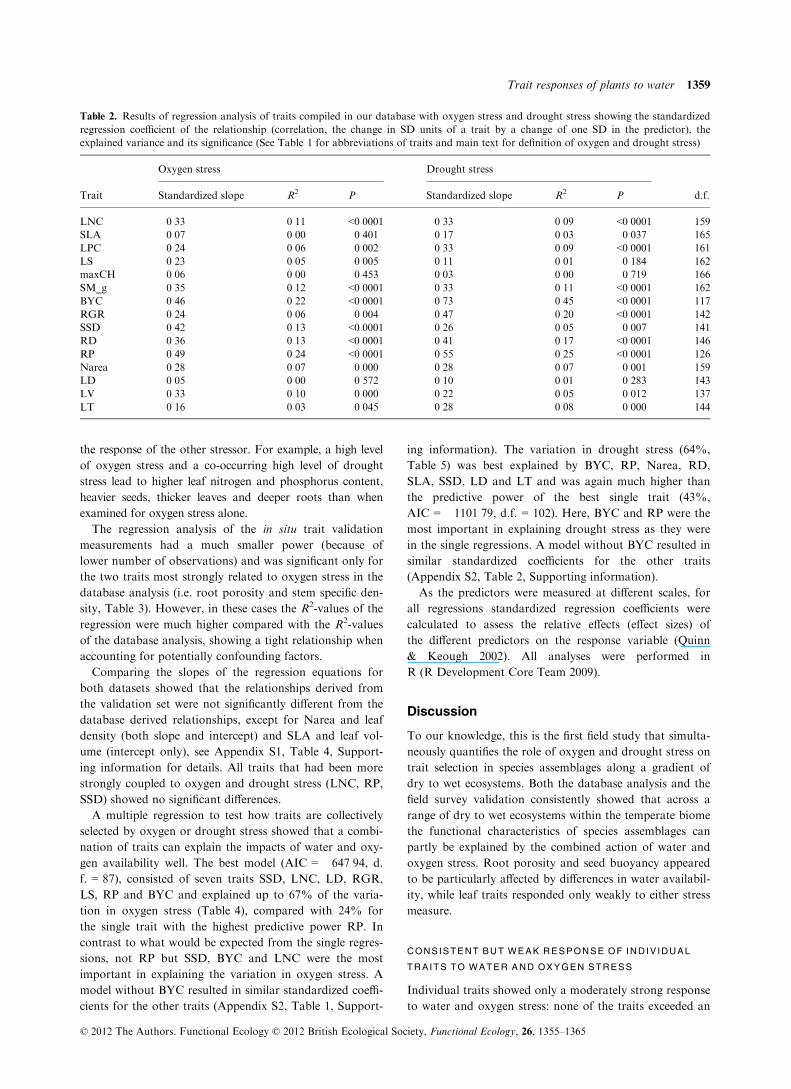
Table 2. Results of regression analysis of traits compiled in our database with oxygen stress and drought stress showing the standardized
regression coefficient of the relationship (correlation, the change in SD units of a trait by a change of one SD in the predictor), the
explained variance and its significance (See Table 1 for abbreviations of traits and main text for definition of oxygen and drought stress)
Trait
Oxygen stress Drought stress
d.f.Standardized slope R2 P Standardized slope R2 P
LNC �0�33 0�11 <0�0001 0�33 0�09 <0�0001 159
SLA �0�07 0�00 0�401 0�17 0�03 0�037 165
LPC �0�24 0�06 0�002 0�33 0�09 <0�0001 161
LS 0�23 0�05 0�005 �0�11 0�01 0�184 162
maxCH �0�06 0�00 0�453 �0�03 0�00 0�719 166
SM_g �0�35 0�12 <0�0001 0�33 0�11 <0�0001 162
BYC 0�46 0�22 <0�0001 �0�73 0�45 <0�0001 117
RGR �0�24 0�06 0�004 0�47 0�20 <0�0001 142
SSD 0�42 0�13 <0�0001 0�26 0�05 0�007 141
RD �0�36 0�13 <0�0001 0�41 0�17 <0�0001 146
RP 0�49 0�24 <0�0001 �0�55 0�25 <0�0001 126
Narea �0�28 0�07 0�000 0�28 0�07 0�001 159
LD 0�05 0�00 0�572 �0�10 0�01 0�283 143
LV 0�33 0�10 0�000 �0�22 0�05 0�012 137
LT �0�16 0�03 0�045 0�28 0�08 0�000 144
© 2012 The Authors. Functional Ecology © 2012 British Ecological Society, Functional Ecology, 26, 1355–1365
Trait responses of plants to water 1359
explained variance of 45%. Traits that were best explained
by water and oxygen stress were traits that are not part of
the commonly accepted plant strategy schemes (Westoby
1998; Weiher et al. 1999; Diaz et al. 2004), which mainly
reflect adaptations to light, nutrients and disturbance. This
shows that coping with water availability requires a spe-
cific set of adaptations both during the persistence and dis-
persal phase (sensu Weiher et al. 1999). Root porosity (one
of the traits most strongly related to oxygen stress) is an
important adaptation to cope with waterlogged conditions
as it enables oxygen transport to the roots. In dry sites,
porous roots may be disadvantageous as porous roots are
more vulnerable to external compressive soil forces (Striker
et al. 2007). Seed buoyancy (adj. R2 42% from the multi-
ple regression) is a specific adaptation to disperse seeds via
water to new sites and was found to be higher in wet envi-
ronments than in dry environments [in concert with
findings of van den Broek, Diggelen & Bobbink (2005)].
Paradoxically, species that rely on buoyant seeds as a dis-
persal mechanism are as a consequence also limited to
those locations that are inundated more or less frequently.
This may explain the strong relationship between water
Fig. 1. Relationships between traits and oxygen stress (a) or drought stress (b) from database predictions (grey dots) and independently
measured field data as black dots. Significant relationships between the drivers are shown with the estimated regression line for both the
traits derived from the database (solid line) as the fieldwork (dashed line). See Table 1 for abbreviations of traits and main text for defini-
tion of oxygen and drought stress.
© 2012 The Authors. Functional Ecology © 2012 British Ecological Society, Functional Ecology, 26, 1355–1365
1360 J. C. Douma et al.
stress with seed buoyancy and oxygen stress with seed
buoyancy, although inundation frequency would be have
been a more direct measure for this trait. The increase in
buoyancy along the water gradient may also explain the
decrease in seed mass with increasing oxygen stress, because
seed mass was negatively correlated with seed buoyancy
(Pearson correlation = �0�50). The relationships derived
from the database were not significantly different from the
response found in the field survey (except for Narea and
LD). The congruence between the results of the database
and the field survey gives confidence in the reliability of
database predictions and suggest that they could be safely
used to interpret water availability trait relationships.
In general, leaf traits responded weakly to both mea-
sures of water supply, which contrasts with the relatively
strong relation between the approximate measures of water
availability (through precipitation and evapotranspiration)
and traits found in global analyses. Still, supporting earlier
findings of Wright et al. (2005) on a global scale, our anal-
yses also indicate that species growing under dry
conditions generally have a higher leaf nitrogen content
(both on an area and mass basis), most likely to optimize
their water use efficiency and reduce transpiration (Wright,
Reich & Westoby 2003). Previous regional studies (Ackerly
2004; chaparral vegetation and Ordonez et al. 2010b; tem-
perate vegetation) did not find a relationship between
Fig. 1. (Continued).
© 2012 The Authors. Functional Ecology © 2012 British Ecological Society, Functional Ecology, 26, 1355–1365
Trait responses of plants to water 1361

LNC and water availability, probably because their water
gradient was narrower. SLA seems to have a more varied
response to differences in water availability. In our data
set, we did not find a significant relationship, and neither
did Ackerly (2004) for chaparral species, while Wright
et al. (2005) and Ordonez et al. (2010b) did find a positive
relationship between water availability and SLA. The dif-
ferential response of SLA to water availability is perhaps
because SLA is additionally dependent on other factors,
such as soil nutrients (Ordonez et al. 2009), disturbance
(Douma et al. 2012b) and growth form (Ordonez et al.
2010a). Despite the absence of a relationship between
SLA, leaf density and water availability, species at dry sites
had smaller but thicker leaves and therefore less volumi-
nous leaves than at sites with higher water availability, but
again this effect was only moderate.
The average trait response of plant communities to oxy-
gen and drought stress displayed an inverse relationship,
for example, an increase in oxygen stress leads to a
decrease in LNC, and an increase in drought stress leads
to an increase in LNC. This is probably because both
stressors are naturally correlated; sites with a high level of
oxygen stress are not likely to suffer from drought stress in
the same growing season. Interestingly, the effect of oxy-
gen stress on trait responses is dampened by co-occurring
high drought stress. In those cases, plants generally have
higher leaf nitrogen and phosphorus contents, heavier
seeds, thicker leaves and surprisingly deeper roots than
without co-occurring stress. This effect becomes stronger
upon rising levels of co-occurring stressors. Consequently,
species at sites with co-occurring stresses lack full adapta-
tion to either of the stresses, which may hamper species
performance relative to their performance on sites without
co-occurring stress (Silvertown et al. 1999; Niinemets &
Valladares 2006; Bartholomeus et al. 2011a).
ARE WE MEASURING THE WRONG TRA ITS?
This study tested, as a first step, the relationships of com-
monly measured traits to water and oxygen stress. A sur-
prising result was that most commonly measured plant
traits do not appear to be strongly constrained by water
and oxygen stress. There may be two explanations for the
relatively low explained variance of individual traits by
oxygen and drought stress. Firstly, as water availability
varies strongly in space and time, species have to adapt on
both short [e.g. closing of the stomata (seconds–hours)
and long time-scales (e.g. avoiding unfavourable periods
(months–years)]. Plants with different life-history strategies
may respond differently to variation in soil moisture within
a site (Blom & Voesenek 1996; Grubb 1998). As a result,
the community mean trait may be only weakly affected by
either of the stressors (van Ommen Kloeke et al. 2011).
Secondly, we may have measured the wrong traits. Other
traits, which are currently not available in databases and
which were not measured in the field because of time con-
straints, are probably more directly related to optimizing
water supply and transpiration and oxygen stress and res-
piration. For example, leaf size/twig size ratio and its
whole plant analogue leaf area/sapwood area ratio (West-
oby et al. 2002; Martinez-Vilalta et al. 2009) may be a bet-
ter indicator of transpirational demand and water supply.
In addition to traits that are related to root oxygen supply,
such as root porosity, traits related to oxygen demand in
Table 3. Results of regression analysis (standardized regression
coefficient, explained variance and significance respectively) of
traits that have been measured in the field and oxygen and
drought stress (See Table 1 for abbreviations of traits, Table 2 for
explanation of standardized regression coefficient and main text
for definition of oxygen and drought stress)
Trait
Oxygen stress
d.f.Standardized slope R2 P
LNC �0�28 0�08 0�47 7
SLA 0�40 0�16 0�25 8
LS 0�29 0�08 0�42 8
SSD �0�67 0�44 0�04 8
RP 0�81 0�65 0�01 8
LT 0�00 0�00 0�99 8
Narea �0�55 0�31 0�10 8
LD �0�54 0�29 0�11 8
LV 0�26 0�07 0�47 8
Table 4. Best multiple trait model to predict oxygen stress (see
Table 1 for abbreviations of traits). Stepwise backward selection.
R2adj = 0�67, AIC = �647�94, d.f. = 87. Standardized regression
coefficients and standardized standard errors are shown (see
Table 2 for full explanation of standardized regression coefficient)
Trait Standardized slope St. Std. Error P
SSD �0�47 0�08 <0�0001LNC �0�35 0�09 <0�001LD �0�12 0�08 0�13RGR 0�11 0�07 0�13LS 0�14 0�07 0�04RP 0�17 0�09 0�06BYC 0�45 0�08 <0�0001
Table 5. Best multiple trait model to predict drought stress (see
Table 1 for abbreviations of traits). Stepwise backward selection.
R2 adj = 0�64, AIC = �705�97, d.f. = 86. Standardized regression
coefficients and standardized standard errors are shown (see
Table 2 for full explanation)
Trait Standardized slope St. Std. Error P
BYC �0�60 0�08 <0�0001RP �0�29 0�09 <0�01Narea �0�09 0�08 0�24RD 0�10 0�07 0�18SLA 0�14 0�11 0�20SSD 0�23 0�08 0�01LD 0�25 0�11 0�02LT 0�26 0�08 <0�01
© 2012 The Authors. Functional Ecology © 2012 British Ecological Society, Functional Ecology, 26, 1355–1365
1362 J. C. Douma et al.
the root zone may also be strongly constrained by oxygen
stress. For example, root respiration is largely determined
by root nitrogen (Reich et al. 2008) and lowering root
nitrogen may provide an alternative way to deal with
reduced levels of oxygen in the soil.
Alternatively, traits relevant for coping with unfavour-
able periods probably would have been strongly related to
water and oxygen stress. For example, Raunkaier (Raunki-
aer 1934) showed that the position of the growth bud is a
trait demonstrating an adaptation to unfavourable condi-
tions, and as such, it could be an important trait to classify
both species and communities.. This view is supported by
regressing the percentage of helophytes in a community
(flowering parts above water and growth buds submerged)
against oxygen stress and therophytes (annuals, surviving
the critical period via seeds) against drought stress. This
analysis revealed that 51% and 20% of the variation in the
helophytes and therophytes could be explained by the level
of oxygen stress or drought stress. (for details see Appen-
dix S4, Supporting information).
ARE THERE MULT IPLE TRA IT SOLUT IONS TO COPE
WITH WATER SHORTAGE OR SURPLUS?
There is a large difference between the rather low
explained variance of the single regressions and the high
explained variance of the two multiple regressions that pre-
dicted oxygen and drought stress by a combination of
traits (67% and 64%, respectively). A combination of sev-
eral traits [BYC and SSD combined with one or two leaf
traits (and RP for oxygen stress)] contributed significantly
to explaining oxygen and drought stress. This shows that
at a given level of oxygen or drought stress, multiple func-
tional solutions seem to prevail across species assemblages.
These differences may be caused by differences in other
environmental drivers, for example, nutrients or distur-
bance that also co-determine trait composition of species
assemblages. Compared with water, disturbance and nutri-
ent availability have a relatively strong constraining effect
on traits. For example, Douma et al. (2012c) have shown
for the same temperate climate that the explained variance
of SSD by time since disturbance and LPC by soil C/P
ratio is 78% and 44%, respectively. In the case of SSD,
this implies that, assuming that disturbance and water
availability can vary independently, only 22% of the vari-
ance remains to be explained by water. Therefore, we
hypothesize that because of this strong coordination of
traits by disturbance and nutrients (Westoby et al. 2002;
Wright et al. 2004), multiple solutions for these traits are
needed to cope with a level of oxygen and drought stress.
In conclusion, the extent to which multiple solutions are
indeed a common way to deal with water availability, or
whether these results were because of the type of traits
selected during this study, remains to be seen. Future stud-
ies would benefit from estimating the relative effects of dif-
ferent environmental drivers on traits to further test this
hypothesis.
Acknowledgements
This study was carried out in the framework ‘Kennis voor Klimaat’ theme
3. We thank Flip Witte for his contribution in acquiring the plot database,
Han Runhaar and Staatsbosbeheer for providing their valuable data and
PWN Hubert Kivit for permission to do fieldwork in the Kennemerduinen.
Leaf thickness data were provided by Peter Wilson and other members of
the Unit of Comparative Plant Ecology and Department of Archaeology at
Sheffield University (see Hodgson et al. 2011). We thank the editor and an
anonymous reviewer for their constructive comments. Also thanks to James
Weedon for proofreading the manuscript.
References
Ackerly, D. (2004) Functional strategies of chaparral shrubs in relation to
seasonal water deficit and disturbance. Ecological Monographs, 74, 25–44.
Ackerly, D.D. & Cornwell, W.K. (2007) A trait-based approach to commu-
nity assembly: partitioning of species trait values into within- and
among-community components. Ecology Letters, 10, 135–145.Bartholomeus, R.P., Witte, J.P.M., van Bodegom, P.M. & Aerts, R.
(2008a) The need of data harmonization to derive robust empirical rela-
tionships between soil conditions and vegetation. Journal of Vegetation
Science, 19, 799–808.Bartholomeus, R.P., Witte, J.P.M., Van Bodegom, P.M., Van Dam, J.C. &
Aerts, R. (2008b) Critical soil conditions for oxygen stress to plant roots:
substituting the Feddes-function by a process-based model. Journal of
Hydrology, 360, 147–165.Bartholomeus, R.P., Witte, J.-P.M., van Bodegom, P.M., van Dam, J.C. &
Aerts, R. (2011a) Climate change threatens endangered plant species by
stronger and interacting water-related stresses. Journal of Geophysical
Research, 116, G04023.
Bartholomeus, R.P., Witte, J.-P.M., van Bodegom, P.M., van Dam, J.C.,
de Becker, P. & Aerts, R. (2011b) Process-based proxy of oxygen stress
surpasses indirect ones in predicting vegetation characteristics. Ecohy-
drology, DOI: 10.1002/eco.261.
Blom, C. & Voesenek, L. (1996) Flooding: the survival strategies of plants.
Trends in Ecology & Evolution, 11, 290–295.van den Broek, T., van Diggelen, R. & Bobbink, R. (2005) Variation in
seed buoyancy of species in wetland ecosystems with different flooding
dynamics. Journal of Vegetation Science, 16, 579–586.Burdick, D.M. (1989) Root aerenchyma development in spartina patens in
response to flooding. American Journal of Botany, 76, 777–780.Cornelissen, J.H.C., Lavorel, S., Garnier, E., Diaz, S., Buchmann, N., Gur-
vich, D.E., Reich, P.B., ter Steege, H., Morgan, H.D., van der Heijden,
M.G.A., Pausas, J.G. & Poorter, H. (2003) A handbook of protocols for
standardised and easy measurement of plant functional traits worldwide.
Australian Journal of Botany, 51, 335–380.Cornwell, W.K. & Ackerly, D.D. (2009) Community assembly and shifts in
plant trait distributions across an environmental gradient in coastal Cali-
fornia. Ecological Monographs, 79, 109–126.De Jong, A. (1997) IJking van de vochttoestand van de bodem met de vocht-
indicatie van de vegetatie, volgens het ecotopensysteem [Calibration of the
moisture conditions of the soil with the moisture indication of the vegeta-
tion according to the ecotope system]. Landbouw Universiteit Wagenin-
gen, Wageningen.
Diaz, S., Hodgson, J.G., Thompson, K., Cabido, M., Cornelissen, J.H.C.,
Jalili, A., Montserrat-Marti, G., Grime, J.P., Zarrinkamar, F., Asri, Y.,
Band, S.R., Basconcelo, S., Castro-Diez, P., Funes, G., Hamzehee, B.,
Khoshnevi, M., Perez-Harguindeguy, N., Perez-Rontome, M.C., Shirv-
any, F.A., Vendramini, F., Yazdani, S., Abbas-Azimi, R., Bogaard, A.,
Boustani, S., Charles, M., Dehghan, M., de Torres-Espuny, L., Falczuk,
V., Guerrero-Campo, J., Hynd, A., Jones, G., Kowsary, E., Kazemi-
Saeed, F., Maestro-Martinez, M., Romo-Diez, A., Shaw, S., Siavash, B.,
Villar-Salvador, P. & Zak, M.R. (2004) The plant traits that drive eco-
systems: evidence from three continents. Journal of Vegetation Science,
15, 295–304.Douma, J.C., Aerts, R., J.P.M, W., Bekker, R.M., Kunzmann, D., Mets-
elaar, K. & Van Bodegom, P.M. (2012a) A combination of functionally
different plant traits provides a means to quantitatively predict a broad
range of species assemblages in NW Europe. Ecograpy, 35, 364–373.Douma, J.C., Shipley, B., Witte, J.P.M., Aerts, R. & van Bodegom, P.M.
(2012b) Disturbance and resource availability act differently on the same
suite of plant traits: revisiting assembly hypotheses. Ecology, 93, 825–835.
© 2012 The Authors. Functional Ecology © 2012 British Ecological Society, Functional Ecology, 26, 1355–1365
Trait responses of plants to water 1363
Douma, J.C., Witte, J.P.M., Aerts, R., Bartholomeus, R.P., Ordonez, J.C.,
Olde Venterink, H., Wassen, M.J. & van Bodegom, P.M. (2012c)
Towards a functional basis for predicting vegetation patterns; incorpo-
rating plant traits in habitat distribution models. Ecography, 35, 294–305.
Drew, M.C. (1983) Plant injury and adaptation to oxygen deficiency in the
root environment: a review. Plant and Soil, 75, 179–199.Dyer, J. (2009) Assessing topographic patterns in moisture use and stress
using a water balance approach. Landscape Ecology, 24, 391–403.Engelaar, W.M.H.G., Vanbruggen, M.W., Vandenhoek, W.P.M., Huyser,
M.A.H. & Blom, C.W.P.M. (1993) Root porosities and radial oxygen
losses of Rumex and Plantago species as influenced by soil pore diameter
and soil aeration. New Phytologist, 125, 565–574.Falster, D.S. & Westoby, M. (2005) Alternative height strategies among 45
dicot rain forest species from tropical Queensland, Australia. Journal of
Ecology, 93, 521–535.Grubb, P.J. (1998) A reassessment of the strategies of plants which cope
with shortages of resources. Perspectives in Plant Ecology, Evolution and
Systematics, 1, 3–31.Hodgson, J.G., Montserrat-Martı, G., Charles, M., Jones, G., Wilson, P.,
Shipley, B., Sharafi, M., Cerabolini, B.E.L., Cornelissen, J.H.C., Band,
S.R., Bogard, A., Castro-Dıez, P., Guerrero-Campo, J., Palmer, C.,
Perez-Rontome, M.C., Carter, G., Hynd, A., Romo-Dıez, A., de Torres
Espuny, L. & Royo Pla, F. (2011) Is leaf dry matter content a better
predictor of soil fertility than specific leaf area? Annals of Botany, 108,
1337–1345.Hommel, P.W.F.M., Arts, G.H.P., Beets, C.P., Schipper, P.C., Smolders, A.
J.P. & De Waal, R.W. (2007) Naar een landelijke referentiesysteem voor
standplaatsbeschrijvingen van aquatische en grondwaterafhankelijke,
terrestrische plantengemeenschappen [To a national reference system for
site descriptions of aquatic and groundwater dependent terrestrial vegeta-
tion types]. Stratiotes, 35, 11–21.Jackson, M.B. & Armstrong, W. (1999) Formation of aerenchyma and the
processes of plant ventilation in relation to soil flooding and submer-
gence. Plant Biology, 1, 274–287.Jansen, P.C. & Runhaar, J. (2005) Toetsing van het verband tussen het aan-
deel xerofyten en de droogtestress onder verschillende omstandigheden
[Testing of the relationship between the covering of xerophytes and
drought stress under different conditions]. Alterra, Wageningen.
Jansen, P.C., Runhaar, J., Witte, J.P.M. & van Dam, J.C. (2000) Vochtindi-
catie van grasvegetaties in relatie tot de vochttoestand van de bodem
[Moisture indication of grass vegetations in relation to the moisture condi-
tions of the soil]. Alterra, Wageningen.
Kleyer, M., Bekker, R.M., Knevel, I.C., Bakker, J.P., Thompson, K.,
Sonnenschein, M., Poschlod, P., van Groenendael, J.M., Klimes, L.,
Klimesova, J., Klotz, S., Rusch, G.M., Hermy, M., Adriaens, D.,
Boedeltje, G., Bossuyt, B., Dannemann, A., Endels, P., Gotzenberger,
L., Hodgson, J.G., Jackel, A.K., Kuhn, I., Kunzmann, D., Ozinga, W.
A., Romermann, C., Stadler, M., Schlegelmilch, J., Steendam, H.J.,
Tackenberg, O., Wilmann, B., Cornelissen, J.H.C., Eriksson, O.,
Garnier, E. & Peco, B. (2008) The LEDA Traitbase: a database of life-
history traits of the Northwest European flora. Journal of Ecology, 96,
1266–1274.Knevel, I.C., Bekker, R.M., Kunzmann, D., Stadler, M. & Thompson, K.
(2005) The LEDA Traitbase Collecting and Measuring Standards of Life-
History Traits of the Northwest European Flora. Scholma Druk. B.V.,
Bedum, The Netherlands.
Leps, J., de Bello, F., Lavorel, S. & Berman, S. (2006) Quantifying and
interpreting functional diversity of natural communities: practical con-
siderations matter. Preslia, 78, 481–501.Martinez-Vilalta, J., Cochard, H., Mencuccini, M., Sterck, F., Herrero, A.,
Korhonen, J.F.J., Llorens, P., Nikinmaa, E., Nole, A., Poyatos, R.,
Ripullone, F., Sass-Klaassen, U. & Zweifel, R. (2009) Hydraulic adjust-
ment of Scots pine across Europe. New Phytologist, 184, 353–364.Moles, A.T., Warton, D.I., Warman, L., Swenson, N.G., Laffan, S.W.,
Zanne, A.E., Pitman, A., Hemmings, F.A. & Leishman, M.R. (2009)
Global patterns in plant height. Journal of Ecology, 97, 923–932.Mommer, L., Pons, T.L. & Visser, E.J.W. (2006) Photosynthetic conse-
quences of phenotypic plasticity in response to submergence: Rumex
palustris as a case study. Journal of Experimental Botany, 57, 283–290.Niinemets, U. & Valladares, F. (2006) Tolerance to shade, drought, and
waterlogging of temperate Northern Hemisphere trees and shrubs. Eco-
logical Monographs, 76, 521–547.van Ommen Kloeke, A.E.E., Douma, J.C., Ordonez, J.C., Reich, P.B. & van
Bodegom, P.M. (2011) Global quantification of contrasting leaf life span
strategies for deciduous and evergreen species in response to environmen-
tal conditions. Global Ecology and Biogeography, 21, 224–235.Ordonez, J.C., van Bodegom, P.M., Witte, J.P.M., Wright, I.J., Reich, P.B.
& Aerts, R. (2009) A global study of relationships between leaf traits, cli-
mate and soil measures of nutrient fertility. Global Ecology and Biogeo-
graphy, 18, 137–149.Ordonez, J.C., van Bodegom, P.M., Witte, J.P.M., Bartholomeus, R.P.,
van Hal, J.R. & Aerts, R. (2010a) Leaf habit and stem investments regu-
late different leaf economy traits at given nutrient supply. Ecology, 91,
3218–3228.Ordonez, J.C., van Bodegom, P.M., Witte, J.P.M., Bartholomeus, R.P.,
van Hal, J.R. & Aerts, R. (2010b) Plant strategies in relation to resource
supply in mesic to wet environments: does theory mirror nature? Ameri-
can Naturalist, 175, 225–239.Porporato, A., Daly, E. & Rodriguez-Iturbe, I. (2004) Soil water balance
and ecosystem response to climate change. American Naturalist, 164, 625
–632.Quinn, G.P. & Keough, M.J. (2002) Experimental Design and Data Analysis
for Biologists, 6th edn. Cambridge University Press, Cambridge.
R Development Core Team (2009) R: A Language and Environment for Sta-
tistical Computing. R Foundation for Statistical Computing, Vienna,
Austria. ISBN 3-900051-07-0, URL http://www.R-project.org
Raunkiaer, C. (1934) The life forms of plants and statistical plant
geography, being the collected papers of C. Raunkiær. History of Ecol-
ogy Series (ed. F. N. Egerton), pp. 632. Oxford University Press,
Oxford.
Reich, P.B., Tjoelker, M.G., Pregitzer, K.S., Wright, I.J., Oleksyn, J. &
Machado, J.L. (2008) Scaling of respiration to nitrogen in leaves, stems
and roots of higher land plants. Ecology Letters, 11, 793–801.Runhaar, J. (1989) Toetsing van het ecotopensysteem [Testing of the ecotope
system]. Rijksuniversiteit Leiden, Leiden.
Schenk, H.J. & Jackson, R.B. (2002) Rooting depths, lateral root spreads
and below-ground/above-ground allometries of plants in water-limited
ecosystems. Journal of Ecology, 90, 480–494.Silvertown, J., Dodd, M.E., Gowing, D.J.G. & Mountford, J.O. (1999)
Hydrologically defined niches reveal a basis for species richness in plant
communities. Nature, 400, 61–63.Sojka, R.E., Joseph, H.A. & Stolzy, L.H. (1972) Wheat response to short-
term heat stress and to soil oxygen stress at three stages of growth.
Agronomy Journal, 64, 450–452.Song, M.H., Duan, D.Y., Chen, H., Hu, Q.W., Zhang, F., Xu, X.L., Tian,
Y.Q., Ouyang, H. & Peng, C.H. (2008) Leaf delta(13)C reflects eco-
system patterns and responses of alpine plants to the environments on
the Tibetan Plateau. Ecography, 31, 499–508.Striker, G.G., Insausti, P., Grimoldi, A.A. & Vega, A.S. (2007) Trade-off
between root porosity and mechanical strength in species with different
types of aerenchyma. Plant Cell and Environment, 30, 580–589.Swenson, N.G. & Enquist, B.J. (2007) Ecological and evolutionary determi-
nants of a key plant functional trait: wood density and its community-
wide variation across latitude and elevation. American Journal of Botany,
94, 451–459.Van Dam, J.C. (2000) Field-Scale Water Flow and Solute Transport.
Wageningen University, Wageningen.
Van Dam, J., Groenendijk, P., Hendriks, R. & Kroes, J. (2008) Advances
of modeling water flow in variably saturated soils with SWAP. Vadose
Zone Journal, 64, 0–653.van Eck, W.H.J.M., van de Steeg, H.M., Blom, C.W.P.M. & de kroon, H.
(2004) Is tolerance to summer flooding correlated with distribution pat-
terns in river floodplains? A comparative study of 20 terrestrial grassland
species. Oikos, 107, 393–405.Visser, E.J.W., Blom, C. & Voesenek, L. (1996) Flooding-induced adventi-
tious rooting in Rumex: morphology and development in an ecological
perspective. Acta Botanica Neerlandica, 45, 17–28.Visser, E.J.W., Bogemann, G.M., Van de Steeg, H.M., Pierik, R. & Blom,
C. (2000) Flooding tolerance of Carex species in relation to field distri-
bution and aerenchyma formation. New Phytologist, 148, 93–103.Voesenek, L., Rijnders, J., Peeters, A.J.M., Van de Steeg, H.M.V. & De
Kroon, H. (2004) Plant hormones regulate fast shoot elongation under
water: from genes to communities. Ecology, 85, 16–27.Voesenek, L., Colmer, T.D., Pierik, R., Millenaar, F.F. & Peeters, A.J.M.
(2006) How plants cope with complete submergence. New Phytologist,
170, 213–226.Von Asmuth, J.R., Bierkens, M.F.P. & Maas, C. (2002) Transer function
noise modeling in continuous time using predefined impulse response
functions. Water Resources Research, 38, 2301–2312.
© 2012 The Authors. Functional Ecology © 2012 British Ecological Society, Functional Ecology, 26, 1355–1365
1364 J. C. Douma et al.
Weiher, E., van der Werf, A., Thompson, K., Roderick, M., Garnier, E. &
Eriksson, O. (1999) Challenging Theophrastus: a common core list of
plant traits for functional ecology. Journal of Vegetation Science, 10, 609
–620.Westoby, M. (1998) A leaf-height-seed (LHS) plant ecology strategy
scheme. Plant and Soil, 199, 213–227.Westoby, M., Falster, D.S., Moles, A.T., Vesk, P.A. & Wright, I.J. (2002)
Plant ecological strategies: some leading dimensions of variation between
species. Annual Review of Ecology and Systematics, 33, 125–159.Wright, I.J., Reich, P.B. & Westoby, M. (2003) Least-cost input mixtures
of water and nitrogen for photosynthesis. American Naturalist, 161, 98–111.
Wright, I.J., Reich, P.B., Westoby, M., Ackerly, D.D., Baruch, Z., Bongers,
F., Cavender-Bares, J., Chapin, T., Cornelissen, J.H.C., Diemer, M.,
Flexas, J., Garnier, E., Groom, P.K., Gulias, J., Hikosaka, K., Lamont,
B.B., Lee, T., Lee, W., Lusk, C., Midgley, J.J., Navas, M.L., Niinemets,
U., Oleksyn, J., Osada, N., Poorter, H., Poot, P., Prior, L., Pyankov, V.
I., Roumet, C., Thomas, S.C., Tjoelker, M.G., Veneklaas, E.J. & Villar,
R. (2004) The worldwide leaf economics spectrum. Nature, 428, 821–827.Wright, I.J., Reich, P.B., Cornelissen, J.H.C., Falster, D.S., Groom, P.K.,
Hikosaka, K., Lee, W., Lusk, C.H., Niinemets, U., Oleksyn, J., Osada,
N., Poorter, H., Warton, D.I. & Westoby, M. (2005) Modulation of leaf
economic traits and trait relationships by climate. Global Ecology and
Biogeography, 14, 411–421.
Received 7 March 2012; accepted 2 August 2012
Handling Editor: Jenny Watling
Supporting Information
Additional Supporting Information may be found in the online
version of this article:
Appendix S1. Details of regression analyses of traits and oxygen
and drought stress.
Appendix S2. Interpretation of seed buoyancy impacts.
Appendix S3. Relationship between oxygen stress and drought
stress.
Appendix S4. Relationship between oxygen and drought stress and
the percentage helophytes and therophytes in a community.
As a service to our authors and readers, this journal provides sup-
porting information supplied by the authors. Such materials may
be re-organized for online delivery, but are not copy-edited or
typeset. Technical support issues arising from supporting informa-
tion (other than missing files) should be addressed to the authors.
© 2012 The Authors. Functional Ecology © 2012 British Ecological Society, Functional Ecology, 26, 1355–1365
Trait responses of plants to water 1365