Titration simulation system and method - European Patent Office
Upload
independentCategory
view
0download
0
Quantification of Reverse Transcriptase Activity by Real-Time PCR as a Fast and Accurate Method for Titration ofHIV, Lenti- and Retroviral VectorsJolien Vermeire1, Evelien Naessens1, Hanne Vanderstraeten1, Alessia Landi1, Veronica Iannucci1,
Anouk Van Nuffel1, Tom Taghon1, Massimo Pizzato2, Bruno Verhasselt1*
1Department of Clinical Chemistry, Microbiology, and Immunology, Ghent University, Ghent, Belgium, 2Centre for Integrative Biology (CIBIO), University of Trento,
Trento, Italy
Abstract
Quantification of retroviruses in cell culture supernatants and other biological preparations is required in a diverse spectrumof laboratories and applications. Methods based on antigen detection, such as p24 for HIV, or on genome detection arevirus specific and sometimes suffer from a limited dynamic range of detection. In contrast, measurement of reversetranscriptase (RT) activity is a generic method which can be adapted for higher sensitivity using real-time PCR quantification(qPCR-based product-enhanced RT (PERT) assay). We present an evaluation of a modified SYBR Green I-based PERT assay(SG-PERT), using commercially available reagents such as MS2 RNA and ready-to-use qPCR mixes. This assay has a dynamicrange of 7 logs, a sensitivity of 10 nU HIV-1 RT and outperforms p24 ELISA for HIV titer determination by lower inter-runvariation, lower cost and higher linear range. The SG-PERT values correlate with transducing and infectious units in HIV-based viral vector and replication-competent HIV-1 preparations respectively. This assay can furthermore quantify MoloneyMurine Leukemia Virus-derived vectors and can be performed on different instruments, such as Roche LightcyclerH 480 andApplied Biosystems ABI 7300. We consider this test to be an accurate, fast and relatively cheap method for retroviralquantification that is easily implemented for use in routine and research laboratories.
Citation: Vermeire J, Naessens E, Vanderstraeten H, Landi A, Iannucci V, et al. (2012) Quantification of Reverse Transcriptase Activity by Real-Time PCR as a Fastand Accurate Method for Titration of HIV, Lenti- and Retroviral Vectors. PLoS ONE 7(12): e50859. doi:10.1371/journal.pone.0050859
Editor: Gilda Tachedjian, Burnet Institute, Australia
Received July 26, 2012; Accepted October 29, 2012; Published December 5, 2012
Copyright: � 2012 Vermeire et al. This is an open-access article distributed under the terms of the Creative Commons Attribution License, which permitsunrestricted use, distribution, and reproduction in any medium, provided the original author and source are credited.
Funding: This work was supported by SBO CellCoVir grant from the agency for Innovation by Science and Technology (IWT) Flanders, Belgium; HIV-STOPInteruniversity Attraction Poles program of Belgian Science Policy, European Union FP7 Health-2007-2.3.2-1 Collaborative Project iNEF, Ghent University grantBOF11/GOA/013 and grants from the Research Foundation – Flanders (FWO) to BV. JV and AL are PhD fellows, TT is a postdoctoral researcher and BV is a SeniorClinical Investigator of the FWO. VI is a PhD fellow supported by the BOF program of the Ghent University. The funders had no role in study design, data collectionand analysis, decision to publish, or preparation of the manuscript.
Competing Interests: Bruno Verhasselt serves as an academic editor of PLOS ONE. No other conflicts of interest are to be reported by the authors. This does notalter the authors’ adherence to all the PLOS ONE policies on sharing data and materials.
* E-mail: [email protected]
Introduction
Retroviral vectors have become an indispensable tool in any
modern molecular biology laboratory. They allow stable expres-
sion of a gene of interest in dividing cells, as well as stable gene
knock-down by expression of short hairpin RNA (shRNA). A
subset of vectors, derived from lentiviruses such as human
immunodeficiency virus (HIV-) 1 and 2 and feline immunodefi-
ciency virus (FIV), can be used for efficient transduction of non-
dividing cells and have therefore received increased attention for
both basic research and clinical applications [1,2,3,4]. Although
methods for accurate quantification of retroviral vector titers will
be indispensable in a clinical setting, also the basic research
environment can benefit from a fast and inexpensive method to
evaluate the quality of retroviral vector productions. Furthermore,
research laboratories investigating the replication of retroviruses,
such as HIV, require routine assays to determine retroviral titers
after production and during viral infection. Multiple methods for
retroviral titer quantification are currently available (see [5,6] for
an overview of lentiviral titration methods), but they often have
some inherent drawbacks. Determination of the proportion of
transduced/infected cells, by evaluating viral integration or
transgene expression, provides a good estimate of the number of
functional viral particles, but is time-consuming as it requires
transduction/infection of the cells and several days of incubation.
Other more rapid methods measure both functional and non-
functional viral particles in the supernatant, by quantifying the
levels of retroviral Gag protein (such as the HIV p24 protein) and
the levels of viral genomic RNA. The former is often done by
enzyme-linked immunosorbent assay (ELISA) and consequently
has a limited linear range and high cost. The latter relies on
quantitative real-time PCR (qPCR)-based amplification of cDNA
of virion-associated RNA and requires target-specific primers.
Furthermore, both methods are still quite labor-intensive.
An alternative retroviral titration method involves quantifica-
tion of the reverse transcriptase (RT) activity, which is associated
with all retroviral particles. In these assays, an exogenous RNA
template is added to the viral supernatant and RT activity is
estimated by determining the amount of RNA that is converted to
cDNA by the retroviral RT. In the first generation RT assays,
cDNA production was monitored by measurement of labeled
nucleotide incorporation [7,8,9]. Sensitivity was highly increased
PLOS ONE | www.plosone.org 1 December 2012 | Volume 7 | Issue 12 | e50859

when a PCR amplification step of the synthesized cDNA was
introduced prior to product detection. These types of assays are
commonly known as product-enhanced RT (PERT) assays.
However, quantification of PCR products still required labor-
intensive techniques such as DNA gel electrophoresis, Southern
Blot or ELISA [10,11,12,13,14,15]. The newest PERT generation
therefore uses integrated qPCR techniques for fast cDNA
quantification, further increasing both the accuracy and linear
range of the assays. Most qPCR based PERT assays use cDNA-
specific fluorogenic labeled probes (TaqmanH chemistry) for signal
generation (F-PERT) [16,17,18,19,20], although a one-step PERT
assay using the more accessible and cost-efficient SYBR Green-I
chemistry (SG-PERT) was also recently developed [21]. PERT
assays are now routinely used for detection of retroviral
contaminants in biological products intended for human use
[22,23,24,25,26,27,28,29,30,31]. However, in basic research
environment, the implementation of real-time PCR based PERT
assays is still limited, despite their low cost and fast procedure.
In this paper, we present an adapted version of the SG-PERT
assay described before by Pizzato et al. [21]. The assay was
adapted for use with different commercial ready-to-use SYBR
Green I qPCR reaction mixes, to allow an easy implementation of
the assay in any research lab with qPCR experience and to avoid
possible compositional variation inherent to in house prepared
qPCR mixes. In addition, RNA from bacteriophage MS2, which
also lacks a DNA phase in its life-cycle, was used instead of RNA
from the Brome Mosaic Virus (BMV) that was used as a template
in the original assay, but is no longer commercially available.
Sensitivity and specificity of the assay were determined, as well as
the variation on repeated RT activity measurement within and
between runs. We used the assay to evaluate the informative value
of the RT activity for lentiviral titer determination, by comparing
it to more commonly used titration methods. We observed
excellent correlation with the p24 antigen concentration in both
replication-competent HIV-1 virus supernatant and replication-
incompetent HIV-based lentiviral vector preparations, as well as
with the levels of transducing units or infectious units. This
particular assay outperformed p24 ELISA by its lower inter-run
variation, lower cost and higher linear range. Furthermore, it was
far less time-consuming than both p24 ELISA and determination
of transducing or infectious units. We therefore believe that this
assay forms an attractive alternative to routine retroviral and
lentiviral titer determination in routine and research laboratories.
Materials and Methods
Cell CultureHuman lymphoblastoid Jurkat E6.1 (ATCC Cell Biology
Collection, Manassas, VA, USA), Jurkat CD4 CCR5 (Programme
EVA Centre for AIDS Reagents, NIBSC, UK), human embryonal
kidney 293T (DZSM, Braunschweig, Germany), 293TN (System
Biosciences, Mountain View, CA, USA), Phoenix-Amphotropic
packaging (Phoenix A) cells (Dr P. Achacoso and Dr G.P. Nolan,
Stanford University School of Medicine, Stanford, CA, USA) [32]
and P4.R5 MAGI cells (AIDS Research and Reference Reagent
Program, Division of AIDS, NIAID, NIH, Germantown, MD,
USA) [33] were cultured at 37uC in a 7% CO2 humidified
atmosphere, in IMDM complete medium: Iscove’s modified
Dulbecco’s medium (Life Technologies, Merelbeke, Belgium)
supplemented with 10% fetal bovine serum (Hyclone, Thermo-
fisher Scientific, Waltham, MA, USA), 100 U/mL penicillin (Life
Technologies) and 100 mg/mL streptomycin (Life Technologies).
Production of Replication-competent HIV-1 VirusReplication-competent HIV-1 virus was produced by trans-
fection of 293T cells with one of the following pNL4-3 proviral
constructs: the NLENG1-IRES vector (kindly provided by Dr.
D.N. Levy, New York University college of Dentistry, New York,
NY) [34], the NL4-3-IRES-HSA vector (kindly provided by Dr.
M.J. Tremblay, Faculte de Medecine, Universite Laval, Quebec,
Canada) [35] or the HIV-1 NL4-3-IRES-eGFP vector (kindly
provided by Dr. F. Kirchhoff, Institute of Virology, University of
Ulm, Ulm, Germany) [36]. Transfection was performed with
Calcium Phosphate Transfection Kit (Life Technologies) or
JetPeiH (Polyplus, Selestat, France), according to manufacturer’s
instructions. Viral supernatant was harvested 48 hours or 72 hours
after transfection and centrifugated at 900 g for 10 min, to clarify
the supernatant from remaining cells. High-titer viral supernatant,
that was used to produce a standard curve for the SG-PERT assay,
was obtained by infection of Jurkat CD4 CCR5 cells with HIV-1
(140 ng p24 equivalent per mL) and subsequent collection of the
culture medium 12 days after infection. During infection, culture
medium was refreshed every two or three days.
Production of Replication-incompetent Lentiviral andRetroviral VectorsAll replication-incompetent lentiviral vectors used in this study
were produced using the pLKO.1-puro Non-Mammalian shRNA
control plasmid from the Sigma MISSIONH product line (Sigma-
Aldrich, Bornem, Belgium), in which the puromycin resistance
gene was replaced by an eGFP encoding sequence. 293T or
293TN cells were transfected with this plasmid using Calcium
Phosphate Transfection Kit, LipofectamineH 2000 (Life Technol-
ogies) or FugeneH 6 (Promega, Leiden, The Netherlands). HIV
packaging genes and the VSV-G heterologous viral envelope gene
were provided in the cells by simultaneous cotransfection with
either the MISSIONH Lentiviral Packaging Mix (Sigma-Aldrich)
or the p8.91/pMD.G plasmids [32] and virus was harvested two
days after transfection. The Moloney Murine Leukemia Virus
(MoMLV)-based retroviral vector was produced by transfection of
Phoenix Amphotropic packaging cells with the LZRS-IRES-
EGFP vector using the Calcium Phosphate Transfection kit, as
described before [37,38].
Reagents Required for the SG-PERT AssayMS2 RNA was purchased from Roche Diagnostics (Vilvoorde,
Belgium; Catalog #10165948001). Primers to amplify MS2
cDNA in the SG-PERT reaction were obtained from Eurogentec
(Seraing, Belgium) and had the following sequence: FWD (59-
TCCTGCTCAACTTCCTGTCGAG-39) and REV (59-CA-
CAGGTCAAACCTCCTAGGAATG-39), as published [19].
RibolockTM RNase inhibitor was from Fermentas (St. Leon-Rot,
Germany; Catalog # EO0381). For SG-PERT on the Light-
CyclerH 480 (Roche Diagnostics), the LightCyclerH 480 SYBR
Green I Master mix from Roche was used as reaction mix (Catalog
#04707516001). For SG-PERT on the ABI 7300 real-time PCR
system (Applied Biosystems, Foster City, CA, USA), a reaction mix
was made using the ROX-containing qPCR Core kit for SYBR
Green I from Eurogentec (Catalog #RT-QP73-05). Recombinant
HIV Reverse Transcriptase was purchased from Ambion (Life
Technologies, Catalog # AM2045). 26 concentrated lysis buffer
was composed of 0.25% Triton X-100, 50 mM KCL, 100 mM
TrisHCL pH 7.4, 40% glycerol and prepared as described
previously [21]. 2 mL of RNAse inhibitor was added per 100 mLof the 26 lysis buffer immediately prior to use.
Quantification of Reverse Transcriptase Activity
PLOS ONE | www.plosone.org 2 December 2012 | Volume 7 | Issue 12 | e50859

SG-PERT AssayCell-free viral supernatant was generally used without prior
dilution as input for the assay. 10-fold dilution series of viral
supernatant or HIV recombinant RT were generated in IMDM
complete. 5 mL of the viral supernatant or recombinant RT
solution was added to a well of a 96-well U-bottom plate (Beckton
Dickinson, Erembodegem, Belgium) and mixed with 5 mL of 26concentrated lysis buffer, already containing RNAse inhibitor.
Samples were incubated for 10 minutes at room temperature and
subsequently diluted by addition of 90 mL nuclease-free water (Life
Technologies). After brief centrifugation, the lysates were resus-
pended and used as input for the assay. For SG-PERT assays on
the LightCyclerH 480 instrument, 9.6 mL of the lysate was
transferred to a 384-well plate (LightCyclerH 480 Multiwell Plates
384, white, Roche Diagnostics), that already contained 10.4 mL of
a reaction mix consisting of 10 mL 26 Roche SYBR Green I
Master mix, 0.1 mL 106 diluted RNAse inhibitor, 0.1 mL MS2
RNA and 0.1 ml of both the MS2 FWD and REV primer
(100 mM, to obtain final concentration of 500 nM in 20 mLreaction volume). After brief centrifugation of the plate, the
reaction was carried out according to the following program: 20
minutes (min) at 42uC for RT reaction, 5 min at 95uC for
activation of FastStart Taq DNA polymerase and 40 or 50 cycles
of amplification: 5 seconds (sec) at 95uC for denaturation, 5 sec at
60uC for annealing and acquisition, 15 sec at 72uC for elongation.
Fluorescence acquisition was done at the end of annealing phase in
our experiments, but can alternatively be done at the end of
elongation phase. For SG-PERT assays on the ABI 7300 qPCR
system, 9 mL of the lysate was added to a 96-well plate (MicroAmp
Optical 96-well reaction plate, Applied Bisosystems) together with
11 mL of a reaction mix consisting of 10.6 mL mastermix from the
Eurogentec qPCR core kit for SYBR Green I (2 mL 106 reaction
buffer, 1.4 mL of 50 mM MgCl2, 0.8 mL of 5 mM dNTP mix,
0.1 mL of HotGoldSTar Taq polymerase, 0.6 mL SYBR Green I
and 5.7 mL of nuclease-free water.), 0.1 mL 106 diluted RNAse
inhibitor, 0.1 mL MS2 RNA and 0.1 ml of both the MS2 FWD
and REV primer (100 mM). Following reaction conditions were
used on the ABI 7300 instrument: 20 min RT reaction at 42uC,2 min activation of the HotGoldStar Taq enzyme at 95uC and 40
cycles of amplification: 5 sec denaturation at 95uC, 30 sec
annealing and acquisition at 60uC, 15 sec elongation at 72uC.All reagents were kept on ice or on a cooling block during
preparation of the assay. For each sample lysate, an SG-PERT
reaction was always performed in duplo. Cycles of quantification
(Cq) values were generated by the software of the qPCR
instruments, after manual threshold determination for the ABI
7300 instrument and according to the second-derivative maximum
method for the LightCyclerH 480. Melting peaks were calculated
automatically by the software of both instruments.
To perform absolute quantification of RT activity values,
a standard curve of replication-competent HIV-1 containing
supernatant with known RT activity levels was run in parallel in
each assay and values were extrapolated from the obtained Cq
values. The standard curve was produced by serial dilution of
a large batch of high-titer supernatant. Dilutions were aliquoted
for use in different SG-PERT assays, to avoid loss of RT activity
by repeated freeze-thaw cycles. RT activity values of the standard
curve were determined by running a dilution series of commercial
recombinant RT in parallel in at least four independent
experiments.
Calculations and StatisticsStandard deviation (STDEV), coefficient of determination (R2)
and regression equations were calculated with Excel 2007
(Microsoft). Coefficient of variation (CV) was calculated as follows:
(STDEV/AVERAGE) x 100%. Column scatter plots were created
with GraphPad Prism version 5.04. Statistical significance of
difference between inter-run coefficient of variation of p24 ELISA
test and SG-PERT assay was analyzed with the one-tailed non-
parametric Mann-Whitney U test (GraphPad Prism).
Determination of p24 Concentration, Transducing andInfectious Units in Viral SupernatantConcentration of the p24 antigen was measured in HIV-1 or
HIV-based lentiviral vector containing supernatant with the
INNOTESTH HIV Antigen mAb ELISA kit (Innogenetics,
Zwijnaarde, Belgium), according to manufacturer’s instructions.
Multiple dilutions of each sample were tested, to ensure that
concentration was within the linear range of the assay. For
correlation analysis of p24 antigen and RT activity values, all
samples were measured within the same ELISA assay, to avoid the
introduction of inter-run variation. For lentiviral vectors, the
number of transducing units per volume of supernatant (TU/mL)
was determined by transduction of Jurkat E6.1 cells with a limiting
dilution series of each sample, using polybrene (8 mg/mL; Sigma-
Aldrich) and spinoculation (30 min, 950 g, 32uC). The percentageof transduced cells was determined 72 hours after transduction by
FACS analysis (MACSquantH Analyzer, Miltenyi Biotec, Leiden,
The Netherlands) of eGFP expression. Vector titers (TU/mL)
were calculated in cultures with 0.5% to 4% of eGFP expressing
cells according to following formula: { (% eGFP expressing cells/
100) x number of cells at moment of transduction x dilution factor
}/volume of viral supernatant used for transduction (mL).
For replication competent HIV-1 virus, relative levels of
infectious units (IU) were determined by single-cycle infection of
P4.R5 MAGI indicator cells. Briefly, 10,000 cells were plated per
well of a 96-well flat bottom plate (Beckton Dickinson). Twenty-
four hours after plating, HIV-1 NL4-3 viral supernatant was
added to the cells in the presence of 1 mM of the HIV protease
inhibitor ritonavir (AIDS Research and Reference Reagent
Program, Division of AIDS, NIAID, NIH, Germantown, MD,
USA), to avoid multiple rounds of infection. Cells were sub-
sequently spinoculated at 950 g for 90 min at 32uC. Forty-eighthours after infection b-galactosidase activity was assessed using
a colorimetric assay (Mammalian b-galactosidase Assay kit;
Thermofisher Scientific) according to manufacturer’s instructions.
Optical density at 405 nm was quantified using a Versa Max Plate
Reader (Molecular Devices, Sunnyvale, CA, USA) and obtained
values were corrected for background signal by subtraction of the
optical density value obtained with non-infected cells. For
correlation analysis of RT activity and relative levels of infectious
units, we used cell-free HIV NL4-3 viral supernatant harvested 48
hours or 72 hours after transfection, with the Calcium Phosphate
Transfection Kit, of 293T with either the NLENG1-IRES vector
or the NL4-3-IRES-HSA vector. To ensure that b-galactosidaseactivity levels were within the linear range of the assay, the viral
concentration in the culture was limited to maximum 360 mU RT
activity/mL. To determine absolute levels of infectious units/mL,
P4.R5 MAGI cells were infected with serial dilutions of HSA
encoding HIV-1 virus in presence of ritonavir. Forty-eight hours
after single-cycle infection, cells were stained with APC (allophy-
cocyanin)-labeled anti-mouse-CD24 antibody (HSA, heat stable
antigen; clone M1/69, BioLegend, San Diego, CA, USA) and the
percentage of infected cells was determined by FACS analysis
(FACSCalibur flow cytometer; Becton Dickinson)of HSA expres-
sion. Viral titers (IU/mL) were calculated according to the
following formula: {(% HSA expressing cells/100)6number of
Quantification of Reverse Transcriptase Activity
PLOS ONE | www.plosone.org 3 December 2012 | Volume 7 | Issue 12 | e50859
plated cells6dilution factor}/volume of viral supernatant used for
infection (mL).
Results
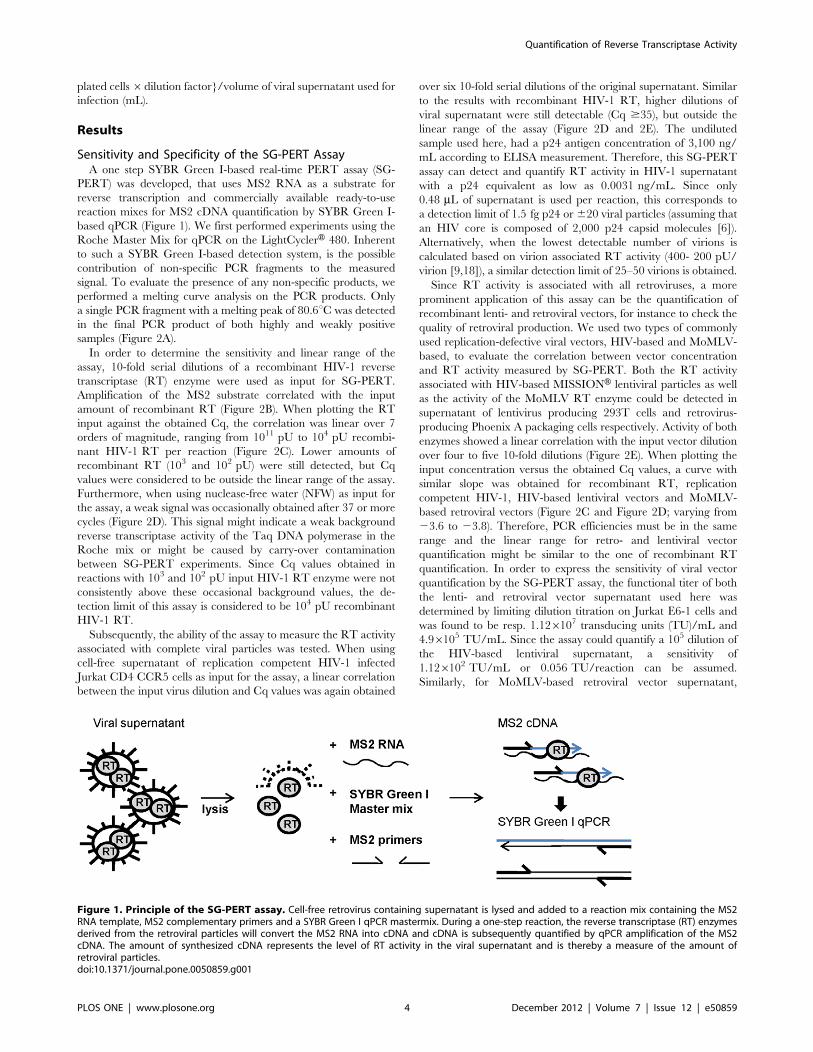
Sensitivity and Specificity of the SG-PERT AssayA one step SYBR Green I-based real-time PERT assay (SG-
PERT) was developed, that uses MS2 RNA as a substrate for
reverse transcription and commercially available ready-to-use
reaction mixes for MS2 cDNA quantification by SYBR Green I-
based qPCR (Figure 1). We first performed experiments using the
Roche Master Mix for qPCR on the LightCyclerH 480. Inherent
to such a SYBR Green I-based detection system, is the possible
contribution of non-specific PCR fragments to the measured
signal. To evaluate the presence of any non-specific products, we
performed a melting curve analysis on the PCR products. Only
a single PCR fragment with a melting peak of 80.6uC was detected
in the final PCR product of both highly and weakly positive
samples (Figure 2A).
In order to determine the sensitivity and linear range of the
assay, 10-fold serial dilutions of a recombinant HIV-1 reverse
transcriptase (RT) enzyme were used as input for SG-PERT.
Amplification of the MS2 substrate correlated with the input
amount of recombinant RT (Figure 2B). When plotting the RT
input against the obtained Cq, the correlation was linear over 7
orders of magnitude, ranging from 1011 pU to 104 pU recombi-
nant HIV-1 RT per reaction (Figure 2C). Lower amounts of
recombinant RT (103 and 102 pU) were still detected, but Cq
values were considered to be outside the linear range of the assay.
Furthermore, when using nuclease-free water (NFW) as input for
the assay, a weak signal was occasionally obtained after 37 or more
cycles (Figure 2D). This signal might indicate a weak background
reverse transcriptase activity of the Taq DNA polymerase in the
Roche mix or might be caused by carry-over contamination
between SG-PERT experiments. Since Cq values obtained in
reactions with 103 and 102 pU input HIV-1 RT enzyme were not
consistently above these occasional background values, the de-
tection limit of this assay is considered to be 104 pU recombinant
HIV-1 RT.
Subsequently, the ability of the assay to measure the RT activity
associated with complete viral particles was tested. When using
cell-free supernatant of replication competent HIV-1 infected
Jurkat CD4 CCR5 cells as input for the assay, a linear correlation
between the input virus dilution and Cq values was again obtained
over six 10-fold serial dilutions of the original supernatant. Similar
to the results with recombinant HIV-1 RT, higher dilutions of
viral supernatant were still detectable (Cq $35), but outside the
linear range of the assay (Figure 2D and 2E). The undiluted
sample used here, had a p24 antigen concentration of 3,100 ng/
mL according to ELISA measurement. Therefore, this SG-PERT
assay can detect and quantify RT activity in HIV-1 supernatant
with a p24 equivalent as low as 0.0031 ng/mL. Since only
0.48 mL of supernatant is used per reaction, this corresponds to
a detection limit of 1.5 fg p24 or620 viral particles (assuming that
an HIV core is composed of 2,000 p24 capsid molecules [6]).
Alternatively, when the lowest detectable number of virions is
calculated based on virion associated RT activity (400- 200 pU/
virion [9,18]), a similar detection limit of 25–50 virions is obtained.
Since RT activity is associated with all retroviruses, a more
prominent application of this assay can be the quantification of
recombinant lenti- and retroviral vectors, for instance to check the
quality of retroviral production. We used two types of commonly
used replication-defective viral vectors, HIV-based and MoMLV-
based, to evaluate the correlation between vector concentration
and RT activity measured by SG-PERT. Both the RT activity
associated with HIV-based MISSIONH lentiviral particles as well
as the activity of the MoMLV RT enzyme could be detected in
supernatant of lentivirus producing 293T cells and retrovirus-
producing Phoenix A packaging cells respectively. Activity of both
enzymes showed a linear correlation with the input vector dilution
over four to five 10-fold dilutions (Figure 2E). When plotting the
input concentration versus the obtained Cq values, a curve with
similar slope was obtained for recombinant RT, replication
competent HIV-1, HIV-based lentiviral vectors and MoMLV-
based retroviral vectors (Figure 2C and Figure 2D; varying from
23.6 to 23.8). Therefore, PCR efficiencies must be in the same
range and the linear range for retro- and lentiviral vector
quantification might be similar to the one of recombinant RT
quantification. In order to express the sensitivity of viral vector
quantification by the SG-PERT assay, the functional titer of both
the lenti- and retroviral vector supernatant used here was
determined by limiting dilution titration on Jurkat E6-1 cells and
was found to be resp. 1.126107 transducing units (TU)/mL and
4.96105 TU/mL. Since the assay could quantify a 105 dilution of
the HIV-based lentiviral supernatant, a sensitivity of
1.126102 TU/mL or 0.056 TU/reaction can be assumed.
Similarly, for MoMLV-based retroviral vector supernatant,
Figure 1. Principle of the SG-PERT assay. Cell-free retrovirus containing supernatant is lysed and added to a reaction mix containing the MS2RNA template, MS2 complementary primers and a SYBR Green I qPCR mastermix. During a one-step reaction, the reverse transcriptase (RT) enzymesderived from the retroviral particles will convert the MS2 RNA into cDNA and cDNA is subsequently quantified by qPCR amplification of the MS2cDNA. The amount of synthesized cDNA represents the level of RT activity in the viral supernatant and is thereby a measure of the amount ofretroviral particles.doi:10.1371/journal.pone.0050859.g001
Quantification of Reverse Transcriptase Activity
PLOS ONE | www.plosone.org 4 December 2012 | Volume 7 | Issue 12 | e50859

quantification of up to 49 TU/mL or 0.024 TU/reaction is
possible.
Inter- and Intra-run Variation of the SG-PERT AssayWhen determining RT activity in lenti- or retroviral superna-
tant with the SG-PERT assay, absolute quantification can be done
by running a standard curve of recombinant reverse transcriptase
in the same assay as the sample of interest. For frequent use of the
assay, a cheaper alternative is the use of a retroviral standard
curve. In this case, the RT activity of high titer retroviral
supernatant is determined once, using a standard curve of
recombinant reverse transcriptase. For subsequent assays, a di-
lution series of this retroviral supernatant can be used as standard
curve and absolute quantification can be done by using the known
RT activity of the retroviral standard curve.
To obtain such a standard curve, supernatant of HIV-1 infected
Jurkat CD4 CCR5 cells with an RT activity of 47,000 mU/mL
was serially diluted and aliquots of each dilution were stored for
use in different assays. Cq values of this standard curve, obtained
in 12 independent SG-PERT experiments on the LightCyclerH480, are shown in Figure 3A. They were found to be highly
reproducible, with a standard deviation of maximum 1 Cq value
over the different assays for each dilution point, corresponding to
a variation of two-fold over the measurement average. If a precise
determination of RT activity is not required, it is therefore possible
to only occasionally include a standard curve in the SG-PERT
experiment and directly derive the RT activity from the obtained
Cq value instead (using a fixed standard curve for calculations).
Subsequently, the reproducibility of RT activity quantification
using the SG-PERT assay and the HIV-1 standard curve, was
evaluated on the LightCycler. To determine intra-run reproduc-
ibility, 8 aliquots from each of 6 different HIV-containing samples
were separately lysed and RT activity in the different lysates was
determined in the same run. The coefficient of variation (CV)
ranged between 8.6% to 15% of the RT activity (Figure 3B), with
an average CV of 12%. Inter-run variation was evaluated on 11
different HIV-1 containing samples by determining their RT
activity in at least 3 independent SG-PERT experiments. We
found an average CV of 19.9%. Except for the sample with the
lowest titer, CV was lower than 30%. The sample with very low
RT activity (0.2 mU/mL; sample 1 in Figure 3C) showed a CV of
43%, which might indicate a decreased reproducibility of the SG-
PERT measurement in the region close to the detection limit of
the assay (Figure 3C).
Figure 2. Sensitivity and specificity of the SG-PERT assay. (A) Melting curves of PCR products obtained by SG-PERT assay on the LightCyclerH480 when using 1011 or 104 pU recombinant HIV-1 RT or nuclease-free water (non-template control =NTC) as input for the assay, as indicated. (B, D)Amplification curves of indicated amount of (B) recombinant HIV-1 RT (pU), (D) replication competent HIV-1 (NL4-3 strain) (ng p24/mL) or nuclease-free water (NTC) obtained by SG-PERT on the LightCyclerH 480. (C,E) Relation between input of (C) recombinant HIV-1 RT, (E) replication competentHIV-1 (HIV-1), HIV-1 based lentiviral vectors (HIV-1 based vector) or Moloney Murine Leukemia-based retroviral vectors (MoMLV) and obtained cycle ofquantification (Cq) values by SG-PERT on the LightCyclerH 480. Viral titers in the undiluted samples in (E) (value of ‘‘0’’ on x-axis) were 3,100 ng p24/mL for the replication competent HIV-1 virus, 1.126107 transducing units/mL (TU/mL) for the HIV-1 based viral vector and 4.96105 TU/mL for theMoMLV-based vector. Only input levels within linear range of the assay were included for correlation analysis.doi:10.1371/journal.pone.0050859.g002
Quantification of Reverse Transcriptase Activity
PLOS ONE | www.plosone.org 5 December 2012 | Volume 7 | Issue 12 | e50859

Comparison of the SG-PERT Assay with Other LentiviralTitration MethodsCurrently, the most frequently used methods for lentiviral titer
determination measure the concentration of the p24 antigen in the
supernatant or determine the number of transducing units (TU) or
infectious units (IU) per volume of the supernatant. The latter can
be done by assessing the level of transduced or infected cells after
limiting dilution of replication incompetent or replication compe-
tent lentiviruses respectively. Alternatively, for HIV viruses,
relative levels of infectious units are often determined by single-
cycle infection of indicator cell lines. To evaluate the informative
value of the RT activity determined by SG-PERT, we investigated
its correlation with the p24 antigen concentration levels and the
levels of TU or IU in the same samples.
Supernatants with HIV-1 virus (NL4-3 strain) or replication
incompetent HIV-based MISSIONH lentiviral particles were used
for both p24 antigen concentration and RT activity determination
by ELISA and SG-PERT respectively. We found a very strong
correlation between the obtained p24 and RT values, both for
combined and separate analysis of the lentiviral vectors and HIV-1
viruses. The two values correlated with each other according to
a power function, with a power number very close to 1, indicating
an almost linear relation. The ratio between the RT and p24
values was calculated, that seemed higher for the lentiviral vectors
compared to the replication competent HIV-1 viruses (Figure 4A
Figure 3. Intra- and inter-run variation of the SG-PERT assay. (A) Standard curve composed of a pre-made six 10-fold serial dilution series ofreplication-competent HIV-1 containing supernatant measured in 12 independent SG-PERT experiments. For each experiment obtained Cq values areplotted versus the RT activity in each sample. RT activity values were determined by running a dilution series of recombinant HIV-1 RT in parallel.Standard deviation on the obtained crossing point values is indicated for each dilution. (B) RT activity values obtained for 8 repeated measurementsof different HIV-1 samples (sample number 1 to 6) within the same run. The average RT activity value for each sample is indicated by a red line, errorbars represent standard deviation on the obtained RT activity values. Numbers indicate intra-run variation for each sample, expressed as percentageof the average RT activity values (coefficient of variation). (C) RT activity values obtained for different HIV-1 samples (sample number 1 to 11) in atleast 3 independent SG-PERT experiments. The average RT activity value for each sample is indicated by a red line, error bars represent standarddeviation on the obtained RT activity values. Numbers indicate inter-run variation for each sample, expressed as percentage of the average RT activityvalues (coefficient of variation). Experiments were performed on the LightCyclerH 480.doi:10.1371/journal.pone.0050859.g003
Quantification of Reverse Transcriptase Activity
PLOS ONE | www.plosone.org 6 December 2012 | Volume 7 | Issue 12 | e50859

and Table 1). Of note, the excellent correlation between the p24-
RT values of HIV-1 viral supernatants was not caused by the
sample with very low titer, since the coefficient of determination
(R2) was still 0.92 if this sample was removed from the analysis
(data not shown).
The MISSIONH lentiviral particles used in this experiment
express eGFP as a marker gene and therefore allow easy
determination of TU/mL, by FACS measurement of the pro-
portion of transduced cells. The number of TU/mL obtained after
limiting dilution of the different lentiviral supernatants on Jurkat
E6-1 cells strongly correlated with the RT activity levels in these
samples (Figure 4B). When calculating the number of viral
particles in the supernatant, assuming an RT activity of 300 pU
per virion [9,18], we found a ratio of 865 to 2,319 RT-containing
viral particles per functional transducing unit. Viral particle
numbers in the same range were obtained when calculations were
based on p24 content, although the estimated particle concentra-
tion was slightly higher when based on RT activity (‘‘RT based/
p24 based’’ ratio of 1.5–3.8 for HIV-1 containing supernatant and
1.9–4.8 for lentiviral vector containing supernatant) (Table 1). This
shows that as for p24, RT activity is representing both transducing
and non-transducing viral particles.
For replication competent HIV-1 virus, relative levels of
infectious units in the supernatants were assessed by infection of
P4.R5 MAGI indicator cells. These CD4, CXCR4 and CCR5
expressing HeLa cells express bacterial b-galactosidase under
control of the Tat-responsive HIV long terminal repeat and
therefore express b-galactosidase upon productive HIV infection
[33]. The levels of b-galactosidase activity induced by HIV-1
supernatant in these types of assays have been shown to correlate
with infectious titers determined by end-point dilution (tissue
culture infectious dose 50% or TCID50) [39]. When infecting the
cells with a serial dilution of HIV-1 supernatant, the input viral
concentration linearly correlated with the b-galactosidase activity
measured in the cell culture 48 h after single-cycle infection. For
high levels of viral input a saturation of b -galactosidase activity
occurred at a level corresponding to an optical density value
around 2 (Fig. 4C). To compare levels of infectious units present in
different productions of HIV-1 NL4-3 viral supernatant, an
appropriate dilution of each supernatant was used for single cycle
infection. We found a high correlation between the levels of b-galactosidase activity and the RT activity, indicating a correlation
between the number of infectious units and RT activity in the
supernatant (Fig. 4D).
Furthermore, we evaluated the inter-run variation of p24
concentration measurement by ELISA and compared this to the
SG-PERT inter-run variation determined above. For 7 different
HIV-1 containing samples, from the same set that was used to
determine SG-PERT reproducibility, p24 concentration was
determined in at least 3 independent ELISA experiments. Due
to the restricted linear range of p24 ELISA, careful consideration
was given to appropriate dilution of the supernatants in each
experiment. Coefficient of variation ranged from 16% to 51.4%
and was on average higher than the inter-run variation of the SG-
PERT assay (p-value = 0.0426 with Mann-Withney U test)
(Figure 4E–F and compare to Figure 3C). Quantification of the
sample with low viral titer and high inter-run variation of RT
activity determination (sample 1 in Figure 4E), was only slightly
more reproducible with p24 ELISA compared to SG-PERT
(Figure 4E, compare to Figure 3C).
Table 1. Evaluation of different lentiviral titration methods.
RT activity(mU/mL) p24 (ng/mL)
ratio RT/p24 TU/mL
p24 based# VP/mL
RT based# VP/mL
ratio p24 based/RT based # VP
ratio TU/p24based # VP
ratio TU/RTbased # VP
HIV-1 sup 1 1.96E-01 2.78E-02 7.0 3.33E+05 6.52E+05 1.95
HIV-1 sup 2 7.41E+02 1.30E+02 5.7 1.56E+09 2.47E+09 1.58
HIV-1 sup 3 5.03E+03 7.69E+02 6.5 9.23E+09 1.68E+10 1.82
HIV-1 sup 4 5.44E+03 7.57E+02 7.2 9.08E+09 1.81E+10 2.00
HIV-1 sup 5 5.52E+03 9.26E+02 6.0 1.11E+10 1.84E+10 1.66
HIV-1 sup 6 6.34E+03 1.14E+03 5.6 1.37E+10 2.11E+10 1.55
HIV-1 sup 7 8.00E+03 1.43E+03 5.6 1.72E+10 2.67E+10 1.55
HIV-1 sup 8 1.26E+04 2.00E+03 6.3 2.40E+10 4.19E+10 1.75
HIV-1 sup 9 1.39E+04 2.01E+03 6.9 2.41E+10 4.64E+10 1.92
HIV-1 sup 10 2.00E+04 1.46E+03 13.7 1.75E+10 6.65E+10 3.81
HIV-1 sup 11 2.06E+04 3.76E+03 5.5 4.52E+10 6.88E+10 1.52
LV sup 1 7.32E+00 9.24E-01 7.9 2.82E+04 1.11E+07 2.44E+07 2.20 393 865
LV sup 2 4.91E+01 2.85E+00 17.2 1.03E+05 3.42E+07 1.64E+08 4.78 330 1581
LV sup 3 3.84E+02 5.54E+01 6.9 9.40E+05 6.65E+08 1.28E+09 1.92 708 1362
LV sup 4 8.14E+02 1.12E+02 7.2 1.72E+06 1.35E+09 2.71E+09 2.01 786 1580
LV sup 5 1.13E+03 1.21E+02 9.3 2.68E+06 1.45E+09 3.76E+09 2.59 541 1401
LV sup 6 1.66E+03 1.31E+02 12.7 2.39E+06 1.58E+09 5.54E+09 3.52 659 2319
LV sup 7 3.53E+03 3.78E+02 9.3 1.13E+07 4.54E+09 1.18E+10 2.60 402 1045
Table shows SG-PERT RT activity measured on the LightCyclerH 480 and p24 antigen concentration in different productions of replication-competent HIV-1 virussupernatant (HIV-1, sup 1–11) and replication-incompetent HIV-1-based MISSIONH lentiviral vectors (LV, sup 1–7). TU/mL: transducing units/mL (only determined forlentiviral vectors). The number of viral particles (#VP) was calculated from p24 values by assuming 12 viral particles per fg p24. For viral particle calculation from RTactivity values, an activity of 300 pU per viral particle was assumed.doi:10.1371/journal.pone.0050859.t001
Quantification of Reverse Transcriptase Activity
PLOS ONE | www.plosone.org 7 December 2012 | Volume 7 | Issue 12 | e50859

Quantification of Reverse Transcriptase Activity
PLOS ONE | www.plosone.org 8 December 2012 | Volume 7 | Issue 12 | e50859

SG-PERT Assay for Applied Biosystems qPCR InstrumentsFor the characterization of the SG-PERT assay above we used
the Roche SYBR Green I Master Mix for qPCR quantification on
the LightCycler. However, other qPCR platforms, such as most of
the Applied Biosystems qPCR instruments, require the presence of
a passive reference dye in the master mix to normalize for non-
PCR related fluorescence signal variations. To compare, we
performed the assay on an ABI 7300 Real-Time PCR System
using the ROX containing qPCR core kit for SYBR Green I from
Eurogentec as reaction mix (see material and methods). Sensitivity
and linear range of the assay were determined by using the same
10-fold serial dilution of HIV-1 supernatant as was used before on
the LightCycler for this purpose. Similar to the results on the
LightCycler, the SG-PERT assay could quantify RT activity in
a sample with p24 antigen concentration as low as 0.0031 ng/mL
and Ct values correlated linearly with the input virus dilution over
six orders of magnitude (Figure 5A and 5B). When using samples
with even higher RT activity, by using recombinant RT, we did
notice a loss of linearity, probably by saturation of the assay (data
not shown). However, such RT activity levels are far above the
ones commonly obtained in supernatant of viral productions or
medium of HIV infected cells. Nuclease-free water did not
generate a detectable signal on the ABI 7300 instrument when
used as input for SG-PERT (Figure 5A). Furthermore, melting
curve analysis of the PCR products confirmed the absence of non-
specific amplification in the assay (data not shown). Therefore,
retroviral quantification by SG-PERT can be performed on ABI
qPCR instruments with equal efficiency as on the LightCycler.
Discussion
Assessment of retroviral titers is a requisite in quality assurance,
virology and molecular biology research laboratories for quality
control of cell derived preparations; quality control of viral
productions; for standardization of experiments using different
batches of virus preparations and for normalization of viral
particles numbers when comparing different types of viruses. In
this paper, we present the first one-step SYBR Green I qPCR-
based PERT assay using commercial ready-to-use reaction mixes
and show that quantification of RT activity in viral supernatant by
this assay, can provide a robust and accurate alternative for other
frequently applied methods of retroviral titer determination.
The SG-PERT assay presented here, uses MS2 RNA as
a substrate for reverse transcription by retrovirus-associated RT
molecules and subsequently quantifies MS2 cDNA by SYBR
Green I-based qPCR, using commercially available reagents and
ready-to-use reaction mixes. Since the introduction of a qPCR
cDNA quantification step to conventional PERT, a number of
assays applying this modification have been published
[16,17,18,19,20,21]. Most of these assays follow a two-step
protocol, separating the reverse transcription and qPCR step
[17,18,19,20]. While such a separation offers the possibility to
remove non reverse transcribed RNA templates after the RT step,
thereby avoiding possible background signals of the Taq poly-
merase [20], it renders the assay more labor-intensive and time-
consuming. For quantification of retroviral titers in research
laboratories, easiness and speed of the assay is often more
important than the elimination of minute background levels, that
are often far below the signal generated by the retroviral
supernatant. Based on assay durations reported in literature, the
SG-PERT assay described here seems considerably faster com-
pared to other published two-step and one-step qPCR-based
PERT assays [16,18,20]. Furthermore, most available qPCR
based PERT assay use cDNA-specific fluorogenic labeled probes
(TaqmanH chemistry) for signal generation [16,17,18,19,20], while
SYBR Green I chemistry is more accessible and is not sensitive to
possible DNAse activity present in the test samples, as has been
reported for fluorogenic labeled probes in one-step qPCR based
PERT assays [17]. Subsequently, the ability to perform the SG-
PERT assay with commercial ready-to-use SYBR Green I qPCR
reaction mixes largely facilitates its implementation in laboratories
equipped for qPCR and eliminates possible compositional
variation inherent to in house prepared qPCR mixes. Of note,
we have confirmed that another commercially available SYBR
Green PCR ready mix (the widely used Qiagen QuantiTect SYBR
Green PCR Kit), is fully compatible with the linear quantification
of HIV-1 RT activity and therefore most likely is an alternative to
the Roche and Eurogentec mixes evaluated in this report.
During evaluation of the one-step SG-PERT assay, we found
that obtained RT activity values correlated with input levels over
six to seven orders of magnitude. Because of this extraordinary
linear range, prior extensive serial dilution of the viral supernatant
is not required for titer determination, thus potential introduction
of variation is avoided. The sensitivity of the assay corresponded to
a p24 equivalent of 3 pg/mL for HIV-1 supernatant and to 650
or 6110 TU/mL for MoMLV-based and HIV-based retroviral
vectors respectively. The original SG-PERT assay described by
Pizzato et al. was reported to have a sensitivity of 102–103 pU
recombinant HIV-1 RT per reaction [21]. Although similar input
levels were still detected in the current modified assay on the
LightCyclerH 480, the obtained values were outside the linear
range of the assay. The higher sensitivity observed by Pizzato et al.
could be due to the use of a different qPCR instrument, the BMV
RNA template-primer combination or the performance of home-
Figure 4. Comparison of SG-PERT assay with other lentiviral titration methods. (A) Correlation between RT activity levels measured withSG-PERT and p24 antigen concentration levels measured with ELISA in supernatant containing replication-competent HIV-1 virus or HIV-1 basedMISSION lentiviral vectors. Coefficient of determination and correlation functions are shown for HIV-1 virus (- - -) and lentiviral vectors (-?-?) separatelyor combined (-). To avoid introduction of interrun variation, p24 ELISA measurements for all samples were performed in the same experiment. (B)Correlation between RT activity levels measured by SG-PERT and levels of transducing units determined by limiting dilution on Jurkat E6.1 cells inHIV-1 based MISSIONH lentiviral vector preparations. (C) Relation between the level of b-galactosidase activity, as a marker of HIV-1 Tat productionand the relative amount (serial dilution) of replication competent HIV-1 NL4-3 virus used to infect the cells, in the culture of P4.R5 MAGI indicator cells48 h after single-cycle infection. Viral input in the undiluted samples (value of ‘‘1’’ on x-axis) was 1.766103 mU RT/mL for HIV sup 12 and2.336102 mU RT/mL for HIV sup 13. For HIV sup 12, the undiluted sample was outside the linear range of the assay and was therefore not includedfor calculation of the determination coefficient (R2) shown in panel C. (D) Correlation between the level of b-galactosidase activity in the culture ofP4.R5 MAGI indicator cells 48 h after single-cycle infection with different productions of HIV-1 NL4-3 supernatant and the RT activity measured in thesupernatant by SG-PERT. (E) p24 antigen concentration values obtained for different HIV-1 containing samples in at least 3 independent ELISAexperiments. Sample numbers in x-axis correspond to those in Figure 3C. The average p24 concentration value for each sample is indicated by a redline, error bars represent standard deviation on the obtained p24 concentration values. Numbers indicate inter-run variation for each sample,expressed as percentage of the average p24 concentration (coefficient of variation=CV). (F) Average inter-run coefficient of variation for SG-PERT andp24 ELISA assays, calculated from the CV’s obtained in Figure 3C and Figure 4E respectively. Error bars indicate standard deviations. The asterix (*)indicates a statistical significant difference between the two values according to a one-tailed Mann-Withney U test (p-value = 0.0426).doi:10.1371/journal.pone.0050859.g004
Quantification of Reverse Transcriptase Activity
PLOS ONE | www.plosone.org 9 December 2012 | Volume 7 | Issue 12 | e50859

made PCR reaction mix. Nevertheless, the sensitivity of the
current assay is sufficient for most applications in virology research
laboratories and similar to the one of most commercial p24 ELISA
kits (eg. Innogenetics INNOTESTH: 10 pg/mL; Perkin-Elmer
ALLIANCEH test: 12.5 pg/mL). The assay was furthermore able
to accurately quantify RT activity in samples containing retro-
viruses of different origins (HIV-1 and MoMLV). This offers the
advantage that viral (vector) preparations of different origins can
all be evaluated within a single assay. In this regard, Ma et al.
recently demonstrated that a standard curve of recombinant HIV-
1 RT can be used to perform absolute quantification of other types
of retroviruses by qPCR-based PERT [18], although the efficiency
of different viral reverse transcriptase enzymes should be evaluated
in our SG-PERT assay. However, for routine evaluation of
a specific type of retrovirus, we recommend to determine absolute
RT activity levels of a high-titer preparation of this virus by
running a standard curve of the appropriate recombinant RT in
parallel. For subsequent assays, a dilution series of this high-titer
preparation can then be used as a standard curve.
Due to the accurate quantification capacity of qPCR, a low
intra- and inter-run variation has been reported for different
PERT assays [17,18,21]. However, variation is usually determined
on the obtained Cq values and consequently underestimates the
variation on the actual RT activity values. Therefore, we
expressed variation of the SG-PERT assay as percentage of the
actual RT values, which are calculated from the obtained Cq
values by running a standard curve with known RT activity in
parallel. We show an acceptable intra- and inter-run reproduc-
ibility of the assay, although, as expected, an increase in variation
is observed in regions close to the detection limit of the assay.
Inter-run variation of viral titer determination was on average
lower when using the SG-PERT assay compared to p24 ELISA. A
high inter-run variation for p24 antigen quantification by ELISA
has been reported by others [5,40], and might be due to extensive
sample dilution or the multiple handling steps inherent to the
assay, which are both sources of variance introduction.
Since the use of qPCR-based PERT assays as a retroviral
titration method is still limited, one goal of this paper is to evaluate
the informative value of retroviral titers based on RT activity
levels. We show an excellent correlation of RT activity with both
p24 antigen concentration and levels of transducing and infectious
units.
For replication-incompetent lentiviral vectors, we calculated the
number of viral particles from the obtained RT activity and found
an average 1/1,450 ratio between transducing units and RT-
containing particles. A functional/physical particle ratio in the
same range has been reported for lentiviral vectors, when the latter
was determined by quantification of viral RNA copies [5,41,42,43]
or p24 antigen concentration [44,45]. However, these ratios are
highly dependent on different characteristics of the both the vector
and transduction process, such as the vector backbone and
envelope protein, the transduction method and the cell line used to
determine functional titers [5,43]. Therefore, it is important to
note that the correlation between RT activity and levels of
transducing units was evaluated on lentiviral vector preparations
produced with the same transfer plasmid, although the packaging
plasmids and transfection methods used were different. We also
calculated the ratio between the absolute number of infectious
units and RT-containing viral particles for two productions of
replication competent HIV-1 virus. The former was determined
by analysis of the HSA marker gene expression, encoded by HIV-
1 replication competent reporter viruses, in P4.R5 cells infected
with a serial dilution of supernatant, the latter based on an RT
activity of 300 pU per virion [9,18]. We found ratios of 1/63,500
and 1/111,800 between infectious units and total viral particles
(data not shown). In line with replication-incompetent lentiviral
vectors, highly variable ratios of infectious/noninfectious units
have been reported in literature for in vitro produced HIV-1
supernatant (ranging from 1/102 to 1/107) [46,47,48,49]. These
ratios are influenced by several factors, such as the type of virion
producing cell, type and density of the target cell, the infection
protocol and the HIV-1 strain [40,48,49,50,51]. If a precise
estimation of the transducing or infectious capacity is necessary, it
is therefore recommended to establish titers of the particular
vector or HIV virus with a functional titration method immedi-
ately on the cell line of interest [5,52]. However, if fixed
transduction or infection levels are not necessary, a more rapid
estimation of physical particle content, with for instance the SG-
Figure 5. SG-PERT assay on ABI 7300 Real-Time PCR System. (A) Amplification curves of indicated amount of replication competent HIV-1(NL4-3 strain) (ng p24/mL) obtained by SG-PERT on the ABI 7300 instrument. The horizontal line represents the threshold line used to calculate Cqvalues. (B) Correlation between input levels of replication-competent HIV-1 virus and Cq values obtained by SG-PERT on the ABI 7300 instrument. p24antigen concentration in the undiluted samples (value ‘‘0’’ on x-axis) was 3,100 ng/mL.doi:10.1371/journal.pone.0050859.g005
Quantification of Reverse Transcriptase Activity
PLOS ONE | www.plosone.org 10 December 2012 | Volume 7 | Issue 12 | e50859

PERT assay, is often sufficient to assess quality control of the viral
production or to normalize the number of viral particles before
transduction or infection. It should be noted that the actual
number of RT-containing viral particles might be different from
the ones estimated in Table 1, since the RT activity per virion
might be dependent on both the origin of the HIV RT packed in
the viral particles as well as the source of the recombinant RT used
for quantification in the SG-PERT assay. In addition, we cannot
exclude that some of the RT activity is not bound to a viral
particle. Nevertheless, these results indicate that, similar to the p24
antigen concentration, the virion associated RT activity most likely
provides an estimate of the physical particle content in lentiviral
supernatant, which strongly correlates with the functional particle
content for both replication-incompetent lentiviral vectors and
replication-competent HIV-1 virus.
Correlation between RT activity and infectious units of
replication competent HIV-1 virus has been investigated by others
in the past [39,40,53,54]. Although one study found RT activity to
be a poor predictor of virion infectivity [54], most of them
observed a correlation between infectivity and the RT activity
measured in the supernatant by conventional non-PERT RT
assays [39,40,53]. It has to be noted that these studies were done
on primary HIV isolates and the presence of correlation appeared
to be dependent on whether or not viruses were grouped
according to coreceptor usage or subtype [39,40]. Since our study
evaluated different productions of the same HIV-1 strain (NL4-3),
a correlation between RT activity and relative levels of infectious
units is in agreement with these studies and indicates that the SG-
PERT assay is a fast and worthy alternative for non-PERT RT
assays in these types of studies. In contrast to RT activity, p24
antigen levels show a poor correlation with levels of infectious HIV
units in most studies [39,40,53,54]. In this regard, it has been
reported that RT activity might present an intermediate of
physical and functional particle concentration. This was based on
the observation that the levels of RT activity and infectious units in
HIV-1 infected cell cultures over time show a rapid decrease after
reaching peak levels, while p24 antigen levels further accumulate
and subsequently reach a plateau phase. These authors therefore
assume a short half life of RT activity, while p24 proteins are still
detected upon decay of infectious particles [39,40]. In the present
study, p24-RT activity correlation was evaluated in supernatant
collected from transfected 293T or 293TN cells at 2 or 3 days post
transfection. Since the levels of transducing units in these
preparations also correlated with p24 levels (data not shown),
viral particle decay is probably still limited at this time-point [5].
However, when monitoring lentiviral replication levels over
prolonged periods of time, assessment of RT activity levels might
provide a more accurate result compared to p24 antigen levels.
Implementation of the SG-PERT assay in our laboratory was
found to be easy. A lab equipped for qPCR assays only needs to
acquire the MS2 RNA template, MS2 specific primers, and a small
amount of the recombinant RT of interest. The Triton X-100
based lysis buffer can be prepared from routine chemical
ingredients and a standard curve can be established from any
high-titer retroviral preparation of choice. We calculated that the
current reagents cost of the SG-PERT assay using the Light-
CyclerH 480 and associated reaction mix is about 10 times lower
per retroviral quantification compared to determination of p24
antigen levels with a commercial ELISA kit. Moreover, since the
limited linear range of quantification of the ELISA assay often
requires the measurement of 3 different dilutions per sample, cost
and labor increase even more. Furthermore, while titer quantifi-
cation of 30 samples by ELISA can take up to six hours of hands-
on labor time, the SG-PERT assay requires less than 2 hours
hands-on time and is amenable to automation and further
reduction in reaction volumes.
In summary, this paper shows that the SG-PERT assay with
commercially available MS2 RNA and qPCR reaction mixes is
a robust and accurate method for retroviral quantification. Titer
determination by this assay correlates well with those of other
frequently applied methods. Combined with its low cost, fast
procedure and easy implementation, it is an attractive alternative
for use in virology and molecular biology research.
Acknowledgments
We thank Programme EVA Centre for AIDS Reagents, NIBSC, UK and
Dr. Q. Sattentau, University of Oxford, U.K.; Dr P. Achacoso and Dr G.P.
Nolan, Stanford University School of Medicine, Stanford, CA for
providing us with Jurkat CD4 CCR5 and Phoenix-A cells, respectively.
The following reagents were obtained through the AIDS Research and
Reference Reagent Program, Division of AIDS, NIAID, NIH: P4.R5
MAGI from Dr. Nathaniel Landau and ritonavir. We would also like to
acknowledge Dr. D.N. Levy, New York University college of Dentistry,
New York, NY; Dr. M.J. Tremblay, Faculte de Medecine, Universite
Laval, Quebec, Canada; and Dr. F. Kirchhoff, Institute of Virology,
University of Ulm, Ulm, Germany for the kind donation of NLENG1-
IRES, NL43-IRES-HSA and NL43-IRES-eGFP HIV constructs, re-
spectively.
Author Contributions
Conceived and designed the experiments: JV MP BV. Performed the
experiments: JV EN HV. Analyzed the data: JV BV. Contributed
reagents/materials/analysis tools: AL VI AVN TT. Wrote the paper: JV
BV.
References
1. Naldini L, Blomer U, Gallay P, Ory D, Mulligan R, et al. (1996) In vivo gene
delivery and stable transduction of nondividing cells by a lentiviral vector.
Science 272: 263–267.
2. Stove V, Smits K, Naessens E, Plum J, Verhasselt B (2006) Multiple gene knock-out by a single lentiviral vector expressing an array of short hairpin RNAs.:
Electron J of Biotechnol 9: 572–579. Available: http://www.ejbiotechnology.info/content/vol9/issue5/full/13/index.html.
3. Dropulic B (2011) Lentiviral vectors: their molecular design, safety, and use in
laboratory and preclinical research. Hum Gene Ther 22: 649–657.
4. D’Costa J, Mansfield SG, Humeau LM (2009) Lentiviral vectors in clinical trials:Current status. Curr Opin Mol Ther 11: 554–564.
5. Geraerts M, Willems S, Baekelandt V, Debyser Z, Gijsbers R (2006)
Comparison of lentiviral vector titration methods. BMC biotechnol 6: 34.
6. Delenda C, Gaillard C (2005) Real-time quantitative PCR for the design oflentiviral vector analytical assays. Gene Ther 12 Suppl 1: S36–50.
7. Roy-Burman P, Dougherty M, Pal BK, Charman HP, Klement V, et al. (1976)
Assay for type C virus in mouse sera based on particulate reverse transcriptase
activity. J Virol 19: 1107–1110.
8. Eberle J, Seibl R (1992) A new method for measuring reverse transcriptaseactivity by ELISA. J Virol Methods 40: 347–356.
9. Sears JF, Repaske R, Khan AS (1999) Improved Mg2+-based reverse
transcriptase assay for detection of primate retroviruses. J Clin Microbiol 37:
1704–1708.
10. Chang A, Ostrove JM, Bird RE (1997) Development of an improved productenhanced reverse transcriptase assay. J Virol Methods 65: 45–54.
11. Fan XY, Lu GZ, Wu LN, Chen JH, Xu WQ, et al. (2006) A modified single-
tube one-step product-enhanced reverse transcriptase (mSTOS-PERT) assay
with heparin as DNA polymerase inhibitor for specific detection of RTaseactivity. J Clin Virol 37: 305–312.
12. Garcia Lerma JG, Yamamoto S, Gomez-Cano M, Soriano V, Green TA, et al.
(1998) Measurement of human immunodeficiency virus type 1 plasma virus load
based on reverse transcriptase (RT) activity: evidence of variabilities in levels ofvirion-associated RT. J Infect Dis 177: 1221–1229.
13. Pyra H, Boni J, Schupbach J (1994) Ultrasensitive retrovirus detection by
a reverse transcriptase assay based on product enhancement. Proc Natl Acad
Sci U S A 91: 1544–1548.
Quantification of Reverse Transcriptase Activity
PLOS ONE | www.plosone.org 11 December 2012 | Volume 7 | Issue 12 | e50859

14. Silver J, Maudru T, Fujita K, Repaske R (1993) An RT-PCR assay for the
enzyme activity of reverse transcriptase capable of detecting single virions.Nucleic Acids Res 21: 3593–3594.
15. Yamamoto S, Folks TM, Heneine W (1996) Highly sensitive qualitative and
quantitative detection of reverse transcriptase activity: optimization, validation,and comparative analysis with other detection systems. J Virol Methods 61: 135–
143.16. Arnold BA, Hepler RW, Keller PM (1998) One-step fluorescent probe product-
enhanced reverse transcriptase assay. Biotechniques 25: 98–106.
17. Lovatt A, Black J, Galbraith D, Doherty I, Moran MW, et al. (1999) Highthroughput detection of retrovirus-associated reverse transcriptase using an
improved fluorescent product enhanced reverse transcriptase assay and itscomparison to conventional detection methods. J Virol Methods 82: 185–200.
18. Ma YK, Khan AS (2009) Evaluation of different RT enzyme standards forquantitation of retroviruses using the single-tube fluorescent product-enhanced
reverse transcriptase assay. J Virol Methods 157: 133–140.
19. Maudru T, Peden KW (1998) Adaptation of the fluorogenic 59-nucleasechemistry to a PCR-based reverse transcriptase assay. Biotechniques 25: 972–
975.20. Sears JF, Khan AS (2003) Single-tube fluorescent product-enhanced reverse
transcriptase assay with Ampliwax (STF-PERT) for retrovirus quantitation.
J Virol Methods 108: 139–142.21. Pizzato M, Erlwein O, Bonsall D, Kaye S, Muir D, et al. (2009) A one-step
SYBR Green I-based product-enhanced reverse transcriptase assay for thequantitation of retroviruses in cell culture supernatants. J Virol Methods 156: 1–
7.22. Boni J, Stalder J, Reigel F, Schupbach J (1996) Detection of reverse transcriptase
activity in live attenuated virus vaccines. Clin Diagn Virol 5: 43–53.
23. Brorson K, Swann PG, Lizzio E, Maudru T, Peden K, et al. (2001) Use ofa quantitative product-enhanced reverse transcriptase assay to monitor
retrovirus levels in mAb cell-culture and downstream processing. BiotechnolProg 17: 188–196.
24. Brorson K, Xu Y, Swann PG, Hamilton E, Mustafa M, et al. (2002) Evaluation
of a quantitative product-enhanced reverse transcriptase assay to monitorretrovirus in mAb cell-culture. Biologicals 30: 15–26.
25. Clemenceau B, Jegou D, Martignat L, Sai P (2001) Long-term follow-up failed todetect in vitro transmission of full-length porcine endogenous retroviruses from
specific pathogen-free pig islets to human cells. Diab tologia 44: 2044–2055.26. Heneine W, Switzer WM, Soucie JM, Evatt BL, Shanmugam V, et al. (2001)
Evidence of porcine endogenous retroviruses in porcine factor VIII and
evaluation of transmission to recipients with hemophilia. J Infect Dis 183: 648–652.
27. Hussain AI, Johnson JA, Da Silva Freire M, Heneine W (2003) Identificationand characterization of avian retroviruses in chicken embryo-derived yellow
fever vaccines: investigation of transmission to vaccine recipients. J Virol 77:
1105–1111.28. Johnson JA, Heneine W (2001) Characterization of endogenous avian leukosis
viruses in chicken embryonic fibroblast substrates used in production of measlesand mumps vaccines. J Virol 75: 3605–3612.
29. Khan AS, Maudru T, Thompson A, Muller J, Sears JF, et al. (1998) The reversetranscriptase activity in cell-free medium of chicken embryo fibroblast cultures is
not associated with a replication-competent retrovirus. J Clin Virol 11: 7–18.
30. Maudru T, Peden KW (1998) Analysis of a coded panel of licensed vaccines bypolymerase chain reaction-based reverse transcriptase assays: a collaborative
study [seecomments]. J Clin Virol 11: 19–28.31. Shahabuddin M, Sears JF, Khan AS (2001) No evidence of infectious
retroviruses in measles virus vaccines produced in chicken embryo cell cultures.
J Clin Microbiol 39: 675–684.32. Stove V, Van de Walle I, Naessens E, Coene E, Stove C, et al. (2005) Human
immunodeficiency virus Nef induces rapid internalization of the T-cellcoreceptor CD8alphabeta. J Virol 79: 11422–11433.
33. Charneau P, Mirambeau G, Roux P, Paulous S, Buc H, et al. (1994) HIV-1
reverse transcription. A termination step at the center of the genome. J Mol Biol241: 651–662.
34. Levy DN, Aldrovandi GM, Kutsch O, Shaw GM (2004) Dynamics of HIV-1recombination in its natural target cells. Proc Natl Acad Sci U S A 101: 4204–
4209.
35. Imbeault M, Lodge R, Ouellet M, Tremblay MJ (2009) Efficient magnetic bead-based separation of HIV-1-infected cells using an improved reporter virus system
reveals that p53 up-regulation occurs exclusively in the virus-expressing cell
population. Virology 393: 160–167.
36. Munch J, Rajan D, Schindler M, Specht A, Rucker E, et al. (2007) Nef-mediated
enhancement of virion infectivity and stimulation of viral replication are
fundamental properties of primate lentiviruses. J Virol 81: 13852–13864.
37. Stove V, Naessens E, Stove C, Swigut T, Plum J, et al. (2003) Signaling but not
trafficking function of HIV-1 protein Nef is essential for Nef-induced defects in
human intrathymic T-cell development. Blood 102: 2925–2932.
38. Verhasselt B, Naessens E, Verhofstede C, De Smedt M, Schollen S, et al. (1999)
Human immunodeficiency virus nef gene expression affects generation and
function of human T cells, but not dendritic cells. Blood 94: 2809–2818.
39. Tschochner M, Schwingel E, Thein C, Wittmann S, Paatz C, et al. (2007)
Superiority of infectivity-based over particle-based methods for quantitation ofdrug resistant HIV-1 as inocula for cell cultures. J Virol Methods 141: 87–96.
40. Marozsan AJ, Fraundorf E, Abraha A, Baird H, Moore D, et al. (2004)
Relationships between infectious titer, capsid protein levels, and reversetranscriptase activities of diverse human immunodeficiency virus type 1 isolates.
J Virol 78: 11130–11141.
41. Sastry L, Johnson T, Hobson MJ, Smucker B, Cornetta K (2002) Titeringlentiviral vectors: comparison of DNA, RNA and marker expression methods.
Gene Ther 9: 1155–1162.
42. Lizee G, Aerts JL, Gonzales MI, Chinnasamy N, Morgan RA, et al. (2003) Real-time quantitative reverse transcriptase-polymerase chain reaction as a method
for determining lentiviral vector titers and measuring transgene expression. Hum
Gene Ther 14: 497–507.
43. Ikeda Y, Collins MK, Radcliffe PA, Mitrophanous KA, Takeuchi Y (2002) Gene
transduction efficiency in cells of different species by HIV and EIAV vectors.
Gene Ther 9: 932–938.
44. Sanchez-Antequera Y, Mykhaylyk O, van Til NP, Cengizeroglu A, de Jong JH,
et al. (2011) Magselectofection: an integrated method of nanomagneticseparation and genetic modification of target cells. Blood 117: e171–181.
45. Logan AC, Nightingale SJ, Haas DL, Cho GJ, Pepper KA, et al. (2004) Factors
influencing the titer and infectivity of lentiviral vectors. Hum Gene Ther 15:976–988.
46. Bourinbaiar AS (1994) The ratio of defective HIV-1 particles to replication-
competent infectious virions. Acta Virol 38: 59–61.
47. Kimpton J, Emerman M (1992) Detection of replication-competent and
pseudotyped human immunodeficiency virus with a sensitive cell line on the
basis of activation of an integrated beta-galactosidase gene. J Virol 66: 2232–2239.
48. Layne SP, Merges MJ, Dembo M, Spouge JL, Conley SR, et al. (1992) Factors
underlying spontaneous inactivation and susceptibility to neutralization ofhuman immunodeficiency virus. Virology 189: 695–714.
49. Thomas JA, Ott DE, Gorelick RJ (2007) Efficiency of human immunodeficiencyvirus type 1 postentry infection processes: evidence against disproportionate
numbers of defective virions. J Virol 81: 4367–4370.
50. Platt EJ, Kozak SL, Durnin JP, Hope TJ, Kabat D (2010) Rapid dissociation ofHIV-1 from cultured cells severely limits infectivity assays, causes the
inactivation ascribed to entry inhibitors, and masks the inherently high level of
infectivity of virions. J Virol 84: 3106–3110.
51. Cortes MJ, Wong-Staal F, Lama J (2002) Cell surface CD4 interferes with the
infectivity of HIV-1 particles released from T cells. J Biol Chem 277: 1770–1779.
52. Zhang B, Metharom P, Jullie H, Ellem KA, Cleghorn G, et al. (2004) Thesignificance of controlled conditions in lentiviral vector titration and in the use of
multiplicity of infection (MOI) for predicting gene transfer events. Genet
Vaccines Ther 2: 6.
53. Ball SC, Abraha A, Collins KR, Marozsan AJ, Baird H, et al. (2003) Comparing
the ex vivo fitness of CCR5-tropic human immunodeficiency virus type 1 isolates
of subtypes B and C. J Virol 77: 1021–1038.
54. Michael NL, Herman SA, Kwok S, Dreyer K, Wang J, et al. (1999)
Development of calibrated viral load standards for group M subtypes of humanimmunodeficiency virus type 1 and performance of an improved AMPLICOR
HIV-1 MONITOR test with isolates of diverse subtypes. J Clin Microbiol 37:
2557–2563.
Quantification of Reverse Transcriptase Activity
PLOS ONE | www.plosone.org 12 December 2012 | Volume 7 | Issue 12 | e50859
Copyright © 2022 FDOKUMEN