PUB-8176 - World Bank Documents
250
A WORLD BANK COUNTRY STUDY PUB-8176 Argentina Provincial Government Finances p,~~~~~~ S2. k~~~ ,.~¿i r ruw Public Disclosure Authorized Public Disclosure Authorized Public Disclosure Authorized Public Disclosure Authorized Public Disclosure Authorized Public Disclosure Authorized Public Disclosure Authorized Public Disclosure Authorized
-
Upload
khangminh22 -
Category
Documents
-
view
0 -
download
0
Transcript of PUB-8176 - World Bank Documents

A WORLD BANK COUNTRY STUDY
PUB-8176
ArgentinaProvincial Government Finances
p,~~~~~~ S2.
k~~~~~~~~~~~~~~.,.~¿i r
ruw
Pub
lic D
iscl
osur
e A
utho
rized
Pub
lic D
iscl
osur
e A
utho
rized
Pub
lic D
iscl
osur
e A
utho
rized
Pub
lic D
iscl
osur
e A
utho
rized
Pub
lic D
iscl
osur
e A
utho
rized
Pub
lic D
iscl
osur
e A
utho
rized
Pub
lic D
iscl
osur
e A
utho
rized
Pub
lic D
iscl
osur
e A
utho
rized


A WORLD BANK COUNTRY STUDY
ArgentinaProvincial Government Finances
The World BankWashington, D.C

Copyright 0 1990The International Bank for Reconstructionand Development/THE WORLD BANKs1818 H Street, N.W.Washington, D.C. 20433, U.S.A.
AUi nghts reservedManufactured in the United States of AmericaFirst printing August 1990
World Bank Country Studies are aunong the many reports originally prepared for internal useas part of the continuing analysis by the Bank of the economic and related conditions of itsdeveloping member countries and of its dialogues with the govermments. Sorne of the reports arepublished in this series with the least possible delay for the use of governments and theacademic, business and financial, and development comnmunities. The typescript of this papertherefore has not been prepared in accordance with the procedures appropriate to formal printedtextt, and the World Bank accepts no responsíbility for errors.
The World Bank does not guarantee the accuracy of the data induded in thii publication andacceptt no responsibility whatsoever for any consequence of their use. Any naLps that accompanythe text have been prepared solely fCr the convenience of readers; the designations andpresentation of material in them do not imply the expression of any opinion whatsoever on thepart of the World Bank, its affiliates, or its Board or member countries conceming the legal statusof any country, territory, city, or area or of the authorities thereof or concerning the delimitationof its boundaries or its national affiliation.
The material in this publication is copyrighted. Requests for permission to reproduce portionsof it should be sent to Director, Publications Department, at the address shown in the copyrightnotice above. The World Bank encourages dissemination of its work and will normally givepermission promptly and, when the reproduction is for noncommercial purposes, without askinga fee. Permission to photocopy portions for classroom use is not required, though notification ofsuch use having been made will be appreciated.
The complete backlist of publications from the World Bank is shown in the annual Index ofPublications, which contains an alphabetical title list (with full ordering informa.tion) and indexesof subjects, authors, and countries and regions. The latest edition is available free of charge fromthe Publications Sales Unit, Department F, The World Bank, 1818 H Street, N.W., Washington,D.C. 20433, U.S.A., or from Publications, The World Bank, 66, avenue d'Iéna, 75116 Paris, France.
ISSN: 0253-2123
Libray of Congress Cataloging-in-Publication Data
Argentina, provincial covernuent finances.p. cm. -- (A World Bank country study)
ISBN 0-8213-1634-61. Finance, Public--Argentina--Provinces. I. International Bankfor Reconstruction and Development. II. SeriesHJ906.A495 1990 90-42637336'.01382--dc20 CIP

PBEFACE
This report lo based partially on the findings of a missionthat visited Argentina from July 15 (seven days after the inauguration of thenew Government) through August 1, 1989. The mission comprised the followingmembere:
James Hicks (Misesion Leader);David Vetter (Public Finance);Lubomir Ficinski (Expenditure Planning and Execution);Humberto Petrei (Budgeting); andBarbara Nunberg (Personnel Policies and Practices).
Prior to the mission, extensive field work, coordinated byMr. Vetter, wag undertaken by Alfredo Perazzo and Guillermo Diaz. Theseconsultante visited the six case study Provinces (Buenos Aires, Chubut,Cordoba, Salta, Santiago del Estero, and Santa Fe), and collected detailedfinancial data that prevíously had not been available in a central place.Thelr final report (May 1989) provided invaluable support to the miesion.Thlu report, together with the individual reports of the other missionmember., were used by Mesers. Hicks and Vetter in writing the present report.
The July 1989 mission, and subsequent missions in December1989 and Hay 1990, visited the Provinces of Buenos Aires, Cordoba, La Pampa,Mendoza, Neuquen and Santa Fe, primarily for investigation of budgetingprocedures, tax administration, personnel procedures, and expenditure planningand execution. Duríng these latter missions, the substantial progresoachieved In lmplementing (with support from a Project Preparation FacilityAdvance from the World Bank) the Provincial Government Financial ManagementInformation System was reviewed. This progress includes reporting andanalyols of the 1987-89 executed budgets for all provinces. Although the1987-89 budget Lnformation was not available when this study was prepared, asummary of this period's provincial budget performance la presented inSection D of the Executive Summary.
A great debt of gratitude le due the national officiale,that supported the miesions, as well as the authorities and staffs of theProvinces of Buenos Aires, Chubut, Cordoba, La Pampa, Mendoza, Neuquen, Salta,Santa Fe, and Santiago del Estero; without their cooperation and support, thisreport would not have been possible.
lii

currency Equivalente
Due to the extremely high ratee of inflation in Argentina, al:l
monetary units are expressed in US dollare of July 1988. Argentine currency
is transformed into Australes of this date using a weighted average of the
Consumer Price Index for Buenos Aires (50 percent) and the Wholesale Price
Index of INDEC (50 percent) and, then, into dollars using the average exchange
rate of the "mercado financiero" for July 1988 (US$1 = 12.28 Australes>. The
rate of the "mercado financiero" was slightly above that of the "mercado
paralelo" for this month.
Fiscal Year
January 1 - December 31
Gloesary of Abbreviations and Acronyms
CFI Federal Investment Cauncil
(Consejo Federal de Inversiones)
FAP Financial Action Plan
FEDEI Special Fund for Electrification of the Interior
(Fondo Especial para Eletrificacion del Interior)
FIEL Foundation for Latin American Economic Studies
(Fundacion de Investigaciones Economicas Latinoamericanas)
FMIS Financial Management Information System
FONAVI National Housing Fund(Fondo Nacional ¿te la Vivienda)
GDP Gross Domestic Product
GPP Gross Provincial Prodluct
INDEC National Institute of Statistics and Censuses(Instituto Nacional de Estadistica y Censos)
IMF International Monetary Fund
OB Output-Oriented Budgeting
PBS Provincial Planning and Budgeting System
TPI Tranefers for Provincial Investments
iv

TABLE OF CONTENTS
EXECUTIVE SUMARY . . . . . . . . . . . . . . . . . . . . . . . . . . vii
PART 1 - MAIN REPORT
CHAPTER 1: INTRODUCTION . . . . . . . . . . . . . . . . . . . . . . . 1
A. Importance of the Study . . . . . . . . . . . . . . . . . . . 1B. Objectives . . . . . . . . . . . . . . . . . . . . . . . . . 4
C. Interfaces with Other Bank Studies and Limitations . . . . . 5
D. Coverage . . . . . . . . . . . . . . . . . . . . . . . . . . 6
E. Methodology and Sources of Data . . . . . . . . . . . . . . . 8
CHAPTER II: OVERVIEW OF THE PROVINCES IN ARGENTINA'S PUBLIC SECTOR . . 13
A. International Comparisons of Fiscal Decentralization . . . . 13B. Four Types of Transfers from the Central Government . . . . . 13
C. Fiscal Federalism in Argentina . . . . . . . . . . . . . . . . 15
D. The Revenue Sharing Law of 1987 . . . . . . . . . . . . . . . 19
E. Summary and Recommendations . . . . . . . . . . . . . . . . . 28
CHAPTER III: PROVINCIAL REVENUES . . . . . . . . . . . . . . . . . . . 33
A. Provincial Own-Source Revenues . . . . . . . . . . . . . . . 33
B. Comparatíve Performance on Current Revenues . . . . . . . . . 38C. The Efficiency of Revenue Collection . . . . . . . . . . . . 43
D. Recommendations for Increasing Provincial Revenues . . . . . 50
E. Simulation of Total Impact of Improved Tax Collection . . . 54
CHAPTER IV: PROVINCIAL EXPENDITURES . . . . . . . . . . . . . . . . . 57
A. Current Expenditures . . . . . . . . . . . . . . . . . . . . . 57
B. Capital Spending . . . . . . . . . . . . . . . . . . . . . . . 64C. Comparative Evaluation of Expenditures . . . . . . . . . . . . 64
D. The Distribution of Expenditures by Functional Categories . . 65E. Distribution of Benefits from Public Expenditures . . . . . . 67
F. Increasing the Efficiency and Equity of Resource Allocation 67
CHAPTER V: PROVINCIAL DEFICITS AND SOURCES OF CREDIT . . . . . . . . . 72
A. The Rapid Rise of the Provincial Fiscal Deficit . . . . . . . 72
B. Financing the Provincial Deficit . . . . . . . . . . . . . . . 75C. Recommendations . . . . . . . . . . . . . . . . . . . . . . . 79
CHAPTER VI: BUDGETING, EXPENDITURE PLANNING AND IMPLEMENTATION . . . . 81
A. A Normative Introduction . . . . . . . . . . . . . . . . . . . 81B. Assessment of the Current Situation: Budgeting . . . . . . . . 82
v

vi
C. An Aseessment of the Current Situation: Expenditure Planning. 86D. Assessment of Current Situation: Project Execution and
Procurement ... . ....... . . . . 89E. An Agenda for Improving Expenditure Planning and Budgeting . . 92
CRAPTFR VII: A STRATEGY FOR PROVINCIAL FISCAL REFORM AND EXPENDITUREEFFICIBNCY . . . . . . . . . . . . . . . . . . . . . . . 102
A. Design Criteria for the Strategy ... . . . . . . . . . . 103B. Instrumento and Actioris Required for Strategy Implementation 105
PART II: IAiXEKES AND STATISTICAL APPENDIX
INTRODUCTION . . . . . . . . . . . . . . . . . . . . . .. . . . . ;117
ANNfX CHAPTER 1. OVFRVIEW OF THI PUBLIC FINANCE DATA AND REPORTIMIPRCDURES . . . . . . . . . . . . . . . . . . . . . . . . . . 118
A. Government Structure for Provision of Public Servi.ces . . . 118
B. The Availability of Data ... . . . . .. 118C. The Reporting System fo.r Provincial Public Finance Data . . 120D. Transfers from the Central Government ... . .. . . . . . 125E. Rationale for Inter-goverrnmental Traneifers .. . . 127
A~nNX CHAPTER II. SOCIO-ECONOMIC< STRATIFICATION OF THF PROVINCES . . 129
A. The CFI Stratification of Provinces .1.. . . . . . . . . . 129B. Population, Product: and Poverty by Province and CFI Group . 1.30
ANNEX CHAPTER III. FIELD WORK IN THE PROVINCtS . . . . . . . . . . . 132
8TATISTICAL APPENDIX . . . . . . . . . . . . . . . . . . . . . . . . 134
TABLE OF COOTENTS . . . . . . . . . . . . . . . . . . . . . . . . . . 134
Tables 1 - 25 ............. ....... ...... . 137_ 2.18
MAPz IBRD 20474

vii
EXECUTIVE SUNMARY
1. Reducing the public sector deficit is of fundamentalimportance for success of Argentina's medium-term adjustment program,and to address the underlying structural problems and sources ofinstability in ite economy. There have been three major sources of thisdeficit: (a) the Central Government itself, including the officialbanking and finance entities, as well as social security; (b) the publicsector enterprises; and (c) the provincial governments.
2. Successful implementation of the medium-term adjustmentprogram must include, of course, measures to adequately address allthree sources of this deficit. In the past, only the Central Governmentand public enterprises have received priority analysis regarding theirroles in creating excessive public sector deficits. Increasingly,however, it has been recognized by national and provincial authoritiesthat the provincial governments cannot be ignored in the nationaladjustment program, as the provinces have become the largest, andfastest growing, contributors to the consolidated public sector deficit.
3. Thus, despite its fundamental importance to macroeconomicpolicy formulation and implementation, provincial public financegenerally has not received the attention that its importance in nationalfiscal policy requires. This is partly because the provinces aredifficult and costly to study, in that they are numerous (22),institutionally complex, extremely heterogeneous by almost anyindicator, and spatially dispersed. Furthermore, there are not evenadequate up-to-date data on provincial public finance.
4. 1/ While provincial expenditures rose rapidly over the 1970-86period,- reaching over 11.2 percent of GDP in 1986, total own-sourceprovincial revenues actually dropped from a high of 5.6 percent of GDPin 1980 to only 5.0 percent of GDP in 1986. The total fiscal deficit ofthe provinces in 1986 before transfers from the central government was6.2 percent of GDP (about US$4 billion), much higher than the public
1/ For a description of the distribution of service deliveryresponsibilities by level of government, see Annex Chapter I,Section A.

- viii -
sector enterprises and social security combined.2/ After transfers, tlheprovinces showed a slight fiscal surplus, but at the expense of helpingtransform the national administration's before transfer surplus of 5.4percent of GDP into a fiBcal deficit of 4.6 percent of GDP aftertransfers. Preliminary data indicate that the situation hasdeteriorated significantly since 1986.
5. A prime contrilbutor to these skyrocketing prcvincial deficitswas the perverse incentives that prevailed in national/provincialrelationships before the implementation of the Revenue Sharing Law in1988, in which provincial financial mis-management generally wasrewarded by ad hoc transfers from the Central Government or bysubsidized loans from the Central Bank. Before implementation of thisnew Revenue Sharing Law, tranefere predominantly were discretionarygrants from the Secretari.a de Hacienda that were neither transparent norpredictable. Also, the C'entral Bank has provided rediscounts oroverdrafts for the Provincial Banks to meet the liquidity crisis caused'by their deficit financirng to the provincial governmenta. Theseprovincial/national finarncia]. practices have contributed tounsustainable public sector fiscal and quasi-fiscal deficits, and theircontinuation would undermfine national efforts to attain price stabilityand to promote sustainable economic development.
6. Although the necesEity of bringing irresponsible provincialdeficits under control is of utmost and urgent concern, the role of theprovinces in promoting Argentinals economic development must not beneglected. The provinces are increasingly important providers of publicservices, especially for education and health. Expenditures ofArgentina's provincial governments in 1986 amounted to 3.1.2 percent ofGDP (or US$7.8 billion) with investments accounting for 2.6 percent ofGDP (US$l.6 billion). The new Government's strategy of decentralizationshould substantially increase this importance.
7. The primary objective of this sector study is to assist theGovernment of Argentina in identifying and implementing appropriatemeasures that will result in an effective an,d equitable reduction in theProvinces' contribution to excessive, consolidated public sectordeficits. To meet this objective the study seeks to go beyond thedocumentation of how much provincial financial management hasdeteriorated. It also seE!ks:
(a) to identify relationships and incentives that explain why thiscrisis has devel.oped; and
2/ All transfers under the ad hoc revenue sharing agreements during1984-86 are treated as grants to the provinces, as the criteriaused in their distribution were neither predictable nortransparent. See para. 2.04 for a discussion.

- ix -
(b) to recommend to the Government a strategy for provincialfiscal reform and improved expenditure efficiency.
8. Chapters I and II present a description of the study'l acopeand methodology, as well as an overview of the provinces in Argentina,spublic sector. Chapters III-V provide analysis of provincial revenues,expenditures and sources of deficit financing. Chapter VI asaseesprovincial practices regarding budgeting, expenditure planning andimplementation, and Chapter VII recommends a strategy for provincialfiscal reform and improved expenditure efficiency. This Summarypresents the principal conclusions reached in this study, itsrecommended strategy for improvement, and finally an estimate of thepotential pay-off to result from implementation of the proposedstrategy.
A. Principal Conclusions
9. A basic conclusion of this study is that there is a stronggeneral consensus at both the central and provincial government levelson the need for fundamental reforms in the financial relationshipsbetween the Central and Provincial Governments. Reforms inintergovernmental financial relationships are an integral part of thestrategy outlined below, and the key to their succese is politicalcommitment at both provincial and central levels. At the provinciallevel, there ie an enormous potential for improved financial management,and these improvements do not require complicated or technicallydifficult initiatives. Rather, dramatic improvements may be attainedfrom quite simple reforms in provincial revenue and expenditureplanning, budgeting and administration. These reforme were not adoptedin the past due to the perverse incentives in the system ofintergovernmental transfers (para. 5), as well as inadequate controls ofrediscounting by provincial banks. National Government officials haveexpressed a firm commitment to the elimination of these perverseincentives, and provincial government officials have expressed stronglytheir desire for increased financial and political autonomy.Sustainable increases in provincial autonomy will require, however,significant improvements in provincial financial management. Theprimary areas for potential improvement are summarized below.
Increasing Revenues
10. There is a very wide margin for increasing provincial tax andnon-tax revenues by increasing the efficiency of billing and collectionprocedures. Just the most basic improvements in these collection andbilling procedures could increase revenues significantly, as well asreduce the inequities resulting from "free-riding` by those who are notbilled and by evaders.
11. Eventually, tax reform should eliminate the considerableoverlap of provincial taxes with those at the national and municipal

- x -
levels. In the meantime, the three levels should increase cooperationin the administration of these taxes.
12. The case studieis done in six provinces show that improvedbilling and collection procedures (e.g., better cadastres, informationsystems and management techniques) could substantially increaseprovincial tax revenues wi.thout raising nominal rates. 'Where feasibleand cost effective, billiriq and collection should be privatized (e.g.,as in the collection of delinquent property taxes in the province ofSanta Fe). After privatizing as much as is desirable and possible, anyadditional qualified staffE nec:essary for adequate tax administrationshould be recruited, if possible through reallocation andl training ofexisting provincial person,nel (thereby not increasing payrollexpenditures), or, as a last resort, by new hiring. Improved fiscalperformance would require not only better billing and more aggressivecollection, but aleo improvements in the quality of services that shouldhelp increase the willingness to pay taxes and fees.
13. Rough estimates based on "reasonable" improvements in taxadministration, without any nominal increases in tax rates or changes inlegislation, would produce a total increase in tax revenues of 38percent (US$461 milllon, or about 0.5 percent of GDP) for five of theprovinces studied.
14. Billing and collection of non-tax revenues tendl to be evenless efficient than for tax revenues. There is a clearly a need forgreater emphasis on cost recovery for public services through user feesand tariffs. This is especially true for the water companies whichoften require constant transfers from the provincial governments. Wateris rarely metered, and botlh billing and collection procedures are oftenmonumentally inefficient. Usera perceive the fees to be unfair, asthey are not based on actuall consumption. Also, consumere may notrespond to increases in tariff s (such as the very high ones of July1989) by reducing consumption. For all of these reasons, the watercompanies often represent a kind of "black hole-' in provincial publicfinance.
Reducing Expenditures and Increaging Their Efficiency
15. Expenditures for the general administrations of all provincesand the Federal Capital rose from 7.5 percent of GDP in 1970 to 11.2percent of GDP (or about US$8 billion) in 1986. The data from the casestudies show that expenditures increased by over seven percent in 1987,even though total revenues declined.
16. The driving force in the increase of current expenditures wasclearly personnel, but transfers to municipalities and other entitieswere also important. Provincial public employment in onlr the generaladministration increased by over 230,000 (34 percent) in all provincesduring the 1983-86 period, to 913,000 in 1986.

- xi -
17. Clearly, provincial personnel policies constitute a priorityarea of reform not only because personnel expenditures represent asizeable portion of total provincial expenditures (an average of 46percent between 1981 and 1986), but also because personneladministration systems in the provinces studied showed seriousdeficiencies in management capacity, resulting in inefficiency anddiminished incentives to performance.
18. A program to improve the management of provincial publicpersonnel systems should include several policy measures. First, thedata base neede to be strengthened. Most fundamental le theimplementation of a public employee census to determine the number andprofile of government personnel. Second, the links between thepersonnel management system and the payroll system should bestrengthened, so that cross-checking between the two systems can be usedto identify ghost workers or double employment. Any gaps between thesetwo systems should be analyzed and closed.
19. Where high employment, low salaries and wage compression areacute, a careful strategy of rationalization should be developed, withcost estimates for ite implementation. Employment reduction and theredistribution of resulting salary savings to decompress the wagestructure and increase incentives to professional levels should be agoal In some cases.
20. Rationalization and control of transfers could produceimportant savinge for provinces. Discretionary grante to municipalitiesshould be reduced and/or replaced with automatic revenue sharingand matchíng grante tied to improved fiscal effort and efficíency.Transfere to public enterprises should be reduced to a minimum byimproving their efficiency and encouraging full coet recovery, as wellas by privatization. Laws regulating pension funde and other transfereto individuals should be reviewed and administrative procedurestightened to discourage abuses.
21. Basic improvements in organization and management ofprovincial governments, direct and indirect administration, could savemuch time and money for both the government and those needing services.
22. Direct subsidies should be transparent and clearly targeted tothe loweet income families. The provinces should emphasize provision ofthose services which tend to go to lower income groups, such as basiceducation.
Improving Fiscal Planning, Budgeting and Execution
23. Most provincial budgets currently are definitely not usefulinstrumento for the programming, management, control and evaluation ofpublic expenditures, because: they lack an adequate strategy forhandling inflation; the budget offices are under-staffed and under-equipped, as well as politically weak; the methodologies are deficient;

- xii -
coverage is incomplete; reporting is slow and not pertinent; and controlis merely legalistic.- The lack of an adequate strategy for dealingwith inflation leads to a number of important distortions in thebudgetary process, inclucling: the approval of the budget during or evenafter the fiscal year, serial budgeting and discontinuities in budgetexecution.
24. There are some changes that should be adopted immediately toimprove the budgeting process. First, a more systemati, way of dealincjwith inflation must be aclopted. Second, the central and decentralizedbudget offices should be strengthened by: giving them greater authorityin budget preparation, improving their information systiems and up-grading their personnel. Firially, the annual budget should be part of amedium term expenditure plan.
25. There are several approaches that may deal eflectively withinflation during budget formulation and execution. The Province ofMendoza employs a very sophisticated strategy (See Box 6.1 at the end ofChapter 6). As the budget is expressed in physical as well as monetaryunits, the Mendoza budget office can continually adjust budgetallotments to current prices, using actual market prices. However, itapproves expenditures only if revenues are sufficient tco cover them.This equilibration of exp,enditures and revenues does not requireapproval of the legislature. The opposite of this strategy could alsobe used: expenditures could be adjusted monthly or quarterly by the risein revenues, but with an option for review by the legislature, if totalreal expenditures rise or decline by a percentage defined in the law.For example, the legislature could specify that it would have the optionto review the budget, if total real expenditures were 20 percent higheror lower than those predicted for the time period. Yet another optionwould be to approve contingency measures for each of these eventualitiesas part of the budget.
26. Investment planning for new projects tends to be haphazard,and there is virtually no planning for preventive maintenance in mostprovinces. Project identification, evaluation and selection should beimproved by adopting more rigorous methodologies and strengthening theresponsible entities. Preventive maintenance plans shouLd be elaboratediand implemented.
27. Improvements in project execution procedures could cut atleast 15 percent in the construction cost of civil works and 10 percentin goods and services expenditures with no loss in qualitV. Thepotential savings for all provinces in 1986 are estimated at aboutUS$230 million in construction and at US$95 million in goods andservices for a total of US$325 million (about 0.5 percent of GDP).These estimates exclude provincial public enterprises.
3/ The Province of Mendoza is a notable exception. See para. 6.59.

- xiii -
28. To lower the cost of new investments, the provinces should:improve procurement procedures, abolish "Buy Argentina" and "Buy
Province" legislation, reduce design errors and changes, improve themethodology for adjusting prices for inflation, and establish aninformation system about projects and costs. For example, simpleimprovements in procurement procedures, such as adopting the lowestevaluated price for bid evaluation, could reduce current and capitalexpenditures by at least 10 percent, or about US$400 million. Also,elimination of "buy Argentina" and "buy province" legislation would notonly lower costs, but also help to modernize industry by stimulatingcompetition. Strategies for maximizing the impact of publicexpenditures on private investment should be developed. Provincesshould analyze their comparative advantages for different kinds of
activities (i.e., those that they could stimulate without subsidies),such as in the primary sector as well as in industry and tourism.Possible forward and backward linkages should also be explored. Forexample, the highest priority might be irrigation, which could in turnproduce demands for processing of the increased production, as well asfor inputs. Ways of informing the private sector of these opportunitiesshould be developed.
B. The Proposed Strategy for Reform
29. The need for fiscal reform in the provincial public sector isevident and fully supported by the officials at the national andprovincial levels. The objectives of this reform should not be just toreduce the deficit (although this is by far the most urgent), but alsoto transform the provinces into agents of development which generatesurpluses that they can invest wisely to increase total provincialproduct, thereby augmenting their future tax revenues.
30. To be successful, a strategy for provincial fiscal reform andimproved expenditure efficiency must encompass two dimensions: nationaland sub-national.
(a) At the national level, there must be in place a system ofintergovernmental transfers (including revenue sharing,matching grants and loans) that are predictable, transparent,financially sustainable, and that provide incentives toprovincial fiscal autonomy. The granting of credit to theprovincial banks by the Central Bank must be rigorouslycontrolled.
(b) The sub-national level of the strategy must include the entiresub-national public sector, not only provincial centraladministrations, but also their indirect administrations,including public enterprises, as well as direct and indirectmunicipal government administrations. A broad approach to theentire sub-national public sector is necessary because inArgentina's federal system, fiscal reform is only as strong as

- xiv -
the weakest link in the system. National public sectordeficit reduction efforts will fail if provincial governmentfinances are not sound, and these, in turn, will not be soundif provincial enterprises and/or municipalitiLes generatedeficite that demand provincial 'bail-outs" that eventuallywork their way up to the Central Bank or the NationalSecretaria de Hacienda.
Des gn Critería for the Strategy
31. The criteria for design of the strategy may be grouped in twobroad categories: intergovernmental tranefers and provincial financialmanagement. Implementation of an improved system of intergovernmentaltranefers ie the responsibility primarily of the Central Government,while responsibility for improved provincial financial management rests3with the provinces, although the Central Government may provide valuab]Leaseistance to them. A fundamental prerequisite for success informulating and implementing a strategy for provincial fiscal reform arndimproved expenditure effiLciency is a transparent (sanctioned throughlegielation and implemented through the budgetary process) anddieciplined proceso for eaccess to credit by the sub-national publicsector. Therefore, the Central Bank should continue to maintain etrictcontrole on rediscounts by provincial banks, thereby not allowing itefunde to be used by provincial banks to finance their provincialgovernment deficits. Furthermore, prudential regulation le required inmany provinces in order to have adequate discipline and control over theprovincial banke' operations. Without these disciplinary measures, thedetailed proposale presented below will be doomed to fa:ilure.
32. The Central Government and Intermovernmental rransfero. Thesystem for the transfer of revenues from the Central to ProvincialGovernmente (and from Provincial to Municipal Governments) should bebased predominantly on a revenue sharing system that is legally mandatedand formula-driven. This ie based on the normative position that arevenue sharing system should provide sufficient revenues to sub-national governmente so that, when combined with a reasonable revenueeffort by the sub-national governmente, these may at leatst adequatelyoperate and maintain their existing services. The overalí system ofintergovernmental tranefers should provide, therefore, not only areliable source of revenues to provinces, but also stron.g incentives toimproved provincial revenuae performance. Discretionary grants shouldform a emall part of the `pool" of resources flowing from the Central toProvincial Governments, basically limited to providing support inemergencies such as floodLng. New provincial investments should befinanced by provincial savringe in current account and by responsibleborrowing. Given this normative framework, the etrategy for provincialfiscal reform should include an intergovernmiental transfer system that:
(a) is predictable;(b) ¡e transparent;

- xv -
(c) provides transfers in sustainable and equitable quantities;and
(d) provides incentives to provincial fiscal autonomy.
33. Provincial Financial Management. Within the nationalframework described above, the strategy requires that provincialgovernments adopt financial management practices that promote:
(a) provincial financial autonomy;(b) management efficiency;(c) public accountability; and(d) expenditures that support sustainable economic development.
Instrumsnts and Actione Required for Strategy Implementation
34. Following the framework for strategy design, recommendationsfor strategy implementation are presented according to the policyinstrumente and actions to be taken by the Central and Provincial levelsof government. Implementation must be actively pursued by both levelsif the strategy le to be successful.
35. The recommended policies and actions to be taken at theCentral Government level may be summarized in three areas: RevenueSharing System; Special Transfer9 for Provincial Investments; andProvincial Financial Management Information System.
36. Revenue Sharing System. Although the current Revenue SharingSystem (RSS -- sistema de coparticipacion), regulated under the December1987 legislation, may be criticized on several grounds, it is a vastimprovement over the chaotic transfer system prevailing before it wentinto effect. To its merit, the current RSS fully meets two of thecriteria for intergovernmental fiscal relations set out above, in thatít provides shared revenues that are transparent and predictable forboth Central and Provincial Governments. The RSS alzo appears to befiscally sustainable, given reasonable levels of price stability. Inaddition, to the extent that all provinces recognize that nationalrevenue sharing will be the only guaranteed intergovernmental transferto be received from the Central Government, the RSS also providesincentives to provincial fiscal autonomy. However, its equity might becriticized, in that its inter-jurisdictional redistribution of revenuesresults in a flow of potential resources away from provinces with thegreatest number of households with unsatisfied basic needs.
37. lt ¡e recomnmended, therefore, that the basic RSS currently inplace not be changed in the near-term. As part of the continualevaluation of the system, however, it also is recommended that theCentral Government implement a system for monitoring the efficacy of thesystem, taking into account the criteria noted above (predictable,transparent, sustainable, equitable, and promoting provincial fiscalautonomy). Basic inputs for monitoring and evaluation of the RSS couldbe provided by the Provincial Financial Management Information System,

- xvi -
described below. EspeciaLly important is the evaluation of the fiscalimpacts resulting from decentralizing the responsibility for theprovision of public services to sub-national governments, such as therecent transfer of responmibility for secondary education to theprovinces. This continuing evaluation should also cover the relativeefficiency of different levelis of governments in the provision of publicservices, according to their different characteristics (e.g., populatiornsize, per capita product, etc.) It is very important, however, that thecontinual evaluation of the RSS, and eventual changes to improve it, notbe done solely on the bas;is of provincial financial management; rather,it should be made in the broader context of national fiscal policies forstabilization and economic development.
38. Special Transfero for Provincial Investments (TPI). The RSSshould be considered primarily as resources designated to meetprovincial recurrent expenditures. Creation of a new system of matchinggrants, the TPI, is recommrended, and it would be designed to meet threebasic needs: (a) to immediately provide strong national incentives toprovincial fiscal autonomy; (b) to provide financing for capitalimprovements programs in the near-term for those provinces that generatecurrent account savings; and (c) to promote, in the medium- and long-term, the transition of the financing of provincial capit:al investmentsfrom earmarked, segmented sources of funding to competitive, non-segmented financing through domestic financial markets.
39. Several alternatives for providing resources for the TPI maybe considered. First, ending the industrial promotion regime wouldeliminate a national fiscal drain estimated conservatively at 3.5percent of GDP, or close to US$2.5 billion, per year (see Chapter II,Section D). The provinces should develop new strategies for regionaldevelopment that would not require the subsidies of industrialpromotion--that would move with market forces rather than against them.This would involve identif,ying provincial comparative advantages insectors that could attract significant private investment. A part ofthe fiscal gain to be received by ending the industrial promotion regimecould be allocated to the TPI. As an alternative, or complement, to theabove, the TPI could be funded by the "pooling` of appropriate "specialpurpose' funds presently transEferred to provinces as current and capitalgrants (discretionary, earrnarked transfers) such as FEDEI, the nutritionand tobacco funds, etc. Together, these funds (excluding the HousingFund, FONAVI, which is considered a loan fund and reported "below theline") have amounted to alrnost one percent of GDP, or about US$600million per year, and they are transferred to provinces on an ad hocbasis, without regard to their financial performance. An alternativeto combining all of these funds into one new fund via legislation couldbe to allocate their resources as matching grants in accord withimprovements in fiscal efficiency via executive ordere.
40. Initially, the TE'I could be included as a line-item in thenational budget, with clear regulatíons for use of TPI funds.

- xvii -
Strong incentives to promote provincial fiscal autonomy would be
provided through strict criteria for provincial acceso to the TPI.Access to TPI grants would be limited to those provinces that have inplace a Financial Action Plan (see para. 49) that has resulted incurrent account savings (without grants) at least during the precedingquarter. Access to the TPI only after a province has begun to generatecurrent savings would provide not only a strong incentive for thesesavings, but also an incentive for provinces to improve their financialreporting systems.
41. The TPI would provide much-needed resources for capitalexpenditures in those provinces that have demonstrated the financialcapacity to properly operate and maintain their existing servicedelivery facilities and obligatione. This matching capital granttransfer mechanism should not be considered a permanent facility,however. Rather, it should be a transitory mechanism necessary toprovide incentives and support to the necessary structural changes inthe financial relationship between the Central and ProvincialGovernments.-
42. Thus, the TPI should be viewed as an initial step, moving awayfrom supporting provincial expenditures with national deficit financing,and toward the provinces eventually financing their investments withtheir own savings and with borrowing obtained through the nationalfinancial markets. Currently, however, Argentina's financial markets areunstable and segmented, and they are not efficiently mobilizing domesticsavings and allocating resources. Therefore, in the near-term, theTPI's key role would be to provide incentives fór provinces to becomesavers, thereby reducing sub-national government pressures on theconsolidated public sector deficit. Combined with deficit-reducingmeasures by the Central Government and its public enterprises, the TPIwould therefore contribute to the macroeconomic conditions necessary forthe financial sector to perform more efficiently.
43. As Argentinals financial markets attain acceptable levels ofdomestic savinga mobilization and of efficient resource allocation, theTPI could be phased out, with the provinces thereafter competing forfunds in non-segmented financial markets.
44. In summary, the proposed TPI would be guided by four generalprinciples:
(a) acceso to the TPI by provinces would be voluntary;
4/ One example of such a transitory measure was approved by theCongress in December 1989: it defines the sources of revenues andalso clear regulationa for their allocation among provinces,including the exclusion of provinces failing to undertake measuresto reduce their fiscal deficits.

- xviii -
(b) accees to TPI grarits would be competitive, w.Lth thoseprovinces maki.ng greater financial management improvemente(generating greater current account surpluses3) being eligibleto receive more fr-om the TPI;
(c) the quantity of funds allocated to the TPI, ag well as theconditions for transfer of these funds to provinces, would beconsistent with the national strategy for development andstrengthening over time of national financia]. markets; and
(d) TPI grant financing would be available only for expendituresthat are part of a provincial budget that has been accepted 'bya national authority on the basis of its verification that theexpenditures are directed to operations that are economicallyefficient, financially sustainable and institutionallymanageable (see discussion of the Provincial Planning andBudgeting System, PBS, para. 52).
45. Financial Management Information System. In order to providedata essential to macroeconomic policy formulation, as well as tomonitor provincial progreass toward fiscal autonomy, it is recommendedthat the Central Government move immediately to establish a ProvincialFinancial Management Information System (FMIS). Baseline date for theFM!S would be provided by the provinces through their Planning andBudgeting Systems (PBS, para. 52). Initially, the PBS would be theFinancial Action Plan to initiate the process, but a more comprehensiveexpenditure planning and budgeting system would be implemented overtime. The PBS would be the ]sey instrument for the planning, programmirngand control of provincial. revenues and expenditures. It also would bethe primary instrument for analysis of provincial eligi.bility for theTPI resources, in that it: would provide information on the economicefficiency and financial sustainability of the provincial plane.
46. The FMIS would serve two key functions. First, it wouldprovide the Central Government with a necessary input for nationalfiscal policy. Alzo, it wou].d provide the base on which to identifyprovincial neede for technical assistance for improved financialmanagement, and to design such assistance programs. Very usefulexperience in the design and implementation of such information systemscurrently is available in. the five provinces (Buenos Aires, Cordoba, LaPampa, Neuquen and Santa Fe) that are implementing the Bank financedMunicipal Development Prcject (Loan 2920-AR), where municipal financialmanagement information systems are being developed at the provinciallevel. The experience with t.he new budgeting system in the Province ofMendoza is also most interesting, showing how much can be done whenthere is a strong commitment to fiscal reform.
47. A prerequisite for making the FMIS useful, as well as all theother measures recommended for implementation at the Central Governmentlevel, i adequate institutional capacity to manage the overall proceso

- xix -
for restructuring provincial government financial management. There areseveral options for strengthening the Central Government's capacity tooverview the provincial development proceso, with thie proceso including(a) dimensioning and regulating the TPI, (b) development and analysis ofthe FMIS (including monitoring the performance of the RSS), and (c)review of PBSs. One option would be to strengthen the national Ministryof Economy's in-house capacity; another would be to contract with anappropriate technical aseista7ce entity, either a public institution(such as a university or CFI- ), or a private organization(such as FIEL, the Fundacion Mediterranea, or a consulting firm).Because of the transitory nature of the TPI and of national scrutiny ofthe PBSs, sonme contracting of outside support to the Central Governmentmay be the preferred option. In any case, however, a "baseline",permanent strengthening of the Ministry of Economy would be necessary toensure adequate linkages between the proposed FMIS and macroeconomicfiscal policy. Similar institutional support and strengthening would berequired in the provinces in order to implement the recommendations forprovincial government actions described below.
48. At the Provincial Government level, it is recommended that theprovinces undertake the following to implement the strategy for fiscalreform and improved expenditure efficiency: begin immediately toformulate Financial Action Plano; and initiate the design of ProvincialPlanning and Budgeting Systems.
49. FLnancial Action Plano. Provincial FAPe would be the first
step in moving toward provincial financial autonomy. They would becomprised of preliminary annual budgets for a three to five year period.The FAPs would emphasize measures that may be taken immediately toimprove performance, without the need for detailed studies orinformation systems. After the reform proceas is initiated under a FAP,more comprehensive measures could be undertaken through permanentProvincial Planning and Budgeting Systems as the FAP is phased out. Themain objective of the FAP is to identify simple measures that shouldincrease revenues and control expenditures so that the province mayproduce a current account surplus to be used for investments and toamortize loans.
50. on the revenue side, simple improvements in billing andcollection procedures would have considerable pay-offs. On theexpenditure side, the FAP would present the province's plans forreducing expenditures and increasing their efficiency, and it wouldinitiate their implementation. Three general areas appear to beparticularly important: personnel, procurement and investment design
5/ CFI (Consejo Federal de Inversiones) is a rather unique publicinstitution that is financed by a percentage of total provincialrevenue sharing, and ite Board of Governors is comprised of theGovernore of all the provinces. Thus, it is national in scope, butprovincial in focus.

- xx -
and execution. Personnel is by far the largest and fastest growingexpenditure category in most provinces.
51. In summary, the FAP involves implementation of therecommendations presented in the Chaptere I]I-V of this report(revenues, expenditures and deficit financing), and it would be thefiret step in implementing a more effective budgeting process in theprovinces in which the an;nual budget would be a comprehensive one-yearslice of the medium term plan.
52. Provincial Planning and Budgeting System. After an initialperiod (about one year) of implementation of the FAP, provinces couldthen move to implement their PBS. The recommendations of Chapter VIcould serve as guidelines for this, and the experience in Mendoza showsthat such reforms are feasible when political commitment is forthcoming.
53. The PBS would bts a key tool for provincial planning, budgetinqand control. It also would be fundamental for monitoring theeffectiveness of provincial management, not only by provincialauthorities, but also by the Central Government as it formulatesmacroeconomic policy and evaluates whether each province is eligible foraccese to the TPI. Key components of the PBS would include:
(a) planning and control of provincial revenues;
(b) expenditure priorit.es, including
(i) maintenance and rehabilitation
(ii) personnel policies that provide adequate professionalismand perfornmance
(iii) new investments, with projecte costing greater that anamount agreed with the Secretaria de Hacienda subject toa competent. benefit/cost analysis to ensure economicefficiency;
(c) reliable projections of total and incremental (with andwithout a proposed investment) revenues to ensure financialsustainability;
(d) strategies for financing investment costs, incLuding ownsavings and borrowings; and
(e) financial and service delivery relationships withdecentralized provincial agencies and enterprises, as well asmunicipalities.

- xxi -
C. Estimated Pay-Offs of the Strategy
54. 1987 is the latest year for which estimates of executedprovincial budgets are available. The overall performance of allprovinces may be summarized as follows:- current account (withoutgrants) deficit -- US$966 million; capital expenditures -- $2,322
million; and overall need for financing -- $2,762 million. Using the1987 budget estimates for all provinces as a baseline, the lmpact ofdifferent percentage increases in provincial tax and non-tax revenuesand of reductions in expenditures may be estimated. Simulations ofthese improvements provide "orders of magnitude" regarding their resultsin terms of absolute monetary impact, as well as the resultingimprovements (compared to the baseline) on current account savings, withand without grants (i.e., savings and own savings). For example, arelatively modest increase in revenues and decrease in expenditures of15 percent would transform the 1987 current account deficit (withoutgrants) of almost US$ one billion (and a need for financing this deficitand capital expenditures of almost US$ three billion) to a currentaccount surplus of US$ 164 million and an overall need for financing ofUS$l.6 million. Increases of revenues and decreases in currentexpenditures by 25 percent would result in a current account surplus(without grants) of over US$ 900 million, while reducing the overallneed for financing to less than US$900 million.
55. This means that improvement at the 25 percent level wouldenable the provinces to undertake an aggregate capital expenditureprogram on the order of $1.4 billion, fully financed with currentaccount savings combined with modest capital revenues and existing grantfunds. Or, provinces could maintain the 1987 level of capitalexpenditures {$2.3 billion), financed in about equal proportion bycurrent account savings and by long-term borrowings, if available.Improvements of these magnitudes are not unrealistic. They would dependfirst on the political will to undertake the reform strategy recommendedhere, as well on technical assistance in implementing the proposedfinancial management improvements.
D. Updating Po-tecript
56. During the missions that followed the main mission for thisstudy (July 1989), it was noted that some of the key recommendations ofthis report were being implemented. Notable among these measures is theCentral Government's conditioning of significant parts of its granttransfere to provinces that are making demonstrable improvements in themanagement of their finances (see paras. 38-44). The national Ministryof Economy also has made substantial progrese in implementing theProvincial Financial Management Information System as recommended here(paras. 45-46), with close collaboration from the provinces. At the
6/ See paras. 7.31 - 7.32.

- xxii -
time the main body of thíis report was prepared, provincial executed
budget data were available only up to 1986, supplemented by the 1987data from a sample of six provinces collected especially for thisreport. In May 1990, however, the Ministry of Economy assembled the
1987-89 executed budget data for all provinces and the Municipality ofBuenos Aires. A comparison of the mean valu.es for the 1981-86 period
with the 1987-89 data i9 presented below.
1981-86
(mean) 1987 1988 1989
Current Revenues 4,972 6,134 5,895 5,634
Current Expenditures 5,344 6,576 6,306 5,626
Grants (Current and Capital) 1,097 622 274 278
Current Account SurplusWithout Grants (Own Saving) (372) (442) (411) 7
Current Account Surplus With
Receipt of Grants (Saving) 725 203 (<.28) 287
Real Investment (Works and Goods) 1,425 1,983 1,523 975
Overall Deficit/Surplus or
Need for Financing (846) (1,847) (1,716) (753)
Net Borrowing 512 1,029 620 295
Net Variation in Short Tern
Assete and Liabilities (334) (818) (1,096) (458)
Gross Fixed Capital Format:Lon 1,420 1,976 1,518 972
Notes: 1981 mean values aret in milliona of US$ of July 1988 (Source:Table 14a of the Statistical Appendix, pp. 174-175).
1987-89 values are ln miLllions of US$ of December 1989 (Source:Argentina, Ministry of Economy, 1990).
57. The above data point to some encouraging trends. Despite 1989being one of the most traumatic years in Argentine history, withhyperinflation during the middle of the year, current revenues increasedby 13 percent as compared to the 1981-1986 average, while currentexpenditures increased only five percent when compared to this average,

- xxiii -
and they decreased by 12 percent from the previous year. This resultedin a small 1989 current account surplus and contributed to a substantialreduction of the overall need for financing. It should be noted,however, that these improvements resulted in a sharp drop In 1989 forgross fixed capital formation and that the net decrease in short termassets and liabilities, although leas than half that of the previousyear, remained high (over 60 percent of the need for financing).
58. A brief indication of how these trende relate to the analysisof this study is presented below.
(a) The new revenue sharing law became effective in 1988, after ahiatus in the revenue sharing system from 1985 to 1987 (eeeSections C and D of Chapter II). This study concludes(Chapter VII, para. 7.10) that the new revenue sharing systemis a significant improvement over the previous, predominantlyad hoc arrangement for intergovernmental fiscal transfers, inthat the new system provides tranefers that are predictableand transparent for both the Central and ProvincialGovernmente. Despite a sharp drop in granto in 1988-89,provincial savings and own savings improved over this period.This indicates that provinces are responding to the improveddiscipline of the revenue sharing system (as well as closercontrol over Provincial Banks, as noted below) and arebeginning to implement current revenue and expenditurereforme, as recommended in Chapters III and IV.
(b) Long term borrowing (greater than one year), as reflected bynet borrowing, as well as short term borrowing, as partiallyreflected by the net variation in short term aseeta andllabilities, have fallen sharply. This indicates that thestrieter controls by the Central Bank on rediscounts andoverdrafts by provincial banks are taking effect. Thesecontrola have limited the capacity of the provincial banks toprovide loans and overdraft facilities to provincialgovernments, as they have done on a significant scale in thepast (see Section B of Chapter V). Alzo, Provinces have notbeen able to obtain substantial credit from commercialfinancial institutiona. As noted in para. 31 above, strictcontrol of the provincial banks by the Central Bank is afundamental prerequisite for implementing the strategy forreform proposed in this study.
(c) Although borrowing has fallen, the most recent data indicatethat there is a substantial potential for provinces toleverage their current account savings to increase theirinvestments and meet their need for financing. In 1989, 12 ofthe 23 provinces (including the Municipality of Buenos Aires)produced current account surpluses (without grante), comparedto only seven in 1987. Summing the 1989 current savings ofthese 12 provinces provides a total own saving of US$ 360

- xxiv -
million, 22 percent greater than the total net borrowing forthat year. Thie indicates that the recommendations of thisreport (paras. 38-44 above, Section C of Chapter V, andSection E of Chapter VI) regarding current account disciplin,eand financing of provincial investment programe are realisticand achievable.

I. INTRODUCTION
A. Importance of the Studv
In the Context of a Country Strategy
1.01 Reducing the public sector deficit is of fundamentalimportance for success of Argentina's medium-term adjustment program,and to address the underlying structural problems and sources ofinstability in its economy. There have been three major sources of thisdeficit: (a) the Central Government itself, including the officialbanking and finance entities, as well as social security; (b) the publicsector enterprises; and (c) the provincial governments.
1.02 The provinces have been responsible for the largest andfastest growing portion of this deficit. While provincial expendituresrose rapidly over the 1970-86 period, reaching over 11.2 percent of GDPin 1986, total own-source provincial revenues actually dropped from ahigh of 5.6 percent of CDP in 1980 to only 5.0 percent of GDP in 1986(Figure 1.1). The total fiscal deficit of the provinces in 1986 beforetransfers from the central government was 6.2 percent of GDP (about US$4billion), much higher than the public sector enterprises and socialsecurity combined (Figure 1.2). The provinces showed a slight fiscalsurplus, but at the expense of helping transform the nationaladministration's before transfer surplus of 5.4 percent of GDP into afiscal deficit of 4.6 percent of GDP after transfers.
1.03 Data from the case studies of six provinces show that theircombined fiscal deficit more than doubled in 1987 to US$1.1 billion (1.8percent of GDP) after transfers, as own-source revenues declined andexpenditures, especially for salaries, continued to rise.y For all 22provinces and the Municipality of Buenos Aires, the total fiscal deficitin 1987 after transfers was estimated at over US$2.8 billion or about 4percent of GDP.' The decline in own-source revenues stems partly fromthe rise of inflation and the resulting Olivera-Tanzi effect, but alsofrom the increasing inefficiency of the provinces in collecting taxes,as well as the reticence of taxpayers to pay taxes and fees for servicesof ever deteriorating quality.
1.04 Despite this importance, provincial public finance has notreceived the attention given to the central government and the publicenterprises. There are not even adequate up-to-date data on provincial
7/ For a description of the case study provinces studied, see para. 1.21.
t./ Estimates of the 1987 total fiscal deficit for all provinces and theMunicipality of Buenos Aires were made through the proportionalexpansion of the data obtained in the six provinces surveyed.

-2-
Figure 1. 1
EXPEMOtTURES ANO OWN4OII0CE REVENUESALL F'ROVINCES ANO THE FEOERAL CAPITAL
s or GOP14
12r
4
2
70 71 72 78 74 75 76 77 78 79 80 81 82 83884 86 U8YEAR
-- WIM-OOURCE REV. -+- TOTAL EXPENO.
*oureg Se Talee S.1 vmd 4.t
Fizure 1.2
PUULIC SECTOR OEPICT UWIEFORE ANO APTER TRANUER8
S OP OO
2
Ml Cm~WAL OVT. 3 PROVINCIALE PuUL.p ENTWEe m OcAL, aECURTY
8e se T~b tt

-3-
Table 1.1: ARGENTINA - PUBLIC SECTOR OEFICIT BYGOVERNMENTAL LEVELS OR ENTITIES, 1986
(Percent of GOP)
Surplus SurplusBefore After
Transfer Transfer
National Administration 5.37 -4.60
Provincial Governments (a) -6.18 0.07
Public Sector Enterprises (PSE) -2.20 0.07
Social Security System -1.29 0.15
Total Non-Financial Public Sector -4.30 -4.30
Quasi-Fiscal -1.00
Total Deficit -5.30
Source: World 9ank, ARGENTINA: REFORMS AND SUSTAINED GROWTH,
Country Economic Memorandum, July 1988.
Note: (a) Following the Ministry of Economy procedure, al]
revenue sharing under the ad hoc agreements was considered tobe grants (ATN) in this table. For the case study data,
transfers made under these ad hoc agreements is considered to
be revenue sharing and, thus, a current revenue from a national
source.
public finance. This is partly because the provinces are difficult andcostly to study, in that they are numerous (22), institutionallycomplex, extremely heterogeneous by almost any indicator, and spatiallydispersed.
1.05 A better understanding of provincial government finance isimportant not only for controlling the fiscal deficit but also forimproving the efficiency of Argentina's public sector, because provincesare increasingly important providers of public services, especially ofhealth and education. The new Government's strategy of decentralizationshould substantially increase this importance. Expenditures ofArgentina's provincial governments in 1986 amounted to 11.2 percent ofGDP (or US$7.8 billion). Investments accounted for US$1.6 billion in1986 (2.6 percent of GDP) of these provincial expenditures, slightlymore than the total investments of all public enterprises and about 60percent more than the central government's investments (including all ofits decentralized entities and special accounts).

- 4 -
1.06 It is clear, therefore, that provincial governments cannot beignored in the efforts to reduce the public sector's fis,cal deficit andto improve its efficiency.
Government's Commnitment to and Cooperation with Study
1.07 The economic team of the new Government has assigned toppriority to the reform of the public sector enterprises and fiscalreform at the sub-national level. The economic teams of' the provincesvisited also showed much interest in the study and in a possible Banklending operation. Thus, at'both the national and provincial levels,officials are quite aware of the need for fiscal reform and increasedprovincial financial autonomy, as they realize that the centralgovernment no longer has the capacity to resolve their revenue problemsvia discretionary transfers. Provincial officials also expressed thedesire for greater political autonomy and freedom from the controls ofthe Central Government.
1.08 The new Governm,ant seems well aware of the fact that fiscalreform at the provincial Level is essential in order to maintain theintegrity of the Revenue Sharing Law. Untíl the implementation of thisLaw in 1988, transfers to the provinces were mostly in the form ofdiscretionary grants. This caused a kind of perverse competition amongthe provinces to "run up" large deficits in order to get a larger shareof the grant "pie". The new revenue sharing law reduces discretionarygrants to only one percent of total shared taxes. Both the national anclprovincial authorities seem quite aware of the importance of maintainingthe integrity of automatic dístribution criteria set in this law, andalso of the impossibility of so doing unless efforts are undertaken toreduce provincial fiscal cLeficits. They also realize th.at this isnecessary to reduce pressures for rediscounts to the provincial banksfrom the Central Bank and the resulting quasi-fiscal deficits.
B. Objectives
1.09 The primary objective of this sector study is to assist theGovernment of Argentina irn identifying and implementing appropriatemeasures that will result in an effective and equitable reduction in theProvinces' contribution te excessive, consolidated public sectordeficits.
1.10 A corollary objective is to identify appropriate areas inwhich the Bank may support imp,roved provincial financial management, sothat provinces can generate surpluses and invest them wisely to increasetheir future economic growth and tax revenues.

1.11 The study's more specific objectives are to identify:
(a) specific ways that provincial revenue performance andexpenditure efficiency may be improved;
(b) effective incentives for implementing the above improvements;
(c) appropriate, standard provincial budgeting and reportingprocedures that may also be used for national financialinformation systems necessary for macroeconomic planning; and
(d) needs for institutional reforms necessary to meet thepreceding objectives.
1.12 In addition, the report provides (Part II) basic data onprovincial public finance in a format similar to that widely used by theBank, as well as information to help in interpreting these data and inunderstanding the institutional structures of the provinces. TheStatistical Appendix will greatly facilitate access to and understandingof these data by those interested in provincial public finance inArgentina.
C. Interfaces with Other World Bank Studies and Limitations
1.13 Provincial governments are highly open sub-systems within boththe public sector and the general economy of Argentina. As such, theyare profoundly affected by most fiscal and sectoral policies of theCentral Government. For example, energy policy must address theroyalties paid by public enterprises to the provinces for extraction ofhydrocarbons and uranium, as well as production of hydroelectric power.Industrial development policy must deal with the fiscal loss engenderedby the Industrial Promotion Program, which has substantially reduced the"mass" of resources to be shared among all provinces. National taxpolicy and the efficiency of tax collection also bear directly on this"mass" of revenue to be shared with the provinces. The fiscal deficitsof the provinces can generate quasi-fiscal ones via losses of theprovincial banks and eventual "bail outs" by the Central Bank.

1.14 This study focuses on the budgets and financial management ofthe provinces per se, treatirng the impacts of national policies asexogenous variables that havei or will be covered by on-going research atthe Bank (e.g., energy, indusitrial development, nationaL tax policy,quasi-fiscal deficits, etc.). In other words, the primary focus is onhow the provinces may improvei their own financial management, ratherthan those aspects which would require changes in the national revenuesharing system, national tax policy, national sectoral policies forindustry and energy, etc. For example, this report will discuss theimplications of recent clh,angeis in Industrial Promotion on provincialpublic finance, but will leave the analysis of this sysl:em and specificrecommendations to the orgoirLg sector work on it.1 Simi.larly, theexisting revenue sharing system will also be taken as a given that mustbe dealt with in the broader context of the national taxr system, as itinvolves the comparative analysis of the efficiency of differentgovernmental levels in tax collection.l2 The same goes for royaltiesand energy policy.LW
1.15 In summary, the focus of this study is on how improvedfinancial management of the provincial public sector might not onlylower provincial fiscal deficits, but also generate surpluses that maybe invested in the econom.ic dlevelopment of the provinces.
D. Coverage
1.16 The study covers all 22 provinces of Argentina and the FederalCapital (Municipality of Buenos Aires), but not the Territory of Tierradel Fuego, as it is small (population in 1985 of 36,O00) and directlysubordinated to the Central Government.
1.17 Special emphasis is given to the years after t:he return toconstitutional government, in, 1983, but data from previous years alsoare sometimes analyzed to provide an historical perspective.
1.18 To the extent possible, the entire non-financiLal provincialpublic sector is covered, including both the centralizecd and
2/ The World Bank, "Industrial Policy,n Annex Chapter VII of Argentina:Reforms for Price Stabil'Lty and Growth, (Washington, D.C.: World BankCountry Study, 1990).
]O/ The World Bank, Argentina: Tax Policy for Stabilization and EconomicRecoverv, (Washington, D.C.: World Bank Country Study, 1990).
il! The World Bank, Argentina: Energy Sector Study, August 10, 1989.
-7 -
decentralized administrations and the provincial public enterprises.YlAlthough both the non-consolidated, decentralized entities and thepublic enterprises should be included, the cost of including all suchprovincial entities would haye been prohibitive. Therefore, it wasdecided to concentrate on those that are by far the most important innumber and total expenditures: the public utilities providing water andelectric energy. In some provinces these utilities are provided by thegeneral administration, either directly by its central administration(e.g., water and energy in La Pampa), or by consolidated decentralizedentities ( e. g., water and energy in Salta). To simply presentation,both the non-consolidated decentralized entities and the provincialpublic enterprises will be called public enterprises, unless thedecentralized entities are specifically referenced. Although there arelegal differences between these two types of entities, they are similarin that they have their own sources of revenue and are not consolidatedin the provincial budget. For all of these reasons, the presentation ofthe results will be simplified by using only two main administrativeunits of analysis:
The general administration, covering the centralized entities andthe consolidated, decentralized entities; and
The public enterDrises, including the non-consolidated,decentralized entities and public enterprises.
Public utility enterprises refer to public enterprises, but not thepublic utilities provided by the general administration.L1
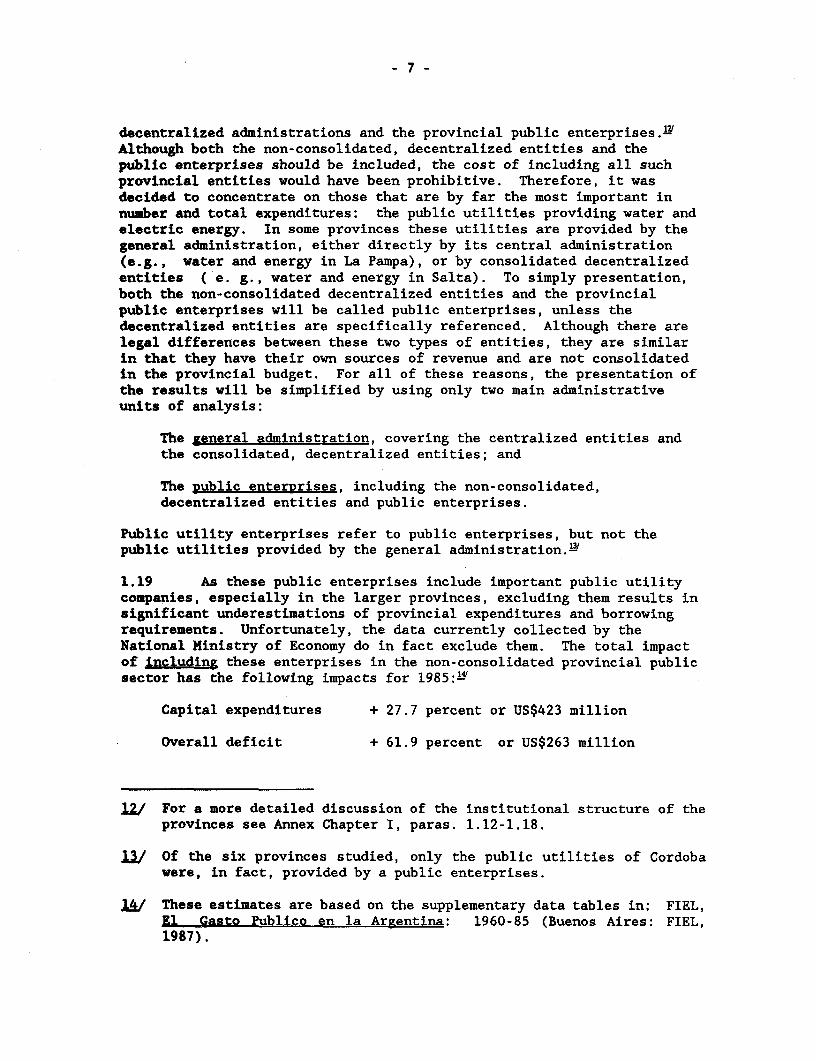
1.19 As these public enterprises include important public utilitycompanies, especially in the larger provinces, excluding them results insignificant underestimations of provincial expenditures and borrowingrequirements. Unfortunately, the data currently collected by theNational Ministry of Economy do in fact exclude them. The total impactof including these enterprises in the non-consolidated provincial publicsector has the following impacts for 1985:'l
Capital expenditures + 27.7 percent or US$423 million
Overall deficit + 61.9 percent or US$263 million
121 For a more detailed discussion of the institutional structure of theprovinces see Annex Chapter I, paras. 1.12-1.18.
IV Of the six provinces studied, only the public utilities of Cordobawere, in fact, provided by a public enterprises.
já/ These estimates are based on the supplementary data tables in: FIEL,El Gasto Publico en la Argentina: 1960-85 (Buenos Aires: FIEL,1987).

Borrowing +121.9 percent or US$26.65 million
Floating debt + 58.7 percent or US$362.9 míllion
Applying these percentages to the 1986 data would increase totalprovincial expenditures by, about 2 percent of GDP, summing to 13 percentof GDP, and investment would i.ncrease to about three percent of GDP.
E. Methodologv and Sources of Data
1.20 The lack of consistent and up-to-date informat:ion onprovincial public finance in Argentina is an important barríer to itsunderstanding. The data from the Secretaria de Hacienda of the Ministryof Economy (hereafter called the Hacienda data) that are used in thisreport are deficient in th.at they: (a) exclude a significant part of theprovincial public sector because they do not cover the provincialenterprises, and (b) are out of date.
1.21 For these reason,s, and to obtain qualitative data, casestudies of six provinces were done to fill in the gaps in the Haciendadata (Buenos Aires, Cordoba, Santa Fe, Salta, Santiago del Estero andChubut), as well as to obtain data for 1987.»' These six provincesaccounted for 68.8 percent of the total population in the provinces in1985, 62.8 percent of households with unsatisfied basic needs in 1980,and 70.9 percent of the gross provincial product in 1980.L2 These sixprovinces represented an average of about half of total provincialexpenditures and 45 percent of the total deficit for the 1981-86 period.In addition to the six provinces of the case studies, two otherprovinces (Neuquen and La Pampa) were visited during the study's mainmission to collect additional data on budgeting, investment planning,personnel policy and general management. Finally, the Province ofMendoza was visited during a mission (December 1989) to ¿Liscuss theprevious version of this report and to see first hand its innovativebudgeting and tax collection systems. Therefore, nine of the 22provinces were visited during the course of the study. These provincesaccounted for over 75 percent of the population of the provinces in1985, for almost 80 percent of their economic product andL for over 68percent of their population with unsatisfied basic needs.
1.22 Although incomplete and out-of-date, the Hacienda data areuseful for analyzing the historical trends for all of the provinces.The case study data are us,ed to complement the Hacienda d.ata and viceversa. For example, the Hacienda data on all of the provinces providean overview of all 22 provinces, and the data from the case studies
5/ For selection criteria, see Annex Chapter III.
]6/ Excluding the Federal Capital and Tierra del Fuego.

-9 -
provide estimates of how accurate these data portray the situation ofthe provinces, as well as how trends might have shifted in 1987.0i
1.23 The data from these two sources (Hacienda and the casestudies) were analyzed following four basic steps.
(a) The Hacienda data provide a broad overview of general trendsfor the 1970-86 period for all provinces and the FederalCapital.l&
(b) More detailed analysis of budget data for both the direct andindirect administrations is provided by the data obtained inthe six provinces of the original case studies.
(c) Next, using the lessons learned from analysis of the six casestudies, the Hacienda data were restructured to make them moreconsistent over time and across all 22 provinces and theFederal Capital (hereafter called simply provinces), with thedata reported as closely as possible according to IMFguidelines.2l
(d) Finally, executed budget data for all the provinces wereanalyzed, consistently using IMF guidelines, and alsoaccording to the CFI classification of the provinces into fourmain groups:!W
(i) Advanced: large population and high per capitaprovincial product.
(ii) Low-Density: low demographic density and high percapita product for the "resource frontier".
1i/ For a more detailed discussion of these data, see Annex Chapter II,Sections B and C.
1j8 These data were obtained from the Country Economic Memorandum's timeseries data. See: Argentina: Reforms . , op. cit., StatisticalAppendix.
12/ For further discussion of this methodology and the restructuring ofthe Hacienda data according to the IMF guidelines, see AnnexChapter I.
VQ/ For a more detailed discussion of this classification and of basicindicators of population, product and poverty for each group ofprovinces, see Annex Chapter II.

- 10 -
(iii) Intermediate: intermediate populatoion size and percapita product.
(iv) Underdeveloped: low per capita prodtLCt.
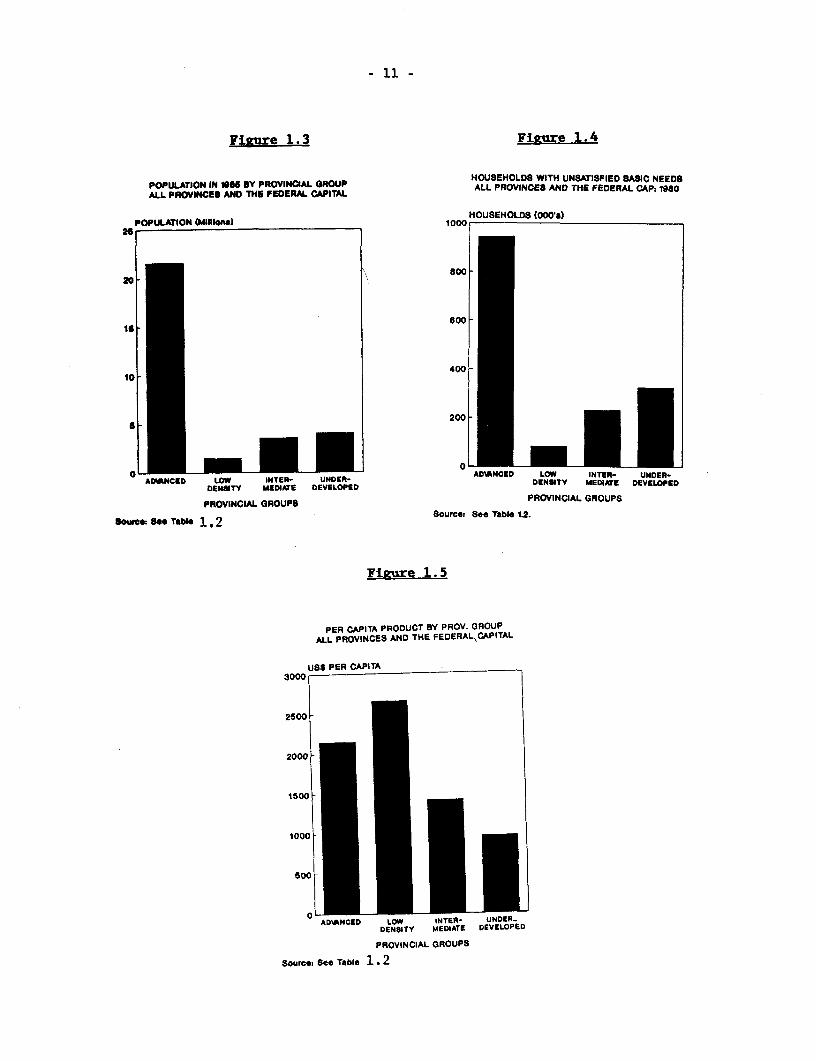
1.24 The diversity of the provinces in terms of almnost anyindicator is impressive and maust be taken ¡ito account when designingstrategies for fiscal reform. See Figures 1.3-1.5 and Box 1.1.
.S.-.-.:'.. -1-$:>.1: TBK eDIVRIT :OF TH 'PKOVINCE';--:--''''-S«<B~~~~~~~~~~~~~~~~~~~~~~~~~~~~~. .. .. . i ...POPUIJ&TIONJ P .OV .` ANDI PEI CAPI-. : PRDUCT
Th 'pro'''i''es'a' reatly tuterms sof popu1at£ in. se er capitp:.-troduc.t--:aud:::. the- :...incidence. of. poverty. yfar: the e:: argest pro ce.by-.any fof these: :crtl:eria la::Buenos ÁAires:witha, ::opulation (2.B*BiLLion)-.abo .-uth :'.same tas tht .ofChile, nivtn n: :an are aru
the. size of Itaíy. Tenof the íeaning' 22 :proVíinces had',popuaisof lesa than 500,00 O tu: 1,985.` Buno irsha ore: than. 3tie
*.R.the populat ion of:-.anyrone -:'of E.E.these. Santa Cruz, t e provincevtth;.-....¿h...t..* ., . -E - --popul-o, ha onl d 1 134,000: inhábiat i t 98 n
La Rioja, he *next argest- ouy1000. Oe 0 rcent ofIArgentina'spOpU atio>n :of :31 ::"Miílitan: in 18 líved u tedac
.::..Group.:whtch la i:comprised of four provincs, and.the .F:deral Capital.'....-.iSe'e 'Figur'e 1...'..44. ....
Although .AlthougE.--thepe ercent:age of hauseholda with unsatisfied basi.::need'.:......'..-tandtb tgher in te provírices f e dlpe Gro uc
as Formosa <(46 8 pret u Santiago: del: Estero. (45A.8 ecn'' -the'..'c'on'cntrationt"'in::.u"absolute term la htghest-i wtu e thret 'argestp'ro svince For' example, of 1:-the 10;.5 ¿miMion: i óiuseholds ittaaunsatisfied bsc 'ees tu 19'89 35 .90 percent. live :Ln 'Buenos- Aires;
a'^''. ftt of 'ht toa of roshod wt Cnai e bab .a'd:
rioad in the 8 provinces of tMe Underdev eloe e Group. See Figre 3
-a.er0--.'io ......... ..... ........Gosa il Product (G is h...-proviucas--. .of- the:::.;: Lo'w.í.r.Density G:;;;Çroup: 9n ::::the w:.0»reanourceroa frontter-sespeciaíly ..... it.hose ijiwiLthi petroleum :i-reserves::................ : Sea0F:igurej 1.5...... 0j---j-'Fo g 'sexample:-i.the -per "lcapita lGPP :of :Santa Cruz:- tuin 1985 v was almost US$3000versiss USS l657 Sin "Buenos' 'Aires tandi leas thau US$900' iLn:the' 0province SR
-. s.^..ofi C.;'>haco, Formosa,- LaRioja, a0isatloned ad Santiag del :Estero..
* f- ,i jE0S EEth -eE a i Uij-f t: ~fEi f hé!4iSE'CUidérevaop rou gu
. - . E . . . -. ............................ i .; . i i 7. - ........................ ........ .... .... '.s -- '.j '.' d .-- '': ''" ''. f f -'S''- ' Si ::.: .':.40 .' .-: :yE: 0 f f E S i j~~~~~~~. .......
.'.,., ~ ~ ft .;,. `í.: Den' ty.i ' t' .
e,. :''" ".s'p'"' e; ¡aft Y h Ç0'!"''' d"tÉ pe'ftrol úm: re er e .0Se,':4:: "!5,0.'';i .......: ....
- 11.
Fiscure 1.3 Figure 1.4
POPULATION IN tOI10 8Y P >VINOAI. GROUP HOUSEHOLDO WITH UNSATISFIED BASIC NEEDO
ALL PROVINCES ANO THE FEDERAL CAPITAL ALL PROVINCE8 ANO THE FEDERAL CAP: 1980
POPULATION )lilo 100 HOUEHOLD8 (000'#)26
20 - ~~~~~~~~~~~~~800
600 18
10 ~~~~~~~~~~~~~~400
a 200 -
OA0 NCED Low INTER- UNDER- ADYANCED Low INTER- UNDER-
N ENE TY MEDIATE DENELOPEO DENSITY MEDIATE DEVELOPED
PROVINCIAL GROUPB PROVINCIAL OROUP8
80wc 8" Tato* 1, 2 Sourcm See Tabbe 12.
Figure 1. 5
PER CAPITA PROOUCT EIY PROV. GROUPALL PROVINCES ANO THE FEDERAL\CAPITAL
USS PER CAPITA3000
2500
2000
1000
500 -
0 AD¶ANCED LOW INTER- UNDER_DENSITY MEDIATE DEVELOPED
PROVINCIAL GROUPS
Source: See Tabíe 1 . 2

- 12 -
Table 1.2: ARGENTINA - POPULATION, EOUSEBOLDS WITH UNSATISFIED BASIC
NEEDS AND PER CAPIIA PROiDUCT BY PROVINCE AND CFI CLASSIFICATION FOR
ALL PROVINCES AND TZE FEDERAL CAPITAL
Population Uouseholds with Per Capita
Unsatisfied Basic Needs Product
CFI Classification---------------------------- ---------------------- ---------------
Provinces 1985 X of Annual 1980 X of X of 1985 Annual
NatiLonal Rate Prov. National Rate
(000's) Total 80/85 (000's) Total Total US$ 80185
TOTAL 30,614 100.0 1.9 1,585 22.3 100.0 1,935 -2.0
ADVANCED 21,568 70.5 1.7 944 17.7 59.5 2,154 -1.8
Capital Federal 2,898 9.5 -0.2 68 7.4 4.3 4,688 -2.7
Buenos Aires 12,091 39.5 2.2 569 19.9 35.9 1,657 -1.1
Cordoba 2,603 8.5 1.6 118 19.2 7.5 1,716 -0.9
Mendoza 1,326 4.3 2.1 56 20.4 3.5 1,985 1.0
Santa Fe 2,649 8.7 1.4 133 20.0 8.4 2,163 -1.2
LOW DENSITY 1,442 4.7 3.5 84 28.6 5.3 2,661 -3.2
Chubut 310 1.0 3.3 19 29.8 1.2 2,861 -5.4
La Pampa 229 0.7 1.9 11 18.5 0.7 2,904 4.0
Neuquen 305 1.0 4.7 18 33.9 1.1 2,972 -6.1
Rio Negro 463 1.5 3.9 30 32.8 1.9 2,111 -1.3
Santa Cruz 136 0.4 3.1 6 22.7 0.4 2,972 -5.4
INTERMEDIATE 3,553 1.1.6 2.0 232 32.9 14.6 1,418 -1.3
Entre Ríos 961 3.1 1.1 61 27.9 3.9 1,267 -2.7
Salta 756 2.5 2.7 58 42.4 3.7 1,469 0.5
San Juan 51:3 1.7 1.9 26 26.0 1.6 1,152 -1.2
San Luis 23:2 0.8 1.6 14 27.7 0.9 1,793 1.8
Tucuman 1,096 3.6 2.4 73 36.6 4.6 1,560 -2.1
UNDERDEVELOPED 4,046 13.2 2.2 326 42.3 20.5 964 -3.1
Catamarca 228i 0.7 1.9 16 37.6 1.0 1,268 1.0
Chaco 780 2.5 2.2 67 44.0 4.3 816 -4.3
Corrientes 7115 2.3 1.6 57 40.6 3.6 1,108 -3.3
Formosa 333 1.1 2.4 29 46.8 1.8 755 -1.9
Jujuy 47. 1.6 3.1 39 45.1 2.5 1,357 -2.8
La Rioja 180 0.6 1.9 11 31.6 0.7 880 -2.5
Misiones 67'J 2.2 2.9 51 39.2 3.2 856 -4.3
Santiago del Ester 652 2.1 1.8 56 45.8 3.5 834 -3.0
Sources: See Tables 2, 3 and 5 of the Statistical Appendix.

- 13 -
II. OVERVIEW OF THE PROVINCES IN ARGENTINA'S PUBLIC SECTOR
A. International Comparisons of Fiscal Decentralization
2.01 International comparisons show Argentina to have a relativelyhigh level of fiscal decentralization. The Bank's 1988 WorldDevelopment Report used two indicators of fiscal decentralization torank 18 countries: percent of total government spending (excludingpublic enterprises) done at the sub-national level and the percent oftotal revenue that is own-source or from automatic transfers.3 "Theshare of state and local governments in total government spendingreveals their importance as providers of public services. The extent towhich they are self-financing indicates their fiscal autonomy, becauseoutside financing may come with conditions that limit local discretionin the use of funds."` Of these 18 countries, only Yugoslavia is moredecentralized than Argentina on both criteria for the 1974-86 period.In 1986, the provinces of Argentina accounted for well over a third oftotal government expenditures (excluding all public enterprises) andabout 80 percent of total revenues were from provincial sources or fromautomatic revenue sharing.2 For the 18 countries studied, the relativesize of the provincial fiscal deficit in Argentina ranked second.
B. Four Tvoes of Transfers from the Central Government
2.02 Understanding the transfers from the national to theprovincial governments is key to understanding provincial finance inArgentina.3y These can be classified into four main types in accord withhow they are allocated to the provinces (automatic or discretionary) andby the provinces (earmarked for a particular use or free allocation bythe provincial government), as summarized in the following matrix:
21/ World Bank, The World Development Report, (Washington, D.C.: 1988),p. 157. See Figure 7.3 of this WDR.
1/ Ibid., p. 155.
23/ These data also exclude municipalities. Including them would increasethis indicator of decentralization considerably. An extensive reviewof sub-national public sector revenues and expenditures for LatinAmerica is presented in Gian Carlo Guarda, Financing Urban Servicesin Latin America: Spatial Distribution Issues, World Bank, Report INU48, June 1989.
24/ For a more detailed discussion of these transfers and how they arereported, see Annex Chapter I, Section E.

- 14 -
Allocation to Allocation by the Provincesthe Provinces _
Free Allocation Earmarked
Automatic a bDiscretionary c cl
2.03 Types a and b are considered to be provincial taxes collectedby the central government and, therefore, as current revenues fromnational sources. All four types of transfers are summarized below.
a. These formula driven transfers to the provincesi includeFederal Revenue Sharing (Coparticipacion Federal) androyalties.
b. Automatic, earmarked transfers include the highway developmentfund (Coparticipacion Vial).
c. Discretionary Gr.ants are unrequited and non-repayabletransfers from the Central Governnent to the provinces, andthey include Aportes Del Tesoro Nacional.
d. Discretionary, earmarked transfers include those from theNational Housing Fund (FONAVI), as well as a host of smallerfunds. FONAVI is treated as borrowing; all others, as grants.
2.04 The 1988 budgeted triansfers, as a percent of GDP, aresummarized below.
Allocation to Allocation by the Provincesthe Provinces Total _
Free Allocation Earmarked
Automatic 5.83 5.37 0.46Discretionary 2.49 0.75 1.74
Total 8.32 6.12 2.20
Source: Table 2.1
Both the total amount transferred and the type of transfer have variedgreatly, as can be seen in Figure 2.1. Clearly, these transfers werenot characterized by predictability as they have varied enormously in

- 15 -
Figure 2.1
TRANSFERS FROM NATIONAL GOVBlRNENTTO PROVINCE8 UY TYPE 1s72vs
% OF OOP10
4
2
72 78 74 76 76 77 78 7 8o st 82 83 84 86 80 87 88YEAR
REVENUE SHARINQ M QRANTO (ATN)CJ ROVALTIE* ALL EARMARKED(a>
Source. Se. Tabie 2.Note: (*) Indudes FONMI m we1l asautomatio and diacutlony traufers.
amount and also by type.22/ The revenue sharing law of 1987 clearlyincreases the total potential volume and predictability of transfersdone by automatic criteria.
C. Fiscal Federalism in Argentina
2.05 Argentina's system of fiscal federalism has evolved throughmany years of conflict between the Central Government and theprovinces.L3/ As with federal systems in other countries, thesecontroversies in Argentina have centered on the basic economic problems
2/ For discussions of the evolution of the transfer system, see: AlbertoPorto, Analisis del Impacto de los Aportes del Tesoro Nacional sobrelas Finanzas Provinciales (Buenos Aires: Consejo Federal deInversiones, 1986); and H. Nunez Minana and Alberto Porto,Distribucion de la Coparticipacion Federal de Impuestos; Analisis yAlternativas (Buenos Aires: Consejo Federal de Inversiones, 1986).
j3 For a concise summary of the history of federalism in Argentina, see:Felix Luna, 'Introduccion Historica al Federalismo Argentino", inFederalismo: Un Ciclo de Conferencias (Buenos Aires: Consejo Federalde Inversiones (CFI), 1982), p. 16.

- 16 -
Table 2.1: ARGENTINA - TRANSFERS FROM TEE NATIONAL GOVERNMENT TO PROVINCIAL
GDVEI4MENTS BY TYPE OF TRA1SFER, 1972-1988
(Percent of GDP) (a)
Total ReverLue Discre- Royalties EarmarkecL Transfers
Ye-r Sharing tlonary ---------------------------
Granta Automatic DI.scretionary
(ATN) ------------------
FCINAVI Granta
72 3.19 1.61 0.95 0.09 0.22 0.00 0.32
73 4.71 2.17 1.88 0.07 0.26 0.00 0.33
74 6.44 2.97 2.43 0.22 0.35 0.17 0.30
75 7.65 1.53 4.92 0.17 0.25 0.24 0.54
76 5.90 2.57 2.32 0.15 0.24 0.33 0.29
77 5.40 3.74 0.62 0.13 0.22 0.31 0.38
78 5.45 3.47 0.54 0.21 0.28 0.66 0.29
79 4.90 3.29 0.28 0.18 0.23 0.68 0.24
80 5.46 3.62 0.30 .0.16 0.23 0.78 0.37
81 5.83 2.94 1.19 0.23 0.26 0.84 0.37
82 4.67 2.42 0.70 0.42 0.22 0.62 0.29
83 7.95 2.16 3.67 0.67 0.31 0.78 0.36
84 6.19 1.79 2.51 0.55 0.27 0.87 0.20
85 (b) 6.23 0.00 4.19 0.68 0.40 0.60 0.36
86 (b) 7.38 0.00 4.64 0.79 0.41 0.84 0.70
87 (b) 7.12 0.00 4.60 0.62 0.34 0.96 0.60
88 *stimate 8.32 4.58 0.75 0.79 0.46 0.95 0.79
Source: Poder Ejecutivo, "lesaje 806 mediante el cual se remite el
proyecto de ley de presupuesto general de la administracion publica
nacional para el ejercicio 1988," Camera de Diputados de la Nacion,
Tramite Parlamentario 43, 1 de Julio, 1988, Cuadro 21.
Notes: (a) The estimates of GDP may be slightly different from those used
in the rest of this report.
(b) Funda transferred. under ad hoc revenue sharing agreements are
treated as discretionary grants.

- 17 -
of efficiency, equity and stability,2' leading to such policy questionsas: Which level of government can most efficiently provide differentkinds of services and collect the various types of taxes? How muchredistribution should be done via the revenue sharing system? How muchregulatory control should the Central Government exert over theprovinces? With regard to the last question, provincial governmentofficials often resent having to go to Buenos Aires for permission toimplement their plans, such as building a port or a power plant, evenwhen they are using their own money to do so.
2.06 What is different in Argentina is the extent to whichstabilization has ranked at the forefront in the debates about fiscalfederalism, a problem left almost exclusively to the Central Governmentin other countries.' This is due in large part to the extent to whichthe public sector in Argentina has resorted to the inflation tax. Arecent study shows that the inflation tax "appears to have been thesingle most important source of revenue to the government" of Argentinaduring the first half of the eighties.' Inflation has accelerated aseconomic agents have learned to economize on holding monetary balancesand accordingly protect themselves from the inflation tax. Financingthe public sector is the core of Argentina's macroeconomicdisequilibrium and stabilization must necessarily find an alternativesource of revenue to replace the inflation tax. Unfortunately, theexperience during the last half of the eighties clearly shows that thisalternative source has not yet been found.?
2.07 Because of the Olivera-Tanzi effect, inflation not onlyreduces the real value of the national taxes that are shared with the
21 Richard Musgrave, The Theory of Public Finance (New York: McGraw-Hill, 1959).
28/ Although the role of sub-national governments in stabilization hasnormally been overlooked in the literature in recent years, HarveyPerloff argued that sub-national governments were "fiscally perverse"during the Great Depression, as they ran up high budget surpluses,thereby countering the Central Governments deficit. In Argentina, sub-national governments are often "fiscally perverse" in exactly theopposite direction in that they run high deficits when the CentralGovernment is trying to move in the opposite direction. See: HarveyPerloff, "Fiscal Policy at the State and Local Level," in The Art ofPlanning: Selected Essays of Harvey S. Perloff, L. S. Burns and J.Friedmann eds. (New York: Plenum Press, 1985), pp. 241-257.
29/ Miguel A. Kiguel and Pablo Andres Neumeyer, Inflation and Seignioragein Argentina. Policy, Planning and Research Working Papers No. 289,The World Bank, Washington, DC, October 1989, p. 26.
10/ See: Argentina: Reforms . . . op. cit., Part I.

- 18 -
provinces, but also that of provincial own-source revenues, whileincreasing their expenditures. The provinces have sought to protectthemselves from inflation or to receive compensation for it in a numberof different ways, all of which are "fiscally perverse' in that theywould work against the stabilization policy of the Central Government.One of their proposals was that the ninflation tax" be shared andlegislation for so doing has be,en submitted to Congress a number oftimes. They have also soug]lt tlhe right to seigniorage by issuing bondswith all of the characteristics of money that circulate within theirboundaries. Five provinces rec,ently have done this (See Chapter V,para. 5.08). Furthermore, they have "borrowed" from the Central Bankvia their provincial banks to cover their deficits, usually in the formof rediscounts or overdrafts, tlhereby adding to the quasi-fiscaldeficit. Finally, they have tried to obtain resources in the form ofdiscretionary grants from the f,ederal government, many times by runningup high fiscal deficits. Fortunately, officials at both the nationaland sub-national levels now seem quite aware that there are no "winners"in this struggle and of the need for a coordinated effort on both levelsto achieve price stability.
2.08 The revenue sharíng system has evolved over the years withinthe context of these conflicts over fiscal federalism, reaching abenchmark with the enactmentl of the previous revenue sharing law of 1973(20.221), which gave the provinces considerably more resources than theyhad received in the past, w:ith distribution among the provincesdetermined by criteria defined in the law.LY The criteria for revenuesharing are strongly weighted in favor of territorial redistributionwhich the provinces of the periphery see as "historical reparation" fortheir past "exploitation" by Buenos Aires, including compensation forsubsidies going to public enterprises located in the Federal Capital orthe Province of Buenos Aires, as well as the distorted tariff structurefor public utilities that aLso :Eavors them. Clearly, it would makemore sense to eliminate these subsides directly, rather than to try tocompensate for them through the revenue sharing system.
2.09 With the enactmenl: of the 1973 law, revenue sharing as apercent of total provincial revenues rose from 39 percent in 1971-72 toapproximately 47 percent in the 1975-76 period. Provincial tax effortdropped initially in response to this influx of resources from theCentral Government, but then began to recuperate.31
2.10 With this transfer of resources came the idea of transferringpublic service delivery responsibilities from the Central Government to
f1/ For a review of the history of fiscal federalism and revenue sharingfrom the Constitution of 1835 on, see: Horacio Nunez Minana,"Coparticipacion de Impuestos y Federalismo Fiscal", in CFI,Federalismo: Um Ciclo de Conferencias, op. cit., pp. 157-182.
IZ/ FIEL, El Gasto . . ., op. cit, pp. 189-193.

- 19 -
the provinces. In 1978, primary education was transferred to someprovincesM', as were medium-size hospitals.34 In 1980-82, primaryeducation for adults, water, irrigation, electricity and some nationalhospitals were also transferred to the provinces. The impacts of thesetransfers on provincial finances varied greatly, but overall the cost ofthese services represented about 22 percent of total revenue sharing andabout 9 percent of total provincial revenues.351 These transfers ofresponsibility were normally not preceded by studies of the fiscalimplications for the provinces, let alone plans for assuring thatadequate resources to provide the decentralized services.
2.11 The formal revenue sharing system was interrupted from the endof 1984, when the previous revenue sharing law expired, until January1988, when the current law was implemented. From 1985-87, a series ofad hoc agreements substituted the revenue sharing law.29
D. The Revenue Sharina Law of 1987
The Law
2.12 The prevailing revenue sharing law (passed in 1987 and madeeffective in January 1988) represents an important step towards moreresponsible federalism in Argentina in the sense that it makes totaltransfers to the provinces more transparent and predictable.a In theperiod before this law, a chief means of transfers to the provinces wereDiscretionary Grants (Aportes del Tesoro Nacional). For example, in1984 (the year that the previous revenue sharing law expired) an amountequal to 4.3 percent of GDP was transferred to the provinces via bothrevenue sharing (1.8 percent of GDP) and discretionary grants (2.5percent of GDP). These grants generally rewarded fiscal
13/ With the exception of the provinces of Buenos Aires, La Rioja, RioNegro and Santa Cruz, as Ley 18.586 of 1970 had already transferredthis responsibility to them.
14/ These hospitals were transferred to: Buenos Aires, Catamarca,Cordoba, Entre Rios, Salta, Santa Fe, Santiago del Estero, Tucumanand the Municipality of Buenos Aires.
5/ A. Humberto Petrei, Fiscal Relations Between the Central andProvincial Governments of Argentina, Paper Prepared for World Bankmission, Buenos Aires, October 1987, p. 12.
jj6 The Ministry of Economy treated all transfers done under these ad hocagreements as discretionary grants (which they legally are), whereasmany provinces treated them as revenue sharing. In the case studies,these transfers are treated as revenue sharing.
.7/ For the basis of this judgement, see para. 7.06.

- 20 -
irresponsibility, as those pro,vinces which ran up high fiscal deficitstended to get more resources from the Central Government in the form ofdiscretionary grants.3
2.13 The present reveniue sharing law has changed the "rules of thegame" regarding fiscal transfers. Discretionary grants are limited toonly one percent of total shariad taxes, and the percentage of the totalrevenues from shared taxes going to the provinces as a whole (i.e.,primary distribution), and also the percentages going to each province(i.e., secondary distribution) are fixed by the law. Hence, the onlyvariable left in the revenue sharing system is total shared taxrevenues: the other parameters used in the system are legally fixedconstants. In the primary distribution, the percentage of total sharedtaxes going to the provinces rose from 48.5 percent to 57.76 percentunder the new law.L9' Furthermore, shared taxes are to be deposited,within 48 to 72 hours of their collection, directly into the accountsof the provinces in the Banco de la Nacion Argentina in accord with thepercentages used in secondary distribution.
2.14 Any additional transfers to provinces must now be approved byCongress. This makes the revenue sharing system transparent and raisesthe political cost to Provinces of requesting financial assistance ofthe Central Government. The :Law is valid for two years, but under itsprovisions, the law will be extended automatically until a new one isadopted. As passage of revenue sharing laws has been difficult inArgentina, the current law couLd well stay in effect for some time tocome.
2.15 Figure 2.2 shows how the revenue sharing system works at boththe national/provincial ancl provincial/municipal levels. All provincesshare part of the resources from the Central Government, as well as someof their provincial taxes with the municipalities in accord withprovincial revenue sharing laws.
2.16 The criteria used in dividing the total revenues of sharedtaxes among the provinces are weighted against the provinces of theAdvanced Groups (i.e., Cordoba, Santa Fe and especially Buenos Aires),
.8/ According to Articulo 67, Inciso 8 of the Constitut:ion, one of theroles of the National Congress is to "provide subsidies from theNational Treasury to the provinces whose revenues, according to theirbudgets, do not cover their ordinary expenditures." This is, ofcourse, vague and open to broad interpretation.
j9/ In this primary distribution, 54.66 percent of total shared taxesgoes directly for division among the provinces in secondarydistribution and two percent goes directly to four provinces (1.5701percent to Buenos Aires and .1433 percent each to Chubut, Neuquen andSanta Cruz) to "recuperate their position", and one percent goes tothe discretionary grant fund.

Figure 2.2FLOW CHART FOR REVENUE SHARING
PRI MARYDISTRIBUTION
OF SHARED TAXES
4 2.3 4% 5 7.ee6%TO CENTRAL TO PROVINCIAL |
GOVERNMENT GOVERNMENTS al
FOR PROVINCES: DISCRETIONARY i54 Eei to al] 22 prov. GnANTS FOR EMERGENCIES t
2% to 5 provinces
PRIMiARYDISTRIBUTION
TO MUNICIPALITIES
PROVINCIAL MUNICI PALSHARE SHARE
Secondary DistributionAmong Muncipal ities
a/ Federal Capital does not participate.

- 22 -
given that the main objective is territorial redistribut:ion. See Tables2.2 and 2.3. Figure 2.3 shows: this quite clearly. For osxample, theprovince of Buenos Aires recei.ved only 46 percent of whalt it would havereceived if revenue were shared according to populatíon, while Catamarca.received over three times what: it would have received on the basis ofits population. Although the criteria assure territorialredistribution, they tend to transfer resources away from areas withhigh concentrations of poor families. For example, the Province ofBuenos Aires received only 53 percent of what it would have gotten ifresources were allocated i.n accord with the distribution of householdswith unsatisfied basic nee,ds i.n 1980.L' On the other hand, theprovinces of the Low Densi.ty group received 1.6 times wh.at they wouldhave received had the revenue sharing been done on the b,asis ofhouseholds in poverty. ArLd the Province of Santa Cruz received almost
Figure 2.3
OE«COMURT DIST. PROM IVIENUE UIHARIO.POP_ (2PP ANO POVIRTY UY PROV. GRwUP
S CIF TOTilL FOR PROVINCE8S
40
^oI
A0iaNCgD 1.0W INTEIR UNOER-* ~~~DENUTY MIDIAI D<VELOftD
PROVINCIMJ OROUPS
i ReviENUe SeMHa m POPULATIONCl * aQP(>) - S POVERTY (b)
Sacurce S<. Tabla 2.3momo. (., a~ Plai P.duebtCb) H6o"uaaw w,lth Uaa*t 3aa .d
iQO See Table 2.3 (Column G). The distribution in Column A of Table 2.2include the compensatory, distribution of 2 percenl: of total sharadtax revenues to Buenos Aires, Chubut, Neuquen aind Santa Cruz inprimary distribution (with Buenos Aires receiving 1.5701 percent ofthe total revenue shared and the other three, (0.14.22 percent each).The percentages used in secondary distribution are even more highlyweighted against Buenos Aires.

- 23 -
four times what it would have received if revenues were shared accordingto this same criteria of households in poverty. Santa Cruz, which has aper capita product of well over twice that of Buenos Aires, receivesover three times than it would have received if revenues were sharedbased only on population size. Thus, although it is clear that thecriteria redistribute, the equity of the distribution is questionable interms of households in poverty or even per capita product of theprovince.
Problems of Imolementation
2.17 Although well designed to meet its objective of providing atransparent and more predictable transfer of funds to the provinces,implementation of the new revenue sharing law has been plagued by twomain problems: (a) a shortfall in the total resources transferred due toa decline in the collection of shared taxes and (b) the continued riseof the fiscal deficits of the provinces. The former has resultedessentially from problems of national tax administration andmacroeconomic instability; the latter from provincial financial mis-management. Thus, these problems do not result from the structureintroduced under the Revenue Sharing Law per se. More predictable andtransparent revenue sharing can complement national stabilizationmeasures by reducing incentives for provincial financial mis-management,but of course it cannot be a substitute for appropriate macroeconomicpolicies at the national level.
2.18 Shortfall in the Transfers. The total amount transferredthrough revenue sharing under the new law was projected to increase byabout US$345 million over the 1984-86 average, to US$2.5 billion in1988. This was not to be: revenues of shared taxes dropped by 9.5percent in 1988 for a number of reasons. For one, the rate of inflationaccelerated rapidly in the first half of the year, reaching over 27percent for August 1988 (440 percent for the year ending in August, asmeasured by the general consumer price index for the Federal Capital),provoking a decline in tax revenues. Furthermore, the generalefficiency of tax collection for the shared taxes also seems to havedeclined. Finally, the fiscal loss generated by the IndustrialPromotion Program reduced the total tax revenues to be shared among theprovinces.
2.19 Although Industrial Promotion is not formally part of theexplicit revenue sharing system, it has a great impact on it because thefiscal losses engendered by its tax exemptions are on shared taxes.

- 24 -
Table 2.2: ARGENTINA - RELATIVE DISTRIBUTION OF REVENUE SHARING FUNDS,POPULATION, GROSS PROVINCIAL PRODUCT AND HOUSEHOLDS WITH UNSATISFIED
BASIC NEEDS EIY PROVINCE AND CFI CLASSIFICATION
% of Total Gross Households withProvinces Revenue Population Provincial Unsatisfied
Shared Product Basic Needsunder NewLaw (a) A/B A/D A/F
1988 1985i 1980 1980(A) (B) (C) (D) (E) (F) (G)
TOTAL 100.00 100.0 1.00 100.0 1.00 100.0 1.00ADVANCED 44.03 67.4 0.65 71.1 0.62 57.7 0.76Buenos Aires 22.00 43.6 0.50 42.4 0.52 37.5 0.59Cordoba 8.90 51.4 0.95 10.1 0.88 7.8 1.14Mendoza 4.18 4.8 0.87 5.8 0.72 3.7 1.13Santa Fe 8.95 51.6 0.93 12.8 0.70 8.7 1.02LOW DENSITY 9.30 5.2 1.80 7.8 1.19 5.5 1.69Chubut 1.58 1.1 1.42 2.3 0.70 1.2 1.28La Pampa 1.87 0.8 2.26 1.1 1.68 0.7 2.66Neuquen 1.74 1.1 1.60 1.7 1.01 1.2 1.47Rio Negro 2.53 1.7 1.52 1.7 1.52 2.0 1.26Santa Cruz 1.58 0.5 3.25 1.0 1.51 0.4 3.99INTERMEDIATE 19.17 12.8 1.49 11.3 1.69 15.3 1.25Entre Rios 4.89 3.5 1.40 3.4 1.43 4.0 1.21Salta 3.84 2.7 1.41 2.0 1.90 3.8 1.00San Juan 3.39 1.9 1.83 1.3 2.55 1.7 1.99San Luiz 2.29 0.8 2.74 0.9 2.67 0.9 2.47Tucuman 4.76 I.9 1.21 3.7 1.28 4.8 0.99UNDERDEVELOPED 27.50 14.6 1.88 9.7 2.83 21.5 1.28Catamarca 2.76 0.8 3.36 0.6 4.90 1.1 2.60Chaco 5.00 2.8 1.78 1.6 3.09 4.4 1.13Corrientes 3.72 2.6 1.44 1.9 1.96 3.7 0.99Formosa 3.65 1.2 3.04 0.6 6.01 1.9 1.93Jujuy 2.84 1.7 1.65 1.7 1.66 2.6 1.11La Rioja 2.08 0.7 3.19 0.4 5.54 0.7 2.87Misiones 3.31 2.4 1.36 1.6 2.03 3.3 0.99Sgo. del Estero 4.14 2.4 1.76 1.3 3.13 3.7 1.12
Sources: Lei de Coparticipeacion, Capitulo 1, Art. 4, Diciembre 22, 1987.INDEC, ARGENTINA EN CIFRAS: TEFRRITORIO, Poblacion Estimada al 30/5/85.Consejo Federal de Inversiones, Estimates of Gross Provincial Product, xerox.INDEC, LA POBREZA EN LA ARGENTINA, Buenos Aires, 1985.
Note: (a) Includes the impact of the distribution of 2 percent of total sharedrevenues to'Buenos Aires, Neuquen, Chubut and Santa Cruz in primarydistribution, as well as secondary distribution. Distribution from PoderEjecutivo, Cuadro 18.

- 25 -
Table 2.3: ARSENTINA - SECONDARY DISTRIJUTION IN REVENUE SARINC AND RE
DISTRUTION O POPULATION, GROSS PROVINCIAL PRODUCT AND 8I0SEHOLDS
UNSATSTIFIZED JASIC NZDS JY PROVINCZ AND CFI CLASSIFICATION
X for Groas Ha-uebhld, vith
CFI Groupa Secondary Population Provincial Unsatisfied
Provinces Distribu- Product BIaa te eds
tlon
(<) A/B A/D Al?
1988 1985 1980 1980
(A) (E) (C) (D) <E) CF)
TOTAL 100.00 100.0 1.00 100.0 1.00 100.0 1.00
ADVANCED 42.76 67.4 0.63 71.1 0.60 57.7 0.74
Buenos Aires 19.93 43.6 0.46 42.4 0.47 37.5 0.53
Cordoba 9.22 9.4 0.98 10.1 0.91 7.8 1.18Mendoca 4.33 4.8 0.90 5.8 0.75 3.7 1.17
Santa Fe 9.28 9.6 0.97 12.8 0.72 8.7 1.06
LOW DENSITY 8.87 5.2 1.71 7.8 1.13 5.5 1.61
Chubut 1.38 1.1 1.24 2.3 0.61 1.2 1.12
La Pampa 1.95 0.8 2.36 1.1 1.75 0.7 2.77
Neuquen 1.54 1.1 1.41 1.7 0.89 1.2 1.30
Rio Negro 2.62 1.7 1.57 1.7 1.57 2.0 1.31
Santa Cruz 1.38 0.5 2.84 1.0 1.32 0.4 3.49
INTERMEDIATE 19.87 12.8 1.55 11.3 1.75 15.3 1.30
Entre Rios 5.07 3.5 1.46 3.4 1.48 4.0 1.25
Salta 3.98 2.7 1.46 2.0 1.97 3.8 1.04
San Juan 3.51 1.9 1.89 1.3 2.65 1.7 2.06
San Luiz 2.37 0.8 2.83 0.9 2.76 0.9 2.55
Tucumn 4.94 3.9 1.25 3.7 1.33 4.8 1.03
UNDERDEVELOPED 28.50 14.6 1.95 9.7 2.93 21.5 1.33
Catamrca 2.86 0.8 3.48 0.6 5.08 1.1 2.69
Chaco 5.18 2.8 1.84 1.6 3.20 4.4 1.17
Corrientes 3.86 2.6 1.49 1.9 2.03 3.7 1.03
Formosa 3.78 1.2 3.15 0.6 6.22 1.9 2.00
Jujuy 2.95 1.7 1.72 1.7 1.73 2.6 1.15
La Rioja 2.15 0.7 3.30 0.4 5.73 0.7 2.97
Misiones 3.43 2.4 1.41 1.6 2.10 3.3 1.03
Sgo. del Estero 4.29 2.4 1.82 1.3 3.25 3.7 1.16
SOURCES: Leo de Coparticlpacion, Capitulo 1, Art. 4, Diciembre 22, 1987.
INDEC, ARGENTINA EN CIFRAS: TERRITORIO, Poblacion Estiada al. 30/5/85.Consejo Federal de Inversiones, EstimateJ of Groas Provincial Product, xorox.
INDEC, LA POBREZA EN LA ARCENTINA, Buenos Aires, 1985.

- 26 -
Thus, Industrial Promotion acts as a kind of pre-primary distribution.Because of reporting abuses, the full fiscal cost is not knownprecisely, but the total revenue loss (including the contribution fromTierra del Fuego) can be estimated conservatively at 3.5 percent of GDPper year (or close to US$2.5 billion).±Y As the four prcvinces receivingthese subsides had a popu]ation in 1985 of only 1.2 million, the annualper capita subsidy is over US$j2,000. If all of the subsidy were directedlto the 67,600 households with unsatisfied basic needs in these fourprovinces, each household wou]Ld receive almost US$37,000 per year.4áHowever, these households probably receive little dírect or indirectbenefits from these subsidies because relatively few jobs are generatedby the capital intensive activities subsidized within the provincesreceiving the benefits. Furthermore, the more effective IndustrialPromotion is in encouraging industries to locate in the four benefitingprovinces, the greater the trcnsfer of jobs away from provinces wherethe number of households livinig in poverty are the highest.
2.20 Rising Provincial Deficits. The 1988 shortfall in sharedrevenues might not have been so noticeable if the deficits of theprovinces had not been rising rapidly due to declines in their own-source revenues and rising current expenditures, especially forpersonnel. It was the slight rise in total transfers to the provincesthat helped to lower this deficit in 1987, but in 1988, as noted above,total revenue sharing dropped sharply.
2.21 The Ad1ustments. As a result of the shortfall in sharedrevenues and the rising provincial deficits, a number of "adjustments"were made or attempted. The ifirst of these occurred in ]4ay 1988, whenthe Congress approved the creation of the "Transitory Fund to CoverProvincial Fiscal Disequilibria" for one year to help the provinces inadapting to the new system, especially those receiving much less thanthey had in previous years. The revenues from tax increases on tobacco,savings deposits and transfers of public bonds went into this TransitoryFund, which was distributed among 15 provinces in accord withpercentages defined in the Transitory Fund law. Although thisrepresented a departure from the revenue sharing law, the adjustment wastransparent, involving-tax increases that were distributed via criteriafixed in the transitory law.
2.22 Pressures began to build again towards the end of 1988, due tothe persistent shortfall of shared taxes and provincial own-sourcerevenues, as well as rising provincial expenditures. The resulting
1l/ See World Bank, "In¿Lustrial Policy", Annex Chapter: VII, Argentina:Reforms for Price Stability and Growth, (Washington, D.C.: World BankCountry Study, 1990).
A2/ Estimate for 1980 from: INDEC, La Pobreza en La Argentina, BuenosAires, 1985.

- 27 -
conflict between the Central Government and the provinces over the "bonode asistencia financiera" rated front page attention by major newspaperson most days of December 1988. The provinces initially requested fourbillion Australes (US$260 million) to help them meet their payrolls andthe second half of the annual bonus ("aguinaldo") for public employees,as well as other expenditures. At stake in this confrontation was theintegrity of the existing revenue sharing law.
2.23 In the days before this existing revenue sharing law, theconfrontation could have been handled by negotiations between theProvinces and the Ministry of Economy of the Central Government fordiscretionary grants. Under the new law, the Congress must approve anyfunds outside of those allocated through revenue sharing. This raisedthe question of whether Hacienda could "hold the line" and stick to thecriteria of the revenue sharing law, or whether it would be forced toshift back to the old system of discretionary grants. Hacienda adeptlyincluded a number of items into the negotiations, including: tax reformand measures to reduce and make more transparent the huge fiscal losscaused by the Industrial Promotion Program. The final agreement may besummarized as follows.
2.24 Tax reform. The major change was to reduce the nominal ratesof taxes, but to compensate for the resulting revenue loss throughincreased efficacy of tax collection.
2.25 Control of the Industrial Promotion Subsidies. Firmsbenefitting from these subsidies will now "pay" their taxes with US$10billion worth of "bonds" given to them by the Central Government inaccord with the projects that they originally submitted for approval.The idea is to control the fiscal loss from these subsidies as much aspossible. Under the prevailing system, four provinces (San Luis, LaRioja, San Juan and Catamarca) had the right to approve industrialprojects for promotion, up to a certain threshold value. These fourprovinces, therefore, had the authority to exempt firms from payingFederal taxes, with frequent abuses, such as dividing projects intounits with values below the limit and purposely underestimating totalproject costs.
2.26 As fiscal loss from Industrial Promotion is on taxes that areshared with the provinces, it should be seen as a kind of "pre-primary"distribution to these provinces, or as an implicit transfer. Combiningthe negotiation of the changes in industrial promotion together withthe "bono de assistencia provincial" made this quite clear to all of thegovernors, especially those which have lost industries because of it,such as Buenos Aires and Santa Fe.
2.27 The Bonos. The total amount of the bono was the object of muchnegotiation, with the provinces requesting four billion Australes andthe Government offering three billion Australes. The final agreementinvolved two bonos: The Bono para El Saneamento Financiero Provincial(hereafter, Bono Provincial), and Bono Federal.

- 28 -
Bono Provincial. The Bono Provincial of A$ three billion (aboutUS$200 million) was a. non-negotiable bond of the Central Governmenttransferred to the provinces using the same percentages establishedfor secondary distribution in the revenue sharing law. Theprovinces will pay ti.e loan back to the Central Government in twoyears with one of grace, with interest determined by the CentralBank plus monetary correction. Payments will be aut:omaticallydeducted from the shared revenues of the provinces. Most provincestransferred the bonds at face value to the provincial banks inpayment of their debts. This Bono is a good example of howconvoluted intergovernmerLtal relations in Argentína can be: it wasissued by the central government, but "marketed" by the provinces,to be paid by the Central Government, using resources discountedfrom the resources of the provinces from revenue sharing.
The Bono Federal. This bond of A$ two billion (US$130 million) wasto have been issued by the government, which was to receive 42.3percent and the provinces 57.7 percent. The provincial share wasthen to be divided in accord with the percentages established inthe revenue sharing law. However, due to the economic crisis, thebond was never issued by the Central Government.
Even adding on the amounts from the Transitory Fund and tihe BonoProvincial did not compensate for the shortfall in sharecl taxes. Thetotal of these "adjustments" plus "normal" revenue sharing dropped byalmost eight percent in real terms in 1988. Although the new RevenueSharing Law clearly represents a considerable improvement: inintergovernmental fiscal relations, it can only complement adequatemacroeconomic stabilization policy at the national level; it isobviously no substitute for it.
E. Snuumarv and Recommendations
2.28 Although the new revenue sharing law reduced uncertainty bylegally defining both primary and secondary distribution, the soleremaining variable (the collection of shared taxes) turned out to bequite unstable, resulting in a significant shortfall during fiscal 1988.Improving intergovernmental fiscal relations can compleme.nt adequatemacroeconomic policy at the national level, but it is obviously nosubstitute for it. This shortfall, in combination with the continuingdecline in the collection of provincial taxes and the rapid rise intheir current expenditures, made 1988 a very difficult year for theprovinces.
2.29 The new Government seems quite firmly committed both tofurther improving intergovernmental fiscal relations, as well as toinducing the provinces to increase their own fiscal effort and toimprove their expenditure esfficiency. Clearly, these efforts at boththe national and provincial levels are needed. Priority areas for

- 29 -
improvement in Argentina's management of intergovernmental fiscalrelations are indicated below.
Improve Efficiencv and Equity of National/Sub-national Relations
2.30 It is recommended that the Central Government develop amonitoring and evaluation system of national/sub-national relations,leading to action plans for their improvement. Key areas for thecoverage of these action plans would include improvements in: the inter-governmental transfer system; the overall system of taxation; and thematching of service delivery responsibilities and resource mobilizationpotential, according to the comparative advantages of each level ofgovernment.
2.31 The National/Sub-national Transfer Svstem. The objectivewould be to identify and agree to ways of increasing the equity andefficiency of all types of transfers, including revenue sharing,royalties, matching grants, etc. For example, one alternative might beto channel all funds now used for discretionary grants (e.g.,electricity, nutrition, etc.) into a sub-national development fund whichwould then allocate these resources according to clearly definedcriteria that are consistent with national policies for stabilizationand growth. Another alternative would be to leave the funds as theyare, but allocate them using predictable and transparent criteria thatcontribute to the objectives of efficiency, equity and stability. Stillanother option would be to abolish these funds and transfer theresources directly through revenue sharing. The equity (bothinterpersonal and territorial) and efficiency of the criteria used inrevenue sharing should be examined, íncluding the feasibility of addingincentives for fiscal effort to the existing re-distributive criteria.In so doing, the achievement of a better matching of service deliveryresponsibility and resource mobilization potential must be taken intoaccount (see para. 2.35).
2.32 The question of royalties should be dealt with in the broadercontext of the national energy policy. One suggestion is to pay theroyalties "in kind"; another is to transfer ownership of sub-soilmineral rights to the provinces. More efficient and equitable ways ofstimulating provincial economic development than the current IndustrialPromotion should also be studied. The distributional impact of subsidiesto public entities with operational deficits and in the pricing ofpublic goods should also be analyzed. However, the reduction of thesesubsidies should be addressed directly by improving cost recovery andmarginal cost pricing, rather than by trying to compensate for thesedistortions via the revenue sharing system.
2.33 Rationalization of the Tax System. As will be discussed inmore detail in the following chapter, there are currently verysignificant overlaps in the tax system. For example, all three levelsof government tax production: the Central Government with the valueadded tax, the provinces with the turnover tax, and the municipalities

- 30 -
through a number of different taxes. Thus, the same taxpayer must paytaxes to all three levels, each of which must maintain teams forcollection, normally with no cooperation among them. The possibility ofconcentrating the Value Added Tax at the governmental level that couldmost effectively collect il:, w:ith sharing to other levels, should beanalyzed. One interesting proposal has been to have the provincescollect the Value Added Tax, which they could, in turn, share with theCentral Government. The Value Added Tax would apply down through thewholesale level. A retail sales tax also could be applied.Consideration also should be given decentralization and simplificationof the tax system as an alternative or complement to a new revenuesharing system.43
2.34 Yet another area of overlap is in the maintenance of cadastresto charge the provincial real estate and the municipal service taxes(street cleaning, lighting and maintenance, etc.). The possibility ofunifying these cadastres or decentralizing the collection of the realestate tax to the municipalities or at least a sub-set of them (e.g.,larger municipalities with greater administrative capacity) should beexamined.
2.35 Better Matching of Service Delivery ResDonsibility andResource Mobilization PotentiaL. Alternatives for the division ofservice delivery responsibilities among the three levels of governmentshould be evaluated, takingi into account the comparative advantages ofeach regarding service deliivery efficiency and resource mobilization.These comparative advantages, of course, might be quite different inprovinces of different socio-economic characteristics. Flexiblesystems, in which the municipaLities or provinces might contract forservices from one another, for example, should be considered. Mostimportantly, any shifts in service delivery responsibilities (e.g., therecent transfer of responsibility for secondary education to theprovinces) should be preceled by a detailed analysis of the fiscalimplications and the preparation of plans to assure that adequateresources are available for provision of the service. Unfortunately,this has usually not been the case.
Improve the National Inforriation System on Provincial Finance
2.36 It is impossible to do competent macroeconomic fiscal planningwithout adequate information on sub-national public finance, when thegeneral administrations of provinces alone are spending well over 12percent of GDP and running up deficits of over US$ one billion per year.A first step in improving financial management by sub-nationalgovernments, and also the consolidated public sector accounts for
A/ For a discussion of somre of these issues, see ihe World Bank,Argentina: Tax Policy for Stabilization and Eccnomic Recovery,,(Washington, D.C.: World Bank Country Study, 1990).

- 31 -
general macroeconomic policy formulation, should be to establish anefficient information system for the collection and analysis of sub-national budget data. For complete consolidated public accounts at thesub-national level, municipal governments should be included, giventheir increasing importance, as well as sub-national public enterprises.
2.37 The proposed information system of the Secretaria de Haciendaof the national Ministry of Economy should be implemented as quickly aspossible. The design of this system should emphasize coverage of theentire, sub-national public sector including both the non-financial andthe financial sub-sectors (i.e. the provincial banks). The non-financial sub-sector must cover both the central administration and thedecentralized entities and enterprises.
2.38 Adequate resources, including proper equipment and staffingfor both the national Secretaria de Hacienda and the provinces, shouldbe provided iímediately. Technical assistance also should be directedto the provinces, so that they can more rapidly provide the basicfinancial management information necessary for their own planning, aswell as that of the Central Government. In the future, it would beimportant for all provinces and the Central Government to operate onfully compatible information systems. A first step might be to preparestandard templates for spreadsheets that can be used by the provinces.
2.39 The Secretaria de Hacienda should intensify its efforts tostandardize treatment of budget items among the provinces, and itsguidelines, "Normas para la Confeccion de Los PresupuestosProvinciales", should be updated. The unification of the definition ofthe functional categories of expenditures is particularly importantf', asis the generation and analysis of tables on the principal types ofexpenditures within each category (e.g., personnel, goods and services.)The results for each exercise for both cash and accrual basis accountingfor expenditures should be published, given the importance of thechanges the floating debt (see Chapter V, Section B; further analysis isprovided in Annex Chapter I, paras. 1.19-1.26).
2.40 Hacienda should publish periodic reports on the financialperformance of the sub-national public sector, and also make the datacollected available on detailed spreadsheets for those wishing to use itin policy analysis. It also should provide technical assistance to theprovincial governments, going beyond the information systems mentionedabove, with activities such as workshops, training programs and thedevelopment of software. It should seek to identify successfulsolutions and diffuse them among the other provinces. In other words,it should try to keep the provinces informed as to what is working and
há/ For the functional categories suggested by the IMF, see Table B/C:IMF, A Manual on Government Finance Statistics, (Washington, D.C.:1986), p. 193.

- 32 -
what is not. The seminars and workshops are one way of accomplishingthis, but Hacienda might also sponsor research and development.
2.41 In addition to this technical assistance from the centralgovernment, provincial governments may wish to "pool" t]heir effortsthrough their regional associLations or informal groups, as there areundoubtedly economies of scaiLe in such activities as developingsoftware, devising methodologies, etc.
Reducing the Deficits and Improving the Efficiency of ProvincialGovernments
2.42 The remainder of this report deals primarily with what theprovinces can do for themnselves in terms of increasing their own-sourcerevenues, as well as redtucing and increasing the effici,ency of theirexpenditures. It also examines provincial budgeting and managementsystems and suggests an agenda for reforms directed to imaking theprovinces financially aut:onomous and more effective providers of publicservices in support of the nation's economic development. Therecommendations of the present chapter are included in the strategy forprovincial fiscal reform and improved expenditure efficLency presentedin Chapter VII.

- 33 -
III. PROVINCIAL REVENUES
3.01 Total provincial revenues from all sources tended to risesteadily during the 1970-86 period, increasing from 7.5 percent of GDPin 1970, to 11.2 percent in 1986. The top line of Figure 3.1 is totalrevenue from all sources, and the second, provincial own-sourcerevenues. The gap between the two is the amount covered by transfers ofall types from the Central Government, which increased greatly after1980. The case study data show that this gap widened further in 1987,when own-source revenues declined by 14.7 percent. As this drop waspartially compensated by a 2.7 percent rise in transfers from thecentral government, total revenues from all sources for the sixprovinces in 1987 suffered a real decline of 8.5 percent.A4
A. Provincial Own-Source Revenues
3.02 The percentage of total revenue that is own-source (i.e., fromprovincial tax and non-tax sources) is an indicator of fiscal autonomy.Figure 3.2 shows that this percentage varíes widely among the provincesof the four provincial groups in 1986. As expected, fiscal autonomy washighest in the Advanced Group (59.8 percent),4W ranging from 31.7 percentin Mendoza to 60.2 percent in the Province of Buenos Aires. It waslowest for the provinces of the Underdeveloped Group (15.4 percent),even though Jujuy and Missiones show indicators of over 20 percent for1986, higher than most of the provinces of the Low-density Group. Forthose provinces with low population but high per capita product on theresource frontier (i.e., Low Density), the percentage of total revenuesthat are own source was only 20.3 percent due to the very high percapita revenues from royalties, ranging from only 11.5 percent in SantaCruz to 23.5 percent in La Pampa. This percentage from own-sourcerevenues was, in fact, much lower for the Low Density Group than for theIntermediate Group, even though per capita product of the Low DensityGroup was much higher.
3.03 Tax revenues are much more important sources of revenue forthe provinces than non-tax revenues from fees, tariffs, etc. See Figure3.3. However this low proportion of non-tax revenues is partially due
á./ In Figure 3.1, revenue sharing and discretionary grants are lumpedtogether. In general, however, revenue sharing is treated in thisreport as a current revenue from a national source, and grants as aseparate category. For a detailed discussion of this and other issuesrelated to the data, see Annex Chapter I.
A6/ See Chapter 1, para. 1.25, for the definition of the provincialgroups.

- 34 -
Figure 3.1 Figure 3;2
PROVINCIAL TOTAL AND OWN-SOURCE REVENUE OWN-SOURCE AS PERCENT OF TOTAL REVENUECALL PROVINCES AND THE FEDERAL CAPIrAL BY PROVINCIAL. GROUPS
% OF GDP S OF TOTAL REVENUES14- 70
12 60o
10~~~~~~~~~~~~~5
46
:30
20
10
70 71 72 73 74 75 76 77 78 7 80 81 82 8384 86 86vYEAR0
TOTAL ADANCED LOW INTER- UN~DENEl'TV ItEDATE O<VWfOPBD- TOTAL REVENUES C OWN-SOURCE PROVINCIAL GROUP
9ee Table 3.t oSurce: See Table 3.2
Figure 3.3 Figure 3.4
OWN-8OURCE CURRENT REVENUES Ir TYPE PROVINCIAL TAX REVENUE8 »Y TYPUALL PROVINCES AND THE FEDERAL CAPITAL ALL PROVINCES AND TIJE FEDERAL CAPrITN
% OF GOP S OF GDP6~~~~ 2.5
2-
4-
1.6
70 71 72 73 747 76 77 70 19 80 81 e2 U0 4 u u7 7nT27T37r4 r576767778 7980 81 82 e3 84 116 85 YE8AYEAR
- REAL ST1T -E TUfIIIOWN-SOURCE REVENUE5 -4- TAX -* NON-MkX -*- VEHICLE Z TR
$cure~: fte : am &t Soura SeT Table 3.1.

Table 3.1: ARGENTINA - PROVINCIAL OWN-SOURCE REVENUES AND REVENUES FROM NATIONAL SOURCES, 1970-1986
(X of GDP)
70 71 72 73 74 75 76 77 78 79 80 81 82 83 84 85 86
TOTAL REVENUES FRON ALL SOURCES 7.55 6.75 6.23 7.64 9.43 10.04 8.53 9.67 10.52 10.28 11.29 10.71 9.40 11.64 10.38 10.77 11.22
Provincial Own-Source Revenues 4.02 3.36 2.64 2.67 3.22 1.77 2.15 3.93 4.88 5.02 5.63 4.83 4.46 4.04 4.49 4.71 4.99
X OWN-SOURCEITOTAL REVENUE 53.3 49.8 42.3 35.0 34.1 17.6 25.2 40.7 46.4 48.8 49.9 45.1 47.4 34.7 43.3 43.7 44.5
Current 3.94 3.32 2.59 2.64 3.10 1.73 2.10 3.89 4.82 4.97 5.58 4.78 4.38 4.01 4.42 4.67 4.97
Tax 2.78 2.30 1.97 1.91 2.23 0.98 1.62 2.89 3.50 3.76 4.37 3.70 3.32 2.68 3.20 3.40 3.83
A. Property Taxes 0.53 0.43 0.42 0.40 0.41 0.22 0.20 0.52 0.71 0.74 0.88 0.84 0.76 0.59 0.86 0.85 0.86B. Gross Sales or Turnover 1.14 0.95 0.78 0.74 0.92 0.13 0.88 1.56 1.83 1.86 2.10 1.84 1.74 1.47 1.66 1.74 2.09
C. Vehicle 0.22 0.19 0.15 0.15 0.16 0.13 0.07 0.14 0.19 0.32 0.36 0.33 0.28 0.25 0.35 0.41 0.34
D. Stamp Duty or Transfer 0.52 0.45 0.39 0.40 0.48 0.31 0.26 0.45 0.54 0.59 0.70 0.52 0.39 0.32 0.28 0.32 0.46
E. Other Taxes 0.37 0.28 0.22 0.21 0.26 0.19 0.21 0.22 0.23 0.25 0.33 0.18 0.16 0.05 0.05 0.07 0.08
Non-tax 1.15 1.02 0.62 0.73 0.87 0.76 0.48 1.00 1.32 1.21 1.21 1.08 1.05 1.33 1.21 1.27 1.14
Capital 0.08 0.04 0.05 0.03 0.11 0.03 0.05 0.04 0.06 0.05 0.06 0.05 0.08 0.03 0.07 0.04 0.02
National Sources (a) 3.53 3.39 3.59 4.97 6.21 8.27 6.38 5.73 5.64 5.26 5.65 5.88 4.94 7.61 5.89 6.06 6.23
Index (Base: 1970-100) (b)
GDP (thousands of Australes) 100.0 108.7 95.4 108.0 111.2 99.5 73.9 87.1 108.5 140.5 154.2 124.7 81.6 84.7 97.7 88.6 103.0Own-Source Revenues 100.0 84.3 65.8 67.0 78.8 44.0 53.3 98.8 122.4 126.2 141.6 121.4 111.1 101.7 112.2 118.5 126.2
Tax 100.0 89.6 67.4 73.9 89.1 35.0 43.0 90.4 136.5 189.9 242.0 165.9 97.3 81.4 112.4 108.1 141.6
Real Estate 100.0 89.1 76.3 82.7 86.4 41.2 28.0 85.2 145.8 197.3 255.6 197.3 117.4 94.7 158.5 143.2 167.5Turnover 100.0 90.1 65.0 69.9 89.1 11.3 57.1 119.0 174.1 228.5 283.6 200.4 124.0 108.7 142.3 134.9 188.2
Vehicle 100.0 90.6 66.2 71.1 80.5 56.4 22.9 54.5 95.1 205.0 251.7 186.1 102.4 96.4 154.7 163.9 158.9Transfer (Sellos) 100.0 94.1 71.1 83.4 102.2 59.7 37.2 75.5 112.1 157.3 207.4 124.3 60.6 51.4 52.1 54.4 90.6
Other 100.0 81.8 57.7 62.1 79.7 51.5 41.2 52.0 66.4 96.6 137.4 61.1 34.9 11.4 13.9 17.6 22.0
Non-Tax 100.0 96.4 51.6 68.6 83.9 65.2 30.9 75.7 123.9 147.2 161.3 116.5 74.5 97.6 102.8 97.5 101.7
Source: See Table 1.1.
Notes: (a) All transfers from national bources, including revenue sharing, granta, royalties, etc.
(b) Constant values calculated using consumer and wholesale price
indices (equal vwight for each).

- 36 -
Table 3.2: ARGENTINA - OWN-SOURCE REVENUES BY CFI PROVINCIAL GROUPINGS, 1981-86
(Percent of Total Revenues)
Provincial Groupings 1981 1982 1983 1984 1985 1916 Mean Coefficlent
1981-86 of Variation
TOTAL 47.7 4t;.8 31.6 42.2 41.5 42.8 42.1 12.5
Advanced 64.0 6b.2 45.1 60.1 59.8 59.8 58.9 10.9
Low Density 22.9 20.8 14.4 15.6 18.4 20.3 18.8 15.8
Internediate 29.7 26.9 17.4 25.4 25.4 27.8 25.4 15.3
Underdeveloped 20.1 18.1 12.4 14.3 13.1 15.4 15.6 17.5
Source: See Table 16 of Statistical Appendix.
Notes: (a) Standard deviation/mean 1981-1986.
(b) The percentages are slig,itly different from the previous table
due to the different treatment of grants (See Annex Chapter I, para. 1.28).
to the exclusion of the provincial public enterprises from the Haciendadata, which only include ut:ility revenues and expenditures when providedby decentralized entities.
Tax Revenues
3.04 The provinces collect: four main taxes: a turnover tax (grosssales tax), a real estate t:ax, a vehicle tax, and-a transfer tax(sellos). Total provincial. tax revenue recovered rapidly from thefiscal reform of 1975, which cut their total tax receipts by half toonly 1.0 percent of GDP in 1975, peaking at 4.4 percent of GDP in 1980,then dropping all the way dlown to 2.7 percent of GDP in 1983, beforebeginning a steady recovery to 3.8 percent in 1986 (See Figure 3.3).Thus, there was a difference of 0.6 percent of GDP between the peak yearof 1980 and 1986. If the provinces had maintained their tax collectionat the 1980 level, they woILld have had about US$350 million more of taxrevenue in 1986. Provinces clearly have maintained a higher fiscaleffort in the past. Data from the case studies show that total real taxrevenues dropped by over 11 percent in 1987 due in part to the rapidrise of inflation, with al]. taxes showing losses in real terms.
3.05 The primary "motor" ¡n this improvement since 1975 was theturnover or gross sales tax, recovering after its reinstatement in 1976.It increased from less than one percent of GDP in 1976, to 2.1 percentof GDP in 1980, before dropping back down to 1.5 percent in 1983, and

- 37 -
then rising back up to 2.1 percent of GDP in 1986.±'/ Over the 1980-86period, the real estate and vehicle taxes showed fairly stable trends,with only the transfer tax (i.e., stamp tax) losing ground in recentyears (see Figure 3.4). This temporal instability in fiscal performancecan be explained by the Olivera-Tanzi effect in times of risinginflation, but also by shifts in the efficiency of collection andbilling procedures (See paras. 3.18-3.44).
3.06 The turnover tax is paid by all types of business activity onthe basis of gross sales. Typical rates range from one percent to 2.5percent depending on the type of business, with lower rates for food andmedicines.
3.07 The importance of these different taxes varied greatly amongthe six case-study provinces. For the general administrations of allsix provinces, the most important source of tax revenue is the turnovertax (Ingressos Brutos), which accounts for about half of all tax revenuein all six provinces in 1987, ranging from 47.2 percent of total taxrevenue in Santa Fe to 64.0 percent in Cordoba. The second mostimportant tax varies by province. The real estate tax is quiteimportant in Buenos Aires, Santa Fe and Cordoba, where it accounted forabout a fifth of total tax revenue in 1987. However, in Santiago delEstero, Salta and Chubut this tax ranks below the transfer tax (Sellos).In Chubut, less than one percent of total tax revenue comes from thereal estate tax. The transfer tax is charged on all transfers ofproperty (e.g., real estate and other property) as a percent of thetotal amount transferred. For all six provinces, the percentage ofincome coming from this transfer tax ranges from about 14 percent inBuenos Aires to 21 percent in Santa Fe. In both Cordoba and Chubut, thevehicle tax is collected by the province but deposited directly in theaccounts of the municipalities without being registered as a provincialrevenue.
Non-tax Revenues
3.08 The performance on non-tax revenues from fees, tariffs, etc.has been quite weak, with their total more or less stable at around onepercent of GDP in the 1980s. This low importance is partially due tothe exclusion of the provincial public enterprises from the Haciendadata, as noted above. For Buenos Aires, adding these enterprises boostsnon-tax revenues, from 10.4 percent of total own-source provincialcurrent revenues in 1987 to 22.7 percent.4f These non-tax revenues,
Í./ The turnover tax was abolished in favor of the National Value AddedTax in 1975 in one of several unsuccessful attempts to eliminate it.As with the other attempts, the precipitous drop in provincialrevenues forced reinstatement.
Ai8 These public utilities are currently consolidated in the provincialbudget, but were not at the time of this study.

- 38 -
including public utilities, dropped by almost 38 percent in 1987 for thesix provinces, adding to the longer term negative slíde.
B. Comparative Performance on Current Reventues
3.09 Revenue per capita and as a percent of gross provincialproduct (GPP) are rough iíndicaLtors of fiscal effort. 9' Per capita efforton own-source taxes is about the same for all six provinces, with theexception of Santiago del Estero, the poorest. For example, per capitaown-source tax revenues ranged from US$71 to US$87 for the five higherincome provinces versus only US$28 in Santiago del Estero. See Figure3.5. This figure also shows the enormous impact of the transfers fromthe central goverrnment on total per capita revenues of the provinces. In1987, the total per capita. cur-rent revenue from both provincial andnational sources was US$338 for Chubut versus only US$12:3for Buenos Aires, almost t.hree times greater. Chubut's per capitarevenues from royalties (US$159) were 30 percent higher than those ofBuenos Aires from all sources (US$123). Santiago del Estero's total percapita revenue (US$209) waLs about 70 percent higher than that of BuenosAires, due chiefly to the US$1.64 per capita that it receives fromrevenue sharing. Salta also had much higher per capita current revenuesthan Buenos Aires due to its high receipts from royalties and revenuesharing.
3.10 Among the provinces of the "Advanced" group, Cordoba and SantaFe do slightly better (48 percent and 34 percent, respectively) thanBuenos Aires in terms of per capita current revenues. Thie comparativeadvantage of Cordoba is due to revenue sharing, and in Santa Fe, itresults from a combination of higher per capita revenues from own-sources and from revenue sharLng (Table 3.3).
3.11 Figure 3.6 shows that the differences among the provincesregarding own source revenue iLn terms of GPP are much smaller than fortransfers. For example, t:otal own source revenues in 19B7 ranged from2.7 percent of GPP in Chubut to 4.2 percent in Buenos Aires. In termsof local tax efforts as a percent of GPP in 1987, the differences amongthe provinces are as follows: Chubut, 2.1 percent; Salta, 2.6 percent;Santiago del Estero, 2.9 percent; Santa Fe, 3.4 percent; Cordoba, 3.6percent; and Buenos Aires, 3.7 percent (Table 3.4).
3.12 GPP is quite relevant for measuring capacity to pay taxes onproduction, such as the turnover and transfer taxes, but not necessarily
A9/ The estimates of GP]? are done by CFI. The impact on revenues ofinflation (Olivera-Tanzi effect) should be considereid in interpretingthese ratios.

- 39 -
Fligure 3. 5
PER CAPITA CURRENT REVENUE8 IY SCUACE8iX PROVINCE MT
PER CAPITA REVENUE (USS)360
300
260
200
100
60
Total l odoba Chubut *alta San StlWoAlma Fe dol ate
PROVINCES
_ Own-ouroa E§ RaveM Sha,lng
O Royaltes lW Otlw KtIonal
Sotwoe Summary Tabie S.S
Figure 3. 6
CURRENT REVENUES EY 8OURCE A8S OF GPPaix PROVINCE8 tN7
s OF GR088 PROV. PRODUCT26
20-
16
10
Total s Corda Clhihut salta Santa SanteWoAlma Fe del Esta
PROVINCES
m OWN-SOUtNCE REVENUE IlHARIlS
= ROYLTIES m OTHER HATIONAL.
Source Ss &ummewy Table 3.4.

- 40 -
Table 3.3: ARGENTINA - PER CAPITA CURRENT PROVINCIAL REVENUES BY SOURCE FOR THE GENERAL
GENERAL ADMINISTRATIONS (a) OF TRE SIX PROVINCES OF TRE CASE STUDIES, 1987
(Dollars of July of 1988)
Trotal
for gix Buenos Cordoba Chubut Salta Santa Santiago
prov!Lnces Aires Fe del
Estero
CURRENT REVENUES 148 123 182 338 214 165 209
Provincial Sources 73 72 71 81 79 87 28
Tax 64 64 64 65 40 78 25
Real estate 13 14 13 4 3 16 3
Automobile 6 7 0 5 2 8 1
Turnover 34 33 41 37 23 37 14
Tranafer (Sellos) 10 9 10 13 9 16 4
Energy and Fuel 0 0 0 0 0 O
Others 1 1 0 6 3 1
Non-tax 9 7 7 16 39 9 3
Fees 0 0 0 0 5 0 2
Tarifs 1 0 0 0 25 0 C
Interest 1 1 0 0 0 0 0
Transfers received O O ° ° ° O O
Others 7 6 7 16 8 9 2
NatiLonal Sources 75 51 112 257 135 79 17C
Federal Revenue Sharing (c) 60 43 104 52 63 61 164
Highway fund 6 6 0 8 7 8 7
Royalties 6 0 0 159 66 0 0
Others 4 2 8 38 0 9 8
Others and Highway Fund (Other National) 9 8 8 46 7 18 16
Other sources of current revenues O O O O O O
Source: Case studiLes. See Table 11 iLn the Statistical Appendix.
Note: (a) Includes central administratLcin, decentralized entitiLes and apeclal accounts.

- 41 -
Tabla 3-4: ARGENTINA - CURNT PROVINCIAL REVENUES BY SOURCE FOR TEE GENERAL
GENERAL ADMINISTRATIONS (a) OF THE SIX PROVINCES OF THE CASE STUDIES, 1987
(Percent of Grosa Provincial Product)
Total Buenos Cordoba Chubut Salta Santa Santiago
Provinces Aires Fe del
Estero
CURRENT REVENUES 8.27 7.14 10.26 11.11 14.19 7.26 24.35
Provincial Sources 4.08 4.18 3.99 2.66 5.21 3.80 3.31
Tax 3.59 3.74 3.61 2.14 2.63 3.41 2.92
Real estate 0.75 0.84 0.73 0.14 0.21 0.70 0.30
Automobile 0.31 0.40 0.00 0.14 0.10 0.36 0.16
Turnover 1.90 1.94 2.31 1.23 1.52 1.61 1.61
Transfer (Sellos) 0.55 0.51 0.56 0.42 0.60 0.71 0.43
Energy and Fuel 0.00 0.00 0.00 0.00 0.00 0.00 0.00
Others 0.08 0.05 0.01 0.19 0.20 0.03 0.42
Non-tax 0.49 0.43 0.37 0.52 2.58 0.39 0.39
Feea 0.02 0.00 0.00 0.00 0.34 0.00 0.19
Tarifs 0.06 0.00 0.00 0.00 1.68 0.00 0.00
Interest 0.05 0.07 0.00 0.00 0.00 0.00 0.00
Transfera received 0.00 0.00 0.00 0.00 0.00 0.00 0.00
Others 0.37 0.36 0.37 0.52 0.56 0.39 0.20
National Sources 4.19 2.97 6.27 8.45 8.98 3.46 20.87
Federal Revenue Sharing 3.35 2.52 5.82 1.71 4.17 2.68 19.14
Eighway fund 0.32 0.35 0.00 0.26 0.45 0.36 0.76
Royaltica 0.31 0.00 0.00 5.24 4.35 0.00 0.00
Others 0.21 0.10 0.45 1.23 0.00 0.42 0.97
Eighway Fund and Others (Other 0.53 0.45 0.45 1.50 0.45 0.78 1.73
National Sources)
Other saources of current revenuea 0.00 0.00 0.00 0.00 0.00 0.00 0.17
Source: Case atudies. See Table 11 in the Statistical Appendix.
Note: (a) Includes central administration, decentralized entities and special accounts.

- 42 -
for those on wealth, such as the real estate and vehicle taxes. Thus,Figure 3.7 shows that the variation for the turnover tax as a percentageof GPP was lower (ranging from 1.2 percent in Chubut to 2.3 percent inCordoba) than that of the real estate tax. Performance on the realestate tax was much more varied, ranging from almost nothing in Saltaand Chubut to almost one percent of product in Buenos Aires. Thetransfer tax (Sellos) is about the same relative percentage of product(0.3 percent to 0.6 percent of GPP) in all provinces.
3.13 Non-tax revenues for the general administraticin and thedecentralized entities are less than one percent in all provinces,except Salta and Buenos Aires, where they reached 2.6 percent of GPP in1987. This reflects the fact that Salta has maintained its "utilities"in its general administration, and that Salta has made an effort toimprove its tariff collections in recent years.
The Distributional Imipact of Provincial Taxes
3.14 A recent study of the incidence of indirect taxes includedboth the provincial turnover and the transfer taxes for five incomegroups.L' Even when calculated as a percentage of total familyexpenditures, the turnover tax proved to be quite regressive, accountingfor 6.1 percent for the lowest income family (average monthly incomeUS$187) versus 4.8 percent for the highest income group (average monthlyincome of US$445). In contrast, the incidence of value added tax wasquite progressive. On the other hand, the incidence of the transfer taxwas not only much lower, but its incidence was more progressive, 0.02percent for the lowest income group versus 0.04 percent for the highestincome group. Obviously, calculating these percentages based on income,rather than expenditures, would have reduced the progressiveness of thisincidence considerably, as lower income families spent on average 8percent more than they earned, whereas the higher income group saved 6percent of its monthly income. Greater reliance on the transfer taxrelative to the turnover tax could increase the equity of thedistribution of the burden of provincial taxes.
The Buovancy of Provincial Own-Source Revenues
3.15 The aggregate diata from all provinces show that the provincialtax revenues have been much more buoyant than non-tax revenues.11 See
10/ J. L. Bour, J. Sereno, and N. Susmel, Incidencia de los ImpuestosIndirectos en el Gasto de las Familias, Documento del Trabajo 20,FIEL, Buenos Aires, 19891, pp. 24-25.
51 Buoyancy refers to the rise of tax revenues due to both discretionaryaction and general economic activity. For a review of tbisliterature: See D, S. Wilford and W. T. Wilford, "Estimates ofRevenue Elasticity and Buoyancy in Central America,n in J. F. Toye
(continued...)

- 43 -
Figure 3.8. The buoyancy for the turnover tax for the 1976-86 periodwas especially high, but the real estate, transfer and vehicle taxesalso showed significant buoyancy. Figure 3.9, however, shows that thiswas concentrated after the revenue reforms of 1975 that were discussedin Chapter II.
The Olivera-Tanzi Effect for Provincial Tax Revenues
3.16 Loss of the real value of a tax from the moment it is incurredto the moment of payment due to inflation is obviously of muchimportance for Argentina. The higher inflation and/or the longer thiscollection period, the greater the Olivera-Tanzi effect. Estimates forthe Province of Buenos Aires show the total fiscal loss due to theOlivera-Tanzi effect for the turnover and transfer taxes alone reachedalmost US$50 million for the first semester of 1989 alone, givencollection periods of over one month and hyperinflation. Other lossesdue to inflation can be much higher. The provincial banks sometimestake as long as six months to transfer taxes collected into the accountof the provincial government. In other words, the time of transferwithin the government can be much longer than the collection perioditself.
C. The Efficiency of Revenue Collection
3.17 There is a very wide margin for improvement in theadministration of provincial tax and non-tax revenues. Not only arebilling and collection procedures quite inefficient, but there is alsomuch overlap between provincial taxes and those at both the national andthe municipal levels, yet little or no cooperation in theiradministration.
Inefficiencv of the Existing Tax System
3.18 The provincial turnover tax overlaps with the national valueadded tax, as well as a host of municipal taxes. Although they aretaxing the same firms, the provincial and national teams do notcooperate at all. The taxpayer must declare and pay taxes on the samebase to all three levels in many cases. In addition to this overlap,the turnover tax is very distorting, as it is charged on the full valueof production at each stage (taxing producers, wholesalers andretailers), causing firms to vertically integrate to avoid taxation,
W( . . . continued)(ed.), Taxation and Development: Twelve Critical Studies (London:Frank Cass, 1978), pp. 83-101.

- 44 -
. lguxe 33.7 iue 3 . 8
GDP, OWN-SOURCE TAX AND NON-TAX REVENUESALL PROVINCE& 1970-86 TAX REVENUES BY TYPE AS % OF GPP
SIX PROVINCES: 1987
CHANGE (BASE: 1970.100)250 - % OF GROSS PROV. PFIODUCT
2000 3 l
150 :S 90 :~~~~aa ~ ~ ~ I 4
x5 Total Bueno. Cordoba Chubut Salta Santa SantiagoAirea Fe dei Eat.ro
PROVINCESO70 71 72 73 74 75 76 77 78 79 80 81 82 83 84 85 86 TURNOVER 2 REAL ESTATE
YEAR AUTOMOBILE 0 TRANSFER TAX
- GDP x TAX - NON-TAXSource: Table 3.4.
Source Seo Table 3.1 Note: Excludes revenue frcrm other-taxee.
Fi=ure 3. 9
C,DP AND TAX REVENUES BY TYPEALL PROVINCE& 1970-86
CHANGE (BASE. 1970.100)300-
250
200
10
70 71 72 73 74 75 76 77 78 79 80 81 82 83 84 85 88YEAR
CDP F TURNOVER x REAL ESTATE
- VEFIICLE - TRANSFER TAX
Source: See TabIe 3.1.

- 45 -
when they would otherwise not do so.L1 For example, in many cases itmight be efficient to separate the production and distributionfunctions, but this is not done to avoid taxation.
Efficiency and Eguity of Billing and Collection Procedures
3.19 Billing and collection procedures for both tax and non-taxrevenues tend to be highly inefficient in all of the provinces studied.Just the most basic improvements in these procedures could increaserevenues significantly, as well as reduce the inequities resulting from"free-riding" by those who are not billed and by evaders. As turnoverand real estate taxes yield most revenue, they receive the mostattention here.
3.20 The Turnover Tax. The effectiveness of the administration ofthis tax varies among the provinces, but there is generally a highdegree of tax evasion from under-reporting income and from businessesthat are undetected for long periods. Although there are no goodstudies of total evasion, most provincial officials estimate that theprovinces collect less than half of the potential total.
3.21 The costs of tax administration and compliance are high. Inmany provinces, the tax administration office sends periodic taxvouchers, based on previous tax reporting and payments. The taxpayershould pay in installments in any of the authorized banks and at the endof the fiscal year reports and pays the difference between the partialpayments and the tax estimated.
3.22 Provinces with a diversified economic base find it moredifficult to administer the tax than those where production isconcentrated in a few products. In the province of Buenos Aires, forexample, tax evasion is quite high with only 500,000 of a total ofapproximately 700,000 registered taxpayers filing returns. Of 120,000registered taxpayers in Santa Fe, only 55,000 file returns. As theprovince of Buenos Aires has a small number of inspectors, it auditsonly a small portion of the registered taxpayers. There is, however,normally good control of large taxpayers which constitute a large partof the potential tax base: 20 percent of taxpayers provide about 80percent of the tax revenue.
3.23 The situation in the Province of La Pampa is totally differentas the economic base is largely agricultural and also because it is somuch smaller in size and number of establishments. These products aresold by producers to commodity traders, who in turn sell them to
52/ For a more complete analysis of the tax system and alternatives forreform, see the Bank's study: Argentina: Tax Policy for Stabilizationand Recovery, (Washington, D.C.: World Bank Country Study, 1990).

- 46 -
exporters or to agro-industries. In some cases, these industries buydirectly from producers.
3.24 The tax administration office of La Pampa signed an agreementwith the association of commodity traders for them to withhold the taxfrom the seller and deposit it in a government account. The tax ratewith withholding is lower: 0.4 percent versus one percent. There arecheckpoints on the main access roads where the trucker must show areceipt from either the commodity trader or municipal tax office. Theresult is that turnover tax compliance in La Pampa genera.lly is good.
3.25 Existing plans to improve tax administration irn severalprovinces tend to put too nuch emphasis on increased penalties forevaders. These plans overlook the need to improve the taxadministration itself, including measures to increase the number offirms reporting and to follow-up on tax compliance. The province ofSanta Fe plans to inspect most taxpayers at least once a year, but hasonly 10 inspectors for the entire province. With the province having atotal of over 120,000 firms, each inspector would have te inspect over1,200 firms per month in order to have a full inspection coverage.
3.26 Neuquen has been contemplating the use of independent auditorsto verify and enforce the collection of taxes. Under the proposedsystem, the provincial tax administration authority would. certify acadastre of eligible auditors. It would, then, distribute the casesamong them. Auditors woul,d be paid when the tax is collected. Althoughthere always has been resistance to linking inspections with theirresults in this manner, otlher provinces have also privatized thecollection of delinquent taxes (e.g., Santa Fe for the real estate tax).
3.27 In the province of Buenos Aires, an agreement with themunicipalities was made by which they collect the tax, keep 40 percent,and transfer the rest to tlhe province. This has resulted. in asubstantial revenue increase for both the province and themunicipalities. This successful innovation has led to fu.rtherinitiatives. For example, the Province of Buenos Aires has reached anagreement with the federal tax administration agency by which inspectorsfrom both federal and provincial governments will inspect businessesaccording to a common plan.
3.28 Initiatives of this kind point to the larger pc,tentialincreases in local revenue.s that may result from inter-governmentalcollaboration in tax administration. Recently, steps have been taken toestablish a federal council on tax administration. This council is tomeet regularly and serve als a coordinating mechanism on inspection andother control procedures on tax matters.
3.29 Real Estate Tax. The billing of the real estate tax is muchbelow potential in most provinces because the cadastres used are

- 47 -
incomplete and the assessments much below market values.L3/ In addition,collection of delinquent taxes is very inefficient in some provinces.Improving the provincial cadastres would boost receipts not only fromthe real estate tax, but also from the transfer tax on real estate(sellos), because the fiscal value from the cadastres is normally usedin calculating the transfer tax, and both buyer and seller currentlyhave an interest in declaring a low market value in the transaction.
3.30 In Buenos Aires, *the provincial real estate cadastre wasdeveloped over the 1937-55 period with the last general adjustment ofthe values in 1955, and even then, this was done based on the valuedeclared by the property owner, rather than by independent assessment.During the last three decades, these values have been adjusted usingfactors for inflation, but not reassessment of property values. Thus,many new buildings and improvements to old ones are not in the cadastreat all, and assessed values are totally out of date.
3.31 Some provinces use more elaborate methods of updatingassessments, such as applying indices to attributes that determine thesite value. The problem is that the listing of attributes is often outof date. For example, Santa Fe uses this method, working with 1948 basevalues and attributes. La Pampa established an elaborate method basedon the characteristics of each piece of land to approximate thepotential average productivity value of the land, and then períodicallyupdates the indices and characteristics. However, the application ofthis method has led to a substantial undervaluation of each parcel.
3.32 Provincial officials in Buenos Aires estimate that justbringing the cadastre up-to-date without reassessment of property valueswould increase the total amount billed by about 30 percent. The Provinceis currently up-dating the cadastre, starting with areas of highestvalues and high growth where the returns of such efforts are the highest(e.g., beach communities). The lack of proper mailing addresses in thecadastre means that about 10 percent of the total tax calculated is noteven mailed out. In other words, just by finding the proper addresseswould increase the total amount of real estate tax billed by about US$24million. An increase of 30 percent due to up-dating the cadastrewithout reassessment of values would mean a total increase in taxbillings of about US$70 million.
~L3 The Bank has supported research and technical assistance for up-dating the cadastres for the tax on rural land. In several of theprovinces, it was suggested that this work be extended to urban land.See: Analisis de los ImDuestos Provinciales aue Afectan al SectorAgroRecuario, Estudio para la Implementacion de la Reforma ImpostivaAgropecuaria, ARG/85/019, Secretaria de Agricultura, Ganaderia yPesca, Buenos Aires, 1988.

- 48 -
3.33 Due to very lax. collection procedures, only about 75 percentof the total amount billed waLs collected in 1987. If both the amountbilled were increased by 30 percent and the amount collected increasedto 90 percent of the amount biilled, the total increase iin real estatetaxes collected in the ProvirLce of Buenos Aires alone would be overUS$63 million per year.
3.34 The total cost of up-dating the cadastre depends, of course,on the sophistication of the cadastre. Developing a simple fiscalcadastre with name, address, most relevant characteristiics and fiscalvalues would undoubtedly cost: only a small fraction of the totalpotential tax increment for one year. There is a tendency to proposemuch more sophisticated cadas,tres, some of which approach a fullGeographic Information System. Although useful for many planning andadministrative functions, such systems are obviously much moreexpensive. The most cost effective methods should be used.
3.35 When asked why they didn't implement such reforms with suchhigh net returns, provincial officials responded that such anundertaking was too costly arnd too long-term, and that they were toobusy "fighting fires" to implement these reforms. However, lack ofpolitical will to collect the taxes undoubtedly has been a factor. Thishas resulted from the general lack of incentives and, thus, motivationto implement these reforms during the years when "easy rnoney" wasavailable via discretiona.ry grants from the central government.
3.36 For example, the Province of Santiago del Estero could benefitgreatly from improvements in its real estate cadastre. Only 120,000 ofthe total of 250,000 parcels in urban areas are registered in thecadastre of this Province, arLd among those registered there are problemssuch as duplication. Only 18,000 of these parcels have full, up-to-date information. There are, however, plans to up-date 60,000 parcelsduring 1989, but these plans are being delayed due to lack of resourcesand computers. The team in charge estimates that a fulL, up-to-datecadastre would increase the tax yield by approximately US$400,000 or by50 percent over 1988 revenues. The cost of this would be less than theannual increase in tax collection.
3.37 In summary, most provinces have out-of-date and incompletereal estate cadastres, and their improvement would produce very highfinancial returns. By fa.r the province with the greatest potentialrevenue improvement is Buenos: Aires, where the cadastre was last up-dated nearly three decades ago. However, not all provinces needimproved cadastres. In Salta, for example, the cadastre is veryefficiently administered and up-to-date, but the tax rale is low. Inthis case, the technical instruments for improved revenue performanceare in place, but the political will has not been forthcoming to do so.
3.38 Another widespread problem of administration of the realestate tax is the implementation of progressive property tax rateschemes in which total tax rate rises with total fiscal value. Owners

- 49 -
of larger and/or more valuable properties respond by sub-dividing theirproperties into smaller units, thereby avoiding the higher tax rate andincreasing collection costs.
3.39 Tax collection is generally made through the banking system,but controls regarding billing, payments and transfers of funds from thebanks to the Treasury leave much to be desired. In the Province ofBuenos Aires, for example, the tax authorities receive the statement ofthe payments from the provincial bank after a delay of six months,meaning that they are providing this bank with an interest free loan ina highly inflationary economy.
3.40 In general, the ratio of tax payments to tax billing rangesfrom 0.50 to 0.65. Most provinces do not have an individual account foreach taxpayer. Others, like Neuquen, have a separate account for eachtaxpayer but individual accounts are not reconciled with total billing,payments, and credits. In other words, they do not function as a part ofaccounts receivable. In this relationship there is a complete asymmetrybetween the expenditure and income accounts. While the former aresubject to a number of controls, the latter are handled cursorily.
3.41 Vehicle Tax. In spite of its apparent simplicity,administration of this tax is also deficient; valuations are a source ofinequity, and evasion is quite high.
3.42 Valuations are made on the bases of weight and model. Thesefrequently result in fiscal inequities because they are divorced fromactual market values. In recognizing this, several provinces areplanning to change the system to an estimated market value of eachvehicle.
3.43 In general, only 65 percent of the tax due in one year is paidwithin the same fiscal year. Approximately, another 15 percent is paidduring the following year. All motor vehicles must be registered in afederal registry, and the regional representatives of the federalregistry have agreed with some provinces to: (a) inform them about eachtransaction; and (b) not register a transfer if the owner does not showevidence of having paid the provincial vehicle tax. In spite of this,some owners prefer not to record a transaction to avoid paying the tax,even maintaining the vehicle in another person's name. From time totime, provincial police set up road checkpoints to enforce compliancewith the tax. However, public resistance to the resulting trafficdelays and a general lack of a legal follow-through have led to areduced use of this method.
3.44 As with other taxes, only a portion of the provinces have asystem of individual accounts that would permit following the complianceof each vehicle. Even with these systems, however, checks are rarelyrun..

- 50 -
3.45 Transfer Tax. As mentioned above, the evasion of the transfertax could be reduced considerabcly by improving the real estate cadastreas well as other checks on trarnsactions that might be linlced withcontrol of the turnover tax.
Non-tax Revenues
3.46 There is clearly a need for greater emphasis on cost recoveryfor public services through useEr fees and tariffs. This holdsespecially for the water comparties which often recover onLy a smallportion of their total cost through fees, requiring constant transfersfrom the provincial governnLents.L' Their billing and collectionprocedures are often monumentally inefficient, and, even when billed,users often do not pay because they perceive the fees to be unfair, asthey are not based on actua.l consumption. Because water .is not metered,users cannot control their total bill by reducing consumpl:ion when thetariffs are raised. As it is considered "unethical" to cut off water,generally there is no penalty for nonpayment even in the rare cases whenthe company tries to collect. The Province of Salta sidestepped thisproblem (and also reduced the cost of billing) by combining electric andwater bills and cutting off only electricity in case of nonpayment.
3.47 Betterment levies, are practically never used by provinces,even though several provinces have fairly detailed laws regarding theapplication of these levies on land affected by road, irrigation orflood control projects. Th,ese laws are rarely enforced, however.
3.48 There is, then, clearly a very wide margin for improvement ofrevenues just by basic improvements in the administration of existingtax legislation. In addition, substantial changes in the legalframework of provincial taxes could result in considerable improvementsin fiscal efficiency and equity.
D. Recommendations for Increasing Provincial Revenues
3.49 Measures to incretase the efficiency and equity of collectionof tax and non-tax revenues are urgent. Reform of the tax legislationto make it simpler and more equitable is also urgently needed. However,this reform should be implemented, to the extent possible,simultaneously with improvements in tax administration, as to dootherwise would amplify the already great inequities of taxadministration.
3.50 Improving tax administration should include general measuresto increase the efficiency in the collection of tax and non-tax
Ei/ An examination of the process is contained in World l3ank, Argentina:.Water Supply and Basic Sanitation Sector Proiect. Staff AppraisalReport, October 19, 1988.

- 51 -
revenues, such as improved accounting controls and information, computersystems and software, etc. Ways of improving human resources shouldalso be addressed, such as via training programs, recruitment from otherprovincial government departments, training programs, etc. In somecases, it may be more efficient to contract services from the privatesector, such as in the case of collection of delinquent accounts or forbilling. Transfer of tax administration to a different level ofgovernment is another alternative that should be analyzed. In additionto these more general measures, the provinces should propose morespecific measures for increasing each type of tax and non-tax revenue.
Reform the Tax Svstem
3.51 It might well be better to substitute the turnover tax at theprovincial and local levels with the Value Added Tax, leaving collectionto that level where it could be collected most efficiently, and thenshared with the other governmental levels by fixed formulas. However,any such transition must be very carefully managed so that provincialrevenues do not suffer the abrupt drops that aborted previous efforts toaccomplish this change. This is one of the possibilities currentlybeing discussed.1 For example, the Central Government could collect thetax itself, or contract with either provinces or municipalities tocollect the tax, depending on which is more efficient. As noted inpara. 3.27, the Province of Buenos Aires has had great success withdecentralization to municipalities of the turnover tax collection.Empirical studies of the tax performance of the different levels ofgovernment should be done as a part on the effort, including theanalysis of the buoyancy and the impact of inflation on tax collection.Alternatives for increasing the progressiveness of the provincial taxstructure should also be analyzed, such as heavier reliance on thetransfer, automobile and real estate taxes.
Improve the Efficiencv of Tax Collection
3.52 The case studies show that improved billing and collectionprocedures (e.g., better cadastres, information systems and managementtechniques) could substantially increase provincial tax revenues withoutraising nominal rates. Tax administration needs more personnel inauditing activities and an upgrade in their computational equipment.Individual accounts should function as in any private business, as inthe case of accounts receivable. Improved fiscal performance wouldrequire not only better billing and more aggressive collection, but alsoimprovements in the quality of services that should help increase thewillingness to pay taxes and fees. In addition to these generalimprovements in tax administration, there should be specific reformsaimed at each major tax.
j55. This and other alternatives are discussed in the Bank's study:Argentina: Tax Policy for Stabilization and Recovery, oR.cit.

- 52 -
3.53 Turnover Tax. Auditing should be increased either byincreasing the number of inspectors or contracting out to privateauditors. Second, at least until a tax reform eliminates the overlap inthe existing tax system, there should be coordination among theProvincial, Municipal and Central Governments in tax collection. Third,the technical level and computational capacity (both hardware andsoftware) of the tax administrations should be improved.
3.54 Coordination with other levels of government should at leastcover the exchange of information about taxpayers and tax liabilities,but could take other forms such as joint inspection, and the delegationof collection responsibil:Lty. A reform in the basic legislation mergingthe tax on value added collected by the federal government, the tax ongross income collected by provinces, and taxes and fees collected bymunicipalities could result in a significant reduction in administrativeand compliance costs.
3.55 Real Estate Tax. Measures for increasing the returns from thereal estate tax might incLude:
(a) Improvements in the coverage and up-dating of the cadastre;
(b) Analysis of the exexmptions (e.g., buildings ín rural areas)with recommendations for possible procedural or legislativechanges to reduce tihe exemptions;
(c) Improve estimatess of assessed values, including the use ofmore appropriate methods for estimating market value.
(d) More efficient billing and collection procedures, includingthe indicators to be used in analyzing this efficiency;
(e) Institutional chang,es to keep the cadastre and values up-dated, such as :reforms in the way property sales andimprovements are re,gistered, decentralization of taxcollection in municipalities and contracting out for part ofthe service suclh as information processing;
(f) Unification of ithe provincial and municipal cadastres and alsoperhaps those oE thes water and energy companies; and
(g) Privatization of billing for delinquent accounts and perhapsof some other aspects of billing and collection. For example,in Santa Fe delinquent accounts are distributed to private lawfirms for collection with the delinquent taxpayer paying boththe back tax and the collection fee of the law firm.

- 53 -
3.56 It is important that the cost effectiveness of each of thesemeasured should be analyzed.19 For example, it may not be cost effectiveto revise the cadastre for lower income areas. Efforts should beconcentrated in those areas where returns are the highest, such asrapidly growing areas for higher income families and expandíngcommercial and industrial areas. The same goes for methodologies. Avery simple and inexpensive fiscal cadastre may produce revenue returnsthat are similar to a very expensive and sophisticated informationsystem.
Strive for Greater Equity
3.57 Measures to increase the efficiency of tax collection areurgently needed and should seek to increase equity by eliminating taxevasion and free riding. In the longer run, alternatives for increasingthe progressiveness of provincial taxes should be studied, such asgreater reliance on the transfer and real estate taxes. However, the"progressive" tax rate structure of the real estate tax should bedropped, as it induces larger property owners to divide up theirparcels, thereby defeating its purpose and greatly increasing billingcoSts.
Increase Cost Recoverv by Raising User Charges
3.58 The cost of providing local services should be recovered fromcharges on the beneficiaries as far as possible. Such charges should berelated to individual consumption or, where this'is not possible, to ameasure of individual benefit received. This is clearly not the case inmost of Argentina's provinces, where public utilities often represent animportant drain on provincial public finance. Financial reform of allof these provincial public utilities should receive highest priority,especially in the improvement of cost recovery through progressivetariff structures, charging higher block rates to those units thatconsume more.
3.59 These reforms in the tax system and improvements in revenueadministration could generate very high financial returns for theprovinces, thereby greatly increasing their financial autonomy.
56/ For a case study of the effectiveness of similar efforts in Brazil,see: William Dillinger, Urban Property Taxation: Lessons fromBrazil, Report INU 37, The World Bank, Washington, D.C., April 1989.

- 54 -
E. Simulati.on of Total Impact of Improved Tax Collection
3.60 Table 3.5 shows rough estimates for the total impact ofimproved billing and collections procedures for five of the sixprovinces surveyed.L7' The! assumptions are that:
Real Estate Tax:Cadastres: 50 percent of full potential improvementBilling: 90 percentEvasion: zero
Vehicle Tax:Billing: 90 percent of the total potentialEvasion: zero
Turnover:Evasion: reduced to 15 percent (Currently ranges from 40 to50 percent)
Transfer (Sellos):Evasion: zeroExcludes impact of improved real estate cadaslre.
3.61 The impact of these- improvements would be substantial,resulting in a total increase in tax revenue for the five provincessurveyed of US$461 million (38 percent). This is just by improved taxadministration, without any nominal increases in tax rates or changesin the legislation. While the biggest relative gains are for the realestate tax for all five provinces, the absolute gains are greater forthe turnover tax, except in Santa Fe where the property tax would offerhigher gains.
j7/ The Province of Chubut was not included in these estimates becausethe data necessary for estimates in this province were incomplete.

- 55 -
.. . .. .--- . ..:,:.:�:,.:.:::.-:::-:::.,.,....,..�., ..' .' - .. .. .. . .. ---........,- . ...1.1.1 1 1... ........ .. ....................... ..:.. .,..... ... --- ................................... ::.:.:.:.:.:.:.:.:.:..:::.::::::.:.:,.:.:::.::.:.: �.............................''. -- -,-:::::::::::::.::::". ..:, .........�..........,.:::: ........................ .. .. ................:.:.:.:.:.: ....,...........l....l..........l..l.. ... :-:.:.:.:::-: ........... :...l.... - -:;:::::.:;-::_:--- ---------.i!�i�iii�!�iii�i�i�ii��i�iii�iiiiiii�iii�i�iii�i�i��li�ililiil�"""::, ` ̀...... ................... ........ .. ,:.:.:.:.:.:.:...::::.:.::::::::::i�::!�l�l�:::i::��li�i�il��i� . .. .. .. ............ p, �-!: ,..:..:..:.:.:.:: . ....... --------- ........ 1...l......,.,.�l.. ...... .............. .. ... .. .... .. .. .--------- --- ....... .. . .... .......... ,�"..,.�.�.".�,I.l..---.....l....., ...�.,.....,..........."....,.......................l......1l...,...... . .... .. .: -, .. . ....-......,-.. ...........1.................. ---S.------- ...... .. .. .. ... ..... . ---........- .......�........ .. :.......�.�...:. ...: .�::�::.:..::...::..::. --- ...:......... ..... , ,-:-,-,. . ....1.", U -LUE�.... :-S: NG, 0,�..... --- .-.:- .. EDIATL-:0T 1....,....�,.,.....l....l.�.,�... ..... T.M. ::, ,. Zr.�'$.:".,.P�,.QP,:::.:.«..Msh 11. UN ... S.O. Ro . VM.Bs.,.-.... .11 ... 1.11...�.l....l....................�.:., . .... --- ...�....�...... .. .. ..... 1. 1 ---. ........... ..--.. .1 ...
.. ....
:.. ---
--- ......
------ ...
.......
.. .......---
�.--..�.-,.--..-,.,...,...........�-1.-I
.. ....�.....�........
�.....l..........,...:..,::.::.::..::.,.:
... :,.,:.,...,
...... 1---------------
...1..........
.'�
-:- ---
, "'
---
.-.. ,:.....:.. ... 1.�.....l.......�...........�.......................�...........l..... .............. ,... �.�.��....,..�,.�..,.....,..... .. ...... .....�.....,.�.�....l. ... ::::::::::::::::::::::.........,.,.............,...... ....1 .1..... --- ..... .......... �.., .......... �... .... ..... . .. .. .. .... ............, ..., .-.-.-.-.-.-.,-.-..-..-,-.�-.-..-..-.-.....l..l..l..,...,....I. ....l.......�....:.: .... .. 1.. ------ -..,-.-..--..,:::.,..::.::::::::::::.::::.::::.::. -. �........�....... -1... .................. . ."'' . .... ".-..-..-�1--�-.-.-..-,-,-.�-..-�...-,-.-.-.-.,.-,.--..-.-.-.............,::.:..l............... .:..:::--::::..:::..,-,..-,..� ... ,.- ............. 11 :::,:::"".....�l..,..,..--..-.-.-..-.-.."....�.....,....l..�- -- -- --- ---- -- ------------ :: :------ .... .................. ....--- ---1.. .- ---. �. . .... ...... ....... -::::::::::::::::::::::::::::... ::::::::::: --- ---------,-.-.-,..--."-.-..-,-.�:.:.:.:.:.:.:.:.:.:..::�- ::-::.:.:.:..,::..: ... .......... .. .--- .l-.::::: .á:.:.... . ---.:::::: ... 1 1... ---------1. ......_. ... .......... .. . .. . ...... :.:.:.: ....._ 1. ... 1... 1 --- ....... .....1. .... .... ,.. ..... ::.:::,.::.,:..:.....,...''.� .............. ......--- ........ �.. ---------.. I.: .,...... .... ... ... �..l................................�..�....................�..................... .:.,.....:.,...".....�...... ....... ,�.��.l...,..........,.....�...........................�..,............. .. ........... 1.......l...., ---1..... -1::: . .,.-. -... . .---h ...... t- :::$�0~:!:��::$� 1..... ............. ....L-- tí1. ...:- ,' 0-Y-.Oi'.:-.::: 0-Uln,: .. - ... --.. .. ....to,.I>.,$.,:::� "O''::::no.riÉla,$,<,..,:,:,:,:..0.l......, 1.1 . , �------.--- ::. .., ...., .. .. . .. .. ..... ...... .,Im... .... , �... ,1��::�::b�,,��i 01� Co---.- - --- -- -- .... .1. . ... ........l..�h ....... --- 1. 1.....-....... � 1............ ..... .. .. ...l..., ....1.. .. .. .. --- ......---.......... ... ,:-:::::: ..... ...�. ...........-..�:.:.:.:.::-:-::.:..:.,.:.:.,.:..�:..::.........:...::..::, :.... ... --- �....�... ---- --- ..... ..... ... ..... . ...... .. .. .. .1.1 .. .. .. ....1...... �...., ..... 1.1... . . ---..l....... ..... --- ........................ ....... .. .. . . . ..... :... ------ ..... .. ...... .:., -, ::.:S,.::: ,o -:��-y .. 1. ..�...........: .X. . 1..1.... ....... 1......................�....,...�.,..�..,.....l ....¡.:.:..l:.:.: .:..: .:...a.:.:: ...:. .--- .. ,.:,:-:-:-:-::-:-;: ........... ,t , ,- --- ...... ....... ........... ' --- ,h -.éVEMU0W.,..::-,-::.:.---h. �ll�l,�::.CMD"SIZP-.,::::..those:,..p��Ei::.:Iwhlc 1...... ........ .. . --- --- --- ... �..---- ... . . ...... :.::::.:.::...:.:.:.,.:.:.::.:.:,::::... . , , .--- ...... --- --- .:.. .,�.,.......,..---.... l........... ...... l..., --- .. .. . . .. . .. ......... ... . .::--::_ . . .....::-::.:.:..... ........ .. .------..... .... :.,.. -¡:l!:`-.�.:.::.::.:.:.:- --- --- -- -- -. 1--- ..... .. 1...�....�...�,��.,.. i:i:::!:i:!:!:!:!:�. ::: 1 . . ... .... �..l."..." " :..::::.:.,.t .,.,�, � - ..........l......�.....�.... ::.., ` --- . .... --- :::..t: .:$ .:.:.:10 . --... ... ..... , .: :::::�-,::.- . .4��,..:::...:. ....t -en.--:il�l�.. !"- �..:.�.,;!! lo..Mo.:: pák"------` . .. :.i.:.:W:--, --- lí&t1tw.,. : .i. , .:� ,1 .:.-ta., .u.---re 0, 1.... .. 1- ---. -1 ... .... ..j;p .. .. .. ....1---- .i��:�&�:.�v, ------ ........�.... �. .1..1 .. ................l.....l..l.....l..... . .... ... 1. 1... .. �,.,.:.!:!��l . . ...........l..�..l....�l...�...,...�...�.l..l.--- ..r, .....��..�.f.... .!!9`::: oto.... 1: W....:.., .........d..í. £-:.:.:,:.:.:.:.: -, -::::�::::::�::...,..,...........,...�....', .... ------ ,::::,::...:..:::.: ..�....�..�..".�...��.... --- .... �.. 1. 1.1.-- ....._ - ... 1. ...--- .... --- ..... ..... . ... . ..,e or .,si:�:�:: y:�:�::. -,--.... nc. t i:....�.:..:.:::� .... ---........--- l':' : ------t`--- "' %.... ................. --- --- ��::,�.�:.:: .:---.:`ó lul..... ...l..................._...... 1..... ... ... . .1. �er pr---... ,rovi t. ..�.....� .. ... ........�.... .. ...., --- ..... --------- 1....1.. ., ,-
1.1... ... I.---.... ...,......... � �. 1............ .. �. �,..�..�,...�.......,:: ,::------ 1--- ......�.�"..,..1�,. ........ -,-::;:-:-:-:.:.:...:,
:::., ,.tl:�:.�.:.:
... :.......�.....�...,..,.,.
1... ..... .. .... w,"...:1..... .. -.... ....., . 11 ......- ... ... ........-::- -,:,-:-,:,:: .. ,---::::::- --- --- . ....... :::::::::::::::::,:.:_.- .. .... --- -- -. .......... . .., 1-..:-... . . ... ,_.. ..::...::...::.:.::.:.::.:.:.:.:.:.:.,:.,..,., ...... .... :,:.:::j;::::::,:::..' �:,...._...............,........-.-.-.-.-.-..-.-..-...�........�.,...................,...,...............:..:.:,:,:,.:.:::,::::,:::.............�.��....��.,..�.....l..,..� ......1..... ........... .. ... .. ... ::!:!,!:!:�,..,!;:..!�:!:::::�::..:::.:.,. 1...1......�... �..... ...............-.....- .::.:::::.:::..:.::.:.:.:::�:::.:......- ..:.,.�.:....:.�:: ....l............�..�.... ":::�!:::�:!:��li�::�:.............., ... �.....-..-.-.....-.-,..,-.-.,-.. .....---.--.......... ......._... 11"-.-.--.-.�...�-� ........... ...�..... �.........,............... ...... .11 ..... , --- "..,.,..".,..,.,.,.,.,...,.---... _:::,.,. .... ..:., . .. ,.... . ........... --- ............................
........ ....1. ..... . ...... . ...........
. .�..
.. 1.... ..............................�.............. ......... ..- '' ,--------------- ......... .--- . 1.. . ..... -- ....--------- . ... .... .... �...�........�....�,..,...� ........ .....�......1................1.. ..._ . �. .................. ... 1...... .. 1........... . ---....l..., ,.......................... ...l..,..,.,....�.�...............� ......�........ . .....""""' ... �.......�.... ........ ... . ... ... ,........... .. .. . ..�.�:�:.,:.:... ..---. ;¡ .. �....t...,..,.....,...... .. 1::.---......,,e:.:: a-:tá,X. Éittát'ióü:,:, ��p~.r..é:.:Cib,gt:" ---.: -iz, --- , n, ,:: ec,en1.... llí- n...,------ ..:: d:.d"""""""""Ü,�'.tá:.�121 ,Dffl..::: e ffá` 61, --- .: iv, é: ... ...---------- ------------------ ....... ,--- 1....1.... ------.. ...... .....�.........�.. ........ ---.....................- .... 1.., ...... .. ---....... .. .... .... .. , '"'.:.l'..'...,: - .. ....... .. �..:..:.,::.,:.. ... --------- �.... ,�t.ia:..l..�-.t:-:-$a-,,..,........ ... --- .... �.. � �..... ---. . . ---.. :,::: .... .... .1...... 0.'t.,4.:.: .1C ,:e , ... .... . .. . ... ,r .... ,,-...- ..-.... --- 1...�--- 1..,1... ... .,.......:.Y ......
'M,`:-- ---. t
..........---.. a.. .. ... .:..........................l....l.. ------......... .I::11:�l.i.O:.:�i.::n.. .. tt.co oe : "".. 1.p... d'li"''''""""""11---q ::: ....,-.. c,.:t::::r.,0�a�::::"$a: �0::.:�:,ax,e,$::,4. 0::.�.. .. ............ 1 11
---------------
...........�.. .......
..1........
1... � ..
.1. ....- .....1.............
--------- ......�........ .. .......�...... ..... ........ .... .. .. 1 1 �....... � 1... �..
........ 1........ .. .... ... ......1.............................í......1..... .... . ...... ... 1".....�..............�........,....�... or---. .,:�:::,::",�,:i:,:::,...... .. . :..:: -t,.::::: ,é:::.U... b` """"""""""" --- :,I,:":,::,:,:,:,::"":""::,:,:,:..,,.:::,:,w:,:'�i",h,:.:,:''t . ...... 1,1 ... 1nú:::.,t ` """""" , ̀ ,- -- �-2,-.pg.�:��:l�.:..:�::::: -. nv: ...1 ... .... bol :, t.11.17.111.P.I....... .... ... .. .. ... .. .... ..... 1. ---.... .., -1. ...... --::.-p,n��:IPW.. --- ---------.1 ".. ..... ..... .... . .1 . .. ll~".--------- ... --- ...... ..... . . .... . . .......�........ 1... ..... . .... --- ---�. .. .......1... ... .. 1. ......... ---------1..... ....,_ ............. ... ... 1 . ,:: ._ ... ..::::..:.. .. ---.. .... :..:::,!.�::::",..,, ..�..l..l....,..........."..,.,...........1.1..,.,.. :.. . .......1 ... -::7: -1 .......�...�..... .. .. ... .. ---------1.1. ..,.1.1 ,O.----.... .......�-, -t5::,Z:OT _.'::`, :'O-.' :r.o�,V� -.noe:, � �......: ,::.: -00,0 ......... , .. .1.. 1.-.:-,......1
,'.,.... -:-,,T , ""' ` "" `'"' ,., 'O'.f".,..''. --- h1,1--- '01, ` b é- é` n,::': .r d d t ,..... 'W�i:� .0. ..1 O., al 001..� --- ::.:,:::::::::_hp................l.......l.................... . 1. . .. ....... --------------- :...�-.... .:..:........�..��.::. --- .. .1.... --------- .....�....... 1.1..... .. ............. 1... 1. .. .:..:..:�..::�::� ...�.........."....:.:.,.:. a---------,:. .... ....�... 1. . . . ........ . ........... . . ......1..... .... ...:.�::�,::.:::::,í: ::.::,.¿.,. . 1 -�.. .. .. .. 1-1 ...... ........ ..... , ....... �.,!..,..".,......."........f".,b.....". . ... .:. .:. : .. :.,;,: --::::::,---- --- --- y . .::::::::::::::::�:!:::.�:::� j::....., ..e:: Tea--:::: g 5--- a. e':: aTl ::: -.1, ,:::o :-.--d .. .. ........ :---. ,... ... --- '"......
én ra: ze
..admí'n',íát.ratlóti::
� o, t ,:.::.hitt.
..
1.., 1."....,..�..,�.�..��l..:1
, ,. . . ..... �.. ... .� �. �........: -.: ...má:.
_:A .. . 1: .. ::
........ 1------------ - .- ... ��..�..�.....�..�..........�...�1.1...l.., --------- 1 1. ------.............- �. 1..... ------------ .",:.:............�.....�-..� ... .................. .. .. 1....:-::::- ......., ...... ......�.......�..............�.�..��....,...,..,.�.........,.,�....1.1.1.. . .... _ ....,�...��.,�.'' .. . .... �....... . . .... � ,.,�.... � -1:.t.. --- .1 1 1 ...t. ... �. 1 ----.
.. �.. �.... --- ------
.. "- .1 --- .. . .t. .�s......�.�..:...-1.1:� .:�..M.. �.:::: � .... ::::�.��..1 1---e.1:::,...1.-XO 0: ::::..j.q `....:...-:.:. 5.,�.......l. .. .----.. lo-v.. a. ... -,-:E¡l" "" --- "',::::::::- .. �.... �....1.- ...11t.,:ti~""""",""tt ,1 tí..: :::: aré:,.-.-.-.-......... ".....l.�.."...�....... I.c . .: ... �.:: ... un c pi. �.... ................. ..P, pa: . ...... 1, l. � �.. �....... ., . ---. - -. :......:..:.. .... ---......- �. �....�:- .... . . ..... .... .. . 1. 1.... --- ..... ,_:-. ... ::�:!:,:::�::::::�::::,:Ii:í.i.:.::.:�:� .1 ... 1 1 ".....,......"........l.�. ,,-- ..:....:.:..... 1. --- . p:I .. .. '1 . .1 .. .. .... .. .1 ...- .. ... --- ---.--- --- ... .... �....�.,.,.�.,.�.....1... ---- �:. ... .... ...... �.---y g ing..-.:,,,',.. 1..... .1 . . .. .. .. ...... 1. "''... ::, 'é 'ták.ias:: ..l,... `- .:' 40*--- f- ` "h ̀ ' ' ̀ ' ' ' ' "' -i: co: : ipc � ,e «. tetóm ...nuisi�:�:.:.:: : k,h . . . ........ ..... gy:::: .,me lp ....1 .....ó :t .. ,1. - -- -- --- �. � �. �.. �. �.... 1.. . 1. .-. ------ -.. 1-. 1. .. . ... ..... .1..l..l..l.....''....l..�....� .. .... --- ........ .. .. .1 ...... ............ -.-.�-�..-� .............. .. ... .... .. 1 1 �. ..... -:::á:.1.....l.. - -- 1 .... � .. ------ ..... --------- ......�. . ....... f, . .. --- ...- ....1.......... ....... _ -.. , ---------.. .. .... .... .., . . ........ ......, ..............�...�..... � �............. .... . . ..... ... . ..... ..- 1 1. .......... .. .. .... 1.... �......... .... _: ...---- .. ---. �.... ---,--- --- ::�tiax.�.�:�l.---------. .. ... .., --'!��� ""ú V'I�:.".-'-.'::;111::!i:.1. --- """"""""..""'..b"""""", , "' creasad duo.. t'o''".h::.,i�i , th --- ,..�...,I.'"', ` "'"""'''' . ...... .. -:C . ffí��i�o.' , , , "" `í'-"" ...... --- ---..: .tlce,$."�.:�.:..:. '.O'V.O.,::.", 11 . , L` h` -:,::.1 1. 1. 1- .. .-,-.-.-.-....�.".��.�...............�.......... .:.. 9... 1 1.... ...... :, - .... . ..... �: ---------: .: �: --::::::-: - -. .. --- ....l.. -_....... �......,.......,., , ------------11.... 1.., .. ...... .......�......... �.. --- .. 1. . ..... �.................l.......l. 1...... ---., --- --- --- --- , ---
--- �.............. ... ---.
... --------- �.... ...... ------ ........�...... �...... 1. 1.. 1. ... , , , , , , , ---. ---...... --- --- , --- �........ ............ ...... . .... ...................�...�..... .. .. ..... . .. :.:::,:�::,::::::::.::,-,-.....-...-.-.-.-..-.-..-,.....,.....,.....l...1.1.... ......-- ...1..... .. ... .,........ ....... 1--- ........... --- ................ ... .------ ... ..... . .. ------1 .. .. . .. ......... . ........ ........ ...... .... ... .--------- 1. 1--- . --------- .......�.... --- ... . .. .....1........... .. .. .. ....1... 1..1.1 ...�........ ... 1.. .... 1......
.... ....�........ .... ....... .. . .. ......_ . .. ...�..............�........
... ... .....
.. ........... .... .. ..... -..-,.,...,�......,..,.,:.,:..::. .. .. 1 1... 1..... .. 1 ..�........�....,�.,..��...�..�..�l..�.�...�... �... ....., ... ..�.l.....�......,. ...l........ : . .: : :::,::::.::::..' .,:::,:::-.,.::: .,.::::...,....,.,.,.,...-�.., ....,.,......, 1. .1.:- �...-,...-..-�-..-..-..-.-.-.-.-. -.-.-.-,.-...�... .... ------------ ....�...�..... .. . ... .. . .... , . ..:.:..--..-,-.-�--.-.-.-.-.-.---.--..--,.�:...�-..."..-. ------------ ........ __--- .. ..... ........�........�..... ---... �.. .--- 1 --- ."....�....�......l.�� ---.....1.1 .:.: -::.: ------ - - --- :..:á- �.. 1 - -... ̀:....... .......... -..... ----... ...--------- .. ......-:.,: .., --1-�.!::!:::��::::��!:::...:::..�:".�:...!:�::::I:....l....,...� ....-- --- -- - --- -- -.. .. 1.., 1.1.. . ..... ------ .. . .... .. ------ : . .. .... --- - .1.............. .... ...1.......l.....l..l....l.....1.11...............l... --------- . 1. 1 1---.. :.,.,.....,....,..,.,.,.,.....��.,....�.....�...� .... : ,-.. .. ---------------.--- ......... ...... .... �......,....,.,..l...,. 1 1---. .. ,........,�.�....�.,�....".....�..�..��....�.::,:.::::,., --- ....... . ....._..... --- . .. .. . ......1.......�..... ------ ..... - - - ---.. 1 .. --- --- - ------ .... .. �....,.1 -- .......�.......�... ..... ...... _ ........ .. ..... ,::.::,::.., � , --- - ---..., --- .�.....�..............,..l...... ...... --- �...1..... ...�...,�.�..�.,..�.�,.�,.....,............,......."....................,.....,....�,......."...�.....................l.....: - .. : : : ::::- - -...... �...,....�,...........�..��...........�......... �. ........�....l....l. .�.-.-,..-,-...�.....�...�..�.....�...�.�,.,..�,. ..- - �. .. .. . .......... ........... .. .. .. .. .. . ... .. .. .... �.. . ......�........... .. . . . .. ..... .. .. ..... .. �.........................
�................
- -----
------
..........
.. .---...
1... --- ....
1...1........�............
... ...
....... ...
.. . .....
--- ........�....
... ...........................1............ ... . .. ... ... .. .... 1..... ... .. ..., ...1.. .. .. .. .........1.. . . . ....... 11.1...... ..... --- ....... � .--- ........ ........1...1.............. .- ,. .... --- ............ .. . ........ .. '..... .... ..... ---......... 1 ..... _ ��........:.,�... ... ............. ...--- ---la -.:::: ., ------- . .. ....... .. .. .. .. . ... 1. .... .. .1. 1.er>r.''d .... 1.... 1........ .1--- líe..,"' tat.---.orier: Ma ---. 1--- ,.:: , Íi.. "---:---... ,ádiat ', --- 'é i�ll�l��,�.. .. �:!Ii...-"É¿-' �!l�i;�.i.....ii..�r -"¡- ' ' --- é::: an :...1ñá-�eIx 5t In&- ........ : �.l...l............. ........... 111.11 .... 1.... .11 1 ... ............ l.. -����.�.�l...��.�,..l.�,.��...l.......,..�..,...".,....l.......l..1.1. ....... l.........- . ....... �. ------ ......... ......, :-----,.....................�..�,�,.,�.�.,�..,..l..... .. � .. ... ..... --- �.. 1..... 1...... ---... ........ ....... , ... 1.... --- ...., ,.1. ... 1 ... ... .... :�:::�::::!:�.::..:.:..:::.:,::,:.., -'- -� - -:::.::::::::-::: ".,.",.,.,,...,....,...........". 1 .... 1..:: :::,�.,:tmiá�'t"t' 1,--- "' "' , , , ''.."....."::�:!.::,:.::::::::::,!:::,!�::,:,::�:11 , ` 1 '11 '11 '11 -`. "..""."".,."",."""""""...�'..'....'.:,...'. :1 1 1 , .., -.- ------------------. --- """ ---..:-:::,.-.- -.'.- ̀. -- .... ... - -- -. . ------1 . ........ . ........ ..... .... .. ......... �................ . --- . .- .... 1. 1 1. .1 1. .� .......-:....... .........-------- .................. �-:.::::.:�.:.::::,�:::,:.::,.::!::::,:::,:..:::::1 . . - .......,..,.,...,....��..�.....,.... ..... --- ... . ------ ---....... 1.1 .... ...1. ... 1.... .. .... ---... --- 1. .1. �.. 1. ... ....... :1 ............... 1:�lli ... .1 .. .: .. :�:::.�.�..�.�...�..,�..
;: 5,:::-:,......_ .. 1.... 1... 1.. 1... .... .. .... 1......, ... ---............- .... �.. .. 1. .... � .. -- -,-. 1-1 ........... :--- �:.,... á- '�:
........ ------
. ------
... ..
.... .-
:--
...... -,-.--.�,.-.-.�
..................
�......
....
. ....... -
.�.,�.�.......�....-.
1-1...-..,.�.....
... .
..
.--- 1......:...: .... ....... -:-. .....,...,..,....,.. .. 1.. ------ "...l.�.l..,.,�...."... 1... .. ---.. ------ 1 1.........��.".,.....�ili�!�i��:1 ���� �::� �.�ii ......... , ........,."..,......l........ . 1.1 .........�........�l..l..l..... --- ..... .. . --- ...., :::::,::.::: .: :. : ,......,.. ..: . 1.... 1 1 . 1 .. ... � : � �:;:::::,:::::.::.::::::.:::::::.,..�.�..,......-... 1 ---......, 1.... ..:----. .. ...1 .... .... ------ .. -. ---...:::. , 1: l�::::: �:�'.i: i':�: �� ...:1... 1.... :.:.---.....- ........ �..... ..-. .-- .1. .11 ...-.... 1.. 1. ...
--- �... --- .........
�.. . ..... �...::il����l��ii:!::�1:11�l�
........ .,:,::
:.,:
.... ::.::::.:::. ........ -..... . .. .::!��i����� --------- . ...: .-.-.-.-.,.-�-..-.-.--..-.-.�."...."............,......".,------ . .. 1. . .... .. ...... .......... ------ .... ..... .. .:', .... . ....U4 ... ... _:..y, ...1.........�...... 1 --�...�..11."..: ........ ::-,-:-:,:- ...........�... ..... ...... �...l... ----------::. . n. :....t...... 1.- -:,-, ,::: .. � �.. �:i::�::it. ---.....:....lt , áüa,ált jbü!:..s.. .. 1ffii11áhd"'i��1:1' tábl hlia---" ` ̀ ' "' í" ' ' --- ó-... -.... � y...
.... ...1.,:: -:: ce,ty :......., -� ..................., ---.. . ... --- ......... .. ._................ �........�:��::!.::.:.:::,:.�... . . . .. .. ......�.. ... .. . �. . .... 1. �.. �.. �..-... . .,...I.:iiiil��:L;Ilii..".,:t.,.. �---. ,:: ,:-:-:-:- .::...:.::.:.I.:w� -. ,---:�, !¡5.i:- .. ---. -,`::::::: esuj:::--- 11 ---k- - -""" `t-' ::.:::::j"::5r:,::o,t::aua::i� ié :::p,:,� . :i.: oftán: sho f d , erson:.......... . ......... ... . -1.. 1 . ... . �. --- .�.�:.:�:�.�:.. t.....�1. : :_ � .. nla:: 11.1. . . .1.. 1. .... . --- 1.11 1. --- -::----:--, , ''.."::.:::.:.::.:�::,�,.i...:..�.:..: .... �.��.��.�:t..:,..... :::::::::::::::::::::::.,!:d.:::::.:..�:.:.::::::..,...,.,.....l.. . .`. �....,.........l... --------- 1 ...... ,.,.,�....�........... . ......... 1.... ..... ........ i, ot: j: 0, ....... :.: . 1... ---t. ------ .. ,... �..�..l....l..... ........ �.1....�:�:�.. . . .. , ------------------------..............., ---. ::.: 1 .... 1.,¡�,::::�:�)�.. :" -� ._..- 0.., : .:.:.`:: a�vo.::.exc,C$;S ,O.pOV.O0:11.. .. ---------o .,...,:!:�.:,::.. ..,:,:... MC,,:!::! OpOr... 0. �.f..' :. o eO. O.rh', --- , """'"""""' In---------.
.. ., �1....1...
... ---..............
. .--- . .. .....��..�...,.,..
...,...,.: .-
_-,::
---.... ....
, .... 1.1....
---------
------ ...
1. 1 1 1 1 1 .1 1 1. ...
1 1 1 -. ,-...,
�....,�.�..��.��......,..
�.. -w. .....
. ..... ..-...
, ---------
..... :. . . 1......... .-,l, ..... �...... � .�-1. .. . ;::...�.::,::�::,:��: -:::,::::::::::::.,.:1..... 1. .... .... . .. :. �__. �.......... 1 1 ...... al...:Ilw�:.:.:.:,:. 1.- - -:";:... -------- , -rlpy�L,P!Q�i�A. .� -j:,P,. :1c ..e' .� -,, ---t , - -t--�......--- --- --- .... �..:..... :1.. ---..... .. -r -c f ,Oy .:in �........ . M.
:.. ,. ...:..1,1.,.......- ...... 1.1.. m, ,.------ --- --- h' , ,, - "" 11, 1, , "" .. .. .. ..:0 i� ��:PQ�. �$��. �: .- 5 óiúé.::: :S ta.t. :' , , , h"`------ e:i:�::..ly . .........., s Ible- 'tó--::
...
:.:.�..., 1.. 1.., --- .........._ ........�..... ...._ .�. 1. . .1 .., 1 .... ------ 1 1. ....._... ----------------1 ... 11 .. .. ....... ....11 .. .....�...... �.. 1. ---.... ...�.....�..,..�..,..� ., ... .�...... .. ... �....... ....l. 1.. ...... .1 1.. --- ..... --------- .. 1...�..t.......�:.. ...... .. ..... .... ...................-_ .. ...... 1.. ... l. �iül::,:,:!: <... .n ... 1.
.ngh.
........ 1...0 . .Y. e.. ...... 1.. d------------V.---b ...::.:. ...0-` ,Ir . ... .. �..... .......... 1. . .... :h.,£."",,£.", , ̀ ..,],,:.: .g:�::il......<,.>., 11...........- ....... --- P. ... .. .. .................. .1.. ........ �.l....�....1.1.1.1.�:.,.�..,�.�,.,�.�.......... .. . . ...., ....... 1........ .. ... --- ..... .é.- . 1...... ....... ....l. .--------------- .v.l.,�'.' ...._......... :-:-- , --1. 1... 1---------.. , , .... ::th¡!:. lféát b. :p. .. .t... :.1,itv.!:!:<),f�l, riva iz:iniz:�'.. .. ... ...... ........l.....�.�...,.,.:,:"..��.��.::�:::::::::::!:"...�:..: :_ . . , :_....... . ... .. ... .. ...... .. .... 1... ---. ------ ...... .. .. .. .1....
...t. ... 1 1 .. t. �.. ......
........ Ou$ i.i�iii�i��i.P.'.'..,;:i,. �:...�:.:.:::�� .. .... 1 .1..,-1 -:-!-... ... 'Í ''--b ..... --- ' ̀ ̀ ' ".b' á'hed:.:::.:í..... :::'. 1 .. i. á 11........... --- �... ......-....... . .. 1, 1.--------- . .---..................... "..................�.....�....�,. ---........,_ 1.. 1..: . . .. .. .. ......... �....,....,...... ,....... ._............ ... ... . .-.... --------- ............. --- 1. .... . ...- .... --------- .... �. 1.. ---. ... . ......�........ ..1.1 .... .1. .... --- . --- 1.... ------ ....-1....... - - 1 .... .------
. ... ------------
..... --- .....
�. �..
�:....�:.: . .1 .. . ..,�..,.....,..��....�..,�....�...�... --- ... .....l..- . . .......... ...... --- ..........., --- --- ------ .... ...
..... ..........
:..... ,. ------ --------- :: �.,::.",. --- . ...l......... ... 1. .............,.,.....��....��-�...� --- -:-:-:-:-:-::- --'-'-'--'--'-'--'-"'-"'......��: , , - ---. ,.,..".... .....�..... �...... ::::::::":-::.: ,: :..: :,:: -:: .: . . ,-- ....., ... ..... .�.... �. ..... ................ 1 ---. 1.. . .... . .. ... .. .....l.........�,.,..�..,�.�............�.....,....... . :::.,::::,:.:::::.:.,:,::.::::,.. -:::: .. .........�.. .... 1:-------- , --- ::..:.,.,.::.:...::." , . --- "' ........ . � --------- ... 1. �. �.. .---,`-::.,..` .... ...... ..... .--- -- � - - ------ ... 1 .. ..........- ---- ---------11...
.. . ---..... 1....
1--- .... --- .....
......... .1..
1......1..
....1.................�.....
...
-.... .. �. ........... �.. 1. .... , ..�.,.....".�..�.......�� ....�.....�... .....�... ....�... 11,11...... ..... . .. ... --- .... ... .---.....
.'�ll�i�il�li:li��1:11���ill�l��l��:�il�:l�:l�:111111��:, , , .......... . ... . .. :..,."....".,. , ........... ... 1.1..-.-..-..-.-..�........"..... ..... �. ::,:: .: .-............... .1......1.�l���:::�::::!::� i:..� ��.l�::��ll�l�il��ll�".., -�..-,-�.... . . ..... ... ... -- i�:11..,�lli.�.--- ..... ........ .1 .. . .. ..................... :_- -................�...,.......,.... .. ..� 1 1 �l:w:� ---........ 1. .�........ 11 . .......1.. .. ... 1. 1. ---l..... . .. .......... �.,�...."....,........�......... 1......................._ ... ,i��ii .��illi. . ...... .1 .-1 -- ------ ........... --- --- ....... .. . .. . ............. 1......... .... ... .. .. --- ------ .. .............. --- .... 1... .. .. . .. ............- ....... �.... ------ ...l. .......... ---------. 1.1.. --------- ...........�................. .. .. ... ............... .. . ......... .1. .. .... 1....... ... . . ........1.. ..... �.. . . . ... _ ... 1.. ,..'é --- ... 11.
-.. :::: :.
..
.. ...... 1.:.TIV ::, t-s . 1.. ....... 1::11.. 1.., ....... .......... �... ---------- - -,.lj::::�::,!..::á::.:::!:::::!:�:: .... ..,,:co,guéra, ion,..,:among:Cave . .. ...1.. .. .. á, . 'á'xing:.: e:::.-:`::::::::nc, rmient..�. 1.:..................1`---`.tt�
me.::b' áéá
.1..............,..."..,..,:...:,:.:...:.,.;�:.:�,.......l..........,,.,.,.- ---------..:. ... "......l....,..,.... .--- .. �.. - ---.... .. . .1... . .. ��..... --- ... i .�i �......t ... ... ,t ... ::... . . .. ... .. ......... 11 .1 . . .. . . 1. . . 1 , .. ............ .... �..:.. :q :. -------.. -el..... ... �.... ..-1...,- -. h ' ' """ ' ---L- ---------:.- , --- , ,--- --- "':� .,-- - 'f -- -- l:,.:"!:!..-.!�i..W.'1:1,0�ii�iá "¡,t:¡eiamolig�::!:gov Tmél! '.'....l.. ........ ,-,.....l.. ,--- :p ::�..-tax..-i�ro. .O.'r)ü -::tó: : , im:na é::t o::I:ov.,or.:,:"$... ... . .g..:,..........-,.,.�� .... ..... ....... - - - - ---- ---................. 1.. 1... .1.. ........::..-: .,::..,., .. �..... .. ._ ......... �. ...l.. --- __--- .,."�..,..�.,..��,��,..:..... .... .... .. .. .1. �..t.:,: : �:.. -- .. ------------ ..... �. ------ �. .. . .
.11.1.1 ... 1... .1 .. --- ...l... ..........-... --- ....�....�..�� .....�.....�... .. �.. --- �. �. .--- ,' '---,, ,,.1 - - -.---. 1' '1.... .. -- �.:Z,Pg,.:.::� l. � l... 1. . .. L-ripp., Sou: .,:,Coóplr,áté:i..,..
:,ec-t rom t é:
.. ... .. 1.1.., 11 ...
....
.:govérnments. c"'ó'I'.1''""'"�,: ::,.:..h,"':'::''s""'a"'me:":'f;"i""", , h ld ........ -,.. ., . 1 1 .- . .. : 1...�---... ......�............,.,....1.1..,.,..l.. .... �..... ::::j:j::::j,i::¡,-:::,i t� 1..... .. .. . �. �. �:::: .: -...: --:.:-:-::-, -:- ...... .. .....' ' ' "'' ... .. ---. ... . ....��..�..�-�..�-�.l.. .. .. .- ...... . .. . ---.... ..... . .. .. . .. �.:: :::«n,:............, ---t ........:::-. ...... --- ------------ -'i�.Oiop�.'�.:�"ce ... .... p:,. .. ... .. .. 1.,a :. , "' lí . .... .. .` ::,,.. 1. --- ón:. 'd '" '" --- --- -� S:.as.. ::!: . .. .... .. ... ... .. íbl -`ú. ..... ,0 . .... 0: .to. ir , e¡ �i��.'i.,.,. la,ol�l:�:�il)O$'.$..:,.......�....�..�..,.,� .�,0:� u..�-.'�..��:�i�.,.�',<> . n+,ci.... , _...., �..... ....... ,.�..,.,.....,�..,...l.5. ------ .... --- . . .. 1.. , .---------
;.. -. ---. 1. . .�..:::.
.� .1 .... 11 ..... --- P.--- . .. .1.. .1..... 1 1.....�............. . .. �..... . . ..... . ....�.�.I.�.� .... ��...��.I.�,..,�.�.�...l.. .. .-- .. ........ 1. ... ..... --------- I.---......... .- ... �. .. ..... ......... ., -�,:i���' - -:::::::.- -, --- - - - -... , .. . ... lh . .1.:
-:: ....�....... .ca::::
v,:: �r.ue.,::
" :..
.-... :: .::C -......... .. .11 , ú .::::::io -::,:_-`t - :--:'VAT':áM. 1.... .. --- ...- b�1:1:�l�:é:....... ::: . ::::::'' :T h - 'í`........ 1.'.:tó: . .....t....... .. ... ::. y j .Pey on .:!:���i� spe....--- .asi is:--- . 4�:.. .--- .

- 56 -
Table 3.5: ARGENTINA - ROUGH ESTINATES OF THE TOTAL IMPACT OF IMPROVING TAX
TAX ADMINISTRATION ON TAX RECEIPTS BY TYPE OF TAX POR FIVE PROVINCES. 1987
(ttillions of US$ of July 1988)
Total Buenoas Aires Salta Cordoba Santiago Santai Fe
del Estero
1. Increase ín real eatate tax from
502 of potential from cadastre Lmprov.(a) 55.2 37.5 0o0 7.5 0.2 10.0
inereasing X billed to 90X and
reducing evasion to zero(b) 81.8 47.2 1.5 5.5 1.4 26.2
Total 137.0 84.7 1.5 13,0 1.6 36.2
2. Increase in vehicle tax from:
increasing X billed to 902(evasion..zero) 19.9 4.0 1.0 0.0 0.6 14.3
3. Increase in the turnover tax from:
reducing evasion to 15X 282.5 175.5 12.8 46.0 6.5 41.7
4. Increase in the transfer tax (Sellos) froai:
reducing evaslon to zero 21.7 8.3 0.4 4.7 0.6 7.7
5. Total increase by type of tax: 461.1 272.5 15.7 63.7 9.4 99.9
Real eatate 137.0 84.7 1.5 13.0 1.6 36.2
Automobile 19.9 4.0 1.0 0.6 14.3
Turnover 282.5 175.5 12.8 46.0 6.5 41.7
Transfer 21.7 8.3 0.4 4.7 0.6 7.7
X increase over revenues in 1987
Total revenue from these taxes 37.6 34.1 53.6 37.0 64.6 47.5
Real estate 51.6 46.4 60.1 37.1 93.3 82.7
Automobile 17.9 4.7 80.0 63.6 63.6
Turnover 42.9 41.7 70.0 41.7 70.0 41.7
Transfer 11.4 7.5 5.3 17.6 25.0 17.6
Source: Based on the data and interviews from the case atudies done for this Study.
Notes: (a) Assumes 100X billing and no evasion.
(b) Calculationa based on the existing cadastre.

- 57 -
IV. PROVINCIAL EXPENDITURES
4.01 Total expenditures for the general administration of allprovinces and the Federal Capital rose rapidly from 7.5 percent of GDPin 1970 to 11.2 percent of GDP (or about US$8 billion) in 1986. SeeFigure 4.1. Including just the expenditures from the provincial publicenterprises in Buenos Aires and Santa Fe would raise this estimate to 12percent of GDP in 1986. Current expenditures shot from a low of 5percent of GDP in 1972, to a peak of 9.2 percent in 1984, then declinedslightly to 8.4 percent of GDP in 1986, excluding those of the publicenterprises. The data from the case studies showed that theseexpenditures increased by over 7 percent in 1987, even though totalrevenues declined. Capital expenditures remained steady at about threepercent of GDP during the 1984-86 period.
A. Current Expenditures
4.02 The driving force in the increase of current expendituresclearly was personnel, but transfers to municipalities and otherentities also were important. See Figure 4.2.
Personnel
4.03 Trends in Public Employment. Payments for personnel variedwidely over the period, ranging from 3.1 percent of GDP in 1977 to ahigh of 5.8 percent of GDP in 1984. Provincial public emplovment inonly the consolidated central adminístration increased bv over 230.000(34 percent) in all provinces during the 1983-86 period, reaching913,000 in 1986. The highest relative increase during this period wasin Santa Cruz (50 percent) and the highest absolute increase in BuenosAires (37,500). See Figure 4.3. This trend continued in 1987 for mostof the six provinces studied. For this reason, total provincialexpenditures on personnel for the general administration alone rose byslightly over 33 percent during the 1983-86 period, reaching over US$3.9billion in 1986. Including the public enterprises would increase thisfigure dramatically.
4.04 By far the most important provincial expense is salaries,ranging from 41.5 percent of total expenditures in Santiago del Esteroto 57.1 percent in Cordoba in 1987 for the central administration.5'This percentage rose significantly over 1986 levels for all provincessurveyed except Buenos Aires and Santiago del Estero.
58/ See Statistical Appendix, Table lld.

- 58 -
ViUKL 4.1 figure 4.2
TO1AL. CURRNT ANO CAPITAL EXPENDITUPEIS CURRENT PROVINCIAL EXPENDITURES BY TYPEAL¡. PROVINCES ANO THE FDERAL (1PIA ALL PROVINCES ANO TElE FEDERAL CAPITAL
5 OF ~ ~ ~ ~ ~ ___ .OF GOP
l~~a _
2-
70 71 72 73 74 75 78 77 78 79 80 81 82 83 84 8S 870 71 72 73 74 76 76 77 78 79 80 81 82 83 84 586 YEAR
YEAR- PERSONNEL -- 0000 AND SERVICES
-TOTAL -+- CURRENT CAPITAL -*- INTEREST -- TRANSFERS
Seu Ttis 4.t Source: See TabEe 4.1.
Figure 4.3
INCREASE IN PROV PUBLIC EMPLC)YMENTALL PROVINCES: 1983/86
40-_Bueno Aires
S~~~~~~~~~~
X 30
o
35
25 Santo Feu a2
c
t'° 20
15
Corrientes
o 10Y' ~~~~~~~~~~~~~~~~~~~salta F'armosa
Cordoba Entre Rios i foO3 Tucum_qn r. La Riojci CrijZ
5 3RCb1 ,i*p c junRio Negro Son Luis Chubut oMendoza Juaornarca I d)Uú'I PampO O
Santibgo la §estero C
1 7 10 12 13 14 14 15 17 17 18 20 21 21 27 29 i4 38 41 41 41 50
% INCREASE IN EMPLOYMENT
Source: Table 4.2

Table 4.1: ARGENTINA - EXPENDITURES BY TYPE, 1970-86
(Percent of GDP)
70 71 72 73 74 75 76 77 78 79 80 81 82 83 84 85 86
TOTAL EXPENDITURES 7.55 7.08 7.10 8.04 9.94 10.60 8.75 9.39 10.42 10.55 11.60 11.99 9.60 11.40 11.89 11.37 11.15
CURRENT EXPENDITURES 5.32 5.14 4.97 6.25 7.52 7.88 5.41 5.47 6.50 6.56 8.02 8.53 7.04 8.51 9.20 8.77 8.45
Personnel Expenditures 3.73 3.67 3.56 4.55 5.35 5.75 3.52 3.13 4.18 4.31 5.14 4.81 3.86 4.95 5.79 5.58 5.47
Goods and Services 0.76 0.68 0.64 0.67 0.75 0.66 0.63 0.78 0.86 0.82 1.06 0.89 0.85 0.84 0.95 1.02 1.03
Interest on Debt 0.04 0.03 0.01 0.03 0.05 0.04 0.03 0.02 0.01 0.05 0.10 0.26 0.15 0.18 0.02 0.05 0.02
Other Current Expenditures 0.00 0.00 0.00 0.00 0.00 0.00 0.00 0.00 0.00 0.00 0.00 0.00 0.00 0.00 0.00 0.00 0.00
Current & Capital Transfers 0.80 0.76 0.75 0.99 1.37 1.43 1.22 1.54 1.45 1.38 1.72 2.56 2.17 2.55 2.44 2.12 1.92
CAPITAL EXPENDITURES 2.23 1.94 2.13 1.79 2.42 2.72 3.34 3.92 3.92 3.63 3.59 3.46 2.56 2.89 2.69 2.60 2.70
Fixed Investments 2.14 1.90 2.05 1.72 2.29 2.65 3.27 3.63 3.79 3.52 3.39 2.77 2.34 2.76 2.43 2.42 2.63
Machinery and Equipment 0.25 0.20 0.14 0.12 0.21 0.16 0.20 0.31 0.25 0.15 0.15 0.11 0.09 0.11 0.12 0.10 0.06
Construction 1.89 1.70 1.91 1.60 2.08 2.49 3.07 3.32 3.54 3.37 3.24 2.66 2.25 2.65 2.31 2.32 2.57
Changes in Inventories 0.00 0.00 0.00 0.00 0.00 0.00 0.00 0.00 0.00 0.00 0.11 0.14 0.08 0.03 0.04 0.04 0.02
Financial Investments 0.09 0.04 0.08 0.07 0.12 0.07 0.07 0.29 0.13 0.12 0.09 0.55 0.14 0.10 0.23 0.14 0.05
Changes in inv. + economies 0.00 0.00 0.00 0.00 0.00 0.00 0.00 0.00 0.00 0.00 0.00 0.00 0.00 0.00 0.00 0.00 0.00
Source: See Table 1.1.

- 60 -
Table 4.2: ARGENTINA - TOTAL PROVINCIAL PUBLIC EMPLOYMZNT
BY PROVINCE, 1983-86
1983 1986 Cha~g 198611983 Public Empnloyees
------------------ por 1000 Population
Provinces (a) (a) Absoluto X
1983 1986
TOTAL 68L,253 912,837 231,584 34.0 23 29
Buenos Aires 173,205 215,702 37,497 21.0 15 17
Catamarca 15,887 19,057 2,170 12.9 77 82
Chaco 2.5,943 29,613 3,670 14.1 35 37
Chubut 11,728 15,688 3,960 33.8 40 49
Cordoba 63,181 66,121 5,940 9.9 24 25
Corrientes 29,552 41,567 12,015 40.7 43 57
Entre Rios 27,622 33,506 5,884 21.3 29 34
Formosa 13,921 26,030 7,109 37.6 60 76
Jujuy 20,800 23,250 2,450 11.8 46 47
La Pampa 9,426 11,144 1,718 18.2 43 48
La Rioja 11,874 16,783 4,909 41.3 68 91
Mendoza 33,661 35,861 2,200 6.5 26 26
Misiones 2D,947 24,179 3,232 15.4 33 35
Neuquen 14,017 16,345 2,328 16.6 50 51
Rio Negro 13,242 21,959 3,717 20.4 42 46
Salta 26,203 33,822 7,619 29.1 37 44
San Juan 17,773 20,808 3,035 17.1 36 40
San Luis 13,269 16,852 3,583 27.0 59 72
Santa Cruz 9,486 14,269 4,783 50.4 75 103
Santa Fe 58,654 82,716 24,062 41.0 23 31
Santiago del Estero 24,253 24,402 149 0.6 39 37
Tucuman 33,609 38,163 4,554 13.5 32 34
Source: See Table 20 in the Statistical Appendix.
Note: (a) Includes only ejnploy3 ent in the General Administration.

- 61 -
4.05 The provinces argue that this great expansion in employmentwas necessary to meet the increased demand for public servíces,especially health and education, for which substantial service deliveryresponsibility had been transferred form the Central Government to theProvinces in the late 1970s and early 1980s (see para. 2.09). The data,however, show that while employment in health and education did, infact, increase, employment in other areas of public administration grewat almost exactly the same rates.L' The total public employment in thesesix provinces increased by 123,000 over the 1983-87 period. The area ofhealth and education increased at rates equal to those of the "other"category, including general administration.
4.06 This is not to say that increases in employment in generaladministration do not have efficiency justifications. Areas ofspecialization such as tax administration, for example, suffer fromshortages of qualified staff, many of whom are lured away by the privatesector.
4.07 This growth of employment varied greatly among the sixprovinces. In Salta, total provincial public employment catapulted from26,000 in 1983 to 55,000 in 1987, an increase of 29,000 or 111.5 percentin only four years. Of this, about 12,000, or 40 percent, was in healthand education with the other 17,000 in the general administration. TheProvince of Salta declared itself an "employer of last resort", and in1987, the payroll in Salta exceeded total current revenues by almost 40percent. Now, however, it is considering a number of policies to reducethe payroll, including assistance in opening small businesses, and"privatizing" services such as transport, copying, etc.
4.8 Impact on Efficiency. Rapid increases in employment havemeant that the efficiency of the provincial public sector has declinedin some cases. However, pinpointing the areas of least efficiency willrequire much deeper studies. A recent analysis of employment policyshows just how difficult it is to answer seemingly simple questionsabout public employment.f' Rapid growth of employment in the publicsector can lead to inefficient mixes of inputs in the production ofpublic goods (e.g., the teacher without chalk and the doctor without anymedical supplies).!Y There is, then, a need for a much more detailedand careful analysis of the efficiency of the public sector (especiallyof the important social sectors) to determine how they might be more
92/ See Table l0.d in the Statistical Appendix.
i0/ David L. Lindauer, "Government Pay and Employment Policies andGovernment Performance in Developing Countries, n Background Paper forthe World Development Report of 1988, Washington, the World Bank.
§it ibid., pp. 7-12.

- 62 -
efficient producers of these irnportant services, as well as the natureof a more equitable employment policy.
4.9 These rapid increases have been accompanied by a series ofproblems which affect a numiber of provinces to varying degrees. Theseinclude overall salary erosion,, often comparing unfavorably with theprivate sector for some (especiLally professional) occupationalcategories and acute compression of the wage structure. In some cases,such as Salta and Cordoba proviLnces, employment has a top to bottomsalary ratio of 3:1 or less, as low as some of the least developedcountries of the world.
4.10 This high employment,/low wage scenario engenders an intricateweb of adaptive behaviors which seem to have emerged in a number ofprovincial personnel systems. First, quit rates may be increasing fornon-political professional and technical posts, especially where privatesector alternatives exist. Chronic absenteeism, a problem clearlyidentified in Buenos Aires province, for example, may be increasing as afunction of increased mooniighting in other economic activities. Doubleemployment, both within the public sector and in private and publicsector jobs was identified as a growing problem, although good data arenot readily available on this point. The use and abuse of compensatoryremuneration mechanisms to correct or mitigate salary erosion,especially at hígher levels, may be on the rise. Thus non-wage benefitsand allowances and time and a half paid for overtime work constitutenon-transparent elements whlich make the remuneration system lesstransparent and much more difficult to rationalize.
4.11 Several features of provincial personnel administration poseserious obstacles to improved management efficiency. These include: theabsence of systematic recruitment criteria and procedures, reinforcingthe highly politicized, non-professionalized character of manyprovincial administrations; the prevalence of (acknowledged) politicalappointments at unusually low :Levels of the bureaucracy, further de-professionalizing public service cadres and also heighteningdiscontinuity through rapid tu:rnover of bureaucratic elites in electoralcycles; low professional incentives for public service employees due tothe absence of merit-based adv.ncement systems through performance-based evaluation and promotion mechanisms, career development andtraining programs, and funetion-related job classification systems; andthe proliferation, in some provinces, of different legal regimesregulating employment and pay policies for various professional corpswithin the central administrat:ion, often negotiated separately withdifferent labor organizations.
Goods and Services
4.12 Current expenditures of all provinces on goods and servicesstayed relatively stable al: about one percent of GDP (about US$700million) over most of the 1L980s. Most provincial administratorsinterviewed agreed that improved purchasing procedures could cut at

- 63 -
least ten percent from expenditures with no loss in quality orefficiency, a saving of US$70 million per year on current expendituresfor goods and services alone. Better bidding procedures and procurementmight bring even higher savings for the over US$1.4 billion investedannually by the provinces (See para. 4.32).
4.13 All provinces except San Juan have adopted the Buy-Argentinalegislation, and seven also have Buy-Provincial legislation (Jujuy, LaPampa, San Juan, Catamarca, Santiago del Estero, Formosa and Chaco).Both not only increase costs significantly, but also impede industrialdevelopment by reducing competition.9
Interest Pavments
4.14 Interest payments account for less than one percent of totalexpenditures in all six of the provinces surveyed, except Santa Fe whereit reached almost two percent. The reason for this, as analyzed inChapter V (Section B), is that provinces "borrow" mainly from suppliersand contractors (1.e., via arrears and delays in payments), although theamount of borrowing from the banks has tended to increase as theprovinces' financial situation has worsened. Most interest paymentsare, therefore, implicit and are included in the price of the works,goods and services received.
Transfers to MuniciRalities and Other Entities
4.15 Provincial governments transfer resources to municipalgovernments via revenue sharing and discretionary grants, as well as toprovincial enterprises and to social security entities. Of these,transfers to municipalities are normally the most important item. Theprovinces vary greatly not only in what taxes they share withmunicipalities, but also in the percentages used in secondarydistribution among the different municipalities. For example, theProvinces of Buenos Aires and La Pampa set aside a constant percentageof almost all of its taxes and Federal revenue sharing to be divided,while the Province of Santa Fe allocates widely ranging proportions ofthe different provincial taxes for secondary distribution among themunicipalities.
4.16 Current transfers to municipalities, provincial enterprisesand special organisms such as social security increased from less than 1percent of GDP in the early 1970s to a peak of 2.6 percent of GDP in1981, but tended to decline over the 1983-86 period, reaching 1.9percent of GDP in 1986. In 1987, these transfers accounted for 22percent of total expenditures in Santa Fe and about 16 percent in BuenosAires.
fiV See World Bank, "Industrial Policy," Annex Chapter VII of Argentina:Reforms. . .

- 64 -
4.17 Because provincial officials are aware that these transferscan represent a real drain on provincial resources, they have takensteps to reduce them by trying to restructure public enterprises andreduce and/or reform the mechanisms for transferring resources tomunicipalities.
B. Capital SRending
4.18 Total capital expenditures include real investment for newconstruction and capital goods, capital transfers (prima.rily tomunicipalities), lending, purchase of equities, and investment inexisting assets (i.e., land and buildings). The general administrationand the enterprises of the six provinces spent a total ef US$1.1 billionon capital expenditures in 1987, of which over 85 percent went to fixedinvestment (US$768 million in 1986 and US$945 million in 1987). Forthe 1981-87 period, the general administration and public enterprises ofthese six provinces showed a total fixed investment of US$4.8 billionfor an annual average of US$693 million. Even excluding the provincialpublic enterprises, the 22 provinces and the Federal Capital investedabout US$1.6 billion in 1986.
4.19 As discussed in Chapter VI (paras 6.38-6.41), there is a clearand urgent need for more emphasis on maintenance of existing assets bythe provinces.
C. Comparative Evaluation of Expenditures
4.20 Comparison of expenditures per capita and as percentages ofGPP provide some interesting insights. For example, Chubut's per capitaexpenditure on personnel in 1987 (US$257) was 23 percent higher thantotal per capita expenditures for Buenos Aires and almost three timeshigher the per capita expenditure of Buenos Aires on personnel (US$86).Salta spent even more per capita on personnel (US$284). In 1987,Salta's expenditure's on personnel were equal to 26.6 pe.rcent of GPP,versus 8.9 percent in Chubut and 4.7 percent in Buenos Aires. Thevariations in total provincial expenditures as a percentage of GPP in1987 was quite high among the six provinces: Salta (35.5 percent);Santiago del Estero (35.8 percent); Chubut (16.5 percent); Santa Fe(13.3 percent); Cordoba (12.6 percent); and Buenos Aires. (9.3 percent).21A large part of this variation may be explained by the broad differencesin revenues from royalties and revenue sharing, with thei Province ofBuenos Aires receiving the least on a per capita basis.
fr3/ See Statistical Appendix, Table ll.b.

- 65 -
D. The Distribution of Expenditures by Functional Categories
4.21 The diversity of the administrative structures of theprovinces makes preparation and interpretation of data on functionalcategories particularly difficult and risky in Argentina, as a givenactivity might be found in a number of different categories.Fortunately, the most consistent categories are education and health,which generally are the largest expenditure categories. For all sixprovinces studied in 1987, health accounted for 14.6 percent of totalexpenditures of the general administration (US$624 million), andeducation, for 27.8 percent (US$1.2 billion), summing to a total of 42.4percent (US$1.8 billion) of total expenditures. See Table 4.3 andFigure 4.4. This is an increase of 64 percent from 1981, when theprovinces spent a total of only 33.4 percent of total publicexpenditures on health and education (US$1.1 billion).§Y Expenditures byall provinces on education accounted for 55 percent of totalexpenditures on education in 1985, up from only 35 percent in 1976 as aresult of the decentralization of responsibility noted in para. 4.05.1Y
4.22 Adding "social welfare" expendituresL6, brings this total forsocial expenditures to 54.9 percent of all provincial expenditures forthe six provinces (US$2.3 billion or 3.3 percent of GDP), almost seventimes more than allocated by the six provinces surveyed to all "economicdevelopment" expenditures (i.e., transportation, irrigation, drainage,natural resources, tourism, etc.). Using 55 percent of totalexpenditures of the provinces surveyed as a bench mark for estimatingthe expenditures of all provinces, then total social spending (including"social welfare") by the provinces in 1987 is estimated at US$4.7billion or 6.7 percent of GDP.
4.23 Some provincial officials stressed the need for better balancebetween "social" and "economic" expenditures. Certainly, efforts toreform the provincial public sector's expenditures will need to focus onthe social sectors, given their great importance. Improved expenditureefficiency in these sectors could make more resources available forinvestments directed to economic development (and expansion of the taxbase). These investments fell from 24.2 percent of total expendituresin 1983 of the six provinces surveyed, to only 8.2 percent in 1987.
i1/ See Statistical Appendix, Table lOd.
ñk/ For a discussion, see: The World Bank, Argentina: Social Sectors inCrisis, Washington, D.C., July 1987.
@/ A very heterogeneous category including housing, water sewage, socialsecurity, social assistance, sports and recreational activities andsocial assistance.

- 66 -
Fi.gure 4.4
EXPENCITUREJI BY FUNCTIONAL CATAGORIESSIXt PROVINCES& 1987
1 OF TOrAL EX;P.100
80
40
20
0btaIl Em.C.ordobeChubut Saita SanitasetiaAira Fe del Eete<
G Geral d,,. - Pubio 8afety
Sooial Eeoeil Doy.
Bource. See Tabte 4.3.
Tjable 4. 3
Table 4.3: ARGENTINA - RELATIVE DISTRIBUTION OF EXPEIDITURES BY FUNCTIONAL CATEGORIES
FOR THE GENERAL ADMINISTRATIONS (a) OF THE SIX PROVINCES OF THE CASE STUDIES, 1987
FunctionaL Categories lotal six Buenos Cordoba Chubut Salta Santa Fe Santiago
Frovinces Aires del Ester
TOTAL 100.0 100.0 100.0 100.0 100.0 100.0 100.0
General Administration (b) 25.7 22.6 23.0 38.2 38.2 28.0 20.6
Public Safety 11.1 11.0 13.7 6.7 10.8 11.8 7.0
Social Expenditures 54.9 57.7 52.0 36.6 48.6 57.5 50.0
Health 14.6 13.7 14.5 11.5 29.8 11.1 9.1
CuLture and Education 27.8 31.4 32.4 14.5 11.3 28.6 17.3
Social Welfare 12.5 12.5 5.1 10.6 7.4 17.8 23.6Economic DeveLopment 8.2 8.7 11.3 18.5 2.4 2.7 22.3
Source: See Table 11.d in the Statistical Appendix.
Notes: (a) Includes Central Adniinistration, DecentraLized entities and specisl accounte. ExcLudes
enterprises, "no consoLidados", and provincial banks.
tb) IncLudes public debt and other expenditures, wihch are narmrLLy very low.
- 67 -
E. Distribution of Benefits from Public Expenditures
4.24 Who receives the benefits of these provincial expenditures?For some, the answer is direct and simple, as in the cases of thetransfers to individuals in social security. For the bulk of generaladministration expenditures, however, it is a question nearly impossibleto answer. The question of equity is most often addressed for socialprograms, such as social security, education, health, housing and basicsanitation (i.e., water and sewer systems). A recent study shows thatthe inter-personal distribution of benefits from these social programstend to vary more by program than by province.51 For example, thebenefits of basic education are much less concentrated in the higherincome groups than are those of higher education across all provinces(and, indeed, across countries). There are a number of ways of makingthe provision of these services more equitable. For education, morecould be devoted to basic education. For some services such as waterand electricity, user fees can be set as a function of consumption, withhigher income groups generally having greater consumption and thuspaying higher unit costs.-
F. Increasing the Efficiency and Ecuity of Resource Allocation
4.25 All of the national and provincial officials interviewedagreed that the efficiency of the provincial public sector could andshould be increased, thereby permitting a reduction of expenditureswithout necessarily reducing service levels. Direct subsidies should betargeted to the lowest income families and made transparent in thebudgetary process. The provinces should concentrate on provision ofthose services which are auto-directed to the lowest income groups, suchas basic education. Priority areas for improving expenditures arediscussed below.
Personnel Policv
4.26 Clearly, provincial personnel policies constitute a priorityarea of reform not only because personnel expenditures represent asizeable portion of total provincial expenditures (an average of 46percent between 1981 and 1986), thus contributing significantly tooverall public deficits at the provincial level, but also because
7/ A. Humberto Petrei, El Gasto Publico Social y sus EfectosDistributivos: Un Examen Comparativo de Cinco Paises de AmericaLatina (Rio de Janeiro: Programa ECIEL, 1987).
í8/ For a review of these ideas, see Chapter 6 of the World DevelopmentReport of 1988.

- 68 -
personnel administration systems in the provinces studied showed seriousdeficiencies in management: capacity, resulting in inefficiency anddiminished incentives to performance.
4.27 A program to improve the management of provincial publicpersonnel systems could include several policy options, some of theseare already being pursued in various provinces. First, the data basethat informs policy decisions needs to be strengthened. Mostfundamental is the implementation of a public employee census todetermine the number and profile of government personnel. Second, thelinks between the personnel management system and the payroll systemshould be strengthened, so that cross-checking between the two systemscan be used to identify ghost workers or double employment. Any gapsbetween these two systems should be analyzed and closed.
4.28 Where high employment, low salaries and wage compression areacute, a careful strategy of rationalization should be developed withcost projections. Employrnent reduction and the redistribution ofresulting salary savings 1:o decompress the wage structure and increaseincentives to professionaL levels should be a goal in many cases.
4.29 Such a program would be based on a review of the employmentand salary pyramid (possibly revealing surplus employment at lowerechelons) and a functiona:L examination of skill and manpowerrequirements for differenti units of government. Possible mechanisms toachieve these objectives include voluntary retirement schemes, enforcedretirement procedures, and retrenchment of redundant workers.
4.30 The first two options would require detailed examination ofpension obligations in order to determine their cost-effectiveness. Thethird option is currently constrained by the absence of laborlegislation that permits dismissal under any but the most exceptionalconditions or that stipulates separation benefits that may be fair butare unaffordable. Permanent oamployment in the provincial public sectoris the overwhelming norm, and temporary employment is often little morethan a first step toward permanent tenure. The obvious pressure fromorganized labor to preser7e t]his guaranteed employment system will beformidable. But changes in tlhe legal and political framework for publicemployment will be essential to any meaningful reform in this area.Systems for the rational but lhumane reduction in public employment havebeen developed in a number of developing and developed countries. Theseexperiences could provide mod,els for appropriate separation packages,retraining programs, small business credit schemes, and otherappropriate measures. Techni,cal assistance in the adaptation of some ofthese mechanisms should be made available.
4.31 Each provincial goverrmxent should do detailed studies on howto improve the efficiency and equity of its personnel policy. A

-69 -
national technical assistance program to support studies and reforms maybe appropriate.~2
Procurement Procedures
4.32 Improved procurement procedures could significantly reducecurrent and capital account expenditures. The lowest evaluated priceprinciple should be applied for procurement of goods and works. This,together with the elimination of "buy Argentina" and "buy province"legislation, would not only lower costs, but would also help in themodernization of industry by stimulating competition. (For a moredetailed analysis of procurement procedures, see Chapter VI, paras.6.42-6.53, and for recommendations, paras. 6.81-6.85).
Transfers to Municipalities. Persons and Public EnterRrises
4.33 Rationalization and control of transfers could produceimportant savings for provinces, as they represent one of the mostimportant provincial expenditures. Discretionary grants tomunicipalities should be strictly disciplined and, in general, replacedwith automatic or formula driven revenue sharing. Transfers to publicenterprises should be eliminated or reduced to a minimum by improvingtheir efficiency and encouraging full cost recovery, as well as byprivatization, when appropriate. Laws regulating pension funds andother transfers to individuals should be reviewed and administrativeprocedures tightened to discourage abuses.
Debt Service
4.34 As discussed in detail in the following chapter, provincescurrently "finance" a substantial part of their capital investmentthrough suppliers, contractors, and other short term means, such asoverdrafts on the provincial banks. Longer term borrowing wouldcertainly reduce the need for pressuring the Central Government to coverthe borrowing needs for capital investments. Formerly, many of theprovinces financed a significant portion of their investment with theirown current account saving (including grants), but this is usually nolonger the case, for the reasons discussed above and in the followingChapter.
General Organization and Management
4.35 Elementary improvements in the basic organization andmanagement practices of government units could save much time and money
92/ The Bank has been involved in numerous efforts to improve publicsector employment policies. For a review, see: Barbara Nunberg,"Public Sector Pay and Employment Reform," Policy Planning andResearch Working Papers, WPS 113, World Bank, Washington, D.C.,October 1988.

- 70 -
for both the government and those needing services. None of theprovinces visited were investing more than token effort in these kindsof improvements. The use of computers could dramatically increaseproductivity in many areas.
4.36 The importance of each of these measures will vary. The keyarea in need of improvement is attitudes toward service delivery andaccountability. Provinces must move away from an attitude of dependenceon Central Government patronage and toward assuming full accountabilityfor the quality of services delivered, and demonstrate t.o their citizensthat the services delivered are worth the taxes and fees, paid bybeneficiaries.
Studies to Improve Efficiency and Eguity within the Sect:ors
4.37 In addition to the more general studies of howj to improverevenues and increase efficiecncy of the provincial publiic sector, moredetailed studies are needed for each of the main sectors, (i.e., socialsector, infrastructure, etc.). Such studies would also help todisseminate information about: the effectiveness of different programapproaches. A key issue to be addressed in these studies is the roleand scope of subsidies. If fiscal discipline is to be attained, thenpolicies regarding subsidLes must be made explicit, transparent in budgetpreparation and execution process, and well focused on Limited andfairly selected target groups. Furthermore, a clear strategy forsubsidy financíng, generally with decreasing subsidy levels over time,should be defined and implemented in a sustainable manner.

:::~~~~~~~~~~~~~~~~~~~~~~~~~~~~~~~~. . . .. : .......... : : ç . . ..... ......... .:
. - qnd ,iXa9;''.. ,-.s '; '~e 's ~ '-m - ' ''' .' .......
... i.o X ta B}p.ua 2.;q- -st ei .-
~~~~~~~~~~~~~~~~~~~~~~~~~~~~~~~~~~~~~~~. .... .. a. : -; 8U3-9a... .. ...a.
..~~~~~~~~~~~~~~~~~~~~~~~~~~~~~~~~~~~~~~~~~~~~.. ...........W=. . .
--uixas . o. esn 5:R 9zlurdo .sip~i XS@din8j o¡. 4 9 im t 5
*. .. p4. TP vi i .q -pl zi '
--W -nb S ......................... S O S .... I U -: X iil -f: f~~~~~~~. . . ..... . .
.... . .a . . a a p ...... p......: spI 14 .
< ueq; eq pinoi seins-am -u~ ; .- ;. -~. . .,....
jf o. Uó flU Oj, 914-.S; :i«pfsUO pflnoqfs 9ap.fl$ eaj ..... ~e ,paj;un-g,poqs-XC1,od- J9uol 2uIÁo.zd¡T tS LSS cU o;einst
.... - Ltc1I ... q.d : :oz:d- Prs~ w j- -f .
. .. ... '. ."." j'," '' '- ........
-- ul ,jo otos s;s f -o -,f d
: - . . -: .. ... .i..--: . . ....
.. .... ..., '. -..- ... .''. .. . .
:-,~~~~~~~~~~~~~~~~~~~~~~~~~~~~~~~~~~~~... ...... : -
~Iq uupr.;ern~o ms;q ;~1dT*
~SYa~DNI GNV ~ ... .. .. . . . . ................ ...... ... ... . . ....
Slsoo~~~ ... -ocau

- 72 -
V. PROVINCIAL DEFICITS AND SOURCES OF CREDIT
5.01 The provinces have financed the bulk of their deficits on avery short term basis, mosltly through supplier and contractor credits,but also through overdrafts at their provincial banks. The resultingliquidity crises at the provincial banks have made them prime users ofthe "rediscount" facilities of the Central Bank, making them significantcontributors to the quasi-fEiscal deficit. This chapter will examine theprovincial fiscal deficits and the ways in which they are financed.
A. The Rap.Ld Rise of the Provincial Fiscal Deficit
5.02 Figure 5.1 shows this ever widening gap between total revenuesand expenditures after transfers, including discretionary grants for thesix provinces, reaching US$l.l billion in 1987 (more than double that of1986), resulting from both the decline of total revenues and grants of8.5 percent and an increase in total expenditures of 7.4 percent. Eventhe current account saving after erants, turned negative in 1987 for thefirst time in the decade. See Figure 5.2. Thus, in 1987, the generaladministrations of the six provinces had to finance not only over US$925million in capital expenditures, but also over US$250 million in currentexpenditures. Including tlhe public enterprises would increase the totalneed for borrowing to US$1.5 billion (by about 35 percent) in 1987 forthe six provinces studied. The estimated deficit for the generaladministrations of all provinces in 1987 was US$2.8 billion, over threetimes that of 1986. For all 22 provinces, the total need for borrowingin 1985 would have been alimost 70 percent higher had all of theprovincial non-consolidated entities and public enterprises beenincluded. Although the full results for fiscal 1988 are rnot yetcomplete, it is quite clear that the fiscal deficit of the provincesincreased markedly in 1988, as both transfers and own-source revenuesdropped precipitously, while expenditures continued to rise in manycases.
5.03 The provinces of the Advanced Group account for less than athird of total deficit of all provinces in 1986, much less thanproportional to their combined population or product (70.5 percent and78.4 percent respectively). See Figure 5.3 and Table 5.2. TheIntermediate Group was responsible for 23.3 percent of the total deficitin 1986, though only 11.6 percent of Argentina's population lived in itsprovinces in 1985. Even though they receive massive transfers from theCentral Government, the provinces of the Underdeveloped group accountedfor nearly a third of the total deficit in 1986, much more thanproportional to their population or product (13.2 percen1: and 6.6percent). Despite very high revenues from royalties, the Low-Densitygroup's share of the total deficit was over three times their share oftotal population (4.7 percent). Clearly, efforts to reduce theprovincial contribution te the public sector deficit wiLl have toencompass all of the provinces, not just those of the adizanced regionwith the largest populaticns and products.

- 73 -
Figure 5.1 FIiire 5. 2
TOTAL RtVENUEB ANO EXPENDITUREBStX PROVINCES: 1981-87 SAVING AND OWN SA/ING
GENERAL ADMIN, SIX PROVINCE8: 1981-87
BILLION8 OF US.£ MILLIONS OF USJ
600
4.6 0
4
-200
1981 1982 1983 1984 1986 1986 1987 -600YEARS 1981 1982 1983 1984 1988 1980 1987
YEARS- TOIM. REV & GRANTS O TOTA. EXPENDITUREO
-OWN SWINO +- *aING<WITN ORANTO)
8" Tab 85.1.8ource: So Table 6.t
Fi&ure 5. 3
RELATIVE DISTRIBUTION OF TOTAL PROV.DEFICIT, POPULATION AND PRODUCT
% OF TOTAL FOR PROVINCES100
°o -80
60-
40-
20
ADWVNCED LOW INTER- UNDER-DENSITY MEDIATE DEVELOPED
PROVINCIAL GROUPS
DEFICIT 1N8 9 DEFICIT 1981-8e
3 % OF TOTAL POP. % OF PRODUCT CGPP)
Source: Soe Tabla 2, 4 and 24 In theStatiktlcal Appendix.

Tablc 5.1 ARCENTIHA - FftVIZNCIAL REVEYUES, EXPBUDITURES, DEWICIT/SURPLUS AID FI ZAICIUG,
SUN or TU CEXIZAL ADMINISTRATION (a) FOR TUI S= PIOVI¡CES or TR CASE STUDIS, 1981-87
(mllLone of l9$ o£ July Jf 191)
1981 1982 19J3 1984 1985 1984 1987 Averaac Cocf.
81/87 of Var.
(b)
6. TOTAL REVEMUES AND GRANTS (1 + 3 + 4)(c) 2,907 2,472 2,907 2,985 2,855 3,420 3,127 2,953 9.0
7. TOTAL EXPENDITURES <2 + 5) 3,471 2,682 3,112 3,476 3,281 3,974 4,269 3,466 14.1
8. OVERALL DEFICIT/SURPLUS OR NEED
FOR FINANCING ( 6 - 7 ) (564) (209) (205) (491) (426) (554) (1,142) (513) (56.8)
9. NET sORROUIN (10 - 11) 351 165 178 178 218 310 418 260 35.7
10. FINANCINC 386 222 195 187 234 421 507 307 38.6
Usn of credot 106 21 4 42 56 124 166 74 73.9
Douaing fian o Fund (VONAVI) 0 117 129 82 63 85 171 93 54.3
Othars (d) 268 84 62 61 113 211 164 138 53.6
Fre pravloum exarelcas 12 0 (0) 1 1 1 6 3 142.4
11. AfORTIZATION OF TEZ DE8T 36 57 17 9 16 111 89 48 76.6
12. NET VARIATION IN SBORS TERM ASSETS
AND LIA8ILITIES (-) (213) (44) (28) (313) (207) (244) (724) (253) (84.9)
13. CURRENT ACCOUNT SURPLUS WITHOUT GRANTS
(OWN SAVING) (1 - 2) (39) 258 (245) (444) (158) (192) (417) (177) (125.1)
14. CURRENT ACCOUNT SAVING WITE RECEIPTS
OF CURRENT GRANTS (SAVING) (1 - 2 + 4) 53 376 428 38 74 158 (255) 124 170.7
15. GROSS FIXED CAPITAL
FORMATION (5.1. - 3.1.) 521 477 544 428 397 572 762 529 21.0
Sourca: Se- Table 10.d In tha Statiatical Appondlx.
Notes: (a) Includes central adminlstratlon, decentralized entíttes and speclal accounts. Excludas *nterprls.s,
non-consolldatmd, decentralízed .ntltics, tha provincial bank. nt social socurity untíties.
(b) Standard davíation/Mlan 1981-1987.
(c) Ad hoc revenue *harinr for 1985-1987 vas treatcd as rev nNo aharing and not as dlscretionary grants.
(d) This cata-ory contacns sea grants and could, thorofore, bh lbov tho lina.
(a) Called "R*aultado in Argentina.

- 75 -
TabLe 5.2: ARGENTINA - OVERALL DEFICIT/SURPLUS, POPULATION AND PRODUCT
BY THE CFI PROVINCIAL GRWPS, 1986 AND MEAN 1981-86
tMillions of USS of July 1988)
Groups Overall Deficit/Surplus X of Total X of Total
------------------------------------ Population Provincial
1986 Mean Product
Abs. X 1981-86 % 1985 1985
TOTAL (912.6) 100.0 (832.7) 100.0 100.0 100.0
Advanced (263.1) 31.6 (368.5) 44.3 70.5 78.4
Low Density (145.1) 17.4 (114.6) 13.8 4.7 6.5
Internediate (212.6) 25.5 (114.1) 13.7 11.6 8.5
Underdeveloped (291.8) 35.0 (235.5) 28.3 13.2 6.6
Source: See Tabtes 2, 4 and 24 of the Statistical Appendix.
B. Flinancin the Provincial Deficit
5.04 The bulk of the deficit of these provinces is financed on ashort term basis. For example, of the total need for borrowing in 1987of US$1.1 billion, US$842 million (76.5 percent) was financed on a shortterm basis, mostly through suppliers and overdrafts of the provincialbanks. See Figure 5.4. Although the total use of credit from Banks andfrom FONAVI increased considerably over the 1981-87 period, it stillrepresented only a third of total capital formation in 1987 for the sixprovinces. See Figure 5.5.
Short-term Borrovina
5.05 Short-term borrowing can take a number of forms, including:(a) unpaid payment orders that are not overdue (voluntary credit), (b)unpaid payment orders that are overdue (involuntary credit), (c) unifiedchecking accounts, and (d) bank overdrafts, usually on the provincialbank. It is common to confuse this short term borrowing with arrears,but it includes both payment orders in arrears and those which are notoverdue. Unfortunately, the available data usually do not distinguishbetween the two. The unified checking accounts (Fondo Unificado deCuentas Oficiales) involve combining the balances of all the provincialchecking accounts, making it possible for the province to draw checks upto a stipulated limit of the total balance of this unified account. Thefunds in Special Accounts (cuentas especiales) can also be used incalculating the balance, making it possible to use these funds as aninterest-free loan without actually transferring funds from the specialaccount, as long as the funds are eventually used in the legallyspecified manner.

- 76 -
Figure 5. 4
FIt4ANCINOI THE FISCAL DEFICIT BY 8OURCWGENERAL ADUN, UiX PROVINCU ~11-87
BILLION8 Os UsS1200
1000
800
600
400
200
1981 1982 n983 94 19811 M« 198rYEAR8
NET LONO TERM FIN. M SgHORT TERM
8uc:SeTable 5.IL
Figure 5. 5
CAPITAL FORMATION ANO NET BORROWIN1GENERAL ADbMIN, SIX PROVINCE& 1981-87
MILLIONII OF U.*800
800./
400
200--
0-1981 1982 1983 1984 1988 1988 1987
YEARS
-CAPITAL FORMATION -- NET BOROWING
Source: Seo Table 5.1.

- 77 -
5.06 Part of what appears as short-term "borrowing", then, stemsfrom the practice of using the accrual basis for expenditures and cashbasis for revenues.] If there were no grow of expenditures and allpayment orders were paid when they came due, there would be littleimpact on the total size of the deficit. However, this has hardly beenthe case in Argentina in recent years, meaning that the estimates ofprovincial deficits are higher than they would be if a cash basis wereused on both revenues and expenditures. Subtracting the accruedexpenditures from those actually paid provides an estimate of floatingdebt by line item. Following this procedure in Cordoba shows that thisfloating debt was increasingly concentrated in current rather thancapital expenditures. For example, in 1981, only 36.9 percent of thisfloating debt was concentrated in the current account versus over 60percent in 1987. Clearly, some of the "financing" is being done byholding up payments on current expenditures. The Province of BuenosAires, including the utility companies, invested a total of over US$2.3billion over the 1981-87 period, but borrowed only US$636 million net ofamortization during the same period. The rest was financed on the shortterm basis described above (i.e., credits from suppliers andcontractors, overdrafts on the provincial banks, arrears, etc.).
5.07 The size of the floating debt can increase expenditures in anumber of ways. Suppliers and contractors include interest charges inthe prices of goods and works. This imputed interest will increase withtheir perception of risk of late or non-payment, which, in turn, willrise with the size of the floating debt. Cases where suppliers andcontractors charge over 100 percent more to provincial governments forthese reasons are not uncommon, and in one case they charged three timesmore.
5.08 In theory, the provinces cannot emit money and must,therefore, finance their deficits either by borrowing from financialinstitutions or issuing provincial bonds, or by the variation of shortterm assets and liabílities. In fact, one form of "borrowing" currentlybeing used by some provinces (Salta, Jujuy, Catamarca, Tucuman and LaRioja) amounts basically to the emission of money, in that it consistsof issuing "bonds" that have all of the characteristics of money. Theseprovincial bonds can be redeemed for Australes on a one-for-one basis bysimply presenting them at the provincial banks. Provinces have usedthese bonds to finance current expenditures, thereby appropriating theright to seignorage of the Central Government. The bonds don't payinterest and seem to be generally accepted as substitutes for Australeswithin the boundaries of the provinces for purchases of smaller amounts(e.g., restaurants, taxis, etc.). By restricting the circulation of
20/ It would be interesting to analyze the time between commitment andactual receipt of the goods by the provincial governments to get anidea of just how much of this floating debt. This would have to bedone using a sample because such information is not normallyavailable.

- 78 -
Australes of smaller denominations, the provincial banks forceacceptance of these bonds. The province converts varying amounts ofthese bonds into Australes each day, depending on its own reserves andits estimates of Australes needed to "import" goods and services fromother provinces. The total emission of these bonds is, however,relatively small. In Salta, the total amount in circulation is aboutUS$10 million, less than six percent of the Province's toital need forfinancing in 1987. In some. ways, this means of finance seems more of asymbolic way of showing indLependence, than of financing the deficit.
5.09 The data on the stock of debt for the provinces is quitefragmentary, rarely coverirng the provincial public enterprises. Until1987, this was not so sericus because provinces borrowed :relativelylittle, but the rapid rise of indebtedness in the last two fiscal yearsmakes this lack of information quite serious. The lack oE informationon guarantees could also bei a very important deficiency oE the system.
Longer-Term Borrowin2
5.10 The provincial banks and FONAVI are the primary sources oflonger term credit. Historically, it has been highly questionablewhether FONAVI should be treated as lending, given that its very highlynegative interest rates ma¿Le it: function more like a funnel than a fund.However, FONAVI has committ:ed itself, with World Bank support (FirstHousing Sector Project, Loain No. 2997-AR), to improved cost recovery,and it will be treated as aL fund here. In 1987, FONAVI lent US$171.2million to the six provinces. All other credit amounted to US$165.9million.
The Provincial Banks
5.11 The relationship between provincial governments and theirprovincial banks in Argentina is anything but transparent. On one hand,they provide subsidized loans t:o the provinces, often in the form ofoverdrafts. On the other, they do not pay interest rates on theprovincial tax revenues that are deposited in them, which they sometimestake an inordinately long t:ime to transfer into the accounts of theprovincial banks (up to six months). Provincial law sets limits on howmuch the provincial bank can lend to the provincial governments, but itappears that there are a number- of ways used to sidestep this, such as:discounting of payment orders issued by the provincial government,agreements by provincial banks to lend to one another, or acceptingprovincial bonds at below market rates. For example, the provincialbanks accepted the "Bonos Provinciales" issued in early 1989 by theCentral Government (See Chapter II, para. 2.26) at face value in paymentof the loans of the provincial governments, even though tlhe interest wasconsiderably below that prevai]Ling in the private market.
5.12 In addition to providing loans at below-market rates toattract jobs and firms to t:he provinces, the provincial banks also "bail

- 79 -
out" firms in financial difficulty. In most cases, they are lenient intheir collection policies. Provincial bank officials often defendthese policies as being part of their "social" orientation in they aretrying to attract and maintain employment opportunities. The resultingsubsidies, however, go directly to the owners of the firms.
5.13 For all of these reasons, it is not surprising that theprovincial banks suffer from continual crises of liquidity, making theirrelationship with the Central Bank conflictive. The provincial banksreceived very substantial quantities of "rediscount" finance from theCentral Bank (in many cases, in the form of overdrafts), especially in1982. "In this way, the provincial banks have often served effectivelyto channel Central Bank resources to provincial governments. TheCentral Bank has tried to curb this credit flow, and largely succeededin doing so during 1988. . . Toward the end of 1987, for example, . . .the Central Bank temporarily suspended some provincial banks' overdraftfacilities on the grounds that they had abused them."' Even so, inSeptember 1988, the rediscount credit of the provinces (excluding theBank of the Province of Buenos Aires, by far the largest) amounted to62.3 percent of total financial system deposits, down by slightly morethan two percentage points from March 1987.
C. Recommendations
Develop a Plan for Financing Investment with Longer Tera Credit
5.14 At a minimum, the provinces should take action to once againgenerate a surplus in their current accounts that they could use tofinance investments. More careful longer term planning, as discussed inChapter VII, could lead to longer term financing either from public orprivate institutions, especially for projects where cost recoverythrough user charges is feasible.
Study the Role of the Provincial Banks
5.14 The present and future role of the provincial banks shouldalso be analyzed, as should their relationships with the provincialgovernments and with the Central Bank. While it is legitimate forprovincial banks to have access to the liquidity rediscounts of theCentral Bank, they should not use them to finance the fiscal deficita ofthe provincial governments.!A The improvement of prudential regulationshould be made a condition of further access to Central Bank liquidity
11/ World Bank, "Financial Sector,' Annex Chapter IV of Argentina:Reform., op. cit.
idem.

- 80 -
discounts. Provinces issuing their own "money" should not receive anyform of assistance from the Central Bank.
Improve the Information Systerm on Debt
5.15 The information system on the debt of provincial governmentshould be improved to provide detailed information on all of the sourcesof short- and longer-term financing. Both the direct and indirectadministrations should be covered. Furthermore, in terms of short termcredit, the data should show: for what the payment is ow,ed (i.e.,personnel, social security, suppliers, contract services) and to whom itis owed (municipalities, decentralized entities and the NationalTreasury, national public enterprises, private firms, etc.), and if itis in arrears. This system would permit a much clearer analysis ofarrears, which most officials recognize as a serious prcblem but onethat is now very difficult to study due to the lack of adequate data.There should also be up-to-date information on the total stock of debtof the provinces by source, including guarantees.
A Long-Term Strategy to Provide Private Financing
5.16 Private financing for public sector investment: at the sub-national level is unlikely to become available in the short or evenmedium run, given the exceedingly high rates of inflation in recentyears. Nevertheless, there are a number of initial steps that might betaken in the direction of establishing the access of sub-nationalgovernments to private capital markets, as is the case i.n many developedcountries. Studies could be done as to how sub-nationa]. governmentsobtain financing in these countries, as well as how these marketsdeveloped. This study might also include contacts with firms that docredit rating for state and municipal governments in the United Statesand other countries. Clearly, these concerns are for the long run, butthe cost of beginning to analyze and discuss ways of increasing theaccess of sub-national governments to private financing is relativelylow, and the potential returns quite high in the long rtn.

- 81 -
VI. BUDGETING. EXPENDITURE PLANNING AND IMPLEMENTATION
A. A Normative Introduction
6.01 A modern public budgeting system should be a mechanism forselection of ends and means. As such, it should be an instrument forpolicy implementation and for political accountability, as it makestransparent expenditure priorities and the strategy for financing thesepriorities. In general, the budget may serve three basic functions:control; management; and planning.Z'
6.02 The control function of budgets serves primarily anaccountability purpose. Approved budgets designate legal expenditures.These expenditures usually are authorized for use by a specific agency,department or other organizational unit. The revenue account from whichthese expenditures may be drawn also should be specified. Theexpenditure authorization generally also specifies the approved lineitem for which expenditures may be made, i.e., personnel, goods, works.These line item accounts also are called "objects of expenditure". Anaudit normally accompanies any expenditure to insure that the authorizedperson or organizational unit has approved the expenditure, that it wasfrom a legally authorized account, and that it was for a legallyauthorized line item or object of expenditure. Used for these purposes,the budget, accompanied by the audit process, serves to control thelegality of any expenditure and the source of funds.
6.03 The management function of a budget requires, in addition tothe information needed for control noted above, information on the workbeing carried out by each organizational unit. A budget serving onlycontrol purposes could insure that no unauthorized personnel were hired,but it would provide no information about the nature of the workperformed by them. A budgeting system that includes workload, oroutput, measures, as well as budget line items, helps to evaluateexpendíture efficiency, and it is often described as performancebudgeting. The focus on performance results from linking outputs toresource uses.
6.04 For budgets to perform a planning function, they shouldinclude information on the purposes of expenditures. For example,program goals may include reducing adult illiteracy from 20 percent to10 percent and improving rural road maintenance so that all farms have
23/ For a broader discussion of these functions, based on case studiesin several developing countries, see James S. McCullough, et.al.,Urban Financial Management Phase I: Case Studies and Analysis,Research Triangle Institute, August 1982. For a general discussionof public sector budgeting, see Robert D. Lee, Jr. and Ronald W.Johnson, El Gobierno y la Economía, Mexico D.F.: Fondo de CulturaEconomico, 1977.

- 82 -
access to markets at least 350 (days per year. If these goals areincluded in the budget, then ex post evaluation improves politicalaccountability and indicates areas of satisfactory and unsatisfactoryperformance. Or, analysis of tlhe budget during its preparation orduring execution may indica-te tihat the budgeted resources will beinsufficient to meet both these goals. This insufficiency may be theresult of revenue shortfalls and/or expenditures that are not beingefficiently managed. This lprogram, or functional, evaluation would notbe possible if only control, or only control and management, informationwere available.
6.05 The remainder of this chapter uses the above normativeframework to assess the current status of budgeting, expenditureplanning and implementation in Argentina's provinces. After thisassessment, an agenda for improvement is discussed.
B. Assessment of the Current Situation: Budgeting
6.06 Current budgeting practices generally fall far s,hort ofadequately performing even the control function of the budlget, much lessmanagement and planning functions. Thus, top priority in the short runfor improving provincial budgeting must concentrate in prcvidíng anadequate base for the control of revenues and expenditures, with a viewto laying the groundwork for expanding the budgetary proceiss to includemanagement and planning. This section assesses provincial. budgetaryprocedures, focussing on the key areas that most contribute toinadequate control performance: inflation; weak budgeting institutions;lack of political commitment to the budgeting process; inc.ompletecoverage and presentation; slow and inadequate registration andreporting; and insufficient internal and external controls,.
Inadeauate Strategies for Handling Inflation
6.07 The lack of an adequate strategy for dealing wit:h inflationleads to a number of important distortions in the budgetary process,including: the approval of the budget during or even after the fiscalyear, serial budgeting and discontinuities in budget execution.
6.08 Provincial budgets are normally not approved until the middleor even toward the end of the fiscal year. For example, over the lastfive years the Province of Buenos Aires approved its budget by thebeginning of its fiscal year only once (1987) and from 5 t:o 12 monthslate during the other four years. Obviously, the budget cannot be aninstrument of control if it is not done until the fiscal year is almostover.
6.09 High inflation makes budgeting a serial process., Budgets areusually prepared and approved in nominal terms. As inflation rises,authorizations for expenditures are exhausted well before the end of thefiscal year. Thus, the executive branch must prepare a proposal for a

- 83 -
budget change and send it to the provincial legislature. The result isa kind of "serial budgeting" in which several budgets may be prepared inany one fiscal year. To reduce the number of budgets per year,provincial officials delay the submission of the budget, sometimes untilthe last month of the fiscal year. Serial budgeting is, therefore, theresult of an inadequate strategy for dealing with inflation. The lackof a systematic means of dealing with inflation also results indiscontinuities in budget execution, such as across the board cuts,slowdowns in disbursement and postponements in public works. All ofthese can seriously reduce the efficiency of resource allocation.
6.10 There are several ways currently being used to deal withinflation in budget programming, execution, and control. One commonmethod has been to budget on the basis of prices prevailing or expectedto prevail at the begínning of the fiscal year, and then to adjust by aforecast of inflation for the year. Another method is to estimate thebudget according to prices projected for the middle of the fiscal year.Or the budget may be done at prices of the beginning of the year with alump sum adjustment for inflation.
6.11 Finally, an interesting new strategy has been adopted inrecent years by some of the provinces. The budget is prepared innominal terms, but indexed by total monthly or quarterlv revenues. Inother words, the executive branch can increase the total amount ofbudget expenditures authorized in proportion to the excess of revenuescollected over the budget estimate. A criticism of this method is thatit gives considerable leeway to the executive branch and thus reducesthe control and orientation role of legislature. Also, given thesituation in most provinces, where the legislatures approve the budgetlate or even at the end of the fiscal year, this approach may not havepractical relevance.
6.12 The approval of budget figures in nominal terms gives programmanagers strong incentives to do all purchasing as early in the fiscalyear as possible, generating uneconomic stocks. At the same time, thesemethods penalize programs that have to execute their budgets in thefinal months of the year, or programs whose execution is delayed,sometimes by reasons beyond their control.
6.13 Tying expenditures to revenues avoids some of the seriousshortcomings of the previously described methods. The problem is thatrapid increases or, more likely, declines in real revenues can seriouslydistort the original budget, as they represent across-the-boardincreases or cuts. The legislature might prefer to respond to a declinein revenues to scale back one sector or cut one big project, rather thanacross the board cutbacks. The method is really just aninstitutionalization of the "pay as you go" approach already used inmany provinces, which can result in the slowdown of all projects,shortages of critical materials, and other distortions.

- 84 -
6.14 Budgeting in real cost terms has been proposed but neverimplemented by any province. Under this system, budget expenditureswould be estimated at prices Iprevailing at the time of budgetpreparation, but adjusted periodically for inflation (every two, three,or four months), using ones or a combination of price indices. Aproblem with this approach is that revenues are reported on a cash basisand are not indexed. Unspent revenues may, of course, be deposited inindexed and interest-bearing accounts, but there is no assurance thatrevenue indexation and interest payments will keep pace with expenditureinflation.
Weakness of the Budgeting Off [ces
6.15 Central budget offices of the provincial governments usuallyexert little influence over resource allocation as they lack analyticalcapacity and political "clout" to significantly influence resourceallocation. Generally, they just keep records and generate budgetfigures (frequently ex post) as dictated by those responsible for thedifferent centralized and decentralized entities. Budget preparation isa top down exercise with Little effective participation of programmanagers. The budget offices in the different centralized anddecentralized departments are normally even weaker than the centralbudget office in terms of bot]h analytical capacity and decision makingpower.
6.16 Computational support for the central budget office variesgreatly among the provinces. Most have weak support. Santa Fe, however,has an information system that is centralized at the General AccountingOffice with computer termínal,s in the budget offices as well as forother users. In general, the decentralized agencies are better equippedthan centralized agencies.
Lack of Political Commitment to the Budgeting Process
6.17 Budgeting is generally incremental (even to the extent of jusitusing the budget for the previous year) with little or no analysis ofpriorities, past performaince, cost effectiveness, etc. The forecastingof revenues is done by rudimentary methods, frequently relying on poorinformation and inadequatts forecasts of general economic conditions.Revenues are sometimes pu-rposely overestimated to obtain the approval ofexpenditures that could not be justified if more reasonable projectionswere used.
6.18 Expenditures are also estimated incrementally. For example,personnel expenses are projected on the basis of existing number ofemployees and the expected increase in salaries with somfe allowance foradjustments required in specific cases. Expenditures proposals forpublic works, as estimated by the Ministry of Public Works, often proveto be gross underestimates and rarely take into account the costs ofoperation and maintenance (paras. 6.38-6.41).

- 85 -
Incomplete Coverage and Presentation
6.19 The provincial budgets do not cover every category of publicexpenditure nor all of the entities of the provincial public sector . 74
For example, the tax credits that some provincial government give toprivate firms to endorse government activities in their advertisementsare not recorded in the budget. Provincial banks collect provincialtaxes, receiving non-interest bearing bank deposits from the government.However, neither a tax collection fee nor the interest that thegovernment loses from these deposits are recorded. Tax exemptions arenot recorded, such as those connected with industrial promotion.
6.20 In some cases the budgets of decentralized entities areconsolidated as part of the central budget, while in others they areshown as part of the central budget, but with their accounts keptseparately.
6.21 Most budgets include a list of public works, while others showonly overall amounts for major line items. In many cases, the budgetshows the number of employees per ministry and category. In a few cases,a classification by programs has been introduced, but only partially.The province of Cordoba, for example, has included quantitativeinformation about budget targets for several prograns.
Slov and Inadeguate Registration and Revortin2
6.22 The registration and reporting systems are of little help inthe monitoring and control of budget operations. Even though theGeneral Accounting Office in the Provincial Ministry of Economygenerally registers all government operations, the information takes solong to flow back to the executing agencies that most entities keeptheir own records.
6.23 In general the closing balance of public administrationaccounts is completed with great delay. For example, the accounts ofthe Province of Buenos Aires for 1988 were not ready by July of 1989.Budget figures corrected for inflation in general are not presented, socomparisons are difficult. The financial statements of assets andliabilities of institutions are seldom published. Normally, the closinggeneral balance does not analyze or evaluate budgeting accomplishmentsor problems. Perhaps because of these shortcoming, the legislature hasshown very little interest in examining these balances. Furthermore,many expenditures accrued during the last months of the fiscal year arepaid during the first months of the following fiscal year, causing anintermingling of budget reporting.
1~4/ For a discussion of the coverage of the entities of the public sector,see Chapter I, paras. 1.16-1.19, and Annex Chapter I, Section C.

- 86 -
Insufficient Internal an¿l External Control
6.24 The Provincial Tribunal de Cuentas is normally responsible fcirexternal and sometimes internial auditing. Usually, this is done in apurely legalistic manner with no checks for cost effectiveness.Internal auditing is generally even more deficient.
C. An Assessment of the Current Situation: ExT>enditure Planning
6.25 Because of the generally chaotic process of budget formulationand execution, resulting in a lack of predictability and control forboth revenues and expenditures, there is no real planning ofexpenditures, and most provínces face a continuous cycle of "pay as yougo" with receipt of reveniues. The predictable results include haphazarddecisions on priorities i'across line items as well as between newinvestments and maintenance of existing investments), paralyzation ofworks, and cost overruns. With such waste in expenditures, it shouldnot be surprising that many citizens may resist payment of taxes andfees. Thus, an area of high priority for provincial financialmanagement is that of improved expenditure efficiency. It may well bethat a transparent process of efficient expenditure planning andexecution, with clear political accountability, may be a prerequisitefor sustained improvements in provincial revenues. Indeed, thesuccessful implementation of the "social contract" for many people mayrequire that sacrifices in private consumption (payment of taxes) mustbe clearly compensated for by the benefits provided through receipt ofpublic services financed by taxes.
6.26 The current status of expenditure planning is examined in thissection in two broad categories: investment planning; and planning formaintenance of existing investments.
Investment Plannin2
6.27 Institutional organization. Planning and budgeting arenormally carried out by different entities. In additicon to planning,the planning offices often carry out a variety of other activities, su,chas statistical analysis, provision of data, and coordination oftechnical assistance functions. In the case of Neuquen, the planningoffice examines and approves requests for industrial promotionincentives. In general, these central planning offices exercise littleinfluence over resource allocation, as they are equipped to provide onlyvery rudimentary information. and guidelines for project preparation.
6.28 Planning and programming offices also often exist in theexecuting agencies, especially in the larger provinces. However, thecapacity of these offices has declined greatly in recent years for thesame reasons discussed above regarding personnel (Chapter IV, paras.4.03-4.07). Furthermore, the links between the central programmingoffice and the different sectorial offices are practically nil.

- 87 -
Investment planning generally is done without reference to an overallplan. While Santa Fe has a three-year investment plan, it is uncertainwhether it will be implemented due to recent changes in the planningstaff. A notable exception may be the Province of Buenos Aires where athree-year investment has been prepared. In all cases, the earmarkingof federal funds constrains resource allocation, most importantly forhousing and road construction. In some cases, provincial laws alsoearmark funds for specific purposes, such as irrigation or roads.
6.29 An Overview of Investment Decisions. As a general procedure,the investment planning entities of each Provincial Ministry identifyprojects and make preliminary cost estimates, but without clear criteriafor establishing investment priorities. The resulting lists arediscussed in a cabinet meeting where they are matched against politicaldemands. The finally agreed list of investments constitutes theprovincial investment plan and is then detailed and included in thebudget.
6.30 The decentralized agencies are more independent in that theyhave theír own sources of funds and also receive resources from nationalgovernment agencies. Their investment plans, however, in general aremere collections of projects, with no mid- or long-term perspective onprovincial development.
6.31 Prolect Identification. Preparation and Selection. Projectidentification varies among sectors, but in general there is nostandardized method within a province to maintain up-to-date records onpotential investment projects. Each ministry, and even each sectorwithin a ministry, has its own project inventory system. The updatingof the inventory is largely dictated by the needs of particularcircumstances which are often influenced by the prospects ofavailability of financing. National and provincial earmarking may exerta powerful influence (para. 6.36).
6.32 Some agencies, such as those for road construction orirrigation, have satisfactory inventories of proposed projects,consisting of a rough estimate of cost and a brief description of theproject. However, there generally is no systematic effort made toidentify priority projects for selection.
6.33 In the vast majority of cases, there is no economic appraisalof projects, although there may be a superficial analysis about theireconomic advantages, mostly in qualitative terms. Even if provincialauthorities would like to consider economic efficiency indicators inorder to rank projects, they generally would be unable to do so becausethe essential information is not available.
6.34 Project proposals tend to have poorly prepared financial plansthat frequently do not take into account the costs of operating andmaintaining the project. The trade-offs among alternative means offinancing are not taken into account. Furthermore, technical

- 88 -
feasibility studies are often inadequate, causing significant costoverruns (see paras. 6.45-6.53).
6.35 The institutional base for preparing projects is very weak.The low remuneration of professionals in the public administration havereduced the quality of project identification and preparation. This hasbecome particularly acute over the past year. Thus, the investmentpipeline is now short of projects, and the selection of projects forpreparation is not systematic. Neither the institutions with animportant role in investment implementation, nor the central agenciessuch as Ministries of Planning or Finance have an installed capacity tomake economic analyses of proposed projects. Only rare exceptions can befound. The Ministry of Public Works of Santa Fe, for example, isestablishing an office to formulate and evaluate proposedL projects andable professionals have bean appointed.
6.36 A substantial portion of provincial investment depends onearmarked taxes or funds transferred by the federal gover-nment.Discussions about priorities among sectors, in these caseIs, has littlerelevance. Even within a given sector with earmarked firLancing,priorities generally are assigned without considering eccnomic criteria.Road construction departs, in part, from this pattern since trafficdensity is used as an indicator to decide project priorit:ies. However,other earmarked investments, like housing, have lacked c].early definedcriteria for resource allocation. Provincial enterprises generally maketheir own selection of projects and negotiate for the necessaryfinancing directly with the provincial government.
6.37 Projects that are financed from general purpose funds sufferfrom the same lack of economic and financial analysis necessary forestablishing priorities. Furthermore, they are also severelyconstrained by the shortage of non-earmarked or provincial own-sourcefunding.
Planning for Maintenance of Existing Investments
6.38 With the exception cf Neuquen, there is no systematic planningof preventive maintenance in the provinces visited.15 In the centraladministration, the splitting of maintenance responsibiliLties among thesectoral ministries hinders bo,th preventive maintenance and thegeneration of consistent maintenance records. These records would bevery important for: (a) the studies needed in order to establish therelationships between the type! of investment and the resultingmaintenance needs; (b) the development of maintenance plans, (c)improvements in future designse and specifications, and (d) greaterprecision in the yearly bu.dgeting of maintenance costs. When
15/ In Neuquen, a study was done of the cost of maintaining schoolbuildings. The maintenance was then contracted out to private firms.

- 89 -
maintenance needs are not known, new ínvestments may be undertaken, thuscausing increased deterioration of the maintenance of all investments.
6.39 The decentralized agencies, although more prepared to performtheir maintenance tasks, are confronting other kinds of problems. Insome provinces, they are still having difficulties in maintaining watersupply, electricity and road systems that were transferred to them indeteriorated state by the Central Government. For example, the entirewater supply network in the central area of Rosario, Santa Fe Province,must be rebuilt, and some roads are beyond repair. In addition, withhyperinflation the tariffs and fees have eroded in real terms, making itdifficult to fund adequate maintenance-(see Chapter III, para.3.08).This is particularly true of the water sector but also applies toelectricity.
6.40 The provincial roads, 70 percent of which are unpaved, receiveonly very superficial maintenance (bacheo) due to the lack of funding.The resources from the Federal Highway Fund (Fondo Vial), established in1958 with shared national taxes, have dropped to only 30 percent oftheir real value in 1958.
6.41 In the face of the very serious deterioration of provincialinvestments and of severe financial constraints, there appears to be agrowing awareness among provincial officials of the need for a revisionof provincial maintenance policy. For example, the three-year plan forSanta Fe calls for emphasis on repair and maintenance.L7«
D. Assessment of Current Situation: Prolect Execution and Procurement
6.42 The Public Works Laws of each of the five provinces studied(Buenos Aires, Santa Fe, Cordoba, La Pampa and Neuquen) establishprocurement procedures for works of the general administration. TheseLaws are similar across provinces, because they are based on NationalLaws as models.77 Provincial Public Works Laws usually do not cover thedecentralized agencies, such as energy and water companies, which areregulated by their own laws, frequently modeled on their respectivenational entities. Finally, goods and services are generally procuredunder the Accounting Law (Ley de Contabilidad).
6.43 Instead of the lowest evaluated price criterion for bidselection, the procurement laws generally specify that the mostconvenient offer from the administration's point of view be selected.Furthermore, in the five provinces visited, only in Buenos Aires and
26/ Santa Fe Province, Plan Trienal 1989-91, p. 123.
17/ Law 13064, (Ley de Obras Publicas) and Law 12961 (Ley deContabilidad).

- 90 -
Neuquen must officials justify their decision not to select the lowestbid. Clearly this proce,dure is open to abuse.3
Uv Argentina and BUY Pr2yince Legislation
6.44 All provinces except San Juan have adopted the Buy-Argentinalegislation, and seven have Buy-Provincial legislation (Jujuy, La Pampa,San Juan, Catamarca, Santiago del Estero, Formosa and Chaco) thatrequires them to provide a certain margin of preference to nationally orlocally produced goods. In La Pampa, for example, the "Compre Pampeano"rule allows a margin of 3 percent. In other words, a blid from a firm inLa Pampa could be selected if it were up to 3 percent higher than thosefrom "outside" firms. This legislation reduces competition and,therefore, general economaic efficiency.2w
Cost Overruns
6.45 Cost overruns are frequent, resulting primari.ly from errors indesign specifications, creating the need for changes duLring theconstruction, and/or from design changes due to the deficient initialevaluation of needs and characteristics of the project. Designadjustments, and resulting cost overruns, frequently are encouraged byPublic Works Laws that permit the bid price to be adjusted to cover thecost of the design changes. This may be done through siimpleadministrative procedures without any contract re-negotiation. In fourof the five provinces, the laws permit cost overruns of up to 20 percentfor each change through these simple administrative procedures. In LaPampa, this limit is 15 percent. Only Buenos Aires andL Neuquen haveestablished the upper limit on total allowable cost increases of 50percent over the work's originally estimated cost.
6.46 There are no formal studies in the provinces to estimate costoverruns due to design modifications.5 However, proviiacialadministrators estimate these modifications add about 20 percent forpublic buildings (e.g., schools, hospitals and administ:rative offices),and about 40 percent for hydraulic works (storm sewers and drainage).Cost overruns for roads appear to be even higher, but reliable estimatesare not available.
Z.D In the cases of World Bank financing of provincial projects (WaterSupply, Housing Sector and Municipal Development) provincialprocurement legislation has been amended to make it compatible withWorld Bank Procurement Guidelines.
22/ For a fuller discussiori, see: The World Bank, Argentina: Reforms,op. cit., Annex Chapter VI, para.6.11.
¡Q/ The Province of Buenos Aires is now doing a stucly of this for the1987-88 period.

- 91 -
6.47 Although the contractor is responsible for any errorsresulting from failure to interpret project plans correctly, thegovernment is responsible for the plans per se. If the contractor findsan error in the plans and notifies the Administration of this before thecommencement of the works, the prevailing procurement laws establishthat the designs or materials must be changed and the eventualdifference in costs must be paid to the contractor, including costs dueto resulting delays (gastos improductivos).
6.48 In addition, the Laws provide that if the cost difference dueto design errors and changes is more than 20 percent above the bidprice, the contractor or the Administration may negotiate a completelynew price for the total work. If this new price is not agreeable to thecontractor, he may cancel the contract. This puts pressure onprovincial officials to reach an agreement in order to avoid the delayand other costs of a new bidding process.
6.49 Very high inflation also has caused cost distortions, as wellas controversy. From 1984 through May 1989, the cost of constructionindex rose by over 88,000 percent, according to INDEC, versus 194,940percent according to the Camara Argentina de la Construccion. Withinflation running at an average of 350 percent per year over 1984-88,the methods used in adjusting costs for inflation are of tantamountimportance. However, with such high inflation, estimates are notreliable, and inflation indexation appears to be contributingsignificantly to construction costs.
6.50 The bid price of the civil work is composed of unit costs fordifferent items that are in turn specified as different products andlabor. Every month the Price Variations Departments (Departamentos deVariaciones de Precios) in each province do a survey to determineproduct and labor costs. As these departments are generally under-staffed and under-equipped (e.g., 2 people and no computer in La Pampa),these surveys often leave much to be desired. Furthermore, the numberof prices studies varies widely from one province to another (110 itemsin La Pampa Province and almost 500 in Santa Fe Province, just forbuilding construction).
6.51 With the exception of Neuquen, none of the visited provincessurvey the costs at the point of origin for items produced outside theprovince, in order to verify if there is a difference higher thantransportation cost between the local cost and those of other productioncenters. Generally, the provinces make lists for only the capital andone or two other important cities. In Neuquen, the ProvincialDepartment of Architecture is responsible for construction of mostpublic buildings, and it studies prices for provincial sub-centers, aswell as those in other provinces, taking into account the cost oftransport to the construction site.
6.52 The study of prices usually is done during the last five daysof each month. The results are submitted for approval to a provincial

- 92 -
council, in which the Argentina Construction Chamber (Camnara Argentinade Construccion) has a seat. In some provinces the official priceadjustment list is matche¿l against a list presented by tlhe ArgentinaConstruction Chamber's local representative and an agreemnent between thetwo lists is negotiated.
6.53 These conditions and procedures result in a lack ofobjectivity in costing est:imates that appears to have a strong upwardbias in the final costs of public works. The longer the delay, thegreater the tendency for cost increases. The delay betwasen contractsigning and the initiation of works averages about six mronths, whilethis gap usually should not exceed two months.
Project Monitoring
6.54 Although no overall system for monitoring project executionexists, practically all agencies have certain rudimentary procedures tofollow up the financial and physical aspects of projects. In general,monitoring is a necessary step for payment purposes (certification), andLit includes visits or eva]uations made by inspectors to the projectsites. Each agency usuall.y prepares a monthly report with theinformation about progress; of the project and brief commiants on the maindifficulties or reasons fcor delay in construction.
6.55 Within each province, and even within each provincialministry, these procedures: differ. No attempt has been made tosystematically identify the main causes of execution del.ays and toderive lessons learned frcom problems, leading to implementation of asystem to trigger appropriate corrective actions when a particularproblem appears.
E. An Agenda for ImtProving Expenditure Planning anid Budgeting
6.56 Each province should prepare a carefully designed plan toimprove its budgeting and planning process through coordinatedimplementation of legal, procedural and administrative reforms.Institutional reform should begin with a fairly detailed analysis of thecore activities of the budget and planning functions which shouldidentify the key problems in terms of organization, staffing, andinfluence of central and sectorial budget and planning offices. Next,the legal framework for budget; and planning should be revised to permitthe integration of the annual budget with a medium term iexpenditureplan, as well as monitorirng of performance in terms of targets. Theplanning and budgeting process should include those involved in theplanning and delivery of siervi.ces. Program managers should participatein budget discussions to establish links between planning and the budget:from the outset.
6.57 The implementation of these reforms may require externalassistance in many provinces. The necessary experience to put some of

- 93 -
the reforms into practice might not be readily available in governmentalcircles. In addition, government officials working on day-to-daybusiness usually find it difficult to allocate the time needed to designfundamental reforms.
6.58 A substantial portion of actions should be specific for eachprovince, but others will be common to several provinces. In the lattercase, it is advisable that a small group within the Central Governmentbe formed to develop methodologies and to provide technical assistanceto provinces needing it.
Bud2etary Process
6.59 There are some changes that should be adopted immediately toimprove the budgeting process. First, a more systematic way of dealingwith inflation must be adopted. Second, the central and decentralizedbudget offices should be strengthened by giving them greater authorityin budget preparation, improving their information systems, and up-grading their personnel. Finally, the annual budget should be part of amedium term expenditure plan. The innovative budgeting system recentlyimplemented in the Province of Mendoza incorporates all of theserecommendations (See Box 6.1 at the end of this Chapter).
6.60 AdoRt a Strategv for Dealing with Inflation. The Province ofMendoza employs a very sophisticated strategy for dealing with inflationin its budgeting system (See Box 6.1). As the budget is now expressedin physical as well as monetary units, the budget office can continuallyadjust budget allotments to current prices, using actual market prices.However, it approves expenditures only if revenues are sufficient tocover them. This equilibration of expenditures and revenues does notrequire approval of the legislature. The opposite of this strategycould also be used: expenditures could be adjusted monthly or quarterlyby the rise in revenues, but with an option for review by thelegislature, if total real expenditures rise or decline by a percentagedefined in the law. For example, the legislature could specify that itwould have the option to review the budget, if total real expenditureswere 20 percent higher or lower than those predicted for the timeperiod. Yet another option would be to approve contingency measures foreach of these eventualities as part of the budget.
6.61 Another approach would be for the executive to preparecontingency plans that would be approved with the budget law. Thesewould go into effect if declines in revenues caused expenditures to dropbelow or exceeded certain real levels. For example, in the case of adecline, the law might define projects that would be cut in case of arevenue shortfall.
6.62 The price index or indices would, of course, be defined in thebudget law. However, in most cases, the average of the retail andwholesale price indices would be sufficient.

- 94 -
6.63 The suggested methods for equilibration of reaL revenues andexpenditures (para. 6.60) hold several advantages over the traditionalmethod. The executive branch can avoid going back to the legislature,and the legislature does not lose control, if budget execution moveswithin the methodology for adjustment defined in the budget law. Italso reduces the incentive for bunching public expenditures at thebeginning of the year, as well as the penalties imposed on programswhere expenditures are concentrated at the end of the year.
6.64 Stren2then Budgeting Offices and ImRrove Procedures. Thecentral budget office should be strengthened and appropri.ate linksbetween this office and the budget offices of all ministries andagencies should be establishedl.
6.65 The strict budget quotas for each ministry based on theallocations of previous years should be replaced with upper and lowerlimits (i.e., resource envelops) that permit changes in allocations inaccord with the priorities of the government. The current practice ofestablishing quotas very early in the preparation phase reduces themargin of conflict on budgetary matters among ministries and agencies,but it also tends to freeze relative shares.
6.66 The díscussion of these "envelops` budget shou]d include thecentral budget office, the upper level authorities of the FinanceMinistry, and representatives from each executing entity. Only afterthe resulting information 'has been gathered and analyzed should adistribution of funds among ministries and agencies take place.
6.67 Such a process of analysis and discussions wou].d require thatthe central and sectorial *budget offices be strengthened in terms ofpersonnel and computational facilities. The budget officet should beprepared to help policy-makers cope with uncertainty by preparingalternative budget strategies corresponding to different financialscenarios.
6.68 Rather than trying to immediately implement prcgram orzero-base budgeting, emphasis should be on improving the quality of thedialogue about the budget lby enriching the analysis of pa.st programperformance and costs. This would permit a gradual move away fromincrementalism and towards progranmming techniques suitable toidentification and measurement of costs and relatíng them to results.
6.69 Increase the Coverage of the Budget and Information Systems.Including the budgets of public enterprises in the budget document, andeven consolidating them into tlhe budget accounts, does not necessarilymean that these enterprises would be included in the budgetary processper se. The advantages of including them in this process should beweighed against the disadvanta,ges. The advantages are found in improvedcontrol and better information for monitoring the overall performance ofthe public sector. However, including all decentralized agencies in thebudget, unless specifically lejgislated otherwise, would subject them to

- 95 -
the same procedures and regulations for disbursements that apply to thecentral government.
6.70 For some agencies this would result in additional rigiditiesand bottlenecks which would seriously impair their operations. A betterway of controlling these entities might be registration of all paymentsand receipts between the agency and the governrent, with controls overborrowing and an effective information system on performance. In allcases, however, investment proposals of decentralized agencies andenterprises should be subject to the same economic, financial and otherappraisal criteria as other provincial governrnent investments.
6.71 Make the Accounting Svstea an Effective Tool for Management.The accounting offices should be streamlined and organized to provideinformation useful for management as well as control as quickly aspossible. This should eliminate the need for duplication of accountingprocedures.
Ianrove Investment Planning
6.72 ImDrove the Project Cvcle. A project planning andimplementation system should insure that a number of projects, with thetotal number of projects examined exceeding the expected investmentpotential, reaches the office where decisions are taken and where thebudget is prepared. To assure comparability, uniform guidelines shouldbe used in project preparation. The project cycle, from the originalidea, to the development of the pre-feasibility studies, and to theevaluation and inclusion of the project in the plan, must be simple toallow for rapid decisions. Moreover, the system should provideinformation which makes the investment plan flexible vis-a-vis changesin economic circumstances or budgetary conditions, while at the sametime ensuring proper continuity in the investment process.
6.73 There should be a strong link between project formulation andimplementation. The central programming office should be in charge ofpreparing guidelines for project preparation and evaluation and toadvise other agencies about the appropriate techniques for projectanalysis. Close links should be established among this office, thecentral budget office and sectorial project offices. Sectorial projectoffices should be in charge of preparing and analyzing proposed projectsof the sector. They should work in close cooperation with technicalareas to identify investment opportunities and to analyze alternativetechnical solutions to a given problem, and also with the sectorialbudget office.
6.74 Project Identification. Greater attention should be given toproject identification to put some order in the investrent procesa andto allow new opportunities to be tapped. The benefit/cost ratio ofallocating some resources to this activity is high. In some sectorswhere the present level of information is rather poor, efforts should beconcentrated on developing a good bank of projects.

- 96 -
6.75 The availability of profiles of proposed projects would permita ranking of project studies,, and thus avoid studying projects that areunjustifiable because of low expected rates of return. This processshould also weed out unpromising proposals at an early stage.Frequently, once a proposal has gathered support from interestedparties, it is difficult to stop it. Projects with poor profitabilityprospects at their outset: should be discarded early in the process.More rigorous identificat:ion procedures would help to achieve this. Itwould also avoid rushed approvals when funds suddenly become available.
6.76 Prolect PreparationI and Evaluation. The preparation ofproposed projects could bte improved by strengthening thes programmíngunits of the implementing agencies and the central programming units, bydeveloping better links betwe-en central and sectorial programming units,and by the adoption of standard guidelines. As a minimum first step,profiles should be prepared for each project. One way of implementing animproved project formulation process is to require this information atthe time of budget preparation. All projects should be evaluated usingsimilar assumptions about macroeconomic variables. Simple guidelinesstandardizing the basic a.ssumnptions would greatly facilitate projectpreparation and appraisal.
6.77 A possible solution for a general lack of appropriate projectsis to have a pre-investment facility through which would quickly channelresources for project preparation in sectors that are irmportant fordevelopment, but are weak in their capacity to produce projectproposals. For example, a substantial concentration of resources mightbe needed at the beginning ir. the case of a developmentally importantsector that lacks the capacity to generate sufficient projects. Once agood stock of projects has been developed, the need for pre-investmentresources may be reduced. In summary, the pre-investment facility wouldeliminate the need to create in-house capacity in each agency, which mayprove difficult to dismantle at a later stage.
6.78 Benefit/cost indica.tors of all projects should be compared,and financial projections should be made of all investment, operationand maintenance costs, with sources of funding identifies, and committedwhen appropriate. Adoption of a multi-annual budget is an importantstep for ensuring the financial sustainability of proposed investments.
6.79 Decentralize Where Cost Effective. There is evidence thatdecentralization of the execution of public works in marty cases resultsin cost savings. The decentralization experiences in the Provinces ofBuenos Aires and Neuquen showed approximately a 20 percent reduction inthe cost of housing projects when administered by municipalities.Technical assistance provided by provincial agencies has been veryimportant in developing local administration expertise and inencouraging the participation of small local firms. Neuquen Province isextending this experiment to the construction of school buildings.

- 97 -
Introduce Preventive Maintenance Planning
6.80 A new maintenance policy should contemplate: (a) theintroduction of maintenance plans based on maintenance cost studies doneby each responsible agency but accessible to all government agencies;(b) transfer of the maintenance duties for those province-ownedfacilities now maintained by their respective ministries to theProvincial Ministry of Public Works or to the private sector; (c)improved cost recovery from tariffs and fees to fully finance operationand maintenance, and (d) studies to examine the maintenance costs ofalternative design standards or of equipment types in order to modifyfuture designs and equipment specifications.
Improve Prolect Execution and Procurement
6.81 Most administrators in the five provinces visited (BuenosAires, Neuquen, La Pampa, Cordoba and Santa Fe) agreed that improvementsin purchasing procedures could cut at least 15 percent in constructionexpenditures and 10 percent in goods and services expenditures with noloss in quality. Hence, the savings for all provinces in 1986 wouldhave amounted to US$230.0 million in construction and to US$95.0 millionin goods and services for a total of US$325 million, excludingprovincial public enterprises, about 0.5 percent of GDP which wouldcover 35 percent of the overall 1986 provincial deficit.
6.82 Improve Bidding Procedures. The provincial government shouldmake project specifications clear and explicit before bidding to permíta comparison of consistently presented offers. The lowest evaluatedDrice criterion could, then, be transparently applied.
6.83 Abolish BUY Argentina and Buv Province Legislation. Toabolish the implicit subsidies to the private sector and reduce costs,the Buy-Provincial legislation should be eliminated, and the Buy-Argentina law modified to allow foreign competition in bidding forcontracts.
6.84 Cut Cost Overruns Due to Design Errors and Changes. ThePublic Works Laws should be modified to reduce cost overruns as much aspossible by: clearly defining the responsibilities of contractorsregarding the detection of design errors and theír discussion with thegovernment authorities before the bidding; and clear attribution ofresponsibilities for errors and consequent penalties to public employeesand hired consultants. The process of establishing specificationsshould be improved so that the they are correct and precise, therebyavoiding changes during execution.
6.85 ImDrove Estimates of Inflation. INDEC or a neutral outsideentity(ies) should be contracted to do the survey of construction pricesusing a scientific methodology for all provinces or for groups of them.Prices in other provinces plus transportation costs should also beincluded in the analysis to assure that prices are not just reflecting

- 98 -
imperfections in the provincial markets for construction materíals. Incases were intra-provincial variations in prices are great, pricesshould be studied. Microco¡nput,ers and adequate software should beprovided for those charged witlh doing this evaluation.
6.86 Establish an Information System on Prolects Costs. Theinformation about projects and their comparative costs should be easilyretrievable for past works, as well as those currently in progress orprojected. This system should cover both centralized and decentralizedagencies and would provide information on costs, project description,and the performance of the contractor. This information could be usedto do comparative cost studies of the different standards or solutionsadopted (including maintenance needs) for the same purpose by differentgovernment agencies in different provincial sub-regions. Theinformation system on publ:ic works should be improved to indicate wherewater, electrical, gas and drainage systems are located, as the lack ofthis elementary information may greatly increases project costs, becausein most provinces no one knows what will be found when the diggingbegins.
Enhance the Impact on Private Sector Investment
6.87 Strategies for enhancing the impact of public expenditures onprivate investment should be developed. Provinces should analyze theircomparative advantages or "vocations" for different kinds of activities(i.e., those that they couLd stimulate without subsidies), such as inthe primary sector as well as in industry and tourism. The resultingdevelopment strategies could serve as a substitute for IndustrialPromotion in which industri.es are induced at tremendous fiscal andeconomic opportunity cost t:o locate in places where they have little orno competitive advantages. The study should begin with an analysis ofthe components of the proviLnce's comparative advantage (naturalresources, climate, social and economic infrastructure, etc.), and,then, identify potential activities for investment and barriers to theirdevelopment. For example, the "vocation" of a province might beagriculture, but it lacks key transportation and storage facilities toassure their adequate deve].opment. The possibility of provision of suchinfrastructure by the private sector should always be analyzed.Possible forward and backward :Línkages should also be explored. Forexample, the highest priority might be irrigation, which could in turnproduce demands for processing of the increased production, as well asfor inputs. Ways of informing the private sector of these opportunitiesshould be developed.

-- 99-
:w::.....: -:: ¡...:, ..., '::_:'. .. ... �. . --- �...... 1.. � .� ... 1-�.I. - ... 1 1 �.., .. .. �. �. .. . -. -.. . ...... ... 1 ..... 1. �. � �... 1 1. .1 � ... 1. 1 1 1 1 1.. . � 1 �. �1 � .------ .. . 1...... .... . .--------- ... . .. --- ... ---. . ..... .... ... 1------ ... � "'-
1... 1.. ....... :::'::':_ . ..... . .......- ------ .... �.. . �.. . .... ' '--- .. ..... - ::: . ,: . .. --- --- ---......-.. 1. 41 ---. .... 1.., .....�..... .. �. 1 1. � �..:. - -::-:-:.-:: .: ::-:: ,: �,. ::': ......: :: _, ::;::.�: _:'::':::::::-'--'-- ----- .::,:�:.:.:,.��.,.,...,,...,.�.....�....,....,. ...�... .... --- 11 ...l... -�........�.� ... ------..... .I.,1:�.:.:........_ . :::-::,::.. -..-..-.-,.-,......l.....1....1.�............''..I-..:� :�. .. ... --- ' ' -.. 1. .: ;:.:..:. --::.-:::-'5:': 1....,..1�l..,.�,. .- .......�... --- .1 :.'::-- .........�..�.��. ..... ':::::':::.: :. -----.....: �. : .�, .. ' 1 ,- � -%,-.:::.�::.:�::�:.::::�::::,:�::::::�:::::::::::...:,'.-..- --. ��.-...:�...:�:,. �..:��.. ,.. :.:::l:��,:.,."l:l ......'.-.."..,�i. .�,�,.�,.�,.�..�,. . ... .1.:�' ------q.. . ..... ---1. . .... :,:1..... ..- ,.. ... ..., ...... .... :..l. --- �... 1--- ...... . ................. ,', .':. ...... :::,.,...,.,.::�:.,.:�::,: ,-:.., , . ... .. 1 ------ . .. . �: . ,. '---- ':::::: .... :.:-...q.1..': . . ..... ---.-.. .... --------- 1 ... ...l.. , ...., 1.:::::::':.:: : ':'::': ' -:::-:::.'---------- ........... ... ...... .; ,.. .�...... .,........:.:....., :: : : : .. .. .. .. . ........- ..., ...... .. .- ..: :: :..... .:,.' '. .......�.......,�... ....., �. :::'- -- .. ' .:.:.:.:.:::� : :.:::: ::::: :' .. . --- . ...... �: .::.,: :: .:.. :.:...,�:, , ..:�,:''.:.,:..:.,:.:::: :..:.. .,....... .'�.,.,.::.... .. --- . .:_:.::.:�': .:.,I.,: "::::.:::�: ,:.:.'.': ' --- -.... ,:: '... .' -::': ' ' ' ' ' --- - . "' '�'--' '' ":: -:: ..::::' : ::- -::- '.:.:.:.:.' 1 -::..:' . � . .' ..,.: .. .1.. 1 . . .1. .. ::: �. ... ...,:... : ... -::. :,.....::�::�,., - --------- �.-':.' . . ... - -- --- . :... .. ....--- . ... .. ---1..---..........1........- ---.......... .- -, ..:...... � ., --- - --- '1.. ..... ..... .., :.. ..::�:lll:::l. l::l�l��,l�:,¿:,:'i:l:,�.: ------ .:,:,:::�::::: .... .. .. ---....1.�------ �--- '::':- .' . ...._........... ... .... ,: : . .: .. :... .... --- .. :'w':: �.,..:. .. ..... .. 1. ._: .. :.:. ::: :::� ---------1... 1. 1..------,:,- ...�........,. ,. .. ::::::::::.1--:-�..:,:..�: .....�',-...:::::�'...., .- ------...--------- , ' �. �.�:: ---....... --- --- 1 ... w. y , -.. ------ ... l;.'l l:';::::.':'-.-: -..... . ... .......---........ :ROVIÑez: 1. ------ .. --- �...........,:�:��:�.'�. .- :':-.:.. .-- ':-:-:::-: :-"::...1 .1 .. : :::OF MENDOM`.' ' 1......'�.'::�::.:::::: -:-'-:-;-::::: .. ,...., � 1.:i: .:.,,,.,. .THE.IJEW...BUDGET,ING.: SYSTEM:::��OF.�:iTHEI,i:P .. ...- ... -,',- ..... 1 ---------. �... .. . ... .--- .1.. .. � . 1 ---.... . --------- . 1 I.---I.:1 1 . ---. . --------------- :. . ------------ .-:l'::. -..... '::- ... 1 -:. 1.. I., 1 ---..-.... 1 . 1.. . 1..........,I.,..1. --- ... 1 --- --------------- 1........,..�,...l.. - ..........._- 1.......11---. ..::::,-:_..... --- .. 1. -1. 1. �.. 1.. ..... �... �.... 1..�......�,...�..l.....�..,�. ,' �.. --- 1 �... 1 .1. ..... .. . ....... ,...."..". . 1... 1.1. . ....1- ---.: :::::�:::..:,: .' -..::..:.'.:. -.:::: -- .:.:.' - ------. .::....:.. . . . . �.:.::::: ,::. ----- - -..... , .:�: ' ' '..' .. .' ,.,.,:::::.:��:.:: '- .. ---.:. .... 1.... ... 1. ':: - Z -- � � �: ,:..' "..........�"..,. .--------------- ,`... - :::::.: .: : : "-::: ' --- ...'::' ...": ......,�.,�.......... . .....�.".�...."... . .1.....,...�.,..''.,..:�..l.....,..�...,...,...,."......".... -. :-:. --- 1...... 1 ---------.. ..... . ... --- .�.�::. , :-- ---. - ---, - - :. '>.. ...,.,_ � .'!:': --- - . ---. ,..:.:.: --- -::":-":::: '. - '�",:::.,...--.-. �; ..:...:�------ ---. �.. ..... .. . - . ��.. ------.. .... --- � ''. . .�. - .... . .., ̀ ----.... . ------ .- ,..:_----.:.:::::::': .,:::: .. .. ..........1 :::!:�:ll..:,: :...:::;:li,:. ,.. ... -. �. .... .' ....... '....:...J... .. . � .1,--- ..:,', --- :.l,m:::,-:::'-- : --- ------ ... - .---.., ..... . -.... . . . �. ' ....:�....... .. --- ---. ... �.---. . .. . ...-.......-... '..,-- - ......' 1--- ---. 1... 1: ,. .... --- .- :- .---1. ---.......... .. .... .---. . . ------------ -. '-''' --- "' :::.::-l:::. - .... :: . : .::.:: , .. ::;: .: .:':1. ,.�...,...".,:::�f�..,M...:..d..:�:�:.:.:�,.,.., .., ..... . -.. .,.w�..�..... :.-:::-::l 1 ,::� _: :'::.:::::' W:' ' ---:.:P �. ...--- --- --- '..... .'�. . 1---... .�. ... ":: . . . --- ..._::: e.. h:,:,:,.,::1--- ---l ' ' "t' d::"" ' ""' --' ---.. E -.. 'tú ------ ,,,, ------..':. �.1rovime :o .. an om.l as,Amp: emen -::an:á- . .' t �:,:,::, ,,,'. . . ------ .. �. -1. 1.: A-'.'-::.::.. ------ . . ...: : .. - . . , . . - ....... e � � : ' ,d.:: i -1 ne.:. -ning.:.. :: :::': . . 1. ... �. --- ,�,�,�:,.:q: gi�,,,,,1�M::sy.,s em l..:.- :'... 1.... 1 .. .1.1.., .. --------------- b:`a,.... .... -.. - ... ---.....l.. ........... .. . ..... ---.... ..---.. .�t".....�..,. .�. .1.._ .... .. .. 1.�..�.��.....�.� .1.... ,�.,.,...l,I....�.....� ..... �.... --- ---.1 1---.....,t�.. . .. ......... . ------ ------------ . 1...... 1.1........ ,_.. ---. . .. 1.:.:'.. ------------ .....,_ ............. .' : :.::l� ,. . --- .... �. . . ... :..,l,:::::::, --.�.. ---. 'd_tí. -.---... ,-1.�',... ..- ...... ... 1.-
'... 1O.:�.1. ..'!:!, III Of1t.001OMIO a. .Qn , 0 .--- .. ---�'---.... . hf :. :lc:.. W 11.1 .' ', 1, 1, ':, ..... ::' --:-:-::- -:;:: .t, u: üt,!,::o�',A<).!Pl:t.I:I�it.'P.6áti- 0:�l�i�i.... , 1. ..�.,�.��.I.�. . �---e -r .. ,1. i:: ..b ap. er.1 .:.1 -:: :,- :-:-'.- ,_ ... . ......---- ..:.:"£. ---.---- .. ...:.....' -..... .. --.. .... __--- . 1 1 .�. . ---.. .---....... _ --------- --- 1...... 11 1 ....._ .... :::�:.:, ::-..., ...... .......,_ . ....�. :,,. . �.... .. . ......... ........... ' �...... .. . ...- . .....�.�.::.:.::-:-:-:-:-:-:-:-�..::: ------, .: :;-:-::-:-:-:: ''::':--- a.. má ¡ir --- ..... ........... ............�.... --- .., --- --- .. : ::. ........ . .. ... .... .. 1. ---..:----- ---...1. 1. '',:::::::::.:��.�:.....:.:.:.:.:.:�....:,:..:.:.::::.::.:::::",:!:::::..:::::,.::. ..::,:!!:::�::::.:�; .. :.:m'::,:.:.:...._,,: ... : ::: . ---...-----1. ..... '... --- . ... ..... �...::- --- : ::.:.' ..::::. :. :.:::::_. . .'.. .:.---. .... :e f "' .:-.... ------------ ---.....- :::'::.::::-' - 1. - . .... . :,....:...... .,-,-.-.-.-..-.-..,...,..�.,.....,.,�......,.-,.,......�.�,.�,.,.. ------ �.. . --------- . . ..... �.. .. .. .. ---..,..:..... . 1. --- ....... .. --------- --- 1.. .. .. --- .... � 111.1 --- ....�... ------..' . . .. .. . .. . . ---... ---. .1 ".�,.�.�.,�. --------- . ---..::: ...... ------ . .. ------:,,:::.,i,.:,:': -1 --- . .------------ ... �. �.: .. .. .... ---. :....- -,'.':..' -':.--::.. :: . .' --- - ... - -------------- ....�1.1...1�....., 1...... .1. -1 :.: -:':-'::'. .....- . 1--------- ...-........- ...... 1 ..... --------- ... '-.,:-::: :."::::::::..:::...:::::::::::::.:�::::: ...1.- .:::....�..:,:. ,.,.:..-,..-,......,,,..�,�,.,:..... .--------------- . .... .... . ---..... .--- 1. 1 --- ..--- !:.::::::!:�:�:l::::,l::::,... .:,:,'::::'�......V., ... ;--......;..�..", � ... : %, .... -. _': .. .: ::z:-:' ...--------------- . ---... ... ....I.---.. ... ---.....' ....,...,.�.,��.�.��.��.�. .:':.;:-::-.. -:::- -::::::: �:� :::l::�:::�;:,.: ---...'--...1..... .. --------- ..., 1 . -- '....:: ... . --- ,.,.:.:--:- .' __''......... . -,:, .: ::-::. --- ' ---v ':..:: : :-:-:::-j::l'l:'.' . .1. 1- 1-11 1,1---11--------- �. �......"...�.�,.�,.�. 1 ------ -:y. :':l:j:j:::l:''':--------- .�..,.......�. -- ---- ''.:.1------1. . 1. 1. --- _:.::::j:l::' ...... ::::::::�:::,: -:::'. -'::'::j:::::l:-..... . ,. ,:, .�,.,.:.. .' :.�..'.�:�:.":.��...",:.,:.,�.'.�.,.: ... .: ,,,,: ::- ,::::.�: i. . . .:::::: i .l:-.' :,.....,:::::::::::::�::::: ,-- .�-�..� . . .. .. .... ::.::---. ::. ....,�.....�.. ---.... . ---..... . 1..: �.: 1. . .... . ------ ... �:..... . _, .:1... ...-..---.... --- ......... .. .1,---... ..--- . . �... .. ....l.., .... 1.. 1.. . 1...... ... .1......,�.�.,. ---. 1.... :l,.--------------- . ..1,---t........ 1.. 1.. ' ' .... �w......�.. ' .:::,::,::�l��:,,l, l. l :,: . . .... . . ... 1.:""'D'" ""' ---. :::éiletitátio ,v ,em.....::.::�... . � ,,- --- ....... 1....': o,pment --- d' 'I S"""' ..... ..: ---. . :.-- :-:�.:.":::.:.::��:l.:.:�:..:: .... .. 1.I.--- ..... .--------- ..... .�,..�...."
. .' 1 ' --- : an' . mp --- ' --- ' '. ,..nls�:�:!.:lS.Váté :.:w:ll:Ct ú: ""'' ' .:...:11:1:: eve' 1,--- ' '"'''" ---- il::�bif:::l:,:t.hé:!:,ll.1:::::.: ��':.aome: m; :...., ..... 1 . . 1 .. . .11 ::�:l::.:::: l......:._j:... e.. :l: Ntie'.... ...... .. .. d...:l,- ....... :!::::, . : : ::- ..0.:.:..:",::,:.::,:''.. . --- . . 1 ...... ---------:-:..�.....:Or::.ellto --- ....... 1.1 Y--- Zlád `-ti:.( ó'�9>.�:I .!:!:l� .... ::::;,,:::j_,:,-..... :: . --- 1------ :� ------ 90 i: n--- .wáW.1 --- :... . . ......1'---..-- q. ....,.Ee.:.-.� ... � ... ..... ---.y.. .. �......._:.' . .'''.. .1% 1...�... ... .:. ..,: ...... `:úa:.. �.�l�l!': "t'' d-'"''f th''�hi1-':":'::::::::':.b:íi..,::. --- 1- .: ... �, --------- ------ 0,ve: �0151 k, :lilo 0: U y.'..---..... :- :-_ . .... . 1........�.�.�.........�.. . ... . .... -: .. .11. . ...,... .' ---I.,.;P...........-�::: -¡:..:: "i":::�: '--- .: . --------- . .. : . .---. ..:..�::::::.::,:.::::.:�::........".::..::..�..�.�:: ... ,... ------------ .. .. �.11l.p..,. ::q--- . --- --- " :':- .. ------ .......: 1. . .i::'::... .. ..-1 1�:1 ---...... , 11 ... ídád.",',,«a'c iona : : d.:.th., 1 .S. 1 --- '1._.......1.1..' '' '........""" 1. ' "é"�ll�:'�.Cu:::::,:�::i�:���wnien�---a :' ie ', c.a.c>.'I:':�:,ic> :':'.'E ' n""'o"mI,.Ciá,::::.::". >f: ...t........ .....,::::see or.,.�.... . u-vers.,- .--- '1:'''h ... £'.'. co' ",.,,,":"':..:< :... ...... '..1�1.. ---..1�.11.t 1�. ---t�. ...... 11 . ... .. ....1..,.,�....,....�, 1,1, .''::-: ::::�:,::: ... :,:�.:::�::::::::: ó!':: l:: l.:: .:':'j:::j:j.::,l: ....... - - -.-:::-:: .. . ...... :' ..':' .... ,_ . . --------- - ..... ...... --- ' i.�::�á�::..:::,:i:�.�::!::,.:��:::: .... �::... á_::',:..�...... ... '",:, ' '''::" ' ::':':':'�..,:,q_. ...... :.:.:.':: ', '.�n.�.l .:. --- 11 ...: ,:.:..:----.1.�.Y.,$::::-:aj--já ' $:j:.:'.--- .: I., ' 1, ', ' ', ', .1.''""1 ' '--- ' "".. bl 19 �8 3- 1 ::..-'�ill��Th" --',:.- �:�--s�yo:teix,:ov<>:.��vú' �:_.. ...., 1. .1 ...... �... . . .1. 1. �.. ', .. .t. Ik ... ur nx,l�:llt o:SU..y1. ---.------ ... ... . . .... �: : '-:: .. ....... 1.. 1,1 ... �... --- ... ---. Ja . 1--- .. ....:.:.:; . . ....... :,. ' _,. .1.......�.... 1,1 ..... .......�.....:..: ' �:�.:..:...... . .- ---.. ---.. :.... S of....------, .'..1...', ......- �. .. . ...... 1 . ............', ..:�:.:�:�........::.:.:.: ..11--------- . _...... - 1---o:v :':: - -. 1 ... ... ---.... ---......, ---. ... .. ....... ---.------------ . ¡Ire. 1. .:-, � .: 1--l� -4.-..',�:bl4.ii� -- :t n ,l�ipi�PCO . . .. l---.------ . ... .,.í�.:�:,::. .:.1..... ,- ....nance,s ::�:.:.::�.,::::,!!::..:::::.: ............_I... . ...,pr inc: a'¡': ,f, ' "' ''''....:�. .. í. '" I:h.m.....:,:..:,'::. . --- --- .. d""" "''�.�:l���::�::�viá��:ldiscusslo,ns: t in ::: ...Ü..:,,::.l:�: .á, !:' . --- .. '::.. - ........- S., ------.::.:,:�;l:lt.': � �::... .. 1.1 ... ---. �', . ... .. .. ,. 9 . :. ,', . � ..... �. ------ --- . ---... 1.. --- .. ' 1 1 1. �... . 1.1. .. 1... ... .. :�... . �.... .1. .---... .- '
'..... 1:..�.... . --- .. .,�-. ---. ... ---... ------------- .. . ... �. . 1-:tv,... .w..:00 :we.- - .wí::0:O:eag 1. --- d...pol-lt.J.O.�,-'..::.' ="Un,í, ' ' """"," 11. _< 0:..1.. . . 1. �--- 1.1�. . ---.'�..�,.: é: ,omí';:.- . --- . --- ', --- .... ---:,:: .-aQ ;.. . . ...l.... ..._... . . ---':.'. --- .� �--------- 1.�.:.::.��.:,::�:,l. ..:��á:,�.:.,�..�.-.-......,..�,..... ,...--- .... , ÉÉ¡ .uÉ`:.1;;..1.,---..., ------ .-,.�...1.1...'.. --------- ....- 1. .-.-::.: .: :-,-::�.�::-,�:.:,..:.:.�:.:.:" . 1.. 1.... 1 1.. 0n. .� � 1�.. ..1,:": ------..,_ --- . 1.. . .�. ---...... ......... l..,..�.. .. ---....,:I:é,ad" .1---
.1.- �,', . .... .. . .1 . .:,:::::l:::::.j�'.... ------ l.�. .e.",t1,:,: .: -' --- --- .. . .... .... .. 1. ..--- '. --------- . ---. :,: ...l. . 1 . .....l. 1 ---. 1.. t..:"..�.�.....l....,...,--- n'' t. 4t ::-efor---a riun P_r:;::''.., � � . 1. ------ 1. ...-.ett- ' '¿ái. 1,.�-::-�:,.'1.1::,l,':::-:-l:ll: .1...�.l..�.11. .1 é. 1 :u Y. a.,i.pi.,.P-,rovíjild:lt..rai �l�g, .::H ---1.- --.. _: .P.át.é:exvo lenc.- �t:,:�::l, .. .... ..:2. - - --- l.1.:�ll.,.... :': :::..: :. 1. ..... . : :..: ....... . .' . '. �...b::.: .-....... . �-.,�'_:: !a:.: or,...--- ...
-:¿... : ....:.:,:.: ....... ------ --------- .. --------------- ...... 1. �. 1 . ...------r,'... '.. . .1.�........ .1.----. ... 1 . .. ... .... . .. ....1. .1.........�,,�... . 1 . 1. .. . .---...,- �...1.�. 1.1.1.., . ..... 1-,- . ., ...- ..... 1 .. .�:1..l...,.t..o. .... ---.. .0.. . .
.. .... 1:::: . - - ... oconib .... '9-"' --- y�.-11 h ""' --- ''"--.--l::: ' ' ,.:�:,:: l:; � --- :-::;;;' -1. 1 1 1 ---1. 1 --- ---.. . . 1 .., . .----. ... 1.. .,''mo.r..n $-.87':!::!�l�:!::�� : :'1-, 'd'.'. ------d. --- .... .',,! :..:..a.::::Y:::':':::: ------------ --------- c ..: 1 4..' t1 l:1,1úkQv, neo. .------ ' ... --- .t... ---O .....1........... . .. .....1'. "--.,.,...,.,.".... . --- . .. .....�..... .---....'....: --- ---------,... ecli: éd'.tó:,u al:I',.-I:_ ':::'é -:::-:Ul- --------- .1.... . --- �. 51,:. : --- em`as:. ---. � - -_---:,: .. ,�.,.,-,.,-,-,:-,::.:!.,;.-""'. �.'------ .... 5...- ::::::l':: .' ,.....,...�... ......... ---.---. ---. . .,9 ' t--- --- --- t.::: or ac ieving---.::.1 -- tí --- t...
.. --------- ... --- --- � . . :. f.i.1....... ..�.8.9::�o.. 1 �.. �. ..... . -..... 1.... ..-�.:� ,, - ,u .., ------ ------------::.�:"h' '£,:, ----1 --- .
'. -. .�...........w. _j.::.:::..: .,::�l:�:::::...�., .:': :.:, -:l::::':::'_.....: ::,:,':.. -:'.: :. ---. 1lCa:l.l.:y h ---c -e :. . ...,..,.,..,...�' - ..,- .�,:":,:".:, -- _.
,- ̀ - hl--''f'"' '--- '---''1 .1..':'::::li::::l.l::$:",2 �,::�:::�:'.-', ... --- --------- ....,_._:.:..S' IDO .::, tft:- ..'.::' é::::::'Pr -1.� --- �.'h ...... ---. ... .11 ..., ::::::,�:,.:.::.:.�:.::::::::::.�:.�.. -...----. 1.... . OV'� ---1. ::',TáO''de.r�nl..Zat..£.O...., -..0.- rth.. - - .........lt....I':"l�."""'b�1.1"':""-': t----- .. - -..-..... .,.,�.�............-.' l: IZO4�l:,���ll:1.. :,::, . -.... l.��,.,.....:é-I. ... . �.1.1...0 .00e or:1W..':::' 15:::... ... 1.---. :.::: ... :' ..... ...... -,:... :.:.: 1 l-!:::::l �' :.. .�- -. 1.11--- 11 .. . ---.::,:,.. .. ::::O. �:-...' : l---:., .:. .:..:,l:�: ,l, pu ,0.1 ' "'f' th' ' "'.. - --- . --- --- --- .' --- ... ------ ú:.-. --------- ' _. . .--- lea:: Oné!:: ' e: . 1,1.. --- .'' -1.....�...l...l..M......�. _- �:.::.:..: :.É::�.. :..:l::_, ,:.:::�::::l:�.::...------.....1 ....... ".,.��..�..�.. .:"::�..,.::::É:::,.:::!.:!::,::.1 .. .. ---.:.- ....... -:::; .-:-:- inis er o .�l�.:I. c�Q,nq,mv -an tó ..Itt ... t. ..".... ... .��1..., ..:re+searc ers .,as.: . .. '::: j:::.' :.: ---. ... :......"�..... -------�-�.., 1..., -.,,.....'-l:: l':::: -:,..:.l.:'::� --- '. . i�i:6"i::..''.,.,:..�'..�'�. 'l.:l::::.:::::-.'- In:..--. E'"" --... �::::dx --- á,-re: �.:...l.:,,:l" l...... É: t �--- -at, �1. ---.
' ''."..,f.."th,..",-.. ---..'--- '----, e,S .alnoi::��'--- ' "' .l:l! .. . ..... .:.::.:�:,:.:,:�:. .. .::::::.::,.Y� :j::: ---....:.... 9. :�:;��.: �AS:::. . '_:.:.:..:--- -. V.P. úrnaer.:::::.' i .... ... _:,:,:::ffl _:,:.- � ' 1.... �... ---. �.. .... ......�....���� .... 1 --- ,..1......- 11 ---. . ---.. ... --- . --- 1..0 .e......- ... l..,........,-1. ------. ::�:: .. �..-�....'.' .- s.'rc, ip.ro.iloct,., -I.:,.::�:th' ' ' ""' .. � ... .... j::::::::::::"._. ------v.... ...... .. � -'"' ,mi íátrf"' "" i'd' t '-':tt-'.és ¡al------`h ' '"'" í-, ..: ... V.:i::.'... .... --- j:":::`l: ,i n - e:: el....l.��...l.�.".�.:11 tU, écn ..... I a ne.. 1 1.�-------..., .... .:�:;.��::-�.::::: ,:.:::l::l�:�l:�,:,:.i::�.,, ---l:,:_l: . . . --- ... .. 1-`, :Wéré::á"l: ', ' ' :`- -` '. .. �.-:l::l:,:�.l:. . .---. -' ' ",.".."........" --- ---. �.. .. .� ' _- --- :1-1.1.1. 1 .... 1 ---........ l.... ---..,-.� - �:, 1 �,--�..-.-,......'�,'.- -, .l::::ll,�,� .. .. � 1. :. .... .... . 1... �.... ......- ,...-.. 1en. nic.a -,.l:a visor, .,."..!.::.::::l,:...:.:� .... .. . ..... ....... . .11.....��..l.�....,ls,o":iirec. ..-d,:..::.:�.-",-.::,::.:::.".�",-".,--' `1.11------ 1 ---------1..'11 --- . 1 1. 1. �l:;as":l:�:':t , h ' ' '..-'j:--" � d---- --- --- '. ...... .. . . ---------1�.:....... .... ---. ------ 1.t'........ 1.---.. ..�...�....�,. ... -::-:-:.: ,_ .---....- :.. 1 1.., ...-.... 1.� ..::::::::::::!:::�::.::.�.:.:�l:�:!:!:::�:�.::..!�.,:.:.:.:�:.�:.�:. .::..:..�..., ---............... .1. ... 9�:��i��l:l� i� 1 l 1: �..:��:...,.l....,:.,. :,:::!::!�:!:::::!�::.!�:::�::�..":.,.�.'�: l::. '':1..�.... �.. m:::-:-::':::;::'::::. .1 ...1... .. ... ---. ... :::::i:i�:i:�i,i��l.. . ... --...... .. . ,.,......,...l. :,;:.:...:, . ..q. --------- .:.:::::::: :á.:.: ,��..�... ---...., .:::����:��:11�l:!::1�!,:��:�:�:I�:�:Iii,�l:�:::!:!:�..,:!�:.��... ,'. ' ' ' '""' ---...... ---.... . -- ------ ...:':'.... ,. :.. �.11�l:l.1 � ---. ' . ....._, �:.:,:.::.::�:.::�. . .... .' ---..., . . .. .' ...- . ... .... . --- ,. 1 1 .:..::, . .. :::::::::::��::: 1 �. �.. l:i:i�lli�l�:���l� 1 1, 1 l ... '�:-:-':': :.:.:::.... 1 ... --- ... ..:..... � . �.. ' . �... ' . ...... . - - .. ::.. --':..-:::::::::'. ':': ' --- ::,,:: .:._-.. ::�:::�,::,:.::.:: .; �.. .. .. ...... :.:,!:::�:�:�...':".::..:�..,.."::: .. ......:: ::.:::::;:: --- : 1, : ' .. .v::':::':: ::::.::._ .' . .... '::"-'::::::.' ..._.::.------1 : -- . '--- . .. .'::',::'. ---. .' ------... �---. . . ....._ 1... . ------------ --------- . --- .. ,� : ,--- .. :..:.:::':::' . .---.1.'�.....::::-::;:::;:: ' ---. . b:.: -': - .::,. -l::: :.:.: � --- ....:. ---- --- .�..: ":::::.: ....:. - :::;::-':-::::::::';:::::'- ..1. .--------- . ---------1...�,�..�. 11 .. --- ' ... ---...' ..,1. ...- ..... .. .......::..:::,:-:::,.; -:'..::.-¡-::::-:;::. ---. ..... ..... ...... ...:..:��.� ..�.......:.
.------ 'Re or�,ffi"l..',.. -.:,,W------11�Z--í--�...'t-. ---...1 1. .. -'.: �.,:::: ,:::::::::::::' ' ' ' --.:.:�::: .,1---. �. --- �..1...-.' : lica .:a------------..... , . --- :. _:..',- :::�",:::". .------ ..... 1 . --- p ---.. '. .... --- . ...-.......... ........ :: .:.. ---- ...... .:..::.: ---9""' .... ------ . ---------.tlno:::a.s�.. .. f¡t h o.u' t l, ' '_- 1,1 ... ...... --- -- "--- - th:-....---...... .. ...- ....l. ,� . . ,f 1 .., 011, 'b --- ' "' ", ¿' �:�l:�l:�!::ltij l:�... 1. 1. �--- --------- ...�..,.,.,.�.. .11. - . .' _W: :1.kE'''""" :���l�'::' . .. --- .... . .,.....��.... ,.,:.:...�:,. ,.,p_. .. e In. ... .. ..... ------ 1 ------------ .. 1...... ....... �.. . . 1. ..., ---. .,...".�........�.� ... '�.:::::. .:l --- .. --- .... , �....�------ ..... ... , '. ---. �....... . 1--- �..5. --- �::::�
., ............... . ....-... �. ---..... ------5,:,1--- .. ... .... : con, I* O' ' ', "' l.::::.:.. 1. ... 1 --- . . ..�.,�:,th.is�:�sv,"s'.'�tom-.;W ld"'h"' y' .. 1 ------1....' ' OU av«', ibt.Wtátiiáril:i�t: . .. '.................... ......-... � 1 --- ... .... .1..... �. .'-,.:.:.:.::.: .-.'--.-�.---- ------ ........ 1 . 1. ,,MP: ...P. !:''",...... --------- . --- "'.. .. 1. i.....,' .. .. . .. 1 --- 1 . ..::.'-wérel:::---.. .W.. .,-:-:-:-:-:.:.:.. -, ...... ::- .. :- --- ... -áti,óná :f2.......,."..� .........1t..'-a_ --........ ...d"...�..,.......,.,.,.,...�.....�......l....��.. 1. ..... .:.:.:--1 us. ---r.. '.: -:::.::'.': ::::.::::.�::,�.!:,: - �.------ t . ---."...�".. :á:::::.: . ------ --- ..... --------- ... i. .' 'h' - - ------ - ------------ -.1. :� 9,:.'"P t ' ' ' ' --- .ha'.gÚ, :. ures, vi:.;'::lan "". ,� ' '!:-¡ "' ��l� ------ . 1 --------- 1 1 --------- . '.eXIS lng l 2,._:' d'�.''""dál" liá,i:� .i.�.,."..., ...' ""::i�::::::::::::�.::.,:::::.:::::::.,:.��..a.:.�.;w ------ ....- 1 ...._----.: �. ,::...::.:.�,:,.�:''.....��,:i::, 1 ,- -.. --- : �::,4 : " ' -1, .l:: -1. �. 1.. 1'.....1.1�.... ---1. ..7.: � �...e. .,ú,t�,.��6:li'�:�ll��ll'a� �... ::.:...::.:..:.:.: ... ........ .. l¡:', --- .. 1.1.. . ::::::':l.llé v .1 . .%:.--�tnero::l:.wouj. l:: `vo: ̀ tíe ti r."O,.:'$'. 1,0--- ' án,C.O.:. .. ......_ . .,n.,é:.i:.� 1:1.��::�::�:::�,::,:,!::��::::���,�:��: �,.:.::,�.-::�:::,...�:.� .:, !:::::::-l'::..'::'::: .�.�.....''...�. .::.. r.- O.f'..... .... 1--- -.-�.�:��::; .. oál:��:��.,!,�:::...:�. �.:..�: . ------ ... --- . ------ �.. .a_. .. .. .. ' ' "' ' '. 1..11 � Ar,m,S. 1 ::- lOveyer.,::':':,vas.,-. :.-u&_é:-:: �..... 1 1.. . ...... .1.-- .... _*--- .'`'.1....1.1...: ' ---d ......1:..��:�..::�..:�.:. . :_:.:. :':I::':: ' �.'..'�".� ..... ....... . -1.-I.. . .... --- --- 1. 1... .. � 1�'-:: ... .. �. .. :. �.1.......------------ ,:� --- :1:', t. ,� "'1.. 1.1........ .1... --------- .--- :,::_:..:,,,::7:01.'::. .. ', :-: ' -:é:......'. .. ..... -::: ....-- .------ el ---... 1.... ':.'.'' .'h""' -- -'...:�::.:.::.:,.:..::..",.,..::::�!,!:!:::'!�:,:,�:,!":.::!�.�l:�:::�:::.!:.:: ..,...'. - .. ---..'-... y -:. �:... � � ---- �,:,*::::,:�::c- Éng6 -1 .--- � 1. --- .... 1....'..t . .....t', --- "OB:I ' 11, lát ' """ ...,:::::::: --------- --- . :. .. ... ela .. .15u.... :: .. ... .1.. .1 .. ---.. :,:!�l -11 ---1..: �:���,4,ni ii�:li-ou:: t ' ' --- :. .. .' .-:-,-. --- ..--------- --- .r---. ,. ...........�...�.. --- 1 1--- ......_. .... :...... --- ------ . _, .� 1......:.::..._.. ......:.::.:.:... u ,l�.-Ii��i��l...-��: :á -::;-::::::::-::illll::�---. 1. ---..... :::::� :::::'.. .... ::'.......1.1, 1. .--..:.:��.�....." --- .........: ::::�::l!::l::l�:��,11::: ,� .,.,�!!:,. �.:i l::,::::!:�:1:1...,:,::ll:w: l, l l l 1: �:ll,::::!:.,:,.......�.�........... .... ' l. .... -i��::�I��ll:.���:..,. -:: �.. 1..._ : ::.,::::::::::::::�.:.�................ ...... �......�.... `l .., -... �'--,.::::�:,::, :':.:..---..... --- .. l � .' .,'.'.: -:!:..'�.-".:.�'i.-",:.�.,',, . li�.:ii�......... 1. 1.. ...�...�. ..... -. -:. �.. .l.: .. 1 - .. . ....�..�.... 1... - "......�,..,.,. ..l..........,.��..�.... ,l � l.:.. �l�...:,.,�..-..�..,...:.�,:::.'....l.�,.��... .11 ..... 1. --- ......-. ... �: ...,,-- . ...,�..�.�......l,I.....:..�"�..�... 1..-..-.........l..�,....�...�..�.' . :-:-:-::-:-:;... :.:.:.:.:.:':.. ...�..::: 1.' ---:.-:'::::::::-::.::.:::: �::: .:.::::::::�.�, ... : -:: ---..---. .:,:':.:.:':-:: :1..:.:,:. .__1. .. 1 -.. �:... ------ ---.::. l.�:::: !:,::. .: -j::.l:;::.5 ': ::;.' ., ---s : : ,::-:-:-:-::-. ------ .: .--- ..........,... .--- ---. � �.. . ... , . --- .... 1. . 1...�...��.......''..l..:::::,:�.,:�:!:,:,:�..::�:::::.�:�:!:�::.�.�..-�::� :: 1 ... ..., . ......1... 1 .... .1 ......... �. .....,........l. 1 1 .. 1. ---...-- 1. . .. 1............;.: - .:.:: 1.: ...: :.' .---....... ------ ... ------. ......l...- -,- ,- 1. .....�..�-� --- 1 1. .. .... : .--- s -':'-.--------- .:...1. .1 . . . "' . '. ,..�::.�.. --- . ..... 1 .. .. . 1. ---. 1 . 1..".....�..�....� .' 1..'.: ..": -- --- -1--------- -1. - - .:�:. . .. �'�:� . ........ ........._ 1 .. ..: .11. �::-�.::� .':: ' ' ':::.... -::; ......... �.. . 1... 1 . .- ..........- ...... :..,..... ..�,:-. .. . .:- '::'... .. -.;:: :,:.:�:::::::.�:. ...".�"..,....,.� .. 1 .. ' .....l.�.�...... . ....1.. .. .......---........ . .1....`::. ... ,::..: .,....,......�... .,!:":::�:!::,l:,::: .: `,..,...".......�,�'�.:.... .- :-:: ... :-:::-- . ... ..1. ------ ,:: :..:... .: :..;�.l::,l::l.,�.,� . .. .........'é, --- .... .:. . ..... :l, �. .---... . �.::�.:.::::::......,.....:.:"Z,.,'' :,:::::::::�::::::::::.::�-�.. -- ...:..y:,:':.., '-: .:. ......--------------- 1...... ,- .�...�.' --- --- .: l---... ..�l . . . ---. .. .1.....,.,..�,. .... 1. 00n On rat.-�... �.,..::l 00 0.,r..,.Was:�:: '--- --- ' d '', --- he"i'i�"��':bu'd .... t- --- fl :. �:..:::h.-:... .. .. .1, . .. :..:::!,�,:::� :ll.a.. 1 la:�..-.... ---. --- �,.�.11�-�.I..1 .1... �-� � 1 .�:.a.' '¿ --- t---- el, 'i:�. 1 1..---...... ¡S''. �oe$.� nOt,:':'M .1 á,............,-... - - .`'------'.' '---:.I.:..' ------------.. .. 1.t..:.:...... ....-... . ..... ------11... - . . .....,` -1 . .1--- - ... .. ---..I.--- 1. 1 1.. �... 1 .. . 1 .1 .....ge ]�rig �: -0 �. I:ce:::::. 0---::: ....... .... 1...�...Mt.,�..",.,...l.., ..... .. ' ' . . . ... ...t-.', 1.,..:.:..: --------- ------ .11. .......,-- --- 1. -:.:.:.:,,_. 1.. .:,¡%::::l:I,.t. ..:.::i:l: ::::.: -:¡¡- --..........--- "-l_ - emn- r e f <' >-- r m""s:':l:: 11::---.:.': -:-.:',:,... l�. .. ..��.�..�.�.. 1*:-.1 i ,>.- .ffi:: -t .., .:..:.:.:�-::... : -:- .. ---....... ',---... .... .-... ---. ---......._ 1. 1. . ..... .. .. .. ::_. ,ill::le.verv.-.,e órt-:.:1.....- ........:�...�.:.:----,...,�.:"'':. ' 1 ' '11--- 11,ah.., .�� ---Eh �u:E ---.,v----.i--- . �. . ... .... ::i:: pú: own,.l..:..,:..1 . ---. .. . .1. -_ :: ' .�.IP .. '.-'::: -''':- er f ró.---....11.... .--- --- ..._ ---..... .:.....::.:.:-:':.:. . ,:: -- �..::�::.......:... ... ...... . .�,..�,..,.,..., ... -::: .:.,.:..:.�. . --- ': .... ..-v4$' �.... .. ... ------.,::..0... 1.--- ...... �-::::: .,�.,.:,....,.:�.:.:. :::.:.:.:�:�:.!,......,...:"�:.,.:,......�..,..h:":::::1.. ........... 1.. .. -:-:-:.. .. ..... . ------ �,.'.. - - ---. ....... --------- 1.......... .---
'... . ..... $-:::':,.:.:: .p,!!.:.: .:::::::: .1.....,1...........�...�. �. . :.:::::<).--- -...... ,... �.....1.... --- 1 1--------- .. ' .0 .1�'.O. :1�ZO'.d'::'�.':'::.:.:�:á.ñd. ..1 . . .. . ..1.11. ..- 1Ay --- .. �..1. �.... 1. 1 _,,_ - 1. ---------. ''.....�....�.. . ...::...::::' .:.:.:.:....".,.-.,...: ........... ._, ........... ...- .. .......�.,��.. -� --- ,----- ------ ------------------ ..,..1. 1... ... 1.. . ..'Cét=4. í. . ñt.. . ' .'- .. .. ... �....�...........�l....:.:.:.......:::.::::::,::::: . .::,. 1.. ..---. �:...':: . .:�.�:-�.�:,.::::.:..:..:,:::,::::--1. ...1.1 1.1. zéd--ia .' ' .': ... 1. ..:.::::�:!:!:�:::::,:. ........,.,..��.,.�...,....�....�...l.. 1 .,........,...,. ..... .---- --- .'.. e....d't new.: ....._I... ....1--------------- 1 .1 ------ ........... 1 ...11, nVI: t'" --- i't..,...-o -..�'. -el-::: Ñ. '.. de, .' 1 it.ó:.�:�:�:l��::''""''í ------" f.011: --- .. . .m ' -Invo ��:�����lI�:�r.ol>r"e"$elltát: .:::;:: ... ... ,.,.....,.�.,. ---... ... --- ... 1..... ..........1........ r..:.d' . ...... 1, , h .i:l::l. eve::oDmeti:aft é g . :::;....�-- ------ � ------ �----- ... --------- . ---,::::::::l�.: i:l���:''É:;:::::l:: .. . - - .. ::,-:''. t.-�" :,l�proc,ass,.i..,.::i..-. ót::::... , ... �.l.....,...........l.�.. .: -:: b.:.w. l:�::.:.:::.-: :::::::,�1.- ---. �:l: .. .- ,::.: -..,.,�.,...,.."":,.-"- ---..,....�::,t -e�.:::.-..... �..t. 1.. ..... ......:,:i.,,:. .... - -:�:�� ,- - ,..., ._w,.:..
..-.. ... :-: --- .... ..:.' � ..------------ .--- .. . .. � .. .1. ' .1.. 1 ... �-,�. `.... . ...'C. 0 ' Un :M1:':Sy0 ---In :�la::,$,0i,ll��l�: u..�T, ------1 1,l:::::,ba:VK .la 1:1: :I.:::::`: --- ' � ' ' ', """" "' --- ... . !"":,:. ",:" mií1, "" "" ', "' ' lí"" ', ', "d 1 'I.::'. 1.�-,-.-�-.., . .. ... ,...,- -, .. -- .. - .:..:1.-V. :: ::. Pl ...--------- ------....., 11 .g t:..4.::�... .n:_----i1. ....l. ...... 1-1 --- ll"..�""......,..............�.... ... �--- 1..�..en ..ra,:'91-110 ..l. ........... . ..... 1 . ...... . ..--- lín e, ::':: t"ó""'.".'. 1e�,�:i.,le., .... .... �. .. �-,.."..::� ..i......:..:.::-::..:,..''.. '.!.:l:l:::::::.':' �::.ltl!:.::!:,::: ---� .--- ... ------ .... ------.. ---1.. :': .. ------t .....�.... .. ,. ---. .. --- � �.:. ... ..... . .:-i., ' """£ cé., -a-::- . .--- , .., :-:::-::-:-:-:-: ------- ..,.COntria 20 .11.1.a..... .. :;..:;....:#.:-- háúil�:::--: k. -d.. - --- ----- -.,:-.'t:üd"" � .. .......' ::',.:,: ' _,'. ..:_:.: :".l: 1 �:'..:�: l:l i�l:lll�:�: l:::.:': �l..�:�l.:� ..., .... .---... . . . ....y.. .a:.,...... -:'.-... � - 1 .. ---.. 1 1....... --- . 1 1.... .1.., ... ---------�..... . .. ..- � . .--- ..... .1 ---.. . . . --- --- .

--::::::::::::::::::::: ---- 1.- - ������,I.". 1.1.. .- . 11 .. -.. ...... ... .. �. ..... . .i�. . 1. � . 1. 1. 1 - - � - .. . .. 1. 1. 1 11 11 - - � . .. . 1. . . 1 . � ---- - . . . 11 . 1. 1,1 ...1.......--- - ----- ..... . 11 ...... �. 1 .. .� �- ........... �. .. �.. 1....-- .. ----- 1 �. .....--- ................. -- ---. --- . -.. 1. .. 1..... ........ �.. .. .. 1.. ..... 1..... �.. �. .1 .. � �---- - � - - .. .. 1.. 1.. 1.............. 1.. �. .. �.....,�.1.1�.,...,......,.,.�1.1...�l..,."�........,....�.l..,..�."..�.....1.......l,I.�.".,�.�..,..�,.,."....l......".��.".�.����.�.��.,�.,.�,�.,.....�..l..................,.��..1.1...l..�...,.�...1.1 ...... 1........�.......................l..,......l..,....,."....,..�..,..............�....l..,...�.......... �� ��''.....".,.�,���.�,�,�,�.�,�.,, ::-:: ::::::::::::::::::::::-::: - -,.,..,.....�..�.�.��11.1�.....l..�...�.1 .... �..�..�..�.�l."....l..,.....,....''. .. ,...,.,....................l..,.,.,.,.I.,�.1,1,�, - -:: : :: ::: : : : : : :-- �.....�.... .. .. �.. .. .. �.. ------ -- - ,.. . ............ .. ................. �........... ---- .- �.1..... �.. --- ::� ::� � ::: ::: ::: : ,:,: .... �......�............. .. �........�...-........ �.. - �. - - - --- ............. .............. �............. � �........�..... �.1 �:. :::::::::::::::-:: -- , .: --:, --. . .,., �,.,.,�...�1.1..,l,I.. 1,1------.,. 1....1.1�.,...��...�.�,.".��...��. �.l..........�..�.�.",.,� - �...,�.l."..., 1 �.l,I.�.�.....�..... .. .- . .. ...........l..� .. .. .. �..�.�..�.,�.".,�.... "..l..,�.., �.�..�.,�........�....�".....
::::�:::::::::::::::::::::::::::::::::::::;::::::::::::::,�....l...�.....,.�'-,�..�.�,. 1.�..".........�.....�..... ..�,.....,.....,..........".-1. . . .- -- , ,. . � 1 . � 1 1 .1.1 .: ::.:� �:.: :1:.; ::: ::Z ::::;:.-;. .: , :. : .:: .. : :�:,: :. .: :�:.: -��..���-, ., .. ',,,. �-.,.,�1---..�.,.�,�.-.,�,.-., -, ,-,,-,-, .......,--- .. ,-.. ..,.,............... ..�.....�..,..�..,.. ,. ,,_ ,_,�,---.. .....,.,�.., �.. ........,,111..1..1111�1....1��. . . . . . . .�1.��.�. . . .�....1..�.��.,... 1. .�..�.1.1.1.11 .�.�, .�11,,,1111.,,1 1.,,... . .,...�..�.. . . . . . . . . . .� .. �..�.,.,�. . .�. . . . .. . . . . . . . .. ..:,,..�.. �,.1 �.1 �.1. . . . .�. . . .... 1. . . . .�..1.1..111�.11-::::::: .:,:::::,,-,-,-,,-1,-,-..�.��.��. . . . . .. . . . . . . .,,...,:::::::: :::::�::::::::�::::: ::::: :: : �: �� �,,-,,I. , �., � .��. . .. .. . .�. . . . . . . .� .. . �. . .�. . .. .. . . . . .. . . . .. ::� : : : � ::::::: ::�::�:::�..... .. . .. �., ,�. . . . . . . . ....1..11 . . 1 . . 1 1 . �1. . . . . . . . .,�,.,..�.....l."....�,.��.�,��.,. 1.��."..,.,..l..,..�..,..�.... �. . .1�1.�1.�1. . . .1. . . ..1:11� .�.1.1.11�1�,,.��11�.� .�, ,.��....,�.� �.. .,,,.�11111.111.1,1-. . ... .. .. .11. .- 1.�......�..�. . . . .�..��.�..��...111.��1�1...1 .��.� � .. . . . .--.- 1-1-.....1..1.1..1-... . . . .... ,. . . . . . . ... �.�.��,�. . . . . . .,. .. . . . . . . . ....... . . .. . . . . . . . . . . . . . . .. . . .1. . .1 . 1 1 1 . � . . . . 1 . � � . 1 � . , �..... .............. --- ...-.... .. .. ..... .. ------------- ... 1. �.. 1.. 1... .� �.. �..... 1. ---.. l.. - 1 , , : : : : : : : : : : : : : : : : : : : : : : : 1 : : � : :. . . 1 � . � . . 1 . . � 1 . 1 . . 1. . . . . . .. . .1 . . 1 . 1 1 . . � . � � , . . . 1 . . � . � . � � .� � .� � � 1 1 .1 1 ..1..... ..... �.. ---- - ----- .....�.....1..... --- ........... ..�.. .. ..... -- . ..... ---- 1, - 1.�. .. . . .1. . . . . . . .�. . .. . .. . . . . . . . . .� �. . . .�...-. ...........�.....�.. .. ... .... .1...., ..... ................................. ...1....1.. .. .. ,�......�.... ------- ------,.. . , . , .... ---.... �. ,���,�, - �...."..."....l....l..l..................l.�....�..l...l..��..�.1 1.�..�..l.",.-. �::1.- - 1 11, � �..... -1 � � 1.. ".,.....,...,.,.,.. �..... �..�...��....�..�.��..�.....�..l..�"..��.�,.,�.�,.,....,�."�."..,..,..,.......,.:.....l..,:..�:...........,.,......�..,..............,.�..,���..�..l..1��.�,���.��...".,�.�.N.',-.1�.�.l..... 1..........l.....,.,�,..�.,.�..��.�.����,.,.�,."..1���,:,.:: :.THE: EW'.".,.BUDGETING:..: SYSTEM.I.....(C t- d����l����������������������������l����l���������,----- .1..�1.1...1.1...........l.�.."....l...........l..,...ll"1. 1 .- �,I.l....l..,.., .. ..... n.. .. nue l, �..... .1..�.....�.�..���� 1. ------.:.::,�d,:k....::6::i:::1::.1.:......., o 1.1.��..l......����,�,�1.1...��".����.�l.,� .. .. .. .. 1..,."."."."."....l...........l....�,.�,.���..��.��."..,...��.,�.�.����..1�..11,111 .... ... ...1....... 1.. , 1. -- --- .... ------- ------ .. . ...... 1.. �.. �.. 1.. 1.. ... 1.. ......... � .-- ----------
1..11.1 -........ ... .. ......... ---- 11 .. ..... --- ---. 1.1 ........... .. .. .. .. .. ... .. .. ........ -- .... .--------- 1. .. ..... --- . .....�. ... ..... .. .. ..... ------- .......-........ .�.. .....11 --------------- -- 1.... .. �...........1..... . ---- ...-.............. .............. .. .. ......... 1.11 ... �. .11 ..... ------- --- .......... 1.., ...... .------ . ... .. ........ .. 1. -- 1. . �. � � --- ..... ... .. --- . .. . .. .. .. .. ..........................1.. .. .. ----- ..... ..... ... 1 � �.. 1.. �.. �. �.. .. .. �.. �..... .. ... ---- .......... ..-..... ..-......1.1 ........... .. ..... ..�.. .. ..-... --- ..... ..-.. .. .. �. -.....-... 1....�.............. .. 1.. 1.. � 1 1. 1. �.....1..... .. .. �.. .�..... ----- �. -- ........ .-..... ------- ---- 11 ....... .......... ---------- ... ----- .. .. .. .....1........ .................... .. .. ..1. .. ........... .. 1. ........�. . .. ..... --- -.. ... .. ................ -- ....... --.. 1 1. -.........-............. ---- - ---------- .. ........�..... ... .. �.. �. 1.. ..... .. 111.11 ...........----,.... �..... ..... ... ............. , . --------- ........�.. .. .. �. ......... .. --- . .. ..............1..... ----- 1........ ---- 1....... .. .. ..... �.. �. 1 �.. 1.. �.. - �. ................... .. -- . .....---- -..... 1.. 1. �........... ----- ... �. ----- .............. .. .. .. .. --- --- ....... ........ .. ------ - -......-... 1.... .. 1.. �.. ....... - - . --------- ..... . .�...... .-...... ..... ..... ... .....1........ --- .... .---- ...�... .. ..�.... .. �... -- ..... ..... .......................�. .. ...... ........�........ ..... ---.. �. ---.... �. -- ---- . .. .. ........ . ..�........-....... -..... .. -- .....�.. .................. --- - ---- ------ ...................�........�.....1.. .. .. ....... ....... �.. ... ---- ... ---- .. ........ 1.1 ----- . ....-. ..... .. ........ �...., ...�..... ---- -- 1. ------ ..... � ----- ........�....................... .. .. �....�... .. ........ .. ...1........ ---.. ----- -..... ............... ................-........ ---.------- -- -...�................. ---- ...... ... .. �. ------- ........ ---- ..... �.. �. 1.. ...... -- ---- ---- .. -- .................. - --- ---�...... ... --------- ............ ........... ... . ............ ..-... �. �. �.... --- .... .. ..1 ........ ....- ---. �..... --- ..... ----- ------- �. .. .........�.............. -- ........-.. .... ---..l..�.,.n,�..�..,�". �......�,.�.�,�.., ........ -- :�::::::::::::::::::�:::::�::�:.�..�,.�l..,� - 1. .1..-11 -. ,�.�,.,�.�,....,.,..".".�....�..�.��.....,.�,�.". �. ---..._- - 1.. .t.. 1. 1. .. 1 - .�. ' ' ''',..�, .� á::::: t: 1 . .. , `...f'h ... ........t------,, "".,:�� . .. ..... ,.OWIUF-:�:�:�:�sed. ions:�:�:�:Dre:s:fa, ,:.:, ,:.:,..b:rie:�.:...,..�ld'e.s,"'c''r, iD, :ion:, ,�:�:t.£!::�:�:��bud-�:�:�:D�roce:ss�:��:�:�:�:.�.�.�.��",�,�.�........ .. .. ... 1 .11 ..-.... , , :.0 . .....1EE:...,....,..l...,. 1 . : �::::: �:::�::::.:::�::::.: � :: �:: ::::::+:::: !::: � .1. 1... 1 1........�..... .. ..,..l..,..- 1 ---- ... 1. � , ...l. :ni:. ......... ......... . ....--........ ... -- 11 1 � --- -- -- ..... .....1.....�.....1.. .... 1. - ----- �::::I:::::::::�:::::�: 1:::�::�W:::::::: �� � 1 M.....------ ------- .. .. .. .. .. ...................... ..... ..... .1..,.......".,... 1 -- 1 -... .. ----........ ,...,....l......,..1.1,1, :::::: ,::: .. .....�...... 1.1 .................... 1. ---. - ,....,...."..l...,.., ".......l........,..........�.. --- �.... ------- --- .... -- ....... ..-.:. :. under: ,��t.be':��:��'�,OB�:�::S�'V'��.%:'tim: ........ ----- 1 -- .1..:::�::�:: z�:�:::",.,- -� --- ......... -- -- ------- ---.---. :_. .. ... ,.�,�".��,..�,.���.,�,.�������,�,.,.�,.,�."� ... .. .. .. .- � �� - � - "�� � , -- �. .. . .. .. ............................. �..,....�..�..��.�,.�� ....�,i.:::::::::::::::::� "..�.l...�....,....... ... .. .. .. ..... .. ..... .. ----............, -, "" ,- , �.,......,."., 1,: ---- ....... -------- .. ..... --�. ----- .11.., ..... .. 1. -- � - ---- --- .11...1.1.1.�,,�".".�'',���,..�.,�.�...�....11,�,,�,���. ---- .......,.,.,�,..,................�l.......l..,..l..".,...,...l.,..�."..l."...l.�.�."......l.....�..�,�l".-. ..... .. 11.11 .. .....�.. ... ..... �.. 1 1. .- � � 1. �. �.. 1.. 1 .1 �. � �. �. 1 �. �. 1.. 1 1 � 1.�.,..l........,.....,........l........,........... 1.. 1.. 1.. 1 1. , 1 � 1 � � 1. �.. �.. ..... ... .. .. ..... .. .. ... .�........., ........l....�..�.�..1�.�.....,... ..... ........-. ..... ..�- .-------- � 1... .. .. .. .. ..... ... ........ ........ 1...,.�....................�.... .. . .:..:.:. :-:- , ,-1. 1 �.,.,.....,.....�..,.�,.�,..,l,I,.,....�..��,.��.�,.�,.,..,.....�........l..,.......".,..�..� ........ --- ..... ---. ---- - ''...1�.".,..,.......l....l..�..�..,.....................�...........��.,...�..��.l..,..�..,.,...... .1-............ ���,�,...".,....�.,���,.�,.�,.��.,�."., ....... .�........"....,......��,�,I.,�.",.,.,.,..�,...l..''..l..� ..... 1...."........,........,.",,.,.".�.I.�l..�..�-",�,��.,��".,..��....l..l.....�,�.�...,.��...��..�.��..�.��..��.�,.��.,. .........,_ � � �. .,...l..,.....�..�.�.� ��,� , 1. 1 1 �� ����� � -1 1 �,,� ��.��.,�.,�.".""."...l. �........... -- ...... �l..�.��,..: ---............-.... .. ..�--- ........... .. �.,��,.�l...........l.....l.l,I.l.l,I.",".,.,.,-,, -, :::: :: :-:::::::�::::: ..�.��.��..�.�.�,�.�-���,.�l..l.�1.11.1..11.1...........�.�..��� .����".,.,..,.,.. ------ - 11 --, ---, , -.... 1...1.- - ---- ..... - �--..... �. 1 1 1 1.. 1.. 1.. �.. �.............. .. ..... .. .. ..... ---. -�..........�... ---... ��..��.��..,.".,.....�....�...�..,. .,......1.1..,.".".".,.. � �.��.".��.,�.,. , , 1. � 1 �..."� 1. �...� .. .. .. .. �..�.��..�....,.��.....�..��...�...�..l.�......................l.................".,..,..�..�.....�.�.�,.�.., ....... �,�,�.I.,�.�.����.�,.,�.�,.,� ..... :.:.:.:::::::::::::::::::::::::�::... �. - �.. ............ - --- -------- 1.... 1 1 1. 1.. 1.. 1.,,, , , - 1.. 1............. -------- �----------- ....-....-.. ........... ..... ......... ............ - -----�. ......... .. -:::::::::::: :::::::: ,�,� ��,�.,����,I.".....1�..�..��.-�,.��..,��,,�.1 . � ,-......... 1.......l......�..l..�.....�. ----- -------�.I.�..l..1.1....1.1..l..l..�.��,.�.,�..''...����1.1�.....,.,...,..,.,...........�.�.,�.,�.........�.l..�....�. .----- - 1 11 --- ..... 11,1,1�,I."�.� ......... ..... ----- ......... ... ,-1,.,-. 1 . .....1................1..... --- -- ------------------- ...... --- ...... .. . �.. ..... --- ..... .�...�.,�..�.,��." ........�........ . ..... .. 0.t.. ..... � ��..�..,.�..�..1. 1.. .1.. �.. ... ra........-, -�.� ��:�::B d -t P épátát íbii�����ábd����� ú mp: : Tb.o. ��i�f:��li r�:s�t,:���i:�g:t:,ep. - í:n��:����thi��I���o: B------------bif :::th.�� .U F.C::�:..�::-.. :����prociás-g::-.:::.---.... l.....�..,... --- --- -, ---------1.- :: �.... :�I.::I:::: ... : :. -�.,.,�� - 5 .. :.: ..... .. . ..�.....�.....1.1 .1 .�.1..... .. 1-- .1 :O: ::::e.e.....,...,..------- ......1............. 11.1 .... � � ---. - --------- ..� .. .. .. �..,...l...........,."..�.l.. ---............l...- -..... �.. ---....... ... - 1.. � .. � 1 .1.. 1.. �. �....... ....... 1........ ..... ----- 1. - 1 :�i. -1,1:1:: �.... ---- ........ -- ..... .. ..-........... � .11 .......1......,::ffi ... :,_ --- , .,.:.:::::,:��,:á:ii:É.:�:�::.::��:�:�:.�..�.....�..".�.111.,...... �....1�..l..t���,�� - -,.� 1,4:an :::::::: e::::.::::.'h.. - ' ':1.M1nary b dt.e-.. .. .... .Y-reDara: :oft: ---.. �.�.'�'����� 1 :eret ,:::::1.1-- ........ C.-- -'---ÜE1 é ���b..!���������t ::::::,���l����� ittüál��.�������� tí'yf.1.1.1.....�...�..��,.�,�-111,�,�,.� ... -- .......... ----------- ��:�� � u ga ���::���:�req s,�,s,-.- ----- .11 ........ .. 11.1..-:: i:T :...�..l....�....� .".,.,.....,..�..�...�.� � - � �-1.... 1.. �. 1 1..... ----- ........ 1.. 1.�,.�..�...,...,."..,."..�."."".".,��1,1�.",�.l..�.I.l.,l.. .- ::�:::: :::::: , . -- 1....- ........ � �.. ---- ---- .....1........ ------ ..... �.. ----- �.:::::::,:::�:,:.!�::::::::::::::::::::::::::::: ... ---------.a,w, :::�::::::: . �........,.............�...........".�.�...l..... �. �,.,...,�.�..�.................�.��.��.�...��1.1�.11.��.,��..�..,..-- 1.. .... .. ... . ........ . .........�-.. :.. . .. - .- ... ��-...... ..1..,1:. ---.....::::� didolstráti. ,.,.::`, , títié 0, 1 �t,f.,h ... Id 1 .- :.----:::::::: �:Ve..."�o-1,f tíftho:: mi: ... .. .V .t Dve.. j ,%mm:_*n.:.:t .... 1. �.a, - ci, 1---1..: � i. - e .o.W : ..i:v1$ s $ ---- ---------..... ---- ... �...., ..,..,.,.,.����,�",�,I."...l..l..11,�.",��l..,�....... �..�..�.� ------ ..... ..... 1.., .. .. ..- 11 -- -- 1.. .. --- 1 1.1.."..�.11,�.l..,..,.".".......,�.�.,.,.........,.......,�.........�.........��.��. -3X -. 1....1,.. --- ..... --------- ........ --- 1. 1 -------- ----------. , 1. ....... ---... ---. �. 1.1 ..... ".,...�,,-",,.,,..1 .. 1 1.. f---. � 1 � 1 1 1 1 1. �. � �,f�,::,�.. � �.........�..... .. .. .. 1.., ... --- ..... .. ------- ..... . --- 1. ----. 1... ------ -.. ........ �l.,�.�,.,..l..,..l..�.�....��.�..�.,U�n:í:t.1..,....l..�,..�.l......,.,...,d.. ..".�.,.".......l.."."..",�""...--- t ... ,�lt.�..''....1: y: ::,:t 1,.--1, �. .�..�1.1, ., 'd' -- --- ---:: I----:::1' ' tD ::::h1�,�.-::::: � ,---, , ,,-... -----s::1 o r: � 1: erent::...:.actíví:t!CS:.:.�an.d::the:::def:inifdr..11 -.... 1 -- - ---- ..... . 1 -- ------ �-on:: o: :: :: . . pu. vu. s�:.:�:,�,:�::: n ,....1. - --- -- --- ------- ....- ...........�..... ---. ... - 1. 1�1 1 1 � �. � � �... 1.. pas, i e, 1......---.... --- ....... ,.. .--- 1 - 1,11 1 -- 1. 11 11 -1....---. -- --- -..... ----- ........ 1.... ..- ....... �.., ..... .. 11.11.11 :,�,�---- ........ --------------- �.ffil, -:..1.1,::� � � �:� ,i,.. 1. �. -------------- --- ...............�--------- ----..,- , !:::i�:::�. ��::�: � 11 . ------- � --- 1 -- ------, ---- --- ..... ..1 ..... ---- 11 �.t ,é ü �:::�:�:�:::� 11 ..- , ..,... . .. �.. �. �. -. 1 �---. , � l --- ,,1 , 1,Efi- , ,'d` 'h ' 'Eltí ftj' ':1.�� �cen� � r,al::1.. 1.:l::: �:: �� S,::, n1t.1 1::�:::�á tb.e...�.,-�.--- V:::_....t:01 :ce ---en es::..: ::.: ,�l",��l..1 � � - ---- ------. .1.."�"1.1,���,,�..,..,. - ...... �. - ---. -- 1 .. : �,ilX;.i�90 : :49��::� J.,an: � ��t. e:��d,4----.. ... ..... ... �.l..l................� ..... 1.1 .... 11.1.1 -- ...�... .. �. - �... ��.�l..,.�,.,.�l. 1.... 1.. ,.,..l..,....,........, .... .. ........ - 1 1 1 1 1. 1. ..', 1 � �..l.�.�....."..... 1. 1 � � 1. � 1 �,......l...�.l.. 1...l.�..�.....�..l.�..",..�.,..�...�.��.. � -- "�.,�..".,.,.,.."."..,�.,.....,."�.".,....�... . ..... .....�.................-....1..... . ........1..... ... .......,_ .....-. ...... .. �.... -..... - �. - ---.,, ,-- ---- ............ ... - :: ."..l..1 �. �.� .�..� .,� � lli " '�1,111.11.1...11.f .. .l.��...�...1�..�..�� - --- -. , 1 , - �..A -.---�:.:.�:1::::::�:wh.at.� a,diáiní t't'... s ratíve:::::.uni �s...I-orw£,...111 ------- - 11 .. 1 . �. �. . �:�:�wj. �,� �l:>er :the:, d'f ... :: , ---t, ---t'a. - ,.. .... 1..,..l..'',.,,.",.,,�.�..� ..... ---- . .... .. ..... .1 1 1... 1.. er�eirit'�::. ac.. isr1 i es. ��:�.an ::�:�:�ap-ree�:�: an.",...,.....�... � � 1 �.. 1.. 1.. �.. �.... .. �........ .. .1 � 1.. � �. 1... � � 1 ,� � , � 1 � � : :: 1 1: '':.:,�..:�:..:.:..: ... .. ...- � �. � �. �.. �. 1 � � 1. 1. 1 1. 1 ------ � - ---..... �.. �. � � -� ,�...l..�..,.,�.:::::::::�:::::::::::::. -- .... - 1 . - --- ... ----- ........ -- ...1.... ---.... - -- -- � ---- . --- 1 1. .1�---- ... .� ---. ------ - ------- .... ...-... 1 11 - - .111 ---- ------ .... ------ .... .---... 1.. 1.. � 1....... --- -- �. ---. -- ---- �1,1 1.1 -...... -� �. , ,.. �..... -- ,-1. �1. -- ... .... ... ... . .,....,....:.. -, . ....., ., . ......--------- �. -:, ,.�:�:. e :: S P-D �: �.�.1--.�,.. - -. ¡a .�.:: .a::�:ico=on.,:nomen,cl:,á�t:uré,.�:�f: or:��:�:��l�.nD,ut s, Th''t' 1 t,-----. ---. . .... 1. . . 1. �. �. -- :, :,: �: �� �::� e: nXt:� � �: 5::�: o�:: def ín6:1::1: , desite d:.. .1 1.. 1.. 1 1. 1.. �. � �. � -'.".---- 1,1 ', � " , " � " -- :��,1. �,.. ........ 1.-� 1 11... 1.. 1. �...., . .. ........ ----- - �. - ---1. .�...l.......�.��.�1.1.�..11.1..............�...........1��.,..,�..,....l.......1.1�,,�,�,�........l..1,11,1� -- :: : ::: ::: � ��������.,���,.���,��,�,,�1,11.1�''. : - .: .::::---- -. ........... �..,..�..,.,...... . � 1 -, �.. ..... - ---- - ---.- . .. -- - - -- -......... ........... 1.....l..,.....l.�..�..��".�,.�l..�...�..,... .. .. .. ..............----- ..... .--- - �. ..... ----- � --------- ....................... ..�....... --111��� ��:.1. 11 .1 . � .. .. . .: �:�:�:� :::�:�: : ...... .1..:�:��OU' DU 5:�:�:�:0 ::.�:.�. es- '.... 'c ivL Íes:é1....:.,.. hoo1i 1:1h1Vedvc"C''i',n"'a':tio.ns. pcné -.. ,-::::::q :�:::::::: ....... ... 1. ---- : ��:':,.�.::> � �� 5 � � � -, -- :-1 unc .e a ... .s e.r !::::.,�A..�,,�.",".,�.�......,. .d 1---.: .�..�.1.....�..��.....�l.l,I..l..,....,..,.,.,....�.�..,.,...........1.1. -1 1 1 1 � 1... �.., �.. ... : :.���.,�.�.����,,�1.111I.".,...... ----------. �::::::::::.:: ,---1. ...l.��.��.11..l.�,.�1.11.1.....l...........�.�.l....., ................ 1. 11 1. - 1. ---- 1. 1 �. � 1 1 1 -1. � 1 1 1. � ���.�,.� � � � � �- 1 � - 1. 1. -1. �- ., 1.. ------1,,-, ....... 11.1...1.1....., ................. 1.. 1. �.�.�..... � .. �. . -�.1.. ..��1 1. �1r�,. ,,::: - kIl - éterl: fdtb: :'-11.1 a ---let �'��,����������:Báléd��'��'''' ..t'h:::é''t'1.1,�:�:r,oa :: al e---ma t..�!5��l���O.� i.������ O����P : 1 Qu& 1. 1-�--. ::::O : �- � 1 ---......1. t .... 1.. -- 11:1. - 11 1 :---on---. ésa.c-...... 1.."..1.11..............l..l..�..,.�,,��, ....... 1 1 1 1 1 � 1 .l-. �....... �... - - ---- .. ......... 1 �::.��,.�.�.. 1 11 1'11 . �,0- -- �..,�".,.....,.,�.".,.,��l..,...,...,.,.",. ---- �. �. �. .11.., ..... .. - �. 1 1.. 1.. 1.. 1.....l.....l.....l..,....,.....,.....,......l. -- 11-1 ---------1 -1 � 11 1 �, 1 � 1 �. � � � 1 11. 1. � 1 1...�....,.......,....". �. � �..... 1.. 1.... 1. 1........ .........----- �1.1�.I.��ll.,,.,.�l..,�,�,..�,,�."..l.111 -- 11 ��,�.,�.�,�� . .... --- ..... �........ .-. .. , � . , , .. .- --- , --- 1.111 ------ -....... 1....... -------- --1.- .. ..... ..�.,- - � W, ------- ................... ...1. 1 �. --- .. :l �� w:; ... ------ �. ..11.1.1 1 ---. - - :, b,: -- � �,: j, ..C. ---..,:. �::�:Y.ear:�.�:�::��.ea,ch:��:�:�ent:l�t,.V.�����:d e, ::�:�:a�:�:�:Dr4a iminad.., t:�-� h,:_: ---.. ó-y���:�� Lagnos s:::ó : 1 s : eri ormance.�:.�:.:::i.whi áti ..---.,.....,- :..:.,,.::..:,:..,:,,-:,.,,,,���.,�r, l!: D---.... 1.- ::::�:::::::::::::�::::�:�:��:���:�:��i:::::::::��::�:::::::::::::�l:!:�::!::�::::::::::::::::::::::::::- 1,1,1,1,�.11,�.�, - 1 - - �.- 1 - - ----- - --- 1. - ---- . .............. 1........,....,.."�".�,.�,�� ..1. 1.., ..... 1.... 11. 1... �.. ---- .----- � �. -�.�.�,� ll,I...,..�,.,�..,.�..1� ...... -- .. ..... .......-.... ---.. 1. 1........,,�. ----- . -- - ------ ........................l........,....�..�.��..�..,.,..,..,,��.��..., .. 1. 1 ,---- --- .. . .... - , ---- ........................ ------t ... I.l.t.",��..�l.., .... ..........-....... .--... �, �,i�d1,�.as�:.,. . -- , � -v,lt-.�,-..tpuS,.,..�....a.S,.�...1.. .:::: , . �é.:.,...:x.o:.:.,.án � -��e�,.:::::�oli :�.�..W,� .�.. -1,---:� �: � resu in---...,th , ,Odé£'ni:�t:í:on������ú�f�:: actí 1 1d---`des'LÚ1', it:.:: -1 . ,� � ��'""'.,."..�''.",..''.,... 1�,V., 1.1..---- 1. - � 1.11 .....-. ..... 1.. 1.. 1. 1 � -1 -- - - -------- ..... -- - -1�.11...�.��,.......1.., .. .. ..1. ........... 11.11 .. ..... .--- ----. 1.1.., ........... .....-... .1. ---. 1. ......... ---. ---- ---- - :1 - �. � � -:S:::,:.. � �- ---------1 ... .. .------... --- ..... �. .. �.. �..... 1.. -- -- 1 �. - ---. ------ .............. --- . ...11. - ---- ....... .1.1,---. .......... �,I.,�,�..,......11 1. 1. ...........,....,..111........,.... . ,...."".,..�.l.....,...Á..l..,..l.l,I...l..--�.�.". 1.11. - ----, .. ........ ,.,.,......l.....�.,.,.,�,..,.........,........�.�..1� ..... 1.1..�.......�..�........,.."..,.......,.tw.£,:::w: ,�.11....,.,W.b.w.�ii w::::::::�:::: ---- , ,.. .. .... ......... ,....... .r .... ::,. .. . . ..:: e.alloca 1on::,p :::�:�:res,Dons.i ..i. .Ities��:::�:amonz:�::e t:ítíe's:�in::::acc:ord ' th.: ,th ' .1 1U ,.-..,.1......-. ... -- ::::: - , - ln-.: , � � � - � - -- �::�vli---- ............. 1"".,�......,..,.,...,..l..,.,�.�,.�.�,.�,,�,I.l..... ....... -------- ........ .. ..1... -- �.... -- 1 � -- -- - ,,o.ir-.::.r.e ... a---. lVe---.......1.., ........ ----- ..... --- --- ------ ---- ........... 1.. . . ..... . .. -- ---- ---.. ---. -.... 1.1.. --- .. .. .. ------- ........ ....------- . .. .............. .. ---- 1. --------- -- 1 ---. 11 ---- --------- ...... 11 .........-1.. ,.,.�..::.�.:.,.�:... ------ �. ... ... ,----- ...... ---- ... ...........�....�...�-.-.1.11 ... ........ ..,.. 1 1.. ór---- -,. . ...-- 1,... . ns : ::¡:.:, : ::::M: ��.: 1: ::::. � 1. 1.11 na - .so:í , `�i�:�::::::: .T ....- 1 t ii¿é:::::,.:::It:::: iizht' b ---a , , , "Ide&�.::,::t,,, �',:...,���p-�� �� �:�C�l:�en ::: . ,.--,.... ----- - - �.Y":,��:..,::,..,.::":",::,..�..�...� ..... 1..... . a---------,11 ee :::el�::L�in:iit1, 1 -- . ... ,. .1. , --- 1.W , "...����;Ovér�il.1. --- ---- ---. ...... -- .............. 111, ---- 11 --- - -- . � - ---1.-,p4n ---...--- :::::: �: - 1,1 - -1 � � 1 � ,�,,�,,� 1.1-1-- ----- .9... 11 ----....... .....- ..... .......... ---... 1-- - � ---- 1... ------ ,.."�.�."."������..l..�.�...l.��,-�..� .... ................. �..,.,�,�.'',�",.�,�",..�....�.l."�.....l....:: , ,�,�,�,.".�.�,.��.1.1�.�1,1�.."�..."..�...�.,�.��..�...��.�.�,,��---- ... � � - - 1, . ... .. ....... .1.��l..�, - --- ..... �.. -... b....l,��.,.....l.....,...... ....-�..... .---- t. ---.- .��, �e.., en, ,i L. y:�:� �1---.�:���civen�:i:activi: v�:::iri:�:�: ,J... :... t t t:�:�:uro,.v.i: 1: iít �,���.��..�� in ,la th ..- hat, , ------`---d, :::: � 1..',-,�:�����::resDons:í i::::ities�:,.:i::�,c''óhdéhtrát� �:, , á,........ �� ���� .. 1 9::,1-11 ----- - . -.. ..... 1.. 1.-:: � .::::::�::�:::::::: '"' - , -- :::::�::::. ---- � -: �-,..11,�11-�.".,.".�..�.��.�..�.��..l.".., ........ ----- .... 1..l..."".,�,�,.,�,�,.�",�.�-�.I.�....��,.���..��.�.,�.�.��.�.�.,�.I.l.,�,...."....,...1.1.1..................l..l..l...�.....1�.l..�.11.1�.I. .1.1t.::i-..��.... 1.----- ... ����..l..l...�..�..�....���,.,�"......�.��.��.�.�,.,��,.".l..�.....�..�..�.��-�..1.1....1.1.1.�..l..''��,�,,��.�...,�.�,��... .. -1...-. ... 1..... ----- ��.�,."."�...�..�.�.��,���11.11�.l....��..�...�,.��.:�,��: á �:..:P,f:fu �tl, ,..�,,�"1..� :::�l::::: ... .. 1,11 ......... ---- �..l......,...........,..... -- 1.... 1..1.111.1 ........ .. 11 ............... �...l......l.�..,�.�,..�.��.��..��...l..Mó 1 1 n, .. ,y .��...,�.�.".: - ::::::::�:::::::,:�:::::.::,.,�,.,.. ..... .. .. .. ..�. .......... .. .�..........�..�........l.. ....,..�........�.1 ...,......,...... ....,....................�..............�-.. �!:::::::::::::::::::,I::::::::::::::::::::::::::::!::�.....�.�..�l.."..l..."..,.,.. .,......1.1...............l..,.... --- .. ...... ... 1.1..�..�........".��---- .. . ....... 1.., ... --- -�.... ---- ..... .. 1.11..�...�,,�l..,..�...,�....l...., ......... ........ .. - --- - 1. ..... --- -- ................... ..... --�. �.. ........ .. �. 1. ........ ... �... . , --- ---- .......�..... �. . ---- ---- --- . .. .................................... .... ..... .�. �. ---- -- .......... .. .. .....1.. ............ 11 ---------- .... .......... --- ... .. ..-... -- � ---- ..... �.... ,. ----- 1.11 ------- ...1.........-... ...... 1..-..... �.. �.. . �.. 1..... ------- �... 1...., - - ---- ...�..... .- . .. . . . ........... ---- � .11..., 1 -- .. 1 11 1. - - 1. ...... ..... .--- ..... . ......... .............................. .....�. .... ---- - .. .. - -- ................. �.... .1.. ---. 1. .�...�...1.1....l..,...I."."""�.11�,�,,�,�.l."..�.,�, . .-.. ,l,l,"�,11.�,�...�.�,.,......''., ".,�,....,.,."......�.�.�"..."......,.....�",....�. -........ .. 1.1 ........1.... ---- ....... -- --- .................... ..... --- .. .. .. - -..... ----- - .... 11 ---- ...... 1.1 .... -...........1.. .. ...........-..... - 1 �. --- ....................... .. . - -- -.....-- , ,,,-........ .. ...-.................... - -- --- ............... -:::::::v:::::::::: � -� � 1 � --1 --1 - 1 -� 1 1 ---1 1.1 1. -�.. -. ...., -- 1.�..l..,�..".,�"",...,....�,.�.,�,�.,.,.......�..�.�...".�......., ............ ---- ----- �.................... .. --- -- �. ----- -- 1� 1. -- ----- ... �. ,.,..,.,.,..".".,..,........�",�, 1,.......... �.., ... - - - --- .. ..... .. �........ - -... 1.11 . .. .. .. .............. .1 ---- �... .. - -- 1. . ........�.. .. .....�..... ........... ..-....... .. ------ -... ------ ..... ....�. .. ................................ .. .. 1 ... 1 1. 1 1 1,�".,.,.,..,....�,.".".",."..�..,........1.1...l....."..�.�,...........,.,..l...� .... �..,�..,..............�...,�,..----- ........... ............ - -. ..... �...... . �. ------ ..... .. , , , , , , , , - "".....,."..''. - - -......-------- -...... .. - - -- .. .. .. .. �.. .......... .. 1 1 --- .............. ,�...."..",..,�..,.".. ,�.�."..l..,..,..,.�,.�""..l..,�.................l..............,�.l..,...1......�.l... ...........1...1------ 1. 1 - - ------ -- ............. . .. ---------- -- ----- -............. ----- ..... .... �.......------- .............. ..1... 1,1 ........1.... - --- .� 1 1.. 1 � 1 � �. � �. � �. . - -� - ... ---. 1... 1... 1 1. 1. �.. �......... .....�..... .. .. 1 1.... 1 1..... ---- ... 1.1.1..11 -1 ------- ................ ...............1.... 1..., .................. .. .. . .. ........ �.., ... -1 .. ..... .. ........... ............... ... ........ ........... .......... �..: ittát v---- 1 �---. --11 � �:, ��e-S.�.�P-- .... ... h" dtí 1, 1ntí t --- , $- Pr.01 1:1U:£::Vl,ary...,����:�,., 'f , � 1 -. 1 S. .e!P.":...llac l ,��,1 1- 11 ue:��e,�:�::�:::�A :t�é�i?�����th::�!!,:�:,.t>.ro:I:��l:m".Iln'a'r.'Y..., ,1trlly-):ar�o ��:�4:��--..... ----- :�:::::::.:::m:::::::�:::::::: ... --- ------- .. 1 1. 1. �... �. 1.... -1. ,�,1 1 1, ..., ... 1. �.. ..�... �� �.. - ---- ,... --- � 1 ---. - ,.-.I.,- 1.. ,.....l..,..,... 1........-..... .......... --.........-......... .. ---.... - -- ---- -............... .-.-- ,.-' ........ ---- ... ---- ..1.1 ......... 1.., ........ �.11.11.1..,.....,.''...�.".�..,..�,.....,..��.l..�.�..1 ... b.., ... --- ... .. ��:,� --- ........ 11.11. 1. ---..., . . .... 1"...� 1.- ..,��:aee::: e1 ir ¡11 pu .,. vera-:,,,--- ..: p.:`:-::-:- .1. - ---d-- ::�:t -:::: ... .1.1..l.�..��.��.t.'' .�l....".Isl�... -, :.J::.::::::�::-.:..:: d 't -f :�: '" ,h: �:..::. l U i, 9 ��:�ii�..:�:::S, .ec 1th 't' ''d'bí d-:d - d- t- -.... ---...1... .....s4 ing����I���.�iv��,"�l���:�l. .u s: ne ae ::� to.::o. tn- -- - 1 1.- ...1.... .. .1..... ... .. ..... . . ..1. ..... : y�. �. .. . e 1, ...... .Pu ... s ":,::::-lle----- ............. ------ - 11 �. .------ ... ------..... . .. 1 �. - �. .��..�......,..,.,.....1.1.1 11 1 1, 1 � ,�,�,.�,�,� "."...,l,ll,�""�"I.".�,.",", .. "".,�,..�"..�.".,."...." .... "."..,.....,....".,...l......1. ...... 1.. 1. 1 1 � � 1. 1. .�: - -�. � � .. 1. 1. � �. . .1.1.�,I.l.� 1.. �.. �.... 1... 1 -- . . � �, 1 � 1 -- � � --- -- ---------------. -1 � .� 1 .� .. .� ..� .--.,l .� 1 .1 .. .� .� 1ilv ... ------. - -..... ....... .... -- ....... .... �1.1�.. v ... -,.. . 1.Du! ����:�: � e e ,Y::::_._ .::O.r. o:4:::::!:::::
. ---.... .. 1-........... 1.. 1.. 1.. 1 1. ... i����,,�.", -1 1 .1 ... �...... .1... ,- ,.. . .. ..... d' ff .. ntm 4r:::::::::::�::::.,�:.�á-lt,ém''' '"''!,.,.es..���are����-.normál d �lfó.t�����:� Í � tré t�����butt... ---.1... � ..,....,�.�.�. .1 1.. -.... m1b<,t::..,&".,., b'..... . ... ..... 1.. 1. 1 ---. 1 1 ��. .1.., .. ............... --- 1 11 11 - ,�..11.�l".�"........,..". �.1. .::::. -- ..... -,�...... 1.�.��.�,��,.��., .. - 1...... -- ��.Ptop,.Ité,..�:. 1. . ..�.�. . ....... --------- -� - -.. l..l..,..,..........................."...,�.�....,.,. ... ... 1..., .. .. ... 11 ...... �. ---l......, .......... 1.............., , ,.,...l."..........,�."..........,.,...,.........................�,..... ----- ---- ....... .. .. �....., ..... ---------1. -- ------- -------- ........�...............�.... ... ---- ........ .... ,..... ---- .... ... ......... 1. ....... ... ........ .. ...... ,-c op :: Aun ... : -- ��, �::. ::i�l�T-h :t ..,.-,-. .................. - , 1. t....... ---- ---.,.....,.- ...... ::: ...::ow ... .. .h- --- - - -d : páti d d .......1U., e::::::� )ase:�..:..:v.ac.c. -, : .`S h1 W aS , ---S(Irve , "�.,.� .)���1.1������������:..�.�i. , .---- .1.1 L: -1,..1...... ..... .,éiit�á::'�:l�átt,éti e::,:e-c -1.-�,11�,,�,.�..�.�..��.,�'� 1, ....- .. ......... ---- ....... ..1,--- �...l.�l..�..l.�. � � 1 � � � � � 1. 1 � � ----, 1.. 1 ,-:: ...�..... �. 1. 1. .. :....�..�.,�.. 1 .-.........: .V4:: -- ..... . .. ... -1 ---- ...-..... .....- .... 1........,..,..�..."".,....,...,.".. --- ------ ---- �. �. -- -------------- ........1.. ..... 1.. 1 1. .. �.. �.. 1.... .� 1.. 1. ..... ...1... .............-...........�.. .. .............. .... .. 1 .1 1.- .. .... í_- .........,........ ........... .. .. .. --------- ............ ..1. .....-. 1,1,.l, : : ;-- ,�,�,,�.""...�..�. 1.1.1 . -1 ��. .... ........ ::r. $: �. � �-:: .,o ::córi rte :: �.n :O,:�::::::.�:::::e.st, mat.�,$:g..,of.::raiQüt�o - ids S e---11 t... dona 1, -n- h ' í e al,�:�"'' Y , - th , ',' , , , , ̀ , , ' ' ` d ' - t' ,.. .. c no : x, ... .. ts,. 1,..�---- - --- ..... 1.. -..... .. --- ------- - �. -- � � .11.1 ----- .. .:,,, ---.,.....�..�............l..1.1..,.,.",..��,....��.,�.��.��.�,.,.,..l... .. .. .. �.�.�l....l.., ............. .. 1.....1.1. --- ------ : -::: ---- -... .. .. �. - �..... .....-.. ........ ... 1..... �. 1.."..�,.......,.,.....�,......,.....,..".�..".�..�,.��...�..l... .. ..... .. ----- - . , -... 1.....�.. .. ..... - 1. -', . ''��. ---- . 1. 1. 1 - ��l..l..1�.��..�,.�,.'',.,....�..,.����,.�,�,11..,�.��.��.��.I.l.�l,I. --- ..�.�.��.".,.,�... v r:�:�::,an:�:�:&F-,ree 1 ,�. -. ..... .................�................-1.. ........... 1.. -1.�l...,��.��.��....�,.�w., ,: �: :,:,qlffit' l£d-ven���:�mon �������,------in, '''' '" , "''' .�,..,��.",�.''''''� ...... .. ̀ , , , "`---,.. qno arv:�:luni:tá�� b. :..�t� :il.�..t�útt,'é' t... �,.,..�..�................�..".�.l..".�..�.���.�l.. � l.1.... - -. �.�::::::::::::::;:;:::��:::::::�::.�::�. �,j, �:veai,~:�.:�:�:�:�:�:�:�:�:�:�l�:�:�:�:�,� -1 �.��.��.��.� .. -1 1.......�. -1......1................- -1..,.::�.11.1 .. .. .. 1....�..�..l..,..�. ---- �..l..� .. .. .. �.... �... .�. . ...... 1..,...l.�... -: ::-:: . ... ........... - --------- ... ........ --- .. -------- ...........�.. ..... ..�.. .. .. ---...,11 --- ---- ........ .. - -- , ------ ........... ....-..... �.. .11 . ..... ..�---- ............................,..".�..�.11..�.l....,.,..�..".�,.,�.���.,�.,....1.1�..l.��..l.��.,�.....l.�...l.....-..,-......................�..l...�..1�.I.��...1�.�,��.�.,�,�.,�,�,.�,�."."..,�...1.1..".....l..l.�,�..�....�.��.�.�.1.11.11 ..... ---.. �. -,..l.., ..... - �...�........ ��.�..�.l..,.....�..�..�..�.�..�,.�..1�.�..,..l.....,.....''.,.. �...,.,....�.��,��.�,.�l..l.�.I...... .. .......... ------ ...... �. �. --- --------- ..... 1.., ..... ....�..... ---.... - -......... 1. .-........ ..........................----- 1.- �. . ---....., .....-. ........ 1.111 -- ------ ........ 11 .... -------- . .. ........... �.,.,�.�.I.l..�.11.......,..�..,...�.".�....,............��,.�..�..,............�l."....,.�...,....,.,......... ..... - ................... ..... - .� -�........-... - .1. - -..... ------- � - 1 - - ---- ------ ....... � ---- .........�........... �.. �.. �.. �........... .. ..... ... 1. -- � - � .11... .. .�. ----- - �. �..... ----- ---------- ---------- .... �,.,.,.�.."...,.....1�...11.�.,..��.,�.".�,.".,..l.....�1.. .....1..... ---------- ... ... .------ ........�.. .. .....-... .. ---- --- ..... ---- ......�.....-..... .... .. . .................... ......�.... �. --- �... --- .. .................................. .. ------ ........ ... ..1.............. .. ... .. 11 --:::::::::::: ::, -- , - , � - --- � - ---- �. -........... ...�... .... --- .......................... ..... .,..l.......,........,..,..,..---- -- 1 11 .....�.. ........ ..�.. .. ...........�.. .. ...... ..�.... - �.. -- - --- ---- ...........�.. ............�....... .......... .. ..... .. - --- .... 11 .....-.. ................. --- --- ::::,F-- 1....��.�.1.11�l..�.-�.11.11.-I..��.����-I..,-..�---�-�.''-.��.�,.�,.�-,.�-,-.� .. .....-.................... -------- ..... -- ........ .. .. .. .............. ..... ... . .... .�l.",.,:�:.:�:��.: -- �. �. ------ ........ .. ---- ..... �.., ... --------------------- ... �. ----- --- ........... ........ .. ......... .1 ------------ .....1..... --- ---- -- --- .. -- �. -- ---.. �...�... ..... �. �.. ........ ..�... ..... --- ........-....... ...... .. . ......... ..... ..1...1.... ---ii::::.- ... ---- ...............................-- ,.'. 1. - -, , ,, , , , ""' , ,..... ... ....... .---s. --1� 1 -..1 ,s, ,,,,.''�����a�p,pro,ve. :�����:�..1, .,:o£.'�:��th-: ...... -h' '-,- tm�- t ... d:is'c'u''""s''e"d"""''"''-d.� .:,�,.es�e:::�:D . .... 1 I `::,�recues:, s::.. ..-.,:::T: , - ::Iminarv�:���bü et.: en Lie:s::.,are.�::�:�. em::: --- �,�."�,�,., , ::., � X- ...... .1. . .....- ... 1. . ..,.....,........l...,.. ------1..,. .... �...1-1....:-:I::i:::::::::o: 1,�. . .1. . . .. . . .� . . �. . . . . . . ..1 . . 1 1 � 1 � � 1 � . . 1 � . � � . � � . � � � � 1 � . 1 1 . 1 � . ,. . . . .. . . . . . ..� . . � . . �. . . .. . . . . . . . . .. .1 � . . . 1 . . 1 . .1 . � 1 . . � 1 . 1 . . � .
1���-,.� � , �� , 1. �. . . . . . . . .. . . .. . . .�,ft1--1.1
. .1 . :A: : :: :: : : ::: : :: : ::. . . .. . �.. � �.. .. ...
� . , � . .. .. . .. . .1 . . � . .. 1 .. .�. . . . . .1 .. 1. . .. . .. . . ...... l.� .1 . �. . �. . . . ..
,�:�. .: �.... .�,. 11 .... t................ ........ .... .1.. ........................ �... .... 1........1.....-1........................ ... 1.. 1. � � �.�,.��.1---... ,...... 9n.j>Ux $��:�:O,r,. ---..,h'- : h: :�::::: , ,t*,� .:,:.,:,.*�r.: 1 �.� ��..���:�� �v.����t e�l4 OMI.Cftéxédút�i�': - `b ::Bo C., alaiá , , ---.. .::�inodl.fí'é'd' b---- h' 'bttdgle::�::��C.O t t0 :::::�. ,O- -va:: rai j:::.:,1 .: ..,-. 1... 1- .......... --- .. 1 ........ :.il�a�.11 .. .Ip,:���11''�..�..�.�..,.�.�.�................�... :::.:,:::::::::::::5-,!::::::::�::::::::::::::::: ... 1:.,.,11 -- ------ 1. 1. - ------ .0..... 1........... .. 1.. 1.. -1 1. . -- --- --------- ...... �. � �.. ..11..1.- ', -` ..... --- - ---. ..... �.....1...........-..... ------ ........................... .. .. .. ..... .. �......... ..... ....��.��..��.�....�,.�....1�.............-... 1..d�:�..l.....l.�� 1,1 1..., , ---- --- ... ..... .,�. �....�...... ........... -- ............ ......... ...-- , .. .:-..:::,.::.:.:.:.:::,::::::::::�::.,..l..,�1.1.., ..... .... --.. -�. .......,- :.. �.t ....... t.......,."."..,. .. ..........:,.! ........- �..... 1 �n:�� e:�:: :A �: -:-...- - ...,.� PU. S�:',�,.�:���:�,..�.., ns, .:�:o� - -. 1 ............... ........-:::..ass, el te. �.. ..W. I.t ... t t .: -b - ::i n-ad- á::': ú: -ta m.. t. .. -.. 0--f --0- á. - -'i tf---...-. � .- �P.- QUIPIP S::c a pg ,a1.1. 1,,, ,�:,:,::..,:a ,l,- � -111.1.1..�.... .E- 1.1.. .. .. - -- 1 .. �. .........�...... 1 .11. ---- - -. 1..".,.."....... 1.. �. 1 �. 1 1.. .. ¡cac1..... .. 11 --- --- -- ...........1.. ..... 1.., ... ---- -- ........ .. - ---- -::é: -::--...... ..... -- :.- :!!::�:::::::::::::::::.�� ..... �.. �.�....l....,..,...�.�..,�,."�"..,�,......... ............ ..�...�...........�.. . ............ .. .. -- ....�..... ...... �:����:� 1.�.�,.�..".,....l.....1�,..�....��...."......l....... - -...... ---.........i.".�..,�.�.. �. ................,......,....".,.....,......l.....�..,.,�..,.,..,..�"..�,��.::t� -. , .. :: ..: ,l: �---- .....1.....�..... .. ..1.1 ............1............�........ ..... ..... -.,..111.1.1 .:�..�:....,..l.....�.1----.....1. ....1.1.:�l�� Pc :::::::::::t ..é :O �al.��l��j» ,...�����: �.. ..... e�:�:.: o�::�Yr1.....�."�:Unaor q:,....._Cu. ":O:::.::.....h, ..o ácid �. �....1.. s. .1:� ákltn�z��i��i��a. .... 0:i,�0rtmult �i ed. ,...e.,�..�... , ,t---a,y .. ....t..1 . . . .h,11..1.1 .1 - A �i�::::::,�.�,� .�.,....:::�.�.. --- --- ....: . .: U.,.... ...... ........ 1-:- �......� � OW �............�. �. �.. ........ 1.. 1- .::::.:::.�:::.::!::::::::::�.,� ................................. --- -.�,.��.�.��..�,.�,.�.��..�.,�,.�..�'�.�,.�.��. �. �.�..�...�.....l....., .......�. - �.. ........... .......�::-:,: ,,�.,:::::::: -- 1---... -- ...... .......�� 1.�.."..�.��..�.�...�.��.�,.� ........ ,, -, , , ,�� -�.�-�.�-�.".,.,�..,.,�....��.��.,."."....�..�.,�.�.."..�.��..�.1.1�.�.....'�".�..11.1......��.."...,.�.....,...,.�...........,......,...,.,�.-- . ..... -- :. -- .... �,a, t i n1,c,án h' d - stád':::tá: thl 's':::: r'e'vj -s:-éd:: ....:.d.e.a.�í�'r','e''d:",.out t:::.:1 áfia:�,�:t�h�<:�-Á�����bu<il:::Z:::�:e:::,:t:::��,���lál'"I,;,6:,C', , ,�-,---. .�.l....,��ip , i� �. ::::::�::::::�:::: : - ...".......,...,..�..,..".,."..,.".�."'' 1..".,.�...�,.,�.�,.,..,.,�.�........... .............. ,eve.,:::,:,,:::: .......... 1:::11.. �. ----- - 9..�............. �. ---... ...... - -.. --- --- --"�.���".,�.".,..l....l....... ........ --------------- ...1,- -- -: �.:�:��:::::::::�::::::::::::::�:::�::::: �----- .. .. .. .. .. .. I.:..l..........�l.....l.........l..,..,..,�1..... 1..�l..�l.".,.,.,,.�......,..�.�.��."...�....��..�.,�.��.��.11..� .. .............. ---.. ---------- ---- ..... --------- 1 .------- 1 �.. 1..., .. ........ .. ......1.......-- ,,:i..........�........�:. ................. -- �l,:é��:�: . .,. . .. �.�����. ........... ---..t. .. :4 ....... � . ---.. ........ , , -,:.::- ..... � - -- ---....,d, , , , "' , , ---h , ""' ""' , ̀ ̀ ' Í ' 4..,....:M.., t------- . ., ,:.:.:: � -C.o . A :. 00 ��:� aca 0, ,.....-,..,..... .. .�,.�,.� .il:f�:�:�:�t-hil�:::í,14 �t �cut.�� :Ciwn�������t:�e�:��:l�P 0.00:0ej :�����XIM r..: -: :: O:Ve�l�::::�,�:::���������P.:Or�I�:���OY,�:1;:..:;:. .$..1 ............... . .. ... 1 1.,'...".,."��,.,�� ......-................ 1---------1 ,�.�.I.��.11.�1.11....l....�..l..�..�..�..�..�..�..l..�.�: ..........,.,...,.,...,.,�.1 ........... 1.....,.,...�.".....".,�"..,..�.l.....,."..�.,.� ... ---.,.,-1.....11.1 ...�..... 1.., ..... ....1.....11.-, ,�.,�.�,�,.,�.:: -.....�..... .. "" .��� ----- .... ..... .1--r0....�.............. ................ 1... ---. - .:::�:::::!:::::::::::::: ....,....... ::::: :::; ... ::::^: :.- ��.�.��.��.��.,�.,�.''.............,."..y la -� �--...... 1..:1.1-:.., .:::�.,....�..� ...... -- ..... 1.. 1 1. � �. � 1. �... �.. ��.��.�,�.�.� ..... ::.:::.,..:I,�:::�::,.,�,,�é�:'!,úüt�t 'd'1:1:v. ::�:�:D�a: ien .... ,:,,a ......- '11 �... tt..,- � .' --- --- b, ' ' ---fl, t ,d,11- Iffl ,. - "d'.' -�.. ....�.... �. �..:.... .. ¡e j:::l, , ft... I-` ---t,511::, ,eñ'de.d::tó::::::á:::::I:�::o':n''o�e""r::: j,Lév` '1�:�:::�il::!�th ::: ::.- :, � ---:::Wi � 1 � -, él:Lé te. � W.,--e r.e.��.�.!C:il ...------ ... ---..-..... -- .... ,�....l.��.��.�,.".:!::.:::::::::::::::....:::::::::::::::::::::::�: .......... .- �.. � �. .... � �. �-� 1 �....�-�. ��, ... 1.-,,-- 1 � � �. 1 1..... - �. �.11.1..��.,,------ ... --- ...... --- .... �.. - -.....,............... -- ......1........ ..-.....1..... ---- ...... --- ...�..... --- ........ ................. 1.., , ,, -,"' , ,, , ,--- ...... .. --- ............ -- .....�.............. .-:::-.... .1. , --- ,.. 1...�........�..l..l. ,.,...l......� .... .. .......,, --- ,,- -- e..:�:t�: :.e .11:-. .......... . . .. o' 111.U d -1 --..... ��.... .. 10 ,:�, e':�':�:,oá" � . rr -ú li.t..-.. :1-0-h: f,in�:��th 9 �:�atid�-. ,. . ...-:::-s: : �i��l����:, ato, � 1, 1: e.:.-:: o� ��,f.ibr:�:�: Jabú.::::noj 4.- , ":�l"..'.:"..:t "" N' , , ,t "'11'y""':"::,:,th'.' ¡ñf.,----- ---. C., q � 1---._, ... w, , - ---..,rMát:���.�..�..,.".....l... ....,.....,.". 1 1 1 � � 1 � 1. � ---. � �. �.....1...... �..�..�..�.. �...,. ---- 1. 11 --- � ::i;l�:rt> ,::iu, t. :��: ��::� g:-1.. -... ---------- .....1... 11 .......... .. 1...�..�......1.1..��,,�.�.11�.�..� � - - ����..�.��..�.��.�,.��.�..��.�,.�.��1.1.. ....- 1 � 1 -- .----- ........ - - -.... - ,. � �1:� �:il�:.�:9..,.."...... , -�....... --- ....,ii...1.11.1..,..''..l..l...�.11..�..l.....�..............1.1.."��....1 ........�.. ........... ...�........ ------ ...........141.-... ` ,. ......... ....l..l,llia.:�:�.f .... :,:� ... 1 � -- � �. �. 1 �.,�, -. - �... ������th� cren :1:- ,�Ilt.t�..�-,�..�. 1.-, 1... ,t á:::An..::'-', n'o'rti..1� � :-'- "'' , q .._����:� iU:�:4 dI- ' -5- "'"' ,'1:. 15, -l - -:. -:::: e e.n inamit 'e'I'r.'��l��:'r'e',. U.e. .: �' ---,:.:� t-1- ' d b.c 1: :en1,.�.::::� .., ------... �.�...��.�1.11..."..l...l..l...�..... .: 4��.�!�x�:::Ize..l..:..�:,.:�:.�.:::::::::::::::::::::...."..",.".. - ---- ,---. 1. �.. 1 .n,q_..... t..,-,.,..,...l.�,�. ..��.��.................,.��.1 ... �. � -1 � 1-1 .....�..... .... ....... ---. ---- ..... ::::::.::::::::::�::::::"!�::::::::::::::::::::::::::::: ---- �- �.1 1 �,��..�.��.�,.�".....,�."..�,....�..�.--------- ------- -. 1. 1. -- -- ---------------- �. - �........��.��. 1 �. � � � � ., �... ....1..1... - - �...............- 1.. ............. ...-.... :-s ` �.... � ..0.1 - '.'ó' ,:::: � r;...-1 - t_,.: ---.-t.... i.. ,ei��.,�,��.".----. .... - �- 1

�. . 1 .. . ---- . ... .. ...-. .1....... � 1'. . . - ---Imm. .. : :- -::' �. ::...-� 1 �. - 1 1 . . .....�...�.���.��....�:.:..:.. ' . . - - ::-.:-l- .: . ..... � : .: :� ..: -...:..:.. ------- -- . , - - 1 : � :::::::- . . . . . --- - . . 1. .. .....�,.,..�..,�.�,,� .� 1 ..... �.................-- 11.1:�:�. , .��:�::.,: - . ----- �.....���.��... . . . ... �. �.. �.�. 1 1. . .. . .. .... .---...:...... .:.:...:.:.::.�...::..:::,.���:�1..... -- 1 .1 .. . 1 .-----...... : : : -::::,: : :::' : : . .... - - - - -::-: - !:' ..... ......... . .. ......1..�. . - - 1 1. . .- - 1... .. .. ----- 1:::.'::::::: :::::.:. . .:�1..- . �- 11,. � ,. ,. 11.� . - .�..1 . . . . . . .�. � 1 . -. . 1 1. .11.1 . . � . . .. .. ..... .::, - .'.'.' ' ' -.�1.. �� - 1. - .1 . 1.. .---. 1....�. . . . . . .�� � . 1 1 111. . . . . . .� �. - �- �.. �, . .. .. .... - ... .................�-.--.-- . �1. �--.-- 1... . -.. � 1 ---.. .. � ... . �... ,� -.... .� .�:� . . .:: :: : :��:�.�:�.� - .. - --- ------- . .. :, :-:-:,::- .... :.:.�::. ......-........... ,- ----- l ... ,....,......,.,........ ' -1. 1 1. ----- 1. . .� .: : : :. .. ,: - � �. � �:�1...- �....:.:.:.:-1:.1:.1:�:': �.. �'''�::.:.:-'.:-:` �:-:...: �.�... 1 .. .. '. -. . . .�. . � �. 1 �. � .. �. . -'., 1 . . .. .. ,. .. .. .. � .. ., � ... �.........., ...... .............,...........�.'. . .1. ��.. � .. .. . .. : : ::: : .:�: �:�: �:.: �:�:..:.,:,::..: -_. 1..... .. ---...........-:� .-- '. . .1 .. .. 1---.... , 1- ... ........... . ... -, . .,.."......-",-� . .. .... .... ,.,1.11.--.:,- -- - : :: :.: :-:_a ':::`."."' ...... . 1 ..... �.��.�.��.��.......,. -- 1 . ... - -- -:: - .: �.::..::.::......:.:..:.:.:.:.:�'�:.:'..... 11 .. 11.�-� �,�1.1...� .-- --- 1 ...�� � .11.. �. '1.. �....-�11. . .- - -111....�- 11..:.:�.. . 1.�-"��.�.11 ...- �; -� 1. :.l .... :-- - -' '--. :::::1.. �' �11'.�.1 .. ....... �..:��:;�� .- 1 1 . .1.1... .1 .. .. ... 1 . 1: :�,: :�,: ;', 1- 11 .. .� � ..............., . ,.1 ..111... ......... l.... ..... ,.1. . .�.11�-... .. 1. . .�..--.. . . ..... - -. 1.�.. . -'.-,- .. . . .. 1. .. . .1 .1 ... 1------ ..... .. ...... - . ........ �..�.,...�1...-...1....1..1�1............� -- -1.:.... ., �1 -1--...l..' - .. -,.-.-�.-�....�.....�.�........"..".......�.1.'11...-. �.....1---..,., -.. �..-. . . . ..... .1..-.- �� ', �, 1. .1.-- .. -,. --- .1111.... .,.. . 1........�..... ..-:-1.:-.. .,. .�. �. - -- 1...1-.1�.. ... �. . . .11.. . - -1�.... .... .... .. ...... .... ................-. . . ... . .:. :.:- :-' '':.-....--- . �. ' -..... ..... ,.... ........... l......,.......1.---.-'11.-.�1�.11.....�� �..' �.: �.. - . . ::: :,. :".:: :'::'. :..,., ', ..... ,..�,.�.�..,.....l..�...1....... 1.-...1....-.., �...1...11� .-. ,.1 .11... . . . .1. . .�. . , 1. ::- :-.: :�: - : �: : �, ,- �-- .. 1 .. . .... . .. -- .. .. - 1....... ... ,..:-- �. �.�-� ..� �.�.-� .. .' '...1 -1.1. 11----. .. .. :: - .:....-�..,�....�..�.........,.,..�.,..�,.,..�....�............ . .... ... . .. 1 . . . -::.::::,:1 . 1.. ---... .1 .. - 1 1...,.�..,�.�,........�......� ....... . . ---.. .... � . . . . .. . - .. :::::::::�:::,: �: �1 1-- - - � 1 . 1 1 :...........�1-...-::-�.:..-- 1. . . .::::::'1.-.. .. ... .... .... ....1..-..,... �.1..1.1......��.-. . . . . . . .. �:: : :: --- --- .''.. .. .. �.".,.�.,.�"".,. -11 1..:.:.:.:.:.:.::` -- ' -` -'`....................., �.. ,� �. 11111. .. .---- 111.......�� � .�.,.............'.. ��-:�....,�.,.,.�. �. 1 ...- 11 11... ::.:.:::. ...- .....- -�-..-�-..-,...-.-......�. . ....1.�.1.� 1� -�-�... . . .:11..�-, 1.11.1..:-1': ;�11.-.� -... ",1'1 ,-1. . . .--- -- -- :....�1.-11..�1.�11.111.1.. .- . .. . . . .... : ,.: -:;...: �:..::..:-....... . .�. �.-..1. . .111... . . .�...1.'...:. ... ... ..... .. .....�. . ..-.--- '..-.....��..�.----1. . . .�.---1. .. .:--... .. 1....''.: ... . . . . .---. ... f .. ... ...-1..�.--- '1.--- .1 ..-.. . .- :: ,::::''. . .1..----. . . . . . .- 11 .�..-- -- 1111... . . .�,-,.. . . .:::.-...... ... ::"11. . . .-. . . . .�-1- .1'1.. . .-- 111 11.,..' .... :: :-.: ... : ..: .:� -.. .1 1. .. . ..1. . . . . . .�. . . .11�. �--- .. . . . . . .-- '..1. . .1.1 ...... . . .: .. �..... .. ....1.. �- ---. - -.--. . ...- �-.-.. . . ��.1. .. . .1-.1 ---..- 1'---- .11..1... y::-.-.:-----�..�....,.,.-- -- .. :.:.-.,-'..1 . 1 1 1'..1..... .�..-- .--- - ' .::"111 -- -- ,-, �. "1. .: .: ..l....-.. . ..1� . -- 111-11. .. .-..-..... 1..... .. .... . .�..::..::.:.:. �:.:::::: :':.::'.. � .. � --- ,1.-..1.1..1........ .. .,- �. ,, .. ...- 1'.1.1... 1- -:':.: - :: ..::::.:..:` .,."..,..�.".......�...1�--- --. 1�,.1.... - ,.'--..1. . .--- -....... :.:::��.: : .: : ,;: ........1.. �. - -... :..:�: ,: � �:-:-'.......1.�..-�. -- 11. �...� 1... .. .�..' .: :.1...' :: - 1-...,.. . �. 1 1..11 ....... - 1... -.....-.......... ...���. 1.........�-. . ... �..1-.�..:::�:.::::::,:.:.::!:::::::::::::---.._.. . .- 1. .. �.. .. . . . . . ... ..�.�l..,."�... 1..,.,.....,...,..................,..l....l.....�.�..
' ' --- ' "'" ' '.1....---.1..---1. . . . . . . . . .-.--- .-- -- - � .'.. '. �'�.,�,..."1,.,.,.,...",...,..�1...-- '111. . .�-. . -�.. . . . . . . . . . .-1'1... . . .1�. . . .1. . . . . .- ::- -: -. :..:" -- --�. �...-. . 1 1. . .� �. �-�.. -� 1 �- . . -1 1 1 1...�..... -,,., --- 1 ', 1 .. ::::� ���!:!:.���I��� ,I.. .....1.,:.::::'::�' :�'. . . .. :��má,áájc....,,--..... � �:. ::-.....1.1... . .- -- - '11�.. ..-....... ------ 1 1 1..... 1 1s::::gtp.��yqpj.R:!:, """�... �. -1 1.... . .---- 1 1....1111.. . ....... :'::-:.. . .: o � � .::é.:::::::-::' - , .: -. 1 �.. 1 ...... 1.....- 1,--- . .... - 1. �. 1...... 1. .' --- ....... '--------- :::'.�. ::.. ..1. � � . .1 . .. 1. . --- -- 1.. .... - � .�1... -.1. ---. � -' �........ . . .�.. ....... �.. ------.: . ...... .... .. ..1.. ....... 1 .. �.. �.. -...... ........ .... --- ............�........ ' 12,'-..--. �,d "'.p�:04 : J.J.JA�:�:::: �ez>�T.IT-t,O.:: oit :::.u ujw'o..� ---l.. .. . ::: a�..:::��l,I.C�:�lw,t2 a:..q:l. . . ----- . .. �.i'O��!::I:qQ��ll��:'�j9�I'S$O.!:>:Z>Il'i�:::!�..0�'M . T.. .':4 �p"...:.:..,U�.I::��:1.a.0,2,.O.,.O,:I..,.,.!::::�l:�:'�1. ..... -- -. 1. . ---. :.. ............�,....,.".:,., . �..�....�.''...,....�..........�-.-.-.-....-,.,...�...,.�. .� � .. -- 1.------ �. 1 1---- 1... .. .....-.....�... . . ...... 1.....1'"' '--. ----. �... ---. -', .. ...... :..:.:::::.::,...."..,.,.... ---..... l......��Á-al .;át':.-- 'é;'.. . -- . -- 1.1.. ...., .:.o:,.4,'%.::�:::.:!. U.: �.�:��: �.� l��:1 pnpóá dTAoid.�-eti.tdú.-á�:::::a-ád..uT.q�its -1""' ,:::: g.. �.. .1.1.. �",���.�.�,.,�� ---. .. lui:�:!..(....... -- . : .pu .1 Talpu .. . y... . 1. 'W :.'..: .. .PI.::..W:21... �...::-::-::�:.- : :- : :�:� �.:,:::�:�.,::::::��:... 11..1 ... -- 1.... ,11 .U....-�1 1... .. - � �. � 1 -�..... . .. 86YUT --�.....�.... -� .......... ..�. �.. ... '1 . . .. --- -. ....... 1.1 .. -- .. ..... 111.11. .' '. 4. . .'.'' aqT . 111 -.-.-,-..-,:�-.....: :-009 ou VIP-9: � .�:lo�� $M;tla.ii�l� I., .'-- : - .' -- ---q, �.�'4:0..�.,.,..::UOT:Vol:R4, d .�l'. 2ul~a0ó,id 1 o-t!ou ' ' ".' ' 'l. d d'"""' 11 .Ipl. dÁ""""""'�".�',�".... 9 -141111.4...". . . . .. . 1 ...�.��.l.'.......�...'�'.. � ---- ---T..:.�:":�: . ...:.7 .1 �... .. ......1... ------ ... - 1 �: :-- .....,- . �---... - � �. � �. � �. � 1 -::.:l. O.::...�1� ... .- �... �... �.....::.. : .: .: :':q ..:.. ....,-1.. -1...11 1 - -.. ::: - - ... , . .......-..... .. ... ----- 1..... .. ---. -..... ---1�..� .�......'... :,419,',.�.,�.'�,.�lt,-:�,í",2uaje.JJTPÁ�::::,!.S!nleo.,a ' .�'. lenz y. ::: 1 -[.e - 2 ou 51:.�-..'E.ZQPU'Ow' amo 1.-II 11 ti�.,S. ....,,4 ::--:,:_11,el 92 1 �:: S T : .W.Z9PUM: ---.:::�: I.:�..:.�...,.. -- 1 1 � 1 1.... .. -:-:-n ' 1..1.1 ------ .q---. -- �.. . . .... -- �.. . : .. -- � �: :-.,. .' -- 1.....-. -W-1 ... .1... . --1. .1 ... 1.. . ----------- ---.1. . -- .. -- 1... ..1---. �. ��' '1-- 1 1 1---- ............1... ---. --.. � �.. .. ---. :::::: �.,.''�...��.��..��, - 1.1...� � ... 1 1::590UIAO�td l �Ááu:i�b, ::'::''�y .ii�i l 1 lion2áú��i�I��� - ----- - ...�uT:,�::: jql.sup eq::Ap .�,:.�:,Illz4. I.::4v::.,1�l�N::i:!�.O.MOS,�::::.,.::1.. �.. �. "� .1 1 :� -0 .: 3. � . -,- . .1.. ... - .. ,..��.,�.�..�..'.:�.."...........-.. 1 .... .: :::: .. -, ... �. .. ----. � --- �. 1 -: ---. ----- -- _:,,-:--::: -.. .1::11... �. -- -- .11....... .. �.��.�-� � 1...........1 .�... , - - 1. 1... l---... 1. --- �. 1... 1 .... 1 1.... 1 .. -- - 1 1 ' 1.. . ..... - 1 1.... � �: : : -::: -:: : ; �:�� �: �. -... 1 - . 1 -- 1 .-... ... ..... . - � -.......--. . . :- : ; �: ,.. .w.: . . .. ....1. - -- -�. ..... .......- ,:-.:.:.::-á:::: :.:.::::::�..,......�."...,.1. � - - -- 1.... 1 --- 1... ........�.l.....� � �� -�. �. �. 1 �.. �. .. 1.. ... ... :�:::,:�::,:�:::::::::,:;:1.- - - . '11...�. . ' '.. �. - -- -- -- 1. 1 ----- . . 1.. .... .. ---. .1 .............1.-- 1 . 1 1 1. �. � -... 1...�...�� 11. . � ... . 11 ----.' ' - 1 . 11. -. . 1 1 1.'. 11...:- :- - - �. . 111 .. . � -- . .. : �:::��. - .:: : . ,: -- ". 11. . . ---.., 1, ..... .� :. �: é.: :,-:::-:. z ----- --.1. � . .1 '.- -- ..... .. ...- 1.... -:::: --:'::::' -- ,_.:.:.:.... .. ------........� .. �. �.... . 1 . .1...:.11 -- 1 - �...��.: :: 1.- -- 11.... .--.... ,-- ...l. 1. . ------. -- 1 .. 111.1. - ��. �... 1. . 1 .1 .-- ... --- --- .. ........ ...�.. .:-�1 ,.1. 1..... 1 - .. �. �....-1..., -- ....:- ... � .�' � ::':::::. - .1. � .. ,----- 1 1 11.1. 1 - .. . . . .',. . � ... 11 1 . 1.1.1 ........1--:::: . . ;..... . �� .- .1.... 1 .1........-. . .... : : :: :.. ::: :::,::�:l��:�:l�����!::�:��...la,�UIIUO .a.M.I.... � �� --..... 1 - 11 .. . ...... �-..:: :...1. . � .1 1 - ,. 1..........1... - ' .. �...�s--....- �...... . � �... 11 ... 1 . .- �. .. 1.... �. ...-. �.�.��.�.��,�.�, - .... .1. 1.-.. --... . -- 1�. 1.. 1. ... .... � - - �...............1� -- - ...... :::: � �, ::-,,,,I. ---.�.... 1 . . .. 1 1..-. . . .1...... - -�'�...1... . � -� �. ..... ... � - .. � .. .... :: .-- ... �... 1,1 1 ....l.. ..- 1....-- �.. 1"....... .- - �� 1 1 . 1 1 1 1.... -- ... 1 1.1.1 .-----�.1 :1 -. ....... 1 . . .. .. --- ...�......��?aj ,si �..Zlo:lc>,a�s::.,��o,-tlqnd'''0..,: "M.10::r:G..!:� �:: 2Y ..E. u-_r 9k-:':! ":413,14,4::::!:!... ..::. .� -- - .. ' -' ' .:. � TpT. PilT" .. .---.. ,:1.j4!::Iii:�o.q.:4:�.. 9 ' - ' "' ' - ' """' "' 'ui ::-aiq1,g,i ..3 : - -� � .. ... �. ...., 1 1.1.1.1. ...... -1 1 '.�... 9T..,i,�7 --- V ' . ..---- 1 1.. . '':-b., - :.-. :. ..-..,-,---.. ... 1. 1 1. .. . ....1.... ... �. .. �. �. 1 1. ........�.-- 1. . � -- ------.. �.- �1 -. 1'�... ---.1zgpyllw:�:..U:Z.�:i�O-Dua,tjr.O..X .sTq4..:.::i��aÉú,'9.�ti::�:�, i9��,'�0.ni .:jv :,:M,$�ZQ:I,P;a ,:011�"d:.1.1?.I.P.I. .Á j4, '..�".,.�.��.�.�,.,�...,�..-,�l, 1...1... l. -1 1. .1 .:... � ---... .. .. �. - --.... .. --- �. . . ... 1 .. ... .. �....,.,........�.... 1 1.1.... .1.. - - ..........1.1....... 1.....� . -.. :: .... . . - - - - 1. . 1 ---.....1... 1. . .. .... 1...1- -�... .1 1.. 1.. ----- 1 11 1 1 1.., --- -... a- .1....... 1 .......l....... ......:ITat'2---SaZUTAO.1 :.:.�::j9,q4p�..�:1.9.q:4.. . j:j::- azlUJODOUL,:,':O: 1,.---....1. j::::' SUIROM e:: 513,1�,�,!: -1:::aTOR4- .911'1�.:.:.9.A:,.�..,---- '11 �:�.:,�:�:...: - 1. ': -1...... 1 . -- - �. ---. . .. - . ---------:...- ......l. ... --::::,': :::::::: -n-::-:-,:- 1 --1-1.1 ,..,.........,..�...... � .... 1 . .'.. . . .1.. 1.. ---. . 1.. .1,..:,�:���:,�: ....--- . . . . 1 .� . � - - �.1....... .. 1--. . .. --- ...... �..... � .. 1 . .. � . . -1.. 1........1 '..�' --- ---1 . .-- 1 1.. ......... 1 �- . ... d.. .... ....i.. O�T ��---.. �,' ' "" ' '....�.' o:` 0,ql.:'iI,O. -�---.�. uo 0------ ...2vi dlaq:új:",joo.n'�0.' 1 -- 1.. . .1.. .....-T.-oq.p ' 1 ....- 1... In0i .vzop4o �ino�t :.,�'ii,Pz>.U;a,Tle X9 :puy �A ' "' "" ', "" ' "'��. .... ----. �:�l, ' .q. .. .... - 1.. . -. 11 1 11 1.. . .� N- ::��i''1.1 1..... 11 1� . ..... �. .. . --- 1. ,. - -':. .. -' .........l., 1....l..,..l.......l.�...l....,.. �--�1� . �:�.:�: ..� -:' ' 11 1.�. . ----- -..... ---..-c14�.�.��M�1� .. . ' ".��.. .' .�..1 . , . .' . 111. . . .1.. .... . . , ,... , .. . ,. .. ...:�tiúbúin-ttumoz>.:.Ei.-Ii . - 32URUID Te... p:.:UeAT2:.:�,DUV,:,:UO,£2vz.OTTie:.eoanoso.i.:.:..1. .: la,&am0H.;: .:.::S -1- 1.1. ,.....�1 -- --- 1 .. . . � . .�..�:..�::,�:.�.. 1.-... .. 7 ..�.�.�.:.:::::::,..:.:.�.. ......... . ...... ' 1:m .. .: - 1..... - ��.. - .1 -- '---- 1. .... . .. . ....- -- . �-... 1. 1-.... ----- ... - ... ---. :1.:::::�,:�:1. .. - .. ..... ...1. - . 1 1. 1 � - 1. 1.. 1....Á 1 ....... ��,.����. -- . - .-- . 1 1... 1 ...-. ;a �. 1 ---t u. ....� . . ��....�1JOA0::: 11T.'a5.1 - ...:4�pt. �.1.1.IJUOzi 1 � l�0qTp� .....�.Tp zo '1. ..--- su0o :51 :.a- ilp.. 1: P .. -P-P i.:� 1 V. 0.11 1.10...... y-.q..4 :aj---. .' 1.-4VV:4 ww4,.. - �... �... .. .... lon... 1 .'. ... ....- 1. ... .. .-1. ... . . . .... . -1...l....... - . - ........ -- 1 1. ... .. --.... .. ---. -- - .. ... .. .. 1...... 1. ... ... ....... ...- ... .. ..... 1 1.. .. �- -...--- --- 1.. .... 1...1..... ..�.....- � 2- . b.' ' ' --- ' '. . . . ....... 1.. ....�'..... .. .. 1 . -... 1.. ..-- 'e a4 lúxtj .....l....---�2��ú�:�:s�ait-nbá.i:t iq ... j.!ix:1,---, ,.'.I.: ., -, -Y "".. -- -.. lé. 4: 01�,,a �, m:I---... . .1 i q. ... . .1 :. p� .T.no � �,p.ui.a:,.m.i.o.TMP, ....::""",.. 1.1 - - 1..... .. � �. - .-- .... 1......... - �... ..��'::�,.":,:::::!::�::�::.,::.�:::"' ' 1...."-- ------..,-, ..l..........1. 1 .. 1. -- 1.. .... ..- 1 1�. �...........1.�.. . -. ... . ....... .--- .1. . 1'--- 1 . . .. ��. ..... . '. . .. 1......1.�.-TÁO-,� :alU.J2S -el�:�ST.:I:I:::u9q4'?,¿::� :' tu ..ni . ::: �$:!!Pl�l�.P."O,.:.:!!'4....�...�...,....... Q3,:, a. '. .. :� Síd' '.�1,. j!yi.ai.iil,ttu.o��o'z. ou .zt.,d.�i�:!��l�.i1. .1.. . �. -- , 1- 1* .1....,....�.,..",.�...... : :': - -: .: : �:::: .. .... � � -.....-..........- '--- '.....1.. .. 1 1 . ........ 111..�.�--- 11.�---...... .0 ::� ', URZII..::,.,...440:::-un,4 .a v.x, ,,d:..�,11.9�,�,.Ióu STAUCCSAS- O�.�gq -1190 TAgj<l�j9l.44P.:::. -A::A �.. 4aj.I.- . ....,---- --- ... . . ---. .' j::j ���... � ��.�..� 1.11.�--- �. 1. .... ....... . ... � � 9 � . .. 1. . 1....u1 11:: -:--,:: �:.::' . ....... 1 .. 1.......- 1. ': . .: : : �-�,::� .. - 1 1 1.... . '-... - . 1 . 1 . : .. . .1.1. . --1. 1 .1.1. .... ��-... - .1 .......... .. ......- �..... . - .... - 1.. .1. .1..... ...-- '. . 1 ... . .. 1.. �:. �::� ,.: ': ' �.�: ---:- -:... :-- 1 . .. 1.. 1.... 11 .. -- ............ : ,: .:': -- ....,l-........., �.,�,�......, 1.... ,-----. -�1 1--- 1 - -,.. �� �. ... 1............... . . :::::::', 1 ....... 1 . .:::.::::. ....... .1.... 1. 1 '. . ... :- �. ... . .... 1........... .�......... . . . -- .----- 1 1..�..�.�.."..�.,.�.,.�.:�:�,:.'' ... ...��.....��..�..,....�.,�..�.�.'�..�....�..�....,.�..,�..,...,...... �. ........ 1.... .. 11....... - � � - ---------1,1 ' ---1......... - -- 1.... . .� � .. . . .. ............. 1 -1...-....1 1... .. .. �. ---- -- .. 1 ....... 1 1..........1-. .. .......... ............ . .. ---- ---. ....1.- 1 1. . 1... 1.1. .... . ..., ---...... �. . 1 1.. - . . ---- ... .... 11.... �. � -... - ' -- .... ..... . ..........- � --- 1...... ---... . ... .............- ------- -- ......... ... - -- 1 - � � 1' ...........-.------------ '------------'. .- 1 .. 1 1. . .� �. --... . . . .'' ' - '-...-----1 - . . .......- ...... ... ... , 1- - �:,:- pa. zÁ¡.'áúú 1 � Rúytor ': SI :a lau A0 id 112TTIOR3`------. .....�.�...1��.�,�... -. ........ 1--- . --------------- ' :'��� � � 1 1'1. .. .1... ....... �.-..11 �. ....... 11' : .: :: ::.::::�� :: : -1. �kI. ;��::::::::.. -.. �".....l..�- - 11. . . ... �-1.��--- .. .1 . ..-- 1 1 . . .. �....- -----. �......�'�..:.:�:. --- ;,:51 1.....T... i 1:.Pnq�:,:.,g.,Q,::!: S a1.11 ... 1 1....... .. .1. .-- 1 11 11. ........ �... - --- 1 - 1.... .....l........-I. :,1.... .. ...,-,.. '-... 1 1. 1 1 .1 .: :. , 1 ,. -. .... .''.' --- ...0'tii���i�..".'.-X dd i. '2.. .. .... ::.�..'... .'.:- gao.la � :alil: � � OD �:lm'O:.4S�.�:�5�:,::�::,:921?;101S uen úTdg,i;::¿i�l�I Á:l. - ... ' .1-11 1..e.in .T41-, ''oo.z ... ... ....�.�...��,... 1. 1 1....�� . .�. ..- -.. .. ' ll" : ú :: ::4....14.-- �..�.���.�.�,�..,.-- . .- � 1 -.. . . � . .�... 11 ..T... .. . ---.- '...�... .. �. ----- ---. 1. ... 1 . 1. 1. 1 : : :::�:-:�:w:::- :,. -i.Á. . . . . � � . . --- 1 - �. .. 1 .. ..... . . . -...-- 1. .. ..... .. . . . ,.:- jo 'X:i'T'jj'q s�e.-ii,j�i,,1�91.q4 :, :.: �:::::. .. 1... ..... :::a,o�l�����M.O2�5 5 :..V.,--- : .Wri : �::!!'4�;)� in 91:' ... ,' tlu . . 11 á:Ud,id��:Iüá' ' simu .SÍ �.1. .. T.:'',: ui:iign.T.i3A .K... .1.-1.. . ---.- -. :.: ... .....-1.1...-.� . .. 1 ,-'.,. . '....:.11 �. 1..:.: T,k, :� ':. :: w o'::: - .. ..-- �-�.11. . .. �: �.�� ���.. . . .�', ' .: :: ::-: : ::::::�.I.:::::::: :: -. . ,-, .............................�� 11 �1 1 ---. ,... �d.�. 1.. .1---.�...-. .... .- . -- -
'' --- ' ' --- ..... .'
': ..... �.........�.....,.,..�.. . .... . ...... ...aq, .o s l:p�:::,:I:�T�.::::1 9-u.':0-....'. :su-e:Z:q! '?úi. ' ':...l....mo"é�'.e:S: .1.:S.X . ---a,�.d10:1:::$`0TIOT. ...... 1..... .--- T .r[c :�zói:,::X4�:14T.:4�,z.>:'�P.PIC1:1.PM...l. ... .1...-.. --- '. . ..-- .. ' l. . ..... 1.-----.. . .. . :- --� ,; :... .. � .-.... ...... 1.... ...- 1''. . .1 .. . .. ..... :.... .. .... 1 1 ... 1.. .. -- �1.1.111.... .::::: --..... 1 ..:�:U uoi: 13.Md' mé.t.a:, 2:::"::':' :'' ::::::::::: .i. i��!�.. �. -.. q . .O:.q,l, la ... :-------14 10:EUT:� 31513 -ap:TA .1 :.. T�IT .tiuoszca �.��,.�..u,ria:lslu-LMD,e.�:�102w '.túáá�É;ÁEii:�!!.,V.,...... .. � .,;-:--- �.,.. . 1 - .�.... .n... .. -l.. � �. --- .1: .. . --- ....,.,... ..1. ...... ::::�:�:�:::�. ... ::,:::::::...:... 1. ' ..- � �.. � 1--- "..---.....- - �. :: �.:.."....,:?�:�.::.:�:�.�.:::!:,:....,:::. ,.:�,:...,.'',..1.1..l.... .�. . . . ... .... ... -�. � - 1 1 1 ---. 1..... -�. -- ---... .. .11 1. .1 1... ... ..- ��.1..�..1..---- .1 1 1 1 11 .1,.. .... -�.�..,���.���.��.��. �. � � .�. : ... ... ---. . . . ... ...1.. 1.... .... : :::: .: : .::� ;.:::':::.-11..... -. 1. � .---. . .1 1 .1..... . -- -- 1- :..1 .. �� ��11 ...... . � ---.. --1 --............... 1 .. �'::.�'�......l...".......,.,.,.,.....,1.. .... . .'11 ... . � � �-� �. �� �. �.. -�, -:. ................- . , .�.;:�:�:!:���l����:�:��,l�:��l��:�:l�... ..'�:i �:�� 1:�l:��, -� �. ... ,....... --,1.... �.111. .�. ---.... w. �:::�: ' ' ,,, -...... ... ... �. l .------- 1..... -- -1 ........ �.. �. � �. �---. .�.....�1.1 .-. 1.1 ...... ----- ..., .....-11...- ... � .--- -�...�....".. . - ::' .::., ...... .--- --..' ....---- �. ........ - - 1..... - �.' .1. ..---. ---- .. . ...... 1 1...... .. ---. . .... 1. 1... .. �-.' '' . 1.-- --. 11 .. . 1.. .-. . .--- �.........11 ---. ,.-. . . .-. 1........1...1. . .. ...... ---. -�'�.. �. 1 �. ..- 1 1. . �.: 2o:,.. iala:�,-- ---------. 1 1.... ::,:'!(:�,�it,:! (- -IU'ai:I-Pd:.P-alz:Til.92 .d,Ñ.D.q Á .,:::�::.... .- :- -- '.. .1- -�..1. ...... ��.. . � -- � ..�1 - .. 1...-1 -'. --- . .. T-.1. ..... � a���!::.��i��ijip,.-.- , ------ . . .1....- . ---.. 1 ... ..... � - -- --- . ---.. .... - ... ' -'..... .- 1 - 1. 1. 1.. 1. .,:...:,.....,. -- '... 1.. ....... 1......l..,�.l.".::' :,:, - '�-::!l,: "''' "'""''""' ...........'a''��. .::aq-4ú, �1.1�$01:4pj I>n-�É.,.�l�i::!�:���2�:�!�:�a.) ..!��'n i,iy�Ii�l��� -a.. .4':' d-ly.''�. �.á: ' ' 1 ' 0,: �~Iill:�ll.,.�i.Jo-ci����AUOPI�, . �-00. 14.49 '-... . '-. .. 1.. .1 . .1. -: :.1...... . .....l.....,.......,...-. 4.1. �li:4o.��P�i/..''''�l� ---.... .11 .. .:-:':: -:' - .1.. . . � . . .... .1. . .. 1- � - .. .. .... �1. ... ... .��;: � �: i�:.----`''::::-: : �: -- : : : : : . 1 1. 1.......... -- .1... - - -- ...... . . .. ........-:..:1,0.UuosjtacL:�:ro: 112-rAi- Ion óad::� -1O�.:��i,álsic-Lt>u-e:� oi�i:iictuj�pj,.� ,p4-..�i.. . �..�..�.:�.:". ' _..... .. .:::. .p. .. ;:,:;::: ..... : q: : : :n: : :.:_:q.. � 9TI41. 4.- . �no,:::uo:::::uo..t:,AvuuoiuT:i�:i:��i,.'.� .�... �. � --- ��.� 1-1... 1 . .. . .. .-- 1 .. . ---- "::::;::::: :�:.:!�:��. .:,:,�:�::,�:�::::::::���.m:::::::�:�:�,:,:::::::�.:....:�-.,..:::::..�:.::'.. �. ,.. � �.. -�.. . . . 1.... 1.---. - 1 ".... ........... - ', .1 .... -. -, .::'::::, :' .. --------
�' '��. �.a 1, � �-:.. ....::'Os.T.Y.,�:�s~t-.:.:�o,,x,91 :..z,4.s:InduT' `�::: ' '- '-- ' ' ' ' ",:": "".------ ---.- .44. �. ;- �4PT:Ivlp.jou: . .. 1.�ill .. �...", ::.:.U- - Ip .P' .�:i��.U,T�::.�::�::�::.... .: :- .: �: ---. �. .......�..-!.Y::P :.gp jo �� . 1411: -.. .11 . .P.- .. ...._I........,-- . �... �. � �.. �.,�.��.".��.. "... � .� 1 1 1. �................. 1 .. .. -- �.:4W.- ... 1�-- 1.11--- 1 '............... .. �. --- .- ::::-,: ---. �...,�,.,...,..�....,.....�...,...,...................,�.�............,.,�...' - 1. - . . . . . . .... � 1. - - 1 . . . . 1 .. . . . � . � �. . -�. ��.. �.. 1.. .� ,. .... ......., -- .1........ ... ���.. 1. �. , 1 �. �, ,- 1 1......... .1.. . .�..�.��.��...�.,�.� . .... - - 1 1 1. - - -- -- - --- - - - - -. . ... 1 :,::,::: ... ........."........�.1. . . . . . . ,...,�..,.,.�,,�"1.1 . . 1.. . ... ' -1 ... . . .-- 1 1 1 1. 1.. - 1. -... .... --- -- .... 1------ ..... 1.' �... .1 - 1.. ... ... .........-. :' ... ,,-, -- -. .. 1........ . ... -- -::: -.--- 1 ...1.... ...... �.. --- 1. ........ �. � 1 � --- � 1. - - 1. .... .. .�... ' -- 1: ::::. 1.. 1...1.. - 1... ..... ,::::::: - �. �. -...., . 1. ... -. 1.. 1.- -- - ...''...".,.-- - .. . 1 . . ... . . -- - 1 1 1. .......... - .1 . - . 1- -. ....- �.....�.. .... 1,1--- ....-..... - �........ .......11---... .... ,....l..... .. -,1,---. � �� ���. ..1.111 11 . ...�...�....�.��.�......�..��.�..�...- �. 1 �..�...�.,�.�.....,.."�, --- �!��!:;������� �. '.' .."!!�:i��:i��l:�!l�lj���l�."................l.... . ..... ---... 1- . - .1....... . .. .�. -- �� - . 1 1 1... - '�... -...----- �.1 ..... 1 .1. .. --- 1 . 1 . 1 11 .. ... �..... -1 � ..........------ ...- ........ . ... .. ...----- ..... ........-.... 11 1 ..., ,-- 1. �. - .. . .. �.: : :,::..:..: - -. ........ ........,..�...�.....................,.,.,. ..1.1....-- ��'�.��".,.�",�.�.. ..... . . 1 . 1...-......��.....�..... 1 .1.. . . : : . : :�::�:.,:::...�-�.�-''�.�l..'"' ....... . .. ---- :::. � � � �. � �. .,I. .', , � �. �. -- .. �. -1...�.... - 1 1 �,� 11 ....... .. . ..1 1. 1. .. ....- - -1...... 1.., 1 � .. . . ���.��.���.�..1�..l.....��.,.,...,... .... .....1.11.11.1 .- ' 11 1.. .......1.1.1..l.."......,.....l.......".....1.11...l..1. .1......�' ,-- ---... .... � �1, --,, .::::'---. - 1 1. . . ... ..... ...1.. 1...... . . . ------ -- .... . - . -- , .- ... 1.111.1 ... 11,11....11,1..-........ . .. ....... .... . . . ---... .....-... ----- --- - ......... . .�.�.��.�.��.� . .1 .... 1.....1 . . �. - - ��-, -- -- .. ....... �."....,..�...."..1....... - � - . �.... ... -1 .... . .1... . . ... . .- ..�,.::�::�:::�:::: : -.. . . . .... ..... ��...�......�.�1.-I.-- 11.111.1 .... .... 1 1. .11 .... .-- 1. ..... .. .... 11�::: �::: :� : ,: -:,: 11...... 11 . 1 ..... 1......... ---.., ..,...:.. illilt:�,els-t2e ~4''Á'' Ao¡ddle:ao:r ..tá sáb-rad ..sanu 'ETIU��:.,O,Ua ::'::... .� ---.. .: �,.I-��::.9-.q .q á�.l...iii...!s,02 ---.. ..-. ,1 : q, le.pq-- - '.._::Paau l 0 j,I.:.: :.,,.:.:.:.::.pgp.. --- q'& - .....1 -1. .. .,: w,',-- - .' ....... 1... .- 1-1 .. �:.:.:.:.,.:.::..:.:....�-..-i-...:�:....:.:..,.:::::....,...,::.�-,::!:..::..�.�......... ...1.. .... . .1. .11-- .... .. �.... .1 1,1 1 �.. ....... --- .. . .......... 1................. .. �. - ,- 1. .... ... -- 1. .. ...- � �. -- .a.:..- -... ..... ,.� - - -.... .�. 1 .1%- 1. -, 1,�.''.,.�.�,....,.�,...:: Va"�ol :jsn ppy::....,-4-aq ' 5o ol�>j;Tp::�ias;atl:i:��l..:!á a�Áyyib:.� q3'?0 `-''---2 ' ..... ..u.V.OM,02 ozt oit::::;,(1��,Ut�.!>�,... 1 .. 1.04�,jo,.- -- 1--- -- 1:. � --- '... ... � .'-- - --- 1..: p q_------.. .-- 1,---_--- ---- . .. . �-. ---. 1... . ----- - ---- - -1 ----- ' ... . --- .á,- 1... --- 1. .......... ... � . 1 - 1. ......... � ... 1 1 1......... -,- 1 ---.. --- ----.. .... .. .� - . . . . ..- - .......... ... ' '. 1. . ...... .. 1..pula ' '.''�:.-alOX9 ds::..:nmíód ' "' ,.......�::::� DeATG3 9-1. la gAa.II:T'Bno: ,p .... .. Ti py 1q.,-�141::: ..... . ---. ---- �nu..1l: ...."..�... .1 . . . . .. . ... .l_... - . 1 1 . ::... . :�:- - - -1,1 1 . . . . .....: . --- . - --- .. 1 - .. �. ... .. - -- - -.�.::.::.:.::�:.:-:::::::�..,.::.,:.":.......- ------ . . . .------ ---1. .. :::O n :.: U-:1' l tk :!��ittiái . 1d.. .... 1.11.. .-� 1 �-1 1 � 1 1 ....... --- ' 1 1............. . .. . ...�..�.,.�..����.�..�.�.�.�.".�''..".�.......: .. ,. .1.. :. :..:':.:.. . .�. .. ..... 1... ... ---. .1. .-I.---... l.:... - � - 1, 1 ---- -- ::.: ... 1..�-Pytj'Qjp � �:AU;I;t livo.:.191.:�:i:..:102 - -'on vod. .SP;to^ X. q .la....-1... ;t .Pnq,.Ioq:.zl:�. - .-� ,ñ��XI.,l�4,:,Z....io.�;!':,�l�,.,.,.'',��',ill��P..�U94" �"::D-;�íF ..':!�l:�l:--- 1. . 1.1- � 1... 1 1..... - -1 -1 1.1.1 . .... .. .......�. . 1. 1 .: ::o:� .. 1..'---- ' ..:.:.::-- .........': -1 11 1.� � .1 1..,11...�.....�.�........1.. �.�..�..,.�....".,�.,...,.,......�. .......l..,... 1...1 .:......1.131LI.l l.:sasviqzln<i.:: av:'.2,0�u:�:ITTT,K "a.'J.l---T:-...._...... . .- -:,.:.::�:...::j9A<)IC �::i���"..... 1 . .. . .- z q i: 15.-. pIpnq::.51 ,A:::�,.l:ii, .p...IjA:�. :��i:�4.:P. ....1.1.... 1 1---. .�.�.�::,..:....34.:!pqQ i. .1.... .... -- . .. . .. -.... .... ..... ....-... -- ....... .....�T".:::..iiI... .P1. �. .... � .. 1 .. . �. ------ ..... .. .. .... ..... .....l.�,..�........ - -..............................,...,...�......-:'. " .. � .. .- . ..... ..-----.. . . ...._...........1.1.............UID .:: .. 1: �,q .j,q'::: ..,y.q, pl:,.4 :.�i:..o ..$.O..�:1:�1:1�,..0TMMI 7.1q"'li Z>:::I:T:;......�.;a?lp�gq:.."�:i�:,il4:P�qm:::, .2. 0 :. U.u 1,3 d"",."".- � -........ �. .. . 1... - .1 . ..... .. 1 11 1. 1 1 .'.-,..... ... - �.I.:41�l��i....�,.p..4 .. 10:1 ...1- ...... . � .,',- 1, 1, . ... .1.. ---- -�1.. .. ,�.,�.,�....�.�.�.�....�..�..��..�..�.��' �::,::�...�..�, .:':: .-.... 1.... ...�........ .... .'-:á::::---- - . .. '2, ,. �... ... -- �--- .. .. ........�......... :. ,:::'.. 1 1.. ... ��.��.�.,..�...��.,.�.4.::j:.::�,l,I.,�,�"......�........�,.�...�,�................. ,........,......l.
.sR.: Ualit>..DOT..I,e..::::z,a p.n n -pueds,::,:O:I:.��..S.a'C2'£2Ua .i.9A'£:.2ua,aul�:��;:OU.............� Sü. � l f�t,5ibthb:�:�:�: -:,- - 1 ---.. 11 1..�.: � ---..... ..-.. �1:4� :.'..: . 1... 4: .:: i'.........::::::�:::�:::,:�,�:,. : : :� . .:.: �: �. �, �. �.:.1 pl---, ....... . ... : . ..... ------- 1 :................,.l...... .1. .... 1 .----- .�.��...l.��.,.....,..�. 1 ... ... �.. .. .. .. -:.: -'!:? ---...........,.� . ,-,.- .1.� -. .. �.:���.::::::::...n.:.., ..,...:-::::::.".:.,::::::::":.:.:-. �. ....-. :.:::::::.::�.-...... ......... .-..... ... ---... ......-........�r: 10.,:�l%�x� :,.. ... . ...... ......... ......��...�.�.�,,�,.�,� -1 - - 1 --- 1.. 1... 1. - .: .1- . ..... 111........ 1.. .4�el..::�.P.O.':1�.,".,..":!:�I:�l�i�
.. '"'.2'.......-P.�l�';�ajjaq1�.!Pg�,e.P-j. 3 .51 ..s. � . n. -- 1: 1: �, S�ii.,�t�,tiO4�áú<).,: 0.�--�. . . ,. 1..:::Px� .-ql. "dllo.10.�. .- 1 11 ........-. .:� q �.g. .: . .10P -1:14.91. ..:1 ...�... . 1. .. ...- 1...:_... .:..�...�.::..... �. . ,-----. 1 -----. ....- �.. �.. ---.. . .. ,.�...��...�.�.l....1. .....�.... ... ..... .. - �. .---- 1 -1.1. . -... ...... ....:.. -:iuóo�:�:�ú:,.tli.ul,le 'P,l�P94��guo�::.�.aav:,1UDI -C-11�:.. -� y .,a",.. .�-. ..:::"�' nJ ,9 '' "" ''' ' 'JdS::: '', ' """ """ .'..,.'. ..':::: ÁT.Timut - uml:��:Sáo� :�OSIgluDan :�-a:s:"4:1,�:...:.:.... 1.... .: ----- ... 1 .'.-T:pn: S.T�GAS.:T�����i�il::,,. ....:.::::.::::.��: . -'.'::.: �:::�1... :.... .. 1 ... �:::::::.:!�:::::::::::::..:.,::......l. . - , .I., :,:....:_::':�-...... . .. ....-... . .. . ::::::�:::, ::::::::::::'::-:::::-:: -::::-:::: --- -"....�.....�....:.,:.:,::..�.:...::.- -�:::::,.,:::.:: ,�1 1 � ..., � . . . ... I.T. , ,:-::,.." �. .�.� 1 � .1 .. .. .. - .1. .. �.. � '� --- . . .. .... .. . ........ , 1.....
�---.-.

- 102 -
VII. A STRATEGY FOR PROVINCIAL FISCAL REFORM AND EXPENDITURE EFFICIENCY
7.01 The need for fiscal. reform in the provincial public sector isevident and fully supported by the officials at the natiLonal andprovincial levels. The objectives of this reform should not be just toreduce the deficit (although this is by far the most urgent), but alsoto transform the provinces irnto agents of development which generatesurpluses that they can invest wisely to increase total provincialproduct, thereby augmenting their future tax revenues.
7.02 The reform strategy must initiate a clear break with pastprovincial financial practices, in which poor fiscal management,resulting in skyrocketing, prcivincial deficits, generally has beenrewarded by transfers from the Central Government or by subsidized loansfrom the Central Bank. Before implementation of the Revenue Sharing Lawin 1988, transfers predominarLtly were discretionary grants from Haciendathat are neither transparent nor predictable. The Central Bank hasprovided rediscounts or overdrafts for the Provincial Banks to meet theliquidity crisis caused by their deficit financing to the provincialgovernments. These provincial financial practices have contributed tounsustainable public sector fiscal and quasi-fiscal deficits, and theircontinuation would undermine national efforts to attain price stabilityand to promote sustainable economíc development.
7.03 To be successftul, a strategy for provincial fiscal reform andimproved expenditure efficiency must encompass two dimensions: nationaland sub-national.
(a) At the national level, there must be in place a system ofintergovernmental transfers (including revenue sharing,matching grants. ancl loans) that are predictabLe, transparent,financially sustainable, and that provide inceantives toprovincial fiscal autonomy. The granting of credit toprovincial banls by the Central Bank must be rigorouslycontrolled.
(b) The sub-nationaLl level of the strategy must iiiclude the entiresub-national public sector, not only provincial centraladministrations, but also their indirect administrations,including public enterprises, as well as direct and indirectmunicipal goverrnmenit administrations. A broad approach to theentire sub-national. public sector is necessary because inArgentina's federal system, fiscal reform is only as strong a.sthe weakest link in the system. National public sectordeficit reduction eifforts will fail if provincial governmentfinances are not sound, and these, in turn, will not be soundif provincial enterprises and/or municipalitieas generatedeficits that cLemand provincial "bail-outs" tlnat eventuallywork their way up to the Central Bank or the National

- 103 -
Secretaria de Hacienda. The sub-national public sector"matrix" is illustrated below.11
Institutional Matrix for Sub-national Government
Government Levels
Provincial Municipal
Non-financial Sub-sectorGeneral Administration
CentralizedConsolidated
decentralizedUnconsolidated
Decentralized EntitiesProvincial Public EnterprisesSocial Security Entities
Financial Sub-sector
7.04 Given the objectives and scope described above, the proposeddesign criteria and actions required for implementation of the strategyare presented below.
A. Desian Criteria for the Strategy
7.05 The criteria for design of the strategy may be grouped in twobroad categories: intergovernmental transfers and provincial financialmanagement. Implementation of an improved system of intergovernmentaltransfers is the responsibility primarily of the Central Government,while responsibility for improved provincial financial management restswith the provinces, although the Central Government may provide valuableassistance to them. A fundamental prerequisite for success informulating and implementing a strategy for provincial fiscal reform andimproved expenditure efficiency ¡s a transparent (sanctioned throughlegislation and implemented through the budgetary process) anddiaciplined process for access to credit by the sub-national publicsector. This requires that the Central Bank maintain strict controls onrediscounts by provincial banks, thereby not allowing its funds to beused by provincial banks to finance their provincial government
DI.! For a more complete discussion of this structure, see Annex ChapterI, para. 1.12.

- 104 -
deficits. Furthermore, prudential regulation is required in manyprovinces in order to have adequate discipline and control over theprovincial banks' operations. Without these disciplinar, measures, thedetailed proposals presented below will be doomed to failure.9
The Central Government and. Intergovernmental Transfers
7.06 The system for t:he transfer of revenues from the Central toProvincial Governments (arnd from Provincial to Municipal Governments)should be based predominarntly on a revenue sharing systein that islegally mandated and formula-driven. This is based on the normativeposition that a revenue sharing system should provide sufficientrevenues to sub-national governments so that, when combined with areasonable revenue effort by the sub-national governments, these may atleast adequately operate and maintain their existing ser7ices. Theoverall system of intergovernmental transfers should provide, therefore,not only a reliable source. of revenues to provinces, but also strongincentives to improved provincial revenue performance. Discretionarygrants should form a small part of the "pool" of resources flowing fromthe Central to Provincial Goverrnments, basically limited to providingsupport in emergencies such as flooding. New provincial investmentsshould be financed by provincial savings in current accolnt and byresponsible borrowing. Given this normative framework, the strategy forprovincial fiscal reform should include an intergovernmiental transfersystem that:
(a) is predictable;(b) is transparent;(c) provides transfers i.n sustainable and equitable quantities;
and(d) provides incentives to provincial fiscal autonomy.
Provincial Financial ManaemeLt
7.07 Within the naticnal framework described above, the strategyrequires that provincial governments adopt financial managementpractices that promote:
(a) provincial finarncial. autonomy;(b) management effic.iency;(c) public accountability; and(d) expenditures tha.t support sustainable economic development.
iá/ For a discussion of tIhe r.eforms recommended for the Central Bank, an.dfor the financial system in general, see The World Bank, Argentina:Reforms for Price Stability and Growth, (Washington, D.C.: World BankCountry Study, 1990), Chapter-IV.

- 105 -
B. Instruments and Actions Required for Strategv Implementation
7.08 Following the framework for strategy design, recommendationsfor strategy implementation are presented according to the policyinstruments and actions to be taken by the Central and Provincial levelsof government. Implementation must be actively pursued by both levelsif the strategy is to be successful.
Central Government
7.09 The recommended policies and actions to be taken at theCentral Government level may be summarized in three areas: RevenueSharing System; Special Transfers for Provincial Investment; andProvincial Financial Management Information System.
7.10 Revenue Sharing System. Although the current Revenue SharingSystem (RSS -- sistema de coparticipacion), regulated under the December1987 legislation, may be criticized on several grounds, it is a vastimprovement over the chaotic transfer system prevailing before it wentinto effect. To its merit, the current RSS fully meets two of thecriteria for intergovernmental fiscal relations set out above, in thatit provides shared revenues that are transparent and predictable forboth Central and Provincial Governments. The RSS also appears to befiscally sustainable, although significant criticisms may be maderegarding the system's equity, in that its inter-jurisdictionalredistribution of revenues results in a flow of potential resources awayfrom provinces with the greatest number of households with unsatisfiedbasic needs. In addition, to the extent that all provinces recognizethat national revenue sharing will be the only guaranteedintergovernmental transfer to be received from the Central Government,the RSS also provides incentives to provincial fiscal autonomy.
7.11 It is recommended, therefore, that the basic RSS currently inplace not be changed in the near-term. As part of the continualevaluation of the system, however, it also is recommended that theCentral Government implement a system for monitoring the efficacy of thesystem, taking into account the criteria noted aboye (predictable,transparent, sustainable, equitable, and promoting provincial fiscalautonomy).§Y Basic inputs for monitoring and evaluation of the RSS couldbe provided by the Provincial Financial Management Information System,described below. Especially important is evaluation of the fiscalimpacts resulting from decentralizing the responsibility for theprovision of public services to sub-national governments, such as therecent transfer of responsibility for secondary education to the
§3/ Alternatives to the current allocation criteria of the RSS arediscussed in Section E of Annex Chapter I, and these may be useful indeveloping the Terms of Reference for the proposed monitoring andevaluation of the RSS.

- 106 -
provinces. It is very important, however, that the continual evaluationof the RSS, and eventual changes to improve it, not be done solely onthe basis of provincial financial management; rather, it should be madein the broader context of national fiscal policies for stabilization andeconomic development.2 Additional recommendations for this study arepresented in Chapter II (paras. 2.29-2.34).
7.12 Special Transfera ifor Provincial Investments (TPI). The RSSshould be considered primnarily as resources designated to meetprovincial recurrent expenditures. Creation of a new system of matchinggrants, the TPI, is recommended, and it would be designed to meet threebasic needs: (a) to immediately provide strong national incentives toprovincial fiscal autonomny; (b) to provide financing for capitalimprovements programs in the near-term for those provinces that generatecurrent account savings; and (c) to promote, in the medium- and long-term, the transition of t:he financing of provincial capital investmentsfrom earmarked, segmenteal sources of funding to competitive, non-segmented financing through domestic financial markets.
7.13 Several alternatives for providing resources for the TPI maybe considered. First, ernding the industrial promotion regime wouldeliminate a national fiscal drain estimated conservativaly at 3.5percent of GDP, or close to UJS$2.5 billion, per year (siae Chapter II,Section D). A part of the fiscal gain to be received by ending theindustrial promotion regime could be allocated to the T;PI. As analternative, or complemerLt, t:o the above, the TPI could be funded by the*pooling" of appropriate "special purpose" funds presenltly transferredto provinces as current a.nd capital grants (discretionary, earmarkedtransfers) such as FEDEI, the nutrition and tobacco funds, etc.Together, these funds (e:cludling the Housing Fund, FONAV'I, which isconsidered a loan fund arLd reported "below the line") have amounted toalmost one percent of GDFE, or about US$600 million per year, and theyare transferred to provinces on an ad hoc basis, withouit regard to theirfinancial performance. An al.ternative to combining all of these fundsinto one new fund vía legislation could be to allocate their resourcesas matching grants in accord with their improvements in fiscalefficiency via executive ordears.
7.14 Initially, the TPI could be included as a line-item in thenational budget, with clear regulations for use of TPI funds. Strongincentives to promote provincial fiscal autonomy would be providedthrough strict criteria for provincial access to the TP[. Access to TPIgrants would be limited to thlose provinces that have in place aFinancial Action Plan (see paLra. 49) that has resulted in currentaccount savings (without grants) at least during the preceding quarter.
«&/ Sea The World Bank, Argentina: Tax Policv for Stabilization andEconomic Recovery, (Washington, D.C.: World Bank Country Study,1990).

- 107 -
Access to the TPI only after a province has begun to generate currentsavings would provide not only a strong incentive for these savings, butalso an incentive for provinces to improve their financial reportingsystems.
7.15 The TPI would provide much-needed resources for capitalexpenditures in those provinces that have demonstrated the financialcapacity to properly operate and maintain their existing servicedelivery facilities and obligations. This matching capital granttransfer mechanism should not be considered a permanent facility,however. Rather, it should be a transitory mechanism necessary toprovide incentives and support to the necessary structural changes inthe financial relationship between the Central and ProvincialGovernments. One example of such a transitory measure was approved bythe Congress in December 1989: it defines sources of revenues and alsoclear regulations for their allocation, among provinces, including theexclusion of provinces failing to undertake measures to reduce theirfiscal deficits.
7.16 Thus, the TPI should be viewed as an initial step, moving awayfrom supporting provincial expenditures with national deficit financing,and toward the provinces eventually financing their investments withtheir own savings and with borrowing obtained through the nationalfinancial markets. Currently, however, Argentina's financial markets areunstable and segmented, and they are not efficiently mobilizing domesticsavings and allocating resources. Therefore, in the near-term, theTPI's key role would be to provide incentives for provinces to becomesavers, thereby reducing sub-national government pressures on theconsolidated public sector deficit. Combined with deficit-reducingmeasures by the Central Government and its public enterprises, the TPIwould therefore contribute to the macroeconomic conditions necessary forthe financial sector to perform more efficiently.
7.17 As Argentina's financial markets attain acceptable levels ofdomestic savings mobilization and of efficient resource allocation, theTPI could be phased out, with the provinces thereafter competing forfunds in non-segmented financial markets.
7.18 In sunmmary, the proposed TPI would be guided by four generalprinciples:
(a) access to the TPI by provinces would be voluntary;
(b) access to TPI grants would be competitive, with thoseprovinces making greater financial management improvements(generating greater current account surpluses) being eligibleto receive more from the TPI;
(c) the quantity of funds allocated to the TPI, as well as theconditions for transfer of these funds to provinces, would be

- 108 -
consistent with the national strategy for development andstrengthening over time of national financial markets; and
(d) TPI grant financing would be available only for expendituresthat are part ofE a Iprovincial budget that has been accepted bya national authority on the basis of its verification that theexpenditures are directed to operations that are economicallyefficient, financially sustainable and institutionallymanageable (see discussion of the Provincial Planning andBudgeting Systerm, P]BS, para. 7.29).
7.19 Financial Management Information System. It is impossible toformulate satisfactory macroeconomic policy without information on theprovinces, when they are spending well over 12 percent of GDP andrunning up deficits of over US$1 billion per year. Since 1986, however,provincial governments havre stopped sending data on their finances tothe National Ministry of Economy.§' Thus, the formulation and conduct ofnational macroeconomic policíes have been "flying blind" with respect tothis important part of the public sector.
7.20 In order to provide data essential to macroeconomic policyformulation, as well as to monitor provincial progress toward fiscalautonomy, it is recommended that the Central Government move immediately,to establish a Provincial Financíal Management Information System(FMIS). Baselíne date for the FMIS would be provided by the provincesthrough their PBS. Initially, the PBS would be the Finanacial ActionPlan to begin the process, but: a more comprehensive expertditure planningand budgeting system woul¿ be implemented over time. The PBS would bethe key instrument for thei planning, programming and control ofprovincial revenues and expenditures and it would also be the primaryinstrument for analysis of provincial eligibility for TPI resources, inthat it would províde informat:ion on the economic efficiency andfinancial sustainability cf the provincial plans.
7.21 The FMIS would serve two key functions. First, it wouldprovide the Central Goverrment: with a necessary input foir nationalfiscal policy. Also, it w,ouldl provide the base on which to identifyprovincial needs for technical assistance for improved f:inancialmanagement, and to design such assistance programs. Very usefulexperience in the design and implementation of such information systemscurrently is available in the five provinces (Buenos Aires, Cordoba, LaPampa, Neuquen and Santa Fe) that are implementing the Bank financedMunicipal Development Project (Loan 2920-AR), where municipal financialmanagement information systemsi are being developed at the provinciallevel. The experience wíth thle new budgeting system in the province of
§S/ Although central/provincial relations have improved under the newGovernment, the intergovernmental flow of financial data still islimited and insufficient for macroeconomic policy formulation.

- 109 -
Mendoza is also most interesting, showing how much can be done whenthere is a strong commitment to fiscal reform (See Box 6.1).
7.22 A prerequisite for making the FMIS useful, as well as all theother measures recommended for implementation at the Central Governmentlevel, is adequate institutional capacity to manage the overall processfor restructuring provincial government financial management. There areseveral options for strengthening the Central Government's capacity tooverview the provincial development process, with this process including(a) dimensioning and regulating the TPI, (b) development and analysis ofthe FMIS (including monitoring the performance of the RSS), and (c)review of PBSs. One option would be to strengthen the national Ministryof Economy's in-house capacity; another would be to contract with anappropriate technical assistance entity, either a public institution(such as a university or CFI), or a private organization (such as FIEL,the Fundacion Mediterranea, or a consulting firm). Because of thetransitory nature of the TPI and of national scrutiny of the PBSs, somecontracting of outside support to the Central Government may be thepreferred option. In any case, however, a "baseline", permanentstrengthening of the Ministry of Economy would be necessary to ensureadequate linkages between the proposed FMIS and macroeconomíc fiscalpolicy. Similar institutional support and strengthening would berequired in the provinces in order to implement the recommendations forprovincial government actions described below.
Provincial Governments
7.23 It is recommended that the provinces undertake the followingto implement the strategy for fiscal reform and improved expenditureefficiency: begin immediately to formulate Financial Action Plans; andinitiate the design of Provincial Planning and Budgeting Systems.
7.24 Financial Action Plans. Provincial FAPs would be the firststep in moving toward provincial financial autonomy. They would becomprised of preliminary annual budgets for a three to five year period.The FAPs would emphasize measures that may be taken immediately toimprove performance, without the need for detailed studies orinformation systems. After the reform process is initiated under a FAP,more comprehensive measures could be undertaken through permanentProvincial Planning and Budgeting Systems as the FAP is phased out.
7.25 The main objective of the FAP is to identify simple measuresthat should increase revenues and control expenditures so that theprovince may produce a current account surplus to be used forinvestments and to amortize loans. In defining current account surplus,discretionary grants of any type (i.e., ATN, FDR, FEDEI, etc.) shouldnot be counted as current revenue, but all automatic revenue sharingshould be counted, including revenue sharing and royalties. In otherwords, only automatic or formula-driven intergovernmental transfersshould be counted as current revenue.

- 110 -
7.26 The FAP should show strategies for the followi.ng:
--Increasing revenues--Tax revenues (Property, Turnover, Transfer, etc.)--Non-tax revenues (Fees, Tariffs, etc.)
--Controlling Expenditures and Increasing Efficiency- -Personnel
--Goods and Services--Investments--Debt Service--Transfers--Other
The FAP would explain the measures to be taken with regard to each ofthese items and present estimates of total impact.
7.27 On the revenue side, simple improvements in billing andcollection procedures would have considerable pay-offs. On theexpenditure side, the FAP would present the province's plans for reducinLgexpenditures and increasirng their efficiency, and it wouLd initiate theirimplementation. Three gerLeral areas appear to be particularly important:personnel, procurement, arnd irnvestment design and execut:ion. Personnelis by far the largest and fastest growing expenditure catiegory in mostprovinces.
7.28 In summary, the FAP involves implementation of therecommendations presented in the Chapters III-V of this report (revenues,expenditures and deficit finarncing), and it would be the first step inimplementing a more effective budgeting process in the provinces in whichthe annual budget would be a comprehensive one-year slice of the mediumterm plan.
7.29 Provincial Planning and Budgeting System. After an initialperiod (about one year) of implementation of the FAP, provinces wouldmove to implementing their PBS. The recommendations of Chapter VI couldserve as guidelines for this.
7.30 The PBS would bei a key tool for provincial planning, budgetingand control. It also would be fundamental for monitoring theeffectiveness of provincial management, not only by provincialauthorities, but also by the National Secretaria de Hacienda as itmonitors macroeconomic policy and evaluates whether the province iseligible for access to the TPI. Key components of the PBS would include:
(a) planning and control of p,rovincial revenues;
(b) expenditure priorities, including
(i) maintenance and rehabilitation

- 111 -
(ii) personnel policies that provide adequate professionalism andperformance
(iii) new investments, with projects costing greater that an amountagreed with the Secretaria de Hacienda subject to a competentbenefit/cost analysis to ensure economic efficiency;
(c) reliable projections of total and incremental (with and without aproposed investment) revenues to ensure financial sustainability;
(d) strategies for financing investment costs, including own savingsand borrowings; and
(e) financial and service delivery relationships with decentralizedprovincial agencies and enterprises, as well as municipalities.
7.31 The proposed design and implementation elements of thestrategy for provincial fiscal reform and improved expenditure efficiencyare summarized in Figure 7.1. The elements that may be initiatedimmediately are noted with an asterisk. Figure 7.2 (based on Table 7.1)illustrates the potential impact to result from implementation of theproposed strategy. Using the 1987 budget estimates for all provinces asa baseline, the impact is estimated of different percentage increases inprovincial tax and non-tax revenues and of reductions in expenditures.Table 7.1 presents estimates of these results in terms of absolutemonetary impact, as well as the resulting improvements (compared to thebaseline) on current account savings, with and without grants (i.e.,savings and own savings). For example, a relatively modest increase inrevenues and decrease in expenditures of 15 percent would transform acurrent account (without grants) of almost US$ one billion (and a needfor financingthis deficit and capital expenditures of almost US$ three billion) to acurrent account surplus of US$ 164 million and an overall need forfinancing of about US$ 1.6 billion. Increases of revenues and decreasesin current expenditures by 25 percent would result in a current accountsurplus (without grants) of over US$ 900 million, and lower the totalneed for financing to less than US$900 million.
7.32 This means that improvement at the 25 percent level wouldenable the provinces to undertake an aggregate capital expenditureprogram on the order of $1.4 billion, fully financed with current accountsavings combined with modest capital revenues and existing grant funds.Or, provinces could maintain the 1987 level of capital expenditures ($2.3billion), financed in about equal proportion by current account savingsand by long-term borrowings, if available. Improvements of thesemagnitudes are not unrealistic. They would depend first on the politicalwill to undertake the reform strategy recommended here, as well ontechnical assistance in implementing the proposed financial managementimprovements.

- 112 -
Figure 7.1 - ARGENTINA
STRATEGY FOR PR.OVIENCIAL FISCAL REFORM AND EXPENDITUREEFFICIENC'l DESIGN AND IMPLEMENTATION MATRIX
Strategy Design Criteria Instruments ActiorLs Required
1. Intergovernmental TransferSystem that Provides:
(a) Predictability RSS Maintain current RSS;(b) Transparency RSS
(c) Sustainable and Equitable Evalu.ation of, andQuantities of Transfers RSS recomimendations for
improvement in RSS;Implemnent FMIS*.
(d) Incentives to ProvincialFiscal Autonomy TPI* FMIS; Establish TPI*.
2. Provincial Fínancial Managementthat Promotes:
(a) Autonomy FAP*/PBS(b) Management Efficiency PBS Political conmitment;;(c) Accountability PBS Technical assistance.(d) Economic Development PBS
Legend: * indicates actions that may be implemented immediately;RSS is Revenue Sharing System;TPI is Transfers for Provincial Investments;FMIS is Financial Man.agement Information System;FAP is Financial Action Plan; andPBS is Provincial Planning and Budgeting System.

- 113 -
Figure 7.2
SIMULATION OF THE IMPACT OF FISCALREFORM ON CURRENT ACCOUNT SAVINO
MILLIONS OF US$2500
2000 -
1500
1000 /
500 - "
-50010 15 20 25 30 35
% INCREASE IN REV AND REDUCTION OF EXP
- OWN SAVING ---- SAVING WITH GRANTS
Source: Seo Table 7.1.

- 114 -
Tabte 7-1: SENSITIVITY ANALYSIS OF THE IMPACTS OF PERCENTAGE INCREASES
IN REVNUES ANO REDUCTIONS II EXP¡NDITURES FOR LL PROVINCES, 1907
(Milliotn of Uit of Iuty 1968>
silmULtion of K¡.cts of the Firnomel Action Ptas
Revenues *nd Expendítures
Ilpct of Percntge Increses oin aveftIs
*nd RaductIon of ExpendItures
1987 10.0X 15.02 20.02 25.02 30.02 35.02
1. CURRENT REVENUES 5,672
Provincial Sources 2.503
Tax 2.178 218 32? 436 545 653 762
Non-Tax 325 33 49 65 81 98 114
mationmt Source« 3,169
2. CURRENT EXPENDITURES 6,3
Personnel 4,171 417 626 834 1,043 1.251 1,460
Goods nd Services 856 86 128 171 214 257 300
Other 1,611
3. CAPITAL REVENUES 72
4. GRANTS 454
5. CAPITAL EXPENDITURES 2.3226. TOTAL REVENUES ANO GRANTS(1+344) 6,198
7. TOTAL EXPENDITURES (2.5) 8,960
8. OVERALL DEFICITISURPLUS 0R
NEED fOR FINAJBC1G (6-7) (2,762) <2,009) (1,633> <1,256) (879) <503) (126)
TOTAL 1NPACT OF FISCAL REFMIN 753 1,130 1,506 1,833 2,259 2,636
CURRENT ACCOUNT SURPLUS
WITNOUT GRANTS£(Uh SAVING)(1 - 2) (<6>) (213) 164 540 917 1,293 1,670WITH GRANTS <SAVING) (1 - 2 + 4) (512) 241 61 994 1.371 1,747 2,124
Scuree: Estintee besed en es study <kit& for .tt 22 provinm *nd th. dme l qaIttet.

- 115 -
PART II
ANNEXES AND STATISTICAL APPENDIX

e

- 117 -
INTRODUCTION
The Annexes cover: the governnental structure of Argentina; theavailable data on provincial public finance and the methodological questionsinvolved in their analysis; the CFI stratification of the provinces into fourmain groups; and the selection of the provinces for the case studies. Theseannexes are followed by the Statistical Appendix.

- 118 -
ANNEX CHAPTER I. OVERVIEW OF THE PUBLIC FINANCE DATA AND REPORTING PROCEDURES
A. Government Structure for Provision of Public Services
1.01 The Argentine State is organized in three political-administrativeand territorial jurisdictions: the central, provincial and municipal levels.Within this federal organization, all governmental powers formally emanatefrom the provinces. Provinces delegate limited powers to the CentralGovernment and retain for themselves all other authority. Provinces areautonomous entities governed by their own Constitutions. Municipalities areorganized as part of each province's system of government.
1.02 The Central Government is empowered to meet the main general n,eedsof Argentine society and to provide for the common interest of the differentterritorial subdivisions. There are also "concurrent powers" entrusted by theConstitution to both the Central Government and the Provinces, and even tomunicipalities by provincial delegation. Because of the diversity ofProvincial Constitutions, and a historically strong interpretation of theCentral Government's authority in practice, there is a gretat deal ofdiversity among the provinces with regard to service delivetry authority andresponsibility. In general, however, responsibilit'ies for service provisionmay be illustrated as follows: exclusively Central Government -- defense,foreign affairs, inter-province transportation and trade retgulation, mail andtelecommunications; Central and Provincial Governments--seicondary and highereducation, preventive health, justice, security, economic dlevelopment, majorpassenger and cargo terminals, housing, electric and gas energy; Provincialand Municipal Governments -- elementary education, primary health care, waterand sewerage, regional and local roads, fire control; and predominatelyMunicipal Governments -- solid waste collection and disposal, local streetsand drainage, parks, markets, cemeteries and land use planning and control.
1.03 As provided in the National Constitution, the Central Governmenthas the following sources of revenues: (a) resources allocEated to itexclusively and on a permanent basis (taxes on foreign tra¿le and profits fromthe postal service); (b) resources allocated permanently in conjunction withthe Provinces (domestic taxes); and (c) resources allocate¿l temporarily and ona shared basis with the Provinces (direct taxes in cases of nationalemergency). Categoríes (b) and (c) have contributed approximately 80 percentof total Central Government tax revenues, and have formed the basis for theCentral/Provincial Governments' revenue sharing system.
B. The Availabilitv of Data
1.04 Although incomplete and out-of-date, the data available in theSecretaria de Hacienda of the National Ministry of Economy (hereafter calledthe Hacienda data) are useful for analyzing the historical trends for all of

- 119 -
the provincesJ/ The strategy for analysis ia to use the case study data tocomplement the Hacienda data and vice versa. For example, the Hacienda dataon all of the provinces are used for an overview of all 22 provinces, and thedata from the case studies to estimate how accurate these data portray thesituation of the provinces, as well as how trends might have shifted in 1987.For these reasons, it í8 important to understand the limitatíons of theHacienda data.
Coverate of the Hacienda Data
1.05 The Hacienda data cover only the Consolidated GeneralAdministration of provincial government, but do not cover the non-consolidated, decentralized entities and the public enterprises at theprovincial level (hereafter called public enterprises), which include theutility companies in many provinces. This results in a significantunderestimation of investment and sometimes of the consolidated public sectordeficit for these provinces where these utility companies are excluded.
1.06 The case study data for the provinces of Buenos Aires and Santa Fegive an idea of the size of the underestimation due to this exclusion. Thepublic utility enterprises of these two provinces spent a total of US$576.7million in 1986 of which US$193.8 million was for fixed investment. Althoughthese enterprises are theoretically "autonomous", they are actually financedby continual transfera from the General Administration. In so doing, theseenterprises spent and invested more than the Province of Chubut. Even aftertransfers from the Central Administrations, the total need for financing in1986 for the non-consolidated entities was US$146.1 million for the twoprovinces. In 1987, the need for financing of these enterprises in BuenosAires alone was US$164.6 million, an increase of 37 percent over the previousyear. Thus, this gap in the Hacienda data represents a significant under-reporting of the provincial non-financial public sector, especially of thewater supply and sewage sector, where urgent reforms are needed to increaseuser fees and efficiency. Given this importance, a high priority should be toincluding these public enterprises in the provincial accounts.
Non-existence of Provincial Public Finance Data after 1986
1.07 In addition to this incomplete coverage, there are no Haciendadata on provincial finance at all after 1986. Until the 1987 exercise, thebudget data were collected and analyzed by the Direccion Nacional deProgramacion Presupuestaria of the national Secretaria de Hacienda. Theprovinces then refused to send this information to Hacienda, as they contendedthat it was used for ̀ political ends" by the Central Government. Asdiscussed in Chapter V of Volume I, the lack of 1987 data is particularlyimportant, as the rapid drop of provincial, own-source revenues (especiallynon-tax revenues), together with a continuing rise in expenditures, caused thetotal need for financing to more than double to over US$1 billion. Thisexplosive increase in the provincial deficita is undoubtedly part of the
1! For a discuasion of these data, see Chapter I of Volume I.

- 120 -
reason why the provinces no longer wanted to send the data to Hacienda.However, with the new Government, the provinces have agreed to resume sendi!ngthe data.
1.08 The Fundacion de Investigaciones Economicas Latinoamericanas(FIEL) used the Hacienda data to develop a set of Consolidated Public SectorAccounts that cover the 1960-85 period, but FIEL does not produce theseaccounts on a regular basis, as it is a private non-profit foundation.2/ TheConsejo Federal de Inversiones (CFI)--a public institution c:ontrolled by theprovinces--receives budget information from the provinces; however, it doesnot analyze and publish the recent results in any systematic manner.
C. The Reportina System for Provincial Public Finance Data
1.09 The estimates of provincial revenues, expenditures and deficitoften vary significantly, depending on the classification of' budget items andthe inclusion or exclusion of different provincial entities. It is normallyassumed that the user should know the reasons for these differences, althoughthis is not always the case.
1.10 One of the objectives of the Provincial Governmeint Finance Study¡s to make these differences more transparent and to show how the Argentinesystem is different from that generally used by the Bank for analysis ofpublic finance. Another is to develop a set of accounts which follows asclosely as possible that used in the Bank.
1.11 The first part of this Annex Chapter discusses the institutionalstructure of the provinces and explore its relationship with provincialfinance; the second, deals with the classification of budget items inArgentina and by the Bank, as well as the "hybrid" system proposed here.
Institutional Structure of Provincial Government
1.12 In Argentina's Federal System, the institutional structure ofevery province is different. Thus, the institutional "map" would have to bevery detailed to show all of these differences. Fortunately, most provinceshave about the same general struciture so that a general ̀ map" can point outsome of the main institutiona:L elements of its structure:
--General Administration (Administracion General)
--Central Administration (Administracion Central)
--Consolidated Decentralized Entities (Organismos DecentralizadosConsolidados). These normally have some administrative autonom3y,may have some independent sources of revenue, but are still
2/ The effort was funided by the Consejo Empresario Argentino: FIEL,El Gasto Publico. . .1987, op. cit.

- 121 -
included in the provincial budget.
--Special Accounts (Cuentas Especiales) are separate accountsestablished by law in which revenues from sources specified in thelaw can be transferred for uses that are also specified in thelaw. Although both the sources and the authorized users of theresources are defined by the law, the province also may transferadditional resources to these accounts from the general fund.These special accounts tend to be much less important at theprovincial level than the national level.
--Unconsolidated Decentralized Entities (Organismos Decentralizados NoConsolidados) These have some administrative autonomy, normally havetheir own sources of revenues such as fees, tariffs and taxes, but donot appear in the budget of the Administracion General, although theirindividual budgets normally appear in the provincial government's budgetdocument.
--Provincial Public Enterprises (Empresas Provinciales) These arepublic enterprises in the usual sense of the term. Their budgets andfinancial statements normally do not appear in the provincialgovernment's budget documents.
--Social Security Entitites (Organismos de Prevision Social)
1.13 Although all six of the provinces surveyed have this basicatructure, there ís no consistency in the way in which different provincestreat the same type of activity. For example, the water companies and otherpublic utilities are treated as Consolidated Decentralized Entities in Salta,Chubut and Santiago del Estero, but as Unconsolidated Decentralized Entitiesin Buenos Aires and Santa Fe. Also Cordoba's water company is a publicenterprise. The study file contains information on the institutionalatructure of all of 22 provinces.
1.14 To simplify presentation, both the non-consolidated decentralizedentities and the public enterprises are ca}led public enterprises unlessspecific reference is made to the former.- Also, the central administrationand its consolidated, decentralized entities are called the generaladministration. Thus, for the purpose of this study there are only two mainadministrative units of analysis:
The general administration, covering the centralized entities and theconsolidated decentralized entities.
The public enterprises, including the non-consolidated,
3/ This is exactly as FIEL, op. cit., does. Both the non-consolidated decentralized entities and public enterprises havetheir own sources of revenue and are not consolidated in theprovincial budget.

- 122 -
decentralized entitiesr, social security entitles, and publicenterprises.
Institutional Structure and Consolidated Public Accounts
1.15 The institutional complexity described above greatly complicatesthe generation of the Consol.idated Public Accounts for the Provinces. TheDireccion National de Programac:Lon Presupuestaria of the national Secretariade Hacienda received budget datal from the provinces on the AdministracionGeneral until the 1986 exercise. These Hacienda data cover the budgets of theCentral Administration and the Consolidated Decentralized Entities, but notthe Unconsolidated Decentralized Entities, as these are not part of theprovincial budget, although theiLr separate budgets sometim,es appear as part ofthe budget document. Hence, the utility companies are included in these dataonly for provinces where they are "consolidados". In the case studyprovinces, these utility companies would be covered in the Hacienda data onlyfor Salta, Chubut and Santiago del Estero, but not in Buenos Aires and SantaF*, which are Unconsolidated or in Cordoba, which has public enterprises.4/
1.16 In generating it.s consolidated public accounts, FIEL went to thegreat trouble of separating out all of the Organismos Decentralizados (bothconsolidados and no consolidados>) with the characteristics of publicenterprises (i.e., administrative autonomy, own source revanues from goods andservices, etc.), but lumped them all together under "empresas publicas",including the big national ones. This FIEL methodology results in anunderestimate of the importance of the sub-national goverranents, as these sub-national public enterprises are directly subordinated to these governments,although they have some autonomy. It would be better to show separateaccounts for each administrative unit (See para. 1.12 of this Chapter).Consolidation could then be done with emphasis on calculat:Lng thedeficit/aurplus of each of these administrative units.5/
1.17 Because the consolidated public sector accounts reported inprevious Bank studies use the data from Hacienda on the provinces' generaladministration, they do not cover either the Unconsolidatecd DecentralizedEntities.
1.18 Even excluding the provincial public utilities, the have beenspending about 11 percent of GDP. With these enterprises, expenditures wouldbe about 12 percent of GDP or about US$8 billion per year. Clearly, sub-national governments deserve more careful attention in the consolidated pu'blicsector accounts.
4/ The public utility enterprises of Cordoba are not included in thisanalysis.
si See para. 7.03 in Volume I for an idea of what categories might beused in this analysis.

- 123 -
The Provincial Accountint Systems
1.19 Reports on the same province using the same budget data may showdeficits of very different sizes caused by shifting important items from aboveto below ̀ the linea or vice versa. The same kind of expenditure or revenuemay also be classified differently by different provinces. Finally, theprovinces use cash basis reporting for revenues, but not for expenditures.This section will deal with three key financial reporting issues: cash basisreporting for revenues but nor for expenditures; definition of the deficit orsurplus; and "above or below the line."
1.20 Cash Basis Reporting for Revenues but Not Expenditures. Revenuesare reported when received; expenditures, when the commitment is made. Unpaidpayment orders (both those for which the payment date has not expired andthose in arreara) are treated as accrued liabilities of the province, and assuch, constitute part of its floating debt.
1.21 Definition of the DeficitlSurplus. The IMF Manual defines thedeficitlsurplus concept as follows:
Deficit/Surplus = Borrowing - Amortization + Net Cash Transfers
Deficit/Surplus = Expendltures on goods and services + Transfers +Lending - Repayments - Revenue - Grants
'A government deficit thus represents the portion of expenditure and lendingwhich exceeds receipts from revenue, grants, and loan repayments. . .Thedeficitlsurplus concept thus measures whether the government meets the costsof expenditure and lending activities undertaken for public policy purposeswith receipts from revenue, grants and loan repayments and which thegoverñment. covers by undertaking obligations for future repayment and/orrunning down its liquidity holdings." 6/
1.22 Before the 1980 exercise in Argentina, the concept of deficit wasmeasured as the "resultado" which is the net change in short term assets andliabilities:
Resultado = Net Borrowing - Need for Financing
Where
Net Borrowing = Borrowing - Amortization
Need for Financing = Revenue (including Transfers) - Expenditures
61 IMF, A Manual on Government Finance Statistics, Washington, D.C.,1986, p. 106.

- 124 -
1.23 In Argentina, where expenditures are reported before delivery orpayment, this "resultado" was quite important. With the implementation of Law22.202 in the 1980 exercise, the provinces began to use the more traditionaldefinition of deficit/surplus: the total borrowing needs of the publicsector. This definition is much closer to that of the IMF, except that itincludes the floating debt because expenditures are reported before deliveryor payment.Z! Some provinces, such as Cordoba, also report on a cash basis,which enables analysis of the composition of the floating debt over time andby line item. Santiago del Estero also reports expendítureis at the deliverydate.
1.24 The floating debt reflects the backlog of unpaid obligations, iandunder the reporting procedures of Argentina's provinces it is quite important,as it may be a non-transparent means of deficit financing. Provinces arefinancing a significant portion of their deficits through suppliers andcontractors. These, in turn, include an interest change as part of the priceto cover not only the risk of not being paid, but also the cost of borrowingfor the supplier or contractor. In this sense, the supplier or contractor isactíng as a bank. The real interest rate in Argentina is quite high (e.g.,even before hyperinflation, public bonds yielded about 25 percent in dollarsper year). In short, the large floating debt increases the costs of goods andservices for the provinces.
1.25 Because Grants are not included as current revenues under the IMFsystem, two measures of currant saving are used:
14. Current Account Surplus without Grants. (Own Saving)
15. Current Account Saving with Current Grants (Saving)
In addition, Gross Fixed Asset Formation is calculated by subtracting Sellingof Fixed Assets from Real Injestinent.8/
1.26 Reporting "Above and Below the Line". This study follows asclosely as possible the methodology recommended in the IMF Manual. The maindifference between the approach used in Argentina and in this study is that:this study reports all discretionary grants "above the line" as Grants,including the Aportes del Tesoro Nacional, Regional Development Fund (whichwas eliminated by the new Revenue Sharing Law), the Electric Fund and allother special accounts unless they require repayment. In Argentina, all ofthese normally appear "below the line" as "financing". Only the Housing Fund(FONAVI) is reported "below the Linea" as financing.
7/ Using cash basis reporting for both revenues and expenditures asthe IMF recommends, the floating debt would not be included aspart of the deficit. However, it would be analyzed in the budgetreport (See memorandum item 14, ibid, pp. 210-211).
8/ See Summary Tablea of Major Components, ibid, pp. 112.

- 125 -
D. Transfers from the Central Government
1.27 Understanding the transfers from the national to the provincialgovernrnents is key for understanding provincial finance in Argentina. Thesecan be classified into four main types in accord with how they are allocated:(1) to the provinces (automatic or discretionary) and (2) by the provinces(earmarked for a particular use or free allocation by the provincialgovernment), as summarized in the following matrix:
Allocation to Allocation by the Provincesthe Provinces ----------
Free Allocation Earmarked
Automatic a b
Discretionary c d
1.28 Types a and b are considered to be provincial taxes collected bythe Central Government and, therefore, as current revenues from nationalsources. These inter-goverrnental transfer categories are summarized asfollows.
a. The main transfer in this category are the federal taxes transferredautomatically to provincial governments under Federal Revenue Sharing(Coparticipacion Federal) for use as they see fit. Revenue sharing istreated here as a current provincial revenue, as is generally the case. InArgentina, there is less consensus with regard to royalties with someprovinces treating them as current tax revenues from a national source andothers as a current, own-source, non-tax revenue, as does FIELI9 Allroyalties are treated here as a current revenue from a national source whetherthey be for hydroelectric power, hydrocarbons or uranium, because the CentralGovernnent owns all subsoil resources in Argentina and the law governingroyalties is thus a national one. Another alternative would be to treat themas a grant that compensates for the loss of a non-renewable resource (i.e., asa kind of reparation for the loss of an asset or to cover environmentaldamage). This would imply that resources from royalties should go todevelopment projects of some type that would cover the loss of revenue whenthe resource is exhausted. In fact, royalties now go into the general fund ofthe provinces and are allocated as they see fit, mostly for salaries.
b. Automatic, earmarked transfers include the highway development fund(Coparticipacion Vial) and social security funds transferred to pay pensions.Both of these are treated here as current revenues from national sources,although they are collected for the provinces by the Central Governnent.
c. Discretionary Grants (Aportes Del Tesoro Nacional) are unrequitedand non-repayable transfers from the Central Government to the provinces. As
9/ FIEL, El Gasto Publico, op. cit., p.60.

- 126 -
such, they are reported as grants.
d. Discretionary, earmarked transfers include those from the RegionalDevelopment Fund (FDR), the Special Fund for Electrification of the Interior(FEDEI), the National Housing Fund (FONAVI), as well as a hLost of smallerfunds (i.e. for nutrition, health, etc.). Except for FONAVI, all are treatedas grants.L6/ FONAVI transfers are considered as borrowing.
1.29 The amounts transferred through these four different channelsconstituted over 8.3 percent of GDP in 1986, about two percentage pointshigher than for the first three years of the decade. However, the amountatransferred via the two most important types (revenue sharing anddiscretionary grants) varied widely over the years, with the biggest shiftoccurring during the 1984-87 period when there was no formal revenue sharinglaw, meaning that all transfers were legally grants.L../ For example, theHacienda data show revenue sharing to be zero in 1987 and projected to be over5 percent of GDP in 1988. Although Discretionary Grants tended to rise tocompensate drops in the Revenue Sharing and vice versa, the total amount goingto the provinces has also be.n t,emporally unstable. In order to interprethistorical trends, the discretionary grants received under the "transitoryrevenue sharing agreements` during the 1984-87 period by the six provincessurveyed are considered in this study to be revenue sharing (l.e., currentrevenue from a national source).
1.30 The provinces normally share part of the resources from thenational revenue sharing witli municipalities. The primary and secondarydistribution criteria used by the provinces vary widely, but tend to beweighted toward redistribution, rather than fiscal effort. Royaltiesincreased by fivefold from only 0.2 percent of GDP in 1980 to 0.8 percent iLn1986. As mentioned above, royalties are very important sources of revenue forthe provinces of the resource frontier.
l0/ Although all should be treated as grants, it was not alwayspossible to do so as the smaller funds are often grouped into one"other" category under financing that could contain someborrowing. In all oi the tables in the Statistical Appendix, the"other" category was left as "financing" (i.e., below the line),although some of it could have been classified -as grants, if theavailable data were adequately disaggregated.
11/ Hacienda treats all revenue sharing done during this period asgrants (Aportes del Tesouro Nacional), as do sorne provinces.However, other provinces consider the transfers under the ad hocrevenue sharing agreements during this period aes current revenuefrom a national source, but it is not always clear how theydetermined what was revenue sharing and what wais grant money.

- 127 -
E. Rationale for Inter-Qovernmental Transfers
1.31 Conceptually, there are three major reasons for ínter-governmental fiscal transfers: (a) the provision of services by onejurisdiction generates the spill-over of benefits or costs in anotherjurisdiction; (b) because of legal and/or administrative attributes, onelevel of government has a comparative advantage in raising revenues over otherlevels of government, and it is therefore more efficient for it to collect arevenue and then share it with other levels of government; and (c) a higherlevel of governrent is not satisfied with the distributive impact of thefiscal base status quo of other governments under its jurisdiction andcentralizes the collection of certain revenues so that distributive objectivesmay be achieved through the inter-governmental fiscal transfer system. Insummary, the three arguments generally used to justify inter-governmentaltransfers are: spill overs, equity and efficiency in tax collection.
1.32 When sub-national governments are expected to have a significantrole in providing public services, public sector efficiency requires thatsub-national governments receive fiscal transfers in a sufficient amount sothat, combined with a reasonable sub-national government own-source fiscaleffort, these governments may at least continue to maintain their currentlevel of services.
1.33 In addition to quantity, predictability of inter-governrentaltransfers is important to public sector management efficiency. In Argentina,high variations in the annual amounts transferred to the provincialgovernments from the Central Government made it difficult for provinces toeffectively plan their capital investments before 1988.
1.34 In order to identify improvements in the effectiveness ofArgentina's inter-governmental fiscal transfers system, it is necessary toidentify the transfer allocation criteria, which may be classified asfollows:
---Straight devolution: The taxes collected by the revenue sharingentity are divided according to the proportion of the total tax collected ineach jurisdiction. In this case, the revenue sharer is just acting as a taxcollector for the other entity.
---Fiscal Efficiency: In this case, allocation of the shared funds isbased on some measure of the level or the increase in tax receipts. Forexample, the distribution of the receipts of a given tax might be based on thetotal tax "effort" of the province or municipality.
--Redistribution: Distributive criteria include: provincial population,surface area, equal shares, the inverse of population size, indicatora ofunderdevelopment, poverty and unsatisfied basic needs. The higher thepositive correlation of the criteria with the jurisdictions's total taxreceipts, the lower the distributive impact. To the extent that populationsize is normally more highly and directly correlated with total tax receiptsthan such criteria as surface area or equal shares, its distributive impact

- 128 -
will be lower. Distributiv'e imnpact is highest where the criteria areinversely correlated with total tax receipts, as is generally the case withpoverty or underdevelopment criteria. It is, therefore, interesting to di.videthe distributive criteria into two subgroups: proportional redistribution(population, surface area or equal shares) and compensatory redistribution(inverse of population size, development gap, etc.).
1.35 As discussed in Chapter II (para. 2.15), Argentina's currentRevenue Sharing System strongly favors territorial redistribution, but ittends to transfer resources away from areas with high conc,antrations of pciorfamilies.

- 129 -
ANNEX CHAPTER II. SOCIO-ECONOMIC STRATIFICATION OF THE PROVINCES
A. The CFI Stratification of Provinces
2.01 In addition to analyzing the data from each province indivíduallyor for all of the provinces together, the provinces are analyzed by group.Rather than do a new stratification of the provinces, this study employs oneused in many CFI studies (hereafter referred to as the CFI stratification) inwhich the provinces are classified in four groups:
Advanced--Buenos Aires, Cordoba, Mendoza, Santa Fe and the FederalCapital (Municipality of Buenos Aires).
Low Density--Chubut, La Pampa, Neuquen, Rio Negro and Santa Cruz.Intermediate--Entre Rios, Salta, San Juan, San Luis and Tucuman.Underdeveloped--Catamarca, Chaco, Corrientes, Formosa, Jujuy, La Rioja,Misiones and Santiago del Estero.
These four groups are relatively homogeneous with regard to population size,economic product and poverty levels. This type of analysis is particularlyimportant in Argentina given the great diversity of the provínces with regardto all three of these variables.
2.02 The tables of Part I of the Statistical Appendix show a number ofbasic indicators for the provinces and these provincial groups, includingTotal and Per Capita Gross Provincial Product population, and households withunsatisfied basic needs. The "Advanced Provinces" and Capital Federal all hadpopulations of over 1.3 million in 1985, as well as above median per capitaproduct and below median poverty as measured by the proportion of householdswith satisfied basic needs. The 'Low Density" provinces all had smallpopulations (ranging from 134,000 to 460,000), but high per capita products.Of the five provinces in this group, two had high relative poverty (Neuquenand Rio Negro) with about a third of the families with unsatisfied basicneeds.
2.03 One problem with this stratification is that the names of the fourgroups are confusing. For example, Formosa has low demographic density, butis classified as "Underdeveloped" and not "Low Density." More descriptivenames for these same CFI regions would be:
Advanced = High Population and Gross Provincial Product(GPP)
Intermediate = Intermediate Population and Per Capita GPP.These provinces had populations ranging from 500,000 to 1.3 million in1985 and per capita GPP in the middle third of the dístribution.
Low Density = Small Population and High Per Capita GPP. These areprovinces on the "Resource Frontier", such as Chubut, Neuquen, etc.
Underdeveloped = Low Per Capita GPP and High Poverty.Note that the last category uses slightly different criteria than the others

- 130 -
in that it includes all provinces with low per capita product and highrelative poverty levels, evem those with populations of sma,ll and intermediatesize. One way to think of tlhis process of classification, then, i8 that th.poorest provinces are first Igrouped into one group, and the rest are, in turn,classified by population and per capita product.
B. Population, Product and Poverty by Province and CFI Group
2.04 Of the total estimated population of 30.6 million in 1985, 21.6million (70.5 percent) lived in the Advanced Group. The 36,000 inhabitants ofTierra del Fuego are excluded. Almost 40 percent of Argentína'is totalpopulation lived in the Prov:Lnce of Buenos Aires alone in 1985. Well over halfof the population líve in the, three largest provinces: Buenos Aires, Santa Feand Cordoba. The population of the Province of Buenos Aires ia about the namas that of Chile, living in an area about the size of Italy (307,571 aquarekilometers). However, 63.6 percent of this population la concentrated in th.Municipalities of Gran Buenos Aires.
2.05 The total population of the five provinces of the Low DensityGroup was only 1.4 million in 1985, about half that of the province of SantaFe in the same year. However, these provinces are quite important in economicterms, due mostly to their hiigh production of oíl, minerals and other primaryproducts. The total populatilon of the 5 provinces of the Intermediate Groupwas 3.6 million (11.8 percent; of the National total). The 8 provinces of th.Underdeveloped Group had a total population of 4.0 million (13.6 percent ofthe National total), ranging frota 180,000 in La Rioja to 7810,000 in Chaco.
2.06 Although the percentage of households with unsatisfied basic needstends to be higher in provinces with smaller populationa and lower per capitaproducts, such as Formosa (46.8 percent) and Santiago del Estero (45.8percent), the concentration in absolute terms la highest in the AdvancedGroup, especially its three largest provinces. For example, of the 1.6million households with unsatisfied basic needs, 59.5 percent lived in theAdvanced Group, with 35.9 pezcent located in Buenos Aires, 13.4 percent inSanta Fe and 7.5 percent in Cordoba. The Underdeveloped Group had 20.5percent of the total, and thei other two regions combined 19.9 percent. Thus,efforts to redistribute territorially, as in revenue sharing, can run at oddswith the objective of interpersornal distribution, as they tend to distríbuteaway from the areas where the: abssolute concentrations of the poor are thehighest.
2.07 Gross Provincial Product (GPP) ls very highly concentrated in theAdvanced Group (78.4 percent).A.2/ The GPP of all eight provinces of theUnderdeveloped Group was less than that of Santa Fe in 1985, as was the total
12/ For a discussion of the methodology used in calculating the GroseProvincial Product, see: Consejo Federal de Iniversiones, ProductoBruto Geografico: 1970-1985, Buenos Aires, CFI", 1988. Thispublication ís currently available for most of the provinces.

- 131 -
GPP of the Intermediate Group. The fastest growing provinces during the1970-80 period were outside of the Advanced Group, especially on the ̀ resourcefrontier` due mostly to the increase in gas and oil production. For example,Neuquen's GPP grew at 11.6 percent per annum during the 1970s. However,stagnation set in for most of the provinces in the first half of the 1980s,especially for the Underdeveloped Group which showed a decline of about 1percent per year. The biggest loser, however, was the Federal Capital forwhich GPP dropped at about 2.8 percent per year.
2.08 Per capita GPP give a totally different ranking. Among theProvinces, the Province of Buenos Aires ranks in twelfth position with a percapita GPP of US$1,675, less than half that of the Province of Santa Cruz,Chubut or Neuquen. The three poorest provinces (Formosa, Santiago del Esteroand La Rioja) had per capita GPP of less than US$1,000.

- 132 -
ANNEX CHAPTER III. FIELD WORK IN THE PROVINCES
3.01 Case studies of six provinces were done to: cover the importantgaps in the data on provincial finance from Hacienda and the total lack ofcentrally collected data after 1986 (See Annex Chapter I iri this Volume), andalso to do interviews to obtain a more detailed understanding of howprovincial finance works. In these interviews, emphasís was given to the"felt need" for fiscal reforms at the provincial level, if any, and what kindof technical assistance would be needed to implement them.
3.02 The following were among the questions addressed: What are themain existing sources of provincial revenues? How could these receipts beincreased in efficient and equitable ways (e.g., improvemernt of cadastres,better collection procedures, training, etc.)? What is the willingness toimplement such reforms? How could provincial expenditures be reduced or bemade more efficient and equitable? What is the willingness to implement suchreforms? What are the sources of provincial credit? Of sp,ecial interest arethe more "informal" ones such as accounts in arrears, overdrafts on provincialbanks, etc.
3.03 Six provinces were s,elected for these case studies for thefollowing reasons:
Buenos Aires, Cordoba and Santa Fe, because they had the highestabsolute deficits of aLl t]he provinces except Salta in 1986 and becauseover 60 percent of Argeantina's population resided in them in 1985.
Santiago del Estero, because it was the only province to register asurplus in both 1983 and 1986, although it is among the poorestprovinces of Argentina.
Salta, as it had one the h:Lghest per capita deficits and also issues"bonds" which have all of the characteristics of currency.
Chubut, because it is very dependent on transfers from the CentralGovernment in the form of royalties and because it is in the Patagonianregion.
These six provinces accounted for 68.8 percent of the total populationin the provinces in 1985, 62.8 percent of households with unsatisfied basicneeds in 1980, half of total fiscal deficit of the general administrations ofall of the provinces, and 70.9 percent of the gross provincial product.
The frequency of the six provinces included in the field work by CFIgroup is as follows:

- 133 -
Sample Universe
Advanced 3 5
Low Density 1 5
Intermediate 1 5
Underdeveloped 1 8
Total 6 23

- 134 -
ARGENTINA
STATISTICAL APPENDIX
LIST OF TABLES
I. GENERAL DATA ON PRICES, POPULATION, PRODUCT MIt POVERTY
1. Consumer and Wholesale Price Indices Used2. Total Population by Regional and Province: 1970-19853. Households with Unsatisfied Basic Needs: 19804. Gross Provincial Product by Provincial Group and Province: 1980-19855. GDP per Capita by Province, Provincial Group and Sector6. Annual Rate of Change of GDP by Sector, Provincial Group and
Province: 1980-19857. GDP by Sector, Provincial Group and Province: 19808. GDP by Sector, Provincial Group and Province: 19859. GDP by Sector, Provincial Group and Province: 1970
II. PUBLIC FINANCE DATA F.ROM THE SIX PROVINCES STUDIED: 1981-1987
10. Revenues, Expenditures and Financing
10.a US$10.b. Percent of Gross Provincial Product10.c Per Capita10.d Suimmary Table of Performance Indicators
11. Revenues, Expenditures and .Financing for the General A.dministration Only:Summary Tables for All Six Provinces: 1986-1987
11.a US$11.b. Percent of Gross Provincial Productll.c Per Capita11.d Summary Table of Performance Indicators
12. Revenues for the Genera:L Admninistration Plus Provincial PublicEnterprises for All S:Lx Provinces: 1986-1987
12.a US$12.b. Percent of Gross Provincial Product12.c Per Capita12.d Percent of Total. Revenues12.e Percent of Total Expenditures

- 135 -
13. Expenditures for the General Administration Plus Provincial PublicEnterprises for All Six Provinces: 1986-1987
13.. US$13.b. Percent of Grosa Provincial Product13.c Per Capita13.d Percent of Total Revenues13.e Percent of Total Expenditures
III. PROVINCIAL GOVERNMENT REVENUES, EXPENDITURES AND FINANCINGFOR THE CONSOLIDATED GENERAL ADMINISTRATION OF
THE 22 PROVINCES AND THE MUNICIPALITYOF BUENOS AIRES IN US$: 1981-1986
14. Provincial Revenues, Expenditures and Financing: 1981-1986 (US$)
14.a US$14.b Percent of Total Expenditures
IV. PROVINCIAL GOVERNMENT FINANCE INDICATORS BYPROVINCIAL GROUP AND PROVINCE: 1981-1986
15. Total Revenues by Provincial Group and Province: 1981-1986
15.a US$15.b. Percent of Gross Provincial Product15.c Per Capita
16. Own Source Revenues by Provincial Group and Province: 1981-1986
16.a US$16.b. Percent of Gross Provincial Product16.c Per Capita16.d Percent of Total Revenues
17. Revenues from National Sources by Provincial Group and Province:1981-1986
17.a US$17.b. Percent of Gross Provincial Product17.c Per Capita17.d Percent of Total Revenues17.e Percent of Total Expenditures
18. Total Expenditures by Provincial Group and Province: 1981-1986
18.. US$18.b. Percent of Gross Provincial Product

- 136 -
18.c Per Capita
19. Personnel Expenditures by Provincial Group and Province: 1981-1986
19.a US$19.b. Percent of Gross Provincial Product19.c Per Capita19.d Percent of Total Revenues19.e Percent of Total Expenditures
20. Total Provincial Public Employment by Region and Province: 1983-1986
21. Total Investment by Provincial Group and Province: 1981-1986
21.a US$21.b. Percent of Gross Provincial Product21.c Per Capita21.d Percent of Total Revenues21.e Percent of Total Expenditures
22. Current Account Surplus Without Grants (Own Saving) by Provincial Groupand Province: 1981-1986
22.a US$22.b. Percent of Gross Provincial Product22.c Per Capita
23. Current Account Surplus With Grants (Saving) by Provincial Group andProvince: 1981-1986
23.a US$23.b. Percent of Gross Provincial Product23.c Per Capita
24. Overall Deficit/Surplus or Need for Financing by Provincial Group andProvince: 1981-1986
24.a US$24.b. Percent of Gross Provincial Product24.c Per Capita
25. Net Variation in Short Term Assets and Liabilities by Provincial Groupand Province: 1981-1986
25.a US$25.b. Percent of Gross Provincial Product25.c Per Capita

- 137 -
I. GENERAL DATA ON PRICES, POPULATIM, PRODUCT AND POVERTY

- 138 -
ARGENTINAPROVINCILI GOVERMENT FINANCE STUDY
Table 1CONSUIER AND WNOLESALE PRICE INDICES
Base: JuIy 1988 100
Phrlod Consumer Wiolesale Average(al
1970 0.00000147 0.00000138 0.000001431980 0.00381685 0.00288433 0.003350591961 0.00780456 0.00604555 0.006925051982 0.02066464 0.02154142 0.021103031983 0.09171153 0.09906286 0.095387191984 0.66648748 0.66888000 0.667644041965 5.14648186 5.10235061 5.124416241966 9.783132 8.360398 9.0717651967 za.631415 18.634139 20.6327771988 100.246987 95.513934 97.880461
1/1988 38.250913 33.950816 36.6009642/1988 43.345701 38.488807 40.9172543/1988 49.734456 44.743903 47.2391804/1988 5U.304732 52.275832 55.29028251i988 67.470934 64.442511 65.9567226/1988 79.591910 79.938701 79.765306711986 100.000000 100.000000 100.00000061988 127.625271 131.852215 129.7387439/1988 142.547638 140.309354 141.42849610/1988 155.367556 146.722814 151.04518511/1966 164.245563 152.418158 158.33186112/1988 175.479171 161.024102 168.251637
SOUBCE: FIEL, INDICADORES DE COYWITURA, Agosto 196,p. 74, 78 nil 110.
NOTE: a) Australes viii be transtorued to July 1966values using the average of the 'Nivel General Total'of both the "Indice de Precios al Consumidor' for theFederal Capital and Gran Buenos Aires and of the*Indice de Precios al por Mayor' froa INDEC, and then¡ito dollars using the average value *financieros forJuly (lUS* a 12.18 Australes). The financial uarketis legal, but vas imuch higher than that of the officalrate (IUS$ a 9.66 Australes).

- 139 -
ARGENTINAPROVINCIAL GOVENIIENT FINANCE STUDY
Table 2Total Population by Provincial Group sad Province: 1970-1985
000's
Groups 1970 1980 1985 Absolute Chante Annial RateaProvlnce -------------------- --------------------
70180 80/85 70/80 80/85
TOTAL 23348.9 27920.1 30613.8 4571.2 2693.7 1.80 1.86ADVANCED 16915.7 19857.8 21567.7 2942.1 1709.9 1.62 1.67Capital Federal 2972.5 2922.8 2898.3 -49.6 -24.5 -0.17 -0.17Buenos Aires 8774.5 10865.4 12090.9 2090.9 1225.5 2.16 2.16Cordoba 2060.1 2407.8 2603.0 347.7 195.3 1.57 1.57Nendoza 973.1 1196.2 1326.3 223.2 130.1 2.09 2.09Santa Fe 2135.6 2465.5 2649.2 330.0 183.6 1.45 1.45
LOW DENSITY 863.6 1213.5 1442.4 349.9 228.9 3.46 3.52Chubut 189.9 263.1 309.7 73.2 46.6 3.31 3.31La Pampa 172.0 208.3 229.1 36.2 20.9 1.93 1.93Neuquen 154.6 243.9 306.3 89.3 62.4 4.66 4.66Rio Negro 262.6 383.4 463.2 120.7 79.8 3.85 3.85Santa Cruz 84.5 114.9 134.1 30.5 19.1 3.13 3.13
INTERMEDIATE 2655.3 3224.2 3557.6 568.9 333.4 1.986 1.99Entre Rtos 811.7 908.3 960.9 96.6 52.5 1.13 1.13Salta 509.8 662.9 755.9 153.1 93.0 2.66 2.66San Juan 384.4 466.0 513.1 81.6 47.1 1.94 1.94San Luis 183.5 214.4 231.8 31.0 17.4 1.57 1.57Tucuman 766.0 972.7 1096.1 206.7 123.4 2.42 2.42
UNDERDEVELOPED 2914.3 3624.6 4046.0 710.3 421.5 2.21 2.22Catamarca 172.3 207.7 228.1 35.4 20.3 1.89 1.89Chaco 566.6 701.4 780.4 134.8 79.0 2.16 2.16Corrientes 564.1 661.5 716.2 97.3 54.8 1.60 1.60Forzosa 234.1 295.9 332.7 61.8 36.8 2.37 2.37Jujuy 302.4 410.0 477.4 107.6 67.4 3.09 3.09La Rioja 136.2 164.2 180.3 28.0 16.1 1.89 1.89misiones 443.0 589.0 679.1 146.0 90.1 2.89 2.89Santiago del Ester 495.4 594.9 651.9 99.5 57.0 1.85 1.85
Source INDEC

- 140 -
ARGENTINAPROVINCIM. GOVERNNENT FINANCE StUDY
Table 3Households vlth Unsatisfied Basic Needs byProvincial Group and Province: 1980
Groupg Ablsolute S of S ofProvinces Provincial National Aceumulated
Total Total % %
TOTAL 1,585,223 100.0ADVANCED 943,659 17.7 59.5 59.5Federal Capital 67,692 7.4 4.3 4.3Buenos Aires 568,925 19.9 35.9 40.2Cordoba 118,315 19.2 7.5 47.6Mendoza 56,061 20.4 3.5 51.2Santa Fe 132,666 20.0 8.4 59.5
LO DENSITY 83,735 28.6 5.3 64.8Chubut 18,695 29.8 1.2 60.7La Pampa 10,679 18.5 0.7 61.4Neuquen 17,951 33.9 1.1 62.5Rio Negro 30,401 32.8 1.9 64.4Santa Cruz 6,009 22.7 0.4 64.8
INTERMEDIATE 232,077 32.9 14.6 79.5Entre Ríos 61,360 27.9 3.9 68.7Salta 58,228 42.4 3.7 72.4San Juan 25,803 26.0 1.6 74.0San Luis 14,078 27.7 0.9 74.9Tucuuan 72,608 36.6 4.6 79.5
UNDERDEVELOPED 325,752 42.3 20.5 100.0Catamarca 16,129 37.6 1.0 80.5Chaco 67,410 44.0 4.3 84.7Corrientes 56,889 40.6 3.6 88.3Formosa 28,732 46.8 1.8 90.1JuJuy 38,886 45.1 2.5 92.6La Rioja 11,002 31.6 0.7 93.3Misiones 50,553 39.2 3.2 96.5Sgo. del Estero 56,151 45.8 3.5 100.0
SOURCE: INDEC, LA POIIREZA EN LA ARGENTINA

- 141 -
ARGENTINAPROVINCIAL GOVERNMENT FINANCE STUDY
Table 4Gross Provincial Product by Provincial Group and Province: 1970-1985
Millions of US$ of July 1988
Groups 1970 1980 1985 Absolute Change Annual RatesProvinces
70180 80/85 70180 80/85
TOTAL 46521.8 59718.9 59238.6 13197.1 -480.3 2.53 -0.16ADVANCED 38390.6 46953.9 46454.7 8563.3 -499.2 2.03 -0.21Capital Federal 13221.8 15704.7 13588.7 2482.9 -2116.0 1.74 -2.85Buenos Aires 15750.4 19021.8 20037.3 3271.4 1015.5 1.91 1.05Cordoba 3024.5 4316.5 4466.2 1292.0 149.7 3.62 0.68Mendoza 2279.5 2260.5 2633.1 -19.0 372.6 -0.08 3.10Santa Fe 4114.4 5650.4 5729.3 1536.0 79.0 3.22 0.28
LOW DENSITY 2097.3 3800.3 3838.2 1703.0 37.9 6.12 0.20Chubut 559.9 995.6 886.1 435.8 -109.5 5.93 -2.30La Pampa 370.1 497.3 665.3 127.2 168.1 3.00 6.00Neuquen 330.6 993.9 910.4 663.3 -83.5 11.64 -1.74Rio Negro 561.7 862.3 977.9 300.6 115.5 4.38 2.55Santa Cruz 275.0 451.2 398.5 176.2 -52.8 5.08 -2.46
INTERFIIDIATE 3404.5 4875.1 5044.3 1470.6 169.2 3.66 0.68Entre Rios 1183.4 1319.3 1217.5 135.9 -101.8 1.09 -1.59Salta 626.8 951.1 1110.2 324.3 159.0 4.26 3.14San Juan 3B8.6 569.4 591.0 180.8 21.6 3.89 0.75San Luis 238.2 351.5 415.7 113.3 64.2 3.97 3.41Tucuman 967.5 1683.8 1709.9 716.3 26.1 5.70 0.31
UNDERDEVELOPED 2629.3 4089.5 3901.4 1460.2 -188.2 4.52 -0.94Catamarca 129.7 251.1 289.1 121.4 38.0 6.83 2.86Chaco 466.5 713.3 636.9 246.8 -76.4 4.34 -2.24Corrientes 637.7 866.1 793.2 228.4 -72.9 3.11 -1.74Formosa 196.3 246.3 251.1 50.0 4.8 2.29 0.39Jujuy 355.5 642.5 647.8 287.0 5.4 6.10 0.17La Rioja 103.6 163.6 158.6 60.0 -5.0 4.68 -0.61Misiones 336.2 628.2 581.0 291.9 -47.1 6.45 -1.55Santiago del Ester 403.9 578.5 543.6 174.6 -35.0 3.66 -1.24
Saurce CFI
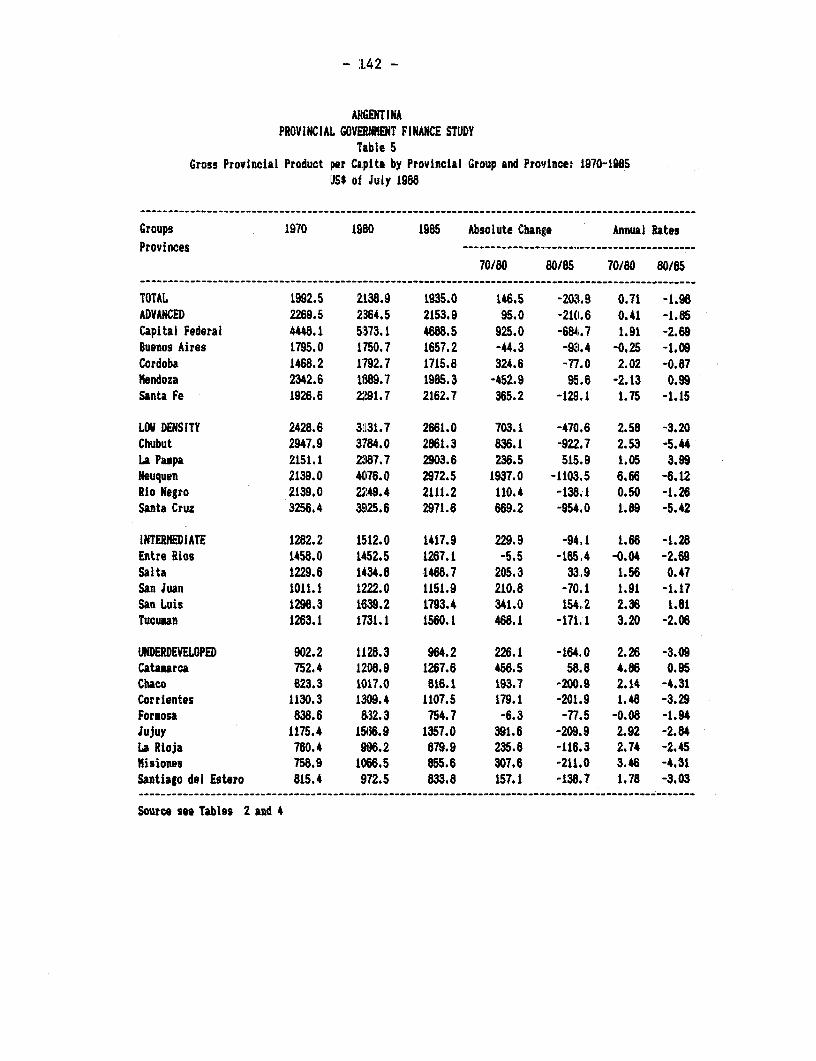
- .L42 -
ARGENTINAPROVINCIAL GOVEfMENT FINANCE STUDY
Table 5Gross Provincial Product per Capita by Provincial Group and Province.: 1970-1985
US$ of July 1988
Groups 1970 1980 1985 Absolute Change Annual RatesProvinces -------------------------------------------
70/80 80/85 70/80 80/85
TOTAL 1992.5 2138.9 1935.0 146.5 -203.9 0.71 -1.98ADVANCED 2269.5 2,364.5 2153.9 95.0 -210.6 0.41 -1.85Capital Federal 4448.1 5373.1 4688.5 925.0 -684.7 1.91 -2.69Buenos Aires 1795.0 1750.7 1657.2 -44.3 -93.4 -0.25 -1.09Cordoba 1468.2 1792.7 1715.8 324.6 -77.0 2.02 -0.87mendoza 2342.6 18899.7 1985.3 -452.9 95.6 -2.13 0.99Santa Fe 1926.6 2;791.7 2162.7 365.2 -129.1 1.75 -1.15
LOW DENSITY 2428.6 3131.7 2661.0 703.1 -470.6 2.58 -3.20Chubut 2947.9 3784.0 2861.3 836.1 -922.7 2.53 -5.44La Pampa 2151.1 2387.7 2903.6 236.5 515.9 1.05 3.99Neuquen 2139.0 4076.0 2972.5 1937.0 -1103.5 6.66 -6.12Rio Negro 2139.0 2249.4 2111.2 110.4 -138.1 0.50 -1.26Santa Cruz 3256.4 3925.6 2971.6 669.2 -954.0 1.89 -5.42
INTERMEDIATE 1282.2 1512.0 1417.9 229.9 -94.1 1.66 -1.28Entre Rios 1458.0 1452.5 1267.1 -5.5 -185,4 -0.04 -2.69Salta 1229.6 1434.8 1468.7 205.3 33.9 1.56 0.47San Juan 1011.1 1222.0 1151.9 210.8 -70.1 1.91 -1.17San Luis 1298.3 1639.2 1793.4 341.0 154,2 2.36 1.81Tucuman 1263.1 1731.1 1560.1 468.1 -171.,1 3.20 -2.06
UNDERDEVELOPED 902.2 1128.3 964.2 226.1 -164.0 2.26 -3.09Catamarca 752.4 1208.9 1267.6 456.5 58.8 4.86 0.95Chaco 823.3 1017.0 816.1 193.7 -200.9 2.14 -4.31Corrientes 1130.3 1309.4 1107.5 179.1 -201.9 1.48 -3.29Forzosa 838.6 832.3 754.7 -6.3 -77.5 -0.08 -1.94Jujuy 1175.4 15M6.9 1357.0 391.6 -209.9 2.92 -2.84La Rioja 760.4 996.2 879.9 235.8 -116.3 2.74 -2.45misiones 75B.9 1066.5 855.6 307.6 -211.0 3.46 -4.31Santiago del Estero 815.4 972.5 833.8 157.1 -138.7 1.78 -3.03
Source see Tables 2 and 4

- 143 -
ARGNTINAPROVINCIAL GOVERNlT FINANCE STUDY
Table 6uA~ ate of Change of Grois Provincial Product by Sector, Provincial Group ai Provino. 1970/15
Croups Total Agrícul- Nintng llanutac- Pubila Const. Producer Corce Flumo, PeroulProvlue ture ture Utilitie Services lu u Servio.
1 2 3 4 5 6 7 8 9…
TOTAL 1.62 2.00 2.78 1.20 5.67 -1.69 0.86 3.04 1.C5 2.5ADA~ 1.28 2.10 3.53 0.97 4.10 -3.19 0.66 2.87 1.58 1.70Fednal Capital 0.18 -0.60 2.84 -5.89 -0.31 1.64 1.30 1.15
~ AiUre 1.62 2.25 -1.12 1.14 5.42 -2.66 1.40 3.87 1.11 1.6Cordoa 2.63 6.09 -3.00 0.94 5.27 -0.04 3.13 1.34 1.31 1.07llN~ 0.97 -12.73 4.70 2.08 4.25 -0.69 2.73 4.42 2.19 -0.55Sata Fe 2.23 1.25 3.80 3.20 4.39 -1.80 1.13 3.66 0.97 2.54
LeU NEITT 4.11 2.59 3.20 5.62 16.17 -1.37 5.55 3.16 2.31 8.35C t 3.11 1.52 2.89 4.94 15.88 -4.81 4.36 1.68 1.31 5.04La Pe 3.66 2.75 2.33 9.81 9.43 3.65 4.17 4.42 2.55 5.74buq:tue. 6.96 s.09 9.64 4.04 20.26 -S.18 11.36 4.62 3.30 s.n31, negro 3.76 2.67 -1.14 4.97 12.27 1.40 3.73 5.03 3.10 8.30Souta Cruz 2.50 0.92 1.03 2.56 15.40 0.91 0.84 3.66 1.15 8.41
¡mtEDIATE 2.66 1.35 -0.12 3.40 9.96 3.89 0.21 3.52 1.8D 4.44Etre Atos 0.19 -0.37 0.18 -1.29 14.18 1.34 -5.03 1.74 0.03 3.17Salta 3.68 1.67 -1.13 1.83 10.24 5.66 4.31 3.39 2.46 7.54sea Jun 2.83 2.08 1.93 5.28 3.55 4.42 1.42 2.10 0.3 2.24Sau Luis 3.78 1.99 -1.37 7.85 2.76 1.53 1.80 5.70 2.1.2 7.18Ticuee 3.87 3.43 7.71 5.67 8.31 4.41 0.75 4.81 2.96 3.94
U IgEJhhIÉUD 2.67 1.77 -1.66 2.70 9.43 2.15 0.61 3.46 2L21 4.30Catacia 5.4D 3.02 -14.64 17.55 12.99 -1.06 0.29 2.23 1.94 7.01Chico 2.10 2.09 6.66 -0.o2 8.36 1.98 1.41 0.77 1.94 3.93Corrientes 1.47 1.42 6.55 1.74 8.87 -0.84 -0.26 2.51 1.54 1.65FOrm 1.65 -0.26 20.99 -2.02 11.89 -0.29 -3.92 6.91 3.66 6.06Julia 4.08 4.21 -2.81 3.53 7.97 6.40 3.57 5.52 5.06 5.75La Aleja 2.88 5.11 6.36 4.38 11.80 -5.80 -1.23 3.79 1.72 3.90olílo.s 3.71 2.25 -7.49 3.02 12.18 4.27 1.72 5.09 1.03 4.67Sge. del Estero 2.00 -0.74 -9.26 1.63 6.88 3.17 0.61 3.36 2.61 4.79
SW.: CFI

- 144 -
ARGENTINAPROVINCIAL GOVERNNENT FINANCE STUDY
Table 7Gross Provincial Product, by Sector, Provincial Group and Provlnce: 1985
Nilliona of US$ of Juiy 1986
Graupa Total Agricul- llining Manufac- Public Const. Producer Couuerce Finance, PersonalProvinces ture ture Utilitie Services Insurance Services
1 2 3 4 5 6 7 8 el
TOTAL 59238.6 8163.0 1174.4 17580.0 2366.7 2182.1 9768.3 4995.6 4e68.4 8140.3ADVANCEI 46454.7 5737.8 532.2 15648.3 1666.3 1295.4 8094.9 4188.1 3858.6 53.1Federal Capital 135%8.7 0.0 0.0 3405.5 681.3 324.2 3902.6 1217.3 1802.9 2254.98uenos Aires 20037.3 3412.3 50.0 8520.4 638.9 552.0 2201.3 1948.8 968.9 1744.7Cordoba 4466.2 1270.2 14.0D 826.1 105.6 131.5 729.1 227.7 581.1 580.9Mendoza 2633.1 51.8 466.1 937.7 73.1 181.3 348.2 94.2 236.4 24. 2Santa Fe 5729.3 1003.4 2.0 1958.6 167.5 106.4 913.7 700.0 269.3 608.4
LOW DENSITT 3838.2 560.9 518.0 350.0 356.2 239.9 652.7 211.1 346.1 603.3Chubut 886.1 40.6 111.1 124.1 90.1 42.6 155.8 102.2 84.1 135.5La Pupa 685.3 294.3 15.3 79.2 12.4 40.1 81.8 16.0 38.6 87.5Neuquen 910.4 39.5 205.4 33.0 167.4 37.5 219.1 30.9 81.7 96.0Rio Nesro 977.9 140.2 85.6 107.4 65.7 82.5 164.1 45.7 104.3 182.3Santa Cruz 398.5 46.2 100.6 6.2 20.6 37.2 31.8 16.3 37.4 102.0
INTERNEDIATE 5044.3 941.5 76.6 1010.7 221.3 328.7 6i4.4 352.0 453.4 1015.6Entre Rlios 1217.5 313.4 16.8 165.3 98.6 66.0 109.3 97.9 96.0 254.1Salta 1110.2 154.7 35.9l 147.8 45.4 107.6 221.9 42.0 86.6 268.3San Juan 591.0 109.1 17.3 152.3 18.2 50.4 69.8 20.1 28.4 125.5San Luis 415.7 132.9 4.i 69.3 1.8 11.8 38.6 22.1 39.3 75.5Tucuman 1709.9 231.5 2.3 456.1 57.3 92.8 204.7 169.9 203.2 292.1
UNIE3RDEVELOPED 3901.4 922.8 47.6 571.0 122.9 318.2 376.2 244.3 210.2 1O88.3Catamarca 289.1 33.0 0.8 72.3 7.3 13.4 20.8 6.6 8.9 126.1Chaco 636.9 178.3 1.5 52.9 17.8 45.0 99.2 34.7 45.8 161.7Corrientec 793.2 222.0 11.0 145.5 23.1 39.2 72.0 47.8 60.4 172.3Formosa 251.1 51.9 1.4 21.3 5.4 22.1 19.3 17.9 10.3 101..6Jujuy 647.8 156.6 25.1 149.6 22.6 51.4 63.3 24.2 26.2 129.0La Rioja 158.6 36.4 5.8 10.0 6.1 6.0 13.2 11.6 5.7 63.8NHsiones 581.0 127.9 1.2 85.6 28.5 95.6 7.4 57.5 20.7 156.6Sgo. del Estero 543.6 116.8 0.8 33.8 12.1 45.5 81.1 44.0 32.2 177.2
SOlRCE: CFI

- 145 -
ARCENTINAPROVINCIAL GOVERNMENT FINANCE STUDY
Table 8Gross Provincial Product by Sector, Provincial Group and Province: 1980
Millions of US$ of July 1988
sroups Total Agricul- Mininq Manufac- Public Const. Producer Conerce Finance, PersonalProvinces ture ture Utilitie Services Insurance Services
1 2 3 4 5 6 7 a 9
TOTAL 59718.9 6966.2 979.7 18523.4 2047.8 3153.6 10327.0 4538.2 5980.6 7202.4ADVANCED 46953.9 4713.1 266.9 16635.5 1475.3 1739.4 8612.7 3787.7 4790.9 4932.4Federal Capital 15704.7 0.0 0.0 4154.6 573.4 744.6 4564.1 1244.8 2312.6 2110.6Buenos Aires 19021.8 2632.0 78.8 9205.8 584.8 372.1 2104.7 1538.8 1029.3 1475.6Cardoba 4316.5 816.8 24.5 978.6 96.9 227.9 710.8 246.9 672.2 541.9Mendoza 2260.5 243.1 161.3 488.6 86.5 174.7 25.3.9 109.8 419.2 323.5Santa Fe 5650.4 1021.3 2.3 1807.9 133.6 220.2 979.3 647.3 357.7 480.7
L(M DENSITY 3B00.3 479.4 554.5 296.4 290.9 389.1 677.5 201.4 411.3 499.8Chubut 995.6 35.9 113.2 151.4 75.8 97.8 182.2 104.5 107.9 126.9La Pa qa 497.3 217.3 24.5 18.2 9.4 46.9 56.1 12.6 46.0 66.3Neuquen 993.9 34.9 209.4 40.3 140.9 B6.0 256.3 31.6 104.8 89.9Rio Negro 862.3 150.5 104.8 78.9 47.5 72.9 145.7 36.1 104.7 121.3Santa Cruz 451.2 40.9 102.6 7.6 17.3 85.5 37.2 16.7 48.0 95.5
INTERMEDIATE 4875.1 885.8 89.8 986.1 179.4 442.9 638.6 306.4 491.8 854.4Entre Rios 1319.3 276.9 17.1 201.6 83.0 151.6 127.9 100.1 123.1 237.9Salta 951.1 148.1 26.2 119.6 27.1 101.5 186.4 46.6 92.5 203.2San Juan 569.4 122.4 31.4 110.5 19.7 46.1 72.1 17.6 43.5 106.0San Luis 351.5 105.1 12.7 60.0 1.5 23.8 34.1 16.9 41.1 56.3Tucuman 1683.8 233.3 2.4 494.4 48.0 119.8 218.2 125.2 191.5 251.1
UNDERDEVELOPED 4089.5 887.8 68.6 605.4 102.3 582.1 398.3 242.7 286.6 915.8Catamarca 251.1 44.4 4.1 39.4 6.8 32.9 19.6 5.8 10.1 87.9Chaca 713.3 177.3 2.0 74.1 13.7 102.5 125.8 41.8 61.0 115.1Corrientes 866.1 196.1 11.2 177.5 19.4 90.0 84.2 48.9 77.4 161.3Formosa 246.3 51.4 0.6 25.5 3.5 31.6 23.8 15.6 11.9 82.3Jujuy 642.5 131.9 36.8 161.4 18.4 67.2 63.7 21.7 26.3 115.2La Rioja 163.6 32.2 5.9 12.2 5.1 13.8 15.5 11.9 7.3 59.7Misiones 628.2 127.0 2.4 80.5 25.5 137.8 6.4 51.8 55.1 141.7Sgo. del Estero 578.5 127.5 5.5 34.8 9.7 106.4 59.3 45.3 37.5 152.6
SGURCE: CFI

-- 146 -
ARGEaNTINAPROVINCIAL GOVERN1IENT FINANCE STUDY
Table 9Gross Provincial Product by Sector, Provincial Group and Province: 1970
ifillions of USS of July 1986
Groups Total Agricul- MIning Manufac- Public Const. Produceur Coamrce Finuace, PersonalProvinces ture ture Utilitie Servtcen lauranuce Servime
1 2 3 4 5 6 7 8 9
TOTAL 46521.8 6063.2 778.5 14696.0 1035.2 2818.7 8596.0 3169.0 3786.4 5558.8ADYANCED 38390.6 4201.4 316.4 13546.9 912.5 2106.5 7338.6 2700.5 3043.5 4218.2Federal Capital 13221.8 0.0 0.0 3727.0 447.4 806.4 4066.3 954.2 14B5.7 171268Buenos Aires 15750.4 2445.7 59.2 7192.0 289.2 826.9 1786.7 1102.4 720.5 1327.8Cordaba 3024.5 523.6 22.1 717.7 48.8 132.3 459.0 186.4 439.5 435.0Mendoza 2279.5 399.5 233.9 688.3 39.2 201.1 232.3 49.2 170.8 265.1Santa Fe 4114.4 832.7 1.2 1222.0 87.9 139.7 772.3 406.3 232.9 417.5
LOW DENSITY 2097.3 382.0 322.9 154.1 37.6 295.2 290.1 132.5 243.3 239.6Chubut 559.9 32.4 72.4 60.2 9.9 89.2 82.2 79.6 69.2 64.8La Pampa 370.1 196.0 10.9 19.5 3.2 23.4 44.3 8.4 26.5 37.9Neuquen 330.6 18.8 51.7 18.2 10.5 83.1 40.8 15.7 50.2 41.7Rio Negro 561.7 94.5 101.7 51.9 11.6 67.0 94.8 19.3 66.0 55.1Santa Cruz 275.0 40.3 86.3 4.3 2.4 32.5 28.1 9.5 31.5 40.2
INTERHEDIATE 3404.5 770.4 78.0 612.0 53.3 185.5 624.1 209.4 342.2 529.6Entre Rios 1183.4 331.4 16.3 200.7 13.5 54.1 237.0 75.6 95.6 159.2Salta 626.8 120.6 42.5 112.6 10.5 47.1 117.9 25.5 59.9 90.2San Juan 388.6 80.1 13.0 70.4 10.8 26.3 56.5 14.7 26.8 90.0San Luis 238.2 98.9 5.4 28.8 1.2 9.4 29.6 9.6 28.7 26.7Tucuman 967.5 139.5 0.8 199.5 17.3 48.6 183.1 84.0 131.2 163.5
UNDERDEVELOPED 2629.3 709.3 61.2 383.1 31.8 231.4 343.2 146.7 151.3 571.4Catamarca 129.7 21.1 8.4 6.4 1.2 15.7 19.9 4.7 6.6 45.6Chaco 466.5 130.8 0.6 59.9 5.3 33.6 80.4 30.9 34.3 90.7Corrientes 637.7 179.6 4.3 112.3 6.4 44.5 74.8 33.0 48.0 134.7Formosa 196.3 53.9 0.1 28.9 1.0 23.1 35.1 6.6 5.8 41.8Jujuy 355.5 84.3 38.4 88.9 7.1 20.3 37.4 10.8 12.5 55.7La Rioja 103.6 17.2 2.3 5.3 1.1 14.7 15.9 6.6 4.4 35.9Hisiones 336.2 91.7 3.8 54.8 5.1 51.0 5.7 27.3 17.8 79.0Sgo. del Estero 403.9 130.7 3.4 26.5 4.5 28.5 74.0 26.7 21.9 87.8
SOURCE: CFI

- 147 -
II. PUBLIC FINANCE DATA FROM THE SIX PROVINCES STUDIED: 1981-1987


- 149 -
ARGENTINAPROVINCIAL GOVERNENT FINANCE STUDY
TablelO.aPROVINCIAL REVENUES, EIPENDITURES AHD FINANCING: 1981-1987
GENERAL ADMINISTRATION (a)SUM OF Sil PROVINCES
lillions of US$ of july of 1988
1981 1982 1983 1984 1985 1986 1987 1981-1987 CoefficientMean of Variation
lb)
1. CURRENT REYENUES 2,746.63 2,345.65 2,225.40 2,472.96 2,605.92 3,030.64 2,927.58 2,622.11 10.51.1. Provincial Sources 1,529.71 1,316.79 1,218.32 1,533.50 1,402.87 1,692.45 1,443.58 1,448.17 10.01.1.1. Tas 1,293.95 1,146.97 996.95 1,284.27 1,211.43 1,434.40 1,271.76 1,234.25 10.21.1.1.1. Real estate 298.59 299.58 262.08 419.56 340.26 332.44 265.82 316.90 15.81.1.1.2. Automobile 118.85 91.53 88.52 155.18 145.63 139.11 111.16 121.42 20.01.1.1.13. Turnover 610.63 519.49 493.58 544.97 575.59 725.94 672.31 591.79 13.11.1.1.4. Transfer (Sellos) 240.37 164.15 135.69 130.79 141.01 215.37 194.90 174.61 22.81.1.1.S. Energy and Fuel 0.00 0.00 0.00 0.99 0.00 0.00 0.00 0.14 244.91.1.1.6. Others 25.51 72.23 17.09 32.80 8.95 21.54 27.58 29.38 64.31.1.2. Non-tas 235.76 169.82 221.37 249.22 191.45 258.05 171.82 213.93 15.81.1.2.1. Feos 1.66 18.77 13.93 5.26 5.37 5.88 5.68 8.08 68.71.1.2.2. Tariffs 0.00 0.00 0.00 14.36 16.55 19.53 20.15 10.09 88.41.1.2.3. lnterest 41.30 36.01 86.61 108.01 60.56 51.80 15.99 57.18 50.71.1.2.4. Transters received 0.00 0.00 0.00 0.00 0.00 0.00 0.00 0.00 --1.1.2.5. Others 192.80 115.04 120.83 121.59 108.96 180.83 130.00 138.58 22.51.2. National Sources 1,216.92 1,028.86 1,007.08 939.47 1,203.04 1,338.11 1,483.04 1,173.79 15.41.2.1. Federal Revenue Sharing (c) 1,020.43 868.38 805.80 754.34 921.81 1,016.33 1,185.51 93B.94 14.51.2.2. Highvay fund 85.72 73.47 95.31 89.82 120.75 130.58 112.97 101.23 18.91.2.3. Royalties 41.79 54.59 73.37 64.24 68.56 79.87 110.55 70.42 28.51.2.4. Others 68.98 32.41 32.59 31.07 91.92 111.33 74.00 63.19 47.11.3. Other sources of current revenues 0.00 0.00 0.00 0.00 0.01 0.09 0.96 0.15 220.92. CURRENT ElPENDITURES 2,785.69 2,087.55 2,470.69 2,917.40 2,764.29 3,223.13 3,344.65 2,799.06 14.22.1. Personnel 1,618.91 1,225.33 1,407.53 1,891.55 1,790.62 1,990.96 2,133.37 1,722.61 17.42.2. Good and services 260.61 235.09 263.93 278.27 304.22 437.29 416.28 313.67 23.72.3. Interest payrents 42.01 6.42 2.83 0.98 4.57 7.01 23.05 12.41 111.42.4. Other current expenditures 12.02 2.76 2.64 1.82 1.79 4.19 4.59 4.26 78.02.5. Current transfers 852.13 617.96 793.76 744.78 663.08 783.69 767.36 746.11 10.02.5.1. To aunicipal}ties 183.50 144.82 227.82 170.09 186.70 232.57 264.61 201.45 19.12.5.1.1. Revenue sharing 176.94 128.97 109.95 148.29 171.31 213.26 255.14 171.98 26.82.5.1.2. Discretionary grants 6.56 15.85 117.86 21.80 15.39 19.31 9.47 29.46 123.62.5.2. To provincial enterprises 0.81 66.17 30.47 34.64 31.02 43.47 41.35 35.42 51.02.5.3. To social security entities 293.60 171.52 181.02 144.51 132.65 146.87 101.90 167.44 33.92.5.4. To General Adsinistration 0.00 0.00 0.00 0.00 0.00 0.00 0.00 0.00 --2.5.5. Other 347.73 206.85 318.23 395.53 312.7i 360.78 359.49 328.76 17.13. CAPITAL REVENUES 68.95 8.37 8.72 29.62 16.87 38.64 37.69 29.84 66.43.1. Selling fixed assets 0.73 0.78 0.99 0.30 0.11 1.92 (0.03) 0.68 89.43.2. Payback of Loans 5.57 5.75 6.10 25.56 11.54 25.35 14.15 13.43 60.93.3. Others 61.86 1.84 1.63 3.75 4.78 10.68 23.06 15.37 131.54. GRANTS (Current aud Capital) 91.62 118.22 672.88 482.25 232.26 350.27 161.93 301.35 65.84.1. Discretionary Grants Id) 88.65 97.42 660.15 469.24 224.59 331.73 142.49 287.75 68.84.2. Regional Developaent Fund (FDR) 1.84 18.16 9.78 6.41 5.83 12.86 10.87 9.39 52.54.3. Electricity Fund (FEDEI) 1.13 2.63 2.96 6.60 1.84 5.68 8.57 4.20 61.04.4. Other 0.00 0.00 0.00 0.00 0.00 0.00 0.00 0.00

- 150 -
ARGENTINAPROVINCIAL GOVERNhENT FINANCE STUDY
TablelO.aPROVINCIAL REVENIES, EXPENDITURES AND FINANCING: 1981-1987
GENEL ADIIINISTRATION (a)SUN OF SIX PROVINCES
ll[Ilions of US$ of july oí 1988(Continuationl
1981 1982 1983 1984 198s 1986 1987 1981-1987 CoetticlentHean of Variation
(b3
5. CAPITAL EXPENDITURES 685.41 594.01 641.55 558.46 516.46 750.86 924.77 667.36 19.15.1. Real Investunt 521.91 477.62 544.70 428.35 397.02 573.79 761.67 529.30 21.0S.l.l. Capital Goods 27.15 17.67 21.32 30.65 25.56 41.19 46.70 30.03 32.35.1.2. Construction 494.76 459.95 523.38 397.70 371.46 532.60 714.98 499.26 20.95.2. Invest.ent in existing asaets 3.75 5.54 5.66 3.11 4.25 15.20 13.13 7.23 62.25.3 Financial investment 44.02 7.97 15.88 50.77 57.95 82.90 69.59 47.01 53.55.4 Capital transters 60.11 102.84 75.31 76.21 57.21 '78.97 80.38 75.86 18.35.4.1 To provincial enterprises 0.20 5.33 0.00 0.06 0.02 0.00 0.17 0.83 222.95.4.2. To social security entitles 0.00 70.33 29.80 31.52 22.21 24.97 21.28 28.59 68.45.4.3. To general administratios 0.00 0.00 0.00 0.00 0.00 0.00 0.00 0.00 --5.4.4. To municipallties 16.95 16.03 24.48 15.98 9.97 .5.02 19.37 16.83 24.35.4.5. Others 42.96 11.15 21.03 28.66 25.00 38.98 39.56 29.62 36.1S.S. Other capital expenditures 0.03 0.04 0.0W 0.00 0.03 0.00 0.00 0.02 102.65.6. Minus repayoent to Province 0.00 0.00 0.00 0.00 0.00 0.00 0.00 0.00 --6. TOTAL REVENUES AND CRAMTS (1 t 3 t 4) 2,907.20 2,472.24 2,907.00 2,984.83 2,855.05 3,4I9.56 3,127.20 2,953.30 9.07. TOTAL EXPENDITUBEi (2 t 5) 3,471.10 2,681.56 3,112.23 3,475.66 3,280.75 3,973.99 4,269.42 3,4 6.42 14.18. OVERALL DEFICITISURPLUS OR NEE§
FOR FINANCING ( 6 - 7 ) <563. 10) (209.32) (205.23) (491.03) (425.70) (5'E4.43)(1,142.22) (513.12) (56.8)
9. NET BORROWING (10 - 11) 350.9 165.0 177.5 177.9 218.2 'i10.4 418.1 259.72 35.7
10. FINANCINC 3865 222.1 195.0 186.9 233.7 421.3 506.8 307.45 38.6Use of credIt 106.2 20.8 4.1 42.4 55.8 124.5 165.9 74.24 73.9Housing Finance Fund (F31AVI)> 00 117.1 129.3 82.1 63.3 85.4 171.2 92.63 54.3Others 268.4 84.1 62.0 61.3 113.2 210.8 164.2 137.72 53.6Froa prevlous exerclces 11.8 0.0 (0.5) 1.1 1.5 0.6 5.5 2.87 142.4
11. AHORTIZATION OF TIE DEBT 35.6 57.1 17.5 9.0 15.5 110.9 88.7 47.73 76.612. NET VARIATION IN SHORT TERP ASSETS
AND LIABILITIES (e) (213.0) (44.3) (27.7) <313.1) (207.5) (244.0) (724.1) (253.40) (84.9)
13. CURRENT ACCOUNT SURPWS YITHOUT GRANTS(OYN SAVING) (1 - 2) (39.06) 258.10 (245.28) (44.44) (158.37) (192.49) (417.07) (176.94) (125.1)
14. CURRENT ACCOUNT SAVING VITN REtEIPTSOF CURRENT GRANTS (SAVING) (1 - 2 t 4) 52.56 376.32 427.60 37.81 73.90 157.79 (255.14) 124.40 170.7
15. GROSS FIID CAPITALFORHATION (5.1. - 3.1.) 521.18 476.84 543.71 428.05 396.91 571.88 761.71 528.61 21.0
(aWincludes Central Adainlstratlon, Decentralized entities and speclal accounts. Excludes enterpriscis, 'no consolidados', Banco.and Social Security Entities
(b)Standard deviatlon/lean 1981-1987Ic)Ad boc revenue sharing for 1985-1987 mas treated m revenue sharing and not a§ dlscretionary granitsMd>Aportes del Tesoro Nacional(e)Called *Resultado* In Argentina.

- 151*-
ARGEUiTINAPROVINCIAL GOVERNNENT FINAUCE STUDY
Table1O.bPROVINCIAL RE~IIES, EPENDITURES AN» FINANCING: 1981-1987
^ENERAL ADINISTRATION (a)SUN OF SiX PROVINCES
% ot Grosg Provincial Product
1981 1982 1983 1984 1985 1986 1987 1981-1987 CoefficientNean of Variation
lb)
1. WUIRDIT 2£EYIUES 8.82 7.79 6.90 7.40 7.95 8.71 8.27 7.98 8.01.1. Provincial Souraes 4.91 4.37 3.78 4.59 4.28 4.86 4.08 4.41 8.71.1.1. Tau 4.16 3.81 3.09 3.84 3.70 4.12 3.59 3.76 8.91.1.1.1. Real estate 0.96 1.00 0.81 1.26 1.04 0.96 0.75 0.97 15.61.L.1.2. Aiutoeobile 0.38 0.30 0.27 0.46 0.44 0.40 0.31 0.37 18.31.1.1.3. Turnover 1.96 1.73 1.53 1.63 1.76 2.09 1.90 1.80 10.01,1.1.4. Traefer (Suelos) 0.77 0.55 0.42 0.39 0.43 0.62 0.55 0.53 23.31.1.1.5. EnErgy and Fuel 0.00 0.00 0.00 0.00 0.00 0.00 0.00 0.00 244.91.1.1.6. GIbthern 0.08 0.24 0.05 0.10 0.03 0.06 0.08 0.09 70.21.1.2. Non-tas 0.76 0.56 0.69 0.75 0.58 0.74 0.49 0.65 15.21.1.2.1. Fee 0.01 0.06 0.04 0.02 0.02 0.02 0.02 0.03 73.91.1.2.2. Tariffs 0.00 0.00 0.00 0.04 0.05 0.06 0.06 0.03 87.81.1.2.3. Interett 0.13 0.12 0.27 0.32 0.18 0.15 0.05 0.17 49.91.1.2.4. T¡anufers received 0.00 0.00 0.00 0.00 0.00 0.00 0.00 0.00 --1.1.2.5. 0thnrs 0.62 0.38 0.37 0.36 0.33 0.52 0.37 0.42 23.11.2. National Saurces 3.91 3.42 3.12 2.81 3.67 3.85 4.19 3.57 12.51.2.1. Federal BRvenus Shuin (le) 3.28 2.88 2.50 2.26 2.81 2.92 3.35 2.86 12.71.2.2. Higbvay fund 0.28 0.24 0.30 0.27 0.37 0.38 0.32 0.31 15.21.2.3. Royaities 0.13 0.18 0.23 0.19 0.21 0.23 0.31 0.21 23.91.2.4. Otbers 0.22 0.11 0.10 0.09 0.28 0.32 0.21 0.19 44.61.3. 0tht sourcees ot curtent revenues 0.00 0.00 0.00 0.00 0.00 0.00 0.00 0.00 220.42. CUUENT EUPENDiTUES 8.95 6.93 7.66 8.73 8.43 9.26 9.45 8.49 9.92.1. Personne 5.20 4.07 4.36 5.66 5.46 5.72 6.03 5.22 13.02.2. Good aid services 0.84 0.78 0.82 0.83 0.93 1.26 1.18 0.95 18.62.3. ¡nterett paymuntl 0.13 0.02 0.01 0.00 0.01 0.02 0.07 0.04 114.62.4. thstr currunt espenditures 0.04 0.01 0.01 0.01 0.01 0.01 0.01 0.01 81.92.5. Current trauntere 2.74 2.05 2.46 2.23 2.02 2.25 2.17 2.27 10.22.5.1. To unicipalities 0.59 0.48 0.71 0.51 0.57 0.67 0.75 0.61 15.22.5.1.1. eveaue §hartig 0.57 0.43 0.34 0.44 0.52 0.61 0.72 0.52 22.72.5.1.2. Discretionary grants 0.02 0.05 0.37 0.07 0.05 0.06 0.03 0.09 125.02.5.2. To provinaell enterpritee 0.00 0.22 0.09 0.10 0.09 0.12 0.12 0.11 54.62.5.3. To social security entities 0.94 0.57 0.56 0.43 0.40 0.42 0.29 0.52 37.82.5.4. Tú Cenral Adeni.tration 0.00 0.00 0.00 0.00 0.00 0.00 0.00 0.00 --2.5.5. Other 1.12 0.69 0.99 1.18 0.95 1.04 1.02 1.00 14.63. CAPITAL i£S 0.22 0.03 0.03 0.09 0.05 0.11 0.11 0.09 69.03.1. SeIling fised asuets 0.00 0.00 0.00 0.00 0.00 0.01 (0.00> 0.00 85.33.2. Payback of Loasu 0.02 0.02 0.02 0.08 0.04 0.07 0.04 0.04 58.23.3. 0thers 0.20 0.01 0.01 0.01 0.01 0.03 0.07 0.05 136.84. CIMITS (Curuent tad Capital) 0.29 0.39 2.09 1.44 0.71 1.01 0.46 0.91 66.44.1. DIscretienary Granto Id) 0.28 0.32 2.05 1.40 0.69 0.95 0.40 0.87 69.54.2. bgioala Developent Fund (FDO) 0.01 0.06 0.03 0.02 0.02 0.04 0.03 0.03 55.94.3. Electrielty Fund <REI) 0.00 0.01 0.01 0.02 0.01 0.02 0.02 0.01 57.0¡,s, Oth.o 0.00 0.0 0.00 0.00 0.00 0.00 0.00 0.00 --

- 152 -
ARGENTINAPROVINCiAL GOVERNIENT FIlANCE STUDY
TablelO. bPROVINCIAL REVENlES, EXPENDITURES AND FINANCING: 1981-1987
GENERAL ADNINISTRATION (a)SUI OF SIX PROVINCES
% of Gross Provincial Product(Continuation)
1981. 1982 1983 1984 1985 1986 1987 1981-1987 Coetticlentlean of Variation
(b>S
5. CAPITAL EXPENDITURES 2.20 1.97 1.99 1.67 1.58 2.16 2.61 2.03 15.95.1. Real Investsent 1.68 1.59 1.69 1.28 1.21 1.65 2.15 1.61 17.85.1.1. Capital Goods 0.09 0.06 0.07 0.09 0.08 0.12 0.13 0.09 27.45.1.2. Construction 1,59 1.53 1.62 1.19 1.13 1.53 2.02 1. 52 18.05.2. Invest¡ent In existing assets 0.01 0.02 0.02 0.01 0.01 0.04 0.04 0.02 57.35.3 Financial investment 0.14 0.03 0.05 0.15 0.18 0.24 0.20 0.14 50.85.4 Capital transters 0.19 0.34 0.23 0.23 0.17 0.23 0.23 0.23 21.25.4.1 TO provincial enterprises 0.00 0.02 0.00 0.00 0.00 0.00 0.00 0.00 224.75.4.2. To social security entities 0.00 0.23 0.09 0.09 0.07 0.07 0.06 0.09 74.55.4.3. TQ general adainistration 0.00 0.00 0.00 0.00 0.00 0.00 0.00 0.00 --5.4.4. To *unicipalities 0.05 0.05 0.08 0.05 0.03 0.04 0.05 0.05 24.95.4.5. Others 0.14 0.04 0.07 0.09 0.08 0.11 0.11 0.09 35.15.S Other capital expenditures 0.00 0.00 0.00 0.00 0.00 0.00 0.00 0.00 104.65.6. Minus repayaent to Province 0.00 0.00 0.00 0.00 0.00 0.00 0.00 0.00 --9. TOTAL REVENUES AND GRANTS (1 t 3 t 4) 9.34 8.21 9.01 8.93 8.71 9.83 8.84 8.98 5.27. TOTAL EXPENDITURES (2 + 5) 11.15 8.91 9.65 10.40 10.01 11.42 12.07 10.51 9.78. OVERALL DEFICIT/SURPLUS OR NEED
FOR FINANCING ( 6 - 7 ) (1.81) (0.70) (0.641 (1.47) <1.30) (1.59) (3.23) (1.53) (52.4)
9. NET BORROWING (10 - 11) 1.13 0.55 0.55 0.53 0.67 0.89 1.18 0.79 33.2
10. FINANCING 1.24 0.74 0.60 0.56 0.71 1.21 1.43 0.93 35.4Use of credit 0.34 0.07 0.01 0.13 0.17 0.36 0.47 0.22 71.0Housing Finance Fund (FONAVI) 0.00 0.39 0.40 0.25 0.19 0.25 0.48 0.28 53.4Others 0.86 0.28 0.19 0.18 0.35 0.61 0.46 0.42 54.5Froa previous exercices 0.04 0.00 (0.00) 0.00 0.00 0.00 0.02 0.01 147.1
11. AMORTIZATION OF THE DEBT 0.11 0.19 0.05 0.03 0.05 0.32 0.25 0.14 72.812. NET VARIATION IN SHORT TERM ASSETS
AND LIABILITIES (e) (0.68) (0.15) (0.09) (0.94) (0.63) 10.70) (2.05) (0.75) (80.6)
13. CURRENT ACCWUNT SURPLUS IITHOUT GRANTS(<WN SAVING) (1 - 2) (0.13) 0.86 (0.76) (1.33) (0.48) 10.55) <1.18) (0.511 <132.5)
14. CURRENT ACCOUNT SAVING WITH RECEIPTSOF CURRENT GRANTS (SAVING) (1 - 2 + 4) 0.17 1.25 1.33 0.11 0.23 0.45 <0n72) 0.40 162.9
15. GROSS FIXED CAPITALFORIATION (5.1. - 3.1.) 1.67 1.58 1.69 1.28 1.21 1.64 2.15 1.60 17.8
(a)lncludes Central Adainistration, Decentralized entities and special accounts. Excludes enterprises, 'no consolidados', Bancosand Social Security Entities
(b)Standard deviation/Mean 1981-1987(o)Ad hon revenue snaring for 1085-1587 vas treated as revenue sharing and not as discretionary grants(d)Aportes del Tesoro Nacional(e)Called RResultado' in Argentina.

- 153 -
ARGENTIffAPROVINCIAL GOVEIWIENT FINANCE STUDY
TablelO.cPROVINCIAL REVENUES, EXPENDITURES AND FINANCING: 1981-1987
GENERAL ADMINISTRATION (a)SUN OF Sil PROVINCES
Dollars of july 19B8 per capita
1981 1982 1983 1984 1985 1986 1987 1981-1987 Coetticientlean of Variation
t. CURUENT REVENUES 156.01 130.62 121.49 132.35 136.72 155.87 147.60 140.09 8.81.1. Provincial Sources 86.89 73.33 66.51 82.07 73.60 87.05 72.78 77.46 9.51.1.1. Taz 73.50 63.87 54.42 68.73 63.56 73.77 64.12 66.00 9.41.1.1.1. Real estate 16.96 16.68 14.31 22.45 17.85 17.10 13.40 16.96 15.91.1.1.2. Autoaobile 6.75 5.10 4.83 8.30 7.64 7.15 5.60 6.4U 19.01.1.1.3. Turnover 34.68 28.93 26.94 29.17 30.20 37.34 33.90 31.59 11.01.1.1.4. Transler (Sellos) 13.65 9.14 7.41 7.00 7.40 11.08 9.83 9.36 23.91.1.1.5. Energy and Fuel 0.00 0.00 0.00 0.05 0.00 0.00 0.00 0.01 244.91.1.1.6. Others 1.45 4.02 0.93 1.76 0.47 1.11 1.39 1.59 66.91.1.2. Non-tal 13.39 9.46 12.08 13.34 10.04 13.27 8.66 11.46 16.4.1.12.1. Fees 0.09 1.05 0.76 0.28 0.28 0.30 0.29 0.44 71.6
1.1.2.2. Tariffs 0.00 0.00 0.00 0.77 0.87 1.00 1.02 0.52 87.91.l.2.3. Interest 2.35 2.01 4.73 5.78 3.18 2.66 0.81 3.07 50.81.1.2.4. Transfers received 0.00 0.00 0.00 0.00 0.00 0.00 0.00 0.00 --1.1.2.5. Others 10.95 6.41 6.60 6.51 5.72 9.30 6.55 7.43 24.01.2. National Sources 69.12 57.29 54.98 50.28 63.12 68.82 74.77 62.63 13.11.2.1. Federal Revenue Sharing (I) 57.96 48.36 43.99 40.37 48.36 52.27 59.77 50.15 13.01.2.2. Higbvay fund 4.87 4.09 5.20 4.81 6.33 6.72 5.70 5.39 15.61.2.3. Royalties 2.37 3.04 4.01 3.44 3.60 4.11 5.57 3.73 24.91.2.4. Others 3.92 1.80 1.78 1.66 4.82 5.73 3.73 3.35 U5.11.3. Other gources of current revenues 0.00 0.00 0.00 0.00 0.00 0.00 0.05 0.01 220.42. CIJUENT EXPENDITWIJRS 158.23 116.25 134.88 156.13 145.03 165.77 168.63 149.27 11.62.1. Personnel 91.96 68.23 76.84 101.23 93.94 102.40 107.56 91.74 14.52.2. Goed and services 14.80 13.09 14.41 14.89 15.96 22.49 20.99 16.66 20.02.3. lnterest payuents 2.39 0.36 0.15 0.05 0.24 0.36 1.16 0.67 115.22.4. Other current expenditures 0.68 0.15 0.14 0.10 0.09 0.22 0.23 0.23 82.42.5. Curtent transters 48.40 34.41 43.33 39.86 34.79 40.31 38.69 39.97 11.32.5.1. To wunicipalities 10.42 8.06 12.44 9.10 9.80 11.96 13.34 10.73 16.52.5.1.1. Revenue sharing 10.05 7.18 6.00 7.94 8.99 10.97 12.86 9.14 23.82.5.1.2. Discretionary grants 0.37 O.88 6.43 1.17 0.81 0.99 0.48 1.59 125.42.5.2. Tú provincial enterprises 0.05 3.68 1.66 1.85 1.63 2.24 2.0B 1.B9 52.72.5.3. To social security entities 16.68 9.55 9.88 7.73 6.96 7.55 5.14 9.07 37.92.5.4. Tú General daidnlstratton 0.00 0.00 0.00 0.00 0.00 0.00 0.00 0.00 --2.5.5. Other 19.75 11.52 17.37 21.17 16.41 18.56 1B.12 17.56 16.33. CAPITAL REVENUES 3.92 0.47 0.48 1.58 0.88 1.99 1.90 1.60 69.43.1. Selling fixed assets 0.04 0.04 0.05 0.02 0.01 0.10 (0.00) 0.04 88.43.2. Payback of Loans 0.32 0.32 0.33 1.37 0.61 1.30 0.71 0.71 59.53.3. Others 3.51 0.10 0.09 0.20 0.25 0.55 1.16 0.84 136.74. GRANTS (Current and Capital) 5.20 6.58 36.73 25.81 12.19 18.02 8.16 16.10 66.94.1. Discretionary Granta (d) 5.04 5.43 36.04 25.11 11.78 17.06 7.18 15.38 70.04.2. Regional Developaent Fund (FDR) 0.10 1.01 0.53 0.34 0.31 0.66 0.55 0.50 53.94.3. Electricity Fund (FEDEI) 0.06 0.15 0.16 0.35 0.10 0.29 0.43 0.22 ".3I,á4 Othav 0.00 0.00 0.00 0.00 0.00 0.00 0.00 0.00 --

- 154 -
PHUINCIAL COEIT FIMc STUDYTah lelO.e
MINCI IEmI¡s, EIPW ITIES AD FICIIIC¡NGs MI1-117CEDOAL AIIIISTRATION (a)
UI OF Sil PfOVINC¡Shilate el july ís3s pe capita
(Contlnuatlon)~~~~~~..........._... ....... .......... ............... ........................... ,__.. ........ .. .... .... ... ..... . ._.... _._.
u961 1162 1993 1994 19m5 1986 197 1961-1967 Coeltlciest§en of Variation
<b)
S. CAPITAL EIPENDITUIES 38.93 33.06 35.02 29.89 27.10 38.62 46.63 35.61 16.95.1. Real nvest.ent 29.65 26.60 29.74 22.92 20.83 29.51 38.40 28.23 18.7E.1.1. Captal Cood§ 1.54 0.96 1.16 1.64 1.34 2.12 2.35 1.59 28.95.1.2. Con tructlon 26.10 25.61 28.57 21.26 19.49 27.39 36.05 26.64 18.85.2. ¡nveei,nt la existiase "ete 0.21 0.31 0.31 0.17 0.22 0.78 0.66 0.38 58.75.3 Financial investent 2.50 0.44 0.87 2.72 3.04 4.26 3.51 2.49 51.45.4 Capital trafters 3.41 5.73 4.11 4.08 3.00 4.06 4.05 4.06 19.35.4.1 To provincial erpr1u 0.01 0.30 0.00 0.00 0.00 0.00 0.01 0.05 223.65.4.2. To social security autitl. 0.00 3.92 1.63 1.69 1.17 1.28 1.07 1.54 71.65.4.3. To genoral admisistratis 0.00 0.00 0.00 0.00 0.00 0.00 0.00 0.00 --5.4.4. To aumicipalitis 0.96 0.89 1.34 0.86 0.52 0.77 0.98 0.90 25.15.4.5. Others 2.44 0.62 1.15 1.53 1.31 2.00 1.91 1.58 36.1S.5. Other capitahl expndituwe 0.00 0.00 0.00 0.00 0.00 0.00 0.00 0.00 103.35.6. linus repayent to Provil 0.00 0.00 0.00 0.00 0.00 0.00 0.00 0.00 --6. TOTAL a£IIEIIS AM CWIS ll * 3 t4 165.13 137.67 158.70 159.74 149.79 175.87 157.67 157.80 7.07. TOTAL WPE1DITUSU (2 + 5) 197.16 149.3z 169.90 ¡6.02 172.12 204.39 215.26 64.88 11.48. OYEALL DEFICIT/SWLUS 01 NO
FOR FlNAlICING ( 6 - 7 ) <32.03) (11.66> (11.20> (26.28) (22.33> (28.51> <57.59) (27,09) (53.5>
9. IiT 0ORROlING (10 - 11) 19.93 9.19 9.69 9.52 11.45 15.96 21.06 13,83 34.3
10. FImCIII 21.95 12.37 10.64 10.00 12.26 21.67 25.55 16.35 36.5Use of credit 6.03 1.16 0.23 2.27 2.93 6.40 6.36 3.91 71.9Nlwling Finesc Fund (FINAVI) 0.00 6.52 7.06 4.40 3.32 4.39 8.63 4.90 53.5Otherr 15.25 4.68 3.36 3.28 5.94 O.e4 8.28 7.38 55.4Froo previlur esrclme 0.67 0.00 (0.03) 0.06 0.08 0.03 0.28 0.16 147.1
11. UIORTIZATION OF T7E DEIT 2.02 3.18 0.95 0.48 0.81 5.70 4.47 2.52 73.812. MIET VARIATION IN SK02T TEIIII ASSMS
MD LIABILITIES (e) (l12.10) <2.47) (1.51) (16.76) (10.89) (12.55) (36.51) <13.25) (81.4)
13. a~ AC=OUIT SWIES VITIO CIIT TS(DIII SAVING) (1 - 2) 12.21> 14.37 (13.39> <23.79) <8.31) <6.90) (21.03) (9.18> <128.6)
14. ClET AC SAVING 1111 ECIPTSOF CIIURT CAm (SAVIIII) tí - 2 * 4) 2.5 20.96 23.34 2.02 3.88 8.12 (12.16> 6.92 164.6
15. GROSS FIED CAPITALFRIIATION (5.1. - 3.1.> 21.60 26.55 29.68 22.91 20.82 29.41 38.40 28.20 18.7
(afiñolud.s Central Adinietratios, Deceatralimed eatlitís aid upeclal acceoute. Eiclun enterprli Sne couoslld osscand Social Security Entitie
Wb)Standard deviatio/lNeaa 161-1967(º>Ad bu reve nv buing tou 1,96-19?7 me tentalted m esa~ ehauqt &ad ust a discretlory griste<dlAportes del Tesoro daleulo<e)Called *Resultado* In Argeutim.

- 155 -
RGENTINAiPROVINCIAL GOVENIIENT FINANCE STUDY
TablelO.dINDICATORS OF PERFOIUNCE
GENERAL ADNINISTRATION (a)95U OF SIlX PROVINCES
Dollars of july 1988 per capita
1981 1982 1983 1984 1985 1986 1987 1981-1987 CoefflcientHean of Variation
Tax Revenues/Total Revenue % 44.51 46.39 34.30 43.03 42.43 41.95 40.67 41.79 8.48Tax Revenue/Gross Prov. Product % 4.16 3.81 3.09 3.84 3.70 4.12 3.59 3.76 8.87Own SourcesíTotal Revenue S 54.99 53.60 42.21 52.37 49.73 50.62 47.37 50.05 7.97PersonnellTotal Expenditures S 46.64 45.69 45.23 54.42 54.58 50.10 49.97 49.69 7.28Investment/Total Expenditures 5 15.04 17.81 17.50 12.32 12.10 14.44 17.84 15.27 15.16Current Rey./Current Exp.+ AMortization 0.97 1.09 0.89 0.85 0.94 0.91 0.85 0.92 8.57Need for Financing/Total Exp. S -16.25 -7.81 -6.59 -14.13 -12.98 -13.95 -26.75 -14.80 -41.33Change in Floating Debt/Expend{tures S -6.14 -1.65 -0.69 -9.01 -6.32 -6.14 -16.96 -7.31 -67.53Own Saving/Current Revenue S -1.42 11.00 -11.02 -17.97 -6.08 -6.35 -14.25 -6.75 -130.68Total Expenditure per Capita USS 197.16 149.32 169.90 186.02 172.12 204.39 215.26 184.88 11.39Education Exp. per Capita US$ 43.01 33.65 34.96 47.22 48.38 52.90 59.91 45.59 19.11Health Exp. per Capita US1 22.78 16.74 19.27 24.28 23.79 29.20 31.48 23.57 20.27Public Security Exp. per Capita US$ 24.67 18.02 16.37 17.44 17.18 21.78 23.92 19.86 16.13Education Expenditure per Teacher US$ 5373.99 4277.61 4312.47 5589.96 5242.00 5797.96 6306.89 5,271.55 13.2Health Exp. per health worker USS 18275.98 13604.41 15463.11 19225.90 17738.00 21867.72 18445.64 17,802.97 13.8Public Security Exp. per policeman US* 6885.46 5098.70 4509.11 4635.11 4335.92 5391.31 5614.30 5,209.99 15.6
Public Employees by SectorAbsolute
PubIlic Safety 63069 63471 66494 70309 75524 78532 84517 71702 10.50Nealth 21940 22093 22824 23598 25560 25965 33851 25119 15.34-Education 140891 141258 148504 157850 175921 177412 188415 161465 10.99TOTAL 349363 351944 368452 390185 421079 435640 491929 401227 11.96
Relative DistributionPublic Safety 18.05 18.03 18.05 18.02 17.94 18.03 17.18 17.87 1.65Health 6.28 6.28 6.19 6.05 6.07 5.96 6.88 6.26 4.52Education 40.33 40.14 40.30 40.46 41.78 40.72 38.30 40.24 2.38TOTAL 100.00 100.00 100.00 100.00 100.00 100.00 100.00 100.00 0.00
S Distribution of expenditures
General Adainistration 18.90 18.73 17.99 16.75 19.83 23.59 24.55 20.01 13.49Public Safety 12.51 12.07 9.63 9.38 9.98 10.65 11.11 10.74 10.38Health 11.55 11.21 11.34 13.05 13.82 14.29 14.63 12.75 10.63Culture and Education 21.81 22.53 20.58 25.39 28.11 25.88 27.83 24.66 11.18Economie Developaent 18.26 18.16 24.20 18.48 17.33 12.52 8.22 16.73 28.00Social lslfare 15.55 15.87 15.15 12.38 9.89 12.02 12.49 13.45 15.35Public Debt 0.34 0.33 0.23 3.87 0.14 0.14 0.25 0.73 175.33Others 1.07 1.09 0.89 0.70 0.90 0.91 0.93 0.93 13.14TOTAL 100.00 100.00 100.00 100.00 100.00 100.00 100.00 100.00 0.00
--- -- -- -- -- -- --- -- -- -- -- -- --- -- -- -- -- -- --- -- -- -- -- -- --- -- -- -- -- -- --- -- -- -- -- -- --- -- -- -- -- -- --

ARGENTINAPROVINCIAL GOVERNñENT FINANCE STU0D
Tablell.aPROVINCIAL REVENUES EXPENOITURES ANID FINACING: 1986-1987
GENERAL ADIINISTRATION (a)SIX PROVINCES
Iilllons «i Usi o« july of 1988
Total £IR Buenos Aires Cordoba Chubut Salta Santa Fe Santiago del EsteroProvinces
1986 1987 1986 1987 1986 1987 1986 1987 1986 1987 1986 1987 1986 1987
1. CURRENT REVENUES 3.030.64 2,927.58 1.569.7 1,547.5 506.2 490.0 128.1 101.6 152.7 170.4 548.5 450.5 143.2 141.11.1. Provincial Sources 1,692.45 1,443.58 1,079.1 904.9 207.9 190.5 30.4 24.4 71.4 62.6 283.1 236.0 18.6 19.21.1.1. Tax 1,434.40 1.271.76 927.8 811.2 164.0 172.6 27.7 19.7 42.4 31.6 237.6 211.8 15.8 16.91.1.1.1. Real estate 332.44 265.82 233.4 182.6 42.1 35.0 0.2 1.3 4.6 2.6 48.7 43.7 2.2 1.71.1.1.2. Autosobile 139.11 111.16 107.7 86.5 0.0 0.0 0.0 1.3 2.2 1.2 26.5 22.5 1.1 0.91.1.1.3. Turnover 725.94 672.31 454.5 421.2 109.3 110.4 13.1 11.3 20.9 18.3 115.4 100.0 8.9 9.41.1.1.4. Transter (Sellos) 215.37 194.90 120.0 109.7 30.4 26.7 4.9 3.9 12.0 7.2 44.2 43.8 2.4 2.51.1.1.5. Energy and Fuel 0.00 0.00 0.0 0.0 0.0 0.0 0.00 0.0 0.0 0.0 0.0 0.0 0.0 0.01.1.1.6. Others 21.54 27.58 12.2 11.1 2.1 0.5 9.4 1.8 2.8 2.4 2.8 1.7 1.2 2.41.1.2. Non-tax 258.05 171.82 151.4 93.7 23.9 17.9 2.7 4.7 29.0 31.0 45.5 24.3 2.9 2.3!.!.2.!. Fees 5.8V 5.68 0.5 O.S 00 .0 0.u .0 4.1 0. 0.i1.1.2.2. Tariffs 19.53 20.15 0.0 0.0 0.0 0.0 0.0 0.0 19.5 20.2 0.0 0.0 0.0 0.01.1.2.3. Interest 51.80 15.99 51.8 16.0 0.0 0.0 0.0 0.0 0.0 0.0 0.0 0.0 0.0 0.0 11.1.2.4. Transfers recelved 0.00 0.00 0.0 0.0 0.0 0.0 0.0 0.0 0.0 0.0 0.0 0.0 0.0 0.01.1.2.5. Others 180.83 130.00 99.1 77.2 23.9 17.9 2.7 4.7 5.4 6.7 45.5 24.3 1.5 1.21.2. National Sources 1,338.11 1,483.04 490.6 642.6 298.3 299.5 97.7 77.2 81.3 107.8 265.4 214.5 124.4 120.91.2.1. Federal Revenue Sharing (c) 1,016.33 1,185.51 373.0 545.9 266.4 278.2 34.1 15.6 45.9 50.1 211.5 166.3 119.5 110.91.2.2. Hlghway fund 130.58 112.97 93.1 75.6 0.0 0.0 5.3 2.4 5.1 5.4 27.4 22.2 4.9 4.41.2.3. Royalties 79.87 110.55 0.0 0.0 0.0 0.0 58.3 47.9 30.3 52.2 0.0 0.0 0.0 0.01.2.4. Others 111.33 74.00 24.5 21.1 31.9 21.3 0.0 11.3 0.0 0.0 26.4 25.9 0.0 5.61.3. Other sources of current revenues 0.09 0.96 0.0 0.0 0.0 0.0 0.0 0.0 0.0 0.0 0.0 0.0 0.1 1.02. CWRRENT EXPENDITURES 3.223.13 3.344.65 1.642.3 1,636.4 473.0 502.7 115.4 92.0 264.5 319.1 604.0 647.2 125.0 123.92.1. Personnel 1,990.96 2.133.37 986.1 1.012.6 314.2 344.3 85.2 62.9 182.5 237.3 340.8 367.9 86.8 86.12.2. Good and servlces 437.29 416.28 244.2 213.7 54.4 59.5 14.7 10.7 46.1 43.9 67.3 75.6 7.9 8.92.3. Interest payeents 7.01 23.05 0.3 1.6 5.6 5.8 0.0 0.0 0.1 0.1 0.8 15.4 0.3 0.22.4. Other current expenditures 4.19 4.59 !.! 1.! 0.0 0.0 0.0 1.1 1.1 0.S 0.0 0.0 2.0 2.82.5. Current transters 783.69 767.36 410.6 407.4 98.9 93.1 15.5 17.2 34.8 37.2 195.1 188.3 28.0 25.92.5.1. To sunicipalities 232.57 264.61 184.0 202.6 30.7 45.9 0.0 0.0 17.9 16.1 0.0 0.0 0.0 0.02.55.11.1. Reynue sZa¡D 2i3.26 255.4 177.9 i95.3 i7.9 43.8 0.0 0.0 17.5 16.1 0.0 0.0 0.0 0.02.5.1.2. D¡scretionary grants 19.31 9.47 6.1 7.4 12.8 2.1 0.0 0.0 0.4 0.0 0.0 0.0 0.0 0.02.5.2. To provIncial enterprises 43.47 41.35 29.8 33.0 11.3 6.6 0.0 0.0 2.4 1.8 0.0 0.0 0.0 0.02.5.3. To social security entities 146.87 101.90 102.1 77.0 35.0 14.5 0.0 0.0 9.8 10.4 0.0 0.0 0.0 0.02.5.4. To General Administratlon 0.00 0.00 0.0 0.0 0.0 0.0 0.0 0.0 0.0 0.0 0.0 0.0 0.0 0.02.5.5. Other 360.78 359.49 94.7 94.7 21.9 26.2 15.5 17.2 4.7 8.9 195.1 188.3 28.0 25.93. CAPITAL REVENUES 38.64 37.69 21.0 2.9 0.0 0.5 0.9 0.6 2.1 1.2 3.9 8.5 11.0 23.73.1. Sellin¡ fixed assets 1.92 (0.03) 0.6 0.0 0.0 0.0 0.1 0.0 1.1 (0.3) 0.0 0.0 0.1 0.13.2. Payback of Loans 25.35 14.15 20.4 2.8 0.0 0.0 0.8 0.2 0.9 1.5 3.9 8.5 0.2 0.53.3. Others 10.68 23.06 0.0 0.0 0.0 0.0 0.0 0.2 0.0 0.0 0.0 0.0 10.6 23.04. GRANTS (Current and Capital) 350.27 161.93 215.4 43.9 0.8 2.5 6.5 6.6 79.1 .79.3 50.5 27.0 4.6 2.84.1. Discretionary Grants (d) 331.73 142.49 215.4 43.9 0.0 0.0 0.0 4.5 66.1 72.1 50.3 26.5 0.0 0.04.2. Regional Developeent Fund (FDR) 12.86 10.87 0.0 0.0 0.8 2.5 2.8 1.1 9.7 4.8 0.2 0.5 2.1 0.34.3. Electricity Fund (FEDEI) 5.68 8.57 0.0 0.0 0.0 0.0 3.7 1.0 3.3 2.4 0.0 0.0 2.4 2.54.4. Other 0.00 0.00 0.0 0.0 0.0 0.0 0.0 0.0 0.0 0.0 0.0 0.0 0.0 0.0

ARGENTINAPROVINCIAL GOVERNNENT FINANCE STUDY
Tableli.aPROVINCIAL REVENUES, EXPENDITURES AND FINANCiNG: 1986-1987
GENERAL ADMINISTRATION (a)SIl PROVINCES
Niliions of US o july of 1988(Continuation)
Total sin Buenos Aires Cordoba Chubut Salta Santa Fe Santiago del EsteroProvinces
1986 1987 1986 1987 1986 1987 1986 1987 1986 1987 1986 1987 1986 1987
S. CAPITAL EXPENDITURES 750.86 924.77 325.9 383.0 90.4 100.7 70.8 59.0 104.1 107.2 107.7 179.7 52.2 83.3S.f. Real Investmnt 573.79 761.67 198.8 274.1 84.1 N9.0 58.7 43.6 94.2 103.3 88.5 159.1 50.7 77.4S.1.1. Capital Goods 41.19 46.70 20.3 20.1 4.4 6.0 0.8 1.3 4.6 1.8 8.5 16.3 1.5 1.85.1.2. Constructíon 532.60 714.98 178.5 254.1 79.7 83.0 58.0 42.2 89.6 101.5 80.0 142.8 49.2 75.65.2. lnvestaent la #fitting #§mets 15.20 13.13 6.2 7.1 1.9 1.1 0.0 0.0 3.9 0.7 2.3 1.7 0.9 2.55.3 Financia¡ investaent 82.90 69.59 59.6 47.7 0.2 0.3 0.5 0.5 5.9 3.2 17.0 16.8 0.1 1.05.4 Capital transfers 78.97 80.38 61.3 54.0 4.3 10.3 11.5 7.0 0.0 0.0 0.0 2.1 0.5 2.45.4.1 To provIncia¡ enterprises 0.00 0.17 0.0 0.0 0.0 0.2 0.0 0.0 0.0 0.0 0.0 0.0 0.0 0.05.4.2. To social security entities 24.97 21.28 25.0 21.3 0.0 0.0 0.0 0.0 0.0 0.0 0.0 0.0 0.0 0.05.4.3. To general adanlistration 0.00 0.00 0.0 0.0 0.0 0.0 0.0 0.0 0.0 0.0 0.0 0.0 0.0 0.05.4.4. To unilcipalities 15.02 19.37 12.3 13.8 2.7 5.6 0.0 0.0 0.0 0.0 0.0 0.0 0.0 0.05.4.5. Others 38.98 39.56 24.0 18.9 1.5 4.6 11.5 7.0 0.0 0.0 0.0 2.1 0.5 2.4S.S. Other capital ezpenditures 0.00 0.00 0.0 0.0 0.0 0.0 0.0 0.0 0.0 0.0 0.0 0.0 0.0 0.05.6. Ninus repay.ent to ProvInce 0.00 0.00 0.0 0.0 0.0 0.0 0.0 0.0 0.0 0.0 0.0 0.0 0.0 0.06. TOTAL REVENUES ANO GRANTS (1 t 3 * 4) 3.419.56 3,127.20 1,806.1 1,594.3 507.0 493.0 135.5 108.9 233.9 250.9 602.9 486.0 158.7 167.57. TOTAL EXPENOITURES (2 * 5) 3,973.99 4.269.42 1.968.2 2,019.4 563.4 603.5 186.1 151.0 368.6 426.3 711.7 826.9 177.3 207.28. OVERALL DEFICITISURPLUS OR NEED
FOR FINANCINO ( 6 - 7 ) (554.431(1,142.22) (162.2) (425.1) (56.4) (110.4> <50.7) (42.1) (134.0) (175.4) (108.9) (340.9) (18.6) (39.7)
9. NET BORROUING (10 - 11) 310.4 418.1 70.3 103.4 45.3 22.5 36.8 41.5 44.3 74.6 53.5 145.8 26.2 35.1
10. FINANCING 421.3 506.6 146.6 106.4 46.8 23.1 36.8 42.1 71.7 125.1 58.5 179.2 26.7 36.1Use of credit 124.5 165.9 74.7 8.1 0.0 14.5 0.1 0.0 39.3 69.8 7.8 52.5 2.7 0.9Housing Finance Fund (FONAVII 85.4 171.2 44.9 92.2 0.0 0.0 20.3 8.6 0.0 0.0 40.5 58.7 0.0 0.0Otiers 94.7 104.8 27.0 6.1 46.8 5.7 16.4 8.5 2.6 1.7 10.2 68.1 8.1 6.9Froe pr.vicus esercíces 0.6 5.5 0.0 0.0 0.0 2.9 0.0 0.0 0.6 0.8 0.0 0.0 0.0 1.8
11. AIORTIUTION OF TIE DEiT 110.9 88.7 76.2 3.0 1.5 0.6 0.0 0.6 27.4 50.5 5.0 33.5 0.5 1.112. NET VARIATION IN SHORT tERi ASSETS
AND LIABILITIES (e) (244.01 (724.1> (91.8> (321.7) (11.1) (88.0> (13.9) (0.71 (90.5 (100.8) (55.4) (195.1) 7.6 (4.6)
13. CURRENT ACCOUNT SURPLUS WITi1OUT GRANTS(OUN SAVING) <I - 2) (192.49) (417.07) (72.6) (88.9) 33.2 (12.7) 12.8 9.7 (111.6> (148.7) (55.5) (196.7) 18.1 17.2
14. CURRENT ACCWUNT SAVING WlTi1 RECEIPTSOF CURRENT GRANtS (SAVING) ( - 2 t 4) 157.79 (255.14) 142.8 (45.0) 34.0 (10.2) 19.2 16.3 (32.7) (69.4) (5.0) (169.7> 22.7 20.0
15. GROSS FIXEO CAPITALFORñATION (5.1. - 3.1.> 571.88 761.71 198.2 274.1 84.1 89.0 58.6 43.5 93.1 103.6 88.5 159.1 50.6 77.3
(a)nciudes Central AdaInistration. Decentralized entiths and speclal accounta. Excludes enterprises, 'no consolidados', Bancosand Social Securíty Entities
(b)Standard devíat(on/Ilean 1981-1987(clAd boc rnvenue sharing lor 1985-1987 vas treated as revenue sbaring and not u díscretionary grants<díAportes dcl Tesoro Nacionalcl0Calied 'Resultado' In Argentina.

ARGENTINAPROVINCIAL GOVERNllENT FINANCE STUDY
Tab Iil.bPROVINCIAL REVENUES, EIPENDITURES AND FINANCING: 1986-1987
GENERAL ADIIINISTRATION (a)51 PROVINCES
S of Gross Provincial Product
Total sIx Buenos Aires Cordoba Chubut Salta Santa Fe Santiago del EsteroProvincos
1986 1987 1986 1987 1986 1987 1986 1987 1986 1987 1986 1987 1986 1987
1. CURRENT REVENUES 8.71 8.27 7.35 7.14 10.83 10.26 13.41 ll.ll 13.09 14.19 8.97 7.26 25.45 24.351.1. ProvincIal Sourcens 4.86 4.08 S.OS 4.18 4.45 3.99 3.18 2.66 6.12 5.21 4.63 3.80 3.31 3.311.1.1. Tan 4.12 3.59 4.35 3.74 3.94 3.61 2.89 2.14 3.64 2.63 3.89 3.41 2.80 2.921.1.1.1. Real Mstate 0.96 0.75 1.09 0.84 0.90 0.73 0.02 0.14 0.39 0.21 0.80 0.70 0.40 0.30L.1.1.2. Autosobile 0.40 0.31 0.50 0.40 0.00 0.00 0.00 0.14 0.19 0.10 0.43 0.36 0.20 0.161.1.1.3. Turnover 2.09 1.90 2.13 1.94 2.34 2.31 1.37 1.23 1.79 1.52 1.89 1.61 1.58 1.611.1.1.4. Transter (Sellos) 0.62 0.55 0.56 0.5 0.65 0.56 0.52 0.42 1.03 0.60 0.72 0.71 0.42 0.43I.1.l.S. Energy and Fuel 0.00 0.00 0.00 0.00 0.00 0.00 0.00 0.00 0.00 0.00 0.00 0.00 0.00 0.001.1.1.6. Oth.rv 0.06 0.00 0.06 0.05 0.05 0.01 0.98 0.19 0.24 0.20 0.06 0.03 0.20 0.421.1.2. Non-tua 0.74 0.49 0.71 0.43 0.51 0.31 0.29 0.52 2.48 2.58 0.74 0.39 0.51 0.391.1.2.1. Foes 0.02 0.02 0.00 0.00 0.00 0.00 0.0n 0o00 0.34 0.34 0.00 0.00 0.26 0.i9í.1.2.i. Tarifis 0.06 0.06 0.00 0.00 0.00 0.00 0.00 0.00 1.67 1.68 0.00 0.00 0.00 0.001.1.2.3. lnterest 0.15 0.05 0.24 0.07 0.00 0.00 0.00 0.00 0.00 0.00 0.00 0.00 0.00 0.001.1.2.4. Transfers received 0.00 0.00 0.00 0.00 0.00 0.00 0.00 0.00 0.00 0.00 0.00 0.00 0.00 0.001.1.2.5. Otbers 0.52 0.37 0.46 0.38 0.51 0.37 0.29 0.52 0.47 0.56 0.74 0.39 0.26 0.201.2. Ibtioual Sources 3.85 4.19 2.30 2.97 6.38 6.27 10.23 8.45 6.97 8.98 4.34 3.46 22.12 20.871.2.1. Federal Rennw Sharlng (c) 2.92 3.35 1.75 2.52 5.70 5.82 3.57 1.71 3.93 4.17 3.46 2.68 21.25 19.141.2.2. Nlghuay fund 0.36 0.32 0.44 0.35 0.00 0.00 0.56 0.26 0.44 0.45 0.45 0.36 0.a7 0.761.2.3. Royalties 0.23 0.31 0.00 0.00 0.00 0.00 6.10 5.24 2.60 4.35 0.00 0.00 0.00 0.001.2.4. Others 0.32 0.21 0.11 0.10 0.68 0.45 0.00 1.23 0.00 0.00 0.43 0.42 0.00 0.971.3. Other sources o current revenues 0.00 0.00 0.00 0.00 0.00 0.00 0.00 0.00 0.00 0.00 0.00 0.00 0.02 0.172. CUUElT EIPENDITURES 9.26 9.45 7.69 7.55 10.12 10.52 12.07 10.04 22.67 26.58 9.88 10.43 22.22 21.382.1. P.rsonnil 5.72 6.03 4.62 4.67 6.72 7.21 8.91 6.85 15.64 19.76 5.5s 5.93 ¡5.43 14.862.2. Good amd ervlces 1.26 1.18 1.14 0.99 1.16 1.25 1.53 1.16 3.95 3.65 1.10 1.22 1.41 1.542.3. Interest papyenta 0.02 0.07 0.00 0.01 0.12 0.12 0.00 0.00 0.01 0.01 0.01 0.25 0.05 0.032.A. Ottur cwroent erpenditures 0.01 0.01 0.01 0.01 0.00 0.00 0.00 0.12 0.09 0.05 0.00 0.00 0.35 0.492.5. Current transtere 2.25 2.17 1.92 1.86 2.12 1.95 1.63 1.89 2.90 3.10 3.19 3.03 4.98 4.472.5.1. To municipaliíties 0.67 0.75 0.86 0.94 0.66 0.96 0.00 0.00 1.53 1.34 0.00 0.00 0.00 0.002.5.1.1. Revenue sharinl 0.61 0.72 0.83 0 90 0.38 0.92 0.00 0.00 i.50 i.34 O.wa 0.00 0.00 0.002.5.1.Z. Discretionary grants 0.06 0.03 0.03 0.03 0.27 0.04 0.00 0.00 0.04 0.00 0.00 0.00 0.00 0.002.5.2. To provincial ent,rprisms 0.12 0.12 0.14 O.IS 0.24 0.14 0.00 0.00 0.21 0.15 0.00 0.00 0.00 0.002.5.3. To social security entities 0.42 0.29 0.48 0.36 0.75 0.30 0.00 0.00 0.84 0.87 0.00 0.00 0.00 0.002.5.4. To General Adeinistration 0.00 0.00 0.00 0.00 0.00 0.00 0.00 0.00 0.00 0.00 0.00 0.00 0.00 0.002.5.5. Otber 1.04 1.02 0.44 0.44 0.47 0.55 1.63 1.89 0.40 0.74 3.19 3.03 4.98 4.473. CAPITAL REVENUES 0.11 0.11 0.10 0.01 0.00 0.01 0.09 0.07 0.18 0.10 0.06 0.14 1.9S 4.093.1. Seli¡n¡ flaed asseta 0.01 (0.00) 0.00 0.00 0.00 0.00 0.01 0.00 0.10 10.02) 0.00 0.00 0.02 0.023.2. Payback of Loans 0.07 0.04 0.10 0.01 0.00 0.00 0.08 0.02 0.08 0.13 0.06 0.14 0.04 0.093.3. Others 0.03 0.07 0.00 0.00 0.00 0.00 0.00 0.02 0.00 0.00 0.00 0.00 1.89 3.974. GRANTS (Current and Capital) 1.01 0.46 1.01 0.20 0.02 0.05 0.68 0.73 6.76 6.61 0Q63 0.44 0.81 0.U84.1. Dlscretionaty unntas (d: 0.95 0.40 1.01 0.20 0.00 0.00 0.00 0.50 5.67 6.01 0.82 0.43 0.00 0.004.2. RegIonal Doevelopment Fund (FDR> 0.04 0.03 0.00 0.00 0.02 0.05 0.29 0.12 0.63 0.40 0.00 0.01 0.38 0.054.3. Electriclty Fund (FEDEII 0.02 0.02 0.00 0.00 0.00 0.00 0.38 0.10 0.28 0.20 0.00 0.00 0.43 0.434.4. Other 0.00 0.00 0.00 0.00 0.00 0.00 0.00 0.00 0.00 0.00 0.00 0.00 0.00 0.00

IISITISAPUOVINIICI. 0OEIS FIIIUCE 81131
TabdlsIbPOVINCiAL lEV9ES. WEIPINITIES Lii FlINIUCINC: 1966-1967
ilEEA AUIIISTiUTIIU bl)511 PllNNICE
* al Iras, Pravluclal Pect
~~~~~~~~~~~~~~.... ... ,.... .. .......... . .... .. . .... .... . . ._...... ...... ----------------------------------------------------------------
Tetal síu h a res Cerd C _u Salta Sata Fe Satap del Este
¡966 1967 ¡Stt l¡97 16m6 1967 1ee t§ IStt 1966 ¡67 IStt ¡I97 196M ¡167
. .... .... .. ......... ........... ......... ............. .. .......... ............. ..... ...... .... .... ... ... . ... ... ... .. ... ... .................................
5. CITAL EIPUIPITUES 2.16 2.61 1.53 1.71 1.64 2.11 7.41 U t .92 e.s3 1.76 2.90 9.26 14.32
5,1. eal laetmt 1.65 2.15 0.93 1.21 1.e0 1.6 6.15 4.n 1 6.06 .61 1.45 2.64 9.01 13.3
5.1.1. Capital 6aads 0.12 0.11 0.10 0.06 0.10 0.13 .e0 0.15 0.36 0.15 0.14 .26 0.21 .31
5.1.2. ~fmsUaftlau 1.53 2.02 0.64 1.17 1.71 L.74 6.07 4.64 1.66 *.U t .31 2.30 6.71 13.015.2. lstmt la almtitiants 0.04 0.04 0.03 0.03 0.04 0.02 0.00 0.00 0.34 0.06 0.04 0.03 0.16 0.435.3 Fímaecial liwestmat 0.24 0.20 0.26 0.22 0.00 0.01 0.06 0.06 0.51 0.21 0.2 0.n 0.02 0.16
S.4 CapItal trialen 0.23 0.23 0.29 0.25 0.06 0.22 1.20 0.77 0.00 0.00 0.00 0.03 0.09 0.42
5.4.1 Te praelimcal emterprls 0.00 0.00 0.0e 0.00 0.00 0.e 0.06 0 0.o 0.06 0.00 0.0 00 0.eo
5.4.2. la social sec,Irfv entitm 0.07 0.o 0.L12 0.10 0.00 0.00 0.00 0.00 0.00 0.00 0.00 0.00 0.00 0.00
5.4.3. To gertal adlalstratioe 0.00 0.06 0.00 0.00 0.06 0.00 0.00 0.00 0.00 0.06 0.00 0.00 0.00 0.0o
1.4.4. Te .alclpeltilos 0.04 0.0e 0.06 0.06 0.06 0.12 0.00 0.e0 0.00 0.00 0.00 0.00 0.00 0.00
5.4.5. teArs 0.11 0.11 0.11 0.06 0.03 0.10 1.20 0.77 0.0o 0.0e 0.00 0.03 0.06 0.42
5.5. BtISr capital poltmras 0.00 0.0o 0.00 0.00 0.0o Leo 0 .00 0 .00 0.00 0.00 eo 0 .00 0 .00 0 0.
S.6. alim repsl.Tt te provc 0.00 0.00 0.00 0eo 0.00 0.eo 0.00 0.0 0eo 0.eo 0.00 0.0 0.o o 0.00
6. MA*1L lDEIIUES AM 0 (ans 1 * 3 4) 9 .63 6.64 6.4 7.36 10.15 ¡0.32 14.17 11.61 20.05 20.t0 9.t6 7.U3 261.21 26.91
7. TOAL o E?INIIES (2 * S5 11.42 12.01 9.22 9.32 12.06 12.93 19.46 ¡6.*4 31.60 36.51 11.115 3.32 31.51 31.76
e. 0111 9EICIIT/SIU1l,IS el UfOe FlMuiCIN6 t 1 - 7 5 <1.590 <3.231 <0.761 <1.66) <1.21) <2.311 <5.33 <4.56) <11.55) <14.1) <1.71 (5.46) <3.30) (6.11
L. NT ~ §IKC tli - 11) 0.6I 1.16 0.3 0.s 1. .5 La 6.52 3.6 6.2 L. 2.3 4.7 S.l
10. FilIMlE 1.21 1.43 0.6s 0.6 L 0.66 3.61 4.66 6.15 10.42 0.s 2.66 4.15 6.24hse el credit 03 0.47 0.35 6.04 0. 0.3 0.01 6.0o 3.37 1.4 0. 13 0.Q« 0.46 0. t
eieq FIl_ fN < i> 0.25 0.4 0.21 0.43 0.0 0.e 2 U 0.6 L 0.06 .o.ee L.66 00 Leo 0.00OtIera 0.27 0.30 .13 0.03 1.06 0.12 1.1 0.3 0.23 .14 0.17 1.10 1.44 ¡.56Fra paIw nererus 0.06 0.02 0.0o 0.0e 0.06o 0.06 0.e0 0.00 0.06 0.0?7 0o 0.06 0.00 0.31
11. UlIlIlTTIS GF m 1m 0.32 0.21s 0.36 0.01 0.03 0.01 0.00 0.e7 2.36 4.20 0.06 0.14 6.eo 0.Lo
t2. m VMI*T¡U lo SImm TEN A5ns*6 LiIILITIES l*) <0.70) (2.05) <0.43> <1.4> <0.24> (1.6 <1.46) <0.0) <7.7 <e.39)> <0.91 <3.14> 1.36 <0.60)
13. C~IImT OT S~UnS vIlIIII 3*1115(0M SAVING) 2( ) 0 .SS1 <1.6> t0.3<) (0.41) 0.71 (0.27) 1.34 1.07 <9.59) (12.39> (0.91) <3.171 3.22 2.97
14. CUa~T ACCEII? &Ayi§ 1W111 2ECEIPTSOF tWEIIT 61*7S (SAVING) ti - 2 * 4) 0.45 t0.72) 0.67 <0.21) 0.73 <0.21) 2.01 1.60 (2.61) <5.70) <0.00) <2.73) 4.03 3.44
15. 63055 FIMl) CUITALFONIUIAI t5.1 - 3.1.> 1.64 2.15 0.93 1.27 1.6e 1.6 6.14 4.76 7.96 6.63 I.S 2.56 6.99 13.34
.. .......................----------------------------------------------------------------------------.........-----------------.....--.--.-..- ....<lIAcludes Central *iialstratin, cemtraltíed entitie su 4 speacial *ccunts. Excludes enterpr¡sos 'ne coolidados', tances
and SaclaS Sacurlty EatitIe,blStaard devlatien/liiaa 1961-1967(C)Ad bae reen bating l 1965-19i7 mas ttrated al revenme sihareg and net ts dilcretioary gramtIdAPOrIeus de Tesareo NaloasíaCafl eO 'esultado' la Argentin.

ARGENTINAPROVINCIAL GOVERNhiENT FINAlCE StUDT
Tablell.cPROVINCIAL REVENUES, EXPENDITURES AND FINANCING: 1986-1987
GENERAL ADIINISTRATION (alSIX PROVINCES
Dollara of juiy of 1968 per capita
Total sil Buenos Aíres Cordoba Chubut Salta Santa Fe Santiago del EsteroProvinces
1986 1987 1986 1987 1986 1987 1986 1987 1986 1987 1986 1987 1986 1987
1. CURRENT REVENUES 155.87 147.60 127.08 122.63 191.47 182.48 387.65 338.11 196.78 213.86 204.09 165.23 215.61 208.611.1. Provincial Sources 87.05 72.78 87.36 71.71 78.65 70.93 91.96 81.05 92.02 78.57 105.34 86.57 28.06 28.381.1.1. Tax 73.77 64.12 75.11 64.28 69.59 64.27 83.69 64.97 54.67 39.70 88.41 77.67 23.75 25.011.1.1.1. Reai eslate 17.10 13.40 18.89 14.47 15.94 13.04 0.69 4.49 5.92 3.22 18.10 16.03 3.37 2.541.1.1.2. Autosobile 7.15 5.60 8.72 6.86 0.00 0.00 0.00 4.55 2.84 1.52 9.87 8.24 1.69 1.381.1.1.3. Turnover 37.34 33.90 36.80 33.38 41.36 41.09 39.63 37.31 26.89 22.95 42.93 36.68 13.36 13.831.1.1.4. Transter (Sellos> 11.08 9.83 9.71 8.70 11.48 9.95 14.93 12.91 15.45 9.03 16.45 16.08 3.60 3.68
!.!.!.S. En.r,y.nd0.00 O.w 0.00 Qo.0 0.00 0.00 0.00 0.00 0.00 0.00 0.00 000001.1.1.6. Othets 1.11 1.39 0.98 0.88 0.81 0.19 28.43 5.70 3.58 2.97 1.05 0.63 1.73 3.581.1.2. Non-tau 13.27 8.66 12.25 7.42 9.06 6.6 8&28 6C09 37.34 38.87 1:.93 8.90 4.32 3.371.1.2.1. Fces 0.30 0.29 0.04 0.04 0.00 0.00 0.00 0.00 5.16 5.14 0.00 0.00 2.10 1.67 -A
1.1.2.2. tarilfs 1.00 1.02 0.00 0.00 0.00 0.00 0.00 0.00 25.17 25.30 0.00 0.00 0.00 0.001.1.2.3. Interest 2.66 0.81 4.19 1.27 0.00 0.00 0.00 0.00 0.00 0.00 0.00 0.00 0.00 0.001.1.2.t. Transtors recelcvd 0.00 0.00 0.00 0.00 0.00 0.00 0.00 0.00 0.00 0.00 0.00 0.00 0.00 0.001.1.2.5. Others 9.30 6.55 8.02 6.12 9.06 6.66 8.28 16.09 7.01 8.44 16.93 8.90 2.22 1.701.2. National Sources 68.82 74.77 39.72 50.92 112.83 111.54 295.69 257.05 104.76 135.28 98.75 78.66 187.42 178.811.2.1. Federal Revenue Sharilng (e) 52.27 59.77 30.20 43.26 100.77 103.60 103.14 51.88 59.13 62.91 78.70 61.01 180.04 163.961.2.2. Hlgheay tund 6.72 5.70 7.54 5.99 0.00 0.00 16.16 7.95 6.61 6.79 10.20 8.15 7.38 6.531.2.3. Royalties 4.11 5.57 0.00 0.00 0.00 0.00 176.39 159.24 39.02 65.58 0.00 0.00 0.00 0.001.2.4. Others 5.73 3.73 1.98 1.68 12.06 7.94 0.00 37.98 0.00 0.00 9.84 9.50 0.00 8.321.3. Other sources of current rnvenues 0.00 0.05 0.00 0.00 0.00 0.00 0.00 0.00 0.00 0.00 0.00 0.00 0.13 1.422. CURENT EXPENDITURES 165.77 168.63 132.96 129.68 178.90 187.21 349.01 304.23 340.89 400.55 224.74 237.38 188.31 183.182.1. Personnel 102.40 107.56 79.83 80.24 118.82 128.23 257.64 207.28 235.13 297.90 126.81 134.94 130.78 127.292.2. Goad and services 22.49 20.99 19.77 16.94 20.58 22.16 44.35 34.81 59.41 55.07 25.05 27.73 11.95 13.182.3. Interest payeents 0.36 1.16 0.02 0.13 2.10 2.16 0.00 0.03 0.11 0.10 0.29 5.64 0.45 0.262.4. Other current expenditures 0.22 0.23 0.09 0.09 0.01 0.01 0.00 4.20 1.41 0.77 0.00 0.00 2.98 4.212.5. Current transfers 40.31 38.69 33.24 32.28 37.39 34.66 47.03 57.91 44.83 46.71 72.59 69.07 42.16 38.262.5.1. To cunicipallties íí.96 ái3 uso '' .e1 7..06 .: 708 0.00 0.00 23.06 i.23 0.00 0.00 0.00 0.002.5.1.1. Reenue charing 10.97 12.86 14.40 15.47 6.76 16.30 0.00 0.00 22.53 20.23 0.00 0.00 0.00 0.002.5.1.2. Dlscretionary grants 0.99 0.48 0.49 0.58 4.85 0.78 0.00 0.00 0.53 0.00 0.00 0.00 0.00 0.002.5.2. To provIncIll enterprises 2.24 2.08 2.41 2.62 4.26 2.44 0.00 0.00 3.09 2.24 0.00 0.00 0.00 0.002.5.3. To social security entities 7.55 5.14 8.27 6.10 13.23 5.38 0.00 0.00 12.60 13.09 0.00 0.00 0.00 0.002.5.4. To General Administration 0.00 0.00 0.00 0.00 0.00 0.00 0.00 0.00 0.00 0.00 0.00 0.00 0.00 0.002.5.5. Other 18.56 18.12 7.67 7.50 8.29 9.75 47.03 57.91 6.09 11.16 72.59 69.07 42.16 38.263. CAPITAL REVENUES 1.99 1.90 1.70 0.23 0.00 0.19 2.63 2.13 2.67 1.56 1.45 3.12 16.55 35.013.1. Selilng (lxed asets 0.10 (0.00> 0.05 0.00 0.00 0.00 0.30 0.12 1.47 (0.34> 0.01 0.01 0.18 0.173.2. Payback of Loans 1.30 0.71 1.65 0.23 0.00 0.00 2.34 0.54 1.16 1.88 1.44 3.12 0.33 0.793.3. Others 0.55 1.16 0.00 0.00 0.00 0.00 0.00 05SS 0Q04 0.01 0.00 0.00 18.04 34.044. GRNS (Current and CapItal) 18.02 8.16 17.44 3.48 0.30 0.92 19.55 22.22 101.92 99.59 18.78 9.91 6.86 4.084.1. Dlscretionary Grants (dt 17.06 7.18 17.44 3.48 0.00 0.00 0.00 15.55 85.18 90.53 18.70 9.71 0.00 0.004.2. Reglonal Development Fund (FOR) 0.66 0.55 0.00 0.00 0.30 0.92 8.50 3.56 12.53 5.98 0.08 0.20 3.22 0.434.3. Electriclty Fund (FEDEII 0.29 0.43 0.00 0.00 0.00 0.00 11.05 3.11 4.21 3.07 0.00 0.00 3.64 3.654.4. Other 0.00 0.00 0.00 0.00 0.00 0.00 0.00 0.00 0.00 0.00 0.00 0.00 0.00 0.00

PROVINCIAL GOVERNIEIIT FINANCE STUD!Tablei.c
PROVINCIAL REVEIUES, EXPENDITURES AND FINAIN.: 1986-lOS7GENERAL ADUINISTRATION (as
512 PROVINCESDollara ot JuIY of 1988 por capita
(Continuation>
Total six Buenos Aires Cordoba Chubut Salta Santa Fe Santíago del EsteroProvinces
1986 1987 1986 1987 1986 1987 1986 1987 1986 1987 1986 1987 1986 1987
5. CAPITAL EXPENDITURES 38.62 46.63 26.39 30.35 34.21 37.51 214.11 196.61 134.16 134.62 40.09 65.92 78.67 123.23
S.1. Real Iavemt.ent 29.51 38.40 16.10 21.72 31.82 33.14 177.69 143.05 121.42 129.71 32.92 58.35 76.35 114.42
5.l.l. Capital Go6ds 2.12 2.35 1.65 1.59 1.68 2.23 2.28 4.41 5.90 2.24 3.17 5.97 2.20 2.66
5.1.2. Construction 27.39 36.05 14.45 20.13 30.14 30.90 175.41 138.63 115.52 127.47 29.75 52.38 74.15 111.76
5.2. Inveltnnt In existing aslets 0.78 0.66 0.50 0.57 0.70 0.42 0.00 0.00 5.08 0.86 0.85 0.61 1.36 3.725.3 Flnancial ínvestaent 4.26 3.51 4.82 3.78 0.07 0.12 1.62 1.70 7.66 4.04 6.31 6.17 0.19 1.52
5.4 Capital transfera 4.06 4.05 4.96 4.28 1.61 3.83 34.80 22.64 0.00 0.00 0.00 0.79 40.77 3.57
5.4.1 To provincial enterprises 0.00 0.01 0.00 0.00 0.00 0.06 0.00 0.00 0.00 0.00 0.00 0.00 0.00 0.00
5.4.2. To social security entities 1.28 1.07 2.02 1.69 0.00 0.00 0.00 0.00 0.00 0.00 0.00 0.00 0.00 0.005.4.3. To general administration 0.00 0.00 0.00 0.00 0.00 0.00 0.00 0.00 0.00 0.00 0.00 0.00 0.00 0.00
5.4.4. To municipalities 0.77 0.98 1.00 1.09 1.03 2.07 0.00 0.00 0.00 0.00 0.00 0.00 0.00 0.00
5.4.5. Others 2.00 1.99 1.94 1.50 0.58 1.70 34.80 22.64 0.00 0.00 0.00 0.79 0.77 3.57
5.5. Other capital expenditures 0.00 0.00 0.00 0.00 0.00 0.00 0.00 0.00 0.00 0.00 0.00 0.00 0.00 0.00 H
5.6. linus repayeent to Provlnce 0.00 0.00 0.00 0.00 0.00 0.00 0.00 0.00 0.00 0.00 0.00 0.00 0.00 0.00
6. TOTAL REVENUES AND GRANTS (1 * 3 t 4) 175.87 157.67 146.22 126.34 191.77 183.59 409.83 362.45 301.37 315.00 224.32 178.26 239.01 247.70
7. TOTAL EXPENDITURES (2 * 5) 204.39 215.26 159.35 160.03 213.10 224.71 563. 12 500.84 475.05 535.18 264.83 303.30 266.99 306.41
8. OVERALL DEFICIT/SURPLUS OR NEEDFOR FINANCING ( 6 - 7 1 (28.51) (57.59) (13.13) (33.69) (21.33) (41.13) (153.29) (138.39) (173.68) (220.18) (40.51) (125.04) (27.98) (58.71)
9. NEt BORROVING (10 - 11) 15.96 21.08 5.7 8.2 17.1 8.4 111.2 137.44 57.1 93.6 19.9 53.5 39.4 51.8
10. FINANCING 21.67 25.55 11.87 8.43 17.71 8.60 111.28 139.70 92.39 157.02 21.75 65.74 40.24 53.43
Use of credit 6.40 8.36 6.05 0.64 0.01 5.40 0.36 0.05 50.60 112.68 2.90 19.25 4.04 1.40
Housing Finance Fund (FONAVI) 4.39 8.63 3.64 7.31 0.00 0.00 61.35 28.45 0.00 0.00 15.06 21.52 0.00 0.00
Others 4.87 5.29 2.18 0.49 17.70 2.11 49.56 28.26 3.40 2.18 3.80 24.98 12.23 10.13
Froe prevlous esercices 0.03 0.28 0.00 0.00 0.00 1.09 0.01 0.00 0.84 1.00 0.00 0.00 0.00 2.65
11. AlMORTIZATION OF THE DEiT 5.70 . 4.47 6.17 0.24 0.56 0.23 0.06 2.26 35.29 63.37 1.86 12.28 0.80 1.59
12. NET VARIATION INI SHORT TERñ ASSETS 0.00 0.00AND LIABILITIES (e) (12.55) (36.51) (7.43) (25.49) (4.19) (32.76) (42.06) (0.95) (116.58) (126.53) (20.62) (71.57) 11.47 (6.87)
13. CURRENT ACCOUNT SURPLUS WIITHOUT GRANTS(OWN SAVING) (I - 2) (9.90) (21.03) (5.88) (7.05) 12.57 (4.73) 38.64 33.87 (144.11) (186.70) (20.65) (72.15) 27.30 25.43
14. CURRENT ACCOUNT SAVING VITH RECEIPTSOF CURRENT GRANTS (SAVINGI (1 - 2 t 4) 8.12 (12.66) 11.56 (3.57) 12.87 (3.81) 58.19 56.09 (42.19> (87.11) (1.87> (62.24) 34.15 29.51
15. GROSS FIXED CAPITALFORMATION (5.1. - 3.1.) 29.41 38.40 16.05 21.72 31.82 33.14 177.39 142.93 119.96 130.05 32.92 58.34 76.17 114.25
(a)lncludes Central Adeinistration. Decentralized entities and speclal accounts. Excludes enterprises, no consolidados', Bancosand Social Security Entities
(b)Standard deviation/Mean 1981-1987(c)Ad hoc revenue sharling for 1985-1987 vas treated as revenue sharlng and not as discretíonary grants(d)Aportes del Tesoro Nacional(e)Called 'Resultado In Argentina.

- 162 -
AliGEiTliM
T9VIC* oloUUT IMR
GEAPL DIOINiiST3TU iall ̂
..... _.......... ......................... ..... .............. . ...... ............. . ... ..................... .......
Total sl lu«os AlTr ctrdob Chéet Salta Sasta Fe Seatiao e EiSeroVrovinCN
19l 1957 1916 19 7 Ii 1907 ISi6 1#7 9m96 il67 1959 1N7 1996 19ii7
Taz Riv,nu.s/Total ¡benuoe a 41.95 40.67 51.37 O.56 36.32 35.01 20.42 16.06 18.14 12.60 3S.41 43.57 9.94 10.10Taz Rev,nue/Gross Prov. Proouct a 4.12 3.59 4.35 3.74 3.64 3.41 2.il 2.14 3.64 2.63 3.il 3.41 2.60 2.92Ohn Sourcus/Total li_ a 50.62 47.37 60.91 5.S94 41.01 3i.74 23.06 23.00 31.42 2S.44 47.61 50.32 16.66 25.59Personnel/Total Eipendlturss I 50.10 49.97 50.10 50.14 55.71 57.06 45.75 41.63 4.50 55.9 47.59 44.49 48.9S 41.54lnnestoent/Total Espenditure a 14.44 17.84 10.10 13.56 1.S3 14.75 31.15 UJ. 25.56 24.24 12.43 19.24 26.60 37.34Current lev./Current Emp. Abortization 0.91 0.65 0.31 0.94 1.07 0.17 1.11 1.10 0.52 0.46 O.S 0.66 1.14 1.13leed tor Financin¡/Total E¡p. ' -13.9S -26.75 -. 24 -21.06 10.01 -I30 -27.22 -27.69 -3.5 -41.14 -15.30 -41.23 -10.48 -19.16Chante in Floating Debt/Expenditures * -6.14 -16.96 -4.117 -15.S3 -1.S7 -14.S1 -7.47 -0.44 -24.54 -23.64 -7.79 -23.EO 4.30 -2.24Ovn Savingicurrent ibvenun 5 4.35 -14.25 -4.43 -5.74 6.17 -2.56 9.17 9.54 -73.24 -i7.30 -0.12 -43.67 12.66 12.19Total Espenditur. per Cepita W#S 204.30 215.26 15SU 100.03 2U3.10 224.71 *3.12 XO.il4 475.05 535.U1 2E4.63 303.30 2U.99 306.41Education Exp. por Capita 105 52.90 59.91 51J.11 50.21 A5.3 72.it 113.41 72U63 45.27 l0.60 40.33 i0.i3 58.43 52.92ll.alth Exp. por Captta voS 21.20 31.46 22.4J 21.# 32.12 32.60 U.2S 57.Q9 ¡15.14 15.74 26.57 33.E4 2i.16 25.01Fublíc Security Esp. pyr Capita WSS 21.76 23.92 t.116 17.67 33.92 30.74 32.30 33.41 54.il 58.06 U.54 35.79 1.90 21.39Education ¡spenditure per Teacber U¡S 5797.9 630fi.i9 860.i 6413.59 7375.2e 7600.31 1305.00 511S.S3 346.85 3713.17? =3.0S 6355.72 444.6 4203.34lealth Esp. pir heaíth ouoer U S ¡1U67.72 lt445.E4 420.25 3il266.97 1i16t.9O llilt.45 7702.05 1 49 2204.4t6 12725.37 27309.922illi.04 59tS.i3 SS9.s1Pubílc S,curity Esp. por pollcsan US 5301.31 5614.30 5591.l7 s509.73 7164.35 62 1 5J3fL 5700.it9 10417.01 1006.64 3300.50 57tLS9 312.39 3572.75
Public Empioyens by SectorAbsolute
Publc S )stt 76532 841l7 40663 4416 12511 13254 19m 174t 4059 4*00 15096 16874 4x6 4048¡ealth 25965 3351 647I1 720 731 71746 245 2331 465 10000 2112 3144 2S4 2i74Educati1a 177412 16t45 970i6 969 23405 24776 5966 4232 10147 13060 3332 37249 1651 6514TOTAL 435640 4919t 215702 23300 5 7121 0 II 1274 3332 5o 52716 9246 21154 24334
Rilative DlstríbutilonPub¡lc Satety 18.03 17.1U 19.00 19.03 1U.93 U.13 10.92 13.71 12.00 7.U4 16.25 16.25 17.43 16.64llaltb S.% 6.59 3.e0 3.12 11.07 11.07 5.4U 17.59 1OO I0 U1 3.40 3.40 12.E3 l1.81Education 40.72 34.30 45.00 4264 35.46 316.4 3t.t0 33.20 30.00 U3.f4 40.2 40.2¿ 37.36 34.99TOTAL 100.00 100.00 100.00 100.00 1,00.00 10.00 100.06 0L0O.O 100.00 100.06 100.00 100.00 100.00 100.00
. Distributioo oQt .tpcnditure
General Adlinlstration 23.S9 24.55 22.56 22.44 20.65 U.65 16.11 17.20 44.97 3615 17.14 27.59 32.22 19.99Pubioc Satety 10.65 11.11 I1.IU 11.04 15.2 13 UM 5.74 e.7 11.54 10.5 7.00 11.0IU 0.71 6.95eaith 14.2 14.63 ¡.1 3.72 19.07 U.51 lI.7 11.52 24.24 385 10.79 1.09 9.U e .U14
Culture amd Educatlon 25.8 27.83 32.51 31.42 30.4 32.4 20.14 14.5 8.53 11.32 15.23 211 3 21.il 17.27Econosio Oeveiopent 12.52 6.22 6.55 6.f9 1.71 11.27 1U.i7 1.52 2.06 243 25.70 2.65 21.25 22.35Social ¡slIar, 12.02 Ut9 10.15 12.54 4.50 5.14 11.39 10.56 7.U3 7.39 23.73 17.79 13.70 23.62Public hbt 0.14 0.25 0.0 0.01 0.32 0.il 0OO 0.2il 0.01 0.02 0.41 0.35 C.32 0.65Othbrs 0.91 0.93 0.0 0.15 0.U21 0.1 19.10 2.72 0.e0 0.00 0.00 0.00 0.10 0.00TOTAL ¡00.00 100.00 1Mo 100 100 100 100 l10l.0 leo 100 l£ 10 100 100
Ialncludn Central Adulístratlo.. Decutrallzed utetiíes s ¡eal ¡ut_b. £milud e pt.tl.. uliélda. k~ .ani Social Security Eatitis:
(blStandMrd dvlatloal Ibn 1961-1987

- 163 -
ARGENTINAPROVINCIAL GOVERNMENT FINANCE STUDY
Table 12a
REVENUES FOR THE SIX PROVINCESGENERAL ADMINISTRATION PLUS PUJBLIC UTILITY ENTERPRISES (a)
Millions of USS of July of 1988
Buenos Aires Cordoba Chubut Salta Santa Fe Santiagodel Estero
1986 1987 1986 1987 1986 1987 1986 1987 1986 1987 1986 1987
1. CURRENT REVENUES 1,818.4 1,810.8 506.2 490.0 110.4 128.1 152.7 170.4 722.9 479.0 143.2 141.11.1. ProvinciaL Sources 1,327.8 1,168.2 207.9 190.5 32.2 30.4 71.4 62.6 457.5 264.5 18.6 19.2
1.1.1. Tax 1,011.0 902.5 184.0 172.6 26.9 27.7 42.4 31.6 238.1 211.8 15.8 16.91.1.1.1. Real estate 233.4 182.6 42.1 35.0 1.5 0.2 4.6 2.6 48.7 43.7 2.2 1.7
1.1.1.2. Automobile 107.7 86.5 0.0 0.0 1.5 0.0 2.2 1.2 26.5 22.5 1.1 0.9
1.1.1.3. Turnover 454.5 421.2 109.3 110.4 17.0 13.1 20.9 18.3 115.4 100.0 8.9 9.41.1.1.4. Transfer (Sellos) 120.0 109.7 30.4 26.7 6.4 4.9 12.0 7.2 44.2 43.8 2.4 2.51.1.1.5. Energy and Fuel 83.3 91.3 0.0 0.0 0.00 0.00 0.0 0.0 0.5 0.0 0.0 0.01.1.1.6. Others 12.2 11.1 2.1 0.5 0.5 9.4 2.8 2.4 2.8 1.7 1.2 2.41.1.2. Non-tax 316.8 265.6 23.9 17.9 5.4 2.7 29.0 31.0 219.4 52.8 2.9 2.31.1.2.1. Fees 11.6 158.0 0.0 0.0 0.0 0.0 4.0 4.1 23.0 24.9 1.4 1.11.1.2.2. Tariffs 142.8 0.0 0.0 0.0 0.0 0.0 19.5 20.2 146.0 0.0 0.0 0.01.1.2.3. Interest 61.3 27.4 0.0 0.0 0.0 0.0 0.0 0.0 0.0 0.0 0.0 0.01.1.2.4. Transfers received 0.0 0.0 0.0 0.0 0.0 0.0 0.0 0.0 0.0 0.0 0.0 0.01.1.2.5. Others 101.1 80.3 23.9 17.9 5.4 2.7 5.4 6.7 50.4 27.9 1.5 1.21.2. National Sources 490.6 642.6 298.3 299.5 78.1 97.7 81.3 107.8 265.4 214.5 124.4 120.91.2.1. Federal Revenue Sharing (b) 373.0 545.9 266.4 278.2 0.0 34.1 45.9 50.1 211.5 166.3 119.5 110.91.2.2. Highway fund 93.1 75.6 0.0 0.0 0.0 5.3 5.1 5.4 27.4 22.2 4.9 4.41.2.3. Royalties 0.0 0.0 0.0 0.0 49.6 58.3 30.3 52.2 0.0 0.0 0.0 0.01.2.4. Others 24.5 21.1 31.9 21.3 28.5 0.0 0.0 0.0 26.4 25.9 0.0 5.61.3. Other sources of current revenues 0.0 0.0 0.0 0.0 0.0 0.0 0.0 0.0 0.0 0.0 0.1 1.03. CAPITAL REVENUES 22.5 4.0 0.0 0.5 0.7 0.9 2.1 1.2 4.6 9.1 11.0 23.73.1. Selling fixed assets 0.6 0.0 0.0 0.0 0.0 0.1 1.1 (0.3) 0.0 0.0 0.1 0.1
3.2. Payback of Loans 20.4 2.8 0.0 0.0 0.0 0.8 0.9 1.5 4.6 9.0 0.2 0.53.3. Others 1.5 1.2 0.0 0.0 0.0 0.0 0.0 0.0 0.0 0.0 10.6 23.04. GRANTS (Current and Capital) 218.3 43.9 0.8 2.5 0.0 6.5 79.1 79.3 53.0 27.2 4.6 2.84.1. Discretionary Grants (c) 215.4 43.9 0.0 0.0 0.0 0.0 66.1 72.1 50.3 26.5 0.0 0.04.2. Regional Development Fund (FDR) 0.0 0.0 0.8 2.5 0.0 2.8 9.7 4.8 0.2 0.5 2.1 0.34.3. Electricity Fund (FEDEI) 2.9 0.0 0.0 0.0 0.0 3.7 3.3 2.4 2.4 0.0 2.4 2.54.4. Other 0.0 0.0 0.0 0.0 0.0 0.0 0.0 0.0 0.2 0.2 0.0 0.06. TOTAL REVENUES AND GRANTS (1+3+4) 2,059.1 1,858.7 507.0 493.0 111.0 135.5 233.9 250.9 780.5 515.3 158.7 167.5Ca)lncludes General Aáninistration and the public utility enterprisaes, except for Cordoba. Excludes Banco de la Provincia
and Social Security Entities. See Annex Chapter ¡ for discussion.(b)Ad hoc revenue sharing for 1985-1987 was treated as revenue sharing and not as discretionary granta
(c)Aportes det Tesoro Nacional

- 164 -
ARGENTINA
PROVINCIAL GOVERNMENT FINANCE STUDY
Table 12b
REVENUES FOR THE SIX PROVINCES
GENERAL ADMINISTRAT1ON PLUS PUBLIC UTILITY ENTERPRISES (a)
X of Gross Provincial Product
Eluenos Aires Cordoba Chubut Salta Santa Fe Santiago
del Estero15186 1987 1986 1987 1986 1987 1986 1987 1986 1987 1986 1987
1. CURRENT REVENUES 8.52 8.36 10.83 10.26 11.82 13.41 13.09 14.19 11.83 7.72 25.45 24.35
1.1. Provincial Sources 6.22 5.39 4.45 3.99 3.46 3.18 6.12 5.21 7.49 4.26 3.31 3.31
1.1.1. Tax 4.74 4.17 3.94 3.61 2.88 2.89 3.64 2.63 3.90 3.41 2.80 2.921.1.1.1. Real estate 1.09 0.84 0.90 0.73 0.16 0.02 0.39 0.21 0.80 0.70 0.40 0.301.1.1.2. Automobile 0.50 0.40 0.00 0.00 0.16 0.00 0.19 0.10 0.43 0.36 0.20 0.161.1.1.3. Turnover 2.13 1.94 2.34 2.31 1.82 1.37 1.79 1.52 1.89 1.61 1.58 1.61
1.1.1.4. Transfer (Sellos) C.56 0.51 0.65 0.56 0.69 0.52 1.03 0.60 0.72 0.71 0.42 0.43
1.1.1.5. Energy and Fuel C.39 0.42 0.00 0.00 0.00 0.00 0.00 0.00 0.01 0.00 0.00 0.00
1.1.1.6. Otbers 0.06 0.05 0.05 0.01 0.05 0.98 0.24 0.20 0.05 0.03 0.20 0.42
1.1.2. Non-tax 1.48 1.23 0.51 0.37 0.58 0.29 2.48 2.58 3.59 0.85 01.51 0.39
1.1.2.1. Fees 0.05 0.73 0.00 0.00 0.00 0.00 0.34 0.34 0.38 0.40 tl.25 0.19
1.1.2.2. Tariffs 0.67 0.00 0.00 0.00 0.00 0.00 1.67 1.68 2.39 0.00 0.00 0.00
1.1.2.3. Interest 0.29 0.13 0.00 0.00 0.00 0.00 0.00 0.00 0.00 0.00 0.00 0.00
1.1.2.4. Transfers received 0.00 0.00 0.00 0.00 0.00 0.00 0.00 0.00 0.00 0.00 0.00 0.00
1.1.2.5. Others 0.47 0.37 0.51 0.37 0.58 0.29 0.47 0.56 0.82 0.45 0.26 0.20
1.2. National Sources 2.30 2.97 6.38 6.27 8.37 10.23 6.97 8.98 4.34 3.46 22.12 20.871.2.1. Federal Revenue Sharing (b) 1.75 2.52 5.70 5.82 0.00 3.57 3.93 4.17 3.46 2.68 21.25 19.14
1.2.2. Highway fund 0.44 0.35 0.00 0.00 0.00 0.56 0.44 0.45 0.45 0.36 0.87 0.76
1.2.3. Royalties 0.00 0.00 0.00 0.00 5.31 6.10 2.60 4.35 0.00 0.00 0.00 0.00
1.2.4. Others 0.11 0.10 0.68 0.45 3.06 0.00 0.00 0.00 0.43 0.42 0.00 0.97
1.3. Other sources of current revenues 0.00 0.00 0.00 0.00 0.00 0.00 0.00 0.00 0.00 0.00 0.02 0.17
3. CAPITAL REVENUES 0.11 0.02 0.00 0.01 0.07 0.09 0.18 0.10 0.08 0.15 1.95 4.09
3.1. Selling fixed assets 0.00 0.00 0.00 0.00 0.00 0.01 0.10 (0.02) 0.00 0.00 0.02 0.02
3.2. Payback of Loans 0.10 0.01 0.00 0.00 0.00 0.08 0.08 0.13 0.08 0.15 0.04 0.09
3.3. Others 0.01 0.01 0.00 0.00 0.00 0.00 0.00 0.00 0.00 0.00 1.89 3.97
4. GRANTS (Current ard Capital) 1.02 0.20 0.02 0.05 0.00 0.68 6.78 6.61 0.87 0.44 0.81 0.48
4.1. Oiscretionary Grants (c) 1.01 0.20 0.00 0.00 0.00 0.00 5.67 6.01 0.82 0.43 0.00 0.00
4.2. Regional Development Fund (FDR) 0.00 0.00 0.02 0.05 0.00 0.29 0.83 0.40 0.00 0.01 0.38 0.05
4.3. Electricity Fund (FEDEI) 0.01 0.00 0.00 0.00 0.00 0.38 0.28 0.20 0.04 0.00 0.43 0.43
4.4. Other 0.00 0.00 0.00 0.00 0.00 0.00 0.00 0.00 0.00 0.00 0.00 0.00
6. TOTAL REVENUES AND GRANTS <1+3+4) 9.64 8.58 10.85 10.32 11.90 14.17 20.05 20.90 12.77 8.30 28.21 28.91
(a>IncLudes Generat Administration and the pubLic utility enterprises, except for Cordoba. Excludes Banco de la Provincia
and Social Security Entities. See Arwnex Chapter I for discussion.
(b)Ad hoc revenue sharing for 1985-1987 was treated as revenue sharing and not as discretionary grants
(c)Aportes del Tesoro NacionaL

- 165 -
ARGENTINA
PROVINCIAL GOVERNMENT FINANCE STUDY
TabLe 12c
REVENUES FOR THE SIX PROVINCES
GENERAL ADMINISTRATION PLUS PU8LIC UTILITY ENTERPRISES (a)
USS of july of 1988 per capita
Buenos Aires Cordoba Chubut SaLta Santa Fe Santiago
deL Estero
1986 1987 1986 1987 1986 1987 1986 1987 1986 1987 1986 1987
1. CURRENT REVENUES 147.21 143.50 191.47 182.48 344.92 387.65 196.78 213.86 268.97 175.68 215.61 208.61
1.1. ProvinciaL Sources 107.49 92.57 78.65 70.93 100.79 91.96 92.02 78.57 170.23 97.03 28.06 28.38
1.1.1. Tax 81.85 71.52 69.59 64.27 83.97 83.69 54.67 39.70 88.59 77.67 23.75 25.01
1.1.1.1. Real estate 18.89 14.47 15.94 13.04 4.55 0.69 5.92 3.22 18.10 16.03 3.37 2.54
1.1.1.2. AutomobiLe 8.72 6.86 0.00 0.00 4.76 0.00 2.84 1.52 9.87 8.24 1.69 1.38
1.1.1.3. Turnover 36.80 33.38 41.36 41.09 53.03 39.63 26.89 22.95 42.93 36.68 13.36 13.83
1.1.1.4. Transfer (SeLLos) 9.71 8.70 11.48 9.95 20.09 14.93 15.45 9.03 16.45 16.08 3.60 3.68
1.1.1.5. Energy and FueL 6.74 7.24 0.00 0.00 0.00 0.00 0.00 0.00 0.18 0.00 0.00 0.00
1.1.1.6. Others 0.98 0.88 0.81 0.19 1.53 28.43 3.58 2.97 1.05 0.63 1.73 3.58
1.1.2. Non-tax 25.64 21.05 9.06 6.66 16.82 8.28 37.34 38.87 81.64 19.36 4.32 3.37
1.1.2.1. Fees 0.94 12.52 0.00 0.00 0.00 0.00 5.16 5.14 8.57 9.12 2.10 1.67
1.1.2.2. Tariffs 11.56 0.00 0.00 0.00 0.00 0.00 25.17 25.30 54.32 0.00 0.00 0.00
1.1.2.3. Interest 4.96 2.17 0.00 0.00 0.00 0.00 0.00 0.00 0.00 0.00 0.00 0.00
1.1.2.4. Transfers received 0.00 0.00 0.00 0.00 0.00 0.00 0.00 0.00 0.00 0.00 0.00 0.00
1.1.2.5. Others 8.18 6.36 9.06 6.66 16.82 8.28 7.01 8.44 18.74 10.24 2.22 1.70
1.2. National Sources 39.72 50.92 112.83 111.54 244.13 295.69 104.76 135.28 98.75 78.66 187.42 178.81
1.2.1. FederaL Revenue Sharing (c) 30.20 43.26 100.77 103.60 0.00 103.14 59.13 62.91 78.70 61.01 180.04 163.96
1.2.2. Nighway fund 7.54 5.99 0.00 0.00 0.00 16.16 6.61 6.79 10.20 8.15 7.38 6.53
1.2.3. RoyaLties 0.00 0.00 0.00 0.00 154.99 176.39 39.02 65.58 0.00 0.00 0.00 0.00
1.2.4. Others 1.98 1.68 12.06 7.94 89.14 0.00 0.00 0.00 9.84 9.50 0.00 8.32
1.3. Other sources of current revenues 0.00 0.00 0.00 0.00 0.00 0.00 0.00 0.00 0.00 0.00 0.13 1.42
3. CAPITAL REVENUES 1.82 0.32 0.00 0.19 2.14 2.63 2.67 1.56 1.72 3.32 16.55 35.01
3.1. Selling fixed assets 0.05 0.00 0.00 0.00 0.00 0.30 1.47 (0.34) 0.01 0.01 0.18 0.17
3.2. Payback of Loans 1.65 0.23 0.00 0.00 0.00 2.34 1.16 1.88 1.71 3.32 0.33 0.79
3.3. Others 0.12 0.09 0.00 0.00 0.00 0.00 0.04 0.01 0.00 0.00 16.04 34.04
4. GRANTS (Current and CapitaL) 17.67 3.48 0.30 0.92 0.00 19.55 101.92 99.59 19.72 9.99 6.86 4.08
4.1. Discretionary Grants (d) 17.44 3.48 0.00 0.00 0.00 0.00 85.18 90.53 18.70 9.71 0.00 0.00
4.2. RegionaL Development Fund tFDR) 0.00 0.00 0.30 0.92 0.00 8.50 12.53 5.98 0.08 0.20 3.22 0.43
4.3. ELectricity Fund (FEDEI) 0.23 0.00 0.00 0.00 0.00 11.05 4.21 3.07 0.88 0.00 3.64 3.65
4.4. Other 0.00 0.00 0.00 0.00 0.00 0.00 0.00 0.00 0.06 0.08 0.00 0.00
6. TOTAL REVENUES AND GRANTS (1 + 3 + 166.70 147.30 191.77 183.59 347.06 409.83 301.37 315.00 290.41 189.00 239.01 247.70
(a)lncLudes General Administration and the public utility enterprises, except for Cordoba. ExcLudes Banco de La Provincia
and SociaL Security Entities. See Annex Chapter 1 for discussion.
(b)Ad hoc revenue sharing for 1985-1987 was treated as revenue sharing and not as discretionary grants
(c)Aportes deL Tesoro NacionaL

- 166 -
ARGENTINA
PROVINCIAL GOVERNMENT FINANCE STUDY
Table 12d
REVENUES FOR THE SIX PROVINCES
GENERAL ADNINISTRATION PLUS PUBLIC UTILITY ENTERPRISES (a)
X of Total Revenues
Buenos Aires Cordoba Chubut Salta Santa Fe Santiago
deL Estero
1986 1987 1986 1987 1986 1987 1986 1987 1986 1987 1986 1987
1. CURRENT REVENUES B8.3 97.4 99.8 99.4 99.4 94.6 65.3 67.9 92.6 93.0 90.2 84.2
1.1. Provincial Sources 64.5 62.8 41.0 38.6 29.0 22.4 30.5 24.9 58.6 51.3 11.7 11.5
1.1.1. Tax 49.1 48.6 36.3 35.0 24.2 20.4 18.1 12.6 30.5 41.1 9.9 10.1
1.1.1.1. Real estate 11.3 9.8 8.3 7.1 1.3 0.2 2.0 1.0 6.2 8.5 1.4 1.0
1.1.1.2. Automobile 5.2 4.7 0.0 0.0 1.4 0.0 0.9 0.5 3.4 4.4 0.7 0.6
1.1.1.3. Turnover 22.1 22.7 21.6 22.4 15.3 9.7 8.9 7.3 14.8 19.4 5.6 5.6
1.1.1.4. Transfer (Sellos) 5.8 5.9 6.0 5.4 5.8 3.6 5.1 2.9 5.7 8.5 1.5 1.5
1.1.1.5. Energy and Fuel 4.0 4.9 0.0 0.0 0.0 0.0 0.0 0.0 0.1 0.0 0.0 0.0
1.1.1.6. Others 0.6 0.6 0.4 0.1 0.4 6.9 1.2 0.9 0.4 0.3 0.7 1.4
1.1.2. Non-tax 15.4 14.3 4.7 3.6 4.8 2.0 12.4 12.3 28.1 10.2 1.8 1.4
1.1.2.1. Fees 0.6 8.5 0.0 0.0 0.0 0.0 1.7 1.6 3.0 4.8 0.9 0.7
1.1.2.2. Tariffs 6.9 0.0 0.0 0.0 0.0 0.0 8.4 8.0 18.7 0.0 0.0 0.0
1.1.2.3. Interest 3.0 1.5 0.0 0.0 0.0 0.0 0.0 0.0 0.0 0.0 0.0 0.0
1.1.2.4. Transfers received 0.0 0.0 0.0 0.0 0.0 0.0 0.0 0.0 0.0 0.0 0.0 0.0
1.1.2.5. Others 4.9 4.3 4.7 3.6 4.8 2.0 2.3 2.7 6.5 5.4 0.9 0.7
1.2. National Sources ;23.8 34.6 58.8 60.8 70.3 72.1 34.8 42.9 34.0 41.6 78.4 72.2
1.2.1. Federal Revenue Shsring (b) '18.1 29.4 52.5 56.4 0.0 25.2 19.6 20.0 27.1 32.3 75.3 66.2
1.2.2. Highway fund 4.5 4.1 0.0 0.0 0.0 3.9 2.2 2.2 3.5 4.3 3.1 2.6
1.2.3. Royalties 0.0 0.0 0.0 0.0 44.7 43.0 12.9 20.8 0.0 0.0 0.0 0.0
1.2.4. Others 1.2 1.1 6.3 4.3 25.7 0.0 0.0 0.0 3.4 5.0 0.0 3.4
1.3. Other sources of current revenes 0.0 0.0 0.0 0.0 0.0 0.0 0.0 0.0 0.0 0.0 0.1 0.6
3. CAPITAL REVENUES 1.1 0.2 0.0 0.1 0.6 0.6 0.9 0.5 0.6 1.8 6.9 14.1
3.1. SelLing fixed assets 0.0 0.0 0.0 0.0 0.0 0.1 0.5 (0.1) 0.0 0.0 0.1 0.1
3.2. Payback of Loans 1.0 0.2 0.0 0.0 0.0 0.6 0.4 0.6 0.6 1.8 0.1 0.3
3.3. Others 0.1 0.1 0.0 0.0 0.0 0.0 0.0 0.0 0.0 0.0 6.7 13.7
4. GRANTS (Current and Capital) '10.6 2.4 0.2 0.5 0.0 4.8 33.8 31.6 6.8 5.3 2.9 1.6
4.1. Discretionary Grants (c) '10.5 2 4 0.0 0.0 0.0 0.0 28.3 28.7 6.4 5.1 0.0 0.0
4.2. Regional Development Fund (FDR) 0.0 0.0 0.2 0.5 0.0 2.1 4.2 1.9 0.0 0.1 1.3 0.2
4.3. Electricity Fund (FEDEI) 0.1 0.0 0.0 0.0 0.0 2.7 1.4 1.0 0.3 0.0 1.5 1.5
4.4. Other 0.0 0.0 0.0 0.0 0.0 0.0 0.0 0.0 0.0 0.0 0.0 0.0
6. TOTAL REVENUES ANO GRANTS <1+34) 100.0 100.0 100.0 100.0 100.0 100.0 100.0 100.0 100.0 100.0 100.0 100.0
(a>Includes GeneraL Administration and the pti>lic utlity enterprises, except for Cordoba. Excludes Banco de la Provincia
and Social Security Entitiíe. See Arinex Chapter 1 for discussion.
(b)Ad hoc revenue sharing for 1985-1987 was treated as revenue sharing and not as discretioniry grants
(c)Aportes del Tesoro Nacional

- 167 -
ASIINTIIUUIIICIAL CO_ EIIT FINAINE STUDY
TibIe 12eRW~W FU TIE 81X #UC$S
IEIEAL AMlI015TIATION PMLS LIC UTILITY ENTEURPISES (C)
X of Totat Expndíitur s............................................................................................................................
Su no air« Cardaba Chubut Sltt Santa Fe SantiagodeL Estero
1966 1967 198 1967 196 1987 1986 1987 1986 1987 1986 1987.......................................................................................................................
1. CURRENT REYEIIES 78.7 75.0 89.6 81.2 59.8 68.8 41.4 40.0 79.4 55.5 80.8 68.11.1. Provincial S~ures 57.4 48.4 36.9 31.6 17.5 16.3 19.4 14.7 50.3 30.6 10.5 9.31.1.1. Tex 43.7 37.4 32.7 28.6 14.5 14.9 11.5 7.4 26.2 24.5 8.9 8.21 1. 1. Real estate 10.1 7.6 7.5 5. 0.8 0.1 1.2 0.6 5.3 5.1 1.3 0.81.1.1.2. Auteombile 4.7 3.6 0.0 0.0 0.8 0.0 0.6 0.3 2.9 2.6 0.6 0.51.1.1.3. Turr r 19.7 17.4 19.4 18.3 9.2 7.0 5.7 4.3 12.7 11.6 5.0 4.51.1.1.4. Tranfer (Sallo.) 5.2 4.5 5.4 4.4 3.5 2.7 3.3 1.7 4.9 5.1 1.3 1.21.1.1.5. nErrgy and Ful 3.6 3.8 0.0 0.0 0.0 0.0 0.0 0.0 0.1 0.0 0.0 0.01.1.1.6. Others 0.5 0.5 0.4 0.1 0.3 5.0 0.8 0.6 0.3 0.2 0.6 1.21.1.2. Non-tax 13.7 11.0 4.3 3.0 2.9 1.5 7.9 7.3 24.1 6.1 1.6 1.11.1.2.1. Fe. 0.5 6.5 0.0 0.0 0.0 0.0 1.1 1.0 2.5 2.9 0.8 0.51.1.2.2. Taritfc 6.2 0.0 0.0 0.0 0.0 0.0 5.3 4.7 16.0 0.0 0.0 0.01.1.2.3. Interest 2.7 1.1 0.0 0.0 0.0 0.0 0.0 0.0 0.0 0.0 0.0 0.01.1.2.4. Tranfea rwceJved 0.0 0.0 0.0 0.0 0.0 0.0 0.0 0.0 0.0 0.0 0.0 0.0
1.1.2.5. Otherc 4.4 3.3 4.3 3.0 2.9 1.5 1.5 1.6 5.5 3.2 0.8 0.61.2. Natitnal Seurcs 21.2 26.6 52.9 49.6 42.3 52.5 22.1 25.3 29.2 24.8 70.2 58.41.2.1. Z Fderol Rev harin (b) 16.1 22.6 47.3 46.1 0.0 18.3 12.4 11.8 23.2 19.3 67.4 53.51.2.2. Nlghway fwtd 4.0 3.1 0.0 0.0 0.0 2.9 1.4 1.3 3.0 2.6 2.8 2.11.2.3. RoyaLtles 0.0 0.0 0.0 0.0 26.9 31.3 8.2 12.3 0.0 0.0 0.0 0.01.2.4. Others 1.1 0.9 5.7 3.5 15.4 0.0 0.0 0.0 2.9 3.0 0.0 2.71.3. Other ~euce of curret re o O OO0.0 0.0 0.0 0.0 0.0 0.0 0.0 0.0 0.0 0.0 0.0 0.53. CAPITAL REIENUS 1.0 0.2 0.0 0.1 0.4 0.5 0.6 0.3 0.5 1.0 6.2 11.43.1. Selling fixed asaeta 0.0 0.0 0.0 0.0 0.0 0.1 0.3 (0.1) 0.0 0.0 0.1 0.13.2. Paybatk of Loa 0.9 0.1 0.0 0.0 0.0 0.4 0.2 0.4 0.5 1.0 0.1 0.33.3. others 0.1 0.0 0.0 0.0 0.0 0.0 0.0 0.0 0.0 0.0 6.0 11.14. GRAITS tCurrent u*d Capital) 9.4 1.8 0.1 0.4 0.0 3.5 21.5 18.6 5.8 3.2 2.6 1.34.1. D1tcretiomry Grantc (t) 9.3 1.8 0.0 0.0 0.0 0.0 17.9 16.9 5.5 3.1 0.0 0.04.2. Regional Deelopmnt Fuhd <FDR) 0.0 0.0 0.1 0.4 0.0 1.5 2.6 1.1 0.0 0.1 1.2 0.14.3. Electricíty Frd <FEDEI) 0.1 0.0 0.0 0.0 0.0 2.0 0.9 0.6 0.3 0.0 1.4 1.24.4. other 0.0 0.0 0.0 0.0 0.0 0.0 0.0 0.0 0.0 0.0 0.0 0.06. TOTAL REVINUES All CIWITS <1+3+4) 89.1 77.0 90.0 81.7 60.1 7.8 63.4 58.9 85.7 59.7 89.5 80.8(aMincludes Gnral Adaínistration ud the public utillty ent.rpris, except for Cordba. Excludes Banco de ta Provincia
*d Soci~l S eurity Ent1ties. See Ax Chapter 1 for d1scusslon.Cb)Ad hoc revene haring for 1965-1967 ase tr eted es revenu haring *nd mt as discretiawary grants
<c>Aportes del Te*oro Nacienal

ARGENTINA
PROVINCIAL GOVERNMENT FINANCE STUDY
Table 13a
EXPENDITURES FOR THE SIX PROVINCES
GENERAL ADMINISTRATION PLUS PUBLIC UTILITY ENTERPRISES (a)
NiLlions of USS of july of 1988
…-- - - - - - - - - … . - - - - - - . . . . . . - - - - - - - - - - - - - - -
Buenos Aires Cordoba Chubut Salta Santa Fe Santiago Total 8ix
del Estero Provinces
1986 1987 1986 1987 1986 1987 1986 1987 1986 1987 1986 1987 1986 1987
7. TOTAL EXPENDITURES (2 + 5) 2,311.3 2,415.4 563.4 603.5 184.7 186.1 368.6 426.3 910.4 863.5 177.3 207.2 4,515.6 4,702.0
6. TOTAL REVENUES ANO GRANTS (1+3+4) 2,059.1 1,858.7 507.0 493.0 111.0 135.5 233.9 250.9 780.5 515.3 158.7 167.5 3,850.2 3,420.9
1. CURRENT REVENUES 1,818.4 1,810.8 506.2 490.0 110.4 128.1 152.7 170.4 722.9 479.0 143.2 141.1 3,453.7 3,219.4
2. CURRENT EXPENDITURES 1,830.0 1,861.4 473.0 502.7 114.3 115.4 264.5 319.1 763.3 669.5 125.0 123.9 3,570.1 3,592.0
2.1. Personnel 1.042.5 1.085.6 314.2 344.3 80.6 85.2 182-5 237-3 3991 379=Q RAR 86 1 , 1n5 .7 2,2t8 4
2.2. Good and services 394.1 356.1 54.4 59.5 17.3 14.7 46.1 43.9 164.3 85.2 7.9 8.9 684.2 568.2
2.3. Interest payments 11.1 43.8 5.6 5.8 0.0 0.0 0.1 0.1 4.7 16.1 0.3 0.2 21.8 66.0
2.4. Other current expenditures 1.1 1.1 0.0 0.0 0.0 0.0 1.1 0.6 0.0 0.0 2.0 2.8 4.2 4.6
2.5. Current transfers 381.2 374.7 98.9 93.1 16.3 15.5 34.8 37.2 195.1 188.3 28.0 25.9 754.3 734.7
2.5.1. To municipalities 184.0 202.6 30.7 45.9 0.0 0.0 17.9 16.1 0.0 0.0 0.0 0.0 232.6 264.6
2.5.1.1. Revenue sharing 177.9 195.3 17.9 43.8 0.0 0.0 17.5 16.1 0.0 0.0 0.0 0.0 213.3 255.1
2.5.1.2. Discretionary grants 6.1 7.4 12.8 2.1 0.0 0.0 0.4 0.0 0.0 0.0 0.0 0.0 19.3 9.5
2.5.2. To provinciat enterprises (b) 0.0 0.0 11.3 6.6 0.0 0.0 2.4 1.8 0.0 0.0 0.0 0.0 13.7 8.3
2.5.3. To social security entities 102.1 77.0 35.0 14.5 0.0 0.0 9.8 10.4 0.0 0.0 0.0 0.0 146.9 101.9
2.5.4. To General Administration 0.0 0.0 0.0 0.0 0.0 0.0 0.0 0.0 0.0 0.0 0.0 0.0 0.0 0.0
2.5.5. Other 95.1 95.1 21.9 26.2 16.3 15.5 4.7 8.9 195.1 188.3 28.0 25.9 361.2 359.9
3. CAPITAL REVENUES 22.5 4.0 0.0 0.5 0.7 0.9 2.1 1.2 4.6 9.1 11.0 23.7 40.9 39.4
5. CAPITAL EXPENDITURES 481.2 554.0 90.4 100.7 70.4 70.8 104.1 107.2 147.0 194.0 52.2 83.3 945.5 1,110.1
5.1. Real Investment 353.5 443.4 84.1 89.0 57.4 58.7 94.2 103.3 127.7 173.4 50.7 77.4 767.6 945.2
5.1.1. Capital Goods 27.9 30.8 4.4 6.0 1.8 0.8 4.6 1.8 11.7 17.0 1.5 1.8 52.0 58.1
5,1-2. contruetion 325=6 412-6 79.7 83.0 55.6 58.0 89.6 101.5 115.9 15.6.4 49.2 w.£ '15.', 8,
5.2. Investment in existing assets 6.7 8.3 1.9 1.1 0.0 0.0 3.9 0.7 2.4 1.7 0.9 2.5 15.8 14.3
5.3 Financial investment 59.7 48.0 0.2 0.3 0.1 0.5 5.9 3.2 17.0 16.8 0.1 1.0 83.0 69.9
5.4 Capital transfera 61.4 54.4 4.3 10.3 12.9 11.5 0.0 0.0 0.0 2.1 0.5 2.4 79.1 80.7
5.5. Other capital expenditures 0.0 0.0 0.0 0.0 0.0 0.0 0.0 0.0 0.0 0.0 0.0 0.0 0.0 0.0
5.6. Minus repayment to Province 0.0 0.0 0.0 0.0 0.0 0.0 0.0 0.0 0.0 0.0 0.0 0.0 0.0 0.0
(a)includes General Administration and the public utility enterprises, except for Cordoba. Exctudes Banco del Provincia
and Social Security Entities. See Annex Chapter ¡ for discussion.
(b)Hecause Cordoba ís exciuded, transfers to its public utility enterprises are included. For Salta, transfers are to enterprises that are not utilities.

ARGENTINA
PROVINCIAL GOVERNhENT FINANCE STUDY
Table 13b
EXPENDITURES FOR THE SIX PROVINCES
GENERAL ADFINISTRATION PLUS PUBLIC UTILITY ENTERPRISES (a)
X of Groas Provincial Product
Buenos Aires Cordoba Chubut salta Santa Fe Santiago Total six
del Estero Provinces
1986 1987 1986 1987 1986 1987 1986 1987 1986 1987 1986 1987 1986 1987
…------- -----.--.-..---------...- - .-----.-...---.-----------. -. ..----- ...-.-.-.--..--.--.--....-.----...-.---.---. .---.- ---.-.----. --- ...-.........
7. TOTAL EXPENDITURES (2 + 5) 10.82 11.15 12.06 12.63 19.79 19.48 31.60 35.51 14.90 13.91 31.51 35.76 12.98 13.29
6. TOTAL REVENUES AND GRANTS <1+3,4) 9.64 8.58 10.85 10.32 11.90 14.17 20.05 20.90 12.77 8.30 28.21 28.91 11.06 9.67
1. CURRENT REVENUES 8.52 8.36 10.83 10.26 11.82 13.41 13.09 14.19 11.83 7.7n 25.45 24.35 9.92 9.10
2. CURRENT EXPENDITURES 8.57 8.59 10.12 10.52 12.24 12.07 22.67 26.58 12.49 10.79 22.22 21.38 10.26 10.15
2.1. Personnel 4.88 5.01 6.72 7.21 8.64 8.91 15.64 19.76 6.53 6.12 15.43 14.86 6.05 6.27
2.2. Good nd services 1.85 1.64 1.16 1.25 1.85 1.53 3.95 3.65 2.69 1.37 1.41 1.54 1.97 1.610'
2.3. Interest payments 0.05 0.20 0.12 0.12 0.00 0.00 0.01 0.01 0.08 0.26 0.05 0.03 0.06 0.19
2.4. Other current expenditures 0.01 0.01 0.00 0.00 0.00 0.00 0.09 0.05 0.00 0.00 0.35 0.49 0.01 0.01
2.5. Current transfers 1.79 1.73 2.12 1.95 1.75 1.63 2.98 3.10 3.19 3.03 4.98 4.47 2.17 2.08
2.5.1. To mnicipalities 0.86 0.94 0.66 0.96 0.00 0.00 1.53 1.34 0.00 0.00 0.00 0.00 0.67 0.75
2.5.1.1. Revenue sharing 0.83 0.90 0.38 0.92 0.00 0.00 1.50 1.34 0.00 0.00 0.00 0.00 0.61 0.72
2.5.1.2. Discretionary grants 0.03 0.03 0.27 0.04 0.00 0.00 0.04 0.00 0.00 0.00 0.00 0.00 0.06 0.03
2.5.2. To provincial enterprises (b) 0.00 0.00 0.24 0.14 0.00 0.00 0.21 0.15 0.00 0.00 0.00 0.00 0.04 0.02
2.5.3. To social security entities 0.48 0.36 0.75 0.30 0.00 0.00 0.84 0.87 0.00 0.00 0.00 0.00 0.42 0.29
2.5.4. To General Administration 0.00 0.00 0.00 0.00 0.00 0.00 0.00 0.00 0.00 0.00 0.00 0.00 0.00 0.00
2.5.5. Other 0.45 0.44 0.47 0.55 1.75 1.63 0.40 0.74 3.19 3.03 4.98 4.47 1.04 1.02
3. CAPITAL REVENUES 0.11 0.02 0.00 o.ól 0.07 0.09 0.18 0.10 0.08 0.15 1.95 4.09 0.12 0.11
5. CAPITAL EXPENDITURES 2.25 2.56 1.94 2.11 7.55 7.41 8.92 8.93 2.41 3.13 9.28 14.38 2.72 3.14
5.1. Real Investment 1.66 2.05 1.80 1.86 6.15 6.15 8.08 8.61 2.09 2.79 9.01 13.36 2.21 2.67
5.1.1. Capital Goods 0.13 0.14 0.10 0.13 0.20 0.08 0.39 0.15 0.19 0.27 0.26 0.31 0.15 0.16
5.1.2. Contruction 1.52 1.91 1.71 1.74 5.96 6.07 7.68 8.46 1.90 2.52 8.75 13.05 2.06 2.51
5.2. Investment in existing assets 0.03 0.04 0.04 0.02 0.00 0.00 0.34 0.06 0.04 0.03 0.16 0.43 0.05 0.04
5.3 Financial investment 0.28 0.22 0.00 0.01 0.01 0.06 0.51 0.27 0.28 0.27 0.02 0.18 0.24 0.20
5.4 Capital transfers 0.29 0.25 0.09 0.22 1.38 1.20 0.00 0.00 0.00 0.03 0.09 0.42 0.23 0.23
5.5. Other capital expenditures 0.00 0.00 0.00 0.00 0.00 0.00 0.00 0.00 0.00 0.00 0.00 0.00 0.00 0.00
5.6. Finus repayment to Province 0.00 0.00 0.00 0.00 0.00 0.00 0.00 0.00 0.00 0.00 0.00 0.00 0.00 0.00
(a)includes General Administration and the public utility enterprises, except for Cordoba. Excludes Banco del Provincia
and Social Security Entities. See Annex Chapter 1 for discussion.
(b)Because Cordoba la excluded, trensfers to its public utility enterprises are included. For SaLta, transfers are to enterprises that are not utilities.

* ~ ~ ~ ~ ~ ~ ~ ~ ~ ~ EOTE AOR IE lx lFm
BPISI10tiUElS FU TUl SIX PWICSEIAI. ADIIISlTnrAm 0s PI. .ic UTILITV Enam §MIE (a>
m of Juty of t6 per agita.......... ................. ..................................... ............................................................................. ................................................................................. ........................... ..
Aires Cwd~e Chut alta ta Fe antiao tetal x
del Este. Provie196 1967 19 197 196 197 1996 1967 196 1987 1966 1967 1966 196
....... ............ ______........................._.__......__.,..._.__......_.__........ __1..... * ****......................................
Y. tOTAL XPE~IEU (2 * 5) 187.11 191.41 213.1 224.71 577.21 563.12 47n.0S 535.18 338.74 316.72 266.99 306.41 232.24 237.or6. TOTAL MWNIES MO ~EANTI (1 * 3 . 4) 166.70 147.30 191.77 183.59 347.06 409.83 301.37 315.00 290.41 169.00 239.01 247.70 196.02 172.481. ODIENT REVElES 147.21 143.50 191.47 12.48 344.92 387.65 196.78 213.86 268.97 175.68 215.61 20.61 177.63 162.312. CJRIIENT EXPEINDITURES 148.15 147.51 178.90 187.21 357.12 349.01 340.89 400.55 284.02 245.57 188.31 183.18 183.62 151-102.1. Pereuel 84.40 86.03 118.82 128.23 251.97 257.64 235.13 297.90 148.52 139.36 130.78 127.29 106.30 111.852.2. Uood and services 31.90 28.22 20.58 22.16 54.07 44.35 59.41 55.07 61.15 31.24 11.95 13.18 35.19 28.652.3. Inter«t pmnt 0.90 3.47 2.10 2.16 0.00 0.00 0.11 0.10 1.77 5.92 0.45 0.26 1.12 3.33 °2.4. Other current expenditume 0.09 0.09 0.01 0.01 0.00 0.00 1.41 0.77 0.00 0.00 2.96 4.21 0.22 0.23 12.5. Current tranferx 30.86 29.70 37.39 34.66 51.08 47.03 44.83 46.71 72.S9 69.07 42.16 38.26 38.79 37.042.5.1. Tyo .icipaliti«e 14.89 16.06 11.61 17.06 0.00 0.00 23.06 20.23 0.00 0.00 0.00 0.00 11.96 13.342.5.1.1. *awR herfng 14.40 15.47 6.76 16.30 0.00 0.00 22.53 20.23 0.00 0.00 0.00 0.00 10.97 12.862.5.1.2. Difcretienary grantc 0.49 0.58 4.85 0.78 0.00 0.00 0.53 0.00 0.00 0.00 0.00 0.00 0.99 0.482.5.2. to provlnciol enterpuises (b) 0.00 0.00 4.26 2.44 0.00 0.00 3.09 2.24 0.00 0.00 0.00 0.00 0.70 0.422.5.3. To ociel sectwity entities -8.27 6.10 13.23 5.38 0.00 0.00 12.60 13.09 0.00 0.00 0.00 0.00 7.55 5.142.5.4. Te Genrl AminxtratJon 0.00 0.00 0.00 0.00 0.00 0.00 0.00 0.00 0.00 0.00 0.00 0.00 0.00 0.002.S.S. Other 7.70 7.54 8.29 9.75 51.08 47.03 6.g 11.16 n.5g 69.07 42.16 38.26 16.5S 16.14
3. CAPITAL NIIES 1.82 0.32 0.00 0.19 2.14 2.63 2.67 1.56 1.n 3.32 16.55 35.01 2.10 1.99S. CAPITAL EXPEINDITIES 38.96 43.90 34.21 37.51 220.09 214.11 134.16 134.62 54.71 71.15 78.67 123.23 40.63 55.97S.1. Real Investmant 28.62 35.14 31.82 33.14 179.51 177.69 121.42 129.71 47.50 63.58 76.35 114.42 39.48 47.665.1.1. Capital Gocé 2.26 2.44 1.6U 2.23 5.76 2.28 s = 2MPL 43L 6Z4 2.20 2' 2. 7 2.935.1.2. Contruction 26.36 32.70 30.14 30.90 173.75 175.41 115.52 127.47 43.13 57.35 74.15 111.76 36.81 44.735.2. Investment In existing auseta 0.54 0.66 0.70 0.42 0.00 0.00 5.08 0.86 0.90 0.61 1.36 3.n 0.S1 o.n5.3 Financiel investmnt 4.83 3.80 0.07 0.12 0.24 1.62 7.66 4.04 6.31 6.17 0.19 1.52 4.27 3.525.4 Capital trasfers 4.97 4.31 1.61 3.83 40.34 34.80 0.00 0.00 0.00 0.79 0.77 3.57 4.07 4.075.5. Other capital experdttures 0.00 0.00 0.00 0.00 0.00 0.00 0.00 0.00 0.00 0.00 0.00 0.00 0.00 0.005.6. Alnus repaent to Province 0.00 0.00 0.00 0.00 0.00 0.00 0.00 0.00 0.00 0.00 0.00 0.00 0.00 0.00
<a>include GCeneral Adeinistration ard the pulic utility enterprises, except for Corddb. Exciudes Banco del Provincla:rd Social Securlty Entities. See AÍw,x Chapter i for discucsion.
(b>Uecae >rd~ la excluded. traferx to itc pubilc utility enterpriese are Included. For Salta, tranafera are to enterprises that are not utilities.

ARGENTINAPROVINCIAL GOMERNMENT FINANCE STUDY
Table 13d
EXPENDITURES FOR TIHE SIX PROVINCESGENERAL ADNINISTRATION PLUS PIJBLIC UTILITY ENTERPRISES (a)
X of Total Revenues
Buenos Aires Cordoba Chubut Salta Santa Fe Santiago Total slxdel Estero Provinces
1986 1987 1986 1987 1986 1987 1986 1987 1986 1987 1986 1987 1986 1987.-- ----- -- --- .-- _- --- .--- --- ----.-- _-_-.-_- _
7. TOTAL EXPENDITURES <2 + 5) 112.2 129.9 111.1 122.4 166.3 137.4 157.6 169.9 116.6 167.6 111.7 123.7 117.3 137.4
6. TOTAL REVENUES AND GRANTS (1+3+4) 100.0 100.0 100.0 100.0 100.0 100.0 100.0 100.0 100.0 100.0 100.0 100.0 100.0 100.0
1. CURRENIT REVENUES 88.3 97.4 99.8 99.4 99.4 94.6 65.3 67.9 92.6 93.0 90.2 84.2 89.7 94.1
2. CIRRENT EXPENDITURES 88.9 100.1 93.3 102.0 102.9 85.2 113.1 127.2 97.8 129.9 78.8 74.0 92.7 105.0
2.1. Personmel 50.6 58.4 62.0 69.8 72.6 62.9 78.0 94.6 51.1 73.7 54.7 51.4 54.7 64.8
2.2. Good and services 19.1 19.2 10.7 12.1 15.6 10.8 19.7 17.5 21.1 16.5 5.0 5.3 17.8 16.6
2.3 Interest payments 0.5 2.4 1.1 1.2 0.0 0.0 0.0 0.0 0.6 3.1 0.2 0.1 0.6 1.9 _
2.4. Other current expeiditures 0.1 0.1 0.0 0.0 0.0 0.0 0.5 0.2 0.0 0.0 1.2 1.7 0.1 0.1
2.S. Current transfers 18.5 20.2 19.5 18.9 14.7 11.5 14.9 14.8 25.0 36.5 17.6 15.4 19.6 21.5
2.5.1. To mmicipalities 8.9 10.9 6.1 9.3 0.0 0.0 7.7 6.4 0.0 0.0 0.0 0.0 6.0 7.7
2.5.1.1. Reveue sharing 8.6 10.5 3.5 8.9 0.0 0.0 7.5 6.4 0.0 0.0 0.0 0.0 5.5 7.5
2.5.1.2. Discretionary grants 0.3 0.4 2.5 0.4 0.0 0.0 0.2 0.0 0.0 0.0 0.0 0.0 0.5 0.3
2.5.2. To provincial enterprises (b) 0.0 0.0 2.2 1.3 0.0 0.0 1.0 0.7 0.0 0.0 0.0 0.0 0.4 0.2
2.5.3. To social security entities 5.0 4.1 6.9 2.9 0.0 0.0 4.2 4.2 0.0 0.0 0.0 0.0 3.8 3.0
2.5.4. To General Administration .0.0 0.0 0.0 0.0 0.0 0.0 0.0 0.0 0.0 0.0 0.0 0.0 0.0 0.0
2.S.S. Other 4.6 5.1 4.3 5.3 14.7 11.5 2.0 3.5 25.0 36.5 17.6 15.4 9.4 10.5
3. CAPITAL REVENUES 1.1 0.2 0.0 0.1 0.6 0.6 0.9 0.5 0.6 1.8 6.9 14.1 1.1 1.2
5. CAPITAL EXPENDITURES 23.4 29.8 17.8 20.4 63.4 52.2 44.5 42.7 18.8 37.6 32.9 49.7 24.6 32.4
5.1. Real Investment 17.2 23.9 16.6 18.1 51.7 43.4 40.3 41.2 16.4 33.6 31.9 46.2 19.9 27.6
5.1.1. Capital Goods 1.4 1.7 0.9 1.2 1.7 0.6 2.0 0.7 1.5 3.3 0.9 1.1 1.3 1.7
5.1.2. Contruction 15.8 22.2 15.7 16.8 50.1 42.8 38.3 40.5 14.9 30.3 31.0 45.1 18.6 25.9
5.2. Investment In existing assets 0.3 0.4 0.4 0.2 0.0 0.0 1.7 0.3 0.3 0.3 0.6 1.5 0.4 0.4
5.3 Financial investment 2.9 2.6 0.0 0.1 0.1 0.4 2.5 1.3 2.2 3.3 0.1 0.6 2.2 2.0
5.4 Capital transfers 3.0 2.9 0.8 2.1 11.6 8.5 0.0 0.0 0.0 0.4 0.3 1.4 2.1 2.4
5.5. Othfr capital expenditures 0.0 0.0 0.0 0.0 0.0 0.0 0.0 0.0 0.0 0.0 0.0 0.0 0.0 0.0
5.6. «in repayment to Province 0.0 0.0 0.0 0.0 0.0 0.0 0.0 0.0 0.0 0.0 0.0 0.0 0.0 0.0
<a)Includes General Administration and the public utility enterprises, except for Cordoba. Exctudes Banco del Provincia
and Social Security Entities. See Annex Chapter 1 for discussion.
(b)ecause Cordoba is excluded, transfers to its public utilíty enterprises are included. For Salta, transfers are to enterprises that are not utilities.

ARGENTINA
PROVINCIAL GOVERNENT FINANCE STUDY
Table 13e
EXPENDITURES FOR TNE SIX PROVINCES
GENERAL ADNINISTRATION PLUS PUBLIC UTILITY ENTERPRISES (a)
X of Total Expenditures
Buenos Aires Cordoba Chubut Salta Santa Fe Santiago Total six--
del Estero Provinces;
1986 1987 1986 1987 1986 1987 1986 1987 1986 1987 1986 1987 1986 1987
-- -- - - - - - - - - - - -- - - - - - - - - - - - - - -- - - - - - - - - - - - - -- - - - - - - - - - - - - - .. ..... ........ .. ... .... . . . . .. . . . . .
7. TOTAL EXPENOITURES (2 + 5) 100.0 100.0 100.0 100.0 100.0 100.0 100.0 100.0 100.0 100.0 100.0 100.0 100.0 100.0
6. TOTAL REVENUES ANO GRANTS <1+3+4) 89.1 77.0 90.0 81.7 60.1 72.8 63.4 58.9 85.7 59.7 89.5 80.8 85.3 72.8
1. CURRENT REVENUES 78.7 75.0 89.8 81.2 59.8 68.8 41.4 40.0 79.4 55.5 80.8 68.1 76.5 .,5
7 3RFMI EXPENDITURES 79.2 77.1 83.9 83.3 61.9 62.0 71.8 74.8 83.8 77.5 70.5 59.8 79.1 r.42.1. Personnel 45.1 «.9 55.8 57.1 43.7 45.8 49.5 55.7 43.8 44.0 49.0 41.5 46.6 47.2
2.2. Good ond services 17.1 14.7 9.7 9.9 9.4 7.9 12.5 10.3 18.1 9.9 4.5 4.3 15.2 12.1 1
2.3. Interest paysents 0.5 1.8 1.0 1.0 0.0 0.0 0.0 0.0 0.5 1.9 0.2 0.1 0.5 1.4
2.4. Other current expenditures 0.0 0.0 0.0 0.0 0.0 0.0 0.3 0.1 0.0 0.0 1.1 1.4 0.1 0.1 h
2.5. Current trasfers 16.5 15.5 17.5 15.4 8.8 8.4 9.4 8.7 21.4 21.8 15.8 12.5 16.7 15.6
2.5.1. To mnicipatities 8.0 6.4 5.4 7.6 0.0 0.0 4.9 3.8 0.0 0.0 0.0 0.0 5.2 5.6
2.5.1.1. Revenue sharing 7.7 8.1 3.2 7.3 0.0 0.0 4.7 3.8 0.0 0.0 0.0 0.0 4.7 5.4
2.5.1.2. Dfscretionary grants 0.3 0.3 2.3 0.3 0.0 0.0 0.1 0.0 0.0 0.0 0.0 0.0 0.4 0.2
2.5.2. To provincial enterprices 0.0 0.0 2.0 1.1 0.0 0.0 0.6 0.4 0.0 0.0 0.0 0.0 0.3 0.2
2.5.3. To social securíty entities 4.4 3.2 6.2 2.4 0.0 0.0 2.7 2.4 0.0 0.0 0.0 0.0 3.3 2.2
2.5.4. To General Adeinistration 0.0 0.0 0.0 0.0 0.0 0.0 0.0 0.0 0.0 0.0 0.0 0.0 0.0 0.0
2.5.5. Other 4.1 3.9 3.9 4.3 8.8 8.4 1.3 2.1 21.4 21.8 15.8 12.5 8.0 7.7
3. CAPITAL REVENUES 1.0 0.2 0.0 0.1 0.4 0.5 0.6 0.3 0.5 1.0 6.2 11.4 0.9 0.8
5. CAPITAL EXPENDITURES 20.8 22.9 16.1 16.7 38.1 38.0 28.2 25.2 16.2 22.5 29.5 40.2 20.9 23.6
5.1. Real Investment 15.3 18.4 14.9 14.7 31.1 31.6 25.6 24.2 14.0 20.1 28.6 37.3 17.0 20.1
5.11 -r~*~dC:pit:! C 1.2 1.3 0.8 1.0 1.0 0.4 .2 0.4 ' 3 2.0 0.8 0=9 ' 2 12
5.1.2. Contruction 14.1 17.1 14.1 13.8 30.1 31.1 24.3 23.8 12.7 18.1 27.8 36.5 15.8 18.9
5.2. Investment in existing assets 0.3 0.3 0.3 0.2 0.0 0.0 1.1 0.2 0.3 0.2 0.5 1.2 0.3 0.3
5.3 Financial investuaent 2.6 2.0 0.0 0.1 0.0 0.3 1.6 0.8 1.9 1.9 0.1 0.5 1.8 1.5
5.4 Capital transfers 2.7 2.3 0.8 1.7 7.0 6.2 0.0 0.0 0.0 0.2 0.3 1.2 1.8 1.7
S.S. Other capital expenditures 0.0 0.0 0.0 0.0 0.0 0.0 0.0 0.0 0.0 0.0 0.0 0.0 0.0 0.0
5.6. minus-repay~ent to Province 0.0 0.0 0.0 0.0 0.0 0.0 0.0 0.0 0.0 0.0 0.0 0.0 0.0 0.0
<a>)ncludes General Adninistration and the public utility enterprises except for Cordaba. Excludes Banco del Provincia
ana Socia( Security Entities. See Annex Chapter 1 for discussion.
(b)Because Cordoba Is excluded. transfera to Ite public utility enterprises are Included. For Salta, transfers are to enterprises that are not utilities.

- 173 -
III. PROVINCIAL GOVERNMENT REVENUES, EXPENDITURES AND FINANCINGFOR THE CONSOLIDATED GENERAL ADMINISTRATION OF
THE 22 PROVINCES AND THE NUNICIPALITY OF BUENOS AIRESIN US$: 1981-1986

- 174 -
ARGENTINA
PROVINCIAL GOVERNMENT FINANCE STUDY
Table 14a
PROVINCIAL REVENUES, EXPENDITURES AND FINANCING: 1981-1986(a)
ALL IPROVINCES ANO MUNICIPALITY OF BUENOS AIRES
M,ilions of USS of juty of 1988
1981 1982 1983 1984 1985 1986 1981-1986 Coefficient
Mean o1: Variation
(b)
1. CURRENT REVENUES 5,133.2 4,163.8 3,787.0 4,184.2 5,844.3 6,718.6 4,971.8 21.01.1. Provincial Sources 2,923.3 2,223.7 1,942.6 2,490.8 2,502.6 3,063.2 2,524.3 15.2
1.1.1. Tax 2,383.5 1,905.0 1,569.3 2,079.8 2,150.2 2,559.3 2,108.7 15.2
1.1.1.1. Real estate 539.4 436.9 347.2 553.1 541.5 576.6 499.1 16.2
1.1.1.2. Automobile 21:5.4 159.8 148.3 227.9 260.4 230.9 206.8 19.31.1.1.3. Turnover 1,18..2 994.8 858.8 1,079.6 1,098.9 1,391.8 1,101.2 14.91.1.1.4. Transfer (Sellos) 335.8 222.7 185.1 184.0 203.1 307.3 239.7 25.0
1.1.1.5. Others 116.7 90.9 29.8 35.2 46.3 52.7 61.9 50.7
1.1.2. Non-tax 534.7 318.7 373.3 411.0 352.3 503.9 415.6 18.91.2. National Sources 2,210.0 1,940.1 1,844.4 1,693.5 3,341.7 3,655.4 2,447.5 31.2
1.2.1. Federal Revenue Sharing (c) 1,896.7 1,532.4 1,281.1 1,172.0 2,677.7 2,885.3 1,907.5 34.7
1.2.2. Highway fund 1659.1 138.6 187.0 177.9 255.0 266.1 199.0 23.21.2.3. Royalties 144.2 250.2 363.7 332.0 393.6 482.9 327.8 32.8
1.2.4 Others tI.0 18.9 12.6 11.6 15.4 21.1 13.3 51.21.3. Other sources of current revenues Q.0 0.0 0.0 0.0 0.0 0.0 0.0 --
2. CURRENT EXPENDITURES 5,373.0 3,964.8 4,911.5 5,877.2 5,527.6 6,409.7 5,344.0 14.4
2.1. Personnet 3,099.0 2,210.6 2,899.2 3,753.2 3,522.8 3,862.8 3,224.6 17.62.2. Good and services 572.5 487.6 487.8 616.9 646.2 856.6 611.3 20.4
2.3. Interest payments 49.9 20.8 35.8 11.8 30.9 39.2 31.4 39.52.4. Other current expenditures 0.0 0.0 0.0 0.0 0.0 0.0 0.0 --
2.5. Transfers 1,651.6 1,245.9 1,488.8 1,495.3 1,327.9 1,651.2 1,476.8 10.2
2.5.1. To municipatities 391.1 294.8 281.9 427.3 484.0 594.3 412.3 26.2
2.5.1.1. Revenue sharing 391.1 294.8 276.1 339.4 426.3 486.9 369.1 20.0
2.5.1.2. Discretionary grants 0.0 0.0 5.8 87.9 57.7 107.4 43.1. 101.3
2.5.2. To provincial enterprises 0.0 0.0 0.0 0.0 0.0 0.0 0.0 --
2.5.3. To social security entities 0.0 0.0 706.3 636.5 300.5 328.7 328.7 83.72.5.4. To General Administration 0.0 0.0 0.0 0.0 0.0 0.0 0.0 --
2.5.5. Other 1,260.4 951.0 500.6 431.6 543.4 728.1 735.8 39.53. CAPITAL REVENUES 28.4 45.9 18.8 41.8 24.2 52.4 35.2 34.63.1. Seliíng fixed assets 10.4 7.6 0.0 1.7 2.0 5.1 4.5 81.53.2. Payback of Loans 0.0 0.0 0.0 30.4 16.2 34.1 13.5 107.93.3. others 18.0 38.3 18.8 9.7 6.0 13.2 17.3 60.04. GRANTS (Current and Capital) 1,026.7 636.9 2,408.5 1,776.3 222.2 511.0 1,096.9 69.74.1. Discretionary Grants (d) 783,3 450.3 2,187.0 1,642.2 0.0 218.7 880.2 89.24.2. Regional Development Fund (FDR> 106.1 73.7 59.5 39.4 61.1 96.1 72.6 31.24.3. Electricity Fund (FEDEI) 21.,0 10.5 14.4 14.8 32.6 43.0 22.7 50.74.4. Other 116.3 102.4 147.6 79.9 128.5 153.2 121.3 20.9

- 175 -
ARGENTMIA
PROVINCIAL GOVERNMENT FINANCE STW5YTeble 14a
PROVINCIAL REVENUES, EXPENDITURES AND FIltUCING: 1961-1986<e>ALL PROVINCES AND iUIICIPALITY OF AENOS AIRES
NilUIOn of US$ of july of 196O
(Continuation)
1981 1982 1983 1984 1985 1986 1961-196 Coefffcfent
Meen of Variation
(b>
5. CAPITAL EXPENDITURES 2,119.1 1,314.9 1.531.5 1.566.4 1.318.9 1.7J4.9 1,606.0 17.4
5.1. Real Investement 1,675.2 1,189.2 1,456.5 1.399.5 1.211.5 1,617.9 1,424.9 12.9
5.1.1. CapitaL Goods 71.5 49.2 59.6 75.5 63.1 89.9 68.1 18.9
5.1.2. Construction 1,603.7 1,140.0 1,396.8 1.324.0 1,14U.4 1.528.0 1,356.8 12.9
5.2. Investement in existing assets 89.7 77.6 15.6 20.5 23.2 29.4 42.7 69.1
5.3 Firancial investement 354.2 48.1 59.5 146.3 84.3 137.7 138.3 74.6
5.4. Other capital expenditures 0.0 0.0 0.0 0.0 0.0 0.0 0.0
5.5. Minus repaynent to Province 0.0 0.0 0.0 0.0 0.0 0.0 0.0
6. TOTAL REVENUES AND GRANTS (1 t 3 * 4) 6,188.3 4,8U.6 6,214.2 6,002.3 6,090.6 7,282.0 6,104.0 11.6
7. TOTAL EXPENDITURES (2 + 5) 7,492.1 5,279.7 6,443.1 7.443.6 6,846.6 8,194.6 6,949.9 13.3
8. OVERALL DEFICITISURPLUS OR NEEDFOR FINANCING <6 7) <1,303.8) <433.1) (228.8)(1,441.3) (756.0) (912.6) (845.9) (51.3)
9. NET BORRWING <10 11) 891.7 339.8 425.2 580.7 313.1 519.9 511.8 37.9
10. FINANCING 1t045.6 448.3 488.8 601.3 419.0 642.0 607.5 34.8Use of credit 405.9 47.0 37.9 39.0 44.2 129.8 117.3 113.4Nousing Finance Fund (FONAVI) 541.1 384.0 443.4 557.6 369.4 480.3 462.6 15.5Others 53.8 2.6 0.4 0.9 1.2 1.4 10.1 194.6Fros previous exercises 44.8 14.8 7.0 3.7 4.2 30.4 17.5 87.4
11. ANORTIZATION OF THE DEBT 153.8 108.5 63.5 20.5 105.8 122.0 95.7 44.8
12. NET VARIATIO IN SHORT TERMASSETS AND LIABILITIES <e) (412.1) (93.3) 196.4 (860.6) <442.8> (392.7) (334.2) (97.6)
................. ..................... _.,
13. CURRENT ACCOUNT SURPLUS WITNOUT
GRANTS (<WN SAVING) <1 - 2) (239.8) 198.9 (1,124.6)(1.693.0) 316.6 308.9 <372.1> (t27.9)
14. CURRENT ACCWNT SURPLUS IITH RECEIPTS
OF CURRENT GRANTS (SAVING) <1 - 2 + 4 786.9 835.8 1,283.9 83.3 538.8 819.9 724.8 49.9
15. GROSS FIXED CAPITALFORMATION (5.1 - 3.1) 1,664.7 1,181.6 1,456.5 1,397.8 1209.S 1,612.8 1,420.5 12.9
.................................. .................................................................... ............. ..................... ___ _ .................
<a>includea Central Adcitnistration. Decentreliaed entities and ~eclal ecou,ts.(b)Stendard deviation/lean 1981-1966(c)Ad hoc reveue shering for 1985-1966 ws treated u re~ aherin und not es dlicertiary grants(d)Aportes det Tesoro Nacional
(e)Called "Resultadoa in Argentina.

- 176.-
ARGENTINA
PROVINCIAL GOVERNMENT FINANCE STUDY
Table 14b
PROVINCIAL REVENIJES, EXPENDITURES AND FINANCING: 1981-11986(a)
ALL PROVINCES AND MIUNICIPALITY OF BUENOS AIRES
Percent of Total Expenditures
1981 1982 1983 1984 1985 1986 1981-1986 Coefficient
Mean of Variation
(b)
x
1. CURRENT REVENUES 68.5 78.9 58.8 56.2 85.4 82.0 71.6 15.7
1.1. Provincial Sources 39.0 42.1 30.1 33.5 36.6 37.4 36.4 10.5
1.1.1. Tax 31.9 36.1 24.4 27.9 31.4 31.2 30.5 11.9
1.1.1.1. Real estate 7.2 8.3 5.4 7.4 7.9 7.0 7.2 12.7
1.1.1.2. Automobile 2.8 3.0 2.3 3.1 3.8 2.8 3.0 15.0
1.1.1.3. Turnover 15.8 18.8 13.3 14.5 16.1 17.0 15.9 11.0
1.1.1.4. Transfer (Sellos) 4.5 4.2 2.9 2.5 3.0 3.8 3.5 21.3
1.1.1.5. Others 1.6 1.7 0.5 0.5 0.7 0.6 0.9 55.9
1.1.2. Non-tax 7.1 6.0 5.8 5.5 5.1 6.1 6.0 10.4
1.2. National Sources 29.5 36.7 28.6 22.8 48.8 44.6 35.2 26.1
1.2.1. Federal Revenue Sharing (c) 25.3 29.0 19.9 15.7 39.1 35.2 27.4 29.7
1.2.2. Highway fund 2.3 2.6 2.9 2.4 3.7 3.2 2.9 17.7
1.2.3. Royalties 1.9 4.7 5.6 4.5 5.7 5.9 4.7 28.8
1.2.4 Others 0.0 0.4 0.2 0.2 0.2 0.3 0.2 54.7
1.3. Other sources of current revenues 0.0 0.0 0.0 0.0 0.0 0.0 0.0 --
2. CURRENT EXPENDITURES 71.7 75.1 76.2 79.0 80.7 78.2 76.8 3.8
2.1. Personnel 41.4 41.9 45.0 50.4 51.5 47.1 46.2 8.4
2.2. Good and services 7.6 9.2 7.6 8.3 9.4 10.5 8.8 11.8
2.3. Interest payments 0.7 0.4 0.6 0.2 0.5 0.5 0.5 34.7
2.4. Other current expenditures 0.0 0.0 0.0 0.0 0.0 0.0 0.0
2.5. Transfers 22.0 23.6 23.1 20.1 19.4 20.1 21.4 7.5
2.5.1. To municipaLities 5.2 5.6 4.4 5.7 7.1 7.3 5.9 17.2
2.5.1.1. Revenue sharing 5.2 5.6 4.3 4.6 6.2 5.9 5.3 13.2
2.5.1.2. Discretionary grants 0.0 0.0 0.1 1.2 0.3 1.3 0.6 98.0
2.5.2. To provincial enterprises 0.0 0.0 0.0 0.0 0.Q 0.0 0.0 --
2.5.3. To social security entities 0.0 0.0 11.0 8.6 4.4 4.0 4.7 87.2
2.5.4. To General Administration 0.0 0.0 0.0 0.0 0.0 0.0 0.0
2.5.5. Other 16.8 18.0 7.8 5.8 7.7 8.9 10.9 43.5
3. CAPITAL REVENUES 0.4 0.9 0.3 0.6 0.4 0.6 0.5 38.7
3.1. SetLing fixed assets 0.1 0.1 0.0 0.0 0.0 0.1 0.1 85.3
3.2. Payback of Loans 0.0 0.0 0.0 0.4 0. 0.4 0.2 105.4
3.3. Others 0.2 0.7 0.3 0.1 0.1 0.2 0.3 78.4
4. GRANTS (Current and Capital) 13.7 12.1 37.4 23.9 3.2 6.2 16.1 71.7
4.1. Discretionary Granta (d) 110.5 8.5 33.9 22.1 0.0 2.7 12.9 90.5
4.2. Regional Development Fund (FDR) 1.4 1.4 0.9 0.5 0.9 1.2 1.1 29.5
4.3. Electricity Fund (FEDEI) 0.3 0.2 0.2 0.2 O.!; 0.5 0.3 42.1
4.4. Other 1.6 1.9 2.3 1.1 1.9 1.9 1.8 21.4

- 177
ARGENTINAPROVINCIAL GOVERNMENT FINANCE STUDY
Table 14b
PROVINCIAL REVEMUES, EXPENDITURES AND FINANCING: 1981-1986(a)ALL PROVINCES ANO MUNICIPALITY OF BUENOS AIRES
Percent of Total Expenditures
<Continuation)
1981 1982 1983 1984 1985 1986 1981-1986 Coefficient
Mean of Variation(b)
X
5. CAPITAL EXPENDITURES 28.3 24.9 23.8 21.0 19.3 21.8 23.2 12.6
5.1. Real Investement 22.4 22.5 22.6 18.8 17.7 19.7 20.6 9.5
5.1.1. Capital Goods 1.0 0.9 0.9 1.0 0.9 1.1 1.0 6.5
5.1.2. Construction 21.4 21.6 21.7 17.8 16.8 18.6 19.6 10.1
5.2. Investement in existing assets 1.2 1.5 0.2 0.3 0.3 0.4 0.6 76.2
5.3 Financial investement 4.7 0.9 0.9 2.0 1.2 1.7 1.9 69.25.4. Other capitaL expenditures 0.0 0.0 0.0 0.0 0.0 0.0 0.0 --S.5. Minus repayment to Province 0.0 0.0 0.0 0.0 0.0 0.0 0.0 --6. TOTAL REVENUES AND GRANTS <1 + 3 + 4) 82.6 91.8 96.4 80.6 89.0 88.9 88.2 6.0
7. TOTAL EXPENDITURES (2 + 5) 100.0 100.0 100.0 100.0 100.0 100.0 100.0 0.08. OVERALL DEFICIT/SURPLUS OR NEED
FOR FINANCING (6 - 7) (17.4) (8.2) (3.6) (19.4) (11.0) (11.1) (11.8) (45.3)
9. NET BORROWING (10 - 11) 11.9 6.4 6.6 7.8 4.6 6.3 7.3 31.2
1O. FINANCING 14.0 8.5 7.6 8.1 6.1 7.8 8.7 28.5
Use of credit 5.4 0.9 0.6 0.5 0.6 1.6 1.6 108.2
Housing Finance Fuwd (FONAVI) 7.2 7.3 6.9 7.5 5.4 5.9 6.7 11.7
Others 0.7 0.0 0.0 0.0 0.0 0.0 0.1 190.3
From previous exercises 0.6 0.3 0.1 0.0 0.1 0.4 0.2 80.4
11. AIORTIZATION OF THE DEBT 2.1 2.1 1.0 0.3 1.5 1.5 1.4 44.412. NET VARIATION IN SHORT TERM
ASSETS AND LIABILITIES (e) (5.5) (1.8) 3.0 (11.6) (6.5) (4.8) (4.5) (98.9)
13. CURRENT ACCOUNT SURPLUS WITHWJTGRANTS (OWN SAVING) (1 - 2) (3.2) 3.8 (17.5) (22.7) 4.6 3.8 <5.2) (210.3)
14. CttRRENT ACCOUNT SURPLUS WITH RECEIPTOF CURRENT GRANTS (SAVING) (1 - 2 + 4 10.5 15.8 19.9 1.1 7.9 10.0 10.9 54.6
15. GROSS FIXED CAPITALFORHATION (5.1 - 3.1) 22.2 22.4 22.6 18.8 17.7 19.7 20.6 9.4
(a)Znctudes Central Aduinistration, Decentralized entities and special accounts.
(b)Standard deviation/Mean 1981-1986
(c)Ad hoc revenue sharing for 1985-1986 was treated as revenue sharing and not as discretionary grants
(d)Aportes deL Tesoro Nacionalte)CaLled "ResuLtado" in Argentina.

- 178 -
IV. PROVINCIAlL GOVERNMENT FINANCE INDICATORS BYPROVINCIAL GRtOUP AND PROVINCE: 1981-1986

- 179 -
ARGENTINA
PROVINCIAL GOVERNMENT FINANCE STUDY
Table 15aTotaL Revenues by Provincial Group and Province: 1981-1986
MiLLions of US$ of juLy 1988
Groups 1981 1982 1983 1984 1985 1986 Mean Coefficient
Provinces 1981-86 of Variation
(a)
TOTAL 6,188.3 4,846.6 6,214.2 6,002.3 6,090.6 7,282.0 5,868.4 12.0ADVANCED 3,678.4 2,865.8 3,462.2 3,4Z0.8 3,380.1 4,099.4 3,361.5 11.0Federal Capital 776.9 539.7 475.5 586.5 660.2 813.8 607.8 20.1Buenos Aires 1,630.5 1,370.4 1,667.5 1,637.2 1,476.1 1,799.9 1,556.3 8.9
Cordoba 453.8 351.7 448.9 451.6 456.8 530.8 432.6 12.0
Mendoza 317.5 231.7 297.8 243.3 261.3 341.8 270.3 14.8
Santa Fe 499.6 372.3 572.5 502.2 525.7 613.1 494.4 15.2
LOW DENSITY 556.9 535.9 722.1 646.6 746.3 915.2 641.6 19.9
Chubut 120.6 113.1 160.7 105.1 123.0 162.9 124.5 18.1La Pampa 89.8 70.8 96.4 89.5 112.7 124.2 91.9 18.8Neuquen 120.5 118.6 171.0 185.3 205.8 258.5 160.2 30.3Rio Negro 134.1 125.4 148.8 140.3 161.7 188.9 142.1 14.7Santa Cruz 92.0 107.9 145.1 126.5 143.2 180.6 122.9 23.2
INTERMEDIATE 790.5 639.7 894.0 870.9 894.9 1,031.5 818.0 14.6
Entre Rios 180.2 159.2 243.9 262.1 228.0 282.2 214.7 20.3
Salta 186.9 154.0 193.5 192.8 205.2 247.3 186.5 14.8
San Juan 154.4 113.3 184.4 140.9 149.7 170.3 148.5 15.1San Luis 86.2 60.2 73.9 80.6 90.7 93.1 78.3 14.3Tucuman 182.8 153.1 198.4 194.6 221.2 238.7 190.0 14.3
UNDERDEVELOPED 1,162.5 805.2 1,135.9 1,063.9 1,069.3 1,235.9 1,047.4 12.9Catamarca 94.4 70.1 95.3 92.0 109.2 107.4 92.2 13.9
Chaco 308.6 159.4 210.3 192.3 185.3 207.9 211.2 22.2
Corrientes 175.2 109.8 157.0 142.2 143.3 180.2 145.5 16.1
Formosa 111.4 95.5 146.3 130.6 124.0 154.3 121.5 16.4
Jujuy 121.1 87.2 130.1 126.5 129.2 140.4 118.8 14.1
La Rioja 70.4 56.4 74.6 72.5 85.6 116.7 71.9 26.1
Misiones 128.4 104.5 151.6 154.3 140.0 158.3 135.8 13.7
Santiago del Estero 153.1 122.4 170.8 153.4 152.8 170.7 150.5 10.7
(a)Standard deviation/mean 1981-1986

- 180-
ARGENTINA
PROVINCIAL GOVERNMENT FINANCE STUDY:
Table 15b
Total Revenues by Provincial Group and Province: 1981-1986
X Of Gross ProvinciaL Product
Groups 1981 1982 1983 1984 1985 1986 Mean Coefficient
Provinces 1981-86 of Variation
(a>
TOTAL 10.8 8.7 10.6 10.0 10.3 11.6 8.9 17.8
ADVANCED 8.1 6.6 7.5 7.2 7.3 8.3 6.1 26.4
Federal CapitaL 5.4 4.1 3.5 4.2 4.9 5.6 6.3 29.1
Buenos Aires 8.6 7.6 8.5 8.1 7.4 8.4 9.2 13.8
Cordoba 11.0 8.7 10.1 10.0 10.2 11.4 11.1 17.6
Mendoza 16.2 10.0 12.2 10.1 9.9 13.6 10.4 23.4
Santa Fe 8.9 6.6 10.1 8.1 9.2 10.0 8.8 13.6
LOW DENSITY 15.3 14.9 19.3 17.2 19.4 22.9 16.3 19.6
Chubut 12.9 12.9 17.9 11.5 13.9 17.5 15.7 14.9
La Pampa 18.8 14.8 17.4 15.4 16.9 18.2 18.0 21.6
Neuquen 12.6 13.3 18.8 20.1 22.6 27.2 17.5 23.5
Rio Negro 16.1 13.3 15.3 15.2 16.5 18.5 24.0 40.9
Santa Cruz 21.1 26.1 35.1 30.8 35.9 44.5 32.3 23.1
INTERMEDIATE 16.5 13.1 18.1 17.4 17.7 19.4 17.6 15.9
Entre Rios 14.4 13.2 19.8 20.9 18.7 22.3 18.6 14.4
Salta 20.4 15.l3 19.5 19.1 18.5 21.2 22.9 20.9
San Juan 26.9 21.2 33.5 26.5 25.3 27.3 22.8 23.2
San Luis 20.2 12.!i 17.6 18.7 21.8 21.6 15.1 29.0
Tucuman 11.2 9.1 11.3 10.9 12.9 13.1 11.4 11.7
UNDERDEVELOPED 30.7 20.3 29.2 26.8 27.4 30.5 31.3 17.6
Catamarca 41.4 29.1[ 37.0 29.4 37.8 35.5 34.3 19.5
Chaco 51.1 25.3 34.5 29.9 29.1 31.6 26.1 37.0
Corrientes 21.4 13.59 19.5 17.3 18.1 21.9 33.6 47.9
Formosa 40.4 36.6 55.1 50.6 49.4 59.6 33.8 47.4
Jujuy 18.9 13.3 20.6 20.0 19.9 20.7 34.3 50.8La Rioja 44.2 36.3 47.0 44.9 54.0 71.9 36.5 42.6
Misiones 23.1 16.9 24.3 25.2 24.1 26.1 25.8 16.8
Santiago del Estero 30.3 19.7 32.0 29.2 28.1 30.3 14.1 102.0
(a)Standard deviation/mean 1981-1986

- 181 --
ARGENTINA
PROVINCIAL GOVERNMENT FINANCE STUDY
Table 15c
Total Revenues by Provincial Group and Province: 1981-1986
USS of July 1988 per capita
Groups 1981 1982 1983 1984 1985 1986 Mean Coefficient
Provinces 1981-86 of Variation
(a)
TOTAL 217.6 167.3 210.7 199.7 198.9 233.5 198.9 10.2
ADVANCED 182.2 139.7 166.0 161.3 156.7 186.9 161.2 9.8
Federal Capital 266.3 185.3 163.5 202.0 227.8 281.3 209.0 20.2
Buenos Aires 146.9 120.8 143.9 138.3 122.1 145.7 134.4 8.1
Cordoba 185.6 141.6 177.9 176.2 175.5 200.8 171.4 10.4
Mendoza 260.0 185.9 234.0 187.3 197.0 252.4 212.8 14.4
Santa Fe 199.7 146.7 222.4 192.3 198.4 228.1 191.9 13.7
LOU DENSITY 443.4 412.2 536.5 464.1 517.4 612.8 474.7 14.0
Chubut 443.5 402.9 554.0 350.7 397.1 509.1 429.6 16.2
La Pampa 423.0 327.3 437.3 398.3 492.0 531.9 415.6 15.8
Neuquen 472.0 443.9 611.6 633.1 671.8 806.5 566.5 21.6
Rio Negro 336.9 303.4 346.6 314.5 349.0 392.8 330.1 8.7
Santa Cruz 776.1 882.5 1,150.5 972.6 1,067.8 1,306.1 969.9 17.9
INTERMEDIATE 240.4 190.8 261.4 249.7 251.5 284.3 238.8 11.9
Entre Rios 196.2 171.4 259.6 275.8 237.3 290.4 228.1 18.6
Salta 274.6 220.4 269.8 261.8 271.5 318.6 259.6 11.0
San Juan 325.0 233.9 373.4 279.9 291.9 325.6 300.8 14.5
San Luis 396.0 271.9 328.7 353.2 391.4 395.4 348.3 13.0
Tucuman 183.5 150.0 189.9 181.9 201.8 212.6 181.4 10.8
UNDERDEVELOPED 313.8 212.6 293.4 268.8 264.3 298.8 270.6 12.1
Catamarca 446.0 325.0 433.9 411.2 478.8 462.4 419.0 11.9
Chaco 430.7 217.7 281.2 251.7 237.4 260.8 283.7 24.7
Corrientes 260.6 160.8 226.3 201.8 200.0 247.6 209.9 15.8
Formosa 367.6 307.9 460.8 401.8 372.7 453.1 382.2 13.8
Jujuy 286.4 200.1 289.5 273.2 270.6 285.2 264.0 11.7
La Rioja 420.9 330.7 429.2 409.7 474.8 635.4 413.1 22.6
Misiones 212.0 167.6 236.3 233.8 -206.2 226.5 211.2 11.0
Santiago del Estero 252.6 198.4 271.8 239.7 234.3 257.1 239.4 9.6
<a>Standard deviation/mean 1981-1986

- 182 -
ARGENTINA
PROVINCIAL GOVERNMENT FINANCE STUDY
Table 16a
Own-Sources Revenes by Provincial Group and Province: 1981-1986
lilUions of USS of july 1988
Groups 1981 1982 1983 1984 1985 1986 Mean Coefficient
Provinces 1981-86 of Variation
(a)
TOTAL 2,951.6 2,269.6 1,961.4 2,532.5 2,526.7 3,115.6 2,448.4 15.9
ADVANCED 2,355.9 1,840.5 1,560.7 2,057.5 2,022.3 2,452.7 1,967.4 15.2
Federal CapitaL 727.6 505.8 338.0 523.9 602.1 754.2 539.5 26.2
Buenos Aires 1,024.8 881.2 837.0 1,086.2 931.0 1,084.4 952.0 10,2
Cordoba 236.7 168.1 137.6 173.5 177.8 218.9 178.7 18.5
Mendoza 119.2 94.6 54.0 65.8 78.9 108.2 82.5 27.8
Santa Fe 247.6 190.7 194.0 208.1 232.5 287.0 214.6 15.7
LOW DENSITY 127.6 111.6 104.1 101.0 137.4 186.1 116.3 24.9Chubut 26.7 23.5 19.5 18.4 23.0 32.9 22.2 21.7
La Pampa 2-.5 18.6 19.4 16.9 25.6 33.6 20.8 27.0
Neuquen 295.4 23.0 30.8 28.3 37.3 52.6 29.8 31,9
Rio Negro 35.5 38.5 26.2 24.1 32.8 46.3 31.4 23.7
Santa Cruz 12.5 8.0 8.3 13.4 18.7 20.7 12.2 39.2
INTERMEDIATE 234.5 171.8 155.3 221.6 227.0 ;286.7 202.0 21.3
Entre Rios 695.7 54.2 55.9 103.9 73.1 104.6 71.4 28.7
SaLta 61.5 44.0 36.9 50.0 57.4 73.1 50.0 23.7
San Juan 25.2 18.4 17.9 16.3 19.8 26.0 19.5 18.9
San Luis 13.9 9.5 7.0 5.8 13.1 16.0 9.9 37.8
Tucuian 64.2 45.6 37.6 45.6 63.6 66.9 51.3 22.1
UNDERDEVELOPED 233.6 145.8 141.3 152.4 140.1 190.1 162.6 21.0
Catamarca 14.7 10.1 8.8 3.7 8.7 11.1 9.2 35.5
Chaco 46.8 28.4 27.8 32.5 26.5 34.8 32.4 21.3
Corrientes 54.4 28.5 30.3 25.0 17.4 25.7 31.1 37.1
Formosa 18.5 16.5 12.1 12.2 9.1 12.5 13.7 22.8
Jujuy 32.0 19.9 20.8 30.0 28.4 32.0 26.2 19.0
La Rioja 8.9 6.4 6.2 5.0 6.9 11.4 6.7 31.7
Misiones 33.0 20.9 22.3 25.3 23.3 31.9 25.0 18.7
Santiago del Estero 25.4 15.1 13.1 18.7 19.8 30.6 18.4 32.4
(a)Standard deviatlon/~ean 1981-1986

- 183 -
ARGENTINA
PROVINCIAL GOVERNNENT FINANCE STUDY
Table 16b
Own-Sources Revenues by Provincial Group and Province: 1981-1986
% Of Grosa ProvinciaL Product
Grous 1981 1982 1983 1984 1985 1986 Mean Coefficient
Provinces 1981-86 of Varlation
TOTAL 5.1 4.1 3.4 4.2 4.3 5.0 4.2 14.0
ADVANCED 5.2 4.3 3.4 4.3 4.4 5.0 4.3 13.4
Federal Capitat 5.0 3.8 2.5 3.7 4.4 5.1 3.9 23.0
Buenos Aires 5.4 4.9 4.2 5.4 4.6 5.1 4.9 8.1
Cordoba 5.7 4.1 3.1 3.9 4.0 4.7 4.2 19.5
Mendoza 6.1 4.1 2.2 2.7 3.0 4.3 3.6 35.3
Santa Fe 4.4 3.4 3.4 3.4 4.1 4.7 3.7 14.4
LOW DENSITY 3.5 3.1 2.8 2.7 3.6 4.7 3.1 21.0
Chubut 2.8 2.7 2.2 2.0 2.6 3.5 2.5 19.9
La Panpa 4.9 3.9 3.5 2.9 3.8 4.9 3.8 19.1
Neuquen 3.1 2.6 3.4 3.1 4.1 5.5 3.2 29.9
Rio Negro 4.3 4.1 2.7 2.6 3.4 4.5 3.4 22.1
Santa Cruz 2.9 1.9 2.0 3.3 4.7 5.1 3.0 41.1
INTERNEDIATE 4.9 3.5 3.1 4.4 4.5 5.4 4.1 18.8
Entre Rios 5.6 4.5 4.5 8.3 6.0 8.3 5.8 27.2
SaLta 6.7 4.5 3.7 5.0 5.2 6.3 5.0 20.1
San Juan 4.4 3.4 3.3 3.1 3.4 4.2 3.5 14.0
San Luis 3.3 2.0 1.7 1.4 3.2 3.7 2.3 39.1
Tucumen 3.9 2.7 2.1 2.6 3.7 3.7 3.0 22.6
UNDERDEVELOPED 6.2 3.7 3.6 3.8 3.6 4.7 4.2 22.2
Catamarca 6.5 4.2 3.4 1.2 3.0 3.7 3.7 42.7
Chaco 7.7 4.5 4.6 5.1 4.2 5.3 5.2 22.9
Corrientes 6.6 3.6 3.7 3.0 2.2 3.1 3.8 36.3
Formosa 6.7 6.3 4.5 4.7 3.6 4.8 5.2 20.5
Jujuy 5.0 3.0 3.3 4.7 4.4 4.7 4.1 18.4
La Rioja 5.6 4.1 3.9 3.1 4.3 7.0 4.2 30.5
Misiones 5.9 3.4 3.6 4.1 4.0 5.3 4.2 21.7Santiago del Estero .5.0 2.4 2.5 3.5 3.7 5.4 3.4 33.7
(a)Standard deviationJlean 1981-1986

- 1.84 -
ARGENTINA
PROVINCIAL GOVERNMENT FINANCE STUDY
TabLe 16c
Own-Sources Revenues by ProvinciaL Group and Province: 1981-1986
US$ of JuLy 1988 per capita
Groups 1981 1982 1983 1984 1985 19136 Mean CoefficientProvinces 1981-86 of Variation
(a)
X
TOTAL 103.8 7B.4 66.5 84.3 82.5 99.9 83.1 15.3ADVANCED 116.7 8;9.7 74.8 97.0 93.8 111.8 94.4 14.8Federal CapitaL 249.4 175.7 116.2 180.4 207.8 260.7 185.5 26.3
Buenos Aires 92.3 77.7 72.3 91.8 77.0 87.8 82.2 9.5Cordoba 96.8 67.7 54.6 67.7 68.3 82.8 71.0 18.9
Mendoza 97.6 75.9 42.4 50.6 59.5 79.9 65.2 28.8
Santa Fe 99.0 715.2 75.4 79.7 87.7 106.8 83.4 14.4
LOW DENSITY 101.6 85.8 77.4 72.5 95.2 124.6 86.5 20.0
Chubut 98.2 83.6 67.1 61.4 74.4 102.9 76.9 19.9
La Pampa 110.5 85.6 87.9 75.3 111.6 143.8 94.2 24.1
Neuquen 115.4 8&.1 110.0 96.6 121.7 164.0 106.0 23.3
Rio Negro 89.1 93.1 61.0 54.0 70.9 96.2 73.6 22.2
Santa Cruz 105.7 65.6 65.6 102.8 139.3 149.7 95.8 33.8
INTERMEDIATE 71.3 51.2 45.4 63.5 63.8 79.0 59.1 19.2Entre Rios 75.8 58.3 59.5 109.3 76.1 107.7 75.8 27.1
Salta 90.3 63.0 51.4 68.0 75.9 94.3 69.7 21.5
San Juan 53.1 318.0 36.3 32.4 38.6 49.7 39.7 18.7
San Luis 64.0 42.9 31.1 25.5 56.6 68,2 44.0 36.5
Tucuman 64.5 44.7 36.0 42.6 58.0 59.6 49.2 21.0
UNDERDEVELOPED 63.1 31.5 36.5 38.5 34.6 46,0 42.2 23.0
Catamarca 69.5 46.8 40.0 16.7 38.3 47.7 42.2 36.9
Chaco 65.3 311.8 37.1 42.5 33.9 43.7 43.5 23.6
Corrientes 81.0 411.7 43.6 35.5 24.3 35.4 45.2 39.4
Formosa 61.1 53.4 38.0 37.5 27.4 36.7 43.5 26.1
Jujuy 75.6 45.7 46.2 64.7 59.4 65.0 58.3 18.3La Rioja 53.1 37.5 35.7 28.2 38.0 62.0 38.5 29.8Misiones 54.4 33.5 34.8 38.4 34.4 45.7 39.1 19.4Santiago deL Estero 41.9 24.5 20.8 29.2 30.4 46.1 29.4 30.7
(a)Standard deviat -ean 1981-1986

- 185 -
ARGENTINA
PROVINCIAL GOVERNMENT FINANCE STUDY
Table 16d
Own-Sources Revenues by Provincial Group and Province: 1981-1986
X Of Total Revenues
Groups 1981 1982 1983 1984 1985 1986 Mean Coefficient
Provinces 1981-86 of Variation
(a)
TOTAL 47.7 46.8 31.6 42.2 41.5 42.8 42.0 12.5
ADVANCED 64.0 64.2 45.1 60.1 59.8 59.8 58.7 11.0
Federal Capital 93.7 93.7 71.1 89.3 91.2 92.7 87.8 9.1
Buenos Aires 62.8 64.3 50.2 66.3 63.1 60.2 61.4 8.5
Cordoba 52.2 47.8 30.7 38.4 38.9 41.2 41.6 16.6
Mendoza 37.6 40.8 18.1 27.0 30.2 31.7 30.7 23.8
Santa Fe 49.6 51.2 33.9 41.4 44.2 46.8 44.1 13.0
LOU DENSITY 22.9 20.8 14.4 15.6 18.4 20.3 18.4 16.1
Chubut 22.1 20.8 12.1 17.5 18.7 20.2 18.3 17.8
La Pmpa 26.1 26.2 20.1 18.9 22.7 27.0 22.8 13.9
Neuquen 24.4 19.4 18.0 15.3 18.1 20.3 19.0 14.7
Rio Negro 26.4 30.7 17.6 17.2 20.3 24.5 22.4 21.8
Santa Cruz 13.6 7.4 5.7 10.6 13.0 11.5 10.1 28.5
INTERMEDIATE 29.7 26.9 17.4 25.4 25.4 27.8 24.9 15.6
Entre Rios 38.7 34.0 22.9 39.6 32.1 37.1 33.5 16.8
Salta 32.9 28.6 19.1 26.0 27.9 29.6 26.9 15.8
San Juan 16.3 16.3 9.7 11.6 13.2 15.3 13.4 18.4
Scn Luis 16.2 15.8 9.5 7.2 14.5 17.2 12.6 29.4
Tucumn 35.1 29.8 18.9 23.4 28.7 28.0 27.2 18.7
UNDERDEVELOPED 20.1 18.1 12.4 14.3 13.1 15.4 15.6 17.4
Catnamrca 15.6 14.4 9.2 4.1 8.0 10.3 10.2 37.8
Chaco 15.2 17.8 13.2 16.9 14.3 16.8 15.5 10.4
Corrientes 31.1 25.9 19.3 17.6 12.1 14.3 21.2 31.0
Formosa 16.6 17.3 8.2 9.3 7.4 8.1 11.8 35.3
Jujuy 26.4 22.8 16.0 23.7 22.0 22.8 22.2 14.2
La Rioja 12.6 11.3 8.3 6.9 8.0 9.8 9.4 21.0
MIsiones 25.7 20.0 14.7 16.4 16.7 20.2 18.7 19.2
Santiago del Estero 16.6 12.3 7.7 12.2 13.0 17.9 12.3 26.9
(a)Standard deviationrmean 1981-1986

186 -
ARGENTINA
PROVINCIAL GOVERNMENT FINANCE STUDY
Table l7a
Reveanu fron National Sources by Provincial Group and Province:1981-1986
M4 LLiona of USS of JuLy 1988
Groipe 1981 1982 1983 1984 1985 1986 Mean Coefffcfent
Prov-nces 1981-86 of Varístion
TOTAL 3,236.6 2,577.0 4,252.9 3,469.8 3,563.9 4,166.4 3,420.0 16.6
ADVANCED 1,322.5 1,025.3 1,901.5 1,363.4 1,357.8 1,646.7 1,394.1 19.7
Federal Capital 49.3 33.8 137.5 62.6 58.1 59.6 68.3 48.3
Buenos Aires 605.7 489.2 830.5 551.0 545.1 715.6 604.3 19.2
Cordlba 217.2 183.6 311.3 278.1 279.0 311.9 253.8 18.8
endoza 198.3 137.1 243.8 177.6 182.4 233.6 187.8 19.1
Santa Fe 252.0 181.6 378.4 294.1 293.2 326.1 279.9 21.8
LOW DENSITY 429.3 424.3 618.0 545.6 608.9 729.1 525.2 20.6
Chubut 93.9 89.7 141.3 86.7 99.9 130.0 102.3 20.5
La Poapa 66.3 52.2 77.1 n7.6 87.2 90.7 71.1 18.1
Neuquen 91.0 95.6 140.2 157.0 168.5 205.d 130.5 30.9
Río Negro 98.6 86.9 122.6 116.2 128.8 142.7 110.6 16.8
Santa Cruz 79.5 99.9 136.8 113.1 124.5 159.9 110.7 23.3
INTERMEDIATE 556.0 468.0 738.7 649.3 667.9 744.11 616.0 16.0
Entre Ríos 110.5 105.0 188.0 158.2 154.9 177.6 143.3 21.8
Salte 125.4 109.9 156.6 142.7 147.9 174.11 136.5 15.2
San Juan 129.2 94.9 166.4 124.5 129.9 144.3 129.0 16.7
Sen Luis n.3 50.7 66.9 74.8 77.6 77.1 68.4 13.6
Tucrun 118.5 107.5 160.8 149.0 157.6 171.8 138.7 16.8
UNDERDEVELOPED 928.8 659.4 994.7 911.5 929.1 1,045.8 884.7 13.8
Csta crca 79.7 60.0 86.5 88.3 100.5 96.4 83.0 15.8
Chaco 261.8 130.9 182.5 159.8 158.8 173.1 178.8 22.8
Corrientes 120.7 81.3 126.8 117.2 125.9 154.4 114.4 18.8
Formosa 92.8 78.9 134.2 118.4 114.9 141.8 107.8 20.3
Jujuy 89.1 67.3 109.3 96.5 100.8 108.4 92.6 15.4
La Rioja 61.5 50.0 68.3 67.5 78.7 105.3 65.2 26.4
NIsion s 95.5 83.6 129.3 129.0 116.7 126.3 110.8 16.0
Santiago del Estero 127.7 107.3 157.7 134.8 132.9 140.1 132.1 11.4.................................................................................................
<*)$t~adrd devictionJ"e n 1981-19%9

- 187 -
ARGENTINA
PROVINCIAL GOVERNMENT FINANCE STUDY
Table 17b
Revenues fron National Sources by Provincial Group and Province:1981-1986
X Of Gross Provincial Product
Groups 1981 1982 1983 1984 1985 1986 Mean Coefficient
Provinces 1981-86 of Variation
(a)
TOTAL 5.6 4.6 7.3 5.8 6.0 6.6 5.9 14.1
ADVANCED 2.9 2.4 4.1 2.9 2.9 3.3 3.1 17.9
FederaL Capital 0.3 0.3 1.0 0.4 0.4 0.4 0.5 49.3
Buenos Aires 3.2 2.7 4.2 2.7 2.7 3.4 3.1 17.2
Cordoba 5.3 4.5 7.0 6.2 6.2 6.7 5.8 14.4
Mendoza 10.1 5.9 10.0 7.4 6.9 9.3 8.1 20.0
Santa Fe 4.5 3.2 6.7 4.7 5.1 5.3 4.8 21.2
LOW DENSITY 11.8 11.8 16.5 14.5 15.9 18.3 14.1 16.9
Chubut 10.0 10.2 15.8 9.5 11.3 13.9 11.4 20.1
La Pawpa 13.9 10.9 13.9 12.5 13.1 13.3 12.9 7.9
Neuquen 9.6 10.7 15.5 17.0 18.5 21.7 14.2 29.7
Rio Negro 11.9 9.2 12.6 12.6 13.2 14.0 11.9 12.6
Santa Cruz 18.3 24.2 33.1 27.6 31.2 39.4 26.9 25.0
INTERMEDIATE 11.6 9.6 14.9 13.0 13.2 14.0 12.5 13.9
Entre Rios 8.8 8.7 15.2 12.6 12.7 14.0 11.6 21.3
SaLta 13.7 11.3 15.8 14.1 13.3 14.9 13.6 10.3
San Juan 22.5 17.7 30.3 23.5 22.0 23.2 23.2 15.9
San Luis 16.9 10.6 15.9 17.4 18.7 17.8 15.9 16.8
Tucuman 7.3 6.4 9.2 8.4 9.2 9.5 8.1 13.9
UNDERDEVELOPED 24.5 16.6 25.6 23.0 23.8 25.8 22.7 13.7
Catamarca 35.0 24.9 33.6 28.2 34.8 31.8 31.3 11.7
Chaco 43.3 20.8 30.0 24.9 24.9 26.3 28.8 25.1
Corrientes 14.7 10.3 15.7 14.3 15.9 18.7 14.2 17.7
Formosa 33.7 30.2 50.6 45.9 45.8 54.8 41.2 21.3
Jujuy 13.9 10.3 17.3 15.3 15.6 16.0 14.5 15.5
La Rioja 38.6 32.2 43.1 41.8 49.6 64.9 41.1 25.1
Misiones 17.2 13.6 20.7 21.1 20.1 20.9 18.5 14.8
Santiago del Estero 25.3 17.2 29.5 25.6 24.5 24.9 24.4 14.9
(a)Standard deviation/mean 1981-1986

- 188 -
ARGENTINA
PROVINCIAL GOVERNMENT FINANCE STUDY
Table 17c
Revenues fron National Sources by Provincial Group and Province:1981-1986
U:S$ of July 1988 per capita
Groups 1981 1982 1983 1984 1985 19136 Mean Coefficient
Provinces 1981-86 of Variation
(a)
TOTAL 113.8 859.0 144.2 115.5 116.4 133.6 115.8 14.9
ADVANCED 65.5 50.0 91.1 64.3 63.0 75.1 66.8 18.9
Federal Capital 16.9 11.6 47.3 21.6 20.0 20.6 23.5 48.3
Buenos Aires 54.6 43.1 71.7 46.6 45.1 57.9 52.2 18.8
Cordoba 88.8 73.9 123.4 108.5 107.2 118.0 100.4 17.0
Mendoza 162.4 11c.0 191.6 136.7 137.5 172.5 147.6 18.2
Santa Fe 100.8 71.6 147.0 112.6 110.7 121.3 108.5 20.8
LOW DENSITY 341.8 326.4 459.2 391.6 422.2 488.2 388.2 15.1
Chubut 345.3 319.3 486.9 289.3 322.7 406.1 352.7 18.8
La Papa 312.5 241.5 349.4 323.0 380.5 388.1 321.4 15.3Neuquen 356.6 357.8 501.5 536.6 550.1 642.4 460.5 22.5Rio Negro 247.8 210.3 285.6 260.5 278.2 296.6 256.5 11.1
Santa Cruz 670.3 816.9 1,084.9 869.8 928.5 1,156.14 874.1 18.6
INTERMEDIATE 169.1 139.6 216.0 186.1 187.7 205.3 179.7 13.8
Entre Rios 120.3 113.1 200.1 166.5 161.2 182.7 152.2 20.6
Salta 184.3 157,4 218.4 193.8 195.6 224.4 189.9 11.7
San Juan 272.0 195.9 337.1 247.5 253.2 275.9 261.1 16.1San Luis 332.0 229.0 297.7 327.7 334.8 327.3 304.2 12.3Tucuman 119.0 105.3 153.9 139.3 143.8 153.tl 132.3 13.5
UNDERDEVELOPED 250.7 174.1 256.9 230.3 229.6 252.8 228.3 12.3
Catamarca 376.5 278.2 393.9 394.5 440.5 414.7 376.7 13.5
Chaco 365.3 178.9 244.1 209.2 203.5 217.1 240.2 25.3
Corrientes 179.6 119.1 182.7 166.3 175.8 212.2 164.7 16.9
Formosa 306.5 254.5 422.7 364.2 345.3 416.4 338.7 17.4Jujuy 210.8 154.5 243.3 208.5 211.1 220.2 205.6 13.0La Rioja 367.8 293.2 393.5 381.5 436.8 573.4 374.6 22.8Misiones 157.6 134.1 201.5 195.4 171.8 180.8 172.1 13.3Santiago del Estero 210.7 173.9 251.0 210.6 203.9 211.0 210.0 10.7
ta)Standard deviation/mean 1981-1986

- 189 -
ARGENTINA
PROVINCIAL GOVERNMENT FINANCE STUDY
Table 17d
Revenues fron National Sources by Provincial Group and Province:1981-1986
X of Total Revenues
Groups 1981 1982 1983 1984 1985 1986 Mean Coefficient
Provinces 1981-86 of Variation
(a)
TOTAL 52.3 53.2 68.4 57.8 58.5 57.2 58.0 9.1
ADVANCED 36.0 35.8 54.9 39.9 40.2 40.2 41.3 15.6
Federal Capital 6.3 6.3 28.9 10.7 8.8 7.3 12.2 65.4
Buenos Aires 37.2 35.7 49.8 33.7 36.9 39.8 38.6 13.5
Cordoba 47.8 52.2 69.3 61.6 61.1 58.8 58.4 11.8
Mendoza 62.4 59.2 81.9 73.0 69.8 68.3 69.3 10.6
Santa Fe 50.4 48.8 66.1 58.6 55.8 53.2 55.9 10.3
LOW DENSITY 77.1 79.2 85.6 84.4 81.6 79.7 81.6 3.6
Chubut 77.9 79.2 87.9 82.5 81.3 79.8 81.7 4.0
La Pampa 73.9 73.8 79.9 81.1 77.3 73.0 77.2 4.1
Neuquen 75.6 80.6 82.0 84.7 81.9 79.7 81.0 3.5
Rio Negro 73.6 69.3 82.4 82.8 79.7 75.5 77.6 6.3
Santa Cruz 86.4 92.6 94.3 89.4 87.0 88.5 89.9 3.2
INTERMEDIATE 70.3 73.1 82.6 74.6 74.6 72.2 75.1 5.2
Entre Rios 61.3 66.0 77.1 60.4 67.9 62.9 66.5 8.4
Salta 67.1 71.4 80.9 74.0 n7.1 70.4 73.1 5.8
San Juan 83.7 83.7 90.3 88.4 86.8 84.7 86.6 2.8
San Luis 83.8 84.2 90.5 92.8 85.5 82.8 87.4 4.3
Tucuman 64.9 70.2 81.1 76.6 71.3 72.0 n.8 7.0
UNDERDEVELOPED 79.9 81.9 87.6 85.7 86.9 84.6 84.4 3.2
Catamarca 84.4 85.6 90.8 95.9 92.0 89.7 89.8 4.3
Chaco 84.8 82.2 86.8 83.1 85.7 83.2 84.5 1.9
Corrientes 68.9 74.1 80.7 82.4 87.9 85.7 78.8 8.3
Formosa 83.4 82.7 91.8 90.7 92.6 91.9 88.2 4.7
Jujuy 73.6 77.2 84.0 76.3 78.0 77.2 77.8 4.0
La Rioja 87.4 88.7 91.7 93.1 92.0 90.2 90.6 2.2
Misiones 74.3 80.0 85.3 83.6 83.3 79.8 81.3 4.4
Santiago del Estero 83.4 87.7 92.3 87.8 87.0 82.1 87.7 3.8
(a)Standard deviation/mean 1981-1986

190 -
ARGENTINA
PROVIIICIAL GOVERNMENT FINANCE STUDY
Tabte 17e
Revenues fron Nati>nal Sources by Provincial Group and Provirnce:1981-1986
7: of Total Expenditures
-- - - - - - - - - - - - - - - - -- - - - - - - - - - - - - - - - - - 1... . ... ....... . . . . . .
Gro44ps 1981 1982 1983 1984 1985 1986 Mean Coefficient
Provinces 1981-86 of Variation
(Ce)
TOTAL 43.2 48.8 66.0 46.6 52.1 50.8 51.3 14.0
ADVANCED 29.8 33.9 54.8 33.7 37.0 37.7 37.8 21.2
Federal Capital 6.0 5.7 25.9 7.9 9.6 8.7 11.0 63.3
Buenos Aires 30.3 35.9 50.8 31.3 32.6 37.0 36.2 19.0
Cordoba 38.5 47.4 69.4 52.1 52.6 51.0 52.0 17.6
Mendoza 42.2 53.2 82.4 59.3 64.2 56.3 60.3 20.3
Santa Fe 42.9 42.6 67.8 44.5 50.3 45.5 49.6 17.7
LOW DENSITY 61.6 69,.0 77.1 67.1 71.3 68.8 69.2 6.7
Chubut 66.6 69.6 96.8 75.2 65.2 70.2 74.7 14.3
La Pampa 63.2 64.2 62.2 65.8 68.3 62.59 64.7 3.2
Neuquen 60.2 66.8 73.9 67.5 78.6 75.0 69.4 8.8
Rio Negro 56.7 57.5 68.6 60.7 67.7 56.7 62.3 8.1
Santa Cruz 62.9 90.3 83.9 69.3 73.9 78.2 76.1 11.9
INTERMEDIATE 58.3 67.8 80.7 58.5 67.4 59.9 66.5 11.8
Entre Rios 46.9 63.2 75.7 56.4 67.0 58.6 61.8 14.5
Salta 58.5 68.4 74.6 51.6 56.6 47.9 61.9 14.9
San Juan 71.2 75.9 90.7 65.3 81.0 72.5 76.8 10.5
San Luis 74.5 77.9 86.8 66.2 83.0 71.6 77.7 8.9
Tucuran 52.6 61.9 81.8 59.8 64.4 63.4 64.1 13.8
UNDERDEVELOPED 66.2 69.7 79.1 61.7 69.8 68.5 69.3 7.5
Catamarca 78.1 79.U 90.0 71.9 71.8 76.1 78.2 7.8
Chaco 69.4 74.1 84.0 69.2 72.2 65.9 73.8 7.8
Corrientes 57.0 48.8 63.7 46.3 57.2 63.6 54.6 12.2
fomosa 66.4 69.4 74.1 62.1 74.6 n.3 69.3 6.4
Jujuy 61.4 67.4 78.3 49.2 64.2 65.9 64.1 13.4
La Rioja 66.3 77.8 76.2 65.9 69.0 65.2 71.0 7.1
Misiones 61.0 75.EI 80.8 63.8 70.5 64.8 70.4 10.0
Santiago del Estero n.2 77.5 90.1 75.4 83.0 78.6 79.6 7.2.... .. ............................................................................................
(a)Standrd deviationSmean 1981-1986

- 191
ARGENTINA
PROVINCIAL GOVERNMENT FINANCE STUDY
Table 18a
Total Expeditures by Provincial Group and Province: 1981-1986
Millions of USS of july 1988
Groups 1981 1982 1983 1984 1985 1986 Mean Coefffcient
Pravinces 1981-86 of Variation
<a>
TOTAL 7,492.1 5,279.7 6,443.1 7,443.6 6,846.6 8,194.6 6,701.0 13.8
ADVANCED 4,439.1 3,028.2 3,468.2 4,043.2 3,671.0 4,362.5 3,729.9 13.4
Federal Capital 821.8 594.9 529.8 789.0 604.3 688.0 668.0 15.8
Buenos Aires 1,997.0 1,362.2 1,635.4 1,760.3 1,669.6 1,932.2 1,684.9 12.4
Cordaba 563.4 387.1 448.8 533.5 530.2 611.2 492.6 15.0
Mendoza 470.0 257.7 295.8 299.3 283.9 414.6 321.3 24.1
Santa Fe 586.9 426.2 558.5 661.1 582.9 716.6 563.1 16.0
LOW DENSITY 697.2 615.0 801.3 812.8 854.2 1,060.3 756.1 18.3
Chubut 140.9 128.8 146.0 115.4 153.3 185.2 136.9 15.9
La Pmpa 105.0 81.4 123.9 110.4 127.7 144.2 109.7 18.0
Neuquen 151.3 143.1 189.8 232.6 214.4 274.7 186.2 24.6
Rio Negro 173.8 151.2 178.7 191.3 190.4 251.7 177.1 17.4
Santa Cruz 126.3 110.5 163.0 163.2 168.5 204.5 146.3 20.8
INTERMEDIATE 953.4 690.5 915.6 1,110.2 990.9 1,244.2 932.1 18.3
Entre Rios 235.6 166.2 248.4 280.7 231.1 303.2 232.4 18.6
Salta 214.2 160.8 210.0 276.6 261.2 363.3 224.6 28.4
$n Juan 181.4 125.0 183.6 190.6 160.3 199.0 168.2 14.6
San Luis 97.0 65.0 77.1 112.9 93.5 107.6 89.1 18.7
Tucuman 225.2 173.6 196.6 249.4 244.7 271.1 217.9 15.1
UNDERDEVELOPED 1,402.3 946.0 1,257.9 1,477.4 1,330.5 1,527.6 1,282.8 14.9
Catamarca 102.1 76.0 96.1 122.8 140.0 126.6 107.4 19.9
Chaco 377.3 176.7 217.2 231.0 220.0 262.8 244.5 25.9
Corrientes 211.9 166.6 199.1 253.2 219.9 242.9 210.1 13.5
Fosa 139.9 113.7 181.2 190.6 154.0 196.3 155.9 19.0
Jujuy 145.0 99.9 139.5 196.4 156.9 164.3 147.6 19.6
La Rioja 92.9 64.2 89.7 102.5 114.1 161.5 92.7 32.1
silones 156.5 110.4 160.0 202.2 165.4 195.0 158.9 18.8
Santiago del Estero 176.7 138.5 175.1 178.8 160.1 178.2 165.9 8.8........................................... .....................................................
(*)St ndrd deviationJmean 1981-1986

- 192 -
ARGENT I MA
PROVINCIAL GOVERNMENT FINANCE STUDY
Table 18b
Total Expeditures by ProvinciaL Group and Province: 1981-11986
X 01 Gross ProvinciaL Product
Groups 1981 1982 1983 1984 1985 1986 Mean Coefficient
Provinces 1981-86 of Variation
<a)
TOTAL 13.0 9.5 11.0 12.4 11.6 13.1 11.5 10.9
ADVANCED 9.8 7.0 7.6 8.5 7.9 8.8 8.2 11.2
Federat Capital 5.7 4.5 3.9 5.6 4.4 4.7 4.8 13.4
Buenos Aires 10.5 7.6 8.3 8.7 8.3 9.0 8.7 10.4
Cordoba 13.6 9.6 10.1 11.9 11.9 13.1 11.4 12.9
Mendoza 23.9 11.1 12.1 12.4 10.8 16.5 14.1 32.9
Santa Fe 10.5 7.6 9.8 10.6 10.2 11.7 9.7 13.0
LOW DENSITY 19.2 17.1 21.4 21.7 22.3 26.6 20.3 14.4
Chubut 15.0 14.7 16.3 12.6 17.3 19.8 15.2 14.8
La Panpa 22.0 17.0 22.3 19.0 19.2 21.2 19.9 9.4
Neuquen 15.9 16.11 20.9 25.2 23.5 28.9 20.3 23.3
Rio Negro 20.9 16.tI 18.4 20.7 19.5 24.6 19.1 13.8
Santa Cruz 29.0 26.8 39.4 39.8 42.3 50.3 35.5 22.5
INTERMEDIATE 19.9 14.2 18.5 22.2 19.6 23.5 18.9 15.6
Entre Rios 18.8 13.8 20.1 22.4 19.0 24.0 18.8 17.1
Salta 23.4 16.5 21.2 27.4 23.5 31.1 22.4 20.6
San Juan 31.6 23.4 33.4 35.9 27.1 31.9 30.3 13.7
San Luis 22.7 13.5 18.3 26.2 22.5 24.9 20.6 20.7
Tucusan 13.8 10.3 11.2 14.0 14.3 14.9 12.7 13.3
UNDERDEVELOPED 37.0 23.8 32.4 37.2 34.1 37.7 32.9 14.6
Catamarca 44.8 31.6 37.3 39.2 48.4 41.8 40.3 13.4
Chaco 62.5 28.1 35.7 35.9 34.5 39.9 39.3 27.7
Corrientes 25.9 21.1 24.7 30.8 27.7 29.5 26.0 12.3
Forosa 50.7 43.6 68.3 73.9 61.3 75.8 59.6 19.8
Jujuy 22.6 15.2 22.1 31.0 24.2 24.3 23.0 20.1
La Rioja 58.2 41.3 56.6 63.5 71.9 99.5 58.3 30.6
Misiones 28.1 17.9 25.7 33.1 28.5 32.2 26.6 18.8
Santiago del Estero 35.0 22.3 32.8 34.0 29.4 31.7 30.7 13.8
(a)Standard deviation/mean 1981-1986

- 193 -
ARGENTINA
PROVINCIAL GOVERNMENT FINANCE STUDY
Table 18c
Total Expeditures by Provincial Group and Province: 1981-1986
USS of July 1988 per capita
Groups 1981 1982 1983 1984 1985 1986 Mean Coefficient
Provinces 1981-86 of Variation
(a)
TOTAL 263.5 182.3 218.4 247.7 223.6 262.7 227.1 12.6
ADVANCED 219.9 147.6 166.2 190.6 170.2 198.9 178.9 13.2
Federal Capital 281.6 204.2 182.2 271.8 208.5 237.8 229.7 15.8
Buenos Aires 179.9 120.1 141.2 148.7 138.1 156.4 145.6 12.6
Cordoba 230.4 155.9 177.9 208.2 203.7 231.2 195.2 13.9
Mendoza 384.8 206.7 232.4 230.4 214.0 306.2 253.7 25.1
Santa Fe 234.7 167.9 217.0 253.2 220.0 266.6 218.6 14.4
LOW DENSITY 555.1 473.1 595.4 583.4 592.2 710.0 559.9 12.5
Chubut 518.2 458.6 503.2 384.8 495.0 578.9 472.0 12.5
La Pampa 494.7 376.2 561.6 491.0 557.1 617.4 496.1 15.3
Neuquen 592.6 535.8 678.8 794.8 699.9 856.9 660.4 16.6
Rio Negro 436.6 365.6 416.1 428.9 411.0 523.4 411.6 11.5
Santa Cruz 1,065.2 904.1 1,292.7 1,255.5 1,256.9 1,478.5 1,154.9 15.7
INTERMEDIATE 290.0 205.9 267.7 318.3 278.5 342.9 272.1 15.8
Entre Rios 256.5 178.9 264.4 295.4 240.5 312.1 247.1 17.3
Salta 314.8 230.1 292.9 375.7 345.6 468.2 311.8 23.7
San Juan 381.8 258.1 371.9 378.8 312.5 380.4 340.6 13.7
San Luis 445.6 293.9 342.9 494.7 403.2 457.1 396.1 17.4
Tucumn 226.1 170.2 188.1 233.0 223.3 241.5 208.1 12.3
UNDERDEVELOPED 378.5 249.8 324.9 373.3 328.8 369.3 331.1 13.5
Catamarca 482.4 352.3 437.4 548.5 613.7 544.9 486.9 17.4
Chaco 526.6 241.4 290.5 302.5 282.0 329.7 328.6 28.1
Corrientes 315.3 244.0 287.0 359.1 307.1 333.8 302.5 12.0
Formosa 461.9 366.6 570.7 586.4 462.9 576.3 489.7 16.4
Jujuy 343.1 229.4 310.6 424.0 328.8 333.9 327.2 17.4
La Rioja 555.0 376.8 516.6 579.4 633.0 879.1 532.2 28.5
Misiones 258.2 177.0 249.4 306.3 243.6 279.0 246.9 16.0
Santiago del Estero 291.7 224.5 278.7 279.3 245.5 268.5 263.9 8.7
<a>Standard deviation/mean 1981-1986

194 -
ARGENTINA
PROVINCIAL GOVERNMENT FINANCE STUIDY
Table 19a
Personnel Expeditures by Provincial Group ond Province: 1981-11986
Niltiona of USS of july 1988
Groups 1981 1982 1983 1984 1985 1986 Mean Coefficient
Provinces 1981-86 of Variation
(a>
TOTAL 3,099.0 2,210.6 2,899.2 3,753.2 3,522.8 3,862.8 3,096.9 18.3
ADVANCED 1,880.7 1,315.4 1,622.3 2,105.1 1,964.7 2,150.9 1,.71.6 16.3
Federal Capital 329.1 237.4 273.6 382.7 348.3 343.1 314.2 15.5
Buenos Aires 901.6 628.7 749.3 910.9 908.1 960.9 819.7 14.2
Cordoba 262.3 179.6 230.5 307.2 272.1 313.6 250.3 18.3
Mendoza 154.2 103.9 126.6 151.0 127.0 192.6 132.6 21.1
Santa Fe 233.5 165.8 242.4 353.2 309.2 340.8 260.8 25.4
LOW DENSITY 261.6 198.45 298.8 364.4 357.2 407.8 296.1 23.7
Chubut 53.0 41.D 55.8 57.2 64.8 78.5 54.5 20.5
La Pampa 40.5 28.0 48.4 48.3 46.4 50.5 42.3 18.1
Neuquen 54.6 43.4 67.3 88.9 75.9 82.7 66.0 23.9
Rio Negro 73.5 55.2 81.9 105.6 104.7 112.0 84.2 24.2
Santa Cruz 39.9 30.1 45.5 64.5 65.5 84.1 49.1 37.0
INTERMEDIATE 423.1 300.3 421.7 552.7 497.8 566.0 439.1 20.7
Entre Rios 102.1 69.5 101.5 116.9 109.4 126.6 99.9 17.8
Salta 101.2 69.0 105.4 156.5 145.9 182.5 115.6 33.1
San Juan 61.5 46.9 63.7 75.0 60.0 67.4 61.4 13.8
San Luis 44.7 31.8 42.9 59.2 49.9 54.4 45.7 19.3
Tucuman 113.6 83.1 108.2 145.1 132.6 135.1 116.5 17.7
UNDERDEVELOPED 533.6 396.3 556.3 731.1 703.0 738.1 584.0 21.4
Catamarca 49.2 34.0 46.9 66.1 76.1 64.0 54.4 25.8
Chaco 100.1 72.8 104.5 127.5 122.6 131.6 105.5 19.2
Corrientes n.5 54.7 73.3 105.0 115.9 121.7 84.3 29.6
Formosa 59.5 48.1 70.9 86.4 89.4 100.7 70.8 25.6
Jujuy 65.5 45.9 66.6 94.5 74.1 81.0 69.3 21.6
La Rioja 37.0 29.3 41.7 58.4 53.4 63.4 44.0 27.6
misiones 64.8 45.5 65.2 91.3 83.2 J8.7 70.0 23.1
Santiago del Estero 85.1 66.0 87.2 101.8 88.2 86.8 85.7 12.2
(a)Standard deviation/mean 1981-1986

- 195 -
ARGENTINA
PROVINCIAL GOVERNMENT FINANCE STUDY
Tabte 19b
Personnel Expeditures by Provincial Group and Province: 1981-1986
X Of Gross Provincial Product
Groups 1981 1982 1983 1984 1985 1986 Mean Coefficient
Provinces 1981-86 of Variation
ta)
TOTAL 5.4 4.0 5.0 6.2 5.9 6.2 5.3 15.0
ADVANCED 4.2 3.1 3.5 4.4 4.2 4.4 3.9 12.9
Federal Capital 2.3 1.8 2.0 2.7 2.6 2.3 2.3 13.8
Buenos Aires 4.7 3.5 3.8 4.5 4.5 4.5 4.2 10.6
Cordoba 6.3 4.4 5.2 6.8 6.1 6.7 5.8 14.9
Mendoza 7.9 4.5 5.2 6.3 4.8 7.7 5.7 23.3
Santa Fe 4.2 2.9 4.3 5.7 5.4 5.6 4.5 21.9
LOW DENSITY 7.2 5.5 8.0 9.7 9.3 10.2 7.9 20.4
Chubut 5.7 4.8 6.2 6.3 7.3 8.4 6.0 19.2
La Pampa 8.5 5.9 8.7 8.3 7.0 7.4 7.7 13.0
Neuquen 5.7 4.9 7.4 9.6 8.3 8.7 7.2 23.2
Rio Negro 8.9 5.8 8.4 11.4 10.7 11.0 9.0 21.2
Santa Cruz 9.2 7.3 11.0 15.7 16.4 20.7 11.9 38.8
INTERMEDIATE 8.8 6.2 8.5 11.0 9.9 10.7 8.9 18.3
Entre Rios 8.1 5.8 8.2 9.3 9.0 10.0 8.1 16.6
SaLta 11.0 7.1 10.6 15.5 13.1 15.6 11.5 26.0
San Juan 10.7 8.8 11.6 14.1 10.2 10.8 11.1 14.7
San Luis 10.4 6.6 10.2 13.7 12.0 12.6 10.6 21.5
Tucuman 7.0 4.9 6.2 8.1 7.8 7.4 6.8 15.7
UNDERDEVELOPED 14.1 10.0 14.3 18.4 18.0 18.2 15.0 20.4
Catamarca 21.6 14.1 18.2 21.1 26.3 21.1 20.3 18.2
Chaco 16.6 11.6 17.1 19.8 19.3 20.0 16.9 17.3
Corrientes 8.8 6.9 9.1 12.8 14.6 14.8 10.5 29.0
Formosa 21.6 18.4 26.7 33.5 35.6 38.9 27.2 27.5
Jujuy 10.2 7.0 10.6 14.9 11.4 12.0 10.8 21.8
La Rioja 23.2 18.9 26.3 36.2 33.7 39.1 27.7 26.3
Misiones 11.6 7.4 10.5 14.9 14.3 14.7 11.7 23.2
Santiago del Estero 16.8 10.6 16.3 19.4 16.2 15.4 15.9 16.5
(a)Standard deviation/mean 1981-1986

196 -
ARGENTINA
PROVINCIAL GOVERNMENT FINANCE STUDY
Table 19c
Personnel Expeditures by Provincial Group and Province: 1981-1986
USS cf July 1988 per capita
Groups 1981 1982 1983 1984 1985 1986 Mean Coefficient
Provinces 1981-86 of Variation(a)
TOTAL 109.0 76.3 98.3 124.9 115.1 123.8 104.7 16.0ADVANCED 93.2 64.1 77.8 99.2 91.1 98.1 85.1 14.7Federal Capital 112.8 81.5 94.1 131.8 120.2 118.6 108.1 15.7Buenos Aires 81.2 55.4 64.7 77.0 75.1 77.8 70.7 12.7Cordoba 107.3 n7.3 91.3 119.9 104.5 118.6 99.1 16.6Mendoza 126.3 83.4 99.5 116.3 95.8 142.2 104.2 19.0Santa Fe 93.4 65.3; 94.2 135.2 116.7 126.8 101.0 23.4
LOW DENSITY 208.3 152.8 222.0 261.6 247.7 273.1 218.5 18.3Chubut 195.0 149.2 192.2 190.9 209.1 245.2 187.3 15.1La Pampa 190.9 129.4 219.2 214.7 202.3 216.3 191.3 16.3Neuquen 213.8 162.5 240.8 303.7 247.8 258.1 233.7 18.4Rio Negro 184.7 133.5 190.7 236.7 226.1 232.9 194.3 18.6Santa Cruz 337.0 246.2 361.0 495.9 488.2 607.8 385.6 31.1
INTERMEDIATE 128.7 89.6 123.3 158.4 139.9 156.0 128.0 18.1Entre Rios 111.1 74.8 108.1 123.1 113.9 130.3 106.2 16.5Salta 148.8 98.8 147.0 212.6 193.0 235.1 160.0 28.6San Juan 129.6 96.9 129.0 148.9 117.0 128.9 124.3 12.6San Luis 205.0 143.6 191.0 259.2 215.3 231.0 202.8 17.6Tucuman 114.0 81.5 103.5 135.6 121.0 120.4 111.1 15.2
UNDERDEVELOPED 144.0 104.6 143.7 184.7 173.7 178.4 150.2 18.4Catamarca 232.4 '157.6 213.4 295.1 333.8 275.6 246.5 23.4Chaco 139.7 99.4 139.7 167.0 157.2 165.1 140.6 16.3Corrientes 107.9 80.1 105.6 149.0 161.8 167.2 120.9 26.9Formosa 196.3 155.1 223.5 265.7 268.8 295.8 221.9 21.6Jujuy 155.1 105.3 148.3 204.1 155.1 164.5 153.6 18.8La Rioja 221.0 172.0 240.2 330.2 296.3 345.4 251.9 24.5Misiones 106.9 72.9 101.7 138.3 122.5 127.0 108.5 19.5Santiago del Estero 140.4 107.0 138.8 159.1 135.3 130.8 136.1 11.3
(a)Standard deviation/rean 1981-1986

- 197 -
ARGENTINA
PROVINCIAL GOVERNMENT FINANCE STUDY
TabLe 19d
PersonneL Expeditures by Provincial Group and Province: 1981-1986
% of TotaL Revenues
Groups 1981 1982 1983 1984 1985 1986 Mean Coefficient
Provinces 1981-86 of Variation
(a)
TOTAL 50.1 45.6 46.7 62.5 57.8 53.0 52.5 11.4
ADVANCED 51.1 45.9 46.9 61.5 58.1 52.5 52.7 10.7
Federal Capital 42.4 44.0 57.5 65.3 52.8 42.2 52.4 16.5
Buenos Aires 55.3 45.9 44.9 55.6 61.5 53.4 52.7 11.0
Cordoba 57.8 51.1 51.3 68.0 59.6 59.1 57.6 9.9
Mendoza 48.6 44.8 42.5 62.1 48.6 56.3 49.3 13.6
Santa Fe 46.7 44.5 42.3 70.3 58.8 55.6 52.5 18.5
LOW DENSITY 47.0 37.1 41.4 56.4 47.9 44.6 45.9 13.0
Chubut 44.0 37.0 34.7 54.4 52.7 48.2 44.6 16.6
La Pmpa 45.1 39.5 50.1 53.9 41.1 40.7 46.0 11.6
Neuquen 45.3 36.6 39.4 48.0 36.9 32.0 41.2 13.2
Rio Negro 54.8 44.0 55.0 75.3 64.8 59.3 58.8 16.4
Santa Cruz 43.4 27.9 31.4 51.0 45.7 46.5 39.9 21.1
INTERMEDIATE 53.5 46.9 47.2 63.5 55.6 54.9 53.3 10.5
Entre Rios 56.7 43.6 41.6 44.6 48.0 44.9 46.9 10.4
Salta 54.2 44.8 54.5 81.2 71.1 73.8 61.2 21.0
San Juan 39.9 41.4 34.5 53.2 40.1 39.6 41.8 13.6
San Luis 51.8 52.8 58.1 73.4 55.0 58.4 58.2 12.4
Tucuman 62.1 54.3 54.5 74.5 59.9 56.6 61.1 11.4
UNDERDEVELOPED 45.9 49.2 49.0 68.7 65.7 59.7 55.7 15.8
Catamarca 52.1 48.5 49.2 71.8 69.7 59.6 58.3 16.1
Chaco 32.4 45.7 49.7 66.3 66.2 63.3 52.1 24.1
Corrientes 41.4 49.8 46.7 73.9 80.9 67.5 58.5 25.3
Formosa 53.4 50.4 48.5 66.1 72.1 65.3 58.1 15.4
Jujuy 54.1 52.6 51.2 74.7 57.3 57.7 58.0 13.5
La Rioja 52.5 52.0 56.0 80.6 62.4 54.4 60.7 16.4
Misiones 50.4 43.5 43.0 59.2 59.4 56.1 51.1 13.3
Santiago del Estero 55.6 53.9 51.1 66.4 57.8 50.9 56.9 9.2
(a>Standard deviation/mean 1981-1986

198 -
ARGENTINA
PIROVINCIAL GOVERNMENT FINANCE STUDY
TabLe 19e
Personet Expeditures by Provincial Group and Province: 1981-1986
X of Total Expenditures
Groups 1981 19B2 1983 1984 1985 1986 Mean Coefficient
Provinces 1981-86 of Variation
(a)
TOTAL 41.4 41.9 45.0 50.4 51.5 47.1 46.0 8.4
ADVANCED 42.4 43.4 46.8 52.1 53.5 49.3 47.6 8.7
Federal CapitaL 40.0 39.9 51.6 48.5 57.6 49.t 47.5 13.3
Buenos Aires 45.1 46.2 45.8 51.8 54.4 49.7 48.7 7.0
Cordoba 46.6 46.4 51.4 57.6 51.3 51.3 50.6 7.4
Mendoza 32.8 40,3 42.8 50.5 44.7 46.4 42.2 13.0
Santa Fe 39.8 38,9 43.4 53.4 53.0 47.6 45.7 12.7
LOW DENSITY 37.5 32f3 37.3 44.8 41.8 38.5 38.7 10.1
Chubut 37.6 32.5 38.2 49.6 42.2 42.4 40.0 13.2
La Pampa 38.6 34.4 39.0 43.7 36.3 35.0 38.4 8.1
Neuquen 36.1 30.3 35.5 38.2 35.4 30.1 35.1 8.6
Rio Negro 42.3 36.5 45.8 55.2 55.0 44.5 47.0 14.3
Santa Cruz 31.6 27.2 27.9 39.5 38.8 41.1 33.0 17.1
INTERMEDIATE 44.4 43.5 46.1 49.8 50.2 45.5 46.8 5.5
Entre Rios 43.3 41.8 40.9 41.7 47.4 41.7 43.0 5.0
Salta 47.3 42.9 50.2 56.6 55.8 50.2 50.6 9.3
San Juan 33.9 37.5 34.7 39.3 37.4 33.9 36.6 5.7
San Luis 46.0 48.9 55.7 52.4 53.4 50.5 51.3 6.1
Tucunman 50.4 47.9 55.0 58.2 54.2 49.9 53.1 6.6
UNDERDEVELOPED 38.0 41.9 44.2 49.5 52.8 48.3 45.3 10.9
Catamarca 48.2 44.7 48.8 53.8 54.4 50.6 50.0 6.7
Chaco 26.5 41.2 48.1 55.2 55.7 50.1 45.3 22.1
Corrientes 34.2 32.8 36.8 41.5 52.7 50.1 39.6 19.3
Formosa 42.5 42.3 39.2 45.3 58.1 51.3 45.5 14.1
Jujuy 45.2 45.9 47.7 48.1 47.2 49.3 46.8 2.9
La Rioja 39.8 45.6 46.5 57.0 46.8 39.3 47.1 12.4
Misiones 41.4 41.2 40.8 45.2 50.3 45.5 43.8 7.7
Santiago del Estero 48.1 47.7 49.8 57.0 55.1 48.7 51.5 7.0
(a)Standard deviation/mean 1981-1986

- 199 -
ARGENTINA
PROVINCIAL GOVERNMENT FINANCE STUDY
Table 20
Total Provincial Public Employment
by Provincial Group and Province: 1981-1986
................. ................................................ -------- --------------------...-----
Greupa 1983 1986 Change 1986/1983 Population/ Total Expenditurel
Provinces Public Employnent Pubtic Employment
Absolute X US$ of JuLy 1988
1983 1986 1983 1986
TOTAL 681,253 912,837 231,584 34.0 43 34 9,458 8,977
ADVAICED 330,701 485,400 154,699 46.8 63 45 10,488 8,987
Fodedrl Capital HA HA MA MA NA NA NA NA
uens Aires 178,205 215,702 37,497 21.0 65 57 9,177 8,958
Co~doba 60,181 66,121 5,940 9.9 42 40 7,457 9,243
Nendoza 33,661 35,861 2,200 6.5 38 38 8,787 11,562
Santa Fe 58,654 82,716 24,062 41.0 44 32 9,522 8,663
LOW DENSITY 62,899 79,405 16,506 26.2 21 19 12,739 13,353
Che~ut 11,728 15,688 3,960 33.8 25 20 12,449 11,807
La P"a 9,426 11,144 1,718 18.2 23 21 13,139 12,940
mequen 14,017 16,345 2,328 16.6 20 20 13,540 16,806
aio Negro 18,242 21,959 3,717 20.4 24 22 9,794 11,464
anta Cruz 9,486 14,269 4,783 50.4 13 10 17,181 14,328
INTERNEDIATE 118,476 143,151 24,675 20.8 29 25 7,729 8,691
Entre Rífo 27,622 33,506 5,884 21.3 34 29 8,992 9,050
salta 26,203 33,822 7,619 29.1 27 23 8,016 10,742
San Juan 17,773 20,808 3,035 17.1 28 25 10,329 9,561
San Luis 13,269 16,852 3,583 27.0 17 14 5,807 6,386
Tucuman 33,609 38,163 4,554 13.5 31 29 5,849 7,103
UUDERDEVELOPED 169,177 204,881 35,704 21.1 23 20 7,435 7,456
Cat_rca 16,887 19,057 2,170 12.9 13 12 5,691 6,643
Chaco 25,943 29,613 3,670 14.1 29 27 8,372 8,876
Corrientes 29,552 41,567 12,015 40.7 23 18 6,737 5,843
Forea 18,921 26,030 7,109 37.6 17 13 9,575 7,540
Jujuy 20,800 23,250 2,450 11.8 22 21 6,708 7,068
La Rioja 11,874 16,783 4,909 41.3 15 11 7,556 9,621
Nifonesi 20,947 24,179 3,232 15.4 31 29 7,637 8,063
Santiago del Estero 24,253 24,402 149 0.6 26 27 7,221 7,305--...-....-..-......-----..............----.......----....--......-.......-......--...--......--......-. ................--....-------......---...-...---

- 200 -
ARGENTINA
PROVINCIAL GOVERNMENT FINANCE STUDY
Táble 21a
Total Invest:ment by Provincial Group and Province:1981-1986
Millions of USS of july 1988
Groups 1981 1982 1983 1984 1985 1986 Mean Coefficient
Provinces 1981-86 of Variation
<a)
TOTAL 1,675.2 1,189.2 1,456.5 1,399.5 1,211.5 1,617.9 1,386.4 13.3
ADVANCED 747.9 462.7 565.0 497.9 389.5 540.6 532.6 20.9
Federal Capital 171.1 78.4 114.1 71.0 24.1 63.0 91.7 50.1
Buenos Aires 243.0 172.7 262.7 231.7 156.6 199.6 213.3 17.8
Cordoba 115.9 92.3 73.6 90.3 98.2 122.2 94.1 17.3
Mendoza 94.6 41.1 43.9 38.3 54.6 62.5 54.5 35.3
Santa Fe 123.2 78.2 70.7 66.5 55.9 93.3 78.9 27.8
LOW DENSITY 279.3 265.9 314.2 270.1 292.0 376.9 284.3 13.4
Chubut 52.5 57.9 53.3 35.8 41.8 58.6 48.2 17.4
La Pampa 47.4 31.6 49.0 33.7 53.3 54.8 43.0 21.1
Neuquen 64.1 74.8 88.8 91.1 94.5 131.1 82.6 25.2
Rio Negro 61.7 53.6 56.4 52.1 50.3 73.5 54.8 14.3
Santa Cruz 53.5 48.2 66.8 57.4 52.1 58.9 55.6 10.6
INTERMEDIATE 221.9 172.5 205.0 218.1 209.8 289.2 205.5 17.1
Entre Rios 53.5 38.7 52.9 62.6 46.0 62.7 50.7 16.9
SaLta 57.9 42.0 42.9 43.7 59.9 94.2 49.3 37.0
San Juan 45.9 36.1 58.5 50.3 44.9 63.3 47.1 19.1
San Luis 32.1 19.2 18.4 32.5 26.1 28.9 25.7 22.0
Tucuman 32.5 36.6 32.2 29.0 32.9 40.1 32.6 10.8
UNDERDEVELOPED 426.0 288.1 372.2 413.4 320.1 411.2 364.0 14.1
Catamarca 30.7 22.3 21.8 18.4 15.2 18.7 21.7 22.4
Chaco 76.3 46.0 50.3 52.3 52.3 64.5 55.4 18.6
Corrientes 82.6 62.4 65.8 90.9 47.1 62.5 69.8 20.6
Formosa 53.1 45.4 78.7 71.1 34.9 54.7 56.6 26.1
Jujuy 47.3 22,1 31.0 48.1 45.7 42.3 38.9 24.8
La Rioja 27.0 17.5 29.0 21.4 37.1 57.? 26.4 49.2
Misiones 54.9 37.8 54.2 72.5 44.8 60.7' 52.8 20.9
Santiago del Estero 54.0 34.6 41.4 38.6 43.1 50.7' 42.4 15.8
(a)Standard deviation/mean 1981-1986

- 201 -
ARGENTINA
PROVINCIAL GOVERNMENT FINANCE STUOY
Table 21b
Total Investment by Provincial Group ard Province:1981-1986
X Of Gross Provincial Product
Groups 1981 1982 1983 1984 1985 1986 Mean Coefficient
Provfncee 1981-86 of Variation
(a)
TOTAL 2.9 2.1 2.5 2.3 2.0 2.6 2.4 12.2
ADVANCED 1.7 1.1 1.2 1.1 0.8 1.1 1.2 21.4
Federal Capital 1.2 0.6 0.8 0.5 0.2 0.4 0.7 48.2
Buenos Aires 1.3 1.0 1.3 1.1 0.8 0.9 1.1 17.8
Cordoba 2.8 2.3 1.7 2.0 2.2 2.6 2.2 17.3
Mendozs 4.8 1.8 1.8 1.6 2.1 2.5 2.4 46.0
Santa Fe 2.2 1.4 1.2 1.1 1.0 1.5 1.4 29.2
LOW DENSITY 7.7 7.4 8.4 7.2 7.6 9.4 7.7 10.0
Chubut 5.6 6.6 5.9 3.9 4.7 6.3 5.4 17.2
La Pampe 9.9 6.6 8.8 5.8 8.0 8.0 7.8 17.3
Neuquen 6.7 8.4 9.8 9.9 10.4 13.8 9.0 23.9
Rio Negro 7.4 5.7 5.8 5.6 5.1 7.2 5.9 14.4
Santa Cruz 12.3 11.7 16.2 14.0 13.1 14.5 13.4 11.1
INTERMEDIATE 4.6 3.5 4.1 4.4 4.2 5.5 4.2 13.9
Entre Rios 4.3 3.2 4.3 5.0 3.8 5.0 4.1 15.3
Salta 6.3 4.3 4.3 4.3 5.4 8.1 4.9 28.0
San Juan 8.0 6.7 10.6 9.5 7.6 10.2 8.5 16.7
San Luis 7.5 4.0 4.4 7.5 6.3 6.7 5.9 23.6
Tucun 2.0 2.2 1.8 1.6 1.9 2.2 1.9 10.3
UNDERDEVELOPED 11.2 7.3 9.6 10.4 8.2 10.1 9.3 14.5
Catamarca 13.5 9.3 8.5 5.9 5.2 6.2 8.5 33.1
Chaco 12.6 7.3 8.3 8.1 8.2 9.8 8.9 19.8
Corrientes 10.1 7.9 8.2 11.1 5.9 7.6 8.6 19.4
Formosa 19.3 17.4 29.7 27.6 13.9 21.1 21.6 25.6
Jujuy 7.4 3.4 4.9 7.6 7.1 6.2 6.1 24.9
La Rioja 17.0 11.3 18.3 13.3 23.4 35.2 16.6 47.6
Misiones 9.9 6.1 8.7 11.9 7.7 10.0 8.9 20.6
Santiago del Estero 10.7 5.6 7.7 7.3 7.9 9.0 7.9 19.9
(a)Standard deviation/mean 1981-1986

.202 7
ARGENTINAPROVINCIAL WRNMENT FIlACE STUDY
Tebte ZlcTotat I entent by Provinciel Group and Province:19811-19t6
U# of JuLy 1988 per cepita
. ............ ......... ...... ......... .. ..... .. .............. 1.......................... ................ .............................. .... .
Gro~ 1961 1962 1963 1984 1985 1986 len CoefftctentProvlnces 1961-86 of Vertation
(a)
........ ............................... ............................................. .. .... .... .. .............................. .. .........
TOTAL 58.9 41.1 49.4 46.6 39.6 51.9 47.1 13.9ADVANCED 37.0 22.5 27.1 23.5 18.1 24.6 25.6 22.8Federal Capital 58.6 26.9 39.2 24.4 8.3 21.8 31.5 49.9Suea Airea 21.9 15.2 22.7 19.6 13.0 16.2 18.5 19.3Cor 47.4 37.1 29.2 35.3 37.7 46.2 37.3 16.9Medoza 77.5 33.0 34.5 29.5 41.2 46.1 43.1 37.3anta Fe 49.3 30.8 27.5 25.5 21.1 34.7 30.8 29.2
L_W DENSITY 222.4 204.6 233.5 193.9 202.5 252.4 211.4 9.6Chubut 193.0 206.0 183.6 119.5 134.9 183,3 167.4 18.8La Pap 223.5 146.1 222.4 149.9 232.6 234,5 194.9 19.5men 251.3 279.8 317.5 311.3 308.4 409.0 293.7 16.5Rio llegro 155.1 129.6 131.3 116.8 108.7 152.,8 128.3 13.3Snte Cruz 451.5 393.9 529.8 441.5 388.8 426.1 441.1 10.6
INTERMEDIATE 67.5 51.5 60.0 62.5 59.0 79.7 60.1 14.5Entre Ríos S8.3 41.7 56.3 65.9 47.8 64.5 54.0 16.0Salta 85.1 60.2 59.8 59.3 79.2 121.4 68.7 32.2Sn Juan 96.5 74.5 118.5 100.0 87.5 121.0 95.4 17.1Sn Luís 147.5 86.6 82.1 142.4 112.8 122.8 114.3 21.9luctun 32.6 35.8 30.8 27.1 30.0 35.7 31.3 9.9
UNDE WLOPUD 115.0 76.1 96.1 104.5 79.1 99.4 94.2 14.5Cetarce 145.0 103.3 99.3 82.3 66.5 80.6 99.3 25.2Checo 106.5 62.8 67.3 68.5 67.0 80.9 74.4 20.1Corrientas 122.9 91.3 94.9 128.9 65.8 85.9 100.8 21.5Famosa 175.4 146.5 247.9 218.8 104.8 160.7 178.7 26.2Jujuy 112.0 50.7 69.1 103.9 95.7 85.9 86.3 24.3La RioJa 161.6 102.5 166.7 121.2 205.8 311.l 151.6 44.9
lfaion 90.6 60,6 84.5 109.8 66.0 86.11 82.3 19.7Santlgo del Estero 89.1 56.1 65.8 60.4 66.1 76.4 67.5 16.2
..................... ................... ..................................... ....................
(*)St~rd devistioníman 1981-191|6

- 203 -
ARGENTINA
PROVINCIAL GOVERNNENT FINANCE STUDY
Tabte 21d
Total Investment by Provincial Group and Province:1981-1986
X of Total Revenues
Groups 1981 1982 1983 1984 1985 1986 Mean Coefficient
Provinces 1981-86 of Variation
(a)
TOTAL 27.1 24.5 23.4 23.3 19.9 22.2 23.7 9.2
ADVANCED 20.3 16.1 16.3 14.6 11.5 13.2 15.8 17.6
Federal Capital 22.0 14.5 24.0 12.1 3.7 7.7 15.3 47.4
Buenos Aires 14.9 12.6 15.8 14.2 10.6 11.1 13.6 14.0
Cordoba 25.5 26.2 16.4 20.0 21.5 23.0 21.9 15.2
Mendoza 29.8 17.7 14.7 15.8 20.9 18.3 19.8 25.2
Santa Fe 24.7 21.0 12.3 13.2 10.6 15.2 16.4 30.5
LOW DENSITY 50.2 49.6 43.5 41.8 39.1 41.2 44.8 9.4
Chubut 43.5 51.1 33.1 34.1 34.0 36.0 39.2 16.8
La Pampa 52.8 44.6 50.8 37.6 47.3 44.1 46.6 10.6
Neuquen 53.2 63.0 51.9 49.2 45.9 50.7 52.7 10.1
Rio Negro 46.0 42.7 37.9 37.1 31.1 38.9 39.0 11.9
Santa Cruz 58.2 44.6 46.0 45.4 36.4 32.6 46.1 17.6
INTERMEDIATE 28.1 27.0 22.9 25.0 23.4 28.0 25.3 8.2
Entre Rios 29.7 24.3 21.7 23.9 20.2 22.2 23.9 12.7
Salta 31.0 27.3 22.2 22.6 29.2 38.1 26.5 20.4
San Juan 29.7 31.9 31.7 35.7 30.0 37.2 31.8 8.8
San Luis 37.3 31.8 25.0 40.3 28.8 31.0 32.6 15.6
Tucuman 17.8 23.9 16.2 14.9 14.9 16.8 17.5 17.5
UNDERDEVELOPED 36.6 35.8 32.8 38.9 29.9 33.3 34.8 8.3
Catamarca 32.5 31.8 22.9 20.0 13.9 17.4 24.2 28.7
Chaco 24.7 28.9 23.9 27.2 28.2 31.0 26.6 9.1
Corrientes 47.1 56.8 41.9 63.9 32.9 34.7 48.5 23.1
Formosa 47.7 47.6 53.8 54.5 28.1 35.5 46.3 20.8
Jujuy 39.1 25.3 23.9 38.0 35.4 30.1 32.3 18.4
La Rioja 38.4 31.0 38.8 29.6 43.3 49.0 36.2 18.5
Misiones 42.8 36.2 35.8 47.0 32.0 38.3 38.7 12.7
Santiago del Estero 35.3 28.3 24.2 25.2 28.2 29.7 28.2 12.7
(a)Standard deviation/mean 1981-1986

- 204 -
ARGENTINA
PROVINCIAL GOVERNMENT FINANCE STUDY
Table 21e
Total Investment by Provincial Group and Province:1981 1986
X of Total Expenditures
Groups 1981 1982 1983 1984 1985 1986 Mean Coefficient
Provinces 1981-86 of Variation
(a)
TOTAL 22.4 22.5 22.6 18.8 17.7 19.7 20.8 9.5
ADVANCED 16.8 15.3 16.3 12.3 10.6 12.4 14.3 16.2
Federal Capital 20.8 13.2 21.5 9.0 4.0 9.2 13.7 46.7
Buenos Aires 12.2 12.7 16.1 13.2 9.4 10.3 12.7 16.9
Cordoba 20.6 23.8 16.4 16.9 18.5 20.13 19.3 12.9
Mendoza 20.1 16.0 14.8 12.8 19.3 15.1 16.6 15.4
Santa Fe 21.0 18.3 12.7 10.1 9.6 13.0 14.3 29.2
LOW DENSITY 40.1 43.2 39.2 33.2 34.2 35.6 38.0 9.3
Chubut 37.2 44.9 36.5 31.1 27.3 31.7 35.4 16.0
La Pampa 45.2 38.8 39.6 30.5 41.7 38.0 39.2 11.4
Neuquen 42.4 52.2 46.8 39.2 44.1 47.7 44.9 9.3
Rio Negro 35.5 35.4 31.5 27.2 26.4 29.2 31.2 11.6
Santa Cruz 42.4 43.6 41.0 35.2 30.9 28.8 38.6 14.8
INTERMEDIATE 23.3 25.0 22.4 19.6 21.2 23.2 22.3 7.6
Entre Rios 22.7 23.3 21.3 22.3 19.9 20.7 21.9 5.4
Salta 27.0 26.2 20.4 15.8 22.9 25.9 22.5 17.6
San Juan 25.3 28.9 31.9 26.4 28.0 31.8 28.1 8.9
San Luis 33.1 29.5 23.9 28.8 28.0 26.9 28.7 9.7
Tucuman 14.4 21.1 16.4 11.6 13.5 14.8 15.4 19.1
UNDERDEVELOPED 30.4 30.4 29.6 28.0 24.1 26.9 28.5 7.9
Catamarca 30.1 29.3 22.7 15.0 10.8 14.8 21.6 34.4
Chaco 20.2 26.0 23.2 22.6 23.8 24.5 23.2 7.7
Corrientes 39.0 37.4 33.1 35.9 21.4 25.7 33.4 19.2
Formosa 38.0 40.tl 43.4 37.3 22.6 27.9 36.3 19.9
Jujuy 32.6 22.1 22.2 24.5 29.1 25.7 26.1 14.5
La Rioja 29.1 27.2 32.3 20.9 32.5 35.4 28.4 16.4
Nisiones 35.1 34.3 33.9 35.8 27.1 31.1 33.2 9.0
Santiago del Estero 30.6 25.0 23.6 21.6 26.9 28.4 25.5 11.7...- - - -- --d devi---o---ean 1981 . . . . . . . . ...---19...8.----- .
(a)Standard deviation/mean 1981-1986

- 205 -
ARGENTINA
PROVINCIAL GOVERNMENT FINANCE STUDY
Table 22a
Current Account Surplus without Grants (Own Saving)
by Provincial Group and Province:1981-1986
Nillions of USS of july 1988
Groups 1981 1982 1983 1984 1985 1986 Mean Coefficient
Provinces 1981-86 of Variation
(a)
TOTAL (239.8) 198.9 (1,124.6)(1,693.0) 316.6 308.9 (508.4) (152.2)
ADVANCED 9.0 263.3 (448.8) (631.2) 139.4 239.0 (133.7) (258.3)
Federal Capital 189.8 71.0 <0.9) (75.8) 96.2 203.7 56.0 176.3
Buenos Aires (144.5) 183.6 <114.8) (53.9) <5.9) 57.5 (27.1) (406.7)
Cordoba 6.0 20.8 (110.2) (155.8) 16.8 28.9 (44.5) (163.6)
Mendoza (12.2) 0.0 (58.3) (80.9) 29.5 (37.0) (24.4) (151.1)
Santa Fe (30.1) (12.1) (164.5) (264.7) 2.8 (14.2) (93.7) (106.3)
LOU DENSITY 34.7 138.0 50.2 (37.6) 130.5 150.0 63.2 107.3
Chubut 5.9 30.6 12.7 11.3 3.5 16.6 12.8 69.0
La Pampa 5.1 4.4 (25.4) (31.0) 19.4 14.6 (5.5) (348.5)
Neuquen 10.9 41.3 41.0 21.7 76.9 93.1 38.4 75.5
Rio Negro (2.2) 22.6 (10.3) (44.7) 7.4 (2.0) (5.4) (377.6)
Santa Cruz 15.0 39.0 32.2 5.2 23.3 27.7 23.0 48.4
INTERMEDIATE (78.4) (60.3) (300.0) (413.0) 69.2 (10.3) (156.5) (107.7)
Entre Rios (19.6) (4.9) (78.2) (49.3) 39.9 41.4 (22.4) (194.7)
Salta (11.8) (5.7) (63.2) (114.6) (3.7) (43.3) (39.8) (99.4)
San Juan (26.9) (27.4) (71.3) (86.2) 17.9 (4.5) (38.8) (92.9)
San Luis (13.8) (8.6) (28.1) (52.4) 13.4 8.0 (17.9) (123.6)
Tucuman (6.4) (13.7) (59.3) (110.6) 1.6 (12.0) (37.7) (105.3)
UNDERDEVELOPED (205.1) (142.0) (425.9) (611.1) <22.5) (69.8) (281.3) (73.9)
Catamarca (14.9) (13.0) (40.2) (75.7) (22.7) (10.3) (33.3) (68.8)
Chaco (106.5) (33.2) (83.2) <93.5) 7.4 (8.3) (61.8) <70.7)
Corrientes (2.3) (15.8) (51.7) (90.0) (30.9) (37.0) (38.1) (73.5)
Formosa (18.4) (14.8) (58.2) (74.5) (1.4) (13.1) (33.4) (79.5)
Jujuy (17.6) (22.1) (51.9) (88.1) 1.7 1.5 (35.6) (89.3)
La Rioja (16.4) (13.4) (32.1) (53.7) (2.5) (29.1) (23.6) (69.2)
Misiones (7.9) (3.8) (41.0) (61.4) 7.6 5.8 (21.3) (120.2)
Santiago del Estero (21.2) (26.0) (67.7) (74.2> 18.3 20.7 (34.2) (108.3)
<a)Standard deviation/mean 1981-1986

- 206 -
ARGENTINA
PROVINICIAL GOVERNMENT FINANCE STUDY
Table 22b
Current Account Surplus without Grants (Own Saving)
by Provinciat Group and Province:1981-1986
X Off Gross Provincial Product
Groups 1981 1982 1983 1984 1985 1986 Mean Coefficient
Provinces 1981-86 of Variation
(a>
TOTAL (0.4) 0.4 (1.9) (2.8) 0.5 0.5 (0.9) (152.0)
ADVANCED 0.0 0.6 (1.0) (1.3) 0.3 0.5 (0.3) (268.5)
Federal Capital 1.3 0.5 (0.0) (0.5) 0.7 1.4 0.4 170.4
Buenos Aires (0.8) 1.0 (0.6) (0.3) (0.0) 0.3 (0.1) (479.6)
Cordoba 0.1 0.5 (2.5) (3.5) 0.4 0.6 (1.0) (165.9>
Mendoza (0.6) 0.0 <2.4) (3.3) 1.1 (1.5) (1.0) (141.9)
Santa Fe (0.5) (0.2:i (2.9) (4.3) 0.0 (0.2) (1.6) (104.0)
LOW DENSITY 1.0 3.8 1.3 (1.0) 3.4 3.8 1.7 104.2
Chubut 0.6 3.5 1.4 1.2 0.4 1.8 1.4 70.5
La Panpa 1.1 0.9 (4.6) (5.3) 2.9 2.1 (1.0) (323.3)
Neuquen 1.1 4.6 4.5 2.3 8.5 9.8 4.2 73.1
Rio Negro (0.3) 2.4 (1.1) (4.8) 0.8 (0.2) (0.6) (365.5)
Santa Cruz 3.5 9.5 7.8 1.3 5.9 6.8 5.6 48.9
INTERMEDIATE (1.6) (1.2) (6.1) (8.2) 1.4 (0.2) (3.2) (106.6)
Entre Rios (1.6) (0.4) (6.3) (3.9) 3.3 3.3 (1.8) (196.4)
Salta (1.3) (0.6) (6.4) (11.3) (0.3) (3.7) (4.0) (98.3)
San Juan (4.7) (5.1) (13.0) (16.2) 3.0 (0.7) (7.2) (92.4)
San Luis (3.2) t1.8) (6.7) (12.2) 3.2 1.9 (4.1) (125.6)
Tucumnn (0.4) 1O.8) (3.4) (6.2) 0.1 (0.7) (2.1) (103.9)
UNDERDEVELOPED (5.4) :3.6) (11.0) (15.4) (0.6) (1.7) (7.2) (73.3)
Catamarca (6.5) C5.4) (15.6) (24.2) (7.8) (3.4) (11.9) (60.6)
Chaco (17.6) (5.3) (13.7) (14.5) 1.2 (1.3) (10.0) (71.1)
Corrientes (0.3) <2.0) (6.4) (11.0) (3.9) (4.5) (4.7) (72.4)
Formosa (6.7) (5.7) (21.9) (28.9) (0.6) (5.1) (12.7) (80.4>
Jujuy (2.7) (3.4) (8.2) (13.9) 0.3 0.2 (5.6) (89.8)
La Rioja (10.3) (8.6) (20.3) (33.3) (1.6) (17.9) (14.8) (68.3)
Misiones (1.4) (0.6) (6.6) (10.0) 1.3 1.0 (3.5) (120.3)
Santiago del Estero (4.2) (4.2) (12.7) (14.1) 3.4 3.7 (6.4) (108.9)
(a)Standard deviation/mean 1981-1985

- 207 -
ARGENTINAPROVINCIAL GOVERNNENT FINANCE STUDY
Table 22cCurrent Account Surplus without Grante (O<n Savirn)
by Provincial Group and Province:1981-1986USS of July 1968 per cepita
Croup 1981 1982 1983 1984 1985 1966 Mean Coefficfent
Provlnces 19J1-86 of Variation
.... ... ... ... ... .... ... ... ... ... .... ... ... ... ... ... ................ .. . . . .
TOTAL (8.4) 6.9 (38.1) (56.3) 10.3 9.9 (17.1) (150.6)
ADVANCED 0.4 12.8 (21.5) <29.8) 6.5 10.9 (6.3) (259.2)
federal Capital 65.1 24.4 (0.3) (26.1) 33.2 70.4 19.2 176.9
8u4mos Aires (13.0) 16.2 (9.9) (4.6) (0.5) 4.7 (2.4) (411.2)Cordo* 2.4 8.4 (43.7) (60.8) 6.5 10.9 (17.4) (163.4)
Mendoza (10.0) 0.0 (45.8) (62.3) 22.3 <27.3) (19.1» <147.6)
Santo Fe <12.0) <4.8) (63.9) (101.4) 1.1 (5.3) (36.2) <105.6)
L04 DENSITY 27.6 106.1 37.3 (27.0) 90.5 100.5 46.9 101.9chUbut 21.6 108.8 43.7 37.5 11.3 52.0 44.6 70.1La Pmap 24.1 20.3 (115.3) (137.9) 84.5 62.6 (24.9) <343.4)
Neuquen 42.7 154.8 146.7 74.1 251.2 290.4 133.9 65.9Rio Negro (5.6) 54.7 (24.1) (100.2) 16.0 (4.2) (11.8) (397.0)
anta Cruz 126.7 319.4 255.7 39.9 174.1 200.1 183.2 48.8
IMTERIUOIATE <23.8) (18.0) (87.7) <118.4) 19.5 (2.8> (45.7) (106.0)
Entre AIo. (21.3) (5.3) (83.2) (51.9) 41.5 42.6 (24.0) (191.0>"alt <17.4) (8.1) (88.1) (155.6) (4.9) (55.7) <54.8) (98.1)$an Juan <56.> (<56.5) (144.4) <171.3> 35.0 <8.6) <78.0 (91.1)*an Luis (63.3) (38.9) (125.1) (229.5) 57.9 34.0 (79.8> (121.3)
Tucummn (6.4) (13.4) (56.7) (103.3) 1.5 (10.7) (35.7) (104.1)
UNDERDEVELOPED (5s.3) (37.5) <110.0> (154.4) (5.6> (16.9) <7n.6) (72.7>
Cataarca (70.3) (60.5) (182.8) (338.3) (99.4> (44.4) (150.3) (68.1)
Chaco (148.6) (45.4) (111.2) (122.3) 9.5 (10.4) (83.6) <70.9)
Corrientes <3.4) (23.1) <74.5) (127.7) <43.1) (50.9> (54.4) (73.2)
Fmosa (60.7) (47.7) (183.3) (229.2) (4.2) (38.4) (105.0) (78.4)
Jujuy <41.7) (50.7) (115.5) (190.4) 3.5 3.1 <79.0) (87.0)
La RIoja (97.8> (78.3) <185.1) <303.6) (14.1) (158.4) (135..) (67.6>
mIsiones (13.0) (6.1) (64.0) (93.0) 11.2 8.3 (33.0) (117.9)
Santiago del Estero (35.0) (42.1) (107.6> (116.0) 28.0 31.2 <54.5) (106.0>
<a)St~nderd devíatlon/aen 1981-1986

- 208 -
ARGENTINA
PROVINCIAL GOVERNMENT FINANCE STUDY
Table 23a
Current A,ccount Surplus with Grants (Saving)
by Provincial Group and Province:1981-1986
Millions of USS of july 1988
Groups 1981 1982 1983 1984 1985 1986 Mean CoefficientProvinces 1981-86 of Variation
(a)
TOTAL 590.4 835.8 1,283.9 83.3 538.8 819.9 666.5 54.5
ADVANCED 20.6 350.4 584.1 (43.3) 163.1 365.3 215.0 100.6
FederaL Capital (119.5) 71.0 67.2 (75.8) 96.2 203.8 7.8 1,389.7
Buenos Aires 28.2 183.6 304.1 129.4 (5.9) 113.7 127.9 79.6
Cordoba 49.8 56.7 73.9 8.6 25.2 43.1 42.8 49.4
Mendoza 31.4 11.4 52.2 (17.4) 34.3 (0.5) 22.4 104.1Santa Fe 30.8 27.8 86.7 (88.1) 13.4 5.2 14.1 368.9
LOWQ DENSITY 118.1 208.8 252.8 124.4 188.6 240.3 178.5 29.2
Chubut 3.9 41.7 69.1 26.1 11.2 35.7 30.4 70.3
La Paawa 12.4 22.7 23.4 15.4 39.9 37.0 22.8 44.7Neuquen 30.3 51.2 72.7 61.1 88.4 118.2 60.7 46.0
Rio Negro 35.5 41l.0 32.8 1.1 21.3 12.8 26.3 52.6
Santa Cruz 35.9 52.2 54.7 20.7 27.9 36.5 38.3 31.8
INTERMEDIATE 126.5 124.0 188.4 1.1 121.2 96.5 112.2 49.8
Entre Rios 29.3 31.9 51.5 58.4 46.3 56.4 43.5 26.0
Salta 52.3 35.2 26.5 <40.2) 4.8 (19.2) 15.7 202.9
San Juan 23.7 26.2 60.3 6.5 36.7 35.8 30.7 53.1
San Luis 27.5 13.7 15.3 1.6 23.7 14.6 16.4 50.2
Tucuman (6.4) 16.9 34.9 (25.2) 9.7 8.9 6.0 311.6
UNDERDEVELOPED 325.3 152.6 258.6 1.1 65.8 117.8 160.7 68.5
Catamarca 37.0 16.8 21.2 (12.1) (12.9) 0.8 10.0 181.7
Chaco 34.5 33.1 45.2 14.1 21.6 12.5 29.7 39.6
Corrientes 76.2 7.4 24.6 <20.2) (29.5) 01.1:1 11.7 296.0
Forosa 27.9 27.0 46.8 13.9 6.7 17.6 24.5 52.4
Jujuy 32.9 9.6 22.0 (21.7) 18.0 18.6 12.2 140.2
La Rioja 58.9 9.6 13.9 (8.4) 8.4 12.6 16.5 125.1
fisiones 38.6 31.3 48.2 26.4 22.4 23.6 33.4 27.3
Santiago del Estero 19.4 17.7 36.7 9.1 31.1 33.2 22.8 43.1- -- - ....................... ..............1.......
(a)Standrd devistionimrean 1981-1986

- 209 -
ARGENTINAPROVINCIAL GOVERNMENT FINANCE STUOY
Table 23b
Current Account Surptus with Grants (Saving)
by Provincial Group and Province:1981-1986% of Gross Provincial Product
Graiws 1981 1982 1983 1984 1985 1986 Mean Coefficient
Provi nces 1981-86 of Variation
(a)
TOTAL 1.0 1.5 2.2 0.1 0.9 1.3 1.2 54.0
ADVANCED 0.0 0.8 1.3 (0.1> 0.4 0.7 0.5 98.4
Federal Capital (0.8) 0.5 0.5 (0.5> 0.7 1.4 0.1 1,012.0Buenos Aires 0.1 1.0 1.5 0.6 (0.0) 0.5 0.7 79.2
Cordoba 1.2 1.4 1.7 0.2 0.6 0.9 1.0 49.6
Mendoza 1.6 0.5 2.1 (0.7) 1.3 (0.0> 1.0 101.9
Santa Fe 0.5 0.5 1.5 (1.4) 0.2 0.1 0.3 316.5
LOW DENSITY 3.2 5.8 6.8 3.3 4.9 6.0 4.8 27.7Chubut ~~~0.4 4.8 7.7 2.9 1.3 3.8 3.4 70.3
La Pulpa 2.6 4.7 4.2 2.7 6.0 5.4 4.0 31.8Neuquen 3.2 5.8 8.0 6.6 9.7 12.5 6.7 44.3Rio Negro 4.3 4.3 3.4 0.1 2.2 1.3 2.9 54.5Santa Cruz 8.3 12.7 13.2 5.0 7.0 9.0 9.2 31.7
INTERMEDIATE 2.6 2.5 3.8 0.0 2.4 1.8 2.3 50.0
Entre Rios 2.3 2.6 4.2 4.7 3.8 4.5 3.5 25.1
Salta 5.7 3.6 2.7 (4.0) 0.4 (1.6) 1.7 193.2San Juan 4.1 4.9 11.0 1.2 6.2 5.8 5.5 53.2San Luis 6.4 2.9 3.6 0.4 5.7 3.4 3.8 51.8Tucunan <0.4) 1.0 2.0 (1.4> 0.6 0.5 0.4 302.3
UNDERDEVELOPED 8.6 3.8 6.7 0.0 1.7 2.9 4.2 69.7Catamarca 16.3 7.0 8.2 <3.9) (4.5> 0.3 4.6 158.8Chaco 5.7 5.2 7.4 2.2 3.4 1.9 4.8 41.4Corrientes 9.3 0.9 3.1 (2.5> (3.7> (0.1) 1.4 299.1Formosa 10.1 10.4 17.6 5.4 2.7 6.8 9.2 51.5Jujuy 5.1 1.5 3.5 (3.4> 2.8 2.7 1.9 141.6La Rioja 36.9 6.2 8.8 (5.2) 5.3 7.8 10.4 124.2misiones 6.9 5.1 7.7 4.3 3.8 3.9 5.6 27.0Santiago del Estero 3.8 2.8 6.9 1.7 5.7 5.9 4.2 43.4
(aStarxdard deviation/mean 1981-1986

-- 210 -
ARGENTIA-PROVINCIAL GOVER~EMT FINAICE sTuDY
Table 23cCurrent Accouat Surptus with Orante ( vln9)by ProvinciaL Group od Province:1961-1966
USM of Juty 1988 pe capita
-------------------------- , ,,,,........ ,. ,. .................................................................... ..
Groups 1981 1982 1963 1964 195 198 N~ CoefffcientProvinces 1961-86 of Voriatior
................. ....................................................... ................................................
TOTAL 20.8 28.9 43.5 2.8 17.6 26.3 22.7 54.2ADVANCED 1.0 17.1 28.0 (2.0) 7.6 16.7 10.3 99.9Federal Capital <41.0) 24.4 23.1 (26.1) 33.2 70.5 2.7 1,375.4Buenos Aires 2.5 16.2 26.2 10.9 (0.5) 9.2 11.1 79.5Cordoba 20.3 22.8 29.3 3.3 9.7 16.3 17.1 49.9Mendoza 25.7 9.1 41.0 (13.4) 25.9 (0.4> 17.7 103.0Santa Fe 12.3 11.CI 33.7 (33.7) 5.0 1.9 5.6 355.6
LOW DENSITY 94.0 160.6 187.8 89.3 130.8 160.9 132.5 27.3chubut 14.5 148.6 238.2 87.0 36.1 111.6 104.9 70.6La Pampa 58.5 104.9 106.3 (A.7 174.0 158.5 102.5 41.5Neuquen 118.5 191.8 259.9 208.8 2tO.7 36W.9 213.5 37.0Rio Negro 89.3 99.1 76.5 2.5 45.9 26.7 62.6 55.3Santa Cruz 303.0 427.1 434.1 159.1 207.8 263.8 306.2 33.7
INTERMEDIATE 38.5 37.0 55.1 0.3 34.1 26.6 33.0 50.1Entre Rios 31.9 34.4 54.8 61.5 48.2 58.1 46.1 24.6Salta 76.9 50.4 36.9 (54.6) 6.3 <24.7) 23.2 193.4San Juan 50.0 54.1 122.2 12.8 71.6 66.5 62.1 52.5San Luis 126.1 62.0 67.9 7.2 102.2 61.8 7n.1 50.8Tucuman <6.4) 16.6 33.4 (23.5) .9 7.9 5.8 307.3
UNDERDEVELOPED 87.8 40.3 66.8 0.3 16.3 28.5 42.3 70.1Catamarca 173.0 78.0 96.5 (54.2) (56.4 3.6 47.8 175.8Chaco 48.1 45.2 60.5 18.5 27.7 15.6 40.0 41.1Corrientes 113.3 10.9 35.5 (28.7) <41.2) <1.5) 10.0 282.4Formosa 92.0 57.1 147.4 42.8 20.0 51.6 77.9 53.1Jujuy 77.8 ,22.0 48.9 <46.8> 37.8 37.7 27.9 136.4La Rioja 351.8 56.4 79.9 (47.7> 46.7 6.8 97.4 126.4Misiones 63.7 50.3 75.1 40.0 32.9 33.8 52.4 29.9Santiago del Estero 32.0 28.7 58.4 14.2 47.7 50.0 36.2 41.3... ... .........................................................ea. .1.9.
(a)Standrd devistion/mea 1981-1986

- 211 -
ARGENTINA
PROVINCIAL GOVERNMENT FINANCE STUDY
Table 24a
Overatl Deficit/Surplus or Need for Financing
by ProvinciaL group and Province:1981-1986
Millions of USS of juty 1988
Groups 1981 1982 1983 1984 1985 1986 Mean Coefficient
Provinces 1981-86 of Variation
(a)
___._______.._ --- --- - - - - - - - - - - - - - - - - - - - - - - - - - - - - - - - - - - - - - - - - - - - - -
TOTAL (1,303.8) (433.1) (228.8)(1,441.3) (756.0) (912.6) (832.6) <52.1)
ADVANCED (760.7) (162.4) (6.0) (622.4) (290.9) (263.1) <368.5) (70.7)
FederaL Capital (44.9) (55.2) (54.3) (202.5) 55.9 125.8 (60.2) (170.0)
Buenos Aires (366.5) 8.1 32.1 (123.1) (193.5) (132.3) (128.6) (103.1)
Cordoba (109.6) (35.5) 0.2 (82.0) (73.4) (80.3) (60.0) (59.6>
Mendoza (152.4) (26.0) 2.0 (56.0) (22.6) (72.8) (51.0) (97.9)
Santa Fe (87.4) <53.8) 14.0 (158.9) (57.2) (103.5) (68.7) (76.8)
LOW DENSITY (140.3) (79.1) (79.2) (166.2) (107.9) (145.1) (114.6) (29.1)
Chubut (20.3) (15.7) 14.7 (10.2) (30.3) (22.3) (12.4) (115.4)
La Pampa (15.2) (10.6) (27.4) (20.8) (14.9) (20.0) (17.8) (30.1)
Neuquen (30.8) (24.5) (18.8) (47.3) (8.6) (16.2) (26.0) (47.5)
Rio Negro (39.7) (25.7) (29.8) (51.0) (28.7) <62.8) (35.0) (38.3)
Santa Cruz (34.3) (2.6) (17.9) (36.8) (25.4) (23.8) (23.4) (48.2)
INTERMEDIATE (162.9) (50.8) (21.6) (239.3) (96.0) (212.6) (114.1) (70.7)Entre Rios (55.4) (6.9) (4.5) (18.6) (3.1) (21.0) (17.7) (101.5)SaLta (27.3) (6.8) (16.5) (83.9) (56.0) (116.0) (38.1) (101.8)San Juan (27.0) (11.7) 0.8 (49.8) (10.6) (28.7) (19.7) (82.9)
San Luis (10.8) (4.9) (3.2) (32.3) (2.7) (14.5) (10.8) (95.2)
Tucuman (42.4) (20.6) 1.8 (54.7) (23.5) (32.4) (27.9) (63.9)
UNDERDEVELOPED (239.8) (140.8) (122.0) (413.5) (261.2) (291.8) (235.5) (41.3)
Catamarca (7.7) (5.9) (0.8) (30.7) (30.8) (19.2) (15.2) (78.3)
Chaco (68.8) (17.3) (6.9) (38.7) (34.8) (54.9) t33.3) (62.9)
Corrientes (36.8) (56.8) (42.1) (110.9) (76.6) (62.7) (64.6) (38.1)Formosa (28.5) (18.2) (34.9) (60.0) (30.0) (42.0) (34.3) (38.0)Jujuy (24.0) (12.7) <9.5) (69.9) (27.8) (24.0) (28.8) (69.0)La Rioja (22.4) (7.9) (15.2) (30.0) (28.5) (44.8) (20.8) (56.4)Misiones (28.0) (5.9) (8.4) (47.8) (25.4) (36.7) (23.1) (64.0)Santiago del Estero (23.7) (16.1) (4.3) (25.3) (7.3) (7.5) (15.3) (53.6)
(a)Standard deviation/mean 1981-1986

- 212 -
ARGENTINA
PROVINCIAL GOVERNMENT FINANCE STUDY
Table 24b
Overall Deficit/Surplus or Need for Financing
by Provincial group and Province:1981-1986
X Of Gross Provincial Product
Groups 1981 1982 1983 1984 1985 1986 Mean Coefficient
Provinces 1981-86 of Variation
<a)
TOTAL (2.3) (0.8) (0.4) (2.4) (1.3) (1.5) (1.4) (51.1)
ADVANCED (1.7) (0.4) (0.0) (1.3) <0.6) (0.5) <0.8) <70.7)Federal Capital (0.3) (0.4) (0.4) (1.4) 0.4 0.9 (0.4) (167.2)
Buenos Aires (1.9) 0.0 0.2 (0.6) (1.0) (0.ó) (0.7) (105.2)
Cordoba (2.7) (0.9) 0.0 (1.8) (1.6) (1.7) (1.4) (59.4)
Mendoza (7.8) (1.1) 0.1 (2.3) (0.9) (2.9) (2.4) (106.6)
Santa Fe (1.6) (1.0) 0.2 (2.6) (1.0) (1.7) (1.2) (73.4)
LOW DENSITY (3.9) (2.2) (2.1) (4.4) (2.8) (3.6> (3.1) (28.0)
Chubut (2.2) (1.3) 1.6 (1.1) (3.4) (2.4) (1.4) (115.5)
La Pampa (3.2) (2.2) (4.9) (3.6) (2.2) (2.9) (3.2) (28.6)
Neuquen (3.2) <2.l3) (2.1) (5.1) (0.9) (1.7) (2.8) (47.0)
Rio Negro (4.8) (2.7) (3.1) (5.5) (2.9) (6.1> (3.8) (35.4)
Santa Cruz (7.9) (0.6) (4.3) (9.0) (6.4) (5.9) (5.6) (47.6)
INTERMEDIATE (3.4) (1.0) (0.4) (4.8) (1.9) (4.0) (2.3) (68.3)
Entre Rios (4.4) <0.6) (0.4) (1.5) (0.3) (1.7) (1.4) (100.6)
Salta (3.0) (0.7) (1.7) (8.3) (5.0) (9.9) (3.7) (90.5)
San Juan <4.7) (2.2) 0.1 (9.4) (1.8) (4.6) (3.6) (84.3)
San Luis (2.5) (1.0) (0.8) t7.5) (0.7) (3.4) (2.5> <95.9)
Tucuman (2.6) (1.2) 0.1 (3.1) (1.4) (1.8) (1.6) (62.6)
UNDERDEVELOPED (6.3) (3.5> (3.1) (10.4) <6.7) (7.2) (6.0) (40.4)
Catamarca (3.4) (2.4) (0.3) (9.8) (10.6) (6.3) (5.3) (71.4)
Chaco (11.4) (2.8) (1.1) (6.0) (5.5) (8.3) (5.4) (63.3)
Corrientes <4.5) (7.2D (5.2) (13.5) (9.7) (7.6) (8.0) (37.4)
Formosa (10.4) <7.0D (13.2) (23.3) (12.0) (16.2) (13.1) (39.0)
Jujuy (3.7) (1.9) (1.5) (11.0) (4.3) (3.5) (4.5) (70.1)
La Rioja (14.1) (5.1) (9.6) (18.6> (18.0) (27.6> (13.1) (54.9)
Misiones (5.0) (1.0) (1.3) (7.8) t4.4) (6.1) (3.9) (62.7)
Santiago del Estero (4.7) (2.6) (0.8) (4.8) (1.3) (1.3) (2.8) (56.7)
(a)Standard deviation/mean 1981-1986

- 213 -
ARGENTINA
PROVINCIAL GOVERNMENT FINANCE STUDY
Tabie 24c
Overall Deficit/Surplus or Need for Financing
by Provincial group and Province:1981-1986
USS of July 1988 per capita
Groups 1981 1982 1983 1984 1985 1986 Mean Coefficient
Provinces 1981-86 of Variation
(a)
X
TOTAL (45.9) (15.0) (7.8) (48.0) (24.7) (29.3) (28.2) (52.3)
ADYANCED (37.7) (7.9) <0.3) (29.3) (13.5) (12.0) (17.7) (72.0)
Federal Capital (15.4) (19.0) (18.7) (69.7) 19.3 43.5 (20.7) (170.5)
Buenos Aires (33.0) 0.7 2.8 (10.4) (16.0) (10.7) (11.2) (105.6)
Cordoba (44.8) (14.3) 0.1 (32.0) (28.2) (30.4) (23.8) (59.9)
Mendoza (124.8) (20.8) 1.6 (43.1) (17.0) (53.8) (40.8) (99.8)
Santa Fe (34.9) (21.2) 5.4 (60.8) (21.6) (38.5) (26.6) (75.7)
L0W DENSITY (111.7) (60.9) (58.9) (119.3) (74.8) (97.2) <85.1) <27.9)
Chubut (74.7) (55.7) 50.8 (34.1) (97.9) (69.8) (42.3) (112.8)
La Pmpa (71.7) (48.9) (124.3) (92.7) (65.1) (85.5) (80.5) (29.5)
Neuquen (120.6) (91.8) (67.2) (161.6) (28.1) (50.4) (93.9) (47.5)
Rio Negro (99.7) (62.2) (69.4) (114.5) (62.0) (130.6) (81.6) (32.9)
Santa Cruz (289.1) (21.7) (142.2) (282.9) (189.1) (172.4) (185.0) (48.9)
INTERMEDIATE (49.6) (15.2) (6.3) (68.6) (27.0) (58.6) (33.3) (68.7)
Entre Rios <60.3) (7.5) (4.8) (19.6) (3.2) <21.6) <19.1) (102.6)
Salta (40.2) (9.7) (23.1) (113.9) (74.1) (149.5) (52.2) (95.8)
San Juan (56.8) (24.1) 1.6 (98.9) (20.6) (54.8) (39.8) <81.4)
San Luis (49.6) (22.0) (14.2) (141.5) (11.8) (61.7) (47.8) (93.7)
Tucuman (42.6) (20.1) 1.7 (51.1) (21.5) (28.9) (26.7) (63.6)
UNDERDEVELOPED (64.7) (37.2) (31.5) (104.5) (64.6) (70.5) (60.5) (39.6)
Catamarca (36.4) (27.3) (3.5) (137.2) (134.9) (82.4) (67.9) (76.7)
Chaco (96.0) (23.7) (9.2) (50.7) (44.6) (68.9) (44.8) (63.4)
Corrientes (54.7) (83.2) (60.6) (157.4) (107.0) (86.2) (92.6) (36.9)
Formosa (94.2) (58.8) (110.0) (184.7) (90.2) (123.2) (107.6) (36.0)
Jujuy (56.7) (29.2) (21.1) (150.9) (58.2) (48.7) (63.2) (67.3)
La Rioja (134.1) (46.1) (87.3) (169.6) (158.2) (243.7) (119.1) (52.6)
Misiones (46.2) (9.4) (13.0) (72.5) (37.4) (52.5) (35.7) (61.6)
Santiago del Estero (39.0) (26.1) (6.9) (39.6) (11.2) (11.4) (24.6) (54.5)
(a)Standard deviation/mean 1981-1986

- 214 -
ARGENTINA
PROVINCIAL GOVERNMENT FINANCE STUDY
Table 25a
Net Variaticn in Short Term Assets and Liabilities
by Provincial Group and Province:1981-1986
Mitllions of US$ of july 1988
Groups 1981 1,982 1983 1984 1985 19.86 Mean Coefficierit
Provinces 1981-86 of Variation
(a)
X
TOTAL (412.1) (9.5.3) 196.4 (860.6) (442.8) (392.7) (322.5) (101.1)
ADVANCED (328.1) (591.8) 193.0 (458.4) (232.8) (116.7) (177.2) (117.2)
Federal CapitaL (7.0) (51.9) 0.0 (165.6) (3.1) 86.6 (45.5) (166.2)
Buenos Aires (267.0) 36.1 111.4 (68.3) (145.2) (71.8) (66.6) (182.5)
Cordoba (48.0) (18i.9) 22.1 (62.6) (47.2) (48.2) (30.9) (91.1)
Mendoza (13.0) (1tl.1) 17.2 (43.4) 3.2 (23.1) (9.2) (207.3)
Santa Fe 6.9 (15i.0) 42.3 (118.5) (40.4) (60.2) (24.9) (204.9)
LOU DENSITY (10.6) (2.2) 1.2 (74.0) (29.4) (29.4) (23.0) (110.1)
Chubut (0.8) (0.6) 26.5 0.0 (11.3) (3.4) 2.8 421.9
La Papa 6.8 (3.8) (19.7) (12.5) (2.6) (4.6) (6.3) (130.6)
Neuquen (4.4) (5.3) (0.4) (24.8) 2.3 (1.5) (6.6) (136.0)
Rio Negro (5.9) (0.5) (9.4) (25.4) (12.5) (11.5) (10.8) (70.7)
Santa Cruz (6.3) 8.1 4.2 (11.4) (5.3) (8.3) (2.1) (325.0)
INTERMEDIATE (29.9) (0.7) 14.7 (146.3) (44.9) (100.5) (41.4) (135.3)
Entre Rios (10.2) 5.7 3.4 0.0 3.8 (5.1) 0.5 1,046.8
Satta (16.2) (5.2) (14.6) (58.9) (26.3) (81.7) (24.2) (112.8)
San Juan 2.2 4.8 6.9 (27.7) (5.2) (5.1) (3.8) (303.4)
San Luis 0.4 (1.9) 2.3 (16.8) 0.0 4.7 (3.2) (218.3)
Tucuman (6.1) (4.2) 16.6 (42.9) (17.2) (13.4) (10.7) (165.4)
UNDERDEVELOPED (43.5) (30.6) (12.4) (181.8) (135.7) (146.0) (80.8) (80.4)
Catamarca 4.6 (2.3) 2.7 (20.7) <25.9) (13.0) (8.3) (139.1)
Chaco <7.7) 1,0 1.2 (16.5) (17.4) (31.0) (7.9) (143.8)
Corrientes (12.2) (18.5) (24.8) (46.4) (53.9) (35.8) (31.2) (47.8)
Formosa (8.9) (1.8) (0.8) (16.7) (15,.2) (25.3) (8.6) (100.0)
Jujuy (4.9) (2.5) 0.0 (49.3) (8.0) (10.5) (12.9) (129.9)
La Rioja (6.8) (6.0) (11.5) (22.8) (18.3) (36.4) (13.1) (80.7)
Misiones (0.9) 6.9 19.7 0.0 (0.6) (4.4) 5.0 159.7
Santiago deL Estero (6.7) (7.6) 1.1 (9.4) 3.6 10.5 (3.8) (187.0)
(a)Standard deviation/mean 1981-1986

- 215 -
ARGENTINA-PROVICIAL GOVERNIENT FINANCE STULY
Table 25bNet Vartetien Shot em Mu ts ad Liabitftles
by Provocial Grou aod Provine.:19B1-1986% Of Groes Provincial Product
*ros 1981 1982 1963 1984 1985 1986 Mean CoefficientProvInco 1981-86 of Variation
<a>
. .................... ......................... ....................................................... ...........
TOTAL (0.7> (0.2) 0.3 (1.4) (0.7) (0.6) (0.5) (99.8)ADVA=ED (0.7) (0.1) 0.4 (1.0) (0.5) (0.2) (0.4) (116.8)Fda ral Cpital <O.0> (0.4) 0.0 <1.2) (0.0) 0.6 <0.3) (162.3)auns Aires (1.4> 0.2 0.6 <0.3) (0.7) (0.3) (0.3) (185.9)Cardba 0<1.2) <0.S> 0.5 <1.4) (1.1) <1.0) (0.7) (88.0)M~Z&a (0.7) <0.4) 0.7 (1.8) 0.1 (0.9) (0.4) (190.5)Santa Fe 0.1 (0.3) 0.7 <1.9) (0.7) (1.0) (0.4) (209.1)
LOW DE01IT8 (0.3) <0.1) 0.0 (2.0) (0.8) (0.7) (0.6) <109.8)chubut <0.1) (0.1) 3.0 0.0 (1.3) (0.4) 0.3 426.0La PaW 1.4 (0.8) (3.6) (2.1) (0.4) <0.7) (1.1) (141.1)nu <0.5) <0.6> (0.0) (2.7) 0.2 (0.2) (0.7) (135.9)Rio Iegro (0.7) (0.1) <1.0) (2.7) (1.3) (1.1) (1.2) <70.6)anta Cruz (1.4> 2.0 1.0 (2.8> (1.3) (2.0) <0.5) (327.8)
IMTEUDIATE <0.6> (0.0) 0.3 (2.9) (0.9) (1.9) (0.8) (132.8)Entre Rf1« (0.8) 0.5 0.3 0.0 0.3 (0.4) 0.0 917.3Sata <1.8) (0.5) (1.5) (5.8) (2.4) (7.0) (2.4) (99.9)SUn Juan 0.4 0.9 1.3 (5.2) (0.9) (0.8) (0.7) (303.0)Sn Luis 0.1 <0.4) 0.6 (3.9) 0.0 1.1 (0.7) (222.0)Tucan (0.4) (0.2) 0.9 (2.4) (1.0) (0.7) (0.6) (162.2)
UNDERDEVELOPED <1.1) <0.8) (0.3) (4.6) (3.5) (3.6) (2.1) (79.0)Catarca 2.0 (1.0) 1.0 (6.6) (9.0) (4.3) (2.7) (148.4)Chaco <1.3) 0.2 0.2 (2.6) (2.7> (4.7) <1.2) (139.2)Corrfentes <1.5> <2.3) (3.1) <5.7) (6.8) (4.3) (3.9) (47.8)Forsa (3.2) <0.7) (0.3) (6.5) (6.0) (9.8) (3.3) (101.1)iujuv <0.8) (0.4) 0.0 (7.8) (1.2) (1.6) (2.0) (130.9)La Rioja (4.2) <3.8) (7.3) (14.1) (11.5) (22.4) (8.2) (78.7)mieln (0.2) 1.1 3.2 0.0 (0.1) (0.7) 0.8 161.1
nttiao del Estero (1.3) (1.2) 0.2 (1.8) 0.7 1.9 <0.7) <185.9)............................................................ ......................... ....1......191
(a)Sttrd dlvetien,v 1981-19%

- 216 -
ARGENTINA
PROVINCIAL GOVERNMENT FINANCE STUDY
Table 25c
Net Variation in Short Term Assets and Liabilities
by Provin,cial Group and Province:1981-1986
US$ of July 1988 per capita
Groups 1981 1982 1983 1984 1985 1986 Mean Coefficient
Provinces 1981-86 of Variation
(a)
TOTAL (14.5) (3.2) 6.7 (28.6) (14.5) (12.6) (10.8) (100.4)
ADVANCED (16.3) (2.9) 9.2 (21.6) (10.8) (5.3) (8.5) (117.3)
Federal Capital (2.4) (17.8) 0.0 (57.0) (1.1) 29.9 (15.7) (166.5)
Buenos Aires (24.1) 3.2 9.6 (5.8) <12.0) (5.8) (5.8) (184.7)
Cordoba (19.6) (7.6) 8.7 (24.4) (18.1) (18.2) (12.2) (90.3)
Mendoza (10.6) (8.1) 13.5 (33.4) 2.4 (17.1) (7.2) (203.1)
Santa Fe 2.7 (5.9) 16.4 (45.4) (15.2) (22.4) (9.5) (206.6)
LOW DENSITY (8.5) (1.7) 0.9 (53.1) (20.4) (19.7) (16.6) (109.0)
Chubut (2.8) (2.1) 91.5 0.0 (36.4) <10.7) 10.0 398.2
La Pampa 31.9 (17.5) (89.5) (55.4) (11.1) (19.8) (28.3) (133.6)
Neuquen (17.4) (20.0) (1.5) (84.9) 7.4 (4.7) (23.3) (130.5)
Rio Negro (14.9) (1.3) (21.9) (56.9) (27.1) (24.0) (24.4) (68.9)
Santa Cruz (53.1) 65.9 33.5 (87.3) (39.6) (60.1>) (16.1) (338.1)
INTERMEDIATE (9.1) (0.2) 4.3 (41.9) (12.6) (27.7) (11.9) (133.4)
Entre Rios (11.1) 6.2 3.6 0.0 3.9 (5.2) 0.5 1,165.3
Salta (23.8) (7.4) (20.3) (80.0) (34.8) (105.3) (33.3) (105.9)
San Juan 4.6 10.0 14.0 (55.1) (10.2) (9.7) (7.3) (313.9)
San Luis 1.9 (8.8) 10.4 (73.7) 0.0 20.1 (14.0) (217.6)
Tucuman (6.1) (4.1) 15.9 (40.0) (15.7) (12.0) (10.0) (166.2)
UNDERDEVELOPED (11.7) (8.1) (3.2) (45.9) (33.5) (35.3) (20.5) (77.9)
Catamarca 21.8 (10.7) 12.2 (92.6) (113.7) (56.1) (36.6) (140.4)
Chaco (10.7) 1.4 1.6 (21.6) (22.3) (38.8> (10.3) (138.4)
Corrientes (18.1) (27.0) (35.8) (65.8) (75.3) (49.2) (44.4) (45.9)
Formosa (29.3) (5.6) (2.4) (51.3) (45.5) (74.4) (26.8) (94.8)
Jujuy (11.6) (5.7) 0.0 (106.5) (16.7) (21.4) (28.1) (128.9)
La Rioja (40.5) (34.9) (66.5) (128.6) (101.5) (198.1) (74.4) (76.0)
Misiones (1.5) 11.11 30.8 0.0 (0.9) (6.31, 7.9 157.8
Santiago del Estero (11.1) (12.4) 1.8 (14.7) 5.5 15.8 (6.2) (179.8)
(a)Standard deviation/mean 1981-19&5

- 217 -
ARGENTINA
PROVINCIAL GOVERNMENT FINANCE STUDY
Table 25d
Net Variation in Short Term Assets and Liabitities
by ProvinciaL Group and Province:1981-1986
X of Total Deficit Surplus
Groups 1981 1982 1983 1984 1985 1986 Mean Coefficient
Provinces 1981-86 of Variation
(a)
TOTAL 31.6 21.5 (85.8) 59.7 58.6 43.0 17.1 291.3
ADVANCED 43.1 36.8 (3,198.6) 73.7 80.0 44.4 (593.0) (204.5)
Federal Capital 15.7 93.9 0.0 81.8 (5.6) 68.8 37.2 108.3
Buenos Aires 72.8 443.5 346.6 55.5 75.1 54.3 198.7 79.8
Cordoba 43.8 53.3 12,800.0 76.4 64.3 60.0 2,607.6 182.1
Mendoza 8.5 38.8 865.2 77.5 (14.2) 31.7 195.2 160.4
Santa Fe (7.9) 27.8 303.1 74.6 70.6 58.2 93.6 107.2
LOW DENSITY 7.6 2.8 (1.5) 44.6 27.3 20.3 16.1 98.4
Chubut 3.8 3.7 180.1 0.0 37.2 15.3 45.0 142.0
La Pampa t44.5) 35.7 72.0 59.8 17.1 23.2 28.0 133.6
Neuquen 14.4 21.7 2.3 52.5 (26.2) 9.3 12.9 181.3
Rio Negro 14.9 2.1 31.5 49.7 43.7 18.4 28.4 58.5
Santa Cruz 18.3 (304.4) (23.6) 30.9 20.9 34.9 (51.6) (234.7)
INTERMEDIATE 18.4 1.5 (67.7) 61.1 46.8 47.3 12.0 359.4
Entre Rios 18.4 (82.6) (75.0) 0.0 (122.0) 24.1 (52.2) (107.4)
Salta 59.3 76.4 88.0 70.2 46.9 70.4 68.2 19.0
San Juan (8.1) (41.3) 888.9 55.7 49.3 17.7 188.9 173.4
San Luis (3.9) 40.0 (73.0) 52.1 0.0 (32.6) 3.0 1,385.8
Tucuran 14.4 20.3 919.0 78.3 73.1 41.5 221.0 147.7
UNDERDEVELOPED 18.1 21.8 10.2 44.0 52.0 50.0 29.2 56.6
Catamarca (59.8) 39.1 (344.4) 67.5 84.3 68.1 (42.7) (353.4)
Chaco 11.2 (5.8) (17.5) 42.6 50.1 56.4 16.1 176.3
Corrientes 33.2 32.5 59.0 41.8 70.3 57.1 47.4 29.8
Formosa 31.1 9.6 2.2 27.8 50.5 60.4 24.2 84.9
Jujuy 20.4 19.6 0.0 70.6 28.8 43.8 27.9 79.4
La Rioja 30.2 75.7 76.1 75.8 64.2 81.3 64.4 26.9
Misiones 3.3 (117.9) (236.1) 0.0 2.4 12.0 (69.7) (132.3)
Santiago del Estero 28.4 47.5 (26.0) 37.2 (49.1) (139.4) 7.6 854.8
(o)Standard deviation/mean 1981-1986

- 218 -
ARGENTINA
PROVINCIAL GOVERNMENT FINANCE STUDY
Table 25e
Net Variation in Short Term Assets and LiabiLities
by Provincial Group and Province:1981-1986
% of Total Expenditures
Groups 1981 1982 1983 1984 1985 1986 Mean Coefficient
Provinces 1981-86 of Variation
(a)
TOTAL (5.5) 01.8) 3.0 (11.6) (6.5) (4.8> (4.4) (100.2)
ADVANCED (7.4) C2.0) 5.6 (11.3) (6.3) (2'.7) (4.3) (123.2)
FederaL CapitaL (0.9) (8.7) 0.0 (21.0) (0.5) 12.6 (6.2) (163.4:)
Buenos Aires (13.4> 2.6 6.8 (3.9) (8.7) (3.7) (3.3) (203.0)
Cordoba (8.5) (4.9) 4.9 (11.7) (8.9) (7.9) (5.8) (91.8)
Mendoza (2.8) (3.9) 5.8 (14.5) 1.1 (5.6) (2.8) (219.0>
Santa Fe 1.2 (3.5) 7.6 (17.9) (6.9) (8.4) (3.9) (202.9)
LOW DENSITY (1.5) (0.4) 0.2 (9.1) (3.4) (2.8) (2.9) (107.4)
Chubut (0.5) (0.5) 18.2 0.0 (7.4) (1.8) 2.0 404.1
La Pampa 6.5 (4.6) (15.9) (11.3) (2.0) (3.2) (5.5) (129.6)
Neuquen (2.9) (:S.7) (0.2) (10.7) 1.1 (0.5) (3.3) (116.9)
Rio Negro (3.4) (0.4) (5.3) (13.3) (6.6) (4.6) (5.8) (68.3)
Santa Cruz (5.0) 7.3 2.6 (7.0) (3.2) (4.1) (1.0) (472.7)
INTERMEDIATE (3.1) (0.1) 1.6 (13.2) (4.5) (8.1) (3.9) (127.6)
Entre Rios (4.3) 3.4 1.4 0.0 1.6 (1.7) 0.4 596.7
Salta (7.6) (3.2) (6.9) (21.3) (10.1) (22.5) (9.8) (74.7)
San Juan 1.2 3.9 3.8 (14.5) (3.3) (2.6) (1.8) (350.2)
San Luis 0.4 (3.0) 3.0 (14.9) 0.0 4.4 (2.9) (220.2)
Tucuman (2.7) (2.4) 8.5 (17.2) (7.0) (5.0) (4.2) (181.2)
UNDERDEVELOPED (3.1) (3.2) (1.0) (12.3) (10.2) (9.5) (6.0) (71.5)
Catamarca 4.5 (3.0) 2.8 (16.9) (18.5) (10.3) (6.2) (144.4)
Chaco (2.0) 0.6 0.6 (7.1) (7.9) (11.8) (3.2) (145.1)
Corrientes (5.8) (11.1) (12.5) (18.3) (24.5) (14.7) (14.4) (40.7)
Formosa (6.3) (1.5) (0.4) (8.8) (9.8) (12.9) (5.4) (82.7)
Jujuy (3.4) (2.5) 0.0 (25.1) (5.1) (6.4) (7.2) (115.2)
La Rioja (7.3) (9.3) (12.9) (22.2) (16.0) (22.5) (13.5) (43.3)
Misiones (0.6) 6.3 12.3 0.0 (0.4) (2.3) 3.5 145.2
Santiago deL Estero (3.8) (5.5) 0.6 (5.3) 2.2 5.91 (2.3) (180.8)
(a)Standard deviation/mean 1981-19186

Distributors of World Bank PublicationsARGENTINA FINLAN^ MEXICO SPAINCl i SRL Aketsoina Kr INFOTEC Mndi-P Libros.SA.CG~d Guat FA). BOa 125 Apatdo Postal 22-~1 Csrll3lFda 165,4th Re~-O 4531/465 SF-0010 14060 Tnp.M M~dosO> 2D0.1.Maid1333 B~s.Ar HSalr 10
MOBocco Lib-eta fnleaeina AEDOSIAUSTRALl, PAPUA NEW GUINEA, FRANCE SMORO d`d-OMau g Ma CeleCiaí391FI,SOLOMONISLANOS Wodd bank~ 'eiflS 12 e Mnet, Id. dAl'fia WIblr .lanVANUATU, AND WESTERN SAMOA 66. avne dlhu C banDA.~Boola&J.Urna 75116 País SR LANKA AND TIS MALDIVES646 Wbidens Road NETmBILANDB LkeiaHwmBan1i.pHita 3132 GERMANt, FEDERAL R LIC OP UnOrPu meb.. PO. SE. 244Vlelnt UNO-VIag P.O Roe 14 ífSrklapls.adn
Popplodf~Wle5S 7240 EA Loaban Mawath.AUSTRIA 0.630 B~o 1 Closbo 2Canil sedCo. NEW ZE.ALANDGraba31 GREECE H, ¡Ub,fr o -d hrf-t S-vRe SWEDENA-1011 Wken 1(EME Pivaielts Por sltille
24,A} Ahlp S Pt a New~ Mat Floi Flebok tareaBAlIRAIN A ~1be1635 Audlaní Rog~lngsan 12, oB 16356Iaxj Reearl &md CoalacS-102 27~SnlA~
A.~ Ted. GUATEMALA NIGERIAPO. to 22103 iUbre7 Pdr Sata rieteLty Pee. o,nor len:MariasTown317 Sa. Calle 7-15 Tkm Cflxe gJaideo Weeegr-Wilhae AB
Zare 1 PeiveiebMailfg SlS BonSX1iANGLADESH cutal City bdanvM S-1042StocknlmMi~ IndsutaiDevelrpoat
Ance Solety ~AIDAS) HONG RONG, MACAO NORWAY SW1TZERLANDllameS Red 16 ASia 32= Uid. Nervos loteanio Castor Po- inÍt ltIo:Dhao R/Area M gok Pot Office Bank Dputeent lábairie Pay
051a1209 Bul Stee No. 37 Pro. Blo 6125 Ensta 6,anerucaaMongk k,I Ien NC ow.646020da Caap 3iae 281
Brande offow ~~~~~~~Hog Ko.g 04 1211 Gasevolí154 NneA..a Sarak OMANClitbsg 4#10 HUNGARY MEMRB nffetion Servie Por enacption orle
-, Av e. o PO. fn 1613, 5ebAio Lbrae Payot76. KD.A. Aveia P.O. Sa 19 Hisca S~,te leAb~wiontslluIna 1389 Budpet 62. Ccepobir 3212
PAKISTAN CH 1002 L neBELGIUM INDIA MíJat Bank .AgecPiblietos de Ndona Une AMied Pub b Peivawte Lid. 65, Sbhrh-~dcA~ TANZANIAA,v. du Ro 202 751 Mrs ROD P.O. Bx No. 729 Oroad Univanity Presa1042 Besase~s M/aIa -6 02072 L~as 3 P.O. BSan 29
BRAZIL Brde P'dRU oe sdarmPnbltbroosTernncrsbtasaenua 153jN.Hella Marg Edit~oit1DerroDloSA THAILAND
Ltda 2 Ballad Ente Apartado 3824 Central Dpartment StoeiRus Paxto Cinnal, 239 Soobey -400 08 Lima 316 Silas ERad01409 Sao Paule, SP 13/14 Ao Ala Sngl Rodk
CANADA New Déi - 110 002 National Ende Stoe TRINIDAD & TOBAGO, ANTIGUA1.aDflsee 701 Rizal Avern BARBUDA.BARBADOS,CP . IS B rueAmp¿re 17 Cuittaranan Aveno P.O. Son 1934 DOMINICA, GRENADA, GUYANA,BSemdai QuIt Cae -710022 MotrMarla JAMAICA, MONTSERRAT, ST.
348 5E6 KDrTS & NEVIS, ST. LUCIA,Jayadev.Hn~iBudding POLAND ST. VINCENT & GRENADINES
~3SA Site 5a Rod Caadktga (YRPAN Sytanli S&udin UnlChna ada & Ero~nic Publiltng Bapngalo - 56D 019 Piae Kltuay Nanl 49e~s~9 5/rr Se
03-011 warsaw CanpeLDa Fo SiOagJle 3-51-1129 Yadugdel Cree Roel Trindad, Wos IndieBiing Hyderabd -SC0 027 PORTUGAL
Lmnraea Palgal TURICECOLOMBlA Pra ehaa 2ed PFlan Ru Do Ca;o 70-74 Hiet Kapv A.S.Enlae Lila. NeaThekoefBig,Navnnpw~22 ib IaileelCd&ale No. 449Apartdo Aav 24270 Ahleselbal-28009 opgBoBoa D.E. Pdi;fi; Houre SAUDI ARABIA, QATAR Uitimbul
Fa". H~ ~~~~~~~~~J.te Bank St..eCOTE dDIVOet f 16-A Ashko M.ao P.O. bnx 3196 UGANDACatre lEditi(n el de Dis Lucloos- 226 021 Riyadh 11471 Uganda Bookilop
Afetain (CEDA) P.O. Bo. 714504 D.F. 541 Eç7DNEStA MEMRB Infumation Serisi KPmpalaAbil»n 04 Platean PL. Indira Iantdl 9ará
JI. Sani S.etulawg 3 Al Ale ;Street UNITEDARABEMIRATESCYPRUB P.O. So. 161 Al abn C~t MEMOB GuI Co..MEMO lf ation Se e JaBox 7DF PRn. l P.O. Bon 6097P.O. Bose 251 PA. on .7188 SkajaNicdai tTALY RiyadkDSNMAfimdsLi~RIduL C ---sael a S.nnal SPA HUNTHD tINGDOMDENMAER ~~~~~~~~~~vta B-.edee Pratn 120/10 SISjAbdUII Alet B.ntdg Mioin Leí.SasíanlLtteir~ Ca..la Postil 552 King iost Sie P.O. LI 3RDK-°, na0 lli C 3125PloSrren P.O. nox 3969 Altse, Hanepehies G1E34 2PG5-1970 FeeleabeE C JAPAN D -sean Englend
DOMuNICAN RPuBIC Ruten Bnk Se 33P. M aex HAssa Aw Srt URUGUAYElisiT. TllnC. por A 37-A, Ha-go 3-Chse Sleok. 113 P.lfO. 8 978 loalitretoNada.d a lbroReatauraaln elaabdl Católic 309 Tekyo Jeidht San Joe1116Apartado PFoa 2190 MontevideSamto Deniego XENYA SINGAPORE, TAIWAN, MYANMAR,
AELro Bank SOio (EA.) Lid. BRUNEI VENEZUELAEL SALVADOR PO. flor 45245 aoPubetion libraia de EntePaida Nai.obi Privat;c Ltd. Aptdo. 62.337AverilaMasae oE~ee Mauen 43530 02-456 lee PI, P.¡-Fn lndnos Carcs1060-AEdiSdo SISA, Ira. PFo KOREA, REPUBUC OF B04*LSa Salvant Pee ll-a tol Csjeai 24 New Initra Roel YUGOSLAVIA
P.O. B. 101, Kwaeh-basin~ I953 JKgolnaatljgaEGYPT,ASABREPUBLC OF Sers) PO. LI. 28Al Aisii SOUTH AFRICA, BOTSWANA Tg RepublikeAl Galaa Sise KUWAIT Par e.lg tille YU-lI1lllBel1raíCate MEMiRBn~;foin&ioneSernies Ohrad U-verity Pr Soetheen
TheMiddleEaeeOt e PO.r 11418 C2,asab lotee MALAYSIA Cp T _Cairo Univaty rl Malaya Cop-vative -POTox1
PO. BS 1127, Jla PaniaB- Soae l l-onS,viellesal Lspre P.O. LI 41096
CJTJneRsn 7D4


IBRD 20474
B O L IV IA O
SOUTH 1 EAcas UTH
A M E R I C AConoiSari, + 0 l PARAG C7U AY
-~~~~~~~~~~~~Y
2 ' / / i ó.<&>~ -~ SALTA ALcu Losis Rk_O--A 8 \iArgenl *v / (urd nU ASuNCIóN
7 ) ( |. : hsAnN,TITAei ,- RESISTNEPOADAS N
i jORRMEA
l<RIO,i,l<AR j SA NTA t,()Y,py B R A Z I L30~ ~ ~~~~~~~~~~~o FzX ¡E d.e lo lib-M
5.- da d origoy"n
SANTfAGO6 U $ R U G U A Y R'
ro /12 MN ONIES_O,/
ANTanqea ORINE
P A EP L EP ROSAI O E NEN TRES E
.~~~~~~~~~Ba ¼ '-' Y as,e ,,
LA ROJA ' A Ca 2 BZAHÍA 1 LMAR DEL PLATA
pW 4/,/ R -D N E G PRs O - o L
5 /' '-rIED M~~~~~~EDA >
Ik,AN JuN
) |C H U 2,i U T
SAN-AO \( ARGENTINAtU P 1 \ > COMODORO~ t= 7~~~-' _ RIVADAVIA
\ { ~~~~~~~~~~~~~~~~~Pririory r<>odsI i Fl~~~tz Roy Poved or grovei rroaM
u) , - ----a Earth raadsC 2 S A N T A * Pr,ncpjlpoí arports
X C R ': Z ~~~~~~~~~~~~~Provincia¡ bolJndories/ < El Salodo _,-. í~~~~~~~~~~nternaltioral bovondorties
50' L-~~~~~~~~~~~~~~~~~~~~~~~~~~~~~~~~~~? (~ ~ ~ ~ ~ ~ ~ ~~~~~5.f o*> SARiO GALALEGOS :-UENOS AIRES
Si ¡ERRA DEL¡-tFUEGO 0 200 400 ooO 800
,//95 ~~~~~~~~~~~KILOMETERSj *aA SEo iaou 200 300 400 sCoS
MRLEES
sO- 70~~ ~~~~~- RIVADAVI
NOV EM BER 1987


The World Bank
Headquarters European Office Tokyo Office1818 H Street, N.W. 66, avenue d'Iéna Kokusai BuildingWashington, D.C. 20433, U.S.A. 75116 Paris, France 1-1 Marunouchi 3-chome
Chiyoda-ku, Tokyo 100, JapanTelephone: (202) 477-1234 Telephone: (1) 40.69.30.00Facsimile: (202) 477-6391 Facsimile: (1) 47.20.19.66 Telephone: (3) 214-5001Telex: wui 64145 WORLDBANK Telex: 842-620628 Facsimile: (3) 214-3657
RCA 248423 WORLDBK Telex: 781-26838Cable Address: INTBAFRAD
WASiHINCTONDC
ISBN 0-8213-1634-6