PUB-2245 - World Bank Documents & Reports
144
A WORLD BANK COUNTRY STUDY PUB-2245 BANGLADESH Current Trends and Development Issues FILE COPY MARCH 1979 Public Disclosure Authorized Public Disclosure Authorized Public Disclosure Authorized Public Disclosure Authorized Public Disclosure Authorized Public Disclosure Authorized Public Disclosure Authorized Public Disclosure Authorized
-
Upload
khangminh22 -
Category
Documents
-
view
3 -
download
0
Transcript of PUB-2245 - World Bank Documents & Reports

A WORLD BANK COUNTRY STUDY PUB-2245
BANGLADESHCurrent Trends and Development Issues
FILE COPY
MARCH 1979
Pub
lic D
iscl
osur
e A
utho
rized
Pub
lic D
iscl
osur
e A
utho
rized
Pub
lic D
iscl
osur
e A
utho
rized
Pub
lic D
iscl
osur
e A
utho
rized
Pub
lic D
iscl
osur
e A
utho
rized
Pub
lic D
iscl
osur
e A
utho
rized
Pub
lic D
iscl
osur
e A
utho
rized
Pub
lic D
iscl
osur
e A
utho
rized


BANGLADESHCurrent Trends and Development Issues
South Asia Regional Ofice.The Weod Bank
Wauhington, D.C., U.S.A.

The World Bank issues country economic studies in two series. This report is a workingdocument and is, as such, part of an informal series based wholly on materials originallyprepared for restricted use within the Bank. The text is not meant to be definitive, but isoffered so as to make some results of internal research widely available to scholars andpractitioners throughout the world. A second, more formal series entitled World BankCountry Economic Reports is published for the Bank by The Johns Hopkins UniversityPress, Baltimore and London. Titles of these and all other Bank publications may befound in the Catalog of Publications, which is available free of charge from World Bank,Publications Unit, 1818 H Street, N.W., Washington, D.C. 20433, U.S.A.
This report is a free publication. A small charge may be made if airmail postage isrequired.
The views and interpretations in this report are the authors' and should not be attributedto the World Bank, to its affiliated organizations, or to any individual acting on theirbehalf.
Copyright (C 1979 The International Bank for Reconstructionand Development/The World Bank
The World Bank enjoys copyright under Protocol 2 of the Universal Copyright Conven-tion. Nevertheless, reproduction of any part of this report is hereby granted providedthat full citation is made.

Preface
This report was prepared as background document for the meeting ofthe Bangladesh Aid Group in January 1979. As such, it is part of the WorldBank's ongoing reporting on economic developments in Bangladesh and givesrelatively large emphasis to short-run developments. The report, however,also discusses longer-term issues (viz., in the general management of economicdevelopment, in agricultural development, in industrial development, and indomestic resources mobilization) and because of this longer-term perspectiveit was felt that the report might be of interest to a wider readership.
This report is based on the findings of a mission which visitedBangladesh in June 1978, consisting of Carl Jayarajah (chief), Ram Agarwala,Armand van Nimmen and Vinod Thomas. Akeel AlSadi, Fred King and Gotz Schreiberalso made contributions. Cornelis Jansen bears responsibility for the over-all preparation of the report.


CURRENCY EQUIVALENTS
Prior to 1972:
US$ 1.00 = Pakistan Rs 4.762Rs 1 = US$ 0.21Rs 1,000 = US$ 210.00
January 1972 - May 1975:
Period Averages:
January - June 1972: US$ 1.00 = Tk 7.298 Tk 1,000 = US$ 137.025July 1972 - June 1973: US$ 1.00 = Tk 7.781 Tk 1,000 = US$ 128.521July 1973 - June 1974: US$ 1.00 = Tk 7.966 Tk 1,000 = US$ 125.532July 1974 - April 1975: US$ 1.00 = Tk 8.045 Tk 1,000 = US$ 124.305
May 1975 - Present:
On May 17, 1975 the Bangladesh Taka (Tk) was officially valuedat 30.00 to the Pound Sterling; the rate has been refixed on occasionsince then, most recently at 31.125 on January 15, 1979. The Pound isfloating relative to the US dollar and consequently the Taka-US dollarrate is subject to change.
Period Averages:
May - June 1975: US$ 1.00 = Tk 13.032 Tk 1,000 = US$ 76.735July 1975 - June 1976: US$ 1.00 = Tk 14.852 Tk 1,000 = US$ 67.331July 1976 - June 1977: US$ 1.00 = Tk 15.467 Tk 1,000 = US$ 64.655July 1977 - June 1978: US$ 1.00 = Tk 15.122 Tk 1,000 = US$ 66.131
A conversion rate of Tk 15 per US dollar has been used throughoutthis report for the period after April 1975 except where indicatedotherwise.
LOCAL QUANTITIES AND WEIGHTS
1 crore = 10 million1 lakh = 100,0001 maund (md) = 40 seers = 82.29 lbs.1 bale = 400 lbs.
In general, the units of measurement referred to in this reportare those which are actually used or are familiar in Bangladesh.
FISCAL YEAR
July 1 - June 30

BANGLADESH
CURRENT TRENDS AND DEVELOPMENT ISSUES
TABLE OF CONTENTS
Page No.
COUNTRY DATA
MAP
SUMMARY AND CONCLUSIONS ......... . .. . .................................... . i-x
PART I
CHAPTER 1. CURRENT DEVELOPMENTS AND PROSPECTS ............. 1A. -Introduction .... .............. .. ..... 1B. Agriculture .......... .......... 2
Foodgrains .......... . ....... . 2Jute os. .. .o .oo oo ... a...3
C. Public Finance, Money and Prices. . 5Developments in FY78 5Prospects for FY79 . . ..... 0 . 6
D. The External Sector ..... . .. ....... .O.. 9Trends in FY78 . .... . . . . . . ... o . . 9The Balance of Payments, FY79 and FY80 10Terms of Trade . 11The Payments Gap, FY79 and FY 8 O 12Aid Requirements ....... ... 15
PART II
CHAPTER 2. MANAGEMENT OF THE OVERALL DEVELOPMENT EFFORT ... 18
CHAPTER 3. ISSUES IN AGRICULTURAL DEVELOPMENT ............. 25A. Introduction ........... 25B. Planning Goals......... . 26C. Irrigation Requirements 29D. Procurement Policy .......... o ......... * ... 32E. Open Market Operations . .34
F. The Role of Jute . 35G. Agrarian Structure .......... ............. 37
CHAPTER 4. INDUSTRY'S CONTRIBUTION TO ECONOMIC DEVELOPMENT . 41A. Introduction .... ...... ... .... ... 41B. Background ........ . .... . ........ . .... .. 42C. Industrial Development After Independence... 43D. Managing the Public Sector..........o.... 46E. Improving Private Sector Policies........... 50F. Developing an Export Strategy ......... . 51
CHAPTER 5. ISSUES IN PUBLIC SECTOR RESOURCE MOBILIZATION .. 54

- ii -
TABLE OF CONTENTS (Cont'd)
Page No.
ANNEX 1: OUTPUT PRICE SUPPORT AND INPUT SUBSIDIES ......... 58 - 66
ANNEX 2: PRICE ELASTICITIES OF DEMAND FOR JUTE ,. ....s 67 - 71
STATISTICAL APPENDIX ..................... 72 - 116

TEXT TABLES
Page
1 Foodgrain Production 2
2 Production, Exports and Stocks of Raw Jute 4
3 Government Revenue and Expenditure 7
4 M4erchandise Exports 13
5 Merchandise Imports 14
6 Balance of Payments 15
7 Procurement, Distribution and Stocks of Foodgrains 16
8 Projected Aid Commitments and Disbursements 17
9 Macro-Economic Targets of the Two-Year Plan 22
10 Sectoral Allocation of Development Outlays 23
11 Production of Selected Agricultural Crops 25
12 Foodgrain Requirement Estimates 27
13 Index of Industrial Production 44
14 Summary of Trends in Manufacturing 44
15 Domestic Resource Costs in Manufacturing 47


Page 1 of 2 pages
COUNTRY DATA - BANGLADESH
AREA 2 POPULATION DENSITy (Jan. 1978)T43,998 km 85. mlin(an. 1978) 590 -2 k/
Rate of Growth: 2.7% (from 1972 to 1978) 841 per kV/of agricultural
land
POPUIATION CHARACTERISTICS (1975) HEALTH (1976)Crude Birth Rate (per 1,000) 46 Population per physician 11,350Crude Death Rate (per 1,000) 18 Population per hospital bed 4,430Infant Mortalily (per 1,000 live births) 140
INCOME DISTRIBUTION (1974) DISTRIBUTION OF LAND OWNERSHIP (1977)% of national income, hngheat quintile 38 % owned by top 10% of owners 47
lowest quintile 8 % owned by smallest 10% of owners 1
ACCESS TO PIPED WATER ( *- ACCESS TO ELECTRICITY (1973)% of population - urban .. % of population - urban 3
- rural .. - rural
NUTRITION (1975) EDUCATIONCalorie intake as % of requirements 93 Adult literacy rate % (1976) 22Per capita protein intake (grams) 58.5 Primary school enrollment X (1975) 73
1/GNP PER CAPITA in 1977 US $ 90
GROSS NATIONAL PRODUCT IN 1977/78 3/ ANNUAL RATE OF GROWTH (7.. constant prices)
_S Mln. %_ 1960-65 1965-70 1974-1978
GNP at Market Prices 7,309 100.0 4.6 3.6 6.7Gross Domestic Investment 4/ 890 12.2 15.5 6.3 15.8Gross National Saving 106 1.5 3.3 5.4Current Account Balance -786 -10.8Exports of Goods 497 6.8 2.0 3.9 1.3Imports of Goods - 1,349 18.4 12.2 6.8 6.1
OUTPUT, LABOR FORCE ANDPRODUCTIVITY IN 1977/78
3/ ~~~~~~~~2/Value Added Labor Force7 V. A. Per Worker
US$ Mln. % Min. % US 7,
Agriculture 3,929 57 23.3 78 169 73Industry 933 13 2.0 7 467 2U2Services 2,059 30 4.6 15 448 194Unallocated .
Total/Average 6,920 100.0 29.9 100 231 lOQ
GOVERNMENT FINANCECentral Goverment
(Take Mln.) 7. of GDP1977/78 5/ 1973/74 1977/78
Current Receipts 12,446 6.0 11.3Current Expenditure 10.360 6.8 9.4Current Surplus 2,086 -0.7 1.9Capital Expenditures 12,522 4.7 11.4External Assistance (net) 9,208 4.6 8.4
V/ 1978 World Bank Atlas. All other conversions to dollars in this table areat the average exchange rate prevailing during the period covered.
2/ Civilian labor force; unemployed are allocated to sector of their normaloccupation.
3/ As a result of the sharp devaluation of the Taka in 1975, the single-yearstraight exchange rate conversion of 1977/78 GNP into US$ renders animplicit per capita income estimate not strictly comparable with thoseshown in the World Bank Atlas.
4/ Monetized investment only.5/ Revised budget.
not availablenot applicable

Page 2 of 2 pages
COUNTRy DATA - BANGLADESH
MONEY, CREDIT and PRICES June 1972 June 1974 June 1975 June 1976 June 1977 June 1978(Mll] ion reka outstanding,end period)
Money and Quasi Money 6,992 12,165 12,874 14,784 18,306 22,213
Bank Credit to Public Sector 5,363 5,112 5,832 6,394
Bank Credit to Private Sector P4,266 3,267 3.011 3,546 5,145
(Percentages or Index Numbers)
Money and Quasi Money as % of GDP *- 18.6 12.7 14.9 19.2 20.2
General Price Index (1969/70 = 100) 2/ 142.4 303.7 409.7 366.1 407.5 457.3Annual percentage changes in:
General Price Index 44.4 34.9 -10.6 11.3 12.2Bank credit to Public Sector * -4.7 14.1 9.6Bank credit to Private Sector -7.8 17.8 45.1
BALANCE OF PAYMENTS MERCHANDISE EXPORTS CAVERAV E 1973-1978)
1975/76 1977/78 US Mln %
Ray jute 11 27Exports of Goods 381 497 Jute goods 207 50Imports of Goods 1,290 1,349 Tea 28 7Trade Gap (deficit -) -909 -852 Leather 32 8
Non-Factor Services (net) )Interest Payments (net) All other coumodities 34 8Workers' Remittances r3 2 66 Total 412 100Other Factor Payments (net)Net Transfers J EXTERNAL DEBT, June 30, 1978Balance on Current Account -877 -786 -v
uS $ mlDirect Foreign InvestmentNet MLT Borrowing: Public Debt, incl. guaranteed 2,556
Disbursements 570 411 Non-Guaranteed Private Debt- 7hmorietTlatIon 67 35 Total outstanding & Disbursed 2,556
Subtotal 503 376 I/Capital Grants 244, 386 DEBT SERVICE RATIO for 1?77Other Capital (net) 19Other items n.e.i i',7 -19Increase in Reserves () -53 -24 Public Debt, incl. guaranteed 13.3
Non-Guaranteed Private DebtGross Reserves (end year) 213 270 Total outstanding & Disbursed 132Net Reserves (end year)
RATE OF EXCHANGE IBRD/IDA LENDING, June 1978 (Million US $):
January - June 1972: Us$1.00 = Taka 7.30 IBRD IDAJuly 1972 - June 1973: US$1.00 - Taka 7.78July 1973 - June 1974: US$1.00 - Taka 7.97 Outstanding & Disbursed 54.9 554.2July 1974 - April 1975: US$1.00 - Taka 8.05 Undiabursed - 374.2May 1975 - June 1975: US$1.00 - Taka 13.032 Outstanding incl. Undisbursed -3w7r 928.4July 1975 - June 1976: US$1.00 = Taka 14.852July 1976 - June 1977: US$1.00 - Taka 15.467July 1977 - June 1978: US$1.00 - Taka 15.122
1/ Ratio of Debt Service to Exports of Goods only.Consumer Price Index for Government employees in Dacca; monthly averages for June.
= not availablenot applicable
January 1979

_ ; =r' ee l- > v ed6 t>Nt1 IMSt~~~~~~~~~~~~~6
r 2 0 f m mEdr= tXjR 09 09 or de o a-tesU6eDF=}X@PI7DM 1°6>@S 8° °2 t~~~HS3GV
42 2 C m .' :t24- .05 oW a o f' m - m I = : ,
X-~~ I N h5--8}IlA -@, .......... ? 2-53V9_ t
< = -I _ ) \ .nd 5 t -Sp, r V 1\4 N |t, *' C~~~~~~~~~~~~~~~~~~~~~~~~~~~~~1
i ) v t -ESXOD i~~~~~~~~~~~~~~~~~~~~~~~~~~~;ji}
2 \q , H,N -*I,C Wf 2 Iyo
SAaVVNo vNH (N; 4. N0ItA.on *ljTD SYOIXK


SUMMARY AND CONCLUSIONS
Introduction
i. This report provides a brief update on current developments,generally confirming the conclusions of the economic report of half a yearago, and makes a contribution to the discussion on a few selected developmentissues such as rural development, industrial development and domestic resourcemobilization. Economic improvements in recent years and a parallel improve-ment in political stability have removed the crisis atmosphere surroundingeconomic policy making in the early years of independence and created abreathing spell in which it is possible to think about the long-term directionof development. The period of the current Two-Year Plan (FY79 and 80) doesindeed provide a critical opportunity to come to firm decisions on long-termpolicy issues and to lay the foundation for the new Five-Year Plan.
Current Developments and Prospects
ii. Recent estimates confirm that FY78 has been a good year for theeconomy of Bangladesh. Mostly as the result of a large grain crop, whichrecovered from the substantial decline in the previous year, and a 10% in-crease in industrial output, GDP grew by 7.8% in real terms after only 1.7%growth in FY77. The favorable results in agriculture are explained not onlyby good weather, but also by beneficial actions by the Governmeht: sharplyincreased supplies of fertilizer, other agricultural inputs and credit, and alarger and more efficient procurement effort at prices attractive to farmers.Results for wheat have been particularly encouraging. Although this crop islimited to the dry (boro) season and, at present, amounts to only 3% of thevolume of total grain output, its potential for further growth is large. Thecrop is attractive because of its low production cost (low need for water) andhigh nutritional value. The farmers' eager response to this opportunity is,therefore, very welcome. Increased use of the boro season for wheat culti-vation is one of the greatest challenges and promises of agriculture inBangladesh; the net area suitable for wheat cultivation is approximately sixtimes the area presently under wheat. Jute output also increased substan-tially, partly due to the Intensive Jute Cultivation Scheme (IJCS) whichin only a few years' time has been expanded to cover 500,000 acres and isexpected to cover one million acres in the current year. For various reasons,however, including high raw jute prices, the jute mills once more sufferedlarge financial losses.
iii. It is too early for an accurate assessment of the growth prospectsfor FY79. There are some signs of dynamism in agriculture, but the weatherhas been unfavorable for the aman crop. Since investments in the public andprivate sector -- particularly in manufacturing -- are showing some growthmomentum, it is possible that the overall GDP growth rate will still be aheadof population growth and will amount to perhaps 3.5-4% in real terms.
iv. Last year's acceleration in economic growth engendered rapid fiscalrevenue growth. Adjustments in the salaries of government personnel, however,permitted only a small increase in the current surplus. At the same time,development expenditures also rose rapidly and, in spite of increased aid

- ii -
disbursements, deficit financing amounted to Tk 0.9 billion, about 7% of cur-rent revenue. Inflation reappeared, and this is the most worrisome aspect ofcurrent developments in Bangladesh. Overall liquidity continued to riseduring FY78 and to have its effect on the price level: the cost of livingincreased by 15% in FY78. Seeking to keep inflation under control, theGovernment drew up a balanced budget for FY79, but in spite of fast growthin current revenue and large aid disbursements there may still be an overalldeficit. Reasons include an apparent underestimation of the cost of thefertilizer subsidy (which partly serves to cover the losses of the fertilizerindustry), the still heavy weight of the food subsidy, and the effect ofsalary and wage increases on the revenue transfers to the budget by the publiccorporations. The utility of the fertilizer subsidy under present scarcityconditions needs careful reconsideration; by most accounts farmers usuallyhave to pay the market rather than the subsidized price, the margin benefit-ing the middleman instead of the farmer. There are also other expansionaryfactors such as the stepped-up grain procurement program, the expanded agri-cultural credit program and the increasing financial needs of the privateindustrial sector. It will be hard to contain the combined effect of thesepotentially inflationary factors during the current year and this in turnis likely to have unfavorable effects on the rate of economic development.Strict financial discipline is needed to prevent the resources for develop-ment from being dissipated. Too severe credit contraction, however, wouldretard the recent increase in activity of the public and private sectors.Efforts to maintain monetary stability should, therefore, be backed up withadditional foreign exchange resources to permit continued import liberaliza-tion.
v. The most significant development in the FY78 balance of paymentswas a 56% increase in import payments after a low import level in FY77.Almost one fifth of this increase consisted of an increase in grain importsneeded to bring food stocks to a safe level, while the remainder provided muchof the necessary external inputs for the acceleration of GDP growth: importsof fertilizer, cement, spare parts, industrial raw materials and capital goodsfor development projects. There was also a sizeable increase in consumergoods imports. A further interesting development was the rapid increase inremittances, mostly from migrants to the Middle East; an offsetting effectis the loss of trained Bangladeshis, which has led to higher wage costs forskills which are in short supply and to delays in the execution of somedevelopment projects. The current account deficit amounted to $786 millionwhich was fully covered by foreign aid disbursements.
vi. The balance of payments for the current year, FY79, is likely tobe marked by a slower growth in imports, but the trade deficit is, neverthe-less, likely to be larger than last year's -- partly because of an expected5% deterioration in the terms of trade after an improvement of 22% in FY78.With private remittances rising further to about $100 million, the currentaccount deficit is projected at $1,033 million. In view of the anticipatedsettlement of certain short-term liabilities and amortization payments onmedium- and long-term debt, the total gap to be covered by foreign aid-disbursements is estimated at almost $1,100 million.

- Lit -
vii. The size and composition of the year's opening aid pipeline, and
expected commitments totalling $1,600 million, seem to assure that this gap
can be covered. Food aid pledges are sufficient to cover the estimated needfor imports of 1.55 million tons of foodgrains, the equivalent of $250 mil-
lion. Smaller than last year because of the good harvest, these imports
should permit further progress towards the Government's goal of one milliontons of grain stock, provided crop results in FY79 are favorable. Commodityaid needs in FY79 are estimated at $520 million, considerably higher than
last year. Expected commitments of $650 million will permit imports of thismagnitude and also improve the pipeline for this type of aid. A further in-
crease in total commodity commitments by some $25-30 million may, however, be
necessary to accommodate the import of an additional 150,000 tons of fertil-
izer. Project aid disbursements are forecast at $325 million, over 25% morethan last year, denoting the expectation of further progress in the imple-mentation of aid-assisted projects. New projects ready for implementationnecessitate commitments of about $700 million, leaving a closing pipeline of$1,835 million in the next year, the equivalent of about five years of dis-
bursements. This ratio of closing pipeline to next year's disbursements would
be consistent with a modest improvement in the speed of project implementation.
viii. At present, forecasts for the FY80 balance of payments are still
tentative. It appears that the gap to be covered by aid disbursements will,at almost $1,200 million, be about $100 million bigger than the gap in the
current year. Due to improvements expected to occur in the pipeline duringFY79, new commitments are recommended for an amount of $1,600 million, equalto the level of commitments in the current year.
xi. Food aid needs are expected to decline further to 1.3 million tonsof grain, requiring only $220 million of new commitments. The basis for this
expectation is the forecast increase in domestic production; in view of un-favorable weather in FY79, food aid needs in FY80 may turn out to be higher,and the recommended amount would then have to be increased.
x. Commodity aid disbursements are estimated at $580 million, about$60 million more than in FY79. New commitments of $650 million should permit
this level of disbursements as well as keep the year end pipeline at almost
the level of one year's disbursements, which appears desirable to assure asmooth flow of imports. The proposed increase in commodity aid should helpto maintain the momentum of growth in the agriculture and manufacturingsectors.
xi. Project aid disbursements are likely to advance further to almost$400 million. New commitments of $720 million should permit this level ofdisbursements as well as keep the closing pipeline at the equivalent of five
years of disbursements.
Development Issues
xii. Favorable economic progress in recent years cannot hide certainimportant facts concerning the economic development of Bangladesh: the

- iv -
economic well-being of most people is still not satisfactory, favorable long-term economic trends are yet to be established, and planning has not yet beeneffective. As mentioned, moreover, inflation has re-emerged as a seriousproblem.
xiii. With a per capita income of about $90, Bangladesh is still one ofthe poorest countries in the world. Life expectancy is short, child mortalityhigh and human fertility remains largely unchecked. A large part of theadult population is illiterate, ill-fed, ill-housed and underemployed. Pro-gress has been slower than in other low income countries; in fact, per capitaincomes in Bangladesh declined by 0.4% a year during 1960-76, whereas theyincreased by 0.9% a year in the other low-income countries. In spite of lastyear's record rice crop, per capita rice production has yet to return to theFY70 level. Landlessness is on the increase; according to a recent survey,about half of the rural population is landless or virtually landless. Afteran increase in recent years, investment still amounts to only about 12-13% ofGDP; for its financing the country depends critically on foreign aid whichcovers 75-80% of public investment.
xiv. Development planning has to become a more effective tool for change.The first Five-Year Plan targets for GDP, employment and investment growthwere not clearly related to feasible proposals for action and projects neces-sary for their implementation. With insufficient manpower available forplanning in the central planning agency as well as the technical ministries,the planning machinery was unable to fully guide implementation. Due tochanging domestic and international factors actual events followed a courselargely independent of the Plan, with the composition of the developmentbudget often determined by aid availability rather than Plan priorities.
xv. Meanwhile the Government had moved to institute more pragmaticeconomic policies which favor monetary stability and incentive pricing foragriculture and provide more scope for the private industrial sector. Thesepragmatic policies can undoubtedly be credited with much of the progress since1975. The Government also established a Project Implementation Bureau whicheventually may help to speed up the slow pace of project implementation.Recognizing population control and rural development as top priorities, itset up a nationwide framework for family planning services and experimentedwith various types of rural development models.
xvi. Feeling the need for a more fundamental reorientation of policies,however, the Government put off the new Five-Year Plan by two years. TheTwo-Year Plan (FY79 and 80) is meant to clear the deck for future action --by completing as many ongoing projects as possible or abandoning those thatare uneconomic -- and to create time for thought about the long-term directionof development.
xvii. The Two-Year Plan (TYP) itself is, of course, unlikely to changethe course of development, since its period is too short and most of thedevelopment budget during these two years (83%) is pre-empted by ongoingprojects. The TYP's claim for progress to be made in these two years in

v
such fundamental areas as employment creation and population control isunlikely to be realized. Further, the TYP has not clearly indicated whichuneconomic projects will be weeded out or what criteria will be used to makedecisions about abandoning such projects during the remainder of the TYPperiod.
xviii. Nevertheless, the TYP period should be an extremely useful occasionto establish clear policies about fundamental development issues. The TYPdraft document lists five important areas where the policy makers must makecritical choices: the respective roles of the public and private sectors, theorganization of agricultural producers, the goals of the national educationpolicy, the role of subsidies in agricultural prices, and the respective rolesof foreign aid and domestic savings in development financing. While outliningalternative solutions for these major problem areas, the document does notpresent a full analysis of the options. Moreover, it only raises the ques-tion of the creation of non-farm employment for those who can no longer beabsorbed by agriculture; this problem is assuming increasing urgency andrequires concentrated government attention. The Government has made thelong-term issues of development the subject of public debate in Bangladeshand has invited the views of foreign and domestic scholars. The presentreport is also intended to make a modest contribution on some of the devel-opment issues.
xix. Consideration of these long-term issues should not diminish theGovernment's concern for the more immediate need to improve the link betweenplan formulation and implementation. The weakness of this connection wasthe main shortcoming of the first Five-Year Plan. Progress was hampered byinadequate preparation of projects and lack of appreciation at differentlevels of the new Government about who was to do what and when. In theimplementation stage, government agencies often lacked the resources to maketheir contributions, and at times they worked at cross purposes with otheragencies. Of late, there have been indications of a growing awareness of theneed for close attention to the details of design and implementation and someagencies have been gearing up to cope better with their development task. Buttop level attention by the Planning Ministry as well as the individual tech-nical ministries to the practical requirements of project design and projectimplementation remains a vital requirement for a successful development effort.
Issues in Rural Development
xx. In spite of the high fertility of its alluvial soils, the abundanceof water resources and the extremely high ratio of cultivators to land, agri-cultural productivity is still very low in Bangladesh. Significant progresshas been made, however, in recent years. The Government hopes to achieVegrain self-sufficiency by 1985, and this should indeed be possible providedprogress is made in a number of areas.
(1) Water resources need to be used more efficiently. Cropping inten-sity averages less than 150%, although climatic conditions would permit threecrops a year in most areas. Groundwater development, especially by meansof shallow tubewells, appears particularly attractive since it is relatively

v-
inexpensive and fast and leads to effective on-field distribution of waterto the participating farmers. Because of the high benefit-cost ratio andthe small number of farmers involved it should, moreover, permit easy costrecovery. A large expansion in the irrigated area (from 2.7 million acresto 4-5 million in the Bank's tentative estimates) is needed to achieve grainself-sufficiency; to be effective, this expansion should be accompanied bystronger efforts to improve flood protection and drainage. Since the devel-opment of water resources has been slow in the past, a large additionaleffort is needed.
(2) Market prices have to be maintained at an incentive level. Lastyear the Government increased its procurement effort and established a pro-curement price which proved attractive to farmers. It also has been encourag-ing production through subsidizing fertilizer use. The key aspect of procure-ment policy, however, is that it needs to be operated flexibly as regardsquantity and price. In this respect, it is not clear that the current procure-ment price, which has been kept unchanged from last year in spite of increasesin the general price level, provides sufficient incentives to marginal farmers;this is a point which needs to be kept under review. The mission has provideda tentative framework for estimating what procurement price and volume arerequired to achieve a given target increase in output. It is recommended thatcalculations of this nature be carried out systematically by the Food PolicyUnit which the Government intends to establish as a source of technical adviceto the Ministerial Committee on Food. The model could also be used to helpdetermine the effectiveness of procurement prices and fertilizer subsidy astwo alternative means of encouraging production. Some observers feel that thefertilizer subsidy is more effective since its benefits are restricted tothose who buy fertilizer and increase output, while a higher procurement pricealso benefits those who do not increase their output. A tentative solution ofthe mission's model suggests that the fertilizer subsidy might cost 150% morethan the procurement policy in obtaining from farmers the same output increase;obviously, however, more analysis is needed to arrive at a firm view on thismatter.
(3) The fact that much of the grain marketed in Bangladesh is sold atsubsidized prices through the ration system creates a financial difficulty forthe Government when operated simultaneously with a price incentive program forfarmers. The rationale for the food subsidy lies largely in the danger ofunexpected scarcity and exorbitant prices. The goal of price and supply sta-bility can, however, also be achieved if the Government were to use the publicgrain stocks to intervene selectively in the retail market through open marketoperations, selling off public grain when the price is moving up towards aceiling and purchasing grain when the market price approaches a pre-determinedfloor price. If supply stability is thus achieved, much of the rationale forextending subsidized grain to the general public would disappear; the rationcould then be restricted to the poor, and the Government would be financiallystronger to support the farmgate price. In the current year, the Governmentis embarking on open market operations on a limited scale; further build-up ofgrain stocks towards the Government's goal of one million tons will allow theGovernment to expand these operations and, thus, to rationalize the grainmarket. This requires both food aid and a sustained domestic procurementeffort.

- vii -
(4) On the basis of current price forecasts, jute production promises
to be a financially and economically attractive alternative to rice produc-tion for at least the next two years. Beyond this, rice may become moreattractive which would tend to reduce jute cultivation to the areas relativelyunsuited for rice. Although Bangladesh provides a large part of the world'sjute exports (about 75%), the scope for achieving further gains in exportearnings by increasing the export price may be limited because of the elasticnature of world demand. According to tentative mission calculations, thisis true for exports of both raw jute and jute goods. The scope for exploitingits comparative advantages in jute production, therefore, lies in improvementsin technology and efficiency in cultivation and manufacturing.
(5) The problem of rural unemployment and underemployment requires ur-gent attention. Under the impact of the rapidly increasing number of ruralhouseholds, the size of the average farm holding has continued to decline andholdings have become increasingly fragmented, often into 8 or 10 pieces ofland. At the same time, increasing numbers have become landless or almostlandless (owning less than 0.2 hectare). Although increases in investmentand productivity in agriculture could lead to higher employment of labor perhectare, it is inconceivable that this sector can productively absorb a size-able part of the oncoming cohorts of young farmers. Nor is it possible toassume that conventional forms of development in other sectors can provideemployment to those who are redundant in agriculture. This enormous problemrequires new solutions. An important part of the Government's energies inthe TYP period should be devoted to devising labor-intensive construction ofirrigation, drainage and flood control works; rural roads, bridges, schools,health clinics; cottage industries and possibly labor-intensive manufacturingfor the export market. Most of these activities should be undertaken on asmall scale using the people already present in the project area. This typeof activity requires tight supervision both during design and implementation.This in turn requires much more detailed administrative attention than theGovernment has provided thus far; substantial numbers of government servantswould need to be redeployed to work at the local level.
(6) In contrast to the great urgency of agricultural development andthe priority accorded to it in government statements, the share of develop-ment resources directly allocated to agriculture has been on the decline. Inthe TYP, 25% of development expenditures is allocated to agriculture comparedto 30% in the Hard Core Program of the first Five-Year Plan. An increasingpart of the budgetary allocations is, moreover, absorbed by the fertilizersubsidy. Obviously, agricultural development requires action in many dif-ferent areas, but it will not be possible to achieve accelerated agriculturalgrowth without adequate budgetary allocations and an equitable distributionof funds among the several elements comprising the agricultural program.
Issues in Industrial Development
xxi. A high rate of agricultural growth is a necessary condition forindustrial expansion which in turn will further economic development by cater-ing to domestic needs, strengthening the trade balance and creating employmentopportunities. Despite recent growth acceleration, however, industry has not

- viii -
yet played a dynamic role in the development of Bangladesh. Over the longer
run, growth has been virtually nil and the contribution of industry to GDP isonly 13%, in comparison, for instance, with 19% on the average in other lowincome countries. The manufacturing sector still suffers from overcapacityand financial losses. Productivity of capital and labor, which rose markedlyin the 1960s., plummeted during 1970-76. Setting industry on a growth path
will require policy changes. Some comments follow on actions that appearneeded in the public sector, the private sector and for the encouragement of
industrial exports.
xxii. The public sector still dominates industry in Bangladesh: itaccounts for 50% of value added in manufacturing, 85% of industrial invest-
ment allocations and 85% of industrial exports. Jute and textiles, thebackbone of the country's industrial sector, are reserved for the publicsector, and so is the sugar industry. Most of the larger import substitutionindustries -- steel, cement, fertilizer -- are also in public hands, although
private investment in these areas is allowed in principle. The public sectorhas sustained heavy losses in every year since independence; particularlyserious have been the losses of the jute industry. If proper allowance weremade for capital depreciation, public sector losses would be even higher.
xxiii. There are several areas in which policies regarding the publicsector appear to need improvement:
(a) establishing clearly that the primary goal of public enter-prises is the efficient production of the relevant goods andservices. To the extent possible, they should be relieved fromthe burden of doubling as welfare agencies by being obliged toemploy redundant staff or selling their output below cost be-cause of social considerations;
(b) increasing-the autonomy of enterprises in day-to-day operations.The recent tendency is to allow managers more freedom to runtheir plant, but they are still unduly restricted in matters ofpersonnel management and authority to purchase raw materials;
(c) raising the salaries for scarce personnel, particularlymanagers, and making these more dependent on performance;
(d) improving and expanding the training of skilled workers.The problem is particularly urgent in view of the increas-ing departure of personnel to the Middle East; and
(e) rehabilitating poorly maintained or worn-out plant andequipment. Balancing and modernization programs areplanned for jute, textiles and paper but are equallynecessary for other industrial branches.
xxiv. In guiding the private sector, the Government should rely less onbureaucratic controls and more on the application of policy instruments. In-dustrial activity is stifled by cumbersome, frequently overlapping, procedures

- ix -
for import and investment licensing. These controls tax the Government'sscarce administrative talent (which could be far better used in rural devel-opment, education, population control, etc.), lead to arbitrary decisionsand delays, and invite corruption. They are least of a hindrance to the wellestablished businessman who knows his way, and most to the small or would-beentrepreneur. Some liberalization has taken place in the administration ofcontrols, but there is much scope for a further reduction of their role infavor of policy instruments of general applicability -- such as tariffs, othertax instruments, and rules on repatriation of profits and capital involved inforeign investment.
xxv. Development of export industries is important to help boost indus-trial production, to reduce the enormous trade deficit and to provide addi-tional employment opportunities to the work force. Besides the actioncurrently undertaken to strengthen the jute industry, still the main exportearner, measures are needed to increase exports of other products. Thesehave shown encouraging growth in recent years but their contribution to ex-ports and industrial production is minimal. The extremely low wage level inBangladesh and the vast pool of underemployed should be a spur to the author-ities to develop Bangladesh's comparative advantage in this area. This wouldrequire appropriate trade and pricing policies and, inter alia, strengtheningthe Export Promotion Bureau, providing a more welcoming attitude to foreigninvestors, providing duty drawbacks, and undertaking a coordinated, wellfocused program of studies of export possibilities.
Issues in Resource Mobilization
xxvi. The trend in domestic resource mobilization has not been favorable.Although revenue has been increasing quite rapidly, current expenditures haverisen at the same pace and the current surplus has allowed the financing ofonly 20-25% of the development budget. If proper allowance is made for anumber of expenditures now included in the development budget and the fullamortization cost of the assets of public enterprises, the level of publicsector savings has been minimal and sometimes negative.
xxvii. The lack of progress in the accumulation of savings has made anincrease in development spending, and eventually in the growth rate ofthe economy, critically dependent on the ability of Bangladesh to attractincreasing amounts of foreign aid. An unfavorable corollary is that anincreasing proportion of the total funds available for development financingis preempted by foreign aided projects. Currently, 34% of the developmentbudget consists of foreign aid disbursements to specific development projects.Since aid covers on average only half of total project cost, an equivalentamount of budgetary resources is required to provide the local counterpartto the financing of aid projects, and relatively few resources are left overto finance all the development activities which are not financed by foreigndonors. As a result, the implementation of many projects, aided and non-aided,is hampered by insufficient or tardy allocation of domestic counterpart funds.
xxviii. This "Taka shortage" problem cannot be solved by shifting resourcesto aid financed projects since then the domestically financed projects would

x
suffer. The only long-run solution -- apart from the effect of the weedingout of uneconomic projects during the TYP -- lies in increasing the totalamount of development resources. In view of the extremely low contribution ofdomestic resources to development financing, the main effort will have to befocussed on an improvement in the mobilization of domestic resources. Donors,however, could in the interim help alleviate the Taka shortage by providinghigher proportions of total project cost, including funds to cover local ex-penditures (in some areas, the proportion of aid in project cost appears tobe relatively low), and by continuing to provide a large proportion of theiraid in the form of commodity assistance. But this would be justified only ifthe Government simultaneously undertook increased efforts to mobilize moredomestic resources.
xxix. Fortunately, substantial increases in public savings would appear
to be entirely feasible. The Bank's recent report on domestic resource mobi-lization roughly estimates that the Government should be able to increasepublic savings to 4% of GDP over the next five years. Assuming an unchangingproportion of aid to GDP and estimating domestic savings at 2-3% of GDP atpresent, this would allow raising development expenditures from 12-13% to16-17% of GDP. The increase would result from measures to improve tax admin-istration, rationalize and increase certain tax rates, improve the financialresults of public enterprises, and diminish subsidies. An important condition,however, is that GDP would grow by at least 4% a year, i.e., well ahead ofpopulation. In view of the country's low per capita income, it would be veryhard to envisage an increase in savings to occur at the expense of alreadydepressed consumption levels.
xxx. Secondly, there is also an urgent need to review the allocationof resources available for public investment. Already, at the onset of theTwo-Year Plan, the Government has made an attempt at reviewing prioritieswithin the ADP by concentrating resources on projects with relatively shortgestation periods, in the hope that a great number of them could be completedby the end of FY80, so that the next Five-Year Plan would be able to startwith a reasonably clean slate. This was a wise decision. Nevertheless, thereprobably is scope for further pruning of projects in the pipeline. In thisrespect, the joint review by the Bank and the Government of the portfolioheld by the Bangladesh Water Development Board (BWDB) is a good example ofhow priorities can be brought into focus. Other sectors might want to followsuit. But above all, it is necessary to begin with the definition of prior-ities for the next Five-Year Plan, not only within, but also between, sectors.In this context, it should be pointed out that despite rapidly increasingoutlays on the fertilizer subsidy the share of agriculture in the ADP hasdeclined in recent years. Once a number of short-gestation projects havebeen completed and a number of less promising projects eliminated from thepipeline, it should be possible to channel more funds into agriculture, asector which -- despite its importance for widespread, grassroots develop-ment -- presently receives less than its due share in overall developmentexpenditures. Increases in the allocations to education, health and popu-lation control also appear desirable.

PART I
CHAPTER 1: CURRENT DEVELOPMENTS AND PROSPECTS
A. Introduction
1.01 GDP increased in FY78 by 7.8% in real terms, following only 1.7%real growth in the preceding year. The main growth factors were a 12.8% in-crease in foodgrain output, an 11.5% increase in the jute crop and a 10.4%increase in the value added of manufacturing. Judging by the increase indevelopment expenditures, government investment may have increased by 14% inreal terms and private investment in all sectors including agriculture mayhave increased at approximately the same rate or perhaps more. The step-upin development expenditures and increased industrial production triggered asharp increase in imports, which rose by 56% in value from the relatively lowlevel of FY77. The increased level of spending in the economy, in the publicas well as in the private sector, led to a resurgence of inflation in spiteof the sharp increase in imports.
1.02 The growth in output would have been less satisfactory without thehelp of good weather. For the third year in a row, Bangladesh has been sparedmajor droughts, floods or cyclones. The weather was particularly good lastyear and this helps explain the sharp improvement in agricultural output overthe disappointing crop of the previous year; as compared with FY76, however,the rice crop increased at an annual rate of only 2%. Changes in governmentpolicies were also a factor. Farmers benefitted from a strengthened food-grain procurement and price support program and the increased availability offertilizer, pumps, spare parts and credit. Industry was stimulated by theliberalization of imports, expeditious treatment of investment applicationsand more plentiful credit.
1.03 Economic advances have gone hand-in-hand with an improvement inpolitical stability. President Ziaur Rahman's victories in the presidentialelection of June 1978 and the parliamentary election of February 1979 haveled to an increase in confidence among key officials in the administration.The general opinion in official and business circles is that after the recentgeneral elections, the Government will be able to take major decisions onimportant policy issues and implement programs that have been postponed orhave suffered from neglect. The feeling that the increased political stabil-ity and the election victories constitute a mandate for reform and policychange has prompted the Government to ask for the advice of a number ofeconomic advisers at home and abroad on long-term development perspectivesand priorities. The period of the current Two-Year Plan (TYP) does, indeed,provide a critical opportunity to formulate positions on long-term policyissues and to make these the foundation for the next Five-Year Plan.

-2-
B. Agriculture
Foodgrains
1.04 Production in FY78 recovered fully from the sharp drop in theprevious year. Good weather undoubtedly contributed to this; at the sametime, the contribution made by modern inputs -- the application of whichexpanded due to favorable output/input price ratios and improved inputsupplies -- played an important role. Fertilizer consumption for both riceand jute cultivation was at a record level, and the use of lowlift pumps,shallow tubewells and deep tubewells increased markedly.
Table 1: FOODGRAIN PRODUCTION(million long tons)
FY70 FY76 FY77 FY78
Aus rice 2.96 3.23 3.01 3.10Aman rice 6.95 7.04 6.91 7.42Boro rice 1.90 2.29 1.65 2.47
Rice, total 11.82 12.57 11.57 12.99
Wheat 0.10 0.22 0.26 0.34
Total production 11.92 12.78 11.83 13.33
Net production /a 10.73 11.50 10.65 12.00
/a Production less 10% for feed, seed and waste.
Source: Ministry of Agriculture.
1.05 Recent evidence indicates that many more farmers than can besatisfied with the available supplies would like to buy fertilizer at theprevailing rate of return for rice. This may be partly explained by thesubsidy on fertilizer -- about 50% on the average of the cost of supply perunit -- although actual prices paid by farmers, according to most sources,are far higher than the subsidized prices. Whatever the effect of the sub-sidy, it appears clear that demand for fertilizer has also been boosted bythe other promotional efforts -- distribution of demonstration kits, liberalprovision of credit and greater involvement of the extension service. Com-bined with the favorable paddy price and good weather, these factors led toa fertilizer offtake of 711,000 tons in FY78 -- 40% more than in FY77. Pro-jected sales in FY79 are 800,000 tons, although some sources expect a muchhigher effective demand. Combined with an estimated need for year-end stocksof about 350,000 tons, the projected sales of 800,000 tons imply that1,000,000 tons of domestic production and imports are required beyond theyear's opening stocks of about 150,000 tons. Confirmed imports as of

- 3 -
November 1978 for FY79 of about 600,000 tons, together with expected domesticproduction of about 250,000 tons, combine for an additional availability of850,000 tons. This implies that there is still a gap of about 150,000 tons.Consultations between the Government and donors are under way about additionalsupplies to fill this gap, although it is unclear at this stage whether suchsupplies could arrive in time to benefit the FY79 crops. Meanwhile, theenvisaged increase in sales has its consequences for the government budget.Although fertilizer sales prices have been raised by about 16% on average inFY79, the total subsidy is expected to increase -- due to increases in bothquantity and unit costs. It is important to continue to review this financialconstraint to a greater supply of fertilizer and to consider alternativemeasures to maintain production incentives (see Chapter 3, Section D). Per-haps the fertilizer subsidy ought to be limited to the temporary promotionof more balanced fertilizer use (potassium and phosphates).
1.06 A promising feature of recent trends in foodgrain production hasbeen the increasing share of wheat. Wheat-requires only about 33% as muchwater as rice and its production costs are lower. New varieties are fertil-izer responsive and have a much shorter maturing period than boro rice.Farmers' response to the Government's seed distribution and extension effortshas been favorable, reflected by an increase in acreage sown to wheat from400,000 acres in FY77 to 470,000 acres in FY78.
1.07 Through its Tk 100 crore Credit Program, the Government disbursedabout Tk 60 crores in FY78 and intends to make available through the nation-alized banks a maximum additional amount of Tk 150 crores up to the end ofFY79. Officials believe that the liberal provision of short-term credit didindeed stimulate the increased application of modern agricultural inputs.The impact of this crash program on the extension program and the creditsystem was, however, not altogether favorable, The repayment rate on loansin FY78 was only 57%. As usual for such programs, the small farmers demon-strated a better repayment record, but did not get a large share of creditoutlays. Besides endangering the development of a disciplined agriculturalcredit system, the low repayment rate adds to the current inflationary pres-sures. The recent opening of more branch offices of banks in rural areasis aimed at improving the access of small farmers to agricultural credit.Parallel efforts by the banking system and the agricultural administrationare aimed at improving the repayment record.
1.08 To stimulate input demand, the Government in FY78 procured 550,000tons of rice (compared to 316,000 tons in FY77) at Tk 132/maund. The expandedlevel of procurement, in the face of a 13% increase in foodgrain output,helped prevent sharp post-harvest declines in prices. The same procurementprice will be effective in FY79 on the presumption that it continues to be anincentive price; in view of the increase in the general price level, however,it may be useful to keep this matter under review (paras. 3.25, 3.26).
Jute
1.09 The trend of declining jute output was reversed in FY77, and inFY78 production reached 5.4 million bales. The key to continued improvements

in the future is the acreage that can be devoted to the Intensive Jute Culti-vation Scheme (IJCS). IJCS acreage, estimated to be about 500,000 acresin FY78, is claimed to have increased to almost one million acres in thecurrent season.
Table 2: PRODUCTION, EXPORTS AND STOCKS OF RAW JUTE(million bales)
FY70 FY76 FY77 FY78 FY79(projection)
Carryover Stocks 0.8 1.9 1.0 0.3 0.6Production 7.2 4.3 4.8 5.4 6.0
Total Availability 8.0 6.2 5.8 5.7 6.6
Mills' Consumption /a 3.6 2.6 2.9 3.1 3.3Exports 3.5 2.4 2.3 1.7 2.3Growers' Consumption
and Losses 0.2 0.2 0.3 0.3 0.3End Season Stocks 0.7 1.0 0.3 0.6 0.7
/a Includes changes in stocks.
Source: Government of Bangladesh and mission projections.
1.10 The developments of FY78 highlight some of the problems and pros-pects for jute. Induced by the favorable output price in the previous year,farmers increased the jute acreage by 13% in FY78 and the IJCS acreage by70%. The average yield, however, actually declined, partly due to adverseweather. Consequently, output in FY78 increased to only 5.4 million bales,12.5% more than in FY77 (see Table 2). Thus, although a reversal of theearlier trend of declining jute acreage continued in FY78, output remainedwell below historic levels.
1.11 In spite of the increase in output the domestic jute price roseto unprecedented levels in FY78 -- 40% more than in FY77. The sharp increasein jute demand was primarily due to low opening stocks (300,000 bales inFY78 compared to 1.0 million bales in FY77), liberal credit available tomills early in the season, and heavy demand from shippers to meet previouslycontracted sales. The high domestic price of raw jute and weaknesses inthe jute purchasing system contributed to a worsening of the profitabilityof jute manufacturing -- despite a considerable increase in the export priceof jute goods.
1.12 In the face of the high overall demand for raw jute relative tosupply the export price in FY78 increased by about 11%, but failed to bid juteaway from the domestic jute manufacturing sector. Raw jute exports actuallydeclined to 1.67 million bales -- 27% less than in FY77 -- causing a 22%

decline in earnings. At the same time, exports of jute manufactures reached522,000 tons -- 15% more than in FY77 -- leading to a 25% increase in exportearnings. The combined earnings from exports of raw jute and jute goodsincreased by 7% from $323 million to $345 million.
C. Public Finance, Money and Prices
Developments in FY78
1.13 The acceleration of economic growth in FY78, combined with the sharpincrease in imports and persistent international as well as domestic inflation,brought about a marked increase in tax revenue, particularly from customsduties. At Tk 9.8 billion, total tax revenue 1/ exceeded the budget forecastby 7% and stood 29% above the level recorded in FY77. The revenues fromcustoms duties and sales taxes -- both levied mainly on imports -- increasedby 37% and 44%, respectively. Non-tax revenue increased by only 12%, however.
1.14 The higher than anticipated level of government revenue was, how-ever, more than offset by a rapid expansion in current expenditures, follow-ing the implementation of a new national pay scale 2/ and an increase inteacher salaries. Consequently, the surplus on current account, 3/ which hadbeen budgeted at Tk 2.7 billion, reached only Tk 2.1 billion, somewhat in excessof the level attained in FY77, both in absolute terms and as a percentage of GDP.Despite the shortfall in the current surplus, the Government was able to raise
1/ The definition of "tax revenue" used in this report, as in previousBank reports on Bangladesh, is slightly more comprehensive than theone used in the budget and includes stamp revenue.
2/ In July 1977, pending the official promulgation of revised pay scales,interim relief was granted to all categories of civil servants. Theextent of this relief varied among grades, but amounted to roughly15-20% on average. For government civil servants proper, this increasein salaries was made permanent and, in most cases, further increased toan average of 20-25% through a number of decisions taken between December1977 and May 1978. For employees of public sector corporations, thefinal announcement of pay scales was made in October 1978. The announce-ment of new pay scales in the banking sector is still pending.
3/ This surplus on current account should, however, not be equated withgovernment savings. As pointed out in previous Bank reports, the sur-plus on current account is overestimated because the "food subsidy"included in current expenditures is intended to cover the losses onfood purchases out of the Government's own resources only, whereas thelosses incurred on food aid are netted out from the estimated value offood aid receipts. Furthermore, some of the items included in the'ADP,particularly the fertilizer subsidy, are more of a recurrent than of acapital nature. If adjustments were made for these factors, governmentsavings would, in fact, be negative.

-6-
its spending on the Annual Development Program (ADP) from Tk 11.9 billion, asenvisaged in the budget, to an anticipated level of Tk 12.5 billion. Addi-tional finance was provided through increased foreign aid disbursements andrecourse to deficit financing (Tk 0.9 billion). 1/ This is the first timein the country's history that such an upward revision in the size of the ADPhas taken place. Because of the start of new projects and gathering momentumon ongoing projects, the increase in the size of the ADP did little to alle-viate the shortage of domestic funds ("Taka shortage") which is hamperingthe implementation of virtually every development project (see Chapter 5).
1.15 The expansionary thrust implied in this increased public spending,
combined with a rapid expansion in credit to the public sector corporationsand the private sector, led to a 21% overall increase in liquidity whichwas almost as high as the 24% increase in liquidity registered during FY77.Prices had begun to rise from the beginning of FY77 onwards, but because thisrise came in the wake of a significant fall in prices during the precedingyear, the average price level in FY77 was only 1% above the price level inFY76. In FY78, however, the average price increase amounted to 15%.
Prospects for FY79
1.16 The resurgence of inflationary pressures last year, following aperiod which had witnessed price declines or stability, is one of the mostdisquieting aspects of current economic developments and a cause of concernto the Government. In response to this new situation, the authorities havedrawn up a budget for FY79 which aims at keeping the government accounts inbalance, while at the same time providing for a sizeable expansion in ADPexpenditure. It is, therefore, particularly ambitious with regard to thegeneration of public savings. Current revenue is expected to go up by 10.6%if new fiscal measures are disregarded, and by 13% if account is taken ofadditional resource mobilization through higher railway fares and freightrates and increased rates for a range of other taxes and fees. The bulk ofthe increase in revenue from existing taxes is to be derived from increasedcustoms and sales tax revenue. Exclusive of the higher rail fares and freightcharges, non-tax revenue is anticipated to remain practically the same as inFY78.
1.17 Strict control is to be exercised with respect to the increase inrecurrent expenditure which is to be kept to only 2%. In fact, outlays onthree important components are expected to fall: (i) the food subsidy fromTk 1.1 billion to Tk 0.7 billion because of a sharp reduction in food importsfinanced out of government resources; (ii) the jute subsidy from Tk 0.6 bil-lion to Tk 0.4 billion because of the expected improvement in the relationshipbetween the price of raw jute and the price of jute goods; and (iii) spendingfor some expenditures for law and order by Tk 0.2 billion. However, evenafter making allowance for these three items, all other current expendituresare still budgeted to rise by only 6%.
1/ Although actual spending on the ADP, at Tk 12.3 billion, was slightlylower than the revised estimate, the actual size of the FY78 budgetarydeficit has turned out to be Tk 1.1 billion.

Table 3: GOVERNMENT REVENUE AND EXPENDITURE
/a(Taka billion) Percent of GDPA
FY76 FY77 FY78 FY79 FY79 FY76 FY77 FY78 FY79 FY79(revised) (TYP) (Budget) (revised) (TYP) (Budget)
Current Revenue 8.8 10.0 12.4 14.0 14.1 8.9 10.6 11.3 11.2 11.3of which:Tax Revenue (6.7) (7.6) (9.8) (10.4) (11.3) (6.8) (8.1) (8.9) (8.4) (9.1)
Current Expenditure 6.8 8.2 10.4 10.8 10.5 6.9 8.7 9.4 8.7 8.5
Current Surplus 2.0 1.7 2.1 3.2 3.5 2.0 1.9 1.9 2.6 2.8
Development Expenditure 8.5 10.4 12.5 14.1 14.5 8.6 11.1 11.4 11.3 11.6
Overall Deficit 6.5 8.6 10.4 10.9 10.9 6.6 9.2 9.5 8.8 8.8
Financed by:Capital Receipts (net) 0.3 0.4 0.3 0.2 0.3 0.3 0.4 0.3 0.1 -0.2Deficit Financing 1.0 - 0.9 0.2 - 1.0 - 0.8 0.1Foreign Aid 5.2 8.2 9.2 10.5 11.2 5.3 8.7 8.4 8.4 9.0
GDP, in current marketprices /a 98.94 93.96 110.09 124.39 124.39 100.0 100.0 100.0 100.0 100.0(million Taka)
/a GDP figures are Planning Commission estimates.
.Less than Taka 5 million.
Note: Minor discrepancies are due to rounding.
Source: Ministry of Finance, Planning Commission and Bank estimates.

1.18 On the basis of these assumptions regarding receipts and expendi-tures, the FY79 budget forecasts a boost in the current surplus from Tk 2.1billion in FY78 to Tk 3.5 billion. This would raise the ratio of currentsurplus to GDP to 2.8%, as compared to only 1.9% in FY78, and would be inconsonance with the domestic resource availability projections included inthe Draft TYP. Together with an anticipated foreign resource inflow amountingto Tk 11.2 billion, this surplus would permit the financing of Tk 14.5 billionof ADP expenditures without recourse to deficit financing. 1/
1.19 However, various factors will make it difficult to achieve thisenvisaged balance in the Government's accounts. First, the modest 6% rate ofincrease in the "residual" current outlays mentioned above would be out ofline with the rates of increase registered in past years and would even remainbelow the annual 12% increase in current spending allowed for in the Two-YearPlan (TYP) projections. It would require extreme restraint on the part ofthe ministries with regard to new current commitments. Secondly, the transferof surpluses from public corporations -- budgeted to remain at the levelachieved last year -- may well turn out to be considerably smaller, given thefinancial implications of the new pay scales for employees of public sectorcorporations. 2/ Thirdly, the fertilizer subsidy included in the ADP is ex-pected to be considerably larger than anticipated in the budget. 3/ Sinceavailable fertilizer supplies have been insufficient to cover all of thedemand, it appears difficult to justify the heavy strain which the presentsubsidy level puts on the budget. By most accounts, farmers usually have topay the market price rather than the subsidized price, the margin benefittingthe middleman rather than the farmer. Although foreign aid resources willprobably be larger than originally projected, this increased resource avail-ability is unlikely to compensate for the factors listed above, and unless
1/ Deficit financing is defined as Government recourse to the bankingsystem. Other domestic resources are provided through borrowing fromnon-financial institutions, such as provident funds. In FY78, thesenet capital receipts are expected to be negative because of an anti-cipated investment by the Government in the share capital of a numberof corporations with a view to improving their capital structure.
2/ The additional financial burden on that account in FY79 has been ten-tatively estimated at Tk 0.6 billion.
3/ In accordance with the TYP, this year's ADP includes an allowance of
Tk 0.7 billion for the fertilizer subsidy. Because of a sharp increasein the world market price of fertilizer, however, the subsidy per ton ofimported fertilizer has increased from Tk 1,930 in FY78 to an expectedTk 2,160 in FY79 -- despite the fact that fertilizer prices were raisedby about 16% in the beginning of the year. If fertilizer sales this yearwere to be on target (800,000 tons), the subsidy would total nearlyTk 1.5 billion. Even at the lower level of last year's sales (710,000tons), the subsidy would still amount to Tk 1.3 billion, or Tk 0.6 bil-lion more than anticipated in the budget. Part of this amount servesto cover the losses of the domestic fertilizer industry.

- 9 -
the ADP is cut -- which would be highly undesirable -- some amount of deficitfinancing may be unavoidable.
1.20 In this case it would become extremely difficult to keep the ex-pansion in monetary liquidity within the targeted ceiling of 11%, especiallysince the expanded program of special agricultural credit, the stepped-upfoodgrain procurement program and the increased needs of the private sectorwill all be fueling monetary expansion as well. In the first three monthsof the current fiscal year, liquidity and domestic credit both expanded by 5%.Given the seasonal character of credit needs, this rate of expansion remainedwithin the monetary program, but only due to a temporary contraction ofcredit to the Government. In anticipation of future expansionary movements,the monetary authorities have tightened up the commercial banks' refinancingfacilities. Extreme caution will, however, have to be exercised in order toensure that these contractionary policies do not adversely affect productiveinvestment programs in both the public and the private sectors.
D. The External Sector
Trends in FY78
1.21 The expansion in economic activity in FY78 was directly related todevelopments in the balance of payments: larger imports were needed to meetthe demands for consumption arising out of higher incomes, and a greatervolume of raw material, spare parts and capital goods imports permitted highercapacity utilization in industry. Expansion in development spending alsocontributed to increased demand for capital goods imports. As a result,imports rose by $484 million or 56% over the level of FY77, reaching $1,349million. Exports also increased, from $460 million to $497 million. Theresulting trade gap of $852 million was more than double the gap of theprevious year.
1.22 Economic expansion in FY78 was also accompanied and aided by arelaxation of import restrictions and liberalization of some classes of im-ports by placing them on "Open General License." Food imports were increased,despite good harvests, because of the desire to build up grain reserves toensure greater food security. These imports have been mainly accommodatedthrough a high level of food aid disbursements. Larger imports of fertilizerwere stimulated as a result of a rapid increase in fertilizer use, combinedwith some decline in domestic production resulting from breakdowns in the twofertilizer plants.
1.23 The increase in export earnings in FY78 represented a continuationof a trend that began with the devaluation of the Taka in May 1975. The rateof increase in FY78 was well above that of FY77, however, due primarily to a16% increase in Bangladesh's export prices, especially of traditional exportssuch as tea and jute. On the other hand, the favorable price effect waspartly offset by a 27% reduction in the volume of raw jute exports. Althoughoutput of raw jute had recovered in recent years, increased consumptionby the jute mills (whose production and exports increased) and the need

- 10 -
to replenish depleted stocks prevented an increase in exports of raw jute.Jute goods exports were buoyant, reflecting shortages of jute and other fibersin international markets and the trend for increased substitution of jute forsynthetics on environmental grounds. The growth in non-traditional exportswas moderate as a result of restrictions to ensure domestic availability of anumber of products such as fruits and vegetables, lower external demand foritems like shrimp and fish, and a temporary tax on exports of wet-blue semi-finished leather and raw hides and skins to encourage domestic processing.
1.24 The Government continued to provide a wide array of export incen-tives in FY78. For traditional products, such as raw jute and tea, continuedattention was given to incentive prices at the producer level, technical pack-ages to improve productivity, and plant modernization. The program for costcontrol and waste reduction in jute manufacturing was pursued vigorously. Thesubsidy for jute was restructured to favor those mills that exported theirproducts by granting them a bonus of approximately 16% of the average unitvalue of their exports. Non-traditional exports continued to receive thebenefit of Export Performance Licenses which grant exporters the title toimport a specified range of imports. Export financing also continued tobenefit from preferential rates of interest.
1.25 The trade.deficit of $852 million was augmented by a deficit of $17million on services account. Private transfers from Bangladeshi nationalsworking abroad continued to rise to a level of $83 million. The currentaccount deficit, therefore, amounted to $786 million which -- together withthe servicing of medium- and long-term debt -- led to a financing deficit of$821 million. Almost all of this deficit was financed by external aid in-flows of nearly $800 million.
The Balance of Payments, FY79 and FY80
1.26 Exports. The demand for Bangladesh's export products is likelyto show continued strength. Bangladesh could benefit from such an improvedclimate since jute production -- both of raw jute and manufactures -- isexpected to rise further in the current year. International demand forBangladesh fish and fish products, which was depressed in FY78, is expectedto strengthen and exports could rise significantly if Bangladesh improvesits ability to compete on the basis of price and quality.
1.27 Exports for FY79 and FY80 are currently projected at $613 millionand $671 million, respectively, mainly as a result of an improvement in thevolume and price of jute exports. Export projections by commodity are shownin Table 4 below. Non-jute exports are estimated to grow by 18% and 16% invalue, respectively, in the two years. Tea exports are expected to declinefrom current levels because of the effects of replanting and modernization oftea estates, which may temporarily reduce exportable quantities, combined withsome decline in international tea prices. The income from non-traditionalexports (fish, shrimps, leather, etc.) is expected to increase.
1.28 Jute will continue to dominate Bangladesh's exports over the comingtwo years, constituting 70% of total export value. Domestic prices of raw

- 11 -
jute have been sufficiently high in relation to rice prices in FY78, so thatthe area sown to jute in FY79 is expected to be about 2 million acres. Witha continued favorable relative price for the crop, the acreage should notdecline in FY80. The IJCS acreage is expected to increase further in thenext two years, leading to higher average jute yields. If weather conditionsare normal 'over the next two years, raw jute output could reach 6.5 millionbales or more annually. Bangladesh could then export up to 2.5 million balesof raw jute annually over the period, given the expected low level of kenafoutput in Thailand and depleted international stocks. An increase in theaverage export price of raw jute is expected in FY79 and export earnings of$150 million could be realized this year. Improvements in the supply ofraw jute, increased efficiency in jute manufacturing and continued recoveryin the industrialized countries should all be conducive to slightly highervolume and prices of jute goods exports. Total jute exports are likely to toaverage almost $450 million per year during the two years. This represents asubstantial increase over the annual average of $316 million during theperiod of the first Five-Year Plan.
1.29 Imports. Bangladesh's import requirements have been projected at$1,719 million in FY79 and $1,860 million in FY80, representing annual in-creases of 27% and 8%, respectively (see Table 5).
1.30 Foodgrain imports depend on the level of domestic production, mini-mum consumption requirements of the population, and the Government's foodgrainstock target. Foodgrain imports are estimated by the Government to be 1.55million tons for FY79 and 1.3 million for FY80, on the basis of the followingassumptions:
(a) 4.1% growth annually in foodgrain output;
(b) 2.7% annual growth in population;
(c) average per capita consumption of 15.5 oz per day; and
(d) additions to official stocks bringing their levelto 1 million tons by the end of June 1980.
1.31 The expected rise in fertilizer imports is a consequence of theplanned increase in distribution to 800,000 tons in FY79 and 900,000 tonsin FY80 and the intention to raise the stock level to 400,000 tons from thelevel of 155,000 tons at the end of FY78. The Government expects that theselevels of fertilizer supply will help achieve its target of an annual increaseof 4.1% in foodgrain output during the plan period.
Terms of Trade
1.32 In FY78, Bangladesh again benefited from a decline in the inter-national prices of a few key commodity imports. There were sharp declinesin foodgrain, raw cotton and yarn prices, only partly offset by the smallincreases in the prices of edible oils, petroleum products, fertilizer, cementand capital goods. This situation is expected to be reversed: average import

- IL -
prices are projected to increase by roughly 10% annually over the two-yearperiod. Export prices are expected to increase at a much lower rate and theterms of trade, which had improved by 22% in FY78, could deteriorate by 5% inFY79 and a further 4% in FY80.
The Payments Gap, FY79 and FY80
1.33 The anticipated balance of payments situation for FY79 may be sum-marized as follows. Merchandise exports are expected to rise in value to$613 million, or by 23%, while commodity imports are projected to increase by27% to $1,719 million because of the continuing expansion of economic activity.The trade deficit of $1,106 million will be partially offset by an estimatedinflow of $98 million in private transfers, primarily consisting of higherremittances from Bangladeshi nationals employed abroad. The current accountdeficit is likely to include also a net outflow on services account of $25million and would amount to $1,033 million -- or $247 million more than inFY78. The amortization of medium- and long-term debt is projected to totalroughly $50 million 1/. Repurchases at the IMF are expected to amount to $40million, but the net settlement may be less if Bangladesh enters into a newStandby Agreement. The allocation of $21 million of new SDRs, finally, wouldstill leave an unfinanced gap of about $1,095 million to be financed fromexternal aid disbursements. Bangladesh's holdings of international reserves,then, are expected to remain at the level of $269 million -- sufficient tocover about two months of merchandise imports.
1.34 In FY80, the second year of the Two-Year Plan, exports are expectedto rise further to $671 million as a result of a continued strengthening ofinternational demand for traditional and non-traditional export products andimproved domestic supply. Imports are also expected to continue to grow,reaching $1,860 million. While this reflects some increase in volume as aresult of changes in the size and structure of investment, it also takesaccount of expected increases in import prices for food and raw materials.The trade deficit is projected at $1,189 million, moderated by a surplus of$80 million on invisibles (primarily due to anticipated migrants' remittances
of $110 million). In addition to the current account deficit of $1,109million there is likely to be a further net outflow of $108 million for theamortization of medium- and long-term debt and short-term capital, resultingin an overall financing deficit of about $1,195 million.
1/ It might be less if debt relief arrangements were to take effectduring FY79.

Table 4: MERCHANDISE EXPORTS(million US$)
Unit FY78 FY79 FY80Quantity Unit Price Value Quantity Unit Price Value Quantity Unit Price Value(million) (US$) (million) (US$) (million) (US$)- Estimated Actuals----- ------- Projections----- - --- --------- ProjectMons …
Raw Jute Bales 1.67 57.5 97 2.30 65.0 150 2.60 65.0 169
Jute Goods Tons 0.522 475.0 248 0.540 525.0 284 0.560 525.0 294
Tea Lbs. 63.00 0.72 45 60.00 0.66 39 60.00 0.65 39
Leather - - 46 - - 47 - - 57
Fish and Shrimp - - 21 - - 40 - - 50
Others - - 40 - - 53 - - 62
Total 497 613 671
Source: Planning Commission and Bank estimates.

Table 5: MERCHANDISE IMPORTS(Values in million US$)
FY78 FY79 FY80Quantity Unit Price Value Quantity Unit Price Value Quantity Unit Price Value(Million) (US$) (US$mil.) (Million) (US$) (US$mil.) (Million) (US$) (US$mil.)------- Estimated Actuals…------ ------ Projections---------- ---------Projections---------
Foodgrains Tons 1.64 144 236 1.55 172 267/a 1.30 181 236/(Rice) Tons ( .30) (229) ( 69) ( .05) (260) C 13) C .03) (357) C 11)(Wheat) Tons (1.34) (125) (167) (1.50) (169) (254) (1.27) (177) (225)
Edible Oil Tons 0.071 683 49 0.075 750 56 0.100 750 75Oil Seeds Tons 0.047 333 16 0.015 310 5 0.060 310 19Petroleum Products Tons 0.323 126 41 0.300 138 41 0.330 145 48Crude Petroleum Tons 1.155 108 125 1.200 112 134 1.250 119 148Cotton Bales 0.154 301 46 0.174 371 65 0.300 333 100Man-made Fibre Bales 0.079 264 21 0.054 273 15 0.060 273 16Cotton Yarn Bales 0.036 552 20 0.048 542 26 0.025 560 14Textiles - - - 21 - - 20 - - 18
Fertilizer Tons 0.418 172 72 0.765 225 172 0.720 210 151Cement Tons 0.392 50 20 0.750 59 44 0.850 62 53Capital Goods - - - 318 - - 375 - - 462Other Raw Materials - - - 280 _ _ 342 _ _ 360Other Consumer Goods - - - 84 - _ 157 _ _ 160
Total 1,349 1,719 1,860
/a Includes $20 million of estimated freight costs.
Source: Planning Commission and Bank estimates.

- 15 -
Table 6: BALANCE OF PAYMENTS(million US$)
FY78 FY79 FY80(Estimated Actuals) (Projections) (Projections)
Merchandise Imports (c.i.f.) -1,349 -1,719 -1,860Merchandise Exports (f.o.b.) 497 613 671
Trade Balance -852 -1,106 -1,189Services (net) -17 -25 -30Private Transfers 83 98 110Current Account Balance -786 -1,033 -1,109Amortization of Medium- and
Long-Term Debt -35 -50 -50Short-Term Capital Movements (net),
incl. Transactions with the IMF 19 -33 -58Allocations of SDRs - 21 22Errors and Omissions -19 - -Changes in Reserves (- = increase) 24 -External Capital Disbursements 797 1,095 1,195
of which: Food (190) (250) (220)Commodity (352) (520) (580)Project (255) (325) (395)
Source: Planning Commission and Bank estimates.
Aid Requirements
1.35 The discussion in this section relates to the aid commitments anddisbursements in FY79 and FY80. Obviously, project aid committed during thesetwo years will for the most part be disbursed only during the early 1980s andit is necessary, therefore, to consider what aid needs are likely to exist atthat time. Even with a good domestic savings performance, aid will continueto be required in the earl.y 1980s to finance a large portion of total invest-ment. According to tentative calculations, aid would continue to amount toapproximately 10% of GDP (which is roughly the same proportion as prevails atpresent). Aid would then finance about 60% of investment, the increase innational savings being the main factor permitting an increase in overall in-vestment. Since domestic savings cannot be expected to grow very fast, muchof the aid should remain in the form of counterpart generating aid, i.e.,commodity and perhaps food aid. The recommendation in this section is, there-fore, for a continued relatively modest share of project aid commitments intotal aid, maintaining the project aid pipeline at about the same ratio toproject aid disbursements (slightly less than 5:1) as has prevailed in recentyears. A corresponding increase in total project aid commitments (and declinein counterpart fund generating aid) would be indicated, however, if donorswere to increase the proportion to be financed of each project's total cost.
1.36 Aid commitments during FY79 are expected to total $1,600 million,an increase of roughly $500 million over the commitments received in FY78.Some of this aid is expected to help strengthen the pipeline at the beginning

- 16 -
of FY80. This (and the expectations about increased domestic food production)suggests that the recommended commitment level for FY80 can be maintained at$1,600 million. This level would help maintain aid disbursements at thepresent ratio to GDP. Such a stable ratio was part of the scenario fordomestic resource mobilization suggested in an earlier Bank report. 1/
1.37 Food Aid. Government stocks of foodgrains recovered from a verylow level in early FY78 to over 600,000 tons at the beginning of FY79. Thiswas still lower than the stock level reached two years earlier and falls shortof the Government's aim of bringing stocks to a level of one million tons. InFY78, the offtake of foodgrains was 1.85 million tons. If crops in FY79 andFY80 are good, requirements for public distribution of grains might decline to1.8 million tons annually. Additions to stocks totalling about 300,000 tonsfor the two years should enable Bangladesh to start its new Five-Year Planwith nearly a million tons of stocks. The imports necessary to achieve thesetargets show a declining trend to 1.55 million tons in FY79 and to 1.3 millionin FY80. Food aid disbursements of $250 million and $220 million for FY79 andFY80, respectively, should be sufficient to cover these import needs.
Table 7: PROCUREMENT, DISTRIBUTION AND STOCKS OF FOODGRAINS(thousand long tons)
FY76 FY77 FY78 FY79 FY80(Projected)
Opening Balance 746 823 376 627 877Imports 1,412 810 1,644 1,550 1,300Local Procurement 415 316 550 600 650Available for Public Distribution 2,573 1,949 2,570 2,777 2,827Total Distribution 1,676 1,473 1,850 1,800 1,800Losses 74 100 93 100 100
Closing Balance 823 376 627 877 927
Source: Planning Commission and Bank estimates.
1.38 Commodity Aid. Commodity aid disbursements are expected to amountto $520 million in FY79 and $580 million in FY80. These levels are in linewith the projected rates of growth of GDP and imports over the Two-Year Planperiod (FY79-80). In addition, they should facilitate the pursuit of theprogram of import liberalization which began in the current year. The markedincrease in the level of disbursement in FY79 (compared with the previousyear when it was $350 million) derives from increases in import prices ofseveral key commodities and from the need to increase the availability ofcertain raw materials and intermediate goods. Fertilizer imports, for
1/ Bangladesh: Report on Domestic Financial Resource Mobilization,IBRD Report No. 1919-BD; April 26, 1978.

- 17 -
example, are projected to rise from 418,000 tons in FY78 to 765,000 tons inFY79, and cement imports are projected to double to 750,000 tons. To ensurethe recommended level of disbursements, the pipeline at the beginning of eachyear should be roughly equivalent to projected disbursements for the year.Commitments of commodity aid in FY80, therefore, should again be about $650million.
1.39 Project Aid. Project aid disbursements in FY79 and FY80 are pro-jected at $325 million and $395 million, respectively, corresponding to aprojected increase in the investment ratio from 12.2% of GDP in FY78 to anaverage of 14.8% of GDP for the TYP period. Most of the investments in theTYP period will derive from the existing pipeline of projects, although somenew projects of a quick-yielding nature may be added. In order to sustainsuch a level of investment, a stream of aidworthy projects must continue to bebuilt up for implementation. It is desirable that the project aid pipelineshould continue to be equivalent to between 4 and 5 years of disbursements.This would imply new commitments of project aid totalling $720 millionfor FY80.
Table 8: PROJECTED AID COMMITMENTS AND DISBURSEMENTS(million US$)
CommodityFood (incl. cash) Project Total
FY78 (Actuals)
Opening Pipeline 79 361 1,109 1,549New Commitments 140 414 606 1,160Total Available 219 775 1,715 2,709Disbursements 190 352 255 797Closing Pipeline 29 423 1,460 1,912
FY79 (Projections)
New Commitments 250 650 700 1,600Total Available 279 1,073 .2,160 3,512Disbursements 250 520 325 1,095Closing Pipeline 29 553 1,835 2,417
FY80 (Projections)
New Commitments 220 650 720 1,590Total Available 249 1,203 2,555 4,007Disbursements 220 580 395 1,195Closing Pipeline 29 623 2,160 2,812
Source: Planning Commission and Bank estimates.

- 18
PART II
CHAPTER 2: MANAGEMENT OF THE OVERALL DEVELOPMENT EFFORT
2.01 The progress achieved in recent years should not, and cannot,hide the fact that at the completion of its first Five-Year Plan (FY74-78)Bangladesh still has to create the momentum for sustained rapid growth. Inthe 1960s and the first half of the 1970s, Bangladesh dropped significantlybehind the rate of economic growth achieved in other low-income countries 1/which, in turn, was far below the performance achieved by better-off countries.Between 1960 and 1976, per capita GDP of the low-income countries increased by0.9% per year, whereas it fell by 0.4% per year in Bangladesh. The stagnationof the Bangladesh economy during this period is shown by the virtual lack ofchange in the sectoral composition of GDP. The contribution of agricultureto GDP declined only from 61% to 59%, whereas it dropped from 52% to 45% inthe low-income countries group. Another indication of the economy's lack ofdynamism is the low level of energy consumption per capita (expressed in kilo-grams of hard coal equivalent) which amounted to only 28 kg, compared to 52 kgfor the low-income group as a whole.
2.02 The first Five-Year Plan aimed at overcoming the physical damagecaused by the war of independence and setting the economy on a rapid growthpath. The plan aimed at a GDP growth rate of 5.5% a year, an investment rateof 13% of GDP, and an increase in domestic resource mobilization which wouldhave permitted a reduction in foreign aid to only 27% of total investments.These targets have, not been achieved. GDP growth averaged only 4.0%, invest-ment in real terms amounted to only half the target, and the proportion offoreign aid in investment financing actually increased to about 80% of thetotal.
2.03 There is also evidence that economic stagnation has been accompaniedby a deterioration in income distribution. The crushing pressure of popula-tion growth, crop failures and farmers' indebtedness have led to diminishingfarm size and an increasing number of landless people. According to a 1977survey, 2/ the average size of farm holdings (including tenanted land)amounted to just under 1 hectare. Significantly, an estimated 82% of ruralhouseholds own less than the average holding, and 49% are landless or near-landless (owning less than 0.2 ha). Tenancy provides some additional landto cultivators, but only 20% of all tenanted land is farmed by those who haveno land of their own. The major part is farmed by those who have some landthemselves, on average 0.7 ha. Generally it seems, therefore, that tenantedland is not available for the landless. With the large number of young
1/ Low-income countries are those with 1976 per capita GNP of US$250 orbelow (34 countries). The definition and subsequent data on thesecountries are from the Bank's World Development Report, August 1978.
2/ F.T. Jannuzi and J.T. Peach, Report on the Hierarchy of Interests inLand in Bangladesh, US AID, Washington, September 1977.

- 19 -
households being formed every year -- 45% of the population is below 15 yearsof age -- fragmentation of holdings and landlessness continue to increase ata rapid rate. Although little is known about the sources of income of thelandless, it is generally recognized that landlessness and poverty are closelyrelated. One striking demonstration is the high correlation found inCompanigonj Thana between landlessness and mortality. Crude death rates andchild mortality both dramatically increased with declining landholding andwere extremely high for the landless.
2.04 In the second half of the first Five-Year Plan period, several factorsemerged which induced the Government to delay the beginning of a new Five-YearPlan by two years. A new, more pragmatic policy orientation had been takingplace since 1975, but it required further articulation to be developed into aconsistent whole. In addition, planners increasingly felt the need for poli-tical decisions on a number of fundamental options in order to be able to chartthe longer-term course of economic development. Finally, in order to make lee-way for a new development course, there was the need to finish up ongoing proj-ects, several of them initiated in pre-independence days, and simultaneouslyto weed out uneconomic projects. It was decided, thus, that a Two-Year Planshould be formulated for FY79 and FY80 as an approach to the second Five-YearPlan which in turn would start in July 1980.
2.05 The new orientation in economic policies arose after the confusionof the immediate post-war period was overcome and most of the infrastructuredamage had been repaired. At the same time, the political situation was be-coming more stable. A more pragmatic view than in the earliest days of inde-pendence arose regarding the nation's economic predicaments. The Governmentrecognized that reduction of population growth was a first priority goal. Anational population policy was formulated and a skeleton network of familyplanning services established throughout the country. At the same time, theGovernment recognized the link between poverty and lack of opportunity forproductivity increases. Top priority was to be given to stepping up food pro-duction. Growers' incentives were strengthened by increased availability offertilizer, improved seeds, irrigation water and credit, as well as by higherprocurement prices and more efficient procurement procedures. In industry,enterprises were aided by more liberal allocations of import quotas and creditand more rapid approval of investment licenses. A small number of the manyenterprises nationalized at the time of Bangladesh's independence were trans-ferred back to the private sector. Efforts were made to put public enterpriseson a commercial footing. The implementation of the public investment program,although still slow, has benefited from more concentrated attention from thetop level of Government. In the monetary field, the Government attempted toadjust the value of the Taka to international price movements by a 58% deval-uation in May 1975. The devaluation was followed by the implementation of apackage of monetary and fiscal measures which, until recently, kept domesticinflation below the level of world inflation and increased slightly, butsignificantly, the rate of domestic resource mobilization from its extremelylow level in the first years after independence. 1/
1/ Public savings had been negligible or even negative.

2.06 The common denominator of these policies has been the somewhat morepragmatic approach taken toward the country's economic problems. The finalimpact of these policies on economic development and growth is still not fully
clear, although it is obvious that the acceleration in growth in the lastthree years, and particularly in FY78, has been due not merely to the impactof favorable weather for agriculture but also to efforts to improve theeconomic conditions and incentives for production. It is too early, however,to assess the impact on economic performance of the new policy direction and,in any event, further measures will have to be formulated and implemented toarrive at a consistent framework for rational resource allocation. TheGovernment has cited the need to review the results of its efforts to intro-duce more pragmatic economic policies, to streamline its economic administra-
tion, to improve private sector incentives and to gain more experience withvarious models of rural development as one set of reasons why it decided todefer the formulation of a new Five-Year Plan by two years.
2.07 A further rationale for delaying the formulation of the new Five-Year Plan is the need for a proper orientation of the planners concerning a
number of fundamental policy issues which will determine the longer-termcourse of development. "Pragmatism", in the words of the Two-Year Plan, "canbe a philosophy for action for the short-term only; long-term planning must
be based on national convictions on important issues which can emerge onlythrough the political process." 1/ The planners believe that the conditionshave become ripe for such a political process, and it is certainly true
that a succession of good harvests and increased political stability havecreated the first breathing space since independence for an investigation anddebate on fundamental political choices. The planners suggest five majorpolicy areas in which fundamental decisions will be required:
(i) The respective role of the public and private sectors.Should certain industries remain reserved for the publicsector? Should the public sector be guided by rate ofreturn considerations alone? What scope exists forpublic-private cooperation in the form of joint ventures?
(ii) The pattern of agricultural land ownership and operation.
Options range from redistribution of land to the landlessand near-landless to various forms of voluntary or compulsorycooperation in farming.
(iii) The prices received by farmers and charged to consumers.Decisions will affect incentives to produce, the situation
of (urban) consumers, and the Government's financialsituation.
(iv) The role of education. What emphasis is to be given touniversal primary education, improved technical/vocationaltraining, and (costly) higher education?
1/ Draft Two-Year Plan, p. 291.

- 21 -
(v) The role of foreign aid and domestic resources in financingdevelopment. What contribution can be made by the agriculturesector, incremental incomes arising from development activi-ties, restrictions on luxury consumption? Is there scope forincreasing grant assistance to reduce future debt servicing?
2.08 The Two-Year Plan sets the stage for a discussion of each ofthese problem areas by outlining alternative solutions, but does not providea full discussion of the options. There are, moreover, a number of other,very practical questions which also appear to have an urgent claim on thepolicy makers' attention: how far does the Government intend to go in theliberalization of the economy; what measures does it intend to take to createoff-farm employment in rural areas; and what steps does it envisage taking tomake planning more effective than before?
2.09 First, regarding liberalization, it should be pointed out thatdespite moves towards pragmatism the Government still tries to exercisedetailed control over many aspects of economic life. Various restrictions,often overlapping, apply to the size and scope of private investment, accessto raw materials, competition from public enterprises and availability ofcredit. These restrictions lead to delays in production and investment,inefficiency in resource allocation and, frequently, abuse and corruption.They also take a heavy toll of the country's very scarce administrative talentwhich could be put to far better use in the implementation of developmentprojects, particularly in the rural areas.
2.10 Second, the creation of off-farm employment in rural areas is aproblem rapidly gaining in urgency. No conceivable rate of progress inagriculture will be able to absorb the large number of young people joiningthe labor force every year. The number of people who have to move out ofagriculture, and of those about to become redundant in future years, is solarge that it is also impossible to foresee that a major part of them canreadily be absorbed by conventional development in other sectors. At the sametime, however, there is an urgent need to provide rural areas with improvedinfrastructure, particularly at the village level, and there should, there-fore, be considerable scope for employing additional labor in the constructionand maintenance of irrigation, flood control and drainage works and of ruralroads, bridges, markets, storage silos, schools, health posts, etc. Thereshould also be scope for the promotion of small-scale and cottage industriesin rural areas. Activities of this nature could absorb some of the redundantlabor and in the process give further impetus to rural development. This willrequire imaginative action, but above all persistent and diligent attentionduring implementation to keep the enterprise going and to prevent the rotwhich, after initial success, tends to attack this type of effort and lead tothe usual frustration. Examples of the few countries that have been success-ful in rural development (e.g., China, T-aiwan and Korea) show that governmentofficials have diligently and persistently worked with local people to assurethe success of rural development activities.
2.11 Finally, on a broader front, it appears necessary to redirect thecountry's administrative talent toward the implementation of development

- 22 -
programs. This is a necessary condition for making the next Five-Year Planmore effective than the first one. Development services of all descriptionshave suffered from a lack of manpower at the working level. There is no doubtthat a much larger proportion of government servants should be involved at theworking level in strengthening extension institutions, local administration ofrural development projects, etc. The main pitfall to be avoided in gearing upfor the next plan is to present a well-written document, but to provide in-adequate administrative attention to resources at the working level for itsimplementation.
2.12 The Government has endeavored to make the preparation of the newFive-Year Plan the subject of public discussion, and this has already led touseful comments by Bangladeshi and foreign observers. Several studies com-pleted in recent years by the Government, Bangladeshi institutions. aid donors,and the Bank should help to orient further public consideration of majordevelopment issues. Among these are studies on rural development, landdistribution, food policy, jute and textile manufacturing, industrial policy,educational and manpower problems, domestic resource mobilization as wellas macro-modelling exercises. These and other studies should enable theplanners to set out in some detail the options which are available to policymakers. The absence of a review of these matters in the (Draft) Two-YearPlan document itself need not mean that the opportunity provided by thebreathing spell has been lost. However, the time available is extremelyshort; it may be asked, therefore, whether the planners are acting accord-ing to a coordinated timetable to obtain answers from the policy makers tothe questions which they posed in the TYP's final chapter and whether theywill, indeed, have the time to present an analysis of the policy options.
2.13 Information provided in the (Draft) Two-Year Plan and estimates ofthe Planning Commission suggest the following macro-economic framework:
Table 9: MACRO-ECONOMIC TARGETS OF THE TWO-YEAR PLAN
First DraftFive-Year Plan FY78 Two-Year Plan(. in % of GDP ........... )
Investment 10.5 12.2 14.8Public 8.9 10.5 12.4Private 1.6 1.7 2.4
Domestic savings 2.1 0.4 3.9Foreign Aid Inflow 8.4 10.9 10.9GDP growth rate (real terms) 4.0 7.8 5.7
Source: Two-Year Plan (Draft) and Bank estimates.
GDP growth in real terms is forecast by the planners at 5.7% per year. In-vestment is to rise moderately from 10.5% of GDP in the First Plan and 12.2%in FY78 to 14.8% in the TYP, while the domestic savings rate is to rise from2.1% of GDP in the First Plan and an estimated 0.4% in FY78 to 3.9% in the

- 23 -
TYP. The increase in domestic savings should allow a modest decline in theshare of foreign aid in investment financing, from 80% in the First Planto 74% in the TYP. The goal for GDP growth -- and with it the achievement ofthe other targets -- may prove to be overly ambitious, since it comes on topof the high growth rate achieved in FY78. Even with an excellent performanceof the agricultural sector, weather conditions for agriculture would have tobe extremely favorable for two more years to achieve the goal for GDP growth.In a weather-dependent agricultural economy such as that of Bangladesh it isvery hard to achieve an unbroken series of three years of rapid agriculturalgrowth and five without one significant off-year. If the GDP growth ratefalls short of expectations, it may also be difficult to achieve the targetfor domestic resource mobilization.
2.14 The planned sectoral allocation of development expenditures duringthe TYP is summarized in the following table; data for the first Five-YearPlan (FFYP) and the Hardcore Program are given for comparison.
Table 10: SECTORAL ALLOCATION OF DEVELOPMENT OUTLAYS(in percent)
HardcoreFFYP Program TYP
T(Y74-78) (FY76-78) (FY79-80)
Agriculture 26 30 25Industry 19 20 22Power and Natural Resources 13 15 12Transport and Communications 16 17 18Physical Planning and Housing 8 6 10Education 8 5 5Health 6 3 3Family Planning 2 2 3Other 2 1 2
Total 100 100 100
Source: Two-Year Plan (Draft).
2.15 The major point to note about this sectoral allocation is that itdiffers sharply from the priorities accorded to each sector in various state-ments on the Government's development objectives. In spite of the avowedpriority of agriculture, the share of agriculture (25%) is lower than in theFFYP (26%) and in the Hardcore Program (30%). The rapid increase in thefertilizer subsidy, which is included in the development expenditures foragriculture, further diminishes the share actually available for investmentin agriculture. Even more striking are the low shares allotted to education(5%), health (3.6%) and population control (3.0%). These low amounts are tosome extent explained, of course, by the weight of ongoing projects in theTwo-Year Plan. One of the purposes of the TYP is to "clear the deck" forlonger-term development action by completing as many projects as possible andabandoning those that lack or have lost economic justification. The latter

- 24 -
category includes a number of projects initiated during pre-independence dayswhich have been kept alive from year to year by small budgetary allocations.
As can be expected in any development program in any two-year period, the
bulk of public investment consists of expenditures on ongoing projects. Theplanners have only limited leeway to adjust the course of development to neweconomic priorities through the implementation of the TYP.
2.16 Statements regarding the elimination of uneconomic projects might,nevertheless, have led to the expectation of a somewhat lower weight for on-going projects than the 83% which is to be devoted to them. The TYP does notindicate which projects have indeed been weeded out and what their aggregateinvestment value has been. Neither does it indicate what criteria have beenused or are to be used in determining whether a project should be abandoned.It would be useful if the planners were to state clearly what has been happen-ing in regard to the evaluation of ongoing projects and how they intend tohandle this subject in the remainder of the TYP period.
2.17 The limited scope for change during the TYP draws into doubt itsgoals for structural improvements. The Plan aims at employment creationequivalent to the number of new entrants to the labor force (estimated at 1.8million during the two-year period) and even at some alleviation of existingunderemployment and unemployment. This is a promise which cannot be fulfilled.In the otherwise candid evaluation of the results of the first Five-Year plan,the TYP omits a discussion about the achievements in respect of that Plan'semployment goals, which also had been to absorb all new entrants to the laborforce. By all indications, however, unemployment has been increasing in thelast five years. The number of landless and near-landless in rural areas hasbeen rising sharply, and industry and other sectors of the economy have beenunable to absorb more than a fraction of those who are underemployed in theagriculture sector. The only sector which has been booming in terms ofemployment is public administration, and even here the employment increase,about 0.3 million, has been only a fraction of the 4.4 million increase inthe overall labor force during the five-year period. Although agricultureand industry have been starting to grow faster, no structural changes havebeen made in the design of development projects or in the relative price oflabor which would lead to a greatly increased employment elasticity. Nor areany such changes about to be introduced on a sufficiently wide scale and thereis, thus, no possible way in which the TYP's employment objective can beachieved.
2.18 Similar observations must be made regarding the TYP target for pop-ulation control, i.e., reducing the birth rate from 40 to 37 per thousand.Although the national population program is developing momentum, here, too,probably more is expected than can be achieved in a short period of time. The
main point to be made is that the TYP period should be utilized not so muchto try to achieve goals which are only achievable through long-term action,but rather to determine what steps must be taken to formulate a long-term
program. The following chapters, on agriculture, industry, and resourcemobilization, attempt to make a modest contribution in helping to determinewhich policies appear most conducive to long-term development in Bangladesh.

- 25 -
CHAPTER 3: ISSUES IN AGRICULTURAL DEVELOPMENT
A. Introduction
3.01 Agricultural productivity in Bangladesh is among the lowest inthe world. Although most of the arable land is under cultivation, only halfof it is double-cropped. Rice, which occupies three-fourths of the croppedarea, yields slightly over half a ton per acre, which is about 50% of Asia'saverage.
3.02 Agriculture in Bangladesh -- including crop production, fisheries,livestock and forestry -- contributes roughly 57% to GDP. Fisheries, live-stock and forestry together account for about 20% of the value of agriculturalproduction. The contribution of these three activities to GDP has been vir-tually stagnant during the 1970s. Crop production -- by far the most im-portant agricultural activity -- also failed to show any significant progress.Production of the major agricultural crops in FY78 was about 7.3% higher inreal terms than in FY70. Improvements have been made in the production offoodgrains -- the most important item in crop production -- but these havebeen partly offset by the decline in the output of jute, the second mostimportant crop.
Table 11: PRODUCTION OF SELECTED AGRICULTURAL CROPS
FY70 FY76 FY78 FY70-78 FY76-78(million tons) (annual growth in %)
Rice 11.82 12.56 12.99 1.2 1.7Wheat 0.10 0.22 0.34 16.2 26.1Sugarcane 7.42 5.89 6.67 -1.4 6.4Jute 1.28 0.77 0.96 -3.7 11.8Potato 0.86 0.89 0.85 -0.1 -2.3Pulses 0.29 0.22 0.23 -3.0 2.2Edible Oil Seeds 0.29 0.24 0.24 -2.5 0.0Tobacco 0.04 0.04 0.05 2.3 5.5Tea 0.03 0.03 0.03 1.3 6.7
Source: Bangladesh Bureau of Statistis.
3.03 The disappointing overall trend in agricultural growth, however,hides some significant factors. Agricultural output, like that of the restof the economy, plunged in the early years following independence. It tookthree years to overcome the dislocation of the agricultural economy and ofthe supporting services and to catch up with the output levels prevailingbefore independence. The stage was then set for further advances, which isborne out by the growth rates shown in Table 11 for the period FY76-78. Theyshow a substantial improvement in the production increase of all crops exceptpotatoes. Foodgrain production, particularly wheat, reached a record level

- 26 -
during FY78. Since FY76 was itself a year of high agricultural production,the relative improvement in growth performance is even somewhat better thanexpressed by the growth rates in the last column of Table 11.
B. Planning Goals
3.04 Among the objectives of the Two-Year Plan prime emphasis is given tothe development of agriculture. The Plan aims at a 4.1% annual rate of growthin agriculture in FY79 and FY80 and lays heavy emphasis on crop production.The targets for rice and wheat are for annual increases of, respectively, 3.7%and 10.9% over their record levels in FY78.
3.05 While these target growth rates imply a considerable shift fromhistoric trends, they draw some support from the favorable performance ofrecent years. Looking ahead, the achievement of such growth rates, at leastin food production, has high economic and social priority. According to theMinistry of Agriculture, the nation will require nearly 20 million tons offoodgrains from domestic production to feed a projected population of 101million in FY85 and also to permit about 1.5 million tons of exports. Theachievement of this target, however, requires a 6% annual growth rate overthe FY78 level. Although such a growth rate has actually been achieved overthe period FY75-78 and the potential for further growth is considerable, itwould be unrealistic to forecast a sustained increase at this rate, even ifstrong efforts were made to raise agricultural production.
3.06 An alternative set of projections (presented in Table 12) indicatesa lower requirement of growth in foodgrain production through 1984/85. Usingthe IBRD population projection and the GOB per capita daily foodgrain require-ment of 15.5 oz, and assuming zero to a million tons of imports, a gross pro-duction requirement of 16.5-17.6 million tons is implied for 1984/85, requiring3%-4% annual growth over the 1977/78 level. (The irrigation requirements forthis growth scenario are discussed in Section C of this chapter.) Althoughtentative explorations by the Bank provide support for the feasibilityof achieving these growth rates, it should be pointed out that they are veryhigh compared to the growth rates of 1.9% between 1960-74 and 1.5% between1969-78. To reach the higher growth rates will require excellent planning,great determination in the implementation stage, and good weather.

- 27 -
Table 12: FOODGRAIN REQUIREMENT ESTIMATES(million tons)
FY70 FY75 FY78 FY80 FY85(Mission projections)
Population (millions) /a 70.8 78.2 85.0 89.6 101.4Food Requirement 11.2 12.3 13.4 14.1 16.0Imports 1.6 2.3 1.6 1.3 1.0-0.0Stock Change - -0.5 0.2 0.2 0.0Required Gross Production 10.7 10.6 13.3 14.3 16.5-17.6Required Net Production /b 9.6 9.5 12.1 12.8 15.0-16.0
FY78-FY80 FY78-FY85
Annual Growth in Production .. .. .. 3.3% 3.0%-4.0%
/a Statistical Appendix, Table 1.179 Allowing 10% for seed, feed and waste.
Source: Ministry of Planning and Bank estimates.
3.07 The rapid increase of wheat cultivation in recent years is one ofthe most promising developments in Bangladesh. Wheat has quickly foundacceptance as a staple food, not only in the cities where it is a large partof grain sold through the ration system, but also in rural areas. The poten-tial for further growth is considerable. Making allowance for the overlappingacreage requirements in the aus and aman season and of non-cereal crops, atleast 3 million acres are suitable for wheat cultivation. Constraints are thestill novel nature of the crop for many farmers who have to solve the problemof fitting wheat into their established cropping pattern, the availability ofseeds and fertilizer, and the prevention of waterlogging of irrigated fields.Success in recent years in overcoming these constraints suggests that furtherrapid growth of wheat cu.ltivation should be feasible.
3.08 For the next two years, the TYP presents an opportunity to consoli-date the progress made in agriculture and lay the foundation for sustainedgrowth. The Plan document, while presenting various output and input targets,does not adequately explain the assumed input-output relationships, nor doesit clearly relate the various actions and investments proposed in the agri-cultural sector to the goals that have been set out. A serious handicap fordecision making is the lack of an adequate and reliable data base that wouldmake planning possible. Work is in progress at the Bureau of Statistics onan Agricultural Census; the results of a pilot survey covering 42 thanashave already been published. Much more information on production relations,farm budgets, prices and on supporting programs will need to be gathered ifagricultural planning is to be effective; establishing a skeleton frameworkof reliable economic statistics should be an essential feature of the devel-opment efforts in the agriculture sector in the TYP period.

- L. U -
3.09 Achievement of the TYP targets is predicated on the strengtheningof programs to elicit suitable farmers' response. This chapter will reviewsome policy issues of relevance for achieving more rapid growth in the pro-duction of foodgrains and jute. In planning for the achievement of themedium-term targets beyond FY80, however, the economic, technical and insti-tutional feasibility of longer-term growth strategies also need to be con-sidered. The GOB is considering the preparation of a National AgriculturalProduction Plan extending beyond 1985. Interest in such a plan was stimulatedby the agricultural sector review carried out jointly by the ConsultativeGroup on Food Production and Investment (CGFPI), UNDP and FAO in April 1977.A follow-up mission in October-December 1977 by FAO and UNDP further examinedthe constraints on food production. The Government recently indicated thatit is prepared to support such a planning exercise and agreed tentatively withthe Bank to carry out a joint medium-term planning exercise for agriculturalproduct ion.
3.10 Achievement of the Plan's targets for agriculture also requiressufficient financial resources, primarily a sufficient allocation for agri-cultural activities in the Annual Development Program (ADP). Although thereis scope for improving efficiency in the use of a given allocation inagriculture -- for instance, through more effective programs to improve watermanagement, through liberalization of inputs distribution and better coordi-nation between the agencies concerned with agricultural and rural development --
the achievement of a higher growth rate in agriculture also calls for higherADP allocations. The Ministry of Agriculture estimates that to achieve theoutput targets for FY80, the last year of the TYP, fertilizer use will needto increase by about 60% above the FY78 level. Similarly, total irrigatedacreage will need to increase by about 35%. To achieve these and other inputtargets, the Ministry estimates the need for a total outlay of Tk 10,940million during the TYP period. The proposed allocation for the Ministry ofAgriculture, however, amounts to only Tk 4,250 million. Although the TYP,in addition, proposes allocations of Tk 3,250 million and Tk 1,480 million,respectively, for the Ministries of Water Resources and Rural Institutions,which are also involved in agricultural activities, these funds would notfully cover the needs described by the Ministry of Agriculture.
3.11 Whether the Ministry's estimates are reasonable or not, the ADPallocations for agriculture seem inadequate to accomplish the stated objec-tives of accelerated growth in agriculture. Although the allocations toagriculture have increased rapidly in current prices, they increased by only6% a year in real terms over the low FY74 level. 1/ This is lower than therate of increase which prevailed for all development expenditures. Thepercentage of development expenditures allocated to agricultural activitiesdeclined from about 34% in FY73 to 29% in FY78 and will drop further to 25%in the TYP. The share of agriculture -- excluding Water Resources andRural Institutions -- has remained around 12%. Furthermore, over the yearsan increasing portion of this ADP allocation has had to be used to financethe subsidies on fertilizer and pesticides. The subsidy component, estimated
1/ Using the deflator implicit in Table 1.6 of the Draft TYP, p. 10.

- 29 -
at 18% of the ADP outlays for agriculture in FY73, rose to 40% by FY76.With sharp increases projected in fertilizer offtakes, these subsidies (atcurrent rates) will represent the primary claim on the ADP allocations foragriculture -- which, in turn, implies inadequate allocations to intensifykey supporting services which are already hampered by the lack of funds.
C. Irrigation Requirements
3.12 Growth of foodgrain output can be achieved through a variety ofinput combinations, utilizing HYV seeds, improved local seeds, fertilizer,irrigation and flood control. Analyses made thus far of the prospects foroutput growth agree on the important contribution that should be made byincreased irrigation and better water control. At present, 22 million acres,or almost all of the arable land, is being cultivated. According to availablestatistical evidence, which admittedly is not totally reliable, only 1.34million acres are triple-cropped and 8.4 million acres double-cropped. Thisimplies substantial potential for cultivating additional crops, particularlyin the dry season (November-March) through the provision of irrigation. Here-in lies the main prospect for increasing agricultural production in Bangladesh.Increased irrigation will permit both an increase in cropping intensity and anincrease of modern inputs leading to higher yields.
3.13 The contribution which irrigation can make to output increases iswell documented. For the shallow tubewells project in Northwest Bangladesh,which IDA is helping to finance, it was estimated, for example, that in theproject area of approximately 150,000 acres (associated with 10,000 shallowtubewells) foodgrain production would increase by about 150,000 tons ('117%).The project envisions a threefold increase in fertilizer use, a twofoldincrease in the application of pesticides and a tenfold increase in theutilization of HYV seeds. It also envisions an increase in cropping intensityfrom 144% to 176%. The projected increases in foodgrain yields to 1 ton peracre (117%) and in cropping intensity (22%) indicate the significant impact ofirrigation and associated inputs on crop production.
3.14 Flooding causes damage to crops and property at an estimated annualcost of Tk 650 million. About 14 million acres out of the 15 million acressubject to floods are now cultivated. Given the high risk in these areas,farmers minimize their potential losses by growing low-yielding varieties andreducing the use of other inputs in these areas. The provision of floodprotection and drainage for such areas will be generally required if thereis to be a significant increase in cropping intensity and planting of HYVs.However, the economics of flood protection in Bangladesh need careful assess-ment in particular circumstances to determine the priority of flood protectionand drainage for flooded areas. Although it is recognized that productionfrom HYV aus and aman will require flood protection and drainage, the dis-cussion below will be confined to irrigation requirements.
3.15 Meeting the FY85 production targets mentioned above will requirelarge increases in irrigated acreage. The Ministry of Agriculture estimates

- 30 -
that achievement of its 20 million ton target will require an increase from2.7 million acres irrigated in FY76 to 4.8-5.5 million acres in FY85.Tentative calculations by the Bank tend to suggest that achievement of itsmore modest output target of 16.5-17.6 million tons would require an increasein the irrigated area to 3.7-5.3 million acres. These calculations, therefore,indicate a range of 3.7-5.5 million acres of irrigation required to meet thealternative production targets by FY85.
3.16 The Government is faced with a major challenge. Irrigation is themain avenue to agricultural growth and foodgrain self-sufficiency, by allowingincreased cropping intensity and guaranteeing higher yields. But past devel-opment has been slow (only some 400,000 acres were newly irrigated duringFY71-76) and most of the increase in production in recent years has probablycome from increased fertilizer use. A large increase in efforts will beneeded to achieve even the more modest targets underlying the Bank's growthprojections.
3.17 One reason for the low growth rate of irrigated acreage in the pasthas been the emphasis laid historically on flood control rather than irriga-tion. Bangladesh, situated in the delta of three mighty rivers -- Ganges,Brahmaputra and Meghna -- is subject to frequent flooding. Combined dis-charges from the rivers sometimes exceed 5 million cusecs, destroying life,property and crops. Given the immensity of the threat of floods, theBangladesh Water Development Board (BWDB), one of the principal agenciesdealing with water -- relying on the 1964 IECO Master Plan for Water and PowerResources Development in East Pakistan -- directed most of its efforts atflood control in the major systems, with irrigation introduced at a laterstage. The Government, in the first Five-Year Plan, allocated 53% of itsinvestment for water development in the ADP to large-scale projects of theBWDB, but these schemes have produced only 9% of the irrigation development. 1/
3.18 While flood control continues to be needed, the requirements offood production have assumed increasing importance in recent years. Giventhe need to meet the food needs of a large and rapidly growing population,the GOB has begun to shift its major objectives in water development fromflood control to irrigation for foodgrain production.
3.19 In designing its irrigation strategy, the Government will havesubstantial leeway to choose between several types of irrigation systems:gravity schemes and low-lift pumps (LLP),- which use the water of the country'srivers, and deep tubewells (DTW), shallow tubewells (STW) and handpumps (HP),which use the groundwater resources abundant almost everywhere. The relativerole of these different irrigation systems in serving the irrigated acreagein FY76 is shown below. 2/
1/ Selected Policy Issues in Agriculture (Bangladesh), FAO/UNDP Mission,Dacca, April 15, 1977, p. 6.
2/ Source: FAO/UNDP Working Paper on Irrigation Policy,Dacca, April 1977, p. 7.

- 31 -
Type of System Acreage CoveredAcres % of Total
Gravity 110,000 4.0LLP 1,430,661 52.6DTW 152,142 5.6STW 7,678 0.3HP 20,000 0.7Traditional 1,000,000 36.8
Total 2,720,481 100.0
In addition, the Bangladesh Water Development Board reports that approxi-mately 3.3 million acres are protected by flood damage control and drainagefacilities. It appears, however, that this figure represents the total sur-face of completed schemes rather than the area under effective control, sincemuch of the coastal embankment is at present not effective in prevent'ing flooddamage.
3.20 The irrigation strategy will eventually have to be determined inthe light of considerations of costs, reliability throughout the year, main-tenance and cost recovery problems, as well as technical and organizationalproblems arising in conveying the water to the farmers' fields. It is almostcertain, however, that the strategy will have to lay increased emphasis on theuse of groundwater. Calculations by the Ministry of Agriculture indicate anincrease from about 7% of total irrigated acreage by groundwater in FY76 to37% in FY86. Bank calculations also indicate the need for a sharp increase.
3.21 Relatively cost-efficient irrigation devices increasingly demandedby farmers are shallow tubewells. In an earlier Bank report, 1/ it has beenestimated that the cost of irrigating one acre of paddy by shallow tubewellsis Tk 660; the comparable figures for low-lift pumps, deep tubewells and majorgravity schemes are, respectively, Tk 415, Tk 880 and Tk 1,300. 2/ The organ-ization of farmer groups to use shallow tubewells is relatively easy, sincethe tubewell typically has a command area of only about 6 acres. An addi-tional favorable factor is that the tubewells are sold to farmers at cost,although operation and maintenance are subsidized. Consequently, the subsidyfor this type of scheme is only about 25% of the cost per unit, compared tothe present subsidies of about 50% on low-lift pumps, 75% on deep tubewellsand almost 100% on the major gravity schemes.
1/ Bangladesh: Irrigation Water Charges, IBRD Report No. 1963-BD; March 6,1978.
2/ Although low-lift pumps show a lower cost, physical conditions appearto put a constraint on the maximum number that can be employed -- 20%more than the number currently in use, according to one estimate. Thiscould be a limiting factor on any major push for introducing more low-lift pumps in the absence of complimentary investments such as doublepumping.

- -)
3.22 Given these favorable features of shallow tubewells, a number ofstudies have recommended a sharp increase in their use, ranging from 11%in the Bank's estimates to 37% in working papers prepared by FAO/UNDP. Itwould appear to be a matter of high priority, therefore,. to plan for a size-able increase in the supply of shallow tubewells.
3.23 The overall implications of future irrigation requirements arespelled out in the draft report of the joint GOB/World Bank review of theBWDB. 1/ This report envisages a greatly expanded role for both the BWDB andthe Bangladesh Agricultural Development Corporation (BADC), the two principalagencies dealing with water. It is envisioned that the BWDB, which provided110,000 acres of irrigation in FY76, will need to install systems during thenext six years (through FY85) to irrigate a total area in the range of 350,000to 1,240,000 acres. The BADC, on the other hand will need to supply irriga-tion for some 2,380,000 to 3,250,000 acres, compared to about 1,610,000 acresof irrigation supplied in FY76. Efforts to reach these targets should not,however, diminish the emphasis to be placed on making better use of existingBADC irrigation facilities.
D. Procurement Policy
3.24 The Government has used two principal tools to provide farmerswith financial incentives to increase their output: the procurement pricefor rice and wheat, and subsidies on inputs like fertilizers and irrigation.Both are meant to induce farmers to adopt modern technology to increase theiroutput. Thus far, there has been no serious attempt to compare the costeffectiveness of the two methods.
3.25 The procurement price seems to be very effective in the case of smalland marginal farmers 2/ whom it helps to protect against the risk of a sharppost-harvest decline in prices when they are financially unable to hold onto their stock. According to scattered evidence, they are adopting moderntechnology in response to the incentive price. Therefore, even if the incen-tive price in any year is well above the cost of production on the average,the procurement price level should be reviewed every year in order to ensurethe desired response in terms of increased output from the marginal farmersin the face of inflation (an estimated 15% in the current year). Last year'sprocurement price of Tk 132/maund for rice still may be higher than the
1/ Bangladesh: Report of Joint Government of Bangladesh/World BankReview of the Bangladesh Water Development Board (Draft), IBRD Report
No. 2327-BD; January 16, 1979.
2/ The increase in marketed surplus of the small farmers may even be largerin percentage terms than that of the big farmers to the extent that the
former are likely to increase output and reduce self-consumption-inresponse to procurement price increases.

- 33 -
average cost of production of the majority of farmers, so that incentives forinvestment for them may still have been maintained; it is probably not highenough anymore for small and marginal farmers, however. Since small farmsaccount for a large part of the cultivated area (30% of the land is in hold-ings of less than 1 ha), it is important that the small farmers have suffi-cient incentive to use purchased inputs. If they do not, it will be hard toachieve satisfactory overall increases in foodgrain output.
3.26 At whatever level the procurement price is fixed, all efforts willneed to be made so that the post-harvest market price does not fall belowthe procurement price. This involves keeping the volume of procurement flex-ible. The procurement target for FY79 is 600,000 tons; if the price drops,however, the authorities should be prepared to purchase additional quantities.A flexible procurement policy aimed at stabilizing prices at incentive levelswould induce the private rice traders to hold rice stocks over the year with-out undue speculative motives. To strengthen particularly the small traderat the thana and village level would also require increased availability ofcredit for these traders.
3.27 Annex 1 presents an illustrative model which attempts to show howmuch grain the authorities should be prepared to procure to achieve a certainprice increase. The model is not based on statistical data but on the rangesof supply and demand elasticity quoted by observers, and it shows how muchgrain should be procured to achieve a stipulated increase in output. Accord-ing to this model, total foodgrain procurement of between 520,000 and600,000 tons would have been needed to raise prices enough to achieve lastyear's increase in output of 3% over the "trend" level (i,e., the level thatwould have prevailed in the absence of the procurement-induced price increase).The actual level of procurement which did achieve a 3% increase in output overthe "trend" level was 550,000 tons, well within the range indicated by themodel. The predictive value of the model in its present form should not beoverrated, however, since it is too simple to do justice to the complicatednature of agricultural production which depends on the output of farms ofdifferent sizes, operating under different tenurial arrangements and producinga variety of products. Serious empirical investigation will be needed toarrive at a more satisfactory approximation of likely farmers' responses toprice change. It is recommended that the Government attempt to base itsprocurement policy on systematic analytical investigations of this nature.These, it seems, should be entrusted to the Food Policy Unit which is toprovide technical advice to the Ministerial Committee on Food.
3.28 The impact of the higher output price on production can also beachieved by an input subsidy -- a fertilizer subsidy, for instance. To havethe same effect, it should reduce the marginal cost of production by an amountequal to the corresponding increase in the procurement price. The cost ofproviding that level of subsidy for fertilizer, however, is likely to differfrom that of supporting the output price. Annex 1 of this report comparesthe cost of two approaches -- a rice procurement policy and a fertilizersubsidy policy -- assuming certain values for the elasticities of demand andsupply of foodgrains and estimates of production costs. A tentative calcu-lation indicates that, to achieve the same output increase, the fertilizer

- 34 -
subsidy would cost the Government about 150% more than the price supportprogram of procurement and sales of foodgrains. 1/ In view of the illustra-tive nature of the model this result can of course be taken as only a verytentative indication of the relative cost of the fertilizer subsidy.
3.29 The price support allows the producer full flexibility in adjustinghis inputs to the incentives, while the fertilizer subsidy restricts incentivein favor of this particular input and may not be cost efficient. On the otherhand, it is sometimes argued that the benefits of price support are availableeven to those who do not raise productivity, while the fertilizer subsidyrestricts benefits only to those who buy fertilizer which will eventually beused in production. This argument cannot apply to those who respond to poten-tial incremental benefits: there is no reason why those who buy more fertil-izer at subsidized prices will not also raise output in response to higheroutput prices. Thus, for any reasonable supply elasticity both schemes willinduce a higher output, and a calculation of the cost of the two approachesbecomes relevant. Doing this on a regular basis should again be the task ofthe Food Policy Unit, which should be concerned not only with productionaspects but also with fertilizer and other input policies. As pointed out,however (para 1.19), it is difficult to justify the current subsidy level,since available supplies are presently insufficient to meet all of the demandfor fertilizer.
E. Open Market Operations
3.30 The sale of foodgrains by the Government can be used for the purposeof stabilizing the price over the seasons, depending on the quantity and priceof the sales. The distribution of foodgrains at prices well below the marketprice, as done in the past, reduces the volume of stocks which the Governmentcan use for price stabilization, however. So far the Government has not usedthe stocks of grain at its disposal to achieve stability in the prices receivedby farmers. The operation of the ration system was completely separated fromthe Government's efforts to improve incentives for producers. While no changeis envisaged in the ration prices for FY79, the Government intends to engagein a limited open market operation with the aim of stabilizing the rice pricein the lean season. The plan is to sell about 200,000 tons of wheat -- at aprice yet to be announced, but perhaps Tk 85/maund -- during the lean periodto prevent the rice price from rising too high -- i.e., over Tk 145-150/maund-- provided there are adequate buffer stocks (about 500,000 tons).
3.31 Ideally, to prevent the rice price from rising too high in the leanseason, open market operations should be done in rice and should start whenthe market price approaches a level which is considered to be the ceiling.Since it has been decided, however, to operate in wheat and with limitedquantities, the Government can increase its impact on the rice price by
1/ As Annex 1 points out, the calculations depend on the parameters usedand the estimates ignore changes in consumers' and producers' costs.

- 35 -
disclosing neither the ceiling and sale prices, nor the sale quantity pre-maturely, thus keeping speculators in the dark. It can then sell the avail-able amount close to the prevailing market price for wheat as the priceceiling for rice is approached. The wheat price is usually 60-68% that ofthe rice price, and there appears to be considerable cross-elasticity inconsumption between rice and wheat. If, then, Tk 150/maund is the thresholdrice price, and if the 60-68% relationship holds, transactions would takeplace when the wheat price is Tk 90-102/maund. Analogous to a fixed minimumprocurement price for paddy to be maintained by a flexible quantity of procure-ment, the Government could aim at maintaining an effective price ceiling onmarket prices by an open market operation flexible in terms of quantity.Given the fixed quantities of wheat earmarked for this operation in FY79,however, the second best solution seems to be to keep the price of wheatflexible and to make no announcement as to the quantity available for this
operation, thereby minimizing speculation by private dealers.
3.32 Carried out on a sufficient scale, open market operations should
lead to stable supplies and prices in consumer markets, thus eliminating the
main justification for a general food rationing system. Once such stabilitywere achieved, the only part of the rationing that might have to remain wouldbe the transfer of food at subsidized prices to the most disadvantaged groups.Achieving the goal of market stability would, of course, require a substantialincrease in the stocks of foodgrains, as well as improvements in transportationand marketing.
F. The Role of Jute
3.33 Bangladesh is yet to achieve a stable level of jute output largeenough to supply the domestic and foreign markets. The relative price and,consequently, acreage have increased considerably in recent years, but outputhas not responded to the same degree. In FY79, however, a marked increasein output to 6.0-6.5 milli-on bales, according to some preliminary estimates,is expected. With a 40-60% increase in productivity possible on IJCS land,the expansion of this scheme will be the key to output increases in FY79 andbeyond. The success of the IJCS depends, inter alia, on the timely supply ofinputs and on increases in trained staff.
3.34 The declining fortune of jute in recent years was not only due toshortages in output, but also to a very slow increase in world demand. Inthis context it becomes important that efforts to improve productivity do notlead to overproduction. The most recent FAO projections indicate annual worldimport requirements for raw jute of about 3.2 million bales by FY80. Maintain-ing its present share of 75% of world exports would imply the possibility ofsales of 2.4 million bales of Bangladesh jute in the world market. (Alterna-tively, a higher level of 2.8 million bales may be projected on the presumptionthat Bangladesh could meet some of India's raw jute requirements). The futurerequirements of domestic mills are estimated at 3.3-3.6 million bales, in linewith, respectively, jute goods exports of 550,000 and 600,000 tons and

- 36 -
no change in domestic consumption of jute goods. Combined with an unchanged300,000 bales consumption of raw jute by domestic users other than mills,the lower demand figures give a lower bound of 6.0 million bales of raw juteproduction that can be marketed with no change in output prices. The higherfigures imply a demand for 6.7 million bales with no change in price.Allowing, in addition, for a 300,000 bales stock buildup during each of thenext two years implies a total demand for 7.0 million bales annually.
3.35 A second consideration in planning for the increase of jute outputis its impact on rice production. Previous studies have discussed the changesin output in response to changes in the rice/jute price ratio. A recentinvestigation 1/ analyzed the financial and economic benefits from the twoalternative crops. As far as financial benefits are concerned, the studyshows that, at current prices, traditional production of aus paddy generatesa net return of 30% of that for traditional jute. By comparison, the netfinancial return from improved aus production is 91% of that from IJCS jute.The study, however, projects that, due to price changes, improved aus ricewould give a financial return of 140% of IJCS by 1985. With regard toeconomic benefits the study indicates that the net return at current pricesfor traditional rice is 65% that of traditional jute; improved rice, on theother hand, yields a net return of 118% of improved jute based on currentIJCS yields, but only 85% of that of improved jute if the full IJCS potentialis realized. By 1985, however, the economic return is projected to change infavor of rice. It would, therefore, appear that the opportunity cost ofincreasing jute production is not a binding constraint at least in the nexttwo years or so; beyond that the opportunity cost of rice foregone could be aserious consideration, however. In the past, jute output has appeared to bequite responsive to price changes. This responsiveness should be conduciveto restricting jute to areas less suited to rice when relative prices changein favor of rice.
3.36 To assure a stable and sufficiently large jute crop, the farmgateprice should be at an incentive level. Farmgate prices for the first halfof FY78 averaged Taka 120-125/maund, compared to the Government's minimumprice of Taka 90/maund. It is expected that the farmgate price will even-tually average around Taka 130-135/maund over the current year, well abovethe FY79 minimum price of Taka 100/maund. Farm budget surveys indicate thatthese price levels should provide sufficient incentives to jute producers,not only in absolute terms, but also relative to the expected price of rice.
3.37 The domestic price represents the shippers' opportunity cost ofexporting jute; it is also the most important determinant of the profitabilityof jute manufactures (the cost of jute being 50% of the cost of production).The jute price rises in response to an increase in demand by either theshippers or the domestic mills who thereby inflict a cost on the other party.Considering the differing constraints under which these two groups of jutebuyers function, it seems important to establish a mechanism to assure an"optimum" supply of jute to both. A number of options exist: one of them
1/ Economic Consultants Ltd. with PA Management Consultants Ltd., InternalMarketing and Pricing of Jute (Final Report), London, February 1979.

- 37 -
is the establishment of a buffer stock of jute. Analogous to the rice pro-curement program, the Government could stock jute when the price is low witha view to stabilizing price over the seasons. This idea has recently beenendorsed by the FAO which has recommended a build-up of national stocksto stabilize international trade in jute. With the jute price presently ata high level, prospects are not good for starting to set up a buffer stock inFY79. The authorities should, however, be prepared to intervene in the marketif in any future year prices were to drop substantially; to this end they maywish to seek appropriate financial and technical assistance from abroad.
3.38 The question of an appropriate price of raw jute cannot be addressedindependently of the overall choice between raw jute exports and jute goodsexports. In trying to estimate how the combined net export earnings fromthese two alternative sources can be maximized, one needs to compare (i) theexport revenue earned from a unit of raw jute with (ii) the export revenue,net of cost, earned from converting a unit of raw jute into jute manufactures.A change in the domestic production cost of raw jute affects the formerdirectly and the latter indirectly. Whether the mix of raw jute and jutegoods exports is "right" depends on Bangladesh's ability to independently varyexport prices. This ability is reflected by the demand elasticities for rawjute and jute goods. Annex 2 of this report shows that the world demand forjute goods exports is quite elastic, while raw jute demand is likely to bemuch more inelastic but not significantly different from one. This impliesthat there exists little possibility of gainfully responding to an increase inproduction costs in Bangladesh by increasing the export price of jute goods --and even of raw jute -- except perhaps in the short term.
G. Agrarian Structure
3.39 The most striking feature of Bangladesh's agrarian structure is thegrowing pressure of the rural population on land. According to the Bureau ofStatistics, the rural population grew by 35% between 1961 and 1974, makingrural Bangladesh one of the most densely populated areas in the world. In1974, the rural population density averaged 2,030 persons per square mile,with some rural areas (like those in Comilla) containing more than 3,000people per square mile. Consequently, the size of landholdings has beendeclining steadily; currently about half of the landholdings are less thanone acre in size and 60% are under three acres.
3.40 Even with high population densities and generally small holdings,the ownership of land has become increasingly concentrated. Evidence for1977 indicates that 3% of the households own more than 25% and 11% own morethan 52% of all land. In contrast, one-third of rural households own noagricultural land at all and, together with those owning less than half anacre, the effectively landless constitute about 48% of the rural population.
3.41 Land Tenure. A disturbing consequence of the population pressureare the emerging land tenurial arrangements which reflect the high value of

- 38 -
land and, therefore, the relative economic strength of the landowners. TheGovernment obviously is aware of this situation but has not been able to gobeyond setting up a commission to look into the question of land reform. Anincreasing percentage of farms (30-35%) are involved in sharecropping arrange-ments under which the tenants generally bear all the input costs, but share50% or more of the output with the landlord. It is widely believed that thesharing of the gross output with the landlord leaves the tenant insufficientincentive to invest in modern inputs. It might be argued that a potentialbenefit from investment exists for the landlord as well so that, where profit-able, he might be expected to vary the tenurial arrangements and investjointly with the tenants. The 1977 Land Occupancy Survey indicates, however,that landlords do not act in this manner, as less than 1% of them providedagricultural inputs to their tenants.
3.42 There is some evidence that in the Northwest region of Bangladesh,where sharecropping is relatively more widespread, productivity is lower,particularly in comparison with the Southeast region. This might be inter-preted as evidence of a negative correlation between sharecropping per se andproductivity. However, at least two additional factors should be considered:first, the Southeast region receives a relatively better supply of inputs;second, it contains relatively more small farmers who generally have beenmore responsive to the use of modern inputs.
3.43 Rural Income and Employment. Whether or not productivity is inde-pendent of the tenurial arrangement, the present trend in land ownershipconcentration is symptomatic of a deeper underlying problem: the lack ofproductive employment opportunities for the rural population and the result-ing pressure on-land. With most of the land under the plough, virtually nopossibility exists for further extending the cultivated acreage. The ruralpopulation has been growing by about 2.6% annually since 1960, while accordingto a recent estimate the annual rate of increase of labor requirements in cropproduction between 1960 and 1976 was only 1.2%. The Ministry of Agriculturereports that the agricultural real wage, as a result, declined from about Tk 2per day in the mid-1960s to about Tk 1.5 in the mid-1970s. According to theRural Nutrition Survey of 1975/76, the caloric content of daily per capitafood intake in the rural areas declined from 2,224 in 19~62-64 to 2,094 in1975/76, a decline of about 6%.
3.44 The available indicators of rural well-being do not extend to theperiod beyond 1975/76, when a significant upturn took place in agriculturalproduction (para 1.04). Nevertheless, they serve to highlight the criticalneed to develop strategies to absorb the growing rural population in produc-tive employment. In rural areas, ways and means need to be found to developa wide range of employment-oriented activities which, in many cases, wouldrequire the prior development of appropriate technology. These could includeagriculture-related schemes like small-scale irrigation and drainage systemsand non-agricultural activities like cottage and small-scale industries andalso, to some extent, the development of the services sector. Expansion ofrural activities alone will not be enough to meet the employment needs.Thought must be given to a better spatial distribution of activities andpeople, and the potential for the development of lagging regions andsecondary urban centers must be examined.

- 39 -
3.45 Rural development. The history of Bangladesh's earlier effortsin this respect shows, however, that there are many pitfalls on the road torural development. Rural development is a complicated task, particularly inBangladesh with its acute scarcity of resources, skewed distribution of landownership, and widespread illiteracy and poverty. The country's main instru-ment for rural development, the Integrated Rural Development Program (IRDP),is based on the principles of village participation and training at the thanalevel of elected village representatives and was first put into practiceunder the auspices of the Comilla Academy. Although it was launched withconsiderable local enthusiasm and foreign acclaim and showed good initialprogress, results of the IRDP have generally remained below expectations.Performance in the program area (200 thanas) is not perceptibly better thanin the rest of the country. The main benefits have been the creation of asubstantial organization reaching down to the village level and the experiencewhich has been gained in dealing with rural problems. Hindsight reveals thatthe main shortcomings of the approach that has been followed fall into twocategories: short comings of design and shortcomings of implementation.
3.46 Concerning design, it is now clear that the program has sufferedfrom too little concern to establish clearly beforehand what was to beachieved. Activities under the program covered a large range of rural works:roads, bridges, drainage canals, storage facilities, markets, fish ponds, etc.For each of these a blueprint would have been needed determining what preciselywas meant by a rural road, market, school, with what materials, methods, andmanpower it was to be constructed, how much it was to cost and how much timeconstruction was to take. Lacking such agreed blueprints, which of coursewould have required considerable study and research, some works of question-able quality have been constructed. This has given some of the rural worksactivities the character of give-away schemes rather than of additions toproductive capacity. Conversely, research on proper design would have repaiditself in solid achievement and in the scope for replicating with less initialeffort over wide areas, eventually over all of Bangladesh. The design stagealso suffered from insufficient consultation at all levels about the actualcontent of the program. Such consultation is indispensable for the successof any planning exercise. In the thanas, rural people, not consulted aboutthe program, remained unaware of what IRDP might have meant for their communi-ties. Ministries and departments were not consulted about their precise rolein the program or asked about their ability to carry out parts of it; as aresult they did not really become committed to its execution. Sorting outlocal priorities and reviewing the division of responsibilities among govern-ment units would have paid off in greater enthusiasm and better coordinationduring implementation.
3.47 Following this weak preparation, implementation results could notbe excellent. As it turned out, coordination among concerned ministries anddepartments has continuously left much to be desired, with certain agenciesfeeling some, but others no, commitment to it. Parallel rural developmentefforts were set up outside IRDP with which they competed for resources.Supervision of works has been inadequate; certificates of completion havebeen issued without proper inspection, sometimes for faulty or unfinishedwork. Without firm guidance, many cooperatives were allowed to become domi-nated by richer members who often have diverted funds for their own benefit.

- 40 -
The financing content of the program was poorly conceived; finding little ofpractical use in it, participants have attended courses irregularly and havenot bothered to disseminate information to their fellow villagers. All around,implementation has suffered from lack of attention on the part of those whowere to guide it and lack of enthusiasm and respect of those who were supposedto benefit. The lessons are clear: to be successful, programs to boost ruralemployment and incomes require a much larger, determined, detailed effort fromstart to finish. Innovative plans are necessary but are not sufficient in andby themselves.
3.48 Awareness of these shortcomings has been spreading and some stepshave been taken to improve the situation. To strengthen the machinery forundertaking feasibility studies -- a difficult task in view of the lack ofprecise knowledge about local conditions in many parts of the country -- aspecial agency has been set up under the Ministry of Local Government, RuralDevelopment and Cooperatives. To strengthen the position of smaller farmers,Rural Development Project I, which is financed with IDA support, requiresthat the board of directors of cooperatives have an equal representation oflarge, medium, and small farmers. Special credit facilities are being setup to benefit the landless. Finally, agencies participating in rural devel-opment are becoming increasingly aware of the need for better coordinationand are directing their field offices to coordinate their actions with thoseof other agencies.

- 41 -
CHAPTER 4. INDUSTRY'S CONTRIBUTION TO ECONOMIC DEVELOPMENT
I. INTRODUCTION
4.01 Rapid industrial growth 1/ is a necessary condition for the eventualsolution of Bangladesh's problems of slow GDP growth, mass poverty and heavydependence on foreign investment resources. Agricultural development alonewill be insufficient to overcome these problems. Although soil fertility ishigh, its present productivity low and farmers' response to output incentivesby recent years' experience highly encouraging, the total contribution ofagriculture to economic growth will remain strictly circumscribed by the rela-tively very small area of available land. Tentative calculations by the Banksuggest a maximum possible sustained growth rate of agriculture of 3-4% peryear. As pointed out in Chapter 3, these are very high growth rates in com-parison with the country's historic record as well as with those experiencedin other developing countries.
4.02 Growth of agriculture at such an accelerated rate would, however,help lay a solid foundation for industrial development. A rise in rural percapita incomes of 1-1.5% a year would create a sizeable market for manufac-tured consumer goods (including processed agricultural products) and agri-cultural inputs and implements. To this should be added the graduallyincreasing scope for producing the capital and intermediate goods required bya more rapidly growing economy. Given the small size of industry's presentcontribution to GDP (8%), these factors should easily permit industry to growby the 7% per year projected in the Two-Year Plan (and already in the firstFive-Year Plan) and, with the right policies and efforts, by considerablymore. A further growth factor should be an increase in exports of manufac-tured products: the abundance of unemployed, low-wage labor presents anenormous potential for the production of labor-intensive industrial productsfor export markets.
4.03 The Government should use the period of the Two-Year Plan todetermine, first, what it will take to create a policy environment in whichindustry, public and private, can flourish and, second, what promising oppor-tunities, by subsector and project, exist to realize industry's growth poten-tial and what investment resources, manpower training and infrastructureimprovement will be needed for their implementation. Drawing on analyticalwork recently carried out in the Bank, 2/ the present chapter chiefly concernsitself with the first of these two problem areas. Before discussing thesubject further, however, a background sketch is presented of the historicalindustrial experience and of the present plight of the industrial sector.
1/ Throughout this chapter, "industry" refers to manufacturing only.
2/ Bangladesh: Issues and Prospects for Industrial Development (in twovolumes), IBRD Report No. 2191-BD, December 8, 1978.

- 42 -
B. Background
4.04 Historically, the area that is now Bangladesh had very littleindustrial development. Before the partition of the subcontinent, only 4%of GDP was generated in the industrial sector and almost all of it in smalland cottage industries. During the time when Bangladesh was part of Pakistanindustry grew rapidly. Growth averaged 6.6% per annum during the period ofFY50 to FY70 and was concentrated in the large- and medium-scale industries(which grew at a rate of 14.5%, compared to only 2.5% per annum for small-scale industry). Investment increased from less than Rs 400 million in FY64(in constant prices of FY70) to more than Rs 1 billion by FY70. Approximately25% of all investment was effected in the industrial sector, even though itproduced less than 10% of GDP.
4.05 The first industries to develop were jute and cotton textiles. Theformer were to replace the jute mills of Calcutta which had processed the rawjute of East Bengal before partition. The latter, traditionally part of theearly phases of industrialization, produced mostly yarn from raw cotton thatwas sent from West Pakistan to the cottage weavers for processing into cloth.By FY70, these two industries supplied 44% of all value added in the indus-trial sector. Food, beverages and tobacco were the other major industries,supplying about 20% of value added. Other intermediate goods producers sup-plied 13%, other consumer goods industries 14%, and capital goods manufactur-ing, the slowest to develop, 6%. Employment in medium- and large-scaleindustries increased from 60,000 workers in FY54 to 200,000 by FY70, anaverage increase of about 8% per year.
4.06 The policies of Pakistan then favored the development of privateownership of the industrial sector, but with widespread government control.This control was especially important in the rationing of foreign exchangewhich was at a premium because of the overvalued exchange rate enforced bythe Government. Controls were also exerted on investment through the require-ment of government sanctioning, and high tariff barriers encouraged importsubstitution rather than export orientation. There was general distrust offoreign investment and it was not encouraged. Unfortunately, there was littlereal planning and coordination of the various measures that were taken and, asa result, the determination of tariff rates and import licensing were oftendone on an ad hoc basis, leading to distortions in the development of industry,especially during the late 1960s. A number of industries developed whose sur-vival depended on high rates of protection and ready access to undervaluedforeign exchange. The engineering industry, for example, produced goods thatwere selling at a price double the c.i.f. import cost of competing goods.
4.07 Pakistan's industrial development banks provided funds and sometimesequity capital to entrepreneurs to set up industries. Interest rates were lowand this, along with the overvalued exchange rate, encouraged investments incapital-intensive industries. Because import entitlements were related toinstalled capacity, there was also a tendency to excess capacity in the plantsthat were built. When it became obvious that the country's Eastern wing was

- 43 -
lagging in industrial development, the East Pakistan Industrial DevelopmentCorporation was set up to start industries in the East and to sell them tothe private sector once they were established. As a result, by the thirdPakistan Five-Year Plan (FY66-FY70), 40% of investment in the East was forpublic sector corporations, compared to only about 10% in the West. Still,many of the industrial units in the private sector in East Pakistan wereowned and run by West Pakistanis and the actual involvement of Bengalisremained at a low level.
C. Industrial Development After Independence
4.08 At the end of the war that led to Bangladesh's independence, thenew Government, committed to socialism as one of its tenets, nationalized allof the jute, cotton textile and sugar mills as well as all enterprises aban-doned by their former West Pakistani owners. As a result, 85% of the assetsof the industrial sector were in the public sector. An estimated Tk 300 mil-lion in assets -- out of an original Tk 6 billion -- had been destroyed duringthe war, much of the entrepreneurial and managerial talent had left the country,and a serious structural imbalance arose because plants had generally been setup in the context of the integrated Pakistan market. The industrial policy of1973 set a limit of Tk 2.5 million on private sector investment, thus rele-gating it to the small and cottage sector only. Public sector corporationswere set up to run the nationalized industries, and over 85% of investment inthe industrial sector during the first Five-Year Plan was to go to the publicsector.
4.09 The ceiling on private investment was raised to Tk 30 million in1974 and to Tk 100 million after the change in Government in 1975. Othermeasures taken to encourage the private sector to participate more fully inthe industrialization process included the decision to disinvest some of thesmaller firms taken over after independence, the establishment of the stockexchange, the setting up of the Investment Corporation of Bangladesh (ICB),and the decision to pay compensation for units nationalized. By the fall of1978, 77 firms worth Tk 330 million had been sold back to private entrepre-neurs, and the Government is planning to sell another 11 in the near future.However, most of these were small, older firms, usually operating at a lossand representing a small percentage of total output. The public corporationsstill control the lion's share of the sector.
4.10 Tables 13 and 14 show the progress of the industrial sector -- orat least of the industries covered by the annual census of manufacturingindustries, which tend to be the larger firms. Table 13 shows the indexof production and Table 14 key variables for FY60, FY70 and FY76 (the lastyear for which detailed data were available).

- 44 -
Table 13: INDEX OF INDUSTRIAL PRODUCTION(FY70 = 100)
FY63 FY66 FY70 FY73 FY74 FY75 FY76 FY77 FY7858 76 100 81 95 86 94 100 107
4.11 Industrial production grew at an average rate of 8% per annum inEast Pakistan during the 1960s, but fell sharply immediately after indepen-dence due to the severe shortage of foreign exchange to import raw materialsand the physical disruptions caused during the war. Although the availabilityof foreign exchange to the industrial sector has improved, the timing offoreign exchange allocations still presents a problem. The index of overallindustrial production in FY73 was 19% lower than the FY70 level and onlyreached the pre-war level again in FY77. During this post-independence stag-nation in industrial production, the population increased from 70 million to83 million.
4.12 The deterioration in the condition of the industrial sector isdepicted in Table 14. Generally speaking, the 1960s were a period ofimpressive growth in the industrial sector with capital, labor and outputall expanding. The period FY70-76, however, was one of virtual stagnationin output despite increases in the stock of capital and labor, implying adecline in productivity of the factors of production.
Table 14: SUMMARY OF TRENDS IN MANUFACTURING
Ratio RatioFY60 FY70 FY76 FY60:FY70 FY70:FY76
Value Added (Constant FY70Prices; Tk millions) 548 1,534 1,436 2.80 0.94
Employment (thousands) 139 204 374 1.47 1.83
Capital (Constant FY70 Prices;Tk millions) 605 1,875 2,902 3.10 1.55
Capital/Output Ratio 1.1 1.2 2.1 1.09 1.75
Capital/Worker (Constant FY70Prices; Tk) 4,353 9,164 7,760 2.11 0.85
Output/Worker (Constant FY70Prices; Tk) 3,934 7,486 3,830 1.90 0.51
Average Real Wage (ConstantFY70 Prices; Tk/year) 1,480 1,798 1,320 1.21 0.73
Return on Investment (ConstantFY70 Prices; Percent) 57 62 32 1.09 0.52
Index of Total Productivity(FY60 = 100) 100.0 114.0 65.7 1.14 .0.576

- 45 -
4.13 High levels of investment raised the capital stock rapidly, espe-cially in the first half of the 1960s. Nonetheless, the capital output ratioremained very steady throughout this decade at between 1.1 and 1.6, a levelthat compares favorably with other countries. 1/ The capital-labor ratioincreased in real terms by over 100% in the 1960s. After independence, how-ever, the capital-output ratio increased greatly, probably reflecting declin-ing production because of the loss of markets, shortages of raw materials andother inputs and decreased efficiency in the industrial sector rather than anydecrease in the marginal output of capital due to increased capital intensity. 2/Similarly, the large decline in the gross rate of return on capital is probablydue to inefficiency and lack of needed inputs rather than to capital saturation.Still, the sharp drop in the rate of return -- together with the prevailingindustrial policies -- seems to have cut down the rate of investment fromretained earnings and to have kept new investors out of the industrial sector.
4.14 The number of workers in industries covered by the Census of Manu-facturing Industries (CMI) increased throughout the 1960s. At the same time,value added per worker increased by about 90%. Labor costs as a percentageof value added fell from 38% in 1960 to only 24% by the end of the decade, andthe average real wage per worker grew by about 20% during this period. Thepicture changed completely after liberation with a sharp rise in the percent-age of value added going to labor, a drop in the average real wage and a sharpdecline of value added per worker to the level of 1960. Since the capital-labor ratio (in constant prices) does not seem to have fallen greatly duringthe 1970s, it appears that decreased labor efficiency and foreign exchangeshortages led to the lower productivity of labor. Many of the public sectorcorporations also appear to be overstaffed with workers hired more forsocial than productive reasons.
4.15 This decline in overall industrial productivity is a major problemfacing Bangladesh. While employment and capital have both increased sinceFY70 -- by more than 80% and 50%, respectively -- value added is less thanit was at the beginning of the decade, indicating a large increase in thecapital-output ratio and a sharp fall in output per worker. Both the averagereal wage and the rate of return on capital have fallen and the index of totalproductivity 3/ (value added per unit of capital and labor), after increasingby 14% during the 1960s, has decreased by almost 50%. Similarly, value addedas a share of gross output in the industrial sector has fallen from 44% to 32%.
1/ For example, in the 1960s Tanzania's ratio ranged from 1.6 to 2.0 andIndia's from 3.0 to 3.7, and Sri Lanka's in 1974 was more than 2.0.
2/ This is borne out by attempts to calculate ICORs for the years 1973through 1976 which yield very low values of 1.0 and 1.1, suggestingthat capital is not the major constraint to output.
3/ This is calculated by comparing the weighted average of the increasesin capital and labor with the increase in production. The weight-s arethe shares of labor and capital in output in the base year, here FY60.

- 46 -
This is the result of both decreased efficiency in the sector and the in-
ability of many industries to pass on raw material cost increases due to
government price controls. 1/
4.16 As mentioned above, government policies in the 1950s and 1960s
encouraged the creation of excess capacity. As a result, capacity utiliza-tion has always been low in many industries. After independence, thePakistan market was lost and some industries faced the problem of even moreexcess capacity. From an average level of 70% in FY70, the average capacityutilization in major industries fell to 49% in FY73 and then rose slowly toreach 61% by FY77. 2/ In spite of its policies, the Government had alwayshoped that it would be able to increase the rate of capacity utilization,and in recent years it seems to have been successful in slowly bringingthe sector back towards the pre-independence levels.
4.17 The slow growth and declining productivity in manufacturing point
to fundamental problems in the management of the sector, suggesting misdirec-ted investment, over-hiring of personnel and incorrect pricing of production
factors and end products. The remainder of the chapter will review some ofthe problems of the public, the private and the export sectors.
D. Managing the Public Sector
4.18 In view of its dominant position (50% of industrial value added,85% of exports and 85% of industrial investment outlays), the public sectordeserves special attention. Financially, the public sector corporations havedone very poorly, showing a loss in every year since FY73 except for one.Most of this has been due to the large deficits run up by the jute corpora-tion. Still, the other corporations have generally shown a profit of lessthan 4% of their combined sales.
4.19 The financial figures, however, can be misleading as many of theinput and output prices are determined by the Government, thus often artifi-cially creating profits or losses. A better measure of the efficiency of the
state enterprises is the domestic resource cost (DRC) which measures the costof earning or saving a unit of foreign exchange. Table 15 sets out three
estimates of the DRC for some of the industries and some of the firms withinthem. The financial DRC is a measure of the cost of foreign exchange using
1/ Preliminary data for FY77 and FY78 suggest that the situation is nowimproving in the public sector.
2/ Capacity utilization figures must be taken cautiously, because ratedcapacity figures are often unrealistically high.

- 47 -
Table 15: DOMESTIC RESOURCE COSTS IN MANUFACTURING (as of FY77)
Industry Financial DRC Economic DRC Incremental DRC---------- _ __----- Tk/$ ----------------- )
Cotton Textiles1. Grey Cloth
(a) Industry Average 15.8 15.3 14.2(b) Good Mill /a 11.0 18.7 10.3(c) Bad Mill /a 15.2 12.6 12.2
2. Cotton Yarn(a) Industry Average 12.2 14.4 9.4(b) Good Mill 7.4 8.1 6.5(c) Bad Mill 17.9 21.3 11.1
Jute Textiles /b1. Hessian
(a) Industry Average 27.0 53.2 16.6(b) Good Mill 14.8 12.7 11.1(c) Bad Mill 66.4 45.0 25.5
2. Sacking(a) Industry Average 22.7 39.2 15.8(b) Good Mill 13.0 11.6 10.4(c) Bad Mill 25.0 20.9 14.9
3. Carpet Backing(a) Industry Average 30.8 397.0 14.3(b) Good Mill 23.7 108.2 12.1(c) Bad Mill 123.1 NEG 14.5
Steel1. Heavy Plate NEG NEG 63.72. Steel Billet 74.6 53.6 36.2
Cement1. Limestone 5.7 5.9 5.72. Clinker 7.0 8.6 6.2
Food & Allied1. Sugar
(a) Industry Average 17.4 20.9 15.3(b) Good Mill 14.9 15.3 13.1(c) Bad Mill 35.3 86.6 22.2
2. Frozen Shrimp 14.4 14.5 14.23. Cigarettes 3.7 3.7 3.54. Edible Oil NEG MEG NEG
Fertilizer1. Urea (Fenchuganj) 2.6 3.7 2.92. Urea (Ghorasal) 3.5 4.8 3.63. TSP 26.9 NEG 9.8
Paper & Board1. Newsprint 15.0 28.3 7.22. Particle Board 631.8 NEG 72.23. Rayon Yarn 77.5 159.0 16.24. Paper (Karnafuli) 57.9 20.2 16.4
Chemical1. Caustic Soda 279.8 NEG 41.9
/a The "good" and "bad" mills were identified by the corporations, and seemto have been chosen on the basis of their profitability or per unitcosts.
/b There are, of course, marginal values valid for small changes in outputwhere marginal costs and revenues are equal to price. Because Bangladeshdoes not face infinitely elastic demand curves for either raw jute orjute goods, major shifts in production would produce different DRCs.
Source: Mission estimates based on the questionnaire supplied to sectorcorporations.

- 48 -
the accounts of the corporations. 1/ The economic DRC attempts to measurethe true costs by employing shadow prices. The incremental DRC ignorescapital costs as being already sunk and uses only variable costs. The figuresare of an illustrative nature only; they should be seen as indications ofpossible problems which require further investigation rather than as a guidefor action.
4.20 These figures must be viewed with caution as they are a firstattempt at estimating DRCs and are partly based on crude estimates. The costfigures were collected from the corporations using somewhat simple question-naires, and the shadow prices used are based on estimates derived during theearly 1970s. Nevertheless, the results are striking. Thirteen of the twenty-one products had an economic DRC well above the official exchange rate of Tk15.5 per dollar in FY77. Five of the products (heavy plate, edible oil, TSP,particle board and caustic soda) actually cost more in foreign exchange thanif they had been imported! Even on an incremental basis, steel, particleboard and caustic soda manufacturing were very inefficient users of Bangla-desh's scarce resources. These figures give some indication of the industriesand firms which may require major efforts to improve production efficiency.Whether a given plant should be closed or not depends on the costs and bene-fits of the efforts needed to improve efficiency. Moreover, firms with goodDRCs must be analyzed not only on the basis of current prices, but also ofexpected future prices and costs. The analysis presented here can only be astarting point for identifying investment possibilities and problems.
4.21 Only tentative suggestions can be made at this stage about solutionsto the serious problems that are suggested by the above figures on profits andlosses and domestic resource costs. First of all, it appears that the Govern-ment should make a sharp distinction between the immediate objectives of thepublic corporations and the wider objectives of economic and of social policy.At present, the public sector corporations carry the weight of various dis-parate objectives. They are charged not only with the production of certaincommodities, but they also have to retain on their staff large and increasingnumbers of redundant personnel and are required to sell products deemed to beof essential social importance (such as sugar, textiles, edible oils andpharmaceuticals) below cost. This makes it difficult for these enterprisesto regain their financial health.
4.22 Second, public enterprises need autonomy in their daily operations.The Government made a move in this direction in 1976 when it issued guidelinesaimed at providing maximum commercial autonomy to individual enterprises.Significant progress has been made in recent years in the implementation of
1/ If the DRC is below the official exchange rate of 15.5, production ofthe item in Bangladesh costs fewer domestic resources than the amountof foreign exchange that it would take to import it (or that wouldbe gained by its export in the case of export goods). If the exchangerate is over- or undervalued, comparison should be with the shadowexchange rate.

- 49 -
these guidelines, although individual enterprises still need to obtain greaterfreedom in personnel management and in the day-to-day conduct of their market-ing and purchasing operations.
4.23 Third, the reward structure should be geared to giving managers andworkers strong incentives to operate their plants efficiently and profitably.Salaries of senior enterprise managers ought to be raised from their pres-ent low levels (Tk 2,500 per month). Throughout the public enterprise sectorsalary scales should be made more flexible so as to allow for rewards forexcellent performance.
4.24 Fourth, training of industrial personnel at all levels needsincreased attention. Only 2% of mill managers have relevant professionalqualifications and only 14% of senior managers have received in-servicetraining. A serious training effort is needed to make managers familiarwith modern management techniques. At the technical level, there is the needto expand the training of skilled workers. The annual supply of only 1,400skilled workers is obviously out of proportion with the needs of a sectoremploying 300,000 workers or with the annual supply of 700 engineers and 2,100technicians. The technical training centers need to be expanded, their curri-cula improved and adapted to the requirements of Bangladesh industry andthe supply of vocational teachers improved and expanded.
4.25 A related problem is the increasing departure in recent years ofworkers to the Middle East. Manpower departures now exceed 3,000 per monthand the proportion of skilled workers among them appears to be rising.Personnel at the supervisory and management levels are also migrating insubstantial numbers. Improvement in the quantity and quality of trainingat all levels is needed if Bangladesh is to cash in on the opportunitiesprovided by the growing foreign market for its manpower and yet to retainsufficient qualified staff to develop the domestic economy. At the sametime, it will be necessary to keep salaries of critical skill categoriesunder review.
4.26 Fifth, for those industries that are to remain in the public sector,it is important that their machinery and equipment be put in good order. Theinefficiency of many enterprises is directly related to the many years ofneglect of plant maintenance and to the insufficient resources available forspare parts and replacements. Balancing and modernization programs areplanned for the jute, textile and paper industries, but there is a clear needto develop similar programs for the fertilizer, steel, cement, and sugarindustries. Where original plant outlay has irredeemable shortcomings,however, or where machinery is completely obsolete, it may be best to cutlosses and scrap the plant.
4.27 The Government may feel that the private sector is not yet ready totackle the financial, technical, and managerial problems of owning and oper-ating the larger enterprises presently in the public sector. It seems clearthat any transfer of control to private interests would indeed require .care-ful preparation and might have to be stretched over a few years. A policystatement clarifying the ground rules for the public and private sector would,however, reduce much of the prevailing uncertainty about the Government'sindustrial strategy and may have a galvanizing effect on private initiative.

- 50 -
E. Improving Private Sector Policies
4.28 As in other countries of South Asia, the activities of the privatesector are subject to numerous bureaucratic controls. Immediately afterindependence, the scope for the private sector was severely limited, butthe Government later liberalized its stance and began to give greater recog-nition to the role of the private sector, raising the investment ceiling andpermitting private investment in areas earlier reserved for the public sector.These factors have led to a rising volume of private investment, particularlyin FY78 when investment approvals increased by about 50% over the previousyear. The total amount of these approvals, however, was the equivalent of onlyabout US$140 million and it is not certain what part of the approved invest-ments will actually be implemented.
4.29 In guiding industrial development, the Government needs to relyless on controls (such as on imports and investment licensing) and more onpolicy instruments (such as customs duties, taxes and incentives) and finan-cial institutions. The operation of controls, beyond being open to corrup-tion, takes a heavy toll on the country's scarce administrative talents.There is evidence, moreover, that controls stifle entrepreneurship. As inneighboring countries, controls are least of a burden for the larger, wellestablished firms, who know how to work the system to their advantage.They are very hard, however, on small and would-be entrepreneurs.
4.30 For the allocation of foreign exchange among users the Governmenthas consistently relied on import licensing rather than on tariffs or theexchange rate mechanism. In recent years there has been some movement towardsliberalization: licenses for raw materials imports by industrial firmshave been lengthened from six months to one year, and for specified items andlimited time periods the Government has allowed open general licensing ofimports. The system is still apt, however, to lead to inefficient resourceallocation. All firms of a certain category, for example, may be allowedimports sufficient for one-shift operation of their plants, while firms inanother category are permitted imports for only 75% of one-shift operation.Allocations of this nature disregard efficiency considerations which mightrequire triple-shift operations of certain plants and closure of others.Obviously, it would be very hard for government officials to discern betweenthe merits of the needs of individual enterprises; the best solution would,therefore, seem to be to move further toward a liberalized system in whichthe price of foreign exchange, including tariffs, on the one hand and indi-vidual profit expectations on the other determine each firm's demand forforeign exchange.
4.31 As far as the approval of investments is concerned, the importcontrols are compounded by various, often overlapping, approval procedures.In this case again, it would appear that the control system -- besides leadingto duplications, unnecessary delays and the possibility of corruption --far exceeds the ability of government officials to determine what will bedesirable for the economy. A reduction of the number of layers of bureau-cratic control over investment and the eventual liberalization of investment

- 51 -
approval seem highly desirable. The basic principle should be that, as arule, private projects will be allowed to proceed unless it is certain thatthey would lead to serious overcapacity generation.
4.32 Generally, industrial policy should be based less on controls andmore on policy instruments. In some important respects, however, theseinstruments will need to be modified. Based on an analysis of the needs fortariff protection -- by a Tariff Commission which would need to be upgradedfor this task -- the Government should rationalize the tariff structure; theCommission should be able to benefit from the research on international tradepolicy which is now being carried out jointly by the Bangladesh Bank and staffof Boston University. Tax write-offs and other financial incentives shouldbe granted to expanding firms as well as to new ones, as the system shouldreward expansion of output, not simply new capacity. A carry-forward provi-sion for losses should be introduced; restrictive requirements on the use oftax-holiday profits should be removed, and the capital gains tax on share-trading profits should be lowered.
4.33 The inflow of foreign investment capital can be improved by earlypublication of a Foreign Investment Protection Act, permitting full repatria-tion of profits and capital within a reasonable period (such as seven years),and a clear statement of all the terms and conditions for foreign investmentin Bangladesh.
4.34 The general structure of the financial institutions in Bangladeshis adequate, but many of the institutions need strengthening through train-ing, filling of staff vacancies and better pay and incentives, as well asmore operational autonomy. The field of industrial promotion, includingequity investment, preparation of feasibility studies and generally assistinginvestors, is especially weak, although the creation of an institution forthis purpose is being considered.
F. Developing an Export Strategy
4.35 Development of the export sector is of utmost importance for thedevelopment of the Bangladesh economy. It can bring dynamism and efficiencyto the industrial sector as well as to related trading and transport activities,help reduce the large trade deficit and provide additional jobs to the manyunemployed. These are areas of high priority for the development of Bangla-desh and it is, therefore, encouraging that the Government has decided to givestrong emphasis to the promotion of industrial exports in the second Five-YearPlan. In spite of the weakness of its. industrial sector, Bangladesh doeshave some of the important prerequisites for developing its exports of manu-factures: the present industrial base, although not large, is reasonablydeveloped; low-wage labor is abundantly available; and the number of business-men, managers and entrepreneurs with industrial experience is fairly substan-tial. To this can be added the existence of relatively well developed bankingand commercial services. These factors, although not unusually favorable,certainly present Bangladesh with a starting point for an export drive.

- 52 -
4.36 Thus far this potential has remained largely unutilized. Exportsstill amount to only some 7% of GDP and continue to consist predominantly(71%) of jute and jute goods. Post-independence growth of exports has beenrelatively slow, only 8% per year in nominal terms during FY73-78. Juteexports, facing increasing competition from synthetics, have been nearlystagnant, growing by merely 3% a year. Non-jute exports, however, have shownimpressive growth, increasing by 33% a year during the same period; havingstarted from a very low base, however, they still make up only 29% of totalexports. Future export development will need to include both increased jutegoods exports and diversification and expansion of other exports. The Govern-ment and IDA, as well as other donors, are currently working on the develop-ment of action programs to strengthen the jute industry, including the market-ing and promotion of exports and cost reducing improvements in efficiency ofthe mills.
4.37 For the other export industries the Government currently offers anumber of incentives. One of them is the Export Performance Licensing Schemewhich allows exporters (both public and private) to receive vouchers forforeign exchange which they may use for the importation of raw materials orsell at a premium to other importers. Other incentives include the rebate ofindirect taxes, a tax reduction on export earnings, some export taxes on rawmaterials, special subsidies, and preferential rates for export financing.The Government has set up an Export Promotion Bureau to promote the export ofnon-jute items; it has been useful in carrying out the expansion of exports,but still needs to have its role more clearly defined and is, moreover, badlyunderstaffed. Other government bodies dealing with export promotion alsoneed strengthening, with their role more clearly defined.
4.38 More effective export promotion will require both improved incen-tives and better guidance for exporters. One of the most important incentives,the exchange rate, improved significantly with the May 1975 devaluation. Thestructure of other incentives, however, still needs rationalization. Thevalue of incentives varies greatly from product to product, the higher ratesof effective protection presently provided to industries which are sufferinglosses (such as jute goods and paper). This disparity should be removed assoon as possible and replaced by uniform levels of effective protection forall export products. This change could be combined with an increase in theoverall level of export incentives. At present, the combined value of exporttaxes and subsidies and the Export Performance Licensing scheme averages only7% over the official exchange rate for all exports together. This is a ratewhich is probably not high enough to attract funds away from less risky andmore traditional activities such as importing, domestic trading, real estateand even import-substituting industries.
4.39 Especially in the beginning of the export drive the Government mustdo much more than offer incentives. The condition of the industrial sectoris such that rapid response to mere financial incentives to export is not tobe expected. Cut off from foreign markets, businessmen need the help of agreatly strengthened Export Promotion Bureau to supply them with inforimationon markets and product design as well as finance to sustain fledgling export

- 53 -
ventures. Moreover, would-be exporters should have easier access to foreignexchange to enable them to visit foreign markets. Since exporting of indus-trial products requires the type of quick response to market opportunitieswhich is best left to private entrepreneurs, improvements in the climate forprivate investors, domestic and foreign, should be very helpful for the exportsector. This is particularly true for light industrial products based on low-cost labor where the main thrust of Bangladesh's export drive should lie.Most of these products require a flexible production response to markets.Finally, there is a need to back up the entire export drive with an intensiveprogram of studies of practical export possibilities. Such a program, whichwould require technical assistance from various quarters, is currently underdiscussion between the Government and IDA.

- 54 -
CHAPTER 5. ISSUES IN PUBLIC SECTOR RESOURCE MOBILIZATION
5.01 The disquieting trend of recent fiscal performance has been des-cribed at length in earlier reports. 1/ It can be summarized as follows:
(i) a low, but rapidly rising level of tax revenue;
(ii) an even faster rising level of current expenditures(much of it due to the transformation of the EastPakistan provincial administration into a nationalcivil service) and, consequently, stagnation in thecurrent surplus; and
(iii) an expanding level of ADP spending which -- given thestagnating current surplus -- has to be increasinglyfinanced through foreign aid resources and/or deficitfinancing.
5.02 The performance in FY78 does not show any improvement from thattrend. Available data included in Table 3 above indicate that, despite arise in the tax ratio from 6.8% of GDP in FY76 to 8.9% in FY78, the currentsurplus declined from 2% of GDP to 1.9% over the same period. It was, never-theless, possible to increase development spending from Tk 8.5 billion toTk 12.5 billion -- or from 8.6% to 11.4% of GDP -- primarily due to a veryrapid expansion in foreign aid inflows. As a result, the share of foreignaid in the financing of development expenditures went up from 61% in FY76 tonearly 74% last year. In the budget forecast for FY79 the share of foreignresources in the financing of the ADP is expected to increase further toabout 77%.
5.03 This increase in the country's dependence on foreign aid has beenaccompanied by a rise in the share of the ADP financed through project aid --from 22% in FY76 to 34% in FY78. It is this latter phenomenon which has givenrise to the complaint of many managers that progress in their projects ishampered by the inability of the Government to allocate sufficient domesticresources -- the "Taka shortage" problem. Since project aid finances, on aver-age, 50% of project cost, nearly two-thirds of all resources available forthe ADP go into foreign aid financed projects. Stated differently: half ofthe domestic resources 2/ available for the Plan are needed to complementdisbursements on project aid, leaving only half of those resources for thefinancing of 100% domestically financed projects. Since the Government hasto channel resources into a number of sectors which for various reasons do
1/ Particularly in Bangladesh - Report on Domestic Financial ResourceMobilization, IBRD Report No. 1919-BD, April 26, 1978.
2/ Of course, most of these resources are counterpart funds generatedby commodity aid and are, thus, also provided by donors. They are,however, not tied to specific projects.

- 55 -
not appeal to foreign donors, there is indeed in those figures an a prioriindication that local resources available to complement foreign aid in thefinancing of projects have become more scarce over time.
5.04 This Taka shortage problem cannot be solved by shifting resourcesto aid-financed projects since then the domestically financed projects wouldsuffer. The only long-term solution -- apart from the effect of the weedingout of uneconomic projects during the TYP (para 2.15, 2.16) -- lies in in-creasing the total amount of development resources. In view of the extremelylow contribution of domestic resources to development financing, the maineffort will have to be focussed on an improvement in the mobilization ofdomestic resources. In the interim, however, donors could help alleviate theTaka shortage by providing higher proportions of total project cost, includingfunds to cover local expenditures (in some areas, the proportion of aid inproject cost appears to be relatively low) and by continuing to provide areasonably large proportion of their aid in the form of commodity assistance.This, however, would be justified only if the Government simultaneously under-took increased efforts to muster more domestic resources.
5.05 Clearly, if the country is to reduce its dependence on foreign aidand, at the same time, increase its flexibility in the deployment of financialresources, the current surplus will have to grow faster than foreign aid dis-bursements. Fortunately, there are a number of factors which should facili-tate an increase in public savings in Bangladesh. First, at the present levelof 9%, the country's tax ratio is low compared to the level of taxation inother developing countries with similar per capita income levels. Furthermore,there seems to be ample room for an increase in tax revenue through improve-ments in tax administration. Finally, there is a need -- independent fromthe urgency to raise public savings -- to review the present taxation system,which was built up on the basis of ad hoc decisions taken under circumstancesdrastically different from those prevailing today. Import duties are a casein point. These duties were introduced in the past to penalize the import ofnon-essentials, to mop up part of the scarcity value of items imported undera system of quantitative restrictions and, especially in the early 1970s, tocompensate for the then prevailing overvaluation of the currency. Especiallynow that new thought is being given to the role of domestic industry ineconomic development, the import tariff structure has to be studied in thecontext of industrial protection. Such a rationalization of the tax structurecould, in turn, lead to a better allocation of resources, more rapid growthand, hence, indirectly to increased tax revenue.
5.06 It should be stressed, however, that an increase in tax revenue willnot by itself guarantee that public savings will rise. Unless the expansionin current outlays can be curtailed, most, if not all, of the additional re-sources will -- as in the past -- tend to be absorbed by increased publicconsumption. The risk that this will happen is quite high in a country likeBangladesh where unsatisfied public consumption needs are still very large,especially in the fields of education and health services. On the other hand,some slowdown in current expenditure growth should be possible, now that afull national civil administration has been built up.

5.07 There are several other ways through which public savings can beincreased other than by increased taxation. The first of these is a reductionin subsidies. In FY79, for example, subsidies on food and fertilizer consump-tion alone are expected to total Tk 2.0 billion -- despite increases of 11%and 14% in the ration prices of rice and wheat in FY78 and a 16% increase inthe fertilizer retail price at the beginning of FY79. This represents as muchas 60% of the anticipated current surplus and probably an even higher percent-age of the surplus likely to be generated in FY79. It would be even higher ifaccount were taken of the fact that most of the irrigation water is providedfree of charge throughout Bangladesh. Although one cannot expect subsidiesto be eliminated over night, there is plenty of scope for gradual reductionof the existing subsidies. This is particularly true for the fertilizer sub-sidy which, as pointed out earlier (para 1.19), is of doubtful value as ameans to increase production under the present conditions of scarcity. In-creases of as little as Tk 10 per maund in the price of fertilizer or theration price of rice could increase government revenue by as much as Tk 0.2-0.4 billion and the current surplus by as much as 5-10%.
5.08 Improvement in the financial performance of public sector enter-prises, including transport and public utilities, is another source of poten-tial public savings. In this respect, the jute mills must be considered first.In FY78, the cash subsidy to the jute goods sector alone amounted to as muchas Tk 0.6 billion. Admittedly, financial performance in that year wasadversely affected by the unusually high purchase price of raw jute. Never-theless, during the present year, cash transfers to the jute mills sector arestill expected to be Tk 0.45 billion. It should be possible to reduce thedrain on government resources through improved management practices, moreefficient purchasing techniques, etc. The viability of the sector shouldalso be improved through a stable supply of raw jute to the mills. Continuedemphasis on improved production through IJCS, the possible setting up of abuffer stock for jute, and the introduction of a graduated export tax on rawjute may provide some of the answers to the problem of guaranteeing a plenti-ful supply at reasonable prices.
5.09 Although the operation of the jute mills represents the largestdrain from industry on government resources, this sector is by no means theonly one which could contribute to an improvement in public savings. Nation-alized industries, other than jute, transfer part or all of their surplusesto the treasury. In FY78 such transfers amounted to Tk 0.25 billion, repre-senting about 9% of government non-tax receipts. The chemical, steel and foodindustries were the major sectors which accounted for the surpluses. Othersectors, however, have put a burden on the budget, either by calling for newinvestment funds (often under conditions of no expected net return to capital)or by requiring conversion of previous loans into equity, entailing a con-comitant fall in government interest receipts. For FY78, the shortfall ininterest receipts of this type amounted to Tk 160 million. Clearly, a re-structuring of the capital base of public sector enterprises and an improve-ment in their debt/equity ratio is in order, but this should not reduce thepressure on them to improve their financial management. What is needed (andpossible) is an improvement in the overall performance of the public sector so

- 57 -
that the drain on public finance is ended. At the same time, attention shouldbe paid to proper accounting practices, to make sure that surpluses are onlytransferred after due allowance is made for adequate depreciation charges.
5.10 Finally, there is scope for augmenting the resources generated bypublic undertakings such as the railways and postal and telecommunicationssystem (PTT). A start in that direction was made this year by raising railfares and freight rates; but even after this increase, receipts from railtraffic will continue to fall short of current expenditure alone. Furtherincreases in rail fares, as well as increases in PTT rates, thus, seem calledfor, although there is ample scope for cost reductions as well -- especiallyfor the railways.
5.11 One of the reasons why the Government opted for a Two-Year Planwas to permit the formulation of new policies before a second Five-YearPlan is embarked upon. It is, therefore, particularly encouraging that theauthorities announced at the June 1978 meeting of the Bangladesh Aid Grouptheir decision to establish a number of committees which are to investigateways and means to improve the mobilization of domestic resources. Thesecommittees are to deal with most of the issues discussed in the previousparagraphs: (i) gradual elimination of the food subsidy; (ii) ration-alization of the rate structure of the public sector transport agencies;(iii) economic pricing by public utilities; (iv) reduction in the subsidy onagricultural inputs; and (v) improvement in the financial performance of pub-lic sector enterprises. Specific recommendations by the committees on eachof these subjects are expected in early 1979. Furthermore, the Governmentrecently completed a detailed survey of the jute mills sector which shouldlead to a modernization program and, hopefully, to improved managementpractices and increased labor productivity. The final report of the TaxationEnquiry Committee is also due to be submitted soon. It is hoped that soonthereafter a start will be made with the implementation of the Committee'srecommendations.
5.12 Not only is there a need to improve the mobilization of domesticresources, but there is also considerable scope for improvement in the manage-ment and sectoral allocation of existing financial resources. Two pointsshould be made in this respect. First, it is now widely recognized thatthe existing system of public accounts in Bangladesh is a relic of the pastand in dire need of restructuring. The monitoring and forecasting of expend-itures is slow and often deficient; management of cash balances can beimproved; the classification of accounts as between development and non-development expenditures is arbitrary; the accounts of public sector enter-prises need to be put on a commercial basis; audits ought to be acceleratedand improved. These problems have all been studied in detail; some progressis now being made with the implementation of recommendations for improvementin the jute and textiles sector.

- 58 - ANNEX 1
OUTPUT PRICE SUPPORT AND INPUT SUBSIDIES 1/
1. The purpose of this Annex is to suggest a quantitative frameworkfor a review of price and subsidy policies for foodgrain production inBangladesh. It is clear that, given the severe data problems, an empiricaldiscussion of most of the arguments for Bangladesh will be difficult, evenfor the short run. The scope of this Annex, therefore, is necessarily limited.The approach is to make some simplifying assumptions and to use "reasonable"values of certain parameters with a view to focusing on a few questions andmaking some illustrative calculations.
Introduction
2. The Government of Bangladesh operates a foodgrain procurement pro-gram, designed to supply grains to the urban areas and, more recently, alsoto support the farmgate price of foodgrains. The FY78 crop of 13.4 milliontons was the largest on record. The Government procured 548,000 tons offoodgrains out of this -- about one-fourth of all grains marketed. It isbelieved that this operation had a significant impact in helping to supportthe post-harvest price at "incentive" levels. Rice was procured at Tk 132/maund and eventually sold in the ration system at Tk 100/maund.
3. In addition to providing such output price support, the Governmentalso subsidizes most of the "modern" inputs in foodgrain production. Inparticular, fertilizer is sold at roughly 50% of cost. In FY78, the budgetarycost of distributing about 700,000 tons of fertilizer was about Tk 1,000 mil-lion, or about 27% of all development expenditures by the Government in theagricultural sector. Unless the rate of the subsidy is lowered, this subsidycomponent of agricultural ADB expenditures is expected to grow along withthe marked increases in fertilizer sales expected in FY79 and beyond.
Output Price Support
4. In the short run, the supply curve of farm output slopes upwards,reflecting the increasing cost faced by farmers when raising production.Consequently, the expectation of a higher output price will lead to a largersupply, depending on the elasticity of supply of foodgrains. An increase inprice is also likely to provide an incentive to farmers to reduce their ownconsumption, so that the increase in the marketed surplus will be larger thanthe increase in production. The additional marketed surplus due to the priceincrease contributed by the smaller farmer -- who, without the price increase,is likely to consume most of his output -- will be proportionately larger thanthat of the bigger farmer. In the long run, the expectation of a higher pricewill also stimulate output. It is then possible that the provision of aninitially higher price to farmers can lead to a fall in the price (in realterms) in the long run.
1/ This Annex was prepared by Vinod Thomas.

-59 - ANNEX 1
5. Confining the discussion to the short term, the productivity impactof the price support mechanism then depends mainly on the elasticity of supplywith respect to the expected farmgate price. This output supply elasticityis derived from a number of factors -- but the crucial factor in Bangladeshis, perhaps, the availability of inputs to farmers. If, for example, theshort-run supply elasticity is 0.1 -- i.e., a 1% increase in the expectedprice leads to a 0.1% increase in output -- the price should be increased by30% more than what it would have been with no intervention in order to facili-tate a 3% increase in output in a year. For a larger elasticity of, say, 0.2,the same benefit can be achieved by a 15% price increase.
6. The main elements of the gross benefit of the price support consistof (i) a higher output available to society and (ii) a higher price receivedby producers. The higher output is produced with the use of more resources,and if they are bid away from other production processes, the value of theseresources, or the value of output foregone elsewhere, needs to be deductedfrom the gross benefits. In an unemployment situation, however, most of thevalue of the higher output is likely to represent a benefit. The higher pricenow available to all units of output implies an increase in producer surpluswhich will be the other part of gross benefits.
7. The first element in cost is the higher price on all units of out-put as it relates to the consumer. Unless the original situation was one ofartificially depressed prices where the consumers were willing to pay a higherprice, the loss in consumer surplus due to the higher price will need to bededucted from the gross benefits. In particular, one needs to considerthe nutritional impact of the higher price on the poor.
8. The second component of cost -- the focus of this note -- is theGovernment's, or the taxpayer's, cost of engineering the price rise to bringforth the higher output. A first element determining this cost is the amountof price increase required for a given output increase; this is given by theprice elasticity of supply. A second element determining cost is the level ofprocurement required to bring about a certain price increase.
9. Appendix 1 presents a model to help estimate the amount of procure-ment required to achieve a given price increase. 1/ The model operates withtwo time periods. The first time period, 1, consists of the four-and-one-halfmonths between mid-November and March. During this time, the main source offoodgrain supply is the aman crop, S1, which is about half the year's totalcrop. The second time period, 2, consisting of the remaining seven-and-one-half months, brings the other crops -- boro and aus -- denoted by S2. TheGovernment procures an amount, G1, out of the aman crop, Sl, and effectivelycontrols the market price during the first time period, Pj. Private tradersalso acquire an amount, Sn (assumed to be fixed), out of the aman crop. It is
1/ This is part of some work Professor George S. Tolley (University ofChicago) and the author of this note have been doing on agriculturalprice policies. The part of the model presented here deals exclusivelywith the issue of changes in the Government's cost, leaving asidechanges in consumers' and producers' costs.

- 60 - ANNEX I
assumed that no procurement takes place in the second time period, 2. Totalconsumer demand in period 1, given by D1, depends on the price, P1, andthe length of time, 11. Similarly, D2 depends on P2 and 12* Importsare assumed to be exogenous and are given by II and I2 for the two periods,respectively.
10. Demand in time 1 (DI) equals supply in time 1 (Si) minus increasein government and private stocks (SG and Sn) plus imports in time 1 (II).Demand in time 2 (D2) equals supply in time 2 (S2) plus decrease in stocks(SG, Sn) plus imports in time 2 (I2). It is assumed that ration is suppliedby the Government out of stocks at a steady rate, qr, giving a total ration ofR1 in 1 and R2 in 2. The above relationships imply that government procure-ment in period 1 (G1) equals total ration in period 1 (R ) minus imports inperiod 1 (II) plus increase in stocks (SG). G2 would equal R2 minusI2 minus SG -- but G2 is zero or negative.
11. Appendix 1 presents these relationships in the form of 10 equationsand solves Government procurement in time 1 (G1), which is then written interms of price in time 1, P1. Differentiating G1 with respect to P1, andre-arranging the terms, the following equation is obtained:
Pl dG1 SE G - dP R D s (A)
1 1~~s s1 s
where E is the percentage change in procurement (G1) divided by the percentagechange in price (P1); r is the price elasticity of supply; A the priceelasticity of demand; D1 refers to demand and Sl to supply in time 1; R1 isthe ration in time 1 and Sn the change in stocks of private traders. Equation(A) can be used to determine the percentage change in procurement required forany given percentage change in price.
12. Example. The aman crop in FY78 was about 7.4 million tons, givinga net supply (SI) of about 6.7 million tons. Total demand during the yearwas about 13.5 million tons, implying that demand in time 1 (D1) was about5 million tons. Consequently, Dl/Sl in equation (A) for FY78 is 0.75. Totalration offtake in time period 1 (RI) was 642,000 tons, implying that R1/Slin equation (A) for FY78 is 0.09. There was a ban on private hoarding in FY78,so that the increase in private traders' stocks (Sn) was probably negligible.
- 61 - ANNEX 1
13. No estimate of supply elasticity is available. Two alternativevalues for the short-run elasticity, 0.1 and 0.2, are assumed here. Alamgirand Berlage (1973) 1/ estimate the price elasticity of demand for rice forBangladesh to be about -0.3. Both this estimate and a higher value of -0.6have been used by Agarwala (1978). 2/ These two numbers may be used torepresent the demand elasticity to give a range for the required procurement.
14. For the purpose of illustration, we shall calculate the procurementrequired for a 3% increase in output -- i.e., from a level of 6.5 million tons(net) to the actual level of 6.7 million tons (net) in FY78. Suppose that 6.5million tons would have been the aman crop if the same percentage of outputwere procured out of it by the Government in FY78 as in FY76. 3/ In FY76,415,000 tons were procured out of a net crop of 6.3 million tons (i.e., 6.6%of the net crop). Assume that the output would have increased in FY78 to 6.5million tons (net) if the same 6.6% (or 430,000 tons) had been procured. Theoutput increase from 6.3 to 6.5 million tons could have been due to a varietyof factors -- like improved supplies of fertilizers, irrigation, seeds,credit. To focus on the effect of procurement on price and, consequently,a further increase in output, we need to evaluate the increase required inprocurement from 430,000 tons (the FY76 proportion) to raise output by 3% from6.5 million tons (i.e., 7.2 gross) to the actual level of 6.7 million tons(7.4 gross) in FY78.
15. We insert the values of the parameters given in paragraphs 12 and14 into equation (A) to obtain estimates for E (the percentage change in pro-curement with respect to the percentage change in price). If the supplyelasticity is 0.1, the 3% output increase requires only a 30% price increase;a supply elasticity of 0.2 on the other hand requires a 15% price increase.If the supply elasticity (X) is 0.1 and the demand elasticity (d) is -0.3, Ein equation (A) is about 1.0: i.e., a 1% price increase requires a 1.0% pro-curement increase. The 30% price increase for this case of supply elasticityto get the 3% output increase requires a 30% procurement increase. This meansthat from the level of 430,000 tons (para 14), procurement would need toincrease by about 130,000 tons -- to about 560,000 tons. Alternatively, ifthe higher estimate of demand elasticity of -0.6 is used, E in equation (A)would be about 1.6. This would imply that a 3% output increase via a 30%price increase would require a 50% increase in procurement to about 640,000tons.
1/ M. Alamgir and L.J.J.B. Berlage, "Foodgrain Demand, Import and PricePolicy for Bangladesh," in The Bangladesh Economic Review, Vol. 1,No. 1, January 1973.
2/ R. Agarwala, "Bangladesh: A Mlacro-Model for Projections and PolicyAnalysis", World Bank, 1978 (unpublished).
3/ FY78 is compared with FY76 rather than FY77, because in FY77 outputwas abnormally low due to bad weather. FY76 and FY78 were relatively"normal" years.

- 62 - ANNEX 1
16. If the supply elasticity (T) of 0.2 is used, E in equation (A) forthe two demand elasticities GE) of -0.3 and -0.6 would be, respectively, 1.33and 2.03. For the supply elasticity of 0.2, price needs to increase by only15% to get a 3% output increase. The increase required in procurement for a15% price increase for the two demand elasticity estimates is, respectively,about 20% and 30%, or about 90,000 tons and 130,000 tons. The level of pro-curement in FY78 for this case would be about 520,000-560,000 tons. Theactual procurement in FY78 was about 550,000 tons.
Table 1: GOVERNMENT PROCUREMENT REQUIRED FOR A 3%OUTPUT INCREASE: AN ILLUSTRATION
Supply Elasticity 0.1 0.2Increase Total Increase Total
Demand Elasticity (........ thousand tons ......... )
-0.3 130 560 90 520-0.6 210 640 130 560
17. Estimates for Table 1 are not to be interpreted to mean that a 3%output increase can be brought about forever by a program of procuring out-put in the range indicated. At best, it means only that, given all otherright conditions, 1/ the marginal output increase in the short term can befacilitated by, or requires, an output price support engineered by procuringthe quantities indicated.
18. What i.s the Government's cost of raising price by procuring thelevels indicated in Table 1? A comprehensive answer cannot be given here,but some considerations are mentioned. A first element of cost is theprocurement price -- Tk 132/maund or $240/ton in FY78. Some or all of thiscost may be recovered, depending on the price at which the Government sellsgrain. The Government sale price for rice was Tk 100/maund or $182/ton inFY78. On this basis alone, the cost in FY78 would have been $58/ton, implyinga range of $5.2-$12.2 million for the increase in procurement. The cost ofstorage, handling, etc., has been estimated at about Tk 10/maund and the lossdue to wastage at Tk 5/maund. 2/ Consequently, the range of Government costwould rise to $7.7-$17.9 million.
19. The sale of grain, however, raises some difficulties in estimatingthe cost of the program. The effect of the grain sale in depressing priceand negating some of the production impact of procurement cannot be ignored.It may be argued, however, that if these sales take place throughout the year,the depressing effect on the market price will not be fully translated intoa disincentive to farmers who sell grain immediately following the harvest.
1/ This assumption is really embodied in the use of a supply elasticity --i.e., it implies that inputs will be available to bring about thepostulated output increase.
2/ Bangladesh - Second Foodgrain Storage Project, IBRD Report No. 1715a-BD,February 15, 1978.
-63 - ANNEX 1
Input Subsidy (Fertilizer )
20. The fertilizer subsidy reduces the marginal cost of production,thereby raising output. The same 3% increase in output envisaged under theoutput price support program can be achieved by a correctly chosen rate offertilizer subsidy that would reduce the marginal cost of production bythe same absolute amount as the price increase. For supply elasticitiesof 0.1 and 0.2, the output price needed to increase by 30% and 15%, respec-tively, to bring about a 3% output increase. Taking Tk 132/maund as the post-procurement price (para 18), the required absolute increases in price for thetwo supply elasticities were, respectively, about Tk 31 and Tk 17 per maund.The same reduction (of Tk 31 and Tk 17 per maund) in the marginal cost ofproduction is now to be achieved through the fertilizer subsidy. The costof achieving these marginal cost reductions through the fertilizer subsidyobviously need not be the same as that of achieving it through an output priceincrease.
21. If input prices are fixed, the marginal cost of producing an addi-tional unit of foodgrains is the sum of the prices of inputs, weighted by thecorresponding additional quantity of input required for the additional unitof output (i.e. the inverse of the marginal product of each input in output).If fertilizer is the only input whose quantity changes, then the change inmarginal cost is inversely proportional to the marginal product of fertilizer.(This is obviously a restrictive assumption -- see para 23). If, as indicatedin some studies, 1/ the marginal product of fertilizer is 3, the price offertilizer would have to reduced by, respectively, Tk 93 and Tk 51 per maund(or $169 and $93 per ton) in order to achieve the desired reduction in marginalproduction cost of Tk 31 and Tk 17.
22. How much increase in fertilizer use is required to get a 3% increasein output, i.e., to increase the aman output to the FY78 level of 7.4 milliontons from a base of 7.2 million tons? In FY76, 132,000 tons of fertilizerwere used for the aman crop. Holding all other inputs constant, Ahmed's esti-mates of the marginal productivity of fertilizer for Bangladesh 2/ imply that67,000 tons of additional fertilizer would be required for the aman crop,giving a total requirement of about 200,000 tons. The subsidy on this amountalone, at the rates of $169 and $93 per ton (para 21), would be $34 millionand $19 million, respectively.
23. The two cost estimates (paras 18 and 22) should not be comparedbefore the assumed values of the crucial parameters are verified. The costof both programs would be higher, if the supply elasticity were in fact lower.
1/ See for example, R. Ahmed, "Foodgrain Production in Bangladesh: AnAnalysis for Growth, its Sources and Related Policies", IFPRI,Washington, D.C., 1976.
2/ Ibid.--The marginal productivity estimate, however, is for boro; thatfor aman is likely to be lower, implying an even higher cost of theprogram than that given in para 22.

I
The cost of the fertilizer subsidy would be lower if full adjustment in theuse of other inputs were allowed for. Furthermore, before policy conclusionsare drawn, a more comprehensive model should be used.
24. In favor of the price support approach it may nevertheless be saidthat it allows the producer full flexibility in the adjustment of inputs tothe incentives. The fertilizer subsidy on the other hand provides incentiveonly to increase the use of one particular input. Appendix 2 shows that,theoretically, the response of output to an input subsidy is in fact only onecomponent of the response of output to price support and that an input subsidyis, therefore, a less desirable option.
25. It is sometimes said that a significant number of the beneficiariesof the higher price under the price support program may not increase theirproduction at all, whereas all those producers who buy inputs under the inputsubsidy program will invariably use them and increase production. Clearly,this argument does not apply to those who respond to potential incrementalbenefits: there is no reason why those who are willing to buy more fertilizerat a subsidized price will not raise output in response to a higher outputprice as well. Thus, if there is any supply elasticity, both schemes willinduce producers to raise output, and a calculation of the cost of the twoapproaches becomes relevant.
26. In general, for any reasonable supply elasticity, the theoreticalmerit of the price support policy cannot be overlooked. Particularly if agri-cultural prices have been historically depressed and are below world pricelevels, a price support program is likely to be cost efficient. The inputsubsidy scheme, on the other hand, may be justified on the grounds that it isrequired to induce the use of a particular input in the early stages of itsadoption.

- 65 - ANNEX 1
Appendix 1
The equations used to derive the elasticity of price with respectto procurement are given below: 1/
Dl = 11D(P1 ) (1)
D2 = 12D(P2) (2)
SI = S(P1 ) (3)
S2 = S(P 2 ) (4)
Dl - SS- SG- Sn+ II (5)
D2 = S2+ SG+ Sn+ 1 2 (6)
RI = llqr (7)
R2 = 12qr (8)
GI = R1- I1+ SG (9)
G2 = R2- I2- SG (10)
To solve the system of equations (1) through (10), we substitute (1)and (2) into (5):
SG SI D1 - Sn + I1
S(P 1) - 11D(P1) - Sn +11 (I)
Substituting (1)1 into (9), we obtain;
G1 = Rl - II + S(P 1 ) - 1ID(Pl) - Sn + II (2)1
Differentiating GI in equation (2)1 with respect to price P1 andrearranging terms, we derive the elasticity of Government procurement (G1)with respect to price (P1), i.e., the percentage change in procurement withrespect to the percentage change in price.
1/ The meaning of the symbols is given in the text (pages 60-61).

- 66- ANNEX I
r '-AP1 dG1 S1
0 dP, R1 D1 Sn (3)11 1 1+ - --
S S Si
where E is the elasticity of procurement with respect to price, d the priceelasticity of demand, and r the price elasticity of supply.
APPENDIX 2
Output Q may be expressed as a function of the two inputs --fertilizer, F, and all other inputs, A. The equilibrium conditions arethat the prices of the inputs, PF and PA, equal the respective marginalproducts, fF and fA , multiplied by the price of output PQ. Thus:
Q = f (F, A) (12)pF = P . fF (F, A) (13)
PA PQ fA (F, A) (14)
Differentiating (12), (13) and (14) totally, the following expression isderived for the change of output with respect to a change in the price ofoutput, dQ
dPQ
dP I Af fQfFF ) + f 'f f+
dP M fA (F Q FF A Q FA F (fF QfAF fAPQfAAJ (15)
where M is the determinant of the matrix of (12), (13) and (14), and thesubscripts denote derivatives. Similarly, an expression can be derived forthe change in output with respect to a change in the price of fertilizer, dQ :
dPF
dQ 1- !..(f Pf -f P)(6dPF M F Q FF APQPFA (16)
It is readily seen that (16) is a subset of (15).

- 67 - ANNEX 2
PRICE ELASTICITIES OF DEMAND FOR JUTE 1/
1. The extent to which Bangladesh can independently influence itsexport earnings by varying the export price of jute depends on the demandelasticities with respect to price that Bangladesh faces in the world forits raw jute and jute goods. This note puts together certain demand rela-tionships to provide simple methods of deriving these elasticities and makessome preliminary estimations. The calculations use assumed values of certainparameters. The assumptions made, however, are perhaps fairly realistic, sothat the results may be considered to be more than illustrative.
Jute Goods
2. If Bangladesh were the only exporter of jute goods, the priceelasticity of demand facing Bangladesh would be the same as the world priceelasticity of demand for jute goods. If, on the other hand, there are othercompeting suppliers of jute goods, the demand elasticity facing Bangladeshwill depend on (i) the world demand elasticity, (ii) the price elasticityof supply of the rest of the world (ROW) for jute goods, and (iii) the rela-tive shares of Bangladesh (BD) and the rest of the world in exports of jutegoods. It can in fact be shown that in this case the following preciserelationship would hold: 2/
BD's demand elasticity = [World demand elasticity - (A)(ROW's supply elasticity x ROW's share)] - BD's share.
3. Grilli and Morrison 3/ have estimated the world demand elasticityfor jute goods to be -2.67. For the purpose of illustration, two alternativevalues of -2 and -5 may also be assumed. These values represent highly elasticdemand curves and reflect the large degree of substitution that exists in con-sumption between jute goods and synthetics. Equation (A) implies that theelasticity of demand facing Bangladesh will be more than the above values forthe world, depending on- how large are the supply elasticity and the share ofexports of the rest of the world for jute goods. The share of the rest of theworld in jute exports is currently about 60%. The rest of the world's supplyelasticity is perhaps no more than 0.5 -- two alternative values 0.1 and 0.5may be assumed for illustration.
1/ This Annex was prepared by Vinod Thomas.
2/ The derivation of this formula is given in various books; for example,S.B. Linder, Trade and Trade Policy for Development (New York: Praeger,1976), p. 158.
3/ See E.R. Grilli and R. M. Morrison, Jute and Synthetics, World BankStaff Working Paper No. 171, January 1974, Annex 1, p. 7.

- 68 - ANNEX 2
4. Using these values for the parameters, equation (A) may be estimated.Table 1 sets out the results. For the case of a world demand elasticityof -2.67 (Grilli and Morrison), the demand elasticity facing Bangladesh isabout -7. In general, the Bangladesh elasticity is more than 2.5 times largerthan that of the world. The results do not appear to be very sensitive tochanges in the assumed value of the jute goods supply elasticity of the restof the world.
Table 1: PRICE ELASTICITY OF DEMAND FOR JUTE GOODSFACING BANGLADESH
Elasticity of WorldDemand for Jute Goods -2.0 -2.67 -5.0
Elasticity ofSupply by theRest of theWorld
0.1 -5.1 -6.8 -12.6
0.5 -5.7 -7.4 -13.3
Raw Jute
5. World. The demand for raw jute (RJ) with respect to price is derivedfrom that for jute goods (JG). The theory of derived demand provides a preciseexpression relating the world demand for raw jute to the world demand for jutegoods. 1/ Accordingly, the raw jute demand elasticity depends on (i) the jutegoods elasticity, (ii) the elasticity of substitution between raw jute andother inputs (OI) in jute manufacturing, (iii) the price elasticity of supplyof inputs other than raw jute, and (iv) the relative shares of raw jute andthe other inputs, respectively, in jute manufacturing. This expression canbe simplified using the fairly realistic assumption that raw jute and theother inputs are used in fixed proportions in jute manufacturing: i.e., theelasticity of substitution is zero. In that case the following equation wouldhold: 2/
RJ demand elasticity = [JG demand elasticity x RJ share x (B)OI supply elasticity] - [0I supply elasticity - (JG demand elasticityx OI share)]
1/ A number of authors discuss derived demand; for example, J. R. Hicks,The Theory of Wages (London: Macmillan, 1935), p. 242.
2/ This formula was applied in The World Jute Economy, IBRD ReportNo. 1141-BD, July 12, 1973, p. 62.

- 69 - ANNEX 2
6. To estimate equation (B), one may again use the values of -2, -2.67and -5 for the Jute Goods (JG) demand elasticity. It may be realisticallyassumed that the shares of raw jute (RJ) and the other inputs (OI) in jutemanufacturing are 50% each. Then the raw jute demand elasticity, accordingto equation (B),would depend on the supply elasticity of the other inputs.For a preliminary calculation, two values of the supply elasticity of otherinputs may bp tried -- 1 and 2. The larger this supply elasticity, thelarger is the raw jute demand elasticity, but as it turns out the resultsare not quantitatively very sensitive to the values used.
7. Table 2 represents the estimates of the world demand elasticityfor raw jute. For the case of a jute goods demand elasticity of -2.67, theraw jute elasticity is between 0.6 and 0.8. The larger the jute goods demandelasticity, the larger is the raw jute demand elasticity. For all casesconsidered, the raw jute elasticity is considerably less than that of jutegoods -- it appears that this would be so for any reasonable value of thesupply elasticity of other inputs.
8. Bangladesh. From the estimates of the raw jute demand elasticityfor the world made above one can calculate the raw jute demand elasticityfacing Bangladesh using the method embodied in expression (A). To recapi-tulate, the Bangladesh elasticity would exceed that of the world (para 7),depending on how large are the supply elasticity and the export share of rawjute of the rest of the world. The present share of the rest of the world inexports of raw jute is about 26%. The supply elasticity of the rest of theworld is perhaps no more than 0.5 and is more likely to be much lower. Twoalternative values of the supply elasticity (0.1 and 0.5) are used and, as inthe earlier case, the results are not very sensitive to changes in its value.
Table 2: PRICE ELASTICITY OF DEMAND FOR RAW JUTEFOR THE WORLD
Elasticity of WorldDemand for Jute Goods -2.00 -2.67 -5.00
Elasticity ofSupply of OtherInputs
1 -0.50 -0.57 -0.71
2 -0.67 -0.80 -1.10
9. Table 3 gives the estimates of the price elasticity of demand forraw jute facing Bangladesh. To simplify the exposition, only three values ofthe world demand raw jute elasticity are considered -- corresponding to the

- 70 - ANNEX 2
cases where world jute goods elasticity is -2, -2.67 and -5.0, respectively,and the supply elasticity of the other inputs is 1. In all these cases,Bangladesh's price elasticity of raw jute demand is less than -- but closeto -- one.
10. Bangladesh's raw jute elasticity was derived in turn from (i)the world raw jute elasticity and (ii) the world jute goods elasticity.Bangladesh's raw jute elasticity increases as these two parameters increase,but less than proportionately because of the interaction of the otherparameters.
Table 3: PRICE ELASTICITY OF DEMAND FOR RAW JUTEFACING BANGLADESH
Elasticity of WorldDemand for Raw Jute -0.5 -0.57 -0.71
Elasticity ofSupply of RawJute by Restof the World
0.1 -0.71 -0.80 -0.99
0.5 -0.85 -0.95 -1.10
According to Table 3, the raw jute demand facing Bangladesh is generallyinelastic. However, for larger values of world demand elasticities and/orlarge values of raw jute supply elasticities of the rest of the world,the raw jute elasticity facing Bangladesh rises above one.
Conclusion
11. Comparing Tables 1 and 3, we find that Bangladesh faces a far moreelastic demand schedule for jute goods than for raw jute. The jute goodsdemand elasticity facing Bangladesh is large and is implicitly determined bythe world demand elasticity as dictated by the price of jute's competitor,synthetics. As the rest of the world's ability to supply jute diminishes(i.e., with a lower supply elasticity of ROW), Bangladesh's demand elasticitydiminishes -- although not markedly (Table 1). The raw jute demand, derivedfrom that of jute goods, reflects the substitution of synthetics in consump-tion, but to a lesser degree (Tables 2 and 3). The raw jute demand elasticityfor the world would be lower depending on how difficult it is to obtain orrelease the other factors (elasticity of supply) in jute manufacturing (Table2). Furthermore, the raw jute demand from Bangladesh will be even lesselastic as the rest of the world finds it more difficult to supply raw jute(Table 3).

- 71 - ANNEX 2
12. The numerical examples tend to suggest that Bangladesh has a fargreater ability to vary its raw jute price independently than its jute goodsprice. Bangladesh, thus, appears to have little flexibility with regard toaugmenting its export earnings by trying to vary the price of jute goodsindependently. It appears that Bangladesh is relatively more of a pricesetter in the case of raw jute compared to that of jute goods. Even for rawjute, however, in many cases the demand elasticity, according to the aboveestimates, is close to one. This implies that even raw jute export earningsare not easily influenced through an independent manipulation of the raw juteprice by Bangladesh. Furthermore, the elasticity estimates presented thus farwere built up from short-run world demand elasticities estimated by Grilliand Morrison. Their regression equation allows no time lags and relies onquarterly data for the 1969-1972 period. Consequently, the price elasticitymay be interpreted to be a short-term one, with the corresponding long-termelasticity likely to be higher.1/ This qualification for the long run wouldmake the demand estimates even more elastic than those presented earlier.
1/ More precisely, the long-term elasticity (LRE) is related to the short-term elasticity (SRE) as follows:
LRE = SRE(1 - coefficient Pt-7)
where Pt-1 is the price in the previous time period. Thus, the largerthe response in demand in this time period to the price in the previoustime period, the more the LRE will exceed the SRE.

- 72 -
STATISTICAL APPENDIX
Table of Contents
Table No. Title
HUMAN RESOURCES
1.1 Population Estimates, Historical and Projected1.2 Population by Sex and Age, 1974
NATIONAL ACCOUNTS
2.1 Gross Domestic Product (at Factor Cost) in Constant Pricesof 1972/73
2.2 Sectoral Contribution to GDP, in Percent
TRADE, BALANCE OF PAYMENTS, AND FOREIGN ASSISTANCE
3.1 Merchandise Exports3.2 Merchandise Imports3.3 Import and Export Price Indices3.4 International Reserves and Outstanding Commercial and
IMF Borrowings3.5 Summary of External Assistance to Bangladesh (December 1971 -
June 1978)
EXTERNAL DEBT
4.1 External Public Debt Outstanding Including Undisbursed as ofJune 30, 1978
4.2 Service Payments, Commitments, Disbursements and OutstandingAmounts of External Public Debt
PUBLIC FINANCE
5.1 Summary of Central Government Finance5.2 Central Government Current Revenue5.3 Central Government Current Expenditure5.4 Public Development Expenditure by Sector
MONEY AND BANKING
6.1 Money Supply and Changes in Domestic Liquidity6.2 Selected Interest Rates

- 73 -
STATISTICAL APPENDIX (continued)
Table No. Title
AGRICULTURE
7.1 Area under Main Crops7.2 Production of Main Crops7.3 Yield of Main Crops7.4 Rice: Production, Area, Yield7.5 Procurement, Distribution and Stocks of Foodgrains7.6 Foodgrain Production, Imports and Per Capita Consumption7.7 BADC Low Lift Pump Program (1960-1979)7.8 BADC Deep Tubewells Program (1967-1978)7.9 BADC Shallow Tubewells Program (1972-1978)7.10 Fertilizer Consumption, Production and Imports
INDUSTRY
8.1 Production Trends of Selected Industries8.2 Financial Performance of the Public Sector Corporations8.3 Industrial Production Indices
PRICES AND WAGES
9.1 Consumer/C.O.L. Indices (Dacca)9.2 Wholesale Price Indices of Agricultural and Industrial Products9.3 Wholesale Prices of Selected Commodities at Dacca9.4 Retail Prices of Selected Consumer Goods at Dacca9.5 Average Prices of Rice9.6 Average Wholesale Prices of Selected Building Materials and Daily
Wage Rates of Construction Workers9.7 Average Wage Rates per Day in Dacca
JUTE
10.1 Production of Jute Goods10.2 Jute Goods Exports10.3 Export Prices of Jute Goods10.4 Production, Domestic Use and Exports of Raw Jute10.5 Export Shipments of Raw Jute10.6 Prices of Raw Jute

TABLE 1.1
POPULATION ESTIMATES. HISTORICAL AND PROJECTED
a/ hiA. HTSTOITCAT, FgTTMATF B. CENSUS RESULTS
Average annual Crude Crude Total PopulationYear Population (in millions) rate of growth birth rate death sate (in millions)(1 January) Male Female Total (in %) (in 0/00) (ijoo)
1911 .. .. 33.2 ... 31.5551921 .. .. 33.9 0.5 57.8 52.5 33.2551931 .. .. 35.8 0.6 58.2 52.8 35.6021941 .. .. 38.8 0.8 55.0 47.4 41.9971951 .. .. 42.6 1.0 47.8 38.2 41.9321961 .. .. 53.4 2.2 50.2 28.4 50.8401974 .. .. .. .. .. .. 76.398 c/
C. ESTIMATES AND PROJECTIONS. 1970-2000d/ e/
1. IBRD 2. Banmladesh Bureau of Statistics _Average annual Average annual Crude f/ Crude f/
Year Population rate of growth Population (in millions) rate of growth birth rate death rate(1 January) (in millions) (in %) Male Female Total (in %) (in O"oO) (in
0/Oo)
1970 70.8 ... 35.807 33.496 69.3031971 72.3 2.1 36.684 34.316 71.000 2.41972 72.4 0.1 37.518 35.096 72.615 2.3 43.0 18.01973 74.4 2.8 38.371 35.895 74.266 2.3 11974 76.2 2.4 39.258 36.797 76.055 2.4
1975 78.2 2.6 40.286 37.757 78.043 2.61976 80.4 2.8 41.255 38.645 79.880 2.41977 82.7 2.9 42.208 39.562 81.765 2.4 39.7 16.51978 85.0 2.8 43.195 40.463 83.678 2.31979 87.3 2.7 44.211 41.434 85.645 2.4
1980 89.6 2.6 45.249 42.408 87.657 2.3 }1985 101.4 2.5 50.337 47.354 97.691 2.2 32.9 14.21990 113.2 2.2 55.258 52.259 107.517 1.9
132.7 13.7
1995 124.4 1.9 60.259 57.095 117.354 1.8 {30.5 3 12.02000 134.2 1.5 65.133 61.797 126.930 1.6 28.6 12.6
' Not available.= Not applicable.
a/ Estimates of the Harvard University Center of Population Studies.b/ Source: Bangladesh Bureau of Statistics.c/ Adjusted census result, corrected for 16% degree of underenumeration in the four major urban centers and 6% in
the rest of the country.d/ Prepared by the Population and Human Resources Division of the IBRD, assuming that a net reproduction rate of
1.0 will have been achieved by the year 2000.e/ Based on the assumption of declining fertility and mortality rates.f/ Assumed rates underlying the population projections.
Sources: Harvard University Center of Population Studies;
Bangladesh Bureau of Statistics;IBRD, Population and Human Resources Division.
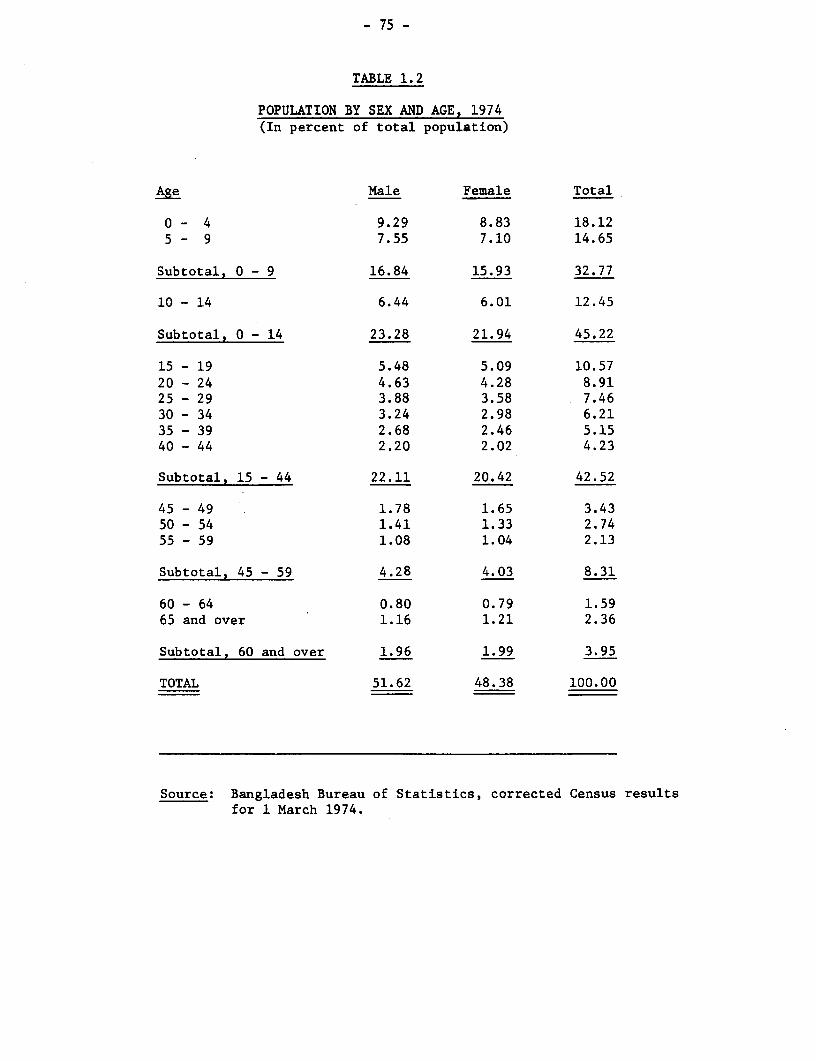
- 75 -
TABLE 1.2
POPULATION BY SEX AND AGE, 1974(In percent of total population)
Age Male Female Total
0 - 4 9.29 8.83 18.125 - 9 7.55 7.10 14.65
Subtotal, 0 - 9 16.84 15.93 32.77
10 - 14 6.44 6.01 12.45
Subtotal, 0 - 14 23.28 21.94 45.22
15 - 19 5.48 5.09 10.5720 - 24 4.63 4.28 8.9125 - 29 3.88 3.58 7.4630 - 34 3.24 2.98 6.2135 - 39 2.68 2.46 5.1540 - 44 2.20 2.02 4.23
Subtotal, 15 - 44 22.11 20.42 42.52
45 - 49 1.78 1.65 3.4350 - 54 1.41 1.33 2.7455 - 59 1.08 1.04 2.13
Subtotal, 45 - 59 4.28 4.03 8.31
60 - 64 0.80 0.79 1.5965 and over 1.16 1.21 2.36
Subtotal, 60 and over 1.96 1.99 3.95
TOTAL 51.62 48.38 100.00
Source: Bangladesh Bureau of Statistics, corrected Census resultsfor 1 March 1974.

TABLE 2.1
GROSS DOMESTIC PRODUCT (at Factor Cost)
in Constant Prices of 1972/73(in millions df Taka)
1969/70 1970/71 1971/72 1972/73 1973/74 1974/75 1975/76 1976/77 1977/78
Agriculture 31,836 30,401 27,146 27,220 30,307 29,701 32,627 32,161 34,542
Industry 6,782 5,407 2,875 4,927 4,787 5,756 6,486 7,316 8,207
Mining and manufacturing 4,281 3,629 1,990 3,298 3,784 3,735 4,216 4,650 5,133- Large and medium scale (2634) (2377) (1281) (2096) (2429) (2380) (2712) (3056) (3444)- Small scale (1647) (1252) ( 709) (1202) (1355) (1355) (1504) (1594) (1689)
Construction 2,377 1,664 812 1,444 744 1,756 1,954 2,306 2,663Power and Gas 124 114 73 185 259 265 316 360 411
Services 13,215 13,185 12,126 13,153 14,512 15,141 16,390 16,961 18,091
Transport 2,399 2,224 1,860 2,399 2,615 2,615 2,955 3,023 3,235Trade 3,864 3,641 3,117 3,513 3,924 3,924 4,289 4,203 4,497Banking and insurance 258 279 301 328 338 349 392 431 470Housing 2,293 2,357 2,357 2,360 2,426 2,494 2,594 2,698 2,806Other services 3,138 3,169 2,852 3,232 3,264 3,297 3,403 3,573 3,752Public administration 1,263 1,515 1,639 1,321 1,945 2,462 2,757 3,033 3,331
Gross Domestic Product, at factor cost 51,833 48,993 42,147 45300 49,606 50,598 55,503 56,438 6
Annual GDP Growth Rate, in % 3.3 -5.5 -14.0 7.5 9.5 2.0 9.7 1.7 7.8
Note: All estimates are provisional.
Source: Planning Commission.

TABLE 2.2
SECTORAL CONTRIBUTION TO GDP. IN PERCENT
1969/70 1970/71 1971/72 1972/73 1973/74 1974/75 1975/76 1976/77 1977/78
Agriculture 61.42 62.05 64.41 60.09 61.10 58.70 58.78 56.98 56.78
Industry 13.08 11.04 6.82 10.88 9.65 11.38 11.69 12.96 13.49
Mining and manufacturing 8.26 7.41 4.72 7.28 7.63 7.38 7.60 8.24 8.44-Large and medium scale (5.08) (4.85) (3.04) (4.63) (4.90) (4.70) (4.89) (5.41) (5.66)-Small scale (3.18) (2.56) (1.68) (2.65) (2.73) (2.68) (2.71) (2.82) (2.78)
Construction 4.59 3.40 1.93 3.19 1.50 3.47 3.52 4.09 4.38
power and gas 0.24 0.23 0.17 0.41 0.52 0.52 0.57 0.64 0.68
Services 25.50 26.91 28.77 29.04 29.25 29.92 29.53 30.05 29.74
Transport 4.63 4.54 4.41 5.30 5.27 5.17 5.32 5.36 5.32Trade 7.45 7.43 7.40 7.76 7.91 7.76 7.73 7.45 7.39Banking and insurance 0.50 0.57 0.71 0.72 0.68 0.69 0.71 0.76 0.77Housing 4.42 4.81 5.59 5.21 4.89 4.93 4.67 4.78 4.61Other services 6.05 6.47 6.77 7.13 6.58 6.52 6,13 6.33 6.17Public administration 2.44 3.09 3.89 2.92 3.92 4.87 4.97 5.37 5.48
Gross Domestic Product. at factor cost 100.00 100.00 100.00 100.00 100.00 100.00 100.00 100.00 100.00
Source: Table 2.1

TABLE 3.1a/
64HANDISE EXPORTS(Value figues in millions of US$)
1972/73 1973t74 1974/75 1975/76 1976Y77 1977/78Quantity Unit Quantity Unit Quantity Unit Quantity Unit Quantity Unit Quantity Unit(million) Price Value (:illion) Price Value (million) Price Value (million) Price Value (million) Price Value (million) Price Value
Cosmodities Unit (________ CUSS) _________ (US$) _(_US$) ___ _ (USS) ___(USSI __) (us$)
Ra. Jute (bales) 2.83 44.50 126.0 2.66 46.60 124.0 1.55 55.50 86.0 2.35 52.00 121.3 2.35 53.20 125.0 1.67 57.50 97.0Jute Goods (tons) 0.41 436.60 179.0 0.44 440.90 194.0 0.38 560.50 213.0 0.437 416.00 182.0 0.454 436.60 198.2 0.522 472.00 248.0Tea (lbs.) 44.80 0.21 9.4 47.50 0.27 12.8 51.80 0.42 22.0 49.23 0.36 17.8 65.00 0.65 42.3 63,00 0,72 45.0Leather .. .. 15.8 .. .. 15.8 .. ., 26.0 .. .. 30.9 .. .. 42.1 .. .. 46.0Fish and Shrimp .. .. 4.4 .. .. 7.9 .. .. 4.1 .. .. 11.8 .. .. 20.9 .. .. 21.0Other .. .. 5.6 .. .. 7.1 .. .. 6.9 .. .. 16.8 .. .. 31.5 .. 40.0
Total .. ., 340.0 .. .. 361.6 .. .. 358.0 .. .. 380.6 *- - 460.0 ,, , 497.0
a/ Export shipment.b/ Preliminary estimte.
Source: Planning Commsission. Government of Bangladesh, and IBRD.

TA,BLE 3.2
k4ERCU ISe IWlPOTS.(Value figures ti millions of UsS)
1972/73 1973/74 1974175 1975/76 1976/77 1977/78Quantity Unit Quantity Unit Quantity Unit Quantity Unit Quantity unit Quantity Unit(million) Price Value (million) Price. Value (million) Price Value (million) Price Value (million) Price Value (million) Price Value
Co-.dities Unit (US) _- (US$) (US$) (___) (US$) -US$ _
Cons ar Goods
Foodgrains (tons) 2.78 115 320.8 1.67 199 332.9 2.29 238 554.1 1.47 249 366.2 0.81 181 146.8 1.64 144 235.6Edible Oil (tons) *- .. .. 0.017 675 11.3 0.05 768 37.9 0.061 678 41.4 0.041 549 22.5 0.071 683 48.5Cotton Textiles (yards) .. .. .. 59.0 .. 18.5 .. .. 9.1 .. .. 15.8 .. .. 11.6 . 21.4
Intermediate Goods
Petrolews Products (tons) 0.13 44 5.7 0.731 86 63.1 0.45 126 56.6 0.404 126 51.1 0.285 121 34.6 0.323 126 40.7Crude Petroleum (tons) 0.73 24 17.5 0.346 60 20.7 0.819 121 98.7 0.842 89 75.1 1.032 103 106.3 1.155 108 125.0Rav Cotton (bales) 0.32 175 41.8 0.142 333 47.3 0.20 331 66.2 0.183 244 44.6 0.200 331 66.2 0.154 301 46.4Cotton Yarn (bales) 0.04 309 13.6 0.069 627 43.3 0.007 800 5.6 0.003 1000 2.8 0.018 711 12.8 0.036 552 20.2Fertilizer (tons) 0.24 117 28.0 0.147 143 21.0 0.23 374 86.1 0.358 246 88.1 0.045 129 5.8 0.418 172 71.7Cement (tons) 0.32 22 7.0 0.115 44 5.0 0.33 75 24.6 0.222 47 10.4 0.211 45 9.5 0.392 50 19.5
Capital Goods .. .. 100.0 .. .. 128.5 .. .. 135.0 .. .. 213.3 .. .. 227.3 .. .. 318.0
Misc. RaV Materials & other *b/rutermediate & Constuer Goods .. .. 192.6 - .. .. 233.4 .. .. 338.5 .. .. 356.9 .. .. 221.240
Total 727.0 925.o 1 402.4 1.265.7 8-.6 1.349.0
A/ Lmuort shipments.b/ Includes imports of edible oil and cotton textiles.
Source: Planning Comission, Governmnt of Bangladesh and IIRD.

- 80 -
TABLE 3.3
IMPORT AND EXPORT PRICE INDICES(1972/73 = 100)
1973/74 1974/75 1975/76 1976/77 1977/78
A. IMPORT PRICE INDICES
Foodgrains 160.9 207.0 216.5 157.4 124.3Edible Oil 149.1 157.8 139.3 110.3 138.5Petroleum Products 215.9 286.4 286.4 279.5 288.6Crude Petroleum 358.3 504.2 370.8 441.6 450.0Raw Cotton 76.0 189.1 139.4 205.3 170.9Cotton Yarn 178.6 258.9 323.6 229.8 178.6Fertilizer 161.5 319.7 210.3 113.8 147.0Cement 204.5 340.9 213.6 213.6 231.8Capital Goods 115.0 130.0 146.8 147.5 158.0others 197.5 232.3 193.2 216.4 231.5
Weighted Average 156.9 215.4 195.8 189.1 180.2
B. EXPORT PRICE INDICES
Raw Jute 104.7 124.7 116.9 111.2 129.2Jute Goods 101.0 128.4 95.3 87.7 108.1Tea 128.6 200.0 171.4 261.0 347.6others 122.2 158.9 132.1 216.0 230.0
Weighted Average 104.6 132.9 108.7 117.7 136.7
C. TERMS OF TRADE 66.7 61.7 55.5 62.2 75.8
Note: The weights used are respective years' value in 1972/73 prices.
Source: Planning Commission and IBRD

- 81 -
TABLE 3.4
INTERNATIONAL RESERVES AND OUTSTANDING COMMERCIAL & IMF BORROWINGS(million US$; end of period)
RESERVES COMMERCIAL & IMF BORROWINGS
Cash Securities -/ Total Foreign I mp Banks Total Regular Compensatory Oilas Total Facility Financing Facility
1973
I 12.4 180.4 192.8 n.a. 75.4 .. 75.4b/II 2.8 142.3 145.1 n.a. 75.6 .3 75.4III 31.6 146.7 178.3 n.a. 76.0 .6 75.4
IV 1.5 132.5 134.0 n.a. 76.3 .9 75.4
1974
I 8.6 91.1 99.7 n.a. 76.8 1.4 75.4II 23.4 41.3 64.7 n.a. 112.6 37.2c/ 75.4
III 4.3 42.1 46.7 n.a. 125.7 36.7 74.2 14.8IV 7.3 129.3 136.6 26.1 164.7 38.7 76.5 49.5
1975
I 25.8 211.3 237.1 22.9 181.7 39.5 78.0 64.2II 2.4 254.1 256.5 20.7 181.7 40.7 77.3 63.7III 4.4 166.9 171.3 20.3 171.1 38.3 72.8 60.0
IV 6.5 131.9 138.4 - 202.2 38.5 73.2 90.5
1976
I 2.5 146.5 149.0 - 247.2 85.5 72.3 89.4II 4.0 209.2 213.2 20.4 252.9 84.8 62.7 105.4III 8.6 245.5 254.1 20.6 283.2 86.4 90.4 106.4IV 5.7 232.0 288.7 20.8 275.3 86.7 81.7 106.9
1977
I 58.6 220.8 279.4 20.9 265.6 86.5 72.5 106.6II 2.0 291.8 293.8 nil 248.0 77.0 63.8 107.2III 23.4 247.5 270.9 25.0 238.3 76.7 54.6 107.0IV 7.2 228.1 235.3 25.0 237.6 79.3 47.5 110.8
1978
r 6.9 236.3 243.2 25.0 238.7 80.7 48.3 109.7II 18.0 250.9 268.9 25.0 235.2 80.9 48.4 105.9
a/ Includes Treasury Bills, Securities, IBRD Bonds and SDR holdings.b/ First drawn in December 1972.c/ Drawn in June 1974.
Source: Bangladesh Bank and IMF.

TABLE 3.5
SUtMRY OF EXTERNAL ASSISTANCE TO BANGIADESHDECEMBER 17. 1971 - JUNE 30, 1978
(million US$)
Type of Assistance 1971/72 1972/73 1973/74 _ 1974/75 _ 1975/76 1976/77 19171y8
Comitted Disbursed Committed Disbursed Cowitted Disbursed Comitted Disbursed Comitted Disbursed Comitted Disbursed Conmitted Dtsbursed
Food 145 103 250 121 180 300 460 379 257 307 130 106 140 190
Coisdity 259 117 327 217 205 186 419 386 355 378 228 188 414 352
project 187 7 396 82 202 154 406 145 318 129 238 147 606 255
Cash _ - - - - - 14 14 - - 61 61 - a/ - a/
Total 591 227 97 420 587 640 1299 924 930 814 657 502 I,So0
*/ Included in co_odity aid.
Source: Planning Comission.

- 83 -
TABLE 4.1 - BANGLADESH
EXTiRNAL PUBLIC DEST CUTSTANDING INCLUDING UNOISBURSEO AS OF JUNE 30. 1978
iNCLUDES ONLY DEST COMMITTED JAN. 1, 1900 - JUN. 30, 1978DEBT REPAYASLE IN FOREIGN CURRENCY AND GOODS
(IN THOUSANDS OF U.S. DOLLARS)
D E B T O U TuS T A N D I N G : I N A A R E A R STYPE OF CiEDITOR… ---------------------------------- :----------------------
CREDITOR COUNTRY DISBURSED :UNDISEURSED: TOTAL PRINCIPAL INTEREST…------____ ------------- …___---__--- ----------- ----------- __________ ----------- -----------
SUPPLIERS CREDITSJAPAN 4,010 - 4,810 - -TURKEY 1,000 - 1,000 - -UNITED ICINGDOM 10,666 - 10,666 - -USSR 58,292 11,479 69,771 - -YU6OSLAVIA 36,684 17,939 54,623
TOTAL SUPPLIERS CREDITS 111,452 29,418 140,870 - -
FINANCiA.L INSTITUTIONSAUST0Yi 6,176 - 6,176 - -FRANCE 10,396 14,896 25,292 - -SINGAPORE 2,377 _ 2,377 - _UNITED KINGDOM 448 - 448 - -UNITED STATES 6,500 - 6,500 - -
TOTAL FINANCIAL INSTITUTIONS 25,897 14,896 40,793 - -
MULTILATERAL LOANSASIAN DEV. BANK 49,935 222,519 272,454 - -IBRD 54,896 - 54,896 - -IDA 554,155 374,260 928,415 -ISLAMIC DEV. BANK - 1,767 1,767 - -OPEC FUND ,t 13,900 3,500 17,400 - -
TOTAL MULTILATERAL LOANS 672,886 602,046 1,274,932 - -
BILATERAL LOANSBELGIUM 11,099 4,951 16,050 - -BULGARIA 362 646 1,208 - -CHINA, P.R. OF 1,300 54,113 55,413 -CZECHOSLOVAKIA 15,620 18,252 33,872 - -DENMARK t5,328 3,235 18,613 - -FINLAND 2,192 - 2,192 - -FRANCE 11,S40 14.876 26,416 - -GERMAN DEM. REP. 5,052 13;550 18,602 - -GERMANY, FED.REP. OF 287,317 135,609 422,926 - 4,339HUNGARY - 10,000 10,000 - -
INDIA 86,400 5,855 92,265 - -IRAN 4,852 7,648 12,500 - -IRAQ 24,737 20,000 44,737 - -JAPAN 366,667 148,221 514,888 - -K(UWAIT 14,679 17,001 31,680 - -NETHERLANUS 34,93? 12,101 47,033 _ _POLAND 1,807 344 2,151 - -ROMANIA 9,972 5,516 is,438 - -SAUDI ARABIA - 50,000 50,000 _ _rURKEY 3,093 - 3,093UNITED ARAB EMIRATES 56,618 18,896 75,714 - -UNITED KINGDOM 25,778 3,884 29,642 - -UNITED STATES 715,374 79,822 795,196. - -USSR 50,469 53,784 104,253 - -
TOTAL BILATERAL LOANS 1,745,438 678,494 2,423,932 - 4,339
TOTAL EXT,ERNAL PUBLIC DEBT 2,555,673 1,324,854 3,880,527 - 4,339
NOTES: (1) ONLY DEBTS WITH AN ORIGINAL OR EXTENDED MATURITY OF OVER ONE YEAR ARE INCLUDED IN THIS TABLE.(2) DEBT OUTSTANDING INCLUDES PRINCIPAL IN ARREARS 3UT EXCLUDES INTEREST IN ARREARS.(3) THE FOLLOWING UNCOMMITTED PARTS OF FRAME AGREEMENTS AND STANDBYS ARE NOT INCLUDED IN THIS TABLE.
BILATERAL LOANSBULGARIA 6,232GERMANY, FED.REP. OF 145ROMANIA 31,751
TOTAL 38,128_-----------______________________________________________-
TOTAL UNCOMMITTED FRAME AGREEMENTS AND STANDBYS 38,128
EXTERNAL DEBT DIVISIONECONOMIC ANALYSIS AND.PROJECTIONS DEPARTMENT

- 84 -
TABLE 4.2 - BANGLADESH
SERVICE PAYMENTS, COMMITMENTS, DISBURSEMENTS AND OUTSTANDING AMOUNTS OF EXTERNAL PUBLIC DEBT
PROOECTIONS BASED ON DEBT OUTSTANDING INCLUDING UNDISBURSED AS OF JUNE 30, 1978
INCLUDES ONLY DEBT CCOM1ITTED JAN. 1. 19o0 - JUN. 30, 1978DEBT REPAYABLE IN FOREIGN CURRENCY AND GOODS
(IN THOUSANDS OF U.S. DOLLARS)TOTAL
FISCAL DEBT OUTSTANDING AT T R A N S A C T I 0 N s D U R I N G P E R I 0 D OTHER CHANGESYEAR : BEGINNING OF PERIOD
DISBURSED : INCLUDING COMMIT- DISBURSE- S E R V I C E P A Y M E N T S CANCEL- ADJUST-ONLY :UNDISBURSEDL MENTS MENTS ----------- ----------- …----------- LATIONS MENT s
PRINCIPAL INTEREST TOTAL(1) (2) (3) (4) (5) (6) (7) (8) (9)
1973/74 228,270 667,857 460,248 -292,975 9,834 7,331 17,165 182 -21.1391974/75 500,530 1,096,950 973,156 528,394 23,765 10,143 33,90S 1,497 356,4341975/76 1,366,003 2,401,27a 533,254 569,500 67.455 23,285 90,740 11,668 -97,7261976/77 1,812,316 2,757,683 341,149 272,306 30,436 28,669 59,105 27,494 53,3331977/78 2,065,689 > 094,235 683,925 410,902 34,839 31,931 66,770 51,782 188,9901978/79 2,555,673 3,880,529
* * * * . * THE FOLLOWING FIGURES ARE PROJECTED * * * * * *
1978/79 2,555,673 3,880,529 - 409,384 77,960 44,231 122,191 -1
1979/80 2,887,100 3,802,570 - 324,219 49.023 46,937 95,960 - 31980/8t 3,162,304 3,753.550 - 248,34; 53,199 50,153 1C3,352 - -41981/82 3,357,436 3,700,347 - 164,511 51,401 51,757 103,158 - 81982/83 3,470,555 3,640,954 - 85,446 58,885 52,217 111,102 - -s1983/84 3,497,102 3,590,061 - 44,379 70,735 51,820 122,555 - 61984/85 3,470,754 3,519,335 - 26,940 83,572 53,232 136,804 - -11985/66 3,414,121 3,435,762 - 15,584 97,321 52,489 149,810 - -41986/87 3,332,378 3,338,437 - 4,437 101,054 50,257 151,311 - 91987/86 3,235,770 3,-237,392 - 1,318 112,989 51,214 164,203 - 41988/89 3,124,103 3,124,407 - 304 115,153 48,713 163,876 - 31989/90 3,009,247 3,009,247 - - 116,301 47,886 164,187 - -111990,'91 2,892,935 2,892,935 - - 110.671 45,583 156,254 - -21991/92 2,782,262 2,782,262 - - 103,435 43,438 146,873 - 51992/93 2,678,832 2,678,832 - - 103,197 41,461 144,658 - 51993/94 2,575,640 2,575,540 - - 105,833 39,489 145,322 - 1
1994/95 2,469,808 2,469,808 - - 107,032 37.544 144,576 - 41995/96 2,362,780 2,362,780 - - 107,844 35,613 143,A57 - -1996/97 2,254,936 2,254,936 - - 111,672 33,691 145,370 - 51997/98 2,143,262 2,143,262 - - 109,347 31,750 141,097 _ 4
NOTES: 1) INCLUDES SERVICE ON ALL DEBT LISTED IN TABLE 4.1.2) THE ADJUSTMENT COLUMN ALSO INCLUDES THE PREINDEPENDENCE LIABILITIES ASSUMED BY BANGLADESH.
* THIS COLUMN SHOWS THE AMOUNT OF ARITHMETIC IMBALANCE IN THE AMOUNT CUTSTANDING INCLUDING UNDISBURSED FROM ONEYEAR TO THE NEXT. THE MOST COMMON CAUSES OF IMBALANCES ARE CHANGES IN EXCHANGE RATES AND TRANSFER OF DEBTSFROM ONE CATEGORY TO ANOTHER IN THE TABLE.
EXTERNAL DEBT DIVISIONECONOMIC ANALYSIS AND PROJECTIONS DEPARTMENT

TABLE 5.1
SUMMARY OF CENTRAL GOVERNMENT FINANCE
(Taka million)
1972/73 1973/74 1974/75 1975176 1976/77 1977/78 1978/79Budget Revised Budget Revised Budget Revised Budget Revised Budget Revised Budget Revised Budget
Revenue 2.916 2.236 4,113 3,939 5,594 6,837 7,554 8,826 9,823 9,961 11,727 12,446 14,059
of whichTax Revenue 2,684 1,866 3,459 3,091 4,558 5,479 5,965 6,718 7,675 7,633 9,184 9,842 11,283Non-Tax Revenue 231 370 654 84 8 -2A 1,036 1,358 1,589 2,108 2,148 2,328 2,543 2,604 2,776
Current Expenditures 2,184 2,914 2,953 4, 4 2 5--W 4,908 5,655 5.992 6,837 7,679 8216 9 063 10,360 10,531of which Food Subsidy - 783 - 963 600 916 1,006 1,006 840 760 W 1,060 729
Current Surplus (+) or Deficit (-) 732 -678 1,160 -486 686 1.182 1.562 1.989 2.144 1.745 2.664 2,086 3,528
Development Expenditures J 5,010 3,978 5,253 3,050--S 5,250 3,93 2- 9,5 8,500--Y 12 220-110 360 11 907 12 522 14,458Agriculture, Rural Development & Water 1,792 1,350 1,600 .. 1,615 .. 2,990 .. 3,630 3,448'- 3, 3,9 3,982 4,385i/Industries 366 294 790 710 .. 1,360 .. 2,460 1,430 1,480 1,900 2,419Transport, Communication & power 1,431 1,157 1,678 .. 1,685 .. 3,105 .. 3,950 3,582 4,103 3,940 4,481Physical planning & Husing-V 299 307 410 .. 480 .. 945 .. 870 710 1,046 950 1,091Social Sectors _Y 1,122 870 775 *- 660 .. 1,100 .. 1,310 1,190 1,529 1,750 2,082 X
Overall Deficit (-) -4.278 -4.656 -4,093 -3.536 -4,564 -2,750 -7.938 -6,511 -9,260 8,615 9,243 -10,436 -10,930
Financed by:
Capital Receipts (net) -82 640 387 60 306 -1,256 941 272 107 4 4 9 --V 2 88-- 305 -308Deficit Financing 610 833 186 496 318 996 - 999 - - -2 923 -5Foreign Grants & Loans 3,750 3,183 3,520 2,980 3,940 3,010 7,000 5,240 9,156 8,168 8,957 9,208 11,243of which:Food Aid (1,050) (n.a.) (630) (750) (1,040) (n.a.) (1,350) (-1,050) (1,710) (1,868) (1,307) (1,338) (1,813)Commodity Aid ( (1,600) (1,320) (1,630) (n.a.) (3,650) (4,350) (4,500) (3,785) (4,244) (4,000) (4,780)Project Aid ( (2,700) (n.a.) (1,200) (910) (1,270) (n.a.) (2,000) (1,940) (2,946) (2,515) (3,406) (3,870) (4,650)
Balance (surplus (-)) _ - _ _ _ -3 -2 -3 -
Note: The Railway budget has been included in Central Government budget's current revenue and expenditure from 1974/75 onwards. Also beginning 1974/75,the central budget includes estimates for food subsidies. Current (revenue) expenditures are those on non-development account only.
a/ Include the Railway receipts and payments (comparable to the following years).b/ Including Reconstruction and Rehabilitation expenditures for 1972/73 and 1973/74. Including current development expenditures.c/ Includes expenditures on Cyclone Reconstruction.d/ Includes Health, Education, Population, Planning, Manpower and Employment, Social Welfare, Development Board and Miscellaneous expenditure.e/ The breakdown is not available.f/ Realizable expenditure is estimated at Tk. 11,404 million; this is the figure used to derive the overall deficit.&/ Tk. 350 million from previously accumulated balances of autonomous bodies included.h/ Includes Tk. 244-million to be mobilized from sales of debentures of some autonomous bodies.i/ Including Food for Work Program.
Source: Ministry of Finance, the National Board of Revenue and the Planning Commission.

TABLE 5.2
CENTRAL GOVERNMENT CURRENT REVENUE(Taka million)
1972/73 1973174 1974/75 1975/76 1976/77 1977/78 1978/79
Revised Revised Revised
Actual 7, Actual 7. Actual 1 Budae t % Budget 7. Budatet 2, Budget 'I Budget 7, Budget %
TAX REVENUE 1.865 83.4 3 091 78.5 5 7 80.1 6 718 76.1 7.675 78.1 ~7633 76.6 9.175 78.2 9.842 79.1 11,283 80.2
Productioni, Consumption
and Distribution Taxes 1,601 71.6 2,611 66.3 4,288 62.7 5,730 64.9 6,498 66.2 6,401 64.2 7,667 65.4 8,332 66.9 9,575 68.1
Custom Duties (697) (31.2) (1,187) (30.1) (1,517) (26.5) (2,602) (29.5) (3,130) (31.9) (2,890) (29.0) (3,911) (33.4) (3,950) (31.7) (4,931) (35.1)Import License Tax a! ( 298)Excise Duties (550) (24.6) ( 636) (21.2) (1,5,03) (22.1) (1.780) (20.2) (2,000) (20.4) (2,030) (20.4) (2,275) (19.4) (2,300) (18.5) (2.417) (17.2)Sales Taxes (214) (19.6) ( 434) (11.0) ( 619) C 9.1) (1,105) (12.5) (1,135) (11.6) (1,230) (12.3) (1,230) (10.5) (1.770) (14.2) (1,898) (13.5)Stamps ( 98) (4.4) ( 112) (2.8) ( 270) ( 3.9) ( 170) (1.9) ( 160) (1.6) ( 160) (1.6) ( 160) ( 1.4) ( 210) ( 1.7) ( 220) ( 1.5)Motor Vehicle Taxes ( 13) ( 0.6) ( 17) ( 0.5) ( 17) ( 0.2) ( 12) ( 0.1) ( 13) ( 0.1) ( 13)( 0.1) ( 13) ( 0.1) ( 20) ( 0.2) ( 27) ( 0.2)Entertainment Taxes ( 29) ( 1.3) ( 25) ( 0.7)( 64) f 0.9) ( 60) ( 0.7) ( 60) ( 0.6) ( 78)( 0.8) ( 78) ( 0.7) ( 82) ( 0.6) ( 82) ( 0.6)
Taxes on Income 141 6.3 332 8.4 677 9.9 804 9.1 919 9.3 1,044 10.4 1,186 10.1 1,240 10.0 1,408 10.0
Individual (136) ( 6.1) ( 322) ( 8.2)( 614) ( 9.0) ( 603) ( 6.8) ( 661) ( 6.7) ( 808)( 8.1) ( 921) ( 7.9) ( 965) ( 7.8) (1,081) ( 7.7)
Company ( 3) (0.1) ( 9) (0.2)( 62) ( 0.9) ( 201) (2.3) ( 216) (2.2) ( 233) (2.3) ( 264) ( 2.2) ( 275) ( 2.2)( 327) ( 2.3)
Land Revenue c/ 25 1.1 55 1.4 87 1.3 106 1.3 65 0.7 179 1.8 300 2.6 250 2.0 280 2.0
Other Taxes and Duties d/ 98 4.4 93 2.4 427 6.2 78 0.8 190h/ 1.9 9 0.1 22 0.2 20 0.2 20 0,1
NON-TAX REVENUE 370 16.6 848 21.5 1.358 19.9 2.108 23.9 2.148 21.9 2.328 23.4 2.552 21,8 2,604 20,9 2,776 19.8
Nationalized Sector 191 8.6 87 2,2 127 1.9 352 4.0 248 2.5 285 2.9 356 3,0 599 4.8 583 4.1
Industries 1 - ( 30) ( 0.8) ( 99) ( 1.4) ( 73) ( 0.8) ( 73) ( 0.7) 10 (0.1) ( 100) ( 0.9) ( 250) ( 2.0) ( 250) ( 1.8)Banks ( 57) (1.4) ( 28)&/ ( 0.5) ( 261) (3.0) ( 153) (1.6) 250 (2.6) ( 228) ( 1.9) ( 337) ( 2.7) ( 321) (2.3)Other Public Sector e/ -. - ( -) ( -) ( -) ( -) ( 18) ( 0.2) ( 22) ( 0.2) 25 ( 0.2) ( 28) ( 0.2) ( 12) ( 0.1) ( 12) ( -)
Interest Receipts 7 0.3 107 2.7 169 2.5 736 6.4 793 8.1 854 8.6 977 8.3 816 6.6 708 5.0Registration Fees 32 1.5 45 1.1 110 1.6 100 1.1 80 0.8 90 0.9 90 0.8 105 0.8 107 0.8Forest 14 0.6 35 0.9 47 0.7 45 0.5 45 0.5 70 0.7 70 0.6 100 0.8 135 1.0Railways 309 7.8 396 5.8 307 3.5 581 6.0 545 5.5 576 4.9 596 4.8 768 5.5Post office, Telephone andTelegraph (Net) -28 -1.3 18 0.5 -5 -0.1 19 0.2 69 0.7 -2 - 22 0.2 -37 -0.3 -58 -0.4Otber f/ 154 6.9 247 6.3 514 7.5 549 6.2 322 3.3 476 5.8 461 3.9 425 3.4 533 3.8
TOTAL CURREYF REVENUE 2.235 100.0 3.939 100.0 6,3 100,0 8.826 100.0 9 823 100.0 9.961 100.0 11.727 100.0 12,446 100.0 14,059 100.0
a/ Tax was imposed in June 1974 and abolished in May 1975.b/ The moratorium on collection of agricultural income tax which was imposed in FY74 for two years was extended for another year in FY76 and collections shown represent arrears In
payment. Beginning Fy76, agricultural intcome has been subjected to a moderate tax.c/ Tax levied on land holdings. it was virtually abolished in FY74 together with the imposition of the moratorium on agricultural incorme tax but reinstated in 1976/77; the exemp-
tion from the tax was extended to holdings up to 8.3 acres (25 bighas).d/ include electricity duties, estate duty on agricultural land, taxes oni isssovable property, gift taxes, capital gain tax, jute tax (abolished in May 1975), toll taxes, betterment
tax on cosmercial establishments and other levies.e/ includes receipts of nationalized insurances, other industrial operations and disinvestment of Industrial units. For 1973/74 these are included under "Industries" above. Budget
speech surwarTy tables include these items in "Other Revenue" and nor in the "Nationalized Sectors".f/ Receipts of various Government departments, especially under civil works, education and health.&/ Included under Industries.h/ Includes effects of new tax measures.
Source: ministry of Finance.

TABLE 5.3
CENTRAL GOVERNMENT CURRENT EEMNDrrURE(Taka million)
1972/73 1973/74 1974/75 1975/76 1976/77 1977/78 1978/79
Revised Revised Revised Revised
Actual % Actual % Budget * % Budget Brudget I Budget % Budget % Budget % Budget % eutget
General Services 1,26 43.5 1.80 40.9 2,315 40.9 2.253 37.6 3,196 46.7 3,471 45.2 4,292 52.3 3,912 43.2 5,276 50.9 5,017 47.6
General Administration 370 25.1 863 11.2 968 17.2 738 12.3 1,095 16.0 1,155 15.0 1,599 19.5 1,430 15.8 2,163 20.9 2,081 19.7
Justice and Police 310 10.6 495 11.2 598 10.5 724 12.1 616 9.0 723 9.4 944 11.5 808 8.9 1,056 10.2 1,116 10. 6
Defense 203 7.0 421 9.5 710 12.5 752 12.5 1,447 21.1 1,551 20.2 1,702 20.7 1,624 17.9 2,001 19.3 1,756 16.7
Scientific Departments 23 0.8 29 0.7 39 0.7 39 0.7 38 0.6 42 0.6 47 0.6 50 0.6 56 0.5 64 0.6
Social Services 584 20.0 821 18.5 1.025 18.1 1.182 19.7 1,225 18.0 1.347 17.5 1.365 16.6 1.567 17.3 1.857 17.9 1.929 18.3
Education 451 15.5 649 14.7 822 14.5 897 15.0 930 13.6 1,020 13.3 1,021 12.4 1,138 12.5 1,353 13.a 1,390 13.2
Health 118 4.0 153 3.4 181 3.2 258 4.3 243 3.6 273 3.5 294 3.6 377 4.2 413 4.0 469 4.4
Social Welfare 15 0.5 19 0.4 22 0.4 27 0.4 52 0.8 54 0.7 50 0.6 52 0.6 91 0.9 70 .7
Economic Services 145 5.0 371 8.4 706 12.5 423 7.1 464 6.8 514 6.7 543 6.6 561 6.2 726 7.0 703 6.7 m
Agriculture 58 2.0 97 2.2 114 2.0 121 2.0 117 1.7 117 1.5 117 1.4 112 1.2 142 1.4 143 1.4
Manufacturing andConstruction 5 0.2 110 2.5 326 5.8 138 2.3 160 2.3 179 2.3 180 2.2 189 2.1 222 2.1 260 2.5
Transport andComunication 82 2.8 164 3.7 258 4.7 164 2.8 187 2.8 218 2.9 246 3.0 260 2.9 362 3.5 300 2.8
Debt Service 134 4.6 183 4.1 313 5.5 389 6.5 438 6.4 526 6.9 689 8.4 741 8.2 707 6.8 858 8.1
Food Subsidy 783 26.9 963 21.8 916 16.2 1.006 16.8 1,006 14.7 840 10.9 760 9.3 696 7.7 1.060 10.3 729 6,9
Railways _ - 279 6.3 380 6.8 439 7.3 508 7.4 581 7.6 567 6.9 586 6.4 734 7.1 795 7.6
Contingency - _ _ - 300 5.0 - - 400 5.2 - _ 1.000 11.0 - - 500 4.8
TOTAL CURRENT EXPENDITURE 2 914 100 0 4 425 100.0 5,655 100.0 5.992 100.0 6,837 100.0 7 679 100 10 8 216 100.0 91053 0 1 100.0Source: ISinistry _of_ Financ
Source: Ministry of Finankce.

TABLE 5.4
PUBLIC DEVELOPMENT EXPENDITURE BY SECTOR(Takca million)
1972/73 1973/74 1974/75 1975/76 1976/77 1977/78 1978/79Revised Revised Revised Revised Revised RevisedBudget 7, Budget 7. Budget 7. Budgyet 7. Budget 7, Budget 7. Budget 7. Budge 7 Budget 7
Agriculture, Rural Developmentand Water 1,350 33.9 1,579 34.0 1,784 34.0 2,990 31.5 3,625 29.7 3.148 31.3 3,348 29.1 3,480 28.9 3,820 27.5
Agriculture - C576) (12.4) (639) ( 12.2) ( 1,150) (12.1) (1,635) ( 13.4) ( 1,529) (15.2) 1.514) ( 13.1) (1,540) (12.8) ( 1,910) (13.0)Rural Development - C306) (6.6) C285) C 5.4) ( 480) C5.1) ( 490) ( 4.0) ( 420) C4.2) C 482) C 4.2) C 510) (4.2) ( 630) (4.5)Water and Flood Costrol - C697) C15.0) (860) ( 16.4) ( 1,360) C14.3) (1,500) ( 7.3) C 1.199) C11.9) C1,352) C 11.8) (1,430) (11.9) ( 1,380) (10.0)
industry 294 7.4 525 11.3 650 12.3 1,360 14.3 2,460 20.1 1,430 14.2 1,480 12.9 1,900 15.8 2,420 17.4
Power, Scientific Researchand Natural Resources )537 11.6 712 13.6 1,510 15.9 1,888 15.5 1,313 13.0 1,764 15.3 1,680 14.0 2,010 14.5
965 20.9 812 15.7 1,250 13.2 1,646 13.5 1,962 19.5 1,815 15.7 1,760 14.6 1,970 14.2Transport ) 1,157 29.1
131 2.8 186 3.5 345 3.6 419 3.4 307 3.1 524 4.6 510 4.2 5011 3.6
Physical Planningand Housing 307 7 .7 233 5.0 340 6.5 660 7.0 734 6.0 630 6.3 933 8.1 810 6.7 1,060 7.6
Education and Training )307 5.6 288 5.5 450 4.7 555 4.5 473 4.7 562 4.9 580 4.9 720 5.2
Health )207 4.5 218 4.0 330 3.5 377 3.1 320 3.2 383 3 .3 430 3.6 500 3.6
Population Planning )50 1.1 77 1.5 250 2.6 294 2.4 216 2.1 288 2.5 310 2.6 430 3.1870 21.9
Socia1 Welfare )21 0.5 20 0.4 40 0.4 40) 0.3 29 0.3 33 0.3 50 0.4 70 0.5
Manpower and Employment 3 - 13 0.2 30 0.3 42 0.3 20 0.2 42 0.4 40 0.3 70 0.5
Cyclone Reconstruction -80 1.7 150 2.8 285 3.0 70 0.6 80 0,8 113 1.0 140 1.2 30 0.2
other - - - - - - 70 0.6 129 1.3 222 1.9 340 2.8 300 2.1
TOTAL DEVELOPNENT EXPENDITURE a/ 3.978 100.0 4,638 100.0 5.250 100.0 9.500 100.0 2.0 100 1,57 100.0 11.506 100.0 12.03 100.0 13.900 100.0
Notes: 'Ve total expenoitures in trho tabrle are not comparable with those in Table 5.1 because of the differences in the way the. aggregates are defined.
Reported actual expenditures are: Tk. 2,674 million for 1972/73. Tk. 3,050 million for 1973/74 and Tk. 3,932 million for 1974/75. It is believed that these totals may understate the level ofexpenditure due in the provisional nature of some entries and the possibility of incomplete recording. Tk. 8,5003million is the revised estimate for 1975/76. Realizable expenditures in1976/77 are estimated in the Budget at Tk. 11,404 million,
a/ ixclode expenditure on Fond for Work Program.
Source: Ministry of Finance.

- 89 -
TABLE 6.1
MONEY SUPPLY AND CHANGES IN DOMESTIC LIQUIDITY(Taka million)
1971/72 1972/73 1973/74 1974/75 1975/76 1976/77 1977/78Dec. 71- July 72- July 73- July 74- July 75- July 76- July 77-June 72 June 73 June 74 June 75 June 76 June 77 June 78
MONEY SUPPLY (end of period!')
Currency in Circulation 1,756 2,864 3,311 2,931 3,399 3,787 5,215Demand Deposits 3,101 4,096 4,856 5,211 5,907 6,521 7,352Money Supply (M1) 4,857 6,960 8.167 8,142 .23jQ 10.307 12.567Tiiae Deposits 2,135 2,931 3,998 4,732 5,478 7,999 9,646Broad Money (M2) 6,992 9,891 12,165 12,874 14,784 18,306 22.213Index ot Money Supply (Ml)(Dec. 1971 = 100 b/) 125 180 211 210 240 266 324
CHANGES IN DOMESTIC LIQUIDITY
Money Supply (Ml) 982 2,103 1,207 -25 1,164 1,001 2,260Currency in Circulation (-310) (1,108) ( 477) (-381) ( 468) ( 388) (1,428)Demand Deposits (1,292) ( 995) ( 760) ( 355) ( 696) ( 614) ( 831)
Time Deposits 550 796 1,067 734 746 2,521 1,647
Total Domestic Liquidity (M2 ) 1,532 2,899 2 274 709 1,910 3,522 3,907
Domestic Credit 1,034 2,814 3,302 1,501 3,156 1,856 4,860
Public Sector 1,500 3,004 2,775 1,548 2,258 197 2,929
Government c/ ( 824) (1,291) (1,723) ( 229) (1,175) (-114) (1,116)Nationalized Industries d/ ( 600) (1,624) ( 789) ( 906) }(1,083) }( 311) }(1,813)other e/ (89) C89) ( 263) ( 413) 1
Private Sector -466 -190 527 -47 898 1,658 1,931
Foreign Sector 1,258 -188 -832 1,098 -1,179 1,645 -1,219
Other f/ -760 273 -196 -1887 R/ 590 -144 -148
Note: Provisional figures.
a/ For 1971-1975, end of period refers to the last Friday of the month; beginning with FY1975/76, it refersto the first business day of the following month.
b/ At Bangladesh's independence (December 17, 1971), the money supply M1 stood at Tk. 3,875 million andbroad money M2 at Tk. 5,460 million.
c/ Investments of Bangladesh Bank and scheduled banks in government securities treasury bills, othergovernment borrowings from Bangladesh Bank, borrowings by Food Department from the banking system,treasury advances and Government currency liability. (The scheduled banks include the six nationalizedbanks, the six foreign banks, Bangladesh Krishi Bank and Bangladesh Shilpa Bank.)
d/ Scheduled banks' credit to public sector, including Bangladesh Bank's investment in debentures of Jute
Industries Corporation (Tk. 100 million in 1973/74 and Tk. 60 million in 1974/75).e/ Scheduled banks' investments in autonomous and semi-autonomous organizations.f/ Includes quantitatively unidentified elements mainly as a result of incomplete reporting by the
scheduled banks.g/ Includes effects of demonetization and devaluation.
Source: Bangladesh Bank

- 90 -
TABLE 6.2
SELECTED INTEREST RATES(in percent per annum)
December 1971- July 1974- April 1976- May 1977- SinceJune 1974 March 1976 April 1977 July 1977 August 1977
Deposaits
(1) Special notice account or depositswithdrawable at notice of 7 to 29 days 3 4 5 4 4
Special notice accounts or depositswithdrawable at notice of 30 days or over 3 1/4 4 1/4 5 1/4 4 1/4 4 1/4
(2) Savings bank accounts with checking facilities 4 5 6 6 4 1/2
Savings bank accounts without checkingfacilities, i.e. accounts withdrawals fromwhich are allowed through withdrawal slips andon production of passbooks only 4 1/2 6 7 7 7
(3) Fixed (or term) deposits
For 3 months and over but less than 6 months 4 1/2 6 7 7 7
For 6 months and over but less than 1 year 4 3/4 6 1/2 7 1/2 7 1/2 7 1/2 f/
For 1 year and over but less than 2 years 5 7 1/4 8 1/4 8 1/4 8 1/4 f/
For 2 years and over but less than 3 years 7 1/2 8 1/4 9 1/4 9 1/4 9 1/4
For 3 years and over 6 9 1/4 10 1/4 10 1/4 10 1/4
Postal Savings
General 7 1/2 7 1/2 8 1/2 8 1/2 8 1/2Fixed: For 1 year 8 9 1/4 a/ 9 1/4 9 1/4
For 2 years 9 10 1/4 a/ 10 1/4 10 1/4For 3 years 10 11 1/4 a/ 11 1/4 11 1/4
Advances
Those extended by smaller banks 9 )12-13 )12-13 )11-12 b/ 11-12Those extended by larger banks 10 ) ) )Advances for jute, jute goods and tea 7 1/2 10 1/2 10 1/2 10 1/2 10 1/2Advances for other export commodities 11 1/2 c/ 10 1/2 10 1/2
Bank Rate
General rate for borrowing from Bangladesh Bank 5 8 d/ 8 8 8Rale fnror rwiaghy-B.np1A_.h fri-hi Leak 3 6 6 6 6Rate for borrowing by Bangladesh Samabaya Bank
(Apex Cooperative Bank) 3 6 6 6 6
Industrial Lending
Lending rates of Bangladesh Shilpa Bank-short term loans 7 )12-13 )11 1/2-13e/ 11 1/2-12 11 1/2-12-long term loans 8 ) )
Agricultural Lending
Borrowing LendingUp to entd 1973/74 Since July 1974 Up to end 1973/74 Since July 1974
(a) Bangladesh Samabaya Bank (to central Coop.(Apex Cooperative Bank) - 3 6 Banks) 4 7
(b) Central Cooperative Banks 4 7 (to Primary 6 9Societies)
(c) Primary Societies 6 9 (to farmers,etc.) 9 12
(d) Bangladesh Krishi Bank 3 6 (short term) 7 11(long term) 8 11 1/2
Money Lenders (Unorganized Sector)Rates vary; typical annual rates are - - - - - - - - - - - - - - - - - - 30 and up - - - - - - - - - - - - - - - -
a/ Effective from July 1, 1976.b/ Includes loans extended by BYB under the special Tk 1 billion agricultural program launched with effect from
February 15, 1977.c/ Effective from July 19, 1976.d/ Effective from June 21, 1974.e/ Since April 1976.f/ Interest being paid at a rate of 1% above the existing rates on deposit accounts opened by individuals in rural
areas since December 16, 1977.
Notes: The Bank Rate has been increased from June 21, 1974; rates on deposits and advances were increased effectiveJuly 1, 1974.For deposits, Bangladesh Krishi Bank and Bangladesh Shilpa Bank (Agricultural Development Bank and IndustrialDevelopment Bank of Bangladesh, respectively) are allowed to quote 1 percent more than the rates given above.However, deposits with these institutions so far have been negligible because their services are more limitedthan those provided by commercial banksFor advances, the rates given are maximum rates. The nominal interest rate on advances to the private sectoris on average about 10-11 percent. Effective rates are 2 to 3 percentage points higher because of margins(15 to 30 percent, depending on the creditworthiness of the borrower or on the type of cosmodity financed).Agricultural loans are routed by the Bangladesh Samabaya Bank to farmers through the Central Cooperative Banksand the Primary Societies.
Source Bangladesh Bank.

TABLE 7,1
AREA UNDER MAIN CROPS(Million Acres)
Crops 1969/70 1970/71 1971/72 1972/73 1973/74 1974/75 1975/76 1976/77 1977/78
Rice 25.48 24.50 22.98 23.80 24.41 24.20 25.53 24.42 24.78Aus ( 8.46) ( 7.89) ( 7.42) ( 7.24) ( 7.68) ( 7.86) ( 8.45) ( 7.95) ( 7.82)Aman (14.84) (14.18) (13.37) (14.12) (14.13) (13.47) (14.24) (14.36) (14.26)Boro (2.18) ( 2.43) ( 2.19) ( 2.43) ( 2.60) ( 2.87) ( 2.84) ( 2.11) (2.70)
Wheat 0.30 0.31 0.31 0.30 0.30 0.31 0.37 0.40 0.47Other Cereals 0.28 0.30 0.25 0.18 0.24 0.24 0.23 0.22 0.22Pulses 0.91 0.92 0.89 0.78 0.70 0.76 0.75 0.82Oilseeds 0.78 0.76 0.69 0.68 0.63 0.69 0.70 0.69Rape and Mustard ( 0.54) ( 0.53) ( 0.47) ( 0.47) ( 0.44) ( 0.48) ( 0.48) ( 0.48) (0.51)Til and Linseed ( 0.16) ( 0.15) ( 0.15) ( 0.15) ( 0.14) ( 0.16) ( 0.17) ( 0.16) ( )Groundnut ( 0.08) ( 0.08) ( 0.07) ( 0.06) ( 0.05) ( 0.05) (0.05) (0.05) (0.06)
Jute 2.46 2.20 1.68 2.21 2.02 1.42 1.28 1.60 1.81Spices 0.42 0.40 0.39 0.38 0.35 0.38 0.38 0.37Sugarcane 0.40 0.40 0.35 0.32 0.36 0.38 0.33 0.36 0.38Potato 0.21 0.21 0.19 0.19 0.20 0.23 0.24 0.19 0.22Sweet Potato 0.18 0.18 0.17 0.16 0.15 0.16 0.18 0.17 0.18Fruits and Vegetables 0.64 0.63 0.58 0.58 0.59 0.61 0.63 0.63Cotton 0.03 0.02 0.03 0.04 0.02 0.02 0.02 0.01 0.01Tea 0.11 0.11 0.11 0.11 0.11 0.11 0.11 0.10Tobacco 0.11 0.11 0.10 0.12 0.11 0.11 0.12 0.17 0.14Others 0.53 0.50 0.39 0.40 0.31 0.50 0.40 0.28a/
Total,all Crops 32.84 31.53 29.11 30.24 30.50 30.12 31.27 30.43a/
Net Cropped Area IncludingCurrent Fallow 22.49 22.48 22.47 22.47 22.48 22.57a/ 22.56a/
Cropping Intensity (x) 146 140 130 135 136 134 139
=Not available.a! Provisional estimate.
Source: Agricultural Statistics Wing, Bangladesh Bureau of Statistics.

92 -
TABLE 7.2
PRODUCTION OF MAIN CROPS(Thousands of Long Tons)
Crovs 1969/70 1970/71 1971/72 1972/73 1973/74 1974/75 1975/76 1976/77 1977/78
Rice 11,816 10,968 9,780 9,930 11,700 11,109 12,561 11,567 12,990
Wheat 103 110 113 90 109 115 215 255 342
Gram and Pulses 293 296 269 222 208 223 220 230
Edible Oil Seeds 290 274 240 228 214 237 238 235
-Rape, Mustard and Til (163) (163) (112) (133) (122) ( 142) (138) 140) ( *-)
-Goundnut (51) (47) (38) (31) (28) (26) (31) (23) (27)
Jute ('000 bales) 7,171 6,670 4,193 6,514 6,000 3,965 4,284 4,806 5,359
Potato 857 849 741 747 719 866 889 724 849
Sugarcane 7,417 7,598 5,686 5,318 6,342 6,635 5,886 6,401 6,670
Mesta ('000 bales) 220 131 93 110 106 54 62 67 75
Tea (mill. lbs.) 67 69 22 53 60 71 65 74
Tobacco 41 47 34 39 41 40 44 63 49
. Not available.
Source: Agricultural Statistics Wing, Bangladesh Bureau of Statistics.

- 93 -
TABLE 7.3
YIELD OF MAIN CROPS(Maunds Per Acre)
Crops 1969/70 1970/71 1971/72 1972/73 1973/74 1974/75 1975/76 1976/77 1977/78
Rice 12.6 12.2 11.6 11.4 13.1 12.5 13.5 13.0 14.3
Aus ( 9.5) ( 9.9) ( 8.6) ( 8.5) ( 9.9) ( 9.9) ( 10.4) (10.3) (10.8)Aman ( 12.7) ( 11.3) ( 11.9) ( 10.8) ( 12.9) ( 12.1) ( 13.5) (13.1) (14.2)Boro (23.7) ( 24.6) (22.6) (23.2) ( 23.3) ( 21.3) ( 21.9) (21.3) (22.5)
Wheat 9.3 9.6 9.9 8.2 9.7 10.0 15.8 17.5 20.0Gram and Pulses 8.7 8,7 8.2 7.7 8.1 7.9 7.9 7.6
Edible Oil Seeds-Rape and Mustard 6.6 6.7 5.1 6.0 6.1 6.4 6.3 6.4-Groundnut 17.3 16.0 14.8 14.0 14.6 13.0 15.4 12.1 12.8
Jute 14.2 14.7 12.1 14.3 14.4 13.3 15.4 15.0 14,9Potato 111.0 110.0 106.0 107.0 98.2 101.7 102.0 103.0 103.9Sugarcane a/ 504.0 516.0 442.0 452.0 473.6 475.9 487.8 487.7 477.7Tea 7.4 7.6 2.4 5.8 6.6 7.4 7.4 8.8Tobacco 10.0 9.5 9.2 8.8 9.6 9.6 10.0 10.1 9.7
= Not available.
a/ These official yield figures of sugarcane are considered to be too high by the BangladeshSugarcane Corporation and by the IBRD. Reasonable yield may be between 2/3 of these officialfigures.
Source: Agricultural Statistics Wing, Bangladesh Bureau of Statistics.

- 94 -
TABLE 7.4
RICE: PRODUCTION, AREA, YIELD
Production in Million Long Tons Area in Million Acres Average Yield Per Acre in Maunds
Aus Aman Boro Total Aus Aman Boro Total Aus Aman Boro Average
1965/66 2.92 6.80 0.62 10.33 7.32 14.67 1.14 23.13 10.8 12.6 14.8 12.11966/67 2.67 5.92 0.83 9.42 6.96 14.06 1.39 22.41 10.4 11.5 16.2 11.41967/68 3.07 6.81 1.11 10.99 8.22 14.68 1.53 24.43 10.2 12.6 19.7 12.21968/69 2.68 6.87 1.61 11.16 7.66 14.40 2.01 24.07 9.5 13.0 21.8 12.61969/70 2.96 6.95 1.90 11.81 8.46 14.84 2.18 25.48 9.5 12.7 23.7 12.6
5-Year AveraRe 2.86 6.67 1.21 10.74 7.72 14.53 1.65 23.90 10.1 12.5 19.9 12.2= - = - ~ ~~~~- - _=_
1970/71 2.86 5.91 2.19 10.96 7.88 14.18 2.42 24.48 9.9 11.4 24.6 12.21971/72 2.34 5.70 1.74 9.78 7.42 13.37 2.19 22.98 8.6 11.9 22.6 11.61972.73 2.27 5.59 2.07 9.93 7.24 14.12 2.43 23.79 8.5 10.8 23.2 11.41973.74 2.80 6.70 2.20 11.70 7.68 14.13 2.60 24.41 9.9 12.9 23.3 13.11974/75 2.86 6.00 2.25 11.11 7.86 13.47 2.87 24.20 9.9 12.1 21.3 12.5
5-Year Avera2e 2.63 5.98 2.09 10.70 7.62 13.85 2.50 23.07 9.4 11.8 23.0 12.2
1975/56 3.23 7.04 2.29 12.57 8.45 14.24 2.84 25.53 10.4 13.5 22.0 13.41976/77 3.01 6.91 1.65 11.57 7.95 14.36 2.11 24.42 10.3 13.1 21.3 12.9
1977/78 3.10 7.42 2.47 12.99 7.82 14.26 2.JO 24.78 10.8 14.2 24.9 14.3
Source: Agricultural Statistics Wing, Bangladesh Bureau of Statistics.

- 95 -
TABLE 7.5
PROCUREMENT, DISTRIBUTION AND STOCKS OF FOODGRAINS(Long Tons)
1972/73 1973/74 1974/75 1975/76 1976/77 1977/78
Opening Balance 359,237 296,621 214,256 746,277 823,167 376,378
Imports 2,739,866 1,640,748 2,254,520 1,412,030 810,000 1,643,081
Local Procurement 52 70,863 137,911 414,954 316,440 550,439
Available for PublicDistribution 3,099,155 2,008,232 2,606,687 2,573,261 1,949,607 2,569,898
Statutory Rationing 464,802 502,488 471,038 359,112 376,810 451,010
Modified Rationing 1,592,148 776,710 577,859 494,816 288,482 352,732
Relief 207,109 52,409 160,852 226,283 199,296 284,829
Others 354,385 396,016 553,787 595,460 608,584 758,559
Total Distribution 2,618,444 1,727,623 1,763,536 1,675,671 1,473,172 1,847,130
Losses 184,090 66,353 96,874 74,423 100,057 95,768
Closing Balance 296,621 214,256 746,277 823,167 376,378 627,000
Source: Directorate of Food, Ministry of Food.

- 96 -
TABLE 7.6
FOODGRAIN PRODUCTION. IMPORTS AND PER CAPITA CONSUMPTION(Million Long Tons)
1969!70 1970/71 1971/72 1972/73 1973/74 1974/75 1975/76 1976/77 1977/78
ProductionRice 11.82 10.97 9.78 9.93 11.70 11.11 12.56 11.57 12.99-Aus (2.96) (2.86) (2-34) (2.27) (2.80) (2.86) (3.23) (T3,1) (3-10)- Aman (6.95) (5.91) (5.70) (5.59) (6.70) (6.00) (7.04) (6.91) (7.42)- Boro (1.90) (2.19) (1.74) (2.07) (2.20) (2.25) (2.29) (1.65) (2.47)Whieat 0.10 0.11 0.11 0.09 0.09 0.12 0.22 0.26 0.34
G-oss_production, total 11.92 11.08 9.89 10.02 11.79 11.23 12.78 11.83 13.33Less: 10% for seed, feed & wastage 1.19 1.11 0.99 1.00 1.18 1.12 1.28 1.18 1.33Net production 10.73 9.97 8.90 9.02 10.61 10.11 11.50 10.65 12.00
Imports 1.55 1.26 1.69 2.74 1.64 2.26 1.42 0.81 1.64- Rice 0.50 0.38 0.67 0.37 0.08 0.26 0.39 0.20 0.30- Wheat 1.04 0.88 1.02 2.37 1.56 2.00 1.03 0.61 1.34
Change in official Stocks(- = addition) .. .. 0.14 0.06 0.08 -0.47 -0.09 0.45 -0.20
Less: Losses in public procuwmoctand distribution .. .. .. 0.18 0.07 0.10 0.07 0.07 0.09
Total availability for consUmptiong' 12.28 11.23 10.73 11.64 12.26 11.80 12.76 11.84 13.35
Population (millions) 70.8 72.3 72.4 74.4 76.2 78.2 80.4 82.7 85.0
Apparent per capita aDnousptton A/- lbs./year 388.5 347.9 332.0 350.5 360.4 338.0 355.5 310.7 351.8- OaZ /day b/ 17.0 15.3 14.5 15.4 15.8 14.8 15.5 14.1 15.4
= Not available.
a/ Inclusive of changes in private stocks.B/ The government's target amount of 15.5 ounces per day corresponds to lbs. 353.6 per annum.
Source: Ministry of Agriculture; Ministry of Food; Planning Commission; Bangladesh Bureau of Statistics;and Table 1.1

- 97 -
TABLE 7.7
BADC LOW LIFT PUMP PROGRAM (1960-1979)
Average Area Irrigated Total AreaNumber of Pumps Cusecs per Cusec Irrigated
Years in Operation per Pump (Acres) (Acres)
1960/61 1,267 .. 64,528
1961/62 1,543 .. 98,163
1962/63 2,024 1.70 38.5 133,043
1963/64 2,456 1.85 34.1 156,281
1964/65 2,238 1.95 30.0 131,129
1965/66 3,420 2.05 24.6 173,553
1966/67 3,990 2.14 26.4 225,105
1967/68 6,558 2.08 23.3 317,903
1968/69 10,582 1.89 20.7 424,799
1969/70 17,844 1.84 19.6 639,000
1970/71 24,454 1.85 18.3 820,074
1971/72 24,254 1.84 19.4 864,427
1972/73 32,924 1.84 20.3 1,230,468
1973/74 35,343 1.84 20.1 1,330,810
1974/75 35,427 1.86 20.0 1,296,960
1975/76 36,376 .. 1,431,000
1976/77 28,224 .- 1,034,328
1977/78 36,735 1,355,138
1978/79 (target) 40,000 1,460,000
S6ource: Bangladesh Agricultural Development Corporation.
= Not available.

- 98 -
TABLE 7.8
BADC DEEP TUBEWELLS PROGRAM
AverageNumber in Area Irrigated Irrigated Area
Year Sunk Operation (Acres) (ac. per Well)
1967/68 106 .. 4,117
1968/69 292 .. 16,080
1969/70 662 .. 32,119
1970/71 51 734 32,070 43.7
1971/72 221 906 29,330 32.4
1972/73 872 1,237 37,776 30.5
1973/74 1,778 1,493 61,456 41.2
1974/75 3,178 2,699 117,864 43.7
1975/76 1,656 3,828 153,747 40.1
1976/77 634 4,455 161,263 36.2
1977/78 1,271 7,453 338,474 45.4
TOTAL 10721
- Not available.
Source: Bangladesh Agricultural Development Corporation.

- 99 -
TABLE 7.9
BADC SHALLOW TUBEWELLS PROGRAM
AverageNumber in Area Irrigated Irrigated Area
Year Sunk Operation . (Acres) (ac. per well)
1972/73 1,808 994 3,560 3.6
1973/74 1,142 2,293 11,845 5.2
1974/75 911 3,605 23,470 6.5
1975/76 1,083 2,162 12,894 6.0
1976/77 1,627 3,045 17,707 5.8
1977/78 3,452 6,517 58,850 9.0
TOTAL 10,023
a/ Under a subsidy scheme which was outside the usual program of BADCbut implemented under the supervision of BADC technical personnel,793 tubewells were sunk and 672 comissioned by June of 1972. Thesetubewells are included here.
Source: Bangladesh Agricultural Development Corporation.
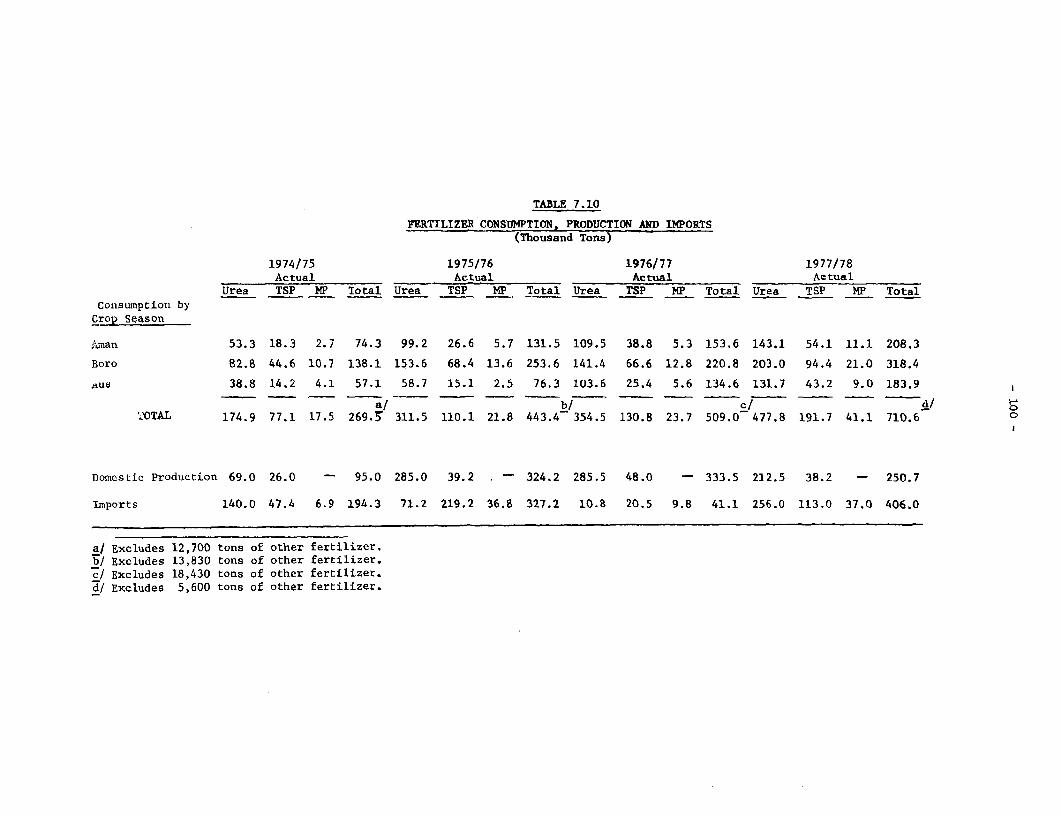
TABLE 7.10
FERTILIZER CONSUMPTION, PRODUCTION AND IMPORTS(Thousand Tons)
1974/75 1975/76 1976/77 1977/78Actual Actual Actual Actual
Urea TSP NP Total Urea TSP MP Total Urea TSP MP Total Urea TSP MP TotalConsumption byCrop Season
Aman 53.3 18.3 2.7 74.3 99.2 26.6 5.7 131.5 109.5 38.8 5.3 153.6 143.1 54.1 11.1 208.3
Boro 82.8 44.6 10.7 138.1 153.6 68.4 13.6 253.6 141.4 66.6 12.8 220.8 203.0 94.4 21.0 318.4
38.8 14.2 4.1 57.1 58.7 15.1 2.5 76.3 103.6 25.4 5.6 134.6 131.7 43.2 9.0 183.9
a/ b/ c/ d/'2OTAL 174.9 77.1 17.5 269.3' 311.5 110.1 21.8 443.4 354.5 130.8 23.7 509.0c 477.8 191.7 41.1 710.6
Domestic Production 69.0 26.0 - 95.0 285.0 39.2 324.2 285.5 48.0 - 333.5 212.5 38.2 - 250.7
Imports 140.0 47.4 6.9 194.3 71.2 219.2 36.8 327.2 10.8 20.5 9.8 41.1 256.0 113.0 37.0 406.0
a/ Excludes 12,700 tons of other fertilizer.a/ Excludes 13,830 tons of other fertilizer.c/ Excludes 18,430 tons of other fertilizer.d/ Excludes 5,600 tons of other fertilizer.

- 401I -
TABLE 8.1
PRODUCTION TRENDS OP BELECTED INDUSTRIIESBA
productim, ~ ~ ~ ~ ro cimCha1969170 197273 197/7 1974/73 1975176 1976/77 1977/78 f197177 1977.L7
Industries/Products Units - ------------ - (Actuals) -------------- - - l1973-FY612i
Juts Textiles (thousand long tons) 560.3 446.3 500.2 444.3 477.9 490.1 546.2 2.6 11.4Hessian . 227.7 155.1 172.3 146.1 161.0 166.5 176.6 3.4 6.11Sacking C) 279.3 210.4 227.2 227.9 221.0 227.0 263.3 2.7 17.0Carpet Backing() 33.0 34.0 66.0 40.0 71.3 70,4 76.3 -1.3 8.4Others () 20.6 26.8 34.7 30.3 24.3 26.2 27.8 7.8 6.1
Cotton TextilesCloth (million yds) 59.1 58.4 79.4 84.6 74.5 68.1 84.5 -8.6 24.1Yarn (million lhs) 103.7 80.9 91.3 91.3 88.1 82.4 89.7 -6.5 8.9
paper and BoardNewsprint (thousand tons) 36.0 27.5 26.3 28.8 20.0 14.6 27.6 -27.0 89.0Paper C) 31.0 23,1 23.0 29.5 19.8 26.5 31.6 33.8 19.3Rayon YarmC 2.7 1.9 2.1 1.8 1.2 1.4 1.3 16.7 -7.1Siardboard (million sq. ft) 15 6 16 15 14.0 17.1 19.3 22.1 12.9particle Board (thousand tonks) 5.3 1.5 2.0 2.1 1.4 2.0 2.7 42.9 35.0
Cement C 3 31 52 127 157 308 340.5 96.2 10.6
Steel Ingote 5 4 67 72 75 89 106 115 19.1 8.5
Petroleum Products ( " ) 853 776 323 761 813 1,048 l,0l7 29.1 -3.0
Eagineering ProductsDiesel Songine (thousand nos.) 1.3 1.4 1.7 3.2 0.9 1.4 - 55.6 -
pumps C " )- 0.9 2.1 7.5 - 2.8 2.1 - -25.0coosserial and Heavy Vehicles ) 0.46 1.23 2.27 1.30 0.89 0.98 1.4 10.1 42.9G. 1. & M1. 5. PiPes ( 5.1 2.8 3.7 2.7 4.8 3.4 5.7 -29.2 67.6Radio . 6.0 5.0 li.0 8.7 4.0 3.9 ..- 2.5
Fertilis.erUrea (thousand tons) 94 207 273 68 276 281 213 1.8 -24.2TSP C ) - - - 32 48 47 38 -2.1 -19.1Assonium Sulphate ( ) 4.7 5.5 10.1 4.9 5.7 9.1 9.3 59.6 2.2
Footwear (thousand doo.) 586 448 391 280 285 235 146 -10.5 -42.7
PharmaceuticalsTablets (million nos.) - 121 209 233 223 232 .. 3.1tiquid (million hottles) - 2.8 4.5 5.1 7.9 7.3 ..- 7.6
Soap (thousand tons) 8.7 8.0 10.4 3.9 8.3 7.3 11.1 -9.6 48.0
Claus Sheets (million ft) 7.2 7.2 3.7 5.7 5.6 5.8 7.6 3.6 31.0
Matches (million groa homes) 13.0 5.9 6.2 6.2 6,9 7.6 9.8 10.1 6.4
Sugar (thousand tons) 93 19 85 98 86 140 175 6~ 25.0Molass.es ( ) 51 10 43 43 39 59 85 ,s.3 44.1
Tea (million Ihs) 67 33 61 71 65 74 77 13.8 4.1
rood and Allied Productstdihle Oils and Vegetehle Ghee (thousand tons) 19.1 14.1 18.4 15.4 19.1 24.9 27.4 30.4 tO.0Fish Processing (million the) 3.8 2.3 3.0 2.7 5.1 7.3 8.4 43.1 -12.3Soft Beverage (thousand cases) 264 330 258 271 233 223 . -3.1Cigarettes (hillion sticks) 17.79 11.20 11.90 10.44 11.91 11.63 12.0 -2.4 3.~2Biscuits and greed (thousand tons) 3.9 6.4 4.4 4.6 4.0 4.2 3.3 5.0 26.2
time stone (thousand tons) 134.3 44.6 81.8 26.0 61.3 61.3 61.0 0.0 -0.3
Sulphuric acid ( ' )6.5 3.7 6.4 5.4 4.0 3.9 4.3 -2.3 13.4Caustic soda . 3.4 3.9 3.8 4.3 4.1 5.0 3.6 22.0 12.0Hydrochloaric acid C). 1.2 1.9 1.6 1.7 1.3 1.7 -11.8 13.3Chlorine ()2.9 2.7 2.3 3.1 3.5 2.9 3.7 -17.1 27.6
Natural gas (million cubic feat) .. . 27,124 17,976 27,357 32,360 34.294 18.3 6.0
Electricity (million kwh) 1,067.3 1,085.6 1,263.4 1,322.1 1,439.7 1,614.35 . 10. 6
a1 Public sector only aecept tea, cigarettes and matches.
Source: Nationalized industries Division; Puhlic Sector Corporations; Planning Cosmission; and gureau of Statistics..

TABLE 8.2
FINANCIAL PERFORMANCE OF THE PUBLIC SECTOR CORPORATIONS(Taka million)
a/Net Profit (+)/Loss (-) Gross Sales
1973/74 1974/175 1975/76 1976/77 1977/78 1973/74 1974/75 1975/76 1976/77 1977/78
1. Bangladesh Jute Mills Corporation (BJMC) -332.0 -239.0 -284.7 -525.5 -605.5 1656.8 2063.3 2941.8 2896,7 3829.3(-20.0) (-11.6) (-9.7) (-18.3) (-17.0)
2. Bangladesh Textile Mills Corporation (BTMC) 162.7 125.1 59.8 -137.8 35.3 1254.4 1409.6 1737.8 1760-7 2005.7(13.0) (8.9) (3.4) (-7.7) (1.8)
3. Bangladesh Sugar & Food Industries Corporation (BSFIC) ... ... ... 86.5 .. ... ... ... 1477.1 1963.0(5.9) (..)
Bangladesh Sugar Mills Corporation (BSgMC) 39.0 53.6 0 ... ... 210.7 580.3 723.2(18.5) (9.2) (H)
Bangladesh Food & Allied Industries Corporation (BFAIC) 24.5 53.1 -18.9 ... ... 349.4 493.2 736.3 ...(7.0) (10.8) (-1.9)
4. Bangladesh Steel & Engineering Corporation (BSEC) ... ... ... 70.8 108.6 ... ... ... 1575.2 1581.0(4.5) (6.9)
Bangladesh Steel Mills Corporation (BStNC) 19.2 41.6 52.5 ... ... 260.5 505.5 791.1 ...(7.4) (8.2) (6.6)
Bangladesh Engineering & Shipbuilding Corporation (BESC) 41.0 45.4 20.7 ... ... 358.9 373.1 333.5 ... ...(11.4) (12.2) (6.2)
5. Bangladesh Chemical Industries Corporation (BCIC) ... ... ... 109.2 65.2 ... ... ... 1646.6 1948.8(6.6) (3.3)
Bangladesh Paper & Board Corporation (BPBC) -32.7 -52.8 -124.7 ... ... 226.8 308.3 320.2 ... ...(-14.4) -17.1 (-38.9)
Bangladesh Fertilizer, Chemical & Pharmaceutical 63.6 -180.7 -67.2 ... ... 507.2 616.4 1046.1 ... ...Corporation (BFCPC) (12.5) (-29.3) (-6.4)
Bangladesh Tanneries Corporation (BTC) -6.4 -3.3 2.9 ... ... 25.2 47.4 35.4 ... ...-25.4 (-7.0) (8.2)
6. Bangladesh Forest Industries Development Corporation (BFIDC) 31.0 51.0 -9.0 -2.8 0.4 81.8 120.0 68.2 76.5 79.6(38.0) (42.5) (-13.2) (-3.7) (0.5)
Sub-total (except BJMC) 341.6 133.0 -78.9 125.9 2 0 9
'5b/ 3274.9 4453.8 5791.8 6529.3 7678.1
(10.4) (3.0) (-1.4) (1.9) (2.7j-Total 9.6 -106.0 -363.6 -399.6 -396.0-/ 4931.7 6517.1 8733.6 9426.0 11507.4
(0.2) (1.6) (-4.2) (-4.2) (-3.4)-
Note: The control, supervision and coordination of the industries nationalized after independence were vested in the Nationalized Industries Division of the Ministry ofIndustries. BJMC was soon transferred to the Ministry of Jute. In 1976, BMDC was transferred to the Ministry of Agriculture and seven sector corporations wereconsolidated into three: BSFIC, BSEC and BCIC. BTMC came under the control of the new Ministry of Textiles in 1977.
a/ The figures in parentheses are ratios of profit or loss over sales, in percent.b/ Excluding BSFIC.
Source: Sector Corporations; Nationalized Industries Division.

- 103 -
TA8LE 8. 3
INDUSTRIAL PRODlUCTION INDICEB
(1969/70 - 100)
*J
Industry Group/Industry Weight 1972/73 1973/74 1974/75 1975/76 1976/77 1977/78
Food industries 15.34 78.4 e 114.7 113.2 117.7 140.8 152.6Fish processing 0.37 60.3 80.7 71.1 131.9 1-95. 1 169.5Flour milling 0.95 245.2 300.8 309.4 333.6 273.4 281.0Bakeries 0.48 110.6 110.9 115.8 101.4 107.3 132.5Sugar industry 4.41 20.2 94.6 105.4 92.8 149.9 187.7Tea industry 8.09 82.0 94.3 95.0 100.4 107.5 111.7Edible oils and fats industry 0.51 182.2 331.7 159.2 257.3 384.6 300.9Vegetable ghee industry 0.53 88.5 78.1 85.8 72.5 92.6 106.4
Beverages 0.25 72.4 58.4 57.5 49.4 46.6 64.8Soft beverages bottling 0.25 72.4 58.4 57.5 49.4 46.6 64.8
Tobacco industry 7.43 63.0 66.9 58.7 67.0 65.4 67.3Cigarettes 7.43 63.0 66.9 58.7 67.0 65.4 67.3
Textile industry 58.17 79.4 90.5 82.8 84.5 84.1 92.8Jute manufacturing 33.53 80.3 90.5 78.6 86.2 88.4 97.7
Cotton textiles 20.82 79.5 92.9 94.0 89.1 83.1 93.4Rayon and other synthetics 3.82 70.7 77.1 59.1 44.1 51.5 48.9
Paper and paper products industries 6.88 62.9 64.1 76.6 52.6 59.8 8 L0.7Paper 4.53841 5 9.-0 7-5.5 50.8 67.0 80.7Newsprint 2.09 76.5 73.6 80.1 55.8 40.6 76.9Hard board 0.21 40.2 104.1 102.1 85.5 124.6 127.7Particle board 0.20 27.4 37.4 38.5 25.6 38.5 50.2
Chemical industries 5.60 139.8 82.5 81.7 208.6 217.4 173.4Fertilizers 3.12 214.5 287.8 106.3 333.0 341.3 258.6Disinfectants and insecticidee 0.36 21.0 35.9 34.8 19.3 52.9 65.9Industrial chemicals 0.13 117.7 122.9 133.5 132.2 134.4 130.0Matches 1.99 45.6 47.9 48.0 52.8 86.4 62.1
Petroleum refining 2.54 88.3 42.4 101.7 111.7 136.7 130.0Petroleum products 2.54 88.3 42.4 101.7 111.7 136.7 130.0
Basic metals industries - 3.32 90.5 90.0 83.5 77.3 95.3 120.50.93 125.5 136.1 1A1I.1 23:mr,14aw.hnolOtts °2.39 77.1 72.3 i4 .4 155:: g 2
Non-metallic minerals industries 0.43 68.6 72.3 121.5 140.5 241.1 274.4Glass manufacturing 0.28 73.9 58.3 58.5 57.0 59.3 77.3Cement manufacturing 0.15 58.8 98.4 239.0 296.2 580.5 642.4
Other industries 0.04 253.9 860.0 512.7 637.3 660.8 819.2Rubber industry 0.01 77.2 60.1 73.4 86.3 68.5 7_.7Ice making 0.03 312.8 1,126.6 659.1 821.0 858.2 1067.7
General Index of Manufacturing& 100.00 80.9 94.7 86.0 93.9 99.7 106.5
* / Preliminary.Note: These indices do not cover all manufacturing. Excluded are, among others, the manufacturing of footwear and clothing,
leather, soap, furniture, drugs and medicines, metal products, machinery, electrical equipment, synthetic resins,plastics, salts, jute pressing, printing and publishing, as well as all small end cottage industries (which includehandloom weaving).
Source: Bangladesh Bureau of Statistics.

TArn. 9. 1
CONSUREB/C.O.L. INDICES (VDCCA)
Weight, Annual Averages Monthly Averages
in %7 1972/73 1973/74 1974/75 1975/76 1976/77 1977/78 July 1976 January 1977 July 1977 January 1978 July 1978
A. Consumer Price Indexfor Government EmployeesiTn Dacc_! (19691/70 = 100)
General Index 100.00 181.5 252.5 407.6 380.1 382.5 440.6 373.5 373.1 420.2 447.2 461.4Food 52.57 18-4.7 263.5 46-9.6 38-4.6 36-6.7 43-1.2 36-2.8 34-9.3 41-7.3 443.9 445.7
Fuel & lighting 5.38 191.8 249.6 358.7 370.1 391.0 401.0 388.9 398.9 398.3 401.3 410.2
Housing & household requisites 11.98 132.1 160.7 268.2 405.8 476.4 563.7 449.8 472.8 505.5 562.5 622.5
Clothing & footwear 8.53 231.8 355.3 413.4 380.0 387.0 466.2 354.1 382.0 437.1 472.7 500.4
Miscellaneous 21.54 178.5 236.7 344.6 357.6 364.8 395.2 351.7 365.7 378.8 392.6 407.3
B. Cost-of-Living Indexfor Middle Income Familiesin Dacca (1973774 = 100)
General Index 100.00 .. 100.0 167.2 153.2 156.9 176.7 166.8 166.8 169.6 181.7 180.9
Food 62.74 *- 100.0 176.9 148.6 150.2 173.7 148.6 143.9 167.2 181.3 177.8
Fuel & lighting 7.50 .. 100.0 153.4 154.5 164.1 168.0 163.5 165.7 165.7 166.7 168.7
Hiousing & household requisites 11.85 *- 100.0 178.3 204.4 218.1 237.3 316.9 335.2 223.7 239.3 246.2
Clothing & footwear 6.20 .. 100.0 119.3 110.9 110.0 144.9 104.7 108.1 121.5 129.0 136.5
Miscellaneous 11.71 .. 100.0 137.8 147.4 150.4 160.7 147.8 150.6 155.6 163.1 163.4
Notes: A. The consurter price index for government employees in Dacca (base 1969/70 100) refers to non-gazetted government employees with monthly salaries between
Taka 100 and Taks 400 in 1969/70. The coverage of items and distribution of weights are based on the findings of the Family Budget Survey of 1955/56.
B. The cost-of living index for middle income families in Dacca (base 1973/74 = 100) is based in the coverage of items and distribution of weights on the
results of the Household Expenditure Survey conducted by the BBS in 1973/74.
Source: Bangladesh Bureau of Statistics.

- 105 -
TABLE 9.2
WHOLESALE PRICE INDICES OF AGRICULTURAL AND INDUSTRIAL PRODUCTS(1969/70 - 100)
Weights,in 7. of Total 1972/73 1973/74 1974/75 1975/76 1976/77 1977/78
A. Dacca
Agricultural products 82.06 180.2 233.0 494.1 338.7 313.0 384.8Food 65.62 187.8 273.4 530.3 328.0 289.3 357.3Raw materials 16.02 169.0 173.5 350.1 392.6 444.7 487.7Fuel 0.42 - - 427.4 397.8 361.1 303.6
Industrial products 17.94 246.3 283.1 382.0 355.4 394.0 413.6Food 13.47 249.7 322.3 354.5 337.6 389.1 392.Raw materials 0.33 - - 154.4 361.1 615.4 486.1Fuel & lighting 0.46 235.8 288.4 367.4 406.2 427.2 450.5Manufactures 3.68 241.7 227.5 501.0 414.0 387.8 478.1
All products 100.00 474.0 341.9 327.5 387.8
B. Chittagong
Agricultural products 82.06 194.5 263.1 504.2 345.2 323.2 403.1Food 65.62 193.8 262.8 558.3 319.2 302.3 379.9Raw materials 16.02 258.6 293.6 288.1 357.5 409.4 492.7Fuel 0.42 - _ 329.6 429.4 327.2 367.7
industrial products 17.94 244.3 290,2 403.9 365.6 407.6 464.6Food 13.47 237.2 294 .7 385.9 349.3 407.7 451.7Raw materials 0.33 - - 145.7 402.2 728.3 615.2Fuel & lighting 0.46 238.5 320.8 362.7 356.3 382.4 438.1Manufactures 3.68 255.1 278.4 503.6 423.2 379.0 471.0
All products 100.00 486.1 348.9 338.4 414.2
C. Bangladesh
Agricultural products 82.06 '87.8 251.3 464.2 332.5 305.7 374.5Food 65.62 186.7 256.6 507.9 326.9 287.1 352.3Raw materials 16.02 261.4 279.7 308.6 354.4 379.9 469.4Fuel 0.42 - - 376.0 415.9 391.4 401.8
Industrial products 17.94 255.5 320.3 390.4 356.5- 361.7 435.7Food 13.47 247.7 341.4 366.9 341.1 348.4 425.0Raw materials 0.33 - - 135.4 352.5 645.,0 521.1Fuel & lighting 0.46 227.5 312.1 348.3 352.8 354.7 381.8Manufactures 3.68 267.1 291.4 504.6 419.6 379.8 474.7
All products 100.00 240.5 304.4 454.3 337.8 315.8 385.4
Note: The wholesale price indices (base 1969/70 - 100) are prepared for six urban centers in Bangladesh(Dacca, Chittagong, Khulna, Raishahi, Sylhet and Rangpur) and cover 44 individual items. Weightsare assigned in proportion to the gross value of production for each item in the base year 1969/70.The national index represents the unweighted average of the indices for the six urban centers.
Source: Bangladesh Bureau of Statistics.

TABLE 9.3
WHOLESALE PRICES OF SELECTED COMMODITIES AT DACCA(Taka)
January June1968/69 1969/70 1970/71 .1971/72 1972/73 1973/74 1974/75 1975/76 1976/77 1977/78 _ 1978 1978
Rice (fine) Md. 47.6 47.6 48.6 79.1 90.7 125.9 250.9 164.3 143.6 1 72.6 174.0 175.0
Rice (medium) Md. 44.5 44.7 45.8 54.5 83.6 119.3 240.9 151.9 133.8 160.4 155.3 161.7
Rice (coarse) Md. 41.4 40.4 41.1 48.4 94.2 110.7 219.3 138.3 120.0 147.3 141.5 144.3
Masur Md. 31.4 39.1 47.2 62.8 79.1 160.8 185.1 222.6 172.4 229.7 297.5 240.0
Chillies (dry),sup. quality Md. 119.9 98.2 93.7 148.8 93.1 332.8 1330.1 298.8 489.2 713.3 1511.3 676.7
Mustard oil(local) Md. 133.0 164.2 194.7 254.6 428.4 254.6 1154.5 775.9 675.5 827.5 1033.8 856.3
Coconut oil(imported) Md. 247.1 216.3 257.8 333.1 470.9 831.2 1271.5 665.0 844.9 1047.1 970.0 1100.0
Vegetables oil(Pakvan) 35 lbs. 59.8 66.8 89.6 119.0 145.5 274.7 439.5 319.9 285.7 341.8 438.8 330.0
Tobacco leaf(Motihari, sup.quality) Md. 341.5 253.9 198.1 375.8 743.5 741.7 599.5 1215.3 1304.3 917.7 718.8 900.0
Source: Bangladesh Bureau of Statistics.

TABLE 9.4
RETAIL PRICES OF SELECTED CONSUMER GOODS AT DACCA(Average Prices in Taka)
January JuneItem Unit 1968/69 1969/70 1970/71 1971/72 1972/73 1973/74 1974/75 1975/76 1976/77 1977/78 1978 1978
Rice (sedium) Md. 47.2 47.6 48.0 57.2 89.6 126.0 280.1 162.4 140.4 171.2 166.0 171.6
(33) ( 9)Hasur (husked, whole) Seer 1.1 1.2 1.3 1.8 2.6 4.5 5.5 6.3 5.0 6.6 8.0 6.4
(78) ( 7)Rohu, big (cut pieces) 3.9 4.1 4.2 5.0 8.7 12.4 14.9 16.0 17.4 21.5 18.4 22.1
( 6) (17)potato (deci. aainital), oediuo 0.7 0.7 0.7 0.8 1.4 2.0 2.3 2.7 1.9 1.7 2.3 1.8
(92) (29)Mustard oil (local vill 1st qlty) " 5.6 4.4 5.2 6.8 12.2 15.3 32.7 22.1 18.8 24.2 28.0 24.2
(41) (21)Chillies - dry 3.5 3.1 3.0 4.4 3.0 9.8 48.7 10.0 14.7 22.9 42.3 20.0
(252) (-8)Cur-Cinia (loose) * 1.5 1.6 1.5 1.1 3.8 4.0 8.0 7.7 5.8 6.0 6.4 6.0
(28) (-)Coconut-dry (wed.) Per Unit 0.6 0.7 0.8 0.6 1.4 2.2 3.8 3.5 3.3 3.5 3.6 3.6
(-3) (9)Firewood (gasari, split) Md. 5.5 5.9 6.1 7.5 11.3 14.9 20.6 21.9 23.3 24.5 24.3 24.6
Karosene-ihite 22 Ounce 0.4 0.4 0.4 0.8 0.9 1.3 1.6 1.7 1.9 2.7 2.8 2.8Bottle (56) (56)
Saree (mill 50's x 70s,med.quality) 5 Yard 11.3 12.2 13.1 15.0 28.1 41.4 41.3 35.4 38.2 52.6 53.3 53.0Piece (48) (18)
Longcloth (mLd. quality) Yard 1.8 2.0 2.3 4.4 10.8 12.2 12.0 8.5 8.9 12.2 12.5 12.5(32) (32)
Paper-Foolscap (white) Quire 0.7 0.8 0.8 n.a. 1.1 1.6 2.7 2.0 2.4 2.7 2.5 2.8
s/ ( -) (12)Betel-leaf (med.) Birah - 1.1 1.0 1.5 2.1 3.8 2.7 4.3 4.9 3.7 4.8 5.1 4.3
(31) (39)Tobacco (leaf) motihari Seer 10.2 9.0 7.7 11.8 24.6 24.1 21.5 39.0 46.1 31.1 40.2 28.2
(-23) (-32)
I/ I birah - 80 leaves.
Note: Figures in parenthesis are percentage increase over the previous year.
Source: Bangladesh Bureau of Statistics.

- 108 -
TABLE 9.5
AVERAGE PRICES OF RICE
(Medium Quality; in Taka per maund)
Wholesale RetailPrice a/ Price b/
1969/70 43.12 45.601970/71 41.48 45.301971/72 56.31 61.201972/73 95.80 107.601973/74 113.31 120.40
1974/75 230.08 252.24
July-September 188.30 201.73October-December 238.75 266.87January-March 263.74 286.53April-June 229.52 253.83
1975/76 141.32 153.78
July-September 202.71 214.17October-December 129.40 150.00January-March 118.51 127.20April-June 114.68 123.73
1976/77 125.38 135.67
July-September 122.04 130.93October-December 120.27 126.53January-March 115.51 126.13April-June 143.67 159.07
1977/78 159.45 169.60
July-September 174.13 184.40October-December 154.73 164.80January-March 148.30 157.60April-June 160.63 171.60
1978/79 .._..
July 157.83 170.40
Ij National average.&j Simple average of 4 centres (Dacca, Chittagong, Khulna and
Rajshahi).
Source: Bangladesh Bureau of Statistics.

TABLE 9.6
AVERAGE WHOLESALE PRICES OF SELECTED BUILDING MATERIALS AND DAILY WAGE RATES OF CONSTRUCTION WORKERS
(Taka)
Unit 1967/68 1968/69 1969/70 1970/71 1971/72 1972/73 1973/74 1974/75 1975/76 1976/77 1977/78
materials
Bricks (10", first class) Per 1,000 118.23 118.85 125.07 124.86 142.27 222.73 324.87 465.44 621.45 611.66 625.49
Cemnrt (A.B.C.) per bag 13.10 12.68 13.08 11.24 21.21 35.62 77.11 124.35 68.61 63.62 65.54
Sand (coarse, superior quality) 100 cft. 36.97 38.62 39.23 38.02 39.29 49.12 86.41 94.91 99.74 111.94 123.64
Iron rods (3/8") per cwt. 74.77 72.73 81.31 84.44 96.83 121.44 239.67 326.83 363.81 349.64 379.22
Cast-iron sheets (24 gauge) per bundle 173.65 99.58 193.16 173.23 230.00 442.19 585.87 1,074.45 934.76 989.88 1,159.70
Labor
Mason per day 6.87 7.01 7.16 6.45 6.65 8.61 13.38 16.74 20.35 21.17 24.62
Helper (Jugali) per day 3.44 3.74 3.51 3.73 3.83 4.74 7.08 9.97 10.83 10.73 12.72
Carpenter Per day 6.12 6.27 6.42 6.41 6.73 8.96 12.05 15.67 18.22 19.92 22.35
Source: Baigladesh Jur- u of Statistics.

TABLE 9.7
AVERAGE WAGE RATE PER DAY IN DACCA
(Taka)
TnOustry January July January July January July January July January July January July Jmuoar ,1968 1972 1971973 1973 1974 1974 1975 1975 1976 1976 1977 1977 197 _
Cotton Textile
Skilled 5.50 7.20 7.12 7.50 7.50 8.50 10.00 11.25 11.25 12.00 13.00 12.00 1..00 l'
Unskilled 3.50 5.00 5.78 5.80 6.50 7.05 8.00 9.50 8.00 9.00 10.00 8,37 s.75 9.SO
Jute Textile
Skilled 5.00 7.60 7.12 7.50 8.00 8.50 10.00 10.87 11.00 12.00 13.00 12.00 15.00 15.00
Unskilled 3.00 5.00 5.78 5.80 6.12 7.00 8.00 8.50 8.12 9.00 8.50 8.37 9.50 10.00
Match
Skilled 4.77 10.00 10.00 10.00 10.75 11.00 11.75 13.00 11.75 14.75 15.00 10.00 14.00 15.00
Unskilled 3.37 7.30 7.00 7.00 7 .75 8.00 8.62 9.31 8.00 10.00 10.00 8.00 9.00 10.00
Mustard Oil
Skilled 4.69 7.60 7.87 9.00 9.44 10.00 10.25 11.79 12.75 12.00 12.00 12.00 12.50 13.00
Unskilled 2.92 5.00 6.62 6.50 7.37 7.50 8.00 9.78 9.00 9.00 9.50 9.00 9.00 10.00
a/ Exclusive of food, housing, medical facilities, etc.
Source: Bangladesh Bureau of Statistics.

- ll -
TABLE 10.1
PRODUCTION OF JUTE GOODS
('000 long tons)
CarpetYear Hessian Sacking Backing Others Total
1969/70 227.7 279.3 33.0 20.6 560.61970/71 199.4 172.8 40.5 26.9 439.61971/72 121.0 145.6 35.5 13.2 315.21972/73 155.1 210.4 53.8 27.0 446.31973/74 172.3 227.2 65.7 34.9 500.21974/75 146.1 227.9 40.4 29.8 444.3-1975/76 161.3 221.0 71.3 24.3 477.91976/77 166.5 227.1 70.5 25.6 489.71977/78 176.6 265.5 76.3 27.8 546.2
Source: Bangladesh Jute Mills Corporation.

TABLE 10.2
JUTE GOODS EXPORTS
Export Shipments Export SalesVolume (in thousand long tons) Value Volume Value
Carpet (in thousandHessian Sacking Backing Others Total (Taka million) long tons) (Tk. million
1969/70 204.2 232.0 34.0 28.0 498.2 773.41970/71 172.6 146.1 42.5 20.7 381.9 667.81971/72 76.7 100.5 32.7 11/1 221.0 795.41972/73 163.1 169.8 50.0 28.7 411.6 1447.9 517.9 1827.61973/74 144.8 206.1 61.4 25.8 438.2 1586.5 492.3 1858.21974/75 136.6 181.3 40.9, 19.8 378.7 1858.6 391.5 1977.71975/76 159.2 198.2 62.4 19.3 439.1 2778.4 547.2 3244.61976/77 151.6 208.4 71.7 21.8 453.5 2782.3 480.6 2880. H
1977/78 184.0 241.3 76.9 20.1 522.3 373342 514.2 3829.3
Source: Bangladesh Jute Mills Corporation, and Bangladesh Bureau of Statistics.

TABLE 10. 3
EXPORT PRICES OF JUTE GOODS
(f.o.b. prices; Taka per long ton)
a/ b/ c/Hessian Sackiog Carret Backing
1973/74 1974/75 1975/76 1976/77 1977/78 1973/74 197 1975/76 1976/77 1977/78 1973/74 1974/75 1975/76 1976/77 1977178
July 3,824 5,867 6,210 6,664 7,070 2,345 3,451 5,533 4,696 5,215 4,860 6,300 8,128 7,277 8,503
August 3,992 6,257 6,143 6,664 7,236 2,527 3,711 5,378 4,696 5,422 4,750 6,075 8,830 7,356 8,410
september 3,973 6,385 6,206 6,530 7,325 2,553 3,959 5,227 4,587 5,513 4,750 5,750 8,484 7,656 8,397
October 4,086 6,205 6,307 6,937 7,454 2,598 4,124 5,198 4,575 5,731 4,750 5,750 8,430 8,123 8,504
November 4,265 5,634 6,169 6,776 7,805 2,668 4,112 5,077 4,536 6,158 4,775 5,750 8,857 8,031 8,620
December 4,534 5,120 6,219 6,688 8,886 2,688 3,936 5,077 4,546 6,799 4,775 4,950 8,823 7,760 8,664
January 5,041 5,120 6,239 6,717 8,932 2,840 3,936 4,782 4,606 7,037 4,475 4,950 8,801 7,959 8,685
February 5,659 5,268 6,295 6,967 9,680 3,151 3,962 4,885 4,802 7,458 5,250 4,950 7,654 8,173 9,402
March 6,189 4,919 6,768 7,027 9,505 3,415 3,853 4,951 5,099 7,331 5,250 4,990 7,940 8,144 9,402
April 6,924 4,579 7,002 7,027 9,178 3,650 3,682 5,042 5,553 6,968 5,350 5,100 8,299 8,341 9,276
May 6,862 5,627 6,409 7,057 8,731 3,522 4,429 4,628 5,671 6,510 6,150 6,219 7,487 8,518 9,589
June 6,088 6,479 6,631 7,080 8,482 3,435 5,690 4,686 5,569 6,236 6,293 8,078 7,483 8,512 9,589
Annual Average (Taka) 5.120 5.622 6.383 6.845 8,357 2,949 4.070 5.039 4.911 6,365 5j144 5,739 8.268 7.987 8.920
a/ 11x12 - 40"; 10 oz./yard.-- Price quotations coionly provided per 100 yards.b/ 6x8 - 26-1/2"; 2.25 lb5./bag; B. Twills.-- Price quotations cn1ly provided per 100 bags.
c/ 7 oz./36 - 13zgo; cloth.-- Price quotation comely provided per long ton.
Source: Bangladesh Jute Mills Corporation.

- 114 -
TABLE 10.4
PRODUCTION, DOMESTIC USE AND EXPORTS OF RAW JUTE
(Million bales)
1972/73 1973/74 1974/75 1975/76 1976/77 1977/78
(- - ---- -------- -Actual------ )
Carryover 1.26 2.11 2.15 1.85 1.00 0.30
Production 6.51 6.00 3.90 4.35 4.80 5.40
Total Availability 7.77 8.11 6.05 6.20 5.80 5.70
Mills Consumption 2.49 2.91 2.50 2.65 2.90 3.10
Growers' Consumption 0.15 0.25 0.10 0.15 0.25 0.30
Estimated Loss & Unaccounted 0.20 0.15 0.05 0.05 0.05 nil
Total Domestic Use 2.84 3.31 2.70 2.85 3.20 3.40
Exports 2.82 2.65 1.55 2.35 2.30 1.70
End Season Stocks 2.11 2.15 1.85 1.00 0.30 0.60
Area under Jute 2.21 2.02 1.42 1.28 1.60 1.81(min. acres)
Source: Ministry of Jute and Bureau of Agricultural Statistics.

- 115 -
TABLE 10.5
EXPORT SHIPMfISTS OF RAW JUTE
('000 bales)
1972/73 1973/74 1974/75 1975/76 1976/77 1977/78
July 143 202 169 73 112 37August 138 84 172 38 100 16September 108 120 218 108 97 46October 171 155 228 129 171 262November 255 169 118 145 281 340December 281 280 192 249 239 322
January 310 280 172 283 364 194February 203 313 105 336 286 137March 337 196 91 350 270 125April 285 317 58 257 132 88May 268 254 31 224 171 52June 327 292 84 155 53 48
Total ('000 bales) 2826 2,662 1,548 2347 2,276 1,667
Total ('000 metric tons) 527.4 496.8 288.9 438.0 424.8 311.1
Note: 1 bale of jute = 411.45 lbs.1 metric ton 5.358178 bales
Source: Bangladesh Jute Export Corporation, Jute Division.

- 116 -
TABLE 10.6
PRICES OF RAW JUTE
A. Growers' Prices-a/ (Taka/Maund)
1972/73 1973/74 1974/75 1975/76 1976/77 1977/78
July 50.47 50.94 66.17 88.90 93.55 129.92August 49.73 52.44 67.39 87.78 93.38 123.68September 48.25 51.70 85.76 90.51 93.77 128.45October 50.94 52.54 107.48 88.24 95.68 123.27November 52.48 52.64 128.71 87.02 103.35 125.29December 54.29 52.90 106.80 90.23 109.69 147.82
January 54.52 53.64 94.09 96.39 118.16 184.67February 55.10 54.80 84.21 101.00 126.21 192.00March 55.33 56.31 81.77 103.70 130.22 191.00April 56.37 57.52 76.67 103.85 131.43 191.25May 55.72 61.12 83.31 105.93 135.64 189.00June 55.77 67.32 88.00 106.05 133.83 185.00
Anntibl / 53.25 55.32 89.20 95.80 113.74 159.28
B. Export Prices (E Sterling/long ton)
July 112 114 144 155 $ 290 $ 320August 112 114 150 155 $ 290 $ 320September 112 116 165 155 $ 290 $ 320October 112 116 190 155 $ 290 $ 340-&/November 112 116 200 155 $ 290 $ 352-h/December 112 116 200 155 $ 30e' $ 352
January 112.7 116 200 155 $ 300 205-i/February 114.05 116.32 200 155 $ 320-/ 205March 115 119 200 160 $ 320 205April 115 124.9 200 171 $ 320 205May 115 133.15 180 $30i-!/ $ 320 205June 114 138.8 160 $ 290 $ 320 210
Annual Average (E) i3L.2. 1.42 _ i1i_
a/ Combined average price for white and tossa jute paid to growers.b/ Unweighted average of monthly prices.c| Export prices quoted for BWD, f.o.b. Chalna/Chittagong.d/ Price quotation was changed to US dollars in May 1976.e/ As of 13 December 1976.f/ As of 14 February 1977.>/ As of 1 October 1977.h/ As of 25 November 1977.i/ Price quotation was changed to pounds sterling in January 1978.
j/ Unweighted average of monthly/daily quotations; where necessary, converted into pound sterling bv means of theaverage monthly exchange rates.
Note: This table which gives announced monthly prices and an unweighted yearly average, is not comparable
with Table 3.3 which gives annual price indices of average prices based on actual transactions.
Source: Bangladesh Jute Export Corporation.


The World Bank
Headquarters European Office Tokyo Office1818 H Street, N.W. 66, avenue d'lena Kokusai BuildingWashington, D.C. 20433, U.S.A. 75116 Paris, France 1-1 Marunouchi 3-chomeTelephone (202) 477-1234 Chiyoda-ku, Tokyo 100, JapanCable Address INTBAFRAD
WASHINGTONDC