The Sexual Excitation/Sexual Inhibition Inventory for Women: Psychometric Properties

www.psye.org © Psychology, Society, & Education 2014, Vol.6, Nº 1, pp.ISSN 2171-2085 (print) / ISSN 1989-709X (online)
*Correspondencce: Myint Swe Khine, Science and Mathematics Education Centre, Curtin Universi-ty, Perth, Australia.Email: [email protected]
Psychometric properties of an inventory to determine the factors that affect students’ attitudes toward mathematics
Myint Swe Khine1* and Ernest Afari2
1Curtin University, Perth, Australia2Petroleum Institute, Abu Dhabi, United Arab Emirates
(Received November 12, 2013; Accepted April 6, 2014)
ABSTRACT: This study explored the reliability and validity of the inventory that measures attitudes toward mathematics among middle school students. The original version of Attitudes toward Mathematics Inventory (ATMI) was adapted and translated into Arabic language and administered to middle school students in the United Arab Emirates (UAE). The data were analysed to establish the reliability and construct validity as well as the factor structure of the instrument. Our results showed that four factor model was the best fit using confirmatory factor analysis. The findings from this study indicated that the translated version of the inventory can be effectively used in Arabic speaking countries.Keywords: math attitudes, reliability, validity, factor analysis.
Propiedades psicométricas de un inventario para determinar los factores que afectan a las actitudes de los estudiantes hacia las matemáticas
Resumen: El presente artículo analiza la fiabilidad y validez del inventario que mide las actitudes hacia las matemáticas entre los estudiantes de secundaria. La versión original de las actitudes hacia la Matemática Inventory (ATMI) fue adap-tado y traducido al árabe y se administró a los estudiantes de secundaria en los Emiratos Árabes Unidos. Los datos se analizaron para establecer la fiabilidad y validez de constructo, así como el factor de estructura del instrumento. Nuestros resultados muestran que el modelo de cuatro factores fue el mejor ajuste en el análisis factorial confirmatorio. Los resultados de este estudio indican que la versión traducida del inventario puede ser utilizado con eficacia en países de habla árabe.Palabras clave: actitudes hacia las matemáticas, fiabilidad, validez, análisis fac-torial.
INTRODUCTION
The effects of attitudes towards science and mathematics have been of inter-est to educators around the world. Numerous research studies to explore how the attitudes affect academic achievement and outcome variables have been conduc-ted in various contexts over the past 40 years. However the progress in this area has been stagnated by the limited understanding of the conception about attitude, constituents, and inability to determine the multitude of variables that made up
1-15

KhINE Et al. Psychometric properties of the arabic version of atMI2
© Psy, Soc, & Educ, 2014, vol.6, Nº1
such a concept (Khine & Saleh, 2011). Ruffell, Mason and Allen (1998) studied attitude to mathematics and noted
that attitude is a complex notion, and it is not a quality of an individual. The li-terature is filled with many attempts in defining and searching for the constructs that make attitudes. Some are controversial and some provides conflicting re-sults. Past research on mathematics anxiety or attitudes toward mathematics has identified differences between countries (Zan et al, 2006; Hannula, 2012).
Singh et al. (2002) reiterate the fact that although cognitive abilities of stu-dents and their home backgrounds are important factors for achievement, other affective variables such as attitudes and motivation plays an important role. In addition students’ interaction with their peers also is a factor that can affect their attitudes toward a subject (Fishbein & Ajzen, 1975).
McLeod (1994) proposed that an attitude towards Mathematics is a positive or negative emotional disposition towards Mathematics. According to Hart (1989), attitude towards Mathematics comprises three components: an emotional response to Mathematics (positive or negative), a conception about Mathematics, and a behavioural tendency with regard to Mathematics. Ma and Kishor (1997, p. 27) defined attitudes towards Mathematics as “an aggregated measure of a liking or disliking of mathematics, a tendency to engage in or avoid mathematical activities, a belief that one is good or bad at Mathematics, and a belief that Mathematics is useful or useless”. It is with this in mind that the definition for attitude towards mathematics, used for our study, is the feelings that a person has about Mathematics, based on their beliefs about Mathematics.
To examine the effect of attitudes, achievement and gender on mathematics education, Arslan et al (2012) conducted a study with 197 middle school stu-dents using Attitude Survey toward Mathematics. The findings of this research indicated that attitude of students’ towards mathematics and achievement scores in Mathematics have a significant difference in terms of their gender and grade levels. Female students revealed more positive attitudes towards Mathematics than male students and also had higher grades than male students.
Chamberlin (2010) reviewed instruments that accessed the influence of affec-tive variables in mathematics and elaborated on different instruments that measu-re mathematics anxiety, attitude, value, enjoyment, self-efficacy and motivational factors. In his opinion in the fields of educational psychology and mathematics education there have been many studies on affective measurements, but practical application and true value are yet to be materialised. The importance of affec-tive variables in mathematics learning has also been highlighted by Ledens et al (2010). They stated that mathematical achievement is not only a function of cognitive factors but also the affective factors such as motivation, self-efficacy beliefs and attitudes. In the same vein, Popham (2005) asserted that students’ affective dispositions such as attitude, value, and interest are powerful predictors of students’ subsequent behaviour. He described that students should develop positive concepts of themselves as learners and they should become more inter-ested in the subject they study (p.84.) He concluded that by collecting evidence

3
© Psy, Soc, & Educ, 2014, vol.6, Nº1
KhINE Et al. Psychometric properties of the arabic version of atMI
of important affective changes in students’ behaviour overtime, teachers can gain important information about the students. These will in turn be useful for desig-ning relevant instructional strategies.
Historically the work by Aiken (1970) focused on the relationship between attitude and achievement in mathematics and noted that these two variables have reciprocal influence, in that attitudes affect achievement and achievement in turns affect attitudes. In the last decade non-cognitive affective variables that can affect mathematics learning have been examined by various researchers. Since then, there has been myriad of instruments developed and tested in various con-texts.
In essence, most of the instruments used Likert-type response where students answer to the extent of agreement to the questions. Whitin (2007) reported a new way of measuring attitudes toward mathematics among young children. The instrument requires to complete an open-ended statement rather than responding to the scale. One of the questions include “Math is easy when ….”. She conclu-ded that information gained from the survey will be helpful for teachers to make better instructional plans.
Akin and Kurbanoglu (2011) examined the relationships between mathe-matics anxiety, attitudes and self-efficacy among university students in Turkey. When correlation analysis was used, mathematics anxiety was found to be nega-tively related to positive attitudes and self-efficacy, positively to negative attitu-des. In Champion et al (2011) study, students’ attitudes towards mathematics was examined in relation to the careers perspectives. The results showed that while students held mostly positive attitudes about the value of mathematics in their career, business students expressed more positive attitudes than those reported by non-business students.
Using secondary data set from Trends in International Mathematics and Science Study (TIMSS), Mullis et al. (2008) and Helal (2009) examined and interpreted the results on how 4th and 8th grades students in Dubai schools perfor-med in international comparative studies in 2007. About students’ affect towards mathematics, they found that among 4th grade students, 81% gave a highly po-sitive response to statements related to their affection for mathematics. This fi-gure dropped to 54% at the 8th grade level. More primary school students in the UAE appeared to be enjoying the study of mathematics than secondary students. Nearly 25% of all 8th grade students indicated that they dislike mathematics or find it boring. The study also indicated that 8th grade students in the UAE hold learning mathematics in lower grade than majority of the Arab countries. This may be due to the existence of poor-quality instruction and learning in some schools within the UAE educational system, and the fact that, on the whole, tea-ching methods are based on rote memorization (Gaad, Arif & Scott, 2006; Shaw, Badri, & Hukul, 1995).
The study also indicated that 8th grade students in the UAE showed less con-fidence in their mathematical abilities than students in 4th grade. Almost 68% of 4th grade students maintained a high confidence in learning mathematics. At the
KhINE Et al. Psychometric properties of the arabic version of atMI4
© Psy, Soc, & Educ, 2014, vol.6, Nº1
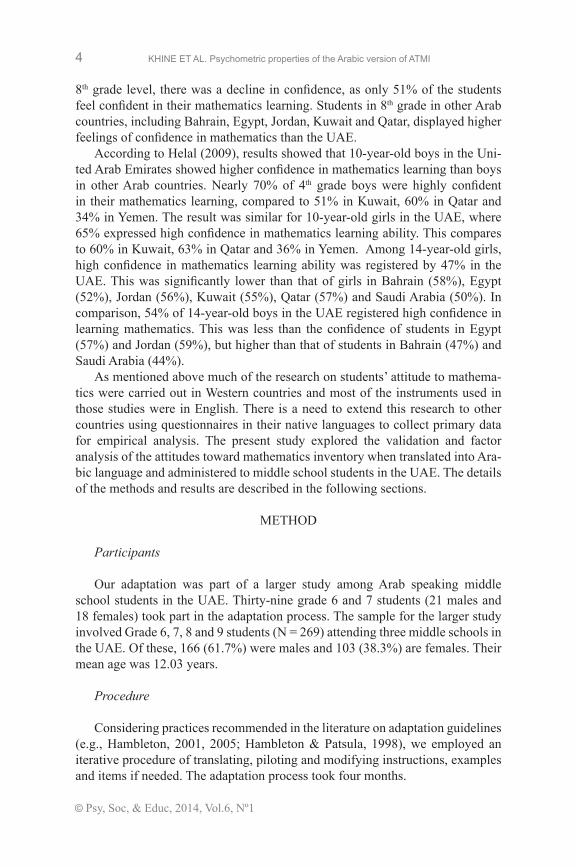
8th grade level, there was a decline in confidence, as only 51% of the students feel confident in their mathematics learning. Students in 8th grade in other Arab countries, including Bahrain, Egypt, Jordan, Kuwait and Qatar, displayed higher feelings of confidence in mathematics than the UAE.
According to Helal (2009), results showed that 10-year-old boys in the Uni-ted Arab Emirates showed higher confidence in mathematics learning than boys in other Arab countries. Nearly 70% of 4th grade boys were highly confident in their mathematics learning, compared to 51% in Kuwait, 60% in Qatar and 34% in yemen. The result was similar for 10-year-old girls in the UAE, where 65% expressed high confidence in mathematics learning ability. This compares to 60% in Kuwait, 63% in Qatar and 36% in yemen. Among 14-year-old girls, high confidence in mathematics learning ability was registered by 47% in the UAE. This was significantly lower than that of girls in Bahrain (58%), Egypt (52%), Jordan (56%), Kuwait (55%), Qatar (57%) and Saudi Arabia (50%). In comparison, 54% of 14-year-old boys in the UAE registered high confidence in learning mathematics. This was less than the confidence of students in Egypt (57%) and Jordan (59%), but higher than that of students in Bahrain (47%) and Saudi Arabia (44%).
As mentioned above much of the research on students’ attitude to mathema-tics were carried out in Western countries and most of the instruments used in those studies were in English. There is a need to extend this research to other countries using questionnaires in their native languages to collect primary data for empirical analysis. The present study explored the validation and factor analysis of the attitudes toward mathematics inventory when translated into Ara-bic language and administered to middle school students in the UAE. The details of the methods and results are described in the following sections.
METHOD
Participants
Our adaptation was part of a larger study among Arab speaking middle school students in the UAE. Thirty-nine grade 6 and 7 students (21 males and 18 females) took part in the adaptation process. The sample for the larger study involved Grade 6, 7, 8 and 9 students (N = 269) attending three middle schools in the UAE. Of these, 166 (61.7%) were males and 103 (38.3%) are females. Their mean age was 12.03 years.
Procedure
Considering practices recommended in the literature on adaptation guidelines (e.g., Hambleton, 2001, 2005; Hambleton & Patsula, 1998), we employed an iterative procedure of translating, piloting and modifying instructions, examples and items if needed. The adaptation process took four months.
5
© Psy, Soc, & Educ, 2014, vol.6, Nº1
KhINE Et al. Psychometric properties of the arabic version of atMI
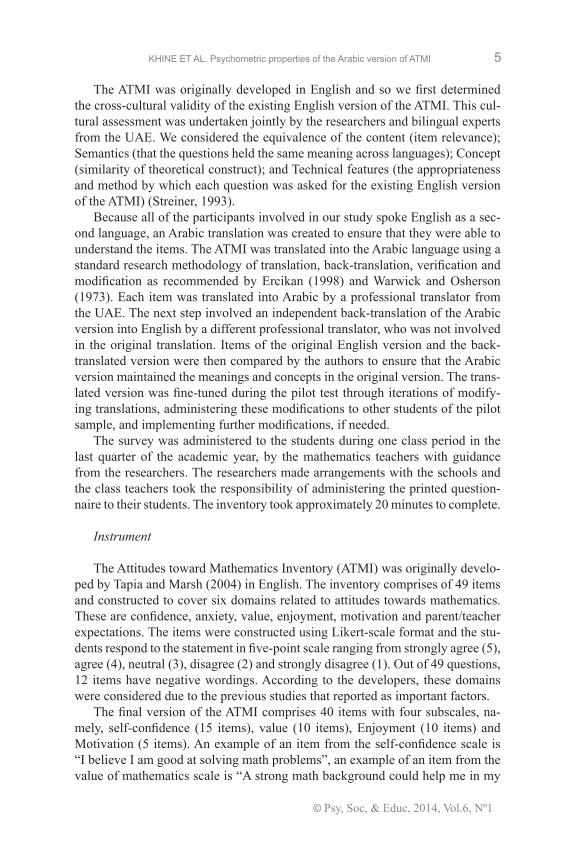
The ATMI was originally developed in English and so we first determined the cross-cultural validity of the existing English version of the ATMI. This cul-tural assessment was undertaken jointly by the researchers and bilingual experts from the UAE. We considered the equivalence of the content (item relevance); Semantics (that the questions held the same meaning across languages); Concept (similarity of theoretical construct); and Technical features (the appropriateness and method by which each question was asked for the existing English version of the ATMI) (Streiner, 1993).
Because all of the participants involved in our study spoke English as a sec-ond language, an Arabic translation was created to ensure that they were able to understand the items. The ATMI was translated into the Arabic language using a standard research methodology of translation, back-translation, verification and modification as recommended by Ercikan (1998) and Warwick and Osherson (1973). Each item was translated into Arabic by a professional translator from the UAE. The next step involved an independent back-translation of the Arabic version into English by a different professional translator, who was not involved in the original translation. Items of the original English version and the back-translated version were then compared by the authors to ensure that the Arabic version maintained the meanings and concepts in the original version. The trans-lated version was fine-tuned during the pilot test through iterations of modify-ing translations, administering these modifications to other students of the pilot sample, and implementing further modifications, if needed.
The survey was administered to the students during one class period in the last quarter of the academic year, by the mathematics teachers with guidance from the researchers. The researchers made arrangements with the schools and the class teachers took the responsibility of administering the printed question-naire to their students. The inventory took approximately 20 minutes to complete.
Instrument
The Attitudes toward Mathematics Inventory (ATMI) was originally develo-ped by Tapia and Marsh (2004) in English. The inventory comprises of 49 items and constructed to cover six domains related to attitudes towards mathematics. These are confidence, anxiety, value, enjoyment, motivation and parent/teacher expectations. The items were constructed using Likert-scale format and the stu-dents respond to the statement in five-point scale ranging from strongly agree (5), agree (4), neutral (3), disagree (2) and strongly disagree (1). Out of 49 questions, 12 items have negative wordings. According to the developers, these domains were considered due to the previous studies that reported as important factors.
The final version of the ATMI comprises 40 items with four subscales, na-mely, self-confidence (15 items), value (10 items), Enjoyment (10 items) and Motivation (5 items). An example of an item from the self-confidence scale is “I believe I am good at solving math problems”, an example of an item from the value of mathematics scale is “A strong math background could help me in my

KhINE Et al. Psychometric properties of the arabic version of atMI6
© Psy, Soc, & Educ, 2014, vol.6, Nº1
professional life”. An example from the Enjoyment scale is “I am happier in a math class than in any other class. Also an example of the motivation scale is “I am willing to take more than the required amount of mathematics.’
DATA ANALySIS
Descriptive Statistics
The descriptive statistics of the ATMI items are shown in Appendix 1. The mean scores ranged from 2.60 to 4.40. All the standard deviations (SD) were above 1.00 (1.749 to 1.996), indicating a large spread of item scores around the mean. As recommended by Tabachnick and Fidell (2007), the data was examined for multivariate normality, multicollinearity and outliers before assessing the fac-tor structure of the responses. The bivariate correlations, tolerance, and variance inflation values indicated that neither bivariate nor multivariate multicollinearity was present. Because maximum likelihood estimation assumes multivariate nor-mality of the observed variables, the data were examined with respect to univa-riate and multivariate normality (Teo & Lee, 2012).
All the items of the ATMI showed a skew or kurtosis value less than the cut-offs of │3│or │8│respectively, as recommended by Kline (2010), and this supported the univariate normality in the items. The value of the Mardia’s coeffi-cient (a standard measure of multivariate normality) obtained in this study, using AMOS 22, was 235.785. This value, as required, was less than [p (p + 2)] where p = the number of observed variables in the model; 40(42) = 1680 (Raykov & Marcoulides, 2008). Therefore the requirement of multivariate normality was satisfied and the data was considered adequate for confirmatory factor analysis.
Exploratory approach
To examine the validity of the ATMI when translated into Arabic and used at the middle school level in the UAE, principal axis factoring with oblique rotation was used. We examined the suitability of the data for exploratory factor analysis (EFA) with the Kaiser-Myer-Olkin (KMO) measure of sampling adequacy and the Bartlett test of sphericity. As suggested by Tabachnick and Fidell (2007), cri-teria for suitability are KMO > .8 and a p-value for Bartlett’s χ2 of less than .01.
A scree plot was also inspected, and an item was considered to load on a factor if it had a factor loading in the pattern matrix greater than .3, and did not load on any other component.
Confirmatory approach
Factor structure of the ATMI was examined by confirmatory factor analysis (CFA) using AMOS 22. The fit of models were evaluated by Chi-square statistics and fit indices including the Comparative Fit Index (CFI: Bentler, 1990), Tuker-

7
© Psy, Soc, & Educ, 2014, vol.6, Nº1
KhINE Et al. Psychometric properties of the arabic version of atMI
Lewis Index (TLI: Bentler & Bonett, 1980). The CFI and TLI are both fit indices, ranging from 0 (indicating poor fit) to 1 (indicating a perfect fit). For these two indices, a value greater than .90 indicates a psychometrically accepted fit to the data. A value greater than or equal to .95 indicate a good fit (Hu & Bentler, 1999). Root mean square error of approximation (RMSEA) is one of absolute fit indices and a measure of discrepancy between the observed and model implied covarian-ce matrices adjusted for degree of freedom. The values of RMSEA of .05 or less indicate close fit, less than .08 indicate a reasonable fit, less than .10 indicate a mediocre fit, and greater than .10 indicate an unacceptable fit (Brown & Cudeck, 1993). Another fit index commonly referred to is the Standardized root mean square residual (SRMR). A value of SRMR less than .05 indicate a well-fitting model (Byrne, 2010). One of the most common fit index is Chi-squared statistics (χ2). As suggested by Hu and Bentler, 1999, χ2 is strongly dependent on sample size, χ2/df ratios instead of probability values are presented for each model. As recommended by Byrne (2010) and Tanaka, 1993, χ2/df ratios ranging from 2 to 5 are considered to be adequate model fit. We also used the chi-squared change (∆χ2) statistics (Hu & Bentler, 1999) to test for differences in fit between the 3-factor and 4-factor models.
RESULTS
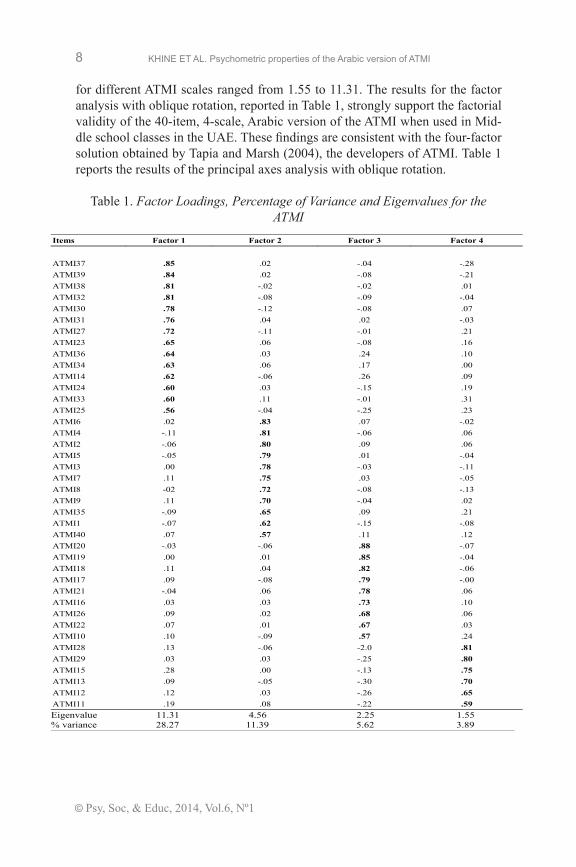
The inter-item correlations between the ATMI items were adequate for fac-tor analysis (KMO = .912; Bartlett’s χ2 = 5171.98, p < .000). Item and factor analyses were conducted to identify those items whose removal would improve the internal consistency reliability and factorial validity of the ATMI scales. Principal axis factoring with oblique rotation was used because one can assume that the scales of the ATMI are somewhat related (Coakes & Ong, 2010). Prior to conducting the factor analysis, the assumptions which underlie the application of the principal axis factor analysis, including the proportion of sampling units to variables and the sample being selected on the basis of representation, were considered. Factor analysis (Table 1) reports the structure for the ATMI comprising 40 items in the 4 factors. The two criteria used for retaining any item were that it must have a factor loading of at least 0.40 on its own scale and less than 0.40 on each of the other three ATMI factors.
Item analysis indicated that, all the 40 items had sizeable item-remainder correlations (i.e. correlations between a certain item and the rest of the scale excluding that item). Table 1 reports the factor loadings for the sample of 269 students for the Arabic version of the ATMI.
All the 40 items of the ATMI had a loading of at least 0.40 on their a priori scale and no other scale. The percentage of variance and the eigenvalue associ-ated with each factor are recorded at the bottom of Table 1. The percentage of variance for different factors ranged between 3.89% and 28.27%, with the total percentage of variance accounted for by the 40 items being 49.17%. The largest contribution to variance was for the Factor 1 scale (28.27%). The eigenvalues
KhINE Et al. Psychometric properties of the arabic version of atMI8
© Psy, Soc, & Educ, 2014, vol.6, Nº1
21
Table 1. Factor loadings, percentage of variance and eigenvalues for the ATMI
Items Factor 1 Factor 2 Factor 3 Factor 4
ATMI37 .85 .02 -.04 -.28
ATMI39 .84 .02 -.08 -.21
ATMI38 .81 -.02 -.02 .01
ATMI32 .81 -.08 -.09 -.04
ATMI30 .78 -.12 -.08 .07
ATMI31 .76 .04 .02 -.03
ATMI27 .72 -.11 -.01 .21
ATMI23 .65 .06 -.08 .16
ATMI36 .64 .03 .24 .10
ATMI34 .63 .06 .17 .00
ATMI14 .62 -.06 .26 .09
ATMI24 .60 .03 -.15 .19
ATMI33 .60 .11 -.01 .31
ATMI25 .56 -.04 -.25 .23
ATMI6 .02 .83 .07 -.02
ATMI4 -.11 .81 -.06 .06
ATMI2 -.06 .80 .09 .06
ATMI5 -.05 .79 .01 -.04
ATMI3 .00 .78 -.03 -.11
ATMI7 .11 .75 .03 -.05
ATMI8 -02 .72 -.08 -.13
ATMI9 .11 .70 -.04 .02
ATMI35 -.09 .65 .09 .21
ATMI1 -.07 .62 -.15 -.08
ATMI40 .07 .57 .11 .12
ATMI20 -.03 -.06 .88 -.07
ATMI19 .00 .01 .85 -.04
ATMI18 .11 .04 .82 -.06
ATMI17 .09 -.08 .79 -.00
ATMI21 -.04 .06 .78 .06
ATMI16 .03 .03 .73 .10
ATMI26 .09 .02 .68 .06
ATMI22 .07 .01 .67 .03
ATMI10 .10 -.09 .57 .24
ATMI28 .13 -.06 -2.0 .81
ATMI29 .03 .03 -.25 .80
ATMI15 .28 .00 -.13 .75
ATMI13 .09 -.05 -.30 .70
ATMI12 .12 .03 -.26 .65
ATMI11 .19 .08 -.22 .59
Eigenvalue 11.31 4.56 2.25 1.55
% variance 28.27 11.39 5.62 3.89
Table 1. Factor Loadings, Percentage of Variance and Eigenvalues for the ATMI
for different ATMI scales ranged from 1.55 to 11.31. The results for the factor analysis with oblique rotation, reported in Table 1, strongly support the factorial validity of the 40-item, 4-scale, Arabic version of the ATMI when used in Mid-dle school classes in the UAE. These findings are consistent with the four-factor solution obtained by Tapia and Marsh (2004), the developers of ATMI. Table 1 reports the results of the principal axes analysis with oblique rotation.

9
© Psy, Soc, & Educ, 2014, vol.6, Nº1
KhINE Et al. Psychometric properties of the arabic version of atMI
Convergent validity
We examined the convergent validity of the 40 items of the ATMI. The con-vergent validity was estimated by composite reliability and average variance extracted. The interpretation of the composite reliability is similar to that of Cronbach’s alpha, except that it also takes into account the actual factor loadings rather than assuming that each item is equally weighted in the composite load determination (Wang, Wu & Wang, 2009).
The results (Table 1) indicate that all the factor loadings of the 40-item ATMI met the minimum requirement of .5 suggested by Hair, Black, Babin and Ander-son (2010), ranging from .56 to .88. This indicated that convergent validity is demonstrated at the item level.
The results (Table 2) of the composite reliability of each construct indicated that all of the four factors exceeded the minimum reliability value of .7 as sugges-ted by Fornell and Larcker (1981), ranging from .87 to .93. The final criterion for the convergent validity was a measure of average variance extracted (AvE) for each factor. The AvE were all above the recommended .5 level (Fornell & Larcker, 1981; Hair, Anderson, Tatham & Black, 1992; Nunnally & Bernstein, 1994), which means that more than one-half of the variance observed in the items was accounted for by their hypothesised factors (Wang et al., 2009). Therefore all factors in the measurement model had adequate convergent validity. 22
Table 2. Composite reliability and average variance extracted and inter-correlations of the
variables and descriptive statistics.
Construct CR AVE Factor 1 Factor 2 Factor 3 Factor 4
Factor 1 .93 .51 (.71 )
Factor 2 .93 .56 .15 (.75 )
Factor 3 .92 .57 .63** -.07 (.75 )
Factor 4 .87 .52 .68** -.02 .62** (.72 )
Mean 51.1 33.59 37.15 24.00
SD 17.53 13.00 12.17 7.44
**p< 0.01
Average variance extracted (AVE) is computed by ∑λ2 / ∑λ2 + ∑ (1 – λ2);
Composite reliability (CR) is computed by (∑λ)2 / (∑λ)2 + ∑ (1 – λ2), where λ = standardized
loadings. The bold elements in the main diagonal are the square roots of AVE and the off-
diagonal elements are the shared variance.
Table 2. Composite Reliability and Average Variance Extracted and Inter-Co-rrelations of the Variables and Descriptive Statistics
Discriminant validity
Discriminant validity assesses the degree to which the constructs differ from each other. We assessed the discriminant validity by comparing the square root of the average variance extracted for a given construct and all the other constructs. As suggested by Barclay, Higgins and Thompson (1995), the square root of the average variance extracted (AvE) should be greater than the inter-construct co-rrelation. The results in Table 2 confirm that discriminant validity was achieved.
KhINE Et al. Psychometric properties of the arabic version of atMI10
© Psy, Soc, & Educ, 2014, vol.6, Nº1
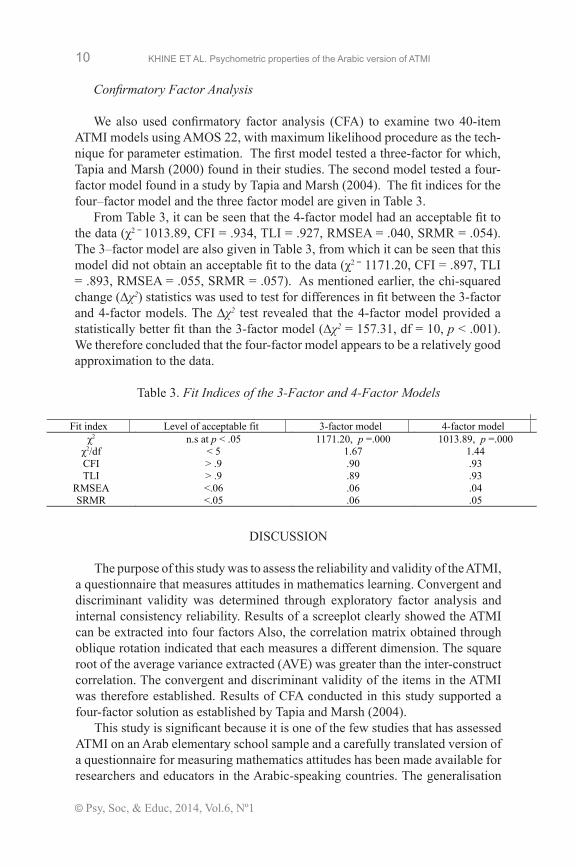
Confirmatory Factor Analysis
We also used confirmatory factor analysis (CFA) to examine two 40-item ATMI models using AMOS 22, with maximum likelihood procedure as the tech-nique for parameter estimation. The first model tested a three-factor for which, Tapia and Marsh (2000) found in their studies. The second model tested a four-factor model found in a study by Tapia and Marsh (2004). The fit indices for the four–factor model and the three factor model are given in Table 3.
From Table 3, it can be seen that the 4-factor model had an acceptable fit to the data (χ2 = 1013.89, CFI = .934, TLI = .927, RMSEA = .040, SRMR = .054). The 3–factor model are also given in Table 3, from which it can be seen that this model did not obtain an acceptable fit to the data (χ2 = 1171.20, CFI = .897, TLI = .893, RMSEA = .055, SRMR = .057). As mentioned earlier, the chi-squared change (∆χ2) statistics was used to test for differences in fit between the 3-factor and 4-factor models. The ∆χ2 test revealed that the 4-factor model provided a statistically better fit than the 3-factor model (∆χ2 = 157.31, df = 10, p < .001). We therefore concluded that the four-factor model appears to be a relatively good approximation to the data. 23
Table 3. Fit indices of the 3-factor and 4-factor models
Fit index Level of acceptable fit 3-factor model 4-factor model
χ2 n.s at p < .05 1171.20, p =.000 1013.89, p =.000
χ2/df < 5 1.67 1.44
CFI > .9 .90 .93
TLI > .9 .89 .93
RMSEA <.06 .06 .04
SRMR <.05 .06 .05
Table 3. Fit Indices of the 3-Factor and 4-Factor Models
DISCUSSION
The purpose of this study was to assess the reliability and validity of the ATMI, a questionnaire that measures attitudes in mathematics learning. Convergent and discriminant validity was determined through exploratory factor analysis and internal consistency reliability. Results of a screeplot clearly showed the ATMI can be extracted into four factors Also, the correlation matrix obtained through oblique rotation indicated that each measures a different dimension. The square root of the average variance extracted (AvE) was greater than the inter-construct correlation. The convergent and discriminant validity of the items in the ATMI was therefore established. Results of CFA conducted in this study supported a four-factor solution as established by Tapia and Marsh (2004).
This study is significant because it is one of the few studies that has assessed ATMI on an Arab elementary school sample and a carefully translated version of a questionnaire for measuring mathematics attitudes has been made available for researchers and educators in the Arabic-speaking countries. The generalisation

11
© Psy, Soc, & Educ, 2014, vol.6, Nº1
KhINE Et al. Psychometric properties of the arabic version of atMI
of the results to other populations should be made with caution as this study in-volved a relatively small number of students and classes. The UAE is a country with seven emirates (states) and no sample was drawn from any of the other six emirates. So the representativeness of the sample could be limiting factor in that, compared to the general elementary school population in the UAE, our sample could not be representative of the full range of elementary schools and students. It is therefore unclear whether our findings would apply to other elementary schools in the UAE.
The study has shown that the ATMI can be used to determine the mathematics attitudes of younger sample with high reliability and validity. This study contri-butes to the existing literature on the attitude measurements and the use of self-report questionnaires to determine the attitudes of students towards mathematics.
ACKNOWLEDGEMENT
Grateful acknowledgement is made to Martha Tapia and George Marsh II for permission to use the inventory in this study.
REFERENCES
Aiken, L. R. (1970). Attitudes toward mathematics. Review of Educational Re-search, 40, 551-596.
Akin, A., and Kurbanoglu, I. N. (2011). The relationships between math anxiety, math attitudes and self-efficacy: A structural equation model. Studia Psycho-logica, 53, 263-273.
Arslan, H., Canli, M., Sabo, H. M. (2012). A research of the effect of attitude, achievement and gender on mathematics education. Acta Didactica Napo-censia, 5, 45-52.
Barclay, D., Higgins, C., Thompson, R. (1995). The partial least squares (PLS) approach to causal modeling: Person computer adoption and uses as an illus-tration. Technology Studies, 2, 285−309.
Bentler, P. M. (1990). Comparative fit indexes in structural models. Psychologi-cal Bulletin, 107, 238-246.
Bentler, P. M., Bonett, D. G. (1980). Significance tests and goodness of fit in the analysis of covariance structures. Psychological Bulletin, 88, 588-606.
Brown, M. W., Cudeck, R. (1993). Alternative ways of assessing model fit. In K. A. Bollen and J. S. Long (Eds.), Testing Structural Equation Models (pp. 136–162). Newbury park, CA: Sage.
Byrne, B. M. (2010). Structural equation modeling with AMOS: Basic concepts, applications, and programming. New york: Routledge.
Chamberlin, S. A. (2010). A review of instruments created to assess affect in mathematics. Journal of Mathematics Education, 3, 167–182.
Champion, J., Parker, F., Mendoza-Spencer, B., Wheller, A. (2011). College al-gebra students’ attitudes toward mathematics in their careers. International

KhINE Et al. Psychometric properties of the arabic version of atMI12
© Psy, Soc, & Educ, 2014, vol.6, Nº1
Journal of Science and Mathematics Education, 9, 1093-1110.Coakes, S., and Ong, C. (2010). SPSS: Analysis without anguish using SPSS
version 18.0 for Windows. Milton, Queensland: John Wiley.Ercikan, K. (1998). Translation effects in international assessments. Internation-
al Journal of Educational Research, 29, 543−553.Fishbein, M., and Ajzen, I. (1975). Belief, attitude, intention and behaviour: An introduction to theory and research. Reading, MA: Addison-Wesley.Fornell, C., Larcker, D. F. (1981). Evaluating structural equation models with
unobservable variables and measurement error. Journal of Marketing Re-search, 18, 39−50.
Gaad, E., Arif, M., and Scott, F. (2006). Systems analysis of the UAE education system. International Journal of Educational Management, 20, 291–303.
Hair, J. T., Anderson, R. E., Tatham, R. L. and Black, W. C. (1992). Multivariate data analysis with readings (3rd ed.). New york: Macmillan.
Hair, J. R., J. E.. Black, W. C., Babin, W. C., Babin, B. J., Anderson, R. E. (2010). Multivariate data analysis (7th Ed.). New Jersey: Prentice-Hall.
Hambleton, R. K. (2001). The next generation of the ITC Test Translation and Adaptation Guidelines. European Journal of Psychological Assessment, 17, 164−172.
Hambleton, R. K. (2005). Issues, designs, and technical guidelines for adapting tests into multiple languages and cultures. In R. K. Hambleton, P. F. Merenda, & C. D. Spielberger (Eds.), Adapting educational and psychological tests for cross-cultural assessment (pp. 3−38). Mahwah, NJ: Lawrence Erlbaum Associates.
Hambleton, R. K., and Patsula, L. (1998). Adapting tests for use in multiple lan-guages and cultures. Social Indicators Research, 45, 153−171.Hannula, M. S. (2012). Exploring new dimensions of mathematics-related
affect: embodied and social theories. Research in Mathematics Education, 14(2), 137-161.Hart, L. (1989). Describing the affective domain: Saying what we mean. In D. B.
McLeod and v. M. Adams (Eds), Affect and Mathematical Problem-Solving: A New Perspective (pp. 37-45). New york: Springer-verlag.
Helal, M. (2009). Benchmarking education: Dubai and the trends in mathematics and science study 2007. Retrieved April 20, 2012, from http://www.dsg.ae/en/Publication/Pdf_Ar/Benchmarking%20Education.pdf
Hu, L.T., Bentler, P. M. (1999). Cutoff criteria for fit indexes in covariance structure analysis: Conventional criteria versus new alternatives. Structural Equation Modeling, 6, 1–55.
Khine, M. S., Saleh, I. M. (2011). Attitude research in science education: Loo-king back, looking forward. In M.S. Khine & I. Saleh. (Eds.) Attitude Re-search in Science Education: Classic and Contemporary Measurements (pp. 291-296). Charlotte, NC: Information Age Publishing.
Ma, X., and Kishor, N. (1997). Assessing the relationship between attitude towards mathematics and achievement in mathematics: A meta-analysis.

13
© Psy, Soc, & Educ, 2014, vol.6, Nº1
KhINE Et al. Psychometric properties of the arabic version of atMI
Journal for Research in Mathematics Education, 28, 26-47.Mcleod, B.D. (1994). Research on affect and mathematics learning in the JRME:
1970 to the present. Journal for Research in Mathematics Education, 25(6), 637-647.
Mullis, I.v.S., Martin, M.O., and Foy, P. (2008). TIMSS 2007 International Re-port: Findings from IEA’s Trends in International Mathematics and Science Study at the Fourth and Eighth Grades. Chestnut Hill, MA: TIMSS & PIRLS International Study Center, Boston College.
Nunnally, J. C., Bernstein, I. H. (1994). Psychometric theory (3rd Ed.). New york: McGraw-Hill.
Popham, W. J. (2005). Students’ Attitudes Count. Educational Leadership, 62(5), 84.
Retrieved September 16, 2013 from http://www.ascd.org/publications/ educatio-nal-Leadership/feb05/vol62/num05/students’ –attitudes-count.aspx
Raykov, T., & Marcoulides, G. A. (2008). An introduction to applied multivaria-te analysis. New york: Taylor and Francis.
Ruffell, M., Mason, J., Allen, B. (1998). Studying attitude to mathematics. Edu-cational Studies in Mathematics, 35, 1-18.
Shaw, K. E., Badri, A. A. M. A., & Hukul, A. (1995). Management concerns in United
Arab Emirates state schools. International Journal of Educational Management, 9(4), 8–13.
Singh, K., Granville, M., & Dika, S. (2002). Mathematics and science achieve-ment: Effects of motivation, interest, and academic engagement. The Journal of Educational Research, 95(6), 323–332.
Streiner D (1993). A checklist for evaluating the usefulness of rating scales. Can J Psychiatry, 38, 140–148.
Tabachnick, B. G., Fidell, L. S. (2007). Using multivariate statistics (5th Ed.). Boston: Pearson Education.
Tanaka, J. S. (1993). Multifaceted conceptions of fit in structural equation mo-dels. In J. A. Bollen & J. S. Long (Eds.), Testing structural equation models (pp. 10–39). Newbury Park, CA: Sage.
Tapia, M., Marsh, G. (2000). Attitudes toward mathematics instrument: An in-vestigation with middle schools students. Paper presented at the annual mee-ting of the Mid-South Educational Research Association, Bowling Green, Kentucky.
Tapia, M., Marsh, G. (2004). An instrument to measure mathematics attitudes. Academic Exchange Quarterly, 8, 1–8.
Teo, T., and Lee, C. B. (2012). Assessing the factorial validity of the Metacogni-tive Awareness Inventory (MAI) in an Asian Country: A confirmatory factor analysis. The International Journal of Educational and Psychological As-sessment, 10(2), 92–103.
Wang, y-S., Wu, M-C., and Wang, H-y. (2009). Investigating the determinants and age and gender differences in the acceptance of mobile learning. British

KhINE Et al. Psychometric properties of the arabic version of atMI14
© Psy, Soc, & Educ, 2014, vol.6, Nº1
Journal of Educational Technology, 40, 92-118.Warwick, D. P., & Osherson, S. (1973). Comparative analysis in the social sci-
ences.In D. P. Warwick and S. Osherson (Eds.), Comparative research methods: An
overview (pp. 3−41). Englewood Cliffs, NJ: Prentice-Hall.Whitin, P. E. (2007). The Mathematics Survey: A Tool for Assessing Attitudes
and Dispositions. Teaching Children Mathematics, 13, 426-433.Zan, R., Brown, L., Evans, J., Hannula, M. S. (2006). Affect in mathematics edu-
cation: An introduction. Educational Studies in Mathematics, 63,113-121.
3
Appendix 1. Descriptive Statistics of the Items in the ATMI
Item Mean SD Skewness Kurtosis 1 Mathematics is a very worthwhile and necessary
subject. 4.09 1.944 .20 -1.40
2 I want to develop my mathematics skills.
4.28 1.841 .51 -1.28
3 I get a great deal of satisfaction out of mathematics experiments.
4.09 1.837 .20 -1.38
4 Mathematics helps develop the mind and teaches a person to think.
4.37 1.778 .33 -1.33
5 Mathematics is important in everyday life.
4.42 1.876 .48 -1.28
6 Mathematics is one of the most important subjects for people to study.
4.31 1.914 .36 -1.28
7 High school mathematics courses would be very helpful no matter what I decide to study.
3.87 1.854 .71 -1.00
8 I can think of many ways that I use mathematics outside of school.
3.75 1.905 .17 -1.42
9 Mathematics is one of my most dreaded subjects.
3.20 1.890 .49 -1.15
10 My mind goes blank and I am unable to think clearly when studying mathematics.
3.20 1.867 -.32 -1.49
11 Studying mathematics makes me feel nervous.
3.06 1.867 -.08 -1.24
12 Mathematics makes me feel uncomfortable.
2.95 1.891 -.22 -1.18
13 I am always under a terrible strain in a mathematics class.
2.97 1.829 -.22 -1.36
14 When I hear the word mathematics, I have a feeling of dislike.
2.94 1.951 -.11 -1.37
15 It makes me nervous to even think about having to do a mathematics experiment.
2.60 1.843 -.51 -1.11
16 Mathematics does not scare me at all.
3.96 1.996 -.50 -1.30
17 I have a lot of self-confidence when it comes to mathematics
3.58 1.753 -.65 -1.01
18 I am able to do mathematics experiments without too much difficulty.
3.80 1.749 -.71 -.84
19 I expect to do fairly well in any mathematics class I take.
3.84 1.848 -.81 -.87
20 I am always confused in my mathematics class.
3.28 1.873 -.71 -1.05
21 I feel a sense of insecurity when attempting mathematics.
2.90 1.844 -.27 -1.35
22 I learn mathematics easily.
3.63 1.815 -.15 -1.44
23 I am confident that I could learn advanced mathematics.
3.64 1.757 -.30 -1.27
24 I have usually enjoyed studying mathematics in school.
3.63 1.819 -.10 -1.32
25 Mathematics is dull and boring.
3.20 1.908 -.59 -1.01
26 I like to do new experiments in mathematics.
4.40 1.829 -.49 -1.15
27 I would prefer to do an experiment in mathematics than to write an essay.
4.25 1.822 -.13 -1.40
28 I would like to avoid using mathematics in college.
3.28 1.934 -.70 -.96
29 I really like mathematics.
3.65 1.848 -.61 -1.00
30 I am happier in a mathematics class than in any other class.
3.06 1.743 -.12 -1.40
31 Mathematics is a very interesting subject.
3.65 1.840 .26 -1.23
32 I am willing to take more than the required amount of mathematics.
3.37 1.765 -.11 -1.35
33 I plan to take as much mathematics as I can during my education.
3.45 1.821 -.36 -1.05
34 The challenge of mathematics appeals to me.
3.53 1.767 -.28 -1.31
35 I think studying advanced mathematics is useful.
3.89 1.816 .23 -1.43
36 I believe studying mathematics helps me with problem solving in other areas.
3.74 1.751 -.08 -1.25
37 I am comfortable expressing my own ideas on how to look for solutions to a difficult mathematics experiment.
3.84 1.727 .04 -1.33
38 I am comfortable answering questions in mathematics class.
3.87 1.829 -.03 -1.26
39 A strong mathematics background could help me in my professional life.
4.13 1.804 .14 -1.23
40 I believe I am good at mathematics experiments.
4.14 1.812 .15 -1.50
Appendix 1. Descriptive Statistics of the Items in the ATMI

15
© Psy, Soc, & Educ, 2014, vol.6, Nº1
KhINE Et al. Psychometric properties of the arabic version of atMI
3
Appendix 1. Descriptive Statistics of the Items in the ATMI
Item Mean SD Skewness Kurtosis 1 Mathematics is a very worthwhile and necessary
subject. 4.09 1.944 .20 -1.40
2 I want to develop my mathematics skills.
4.28 1.841 .51 -1.28
3 I get a great deal of satisfaction out of mathematics experiments.
4.09 1.837 .20 -1.38
4 Mathematics helps develop the mind and teaches a person to think.
4.37 1.778 .33 -1.33
5 Mathematics is important in everyday life.
4.42 1.876 .48 -1.28
6 Mathematics is one of the most important subjects for people to study.
4.31 1.914 .36 -1.28
7 High school mathematics courses would be very helpful no matter what I decide to study.
3.87 1.854 .71 -1.00
8 I can think of many ways that I use mathematics outside of school.
3.75 1.905 .17 -1.42
9 Mathematics is one of my most dreaded subjects.
3.20 1.890 .49 -1.15
10 My mind goes blank and I am unable to think clearly when studying mathematics.
3.20 1.867 -.32 -1.49
11 Studying mathematics makes me feel nervous.
3.06 1.867 -.08 -1.24
12 Mathematics makes me feel uncomfortable.
2.95 1.891 -.22 -1.18
13 I am always under a terrible strain in a mathematics class.
2.97 1.829 -.22 -1.36
14 When I hear the word mathematics, I have a feeling of dislike.
2.94 1.951 -.11 -1.37
15 It makes me nervous to even think about having to do a mathematics experiment.
2.60 1.843 -.51 -1.11
16 Mathematics does not scare me at all.
3.96 1.996 -.50 -1.30
17 I have a lot of self-confidence when it comes to mathematics
3.58 1.753 -.65 -1.01
18 I am able to do mathematics experiments without too much difficulty.
3.80 1.749 -.71 -.84
19 I expect to do fairly well in any mathematics class I take.
3.84 1.848 -.81 -.87
20 I am always confused in my mathematics class.
3.28 1.873 -.71 -1.05
21 I feel a sense of insecurity when attempting mathematics.
2.90 1.844 -.27 -1.35
22 I learn mathematics easily.
3.63 1.815 -.15 -1.44
23 I am confident that I could learn advanced mathematics.
3.64 1.757 -.30 -1.27
24 I have usually enjoyed studying mathematics in school.
3.63 1.819 -.10 -1.32
25 Mathematics is dull and boring.
3.20 1.908 -.59 -1.01
26 I like to do new experiments in mathematics.
4.40 1.829 -.49 -1.15
27 I would prefer to do an experiment in mathematics than to write an essay.
4.25 1.822 -.13 -1.40
28 I would like to avoid using mathematics in college.
3.28 1.934 -.70 -.96
29 I really like mathematics.
3.65 1.848 -.61 -1.00
30 I am happier in a mathematics class than in any other class.
3.06 1.743 -.12 -1.40
31 Mathematics is a very interesting subject.
3.65 1.840 .26 -1.23
32 I am willing to take more than the required amount of mathematics.
3.37 1.765 -.11 -1.35
33 I plan to take as much mathematics as I can during my education.
3.45 1.821 -.36 -1.05
34 The challenge of mathematics appeals to me.
3.53 1.767 -.28 -1.31
35 I think studying advanced mathematics is useful.
3.89 1.816 .23 -1.43
36 I believe studying mathematics helps me with problem solving in other areas.
3.74 1.751 -.08 -1.25
37 I am comfortable expressing my own ideas on how to look for solutions to a difficult mathematics experiment.
3.84 1.727 .04 -1.33
38 I am comfortable answering questions in mathematics class.
3.87 1.829 -.03 -1.26
39 A strong mathematics background could help me in my professional life.
4.13 1.804 .14 -1.23
40 I believe I am good at mathematics experiments.
4.14 1.812 .15 -1.50
Copyright © 2022 FDOKUMEN