PSoC® 1 Measuring Frequency
14
www.cypress.com Document No. 001-32359 Rev. *D 1 AN2283 PSoC ® 1 Measuring Frequency Author: Dave Van Ess Associated Project: Yes Associated Part Family: All PSoC ® 1 Families except CY8C20xxx family Software Version: PSoC Designer 5.4 Related Application Notes: AN2099 If you have a question, or need help with this application note, contact the author at [email protected] Many applications require measuring a frequency. Several methods exist to do this, each having particular advantages. A brief review of two commonly used methods is discussed and a hybrid method is introduced. A sample project is presented enabling measurement of frequencies with a typical error of 0.0016% (16 ppm). Contents Introduction ....................................................................... 1 Counting Cycles for a Fixed Time ..................................... 1 Measuring Time for a Single Cycle ................................... 2 A Hybrid Method ............................................................... 3 Selecting Parameters ........................................................ 5 A PSoC Implementation .................................................... 6 Example Hardware ....................................................... 6 Example Software ........................................................ 7 Cycle Capture............................................................... 8 Roughly 16 ppm of Error (App. 25,000 ppm) .................. 10 Building Your Own........................................................... 11 Summary ......................................................................... 12 About the Author ............................................................. 12 Document History ............................................................ 13 Worldwide Sales and Design Support ............................. 14 Introduction Measuring a signal’s frequency is a common mixed-signal application. It may be the tachometer signal from a motor or an analog signal for tone detection. For all cases, it requires determining the rate of the signal’s oscillation. For mechanical systems, this rate is generally known as “revolutions per minute” (rpm). For electrical systems, it is better known as “cycles per second” or Hertz. There are two classic methods for measuring frequency: Measure the number of cycles in a fixed period of time Measure the time of one cycle Each method has advantages and limitations of range and accuracy. They are described as follows. Counting Cycles for a Fixed Time Figure 1 shows the topology for counting the number of cycles in a fixed period. Figure 1. Counting Cycles for a Fixed Time f sample f input Latch Latch + - Counter The counter’s value is latched at sample rate f sample and incremented every cycle of the input signal f input . The double latches enable the old count value to be subtracted
-
Upload
khangminh22 -
Category
Documents
-
view
0 -
download
0
Transcript of PSoC® 1 Measuring Frequency

www.cypress.com Document No. 001-32359 Rev. *D 1
AN2283
PSoC® 1 Measuring Frequency
Author: Dave Van Ess Associated Project: Yes
Associated Part Family: All PSoC® 1 Families except CY8C20xxx family
Software Version: PSoC Designer 5.4
Related Application Notes: AN2099
If you have a question, or need help with this application note, contact the author at [email protected]
Many applications require measuring a frequency. Several methods exist to do this, each having particular
advantages. A brief review of two commonly used methods is discussed and a hybrid method is introduced. A
sample project is presented enabling measurement of frequencies with a typical error of 0.0016% (16 ppm).
Contents
Introduction ....................................................................... 1 Counting Cycles for a Fixed Time ..................................... 1 Measuring Time for a Single Cycle ................................... 2 A Hybrid Method ............................................................... 3 Selecting Parameters ........................................................ 5 A PSoC Implementation .................................................... 6
Example Hardware ....................................................... 6 Example Software ........................................................ 7 Cycle Capture ............................................................... 8
Roughly 16 ppm of Error (App. 25,000 ppm) .................. 10 Building Your Own........................................................... 11 Summary ......................................................................... 12 About the Author ............................................................. 12 Document History ............................................................ 13 Worldwide Sales and Design Support ............................. 14
Introduction
Measuring a signal’s frequency is a common mixed-signal application. It may be the tachometer signal from a motor or an analog signal for tone detection. For all cases, it requires determining the rate of the signal’s oscillation. For mechanical systems, this rate is generally known as “revolutions per minute” (rpm). For electrical systems, it is better known as “cycles per second” or Hertz.
There are two classic methods for measuring frequency:
Measure the number of cycles in a fixed period of time
Measure the time of one cycle
Each method has advantages and limitations of range and accuracy. They are described as follows.
Counting Cycles for a Fixed Time
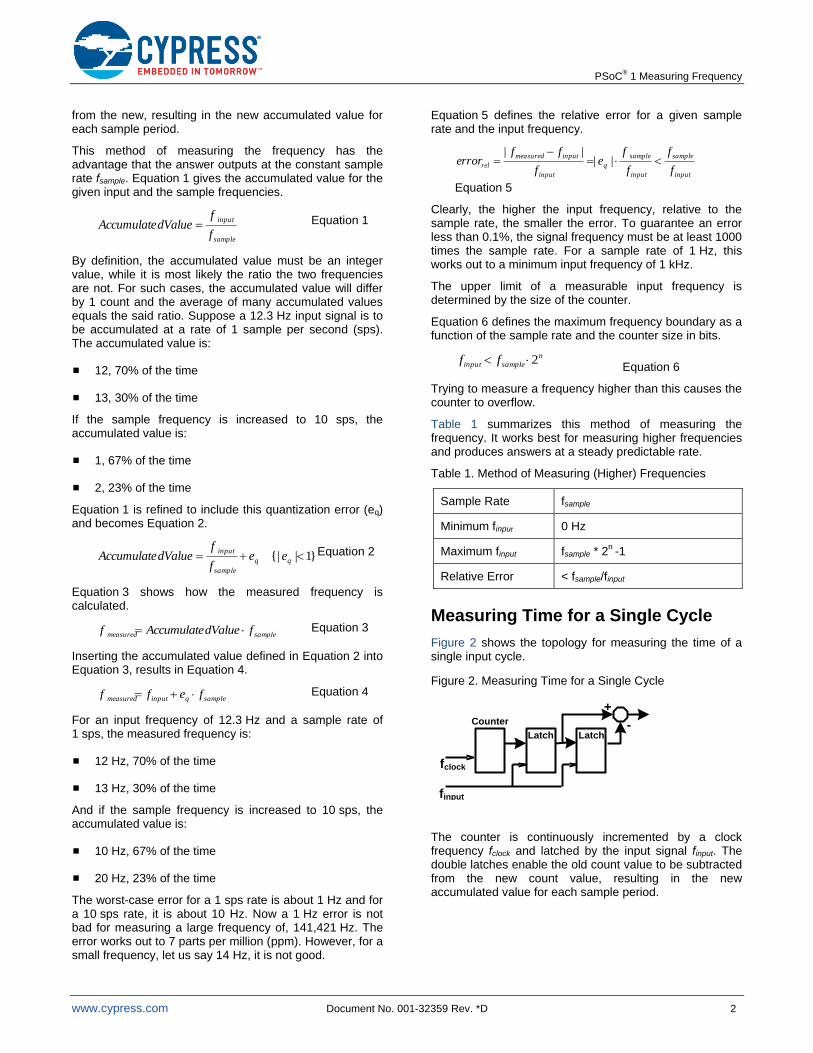
Figure 1 shows the topology for counting the number of cycles in a fixed period.
Figure 1. Counting Cycles for a Fixed Time
fsample
finput
Latch Latch
+
-Counter
The counter’s value is latched at sample rate fsample and incremented every cycle of the input signal finput. The double latches enable the old count value to be subtracted
PSoC® 1 Measuring Frequency
www.cypress.com Document No. 001-32359 Rev. *D 2
from the new, resulting in the new accumulated value for each sample period.
This method of measuring the frequency has the advantage that the answer outputs at the constant sample rate fsample. Equation 1 gives the accumulated value for the given input and the sample frequencies.
sample
input
f
fdValueAccumulate Equation 1
By definition, the accumulated value must be an integer value, while it is most likely the ratio the two frequencies are not. For such cases, the accumulated value will differ by 1 count and the average of many accumulated values equals the said ratio. Suppose a 12.3 Hz input signal is to be accumulated at a rate of 1 sample per second (sps). The accumulated value is:
12, 70% of the time
13, 30% of the time
If the sample frequency is increased to 10 sps, the accumulated value is:
1, 67% of the time
2, 23% of the time
Equation 1 is refined to include this quantization error (eq) and becomes Equation 2.
}1|{| qq
sample
inputee
f
fdValueAccumulate Equation 2
Equation 3 shows how the measured frequency is calculated.
samplemeasured fdValueAccumulatef Equation 3
Inserting the accumulated value defined in Equation 2 into Equation 3, results in Equation 4.
sampleqinputmeasured feff Equation 4
For an input frequency of 12.3 Hz and a sample rate of 1 sps, the measured frequency is:
12 Hz, 70% of the time
13 Hz, 30% of the time
And if the sample frequency is increased to 10 sps, the accumulated value is:
10 Hz, 67% of the time
20 Hz, 23% of the time
The worst-case error for a 1 sps rate is about 1 Hz and for a 10 sps rate, it is about 10 Hz. Now a 1 Hz error is not bad for measuring a large frequency of, 141,421 Hz. The error works out to 7 parts per million (ppm). However, for a small frequency, let us say 14 Hz, it is not good.
Equation 5 defines the relative error for a given sample rate and the input frequency.
input
sample
input
sample
q
input
inputmeasured
relf
f
f
fe
f
fferror
||
||
Equation 5
Clearly, the higher the input frequency, relative to the sample rate, the smaller the error. To guarantee an error less than 0.1%, the signal frequency must be at least 1000 times the sample rate. For a sample rate of 1 Hz, this works out to a minimum input frequency of 1 kHz.
The upper limit of a measurable input frequency is determined by the size of the counter.
Equation 6 defines the maximum frequency boundary as a function of the sample rate and the counter size in bits.
Equation 6
Trying to measure a frequency higher than this causes the counter to overflow.
Table 1 summarizes this method of measuring the frequency. It works best for measuring higher frequencies and produces answers at a steady predictable rate.
Table 1. Method of Measuring (Higher) Frequencies
Sample Rate fsample
Minimum finput 0 Hz
Maximum finput fsample * 2n
-1
Relative Error < fsample/finput
Measuring Time for a Single Cycle
Figure 2 shows the topology for measuring the time of a single input cycle.
Figure 2. Measuring Time for a Single Cycle
fclock
finput
Latch Latch
+
-Counter
The counter is continuously incremented by a clock frequency fclock and latched by the input signal finput. The double latches enable the old count value to be subtracted from the new count value, resulting in the new accumulated value for each sample period.
n
sampleinput ff 2
PSoC® 1 Measuring Frequency
www.cypress.com Document No. 001-32359 Rev. *D 3
This method has the advantage of updating at the rate of the input frequency finput. Equation 7 gives the accumulated value for the given input and the sample frequencies.
Equation 7
Note that an error term has been added to account for the quantization. Suppose a 3 kHz input signal is clocked at 1 MHz. Using Equation 7 and neglecting the error term, the accumulated value is 333.33. The actual accumulated count is:
333, two thirds of the time
334, one third of the time
Equation 8 shows how the measured frequency is calculated.
Equation 8
Given the same input and the clock as previously mentioned, the measured frequency is:
3.003 kHz, two thirds of the time
2.994 kHz, one third of the time
Inserting the accumulated value defined in Equation 7 into Equation 8, results in Equation 9.
Equation 9
Equation 10 defines the relative error for given clock and input frequencies.
Equation 10
To guarantee an error less than 0.1%, the clock frequency must be at least 1000 times that of the input. For a 24 MHz clock, this works out to a maximum input frequency of 24 kHz.
The lower limit of a measurable input frequency is determined by the size of the counter. Equation 11 defines the minimum input frequency boundary as a function of the clock rate and the counter size in bits.
Equation 11
Trying to measure a frequency less than this causes the counter to overflow.
Table 2 summarizes this method of measuring frequency. It works best for measuring lower frequencies.
Table 2. Method of Measuring (Lower) Frequencies
Sample Rate finput
Minimum fsignal fclock/(2n-1)
Maximum fsignal fclock
Relative Error < finput/fclock
A Hybrid Method
Both methods for measuring the frequency have their particular advantages. Counting cycles is best suited for measuring higher frequencies while measuring a cycle’s period is better for measuring lower frequencies. Both have the limitation that for any amount of decent resolution (small relative error), the input frequency range for any particular clock or sample frequencies is limited.
One traditional solution is to have different ranges. That is, several selectable clocks or sample frequencies. This requires intelligence to determine when it is best to change range or measurement method.
A hybrid method could be used to measure the width of as many cycles that fit in a specified sample period. Figure 3 shows the topology for making such a measurement.
Figure 3. Measuring Time of Many Cycles
capture
Timer
fclock
finput
tc
fsample
CPU
count
The timer is an n bits down counter that decrements each clock cycle fclock. A terminal count is generated when the counter underflows. This signal fsample defines the sample period. It is a function of the clock frequency and counter size. The CPU uses this signal to synchronize the first and the last cycle capture. The input finput is connected to the timer capture input. A rising edge on the capture causes the counter value to be latched and be accessible to the CPU. The input signal is connected to the CPU. This enables it to be counted.
Again, this method requires measuring the time of as many input cycles that fit within the sample period. Equation 12 defines the sample frequency as a function of the sample rate and the counter size in bits.
Equation 12
q
input
clock ef
fdValueAccumulate
dValueAccumulate
ff clock
measured
clock
input
qinput
q
input
clock
clockmeasured
f
fef
ef
f
ff 1
clock
input
clock
input
q
input
inputmeasured
relf
f
f
fe
f
fferror
||
||
12
n
clockinput
ff
n
clocksample
ff
2
PSoC® 1 Measuring Frequency
www.cypress.com Document No. 001-32359 Rev. *D 4
For a clock frequency of 100 kHz and a 16-bit timer, the sample rate is 1.52588 sps.
The number of input cycles detected in a sample period is a function of that sample frequency and the input frequency. It is defined in Equation 13.
Equation 13
Given an input signal with a frequency of 15 kHz and neglecting the quantization error, the cycle count is 9830.4. The actual cycle count is:
9830 60% of the time
9831 40% of the time
The actual cycle count fluctuates. Note that a cycle count of “c” gives “c-1” cycles to be measured. The accumulated timer value is a function of the data clock, the input frequency, and the cycle count value. It is defined in Equation 14.
2
1
qinput
clock e
CycleCount
f
fdValueAccumulate
Equation 14
Given the same parameters and neglecting the new quantization error, the accumulated value is:
65526.67 when the cycle count is 9830
65533.33 when the cycle count is 9831
Equation 15 defines how the measured frequency is calculated. It is a function of the data clock, the number of cycles measured, and the accumulated count for those cycles.
dValueAccumulate
CycleCountff clockmeasured
1 Equation 15
Again, given the same parameters, Table 3 gives the measured frequency for all four permutations of the cycle count and the accumulated value.
Table 3. Frequency for All Four Permutations
Fmeasured
(kHz) Cycle Count
Accumulated Value
15.00015 9830 65526
14.99992 9830 65527
15.00008 9831 65533
14.99985 9831 65534
For all four possibilities, the worst-case error is 0.15 Hz for a relative error of 10 ppm.
The relative error for this method of frequency measurement is difficult to precisely calculate, but it is roughly determined by the accumulated value and defined in Equation 16.
< Equation 16
The worst-case error results from the input signal, which causes the smallest accumulation. For an input signal not three times the sample rate, the cycle count is less than three. It fluctuates between the values of two and three, resulting in one or two cycles being measured. For the case of one cycle, the accumulation value is roughly 1/3 to total range of the counter. Equation 17 roughly defines the worst-case error given the sample rate counter size in bits and the ratio of the input frequency to the sample rate.
Equation 17
The error is the worst of the ratio of 3. For a 16-bit timer, it is 3 parts in 65536 or 46 ppm. As the ratio increases, the error drastically decreases to a limit of 1 part in 65536 counts or 15 ppm.
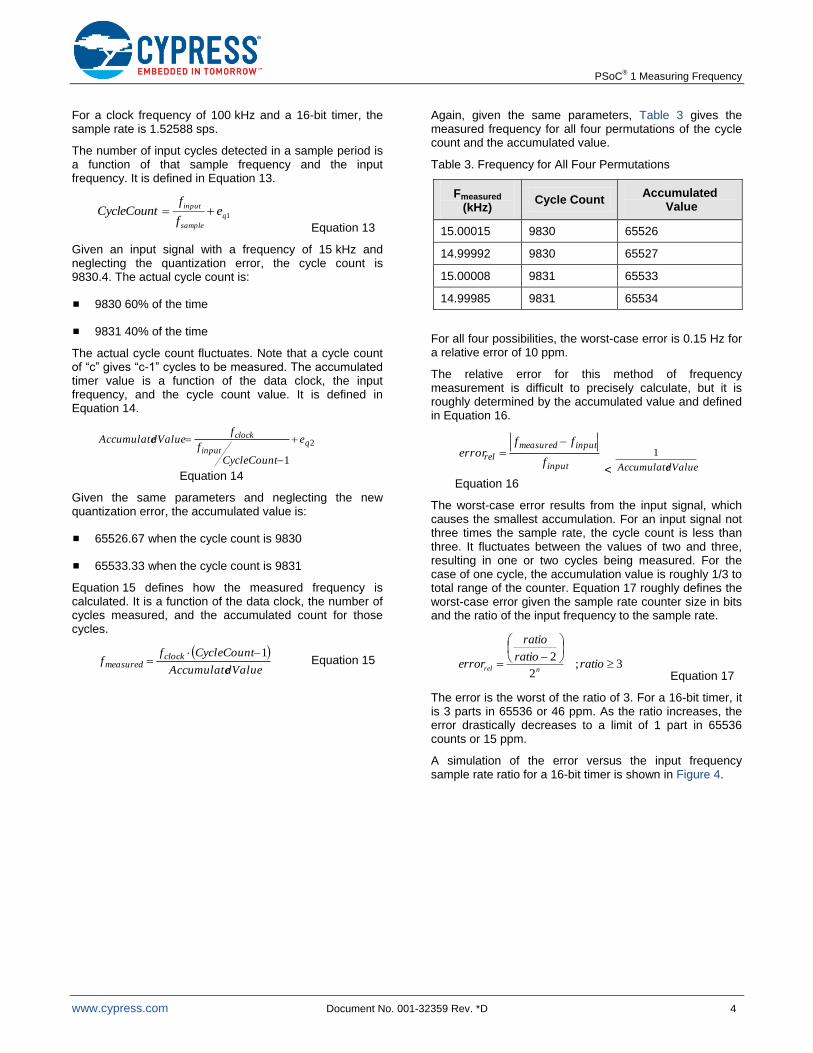
A simulation of the error versus the input frequency sample rate ratio for a 16-bit timer is shown in Figure 4.
1q
sample
inpute
f
fCycleCount
input
inputmeasured
relf
fferror
dValueAccumulate
1
3;2
2
ratio
ratio
ratio
errornrel
PSoC® 1 Measuring Frequency
www.cypress.com Document No. 001-32359 Rev. *D 5
Figure 4. Relative Error for 16-Bit Timer
Note that the error reaches a peak at a signal three times the sample rate and is relatively flat for values larger than sixteen times the sample rate.
Table 4 gives the worst-case error and limit error for three different sized timers.
Table 4. Worst and Limit Relative Error
Timer Size
(Bits) Worst-Case Error Limit Error
8 1,2% 0.4%
16 46 ppm 15 ppm
24 0.18 ppm 0.06 ppm
The minimum frequency that can be consistently measured is twice the sample rate. Any value less than that cannot guarantee that two cycles are detected. The maximum frequency will be the clock frequency.
The range is the ratio of maximum and minimum values and is defined in Equation 18.
Equation 18
Table 5 summarizes the hybrid method of measuring the frequency. It works well over a wide range of frequencies and produces answers at a steady predictable rate.
Table 5. Hybrid Method of Measuring the Frequency
Sample Rate fclock/2n
Minimum fsignal fclock/2n-1
Maximum fsignal fclock
Range 2n-1
Relative Error < 3/2n down to 1/2
n
Selecting Parameters
The five parameters shown in Table 5 are derived from only two variables.
Clock Frequency
Timer Size
Each application will place more weight to one or more of the parameters. This will drive the selection of the two variables.
Suppose an application requires you to control the speed of a four-pole fan with the following requirements:
Must measure speed from 1000 to 8000 rpm
Accuracy is better than 50 rpm
Sample rate must be exactly 10 sps
The third condition requires fsample = 10 sps.
A four-pole fan with a range of 1000 to 8000 rpm generates pulses at a rate of 66.66 Hz to 533.33 Hz. A sample frequency of 10 sps determines the minimum input frequency to be 20 Hz. This is well below the required 66.66 Hz lower limit.
The required range is only 8, so it appears that an 8-bit timer may be acceptable. This sets the requirement for the
clock frequency of fclock = 2.56 kHz. It also sets the upper
measurement limit to 2.56 kHz. This is well above the requirement of 543.33 Hz.
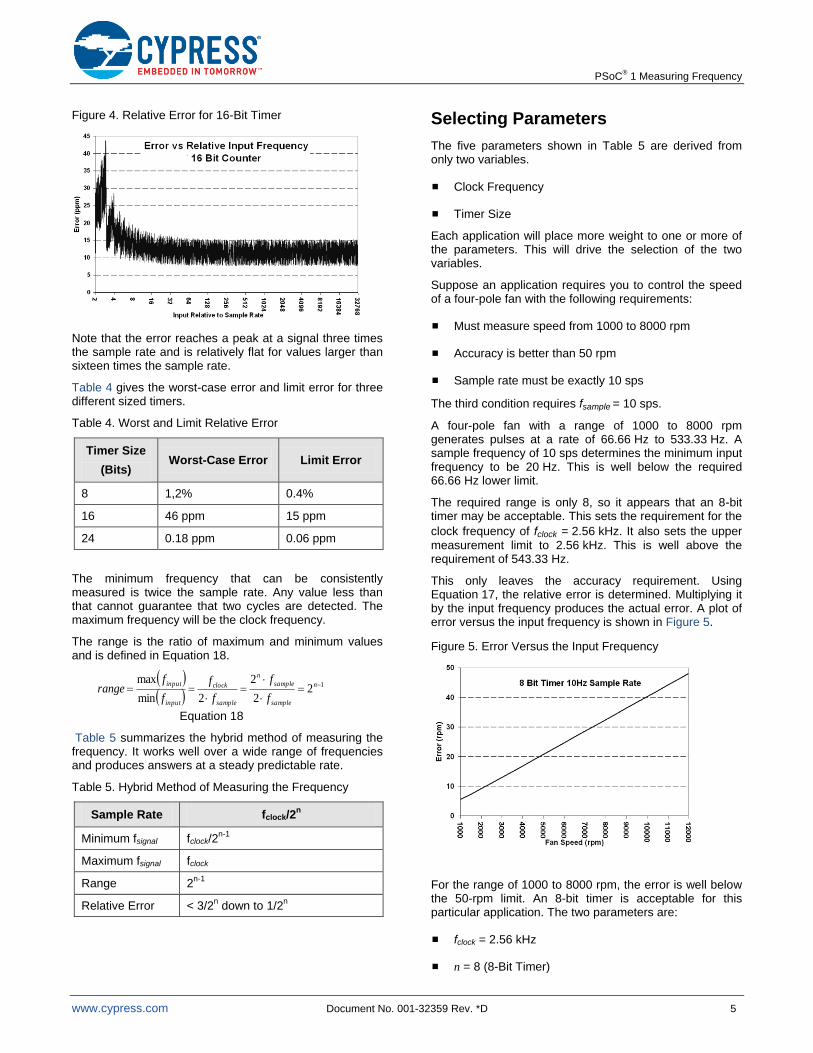
This only leaves the accuracy requirement. Using Equation 17, the relative error is determined. Multiplying it by the input frequency produces the actual error. A plot of error versus the input frequency is shown in Figure 5.
Figure 5. Error Versus the Input Frequency
For the range of 1000 to 8000 rpm, the error is well below the 50-rpm limit. An 8-bit timer is acceptable for this particular application. The two parameters are:
fclock = 2.56 kHz
n = 8 (8-Bit Timer)
122
2
2min
max
n
sample
sample
n
sample
clock
input
input
f
f
f
f
f
frange
PSoC® 1 Measuring Frequency
www.cypress.com Document No. 001-32359 Rev. *D 6
A PSoC Implementation
This example uses a general-purpose, 16-bit timer with a sample rate of 1 sps. It is implemented in a CY8C29466-24XI (28-pin DIP CY8C29xxx family part).
This PSoC® device was selected because it is included in
the CY3210-PSoCEval1. This project can easily be cloned to any of the PSoC device families. The blocks required to implement the topology shown in Figure 3 are:
A comparator to condition the input signal and give an “acquire” interrupt
A 16-bit timer with an interrupt on terminal count
An LCD
Software for the controller
Example Hardware
The placement and parameter selection for each block of hardware is described as follows.
Comparator User Module
The comparator is implemented with the Programmable Threshold Comparator User Module. Its placement and parameter selections are shown in Figure 6 and Figure 7.
Figure 6. User Module Placement of the Comparator
Figure 7. User Module Parameters for the Comparator
Port 0[7] is selected as the input. The threshold is set for 50% of the supply voltage but can easily be changed to some other threshold voltage. The comparator output is connected to the Comparator Bus 0 where it is available to the digital blocks, the CPU, and the interrupt server.
Timer User Module
The timer is implemented with a Timer16 User Module. Its placement and parameter selections are shown in Figure 8 and Figure 9.
Figure 8. User Module Placement of the Timer
Figure 9. User Module Parameters for the Timer
The timer is set up as a 16-bit timer that generates an interrupt every 2
16 clocks. The clock is connected to VC3,
which is set up to be 24 MHz/368 for the clock frequency of 65.21739 kHz. The sample rate is this clock frequency divided by the period value or 0.995 sps. The capture input connects to the comparator so that the timer value is latched and available to the CPU.
LCD
The LCD User Module is set to use port 2.
Sample Signal Source
The Counter24 User Module is added to generate a sample frequency. Its placement and parameter selections are shown in Figure 10 and Figure 11.
PSoC® 1 Measuring Frequency
www.cypress.com Document No. 001-32359 Rev. *D 7
Figure 10. User Module Placement of the Counter
Figure 11. User Module Parameters for the Sample Frequency Source (Counter)
VC1 is the clock for the counter and is set to 12 MHz. The present period setting results in an output frequency to 1.2346 kHz. The output is connected to Port 0[5]. Changing the period and compare values enables the sample frequency to be adjusted from 6 MHz to 0.72 Hz.
Other Considerat ions
Port 1[7] is connected to an LED to blink at the sample rate. The pin-out for this example is shown in Figure 12.
Figure 12. Example Project Pin-Out
Example Software
Calculating the frequency requires:
Saving the first captured timer value in a timer period
Saving the last captured timer value in a timer period
Saving the total number of cycles detected in a timer period
Processing the measured frequency from these three values
Two 16-bit variables are required to hold the first and last captured timer values. They are:
wFirstValue
wLastValue
A 16-bit variable is required to count the number of cycles detected and an 8-bit variable to keep the overflow of this variable. They are:
wTickCount
cOverFlow
They can be thought of as a single, 24-bit variable.
At the end of the timer period, the difference of the two timer values must be stored with a copy of the cycle count value. Because this process runs in the background, a semaphore must be set to declare that new data is available. These variables are:
wSaveTickNum
cSaveOverFlow
wSaveCountNum
bDataAvailable
PSoC® 1 Measuring Frequency
www.cypress.com Document No. 001-32359 Rev. *D 8
A total of eight variables using 13 bytes of RAM are required.
There are three parts to the software for measuring the frequency:
Initialization
Cycle Capture
Processing at End of Timer Period
Ini t ial izat ion
The initialization function is shown in Code 1. It is called StartFreq and located in freqcode.asm of the project associated with this Application Note.
Code 1. Initialization Function
export _StartFreq
include "m8c.inc"
include "memory.inc"
include "PSoCAPI.inc"
_StartFreq:
RAM_PROLOGUE RAM_USE_CLASS_4
RAM_SETPAGE_CUR >_bDataReady
mov [_cOverFlow],ffh ;TickCount =-1
mov [_wTickCount + 0],ffh
mov [_wTickCount + 1],ffh
mov [_bDataAvailable],0 ;clear bDataReady
and reg[INT_CLR1],~02h ;clear timer int
TickTimer_EnableInt_M ;enable timer
TickTimer_Start_M ;start timer
and reg[INT_CLR0],~02h ;clear comp int
or reg[INT_MSK0],02h ;enable comp int
RAM_EPILOGUE RAM_USE_CLASS_4
ret
This routine initializes the cycle count variable. Note that it initializes to -1. This automatically subtracts 1 from the count value. The timer is started and both interrupts are enabled.
Cycle Capture
The cycle capture function is shown in Code 2. It is called TickHandler_ISR and located in tickhandler.asm of the project associated with this application.
Code 2. Cycle Capture Function
include "m8c.inc"
include "memory.inc"
include "TickTimer.inc"
export _TickHandler_ISR
_TickHandler_ISR:
push A
inc [_wTickCount + 1]
adc [_wTickCount + 0],0
adc [_cOverFlow],0
jnc LastTick
FirstTick:
mov A, reg[TickTimer_COMPARE_LSB_REG]
mov [_wFirstValue + 1],A
mov A, reg[TickTimer_COMPARE_MSB_REG]
mov [_wFirstValue + 0],A
pop A
reti
LastTick:
mov A, reg[TickTimer_COMPARE_LSB_REG]
mov [_wLastValue + 1],A
mov A, reg[TickTimer_COMPARE_MSB_REG]
mov [_wLastValue + 0],A
pop A
reti
The count value is incremented. If the counter rolls over to zero, then this must be the first cycle detected. The acquired timer value is stored in wFirstTick. For any other case, the timer value is loaded into wLastTick.
Processing at End of Timer Period
This function is shown in Code 3. It is in the reserved area of the timer’s interrupt handler in TickTimerint.asm.
Code 3. Processing Data at Period’s End
;-------------------------------------------
; Insert your custom code below this banner
;---------------------------------------------
push A
mov [_wSaveCountNum+1],[_wFirstValue+1]
mov [_wSaveCountNum+0],[_wFirstValue+0]
mov A,[_wLastValue +1]
sub [_wSaveCountNum+1],A
mov A,[_wLastValue +0]
sbb [_wSaveCountNum+0],A
mov [_cSaveOverFlow] ,[_cOverFlow]
mov [_wSaveTickNum + 0 ],[_wTickCount + 0]
mov [_wSaveTickNum + 1 ],[_wTickCount + 1]
mov A,ffh

PSoC® 1 Measuring Frequency
www.cypress.com Document No. 001-32359 Rev. *D 9
mov [_cOverFlow],A
mov [_wTickCount + 0],A
mov [_wTickCount + 1],A
mov [_bDataAvailable] ,A
pop A
;-------------------------------------------
; Insert your custom code above this banner
;-------------------------------------------
This routine subtracts the second timer from the first to determine the time value and stores it in a variable accessible by the main program. The cycle count is also copied to such a variable before it is reinitialized to -1. And lastly, the semaphore is set.
These functions run in the background to produce a count value and time value. They are converted to a frequency in the main program.
Main Program
The main program is shown in Code 4 and can be found in main.c of the project associated with this Application Note.
Code 4. Main Program
#define SYSCLOCK 24000000.0
#define FCLOCK (SYSCLOCK / 368.0)
#define PERIOD 65536.0
#define FSAMPLE (FCLOCK / PERIOD) void main()
{
Comparator_Start(Comparator_HIGHPOWER);
SampleFreq_Start();
PRT0DR = 0x80; //Enable Input Pullup P0.7
PRT1DR = 0x0c;//Set P1.2 & P1.3 High
LCD_Start();
M8C_EnableGInt;
StartFreq(); //Start TickTimer, Initialize
while(1){
bDataAvailable = 0x00;
while(bDataAvailable == 0x00);
PRT1DR |= 0x80; //LED On
if(cSaveOverFlow < 0 )fFreqValue = 0.0;
else if (cSaveOverFlow > 0){
fFreqValue = (float)(cSaveOverFlow);
fFreqValue *= 65536.0;
fFreqValue += (float) wSaveTickNum;
fFreqValue += 1.0;
fFreqValue /= FSAMPLE;
}
else{//No OverFlow
if( wSaveTickNum ==0)fFreqValue = 0.0;
else{
fFreqValue = (float) wSaveTickNum;
fFreqValue *= FCLOCK;
fFreqValue /= (float)wSaveCountNum;
}
}
DisplayValue();
PRT1DR &= ~0x80; //LED Off
}
}
The program starts with the system definitions. It then initializes the variables, starts the user modules, enables the interrupts, and starts the background frequency measuring process. It then goes into a continuous loop that:
Clears the bDataAvailable flag
Waits for this flag to be set again
Turns on the LED
Calculates the measured frequency
Displays this value with the cycle count and timer values
Turns off the LED
Upon examination of the code, four of the six steps are apparent and need no more discussion. The LCD display is separate function. Its purpose is to write the calculated frequency value to the LCD. For the interested reader, this function’s code can be in the project associated with this Application Note. It is not discussed here. This leaves the code frequency calculation.
There are four different conditions that cause the different methods of calculation:
cSaveOverFlow < 0
cSaveOverFlow = 0. wSaveTickNum = 0
cSaveOverFlow = 0. wSaveTickNum >0
cSaveOverFlow > 0

PSoC® 1 Measuring Frequency
www.cypress.com Document No. 001-32359 Rev. *D 10
cSaveOverFLow < 0
This condition results when no captures are acquired within the timer period. The frequency must be less than the sample rate so the calculated frequency is set to zero.
cSaveOverFLow = 0. wSaveTickNum = 0
This condition results when only one capture is acquired within the timer period. The frequency must be less than the minimum allowable input frequency sample rate so the calculated frequency is again set to zero.
cSaveOverFLow = 0. wSaveTickNum != 0
This condition results when the input is in range. The frequency is calculated using Equation 15.
cSaveOverFLow > 0
This condition results when the input frequency exceeds the maximum allowable input frequency. This now becomes a problem of measuring counts for a fixed time. The frequency is calculated using Equation 3.
This conversion to a different measurement technique enables an increase in range. The new maximum input frequency is determined by the time needed to service the capture of the input signal. The period of the input signal must be greater than the time required to service this interrupt.
This interrupt requires 91 CPU cycles. For a 24 MHz CPU clock, this makes the maximum input frequency to be no greater than 260 kHz. For a 12 MHz CPU clock, it drops to 130 kHz. For inputs of higher frequency, another solution is required. One method is to reconfigure the digital blocks to count the cycles for a fixed time. Another solution is to place an 8-bit counter in front of the input to divide down the input frequency (prescaler).
Figure 13 shows this project implemented on a PSoC Evaluation Board.
Figure 13. A Working Frequency Meter
Note The 24-bit cycle count value and 16-bit timer value appear in the lower line. For verification, the system clock can be calculated by working back from the measured frequency, count value, and timer value. For the values displayed in Figure 13, it works out to be 24,000,497 Hz.
Roughly 16 ppm of Error (App. 25,000 ppm)
When you build the frequency meter, sometimes variations may occur. For example, on giving an input of 10 KHz there might be an answer of 10.127 kHz.
This discrepancy is the result of the input being measured relative to a clock frequency generated from the internal system clock (24 MHz). This system clock has a worst-case error of 2.5%. This project was developed with the internal system clock because the evaluation board does not come with the crystal components installed.
The following steps show how to modify the example using a crystal-controlled clock.
The evaluation board must be altered. Execute the following:
Remove R8 and R9
Install a 32.768 kHz clock crystal in location Y1
Install a 12 pF capacitor in location C10 and a 100 pF capacitor in location C9
The following PSoC parameters must be changed:
P1[0] drive must be set to XtalOut and P1[1] drive must be set to XtalIn
Global resource 32K_Select must be set to External

PSoC® 1 Measuring Frequency
www.cypress.com Document No. 001-32359 Rev. *D 11
Global resource PLL_Mode must set to Ext Lock
The system clock is now crystal controlled. It is 732 times the crystal frequency, or 23.986 MHz, instead of the standard 24 MHz. It requires that the SYSCLOCK definition in main.c be changed to 23986176.0.
This new system clock frequency requires the period of the sample signal source to be changed to 9715 for the desired 1.2345 kHz test frequency.
All these project changes can be found in the project folder …\FrequencyProjectPLL associated with this Application Note. Figure 14 shows this crystal-controlled frequency meter.
Figure 14. Crystal-Controlled Frequency Meter
You might notice that the two resistors have been removed. Also, the two capacitors and a crystal have been added.
The system clock can be calculated by working back from the measured frequency, count value and timer value. For the values displayed in Figure 14, it works out to be 23,986,462 Hz.
Building Your Own
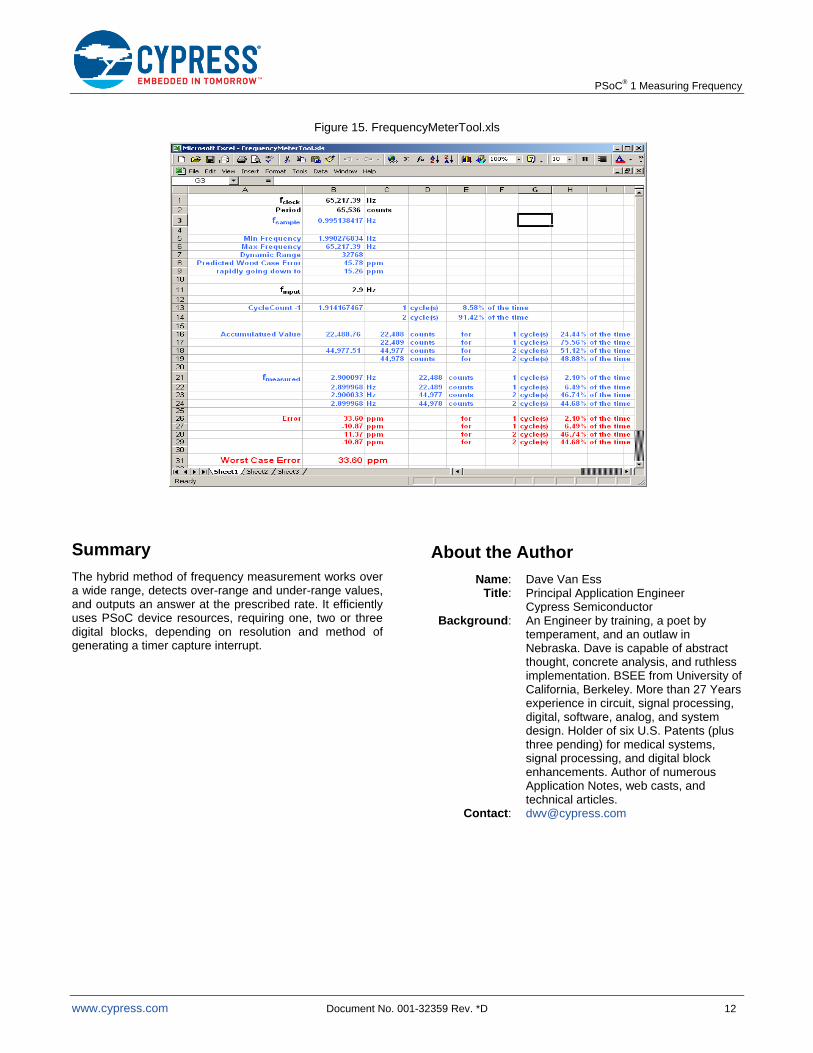
This example was developed for particular specifications. Your project will most likely have a different set of requirements. A spreadsheet has been provided that enables the user to select the clock frequency and timer size. The results are the sample rate, and minimum and maximum acceptable input frequencies. The user may input a frequency and determine the relative error of the measurement. FrequencyMeterTool.xls is in the project folder associated with this Application Note. It is shown in Figure 15.
PSoC® 1 Measuring Frequency
www.cypress.com Document No. 001-32359 Rev. *D 12
Figure 15. FrequencyMeterTool.xls
Summary
The hybrid method of frequency measurement works over a wide range, detects over-range and under-range values, and outputs an answer at the prescribed rate. It efficiently uses PSoC device resources, requiring one, two or three digital blocks, depending on resolution and method of generating a timer capture interrupt.
About the Author
Name: Dave Van Ess Title: Principal Application Engineer
Cypress Semiconductor Background: An Engineer by training, a poet by
temperament, and an outlaw in Nebraska. Dave is capable of abstract thought, concrete analysis, and ruthless implementation. BSEE from University of California, Berkeley. More than 27 Years experience in circuit, signal processing, digital, software, analog, and system design. Holder of six U.S. Patents (plus three pending) for medical systems, signal processing, and digital block enhancements. Author of numerous Application Notes, web casts, and technical articles.
Contact: [email protected]
PSoC® 1 Measuring Frequency
www.cypress.com Document No. 001-32359 Rev. *D 13
Document History
Document Title: AN2283 – PSoC® 1 Measuring Frequency
Document Number: 001-32359
Revision ECN Orig. of Change
Submission Date
Description of Change
** 1491203 SWU 09/20/2007 Re-catalogued application note.
*A 3220248 DASG 04/08/2011 The following changes have been made to Application Note AN2283: The version of the PSoC Designer is changed to 5.1 in page 1 of the document. In page 6 of the document, the word 'been' is changed to 'be'. The project associated with the AN is upgraded from PSoC Designer 4.2 to 5.1 The pin names are changed to 'Test_SignalOut' and 'Signal_Input'.
*B 3301545 DASG 07/04/2011 Removed “extern” for the variable fFreqValue from main.c.
Title changed to PSoC® 1 Measuring Frequency – AN2283.
*C 4361939 MSUR 04/25/2014 Updated example projects to PSoC Designer 5.4.
Updated in new template.
Completing Sunset Review.
*D 5690101 AESATMP8 04/19/2017 Updated logo and Copyright.

PSoC® 1 Measuring Frequency
www.cypress.com Document No. 001-32359 Rev. *D 14
Worldwide Sales and Design Support
Cypress maintains a worldwide network of offices, solution centers, manufacturer’s representatives, and distributors. To find the office closest to you, visit us at Cypress Locations.
Products
ARM® Cortex
® Microcontrollers cypress.com/arm
Automotive cypress.com/automotive
Clocks & Buffers cypress.com/clocks
Interface cypress.com/interface
Internet of Things cypress.com/iot
Memory cypress.com/memory
Microcontrollers cypress.com/mcu
PSoC cypress.com/psoc
Power Management ICs cypress.com/pmic
Touch Sensing cypress.com/touch
USB Controllers cypress.com/usb
Wireless Connectivity cypress.com/wireless
PSoC® Solutions
PSoC 1 | PSoC 3 | PSoC 4 | PSoC 5LP | PSoC 6
Cypress Developer Community
Forums | WICED IOT Forums | Projects | Videos | Blogs | Training | Components
Technical Support
cypress.com/support
All other trademarks or registered trademarks referenced herein are the property of their respective owners.
Cypress Semiconductor 198 Champion Court San Jose, CA 95134-1709
© Cypress Semiconductor Corporation, 2007-2017. This document is the property of Cypress Semiconductor Corporation and its subsidiaries, including Spansion LLC (“Cypress”). This document, including any software or firmware included or referenced in this document (“Software”), is owned by Cypress under the intellectual property laws and treaties of the United States and other countries worldwide. Cypress reserves all rights under such laws and treaties and does not, except as specifically stated in this paragraph, grant any license under its patents, copyrights, trademarks, or other intellectual property rights. If the Software is not accompanied by a license agreement and you do not otherwise have a written agreement with Cypress governing the use of the Software, then Cypress hereby grants you a personal, non-exclusive, nontransferable license (without the right to sublicense) (1) under its copyright rights in the Software (a) for Software provided in source code form, to modify and reproduce the Software solely for use with Cypress hardware products, only internally within your organization, and (b) to distribute the Software in binary code form externally to end users (either directly or indirectly through resellers and distributors), solely for use on Cypress hardware product units, and (2) under those claims of Cypress’s patents that are infringed by the Software (as provided by Cypress, unmodified) to make, use, distribute, and import the Software solely for use with Cypress hardware products. Any other use, reproduction, modification, translation, or compilation of the Software is prohibited.
TO THE EXTENT PERMITTED BY APPLICABLE LAW, CYPRESS MAKES NO WARRANTY OF ANY KIND, EXPRESS OR IMPLIED, WITH REGARD TO THIS DOCUMENT OR ANY SOFTWARE OR ACCOMPANYING HARDWARE, INCLUDING, BUT NOT LIMITED TO, THE IMPLIED WARRANTIES OF MERCHANTABILITY AND FITNESS FOR A PARTICULAR PURPOSE. To the extent permitted by applicable law, Cypress reserves the right to make changes to this document without further notice. Cypress does not assume any liability arising out of the application or use of any product or circuit described in this document. Any information provided in this document, including any sample design information or programming code, is provided only for reference purposes. It is the responsibility of the user of this document to properly design, program, and test the functionality and safety of any application made of this information and any resulting product. Cypress products are not designed, intended, or authorized for use as critical components in systems designed or intended for the operation of weapons, weapons systems, nuclear installations, life-support devices or systems, other medical devices or systems (including resuscitation equipment and surgical implants), pollution control or hazardous substances management, or other uses where the failure of the device or system could cause personal injury, death, or property damage (“Unintended Uses”). A critical component is any component of a device or system whose failure to perform can be reasonably expected to cause the failure of the device or system, or to affect its safety or effectiveness. Cypress is not liable, in whole or in part, and you shall and hereby do release Cypress from any claim, damage, or other liability arising from or related to all Unintended Uses of Cypress products. You shall indemnify and hold Cypress harmless from and against all claims, costs, damages, and other liabilities, including claims for personal injury or death, arising from or related to any Unintended Uses of Cypress products.
Cypress, the Cypress logo, Spansion, the Spansion logo, and combinations thereof, WICED, PSoC, CapSense, EZ-USB, F-RAM, and Traveo are trademarks or registered trademarks of Cypress in the United States and other countries. For a more complete list of Cypress trademarks, visit cypress.com. Other names and brands may be claimed as property of their respective owners.