FAD binding properties of a cytosolic version of Escherichia coli NADH dehydrogenase-2
Upload
independentCategory
view
1download
0
http://www.elsevier.com/locate/bba
Biochimica et Biophysica Ac
Proteomic analysis of succinate dehydrogenase and ubiquinol-cytochrome
c reductase (Complex II and III) isolated by immunoprecipitation
from bovine and mouse heart mitochondria
Birgit Schillinga,1, James Murrayb,c,1, Chris B. Yooa, Richard H. Rowa, Michael P. Cusacka,
Roderick A. Capaldib,c, Bradford W. Gibsona,d,*
aBuck Institute for Age Research, Novato, CA 94945, USAbDepartment of Molecular Biology, University of Oregon, Eugene, OR 97403, USA
cMitoSciences LLC, Eugene, OR 97403, USAdDepartment of Pharmaceutical Chemistry, University of California, San Francisco, CA 94143, USA
Received 28 May 2005; accepted 12 July 2005
Available online 3 August 2005
Abstract
The oxidative phosphorylation system (OXPHOS) consists of five multi-enzyme complexes, Complexes I–V, and is a key component of
mitochondrial function relating to energy production, oxidative stress, cell signaling and apoptosis. Defects or a reduction in activity in
various components that make up the OXPHOS enzymes can cause serious diseases, including neurodegenerative disease and various
metabolic disorders. Our goal is to develop techniques that are capable of rapid and in-depth analysis of all five OXPHOS complexes. Here,
we describe a mild, micro-scale immunoisolation and mass spectrometric/proteomic method for the characterization of Complex II (succinate
dehydrogenase) and Complex III (ubiquinol-cytochrome c reductase) from bovine and rodent heart mitochondria. Extensive protein sequence
coverage was obtained after immunocapture, 1D SDS PAGE separation and mass spectrometric analysis for a majority of the 4 and 11
subunits, respectively, that make up Complexes II and III. The identification of several posttranslational modifications, including the covalent
FAD modification of flavoprotein subunit 1 from Complex II, was possible due to high mass spectrometric sequence coverage.
D 2005 Elsevier B.V. All rights reserved.
Keywords: Mitochondria; Succinate dehydrogenase; Ubiquinol-cytochrome c reductase; Posttranslational modification; Neurodegenerative disease
1. Introduction
The contribution of mitochondria to a variety of
metabolic, neurodegenerative, and age-related diseases is
still controversial, but evidence implicating mitochondrial
dysfunction in these and other pathologies has increased
significantly in recent years. Mitochondrial dysfunction has
multiple effects, initiated as reduced energy production, that
results in the formation of reactive oxygen and nitrogen
0925-4439/$ - see front matter D 2005 Elsevier B.V. All rights reserved.
doi:10.1016/j.bbadis.2005.07.003
* Corresponding author. Buck Institute for Age Research, 8001 Redwood
Blvd., Novato, CA 94945, USA. Tel.: +1 415 209 2032; fax: +1 415 209
2231.
E-mail address: [email protected] (B.W. Gibson).1 These authors contributed equally to this work.
species [1], altered bioenergetic interactions within the
organelle, and subsequent changes in cellular homeostasis
that can lead to apoptosis or necrotic cell death [2].
The five enzyme complexes that constitute the mito-
chondrial oxidative phosphorylation system (OXPHOS)
contain over 90 different protein subunits, making direct
and specific correlations of these to disease cause or
progression difficult at best. High-resolution structures are
available for all the OXPHOS complexes except Complex I
(NADH:ubiquininone oxidoreductase), which contains the
largest number of subunit proteins (¨46), and has a MW of
950,000 Da. Mutations in nuclear (and mitochondrial) genes
of the OXPHOS complexes can cause specific human
diseases and these have been reviewed recently by van den
Heuvel and Smeitink [3]. Those in Complexes II and III
ta 1762 (2006) 213 – 222
B. Schilling et al. / Biochimica et Biophysica Acta 1762 (2006) 213–222214
have been associated with clinical phenotypes such as optic
atrophy, tumor formation, myopathy, and encephalopathy
depending on the specific subunits involved [4,5].
OXPHOS defects are also observed in a number of late
onset diseases, such as Parkinson’s disease [6], Huntington’s
disease [7], and amyotrophic lateral sclerosis [8]. In these, it
is thought that certain polymorphisms in the genes for the
proteins of the OXPHOS system predispose to higher levels
of accumulated environmental insult thereby increasing
oxidative stress which, in turn, triggers cell dysfunction
and ultimately cell death. However, a mitochondrial
etiology of the above neurodegenerative diseases is not
universally accepted.
To better investigate the role of the mitochondrial
OXPHOS complexes in mitochondrial disease, better
methods are needed to rapidly purify, isolate and character-
ize the proteins that constitute this system. As a first
approach, we have used a sucrose gradient fractionation
centrifugation method to isolate and partially separate the
OXPHOS complexes from human heart and mouse tissue
(Hanson et al. [9] and Taylor et al. [10]). This approach led
to an initial proteomic analysis of the components in each
complex as well as other proteins of the mitochondrion.
More recently, our laboratories have focused on immu-
noisolation as a simple method for the one-step purification
of the OXPHOS complexes. Isolation of Complex I from
human heart [11] and from rodent tissue [12], by this
method has been combined with mass spectrometric
methods for the protein identification and to evaluate
sequence coverage of the individual polypeptides resolved
as a necessary prerequisite for post-translational modifica-
tion studies. Analogous methods have also been demon-
strated for the isolation of human Complex V (ATP
synthase) [13] and the pyruvate dehydrogenase complex
[14]. Moreover, an immunoisolation protocol for bovine
cytochrome c oxidase (Complex IV) has been developed
and the enzyme studied extensively by mass spectrometry
(Murray and Capaldi, unpublished data).
In this current work, we describe a rapid and mild
isolation and characterization of intact Complexes II and III
from both bovine and rodent tissue followed by detailed
mass spectrometric-based proteomic analysis. Both
MALDI-MS peptide mass fingerprinting (PMF) and tandem
mass spectrometry (nano-HPLC-MS, MS/MS) were used to
identify and characterize individual protein subunits from
both Complexes II and III, and this has led to the
identification of several posttranslational modifications.
2. Materials and methods
2.1. Materials
All tissue culture materials were procured from Life
Technologies/Invitrogen (Carlsbad, CA) or Cellgro (Kansas
City, MO). Protease inhibitor cocktail was obtained from
Roche Diagnostics (Indianapolis, IN). Antibodies coupled
to protein G agarose beads for OXPHOS complex isolation
were purchased from MitoSciences (Eugene, OR). NuPAGE
4–12% Bis-Tris (MES) gels were obtained from Invitrogen
(Carlsbad, CA). Materials related to proteomics, such as
sample buffers, 1D SDS PAGE gels were obtained from
Bio-Rad Laboratories (Hercules, CA). Gel stains, such as
Coomassie Brilliant Blue R was purchased from Sigma (St.
Louis, MO). For proteolysis, sequencing grade, modified
trypsin (porcine) was purchased from Promega (Madison,
WI). Non-ionic detergent, n-dodecyl-h-d-maltoside, and
additional reagents for protein chemistry including iodoa-
cetamide and dithiothreitol were obtained from Sigma (St.
Louis, MO). HPLC solvents such as acetonitrile and water
were obtained from Burdick and Jackson (Muskegon, MI).
For immunoprecipitation experiments, protein G agarose
beads and antibody crosslinking reagent, dimethylpimeli-
midate, were purchased from Sigma (St. Louis, MO). For
MALDI-MS a matrix solution of a-cyano-4-hydroxycin-
namic acid in acetonitrile/methanol was purchased from
Agilent Technologies (Palo Alto, CA).
2.2. Preparation of bovine and mouse heart mitochondria
Bovine heart mitochondria were prepared essentially as
described by Smith [15]. Briefly, ventricles in isotonic
buffer (10 mM Tris–HCl pH 7.8, 0.25 M sucrose, 0.2 mM
EDTA, 0.5 mM PMSF) were homogenized in an ultraturrex
blender followed by a polytron tissue disruptor. Particulate
material was removed filtering through cheesecloth fol-
lowed by centrifugation at 1000�g. Mitochondria were
collected from the supernatant by spinning down at
12,000�g and resuspended in the isotonic buffer. Mouse
heart mitochondria were prepared by dissecting 5 mouse
hearts followed by homogenization in 10 mL of the same
isotonic buffer in a Potter–Elvehjem homogenizer. Partic-
ulate material was removed by centrifugation at 1000�g.
Mitochondria were then isolated by centrifugation at
12,000�g. Protein concentration was determined by the
BCA method (Pierce).
2.3. Immunocapture of Complex II and Complex III using
antibody-coupled protein G agarose beads
A monoclonal antibody against Complex II (4H12B-
G12AG2) was coupled to protein G agarose beads for the
capture of Complex II (now available through MitoScien-
ces, MS201). A monoclonal antibody against Complex III
(1A11BC12AB9) was coupled to protein G agarose beads
for the capture of Complex III (now available through
MitoSciences, MS301). Immunocapture was performed as
previously described [16]. Briefly, 2.5 mg of mitochondria
in 0.5 mL PBS were solubilized by addition of 20 mM
dodecyl-h-d-maltoside (Calbiochem) and incubation for 30
min on ice. Insoluble material was removed by centrifuga-
tion at 70,000�g for 30 min. The recovered supernatant
B. Schilling et al. / Biochimica et Biophysica Acta 1762 (2006) 213–222 215
was incubated with 10 AL antibody-conjugated beads
overnight at 4 -C while turning. Beads were washed 3
times in 1 mL PBS, 0.1 mM dodecyl-h-d-maltoside.
Immunocaptured protein complexes were eluted by addi-
tion of 40 AL SDS-PAGE sample buffer (50 mM Tris pH
6.8, 2% SDS, 10% glycerol, 0.001% bromophenol blue).
After the elution and discarding of the beads, the super-
natant was supplemented with 50 mM DTT before
electrophoresis. For electrophoresis, a 20-AL sample was
resolved by SDS-PAGE on a NuPAGE 4–12% Bis-Tris gel
(Invitrogen) in an X-Cell Sure Lock Mini Cell Apparatus
(Invitrogen) using MES running buffer (50 mM 2-
morpholinoethanesulfonic acid, 50 mM Tris base, 0.1%
SDS, 1 mM EDTA) at 100 V for 1.5 to 2 h. Alternatively,
gels were run on a Tris–HCl 10–22% acrylamide gel
according to Laemmli [17]. All SDS gels were fixed with
10% methanol, 7% acetic acid for 30 min, and subse-
quently stained with Coomassie Brilliant Blue followed by
destaining in 10% methanol/7% acetic acid.
2.4. In-gel tryptic digestion of mitochondrial proteins
Protein spots of interest were manually excised and
processed with an automatic in-gel digester Robot, ProGest
(Genomic Solutions, Ann Arbor, MI). The gel spots were
destained and dehydrated with acetonitrile. Proteins con-
tained within these gel spots were reduced with 10 mM DTT
at 60 -C for 30 min, alkylated with 100 mM iodoacetamide
(37 -C, 45 min) and proteolyzed by adding 125–250 ng
sequencing grade trypsin (Promega, Madison, WI) at 37 -Cfor 4 h. The resulting tryptic peptides were then extracted
from the gel by aqueous/10% formic acid extraction and
analyzed by mass spectrometry. In addition to tryptic
digestion, gel bands were separately proteolyzed with
chymotrypsin after reduction and alkylation (125 ng chymo-
trypsin, 25 -C, 4 h). The resulting chymotryptic peptides were
extracted with 50% acetonitrile/5% formic acid, concentrated
to near dryness by vacuum centrifugation (Savant) and
analyzed by mass spectrometry as described below.
2.5. Mass spectrometry
Mass spectra of digested gel spots were obtained by
matrix-assisted laser desorption ionization time-of-flight
(MALDI-TOF) mass spectrometry on a Voyager DESTR
plus (Applied Biosystems, Framingham, MA). All mass
spectra were acquired in positive-ionization mode using
reflectron optics. The instrument was equipped with a 337
nm nitrogen laser and operated under delayed extraction
conditions; delay time 190 ns, grid voltage 66–70% of full
acceleration voltage (20–25 kV). All peptide samples were
prepared using a matrix solution consisting of 33 mM a-
cyano-4-hydroxycinnamic acid in acetonitrile/methanol (1/
1; v/v); 1 AL of analyte (0.1–1 pmol of material) was mixed
with 1 AL of matrix solution, and then air-dried at room
temperature on a stainless steel target. Typically, 50–100
laser shots were used to record each spectrum. The obtained
mass spectra were externally calibrated with an equimolar
mixture of angiotensin I, ACTH 1–17, ACTH 18–39, and
ACTH 7–38.
All proteolytic peptide extracts were analyzed by reverse-
phase nano-HPLC-MS/MS. Briefly, peptides were separated
on an Ultimate nanocapillary HPLC system equipped with a
PepMapi C18 nano-column (75 Am I.D.�15 cm) (Dio-
nex, Sunnyvale, CA) and CapTrap Micro guard column (0.5
AL bed volume, Michrom, Auburn, CA). Peptide mixtures
were loaded onto the guard column and washed with the
loading solvent (H2O/0.05% formic acid, 20 AL/min) for 5
min, transferred onto the analytical C18-nanocapillary HPLC
column and then eluted at a flow rate of 300 nl/min using
the following gradient: 2% B (from 0 to 5 min), and 2–70%
B (from 5–55 min). Solvent A consisted of 0.05% formic
acid in 98% H2O/2% acetonitrile and solvent B consisted of
0.05% formic acid in 98% acetonitrile/2% H2O. The column
eluant was directly coupled to a FQSTAR Pulsar i_ quadru-pole orthogonal TOF mass spectrometer (MDS Sciex,
Concorde, Canada) equipped with a Protana/ProXeon
nanospray ion source (ProXeon Biosystems, Odense, Den-
mark). The nanospray needle voltage was typically 2300 V
in the HPLC-MS mode. Mass spectra (ESI-MS) and tandem
mass spectra (ESI-MS/MS) were recorded in positive-ion
mode with a resolution of 12,000–15,000 FWHM. For
collision-induced dissociation tandem mass spectrometry,
the mass window for precursor ion selection of the quadru-
pole mass analyzer was set to T1 m/z. The precursor ions
were fragmented in a collision cell using nitrogen as the
collision gas. All ESI-MS and MS/MS spectra were
externally calibrated in static nanospray mode using MS/
MS fragment-ions of a renin peptide standard (His
immonium-ion with m/z at 110.0713, and b8-ion with m/z
at 1028.5312) providing a mass accuracy of �50 ppm.
2.6. Database searches
Mass spectrometric data were analyzed with licensed
Mascot (Matrix Sciences, London, UK) bioinformatics
database search engine [18]. Before submission, MALDI-
MS data were first processed with Mascot Wizard v. 1.1.2
(Matrix Sciences, London, UK). The MALDI-MS Peptide
Mass Fingerprint (PMF) data were matched against peptides
from known protein sequences searching in-house custom-
designed databases (for details, see below) using the
following parameters: 100 ppm mass accuracy, 2 missed
proteolytic cleavages allowed (data were internally cali-
brated, i.e., using trypsin autolysis masses, such as m/z
842.5100 and 2211.1046). In all cases, proteolytic digestion
extracts of proteins were also analyzed by nano-HPLC-ESI-
MS and MS/MS. For ESI-MS/MS data sets, spectra were
submitted using Mascot Daemon to our in-house Mascot
server searching in-house, custom-designed databases.
Mascot uses a probability based FMowse Score_ to evaluate
data obtained from tandem mass spectra, e.g., for a score
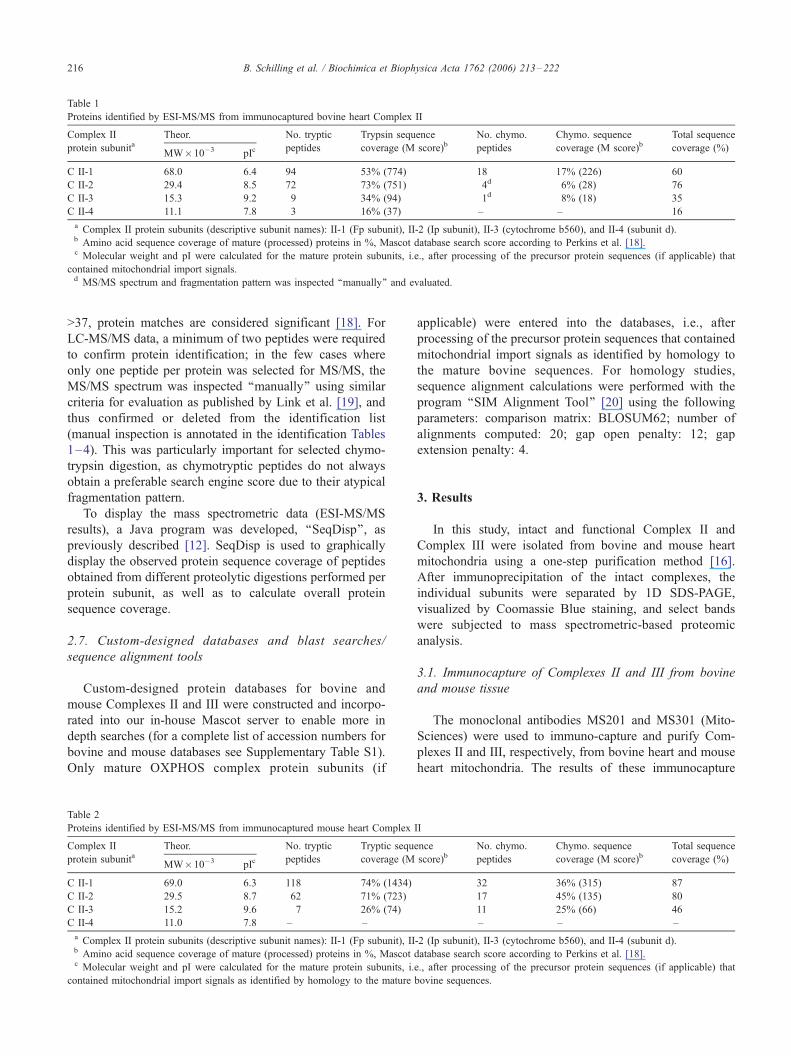
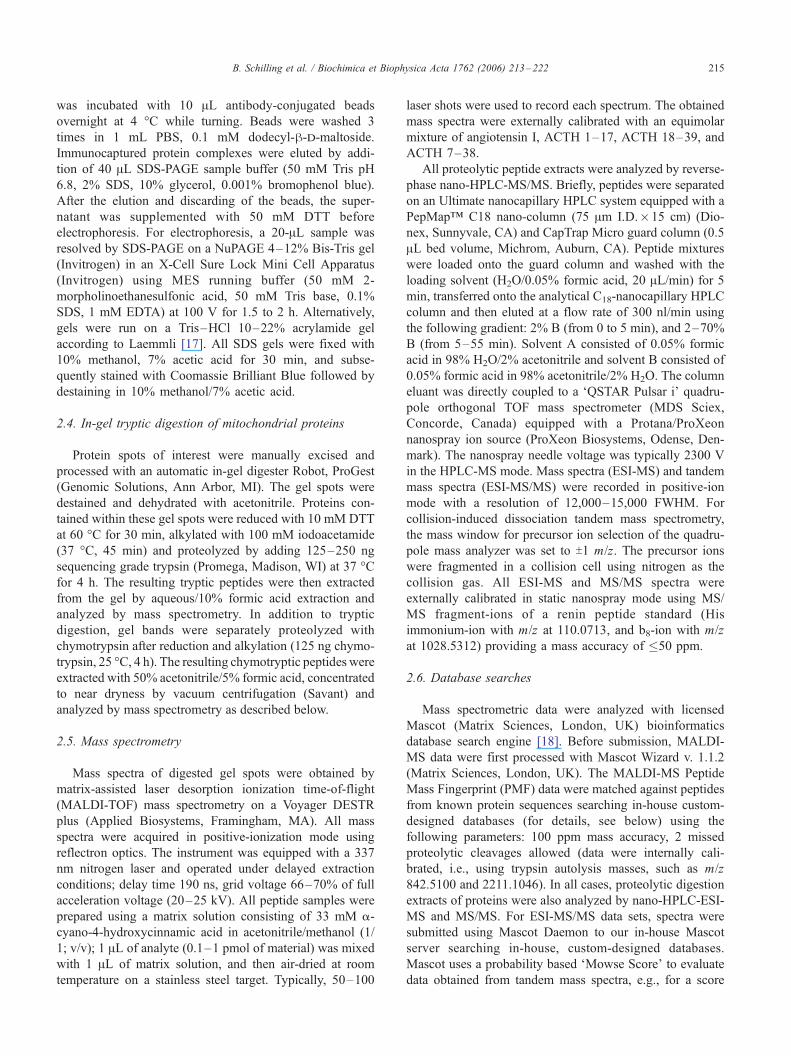
Table 1
Proteins identified by ESI-MS/MS from immunocaptured bovine heart Complex II
Complex II
protein subunitaTheor. No. tryptic
peptides
Trypsin sequence
coverage (M score)bNo. chymo.
peptides
Chymo. sequence
coverage (M score)bTotal sequence
coverage (%)MW�10�3 pIc
C II-1 68.0 6.4 94 53% (774) 18 17% (226) 60
C II-2 29.4 8.5 72 73% (751) 4d 6% (28) 76
C II-3 15.3 9.2 9 34% (94) 1d 8% (18) 35
C II-4 11.1 7.8 3 16% (37) – – 16
a Complex II protein subunits (descriptive subunit names): II-1 (Fp subunit), II-2 (Ip subunit), II-3 (cytochrome b560), and II-4 (subunit d).b Amino acid sequence coverage of mature (processed) proteins in %, Mascot database search score according to Perkins et al. [18].c Molecular weight and pI were calculated for the mature protein subunits, i.e., after processing of the precursor protein sequences (if applicable) that
contained mitochondrial import signals.d MS/MS spectrum and fragmentation pattern was inspected ‘‘manually’’ and evaluated.
B. Schilling et al. / Biochimica et Biophysica Acta 1762 (2006) 213–222216
>37, protein matches are considered significant [18]. For
LC-MS/MS data, a minimum of two peptides were required
to confirm protein identification; in the few cases where
only one peptide per protein was selected for MS/MS, the
MS/MS spectrum was inspected ‘‘manually’’ using similar
criteria for evaluation as published by Link et al. [19], and
thus confirmed or deleted from the identification list
(manual inspection is annotated in the identification Tables
1–4). This was particularly important for selected chymo-
trypsin digestion, as chymotryptic peptides do not always
obtain a preferable search engine score due to their atypical
fragmentation pattern.
To display the mass spectrometric data (ESI-MS/MS
results), a Java program was developed, ‘‘SeqDisp’’, as
previously described [12]. SeqDisp is used to graphically
display the observed protein sequence coverage of peptides
obtained from different proteolytic digestions performed per
protein subunit, as well as to calculate overall protein
sequence coverage.
2.7. Custom-designed databases and blast searches/
sequence alignment tools
Custom-designed protein databases for bovine and
mouse Complexes II and III were constructed and incorpo-
rated into our in-house Mascot server to enable more in
depth searches (for a complete list of accession numbers for
bovine and mouse databases see Supplementary Table S1).
Only mature OXPHOS complex protein subunits (if
Table 2
Proteins identified by ESI-MS/MS from immunocaptured mouse heart Complex
Complex II
protein subunitaTheor. No. tryptic
peptides
Tryptic sequ
coverage (MMW�10�3 pIc
C II-1 69.0 6.3 118 74% (1434)
C II-2 29.5 8.7 62 71% (723)
C II-3 15.2 9.6 7 26% (74)
C II-4 11.0 7.8 – –
a Complex II protein subunits (descriptive subunit names): II-1 (Fp subunit), IIb Amino acid sequence coverage of mature (processed) proteins in %, Mascotc Molecular weight and pI were calculated for the mature protein subunits, i.
contained mitochondrial import signals as identified by homology to the mature
applicable) were entered into the databases, i.e., after
processing of the precursor protein sequences that contained
mitochondrial import signals as identified by homology to
the mature bovine sequences. For homology studies,
sequence alignment calculations were performed with the
program ‘‘SIM Alignment Tool’’ [20] using the following
parameters: comparison matrix: BLOSUM62; number of
alignments computed: 20; gap open penalty: 12; gap
extension penalty: 4.
3. Results
In this study, intact and functional Complex II and
Complex III were isolated from bovine and mouse heart
mitochondria using a one-step purification method [16].
After immunoprecipitation of the intact complexes, the
individual subunits were separated by 1D SDS-PAGE,
visualized by Coomassie Blue staining, and select bands
were subjected to mass spectrometric-based proteomic
analysis.
3.1. Immunocapture of Complexes II and III from bovine
and mouse tissue
The monoclonal antibodies MS201 and MS301 (Mito-
Sciences) were used to immuno-capture and purify Com-
plexes II and III, respectively, from bovine heart and mouse
heart mitochondria. The results of these immunocapture
II
ence
score)bNo. chymo.
peptides
Chymo. sequence
coverage (M score)bTotal sequence
coverage (%)
32 36% (315) 87
17 45% (135) 80
11 25% (66) 46
– – –
-2 (Ip subunit), II-3 (cytochrome b560), and II-4 (subunit d).
database search score according to Perkins et al. [18].
e., after processing of the precursor protein sequences (if applicable) that
bovine sequences.

B. Schilling et al. / Biochimica et Biophysica Acta 1762 (2006) 213–222 217
experiments and the subsequent separation of Complexes II
and III into their protein subunits by 1D SDS PAGE are
shown in Fig. 1. Complex II was successfully immuno-
purified from both bovine and mouse sources before
undergoing final separation by 1D SDS-PAGE (Fig. 1,
panels A and B). All four protein subunits of bovine
Complex II could be identified by mass spectrometry as
visualized by Coomassie staining, while only 3 out of 4
were identified from mouse. Similarly, bovine and mouse
Complex III were immunocaptured from bovine and mouse
Fig. 1. Immunopurified bovine and mouse Complexes II and III separated
by 1D SDS-PAGE. Complexes II and III were immunopurified from bovine
heart mitochondria (2.5 mg) and mouse heart mitochondria (2.5 mg)
mitochondria using Complex II monoclonal antibody MS201 (MitoScien-
ces) and Complex III monoclonal antibody MS301 (MitoSciences),
respectively. Eluted proteins were resolved on a NuPAGE 4–12% BisTris
(MES) gel, and stained with Coomassie Brilliant Blue. Panel A shows
immunoprecipitated bovine heart Complex II, Panel B shows immunopre-
cipitated mouse heart Complex II. Four out of the four (4/4) Complex II
subunits were identified by mass spectrometry (see annotation). Panels C
and D show immunoprecipitated Complex III isolated from bovine heart
mitochondria (Panel C) and from mouse heart mitochondria (Panel D),
respectively. Ten out of eleven (10/11) Complex III subunits were identified
by mass spectrometry. A few protein bands were observed that contained
interacting proteins that co-immunoprecipitated as marked with a circle (&).For more details about these interacting proteins, see Supplementary Tables
S3 and S4.
heart mitochondria, and subsequently separated by 1D SDS-
PAGE (Fig. 1, panels C and D). Overall, 10 out of 11
subunits of Complex III were identified by mass spectrom-
etry from both bovine and mouse mitochondria, and their
migration position indicated in Fig. 1C and D (for
comparison, see previous report Sun et al. [21] for the
analogous separation of Complex III subunits from rat
heart).
To obtain a more complete sequence coverage of the
immunopurified Complexes II and III from mouse and
bovine heart mitochondria, a combination of MALDI-MS
and nano-HPLC-ESI-MS/MS analysis was employed. The
mass spectrometric results of these latter studies are listed in
Tables 1–4. Following excision from the 1D SDS-PAGE
gel, protein bands were digested with trypsin and analyzed
by MALDI-MS prior to analysis by HPLC ESI-MS/MS. In
addition, all protein bands (except for the mouse Complex
III samples) were subjected to incubation with chymotrypsin
to provide overlapping sequence coverage. All the major 1D
SDS gel bands visualized by Coomassie staining obtained
were assigned as Complex II and Complex III subunits,
demonstrating the specificity of the monoclonal antibodies
and the effectiveness of the immunocapture protocol (see
Fig. 1 and Tables 1–4).
Although HPLC ESI-MS/MS provided the best overall
sequence coverage, in many cases the peptide mass finger-
print data acquired by MALDI-MS was sufficient to identify
the individual Complex II and III protein subunits.
Presumably, these identifications were possible due the
efficiency of the immunoprecipitation protocol combined by
1D SDS-PAGE separation that greatly decreased the overall
sample complexity. For example, Fig. 2 shows two MALDI-
MS spectra that contain molecular ions of peptides obtained
after in-gel tryptic digestion of selected mouse and bovine
protein bands from the 1D SDS-PAGE gels. Similarly, Fig.
2A shows 33 peptide mass fingerprints resulting from
tryptic digestion of mouse Complex II protein subunit 1 that
yielded a protein sequence coverage of 69% and a
corresponding Mascot Mowse (M) score of 310 (a Mowse
score of 25 or higher was considered significant for PMF
data in this study [18]). Likewise, Fig. 2B displays 30
peptide mass fingerprints resulting from tryptic digestion of
bovine Complex III subunit 1 (69% sequence coverage;
M=253). In both cases (Panels A and B), a single unique
protein subunit of Complex II or Complex III was found to
be the major component present in each corresponding gel
band. Several other subunits from Complexes II and III
could also be assigned after tryptic digestion by MALDI-
MS screening alone, with a maximum coverage of 73% (18
peptides, M=129) for bovine Complex III-6 (see Supple-
ment, Table S2).
The initial screening of the tryptic and chymotryptic
samples by MALDI-MS was then followed by more
detailed analyses using online nano-HPLC-ESI-MS/MS.
As expected, the HPLC-MS/MS approach provided a
significant increase in sequence coverage for both Complex

Table 3
Proteins identified by ESI-MS/MS from immunocaptured bovine heart Complex III
Complex III
protein subunitaTheor. No. tryptic
peptides
Tryptic seq.
coverage (M score)bNo. chymo.
peptides
Chymotryp. seq.
coverage (M score)bTotal sequence
coverage (%)MW�10�3 pIc
C III-1 49.9 5.5 32 41% (1000) 52 43% (424) 63
C III-2 46.6 7.8 28 49% (927) 61 55% (503) 74
C III-3 42.8 7.8 1d 2% (49) 1d 2% (22) 5
C III-4 27.6 6.5 16 52% (435) 7 24% (89) 65
C III-5 21.8 7.0 8 27% (238) 28 47% (246) 64
C III-6 13.5 9.1 18 64% (435) 3 19% (13) 66
C III-7 9.6 10.3 9 46% (242) – – 46
C III-8 9.5 4.5 3 19% (112) – – 19
C III-9 8.0 11.5 1d 17% (48) 4d 42% (86) 47
C III-10 7.2 9.5 3 51% (130) – – 51
C III-11 6.5 10.2 – – – – –
a Complex III protein subunits (descriptive subunit names): III-1 (core protein I), III-2 (core protein II), III-3 (cytochrome b), III-4 (cytochrome c1), III-5
(Rieske iron-sulfur subunit), III-6 (14 kDa subunit), III-7 (9.5 kDa subunit), III-8 (11 kDa subunit), III-9 (chain u), III-10 (7.2 kDa subunit), and III-11 (6.4 kDa
subunit).b Amino acid sequence coverage of mature (processed) proteins in %, Mascot database search score according to Perkins et al. [18].c Molecular weight and pI were calculated for the mature protein subunits, i.e., after processing of the precursor protein sequences (if applicable) that
contained mitochondrial import signals.d ESI-MS/MS spectrum and fragmentation pattern was inspected ‘‘manually’’ and evaluated (also see Fig. 3).
B. Schilling et al. / Biochimica et Biophysica Acta 1762 (2006) 213–222218
II and III subunits. Overall, all four protein subunits were
observed for bovine Complex II, and 3 of 4 subunits for
mouse Complex II. For Complex III, 10 out of the expected
11 protein subunits were identified both the bovine and
mouse immunocapture experiments. The smallest protein
subunit from Complex III, subunit 11 (III-11, 6.4 kDa
subunit), was not identified. Tables 1–4 summarize the
Table 4
Proteins identified by ESI-MS/MS from immunocaptured mouse heart
Complex III
Complex III
protein subunitaTheor. No. tryptic
peptides
Tryptic sequence
coverage
(M score)bMW�10�3 pIc
C III-1 49.8 5.3 36 65% (585)
C III-2 46.6 9.0 33 37% (612)
C III-3 43.3 7.8 1d 3% (30)d
C III-4 27.5 6.5 8 39% (122)
C III-5 21.7 7.0 12 27% (161)
C III-6 13.6 9.1 16 54% (206)
C III-7 9.8 10.3 9 40% (133)
C III-8 9.3 4.8 3 32% (72)
C III-9 7.9 11.6 1d 16% (14)d
C III-10 7.4 9.2 7 50% (130)
C III-11 6.5 9.8 – –
a Complex III protein subunits (descriptive subunit names): III-1 (core
protein I), III-2 (core protein II), III-3 (cytochrome b), III-4 (cytochrome
c1), III-5 (Rieske iron-sulfur subunit), III-6 (14 kDa subunit), III-7 (9.5 kDa
subunit), III-8 (11 kDa subunit), III-9 (chain u), III-10 (7.2 kDa subunit),
and III-11 (6.4 kDa subunit).b Amino acid sequence coverage of mature (processed) proteins in %,
Mascot database search score according to Perkins et al. [18].c Molecular weight and pI were calculated for the mature protein
subunits, i.e., after processing of the precursor protein sequences (if
applicable) that contained mitochondrial import signals as identified by
homology to the mature bovine sequences.d ESI-MS/MS fragmentation pattern was inspected manually, fragmenta-
tion was compared to identical peptide observed for homologous bovine
subunit.
mass spectrometric details of protein identification, includ-
ing information as to the number of peptides observed, the
Mascot Mowse scores, and protein sequence coverages
calculated for the mature (processed) protein subunits.
Mascot database search results of the ESI-MS/MS peptide
data are listed for both tryptic and chymotryptic digestions.
As can be seen from these data, high protein sequence
coverages were obtained for the majority of the subunits
from ESI-MS/MS data of the tryptic digests alone (average
coverage ¨40%). This trypsin-based protein sequence
coverage was improved further when combined with the
chymotryptic peptide data set, yielding a combined MS/MS
sequence coverage ranging from a high of 87% (II-1,
mouse) to a low of 5% (III-3, bovine), with a combined
average coverage of ¨59% (see Tables 1–4).
For two of the protein subunits from Complex III (III-3
and III-9, bovine, and mouse), we observed only one tryptic
peptide in each case by tandem mass spectrometry. The
individual Mascot scores for bovine III-3 and III-9 were 49
and 48, respectively, which corresponds to a confident
peptide assignment. Nevertheless, we manually inspected
these MS/MS spectra and fragmentation pattern of these 2
peptides to confirm the identity. The CID (collision-induced
dissociation) tandem mass spectrum of peptide SGPFAPVL-
SATSR (residues 8–20) from bovine Complex III subunit 9
(chain u), for example, is shown in Fig. 3. The molecular
ion, [M+2H]2+ at m/z 645.312+ (M=1288.61 Da) was
selected for collision-induced dissociation and the resulting
MS/MS spectrum revealed distinctive fragmentation,
including a nearly complete y-fragment ion series at m/z
175.1, 262.1, 434.3, 521.3, 634.3, 733.4, 830.5, 901.5, and
1048.6 (corresponding to fragment ions y1, y2, and y4–y10),
and several b-fragment ions at m/z 242.1, 389.2, and 460.2
(corresponding to fragment ions b3–b5). Similarly, the ESI-
MS/MS fragmentation pattern of the ‘‘one-peptide-hit’’

Fig. 2. MALDI-TOF mass spectra of Complex II subunit 1 (A) and
Complex III subunit 1 (B) obtained after immunoprecipitation from bovine
heart mitochondria and 1D SDS-PAGE separation. The MALDI-MS
peptide mass fingerprint spectra display molecular ions of peptides obtained
after in-gel tryptic digestion of the selected protein bands from a 1D SDS
PAGE gel. The observed masses are labeled and annotated with starting and
ending amino acids. Panel A shows 33 peptides resulting from tryptic
digestion of mouse mature/processed Complex II subunit 1 (mature Fp
protein subunit). Overall, a protein sequence coverage of 69% was observed
(Mowse score 310). Panel B shows 30 peptide mass fingerprints resulting
from tryptic digestion of bovine mature/processed Complex III subunit 1
(mature Core 1 subunit). Overall, a protein sequence coverage of 69% was
observed (Mowse score 253). Several more peptide mass fingerprints were
observed as marked with #1–#4, and correspond to the following sequences
in C II-1: #1=475–484 with m/z 1160.6; #2=594–604 with m/z of 1332.7;
#3=69–77 with m/z at 998.5; and #4=180–188 with m/z at 1067.5.
Fig. 3. ESI-MS/MS spectrum of peptide SGPFAPVLSATSR (residues 8–
20) after immunoprecipitation and tryptic digestion of bovine Complex III
subunit 9 (chain u). The molecular ion, [M+2H]2+ at m/z 645.312+
(M=1288.61 Da) was selected for collision-induced dissociation and a
distinctive series of y-fragment ions and several b-fragment ions were
observed. Fragment ions marked with * indicate internal fragment ions;
peaks marked with # indicate fragment ion loss of H2O.
B. Schilling et al. / Biochimica et Biophysica Acta 1762 (2006) 213–222 219
(DVNYGWIIR, residues 72–80) resulting from bovine
Complex III subunit 3 (cytochrome b) was also inspected
manually and was judged to be the correctly assigned based
on an overall quality MS/MS spectrum, the presence of
several b-ions and a significant y-ion series (y1–y7), also
compare similar evaluation criteria as reported by Link et al.
[19]. In addition, chymotryptic digestion of these specific
proteins generated additional peptides that confirmed these
subunit assignments and increased the overall coverage.
Interestingly, the corresponding homologous mouse proteins
Complexes III-9 and III-3 obtained after immunoisolation
from mouse heart, generated identical tryptic peptides,
SGPFAPVLSATSR and DVNYGWIIR, as the bovine
counterpart. The ESI-MS/MS spectra and fragmentation
patterns of these two mouse peptides were weaker but could
be compared to the fragmentation patterns obtained from the
identical bovine peptides and properly validated.
As described above, all protein subunits from both
bovine and mouse Complexes II and III were identified by
mass spectrometry, with the exception of subunit 11 from
Complex III. All of these subunits could be matched to the
major bands as visualized by 1D SDS PAGE (see Fig. 1)
after immunoprecipitation. However, some ‘‘co-precipitat-
ing/interacting proteins’’ were also identified at low to very
low abundance levels in regions of the gel lane where
the protein dye stain was barely visible. Most of these
low abundance co-precipitating proteins were found to be
subunits from other electron transport chain complexes, and
may, in fact, be components of so-called Fsupercomplexes_[22–24]. A complete list of these co-precipitating proteins
can be found in the Supplementary Tables S3 and S4.
3.2. Posttranslational modifications of Complexes II and III
protein subunits
As part of our efforts to purify and identify the subunits
of Complexes II and III, we also examined these separated
proteins for the presence of posttranslational modifications
(PTMs). The mass spectrometric dataset obtained from the
immunoprecipitation experiments was therefore exhaus-
tively searched against custom-designed databases that
included all proteins for the bovine and mouse Complexes
II and III (for database information see Materials and
methods and Supplementary Table S1). Searching custom
databases using our in-house Mascot server allowed us to
perform less restrictive searches, essentially allowing for all
possible PTMs. Using this search, we observed modifica-

B. Schilling et al. / Biochimica et Biophysica Acta 1762 (2006) 213–222220
tions of several protein subunits including N-terminal
acetylation, as well as several oxidative and non-enzymatic
modifications, such as deamidation of Asn, oxidation of Trp
to formylkynurenine, oxidation of Met to the sulphone, and
oxidation of Cys to cysteic acid (for a more detailed list of
modified subunits see Supplementary Table S5). An
example of a modified peptide is shown in Supplementary
Fig. S1, where the tandem mass spectrum (ESI-MS/MS) of
N-acetylated peptide AGRPAVSASSR is shown, confirm-
ing previous observations [25] that the bovine Complex III
protein subunit 6 (14 kDa subunit) is processed by the
removal of the N-terminal methionine and N-acetylated at
alanine. The analogous acetylation event was also observed
for mouse Complex III subunit 6 (see Supplementary Table
S5), which had not previously been identified.
As another example of a protein modification present
in this MS data set, a tryptic peptide from mouse Complex
II subunit 1 (Fp/flavoprotein subunit) corresponding to
residues Ser-55 –Arg-77 (SHTVAAQGGINAALGN-
MEEDNWR) was identified. This peptide, however, was
shifted in mass by 783 Da corresponding to the presence of
a covalently bound flavin adenine dinucleotide (FAD)
group. This FAD-containing peptide was observed at m/z
1075.43+ (M=3223.2 Da) and after collision-induced
dissociation the spectra shown in Fig. 4 was obtained.
Although an extensive y-ion series was observed (y1–y16),
Fig. 4. ESI-MS/MS spectrum of FAD-modified peptide isolated following
immunoprecipitation, 1D SDS-PAGE separation and tryptic digestion of
mouse Complex II. Peptide SHTVAAQGGINAALGNMEEDNWR (resi-
dues Ser-55–Arg-77) originates from the Fp subunit and contains an intact
flavin adenine dinucleotide (FAD) covalently bound to His-56. FAD
contributes 783.1 Da to the mass of the peptide. The molecular ion,
[M+3H]3+ at m/z 1075.43+ (M=3223.2 Da) gave an extensive series of
y(n)-fragment ions after collision-induced dissociation. The b-fragment ions
exhibited loss of adenosine monophosphate (AMP) from the FAD
modification, but still showed the flavin moiety. For example, the b(n)*-
ions show a mass shift of 436 Da compared to the corresponding values
expected for the unmodified peptide. Abbreviations A: adenine; AMP:
adenosine monophosphate. A more complete description of the fragmenta-
tion mechanism of FAD modified peptides can be found in a report by
Halada et al. [30] for pyranose 2-oxidase.
this series gave no information as to the location of the FAD
group as this group appears to be located close to the N-
terminus of the fragmented peptide. Caused by gas phase
reactions, two abundant ions resulting from FAD itself were
observed at m/z 136.1 (adenine; ‘‘A’’) and 348.1 (AMP). In
contrast to the y-ion series, an extensive b*-ion series
exhibited a mass shift that could be directly correlated to the
position of the FAD moiety. These b*-fragment ions showed
a loss of adenosine monophosphate (AMP) from the FAD
modification, but with the flavin moiety attached (+436 Da)
when compared to the expected masses of the unmodified b-
ions. Overall, the fragmentation pattern clearly proved the
FAD group to be covalently attached to residue His-56 as
one might expect from ‘‘prediction by similarity’’ for the
mouse Complex II protein subunit 1.
4. Discussion
In this current study, we have provided a thorough
proteomic analysis of the two smallest OXPHOS compo-
nents, Complexes II and III, each obtained by selective
immunocapture from both mouse and bovine mitochondria.
Mass spectrometric sequence analysis of the immunopuri-
fied proteins led to the identification of 4 out of the 4
subunits of bovine Complex II (3/4 for mouse Complex II),
and to the identification of 10 out of the 11 subunits of
bovine and mouse Complex III. The only protein subunit
that was not identified in this study was Complex III subunit
11, a small 6.4 kDa protein (56 residues) that contains a 21-
amino acid transmembrane domain. Although the large
majority of subunits were identified with a high sequence
coverage, some subunits were more difficult. For example,
although bovine Complex II subunit 4, a small membrane-
anchoring cytochrome b associated subunit, was identified
by mass spectrometry, only 3 peptides were assigned by
MS/MS and these peptides were located outside the large
transmembrane domain for a total sequence coverage of
16%. As the mature bovine II-4 subunit contains 103
residues (11.1 kDa) and residues 15–35 and 70–86 form
transmembrane domains, this is not surprising. Indeed, Yang
et al. [26] also described similar difficulties in identifying
this subunit from E. coli that was compounded by low
staining intensities with Coomassie Blue.
The monoclonal antibodies used in these studies for the
immunocapture of Complexes II and III were initially
described by Murray et al. [16]. Interestingly, these two
antibodies were originally developed against bovine Com-
plexes II and III, but worked equally well against the two
analogous mouse complexes. This high degree of cross-
reactivity is not unexpected given the high sequence identity
between the bovine and mouse subunits, ranging from a
high of 96% to a low of 79% (see Supplementary Table S1).
These antibodies have also proven effective in immunopre-
cipitating Complexes II and III from human mitochondria
(data not shown) suggesting they may prove effective

B. Schilling et al. / Biochimica et Biophysica Acta 1762 (2006) 213–222 221
against other mammalian species, and possibly some non-
mammalian species such as C. elegans where a high level of
protein subunit sequence identity exists [27].
The ability to obtain a high sequence coverage is a
generally a necessary requirement for detecting post-trans-
lational modifications. To graphically present sequence our
coverage data (see Tables 1–4), a Java program named
‘‘SeqDisp’’ was developed in-house as described previously
[12]. A specific case is shown in Supplementary Material
(Fig. S2) where the sequence coverage of mouse Complex II
subunit 2 is displayed for individual experiments using
trypsin (71% coverage) and chymotrypsin (45% coverage),
yielding a combined coverage of 80%. Such graphic
displays of experimental sequence data were performed
for each individual subunit (data not shown) and are useful
to optimize experimental conditions to target specific
posttranslational modifications.
With the rather extensive proteomic/mass spectrometric
data set obtained in our studies, we were able to identify
several posttranslational modifications, including N-termi-
nal acetylation (see Supplementary Fig. S1), as well as
several oxidative and non-enzymatic modifications, such as
deamidation of Asn, oxidation of Trp to formylkynurenine,
oxidation of Met to form a sulphone, and oxidation of Cys
to form a cysteic acid (see Supplementary Table S5). These
latter oxidative (non-enzymatic) modifications, however,
need to be evaluated under more carefully controlled
conditions before any biological significance can be
established. Nonetheless, we were able to identify the
covalent FAD modification of mouse Complex II subunit
1, the Fp (flavoprotein) subunit, and determine the site of
modification as residue His-56. This histidine residue was
‘‘predicted by similarity’’ to carry the FAD modification (see
Swiss-Prot entry for accession number Q8K2B3; gene name
DHSA_MOUSE), our data now validates this prediction.
The FAD moiety (D =783 Da) is quite a large covalent
protein modification consisting of several components, the
flavinmononucleotide (FMN) and adenosine monophos-
phate (AMP) [28,29]. Previously, mass spectrometric
studies have been performed on proteins and peptides
containing FAD [30,31]. It is often challenging to find
conditions that maintain a covalently bound FAD group,
suggesting that the immunopurification and sample han-
dling protocols are mild enough to maintain this and other
protein modifications.
Studies are now underway to identify other posttransla-
tional modifications in these and other OXPHOS com-
plexes, including both enzymatic (e.g., phosphorylation)
and non-enzymatic modifications, especially those that
might arise from oxidative stress [1,32]. To address this
latter point, we have recently developed a stable isotope
methodology [33] using differential alkylation to determine
the oxidative status of cysteine residues in proteins, such as
glutathionylation and nitrosylation. The application of this
latter method in the context of the immunopurification and
proteomic characterization strategy of OXPHOS complexes
described here should hopefully allow one to assess changes
in the oxidation status at both the subunit and the amino acid
level. In general, the ability to isolate highly purified
Complexes II and III (and other OXPHOS enzymes) from
rodent and other mammalian sources provides a powerful
means to examine a wide variety of potential defects or
modifications in specific subunits that make up these
enzymes.
Acknowledgement
This work was supported by NIH R21 NS 043620-01
grant to B.W.G.
Appendix A. Supplementary data
Supplementary data associated with this article can be
found, in the online version, at doi:10.1016/j.bbadis.2005.
07.003.
References
[1] I. Dalle-Donne, A. Scaloni, D. Giustarini, E. Cavarra, G. Tell, G.
Lungarella, R. Colombo, R. Rossi, A. Milzani, Proteins as biomarkers
of oxidative/nitrosative stress in diseases: the contribution of redox
proteomics, Mass Spectrom. Rev. 24 (2005) 55–99.
[2] D.G. Nicholls, Mitochondrial function and dysfunction in the cell: its
relevance to aging and aging-related disease, Int. J. Biochem. Cell
Biol. 34 (2002) 1372–1381.
[3] L. van den Heuvel, J. Smeitink, The oxidative phosphorylation
(OXPHOS) system: nuclear genes and human genetic diseases,
Bioessays 23 (2001) 518–525.
[4] P. Rustin, A. Rotig, Inborn errors of complex II—Unusual human
mitochondrial diseases, Biochim. Biophys. Acta 1553 (2002) 117–122.
[5] P. Rustin, A. Munnich, A. Rotig, Succinate dehydrogenase and human
diseases: new insights into a well-known enzyme, Eur. J. Hum. Genet.
10 (2002) 289–291.
[6] A.H. Schapira, J.M. Cooper, D. Dexter, J.B. Clark, P. Jenner, C.D.
Marsden, Mitochondrial complex I deficiency in Parkinson’s disease,
J. Neurochem. 54 (1990) 823–827.
[7] M.F. Beal, Neurochemistry and toxin models in Huntington’s disease,
Curr. Opin. Neurol. 7 (1994) 542–547.
[8] C. Jung, C.M. Higgins, Z. Xu, Mitochondrial electron transport chain
complex dysfunction in a transgenic mouse model for amyotrophic
lateral sclerosis, J. Neurochem. 83 (2002) 535–545.
[9] B.J. Hanson, B. Schulenberg, W.F. Patton, R.A. Capaldi, A novel
subfractionation approach for mitochondrial proteins: a three-
dimensional mitochondrial proteome map, Electrophoresis 22
(2001) 950–959.
[10] S.W. Taylor, D.E. Warnock, G.M. Glenn, B. Zhang, E. Fahy, S.P.
Gaucher, R.A. Capaldi, B.W. Gibson, S.S. Ghosh, An alternative
strategy to determine the mitochondrial proteome using sucrose
gradient fractionation and 1D PAGE on highly purified human heart
mitochondria, J. Proteome Res. 1 (2002) 451–458.
[11] J. Murray, B. Zhang, S.W. Taylor, D. Oglesbee, E. Fahy, M.F.
Marusich, S.S. Ghosh, R.A. Capaldi, The subunit composition of the
human NADH dehydrogenase obtained by rapid one-step immuno-
purification, J. Biol. Chem. 278 (2003) 13619–13622.
[12] B. Schilling, M.M.S. Bharath, R.H. Row, J. Murray, M.P. Cusack, R.A.

B. Schilling et al. / Biochimica et Biophysica Acta 1762 (2006) 213–222222
Capaldi, C.R. Freed, K.N. Prasad, J.K. Andersen, B.W. Gibson, Rapid
purification and mass spectrometric characterization of mitochondrial
NADH dehydrogenase (Complex I) from rodent brain and a dopami-
nergic neuronal cell line, Mol. Cell. Proteomics 4 (2005) 84–96.
[13] R. Aggeler, J. Coons, S.W. Taylor, S.S. Ghosh, J.J. Garcia, R.A.
Capaldi, M.F. Marusich, A functionally active human F1F0 ATPase
can be purified by immunocapture from heart tissue and fibroblast cell
lines. Subunit structure and activity studies, J. Biol. Chem. 277 (2002)
33906–33912.
[14] M. Lib, A. Rodriguez-Mari, M.F. Marusich, R.A. Capaldi,
Immunocapture and microplate-based activity measurement of
mammalian pyruvate dehydrogenase complex, Anal. Biochem. 314
(2003) 121–127.
[15] A. Smith, Preparation, properties, and conditions for assay of
mitochondria: slaughterhouse material, Methods Enzymol. 10 (1967)
81–86.
[16] J. Murray, M.F. Marusich, R.A. Capaldi, R. Aggeler, Focused
proteomics: monoclonal antibody-based isolation of the oxidative
phosphorylation machinery and detection of phosphoproteins using a
fluorescent phosphoprotein gel stain, Electrophoresis 25 (2004)
2520–2525.
[17] U.K. Laemmli, Cleavage of structural proteins during the assembly of
the head of bacteriophage T4, Nature 227 (1970) 680–685.
[18] D.N. Perkins, D.J. Pappin, D.M. Creasy, J.S. Cottrell, Probability-
based protein identification by searching sequence databases using
mass spectrometry data, Electrophoresis 20 (1999) 3551–3567.
[19] A.J. Link, J. Eng, D.M. Schieltz, E. Carmack, G.J. Mize, D.R. Morris,
B.M. Garvik, J.R. Yates 3rd, Direct analysis of protein complexes
using mass spectrometry, Nat. Biotechnol. 17 (1999) 676–682.
[20] X.Q. Huang, W. Miller, A time-efficient, linear-space local similarity
algorithm, Adv. Appl. Math. 12 (1991) 337–357.
[21] G. Sun, M.T. Kinter, V.E. Anderson, Mass spectrometric character-
ization of mitochondrial electron transport complexes: subunits of the
rat heart ubiquinol-cytochrome c reductase, J. Mass Spectrom. 38
(2003) 531–539.
[22] H. Schagger, K. Pfeiffer, Supercomplexes in the respiratory chains of
yeast and mammalian mitochondria, EMBO J. 19 (2000) 1777–1783.
[23] C.M. Cruciat, S. Brunner, F. Baumann, W. Neupert, R.A. Stuart, The
cytochrome bc1 and cytochrome c oxidase complexes associate to
form a single supracomplex in yeast mitochondria, J. Biol. Chem. 275
(2000) 18093–18098.
[24] N.V. Dudkina, H. Eubel, W. Keegstra, E.J. Boekema, H.P. Braun,
Structure of a mitochondrial supercomplex formed by respiratory-
chain complexes I and III, Proc. Natl. Acad. Sci. U. S. A. 102 (2005)
3225–3229.
[25] S. Wakabayashi, T. Takao, Y. Shimonishi, S. Kuramitsu, H. Matsu-
bara, T. Wang, Z. Zhang, T.E. King, Complete amino acid sequence of
the ubiquinone binding protein (QP-C), a protein similar to the
14,000-dalton subunit of the yeast ubiquinol-cytochrome c reductase
complex, J. Biol. Chem. 260 (1985) 337–343.
[26] X. Yang, L. Yu, C.A. Yu, Resolution and reconstitution of succinate-
ubiquinone reductase from Escherichia coli, J. Biol. Chem. 272
(1997) 9683–9689.
[27] W.Y. Tsang, B.D. Lemire, The role of mitochondria in the life of the
nematode, Caenorhabditis elegans, Biochim. Biophys. Acta 1638
(2003) 91–105.
[28] O. Dym, D. Eisenberg, Sequence-structure analysis of FAD-containing
proteins, Protein Sci. 10 (2001) 1712–1728.
[29] D.E. Edmondson, P. Newton-Vinson, The covalent FAD of mono-
amine oxidase: structural and functional role and mechanism of the
flavinylation reaction, Antioxid. Redox Signal. 3 (2001) 789–806.
[30] P. Halada, C. Leitner, P. Sedmera, D. Haltrich, J. Volc, Identification
of the covalent flavin adenine dinucleotide-binding region in
pyranose 2-oxidase from Trametes multicolor, Anal. Biochem. 314
(2003) 235–242.
[31] L.J. Chlumsky, A.W. Sturgess, E. Nieves, M.S. Jorns, Identification of
the covalent flavin attachment site in sarcosine oxidase, Biochemistry
37 (1998) 2089–2095.
[32] B.W. Gibson, Exploiting proteomics in the discovery of drugs that
target mitochondrial oxidative damage, Sci. Aging Knowledge
Environ. 2004 (2004) pe12.
[33] B. Schilling, C.B. Yoo, C.J. Collins, B.W. Gibson, Determining
cysteine oxidation status using differential alkylation, Int. J. Mass
Spectrom. 236 (2004) 117–127.
Copyright © 2022 FDOKUMEN