Protein–DNA interfaces: a molecular dynamics analysis of ...
13
9990–10002 Nucleic Acids Research, 2016, Vol. 44, No. 20 Published online 21 September 2016 doi: 10.1093/nar/gkw841 Protein–DNA interfaces: a molecular dynamics analysis of time-dependent recognition processes for three transcription factors Lo¨ ıc Etheve, Juliette Martin and Richard Lavery * MMSB UMR 5086 CNRS/University of Lyon I, Institut de Biologie et Chimie des Prot´ eines, 7 passage du Vercors, Lyon 69367, France Received July 7, 2016; Revised September 12, 2016; Accepted September 13, 2016 ABSTRACT We have studied the dynamics of three transcription factor–DNA complexes using all-atom, microsecond- scale MD simulations. In each case, the salt bridges and hydrogen bond interactions formed at the protein–DNA interface are found to be dynamic, with lifetimes typically in the range of tens to hundreds of picoseconds, although some interactions, notably those involving specific binding to DNA bases, can be a hundred times longer lived. Depending on the complex studied, this dynamics may or may not lead to the existence of distinct conformational substates. Using a sequence threading technique, it has been possible to determine whether DNA sequence recog- nition is sensitive or not to such conformational changes, and, in one case, to show that recognition appears to be locally dependent on protein-mediated cation distributions. INTRODUCTION We recently carried out a molecular dynamics study of the interface dynamics of the complex between SKN-1, a tran- scription factor and its DNA cognate binding site (1). We found that arginine-phosphate salt bridges broke and re- formed regularly with lifetimes of the order of hundreds of picoseconds. This result was in line with recent nuclear mag- netic resonance (NMR) experiments (2–4), coupled with computational studies (5), showing that lysine-phosphate salt bridges were also dynamic within protein–DNA com- plexes. However, in the case of our work, we found that some arginine side chains could oscillate between backbone and base binding sites. By identifying the distinct conforma- tional substates associated with these movements, and using a sequence threading technique to analyze binding selectiv- ity, we found that different arginine-linked substates could explain different parts of the experimentally observed con- sensus binding sequence. It thus appeared that recognition, at least with this particular transcription factor, was the re- sult of a dynamic process. In order to test whether this result can be generalized, we have now extended our study to three other transcrip- tion factor–DNA complexes involving both major and mi- nor groove binding and different degrees of protein-induced DNA deformation. First, we chose the ubiquitous TATA- box binding protein (TBP) that, as part of the TFIID factor, initiates the assembly of the transcriptosome on core pro- moters. TBP binds in the minor groove of the double helix via an extended -sheet, producing a large DNA deforma- tion, opening the minor groove, unwinding the double helix, bending it away from the protein and creating kinks at ei- ther end of the binding site due to the partial intercalation of phenylalanine residues (6). For the second protein, we chose sex-determining Y protein (SRY) that again binds in the minor groove, but this time via an -helix and a flexible cationic tail (7). SRY binding, that also includes the partial intercalation of an isoleucine residue, again deforms DNA, but less extensively than TBP. The third protein chosen was the P22 c2 repressor (8). P22 is a homodimer that binds at two major groove sites separated by one turn of the double helix. P22 binding produces limited DNA deformation, but includes the close packing of DNA methyl groups around a valine residue within each half-site. In addition to the differences already mentioned, our chosen proteins differ in the extent of their direct, and pre- sumably sequence-specific, contacts between amino acid side chains and DNA bases. There are relatively few such contacts with TBP, only one in each half-site of P22, but many with SRY. This suggests that the balance between so- called direct and indirect recognition will vary significantly for these three proteins. We have carried out microsecond-scale simulations on each of these complexes in water at a physiologically reason- able salt concentration and also performed reference simu- lations on the corresponding, isolated DNA oligomers. The results show that most protein–DNA contacts fluctuate on a sub-nanosecond timescale. A subset of these contacts oscil- late between different DNA target sites, and a further subset * To whom correspondence should be addressed. Tel: +33 4 7272 2637; Fax: +33 4 7272 2604; Email: [email protected] C The Author(s) 2016. Published by Oxford University Press on behalf of Nucleic Acids Research. This is an Open Access article distributed under the terms of the Creative Commons Attribution License (http://creativecommons.org/licenses/by-nc/4.0/), which permits non-commercial re-use, distribution, and reproduction in any medium, provided the original work is properly cited. For commercial re-use, please contact [email protected] Downloaded from https://academic.oup.com/nar/article/44/20/9990/2608006 by guest on 30 March 2022
-
Upload
khangminh22 -
Category
Documents
-
view
1 -
download
0
Transcript of Protein–DNA interfaces: a molecular dynamics analysis of ...
9990–10002 Nucleic Acids Research, 2016, Vol. 44, No. 20 Published online 21 September 2016doi: 10.1093/nar/gkw841
Protein–DNA interfaces: a molecular dynamicsanalysis of time-dependent recognition processes forthree transcription factorsLoıc Etheve, Juliette Martin and Richard Lavery*
MMSB UMR 5086 CNRS/University of Lyon I, Institut de Biologie et Chimie des Proteines, 7 passage du Vercors,Lyon 69367, France
Received July 7, 2016; Revised September 12, 2016; Accepted September 13, 2016
ABSTRACT
We have studied the dynamics of three transcriptionfactor–DNA complexes using all-atom, microsecond-scale MD simulations. In each case, the salt bridgesand hydrogen bond interactions formed at theprotein–DNA interface are found to be dynamic, withlifetimes typically in the range of tens to hundredsof picoseconds, although some interactions, notablythose involving specific binding to DNA bases, canbe a hundred times longer lived. Depending on thecomplex studied, this dynamics may or may not leadto the existence of distinct conformational substates.Using a sequence threading technique, it has beenpossible to determine whether DNA sequence recog-nition is sensitive or not to such conformationalchanges, and, in one case, to show that recognitionappears to be locally dependent on protein-mediatedcation distributions.
INTRODUCTION
We recently carried out a molecular dynamics study of theinterface dynamics of the complex between SKN-1, a tran-scription factor and its DNA cognate binding site (1). Wefound that arginine-phosphate salt bridges broke and re-formed regularly with lifetimes of the order of hundreds ofpicoseconds. This result was in line with recent nuclear mag-netic resonance (NMR) experiments (2–4), coupled withcomputational studies (5), showing that lysine-phosphatesalt bridges were also dynamic within protein–DNA com-plexes. However, in the case of our work, we found thatsome arginine side chains could oscillate between backboneand base binding sites. By identifying the distinct conforma-tional substates associated with these movements, and usinga sequence threading technique to analyze binding selectiv-ity, we found that different arginine-linked substates couldexplain different parts of the experimentally observed con-sensus binding sequence. It thus appeared that recognition,
at least with this particular transcription factor, was the re-sult of a dynamic process.
In order to test whether this result can be generalized,we have now extended our study to three other transcrip-tion factor–DNA complexes involving both major and mi-nor groove binding and different degrees of protein-inducedDNA deformation. First, we chose the ubiquitous TATA-box binding protein (TBP) that, as part of the TFIID factor,initiates the assembly of the transcriptosome on core pro-moters. TBP binds in the minor groove of the double helixvia an extended �-sheet, producing a large DNA deforma-tion, opening the minor groove, unwinding the double helix,bending it away from the protein and creating kinks at ei-ther end of the binding site due to the partial intercalationof phenylalanine residues (6). For the second protein, wechose sex-determining Y protein (SRY) that again binds inthe minor groove, but this time via an �-helix and a flexiblecationic tail (7). SRY binding, that also includes the partialintercalation of an isoleucine residue, again deforms DNA,but less extensively than TBP. The third protein chosen wasthe P22 c2 repressor (8). P22 is a homodimer that binds attwo major groove sites separated by one turn of the doublehelix. P22 binding produces limited DNA deformation, butincludes the close packing of DNA methyl groups around avaline residue within each half-site.
In addition to the differences already mentioned, ourchosen proteins differ in the extent of their direct, and pre-sumably sequence-specific, contacts between amino acidside chains and DNA bases. There are relatively few suchcontacts with TBP, only one in each half-site of P22, butmany with SRY. This suggests that the balance between so-called direct and indirect recognition will vary significantlyfor these three proteins.
We have carried out microsecond-scale simulations oneach of these complexes in water at a physiologically reason-able salt concentration and also performed reference simu-lations on the corresponding, isolated DNA oligomers. Theresults show that most protein–DNA contacts fluctuate on asub-nanosecond timescale. A subset of these contacts oscil-late between different DNA target sites, and a further subset
*To whom correspondence should be addressed. Tel: +33 4 7272 2637; Fax: +33 4 7272 2604; Email: [email protected]
C© The Author(s) 2016. Published by Oxford University Press on behalf of Nucleic Acids Research.This is an Open Access article distributed under the terms of the Creative Commons Attribution License (http://creativecommons.org/licenses/by-nc/4.0/), whichpermits non-commercial re-use, distribution, and reproduction in any medium, provided the original work is properly cited. For commercial re-use, please [email protected]
Dow
nloaded from https://academ
ic.oup.com/nar/article/44/20/9990/2608006 by guest on 30 M
arch 2022
Nucleic Acids Research, 2016, Vol. 44, No. 20 9991
are able to modulate the optimal DNA binding sequence ofthe protein.
While the sequence-threading technique we previouslydeveloped is an essential part of this study, for computa-tional reasons it cannot treat explicit water molecules, orions, at the protein–DNA interface (9,10). For the casesstudied here this restriction actually helps in determiningwhether such ‘environmental factors’ indeed play an impor-tant role in the recognition mechanisms of the proteins wehave studied.
MATERIALS AND METHODS
Starting conformations
The initial construction of our three chosen protein–DNAcomplexes was based on coordinates drawn from the Pro-tein Data Bank (11): the crystal structure of human TBP ata resolution of 1.9 A (1CDW; (6)), the NMR structure ofhuman SRY (1J46; (7)) and the crystal structure of lamb-doid bacteriophage P22 c2 repressor (P22) at a resolutionof 1.53 A (2R1J; (8)). The internal/helicoidal variable mod-eling program JUMNA (12) was used to construct com-plexes within oligomers containing the experimentally stud-ied binding sequences, maintaining the conformation of theprotein and of the protein–DNA interface. We used a 16-mer for TBP, a 14-mer for SRY and a 20-mer for the dimericP22. Their exact sequences are shown and discussed in theresults section.
MD simulations
The initial conformations of the protein/DNA complexeswere solvated with SPC/E water molecules (13). Periodicboundary conditions were imposed using a truncated octa-hedral box, ensuring a solvent shell of at least 10 A aroundthe solute. The solute was neutralized with potassium ionsand then sufficient K+/Cl− ion pairs were added to reach aconcentration of 150 mM. The ions were initially placed atrandom, but at least 5 A from DNA and 3.5 A from one an-other. The resulting systems contained between 9800 and 11200 water molecules, corresponding to a total of 33 456, 32516 and 37 091 atoms for the TBP, SRY and P22 complexesrespectively.
Molecular dynamics simulations were performed withthe AMBER 12 suite of programs (14,15) using PARM99parameters (16) and the bsc0 modifications (17) for the so-lute and Dang parameters (18) for the surrounding ions.Simulations employed periodic boundary conditions andelectrostatic interactions were treated using the particle-mesh Ewald algorithm (19,20) with a real space cutoff of9 A. Lennard–Jones interactions were truncated at 9 A. Apair list was built with a buffer region and a list update wastriggered whenever a particle moved by more than 0.5 Awith respect to the previous update.
Each system was initially subjected to energy minimiza-tion with harmonic restraints of 25 kcal mol−1 A−2 on thesolute atoms. The system was then heated to 300 K at con-stant volume during 100 ps. Constraints were then relaxedfrom 5 to 1 kcal mol−1 A−2 during a series of 1000 stepsof energy minimization (500 steps of steepest descent and
500 steps of conjugate gradient) followed by 50 ps of equili-bration with restraints of 0.5 mol−1 A−2 and 50 ps withoutsolute restraints. The 500 ns production simulations (or 1�s in the case of P22) were carried out at constant tempera-ture (300 K) and pressure (1 bar) with a 2 fs time step. Dur-ing these simulations pressure and temperature were main-tained using the Berendsen algorithm (21) with a couplingconstant of 5 ps and SHAKE constraints were applied toall bonds involving hydrogens (22). Conformational snap-shots were saved for further analysis every ps. For compari-son purposes, the isolated DNA oligomers from each com-plex were also simulated alone using an identical protocol,creating a second set of 500 ns trajectories.
Conformational and environmental analysis
Average DNA conformation, DNA conformational fluctu-ations and ion distributions around the protein/DNA com-plexes during the MD simulations were analyzed with theCurves+ program (23) and the Canal and Canion utilities(https://bisi.ibcp.fr/tools/curves plus/). In addition to intra-bp, inter-bp and bp-axis parameters Curves+ can calculategroove geometries and the overall bend of a helical axis.Note that the values of axis bend presented here ignore theterminal base pairs of the oligomers since these often sufferfrom local deformations.
Using the recently developed Curves+ ion analysis ap-proach, based on describing ion positions using curvilinearhelicoidal coordinates with respect to the DNA helical axis,it was notably possible to calculate average ion molaritiesand ion populations within the DNA grooves (24,25). As inour earlier work, the groove limit was set at a radius of 10.25A from the DNA helical axis (the average radial positionof the backbone phosphorus atoms), while the angular lim-its defining the major and minor grooves were determinedby the average position of the sugar C1’ atoms. Spatial iondensities, and all molecular graphics, were generated usingChimera (26,27).
Lastly, hydrogen bond and salt bridges were analyzed us-ing AMBER Tools (28). We chose to limit our analysis todirect interactions by applying a distance cut-off of ≤3.5A between the relevant heavy atoms and an angle cut-off of≥135◦ at the intervening hydrogen atom. These interactionsare characterized by the percentage of the trajectory duringwhich they are observed (% presence) and by their averagelifetimes, which are calculated ignoring interruptions in theinteraction that last less than 1 ps. As shown in Supplemen-tary Figure S1, for the case of salt bridges, longer range in-teractions, notably in the range 3.5–6.0 A (presumably in-volving a bridging water molecule (5)) exist and even moredistant interactions (generally involving concurrent interac-tions with a neighboring nucleic acid residue) can also oc-cur. It is however difficult to characterize these indirect in-teractions with a simple distance criteria and they have beenexcluded from the present analysis.
Clustering the MD trajectory
In order to identify conformational clusters within the MDtrajectory, we began by extracting snapshots every 200 ps.Since we were principally interested in the evolution of
Dow
nloaded from https://academ
ic.oup.com/nar/article/44/20/9990/2608006 by guest on 30 M
arch 2022
9992 Nucleic Acids Research, 2016, Vol. 44, No. 20
the protein–DNA binding specificity, we characterized eachsnapshot by counting the number of contacts between theprotein and the DNA bases. Each contact between heavyatoms scored 1 for distances rij below 4 A (using shorterdistances would result in many transient ‘breaks’ that addnoise to the analysis). In order to further increase the ro-bustness, we used a buffer zone from 4 A to 5 A over whichthe score was modulated with a sigmoidal function s(i,j) ofthe distance rij between the atoms i and j:
s(i, j ) = 1
1 + e10∗(ri j −4.5)
This analysis yielded a rectangular Na amino acid by Nbbase matrix for each snapshot. The overall distance d(x,y)between any two such matrices x and y was then calculatedusing the Manhattan algorithm (29).
d (x, y) =Na∑
k=1
Nb∑
l=1
|xkl − ykl |
Next, the Ward agglomerative hierarchical clusteringmethod (30–32) was used to classify the different snapshotsinto groups by minimizing the variance within each clusterand increasing the weighted squared distance between clus-ter centers. The distance matrix and cluster representationswere obtained using the R software package (33).
When an MD trajectory shows the existence of confor-mational substates, we create new clustered maps for eachamino acid at the interface. These component maps indicatewhich residue, or residues, are responsible for the observedchanges and, in the case that several residues are involved,indicate whether these residues act together or separately tocreate conformational substates.
Binding specificity analysis
Binding specificity was determined for any chosen snapshotfrom the MD trajectory (after a brief Cartesian coordinateenergy minimization to remove bond length and base planedeformations) using the so-called ADAPT sequence thread-ing approach (9,10) implemented within the JUMNA pro-gram (12). This consists of calculating the complex forma-tion energy of the protein–DNA complex for all possibleDNA base sequences and then deriving a position weightmatrix (PWM) from the best binding sequences. In orderto do this, it is necessary to thread all possible base se-quences into the binding site of the DNA oligomer withinthe complex, adapting the protein–DNA interface in eachcase using internal coordinate energy minimization. Mini-mization was performed with the same AMBER parameter-ization used for the MD simulations, but replacing the ex-plicit solvent and ion shell with a simple continuum modelusing a sigmoidal distance-dependent dielectric functionand reduced phosphate charges (10). In parallel, an iden-tical base sequence is threaded into the average conforma-tion of the isolated DNA oligomer and energy minimizationis again performed. Finally, another energy minimization isperformed for the isolated protein (with flexibility limited tothe side chains included within the interface cutoff distance,see below).
Subtracting the isolated DNA oligomer and protein en-ergies from the protein–DNA complex energy yields thecomplex formation energy, which can be further analyzedin terms of two components: the DNA deformation energyand the protein–DNA interaction energy. In this work, weused ADAPT to scan 8, 10 and 20 bp belonging to the bind-ing sites of the TBP, SRY and P22 complexes respectively(this implies analyzing binding for between 6.5 × 10⁴ and1.1 × 1012 potential base sequences). ADAPT calculationsachieve this task by a divide-and-conquer technique, break-ing each sequence down into overlapping 5 bp fragmentsand thus dramatically reducing the total number of calcu-lations for the complex and for the isolated DNA oligomer,without significant loss of accuracy (10). Protein flexibilitywas also limited to side chains within 20 A of the protein–DNA interface. The energies resulting from this analysiswere converted into PWMs using the WebLogo software(34). Finally, by analyzing the binding specificity derivedfrom the sequence-dependent DNA deformation energy, orfrom the sequence-dependent protein–DNA interaction en-ergy we could also describe binding specificity in terms ofits so-called indirect and direct components.
We remark that the utility programs associated withADAPT have been extended to be able to derive a singlePWM from a number of MD snapshots belonging to a givenconformational substate (in the present work, between 5and 10 snapshots per substate, depending on its overall du-ration). In this case, ADAPT calculations were based onsequence-dependent energy differences with respect to theminimum energy for each snapshot, enabling us to over-come sequence-independent energy changes mainly causedby the necessary simplification of the electrostatic calcula-tions (which rely on a rudimentary implicit solvent repre-sentation). Using this approach it was possible to describethe sequence selectivity of each of the conformational sub-states detected by the cluster analysis and to compare thisto the consensus selectivity for the entire MD simulation, orto experimental binding data.
RESULTS AND DISCUSSION
TATA-box binding protein (TBP)
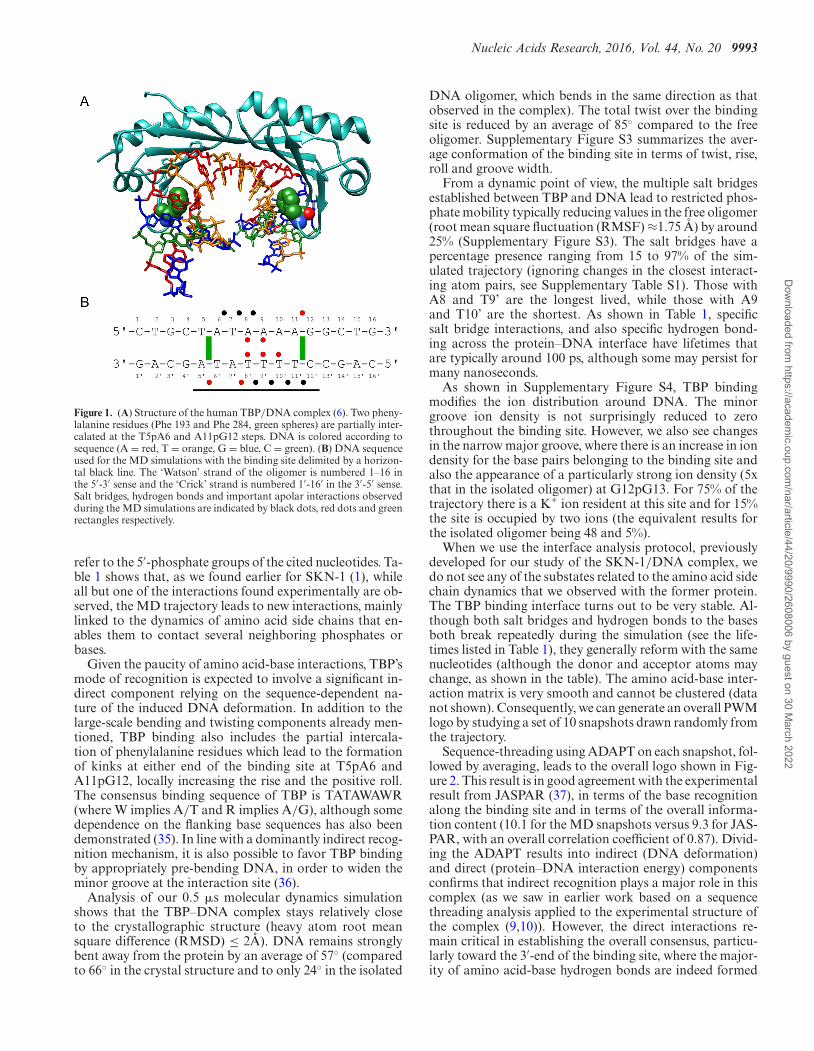
We chose to study human TBP as a casebook example of aprotein binding in the minor groove of DNA, producing sig-nificant DNA deformation (6). In this case, protein bindingcauses a wide opening of the minor groove, a strongly re-duced twist and ∼60◦ bending away from the protein. TBPinteracts with DNA via an extensive �-sheet covering 8-bp site (T5 → G12) within the 16 bp oligomer we studied.Despite this extensive contact surface, the MD simulationsconfirm that the protein establishes relatively few hydro-gen bonds with the DNA bases, only two with the Watsonstrand and three with the Crick strand involving asparagineor threonine side chains binding to the bases A8, A9 andT8’ → T10’ (see Table 1). These are complemented by eightarginine-phosphate salt bridges involving seven phosphategroups, three in the Watson strand and four in the Crickstrand, and three serine-phosphate hydrogen bonds (withG12, A5’, A7’, see Figure 1). For comparison, the contactsfound in the crystal structure are shown in SupplementaryFigure S2A. Note that, by convention, phosphate contacts
Dow
nloaded from https://academ
ic.oup.com/nar/article/44/20/9990/2608006 by guest on 30 M
arch 2022
Nucleic Acids Research, 2016, Vol. 44, No. 20 9993
Figure 1. (A) Structure of the human TBP/DNA complex (6). Two pheny-lalanine residues (Phe 193 and Phe 284, green spheres) are partially inter-calated at the T5pA6 and A11pG12 steps. DNA is colored according tosequence (A = red, T = orange, G = blue, C = green). (B) DNA sequenceused for the MD simulations with the binding site delimited by a horizon-tal black line. The ‘Watson’ strand of the oligomer is numbered 1–16 inthe 5′-3′ sense and the ‘Crick’ strand is numbered 1′-16′ in the 3′-5′ sense.Salt bridges, hydrogen bonds and important apolar interactions observedduring the MD simulations are indicated by black dots, red dots and greenrectangles respectively.
refer to the 5′-phosphate groups of the cited nucleotides. Ta-ble 1 shows that, as we found earlier for SKN-1 (1), whileall but one of the interactions found experimentally are ob-served, the MD trajectory leads to new interactions, mainlylinked to the dynamics of amino acid side chains that en-ables them to contact several neighboring phosphates orbases.
Given the paucity of amino acid-base interactions, TBP’smode of recognition is expected to involve a significant in-direct component relying on the sequence-dependent na-ture of the induced DNA deformation. In addition to thelarge-scale bending and twisting components already men-tioned, TBP binding also includes the partial intercala-tion of phenylalanine residues which lead to the formationof kinks at either end of the binding site at T5pA6 andA11pG12, locally increasing the rise and the positive roll.The consensus binding sequence of TBP is TATAWAWR(where W implies A/T and R implies A/G), although somedependence on the flanking base sequences has also beendemonstrated (35). In line with a dominantly indirect recog-nition mechanism, it is also possible to favor TBP bindingby appropriately pre-bending DNA, in order to widen theminor groove at the interaction site (36).
Analysis of our 0.5 �s molecular dynamics simulationshows that the TBP–DNA complex stays relatively closeto the crystallographic structure (heavy atom root meansquare difference (RMSD) ≤ 2A). DNA remains stronglybent away from the protein by an average of 57◦ (comparedto 66◦ in the crystal structure and to only 24◦ in the isolated
DNA oligomer, which bends in the same direction as thatobserved in the complex). The total twist over the bindingsite is reduced by an average of 85◦ compared to the freeoligomer. Supplementary Figure S3 summarizes the aver-age conformation of the binding site in terms of twist, rise,roll and groove width.
From a dynamic point of view, the multiple salt bridgesestablished between TBP and DNA lead to restricted phos-phate mobility typically reducing values in the free oligomer(root mean square fluctuation (RMSF) ≈1.75 A) by around25% (Supplementary Figure S3). The salt bridges have apercentage presence ranging from 15 to 97% of the sim-ulated trajectory (ignoring changes in the closest interact-ing atom pairs, see Supplementary Table S1). Those withA8 and T9’ are the longest lived, while those with A9and T10’ are the shortest. As shown in Table 1, specificsalt bridge interactions, and also specific hydrogen bond-ing across the protein–DNA interface have lifetimes thatare typically around 100 ps, although some may persist formany nanoseconds.
As shown in Supplementary Figure S4, TBP bindingmodifies the ion distribution around DNA. The minorgroove ion density is not surprisingly reduced to zerothroughout the binding site. However, we also see changesin the narrow major groove, where there is an increase in iondensity for the base pairs belonging to the binding site andalso the appearance of a particularly strong ion density (5xthat in the isolated oligomer) at G12pG13. For 75% of thetrajectory there is a K+ ion resident at this site and for 15%the site is occupied by two ions (the equivalent results forthe isolated oligomer being 48 and 5%).
When we use the interface analysis protocol, previouslydeveloped for our study of the SKN-1/DNA complex, wedo not see any of the substates related to the amino acid sidechain dynamics that we observed with the former protein.The TBP binding interface turns out to be very stable. Al-though both salt bridges and hydrogen bonds to the basesboth break repeatedly during the simulation (see the life-times listed in Table 1), they generally reform with the samenucleotides (although the donor and acceptor atoms maychange, as shown in the table). The amino acid-base inter-action matrix is very smooth and cannot be clustered (datanot shown). Consequently, we can generate an overall PWMlogo by studying a set of 10 snapshots drawn randomly fromthe trajectory.
Sequence-threading using ADAPT on each snapshot, fol-lowed by averaging, leads to the overall logo shown in Fig-ure 2. This result is in good agreement with the experimentalresult from JASPAR (37), in terms of the base recognitionalong the binding site and in terms of the overall informa-tion content (10.1 for the MD snapshots versus 9.3 for JAS-PAR, with an overall correlation coefficient of 0.87). Divid-ing the ADAPT results into indirect (DNA deformation)and direct (protein–DNA interaction energy) componentsconfirms that indirect recognition plays a major role in thiscomplex (as we saw in earlier work based on a sequencethreading analysis applied to the experimental structure ofthe complex (9,10)). However, the direct interactions re-main critical in establishing the overall consensus, particu-larly toward the 3′-end of the binding site, where the major-ity of amino acid-base hydrogen bonds are indeed formed
Dow
nloaded from https://academ
ic.oup.com/nar/article/44/20/9990/2608006 by guest on 30 M
arch 2022
9994 Nucleic Acids Research, 2016, Vol. 44, No. 20
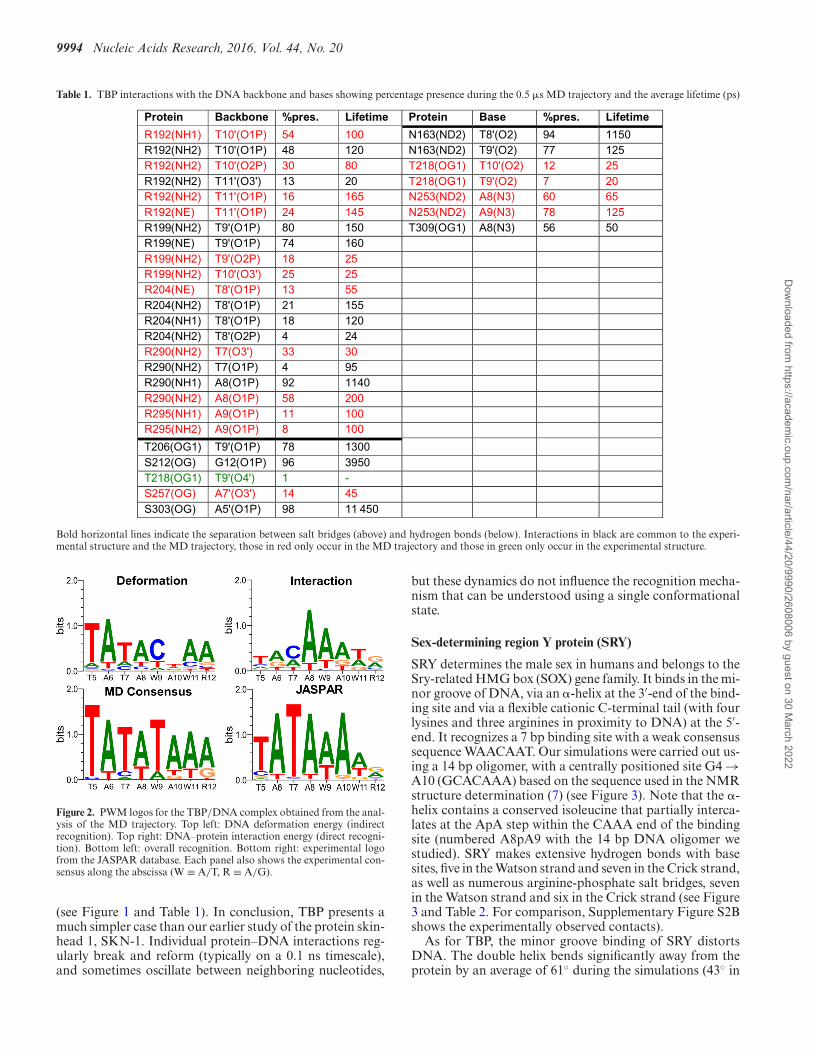
Table 1. TBP interactions with the DNA backbone and bases showing percentage presence during the 0.5 �s MD trajectory and the average lifetime (ps)
Bold horizontal lines indicate the separation between salt bridges (above) and hydrogen bonds (below). Interactions in black are common to the experi-mental structure and the MD trajectory, those in red only occur in the MD trajectory and those in green only occur in the experimental structure.
Figure 2. PWM logos for the TBP/DNA complex obtained from the anal-ysis of the MD trajectory. Top left: DNA deformation energy (indirectrecognition). Top right: DNA–protein interaction energy (direct recogni-tion). Bottom left: overall recognition. Bottom right: experimental logofrom the JASPAR database. Each panel also shows the experimental con-sensus along the abscissa (W ≡ A/T, R ≡ A/G).
(see Figure 1 and Table 1). In conclusion, TBP presents amuch simpler case than our earlier study of the protein skin-head 1, SKN-1. Individual protein–DNA interactions reg-ularly break and reform (typically on a 0.1 ns timescale),and sometimes oscillate between neighboring nucleotides,
but these dynamics do not influence the recognition mecha-nism that can be understood using a single conformationalstate.
Sex-determining region Y protein (SRY)
SRY determines the male sex in humans and belongs to theSry-related HMG box (SOX) gene family. It binds in the mi-nor groove of DNA, via an �-helix at the 3′-end of the bind-ing site and via a flexible cationic C-terminal tail (with fourlysines and three arginines in proximity to DNA) at the 5′-end. It recognizes a 7 bp binding site with a weak consensussequence WAACAAT. Our simulations were carried out us-ing a 14 bp oligomer, with a centrally positioned site G4 →A10 (GCACAAA) based on the sequence used in the NMRstructure determination (7) (see Figure 3). Note that the �-helix contains a conserved isoleucine that partially interca-lates at the ApA step within the CAAA end of the bindingsite (numbered A8pA9 with the 14 bp DNA oligomer westudied). SRY makes extensive hydrogen bonds with basesites, five in the Watson strand and seven in the Crick strand,as well as numerous arginine-phosphate salt bridges, sevenin the Watson strand and six in the Crick strand (see Figure3 and Table 2. For comparison, Supplementary Figure S2Bshows the experimentally observed contacts).
As for TBP, the minor groove binding of SRY distortsDNA. The double helix bends significantly away from theprotein by an average of 61◦ during the simulations (43◦ in
Dow
nloaded from https://academ
ic.oup.com/nar/article/44/20/9990/2608006 by guest on 30 M
arch 2022
Nucleic Acids Research, 2016, Vol. 44, No. 20 9995
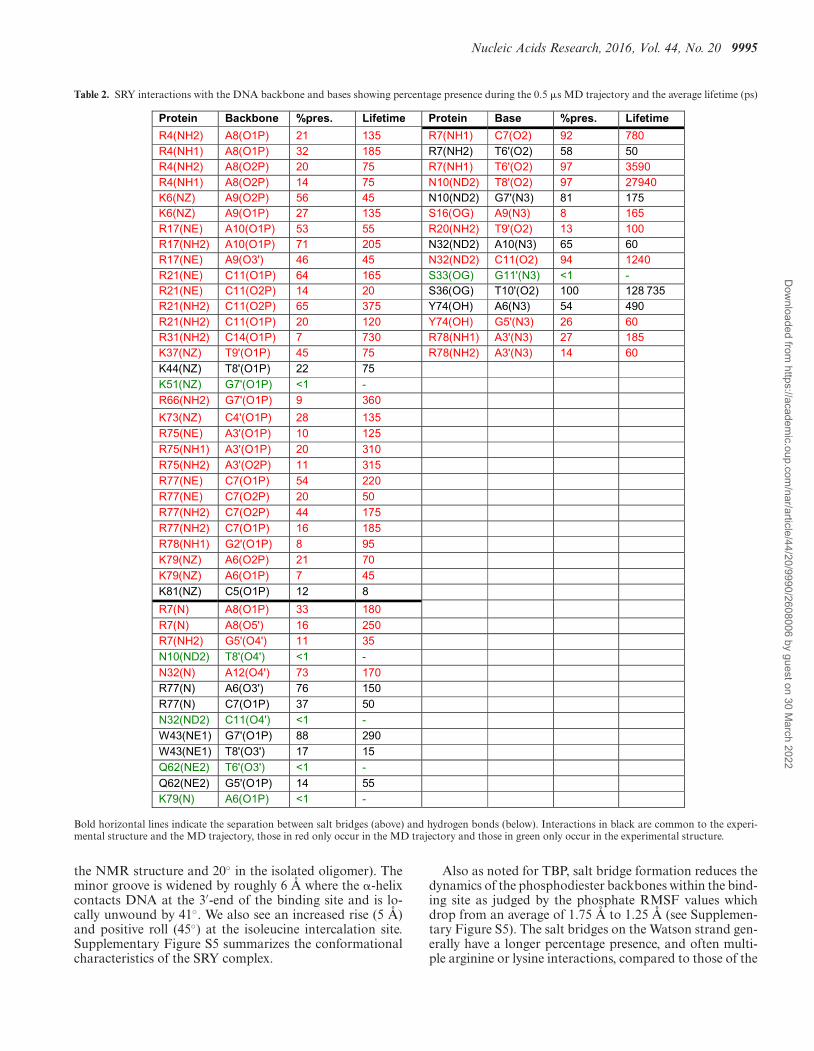
Table 2. SRY interactions with the DNA backbone and bases showing percentage presence during the 0.5 �s MD trajectory and the average lifetime (ps)
Bold horizontal lines indicate the separation between salt bridges (above) and hydrogen bonds (below). Interactions in black are common to the experi-mental structure and the MD trajectory, those in red only occur in the MD trajectory and those in green only occur in the experimental structure.
the NMR structure and 20◦ in the isolated oligomer). Theminor groove is widened by roughly 6 A where the �-helixcontacts DNA at the 3′-end of the binding site and is lo-cally unwound by 41◦. We also see an increased rise (5 A)and positive roll (45◦) at the isoleucine intercalation site.Supplementary Figure S5 summarizes the conformationalcharacteristics of the SRY complex.
Also as noted for TBP, salt bridge formation reduces thedynamics of the phosphodiester backbones within the bind-ing site as judged by the phosphate RMSF values whichdrop from an average of 1.75 A to 1.25 A (see Supplemen-tary Figure S5). The salt bridges on the Watson strand gen-erally have a longer percentage presence, and often multi-ple arginine or lysine interactions, compared to those of the
Dow
nloaded from https://academ
ic.oup.com/nar/article/44/20/9990/2608006 by guest on 30 M
arch 2022
9996 Nucleic Acids Research, 2016, Vol. 44, No. 20
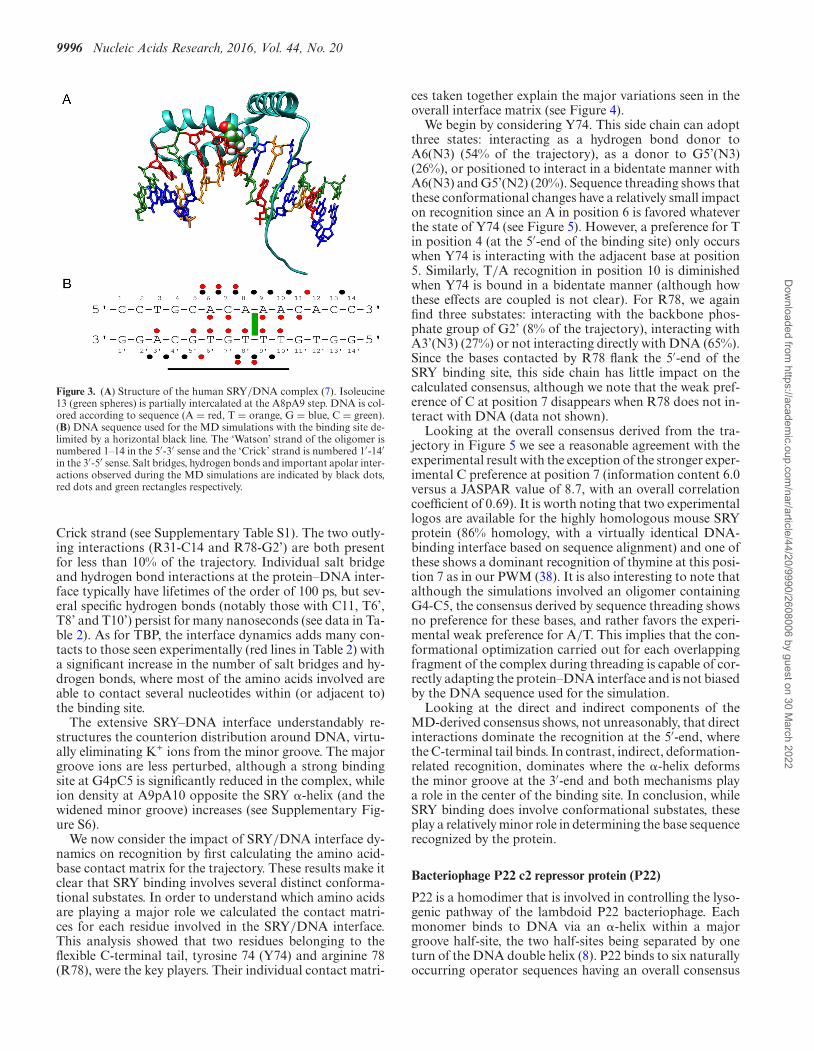
Figure 3. (A) Structure of the human SRY/DNA complex (7). Isoleucine13 (green spheres) is partially intercalated at the A8pA9 step. DNA is col-ored according to sequence (A = red, T = orange, G = blue, C = green).(B) DNA sequence used for the MD simulations with the binding site de-limited by a horizontal black line. The ‘Watson’ strand of the oligomer isnumbered 1–14 in the 5′-3′ sense and the ‘Crick’ strand is numbered 1′-14′in the 3′-5′ sense. Salt bridges, hydrogen bonds and important apolar inter-actions observed during the MD simulations are indicated by black dots,red dots and green rectangles respectively.
Crick strand (see Supplementary Table S1). The two outly-ing interactions (R31-C14 and R78-G2’) are both presentfor less than 10% of the trajectory. Individual salt bridgeand hydrogen bond interactions at the protein–DNA inter-face typically have lifetimes of the order of 100 ps, but sev-eral specific hydrogen bonds (notably those with C11, T6’,T8’ and T10’) persist for many nanoseconds (see data in Ta-ble 2). As for TBP, the interface dynamics adds many con-tacts to those seen experimentally (red lines in Table 2) witha significant increase in the number of salt bridges and hy-drogen bonds, where most of the amino acids involved areable to contact several nucleotides within (or adjacent to)the binding site.
The extensive SRY–DNA interface understandably re-structures the counterion distribution around DNA, virtu-ally eliminating K+ ions from the minor groove. The majorgroove ions are less perturbed, although a strong bindingsite at G4pC5 is significantly reduced in the complex, whileion density at A9pA10 opposite the SRY �-helix (and thewidened minor groove) increases (see Supplementary Fig-ure S6).
We now consider the impact of SRY/DNA interface dy-namics on recognition by first calculating the amino acid-base contact matrix for the trajectory. These results make itclear that SRY binding involves several distinct conforma-tional substates. In order to understand which amino acidsare playing a major role we calculated the contact matri-ces for each residue involved in the SRY/DNA interface.This analysis showed that two residues belonging to theflexible C-terminal tail, tyrosine 74 (Y74) and arginine 78(R78), were the key players. Their individual contact matri-
ces taken together explain the major variations seen in theoverall interface matrix (see Figure 4).
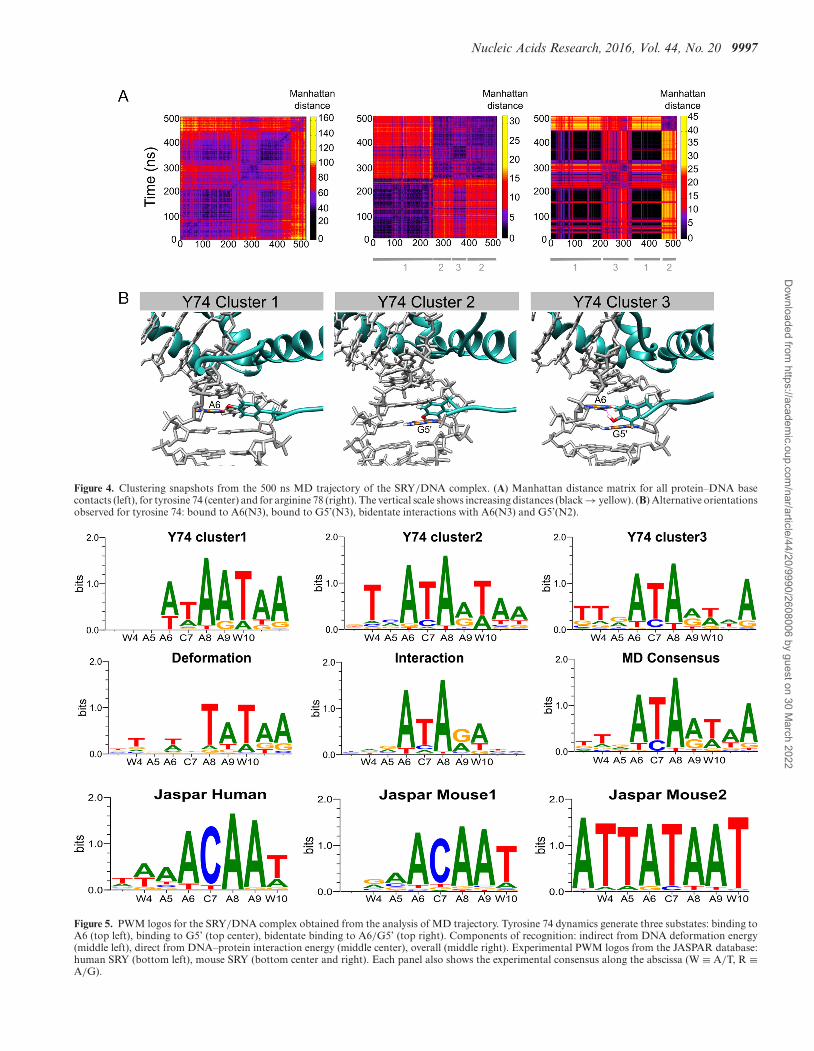
We begin by considering Y74. This side chain can adoptthree states: interacting as a hydrogen bond donor toA6(N3) (54% of the trajectory), as a donor to G5’(N3)(26%), or positioned to interact in a bidentate manner withA6(N3) and G5’(N2) (20%). Sequence threading shows thatthese conformational changes have a relatively small impacton recognition since an A in position 6 is favored whateverthe state of Y74 (see Figure 5). However, a preference for Tin position 4 (at the 5′-end of the binding site) only occurswhen Y74 is interacting with the adjacent base at position5. Similarly, T/A recognition in position 10 is diminishedwhen Y74 is bound in a bidentate manner (although howthese effects are coupled is not clear). For R78, we againfind three substates: interacting with the backbone phos-phate group of G2’ (8% of the trajectory), interacting withA3’(N3) (27%) or not interacting directly with DNA (65%).Since the bases contacted by R78 flank the 5′-end of theSRY binding site, this side chain has little impact on thecalculated consensus, although we note that the weak pref-erence of C at position 7 disappears when R78 does not in-teract with DNA (data not shown).
Looking at the overall consensus derived from the tra-jectory in Figure 5 we see a reasonable agreement with theexperimental result with the exception of the stronger exper-imental C preference at position 7 (information content 6.0versus a JASPAR value of 8.7, with an overall correlationcoefficient of 0.69). It is worth noting that two experimentallogos are available for the highly homologous mouse SRYprotein (86% homology, with a virtually identical DNA-binding interface based on sequence alignment) and one ofthese shows a dominant recognition of thymine at this posi-tion 7 as in our PWM (38). It is also interesting to note thatalthough the simulations involved an oligomer containingG4-C5, the consensus derived by sequence threading showsno preference for these bases, and rather favors the experi-mental weak preference for A/T. This implies that the con-formational optimization carried out for each overlappingfragment of the complex during threading is capable of cor-rectly adapting the protein–DNA interface and is not biasedby the DNA sequence used for the simulation.
Looking at the direct and indirect components of theMD-derived consensus shows, not unreasonably, that directinteractions dominate the recognition at the 5′-end, wherethe C-terminal tail binds. In contrast, indirect, deformation-related recognition, dominates where the �-helix deformsthe minor groove at the 3′-end and both mechanisms playa role in the center of the binding site. In conclusion, whileSRY binding does involve conformational substates, theseplay a relatively minor role in determining the base sequencerecognized by the protein.
Bacteriophage P22 c2 repressor protein (P22)
P22 is a homodimer that is involved in controlling the lyso-genic pathway of the lambdoid P22 bacteriophage. Eachmonomer binds to DNA via an �-helix within a majorgroove half-site, the two half-sites being separated by oneturn of the DNA double helix (8). P22 binds to six naturallyoccurring operator sequences having an overall consensus
Dow
nloaded from https://academ
ic.oup.com/nar/article/44/20/9990/2608006 by guest on 30 M
arch 2022
Nucleic Acids Research, 2016, Vol. 44, No. 20 9997
Figure 4. Clustering snapshots from the 500 ns MD trajectory of the SRY/DNA complex. (A) Manhattan distance matrix for all protein–DNA basecontacts (left), for tyrosine 74 (center) and for arginine 78 (right). The vertical scale shows increasing distances (black → yellow). (B) Alternative orientationsobserved for tyrosine 74: bound to A6(N3), bound to G5’(N3), bidentate interactions with A6(N3) and G5’(N2).
Figure 5. PWM logos for the SRY/DNA complex obtained from the analysis of MD trajectory. Tyrosine 74 dynamics generate three substates: binding toA6 (top left), binding to G5’ (top center), bidentate binding to A6/G5’ (top right). Components of recognition: indirect from DNA deformation energy(middle left), direct from DNA–protein interaction energy (middle center), overall (middle right). Experimental PWM logos from the JASPAR database:human SRY (bottom left), mouse SRY (bottom center and right). Each panel also shows the experimental consensus along the abscissa (W ≡ A/T, R ≡A/G).
Dow
nloaded from https://academ
ic.oup.com/nar/article/44/20/9990/2608006 by guest on 30 M
arch 2022
9998 Nucleic Acids Research, 2016, Vol. 44, No. 20
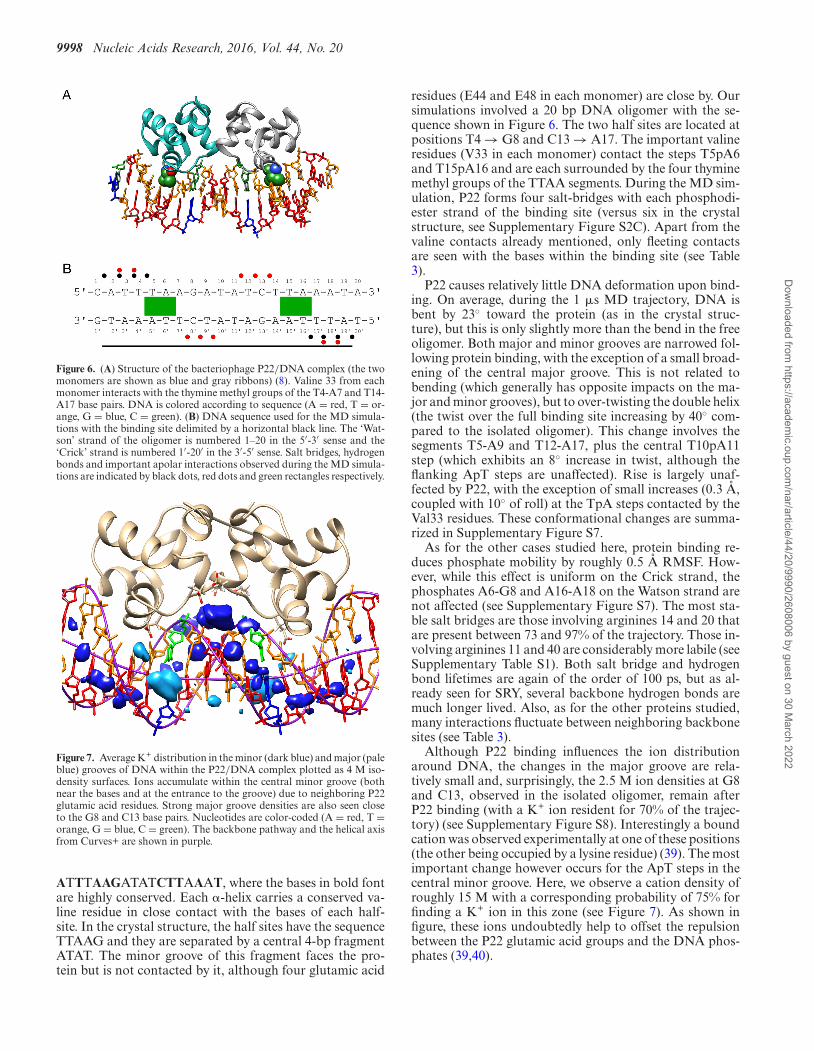
Figure 6. (A) Structure of the bacteriophage P22/DNA complex (the twomonomers are shown as blue and gray ribbons) (8). Valine 33 from eachmonomer interacts with the thymine methyl groups of the T4-A7 and T14-A17 base pairs. DNA is colored according to sequence (A = red, T = or-ange, G = blue, C = green). (B) DNA sequence used for the MD simula-tions with the binding site delimited by a horizontal black line. The ‘Wat-son’ strand of the oligomer is numbered 1–20 in the 5′-3′ sense and the‘Crick’ strand is numbered 1′-20′ in the 3′-5′ sense. Salt bridges, hydrogenbonds and important apolar interactions observed during the MD simula-tions are indicated by black dots, red dots and green rectangles respectively.
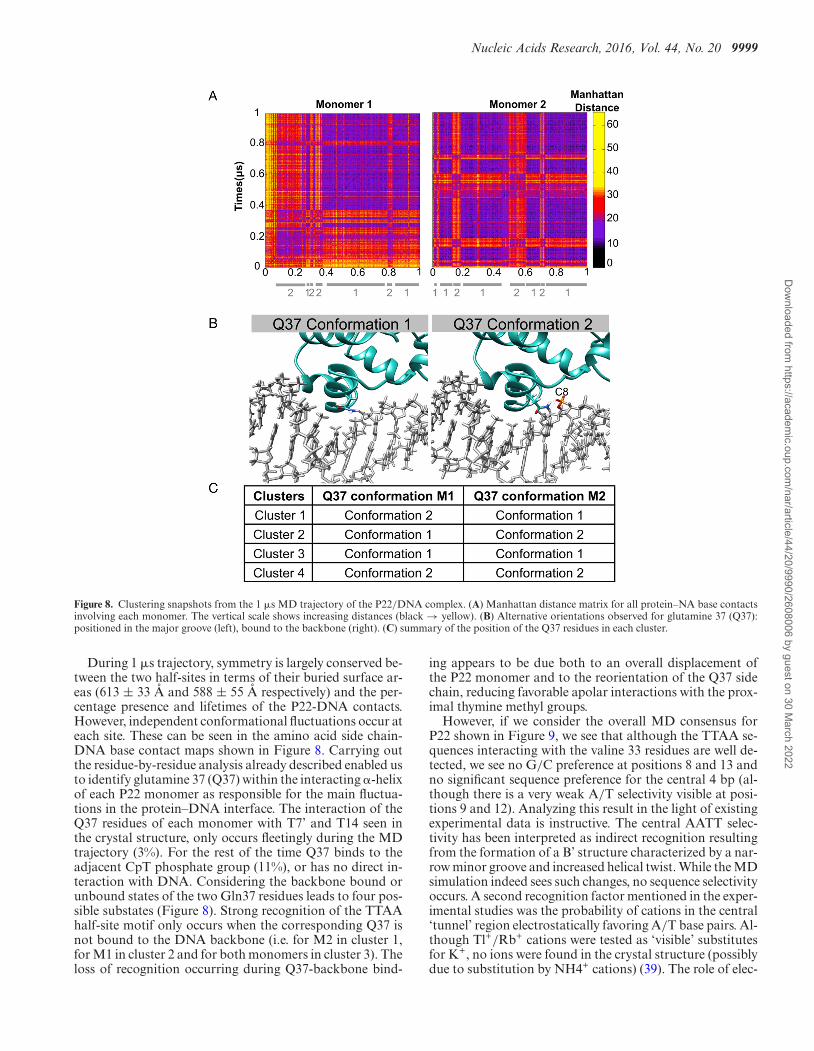
Figure 7. Average K+ distribution in the minor (dark blue) and major (paleblue) grooves of DNA within the P22/DNA complex plotted as 4 M iso-density surfaces. Ions accumulate within the central minor groove (bothnear the bases and at the entrance to the groove) due to neighboring P22glutamic acid residues. Strong major groove densities are also seen closeto the G8 and C13 base pairs. Nucleotides are color-coded (A = red, T =orange, G = blue, C = green). The backbone pathway and the helical axisfrom Curves+ are shown in purple.
ATTTAAGATATCTTAAAT, where the bases in bold fontare highly conserved. Each �-helix carries a conserved va-line residue in close contact with the bases of each half-site. In the crystal structure, the half sites have the sequenceTTAAG and they are separated by a central 4-bp fragmentATAT. The minor groove of this fragment faces the pro-tein but is not contacted by it, although four glutamic acid
residues (E44 and E48 in each monomer) are close by. Oursimulations involved a 20 bp DNA oligomer with the se-quence shown in Figure 6. The two half sites are located atpositions T4 → G8 and C13 → A17. The important valineresidues (V33 in each monomer) contact the steps T5pA6and T15pA16 and are each surrounded by the four thyminemethyl groups of the TTAA segments. During the MD sim-ulation, P22 forms four salt-bridges with each phosphodi-ester strand of the binding site (versus six in the crystalstructure, see Supplementary Figure S2C). Apart from thevaline contacts already mentioned, only fleeting contactsare seen with the bases within the binding site (see Table3).
P22 causes relatively little DNA deformation upon bind-ing. On average, during the 1 �s MD trajectory, DNA isbent by 23◦ toward the protein (as in the crystal struc-ture), but this is only slightly more than the bend in the freeoligomer. Both major and minor grooves are narrowed fol-lowing protein binding, with the exception of a small broad-ening of the central major groove. This is not related tobending (which generally has opposite impacts on the ma-jor and minor grooves), but to over-twisting the double helix(the twist over the full binding site increasing by 40◦ com-pared to the isolated oligomer). This change involves thesegments T5-A9 and T12-A17, plus the central T10pA11step (which exhibits an 8◦ increase in twist, although theflanking ApT steps are unaffected). Rise is largely unaf-fected by P22, with the exception of small increases (0.3 A,coupled with 10◦ of roll) at the TpA steps contacted by theVal33 residues. These conformational changes are summa-rized in Supplementary Figure S7.
As for the other cases studied here, protein binding re-duces phosphate mobility by roughly 0.5 A RMSF. How-ever, while this effect is uniform on the Crick strand, thephosphates A6-G8 and A16-A18 on the Watson strand arenot affected (see Supplementary Figure S7). The most sta-ble salt bridges are those involving arginines 14 and 20 thatare present between 73 and 97% of the trajectory. Those in-volving arginines 11 and 40 are considerably more labile (seeSupplementary Table S1). Both salt bridge and hydrogenbond lifetimes are again of the order of 100 ps, but as al-ready seen for SRY, several backbone hydrogen bonds aremuch longer lived. Also, as for the other proteins studied,many interactions fluctuate between neighboring backbonesites (see Table 3).
Although P22 binding influences the ion distributionaround DNA, the changes in the major groove are rela-tively small and, surprisingly, the 2.5 M ion densities at G8and C13, observed in the isolated oligomer, remain afterP22 binding (with a K+ ion resident for 70% of the trajec-tory) (see Supplementary Figure S8). Interestingly a boundcation was observed experimentally at one of these positions(the other being occupied by a lysine residue) (39). The mostimportant change however occurs for the ApT steps in thecentral minor groove. Here, we observe a cation density ofroughly 15 M with a corresponding probability of 75% forfinding a K+ ion in this zone (see Figure 7). As shown infigure, these ions undoubtedly help to offset the repulsionbetween the P22 glutamic acid groups and the DNA phos-phates (39,40).
Dow
nloaded from https://academ
ic.oup.com/nar/article/44/20/9990/2608006 by guest on 30 M
arch 2022
Nucleic Acids Research, 2016, Vol. 44, No. 20 9999
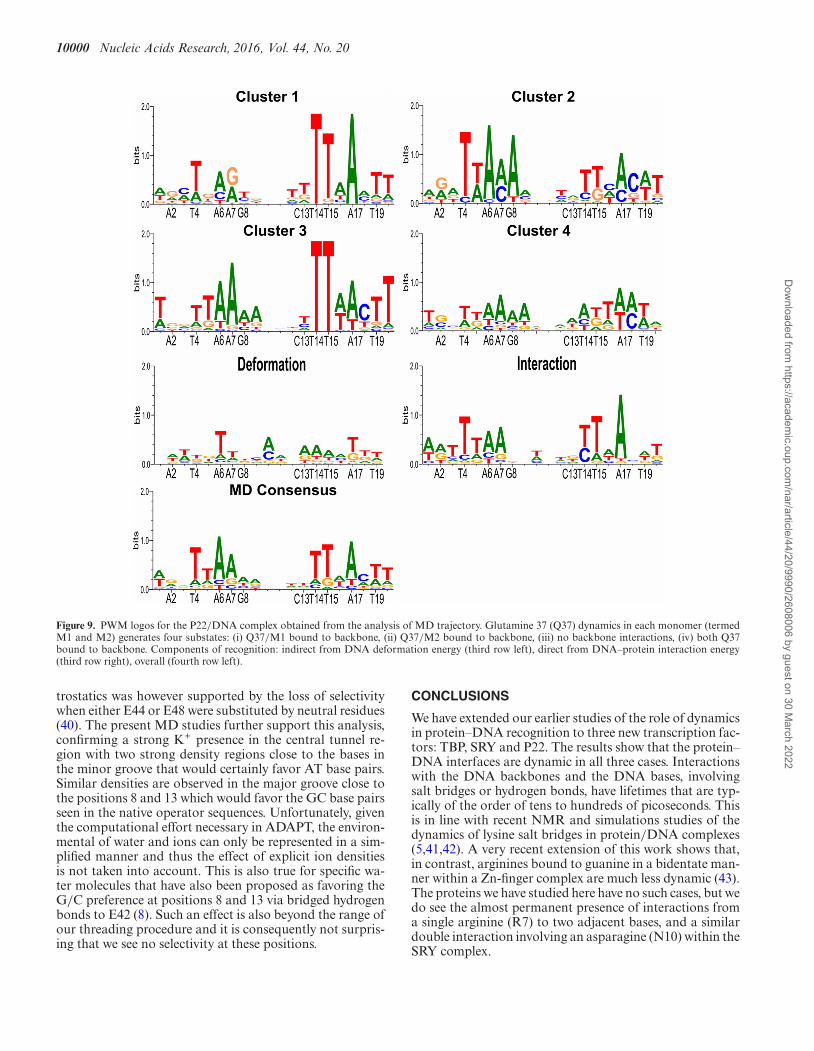
Figure 8. Clustering snapshots from the 1 �s MD trajectory of the P22/DNA complex. (A) Manhattan distance matrix for all protein–NA base contactsinvolving each monomer. The vertical scale shows increasing distances (black → yellow). (B) Alternative orientations observed for glutamine 37 (Q37):positioned in the major groove (left), bound to the backbone (right). (C) summary of the position of the Q37 residues in each cluster.
During 1 �s trajectory, symmetry is largely conserved be-tween the two half-sites in terms of their buried surface ar-eas (613 ± 33 A and 588 ± 55 A respectively) and the per-centage presence and lifetimes of the P22-DNA contacts.However, independent conformational fluctuations occur ateach site. These can be seen in the amino acid side chain-DNA base contact maps shown in Figure 8. Carrying outthe residue-by-residue analysis already described enabled usto identify glutamine 37 (Q37) within the interacting �-helixof each P22 monomer as responsible for the main fluctua-tions in the protein–DNA interface. The interaction of theQ37 residues of each monomer with T7’ and T14 seen inthe crystal structure, only occurs fleetingly during the MDtrajectory (3%). For the rest of the time Q37 binds to theadjacent CpT phosphate group (11%), or has no direct in-teraction with DNA. Considering the backbone bound orunbound states of the two Gln37 residues leads to four pos-sible substates (Figure 8). Strong recognition of the TTAAhalf-site motif only occurs when the corresponding Q37 isnot bound to the DNA backbone (i.e. for M2 in cluster 1,for M1 in cluster 2 and for both monomers in cluster 3). Theloss of recognition occurring during Q37-backbone bind-
ing appears to be due both to an overall displacement ofthe P22 monomer and to the reorientation of the Q37 sidechain, reducing favorable apolar interactions with the prox-imal thymine methyl groups.
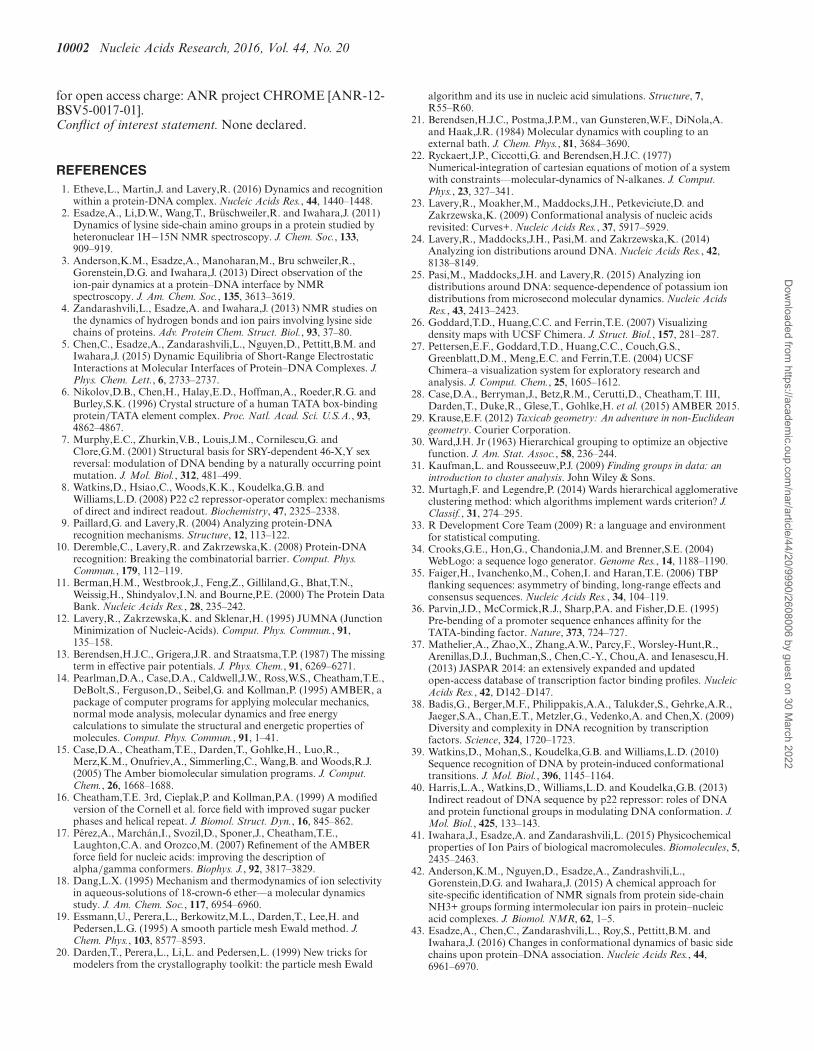
However, if we consider the overall MD consensus forP22 shown in Figure 9, we see that although the TTAA se-quences interacting with the valine 33 residues are well de-tected, we see no G/C preference at positions 8 and 13 andno significant sequence preference for the central 4 bp (al-though there is a very weak A/T selectivity visible at posi-tions 9 and 12). Analyzing this result in the light of existingexperimental data is instructive. The central AATT selec-tivity has been interpreted as indirect recognition resultingfrom the formation of a B’ structure characterized by a nar-row minor groove and increased helical twist. While the MDsimulation indeed sees such changes, no sequence selectivityoccurs. A second recognition factor mentioned in the exper-imental studies was the probability of cations in the central‘tunnel’ region electrostatically favoring A/T base pairs. Al-though Tl+/Rb+ cations were tested as ‘visible’ substitutesfor K+, no ions were found in the crystal structure (possiblydue to substitution by NH4+ cations) (39). The role of elec-
Dow
nloaded from https://academ
ic.oup.com/nar/article/44/20/9990/2608006 by guest on 30 M
arch 2022
10000 Nucleic Acids Research, 2016, Vol. 44, No. 20
Figure 9. PWM logos for the P22/DNA complex obtained from the analysis of MD trajectory. Glutamine 37 (Q37) dynamics in each monomer (termedM1 and M2) generates four substates: (i) Q37/M1 bound to backbone, (ii) Q37/M2 bound to backbone, (iii) no backbone interactions, (iv) both Q37bound to backbone. Components of recognition: indirect from DNA deformation energy (third row left), direct from DNA–protein interaction energy(third row right), overall (fourth row left).
trostatics was however supported by the loss of selectivitywhen either E44 or E48 were substituted by neutral residues(40). The present MD studies further support this analysis,confirming a strong K+ presence in the central tunnel re-gion with two strong density regions close to the bases inthe minor groove that would certainly favor AT base pairs.Similar densities are observed in the major groove close tothe positions 8 and 13 which would favor the GC base pairsseen in the native operator sequences. Unfortunately, giventhe computational effort necessary in ADAPT, the environ-mental of water and ions can only be represented in a sim-plified manner and thus the effect of explicit ion densitiesis not taken into account. This is also true for specific wa-ter molecules that have also been proposed as favoring theG/C preference at positions 8 and 13 via bridged hydrogenbonds to E42 (8). Such an effect is also beyond the range ofour threading procedure and it is consequently not surpris-ing that we see no selectivity at these positions.
CONCLUSIONS
We have extended our earlier studies of the role of dynamicsin protein–DNA recognition to three new transcription fac-tors: TBP, SRY and P22. The results show that the protein–DNA interfaces are dynamic in all three cases. Interactionswith the DNA backbones and the DNA bases, involvingsalt bridges or hydrogen bonds, have lifetimes that are typ-ically of the order of tens to hundreds of picoseconds. Thisis in line with recent NMR and simulations studies of thedynamics of lysine salt bridges in protein/DNA complexes(5,41,42). A very recent extension of this work shows that,in contrast, arginines bound to guanine in a bidentate man-ner within a Zn-finger complex are much less dynamic (43).The proteins we have studied here have no such cases, but wedo see the almost permanent presence of interactions froma single arginine (R7) to two adjacent bases, and a similardouble interaction involving an asparagine (N10) within theSRY complex.
Dow
nloaded from https://academ
ic.oup.com/nar/article/44/20/9990/2608006 by guest on 30 M
arch 2022

Nucleic Acids Research, 2016, Vol. 44, No. 20 10001
Table 3. P22 interactions with the DNA backbone (A) and the bases (B) showing percentage presence during the 1 �s MD trajectory and the averagelifetime (ps) for each monomer (M1 and M2)
Bold horizontal lines indicate the separation between salt bridges (above) and hydrogen bonds (below). Interactions in black are common to the experi-mental structure and the MD trajectory, those in red only occur in the MD trajectory and those in green only occur in the experimental structure.
Many of these interactions we have analyzed, both saltbridges and hydrogen bonds, not only break and reform reg-ularly, but also involve changes in the DNA sites contactedby given amino acids. How much these fluctuations subse-quently modify recognition of the DNA sequence varies:TBP is completely unaffected, SRY is moderately affecteddue to a single interface residue and P22 is significantly af-fected due to changes indirectly coupled to a single interfaceresidue. At least for the complexes studied here, changes inamino acid interactions seem to have little impact on DNAconformation and where they modify sequence selectivity,this occurs because of the changes in direct amino-acid baseinteractions.
The case of P22 also underlines one limitation of ourADAPT sequence threading approach. While the ion dis-tributions seen during the MD simulation clearly supportthe observed sequence preference in the center of the bind-ing site (that is not directly in contact with the protein),these environmental effects cannot be taken into accountby ADAPT that, for computational reasons, cannot deal
with explicit ions or water molecules. However, the fact thatADAPT fails to predict any recognition in the central re-gion of P22 also suggests that the changes in DNA geometry(involving a B → B’ transition) that we indeed observe arenot themselves sufficient to explain the associated sequencerecognition.
SUPPLEMENTARY DATA
Supplementary Data are available at NAR Online.
ACKNOWLEDGEMENT
The authors wish to acknowledge GENCI for a generousallocation of supercomputer resources at the CINES centerin Montpellier.
FUNDING
ANR project CHROME [ANR-12-BSV5-0017-01]; Rhone-Alpes ARC 1 Sante Doctoral Grant (to L.E.). Funding
Dow
nloaded from https://academ
ic.oup.com/nar/article/44/20/9990/2608006 by guest on 30 M
arch 2022
10002 Nucleic Acids Research, 2016, Vol. 44, No. 20
for open access charge: ANR project CHROME [ANR-12-BSV5-0017-01].Conflict of interest statement. None declared.
REFERENCES1. Etheve,L., Martin,J. and Lavery,R. (2016) Dynamics and recognition
within a protein-DNA complex. Nucleic Acids Res., 44, 1440–1448.2. Esadze,A., Li,D.W., Wang,T., Bruschweiler,R. and Iwahara,J. (2011)
Dynamics of lysine side-chain amino groups in a protein studied byheteronuclear 1H−15N NMR spectroscopy. J. Chem. Soc., 133,909–919.
3. Anderson,K.M., Esadze,A., Manoharan,M., Bru schweiler,R.,Gorenstein,D.G. and Iwahara,J. (2013) Direct observation of theion-pair dynamics at a protein–DNA interface by NMRspectroscopy. J. Am. Chem. Soc., 135, 3613–3619.
4. Zandarashvili,L., Esadze,A. and Iwahara,J. (2013) NMR studies onthe dynamics of hydrogen bonds and ion pairs involving lysine sidechains of proteins. Adv. Protein Chem. Struct. Biol., 93, 37–80.
5. Chen,C., Esadze,A., Zandarashvili,L., Nguyen,D., Pettitt,B.M. andIwahara,J. (2015) Dynamic Equilibria of Short-Range ElectrostaticInteractions at Molecular Interfaces of Protein–DNA Complexes. J.Phys. Chem. Lett., 6, 2733–2737.
6. Nikolov,D.B., Chen,H., Halay,E.D., Hoffman,A., Roeder,R.G. andBurley,S.K. (1996) Crystal structure of a human TATA box-bindingprotein/TATA element complex. Proc. Natl. Acad. Sci. U.S.A., 93,4862–4867.
7. Murphy,E.C., Zhurkin,V.B., Louis,J.M., Cornilescu,G. andClore,G.M. (2001) Structural basis for SRY-dependent 46-X,Y sexreversal: modulation of DNA bending by a naturally occurring pointmutation. J. Mol. Biol., 312, 481–499.
8. Watkins,D., Hsiao,C., Woods,K.K., Koudelka,G.B. andWilliams,L.D. (2008) P22 c2 repressor-operator complex: mechanismsof direct and indirect readout. Biochemistry, 47, 2325–2338.
9. Paillard,G. and Lavery,R. (2004) Analyzing protein-DNArecognition mechanisms. Structure, 12, 113–122.
10. Deremble,C., Lavery,R. and Zakrzewska,K. (2008) Protein-DNArecognition: Breaking the combinatorial barrier. Comput. Phys.Commun., 179, 112–119.
11. Berman,H.M., Westbrook,J., Feng,Z., Gilliland,G., Bhat,T.N.,Weissig,H., Shindyalov,I.N. and Bourne,P.E. (2000) The Protein DataBank. Nucleic Acids Res., 28, 235–242.
12. Lavery,R., Zakrzewska,K. and Sklenar,H. (1995) JUMNA (JunctionMinimization of Nucleic-Acids). Comput. Phys. Commun., 91,135–158.
13. Berendsen,H.J.C., Grigera,J.R. and Straatsma,T.P. (1987) The missingterm in effective pair potentials. J. Phys. Chem., 91, 6269–6271.
14. Pearlman,D.A., Case,D.A., Caldwell,J.W., Ross,W.S., Cheatham,T.E.,DeBolt,S., Ferguson,D., Seibel,G. and Kollman,P. (1995) AMBER, apackage of computer programs for applying molecular mechanics,normal mode analysis, molecular dynamics and free energycalculations to simulate the structural and energetic properties ofmolecules. Comput. Phys. Commun., 91, 1–41.
15. Case,D.A., Cheatham,T.E., Darden,T., Gohlke,H., Luo,R.,Merz,K.M., Onufriev,A., Simmerling,C., Wang,B. and Woods,R.J.(2005) The Amber biomolecular simulation programs. J. Comput.Chem., 26, 1668–1688.
16. Cheatham,T.E. 3rd, Cieplak,P. and Kollman,P.A. (1999) A modifiedversion of the Cornell et al. force field with improved sugar puckerphases and helical repeat. J. Biomol. Struct. Dyn., 16, 845–862.
17. Perez,A., Marchan,I., Svozil,D., Sponer,J., Cheatham,T.E.,Laughton,C.A. and Orozco,M. (2007) Refinement of the AMBERforce field for nucleic acids: improving the description ofalpha/gamma conformers. Biophys. J., 92, 3817–3829.
18. Dang,L.X. (1995) Mechanism and thermodynamics of ion selectivityin aqueous-solutions of 18-crown-6 ether––a molecular dynamicsstudy. J. Am. Chem. Soc., 117, 6954–6960.
19. Essmann,U., Perera,L., Berkowitz,M.L., Darden,T., Lee,H. andPedersen,L.G. (1995) A smooth particle mesh Ewald method. J.Chem. Phys., 103, 8577–8593.
20. Darden,T., Perera,L., Li,L. and Pedersen,L. (1999) New tricks formodelers from the crystallography toolkit: the particle mesh Ewald
algorithm and its use in nucleic acid simulations. Structure, 7,R55–R60.
21. Berendsen,H.J.C., Postma,J.P.M., van Gunsteren,W.F., DiNola,A.and Haak,J.R. (1984) Molecular dynamics with coupling to anexternal bath. J. Chem. Phys., 81, 3684–3690.
22. Ryckaert,J.P., Ciccotti,G. and Berendsen,H.J.C. (1977)Numerical-integration of cartesian equations of motion of a systemwith constraints––molecular-dynamics of N-alkanes. J. Comput.Phys., 23, 327–341.
23. Lavery,R., Moakher,M., Maddocks,J.H., Petkeviciute,D. andZakrzewska,K. (2009) Conformational analysis of nucleic acidsrevisited: Curves+. Nucleic Acids Res., 37, 5917–5929.
24. Lavery,R., Maddocks,J.H., Pasi,M. and Zakrzewska,K. (2014)Analyzing ion distributions around DNA. Nucleic Acids Res., 42,8138–8149.
25. Pasi,M., Maddocks,J.H. and Lavery,R. (2015) Analyzing iondistributions around DNA: sequence-dependence of potassium iondistributions from microsecond molecular dynamics. Nucleic AcidsRes., 43, 2413–2423.
26. Goddard,T.D., Huang,C.C. and Ferrin,T.E. (2007) Visualizingdensity maps with UCSF Chimera. J. Struct. Biol., 157, 281–287.
27. Pettersen,E.F., Goddard,T.D., Huang,C.C., Couch,G.S.,Greenblatt,D.M., Meng,E.C. and Ferrin,T.E. (2004) UCSFChimera–a visualization system for exploratory research andanalysis. J. Comput. Chem., 25, 1605–1612.
28. Case,D.A., Berryman,J., Betz,R.M., Cerutti,D., Cheatham,T. III,Darden,T., Duke,R., Glese,T., Gohlke,H. et al. (2015) AMBER 2015.
29. Krause,E.F. (2012) Taxicab geometry: An adventure in non-Euclideangeometry. Courier Corporation.
30. Ward,J.H. Jr (1963) Hierarchical grouping to optimize an objectivefunction. J. Am. Stat. Assoc., 58, 236–244.
31. Kaufman,L. and Rousseeuw,P.J. (2009) Finding groups in data: anintroduction to cluster analysis. John Wiley & Sons.
32. Murtagh,F. and Legendre,P. (2014) Wards hierarchical agglomerativeclustering method: which algorithms implement wards criterion? J.Classif., 31, 274–295.
33. R Development Core Team (2009) R: a language and environmentfor statistical computing.
34. Crooks,G.E., Hon,G., Chandonia,J.M. and Brenner,S.E. (2004)WebLogo: a sequence logo generator. Genome Res., 14, 1188–1190.
35. Faiger,H., Ivanchenko,M., Cohen,I. and Haran,T.E. (2006) TBPflanking sequences: asymmetry of binding, long-range effects andconsensus sequences. Nucleic Acids Res., 34, 104–119.
36. Parvin,J.D., McCormick,R.J., Sharp,P.A. and Fisher,D.E. (1995)Pre-bending of a promoter sequence enhances affinity for theTATA-binding factor. Nature, 373, 724–727.
37. Mathelier,A., Zhao,X., Zhang,A.W., Parcy,F., Worsley-Hunt,R.,Arenillas,D.J., Buchman,S., Chen,C.-Y., Chou,A. and Ienasescu,H.(2013) JASPAR 2014: an extensively expanded and updatedopen-access database of transcription factor binding profiles. NucleicAcids Res., 42, D142–D147.
38. Badis,G., Berger,M.F., Philippakis,A.A., Talukder,S., Gehrke,A.R.,Jaeger,S.A., Chan,E.T., Metzler,G., Vedenko,A. and Chen,X. (2009)Diversity and complexity in DNA recognition by transcriptionfactors. Science, 324, 1720–1723.
39. Watkins,D., Mohan,S., Koudelka,G.B. and Williams,L.D. (2010)Sequence recognition of DNA by protein-induced conformationaltransitions. J. Mol. Biol., 396, 1145–1164.
40. Harris,L.A., Watkins,D., Williams,L.D. and Koudelka,G.B. (2013)Indirect readout of DNA sequence by p22 repressor: roles of DNAand protein functional groups in modulating DNA conformation. J.Mol. Biol., 425, 133–143.
41. Iwahara,J., Esadze,A. and Zandarashvili,L. (2015) Physicochemicalproperties of Ion Pairs of biological macromolecules. Biomolecules, 5,2435–2463.
42. Anderson,K.M., Nguyen,D., Esadze,A., Zandrashvili,L.,Gorenstein,D.G. and Iwahara,J. (2015) A chemical approach forsite-specific identification of NMR signals from protein side-chainNH3+ groups forming intermolecular ion pairs in protein–nucleicacid complexes. J. Biomol. NMR, 62, 1–5.
43. Esadze,A., Chen,C., Zandarashvili,L., Roy,S., Pettitt,B.M. andIwahara,J. (2016) Changes in conformational dynamics of basic sidechains upon protein–DNA association. Nucleic Acids Res., 44,6961–6970.
Dow
nloaded from https://academ
ic.oup.com/nar/article/44/20/9990/2608006 by guest on 30 M
arch 2022