Hydration pattern of A4T4 and T4A4 DNA: A molecular dynamics study
6
Hydration pattern of A4T4 and T4A4 DNA: A molecular dynamics study Chandramouli Balasubramanian a , Rajendra Prasad Ojha b, * , Souvik Maiti a, * a Proteomics and Structural Biology Unit, Institute of Genomics and Integrative Biology, CSIR, Mall Road, Delhi 110 007, India b Biophysics Unit, Department of Physics, DDU Gorakhpur University, Gorakhpur 273 009, India Received 13 February 2007 Available online 26 February 2007 Abstract Hydration pattern and energetics of ‘A-tract’ containing duplexes have been studied using molecular dynamics on 12-mer self-com- plementary sequences 5 0 -d(GCA4T4GC)-3 0 and 5 0 -d(CGT4A4CG)-3 0 . The structural features for the simulated duplexes showed corre- lation with the corresponding experimental structures. Analysis of the hydration pattern confirmed that water network around the simulated duplexes is more conformation specific rather than sequence specific. The calculated heat capacity change upon duplex forma- tion showed that the process is entropically driven for both the sequences. Furthermore, the theoretical free energy estimates calculated using MMPBSA approach showed a higher net electrostatic contribution for A4T4 duplex formation than for T4A4, however, energet- ically both the duplexes are observed to be equally stable. Ó 2007 Elsevier Inc. All rights reserved. Keywords: Molecular dynamics; Hydration; Conformational effect; Heat capacity Water plays an important role in all biological phenom- ena and its influence on the stabilization of the secondary structure of nucleic acids is well established [1], along with the solvent mediated conformational changes of DNA. By mediating sequence and conformation specific recognition of nucleic acids, water plays a significant role in DNA– ligand interactions. In this context, understanding of the solvation pattern of A-tract sequences, comprising of four or more consecutive A–T base pairs, is particularly impor- tant as these are the most common sites for the interaction of DNA with proteins and drugs [2,3]. Since the last decade many experimental and theoretical studies have been devoted to examine different aspects of A-tract containing sequences including their structural fea- tures, sequence effects, hydrogen bonding pattern, counter ion distribution etc. [4–11]. However, the hydration pattern of A-tracts still remains elusive. This work is an attempt to study the hydration pattern of A-tract containing duplexes in sequence context. By carrying out MD simulations on two self-complementary sequences that have same base composition but different structural features (d(GCAAAA TTTTGC) and d(CGTTTTAAACG) referred hereafter as A4T4 and T4A4), we have elucidated if the hydration net- work around A-tract is conformation specific or sequence specific. The NMR structures available for these sequences reveal that the former sequence takes a bent structure while the latter takes a straight structure [12]. In addition, a num- ber of other studies have shown that the sequences of the form d(GA4T4C) n or d(CA4T4G) n have different struc- tural features as compared to d(GT4A4C) n or d(CT4A4G) n [13–15]. Further, to understand the hybridization thermo- dynamics of these sequences, we made theoretical estimates of heat capacity changes and determined the free energy components using the well known MMPBSA [16–18] approach. Methods The canonical B-form duplex of 5 0 -d(GCAAAATTTTGC)-3 0 and 5 0 -d(CGTTTTAAAACG)-3 0 were generated using Nucgen module in Amber8 [19]. The nucleotides were designated from 1 to 12 (5 0 –3 0 ) for the 0006-291X/$ - see front matter Ó 2007 Elsevier Inc. All rights reserved. doi:10.1016/j.bbrc.2007.02.084 * Corresponding authors. Fax: +91 551 340459 (R.P. Ojha), +91 11 2766 7471 (S. Maiti). E-mail addresses: [email protected] (R.P. Ojha), [email protected] (S. Maiti). www.elsevier.com/locate/ybbrc Biochemical and Biophysical Research Communications 355 (2007) 1081–1086
-
Upload
independent -
Category
Documents
-
view
2 -
download
0
Transcript of Hydration pattern of A4T4 and T4A4 DNA: A molecular dynamics study
www.elsevier.com/locate/ybbrc
Biochemical and Biophysical Research Communications 355 (2007) 1081–1086
Hydration pattern of A4T4 and T4A4 DNA: A molecular dynamics study
Chandramouli Balasubramanian a, Rajendra Prasad Ojha b,*, Souvik Maiti a,*
a Proteomics and Structural Biology Unit, Institute of Genomics and Integrative Biology, CSIR, Mall Road, Delhi 110 007, Indiab Biophysics Unit, Department of Physics, DDU Gorakhpur University, Gorakhpur 273 009, India
Received 13 February 2007Available online 26 February 2007
Abstract
Hydration pattern and energetics of ‘A-tract’ containing duplexes have been studied using molecular dynamics on 12-mer self-com-plementary sequences 5 0-d(GCA4T4GC)-3 0 and 5 0-d(CGT4A4CG)-3 0. The structural features for the simulated duplexes showed corre-lation with the corresponding experimental structures. Analysis of the hydration pattern confirmed that water network around thesimulated duplexes is more conformation specific rather than sequence specific. The calculated heat capacity change upon duplex forma-tion showed that the process is entropically driven for both the sequences. Furthermore, the theoretical free energy estimates calculatedusing MMPBSA approach showed a higher net electrostatic contribution for A4T4 duplex formation than for T4A4, however, energet-ically both the duplexes are observed to be equally stable.� 2007 Elsevier Inc. All rights reserved.
Keywords: Molecular dynamics; Hydration; Conformational effect; Heat capacity
Water plays an important role in all biological phenom-ena and its influence on the stabilization of the secondarystructure of nucleic acids is well established [1], along withthe solvent mediated conformational changes of DNA. Bymediating sequence and conformation specific recognitionof nucleic acids, water plays a significant role in DNA–ligand interactions. In this context, understanding of thesolvation pattern of A-tract sequences, comprising of fouror more consecutive A–T base pairs, is particularly impor-tant as these are the most common sites for the interactionof DNA with proteins and drugs [2,3].
Since the last decade many experimental and theoreticalstudies have been devoted to examine different aspects ofA-tract containing sequences including their structural fea-tures, sequence effects, hydrogen bonding pattern, counterion distribution etc. [4–11]. However, the hydration patternof A-tracts still remains elusive. This work is an attempt tostudy the hydration pattern of A-tract containing duplexes
0006-291X/$ - see front matter � 2007 Elsevier Inc. All rights reserved.
doi:10.1016/j.bbrc.2007.02.084
* Corresponding authors. Fax: +91 551 340459 (R.P. Ojha), +91 112766 7471 (S. Maiti).
E-mail addresses: [email protected] (R.P. Ojha), [email protected](S. Maiti).
in sequence context. By carrying out MD simulations ontwo self-complementary sequences that have same basecomposition but different structural features (d(GCAAAATTTTGC) and d(CGTTTTAAACG) referred hereafter asA4T4 and T4A4), we have elucidated if the hydration net-work around A-tract is conformation specific or sequencespecific. The NMR structures available for these sequencesreveal that the former sequence takes a bent structure whilethe latter takes a straight structure [12]. In addition, a num-ber of other studies have shown that the sequences of theform d(GA4T4C)n or d(CA4T4G)n have different struc-tural features as compared to d(GT4A4C)n or d(CT4A4G)n
[13–15]. Further, to understand the hybridization thermo-dynamics of these sequences, we made theoretical estimatesof heat capacity changes and determined the free energycomponents using the well known MMPBSA [16–18]approach.
Methods
The canonical B-form duplex of 5 0-d(GCAAAATTTTGC)-3 0 and5 0-d(CGTTTTAAAACG)-3 0 were generated using Nucgen module inAmber8 [19]. The nucleotides were designated from 1 to 12 (5 0–3 0) for the
1082 C. Balasubramanian et al. / Biochemical and Biophysical Research Communications 355 (2007) 1081–1086
first strand and from 13 to 24 (5 0–3 0) for the complementary strand. Thesystems were neutralized with explicit Na+ ions. All simulations wereperformed using sander module in Amber8 with Cornell et al., all-atomforce field [20] and TIP3P model for water. Periodic boundary conditionswere applied using the particle mesh Ewald (PME) method [21] to treatlong-range electrostatics. Hydrogen bonds were constrained usingSHAKE [22]. A time step of 2 fs and a direct-space non-bonded cutoff of10 A was used. All simulations were performed at a constant temperatureof 300 K. The Langevin coupling [23] with a collision frequency of 1.0 wasused for temperature regulation. A constant pressure with isotropic mol-ecule based scaling with a relaxation time of 1 ps was used. The structureswere collected in the trajectory at an interval of 1 ps. All trajectory analysiswas done with Ptraj and Carnal modules in Amber8. Structural parame-ters were calculated using 3DNA [24]. All molecular visualization wasdone using InsightII and Chimera [25].
Equilibration. The solute was initially fixed with a force constant of500 kcal/mol and the system was minimized for 1000 steps followed bydynamics of 30 ps retaining a force constant of 50 Kcal/mol on the solute.The above steps were repeated again with slightly reduced force constants.Multiple minimizations for 1000 steps were done with an initial forceconstant of 25 Kcal/mol on the solute that was gradually reduced at anorder of 5 Kcal/mol in the subsequent runs. Thereafter, a free unrestrainedminimization of the whole system was done for 2000 steps. Finally thesystem was heated from 100 to 300 K over 10 ps and equilibrated for150 ps at constant pressure and temperature. Production dynamics wasinitiated at this stage and continued for 10 ns.
Solvent accessible surface area calculations. The solvent accessiblesurface area (SASA) calculation was done using the GRASP version 1.3[26] with a probe radius of 1.4 A for solvent. The MD averaged structuresof A4T4 and T4A4 were used for calculation. Surfaces for carbon, carbon-bound hydrogen and phosphorus were considered as non-polar while theremaining hydrophilic atoms were defined as polar. The calculations weredone with default Grasp radii set.
Thermodynamics analysis. The free energy components for the duplexformation were calculated using mm_pbsa module in Amber8. Here, weconsidered one strand as receptor and the complementary strand as theligand. The snapshots for the individual strands were extracted from the last6 ns trajectory of the duplexes at an interval of 20 ps, which yielded 300snapshots. Thereafter, all counter ions and water molecules were strippedout from the trajectory prior to the thermodynamic analysis. The Gas phaseenergies of the solutes were calculated using Cornell et al., force field [20]with no cutoff. Solvation free energies were computed as the sum of polarand non-polar contributions using continuum solvent representation.
The polar contribution was calculated with pbsa program in Amber8.The dielectric constant used for the solute and the surrounding solvent was 1and 80, respectively. Cornell et al., radii set was used to define atom-centeredspheres for the solute atoms and a probe radius of 1.4 A was used for thesolvent to define the dielectric boundary around the molecular surface. Alattice spacing of two grid points per A was used and 1000 finite differenceiterations were performed, excluding salt effect. The non-polar solventcontribution was estimated from a solvent accessible surface area (SASA)dependent term: DEsnp = c Æ SASA + b, where c was set to 0.005 Kcal/A2
and b to 0. The calculation for solute entropic contribution was performedwith NMODE module in Amber8. The snapshots were minimized in gasphase using the conjugate gradient method for 5000 steps, using a distancedependent dielectric of 4r (r is the inter-atomic distance) and with a con-vergence criteria of 0.1 Kcal/mol A for energy gradient. The frequencies ofthe vibrational modes were computed for these minimized structures at300 K using the normal mode analysis methodology.
Results
Structural analysis
Though, the main focus of the work is to elucidate thehydration pattern and thermodynamics of A-tract contain-
ing duplexes, we have also analyzed the helical parametersof the average structures of A4T4 and T4A4 calculatedover the last 4 ns of the trajectory. The structural featureswere then compared with the corresponding NMR struc-tures (1RVH and 1RVI) and the available literature studiesto assess the overall data. The ensemble average values ofthe parameters such as roll, tilt, buckle, slide, inclination,minor groove width are shown in the Supplementary Fig-ure S1, as a function of base pair. The terminal base pairwas excluded due to end effects. While, the distributionof tilt is similar for both A4T4 and T4A4, a distinctive pat-tern is seen for the roll. The roll for the simulated A4T4 atthe central A–T step is negative, however, less negativethan that for NMR structure. This leads to a compressioneffect towards the minor groove at the central A-tractregion. An opposite trend for roll is observed for theT4A4-molecule with a high positive roll at the central T–A step leading to a compression at the major groove. Sim-ilar observation has been reported in the X-ray structure ofd(CCTTTAAAGG) [6]. The slide and inclination valuesare positively correlated with the roll angles. Due to theconcerted variations in the slide value, which measuresthe relative transitions of the base pairs along their longaxes, the A–T and G–C base pairs are inclined in the oppo-site orientations at the A-tract junction. This change ininclination is compensated by the buckling of the base pairsat the junctions of the A-tracts. The change in buckling isfrom positive to negative for A4T4 structure and reversein case of T4A4 structure. Similar buckle mediated bendingof A-tract containing DNA sequence has been shown inearlier reports [5,27]. The minor groove width ofA4T4 shows a narrower region at the centre of thesequence while, opposite is the case for T4A4. These obser-vations are thus in fine agreement with the previous works[5–8].
Hydration pattern
Radial distribution function (rdf) is a useful quantity toget insight into the distribution of water layers around bio-molecules. The rdf of water around phosphate oxygen ofA4T4 and T4A4 over 10 ns is shown in Figure S2 in thesupplementary material. The distribution of water layersis similar around the phosphate oxygen of both A4T4and T4A4 with the first hydration shell starting at a dis-tance of 1.5 A and extending up to 2.5 A and the secondhydration shell extending up to 3.5 A. The calculated aver-age number of water molecules present within the firsthydration shell around A4T4 and T4A4 amounts to10.29 and 10.35 per nucleotide, respectively. In the secondshell this value is same for both the molecules that is �14/nucleotide. These values are close to the spectroscopic esti-mates of 11–12 waters per nucleotide for duplexes within3 A [1].
Further, to investigate the nature of interaction of waterat the nucleotide level, we calculated the average number ofwater molecules around the different donor/acceptor atoms
C. Balasubramanian et al. / Biochemical and Biophysical Research Communications 355 (2007) 1081–1086 1083
of A and T nucleotides at a distance of 2.5 and 4 A. Thevalues are shown in Tables S3–S6 in the supplementarymaterial. In the case of A4T4, the number of water mole-cules around the minor groove atoms (N3,O2), in the mid-dle of the sequence (A6–T7/A18–T19) is slightly lower incomparison to the corresponding atoms at the other nucle-otide positions in both first and second shell. This can beattributed to the compression of minor groove in the mid-dle of the sequence, as a result of which less number ofwater molecules can be accommodated for interaction.Another possible reason for the lesser number of watersin the minor groove in the middle of A4T4 may be dueto the replacement of the water by cations. This narrowminor groove pocket has been shown to be a probable sitefor ion binding in earlier works [9,11]. The interaction ofwater and ion between two base pairs in the groove affects
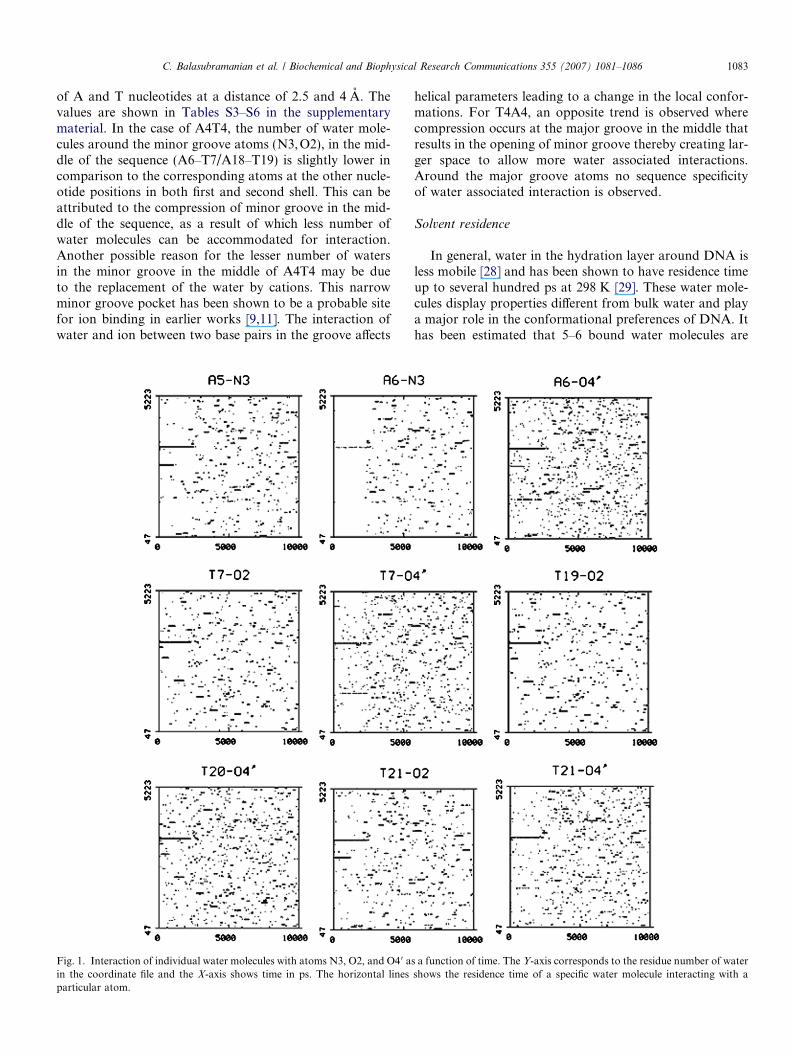
Fig. 1. Interaction of individual water molecules with atoms N3, O2, and O4 0 ain the coordinate file and the X-axis shows time in ps. The horizontal linesparticular atom.
helical parameters leading to a change in the local confor-mations. For T4A4, an opposite trend is observed wherecompression occurs at the major groove in the middle thatresults in the opening of minor groove thereby creating lar-ger space to allow more water associated interactions.Around the major groove atoms no sequence specificityof water associated interaction is observed.
Solvent residence
In general, water in the hydration layer around DNA isless mobile [28] and has been shown to have residence timeup to several hundred ps at 298 K [29]. These water mole-cules display properties different from bulk water and playa major role in the conformational preferences of DNA. Ithas been estimated that 5–6 bound water molecules are
s a function of time. The Y-axis corresponds to the residue number of watershows the residence time of a specific water molecule interacting with a
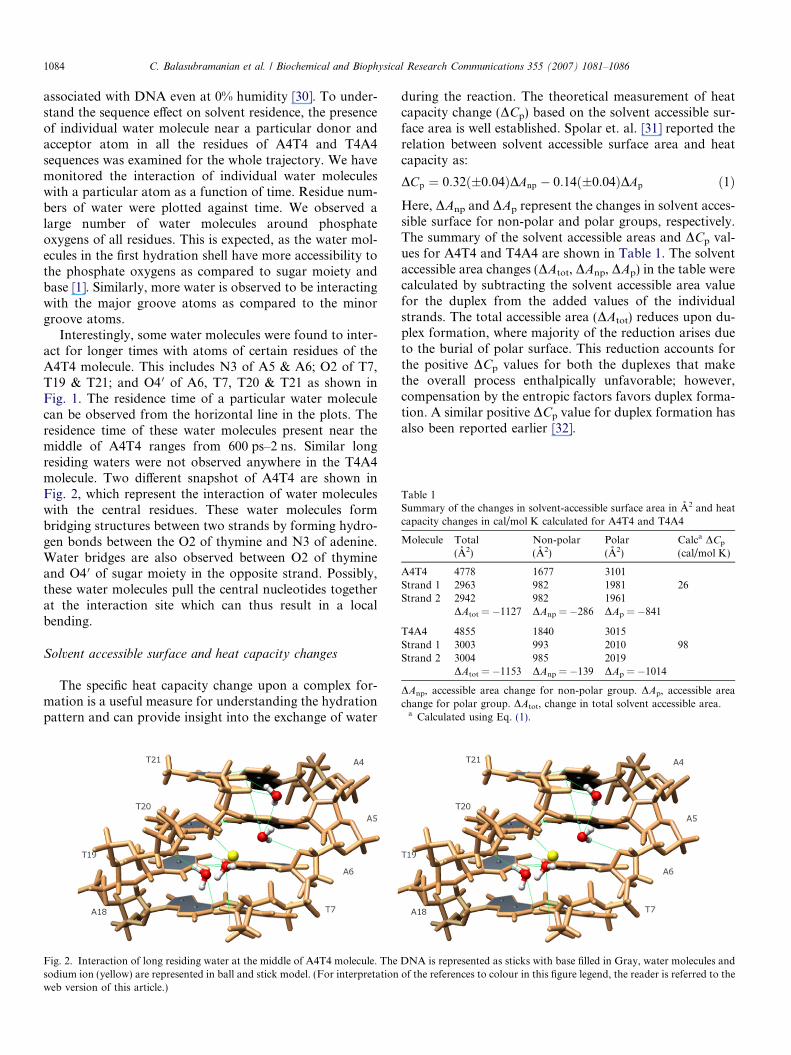
Table 1Summary of the changes in solvent-accessible surface area in A2 and heatcapacity changes in cal/mol K calculated for A4T4 and T4A4
Molecule Total(A2)
Non-polar(A2)
Polar(A2)
Calca DCp
(cal/mol K)
A4T4 4778 1677 3101Strand 1 2963 982 1981 26Strand 2 2942 982 1961
DAtot = �1127 DAnp = �286 DAp = �841
T4A4 4855 1840 3015Strand 1 3003 993 2010 98Strand 2 3004 985 2019
DAtot = �1153 DAnp = �139 DAp = �1014
DAnp, accessible area change for non-polar group. DAp, accessible areachange for polar group. DAtot, change in total solvent accessible area.
a Calculated using Eq. (1).
1084 C. Balasubramanian et al. / Biochemical and Biophysical Research Communications 355 (2007) 1081–1086
associated with DNA even at 0% humidity [30]. To under-stand the sequence effect on solvent residence, the presenceof individual water molecule near a particular donor andacceptor atom in all the residues of A4T4 and T4A4sequences was examined for the whole trajectory. We havemonitored the interaction of individual water moleculeswith a particular atom as a function of time. Residue num-bers of water were plotted against time. We observed alarge number of water molecules around phosphateoxygens of all residues. This is expected, as the water mol-ecules in the first hydration shell have more accessibility tothe phosphate oxygens as compared to sugar moiety andbase [1]. Similarly, more water is observed to be interactingwith the major groove atoms as compared to the minorgroove atoms.
Interestingly, some water molecules were found to inter-act for longer times with atoms of certain residues of theA4T4 molecule. This includes N3 of A5 & A6; O2 of T7,T19 & T21; and O4 0 of A6, T7, T20 & T21 as shown inFig. 1. The residence time of a particular water moleculecan be observed from the horizontal line in the plots. Theresidence time of these water molecules present near themiddle of A4T4 ranges from 600 ps–2 ns. Similar longresiding waters were not observed anywhere in the T4A4molecule. Two different snapshot of A4T4 are shown inFig. 2, which represent the interaction of water moleculeswith the central residues. These water molecules formbridging structures between two strands by forming hydro-gen bonds between the O2 of thymine and N3 of adenine.Water bridges are also observed between O2 of thymineand O4 0 of sugar moiety in the opposite strand. Possibly,these water molecules pull the central nucleotides togetherat the interaction site which can thus result in a localbending.
Solvent accessible surface and heat capacity changes
The specific heat capacity change upon a complex for-mation is a useful measure for understanding the hydrationpattern and can provide insight into the exchange of water
Fig. 2. Interaction of long residing water at the middle of A4T4 molecule. Thesodium ion (yellow) are represented in ball and stick model. (For interpretationweb version of this article.)
during the reaction. The theoretical measurement of heatcapacity change (DCp) based on the solvent accessible sur-face area is well established. Spolar et. al. [31] reported therelation between solvent accessible surface area and heatcapacity as:
DCp ¼ 0:32ð�0:04ÞDAnp � 0:14ð�0:04ÞDAp ð1ÞHere, DAnp and DAp represent the changes in solvent acces-sible surface for non-polar and polar groups, respectively.The summary of the solvent accessible areas and DCp val-ues for A4T4 and T4A4 are shown in Table 1. The solventaccessible area changes (DAtot, DAnp, DAp) in the table werecalculated by subtracting the solvent accessible area valuefor the duplex from the added values of the individualstrands. The total accessible area (DAtot) reduces upon du-plex formation, where majority of the reduction arises dueto the burial of polar surface. This reduction accounts forthe positive DCp values for both the duplexes that makethe overall process enthalpically unfavorable; however,compensation by the entropic factors favors duplex forma-tion. A similar positive DCp value for duplex formation hasalso been reported earlier [32].
DNA is represented as sticks with base filled in Gray, water molecules andof the references to colour in this figure legend, the reader is referred to the
C. Balasubramanian et al. / Biochemical and Biophysical Research Communications 355 (2007) 1081–1086 1085
Thermodynamic analysis
In addition to solvation, we also estimated the relativefree energy of duplex formation of A4T4 and T4A4 usingthe MMPBSA approach, where the total free energy ofbinding is expressed as the sum of the contributions fromgas phase and solvation energies plus an additional termfor the solute entropic contribution. This can be expressedin the following form:
G ¼ Egas þ Esolv � TSsolute ð2Þ
where Egas is the gas-phase energy, Esolv is the total solva-tion energy (polar + non-polar) and the TS term corre-sponds to solute entropic effects. The estimates aresummarized in Table S7 in the supplementary material.These calculations are based on single trajectories of theduplexes obtained from the explicit solvent simulations.The overall free energy of duplex formation amounts to�36.57 Kcal/mol and �36.98 Kcal/mol, for A4T4 andT4A4 respectively, suggesting that both the duplexes areequally stable. The electrostatic contribution to free energyis observed to be positive for both the duplexes, however,this is compensated by a high negative contribution by po-lar part of solvation energy. The net electrostatic energy forA4T4 and T4A4 thus, amounts to �15.63 and �9.84 Kcal/mol, respectively, that contributes favorably to the duplexformation. The other favorable contributions to this pro-cess are from the Van der Waals and non-polar solvationenergies. Further, the entropic contributions arising fromthe changes in the degrees of freedom of the solutes duringduplex formation showed a higher entropic gain for T4A4than for A4T4. Similar findings have also been reportedearlier [33].
Conclusion
A-tracts are known to serve as the most common site forthe interaction of DNA with proteins and drugs. In thiscontext, studying the hydration pattern and thermodynam-ics of these A4T4 and T4A4 sequences will be instrumentalin getting an insight into the various molecular forces thatgovern the A-tract associated interactions. This work high-lights the hydration pattern and energetic of A-tract con-taining duplexes.
Our model obtained from the MD simulations showed areasonable correlation with the NMR structures in termsof helical parameters, indicating the reliability of the mod-els. The differential interaction of water in the minorgrooves of A4T4 and T4A4 molecules, together with theirlong term interaction with A4T4 compared to T4A4, sug-gested that the nature of water binding and life time ofbound water molecules is indeed, conformation specificrather than sequence specific. Furthermore, thermody-namic analysis revealed a positive heat capacity changefor both A4T4 and T4A4 duplex formation, signifying thatthe reaction is entropically driven. A detailed insight intothe free energy estimates showed a higher net electrostatic
contribution for A4T4 duplex formation than for T4A4,however, energetically both the duplexes are observed tobe equally stable.
Acknowledgment
Authors acknowledge CSIR for funding (CMM0017)this research. Authors thank Professor David A Case,The Scripps Research Institute, for providing the comple-mentary copy of AMBER8 and Dr. Simone Gupta, Insti-tute of Genomics and Integrative Biology for helping usin proof reading.
Appendix A. Supplementary data
Supplementary data associated with this article can befound, in the online version, at doi:10.1016/j.bbrc.2007.02.084.
References
[1] W. Saenger, Principles of Nucleic Acid Structure, Springer-Verlag,New York, 1984.
[2] M.A. E1 Hassan, C.R. Calladine, Two distinct modes of protein-induced bending in DNA, J. Mol. Biol. 282 (1998) 331–343.
[3] S. Neidle, DNA-minor groove recognition by small molecules, Nat.Prod. Rep. 18 (2001) 291–309.
[4] H. R Drew, R.E. Dickerson, Structure of a B-DNA.III. Geometry ofhydration, J. Mol. Biol. 151 (1981) 535–556.
[5] A. Barbic, D.P. Zimmer, D.M. Crothers, Structural origins ofadenine-tract bending, Proc. Natl. Acad. Sci. USA. 100 (2003)2369–2373.
[6] D.R. Mack, T.K. Chiu, R.E. Dickerson, Intrinsic bending anddeformability at the T–A step of CCTTTAAAGG: A comparativeanalysis of T–A and A–T steps within A-tracts, J. Mol. Biol. 312(2001) 1037–1049.
[7] M.A. Young, D.L. Beveridge, Molecular dynamics simulations of anoligonucleotide duplex with adenine tracts phased by a full helix turn,J. Mol. Biol. 281 (1998) 675–687.
[8] D. Sprous, M.A. Young, D.L. Beveridge, Molecular dynamics studiesof axis bending in d(G5-(GA4T4C)2-C5) and d(G5-(GT4A4C)2-C5):Effects of sequence polarity on DNA curvature, J. Mol. Biol. 285(1999) 1623–1632.
[9] M.A. Young, B. Jayaram, D.L. Beveridge, Intrusion of counterioninto the spine of hydration in the minor groove of B-DNA: Fractionaloccupancy of electronegative pockets, J. Am. Chem. Soc. 119 (1997)59–69.
[10] A. Madhumalar, Manju Bansal, Structural insights into the effect ofhydration and ion- on A-track DNA: A molecular dynamics study,Biophys. J. 85 (2003) 1805–1816.
[11] F. Mocci, G. Saba, Molecular dynamics simulations of a.t-richoligomers: sequence-specific binding of Na+ in the minor groove ofB-DNA, Biopolymers 68 (2003) 471–485.
[12] R. Stefi, H. Wu, S. Ravindranathan, V. Sklenar, J. Feigon, DNAA-tract bending in three dimensions: Solving the dA4T4 vs.dT4A4 conundrum, Proc. Natl. Acad. Sci. USA 101 (2004) 1177–1182.
[13] P.J. Hagerman, Sequence-directed curvature of DNA, Nature 321(1986) 449–450.
[14] A.M. Berkhoff, T.D. Tullius, Structural details of an adenine tractthat does not cause DNA to bend, Nature 331 (1988) 455–456.
[15] J.H. Chen, N.C. Seeman, N.R. Kallenbach, Tracts of A Æ T base pairsretard the electrophoretic mobility of short DNA duplexes, NucleicAcid Res. 16 (1988) 6803–6812.
1086 C. Balasubramanian et al. / Biochemical and Biophysical Research Communications 355 (2007) 1081–1086
[16] P.A. Kollman, I. Massova, C. Reyes, B. Kuhn, S. Huo, et al.,Calculating structures and free energies of complex molecules:Com-bining molecular mechanics and continuum models, Acc. Chem. Res.33 (2000) 889–897.
[17] J. Srinivasan, T.E. Cheatham III, P.A. Kollman, D.A. Case,Continuum solvent studies of the stability of DNA, RNA, andphosphoramidate-DNA helices, J. Am. Chem. Soc. 120 (1998) 9401–9409.
[18] H. Gohlke, D.A. Case, Converging free energy estimates: MM-PB(GB) SA studies on the protein–protein complex Ras–Raf, J.Comput. Chem. 25 (2003) 238–250.
[19] D.A. Case, T.A. Darden, T.E. Cheatham III., C.L. Simmerling, J.Wang, R.E. Duke, R.Luo, K.M. Merz, B. Wang, D.A. Pearlman, M.Crowley, S. Brozell, V. Tsui, H. Gohlke, J.Mongan, V. Hornak, G.Cui, P. Beroza, C. Schafmeister, J.W. Caldwell, W.S. Ross, P.A.Kollman (2004), AMBER 8, University of California, San Francisco.
[20] W.D. Cornell, P. Cieplak, C.I. Bayly, I.R. Gould, K.M. Merz Jr.,D.M. Ferguson, D.C. Spellmeyer, T. Fox, J.W. Caldwell, P.A.Kollman, A second generation force field for the simulation ofproteins, nucleic acids, and organic molecules, J. Am. Chem. Soc. 117(1995) 5179–5197.
[21] T. Darden, D. York, L. Pedersen, Particle mesh Ewald–an Nlog(N)method for Ewald sums in large systems, J. Chem. Phys. 98 (1993)10089–10092.
[22] J.P. Ryckaert, G. Ciccotti, H.J.C. Berendsen, Numerical integration ofthe Cartesian equations of motion of a system with constraints:Molecular dynamics of n-alkanes, J. Comput. Phys. 23 (1977) 327–341.
[23] J.A. Izaguirre, D.P. Catarello, J. M Wozniak, R. D Skeel, Langevinstabilization of molecular dynamics, J. Chem. Phys. 114 (2001) 2090–2098.
[24] X.J. Lu, Z. Shakked, W. K Olson, A-form conformational motifs inligand-bound DNA structures, J. Mol. Biol. 300 (2000) 819–840.
[25] E.F. Pettersen, T.D. Goddard, C.C. Huang, G.S. Couch, D.M.Greenblatt, E.C. Meng, T.E. Ferrin, UCSF Chimera—A visualiza-tion system for exploratory research and analysis, J. Comput. Chem.25 (2004) 1605–1612.
[26] A. Nicholls, K.A. Sharp, B. Honig, Protein folding and association:insights from the interfacial and thermodynamic properties ofhydrocarbons, Proteins: Struct. Funct. Genet. 11 (1991) 281–296.
[27] J. Hizver, H. Rozenberg, F. Frolow, D. Rabinovich, Z. Shakked,DNA bending by an adenine–thymine tract and its role in generegulation, Proc. Natl. Acad. Sci. USA 98 (2001) 8490–8495.
[28] V.A. Makarov, M. Feig, B.M. Pettitt, Diffusion of solvent aroundbiomolecular solutes: A molecular dynamics simulation study,Biophys. J. 75 (1998) 150–158.
[29] A.T. Phan, J.L. Leroy, M. Gueron, Determination of the residencetime of water molecules hydrating B 0-DNA and B-DNA, by one-dimensional zero-enhancement nuclear overhauser effect spectros-copy, J. Mol. Biol. 286 (1999) 505–519.
[30] N.J. Tao, S.M. Linsway, A. Rupprecht, Structure of DNA hydrationshells studied by Raman spectroscopy, Biopolymers 28 (1989) 1019–1030.
[31] R. Spolar, J.R. Livingstone, M.T. Record, Use of liquid hydrocarbonand amide transfer data to estimate contributions to thermodynamicfunctions of protein folding from the removal of nonpolar and polarsurface from water, Biochemistry 31 (1992) 3947–3955.
[32] T.V. Chalikian, J. Volker, G. E Plum, K.J. Breslauer, A more unifiedpicture for the thermodynamics of nucleic acid duplex melting: acharacterization by calorimetric and volumetric techniques, Proc.Natl. Acad. Sci. USA 96 (1999) 7853–7858.
[33] Y.W. Park, K.J. Breslauer, A spectroscopic and calorimetric study ofthe melting behaviors of a ‘‘bent’’ and a ‘‘normal’’ DNA duplex:[d(GA4T4C)]2 versus [d(GT4A4C)]2, Proc. Natl. Acad. Sci. USA 88(1991) 1551–1555.