(Microsoft PowerPoint - 03. Cement hydration [\300\320\261 ...
Upload
independentCategory
view
1download
0
熊本大学学術リポジトリ
Kumamoto University Repository System
Title Infrared spectroscopy on poly(dG)-poly(dC) DNA at
low hydration
Author(s) Hasanudin; Tajiri, Kenji; Yokoi, Hiroyuki; Kuroda,
Noritaka; Matsui, Hiroshi; Yanagimachi, Takeshi;
Taniguchi, Masateru; Kawai, Tomoji; Toyota, Naoki
Citation Journal of the Physical Society of Japan, 76(2):
024009-1-024009-6
Issue date 2007-02-13
Type Journal Article
URL http://hdl.handle.net/2298/10533
Right © 2007 The Physical Society of Japan

1
Infrared spectroscopy on poly(dG)-poly(dC) DNA at low hydration
Hasanudin ABDURAKHMAN,1,2,3,4 Kenji TAJIRI,3 Hiroyuki YOKOI, 3 Noritaka KURODA,3 Hiroshi MATSUI,1,2 Takeshi YANAGIMACHI,2 Masateru TANIGUCHI,5
Tomoji KAWAI,5 and Naoki TOYOTA1,2
1Center for Interdisciplinary Research, Tohoku University, Sendai 980-8578
2Physics Department, Graduate School of Science, Tohoku University, Sendai 980-8578
3Department of Materials Science and Engineering, Graduate School of Science and Technology, Kumamoto University, Kumamoto 860-8555
4Faculty of Engineering, Tanjungpura University, Pontianak 78124, Indonesia 5The Institute of Scientific and Industrial Research, Osaka University, 8-1 Mihogaoka,
Ibaraki, Osaka 567-0047 Abstract Infrared absorption measurements have been made on dry samples of poly(dG)-poly(dC) DNA at various relative humidity and temperatures. The water content, controlled by the relative humidity, reduces as temperature increases and reaches a very low value of ~ 0.1 wpn above 120 oC. This minimum water content is maintained when the samples are brought back to room temperature as long as they are kept at the relative humidity of ~0 %. The molecular vibrations, which characterize the backbone structure as well as the base stacking and pairing, indicate that our samples maintain an A-form double helical structure at all the values of water content. The disorder in the base stacking is observed as the result of the decrease of the water content. Additionally the denaturation appears at high temperatures above 100 oC, which reversibly disappears with decreasing temperature. KEYWORDS: DNA, structure, infrared, water content, molecular vibrations
2
1. Introduction
The structure of DNA has been studied using various methods such as an X-ray
diffraction, neutron scattering, and infrared spectroscopy. In the early stages of the
structural studies, X-ray diffraction had been a unique method available for this purpose,
while later, other methods have been applied to the analysis of the structure. One of the
most important points obtained from those studies is the fact that DNA takes various
conformations, and the conformational transition takes place due to several
environmental factors1,2).
Fiberous samples have been used in early X-ray diffraction studies of DNA
structure1). This method has proved to be powerful for identifying a certain
conformation, as well as the condition that favour particular conformations and that are
responsible for introducing transitions between them. However, since the diffraction
data of the DNA fiber are limitedto a resolution of 2 Å at best, such data hardly gives
the structural information at an atomic resolution1,3,4). Later, X-ray diffraction
measurements have been performed also on the single crystals of oligonucleotides. Over
the past two decades this method has provided the structural information at the atomic
level, at least as far as atoms except hydrogen are concerned. However, unlike the
situation within the fibers, the single crystal environment is rarely able to accommodate
significant conformational transitions3,4).
As is well known, neutron scattering measurement is unique and powerful for
studying biological systems. This is because the neutron scattering allow us to “see” the
hydrogen atoms 5,6). This method, however, requires a sizable single crystal since in
general its intensity is five orders of magnitude as low as X-ray intensity.
3
Finally to note, the infrared spectroscopy is also a powerful tool for providing
structural information through the molecular vibrations. In the 500-2000 cm-1 region the
infrared spectrum of a DNA gives about 40 well-defined absorption bands that appear at
different positions with different relative intensities and dichroic ratios, depending on
the conformation of DNA. Each spectral difference reflects the difference in the
structure. A combination of the infrared spectroscopy with the X-ray diffraction have
resulted in the sets of infrared marker bands of various conformations7-10). These marker
bands make infrared spectroscopy very convenient for studying the structural properties
of DNA.
The other advantage of infrared spectroscopy from the technical point of view is
that there is no limitation for the sample size and one can work with native high
molecular weight DNA, with DNA fragments obtained by an enzymatic or chemical
cleavage, and with long stranded polynucleotides or short synthetic olygomers. In
addition, it is a non-destructive technique that requires small amount of samples10).
Many parameters such as the ionic strength and concentration of the counterion, pH,
temperature, and hydration, can be easily monitored. Therefore, the infrared
spectroscopy has been widely used to obtain the structural related properties as well as
to study the structural change induced by the change in the environmental factors, such
as relative humidity and temperature. For this reason the infrared spectroscopy has also
been employed to explore the interaction of counterions with DNA7).
In general, the conformation is strongly dependent on the relative humidity, and
hence the water content. At high humidity a DNA fiber or film adopts the B-form at
room temperature. As it is reduced to a certain threshold, the decrease in hydration leads
to the transformation of the B-form into other conformations such as A or Z-form1,9). A

4
further decrease introduces a disordered structure. In addition, the denaturation can take
place when the samples are heated up to ~90 oC. In the disordered structure, the
hydrogen bonds connecting the bases are partially broken, resulting in a lack of the base
stacking and pairing. In the denaturated state, on the other hand, most of the hydrogen
bonds of the bases are broken, and DNA loses its double helical structure.
The infrared spectroscopy is convenient for studying the properties of water
hydrated in DNA. Water molecules manifest themselves in the infrared absorption
spectrum as several absorption bands arise from the OH stretching mode. Among them,
the most intense band, which arises from the antisymmetric OH stretching mode,
appears at around 3400 cm-1[Ref. 11,12]. The intensity of this band is strongly
dependent on the relative humidity as well as the water content. Therefore it has been
widely used as the convenient measure of water content in DNA.
All three molecular subgroups in DNA (the heterocyclic bases, sugars, and
diesterified phosphate groups) provide sites where water molecules can hydrate. The
frequencies and intensities of the infrared bands associated with the various molecular
subgroups are sensitive to environmental effects, particularly to the hydrogen bonding.
The hydrogen bonding of water molecules with any molecular subgroups causes a shift
in the vibration frequency. This shift, therefore, can be used for determining the
hydration sites in a certain relative humidity range11).
Actually, the water content is not the only factor that determines the structure. In
addition to water content, the structural properties are strongly dependent on the
types7,13-15) and concentrations of counterions16), base sequence1, 3,17), and temperature18).
There have been many studies reporting the important roles of these factors. Those
studies, however, focus mainly on the structural transition from one conformation to
5
another.
Up to date, the studies on the structural properties of dry DNA at low water
content are very limited. The most recent work has been performed by Lee et al. on the
natural DNA with sodium counterions using calorimetric and infrared spectroscopies9).
They have found that, at room temperature, in the water content of 3.3 - 7.2 water per
nucleotide (wpn) a structural change involving a slight disruption of the base stacking
arises, followed by the denaturation process at higher temperature where the changes in
the backbone structure occur. In case of natural DNA, the base sequence is random.
Then, it is worth investigating the structural properties at low water content for
differently sequenced DNA.
In this paper work we report on the results from infrared absorption
measurements on dry poly(dG)-poly(dC) DNA with the regular base sequence at low
water content. We are particularly interested in the structural stability of DNA at the
state where the surrounding water is almost absent. Through this study, we intend to
investigate the conditions to maintain the DNA structure at very low water content. A
stable DNA structure at low water content might be important for further studies of
DNA, particularly from the electrical conduction point of views.
2. Experimental
The samples of poly(dG)-Poly(dC) DNA with the typical molecular length of
1.7-2.9 µm was purchased from Amersham Bioscience Co. Ltd. The purification and
collection were performed by using conventional method for an electroelution, phenol
extraction, and ethanol precipitation. The processed samples then were diluted with
deionized water (17.8 MΩ) to a concentration of 25 U (1 U = 50 ng/ml). The
6
concentration of sodium ions in the solutions was estimated as 1.2 x 10³ ppm using an
inductively coupled plasma spectroscopy. Finally, this solution was dried in a vacuum to
obtain film-like solid samples.
A film for infrared absorption measurements was achieved by spreading the solid
DNA on a BaF4 crystal. The infrared absorption in the spectral range of 700-4000 cm-1
was measured using a FTIR spectrometer (Jasco FT/IR 410) equipped with a Cassegrain
microscope. The samples were placed in a temperature-controllable optical cell (Linkam
Th 6800). All the measurements were performed with a constant flow of dry nitrogen
gas (500 ml/min.) into the sample chamber to keep the samples at low relative humidity,
except for the first measurement at 30 oC.
3. Results and Discussion
Figure 1 shows the absorption spectra in the region of 2000-4000 cm-1 before and
after the flow of dry nitrogen gas into the sample chamber at 30 oC and at higher
temperatures. The spectrum is mainly featured by a broad band at 3400 cm-1. Before the
flow of nitrogen gas, the intensity of the band is quite strong. After 10 minutes of
exposure to nitrogen gas, it abruptly decreases, and remains almost unchanged after the
longer exposure to nitrogen gas. As temperature increases, the intensity gradually
decreases up to 120 oC to become constant at higher temperature at 150 oC. It also
remains constant as temperature is lowered back to 30 oC.
The band at 3400 cm-1 is assigned to the OH stretching mode of water molecules.
This band is known to be strongly dependent on the relative humidity and has been used
for estimating the water content in DNA11,12). It should be noted that several other
vibrations such as NH and NH2 stretching modes also appear in this frequency region

7
almost the same with the OH stretching mode18,19). Therefore, a careful identification of
each vibration is necessary before using this band to estimate the water content.
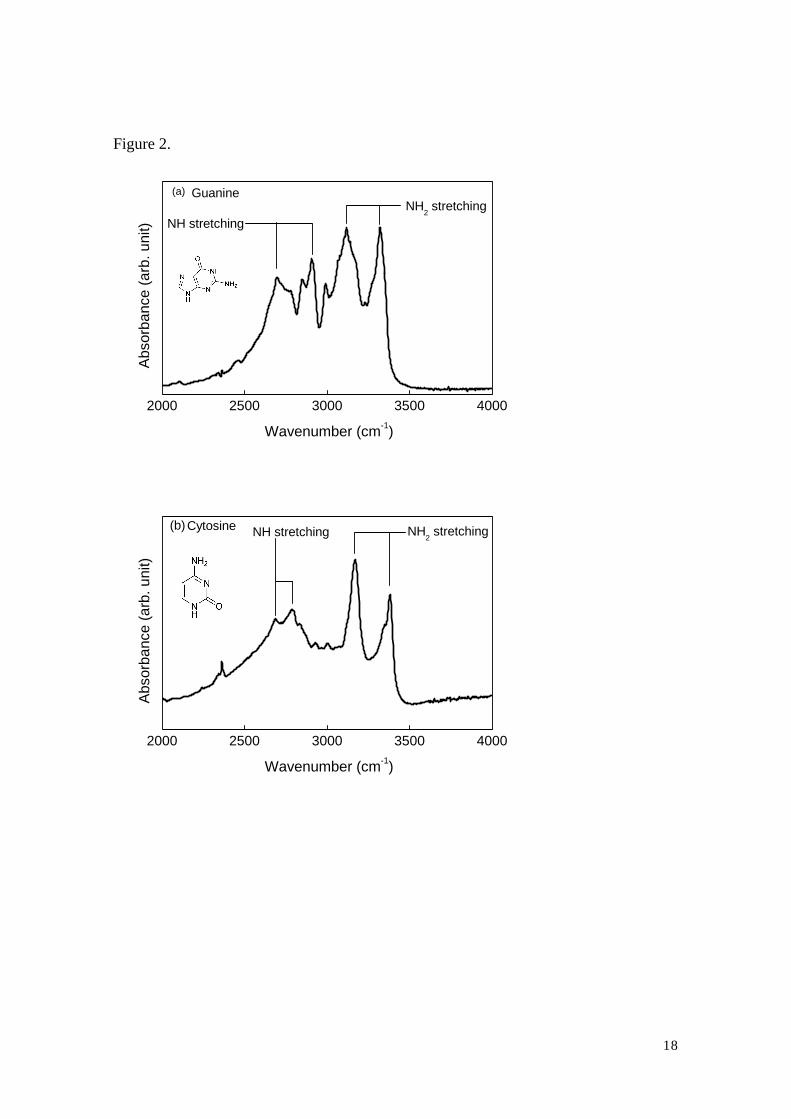
To interpret on the spectrum carefully, we have measured the absorption spectrum
of the guanine and cytosine powder, and the results are shown in Figs. 2 (a) and (b). The
obtained spectra are in good agreement with previously reported results19,20). Each
spectrum consists of several sharp peaks arises from NH and NH2 stretching, observed
below and above 3000 cm-1, respectively. The two peaks of NH2 stretching may
correspond to the two main peaks in the spectrum of DNA shown in Fig.1. We have also
measured the absorption of the bases at several temperatures up to 150 oC and observed
no temperature dependence. The significant temperature dependence of the band at
3400 cm-1, therefore, is considered as the property of the OH stretching of water
molecules.
To separate the absorption band due to water from that of other origins, we
subtracted each spectrum from the spectrum at 150 oC by assuming that, at this
temperature, the remaining spectrum consists of the underlying absorption of DNA only,
so that the subtracted spectrum can be regarded as the absorption spectrum of water.
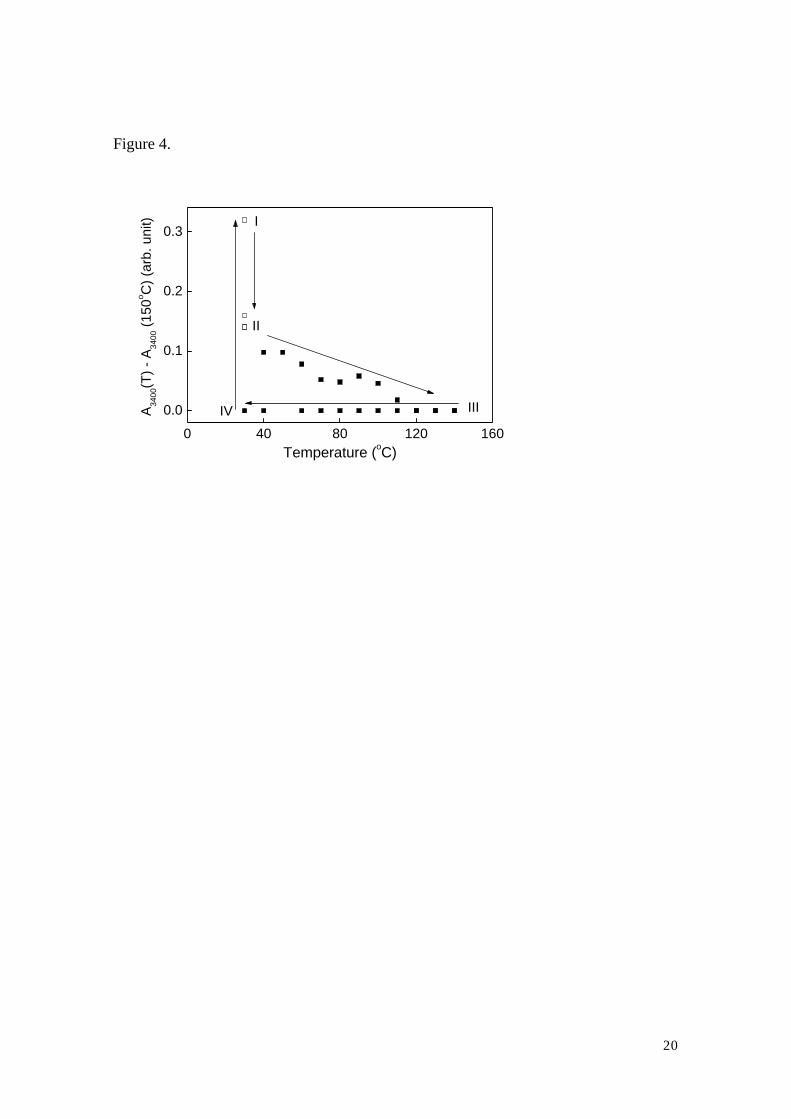
The results are shown in Fig. 3, and the intensity of the band as the function of humidity
and temperature is shown in Fig. 4. The intensity is high at 30 oC before the flow of
nitrogen (state I). It decreases after the 10 minute-flow, but remains unchanged after the
longer exposure to nitrogen at the same temperature (state II).
As the temperature increases, the intensity decreases further, and becomes almost
zero at 120 oC and higher temperatures (state III). This state remains as the temperature
is lowered to 30 oC (state IV). It should be noted that the intensity recovers its initial
value when the samples are exposed to room humidity.

8
Based on the previous reports11), we consider the change of the intensity of the
OH stretching band with the changing humidity and temperature is due to the change of
the water content in our samples. In general, the water content of DNA can be measured
by several methods, such as the so-called Karl Fisher titration and thermogravitometric3).
However, we did not perform any measurements to check the exact value of the relative
humidity and the water content of our samples. For a rough quantitative estimation, we
use the formula given by Falk et al. 21)
)86.0(52.4 −= Rn . (1)
Here R is the absorbance of the band at 3400 cm-1 without being subtracted with the
spectrum at 150 oC, normalized by the absorbance of the band at 1240 cm-1. Using the
value of the absorbance plotted in Fig. 4 added by 0.43, which is the value of R at 150
oC and normalized with the absorbance of the band at 1240 cm-1, we obtaine the water
content for the sample prior to nitrogen gas exposure is 3-6 wpn.
After the flow of nitrogen gas, the water content is estimated to be ~1 wpn.
Heating up the samples causes the remaining water molecules to evaporate. This
evaporation is indicated by the further decrease in the intensity of the above-mentioned
band as temperature increases. The water content in the sample after being heated above
120 oC is estimated to be ~ 0.1 wpn. Lee et al. have mentioned that they have
completely removed water molecules from their samples by annealing them at 160 oC
for 30 minutes9). Since the situation is very similar to our experiment, we believe that
the value of water content of ~0.1 wpn above 120 oC is reliable.
The behavior of the band at around 1240 cm-1 in Fig. 5, which has been assigned
to the antisymmetric PO2- stretching mode, also supports the above estimation on the
water content. The frequency of this band is known to be strongly dependent on the
9
relative humidity12,15. In natural DNA at relative humidity of 70% and higher, it appears
at ~1220 cm-1, and almost linearly shifts to higher frequency as the relative humidity
decreases. At 0 % humidity, it appears at ~1243 cm-1. The exact frequency for each
value of humidity varies depending on many factors such as the base sequence and
counterion. Nevertheless, the relation between the humidity and frequency shift shows a
similar trend for each kind of DNA.
Figure 5 shows the spectra in the region of 750-1800 cm-1. At 30 oC before the
flow of nitrogen in Fig. 5(a), we observe the antisymmetric PO2- stretching mode at
1240 cm-1, which shifts to 1247 cm-1 after the flow of nitrogen (Fig.5(b)) and remains
unchanged when the sample is brought to higher temperature. The frequency before the
flow of nitrogen is very close to that of the sample at low hydration11,12), and the shift to
higher frequency indicates that the water content of the samples decreases. This shift
also indicates that the water molecules hydrate the phosphate backbone before being
released.
It is now our concern to explore the structure of the present DNA sample at the
state where water is almost absent. As described in Section I, the structural properties of
DNA in the infrared spectrum is represented by several marker bands, which appear
only for a certain conformation. In addition, the frequency of certain vibrations also
shows the characteristics of a certain structure, such as the antisymmetric PO2-
stretching, and the in-plane C=C or C=N stretching of the bases. Those bands, therefore,
have been used as the indicator of the structural transformation as well as the structural
disruption due to the change in the environment. The structural changes in our samples
are easier to understand if we use each marked states in Fig. 4 as the guideline.
Figure 5(a) shows the spectrum measured at 30 oC prior to the exposure of the

10
samples to the nitrogen gas. This state of the samples corresponds to the state I in Fig. 4.
The spectrum exhibits the characteristic of A-form with marker bands are observed at
806, 899, and 1182 cm-1(Ref. 7). The absorption bands due to the symmetric and
anti-symmetric stretching of the PO2- are observed at 1086, and 1240 cm-1, respectively.
The double bond (C=O and C=N) stretching mode of the bases, is observed at 1710
cm-1 which also reflect the characteristic of A-form 7,9,10).
As mentioned above, the water content of the samples significantly decreases after
the exposure to nitrogen for 60 minutes, which corresponds to the state II in Fig. 4.
However, this does not result in a significant change in the overall spectrum,
particularly in the structural point of view. As shown in the spectrum of Fig. 5(b), the
peak position and the shape of characteristic bands remain almost unchanged. Most of
the bands are slightly enhanced, except the marker bands, which slightly diminish but
remain clearly observable. The symmetric PO2- stretching mode at 1086 cm-1 also
slightly diminishes and is broadened.
As the temperature increases (Fig. 5(c) and (d)), the intensity of each bands
gradually decreases. These states correspond to the states II and III in Fig. 4. In
particular, at 150 oC shown in Fig. 5(d), the A-form marker bands become barely
observable, and the band at 1086 cm-1 representing the backbone structure is
significantly reduced and broadened. The characteristic band of base stacking and
pairing at 1710 cm-1 remains observable.
Figure 5(e) shows the spectrum measured at 30oC after the sample is heated up to
150oC. This state corresponds to the state IV in Fig. 4. The spectrum is very similar to
that measured at the same temperature prior to the exposure to nitrogen gas, despite the
difference in water content. In particular, the band at 1086 cm-1 becomes quite intense

11
and almost comparable to the intensity observed in the samples after the flow of
nitrogen gas. The A-form marker bands, on the other hand, are very weak but remain
observable.
As explained above, at 30 oC before the exposure to nitrogen gas (state I of Fig.
4) our samples take the A-form. After the exposure to nitrogen gas (state II), the
samples maintain the A-form despite the decrease of their water content. A disorder,
however, takes place, which is indicated by the diminishing of the marker bands. Lee et
al. have observed that, in natural NaDNA at water content of 1 wpn, corresponding to
the state II in the present work, the mode representing the base stacking and pairing at
1710 cm-1 disappears, while the symmetric PO2- stretching mode at 1086 cm-1 is
broadened9). In contrast, both modes remain almost unchanged in our spectrum. This
fact suggests that the degree of the disorder in our samples is much lower than that
observed by Lee et al.
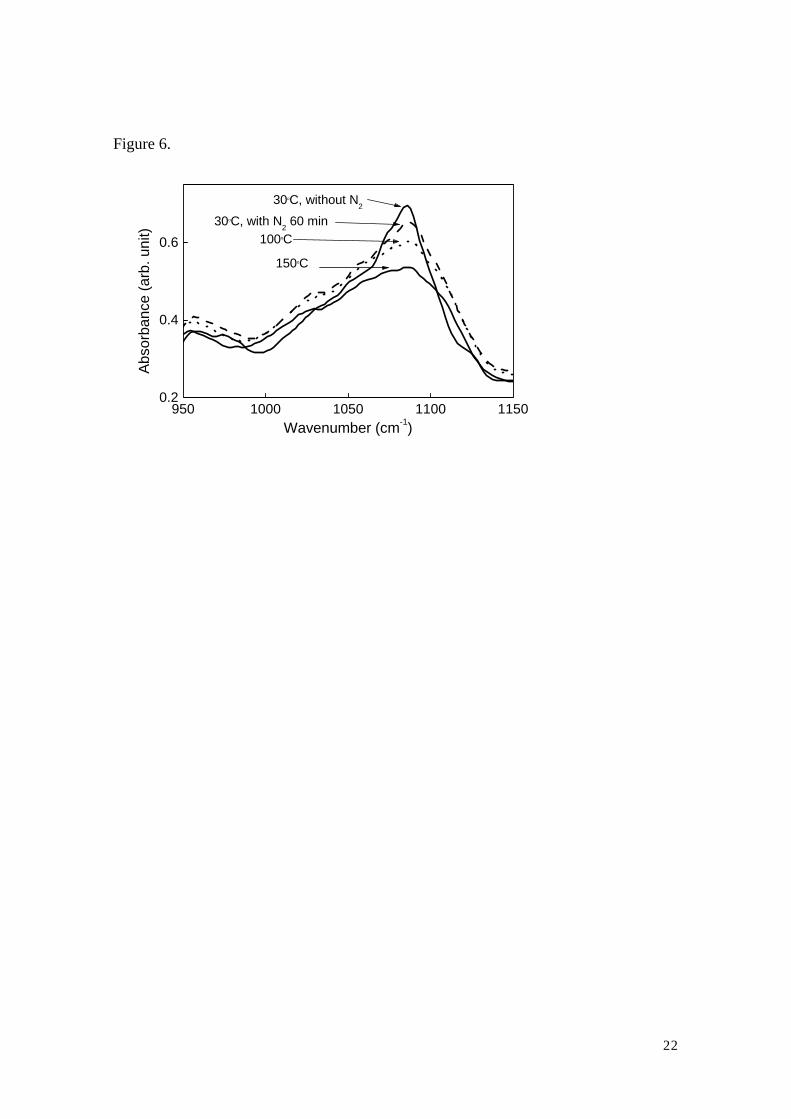
Our samples experience further disorder at high temperature (state II-III), which
is indicated by the barely observable marker bands and the lowering intensity of the
in-plane double band stretching of the bases. In addition, as shown in Fig. 6., the
symmetric PO2- stretching mode is reduced and broadened with increasing temperature.
This mode has been reported to be sensitive to the denaturation9). These facts indicate
that, in addition to the slight disorder in base stacking and pairing, the denaturation also
takes place at high temperatures above 100 oC.
In Fig. 7 we plot the intensity of the mode at 1086 cm-1 normalized at 1240 cm-1
as a function of temperature at different relative humidity together with the previously
published data by Lee et al. The temperature dependence of the intensity of this band is
very similar to the data of Lee et al. for the sample with 1 wpn. The change of the
12
intensity in this sample is small compared to the change of the intensity in the sample
with 12 wpn,. Lee et al. have argued that this small change indicates that the samples
are already in the denaturated state at room temperature because of the low water
content. In contrast, as previously explained, our samples do not show any indication of
denaturated state at room temperature.
Semenov et al. have identified that the intensity of the band at 1086 cm-1 is also
strongly dependent on the water content22). Our data plotted in Fig. 7 is similar to their
results. The intensity of this band decreases due to the flow of nitrogen at room
temperature. The sharp change in the intensity of the same band in the sample with 12
wpn observed by Lee et al. could be attributed to the decrease of water content. They
have mentioned that the samples are sealed during the whole measurement, but there
may be no guarantee that water is not evaporated from the sample, particularly during
the heating process.
In Fig. 5(e) the spectrum measured at 30 oC after the samples are heated to 150 oC
reveals that the samples recover its A-form structure. This is indicated by the complete
features for A-form, such as the marker bands, and the characteristic bands for the
backbone and base pairs. It should be noted that this spectrum is measured at the state
IV of Fig. 4, where the water content of the samples is ~0.1 wpn. It means that the
denaturation at high temperature is mainly caused by the thermal energy, not by the
lowering of the water content. On the other hand, a slight disorder observed at 30 oC
after the samples are heated is attributed to the low water content.
The structural stability at very low water content observed in the present work is
in contrast to the stating that a lack of water will result in a structural disruption of DNA.
Our finding is similar to the previous observation on poly(dA)-poly(dT) DNA which

13
remain structurally stable at humidity of ~0%23).
The counterion concentration is considered as the important factor for the structural
stability of DNA. Water molecules and counterions have the same site where they have
the highest affinity, i.e., the phosphate backbone. The water and counterion play the
same role against the phosphate group; they screen the Coulomb repulsion between the
negatively charged phosphate oxygens. At high hydration, this screening is mainly
performed by water molecules. When the hydration is lowered, which corresponds to
the lowering of water content, the counterions play the role of water molecules. In this
case a high concentration of counterion, like the case of our samples, is required.
The structural stability of DNA at low hydration is very important for further
exploration of electrical conductivity in DNA, a topic of controversy. Several theoretical
calculations have predicted that water and counterions surrounding DNA influence not
only its conformation, but also its electronic structure24). A particular configuration of
DNA environment might induce a large shift in the location of Fermi level, which is
relevant for the DC transport properties. Kino et al. have proposed that carriers can be
doped to DNA by controlling the counterions25). Moreover, the doping states depend on
whether counterions are hydrated or unhydrous. Particularly, a small amount of
unhydrous Mg cations among the hydrated ones might act as impurities in
poly(dG)-poly(dC) DNA. It is noteworthy that this doping state seems to be
independent of the condition whether the DNA is in A- or B-form. The realization
above mentioned theoretical proposal experimentally requires DNA with stable
structure at any degree of hydration. In this context, our findings that the
poly(dG)-poly(dC) DNA has a stable structure at very low hydration might be an
important key toward it.
14
4. Conclusions
We have studied the properties of hydrated water and the effects of hydration on
the structural properties in poly (dG)-poly (dC) DNA using the infrared spectroscopy.
The water content of our samples at 30 oC and humidity of ~60 % is estimated to be 3-6
wpn. As humidity is lowered to 0 %, the water content decreases to 1 wpn. The water
content reduces further to 0.1 wpn as temperature increases up to 120 oC, and that value
remains at higher temperature. This state is maintained when the temperature is lowered
to 30 oC while keeping the humidity at 0 %. Our samples maintain the A-form structure
at all values of water content. The disorder in the base pairing is observed as the water
content decreases. The high concentration of couterions is suggested as the origin of the
stable structure despite its low water content. At high temperature, the disorder is
accompanied by the denaturation, where the changes in the backbone occur. The
denaturation is reversible against the temperature.
5. Acknowledgement
This work was supported by a Grant-in Aid for Scientific Research from the Ministry of
Education, Culture, Sports, Science and Technology (No. 16038205) and Grant for
Research Program, from Center for Interdisciplinary Research, Tohoku University. The
authors are grateful to Prof. M. Satake of the Institute of Development, Aging, and
Cancer, Tohoku University for fruitful discussions.
15
References 1) W. Saenger: Principles of Nucleic Acid Structure (Springer-Verlag, New York
1984). 2) A. Ghosh, M. Bansal, Acta Cryst.: D59 (2003) 620. 3) W. Fuller, T. Forsyth, A. Mahendrasingam: Phil. Trans. R. Soc. Lond. B 359
(2004) 1237. 4) C.S. Delmonte, L.R.B. Mann: Current Science 85 (2003) 1564. 5) H.B. Stuhrmann: Rep. Prog. Phys. 67 (2004) 1073. 6) N. Niimura: Gendai Kagaku 396 (2003) 23 (in Japanese). 7) V.V. Andruschenko,. S.V. Kornilova, L.E. Kapinos, E.V. Hackl, V.L. Galkin,
D.N. Grigoriev, Y.P. Blagoi: J. Mol. Struct. 408/409 (1997) 225. 8) J.A. Taboury, J. Liquier, E. Taillandier: Can. J. Chem., 63 (1985) 1904. 9) S.L. Lee, P.G. Debenedeetti, J.R. Errington, B.A. Pethica, D.J. Moore: J. Phys.
Chem. B 108 (2004) 3098. 10) J. Liquier, E. Taillandier, in H.H. Mantsch, D. Chapman (ed.): Infrared
spectroscopy of biomolecules, (Wiley-Liss Inc., New York 1996) chap. 6, p. 131.
11) M. Falk, K.A. Hartman, R.C. Lord: J. Am. Chem. Soc. 85 (1963) 387. 12) P.B. Keller, K.A. Hartman: Spectrochim. Acta 42 A (1986) 299. 13) S.V. Kornilova, P. Miskovsky, A. Tomkova, L.E. Kapinos, E.V. Hackl, V.V.
Andruschenko, D.N. Grigoriev, Y.P. Blagoi: J. Mol. Struct. 408/409 (1997) 219. 14) T. Weidlich, S.M. Lindsay, A. Ruprecht: Phys. Rev. Lett., 61 (1988) 1674. 15) N. Lavalle, S.A. Lee, A. Ruprecht: Biopolymers 30 (1990) 877. 16) P.B. Keller, K.A. Hartman: Nucleic Acids Res. 14 (1986) 8167. 17) B. Wolf, S. Hanlon: Biochemistry 14 (1975) 1661. 18) G. Albiser, A. Lamiri, S. Premilat: Int. J. Biol. Macr. 28 (2001) 199. 19) B. Stuart: Biological Application of Infrared Spectroscopy, (John Wiley and
Sons, New York, 1997). 20) E.R. Blout: M. Fields, J. Am. Chem. Soc. 72 (1950) 479. 21) M. Falk, A.G. Poole, C.G. Goymour: J. Can. Chem. Soc. 48 (1970) 1536 22) M. Semenov, T. Bolbukh, V. Maleev: J. Mol. Struct. 408/409 (1997) 213. 23) B. Sclavi, W.L. Peticolas, J.W. Powell: Biopolymers, 34 (1994) 1105. 24) R.G. Endres, D.L. Cox, R.R.P. Singh: Rev. Mod. Phys., 76 (2004) 195. 25) H. Kino, M. Tateno, M. Boero, J.A. Torres, T. Ohno, K. Terakura, H.
Fukuyama: J. Phys. Soc. Jpn. 73 (2004) 2089.

16
Figure captions. Figure 1. Absorption spectra in the region of 2000-4000 cm-1 at various humidity and temperatures. Figure 2. Absorption spectrum of guanine (a) and cytosine (b) in the region of 2000-4000 cm-1 at 30 oC. Figure 3. Absorption spectra in the region of 2000-4000 cm-1 at various humidity and temperatures after being subtracted by the spectrum at 150 oC. Figure 4. Intensity of the absorption band due to the OH stretching mode as the function of exposure time to nitrogen gas and temperature. The states I and II are measured at 30 oC without and with the flow of nitrogen gas, respectively, the III is measured at 150 oC, and the state IV is measured at at 30 oC after the temperature is lowered from 150 oC. Figure 5. Infrared absorption spectra in the region of 750-1800 cm-1 at 30 oC before (a) and after (b) the flow of nitrogen, we measure the high temperature spectra at 100 oC(c), 150 oC (d), and after the temperature is lowered back to 30 oC (e). Figure 6. The symmetric PO2
- stretching mode at various humidity and temperatures. Figure 7. Hydration and temperature dependence of the intensity of the symmetric PO2
- stretching mode.

17
Figure 1.
2000 2500 3000 3500 40000.2
0.4
0.6
0.8
150oC
100oC
30oC, with N2
30oC, without N2
Abso
rban
ce (a
rb. u
nit)
Wavenumber (cm-1)
18
Figure 2.
2000 2500 3000 3500 4000
Abs
orba
nce
(arb
. uni
t)
Wavenumber (cm-1)
(a)
NH stretchingNH2 stretching
Guanine
2000 2500 3000 3500 4000
Wavenumber (cm-1)
(b) NH stretching NH2 stretching
Abs
orba
nce
(arb
. uni
t)
Cytosine

19
Figure 3.
2000 2500 3000 3500 4000-1.0
-0.5
0.0
0.5
1.0
1.5
100oC
30oC, with N2 60 min.
30oC, without N2
Abso
rban
ce (a
rb. u
nit)
Wavenumber (cm-1)
20
Figure 4.
0 40 80 120 160
0.0
0.1
0.2
0.3
IV III
II
I
A 3400
(T) -
A34
00 (1
50o C
) (ar
b. u
nit)
Temperature (oC)

21
Figure 5.
800 1000 1200 1400 1600 1800
1710
1710
1710
1710
1247
1247
1247
1182
1182
1182
1182
1086
1086
1086
1086
899
899
899
806
806
806
806
1710
1240
1247
1182
1086
899
899
806
(e)
(d)
(c)
(b)
(a)
Abso
rban
ce (a
rb. u
nit)
Wavenumber (cm-1)
22
Figure 6.
950 1000 1050 1100 11500.2
0.4
0.6150oC
100oC30oC, with N2 60 min
30oC, without N2
Abso
rban
ce (a
rb. u
nit)
Wavenumber (cm-1)

23
Figure 7.
40 80 120 160
1.2
1.6
2.0
2.4
N2, 60 minN2, 10 minwithout N2
this work 1 wpn, Lee et al. 12 wpn, Lee et al.
A 1086
/A12
40
Temperature (oC)
Copyright © 2022 FDOKUMEN