PROJECT REPORT Author: Manuel Villavicencio Director
104
PROJECT REPORT Author: Manuel Villavicencio Director: Dr. Enrique Velo García Session: June 2012 Màster Interuniversitari UBUPC d’Enginyeria en Energia Technical Support on the Elaboration of the Rural Electrification Master Plan of Jigawa State (Northern Nigeria)
-
Upload
khangminh22 -
Category
Documents
-
view
2 -
download
0
Transcript of PROJECT REPORT Author: Manuel Villavicencio Director

PROJECT REPORT Author: Manuel Villavicencio Director: Dr. Enrique Velo García Session: June 2012
Màster Interuniversitari UB-‐UPC
d’Enginyeria en Energia
Technical Support on the Elaboration of the Rural Electrification Master Plan of Jigawa State
(Northern Nigeria)

Màster Interuniversitari UB-‐UPC d’Enginyeria en Energia
Sol·licitud d’acceptació de presentació del Projecte Final de Màster i
sol·licitud de defensa pública. Alumne: Manuel Villavicencio DNI: Y-‐0717761-‐Z Títol: Director: Prof. Enric Velo Acceptació de la presentació del projecte: Confirmo l’acceptació de la presentació del Projecte Final de Màster. Per a que consti, Cognoms, nom (director del Projecte) Sol·licito: La defensa pública del meu Projecte Final de Màster. Per a que consti, Manuel Daniel Villavicencio Rojas
Barcelona, ........ de .............. de .......

Màster Interuniversitari UB-‐UPC d’Enginyeria en Energia
Acta d’Avaluació de Projecte
Curs: Codi UPC: 33563
Data defensa: Qualificació: Alumne: Manuel Villavicencio DNI: Y-‐0717761-‐Z Títol: Technical support for the elaboration of the Jigawa State`s electrification
master plan Director: Prof. Enric Velo Director: Ponent: Tribunal President: Vocals: Suplents: Observacions Signatura
Convocatòria Ordinària, Cognoms, nom (President) Cognoms, nom (Vocal) Cognoms, nom (Vocal)
Convocatòria Extraordinària, Cognoms, nom (President) Cognoms, nom (Vocal) Cognoms, nom (Vocal)

SUPPORT FOR THE ELABORATION OF THE MASTER PLAN FOR THE JIGAWA STATE ELECTRIFICATION
ENGR. MANUEL VILLAVICENCIO
ABSTRACT
Jigawa State, with a rural population of 85% and 20% of electricity access among other basic services deficiencies, is one of the poorest states of Nigeria
The electrification targets of the state were assessed from a decentralized approach. Solar potential, biomass residues and Jatropha Curcas harvest are the main local resources to be considered for power generation.
It was found that a fuel diversified strategy, considering local available resources, represent a more feasible and ecological alternative than the current strategy based on increasing on-‐grid diesel capacity, and also improve security against fuel price volatility and eventual supply contingencies.

SUPPORT FOR THE ELABORATION OF THE MASTER PLAN FOR THE JIGAWA STATE ELECTRIFICATION
ENGR. MANUEL VILLAVICENCIO
ACKNOWLEDGMENTS
Special thanks to my family and friends who have been extremely supportive, remarkably enthusiast and uniquely kind to me during my stay in Barcelona. I would like to thank my live girlfriend for her moral support and her understanding regarding to me while spending long working hours in front of the computer.
I would like to thank the work team conformed by my professor Enric Velo, my co-‐
director Engr. David Vilar and my team partner and high level assessor PhD. Alejandro Blanco Romero, for their wise supervision and advices on the realization of this project.
Finally, I am in debt to all the people that directly or indirectly have helped me in the elaboration of this project.

SUPPORT FOR THE ELABORATION OF THE MASTER PLAN FOR THE JIGAWA STATE ELECTRIFICATION
ENGR. MANUEL VILLAVICENCIO
TABLE OF CONTENTS
LIST OF FIGURES 8
LIST OF TABLES 9
ACRONYMS 11
INTRODUCTION 12
OBJECTIVES 14 GENERAL OBJECTIVE 14 SPECIFIC OBJECTIVES 14
CHAPTER 1. NIGERIA AND JIGAWA STATE OVERVIEW 15 1.1. BRIEF NIGERIA PROFILE 15 1.1.1. POLITICS 15 1.1.2. ECONOMY 17 1.1.3. ENERGY & ELECTRICITY BRIEF 19 1.1.4. SOCIAL ISSUES 22 1.2. JIGAWA STATE PROFILE 24 1.2.1. TOPOGRAPHY AND CLIMATE 24 1.2.2. POPULATION 26 1.2.3. SOCIOECONOMIC VALUATION 26 1.2.4. SOCIOPOLITICAL DESCRIPTION 29 1.2.5. ECONOMICAL PANORAMA 30 1.2.6. POLICIES AND DEVELOPMENT PLANS 32
CHAPTER 2. CURRENT STATUS OF THE ENERGY SECTOR: JIGAWA STATE IN PERSPECTIVE 33 2.1. ENERGY STATUS 33 2.1.1. OIL & LIQUIDS FUELS 33 2.1.2. GAS 34 2.1.3. OTHERS ENERGIES 34 2.1.4. ELECTRICITY 35 2.2. ENERGY PROJECTIONS 36 2.3. ENERGY POLICIES AND FRAMEWORK 41
CHAPTER 3. RURAL ELECTRIFICATION PLANNING: METHODOLOGY PRESENTATION 43 3.1. PLANNING SCHEMES FOR RURAL ELECTRIFICATION IN DEVELOPING COUNTRIES 43 3.1.1. DEP METHODOLOGY PRESENTATION 43 3.2. METHODOLOGY IMPLEMENTATION 47 3.2.1. DATA COLLECTION CAMPAIGN 48 3.2.2. GIS IMPLEMENTATION 49
CHAPTER 4. POWER SECTOR ASSESSMENT OF JIGAWA STATE 52 4.1. ELECTRICITY DEMAND ESTIMATION 52 4.1.1. HOUSEHOLDS (HH) 54 4.1.2. PUBLIC FACILITIES (PF), BUSINESS ENTITIES (BE) AND HAMMER MILLS (HM) 55 4.1.3. AGGREGATED POWER DEMAND SCENARIOS 56 4.2. LOCAL ENERGY RESOURCES AND FACILITIES CHARACTERIZATION 58

SUPPORT FOR THE ELABORATION OF THE MASTER PLAN FOR THE JIGAWA STATE ELECTRIFICATION
ENGR. MANUEL VILLAVICENCIO 4.2.1. ELECTRICITY DISTRIBUTION GRID: STATUS AND ACCESSIBILITY 58 4.2.2. WIND POTENTIAL 59 4.2.3. SOLAR POTENTIAL 60 4.2.4. BIOMASS POTENTIAL 61 4.2.5. BIOFUELS: BIODIESEL FROM JATROPHA CURCA 64 4.3. POWER SUPPLY OPTIMIZATION ANALYSIS 65 4.3.1. SIMULATION METHODOLOGY 65 4.3.2. SIMULATION RESULTS AND DISCUSSION 69
CONCLUSIONS AND RECOMMENDATIONS 82
BIBLIOGRAPHY 85
RELEVANT VISITED WEBSITES 88
ANNEX I 89 A. SOLAR BASED ELECTRIFICATION PROJECTS. 89
ANNEX II 91 A. ENERGY AND ELECTRICITY NEEDS ESTIMATIONS 91 B. METEOROLOGICAL COMPLEMENTARY INFORMATION. 96 C. SOLAR POTENTIAL COMPLEMENTARY INFORMATION. 98 D. BIOMASS POTENTIAL COMPLEMENTARY INFORMATION. 99
ANNEX III 100 A. POWER SYSTEMS COSTS 100 B. POWER OPTIMIZATION INPUTS 101 C. AC LOAD: 10% -‐ LOAD 2012 101 D. AC LOAD: 50% -‐ LOAD 2020 102 E. GENERATOR: BLEND DIESEL/BIODIESEL 103 F. AC GENERATOR: GASIFICATION FRACTION 103 G. PV & CONVERTER SYSTEMS 104 H. SOLAR RESOURCE 104

SUPPORT FOR THE ELABORATION OF THE MASTER PLAN FOR THE JIGAWA STATE ELECTRIFICATION
ENGR. MANUEL VILLAVICENCIO
LIST OF FIGURES Figure 1. Geopolitical map of Nigeria. .................................................................................................................................................. 15 Figure 2. Ethnic groups. Secondary source: BBC News Africa. .................................................................................................. 16 Figure 3. Nigeria historic GDP at constant price (Billion of US $, 2000). Source: Tradingeconomics.com/Nigeria. ............................................................................................................................................................ 17 Figure 4. Nigeria wealth distribution. Secondary source: BBC News Africa. ....................................................................... 18 Figure 5. a) Nigeria GDP historic growth and projections. Source: Perspectives économiques en Afrique 2011. b) Evolution of the Nigeria share of incomes. Source: Central Bank of Nigeria – Annual report 2010. .................. 19 Figure 6. Indicator of energy crisis in Nigeria 1970 -‐2004. Source: (Iwayemi, 2008) ...................................................... 20 Figure 7. a) Electric power generation historic in Nigeria. b) Nigeria power system composition 2010. Source: Central Bank of Nigeria – Annual report 2010. ................................................................................................................................ 21 Figure 9. Geopolitical map of Jigawa State. Self Elaboration ..................................................................................................... 24 Figure 10. Croplands of Jigawa State. Self Elaboration ................................................................................................................ 25 Figure 12. Top 10 Business environment constraints 2007. Source: Enterprise Surveys, The World Bank. .......... 36 Figure 12. a) GDP grow effect based in the assumptions. b) Diversification effect. Source: (Sambo, Iloeje, Ojosu, Olayande, & Yusuf, 2005). .......................................................................................................................................................................... 37 Figure 13. Trends in Final Commercial Energy Demand. Source: (Sambo, Iloeje, Ojosu, Olayande, & Yusuf, 2005). .................................................................................................................................................................................................................. 38 Figure 14. Trends in Electricity Demand. Source: (Sambo, Iloeje, Ojosu, Olayande, & Yusuf, 2005). ........................ 38 Figure 15. Electricity lines of Jigawa State. Self Elaboration ..................................................................................................... 39 Figure 16. Continental view of the GIS elaborated for electrification project of Jigawa State. Self Elaboration 50 Figure 17. Local view of the GIS elaborated for electrification project of Jigawa State. ............................................... 51 Figure 18. Rural growth centers (RGC) examples of Jigawa State ........................................................................................... 53 Figure 19. RGC distribution over Jigawa State by local government area ........................................................................... 53 Figure 20. Range of load estimations by 2012. ................................................................................................................................. 57 Figure 21. Range of load estimations by 2020. ................................................................................................................................. 58 Figure 22. Influence area of the electricity grid. Self elaboration ............................................................................................ 59 Figure 23. Yearly average of daily sums of horizontal irradiation for Nigeria. Jigawa State tile (HelioClim-‐1/PVGIS data 1985-‐2004). Source: PVGIS. (http://re.jrc.ec.europa.eu/pvgis/) ................................................................ 60 Figure 24. Cultivated area of Jigawa State by crop type. Self elaboration. Source: historical data from the National Bureau of Statistics of Nigeria, 2011. ................................................................................................................................ 62 Figure 25. Daily load curve types for 2012. ........................................................................................................................................ 67 Figure 26. Daily load curve types for 2020. ........................................................................................................................................ 67 Figure 27. Sensitivity analysis: NPC -‐ Fuel cost Vs. Primary load (interest rate 7.85%, horizon 2012) ................. 71 Figure 28. Sensitivity analysis: Fuel cost Vs. Cost multiplier (interest rate 7.85%, horizon 2012) ............................ 72 Figure 31. Renewable technologies capacity share. A) PV B) BBFB ...................................................................................... 77 Figure 32. Renewable fraction as a function of fuel prices ......................................................................................................... 78 Figure 33. Diesel consumption as a function of fuel prices ......................................................................................................... 79 Figure 34. Sensitivity analysis: Influence of fuel cost and primary load to the NPC (interest rate 7.85%, horizon 2020) ................................................................................................................................................................................................................... 80 Figure 35. Sensitivity analysis: Fuel cost Vs. Cost multipliers -‐ min load (interest rate 7.85%, horizon 2020). A) PV cost multiplier B) BBFB cost multiplier ......................................................................................................................................... 81

SUPPORT FOR THE ELABORATION OF THE MASTER PLAN FOR THE JIGAWA STATE ELECTRIFICATION
ENGR. MANUEL VILLAVICENCIO
LIST OF TABLES
Table 1. Self elaboration. Source: Nigeria Statistical Data 2011, IMF DATA & Forecasts. ............................................ 18 Table 2. Human Development Index, Nigeria. Source: (UNPD, 2011) .................................................................................... 26 Table 3. North East core welfare indicator, 2006 survey. Source: (National Bureau of Statistics, 2006). ............... 28 Table 4. Summary of economy empowerment policies promoted by Jigawa State Administration Source: (Directorate of Budget and Economic Planning - SEEDS II, 2009). .......................................................................................... 32 Table 5. Energy statistics. Source: Key World Energy Statistics, IEA 2010. ......................................................................... 33 Table 6. Power industry in Nigeria. Source: (Adenikinju, 2008). .............................................................................................. 35 Table 7. Aggregated capacity of particular diesel generator sets. Source: Tennessee Village Infrastructure group (TVIG) 2001. ....................................................................................................................................................................................... 40 Table 8. General assumptions for demand estimations. Self elaboration. ............................................................................ 54 Table 9. Summary comparison of different demand estimations. ............................................................................................ 55 Table 10. Facility ratio normalized by number of HH estimated for Jigawa State (blue: estimations from statistics, black: JICA values, orange: assumed). .............................................................................................................................. 55 Table 11. Monthly Averaged Wind Speed At 10 m Above The Surface Of The Earth For Terrain Similar To Airports (m/s). Source: NASA database. .............................................................................................................................................. 59 Table 12 Monthly Averaged Insolation Incident On A Horizontal Surface (kWh/m2/day). Source: NASA database. ............................................................................................................................................................................................................ 61 Table 13. Yield crop obtained increases. Source: (Ajeigbe, 2009) ............................................................................................ 63 Table 14. Crop and residues production. ............................................................................................................................................. 63 Table 15. Manure to energy potential. ................................................................................................................................................ 63 Table 16. Assessment of the potential of the Jarda Kangiwa Jatropha Curca program. ................................................ 65 Table 17. Blend cost calculations ............................................................................................................................................................ 66 Table 18. Sensitivity variables for the system optimization on the 2012 horizon ............................................................ 68 Table 19. Sensitivity variables for the system optimization on the 2020 horizon ........................................................... 69 Table 20. Sensitivity multipliers for the system optimization on the 2020 horizon. ........................................................ 69 Table 21. Optimization results for Horizon 2012 (fixed interest rate of 7.8%) .................................................................. 69 Table 22. Winner system results: 3.2MW for Horizon 2012 (interest rate 7.8%). ............................................................ 70 Table 23. Technical information ............................................................................................................................................................. 70 Table 24. Generated pollution .................................................................................................................................................................. 71 Table 25. Optimization categorized results for Horizon 2020 – economical outputs (fixed interest rate of 7.85%, Biomass max availability 150 t/d, fuel price 0.77 $/L) ................................................................................................. 73 Table 26. System architecture of the winner system (ID 11) for the minimum load case by 2020. ......................... 74 Table 27. System architecture of the winner system (ID 15) for the maximum load case by 2020. ........................ 74 Table 28. Optimization categorized results for Horizon 2020 – technical outputs (fixed interest rate of 7.85%) ................................................................................................................................................................................................................................ 75 Table 29. Power generation mix. ............................................................................................................................................................ 75 Table 30. Pollutant emissions ................................................................................................................................................................... 76 Table 31. Solar based electrification projects in Jigawa State. .................................................................................................. 90 Table 32. Solar based electrification project devices. Source: Alternative energy fund 2011. .................................... 90 Table 33. Surveyed effects and goods for HHs 2008 & 2003. ...................................................................................................... 91 Table 34. HH electric energy demand estimations. (blue: estimations from statistics, black: JICA values, orange: assumed). ........................................................................................................................................................................................................... 91 Table 35. Aggregate electricity demand assuming different criteria. .................................................................................... 92

SUPPORT FOR THE ELABORATION OF THE MASTER PLAN FOR THE JIGAWA STATE ELECTRIFICATION
ENGR. MANUEL VILLAVICENCIO Table 36. Facilities obtained from statistical reports of Jigawa State. .................................................................................. 93 Table 39. Meteroological information. Source: Birmin Kudu and Gumel metrological stations. .............................. 97 Table 40. Clear Sky factor. Source: NASA. ........................................................................................................................................... 98 Table 41. Surface Albedo. Source: NASA. ............................................................................................................................................. 98 Table 42. Area Sown of Jigawa State. Source: National Bureau of Statistics 2011. ......................................................... 99 Table 43. Crop characteristics and properties. ................................................................................................................................. 99 Table 44. Dung yield of different species. Source: (1) Memento de l’agronome : quatrième edition; (2) GTZ, 1989. Biogas plants in animal husbandry. .......................................................................................................................................... 99 Table 45. Power plants capital and operating costs. Source: EIA, 2010. .......................................................................... 100 Table 46. Primary power load for the HOMER optimization. ................................................................................................ 101

SUPPORT FOR THE ELABORATION OF THE MASTER PLAN FOR THE JIGAWA STATE ELECTRIFICATION
ENGR. MANUEL VILLAVICENCIO
ACRONYMS
BBFB: biomass based fluidized bed
BE: business entities
CAF: Consumer Assistance Fund
CEP: centralized energy planning
COE: cost of electricity
DEP: decentralized energy planning
DSS: decision support systems
ECN : Electric Corporation of Nigeria
ECOWAS: Economic Community of West Africa
EIA: Energy information administration
EPSR : Electric Power Sector Reform
EXCO: State Executive Council
GDP: Gross domestic product
HDI: Human Development Index
HH: household
HM: hammer mill
IAEA: International Atomic Energy Association
IEA: International Energy Agency
IITA: International Institute of Tropical Agriculture
JARDA: the Jigawa State Agriculture and Rural Development Authority
JSC: Judicial Service Commission LCOE: Levelized cost of electricity
LDC: Local Distribution Companies
LEEDS: Local Economic Empowerment and Development Strategies
LGA: local government area
LHV: Low heating value
NEEDS: National Economic Empowerment and Development Strategy
NEPA: National Electric Power Authority
NEP: National Energy Policy.
NERC: Nigerian Electricity Regulatory Commission
NGN: Nigerian Naira
NNPC: Nigerian National Petroleum Corporation
NPC1: national population commission NPC2: Net present cost
NV20: 2020: Nigeria Vision 20 in 2020
OPEC: Organization of the Petroleum Exporting Countries
PACP: Presidential Action Committee on Power
PF: Public facilities
PHCN: Power Holding of Nigeria
PPP: Power purchasing parity
PTFP: Presidential task force on power
REA: Rural Electricity Agency
REF: Rural Electrification Fund
REMP: renewable energy master plan
RPR: Residue-‐to-‐Product-‐Ratios
SEEDS: State Economic Empowerment and Development Strategies
TCE: tones of coal equivalent
UNDP : United Nations Development Program
UNDP: United Nation Development Program
WADE: World Alliance for Decentralized Power

SUPPORT FOR THE ELABORATION OF THE MASTER PLAN FOR THE JIGAWA STATE ELECTRIFICATION
ENGR. MANUEL VILLAVICENCIO
INTRODUCTION
The infrastructures and services sectors, and more specifically the power sector of Nigeria, has gone through a precarious situation during the last years, affecting not only its economic development but the living standard of the population in terms of basic service deficiencies. The Electric Power Sector Reform Act (2005), the Renewable Energy Master Plan (REMP 2005), followed by the constitution of the Power Holding Companies of Nigeria (PHCN) and the further liberalization of electricity markets with the introduction of the Nigerian Electricity Regulatory Commission (NERC) represent the undertaken initiatives to overcome the critical situation of the power sector.
Jigawa State, one of the poorest states of Nigeria, presents extremely insufficient
access to basic services to its 85% rural population. In particular, according to the last survey on 2008, the electricity access was estimated on 20% and additionally, the small electrified portion of the population, have a frequently insufficient power supply. Therefore, the power sector reform is conceived as an opportunity also for the state to improve its energy services. The development target of Jigawa State has identified the necessity of enhancing electrification as a relevant subject to eradicate poverty by empowering economic growth. It is also conceived that achieving the millennium development goals also goes throw improving basic services in which energy and electricity access plays a central role.
In 2009, the regional government of Jigawa State, in its “Jigawa State Economic
Empowerment and Development Strategies” (J-‐SEEDS), has announced electrification targets to be accomplished by two time horizons: 30% of electricity access with 10% of local power generation by 2012 and 50% of electricity access with 50% of local power generation by 2020. The Rural Electricity Board of Jigawa State, aligned with the targets, has identified three main areas for the promotion of the rural electrification of the state:
a. Local power generation capacity projects. Introduction of Independent Power Producers (IPP) projects and development of off-‐grid generation systems. b. Grid extension and power transmission improvements.
c. New sources for power supply. Introduction of biodiesel from Jatropha Curca plantations. On this framework, this study is presented as a cooperation project, sharing
capabilities and responsibilities to offer technical support on the elaboration of the rural electrification master plan for Jigawa State. The cooperating organizations participating in the project are: the Jigawa State Rural Electricity Board, public authority of the state; the Center for Renewable Energy and Energy Efficiency (ECREEE), department of the Economic Community of West African States (ECOWAS); and the Cooperation and Human Development Research Group (GRECDH), research unit of the Polytechnic University of Catalonia (UPC -‐ Barcelonatech).

SUPPORT FOR THE ELABORATION OF THE MASTER PLAN FOR THE JIGAWA STATE ELECTRIFICATION
ENGR. MANUEL VILLAVICENCIO
This study has been conceived in two parts, the first part (Chapters 1 and 2 ) pretends to set the foundations of the project by compiling the background information required to comprehend the relevant economical and socio-‐political issues of Jigawa State and its place within the country, as well as a brief energy and power sector history and prospective, its current regulatory framework and its development plans related to electrification.
The second part of the study (Chapters 3, 4 and 5) presents a brief review of the
methodology for decentralized energy planning (DEP), followed by its particular application in Jigawa State with the development of a GIS library to assess the current status of electrification and enhance further grid expansion and off-‐grid projects; an evaluation of the power generation strategy is presented in Chapter 5, considering a local resources model with a demand driven strategy to evaluate the implications of the already started power expansion initiative, based in the addition of new diesel generation units, against the further inclusion of alternative power generation technologies (diversified scenario) to accomplish the electrification goals of Jigawa State.

SUPPORT FOR THE ELABORATION OF THE MASTER PLAN FOR THE JIGAWA STATE ELECTRIFICATION
ENGR. MANUEL VILLAVICENCIO
OBJECTIVES
General objective
Cooperate with technical support with the Rural Electricity Board of Jigawa State in the Rural Electricity Master Plan (REMP) elaboration for the state.
Specific objectives
∗ Comprehend the background factors and the framework of the project from the federal level until the local level.
∗ Adopt a holistic approach for the study, taking into account social, economical and technical aspects into the appraisal.
∗ Locate the Jigawa State current development situation in perspective, contrasting the main country indicators with that of Jigawa State.
∗ Evaluate the regional electrification objectives coherence with the general development plans.
∗ Align electricity objectives with other development plans for the state focused in a sustainability approach.
∗ Assess the current situation of rural electricity needs within the state.
∗ Characterize the available energy resources for electricity supply within the state.
∗ Develop a geographical information system library (GIS) for the use in the project. Georeferenciation of the relevant information related to the development plans to enhance planning integration between actors.
∗ Built an tailored energy model for Jigawa State to optimize the feasibility of different power supply alternatives.
∗ Indicate further research and works in order to achieve a satisfactory and well adapted road map for the rural electrification of the state.

SUPPORT FOR THE ELABORATION OF THE MASTER PLAN FOR THE JIGAWA STATE ELECTRIFICATION
ENGR. MANUEL VILLAVICENCIO
Chapter 1. Nigeria and Jigawa State Overview
1.1. Brief Nigeria Profile Nigeria is the largest country in Africa with a population of 167 million of
inhabitants accounting for 47 percent of West Africa’s population. The country takes its name from its chief river, the Niger. Nigeria is a federal republic formed by thirty-‐six states. Until 1991, the capital was the largest city, Lagos, on the southwestern coast; at the present, the city of Abuja, is the current capital of the country (National Population Commission (NPC) of Nigeria, 2009).
With a total area of 923,768 km2 most of Nigeria consists of a low plateau cut by
rivers, especially the Niger and the Benue. It is located between latitudes 4° and 14°N, and longitudes 2° and 15°E. The country shares borders to the west with Benin, to the north with Niger, to the north-‐east with Chad (87 km), to the south east with Cameroon and to the south the country has a coast along the Atlantic Ocean on the Gulf of Guinea.
Figure 1. Geopolitical map of Nigeria.
1.1.1. Politics
After the independence from Great Britain in 1960, Nigeria has experienced many political phases, starting with the first coalition government of conservatives parties in 1961, Nigeria established itself a Federal Republic in 1963. Ethnocentrism, tribalism,

SUPPORT FOR THE ELABORATION OF THE MASTER PLAN FOR THE JIGAWA STATE ELECTRIFICATION
ENGR. MANUEL VILLAVICENCIO religious persecution, and prebendalism have played a visible role in Nigerian politics both prior and subsequent to independence. The country has experienced many disequilibrium and political adversities, frequently laying in military coups. The Nigerian-‐Biafran civil war and a military era of 33 years of dictatorships governments, until the return to democracy in 1999 with the establishment of free elections and the adoption of a new constitution that assures alternation and separation of powers were evidences of last decades socio political instability in the country.
The federal government is formed by an executive, a legislative and a judiciary
power, each acting independently as a check and balance on the powers of the other two arms.
The 1999 elections to presidency brought the first democratically elected president,
however they were controversial as well as the following ones in 2003 and 2007, which were condemned as unfree and unfair by the public opinion. In December of 2010, Dr Goodluck Ebele Jonathan substituted Mr Yar`Adua in the power of presidency and in the later elections, in April 2011, he was reelected president of Nigeria.
The power of presidency is controlled by a Senate and a House of Representatives, which are combined in a bicameral body called the National Assembly. Its main function is to represent the interest of all the former States and is the highest law-‐making body for the federation.
Historically, the political context has been related to ethnic groups disputes. The
three largest ethnic groups (Hausa, Igbo and Yoruba) have maintained historical preeminence in this field.
Figure 2. Ethnic groups. Secondary source: BBC News Africa.

SUPPORT FOR THE ELABORATION OF THE MASTER PLAN FOR THE JIGAWA STATE ELECTRIFICATION
ENGR. MANUEL VILLAVICENCIO
In each of the 36 States of the federation the maximum authority is the Chief Executive, represented by the Governor of the State, who is elected like the president, to a four-‐year term of office in the first instance. The Governor is assisted in the discharge of his duties and responsibilities by a Deputy Governor. The Governor is empowered to appoint Commissioners and Advisers and to assign responsibilities to them. The Governor, Deputy Governor and Commissioners constitute the State Executive Council. They cannot be members of the State House of Assembly. The State House of Assembly is the unicameral legislature for the State. It comprises representatives from all the local government areas within the State, it exercises identical functions at the State level of those of the National Assembly at the Federal level.
The local government is the third tier of the administrative structure in Nigeria and
it is the pivot of socio-‐economic planning and development in its area of authority. There are 774 local government areas (LGAs) in the country. Each of them is administered by a Local Government Council. The Council comprises & Chairman who is the Chief Executive of the LGA, and other elected members who are referred as Councilors. The Chairman is normally elected, but can, under special circumstances, also be appointed (Presidency of Nigeria 2011).
1.1.2. Economy
During the previous decades the economy of Nigeria has been characterized by corruption and mismanagement, but since the restoration of democracy, an important compendium of reformation laws specially targeted to the economic development, have changed the panorama for the country, now considered to have a high growth potential for the coming years.
Figure 3. Nigeria historic GDP at constant price (Billion of US $, 2000). Source: Tradingeconomics.com/Nigeria.
The economy of Nigeria is considered as a mixed economy emerging market, it is the
first economy of West Africa and the second largest economy in the continent. The official currency of the country is the Nigerian Naira (NGN) and although it was stated that the Naira would be fully convertible against foreign currencies by 2009, the amount of foreign currency is still regulated through weekly auctions while the Central Bank, in charge of

SUPPORT FOR THE ELABORATION OF THE MASTER PLAN FOR THE JIGAWA STATE ELECTRIFICATION
ENGR. MANUEL VILLAVICENCIO monetary policy, sets the exchange rate. The Naira has been depreciating against the US Dollar during 2011. National bond yields of Nigeria at the beginning of 2010 were 7.71% and 8.16% for 10-‐year and 20-‐year bonds respectively (Maristem investment guide, 2010). Some up to date economical indicators are presented in the following table:
!"#" !"#$Currency Exchange rate (NGN/US $) !"! #Inflation rate !$%"$& '%"$&GDP at constant prices (Billion US$) (!%)"* +'%,)(Growth rate of GDP (%-& )&GDP Deflator *+*%(" ---%**Implied PPP conversion rate (NGN/INTLl $) ')%$' !!+%"-Gini Index (last report in 2004) $%-, #Free risk rate of interest !*& #Unemployment rate (last report in 2010) *!& #
Table 1. Self elaboration. Source: Nigeria Statistical Data 2011, IMF DATA & Forecasts. *PPP: Power purchasing Parity
Nigeria joined the OPEC in 1971 and is currently the 12th largest producer of
petroleum in the world and the 8th largest exporter, and has the 10th largest proven reserves. The national oil industry represents the 40% of the country GDP and the 80% of the government budget. Nevertheless the country has experienced difficulties in the equal repartition of benefits from the oil incomes, which represents the principal socio-‐economical issue in the country especially in the Delta of the Niger area, where the oilfields are located. The country also has important reserves of other strategic natural resources such as natural gas, coal, bauxite, gold, tin, iron ore, limestone, niobium, lead and zinc.
Figure 4. Nigeria wealth distribution. Secondary source: BBC News Africa.

SUPPORT FOR THE ELABORATION OF THE MASTER PLAN FOR THE JIGAWA STATE ELECTRIFICATION
ENGR. MANUEL VILLAVICENCIO
Other key sector of the economy is the telecommunication industry, which is considered among the fastest growing markets in the world; the financial sector and the agriculture sector follows in importance at macroeconomic level.
Figure 5. a) Nigeria GDP historic growth and projections. Source: Perspectives économiques en Afrique 2011. b) Evolution of the Nigeria share of incomes. Source: Central Bank of Nigeria – Annual report 2010.
Regionally, Nigeria is the predominant power in West Africa and was instrumental
in setting up the Economic Community of West Africa (ECOWAS) under which it has taken the lead in regional conflict resolution, principally in Liberia and Sierra Leone.
1.1.3. Energy & Electricity Brief
Nigeria has important energy resources, fossils fuels proven reserves starting are considerable, oil reserves are estimated to be over 35 billion barrels, 187 trillion cubic feet of gas and about 4 billion metric tons of coal and lignite. In addition, the country has huge reserves of tar sands, hydropower, biomass and solar radiation, among others resources (Adenikinju, 2008). Nevertheless, it is accepted that despite the enormous domestic reserves of both, non-‐renewable and renewable primary energy resources, the energy supply in the country is described to be inadequate, poor and of low accessibility (Iwayemi, 2008). Some publications have explored the nature of the energy situation in Nigeria, referring to it as “critical” and recognize some of the main causes of the energy status of the country. The main recognized constrains for energy development of the country during the last decade are: the absence of diversification, the inadequate gas supply linked to the gas and oil pipelines vandalisation in the Delta of the Niger region. The alarming energy infrastructural gaps in the refinery sector have caused scarcity and shortage of Kerosene and Diesel supply in the last years.
Within the electricity sector, in 1950 the nigerian government passed the Electric
Corporation of Nigeria (ECN) ordinance No. 15 to establish an institution responsible of
a)
b)

SUPPORT FOR THE ELABORATION OF THE MASTER PLAN FOR THE JIGAWA STATE ELECTRIFICATION
ENGR. MANUEL VILLAVICENCIO gathering and managing the electric sector of the country. After the civil war in 1970, ECN became the National Electric Power Authority (NEPA). The high transmission and distribution power losses, the low capacity factor in the existing power stations, the complete absence of investment in maintenance of equipment and the lack in increasing the generation capacity, have driven the instability of the power system and a very low efficiency of the grid.
Figure 6. Indicator of energy crisis in Nigeria 1970 -2004. Source: (Iwayemi, 2008)
In order to surpass this situation, the federal government, disposed to change the
monopolistic nature of the public power industry, approved the National Energy Policy (NEP) in 2003, dividing the NEPA into a generation, a transmission and a distribution independent branches willing to enhance the efficiency of the sector.
Also in 2003, derived from the NEP, the elaboration of a Renewable Energy Master
Plan (REMP) was started. By the end of 2005, with the support of the United Nations Development Program (UNDP), the draft of the master plan was launched by the Energy Commission of Nigeria. It specifies the capacity targets stipulated for midterm and long-‐term to take advantage of the renewable resources of the country for the energy supply.
Later in 2005, in recognizing that the power sector performance is critical to
address development challenges, the Electric Power Sector Reform (EPSR) was launched. It provides law support for allowing private companies to invest and operate power companies in Nigeria. Consequently, the above implies the reformation of NEPA into a fragmented company with the possible participation of private investments. The Act also provided for the creation of the institutions conceived to protect consumers and stimulate investment in the open power sector market from competing firms, and to regulate the electricity market. Thereafter, the Nigerian Electricity Regulatory Commission (NERC), the Consumer Assistance Fund (CAF), the Rural Electrification Fund (REF) and the Rural Electricity Agency (REA) were established.
NERC has the general mandate to regulate the entire electricity sector in the country
with regards to tariff setting and regulation, supervision of market rules, performance monitoring, and supervise the orderly transformation of the power sector. The NERC require licenses for generation of 1MW aggregate and above and distribution of power greater than 100kW in aggregate at a site. Currently, the reformation of the electricity sector is in process and the Power Holding of Nigeria (PHCN) is expected to substitute the NEPA in accordance with a transition process to a privatized and decentralized energy

SUPPORT FOR THE ELABORATION OF THE MASTER PLAN FOR THE JIGAWA STATE ELECTRIFICATION
ENGR. MANUEL VILLAVICENCIO market. The PHCN distribution sector is currently separated into Local Distribution Companies (LDC) among the regions.
The current structure of the energy authorities in Nigeria can be explained with the
following assertions. The ECN plays an advisory role related to energy sector as a general, including advisory to the government on issues related of policy formulation and regulation; it is also the regulatory authority for the renewable energy sector. Meanwhile, NERC is especially in charge of the electric sector regulation. In addition, the REA main function is to promote rural electrification programmes through the management of the Rural Electrification Fund and the implementation of rural electrification strategy and planning for the country.
The process of implementing reforms was revitalized in August 2010 through the so
called Roadmap 2010, which clearly outlines the Nigerian government’s strategy and actions to undertake comprehensive power sector reform to expand supply, opening the door to private investment and addressing some the chronic sector issues hampering improvement of service delivery (Country Brief: Nigeria, The World Bank 2011).
The last national report shows that the total aggregated energy consumption in
2010 stood for 19.1 tce (tons of coal equivalent), which represents an annual increase of 4.9%. This expansion is directly attributed to the increase in natural gas supply by 143.6% in this year (Central Bank of Nigeria, 2010).
The power sector reported that the total installed electricity generation capacity in
2010 increased 4.1% in 2009. By 2010, the composition of the power system remains with 1938.4 MW of hydro-‐power (22%) and 6876.6 MW of thermal power (78%) leaving a total power capacity of of 8815 MW. The total electricity produced in 2010 increased 32% about its level in 2009 up to 2982 MWh, due to an increase of 7% on the average capacity utilization of the system (Central Bank of Nigeria, 2010).
Figure 7. a) Electric power generation historic in Nigeria. b) Nigeria power system composition 2010. Source: Central Bank
of Nigeria – Annual report 2010. The power supply continues to pose a problem and challenges in Nigeria. While
generation capacity has improved, with a net balanced national demand estimation of 10,000MW, the national installed power deficit was 5,750MW (PHCN, 2008), leaving the system to a clearly status of insufficiency to meet the demand. In addition, only about 45% of the population has access to electricity, with just about 30% of their power demand
a)
b)

SUPPORT FOR THE ELABORATION OF THE MASTER PLAN FOR THE JIGAWA STATE ELECTRIFICATION
ENGR. MANUEL VILLAVICENCIO being met. The power sector is plagued by recurrent outages to the extent that some 90% of industrial customers, a significant number of residential, and others non-‐residential, customers provide their own power trough the intensive use of conventional backup power plants, incurring in huge costs to themselves and to the Nigerian economy (African Development Bank Group, 2009).
The reformation of the power sector is still ongoing. In 2009, The REA was to be
dissolved by the former administration over claims of redundancy and irrelevance to the reform in the sector. There were also allegations of corruption and excessive bureaucracy within the agency. Currently in 2012, “the privatization of the electricity sector is on” (Prof. Bart Nnaji, The Minister of Power) and Nigeria is committed to ensure the attractiveness for the private investors, and at the same time, the government has declared that it has revived the Rural Electrification Agency, in order to expand electricity networks to rural areas where private distribution companies may not find economical to go (Onwuemenyi, 2012).
1.1.4. Social issues
With around 167 million people, Nigeria is the most populous country in Africa and the 7th most populated in the world. It comprises over 250 socio-‐linguistic groups in 774 Local government areas, 44% of the population is under the age of 15, the rate of growth of the population is estimated to be around 2.3% (UN, 2005) which is considerably fast due to a high rate of fertility. The average of rural population is about 52% and it is estimated that about 55% of the population lives under the national poverty line (Federal Government of Nigeria, 2004), which is in accordance with the low health, education and access to basic services surveyed indicators.
In 2000, Nigeria joined the rest of the worldwide nations at the Millennium Summit
to endorse the United Nations Millennium Declaration. The eight inter-‐related and time bound Millennium Development Goals (MDGs) were formally internationally adopted in 2001 and are pretended to be achieved by 2015. A summary of the MDGs is listed below:
MDG 1: Eradicate extreme poverty and hunger.
MDG 2: Achieve universal primary education.
MDG 3: Promote gender equality and empower women.
MDG 4: Reduce child mortality.
MDG 5: Improve maternal health.
MDG 6: Combat HIV/AIDS, malaria and other diseases.
MDG 7: Ensure environmental sustainability.
MDG 8: Develop a global partnership for development.
Since the beginning, the MDGs were well received by the government of Nigeria but
progress was initially slow. However, progress accelerated in 2004 when the federal government integrated the MDGs into its National Economic Empowerment and Development Strategy (NEEDS). At regional level, the states also integrated them into their development programs theirs State Economic Empowerment and Development Strategies (SEEDS). Furthermore, some of the local government areas integrated the goals into their Local Economic Empowerment and Development Strategies (LEEDS) as well. Later in 2007,

SUPPORT FOR THE ELABORATION OF THE MASTER PLAN FOR THE JIGAWA STATE ELECTRIFICATION
ENGR. MANUEL VILLAVICENCIO the Yar'Adua administration stated that there would be consistency between its 7-‐Point Agenda and the MDGs. The Nigeria Vision 20:2020 (NV20:2020) adopted in late 2009, consequently integrates the MDGs and reinforces the Government's commitment toward them (Millenium Developments Goals, Nigeria, 2010). A more detailed description of social aspects and MDGs progress within the country and more specifically in Jigawa State will be presented in the following section.
All the presented above witness that the country is linguistically, culturally and ethnicity diverse, and that there exists strong social-‐economical desegregations. The word press entity BBC News presents the current social status of Nigeria with the phrase: “a nation divided in many lines”. Each state of the country has their particular characteristics related to their own geopolitical, sociological and economical legacies. In order to present an adequate study in accordance with a holistic point of view, and committed in obtaining accurate conclusions, it is mandatory that whichever conducted analysis takes into considerations the heterogeneity of the country as its main attribute. The strong diversity in the country causes the need of developing customized evaluations in order to address accurately suggestions to solving problems.
Consequently and following the previously exposed, a project addressed to alleviate
poverty or to enhance human development in a particular region, State or even to a particular community within the country, should be take into consideration multiple criteria but also should have a very well adapted perspective to the specific features at the local scale.
Figure 8. Heterogeneity indicators in Nigeria. Secondary source: BBC News Africa.

SUPPORT FOR THE ELABORATION OF THE MASTER PLAN FOR THE JIGAWA STATE ELECTRIFICATION
ENGR. MANUEL VILLAVICENCIO
1.2. Jigawa State Profile
Jigawa State was legally established on Tuesday 27th August, 1991. It was excised from Kano State and got its initial legal consolidation through the States Creation and Transitional Provisions Decree No. 37 of 1991.
Located in the north-‐western geopolitical part of the country between latitudes
11.00ºN to 13.00ºN and longitudes 8.00ºE to 10.15 ºE, Jigawa State is one of the biggest state of Nigeria with an area of 24,742 Km2. It is politically constituted by 27 local administrations and has a population of 4,361,002 inhabitants according with the National Bureau of Statistics (2008). The State shares borders with Kano and Katsina in the west, Bauchi State to the east, Yobe State to the northeast and to the north, the State shares an international border with the Republic of Niger (Directorate of Budget and Economic Planning - SEEDS II, 2009; National Population Commission (NPC) of Nigeria, 2009).
Figure 9. Geopolitical map of Jigawa State. Self Elaboration
1.2.1. Topography and Climate
Topography is characterized by undulating land, with sand dunes of various sizes
covering several kilometers in parts of the State. The southern part of Jigawa comprises the Basement Complex while the northeast is made up of sedimentary rocks of the Chad formation.
There are two main seasons during the year. Generally, from May to September (and including October in the recent years) the rain season is caused by the humid south westerly breezes from the Atlantic cost of West Africa. Annual rainfall is estimated to be between 600mm to 1,000mm with an average of about 650mm over the last few years.

SUPPORT FOR THE ELABORATION OF THE MASTER PLAN FOR THE JIGAWA STATE ELECTRIFICATION
ENGR. MANUEL VILLAVICENCIO Rainfall in the state normally lasts an average of five months. Meanwhile, the rest of the year is dominated for a dry season (“Harmatan”) brought by the dusty north easterly winds from the Sahara desert.
Monthly mean temperatures are in the range of 19 -‐ 35 ºC with a reported maximum of
42ºC registered in the wet season, and 13 -‐ 33ºC with a minimum of 10ºC, registered during the night in the dry season (Sambo, 2008). There is also a substantial daytime/night time temperature variation of near 15ºC.
A large proportion of total landmass is qualified to be arable. Ground survey data
from the Jigawa State Agriculture and Rural Development Authority (JARDA) indicated that Jigawa State has a total wetlands (“Fadama”) of 3,433.79 Km2 (around 14% of the total area of the state). Nevertheless, the north-‐eastern side of the state, particularly Birniwa, Maigatari and Babura Local Government Areas, are arid desert and are under threat of desertification. It is noted that the rainy season is relatively short, especially for subsistence agriculture methods, but there are good potentials for irrigation through the rivers and tributaries of Hadejia-‐Jama and the Komadugu-‐Yobe (Directorate of Budget and Economic Planning - SEEDS II, 2009) (additional meteorological data is presented in annex II -‐ Meteorological complementary information.).
The main rivers in Jigawa State are Hadejia, Kafin Hausa and Iggi Rivers with a number of tributaries feeding extensive marshlands in north-‐eastern part of the State. The Hadejia – Kafin Hausa River traverses the State from west to east through the Hadejia-‐Nguru wetlands and empties into the Lake Chad Basin. One of the most valuable resources of the state is its fertile and arable lands. Also, the Sudan Savannah vegetation zone offers a vast potential for livestock production. Nevertheless, over the last decade it has been noted that forest cover is rapidly being depleted, making northern part of the State highly vulnerable to desertification. It is registered by the International Disaster Database (EM-‐DAT) that the periodicity of droughts has increased in the last decade especially in this region.
Figure 10. Croplands of Jigawa State. Self Elaboration

SUPPORT FOR THE ELABORATION OF THE MASTER PLAN FOR THE JIGAWA STATE ELECTRIFICATION
ENGR. MANUEL VILLAVICENCIO
1.2.2. Population
Jigawa State ranked 8th among the most populated states in Nigeria. The 2006 census (National Population Commission (NPC) of Nigeria, 2009) shows that the State comprises about 3.11% of the country population, which is exactly 4,361,002 of which 51% are men while the remaining 49% are women. The population density in the State is estimated to be 177 people/Km2 which is higher than the average estimated for the country (139 people/Km2).
The CWIQ Report North-‐West Area (National Bureau of Statistics, 2006) indicates that 85% of the population of the state lives in the rural areas. Mean household size was found to be about 6.3 persons, which is above the national average of 4.8 persons. Almost all households are male headed. The survey also reveals a dependency ratio of 1.1, meaning that there is more than one dependent to every economically active person in the population. It is also estimated that about 42.2% of he population is below the age of 15 years, 49% are aged between 15 – 59 years, while the 8.8% are aged 60 years and above.
These indicators reveal the predominantly young population in the State due to a
high fertility rate, around 6 children per woman, and a short life expectancy, around 47.5 years for man and 48.5 for woman (National Population Commission (NPC) of Nigeria, 2009).
1.2.3. Socioeconomic valuation
The socio-‐cultural situation in Jigawa State could be described as partially homogeneous, with Hausa/Fulani found in all parts of the State (see Figure 2). Kanuri are largely found in Hadejia Emirate, and some traces of Badawa groups mainly in the north-‐eastern parts. Even though each of the three dominant tribes has continued to maintain its ethnic identity, Islam religion and a long history of intermarriages have continued to bind them together. Human Development Indicators and Poverty Situation
In the 2011 Human Development Report of the United Nations, Nigeria is ranked 156th out of 179 nations based on a score of 0.459 on the Human Development Index (HDI) with a light tendency to improve among the last decade (Millenium Developments Goals, Nigeria, 2010).
Check : (National Bureau of Statistics, 2006)
Table 2. Human Development Index, Nigeria. Source: (UNPD, 2011) a. Data refer to 2011 or the most recent year available.

SUPPORT FOR THE ELABORATION OF THE MASTER PLAN FOR THE JIGAWA STATE ELECTRIFICATION
ENGR. MANUEL VILLAVICENCIO
At the same time, the poverty situation in Jigawa is clearly below the average of the country. According to the 2007 Nigerian Poverty Assessment (National Bureau of Statistics, 2006), the incidence of poverty in Jigawa State was 90.9%, which is the highest in the country. Severity of poverty in the state reported at 24.6% is also among the highest in the country. While there is no specific estimations of per capita income, the report shows that by 2007 the gross per capita income was below the estimated National Average of N140,000/year (approx. US$1,200/year).
About 68.7% of household heads were self-‐employed, where 70% of those rely on subsistence agriculture as their main occupation. While 81.3% of the household heads have never had any form of formal education, only 4.4% were reported as having acquired a post-‐secondary education (Directorate of Budget and Economic Planning -‐ SEEDS II, 2009).
A set of the socioeconomic indicators of the population of the state was described by
the 2006 CWIQ (National Bureau of Statistics, 2006). Table 3 shows the results obtained for the North East region of the country where Jigawa State is included. The report indicates that most of the human development indicators and services quality indexes of the state are below acceptable levels. Infant, child and maternal mortality rates are high; Basic social services like health and education are quiet below the acceptable.
All the infrastructure indicators for the State were poor excepting the water accessibility ones that were reported over the average. Specifically, water supply sector shows that while overall access to water supply in the state is over 96%, access to quality safe drinking water (defined as water from pipe born, hand pump boreholes and protected wells) is lower at about 65% ,which is, however, still among the highest in the country. The survey also indicates that only about 55% of the state’s population has access to safe means of sanitation. Concerning to electricity access, about two in every five households (37.7 %) had access to electricity within the region. Proportion of access to electricity varies with demographic factors, consequently, for urban households the survey reported 83.4% of electrified house, meanwhile the proportion for rural households is only 26.7%. The Table 3 also shows that the electricity access in Jigawa State was 18.1%, which is the lowest in the region. Although, while severity and incidence of poverty is high in the state, the survey recognizes some opportunities for fast economic empowerment through appropriate policies. First, an average of 95% of all male headed households have land and a house of their own (the second highest in the country), together with the highest mean number of household size in the state (6.3) and strong assets ownership base, the potential for economic empowerment among households, particularly through intervention in agriculture, is therefore high.

SUPPORT FOR THE ELABORATION OF THE MASTER PLAN FOR THE JIGAWA STATE ELECTRIFICATION
ENGR. MANUEL VILLAVICENCIO
Table 3. North East core welfare indicator, 2006 survey. Source: (National Bureau of Statistics, 2006).

SUPPORT FOR THE ELABORATION OF THE MASTER PLAN FOR THE JIGAWA STATE ELECTRIFICATION
ENGR. MANUEL VILLAVICENCIO
1.2.4. Sociopolitical description
Government The Government of Jigawa State, in accordance with the 1999 Constitution, is made
up of three arms: the Executive, the Legislature and the Judiciary. The Executive Arm comprises of the State Executive Council (EXCO) with an Elected Governor as its Chairman and the Deputy Governor, Secretary to the State Government. The State Civil Service is made up of 15 ministries and a range of extra-‐ministerial Departments, Agencies and Parastatals organizations. The State House of Assembly, along with its thirty (30) elected members, constitutes the Legislative Arm of the government. The judiciary arm is headed by the Honourable Chief Judge who is also the Chairman of the Judicial Service Commission (JSC).
Jigawa State comprises 27 Local Government Councils, which are divided into 30
State constituencies, grouped into 11 Federal Constituencies and 3 Senatorial Districts. In line with the democratic setting in the country, Local Government Councils are elected, and comprise an Executive with an Unicameral Legislature. The three tiers of government (Federal, State and Local) are interdependent on each other for service delivery and on other matters.
Although not recognized by the 1999 Constitution as part of any arm of government,
traditional institutions play a significant social role in governance. Traditional institutions comprise Emirates (headed by an Emir), Districts (headed by District Head), Villages (headed by Village Head) and Wards (headed by Ward Head). These institutions are increasingly seen as part of the social capital of society. (Newswatch of 22nd June, 2004)
The socio-‐economic development services provided by the Local Government
Councils constitute a major sphere of partnership with the State Government. The services are carried out through the Local Government Capital Contribution captured in both the annual budgets of the Local Governments and that of the State Government.
Stipulated by law, government and traditional institutions are engaged to support
and foster the development of the State. The program of the economy empowerment of Jigawa (Directorate of Budget and Economic Planning -‐ SEEDS II, 2009) prioritizes the following areas: • Primary healthcare services including maternity centers and preventive health services. • Basic Education including nursery, primary and adult education. • Information and public enlightenments • Agriculture including livestock and extension services. • Rural and semi-‐urban water supply. • Provision of roads (other than trunk roads), street lights and drainages. • Public housing programs. • Social welfare services. • Trading and commercial activities.

SUPPORT FOR THE ELABORATION OF THE MASTER PLAN FOR THE JIGAWA STATE ELECTRIFICATION
ENGR. MANUEL VILLAVICENCIO
Relation with Development Partners The State Government cultivated and harnessed relationship with various
Development Partners. This developing global partnership is in line with the Millennium Development Goal strategy, the partnership is mostly in the execution of several development projects and programs in the sphere of governance reforms, poverty reduction, education and health systems reforms.
For Jigawa State, the primary objective in developing these partnerships is to source
technical assistance and development grants. Currently, the Jigawa State Government is in partnership with (Directorate of Budget and Economic Planning -‐ SEEDS II, 2009):
a) UK Department for International Development (DFID) b) The World Bank c) United Children Fund (UNICEF) d) World Health Organization (WHO) e) The European Union (EU) f) Water Aid d) Other Multilateral and International Development Agencies The State Government intends to take donor coordination to new levels ensuring an
effective coordination, achievement of synergies and optimal utilization of resources in the activities of the various Development Partners. A citation exposed in the J-‐SEEDS document explains more clear this will:
“It is the hope of the Government that Development Partners would buy-‐in to its development efforts and provide direct budget support and technical assistance. This will facilitate the attainment of the state’s development policy objectives particularly as they relate to the attainment of the Millennium Development Goals” (Directorate of Budget and Economic Planning - SEEDS II, 2009).
In this regard, the Jigawa State Government is committed to manage appropriate
budgetary provision for counterpart fund wherever required. The government says to be also committed in providing logistical support to Development Partners in their operations.
1.2.5. Economical panorama
As already presented, Nigeria’s finance profile is dominated by oil income which accounts for at least 80 percent of all government´s revenues. Volatility in the international oil prices and production levels directly affects government revenue. The over-‐dependence of the state on the Federal Statutory Allocation makes it susceptible to the volatility in international oil prices.
The macroeconomic framework within which the economic activities in the state
take place is largely a function of federal policies. However, within limits, the state government operates policies that influence macroeconomic performance within the state.

SUPPORT FOR THE ELABORATION OF THE MASTER PLAN FOR THE JIGAWA STATE ELECTRIFICATION
ENGR. MANUEL VILLAVICENCIO
The State has a agriculturally based economy, it is largely characterized by informal sector activities with agriculture as the major economic activity. Over 80% of the people in the state are farmers engaged in farming and animal husbandry. The financial sources of the State are agriculture as the main contributor to it followed by small and medium scale enterprises; also the Public Sector has a profound influence on the level of economic activities. Commerce and Industry are limited to small and medium scale agro enterprises, such as agricultural products, livestock, fisheries, food and beverages, and other household consumer goods. Other informal sector activities include blacksmithing, leatherworks, tailoring services, auto repairs, metal works, carpentry, tanning, dyeing, food processing, masonry, quarrying, block-‐making, among others.
In general, Jiwaga is well connected by a wide network of motor able all-‐season
roads. Even though, the State recognizes the need of promoting a deeper infrastructure development in order to enhance an investment climate for economic development. Infrastructure development plans includes roads, electricity, telecommunication and information networks.
Financial Intermediation is also relatively good in Jigawa State. In addition to the
presence of many commercial banks all over the state, there also exist several micro finance banks that mobilize rural savings and provide finance for entrepreneurs in the state.
The fiscal policy at the sub-‐national level is a very important instrument of
macroeconomic management and overall socioeconomic development. Consequently there have been attempts to undertake reforms in this respect. One of the areas of focus of the J-‐SEEDS reform is the ongoing effort to diversify the revenue base of the state in order to reduce over-‐dependence on the Federal Statutory Allocation. The intense debate and sustained pressure for ‘fiscal federalism’ is reinforcing the State Government’s determination to continue to search for ways and means of achieving fiscal self-‐reliance for the state. Ensuring fiscal-‐self reliance is therefore adopted as a major policy goal of the state.
The State Government is adopting a policy plan to facilitate and allow the private
sector to promote and drive the economic growth. Since the last five years, its main concern has been to create an enabling environment that would generate employment and raise productivity, improve the state’s technical and managerial skills through well-‐equipped skill acquisition centers and encourage public-‐private sector partnerships in economic development.
Another relevant strategy of the state government is the pursuit of balanced budget
to ensure fiscal discipline. To promote the overall purpose of socioeconomic development of the state, the government recently passed a Fiscal Responsibility Law (Directorate of Budget and Economic Planning - SEEDS II, 2009). The overarching objective of the law is to ensure that government strives towards:
• Aligning its income and expenditure by keeping its spending limits within the dictates of its available resources.

SUPPORT FOR THE ELABORATION OF THE MASTER PLAN FOR THE JIGAWA STATE ELECTRIFICATION
ENGR. MANUEL VILLAVICENCIO
• Ensuring that the budget process is pursued within a framework that supports the strategic policy objectives of the state.
• Prioritization and rationalization of natural resources allocation in accordance with the overall development plans.
• Ensuring strict adherence to ‘due-‐process’ in budget execution as well as in accountability.
• Transparency and prudence in the entire Public Financial Management (PFM) process.
This Law also provides for the establishment of a Council for Economic Planning and
Fiscal Responsibility. The Council has the responsibility of attaining the State’s Fiscal Policy Objectives through the promotion and enforcement of best practices in public expenditure and financial management as provided in the Fiscal Responsibility Law and other relevant laws and government circulars.
1.2.6. Policies and development plans The government of Jigawa State recognizes the multidimensional poverty situation in the state and proposes a multifaceted approach to improve this situation. The strategy of the program is merely focused in the economical growth of the region by improving the competences for wealth production and could be summarized with the following citation, referring its strategy: “Empowering people with a range of assets and capabilities at both individual and collective levels” (Directorate of Budget and Economic Planning -‐ SEEDS II, 2009).
The action is to offer an appropriate infrastructure in order to provide access to means of production and markets. This is expected to encourage large scale farming and provide opportunities to engage in more profitable farm and non-‐farm activities particularly small and medium scale enterprises.
Table 4. Summary of economy empowerment policies promoted by Jigawa State Administration Source: (Directorate of
Budget and Economic Planning - SEEDS II, 2009).

SUPPORT FOR THE ELABORATION OF THE MASTER PLAN FOR THE JIGAWA STATE ELECTRIFICATION
ENGR. MANUEL VILLAVICENCIO
Chapter 2. Current Status of the Energy Sector: Jigawa State in Perspective
After the energy brief given in section 2.1.3, where the current situation of energy in
the country has been presented as “critical” (Iwayemi, 2008) and after been presented the government perceptions related to energy, considering its promotion to be extremely relevant to accomplish the development objectives of the country, a more detailed approach of the energy overview in presented in this section, including an special consideration to the power sector.
2.1. Energy status
For comprehensible reasons, Nigeria has not devoted equal attention to its abundant energy resources. Its efforts have been concentrated on the development, exploitation and utilization of crude oil and gas for fiscal objectives, and the electric power to generate electricity to supply the most relevant sectors of economy (Adenikinju, 2008). In 2010, the total energy production of the country was reported to be 226.8 Mtoe, mostly primary products, meanwhile the net imports accounted for 115.5 Mtoe, leaving a total primary energy supply (TPES) of 111.16 Mtoe (see Table 5) which evidence energy consumption per capita of 0.73 toe/capita, which is one of the lowest in the world (IEA, 2010).
Despite of that, the country is well known to have important reserves of petroleum, natural gas, tar, and coal deposits, and a vast natural energy resources. It is not surprising that the country also consumes a large amount of liquefied petroleum, diesel, fuel and gas oil. However, it is also rich in renewable energy sources such as solar, hydro, biomass, and wind energy (Kevelaitis 2008).
Table 5. Energy statistics. Source: Key World Energy Statistics, IEA 2010.
2.1.1. OIL & liquids fuels
The Nigerian economy is heavily dependent on its oil sector, accounting for 80% of
government revenues and is the 2nd largest contributor to GDP following agriculture. Nigeria is the largest producer of oil in West Africa, and it is mostly exported,
approximately 2.11 million bbl/d in 2009. In 2010, Nigeria consumed about 279000 bbl/d

SUPPORT FOR THE ELABORATION OF THE MASTER PLAN FOR THE JIGAWA STATE ELECTRIFICATION
ENGR. MANUEL VILLAVICENCIO (CIA, 2010) of oil, representing nearly 52% of the energy consumption of the country. Nigeria`s current oil production is reported to be 2.2 million barrels per day and, assuming a “business as usual” scenario, is projected to have an annual growth rate of 3.2%, achieving 4.4 million barrels per day by 2030 (EIA, 2011). In terms of oil reserves, the country has 37.2 billion barrels of proven reserves, representing the 2.53% of the global, placing Nigeria 10th in the world ranking (EIA, 2011).
Although Nigeria has four refineries with a combined capacity of around 500,000 bbl/d, the country imports 85% of refined products. In 2009 the Nigerian National Petroleum Corporation (NNPC) reported that only one of these refineries remains operational, but it was running below capacity. The operation problems in these refineries are attributed to corruption, poor maintenance, theft, and fire. Many of these factors are recurring issues in the energy sector as a whole.
Oil consumption in the country is mainly used for transportation; the natural gas associated to the refining process is becoming important for the production of electricity. In March 2011, Nigeria unveiled a 25 billion US$ plan to reduce flaring by utilizing the gas in power generation. (IEA, 2011)
2.1.2. GAS
Nigeria is also the predominant natural gas producer in West Africa. With a current annual gas production of 23.21 million of cubic meters is the 25th most important gas producer in the world (CIA, 2010) and with 5.294 trillions cubic meters of proven gas reserves, which represents the 2.8% of global reserves, it is the 8th country in the world ranking (EIA, 2011).
The gas exports represent two thirds of the total national production while the remaining portion is domestically consumed. Nigeria is taking measures to end natural gas flaring and to prioritize natural gas use for internal consumption over exports in order to support growing use in the electric power sector (EIA, 2011).
2.1.3. OTHERS ENERGIES
Coal, nuclear, and renewable energy, with the exception of biomass, is currently not
part of Nigeria’s energy mix. Coal reserves are estimated to be about 693 million tones, but production has not been at a substantial level since the early 1990s (Ajao, 2009). The government is currently considering plans to increase coal production as a source of additional power generation.
In rural areas, a substantial amount of energy is provided by the burning of fuelwood (firewood) often used for heating and cooking needs. The usage of this kind of fuel bear problems of pollution related to its toxicity, it also contributes to the already heavy deforestation process caused by the growing timber industry. Due to the growing scarcity of wood a person on average has to spend 4-‐6 hours collecting enough wood for a single day’s meal (Darling, Hoyt, Murao, & Allison, 2008).

SUPPORT FOR THE ELABORATION OF THE MASTER PLAN FOR THE JIGAWA STATE ELECTRIFICATION
ENGR. MANUEL VILLAVICENCIO
The most significant renewable resources available are solar energy, biomass, wind, and hydropower. With the exception of hydropower the current exploitation and utilization of these resources is very low and largely limited to pilot and demonstration projects (Ajao, 2009). The main constraints to mass diffusion of renewable energy technology in Nigeria are the absence of market and the lack of appropriate policy, regulatory, and institutional framework to stimulate demand and attract investors (Ajao, 2009).
2.1.4. ELECTRICITY
The Nigerian electricity consumption is reported to be 19.2 TWh (see Table 5), completely domestic consumption. Indeed, the electricity demand far outstrips the supply and, in addition, the supply is characterize to be “epileptic in nature” (Sambo, Matching Electricity Supply with Demand in Nigeria, 2008). Electric power is mostly generated by both hydro electric power and thermal gas powered stations. Large hydro accounts for 31.3% of grid electricity generation while natural gas accounts for the remaining 68.3% (Ajao, 2009).
Electric energy supply efficiencies of existing thermal plants are as low as 12%. Also large amounts of electricity are lost during transmission and distribution. These losses are sometimes more than 30% of the total generated electricity. The Nigerian electric power sector has been rated by the UNPD as having one of the highest rate of losses (33%), a generation capacity factor of 20% (UNDP/World Bank Report 1993), the lowest revenue at 1.56c/kWh, the lowest rate of return (-‐8%) and the longest average account receivable period (15 months), among a group of 20 low income and upper income countries (Adenikinju, 2008). Apart from these deficiencies, the reliability and availability of existing installed electric generation system is as well very low. The country has had serious problems of power reliability over the years causing an important captive demand.
Table 6. Power industry in Nigeria. Source: (Adenikinju, 2008).

SUPPORT FOR THE ELABORATION OF THE MASTER PLAN FOR THE JIGAWA STATE ELECTRIFICATION
ENGR. MANUEL VILLAVICENCIO
On 2007, the Enterprise Survey initiative carried out by The World Bank reported a list of the top 10 business environment obstacles surveyed by an annual poll for a total of 1891 firms within the country. The survey indicates the firms perceptions about principal constraints for business development, as a result, electricity service inefficiency is perceived as the main constraint by 63.6% of the firms, highlighting 25.2 average electricity outage in a month with an average duration of 7.8 hours each one and revealing that at least 85.7% of firms owns or shares a generator.
Most industrial establishments and upper income households install very expensive
generation sets amounting to over half of the total installed grid capacity (Ajao, 2009). Only about 40 per cent of nigerians have access to electricity.
Figure 11. Top 10 Business environment constraints 2007. Source: Enterprise Surveys, The World Bank. In accordance with the exposed in section 1.1.3 (Energy & Electricity Brief), the
National Energy Policy (2003) generated the dissolution of NEPA, and ended the government monopoly over the power utilities and started the energy market liberalization to create new legal entities in which private investors could acquire shares and manage them. The Roadmap for the Power Sector Reform, published by the presidency of Nigeria in 2010, presents the complete agenda for the transformation of the power sector, including the immediate actions to take to align the sector with the economy development program, giving special attention to the promotion of IPPs participation and the improvement of electricity policies. In that document, the government assigns to the NERC a complete review of the sector and of the tariff regime by the first quarter of 2011, with the scope of replacing the national uniform tariff with a new “genuinely” cost-‐reflective, ceiling on end-‐user tariffs, and also sets a detailed ambitious targets for the power capacity expansion and the supply quality amelioration.
2.2. Energy Projections
In accordance with the development plans of the country (NV 20-‐2020), and within the framework of the cooperation program between the International Atomic Energy

SUPPORT FOR THE ELABORATION OF THE MASTER PLAN FOR THE JIGAWA STATE ELECTRIFICATION
ENGR. MANUEL VILLAVICENCIO Association (IAEA) and the Energy Commission of Nigeria (ECN) an study titled Energy Study for the Industrialization of Nigeria was carried out in 2005. Having as inputs the economic and demographic situation of the base year 2000, the energy supply projection required for the transformation of Nigeria into an industrializing nation by 2030 were estimated in this study as well as the investment requirements to meet the projected energy needs. The basic assumptions considered within the projection were (Sambo, Iloeje, Ojosu, Olayande, & Yusuf, 2005): · The economic reforms will bear significant fruits, which will translate to high per capita income and high economic growth rates, allowing government to achieve the socio-‐economic targets of the Millennium Development Goals. · A rate of growth of population of 1 – 2 % p.a., in accordance with the presented by the average middle-‐income countries. · Energy supply mix will be diversified to enhance security of supply. · There will be a significant increase in energy access for all classes of Nigerians and the need for auto-‐generation will be minimized. · Nigeria will be an environmentally conscious and friendly society.
The evaluation of future energy demand was modeled using the Model for Analysis of Energy Demand (MAED) and the evaluations to find the optimal expansion plans for the power generating system of the country were solved with the Wien Automatic System Planning (WASP) package.
This appraisal gave as a result three scenarios of conceivable economic growth, GDP growth rates of 7% (Reference), 10% (High Growth) and 11.5% (Optimistic) per year in real terms, with a particular energy trend for each one. The reference scenario represents the MDG objective to reduce poverty by half by 2015 and to transform the country to an industrializing nation by 2030.
Figure 12. a) GDP grow effect based in the assumptions. b) Diversification effect. Source: (Sambo, Iloeje, Ojosu, Olayande, & Yusuf, 2005).
a) b)

SUPPORT FOR THE ELABORATION OF THE MASTER PLAN FOR THE JIGAWA STATE ELECTRIFICATION
ENGR. MANUEL VILLAVICENCIO
Not only the grow of the GDP based in constant prices was considered in the projections for the economy development (grow effect), it was also assumed a progressive transition in the country economy structure in which agriculture and energy share of revenue decrease meanwhile industry (specially manufacture), services and construction sectors became more significant in the share of the total country incomes (diversification effect).
The energy and electricity demand projections were made in the context of the
projected trends in the overarching drivers of energy demand, namely, population and economic and life style parameters. Average growth rates of commercial energy demand over the study period for the Reference, High Growth and Optimistic scenarios were 7.52%, 9.18% and 10.25% respectively (see Figure 13). The projected demands of electricity are shown in Figure 14, they include losses and exports, and correspond to the national grid and does not include captive generation by industry, service and household sectors.
Figure 13. Trends in Final Commercial Energy Demand. Source: (Sambo, Iloeje, Ojosu, Olayande, & Yusuf, 2005).
Figure 14. Trends in Electricity Demand. Source: (Sambo, Iloeje, Ojosu, Olayande, & Yusuf, 2005).

SUPPORT FOR THE ELABORATION OF THE MASTER PLAN FOR THE JIGAWA STATE ELECTRIFICATION
ENGR. MANUEL VILLAVICENCIO
Similar results were achieved in an analogous study done by Ibitoye in 2006, assuming an economic transformation from a low income to a middle-‐income economy by 2030 with a real yearly GDP growth rate of 10%, a similar sectorial composition of GDP for 2030 (diversification effect) and an improved electricity access from the level of 45% in 2005 to 73% in 2015 (F.I. Ibitoye & A. Adenikinju, 2006). Based on these assumptions the predicted composition of electricity demand is expected to rise from about 35 GW in 2015, to 105 GW in 2025, and 164 GW in 2030. These studies confirm each other and delineate the anticipated tendency for the electricity demand of the country, and more general, for its energy demand.
As discussed in section (1.1.3 Energy & Electricity Brief), with the Electric Power Sector Reform Act (EPSR) in 2005, the federal government provided for the bulk private power generation. Generation capacity is expected to increase the existing inadequate supply coming from the federal government’s generating stations. This plan has also given the opportunity to the states governments and other stakeholders in the industry to venture into electricity generation through the Independent Power Producers (IPP) program.
Power supply in Jigawa State is mainly provided by the Power Holding Company of Nigeria (PHCN). The allocation of power to the State by PHCN is not based on demand but is dependent on what is available on the grid. Based on the fact that the national generation capacity (currently less than 4000 MW) is far below the national demand, the supply allocation for Jigawa State, like that of its counterparts all over the Federation, is grossly scarce. This allocation which is mainly coming through the two 132kV transmission substations located at Hadejia and Dutse is also shared by some parts of Kano, Katsina, Bauchi and Yobe States, although some few areas of the State also get their power supply from some of the neighboring states. Electricity is mainly distributed from the transmission substations through the 33kV overhead distribution network with about 1000km route length and about the same number of distribution transformers (substations) serving the individual communities (Directorate of Budget and Economic Planning - SEEDS II, 2009).
Figure 15. Electricity lines of Jigawa State. Self Elaboration

SUPPORT FOR THE ELABORATION OF THE MASTER PLAN FOR THE JIGAWA STATE ELECTRIFICATION
ENGR. MANUEL VILLAVICENCIO
The county authority assigned to follow the power projects is the Jigawa State Rural Electricity Board. The government of Jigawa State is currently promoting IPPs projects in five locations: Dutse with 3.2 MW, Kazaure with 2.4 MW, Gujungu with 19.2 MW, Kanya with 1MW and Abunabo with 0.5 MW, all of them Diesel power stations for a total capacity of 26.3 MW. The last brief report (Jigawa State Rural Electricity Board, 2010) exposed that the Dutse and Kazaure equipments have been installed while the Gujungu ones are still in containers because of some unresolved issues with the contractors, the Kanya IPP has a 1000 kVA installed generator but other equipments are yet to be purchased and installed, and the Abunabo project is in works of construction of the power house. Further information about IPP projects shows that just the Dutse projects is likely to be available in the short term, others projects are not likely to continue due to some technical, financial and economic viability problems. The major constrain to the state’s IPP plants in Dutse is the use of diesel fuel which comes at a very high cost with intermittent shortages and also high maintenance costs associated with internal combustion engines. In addition, there is the unfavorable regulatory framework which gives PHCN monopoly over transmission, distribution and sales of power.
Other constraints presented in the report of the Rural Electricity Board, were the lack of interest by the private sector in investing in power generation and distribution lines, the use of poor quality and substandard materials and poor maintenance culture in the country resulting in frequent collapse of the existing grid and other infrastructure. Of great concern also are the lack of adequate skilled technical manpower, vandalism and theft on electrical installations in the state. Existing data available in the state’s Rural Electricity Board indicates that despite the efforts of both the federal, state and local governments in providing electricity to the people, only about 10% of the households in the state have electricity access (Directorate of Budget and Economic Planning - SEEDS II, 2009). Power supply private micro-‐plants are very common within the country and in Jigawa
State. They are mostly small diesel generator sets considered to be highly pollutants. Due to their high capital and operation and maintenance costs, although they are not a very feasible solution for particulars and just a few of them can afford such systems, they
represent an important captive demand for the electricity system to consider as well as to the national economy.
Table 7 presents some estimations of private generators capacity for some of the major cities of Jigawa.
Village KVA -‐ estimated total
capacity MW Dutse 9217 9.217 Kazaure 7640 7.64 Maigatari 20440 20.44 Ringim 19310 19.31 Gurri 58 0.058 Total 56665 56.665
Table 7. Aggregated capacity of particular diesel generator sets. Source: Tennessee
Village Infrastructure group (TVIG) 2001.

SUPPORT FOR THE ELABORATION OF THE MASTER PLAN FOR THE JIGAWA STATE ELECTRIFICATION
ENGR. MANUEL VILLAVICENCIO
At the same time, there exists a solar based grid electrification initiative addressed to some isolated villages within the State. The projects are carried out mostly by the Jigawa State Alternative Energy Fund and the ECN, and they consist in providing power supply for lightning and water pumping needs to the villages. Up to 2011, small photovoltaic systems have been installed in 30 villages covering basic services. Further details of those projects are presented in annex I.
Considering the low electricity access and the low reliability of the national grid, even with no reported estimations, it is also expected to have an important captive demand within the state, in both rural and urban settlements. In addition, the electricity access surveys show different estimations, with values as little as 10% (J-‐SEEDS II 2009) and 18.3% (North East core welfare survey, 2006). Two type of factors can contribute to this inconsistency, the different reference year joined with a high population growth rate and the statistical population dependency. Nevertheless, both values are certainly slight. In this context, complete power demand estimation for the State is necessary.
2.3. Energy policies and framework
At the country scale, over twenty years prior to 1999, the power sector did not witness substantial investment in infrastructural development. During that period, new plants were not constructed and the existing ones were not properly maintained, bringing the power sector to a deplorable state. In 2001, generation went down from the installed capacity of about 5,600MW to an average of about 1,750MW, as compared to a load demand of 6,000MW. Also, only nineteen out of the seventy-‐nine installed generating units were in operation (Sambo, 2008). The energy sector in Jigawa State followed the same pattern. In addition, the Northern states of the country suffer a poverty situation below the average of the country, with a higher deficiency in basic services and infrastructure.
As presented in the previous section, the State government has adopted an ambitious plan for the development of the Jigawa (J-‐SEEDS program), in which the objectives and strategies to be applied in order to eradicate poverty and to enhance development are detailed. The Comprehensive Development Framework identifies the critical areas and start a transition to achieve a “proper investment climate” conceived to lead development. In this sense, an institutional and policies reformation has started in parallel with an infrastructure empowerment program. The three main infrastructure areas identified in this regards include provision of roads network, power supply and information and communication technology.
In what concerns the energy sector, Jigawa State Government follows the federal directive of the Electric Power Sector Reform Act 2005, and it is committed to promote independent power supply generated from both conventional and renewable sources and to encourage the rehabilitation of existing lines and to invest in building new ones. Also, the Federal Government plans to extend the gas pipeline to the northern part of the country facilitating with it the power generation in the state. The primary objective related to energy policy in the state is to ensure adequate and stable power supply to the population (J-‐SEEDS II, 2009). Secondary objectives in this sector are to improve the access to the electricity grid, upgrade, strengthen and improve maintenance of existing electricity

SUPPORT FOR THE ELABORATION OF THE MASTER PLAN FOR THE JIGAWA STATE ELECTRIFICATION
ENGR. MANUEL VILLAVICENCIO distribution networks and increase the generation capacity through IPP participation and include alternative energy sources. The identified targets are: • Achieve at least 30% and 50% coverage for households with electricity supply by 2012 and 2020 respectively. • Ensure that the state generates at least 10% and 50% of its electricity demand by 2012 and 2020 respectively. • To upgrade and strengthen 500km and 1000km of existing 33KV distributions lines by 2012 and 2020 respectively.
The specifics actions within the power generation and distribution sector
considered in the last report of the state are: • Double the rate of contribution of this sector to economic growth and rate of employment in sectors that rely on electricity by 2020. • Appealing to the Federal Government to upgrade the two existing transmission substations in the state and the construction of an additional one at Gagarawa as already proposed. • To upgrade and strengthen 500km and 1000km of existing 33KV distributions lines by 2012 and 2020 respectively. • Partnership between Jigawa State Government and its neighbors, especially Kano, in the power sector such as hydropower generation at Tiga Dam and having a stake in the Kano Distribution Company of PHCN. • Completion of the Independent Power Plants in Gujungu, Kazaure and Dutse and the establishment of a 15 Megawatts IPP using dual gas/LPFO(black oil) as fuel through cooperation with international agencies specialized in power generation. • Continuation of rural electrification projects through extension of the national grid and renewable energies by partnering with the local governments. • Joint efforts and funding between the Federal Government and the States in the north for the exploration and exploitation of oil and gas deposits and the development of Jatropha farms for the production of bio-‐diesel.
The implementation of alternative energy in Jigawa, mainly targeting the rural
areas, could be harnessed as a substitute of firewood, kerosene and diesel. In the strategy for environmental protection of the state it is also regarded to “produce locally available, cheap, environment-‐friendly and renewable energy sources, particularly solar energy and bio-‐gas” (Directorate of Budget and Economic Planning -‐ SEEDS II, 2009). The State is however aware that renewable energies, apart from hydropower, are rarely used for regional or industrial power supply.

SUPPORT FOR THE ELABORATION OF THE MASTER PLAN FOR THE JIGAWA STATE ELECTRIFICATION
ENGR. MANUEL VILLAVICENCIO
Chapter 3. Rural Electrification Planning: Methodology Presentation
3.1. Planning Schemes for Rural Electrification in Developing Countries
Planning involves to study and to analyze a set of patterns and needs to be met in order to propose, and later implement, the most suitable strategy to reach the identified objectives. In energy planning and more specifically in rural electricity planning, these tasks comprise the quantitative estimation of energy needs or electricity demand, finding a set of resources and conversion technologies to meet these needs by doing it in an optimal manner.
Hiremath R.B. et al. recognizes the energy planning issue to be frequently driven by
the current commercial energy oriented development plans. The author asserts that the energy planning, when focused on fossil fuels and centralized electricity generation, most of the time results in inequities, external debt and environmental degradation. These are the usual incentives related to the Centralized Energy Planning (CEP) methodology. That is because CEP tends to ignore energy needs and inequities of rural and poor areas, and also led to environmental degradation due to fossil fuel specialization by seeking profitability intentions. This methodology usually neglects the variations in socio-‐economic and ecological factors of the region, which have been demonstrated to be crucial aspects influencing the success of any intervention at local level. The alternative approach, the Decentralized Energy Planning (DEP) is in the interest of efficient utilization of resources, considering various available resources and driven by the specificities of the region.
As it was already commented, the approach attempted on this cooperation project is to adopt a holistic point of view by recognizing and taking into consideration a set of complementary variables in meeting the objectives of the electrification plan of Jigawa State. The above implies planning at decentralized level. A brief review of the existing DEP methodology for energy planning models and the particular implementation concerning this project are exposed next.
3.1.1. DEP methodology presentation
Decentralized energy planning is based in a particular conception of the system by
making adapted energy models. The energy models are simplified representation of real systems used to comprehend the complex system based on its most relevant variables. Modeling implies making coherent assumptions and interrelating many factors simultaneously in order to compute the logical consequences of them, always keeping the arbitration of fidelity to the real system dynamics and the complexity of the model. The assumptions made represent the heart of the model, they should be explicitly and unambiguously stated (unlike thought experiments and mental models), so that they are open for critique and review. Further, this allows for risk, hedging strategy and sensitivity analysis for the stakeholders (Hiremath, 2005).

SUPPORT FOR THE ELABORATION OF THE MASTER PLAN FOR THE JIGAWA STATE ELECTRIFICATION
ENGR. MANUEL VILLAVICENCIO
The planning subject also implies the recognition of the present situation and the targets to be achieved, which involves an inevitable deal with time. Grubb et al. mentions that any model dealing with future situations unavoidably makes use of estimates and assumptions which may or may not turn out to be valid under certain circumstances, they are contingent by nature, and at the time of application they will inevitably be uncertain. The objective of the modeling work is to obtain a set of possible scenarios, making more accessible the understanding the interaction of the multiple variables. The outputs of the model are quantitative indicators that facilitate the design of the plan, the resource allocation and detail the prioritization criteria, which give support to the decision making process for plan implementation.
The energy models can be summarized by determining the following aspects (Hiremath, 2005):
• The purpose: General or specific. • The structure: internal assumptions or external assumptions. • The analytical approach: top-‐down vs. bottom-‐up. • The underlying methodology. • The mathematical approach. • Geographical coverage: global, regional, national, local or project. • Sectorial coverage. • The time horizon: short, medium, and long term. • The data requirements.
Hiremath et al. make an overview of the DEP models and application literature, and
use the presented aspects to describe them. They expose the followings:
a) Optimization models:
These models are prescriptive tools that use an objective function, a set of variables and a set of constrains to represent the goal to be accomplished. The optimization process depends on the type of the objective function and the algorithm followed, the result of the process is to uncover the optimal option from the given alternatives that met the imposed restrictions. Once the problem is defined, the optimal solution obtained by mathematical methods. In energy planning, this kind of model is very useful in studies where the problem is to choose the more appropriate technology between a set of well-‐defined alternatives. The most common methods used in this field are the linear programming (LP) such as the Optimal Renewable Energy Model (OREM) that minimize the cost/efficiency ratio to allocate renewable energy sources to different end uses (Iniyan & Jagadeesan, 1998); the dynamic programming (DP), utilized to plan the rural medium voltage distributions networks taking into consideration the exploitation and undelivered energy costs to obtain the optimal investment policy over time (Nahman J, 1997); the multi-‐objective linear programming (MOLP), used to analyze the renewable energy policy of Tamil Nadu, an state in India (Das, 1987); the mixed integer linear programming (MILP), used to plan energy supply in India at different levels (Malik & Satsangi, 1997) and a combination of them with forecasting tools (Long Term Energy Planning model -‐ LEAP ) all of which are developed under computational tools due to the long iterative nature of the calculations.
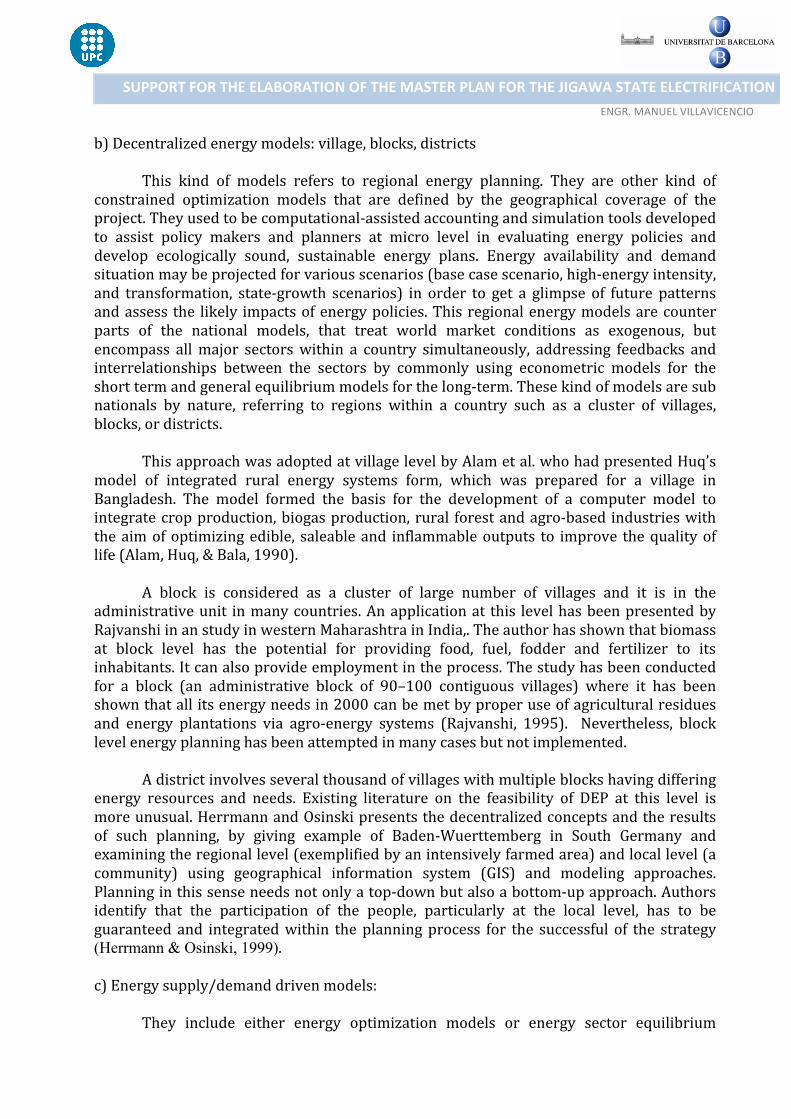
SUPPORT FOR THE ELABORATION OF THE MASTER PLAN FOR THE JIGAWA STATE ELECTRIFICATION
ENGR. MANUEL VILLAVICENCIO b) Decentralized energy models: village, blocks, districts
This kind of models refers to regional energy planning. They are other kind of constrained optimization models that are defined by the geographical coverage of the project. They used to be computational-‐assisted accounting and simulation tools developed to assist policy makers and planners at micro level in evaluating energy policies and develop ecologically sound, sustainable energy plans. Energy availability and demand situation may be projected for various scenarios (base case scenario, high-‐energy intensity, and transformation, state-‐growth scenarios) in order to get a glimpse of future patterns and assess the likely impacts of energy policies. This regional energy models are counter parts of the national models, that treat world market conditions as exogenous, but encompass all major sectors within a country simultaneously, addressing feedbacks and interrelationships between the sectors by commonly using econometric models for the short term and general equilibrium models for the long-‐term. These kind of models are sub nationals by nature, referring to regions within a country such as a cluster of villages, blocks, or districts.
This approach was adopted at village level by Alam et al. who had presented Huq’s model of integrated rural energy systems form, which was prepared for a village in Bangladesh. The model formed the basis for the development of a computer model to integrate crop production, biogas production, rural forest and agro-‐based industries with the aim of optimizing edible, saleable and inflammable outputs to improve the quality of life (Alam, Huq, & Bala, 1990).
A block is considered as a cluster of large number of villages and it is in the administrative unit in many countries. An application at this level has been presented by Rajvanshi in an study in western Maharashtra in India,. The author has shown that biomass at block level has the potential for providing food, fuel, fodder and fertilizer to its inhabitants. It can also provide employment in the process. The study has been conducted for a block (an administrative block of 90–100 contiguous villages) where it has been shown that all its energy needs in 2000 can be met by proper use of agricultural residues and energy plantations via agro-‐energy systems (Rajvanshi, 1995). Nevertheless, block level energy planning has been attempted in many cases but not implemented.
A district involves several thousand of villages with multiple blocks having differing energy resources and needs. Existing literature on the feasibility of DEP at this level is more unusual. Herrmann and Osinski presents the decentralized concepts and the results of such planning, by giving example of Baden-‐Wuerttemberg in South Germany and examining the regional level (exemplified by an intensively farmed area) and local level (a community) using geographical information system (GIS) and modeling approaches. Planning in this sense needs not only a top-‐down but also a bottom-‐up approach. Authors identify that the participation of the people, particularly at the local level, has to be guaranteed and integrated within the planning process for the successful of the strategy (Herrmann & Osinski, 1999). c) Energy supply/demand driven models:
They include either energy optimization models or energy sector equilibrium

SUPPORT FOR THE ELABORATION OF THE MASTER PLAN FOR THE JIGAWA STATE ELECTRIFICATION
ENGR. MANUEL VILLAVICENCIO models. In this sense the approach of both models is quite similar, the only difference is that in energy optimization approach the objective is to minimize the present value of the overall system cost of meeting the given demand to determine the equilibrium share of various technology options, while in the latter the objective is in determining the equilibrium prices based on the behavior of individual elements. Very little literature is available on the supply demand models. The literature mainly focuses on rural areas and not individual villages, cluster of villages, block or districts. The energy mix is not considered at all, and the supply and demand matching is hardly seen.
A punctual case of a supply demand model was presented by Parikh in which he had programmed a general LP model developed to capture energy and agricultural interactions existing in the rural areas of developing countries. On supply side, energy used for agriculture includes fertilizers, irrigation, mechanization, different technological choices, crop commodities, livestock, farmers of different income groups along with their assets, i.e. land holdings, livestock and others. The by-‐products of agriculture, i.e. biomass (crop residues, animal dung, wood, etc.), can be used to generate energy. On the demand side their use for feed, fuel, and fertilizer must be considered. Twelve different energy sources and several conversion technologies, such as biogas, charcoal kilns, alcohol distilleries, etc., were considered. The model was applicable to low-‐income, biomass-‐scarce developing countries and was suitable for policy purposes because it considers several income groups separately and considers how different changes affect each of them (Parikh, 1985). d) Energy and environmental planning models:
This kind of method consist in the evaluation of the utility of any energy system by assessing the energy needs and the resulting emissions through all the materials and processes available to build and use any system over the lifetime of the project and including also the rehabilitations works of the used area at the cessation of the project. Consequently, it can be considered as a cradle-‐to-‐death study through dynamic assessment of the defined reference energy system comprising of many alternatives and constraints. It is done to find the optimum solution for certain objective function often system cost minimization through meeting system requirements such as the energy demand (Hiremath, 2005). e) Resource and energy planning models:
The resource methodology planning consist on assessing all the energy resources available at local level with the goal of identifying the optimal mix of centralized or decentralized energy systems and all the efficiency improvements that will be required to meet the demand or to increase the energy services supply always taking into consideration a cost minimizing or least environmental impact criteria.
Under this methodology, Yue and Wang evaluates wind, solar, and biomass energy sources in a rural area of Chigu in southwestern Taiwan by analyzing technical, economic, environmental, and political implications in order to establish an evaluation model for developing local renewable energy sources. The study evaluated the local potential of renewable energy resources with the aid of a GIS according to actual local conditions, and

SUPPORT FOR THE ELABORATION OF THE MASTER PLAN FOR THE JIGAWA STATE ELECTRIFICATION
ENGR. MANUEL VILLAVICENCIO allows the assessment to consider local potentials and restrictions such as climate conditions, land uses, and ecological environments, thus enabling a more accurate assessment than is possible with evaluations on an approximate basis. The results helped to build a developmental vision for sustainable energy systems based on locally available natural resources, and facilitate a transition of national energy and environmental policies towards sustainability (Yue & Wang, 2004).
f) Energy planning models based on neuronal networks:
Integrated energy planning based on decision support systems (DSS) is flexible, adaptable, and ecologically friendly and result on an optimal selection of the mix of new renewable/conventional energy sources.
The most common application of this kind of methods is the fuzzy based multi-‐objective analysis and the multi-‐criteria decision making (MCDM) methods. The increase in popularity and applicability of these methods beyond 1990 indicates a paradigm shift in energy planning. The methods are observed to be most popular in renewable energy planning followed by energy resource allocation. The most popular techniques are the analytical hierarchy process, the Preference Ranking Organization Method for Enrichment Evaluations (PROMETHEE) and the “Elimination Et Choix Traduisant la Realité” (ELECTRE).
An application of this method on energy planning was carried out by Pokharel and Chandrashekar, who have applied a suitable multi-‐objective programming method for rural energy analysis. Multi-‐objective methods provide decision makers with an opportunity to negotiate and explore different energy options. As an illustration of the proposed method, authors have analyzed the energy situation of a rural area and examined the tradeoff between energy supply, investment for energy programs, and employment generation (Pokharel & Chandrashekar, 1998).
A review of the existing methods to assess rural electrification projects in developing countries have been presented by Ochoa J.L. (2009). In his study, he has followed an Analytic Hierarchy Processes (AHP), firstly introduced by Saaty (1980), to propose a multi-‐criteria methodology specially designed to take into consideration both quantitative and qualitative variables such as feasibility, energy security, social and environmental impacts, among others previously surveyed ones, to develop the rural electrification plan of El Alumbre community in Peru (Ochoa Ramón, Velo García, & Ferrer Martí, 2009).
3.2. Methodology Implementation
The context of the project was given in chapters 1-‐3. They were exposed the deregulation situation of the electricity market, the commercial electricity development taking place, and the socioeconomic issues surveyed in Jigawa State. The study of the rural electrification alternatives for Jigawa State is presented from a perspective of DEP, applying a demand driven approach with an especial focus in the potential utilization of the available resources at the local level. A preliminary optimization model is to be developed

SUPPORT FOR THE ELABORATION OF THE MASTER PLAN FOR THE JIGAWA STATE ELECTRIFICATION
ENGR. MANUEL VILLAVICENCIO in section 4.3 in order to roughly determine some essential questions about the fuel strategy to be followed. From this philosophy, the pretension is not only to appraise the electrification targets of the state, a dimension of long term energy security and the environmental impacts of the projects are also contemplated and pretended to be further developed by next studies.
In accordance with the J-‐SEEDS`s targets on electrification by 2012 and 2020, the
two time horizon were assessed. Most of the information available was updated to the year 2008, for this reason it was used the year of reference; therefore, the electricity demand was forecasted for 2012 and 2020. Energy resources of the State were also estimated in order to have a diversified set of alternative in order to preliminary optimize the objectives on electrification.
In addition a GIS library of the project was initiated. The information compiled and
the results obtained were generated in the library, which serves as support for the decision making process and allows the promotion of further projects within the development plans of Jigawa State.
3.2.1. Data collection campaign
Due to the scope of the project, it was adopted a rapid appraisal technique for data collecting, comprising two categories of data collected and being developed in three phases.
The process followed the methodology of Rapid Resource Assessment (RRA),
consistently applied by the USAID agency in various rural energy projects in developing countries. The RRA is an useful tool to build a first panoramic picture of the project`s context when time and economics are strong constraints.
Categories of data gathering correspond to primary and secondary data collection,
which varies significantly depending on the subject of RRA. For energy resource assessment, primary sources include direct observations, actual meter readings, key informants, and interviews. Secondary data collection include reviewing papers on the issue for the particular region under study; published government data and statistics, discussions with selected experts from various related organizations, informal discussions with selected key experts, maps and aerial photographs, and review of existing programs for rural development, both regionals and nationals (USAID, 2005). The phases of data gathering were:
1) Preliminary/preparatory phase: It comprised the secondary data research, concerning literature, related projects and the background Jigawa`s public information. The mission was inputs identification, checklist elaboration for tasks and data required and questionnaire preparation for not available data finding. Meetings and conversations with team members and counterparts in Jigawa State were carried out for data gathering and visit organization.

SUPPORT FOR THE ELABORATION OF THE MASTER PLAN FOR THE JIGAWA STATE ELECTRIFICATION
ENGR. MANUEL VILLAVICENCIO 2) Fieldwork: A member of the team visited Jigawa State on August 2011. During three weeks, in company with representatives of the Rural Electricity Board of the State, he had meetings with the principal stakeholders of the project and had first person interviews with possible collaborators and communities. In that phase important primary data was gathered in form of meeting minutes, actors map, agenda analysis, direct compilation and photographs. 3) Discussion phase (Validation and refining): After the visit, they were carried out meetings for the analysis of the findings among the team members. Once having a better picture of the project and having updated the checklists of tasks and data required, they were recognized what were still unclear and the next steps. Also, with a better understanding of the context of the project, it was more easier to make accurate assumptions for the modeling phase.
3.2.2. GIS implementation Geographic Information Systems (GIS) are digital cartography built with a layer
based architecture, each layer contains a particular feature of the area under investigation. They can be created multiple projects and view including the layers of the data relevant to the task. These layers are useful tools for georeferring inputs, results and considerations; they are also useful to do calculations with physical location within the area of study. They can be observed individually or overlapped. GIS provides a better understanding of the spatial location of variables, facilitates the plan elaboration and the supervision of its evolution, as well as it makes easy the integration and collaboration among agencies with complementary objectives.
Due to the user friendly interface, the robustness, the versatility and the public access character, the GIS tool used in the analysis was the free software developed by the public administration of Valencia, Spain (Generalitat Valenciana), GVSIG desktop. In 2003, GVSIG was conceived for dealing with municipality infrastructure data with an open source code philosophy, allowing multiple collaborators to contribute and cooperate for its development. Currently the software continues with the value of solidarity of free software and accounts with an extended community of collaborators at international level, focused on improving the code and sharing knowledge in a collaborative way.
The implementation of GIS tools for energy projects is becoming a common
technique, especially for the DEP models taking into consideration distributed demand and resources. GIS system is also implemented in grid expansion projects due to the advantages offered by the calculation capabilities using spatial data. Dominguez et Amador (2007) explains that in the renewable energy field, GIS applications are used in three major groups (J. Amador, 2005): 1) The decision support systems (DSS) for renewable energy regional integration. These projects are focused in identifying potential areas for renewable energy technologies, determining the socio-‐economic and environmental consequences of the projects. Mostly applied in the EU, projects as REGIS, EPURE, EnTRACK, REPLAN and REDES were developed within this framework during the last two decades.

SUPPORT FOR THE ELABORATION OF THE MASTER PLAN FOR THE JIGAWA STATE ELECTRIFICATION
ENGR. MANUEL VILLAVICENCIO 2) The evaluation of renewable energy for distributed electricity generation. These projects have been usually developed for the evaluation and detailed design of renewable plants, mainly wind farms, solar installations and biomass reactors, and the sitting of grid-‐connected systems. The renewable energy resources characterization and the feasibility of projects strongly depend on topographic factors such as terrain elevation, slope and morphology, also, factors as soil type, hydrography and protected areas are crucial for biomass evaluations. 3) The evaluation of decentralized electricity generation and rural electrification systems. Predominantly based on the SOLARGIS project, which is a methodology developed within the framework of the EU JOULE program by several European institutions in order to identify the best alternative to foster electrification plans based in techno economical feasibility criterions.
Figure 16. Continental view of the GIS elaborated for electrification project of Jigawa State. Self Elaboration
In this sense, the elaboration of a GIS system was recognized to be of relevant
importance for the rural electrification plans of Jigawa State. The GIS database developed in this study conveys information of various elements influencing the project, in both format, raster and shape files, they are ordered in group of layers corresponding to:
• Population: main villages, settlements and their available statistics. • Transportation: as roads, railroads and near airports • Satellite imagery

SUPPORT FOR THE ELABORATION OF THE MASTER PLAN FOR THE JIGAWA STATE ELECTRIFICATION
ENGR. MANUEL VILLAVICENCIO • Electricity: Transport lines (high voltage), distribution network (medium and low voltage), main generation stations at the country level, as well as projected generation stations for the State, connected nodes, nodes to be connected and solar based electrification pilot projects at the state level. • Hydrology: Rivers, tributary flows, springs/water-‐holes and inland waters • Vegetation: grasslands and croplands. • Wind speed • Solar irradiation map.
This information can be used for further assessments of electrification projects at
different levels within the state, considering the location and availability of renewable resources, the proximity to the existing grid, and other pertinent supply factors. Also, this database can be further complemented and shared between other public institutions or collaborators related to the development plans of the region.
Figure 17. Local view of the GIS elaborated for electrification project of Jigawa State.

SUPPORT FOR THE ELABORATION OF THE MASTER PLAN FOR THE JIGAWA STATE ELECTRIFICATION
ENGR. MANUEL VILLAVICENCIO
Chapter 4. Power Sector Assessment of Jigawa State
As long as basic electricity needs relies on people’s needs according to geographical, meteorological and other physical factors that, in a first approach, can be considered to be constants on time in the middle term. However, electricity demand is also influenced by socio-‐cultural factors that strongly affect the pattern of the power load curve in a shorter term especially in developing communities, hence, in rural electrification planning this dimension represents a variable to be considered and evaluated.
4.1. Electricity demand estimation Even if urbanization in Nigeria preceded colonization, it was largely under colonial
rule that the major cities and the urban systems that exist today were defined. Also, it is the institutional structure left by the colonial rule which is still established. The towns and cities have continued to grow at a faster rate than the capacities of the initially installed facilities. Thus, the dynamics of the Nigerian city growth have been accompanied by enormous deficiencies in modern basic facilities (Agbola, 2005). The rapid rate of urbanization should presuppose an increase in the provisioning of infrastructure in both rural and urban centers, but by the moment this has not been the case and the current situation is widely represented in terms of inadequate supply of basic services such as potable water, sanitation, health services, roads, electricity, among others municipal and community facilities, which contribute to ill health, and environment degradation.
Given the focus of the present study, being conceived as a first evaluation for the
elaboration of a the rural electricity plan of Jigawa State, time and economics limitations did not allowed to include any detailed study of the electricity demand of the region. That goal could be assessed on a next validation phase of the project. Nevertheless, the gathered data has made possible the uncovering of some electricity demand patterns and to find similarities between the average electricity needs of Jigawa State and that estimated in previous case of study reviewed in literature. Particularly, those reference studies covering other regions of Africa and sharing comparable infrastructures, services needs, and socioeconomic conditions with the region of interest of this project.
As it was already presented, the rural/urban population ratio surveyed in Jigawa
State was 0.85 (National Bureau of Statistics, 2007), with agriculture representing the principal economic activity of the State, they were made some assumptions in the average settlement electricity needs modeling which has been highlighted as simplifications.
Based on the dissemination of the population within the state, the average rural
town was modeled as a Rural Growth Center (RGC) node. Such RGC concept has already been defined and used for modeling the electricity demand in other regions of Africa. The RGC, is described as a rural community center with a high concentration of residential households, it is the center of rural economic activities at local level. The RGC vicinity provides services to its residents and to those in its catchment area (CA) that surrounds it (REMP, Zambia 2009).

SUPPORT FOR THE ELABORATION OF THE MASTER PLAN FOR THE JIGAWA STATE ELECTRIFICATION
ENGR. MANUEL VILLAVICENCIO
The RGCs is conceived as the center of daily life and activities in rural areas. Typically, people go to a RGC in order to sell their agricultural products and handicrafts, to purchase daily necessities and to access public services. Consequently, as a first simplification, each RGC was modeled as a concentrated point of power demand, which implies the identification of four different types of possible consumers (see Figure 1). For the average RGCs the electricity loads considered are: households, public facilities, business entities and provisionally, hammer mills.
Danzomo village Sawo village Chirawa village
Figure 18. Rural growth centers (RGC) examples of Jigawa State
The procedure for the power demand estimation was based in the methodology presented by the Japon International Cooperation Agency (JICA) on the elaboration of the rural electrification master plan (REMP) for Zambia in 2009. In the study for Zambia, the JICA divided the country into provinces and then identified a considerable number of RGCs within the provinces in order to conduct surveys to characterize their power needs. The RGCs were classified using different technical and socio-‐economical criteria such as their current status of power supply, the number of existing facilities, the willingness to pay a tariff for the electricity supply, the power loads of the facilities types, among others.
Figure 19. RGC distribution over Jigawa State by local government area

SUPPORT FOR THE ELABORATION OF THE MASTER PLAN FOR THE JIGAWA STATE ELECTRIFICATION
ENGR. MANUEL VILLAVICENCIO
Since at this stage of the project the gathered data for Jigawa State is not as broad as that obtained by the JICA for Zambia, and based in the meteorological, socioeconomic and infrastructure parallelisms between the RGCs in both regions, missing information and non available data related power curves measures for each type of user has been taken from the referenced to the JICA study and adapted for Jigawa State via a deflator as a first approximation.
The general assumptions used to assess the electricity demand for each type of
facility of Jigawa State are presented in Table 8 and detailed postulations for each type of load are explained next.
Table 8. General assumptions for demand estimations. Self elaboration. 4.1.1. Households (HH)
The last Nigeria Demographic And Health Survey of 2008 shows the average
households characteristics. Expressly focused in MDGs indicators, the survey also offers valuable information about the goods and effects of the households by geographical area. Also, the North West regional survey of 2003 reported some households effects for the region. Based on this data, assuming an average power requirement for each reported device and introducing an average time of utilization for each device, the power demand for a typical household in the state was calculated.
As a first estimation, the number of households was estimated dividing the total
population of each local government area (LCA) by the number of persons per household reported in the last 2007 census (6.3 persons per household) (simplification 1). The subsequent steps were followed:
• The total installed power for the average household (HH) was estimated by the 2008 survey and the demographic information of the 2007 census concerning the common electrical devices. • The daily electricity demand was calculated from the total power installed per HH and the average utilization assumed for each surveyed device. • The total yearly electricity demand for the households of each LGA was calculated and compared with the results obtained using different author’s energy criteria within the framework of the electrification for sustainable development. • The power curve of the household (HH) of Zambia was adjusted by a deflator calculated as the ratio of total energy demand obtained for the average Jigawa State HH divided by the total energy calculated from the JICA power curves on Zambia. Different deflators were calculated based the different approaches of rural electricity need found in the literature.
Base year 2007 Avg. Economic growth rate 3%
persons/HH 6.3
Rural/urban ratio 0.85
Year 2012 2012 2020 2020 Population rate growth scenario 1% 2% 1% 2% CF1: correction factor based on economical activity expansion 1.16 1.16 1.47 1.47

SUPPORT FOR THE ELABORATION OF THE MASTER PLAN FOR THE JIGAWA STATE ELECTRIFICATION
ENGR. MANUEL VILLAVICENCIO The most adapted deflator was considered the one based on the most recent survey of effects resulting on 0.315. Details about the deflator estimation and electricity needs are exposed in annex II.
Calculated Deflator for HH demand correction
WEC objectifs for HH
electricity supply
Electricity demand per HH
based on income level
Energy needs based on basic services supply per HH for
development targets
Electricity needs based on O. Adeoti estimations for a Nigerian avg HH
Electricity demand per HH based on effects
surveyed 1.792 0.692 1.036 0.440 0.315
Median 0.692
Min 0.315 Mean 0.855
Max 1.792
*Deflator selected 0.315
Table 9. Summary comparison of different demand estimations. 4.1.2. Public facilities (PF), business entities (BE) and hammer mills (HM)
According to the current socioeconomic situation, the developments plans of the
State (J-‐SEEDS, 2009 and vision 20:20) and aligned with the above mentioned REMP for Zambia, it was considered for each RGC and its CA to have the following basic services: Basic/Primary School, Secondary School, Hospital, Health Center/Clinic, Police Post/Station, Post Office, Church/Mosque, Community Center, Agriculture Depot, Orphanage, Central Government Office and District Government Offices, other (average). The number of facilities and business entities per HH was estimated from the information reported by public authorities, the Health, Education and Government Ministries, in their annual budget reports and statistical reports. Not available values were assumed to have a similar ratio than the ones obtained in Zambia.
Facility Type JICA
(ZAMBIA) Jigawa State Hammer Mill (HM) 2.50E-‐03 2.50E-‐03 Household (HH) 1 1 Business entity (BE) 7.00E-‐02 7.00E-‐02 Public facilities
Basic/Primary School 2.50E-‐03 2.74E-‐03 Secondary School 6.25E-‐04 6.85E-‐04
Tertiary School 1.25E-‐05 7.22E-‐06 Hospital 7.50E-‐05 1.16E-‐05
Health center / clinic 2.50E-‐03 2.50E-‐03 Police Post/Station 2.50E-‐03 2.50E-‐03
Post Office 0 7.88E-‐03 Church/mosque 0 7.00E-‐03
Community Center 0 7.00E-‐03 Agriculture Depot 0 5.25E-‐03
Orphanage 0.0025 2.50E-‐03 Central Government Offices -‐ Total 0 7.00E+00
Provincial Government Office -‐ Total 0 1.00E+01 District Government Office -‐ Total 0 2.70E+01 Local Administration Office -‐ Total 0 4.00E+01
Courts -‐ Total 0 2.00E+00 Other -‐ Total 0 6.60E+02
Table 10. Facility ratio normalized by number of HH estimated for Jigawa State (blue: estimations from statistics, black: JICA
values, orange: assumed).

SUPPORT FOR THE ELABORATION OF THE MASTER PLAN FOR THE JIGAWA STATE ELECTRIFICATION
ENGR. MANUEL VILLAVICENCIO
In view of the fact that the electrification plans of the state conceived to foster the economic empowerment of the region, electricity supply is expected to be enhanced and preferred by productive usages. Due to agriculture being the main economic activity in Jigawa State, with millet, sorghum and maize as primary crops, the usage of a tool to shred grains mechanically was considered to be of first need to boost productivity in the sector, according to the study of the JICA in Zambia.
For Jigawa State, Hammer Mills (HM) were considered as well because of its
multiple applications in agroindustry and the advantages that they provide (multiple particle size, multiple input materials and fibers, minimal maintenance, lower initial investment) over other kind of more sophisticated devices (like Roller mills). The ratio of HM was assumed to be the same estimated by JICA, 1/400 HH (see Table 10). Under this type of facility, not just hammer mills are included, this field is considered to represent the all of the devices related to the basic food processing industry pretended to be developed in order to add value to the agricultural activities, being hammer mills (HM) the most representative and immediate tool.
Due to the non-‐existence of load curves for facility types on Jigawa State and based
on the similar weather conditions, population distribution, economical activity and other socio-‐economical parallelisms found between the RGCs structure of Zambia and Nigeria, as a first approximation, the power curves were considered to have a similar pattern than that one statistically estimated for the JICA in their study in Zambia (see Annex II, Error! Reference source not found.) (simplification2). On its estimations, JICA obtained these patterns by directly measuring the load curves of a sample group of similar facilities on different RGCs.
4.1.3. Aggregated power demand scenarios The scenarios of the hourly electricity demand for the state were estimated based
on two principal assumptions, such as population growth and economic expansion for both time horizons (see Table 8). No seasonal variations were considered (simplification 3).
The aggregated load curves are presented in Figure 20 andFigure 21, in which it can
be seen that all of them share the same pattern but differ in the width of the share for each hour. For both time horizons, the demand peak is placed at 19:00 with an expected magnitude between 183.1 -‐ 192.3 MW on 2012, meanwhile 220.3 – 250.3 on 2020. The average share of daily electricity supply by type of facility is 50% to households, 21% to hammer mills, 16% to business entities and 13% to public facilities. More detailed information and tables are presented in Annex II.

SUPPORT FOR THE ELABORATION OF THE MASTER PLAN FOR THE JIGAWA STATE ELECTRIFICATION
ENGR. MANUEL VILLAVICENCIO
Figure 20. Range of load estimations by 2012.
The targets for electricity supply of the J-‐SEEDS roadmap are to achieve 30% and
50% of electricity access by 2012 and 2020, and to achieve 10% and 50% of power generation on the same time horizons (simplification 4). Using the previous estimations of the total expected power demand, both targets can be assessed with a demand driven approach. The energy supply optimization analysis is presented in section 4.3, in which power generation targets are assessed, choosing the most appropriated technology focused in a techno-‐economical model as a first approach.
!"
#!"
$!"
%!"
&!"
'!!"
'#!"
'$!"
'%!"
'&!"
#!!"
!(!!" '(!!" #(!!" )(!!" $(!!" *(!!" %(!!" +(!!" &(!!" ,(!!" '!(!!" ''(!!" '#(!!" ')(!!" '$(!!" '*(!!" '%(!!" '+(!!" '&(!!" ',(!!" #!(!!" #'(!!" ##(!!" #)(!!"
!"#$%&'(
)*&
+",%&
-"./&0,%1$&2342&5&(67&8"8,9.:"7&;%"#<=&%.<$&-./012"3421015678"9.71:677"6:5;<"=>.76?>0@78"=4AA6B"A1007""
!"
#!"
$!!"
$#!"
%!!"
%#!"
!&!!" $&!!" %&!!" '&!!" (&!!" #&!!" )&!!" *&!!" +&!!" ,&!!" $!&!!" $$&!!" $%&!!" $'&!!" $(&!!" $#&!!" $)&!!" $*&!!" $+&!!" $,&!!" %!&!!" %$&!!" %%&!!" %'&!!"
!"#$%&'(
)*&
+",%&
-"./&0,%1$&2342&5&(.6&7"7,8.9":&;%"#<=&%.<$&&-./012"3421015678"9.71:677"6:5;<"=>.76?>0@78"=4AA6B"A1007""

SUPPORT FOR THE ELABORATION OF THE MASTER PLAN FOR THE JIGAWA STATE ELECTRIFICATION
ENGR. MANUEL VILLAVICENCIO
Figure 21. Range of load estimations by 2020.
4.2. Local energy resources and facilities characterization
4.2.1. Electricity distribution grid: status and accessibility
Figure 22 shows a view of the transportation and distribution electricity lines (T&D) of Jigawa State with over a background of red dots representing the physical location of principal settlements (RGC). Purple dots represent connected nodes while orange dots are the next nodes to be connected. Black lines are 132 KV electricity transportation lines, while grey lines are 33 kV distribution lines. The green, orange and grey transparent areas surrounding the T&D lines represent the catchment area of 10 km, 15 km and 20 km respectively. This map was created from the GIS library developed for the project, it allows having an accurate view of the status of the electrification projects, it can be used as a tool for the project development decision making and it follows up in time.
!"
#!"
$!!"
$#!"
%!!"
%#!"
!&!!" $&!!" %&!!" '&!!" (&!!" #&!!" )&!!" *&!!" +&!!" ,&!!" $!&!!" $$&!!" $%&!!" $'&!!" $(&!!" $#&!!" $)&!!" $*&!!" $+&!!" $,&!!" %!&!!" %$&!!" %%&!!" %'&!!"
!"#$%&'(
)*&
+",%&
-"./&0,%1$&2323&4&(56&7"7,8.9"6&:%"#;<&%.;$&-./012"3421015678"9.71:677"6:5;<"=>.76?>0@78"=4AA6B"A1007""
!"
#!"
$!!"
$#!"
%!!"
%#!"
&!!"
!'!!" $'!!" %'!!" &'!!" ('!!" #'!!" )'!!" *'!!" +'!!" ,'!!" $!'!!" $$'!!" $%'!!" $&'!!" $('!!" $#'!!" $)'!!" $*'!!" $+'!!" $,'!!" %!'!!" %$'!!" %%'!!" %&'!!"
!"#$%&'(
)*&
+",%&
-"./&0,%1$&2323&4&(.5&6"6,7.8"9&:%"#;<&%.;$&&-./012"3421015678"9.71:677"6:5;<"=>.76?>0@78"=4AA6B"A1007""

SUPPORT FOR THE ELABORATION OF THE MASTER PLAN FOR THE JIGAWA STATE ELECTRIFICATION
ENGR. MANUEL VILLAVICENCIO
Figure 22. Influence area of the electricity grid. Self elaboration
4.2.2. Wind potential
Wind data was collected from different databases. The values obtained by NASA at 10m from the surface are presented in Table 11. This data presents global simulations of wind speed made by NASA, dividing the world surface in a one degree grid, and simulated based on international meteorological information. Although the precision of the resulting these grid is just enough to roughly estimate the wind potential of the state, looking at the annual average wind speed it can be concluded that the State has a very low wind potential.
Lat Long Jan Feb Mar April May June July Aug Sept Oct Nov Dec Annual AVG 11 8 3.38 3.28 3.63 3.68 3.52 2.99 2.83 2.67 2.44 2.66 3.13 3.55 3.15 11 9 3.61 3.51 3.87 3.96 3.72 3.13 2.95 2.78 2.55 2.83 3.33 3.81 3.34 11 10 3.78 3.68 4.06 4.17 3.88 3.25 3.05 2.88 2.65 2.95 3.49 3.97 3.48 11 11 3.89 3.80 4.19 4.32 3.99 3.33 3.12 2.95 2.72 3.04 3.58 4.06 3.58
Lat Long Jan Feb Mar April May June July Aug Sept Oct Nov Dec Annual AVG 12 8 3.71 3.62 3.87 3.89 3.70 3.22 3.03 2.82 2.58 2.87 3.39 3.87 3.38 12 9 3.99 3.90 4.06 4.03 3.81 3.39 3.22 2.96 2.74 3.06 3.59 4.08 3.57 12 10 4.17 4.10 4.21 4.17 3.90 3.51 3.33 3.07 2.86 3.20 3.71 4.21 3.70 12 11 4.26 4.20 4.33 4.31 3.99 3.56 3.40 3.14 2.93 3.28 3.77 4.26 3.79
Lat Long Jan Feb Mar April May June July Aug Sept Oct Nov Dec Annual AVG 13 8 3.99 3.93 3.98 3.89 3.71 3.44 3.28 3.00 2.76 3.07 3.57 4.04 3.56 13 9 4.57 4.53 4.25 4.00 3.81 3.79 3.65 3.28 3.08 3.44 3.90 4.37 3.89 13 10 4.87 4.86 4.43 4.09 3.89 3.97 3.86 3.43 3.27 3.64 4.06 4.53 4.08 13 11 4.91 4.93 4.52 4.17 3.92 3.97 3.89 3.47 3.33 3.70 4.04 4.52 4.11 Table 11. Monthly Averaged Wind Speed At 10 m Above The Surface Of The Earth For Terrain Similar To Airports (m/s).
Source: NASA database.

SUPPORT FOR THE ELABORATION OF THE MASTER PLAN FOR THE JIGAWA STATE ELECTRIFICATION
ENGR. MANUEL VILLAVICENCIO
Nevertheless, it can be expected to find a low to medium wind class in the north-‐east region of the State, but, detailed local information needs to be collected. Also, wind data at 50m shape files were obtained from NASA database, which allows to corroborate similar conclusions.
Local datasets were collected from on site metrological stations in Gumel and
Birnin-‐Kudu LGA. The data covered only four year of meteorological measures. Due to the low wind speed observed, no wind potential was confirmed for non of the villages. Generally, the wind potential of the region appear to be modest, this impression was also confirmed during the fieldwork, for this reason, at this time of the project, the wind resource was discarded for electricity production purposes. Nevertheless, as commented above, it can be possible to find specific locations with interesting potential for small wind turbines for embedded generation or for water pumping.
4.2.3. Solar potential
Solar maps and temperature data were collected from the JRC-‐renewable energy unit, NASA and local metrological stations databases. Figure 23 shows the solar potential overview for the country, it can be seen that solar irradiation strongly increases with latitude, which allows to divide the country in tree regions. In the northern stripe of the country, solar irradiation varies from 5.5 -‐6.5 kWh/m2 and there is also an slightly increase of irradiation with longitude. The tile were Jigawa State is located (see Figure 23) presents a global horizontal irradiation between 6 -‐ 6.5 kWh/m2.
Figure 23. Yearly average of daily sums of horizontal irradiation for Nigeria. Jigawa State tile (HelioClim-1/PVGIS data 1985-2004). Source: PVGIS. (http://re.jrc.ec.europa.eu/pvgis/)
11ºN 8E
13ºN 11E

SUPPORT FOR THE ELABORATION OF THE MASTER PLAN FOR THE JIGAWA STATE ELECTRIFICATION
ENGR. MANUEL VILLAVICENCIO
The helioclim-‐1 database presents both, the annual horizontal irradiation and the annual irradiation over an optimally inclined plane for a place in the centroid of the state, resulting on 5.85 kWh/m2 and 5.99 kWh/m2 respectively. The average insolation data from NASA confirms the previously presented.
Table 12 presents the yearly distribution of the insolation for the tile, the monthly
average daily horizontal insolation reach a maximum value in April (up to 7.19 kWh/m2) and a minimum value usually in December (5.23 kWh/m2), with an average delta of 1.7 kWh/m2 within the year.
Lat Long Jan Feb Mar April May June July Aug Sept Oct Nov Dec Annual AVG 11 8 5.55 6.29 6.65 6.69 6.37 5.93 5.45 5.16 5.53 5.77 5.65 5.35 5.87 11 9 5.55 6.27 6.61 6.67 6.42 6.02 5.57 5.30 5.62 5.85 5.65 5.25 5.90 11 10 5.61 6.32 6.75 6.78 6.59 6.26 5.63 5.33 5.69 5.88 5.67 5.32 5.99 11 11 5.63 6.34 6.72 6.78 6.53 6.24 5.58 5.27 5.68 5.86 5.62 5.30 5.96
Lat Long Jan Feb Mar April May June July Aug Sept Oct Nov Dec Annual AVG 12 8 5.49 6.33 6.79 6.96 6.76 6.42 5.81 5.41 5.67 5.90 5.72 5.27 6.04 12 9 5.55 6.41 6.83 7.02 6.89 6.63 6.02 5.64 5.84 6.03 5.78 5.28 6.16 12 10 5.53 6.34 6.77 6.97 6.82 6.62 6.00 5.58 5.86 5.97 5.70 5.24 6.12 12 11 5.59 6.41 6.83 6.98 6.72 6.53 6.00 5.57 5.78 5.89 5.70 5.27 6.11
Lat Long Jan Feb Mar April May June July Aug Sept Oct Nov Dec Annual AVG 13 8 5.64 6.52 7.01 7.28 7.15 7.00 6.47 6.01 6.19 6.24 5.93 5.30 6.40 13 9 5.62 6.48 6.98 7.24 7.11 6.92 6.43 6.04 6.17 6.25 5.91 5.30 6.37 13 10 5.51 6.40 6.89 7.17 7.01 6.83 6.38 5.96 6.01 6.10 5.80 5.23 6.27 13 11 5.64 6.52 6.96 7.19 7.04 6.80 6.40 6.03 6.14 6.23 5.87 5.36 6.35
Table 12 Monthly Averaged Insolation Incident On A Horizontal Surface (kWh/m2/day). Source: NASA database. Other relevant information concerning the evaluation of the solar potential was also
collected and can be summarized with the following assertions: the yearly average of the clear sky horizontal insolation for the region is 6.78 kWh/m2/day, the yearly average of clear sky days is 93 days, and the surface albedo yearly varies from 0.23 to 0.30 in the southern region of the State and from 0.31 to 0.38 in the northern region (detailed information is presented annex II).
4.2.4. Biomass potential
It is know that the utilization of biomass for energy generation purposes is a
controverted issue on sustainability debate, because of multiple factors all of them conducing to an intensive exploitation of earth and forests without regards to their secondary effects on environment, health and food security, in the long term.
Considering this issues, the biomass potential considered in this section only takes
into account the residual amount of products from agriculture. The purpose of the following analysis is to quantify the added value of agroforestry and animal husbandry wastes available to be used for energy generation within the State. In this sense, what is important to assess is the total flow of residues available by year, its trend and its periodicity.

SUPPORT FOR THE ELABORATION OF THE MASTER PLAN FOR THE JIGAWA STATE ELECTRIFICATION
ENGR. MANUEL VILLAVICENCIO
The historic data of the total sown area for Jigawa State was collected from the country statistic department (Figure 24). All the crops presented are mainly cultivated during the rainy season. The agriculture activity of the state has reached a certain level of stability from 2001, with only a light tendency of increasing millet crops at expense of sorghum ones in 2006.
Figure 24. Cultivated area of Jigawa State by crop type. Self elaboration. Source: historical data from
the National Bureau of Statistics of Nigeria, 2011.
Concerning to the plantation yield, the International Institute of Tropical
Agriculture (IITA), in accordance with the National Program for Food Security, has presented a specific manual of training to enhance productivity in the sector directly addressed to the Northern States of Nigeria. In other study of the ITAA (Kamara, 2008), it is presented a complete assessment of the biophysical constrains is presented for crops located on Sahel and Sudan Savannas agro-‐ecological zones, proposing solutions to them and presenting the impact on beneficiaries farms of the research activities, the increases of crop yields are presented in Table 13, from which it can be seen that the productivity of the sector can be significantly expanded with the proper technology and good practices dissemination. Using these crop yields, the reported crop area for 2006, the residue to product ratios (RPR) and the moisture contents presented in the literature (see annex II, Table 41), the crop and residues production where estimated. Based on this maximum value calculated, assumptions a availability an minimum monthly biomass supply can be done.
0
500
1000
1500
2000
2500
1995 1996 1997 1998 1999 2000 2001 2002 2003 2004 2005 2006
(1000 x Ha)
Jigawa State sown area Melon Rice Maize Beans Groundnut Sorghum Millet

SUPPORT FOR THE ELABORATION OF THE MASTER PLAN FOR THE JIGAWA STATE ELECTRIFICATION
ENGR. MANUEL VILLAVICENCIO
Lead farmer crop yields [ton/Ha] Crop Baseline 2005 2006 2007 2008 Maize 1 1.4 3 3.2 3.2 Rice 2.6 - 3.3 3 3.2 Sorghum 1 2 2.2 1.5 2.6 Cowpeas 0.4 0.6 1.3 0.8 1.4 Groundnuts 1 1 1.9 1.7 1.9 Millet 1.2 - - - -
Table 13. Yield crop obtained increases. Source: (Ajeigbe, 2009)
Estimated crop production [ton] Crop Baseline 2005 2006 2007 2008 Maize 6000 8400 18000 19200 19200 Rice 57200 - 72600 66000 70400 Sorghum 167000 334000 367400 250500 434200 Cowpeas 71200 106800 231400 142400 249200 Groundnuts 42000 42000 79800 71400 79800 Millet 416400 416400 416400 416400 416400
Dry residues production [ton] Crop Residue type 2005 2006 2007 2008 Maize Wastes 45360 97200 103680 103680 Rice Wastes - 111078 100980 107712 Sorghum Wastes 709750 780725 532312.5 922675 Cowpeas Straw 278748 603954 371664 650412 Groundnuts Shell 9660 18354 16422 18354 Millet Straw, Bran 707880 707880 707880 707880 Total agroforestry residues 1751398 2319191 1832939 2510713
Table 14. Crop and residues production.
The energy potential from animal manure was grossly estimated by using the statistics of the livestock report of 2006 of the JARDA, the dung yield of different species reported in literature (see annex II, Table 42) and making conservative assumptions on the average liveweight for each type of specie. Even though, real availability is expected to be quite under this maximum because of difficulties concerning to the animal husbandry practices on the State, mainly nomad rearing.
Species
JARDA 2006
[heads]
Average estimated liveweight for Jigawa
State animals [kg]
Dung yield expected [ton/day]
Moisture content
Potential energy from dung
[TJ/year]
Cattle 1.1E+06 268 14740 70% 28246
Buffalo - 356 - - -
Pigs 4.2E+06 39 3276 70% 5740
Sheep/goats 4.1E+06 44 5412 50% 14815
Chickens - 2 - - - Table 15. Manure to energy potential.

SUPPORT FOR THE ELABORATION OF THE MASTER PLAN FOR THE JIGAWA STATE ELECTRIFICATION
ENGR. MANUEL VILLAVICENCIO
4.2.5. Biofuels: Biodiesel from Jatropha Curca
Biofuel harvesting has been promoted since 2006 by the federal and regional
development plans (NEEDS and J-‐SEEDS). Although Jigawa State started a sugar cane/ethanol projects in 2006 with no high success, the first biodiesel project was initiated in 2010 with positive expectations about the Jatropha Curca program in Jarda Kaginwa. The pilot project consisted on four blocks of 50 Ha of Jatropha plantations comparing harvest yields of mono-‐cropping with sesame, bean and watermelon inter-‐cropping modalities. The Secretary of the Technical Committee of the project summarized the mission as follows: “The aim of the project is: To promote Jatropha Curca plant in the state as a source of raw materials for bio diesel production from the seed; to serve as climate change adaptation program; to reclaim the degraded forest reserve to better use, through Agro forestry practices by inter planting water melon, beans, sesame with Jatropha” (Blanco, 2011).
The Yarda Kangiwa pilot project was visited during the fieldwork in August 2011 and a 1st visit report has been prepared and estimations about its real potential and implications are assessed. On this report Blanco A. explains that given the high reliance of Jigawa State on externally supplied oil products, the Jatropha Curca project is envisaged to meet the domestic needs of the state but it contemplates an ambitious expansion plan driven by the low cost biodiesel requirements for electricity production on diesel generators more than enhancing local food plantation.
“The recent interest (2010) of the State in bio-‐diesel local production from Jatropha Curca was understood as an attempt to self-‐provide the domestic electricity demand. In this way, the rural electricity development as it is understood by the counterpart Mr. Nakore (REB) is focused on this energy crop as the potential substitute of the Diesel in the IPPs of Dutse and Kazaure” (Blanco, 2011).
Even though no report of the pilot plantation has been produced yet, the assessment
of its potential consisted on studying the development of the harvest and the evolution of its yield over time, in order to contrast them with the existing data with the literature of reference. The empirical data of the Jarda Kangiwa plantation was compared with the available results of Filipinas and India projects due to the similarities on their conditions.
Results obtained by Blanco A. (2011) are presented on Table 16. The low yield of the first harvest and the slow growth trend of the plants of the Jarda Kangiwa plantations in comparison with others experiences outcomes with a very small steady state yield, expected from the 5th harvest, of only 59 kg/Ha. This expected yield represents around 14 kg/Ha of dried seeds and assuming a transesterification reaction efficiency of 80%, and assuming an average biodiesel density of 0.9 g/cm3, results on a final yield of 12 L/Ha.

SUPPORT FOR THE ELABORATION OF THE MASTER PLAN FOR THE JIGAWA STATE ELECTRIFICATION
ENGR. MANUEL VILLAVICENCIO
Table 16. Assessment of the potential of the Jarda Kangiwa Jatropha Curca program.
Nevertheless, the technical committee of the Jatropha Curca program (PRIME, Global Environmental Services LTD) still expects important improvement of this yields, considering the India (Case 44) as the maximum possible scenario for Jarda Kangiwa, which means an enhancement of 32.5 times the current assessed yield.
The accuracy of the possible contribution of biodiesel from Jatropha Curca
plantations is still uncertain. The ongoing biodiesel plantations are still in a developing stage and is difficult to assess with precision the potential biodiesel availability.
4.3. Power supply optimization analysis
The computational tool considered for the optimization analysis was the software HOMER V2.68 beta (2009), developed by the Alliance for Sustainable Energy System with the U.S. Department of Energy (DOE).
4.3.1. Simulation methodology General inputs Concerning to the economical inputs, it was considered an interest rate of 7.85% with a sensitivity values of 9% and 15% in order to deal with the incertitude introduced with project lifetime of 20 years. Technical constraints include a maximum annual capacity shortage of 15% with an operating reserve of 10% of the hourly load. The operating reserve was set to 25% of the solar power output. The biomass availability was supposed to be constant for all the months and was assumed to be 0.5% of total estimated (see Table 14), giving a daily maximum availability of 137 ton/d with a cost of 70$/ton. The simulation was set to a demand following dispatch strategy with a time step of 60 minutes on a year base calculation for the entire lifetime of the projects. More detailed information is presented in Annex III.
Special attention has been given to the fuel cost calculation for the diesel/biodiesel blend considered in both time horizon. In accordance with the Jatropha Curcas plantation, the biodiesel expected yield of 14700 L/yr up to 250000 L/yr, and it’s expected to present
1st harvest (2011)Deviation Ratio
from Filipina Case (Wet Climate)
Estimated Production (5th harvest)1
[kg/Ha] [-‐] [kg/Ha]
Pilot Site 10 0.0059 59
Pilot Site Potential (India, Case 44) 325 0.1914 1914Wet Climate Case (Filipinas) 1700 1
(1)-‐ Once aged 5, the plant is fully developed and productivity stabilize if external conditions are maintained
(2) Filipina Case, Prof. Carlos Gracia (UB, Ecology Department)
Production Estimation (5th Harvest)

SUPPORT FOR THE ELABORATION OF THE MASTER PLAN FOR THE JIGAWA STATE ELECTRIFICATION
ENGR. MANUEL VILLAVICENCIO a regulated retail price between 0.60-‐0.65 $/L, which represent a broad range of uncertainty. Once this speculative input considered, the systems cost calculation becomes a two step iteration process in which at the first step the blend cost is assumed to be equal to the diesel cost and the total volumes of fuel required are calculated (HOMER output). Using this input and the biodiesel yield average range it is possible to calculate the biodiesel fraction of the blend and adapt the blend costs, which are the corrected HOMER inputs on the second run. The iteration process ends with the verification of the equality of the total fuel consumption of each step.
ID #
Total fuel required (lt/yr)
Min supply (lt/yr)
Max supply (lt/yr)
Min ratio %
Max ratio %
Blend Cost ($/lt)
Blend Cost ($/lt) Avg
Blend Cost ($/lt)
Blend cost ($/lt) Avg
1 3.31E+07 14700 2.50E+05 0.65 0.60 0.04 0.75 0.76995 0.76992 0.76994 0.76913
5 3.49E+07 14700 2.50E+05 0.65 0.60 0.04 0.72 0.76995 0.76993 0.76994 0.76917
11 1.23E+08 14700 2.50E+05 0.65 0.60 0.01 0.20 0.76999 0.76998 0.76998 0.76977
15 1.34E+08 14700 2.50E+05 0.65 0.60 0.01 0.19 0.76999 0.76998 0.76998 0.76978 Table 17. Blend cost calculations
Simulated Power Loads
According with the J-‐SEEDS power development targets, the load curves for the simulation were generated based on the aggregated power demand estimations (see section 4.1.3) considering the factors of 10% and 50% of self generation by 2012 and 2020 respectively (see Figure 20 and Figure 21), which represents the fractions of the total power demand to be generated within the state. For both time horizons, yearly load curves were synthetically generated from two types of daily load curves (weekday and weekend type) and two coefficients of randomness (noise) were assumed to simulate hourly and daily deviation across the year. Daily noise was considered to be 10% meanwhile hourly noise was assumed to be 5%.
Figure 25 and Figure 26 show the range of values obtained in accordance with the
two drivers considered on the demand estimations (population and economical growth) for both time horizons used as inputs in the optimization. Difference between weekdays and weekend loads comes from the assumption of only a fraction (20%) of hammer mills (HM) load type is going to be working during weekends.

SUPPORT FOR THE ELABORATION OF THE MASTER PLAN FOR THE JIGAWA STATE ELECTRIFICATION
ENGR. MANUEL VILLAVICENCIO
Figure 25. Daily load curve types for 2012.
The power demand range was modeled on a sensitivity approach in which a
baseline a scaled curve were used to draw the corresponding minimum and maximum population growth scenarios respectively on each time horizon, maintaining the same pattern of the load curves, randomness coefficients and load factor, resulting on an annual average between 66,289 and 63,116 kWh/d by 2012 and between 86,339 and 76,006 kWh/d by 2020 (detailed information on Annex III).
Figure 26. Daily load curve types for 2020.
!"
#"
$"
%"
&"
'!"
'#"
'$"
'%"
'&"
#!"
!" '" #" (" $" )" %" *" &" +" '!" ''" '#" '(" '$" ')" '%" '*" '&" '+" #!" #'" ##" #("
!"#
$%&'()(*#(+(,)&-,-).#/011+.#2342# #!'#",--./012"304/"
#!'#",--.-4/"304/"
!"
#!"
$!"
%!"
&!"
'!!"
'#!"
'$!"
!" '" #" (" $" )" %" *" &" +" '!" ''" '#" '(" '$" ')" '%" '*" '&" '+" #!" #'" ##" #("
!"#
$%&'()(*#(+(,)&-,-).#/011+.#2323# #!#!",--./012"304/"
#!#!",--.-4/"304/"
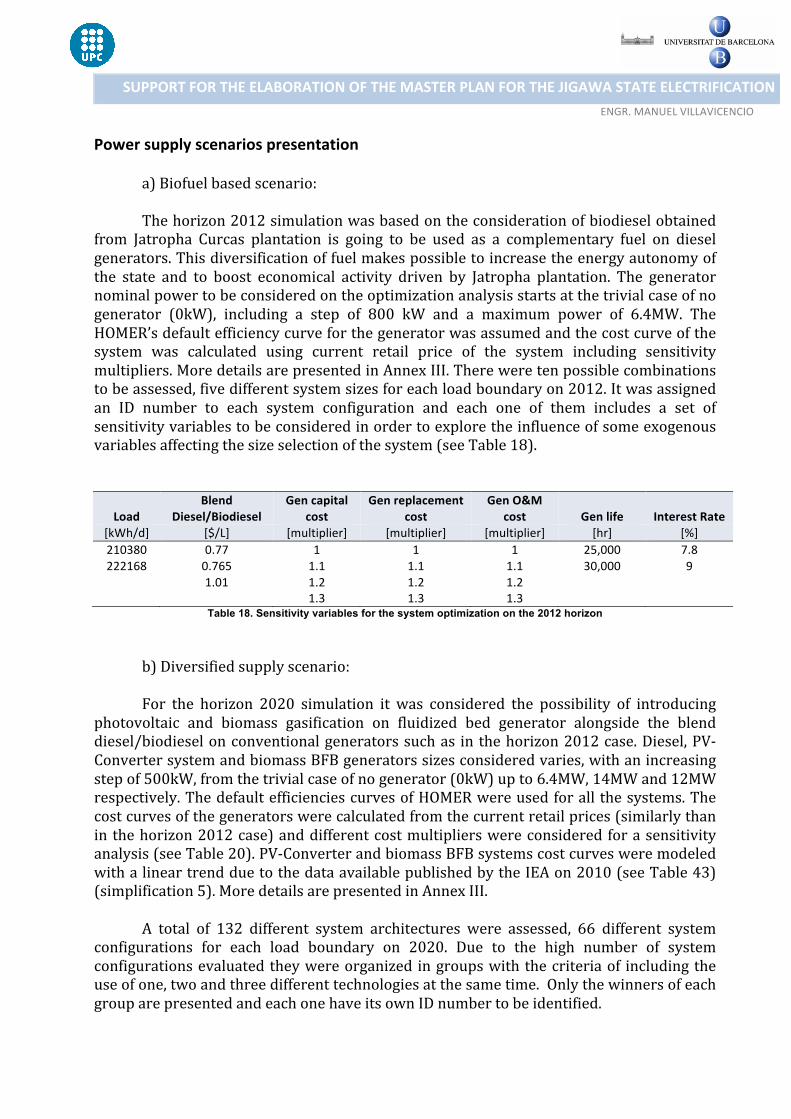
SUPPORT FOR THE ELABORATION OF THE MASTER PLAN FOR THE JIGAWA STATE ELECTRIFICATION
ENGR. MANUEL VILLAVICENCIO
Power supply scenarios presentation
a) Biofuel based scenario: The horizon 2012 simulation was based on the consideration of biodiesel obtained
from Jatropha Curcas plantation is going to be used as a complementary fuel on diesel generators. This diversification of fuel makes possible to increase the energy autonomy of the state and to boost economical activity driven by Jatropha plantation. The generator nominal power to be considered on the optimization analysis starts at the trivial case of no generator (0kW), including a step of 800 kW and a maximum power of 6.4MW. The HOMER’s default efficiency curve for the generator was assumed and the cost curve of the system was calculated using current retail price of the system including sensitivity multipliers. More details are presented in Annex III. There were ten possible combinations to be assessed, five different system sizes for each load boundary on 2012. It was assigned an ID number to each system configuration and each one of them includes a set of sensitivity variables to be considered in order to explore the influence of some exogenous variables affecting the size selection of the system (see Table 18).
Load Blend
Diesel/Biodiesel Gen capital
cost Gen replacement
cost Gen O&M
cost Gen life Interest Rate [kWh/d] [$/L] [multiplier] [multiplier] [multiplier] [hr] [%] 210380 0.77 1 1 1 25,000 7.8 222168 0.765 1.1 1.1 1.1 30,000 9
1.01 1.2 1.2 1.2
1.3 1.3 1.3 Table 18. Sensitivity variables for the system optimization on the 2012 horizon
b) Diversified supply scenario:
For the horizon 2020 simulation it was considered the possibility of introducing photovoltaic and biomass gasification on fluidized bed generator alongside the blend diesel/biodiesel on conventional generators such as in the horizon 2012 case. Diesel, PV-‐Converter system and biomass BFB generators sizes considered varies, with an increasing step of 500kW, from the trivial case of no generator (0kW) up to 6.4MW, 14MW and 12MW respectively. The default efficiencies curves of HOMER were used for all the systems. The cost curves of the generators were calculated from the current retail prices (similarly than in the horizon 2012 case) and different cost multipliers were considered for a sensitivity analysis (see Table 20). PV-‐Converter and biomass BFB systems cost curves were modeled with a linear trend due to the data available published by the IEA on 2010 (see Table 43) (simplification 5). More details are presented in Annex III.
A total of 132 different system architectures were assessed, 66 different system
configurations for each load boundary on 2020. Due to the high number of system configurations evaluated they were organized in groups with the criteria of including the use of one, two and three different technologies at the same time. Only the winners of each group are presented and each one have its own ID number to be identified.

SUPPORT FOR THE ELABORATION OF THE MASTER PLAN FOR THE JIGAWA STATE ELECTRIFICATION
ENGR. MANUEL VILLAVICENCIO
Load Blend Diesel/Biodiesel Interest Rate Gen life PV life Biomass BFB life [kWh/d] [$/L] [%] [hr] [yr] [hr] 86,339.00 0.77 7.8 25,000 20 30,000 76,006.00 0.762 9 30,000
1.01 15 4
Table 19. Sensitivity variables for the system optimization on the 2020 horizon
Generator Capital cost [multiplier] 1 1.1 1.2
Replacement cost [multiplier] 1 1.1 1.2
O&M cost [multiplier] 1 1.3 1.6 PV Capital cost [multiplier] 1 1.1 1.2
Replacement cost [multiplier] 1 1.2 1.3
O&M cost [multiplier] 1 1.3 1.6 Biomass BFB Capital cost [multiplier] 1 1.2 1.4
Replacement cost [multiplier] 1 1.2 1.4
O&M cost [multiplier] 1 1.3 1.6 Table 20. Sensitivity multipliers for the system optimization on the 2020 horizon.
4.3.2. Simulation results and discussion Biofuel based strategy (horizon 2012)
On this scenario, due to the consideration of only one type of generation technology, the optimization process becomes an iterating sizing program for each load boundary along side with its influence on the total blend fuel consumption. The blend cost was adjusted to exactly fit with the overall winners configurations (ID 1 and ID 5 systems architectures). For both loads, the results are presented in Table 21. System configurations are ordered by calculated Net Present Cost (NPC). The overall winner capacity for both the baseline and the scaled load, are the 10MW and the 10.5MW respectively. Resulting on a Total capital cost of $11.4 MM, a NPC between $281.7 -‐ $296.3 MM and a levelized cost of electricity (LCOE) around 0.408 $/kWh.
Average load
Gen size
Total NPC
Total Capital Cost
Total Ann. Cost
Operating Cost COE
Gen Production
Unmet Load Frac.
Blend Diesel/BioDiesel
kWh/d # MW $ $ $/yr $/yr $/kWh GWh/yr L/yr 210380 1 10.0 281.7E+6 11.4E+6 28.4E+6 27.2E+6 0.408 69,523,056 0.09 33,148,764 210380 2 10.5 291.3E+6 11.9E+6 29.3E+6 28.1E+6 0.415 70,648,808 0.08 34,219,284 210380 3 11.0 300.5E+6 12.5E+6 30.3E+6 29.0E+6 0.423 71,575,592 0.07 35,238,668 210380 4 11.5 309.4E+6 13.0E+6 31.2E+6 29.8E+6 0.431 72,339,128 0.06 36,217,508 222168 5 10.5 296.3E+6 11.9E+6 29.8E+6 28.6E+6 0.407 73,268,056 0.10 34,874,492 222168 6 11.0 305.9E+6 12.5E+6 30.8E+6 29.6E+6 0.414 74,425,008 0.08 35,950,944 222168 7 11.5 315.2E+6 13.0E+6 31.7E+6 30.4E+6 0.421 75,386,544 0.07 36,979,116
Table 21. Optimization results for Horizon 2012 (fixed interest rate of 7.8%)

SUPPORT FOR THE ELABORATION OF THE MASTER PLAN FOR THE JIGAWA STATE ELECTRIFICATION
ENGR. MANUEL VILLAVICENCIO
Table 22 shows the NPC cost type distribution for the winners configurations. It is important to highlight that the fuel cost represents 90% of the total NPC of the project. This fact is extremely important due to the issues concerning fuel prices volatility risk and energy security.
ID Capital Replacement O&M Fuel Salvage Total
# ($) ($) ($) ($) ($)
1 11.37E+6 4.26E+6 12.72E+6 253.43E+6 -‐61.23E+3 281.72E+6
5 11.93E+6 4.48E+6 13.36E+6 266.62E+6 -‐64.32E+3 296.32E+6 Table 22. Winner system results: 3.2MW for Horizon 2012 (interest rate 7.8%).
The technical results concerning the two winner systems on this scenario are
presented in Table 23. In both systems configurations the set of generators is expected to be working the hole year (non-‐stop) with a mean electrical efficiency around 21%, a capacity factor of 79.7% resulting on an annual fuel consumption between 33.1 – 34.9 MM L/yr and a lifespan of 2.85 yr, being necessary 6 replacements of the system during the lifetime of the project., if proper maintenance is conducted during the project operation. If the lifespan of the generators are expanded up to 3.42 yr (30000 hr), it would represent a benefit of reducing NPC to a range of 13% the total capital investment which represents around $1 MM of savings.
Quantity ID 1 ID 5
Fuel consumption (L/yr) 33,148,764 34,874,492
Specific fuel consumption (L/kWh) 0.477 0.476
Fuel energy input (kWh/yr) 326,183,872 343,165,024
Mean electrical efficiency (%) 21.3 21.4
Electrical production (kWh/yr) 69,523,056 73,268,056
Mean electrical output (kW) 7,936 8,364
Min. electrical output (kW) 3,165 3,343
Max. electrical output (kW) 10,000 10,500
Table 23. Technical information
!"# $"#%"#
&'"#
!"#$%&'()#$'*+#$,+-./)0'()*+,)-# ./*-)0/1/2,# 345# 67/-#

SUPPORT FOR THE ELABORATION OF THE MASTER PLAN FOR THE JIGAWA STATE ELECTRIFICATION
ENGR. MANUEL VILLAVICENCIO
ID 1 ID 5
Emissions (kg/yr)
Carbon dioxide 87,291,608 91,836,016
Carbon monoxide 215,467 226,684
Unburned hydrocarbons 23,867 25,110
Particulate matter 16,243 17,089
Sulfur dioxide 175,297 184,423
Nitrogen oxides 1,922,628 2,022,721 Table 24. Generated pollution
In order to quantify the influence of the macroeconomic variables on the results, a
series of sensitivity analysis were carried out. Figure 27and Figure 28 present the sensitivity analysis of the primary load range, the cost multiplier factors (capital, replacement and O&M increasing simultaneously) and the fuel cost over the NPC and the LCOE calculations, considering a constant interest rate of 7.85%.
Figure 27. Sensitivity analysis: NPC - Fuel cost Vs. Primary load (interest rate 7.85%, horizon 2012)
The previous figure confirms the high influence of the fuel cost over the NPC of the
project. Constants NPC lines are almost horizontal on the interval of electricity loads considered and the higher LCOE are placed on the top of the graph. For a constant fuel cost, LCOE increases slightly from the minimum to the maximum load. All the above means that electricity supply variations have very little influence over the financial results of this scenario, meanwhile, for a fuel cost of 1 $/L (30% of increment over the base scenario) the NPC reach $350 MM and the LCOE can get up to 0.53 $/kWh, which represent around 40% and 28% of increments respectively. From this analysis, it can be found that at least 80% of

SUPPORT FOR THE ELABORATION OF THE MASTER PLAN FOR THE JIGAWA STATE ELECTRIFICATION
ENGR. MANUEL VILLAVICENCIO the fuel price rise is reflected directly over the NPC no matter the load supplied inside the interval considered, which implies that the uncertainties concerning the load estimations are not as significant as that of the fuel price volatility over the NPC and the LCOE.
On the model, the fuel has been calculated using the regulated price of diesel (0.77
$/L) and the expected price of biodiesel joined with its expected production yield of the Yarda Kangiwa project. The uncertainties coming from biodiesel expectations can be assessed by building a best case assuming maximum biodiesel fraction (4.6% V/V of biodiesel or B5) with a minimum biodiesel cost, against a worst case of only diesel blend usage (0% of biodiesel). On the best case (see Table 18), blend cost has a minimum cost of 0.768 $/L. On this ideal case, the NPC and the LCOE of the project is placed between MM 250 -‐ 275 $ and 0.408 -‐ 0.407 $/kWh respectively. The maximum cost of fuel correspond to the black market diesel price of 1.2$/L, which is a common market when fuel availability is constraint, resulting on an NPC and LCOE between $ 425 – 450 MM and 0.618 -‐ 0.617 $/kWh respectively. Even though, there could be considered an even worst case in which diesel is not longer regulated diesel and reach international prices.
Figure 28. Sensitivity analysis: Fuel cost Vs. Cost multiplier (interest rate 7.85%, horizon 2012)
Similarly, Figure 28 shows the influence of the variations of equipment costs (CAPEX and OPEX) over the NPC and the LCOE. Due to the same system architecture, both load boundaries share the same trend but there is a level shift between them coming from the loads differences. Once again, the influence of fuel cost over the NPC is higher than that of the multiplier, nevertheless, for an increment of 15% of the multiplier the NPC increases around $1.5 MM and the LCOE increases around 0.08 $/kWh no matter the cost of the fuel. By this analysis, uncertainties on CAPEX and OPEX can affect moderately the results.

SUPPORT FOR THE ELABORATION OF THE MASTER PLAN FOR THE JIGAWA STATE ELECTRIFICATION
ENGR. MANUEL VILLAVICENCIO
Diversified supply strategy (horizon 2020)
In this strategy, the optimization program has been more complex due to the higher number of possible system combinations. The program consisted on calculating all the outputs of the 4608 combinations (generator sizes including the sensitivity variables) and classifying them in groups by the technology type considered. For each group, the system configurations were classified by ascendant net present cost (NPC) and are the results are presented in Table 25. On each case, the fuel consumption was also fitted to the winner system to compute correctly the blend cost (see General inputs).
The configuration ID 11 and ID 15 show the overall winner configurations for the
two load boundaries by 2020, both resulting on diversified supply scenarios and under the assumption of fuel price and biomass maximum availability of 0.77$/L et 150 t/d respectively, the two systems share the same architecture. Both systems present a total power capacity of 290 MW with a share of 69% on PV systems, 21% on diesel generators 10% on gasification systems. This result implies that, under this assumptions, the uncertainties of the power demand estimations may not affect the optimization result of the best system’s architecture.
Load ID PV Gen BBFB Total NPC
Total Capital Cost
Total Ann. Cost
Operating Cost COE
kWh/d # MW MW MW $ $ $/yr $/yr $/kWh 1266775 11 200 60 30 1.7E+9 504.0E+6 171.6E+6 120.8E+6 0.396 1266775 12 200 60 0 1.8E+9 465.8E+6 177.3E+6 130.3E+6 0.414 1266775 13 0 60 0 1.9E+9 66.5E+6 193.8E+6 187.1E+6 0.464 1266775 14 0 60 75 2.0E+9 141.3E+6 196.6E+6 182.3E+6 0.468 1446770 15 200 60 30 1.8E+9 504.0E+6 181.4E+6 130.6E+6 0.377 1446770 16 220 60 0 1.9E+9 505.8E+6 186.6E+6 135.6E+6 0.392 1446770 17 0 80 0 2.5E+9 88.6E+6 247.2E+6 238.3E+6 0.495 1446770 18 0 80 75 2.5E+9 163.4E+6 249.7E+6 233.3E+6 0.499
Table 25. Optimization categorized results for Horizon 2020 – economical outputs (fixed interest rate of 7.85%, Biomass max availability 150 t/d, fuel price 0.77 $/L)
The economical results of the optimal systems (ID 11 an 15) give the range of the total investment required in order to optimally accomplish electrification objectives by 2020. The NPC range is placed around $ 1.7 – 1.8 BB and a LCOE between 0.377 – 0.396 $/kWh. Considering a combination of fuel generators together with only one renewable energy source, in accordance with the minimum NPC criteria, the best choice results from the installation of 60 MW capacity of fuel generators and 200 MW of PV systems, which result on a NPC and LCOE ranges of $ 1.8 -‐ 1.9 BB and 0.392 – 0.414 $/kWh respectively, values that are very closer to the overall winners due to the strong restriction on biomass availability assumed which result in a small contribution of BBFB systems in the total power generation.
The alternative combination of fuel generators and BBFB systems (systems ID 14 and 18), have a similar operating cost than that of the only generators cases (systems 13 and 17 ), but this is quite more intensive in capital cost, resulting on higher NPC and LCOE

SUPPORT FOR THE ELABORATION OF THE MASTER PLAN FOR THE JIGAWA STATE ELECTRIFICATION
ENGR. MANUEL VILLAVICENCIO ranges ($141.3 – 163.4 MM and 0.468 – 0.499 $/kWh), making the economic feasibility of this combination the worst between the considered. Therefore, under the circumstance of biomass availability restricted to 150 t/day, the increment of adding BBFB systems over the capital cost of the project does not economically justify the savings due to fuel diversification obtained by using residual biomass. Nevertheless, over this boundary, adding BBFB units to the electricity mix becomes feasible enough to be a preferred alternative against the diesel generators alone.
It is important to remark that if instead of a minimum NPC criteria, a minimum capital cost criteria is followed on selecting the generation systems, the preference order differs from the presented above, being the optimum system architecture the fuel generator alone, followed by the full diversified cases, then the fuel generators with the PV systems and then the fuel generators together with BBFB systems.
Component Capital Replacement O&M Fuel Salvage Total
($) ($) ($) ($) ($) ($) ($)
PV 399.3E+6 -‐ 6.0E+3 -‐ -‐ 399.3E+6 Blend 66.5E+6 165.4E+6 52.3E+6 940.6E+6 -‐43.8E+3 1.2E+9 Gasification 38.2E+6 -‐ 4.4E+6 38.0E+6 -‐1.4E+6 79.3E+6 System 504.0E+6 165.4E+6 56.7E+6 978.6E+6 -‐1.4E+6 1.7E+9
Table 26. System architecture of the winner system (ID 11) for the minimum load case by 2020. Component Capital Replacement O&M Fuel Salvage Total
($) ($) ($) ($) ($) ($) ($)
PV 399.3E+6 -‐ 6.0E+3 -‐ -‐ 399.3E+6 Blend 66.5E+6 186.8E+6 55.1E+6 1.0E+9 -‐9.8E+6 1.3E+9 Gasification 38.2E+6 -‐ 4.5E+6 38.0E+6 -‐1.2E+6 79.5E+6 System 504.0E+6 186.8E+6 59.7E+6 1.1E+9 -‐11.1E+6 1.8E+9
Table 27. System architecture of the winner system (ID 15) for the maximum load case by 2020. Table 26 and Table 27 offers a detailed cost distribution for the lifetime of the
winners systems. It is possible to appreciate that due to the fact that both, ID 11 and ID 15, systems shares the same system architecture with the same share of the installed capacity, the cost distribution differences comes from the different on the dispatch strategy for each one. The most relevant readings from these two system architectures are:
Capital cost: Both systems have the same capital cost distribution due to their
similar architectures. PV systems has the higher cost by installed capacity among the three generation technologies considered, they represent 80% of the total capital expenses. The total capacity cost of the system is 1.73 $/W.
Replacement cost: PV system and BBFB system were modeled with a higher
lifetime than generators (see Power optimization inputs on Annex III). The replacement cost of the systems is the replacement cost of the generators and represents around 10% of
!"#$
%"#$
!#$
&'#$
!"#$%&'()#$'*+#$,+-./)0'()*+,)-$ ./*-)0/1/2,$ 345$ 67/-$
!"#$
%&#$
'#$
()#$
!"#$%&'()#$'*+#$,+-./)0'*+,-.+/$ 01,/+21314.$ 567$ 891/$

SUPPORT FOR THE ELABORATION OF THE MASTER PLAN FOR THE JIGAWA STATE ELECTRIFICATION
ENGR. MANUEL VILLAVICENCIO the total NPC. Replacement cost of ID 15 is higher than that of ID 11 but they share the same replacement cost/annual load ratio.
Fuel cost: Is the most important component of the total NPC cost and it’s basically
constituted by the diesel cost. System ID 15 is more dependent on fuel (blend and biomass) than system ID 11, which results on an increment of around MM 122 $ (13%) for ID 15.
ID PV Production Gen Production BBFB Production Tot. Electrical Production Ren. Fraction
Unmet Load Frac.
Blend Diesel/BioDiesel Biomass
# GWh/yr GWh/yr GWh/yr GWh/yr L/yr t/yr 11 374.43 233.06 20.92 628.41 0.63 0.06 1.23E+08 55 12 374.43 253.92 -‐ 628.35 0.6 0.07 1.36E+08 -‐ 13 -‐ 417.64 -‐ 417.64 -‐ 0.1 1.99E+08 -‐ 14 -‐ 398.37 21.34 419.71 0.05 0.09 1.91E+08 55 15 374.43 262.14 20.79 657.36 0.60 0.09 1.34E+08 55 16 411.87 275.97 -‐ 687.84 0.60 0.1 1.43E+08 0 17 -‐ 498.98 -‐ 498.98 0.00 0.06 2.51E+08 0 18 -‐ 479.32 21.60 500.92 0.04 0.05 2.42E+08 55
Table 28. Optimization categorized results for Horizon 2020 – technical outputs (fixed interest rate of 7.85%)
The architecture of the winner systems has a renewable fraction between 0.60-‐0.63 on the electricity mix, and their composition are very close. Considering the two systems, from system ID 11 to ID 15 the power generation coming from PV systems decreases from 60% to 57% meanwhile the generators share increases from 37% to 40%, and at the same time, the fraction of BBFB remains constant on 3%.
Table 29. Power generation mix.
ID 11 ID 15
Component Production Fraction Production Fraction
(kWh/yr)
(kWh/yr)
PV array 374,427,488 60% 374,427,488 57%
Diesel/Biodiesel 233,062,192 37% 262,144,064 40%
Gassification fraction 20,921,852 3% 20,789,930 3%
Total 628,411,520 100% 657,361,472 100%
Figure 30. Monthly average electricity production ID 11 Figure 29. Monthly average electricity production ID 15

SUPPORT FOR THE ELABORATION OF THE MASTER PLAN FOR THE JIGAWA STATE ELECTRIFICATION
ENGR. MANUEL VILLAVICENCIO
The monthly average distribution of the power production is slightly constant on the two system architectures. From the Figure 29 Figure 30 it can be observed that the supply strategy of both systems consist in prioritizing the technology by its fuel cost. The power generation of PV systems has a power production range of 40 -‐ 45 for systems (ID 11 and ID 15). The PV power peak is reached between the months of February to March, coinciding with the peak of power production (minimum unmet load), meanwhile there is a soft valley on the PV production between July and August which results on a valley of the total supply to reach the maximum unmet load accepted.
The higher share of the PV production for system ID 11 results on a minimum pollutant emission, representing an overall of 8% less emissions than system ID 15 and 90% less emissions than system ID 17 (only generators).
ID 11 ID 15 ID 16 ID 17
Pollutant Emissions (kg/yr) Emissions (kg/yr) Emissions (kg/yr) Emissions (kg/yr)
Carbon dioxide 323,994,656 352,524,544 376,318,816 660,673,408
Carbon monoxide 800,067 870,489 928,890 1,630,779
Unburned hydrocarbons 88,623 96,423 102,892 180,640
Particulate matter 60,313 65,621 70,024 122,936
Sulfur dioxide 650,619 707,912 755,714 1,326,748
Nitrogen oxides 7,139,061 7,767,442 8,288,555 14,551,564
Table 30. Pollutant emissions
For the diversified strategy 2020 there were carried out two set of sensitivity analysis in order to give a wider lecture of the simulated cases. The first dimension of the analysis has a technical approach, it studied the influence of the uncertainties related of the load estimations side by side that concerning to the fuel prices, over the optimal system architecture and in the resulting electricity mix. The second dimension tackle the influence of other externalities on the financial results of the project.
Figure 31 shows the transition of the capacity of renewable technologies in the NPC
optimization program. For a constant diesel price (figure 31-‐A), progressive increments in the power load makes increase the optimal PV capacity selected. The Diesel cost of 0.85$/L represent an inflexion point in the trend of the PV optimal capacity over which increments in the power load make slightly higher augmentations on the PV selected capacity.
Setting the diesel price on 0.77 $/L, and analyzing the influence of the biomass
availability (with a fixed cost of 70 $/t ) over the optimal gasification capacity (figure 31 –b), it can be seen that for the cases located over biomass boundary of 150 t/d, higher electricity loads produce falls on the PV capacity and rises on that of BBFB, nevertheless the capacity share of the generators also increases to met the maximum unmet load restriction of 12%.

SUPPORT FOR THE ELABORATION OF THE MASTER PLAN FOR THE JIGAWA STATE ELECTRIFICATION
ENGR. MANUEL VILLAVICENCIO
B)
Figure 31. Renewable technologies capacity share. A) PV B) BBFB
Also, as it is expected, higher diesel prices make escalations in both systems,
resulting on an increment on the total renewable fraction. Progressives diesel price increments and flexible biomass availability, joined with higher electricity demand make intensify the BBFB capacity directly, meanwhile, the PV capacity variations depends on the diesel cost/load ratio (Figure 32).
A)

SUPPORT FOR THE ELABORATION OF THE MASTER PLAN FOR THE JIGAWA STATE ELECTRIFICATION
ENGR. MANUEL VILLAVICENCIO
Figure 32. Renewable fraction as a function of fuel prices
In terms of fuel substitution, Figure 33 presents the total consumption of diesel as a
function of its price and the biomass availability. The boundary that represents the biomass availability over the financial results of the project is explained here. It can be seen that the iso-‐fuel consumption family curves have a flat segment corresponding to different diesel prices representing the local biomass boundary in which for a constant diesel price there is fuel substitution if biomass availability is over the respective boundary. Nevertheless, the residual biomass availability is related to agricultural and meteorological issues that should be included and addressed in order to assure environmental problems due to an overexploitation of biomass resources including non residual sources to take profit of financial opportunities.

SUPPORT FOR THE ELABORATION OF THE MASTER PLAN FOR THE JIGAWA STATE ELECTRIFICATION
ENGR. MANUEL VILLAVICENCIO
Figure 33. Diesel consumption as a function of fuel prices
The corresponding explanation about the trend of the renewable fraction on the
electricity production was slightly outlined in Table 25, Table 28 and presented in Figure 32. With restricted biomass availability, a constant fuel price and higher electricity load the power demand is absorbed mostly by the generators even if the PV optimal capacity increases. But, with biomass flexibility, the renewable fraction increases even if the share of the non-‐renewable capacity on the optimal system architecture selected is considerately higher, which means that the biomass consumption is the main variable affected due to increments in the BBFB capacity and the resulting fuel transition.
A)

SUPPORT FOR THE ELABORATION OF THE MASTER PLAN FOR THE JIGAWA STATE ELECTRIFICATION
ENGR. MANUEL VILLAVICENCIO
B) Figure 34. Sensitivity analysis: Influence of fuel cost and primary load to the NPC (interest rate 7.85%, horizon 2020)
The previous figures represent the influence of the blend cost and the biomass
availability over the NPC and the LCOE. Figure 34-‐A shows the fuel price moderate dependence for this scenario with a slightly slope of the iso-‐NPC lines which under the biomass availability restrictions, progressive increments in fuel cost are reflected directly into the NPC of the project without any fuel transition possibilities. Figure 34-‐B presents the already indicated financials benefits of biomass availability expansions. Due to the high renewable fraction on the total power generation, the influence of the capital cost variations (or uncertainties) of the renewable energy systems over the NPC represent a relevant issue to study. Figure 35 A and B reveal that keeping fixing the rest of assumptions, a 10% of PV system cost variation represents around 2% of total NPC deviation, meanwhile a 10% of BBFB cost variation has an influence of 0.19% over the total NPC of the project.

SUPPORT FOR THE ELABORATION OF THE MASTER PLAN FOR THE JIGAWA STATE ELECTRIFICATION
ENGR. MANUEL VILLAVICENCIO
A)
B)
Figure 35. Sensitivity analysis: Fuel cost Vs. Cost multipliers - min load (interest rate 7.85%, horizon 2020). A) PV cost
multiplier B) BBFB cost multiplier

SUPPORT FOR THE ELABORATION OF THE MASTER PLAN FOR THE JIGAWA STATE ELECTRIFICATION
ENGR. MANUEL VILLAVICENCIO
CONCLUSIONS AND RECOMMENDATIONS
The electrification targets of Jigawa State on the framework of the J-‐SEED
Developing Program 2009 were assessed in this study. The background of the project was documented, an extensive data gathering phase was carried out and the relevant information was assembled in a geographical information system library (GIS library) to boost further phases of the project. The power demand was estimated and approximately forecasted to the time horizons considered on the development plans. A first evaluation of the local energy resources was conducted and a set of power generation strategies were modeled for both time horizons, making possible a better representation of the road map to be followed in order to accomplish the electrification targets.
Findings, results and outputs of this study are as follows:
∗ Improve infrastructure and services is a highly relevant task to improve human living conditions and propitiate economic development in Nigeria. At regional level, Jigawa State is one of the poorest states of the country and presents public services deficiencies under the average of the country.
∗ Nearly 85% of the population of Jigawa State lives in rural conditions with restricted access to electricity, in addition, the urban portion of the population have a very insufficient electricity supply among other basic services deficiencies. The development objectives of the state recognize electrification as a primary need. The current electrification initiative is based in the federal energy market deregulation reform of 2005 from which the participation of independent power producers (IPP) in the electricity market becomes possible. The rural electrification master plan for Jigawa State is an initiative established on this framework
∗ Ambitious objectives have been set by the authorities of the state in two time horizons. The goals for the 2012 horizon are to reach 30% of electricity access and 10% of power production within the state. The 2020 goals include reaching 50% of electricity access and 50% of local power production. Currently, there are ongoing projects on grid expansion, on grid diesel generators installations and off-‐grid solar based electrification, but a proper valuation of the proposed objectives, their multiple implications and the strategy to optimally accomplish them is yet to be established.
∗ The power demand of the State was forecasted for both time horizons by assuming observed demographic parameters, basic electricity appliances surveyed in households, economic activity growth pattern and a set of simplifications about urbanization with the application of the concept of rural growth center (RGC).
∗ The annual electricity demand estimated for Jigawa State by 2012 is placed in the range of 0.8064 – 0.8470 TWh, presenting a daily power peak between 183.1 – 192.3 MW located at 19:00 in the evening. Therefore, the electrification target of reaching 30% of electricity access and the generation target of 10% of total power demand mean an expansion of 50% of the existing distribution lines (Figure 22), giving power supply to around 750000 users and the introduction of new generation capacity to cover at least 18MW peak (Figure 25).

SUPPORT FOR THE ELABORATION OF THE MASTER PLAN FOR THE JIGAWA STATE ELECTRIFICATION
ENGR. MANUEL VILLAVICENCIO
∗ The annual electricity demand by 2020 is estimated to be in the range of 0.9768 – 1.1096 TWh, with around 220-‐250 MW of power peak, which consequently implies a grid expansion that allows the power supply to around 840000 users (Figure 22) and an expansion of the generation capacity to cover up to 125 MW of the total demand (Figure 26).
∗ Energy resources of Jigawa State were roughly estimated with the available information found (section 4.2). The solar potential of 6.3 kWh/m2*d , the estimated biomass residues of 2.5 millions t/yr and the Jatropha Curcas harvest on the Jarda Kangiwa Forest Reserve are the most interesting local energy resources to be included in the electrification master plan.
∗ The electrification objectives on the two time horizons were assessed (section 4.3). For the 2012 horizon it was considered the already started scheme of adding diesel generation units to supply power to the T&D grid, and the medium term pretension of using biodiesel from Jatropha Curcas plantations as a blend fuel for power generation. The lifetime of the project was set to 20 years and the optimum generation capacity range obtained with this strategy was 10 -‐ 10.5 MW, resulting on a capital cost of $11.4 MM, a NPC between $281.7 -‐ $296.3 MM and a LCOE around 0.408 $/kWh (Biofuel based strategy (horizon 2012). On this strategy, even with the best yield for Jatropha Curcas plantations, the biodiesel fraction on the blend was found insignificant due to the high fuel consumption of the generators. Thus, the power generation explicitly relies on diesel consumption, and the influences of fuel price volatility is directly conducted to the NPC and LCOE. Also, electricity security could be seriously affected by possible irregularities in fuel supply.
∗ On the 2020 horizon, the assessed strategy consisted on fuel diversification alternatives, including on grid photovoltaic systems (PV) and fluidized bed biomass gasification systems (BBFB) (Diversified supply strategy (horizon 2020). It was assumed a maximum biomass availability of 150 t/d (around 0.5% of the total estimated for the state). The optimal system architecture obtained was a combination of 200 MW of PV systems (around 20 solar gardens of at least 7MW), 60 MW of diesel generators (30 units of 2MW) and 30 MW of BBFB (1 unit). The NPC was found estimated between 1.7 – 1.8 B $ and the LCOE between 0.377 – 0.396 $/kWh. Under the same assumptions and considering a combination of only fuel generators and PV systems, the optimal system architecture corresponded to the installation of the same capacity of fuel generators and PV systems (60 MW and 200MW) but with a higher fuel consumption, which results on a NPC and LCOE ranges of 1.8 -‐ 1.9 B $ and 0.392 – 0.414 $/kWh respectively.
∗ The sensitivity analysis of the diversified scenario shows that the considered boundary of biomass availability (150 t/day) represents a borderline of the BBFB system feasibility, over this value, whichever combination of BBFB with other systems is preferred than the system without it. Nevertheless, the residual biomass availability is related to agricultural and meteorological issues that should be included and addressed in order to bound possible environmental impact due to indirect incentives to biomass overexploitation, including the non residual one, driven by profits opportunities as a preferred fuel substitute.
∗ On the fuel diversified scenario, the little generator capacity in proportion results on a higher energy security alternative with more guard against fuel volatilities in comparison with the blend based scenario (Figure 34). The diversified scenario also result in a lower LCOE, thus, the state’s electrification strategy should be focused on this consideration.

SUPPORT FOR THE ELABORATION OF THE MASTER PLAN FOR THE JIGAWA STATE ELECTRIFICATION
ENGR. MANUEL VILLAVICENCIO
∗ If a minimum capital cost criteria is followed to design the architecture of the power supply systems, under the assumptions made, the NPC and the LCOE are not longer optimal and the feasibility of the projects get threaten. This selection criteria can be induced by a certain level of aversion to new technologies, by constrained access to capital or by a short term vision of the projects.
∗ The contribution of biodiesel from Jatropha Curca plantations over the blend fraction remains uncertain. The current biodiesel yields obtained from the Yarda Kangiwa plantation are not very promising but it is also recognized that this pilot project is been tested under the worst possible conditions in order to recuperate marginal lands of the Yarda Kangiwa Old National Forest Reserve. Therefore, better estimations of the biodiesel expected production should be done in order to properly assess its potential for power generation.
∗ With respect to the targets on electricity access, the current configuration of the electricity grid was digitalized and placed on the GIS library, allowing the easily appreciation of the proximity between the grid and the non electrified villages (RGCs) and to properly develop further grid extensions or stand alone installations.
The power demand estimations presented are based on a set of simplifications that
may introduce uncertainties to the quantification of the electrification targets. The estimated power curves are substantial inputs in the energy optimization model developed, henceforward, this aspects should be carefully elucidated and validated with further measurements and with a direct data gathering campaign for the corroboration and sharpening of the results.
From a decentralized energy planning perspective, the preparation of a Master Plan
of Electrification should be a highly consultative process. Workshops involving key stakeholders must be held at each provincial headquarters to include the maximum possible inputs through the local participation.
The optimization model developed is considered as a preliminary study of the
energy strategy for electrification of Jigawa State and presents some limitations due to the design architecture of the computational tool used (HOMER micro-‐power modeling) that has been applied at district level; from this perspective, further developments of the project should include multi – objective fuzzy linear programming tools with the inclusion of multi-‐criteria parameters consulted at very local level in order to take into consideration relevant aspects (such as socio-‐cultural factors, electrification and water access, energy and food security, etc.), which had been neglected at this first stage of the project due to the several limitations. Nevertheless, this project sets a background and opens the way to further and deeper analysis on the exposed subjects.

SUPPORT FOR THE ELABORATION OF THE MASTER PLAN FOR THE JIGAWA STATE ELECTRIFICATION
ENGR. MANUEL VILLAVICENCIO
BIBLIOGRAPHY [1] Adenikinju, A. (2008). Efficiency of the Energy Sector and its Impact on the
Competitiveness of the Nigerian Economy. International Association for Energy Economics , 27 -‐ 32.
[2] African Development Bank Group. (2009). NIGERIA ECONOMIC AND POWER SECTOR REFORM PROGRAM (EPSERP) -‐ Appraisal Report 2009.
[3] African Development Bank Group, African Union, & UN Economic Commission for Africa. (2011). African Statistical Yearbook 2011.
[4] Ajao, K. (2009). Electric Energy Supply in Nigeria, Decentralized Energy Approach. Cogeneration and Distributed Generation Journal , 24, 34 -‐ 50.
[5] Ajeigbe, H. T. (2009). Legume and cereal seed production for improved crop yields in Nigeria. IITA, Kano Station, Nigeria, Kano.
[6] Alam, M., Huq, A., & Bala, B. (1990). An integrated rural energy model for a village in Bangladesh. :131–9. Energy .
[7] Blanco, A. (2011). Toward the State-‐of-‐the-‐art Energy Services in Jigawa state (Northern Nigeria).
[8] Central Bank of Nigeria. (2010). 2010 Annual Report. Government of Nigeria, Abuja. [9] CIA. (2010). World Fact Book. Central Intelligence Agency of the United States,
Washington. [10] EIA. (2011). International Energy Outlook. Annual, US Energy Information
Administration, Washington. [11] Das, T. (1987). Multiobjective linear programming approach to renewable energy
policy analysis. Energy Manage Conver . [12] Darling, K., Hoyt, N., Murao, K., & Allison, R. (2008). The Energy Crisis of Nigeria: An
Overview and Implications for the Future. [13] Directorate of Budget and Economic Planning -‐ SEEDS II. (2009). Jigawa State
Comprehensive Development Framework. Final Draft, Technical Committee SEEDS II, Government of Jigawa State, Directorate of Budget and Economic Planning.
[14] F.I. Ibitoye, & A. Adenikinju. (2006). Future demand for electricity in Nigeria. Applied Energy , 84, 492 -‐ 504.
[15] Federal Government of Nigeria. (2004). National Policy on Population for Sustainable Development. Abuja.
[16] Groupe de la Banque Africaine de Développement. (2011). Perspectives économiques en Afrique 2011. BafD, OCDE, PNUD, CEA.
[17] Iwayemi, A. (2008). Nigeria’s Dual Energy Problems: Policy Issues and Challenges. International Association for Energy Economics .
[18] IEA. (2011). Are we entering a golden age of gas -‐ Special Report. International Energy Agency, Paris.

SUPPORT FOR THE ELABORATION OF THE MASTER PLAN FOR THE JIGAWA STATE ELECTRIFICATION
ENGR. MANUEL VILLAVICENCIO [19] IEA. (2010). Key World Energy Statistics . International Energy Agency, Paris. [20] Iniyan, S., & Jagadeesan, T. (1998). Effect of wind energy system performance on
optimal renewable energy model: an analysis. Renewable and Sustainable Energy Review .
[21] Herrmann, S., & Osinski, E. (1999). Planning sustainable land use in rural areas at different spatial levels using GIS and modeling tools. Landscape Urban Plann .
[22] Hiremath. (2005). Decentralized energy planning; modeling and application: a review. Renewable and Sustainable Energy Reviews , 729–752.
[23] J. Amador, J. D. (2005). Application of geographical information systems to rural electrification with renewable energy sources. Renewable Energy 30 , 1897–1912.
[24] Jigawa State Rural Electricity Board. (2010). Brief on the Jigawa IPPs. Secretary of the State Government, Dutse.
[25] Kamara, A. (2008). Increasing Crop Productivity in the West African Savannas: Experiences from northern Nigeria. IITA publications .
[26] Nahman J, S. J. (1997). Optimal planning of rural medium voltage distribution networks. Electri Power Energy Systems .
[27] National Bureau of Statistics. (2006). Core Welfare Indicators Questionnaire (CWIQ). ZONAL SUMMARY: NORTH-‐WEST. Final Report.
[28] National Bureau of Statistics. (2006). Electricity Supply And Demand Statistics. [29] National Population Commission (NPC) of Nigeria. (2009). Annual Report 2009. [30] Nigeria Presidential Task Force On Power (PTFP). (2010). Road Map for Power Sector
Reform. The Presidency Federal Republic Of Nigeria, PRESIDENTIAL ACTION COMMITTEE ON POWER (PACP), Abuja.
[31] Malik, S., & Satsangi, P. (1997). Data extrapolation techniques for energy systems planning. Energy Conver Manage .
[32] Millenium Developments Goals, Nigeria. (2010). NIGERIA: MILLENNIUM DEVELOPMENT GOALS. Government of the Federal Republic of Nigeria.
[33] Ochoa Ramón, J. L., Velo García, E., & Ferrer Martí, L. (2009). Criterios de evaluación y análisis de alternativas para el diseño de proyectos de electrificación rural con energía eólica y solar en países en desarrollo. Universitat Polytechnica de Catalunya, Barcelona.
[34] Oluwayemisi, A. (2010). AN INVESTIGATION ON USING GIS TO PROSPECT FOR RENEWABLE ENERGY IN NIGERIA. Kansas City, Missouri, EEUU: University of Missouri-‐Kansas City.
[35] Onwuemenyi, s. (2012, February 13). Nigeria to revive moribund rural electrification agency. Abuja, Abuja, Nigeria: Sweet Crude. Retrieved February 19, 2012, from http://sweetcrudereports.com/2012/02/13/nigeria-‐to-‐revive-‐moribund-‐rural-‐electrification-‐agency/
[36] Parikh, J. (1985). Modeling energy and agriculture interactions: a rural energy systems model. Energy .

SUPPORT FOR THE ELABORATION OF THE MASTER PLAN FOR THE JIGAWA STATE ELECTRIFICATION
ENGR. MANUEL VILLAVICENCIO [37] Pokharel, S., & Chandrashekar, M. (1998). A multiobjective approach to rural energy
policy analysis. Energy . [38] Sambo, A. S. (2008). Matching Electricity Supply with Demand in Nigeria.
International Association for Energy Economics . [39] Sambo, A. S., Iloeje, O., Ojosu, J., Olayande, J., & Yusuf, A. (2005). Nigeria`s Experience
on the application of IAEA’s energy models (MAED & WASP) for national energy planning.
[40] Rajvanshi, A. (1995). Energy self sufficient talukas: a solution to national energy crisis. Economic Policy Weekly (EPW) .
[41] THE JAPAN INTERNATIONAL COOPERATION AGENCY (JICA). (2009, February). RURAL ELECTRIFICATION MASTER PLAN FOR ZAMBIA 2008 -‐ 2030.
[42] UNPD. (2011). Human Development Report. United Union Program for Development (UNPD), Human Development Report Office (HDRO).
[43] USAID. (2005). Zambia Rural Electrification Master Plan: Phase 1: Rapid Resource Assessment. Final Report .
[44] Yue, C., & Wang, S. (2004). GIS-‐based evaluation of multifarious local renewable energy sources: a case study of the Chigu area of southwestern Taiwan. Energy Policy .

SUPPORT FOR THE ELABORATION OF THE MASTER PLAN FOR THE JIGAWA STATE ELECTRIFICATION
ENGR. MANUEL VILLAVICENCIO
Relevant visited websites [1] World Bank Nigeria Statistics: http://web.worldbank.org/WBSITE/EXTERNAL/COUNTRIES/AFRICAEXT/NIGERIAEXTN/0,,menuPK:368906~pagePK:141132~piPK:141107~theSitePK:368896,00.html [2] Nigeria indicators: http://data.worldbank.org/country/nigeria [3] General info of Nigeria: http://www.motherlandnigeria.com/history.html [4] Politics in Nigeria: http://www.iss.co.za/af/profiles/nigeria/politics.html [5] BBC Africa: http://www.bbc.co.uk/news/world/africa/ [6] Central Bank of Nigeria: http://www.cenbank.org/ [7] MDG’s Nigeria: http://www.ng.undp.org/ [8] Statistics: http://surveynetwork.org/ [9] Energy commision of Nigeria: http://www.energy.gov.ng/index.php?option=com_content&task=view&id=59&Itemid=39 [10] IEA power plants indicators: http://www.instituteforenergyresearch.org/2010/11/23/eia-‐releases-‐new-‐generating-‐plant-‐capital-‐cost-‐data/ [11] Enterprise data for Nigeria: https://www.enterprisesurveys.org/Data/ExploreEconomies/2007/nigeria#informality-‐-‐sector [12] Hardy Diesel generators costs: http://www.hardydiesel.com/detroit-diesel-generators/ [13] World Alliance for Decentralized Power (WADE): http://www.localpower.org/

SUPPORT FOR THE ELABORATION OF THE MASTER PLAN FOR THE JIGAWA STATE ELECTRIFICATION
ENGR. MANUEL VILLAVICENCIO
Annex I
A. Solar based electrification projects.
Promoter Year Village LGA Details Fund partner References
Jigawa State Alternative Energy Fund
2001 Waman Rafi
Kazaure Solar lighting for HH, school, clinic and mosques. Solar Street lights, solar lighting for micro BE shops, solar powered boreholes
NGO Solar Electric light Fund (SELF)
Public report 2011
Jigawa State Alternative Energy Fund
2001 Baturiya Kirikasamma Solar lighting for HH, school, clinic and mosques. Solar Street lights, solar lighting for micro BE shops, solar powered boreholes
NGO Solar Electric light Fund (SELF)
Public report 2011
Jigawa State Alternative Energy Fund
2001 Ahoto Buji Solar lighting for HH, school, clinic and mosques. Solar Street lights, solar lighting for micro BE shops, solar powered boreholes
NGO Solar Electric light Fund (SELF)
Public report 2011
Jigawa State Alternative Energy Fund
2005 Garkon Alli Kiyawa Solar lighting for HH, school, clinic and mosques. Solar
Streetlights. with JICA Public report 2011
Jigawa State Alternative Energy Fund
2008 Dage Gwiwa Solar lighting for HH, school, clinic and mosques. Solar Streetlights. MDG`s Public report
2011
Jigawa State Alternative Energy Fund
2008 Kurfi Kazaure Solar lighting for HH, school, clinic and mosques. Solar Streetlights. MDG`s Public report
2011
Jigawa State Alternative Energy Fund
2008 Gidan Maza Garki
Solar lighting for HH, school, clinic and mosques. Solar Streetlights. MDG`s Public report
2011
Jigawa State Alternative Energy Fund
2008 Dankumbo Maigatari
Solar lighting for HH, school, clinic and mosques. Solar Streetlights. MDG`s
Public report 2011
Jigawa State Alternative Energy Fund
2008 Madaka Gagarawa Solar lighting for HH, school, clinic and mosques. Solar Streetlights. MDG`s
Public report 2011
Jigawa State Alternative Energy Fund
2008 Badingu Birnin kudu Solar lighting for HH, school, clinic and mosques. Solar Streetlights. MDG`s Public report
2011
Jigawa State Alternative Energy Fund
2008 Duhuwa Kiyawa Solar lighting for HH, school, clinic and mosques. Solar Streetlights. MDG`s Public report
2011
Jigawa State Alternative Energy Fund
2008 Yayarin chakauri Buji
Solar lighting for HH, school, clinic and mosques. Solar Streetlights. MDG`s
Public report 2011
Jigawa State Alternative Energy Fund
2008 Tsagaiwa Miga Solar lighting for HH, school, clinic and mosques. Solar Streetlights. MDG`s Public report
2011
Jigawa State Alternative Energy Fund
2008 Gunka Jahun Solar lighting for HH, school, clinic and mosques. Solar Streetlights. MDG`s
Public report 2011
Jigawa State Alternative Energy Fund
2008 Unik Auyo Solar lighting for HH, school, clinic and mosques. Solar Streetlights. MDG`s
Public report 2011
Jigawa State Alternative Energy Fund
2008 Makera kafin
Hausa Solar lighting for HH, school, clinic and mosques. Solar Streetlights. MDG`s Public report
2011
Jigawa State Alternative Energy Fund
2008 Dawa Guri Solar lighting for HH, school, clinic and mosques. Solar Streetlights. MDG`s Public report
2011
Jigawa State Alternative Energy Fund
2008 Baramusa Malam Madori
Solar lighting for HH, school, clinic and mosques. Solar Streetlights. MDG`s
Public report 2011
Jigawa State Alternative Energy Fund
2008 Kazura Birniwa Solar lighting for HH, school, clinic and mosques. Solar Streetlights. MDG`s Public report
2011

SUPPORT FOR THE ELABORATION OF THE MASTER PLAN FOR THE JIGAWA STATE ELECTRIFICATION
ENGR. MANUEL VILLAVICENCIO
Jigawa State Alternative Energy Fund
2009 Fiji Birnin kudu Improved facilities: Solar lighting for HH, school, clinic and mosques. Solar Street lights, solar lighting for micro BE shops, solar powered boreholes
State Government
Public report 2011
Jigawa State Alternative Energy Fund
2009 Duhuwa Gumel Improved facilities: Solar lighting for HH, school, clinic and mosques. Solar Street lights, solar lighting for micro BE shops, solar powered boreholes
State Government
Public report 2011
Jigawa State Alternative Energy Fund
2009 Kwajali Taura Improved facilities: Solar lighting for HH, school, clinic and mosques. Solar Street lights, solar lighting for micro BE shops, solar powered boreholes
State Government
Public report 2011
Jigawa State Alternative Energy Fund
2009 Maina Kaugama Improved facilities: Solar lighting for HH, school, clinic and mosques. Solar Street lights, solar lighting for micro BE shops, solar powered boreholes
State Government
Public report 2011
Jigawa State Alternative Energy Fund
2011 Malindi Birniwa Solar lighting for HH, school, clinic and mosques. Solar Streetlights.
State Government
Public report 2011
ECN up to 2010 Laya N/A Solar Based Rural Electrification. N/A
Energy Commission of Nigeria (1).
ECN up to 2010
Sakura N/A Solar Based Rural Electrification. N/A Energy Commission of Nigeria (1).
ECN up to 2010
Sharhori N/A Solar Based Rural Electrification. N/A Energy Commission of Nigeria (1).
ECN up to 2010
Tudun Wada N/A Solar Based Rural Electrification. N/A
Energy Commission of Nigeria (1).
ECN up to 2010 Dubau N/A Solar Based Rural Electrification. N/A
Energy Commission of Nigeria (1).
ECN up to 2011
Malarin Gamma Malam Madori 1.565kWp Solar-‐Powered Borehole and Street Lighting N/A
Energy Commission of Nigeria (1).
(1) Source: http://www.energy.gov.ng/index.php?option=com_content&task=view&id=59&Itemid=39 Table 31. Solar based electrification projects in Jigawa State.
S/ NO. DESCRIPTION AMOUNT IN NAIRA 1 80 WATTS 12V SOLAR PANEL N55,000 2 200AH 12V DEEP CYCLE BATTERIES N60,000 3 150AH 12V “ “ “ N50,000 4 CHARGE CONTROLLER N15,000 5 12V LED BULB N1,500 6 VACCINE REFREGERTOR N350,000 7 SQ FLEX SUMMERSIBLE PUMP N300,000 8 3KVA, 48V INVERTER N85,000 9 2.5KVA 24V INVERTER N80,000
Table 32. Solar based electrification project devices. Source: Alternative energy fund 2011.

SUPPORT FOR THE ELABORATION OF THE MASTER PLAN FOR THE JIGAWA STATE ELECTRIFICATION
ENGR. MANUEL VILLAVICENCIO
Annex II
A. Energy and Electricity Needs Estimations
Health survey 2008 North West regional survey 2003
Calculated for Jigawa 2008
Effects & goods Urban Rural
Electrical devices
Radio 83.5 69.4 -‐ 71.5 Television 69 22.9 -‐ 29.8 Telephone/cell phone 76.1 35.1 -‐ 41.3 Non-‐mobile telephone 3.7 0.7 -‐ 1.2 Refrigerator 32.4 6.7 -‐ 10.6 Gas cooker 7.5 2.1 1.7 1.7 Iron 57.3 16.8 20.6 20.6 Fan 69.2 19.6 23.1 23.1
Transportation effects
Bicycle 17.9 41 40.8 40.8 Motorcycle/scooter 17.5 13.8 14.9 14.9 Car/truck 17.8 4.9 4.9 4.9 Donkey/horse/camel 1.5 8 18 18.0 Canoe/boat/ship 1.2 7.1 7.5 7.5
None of the above 7 19.9 14.3 14.3 Table 33. Surveyed effects and goods for HHs 2008 & 2003.
Power Average Usage Household avg. Electricity demand
Device Min (kW) Max (kW) (hrs/day) (kWh/day) (MWh/year)
Surveyed
Radio 0.01 0.075 7.2 0.219 0.080 Television 0.1 0.15 4.2 0.157 0.057 Telephone/cell phone 0.01 0.05 1 0.012 0.005 Non-‐mobile telephone 0 0.005 24 0.001 0.000 Refrigerator 0.4 0.4 7 0.296 0.108 Gas cooker -‐
Iron 0.8 1 0.1 0.019 0.007 Fan 0.08 0.1 6 0.125 0.046
Not su
rveyed
Lighting 0.04 0.1 28.98 0.828 0.302 Cooker (heat storage) 0.4 0.4 -‐ Water-‐pumping 0.1 0.4 0.5 0.006 0.002 Others 0.05 0.05 1 0.009 0.003
Total 1.67 0.61
Table 34. HH electric energy demand estimations. (blue: estimations from statistics, black: JICA values, orange: assumed).

SUPPORT FOR THE ELABORATION OF THE MASTER PLAN FOR THE JIGAWA STATE ELECTRIFICATION
ENGR. MANUEL VILLAVICENCIO
Various energy & electricity needs estimations considering different criteria
WEC objectifs for HH electricity
supply
Electricity demand per HH based on income
level
Based on basic services supply per HH for development
targets
Based on O. Adeoti estimations for a Nigerian avg HH
Electricity demand per HH based on effects
surveyed Criteria
LGA (MWh/year) (MWh/year) (MWh/year) (MWh/year) (MWh/year)
Auyo 72747 28070 42029 17862 12798
Babura 117125 45194 67668 28759 20605
Biminwa 78108 30139 45126 19179 13741
Brinin Kudu 172759 66660 99811 42420 30392
Buji 53506 20646 30913 13138 9413
Dutse 138124 53296 79800 33915 24299
Gagarawa 45184 17435 26105 11095 7949
Garki 82644 31889 47747 20292 14539
Gumel 58504 22574 33800 14365 10292
Guri 62350 24058 36022 15309 10969
Gwaram 149252 57590 86230 36648 26257
Gwiwa 70802 27319 40905 17385 12455
Hadejia 57357 22132 33138 14084 10090
Jahun 126435 48786 73047 31045 22243
Kafin Hausa 147006 56723 84932 36096 25861
Kaugama 70940 27373 40985 17419 12480
Kazaure 88639 34202 51210 21764 15593
Kiri Kasama 105921 40870 61195 26008 18634
Kiyawa 95124 36704 54957 23357 16734
Maigatari 97381 37575 56261 23911 17131
Mallam Madori 90635 34972 52364 22255 15945
Miga 70332 27138 40634 17269 12373
Ringim 105824 40833 61139 25984 18617
Roni 42578 16429 24599 10455 7490
Sule Tankarkar 74147 28610 42838 18206 13044
Taura 72524 27984 41900 17808 12758
Yankwashi 52604 20297 30391 12916 9254
Total 2398551 925498 1385746 588943 421955 Table 35. Aggregate electricity demand assuming different criteria.

SUPPORT FOR THE ELABORATION OF THE MASTER PLAN FOR THE JIGAWA STATE ELECTRIFICATION
ENGR. MANUEL VILLAVICENCIO
Details Facilities Ratio Source/Info
Primary school 2% operate a double shift. 1,861 2.69E-03
Ministry of Education, Science and Technology 2007
JUNIOR SECONDARY SCHOOLS 361 5.22E-04 SENIOR SECONDARY SCHOOLS 113 1.63E-04 TERTIARY 5 7.22E-06 School libraries 470 6.79E-04
Hospitals 8 1.16E-05 Ministry of Health, Jigawa State 2011
Dutse 1 1.44E-06
Supply of 150 KVA Gen Set
Gunel 1 1.44E-06 Kazaure 1 1.44E-06 Ringim 1 1.44E-06 Birnin Kudu 1 1.44E-06 Jahun 1 1.44E-06 Hadejia 1 1.44E-06 Babura 1 1.44E-06 Psychiatric Hospital Kazaure 1 1.44E-06 Supply of 60 KVA Gen Set Basirka PHC 1 1.44E-06 - TBL Referral Centre Hadejia 1 1.44E-06 - WF Centre Jahun 1 1.44E-06 -
Table 36. Facilities obtained from statistical reports of Jigawa State.

SUPPORT FOR THE ELABORATION OF THE MASTER PLAN FOR THE JIGAWA STATE ELECTRIFICATION
ENGR. MANUEL VILLAVICENCIO
!"#$%&
'()'
*"+%
,-.
/+%#
(0((
)0((
'0((
10((
20((
30((
40((
50((
60((
70((
)(0((
))0((
)'0((
)10((
)20((
)30((
)40((
)50((
)60((
)70((
'(0((
')0((
''0((
'10((
89:;<"=
89:;=%"#
!"##$%&#
'(()&
**
**
**
*+,-./
+,-./
+,-./
+,-./
+,-./
+,-./
+,-./
+,-./
+,-./
+,-./
+,-./
+,-./
+,-./
**
**
2))>'
)3((52
!01)$2
0(3)4
+5-5*
++*+5
++*+5
+,-67
+,//7
++58+
67,.,
6/.-/
66756
+/88/
+-576
558-+
-5-8,
6-.*+
5,.8.
+88,-
5*,56
558-+
8,88*
,*7,+,
/6,*/
--*-/
6-5++
5/-++
)'1)>7
227417
91)':$
))&$:;';<
/,57
78,,
78,,
78,,
78,,
787*
,,/-7
,,67.
,6//,
7-,-
875,
,67*5
,7.+8
/.*-
758/
,.6,-
,.-+5
,**+7
.-8/,
.8*57
.,-*/
.*+-/
,75,-
,.567
1)4>'
))3174
=1>('?&@"
?'(';'$)4
,.6*/
,.58.
,.58.
,.565
,.565
,.**8
,,.6*
//*7
86*.
/.-6
-//,
7*76
6/6,
6/,6
57**
7/.5
//,7
,*/-,
,66+*
,6.7,
,+-++
,.56-
,.,/6
,*8+6
'3(>)
7)'53
?"+-@;A#-,
"#=BC@:D
DE)((2
)((2
)((2
)((2
)((2
712
))7)
337
43'
432
46'
5)2
51'
46'
46(
44'
7(4
4'2
)'17
)115
)1(3
))13
)((2
766
')>5
57'(
C%@D.<
"#=BC@:D
DE(
((
((
((
)'(
)'(
)'(
)'(
)'(
((
()3
)13
)3(
((
((
((>6
'56
!%#&-"#=BC@:DD
E)
))
))
)7
7)6
)6)6
)6)6
)()6
)4)4
)4)6
)5)5
)5)5
)(>1
)()
FD+G-&"E
4)4)
4)4)
4)4)
4))12
'15
'15
'15
)77
)77
)76
)76
)76
'14
'14
)6)
)1)
)1)
)1)
)1(
4)1>3
)'55
F%"E&:B@%.&%#B;[email protected]@
762
762
762
762
762
762
)''
316
416
376
422
324
37)
4'4
473
46'
427
436
764
771
))57
))22
))11
))'4
)7>3
5)((
ADE-@%BAD
+&;C&"&-D.
21)
21)
21)
21)
21)
21)
4741)
41)
4747
4747
4747
4747
4721)
21)
21)
2))
21)
21)
5>)
'372
AD+&BHII-@%
)))5
)))5
)))5
)))5
)))5
)))5
)))5
21(
)124
3'5
3'5
3'5
3'5
3'5
('5')
'5')
'511
'511
))))
))'7
))'7
))'7
'4>3
747)
*:J#@:;,
D+KJ
%4'4
4'4
4'4
4'4
4'4
4'4
4'4
15'
1414
1414
1414
1414
31(
65)
65)
65)
65)
65)
65)
4'4
))>2
2)47
*D,,J.
-&=B*%
.&%#
1435
1435
1435
1435
1435
1435
146'
)433
'747
14)4
'121
'121
)41(
)41(
))'(
))'(
))'(
'121
2743
462(
3344
16(7
16(7
1435
54>'
'5575
L$#-@JE&J#%BM%G
D&725
7)5
7)5
7)5
7)5
41(
7(7
))62
))62
67(
67(
))62
676
67(
67(
67(
67(
)'2)
)25)
)764
)47'
)413
)413
)(4'
'4>5
751'
H#G:"."$%
)6'6
)64)
)64)
)6'6
)6'6
)6'6
)6'6
)6'6
77
77
77
77
77
742
427
77
)2>7
3232
*%.&#"EBN
DO%#.,
%.&BHII-@%
((
((
((
(2
22
2)
))
)1
11
''
''
''
(>(
)3
A#DO-.@-"EBNDO%#.,
%.&BHII-@%
'(
((
((
(1
)3)3
)3)3
)3)3
)3)'
)'3
)')'
)')'
11
(>'
5(
M-+&#-@&BNDO%#.,
%.&BHII-@%
6(
((
((
((
4'4'
4'4'
4'4'
4'32
32)5
4'4'
4'4'
66
(>6
1(2
PD@"EBL
<,-.-+&#"&-D.BHII-@%
4(
((
((
())
3737
3727
2727
2727
27')
3737
3737
)')'
(>6
'56
*DJ#&
((
((
((
((
))
))
))
))
)'
))
))
))
(>(
5
H&:%#
,,7
,,7
,,7
,,7
,,7
8*8*
,.*
.,6
.,6
..,
.,.
.,.
.,.
.,.
.,.
.*7
6*6
+6-
+6-
+6-
+,7
+,7
+,7
3>1
)723
A0;"(&=0B
$%&CD
EF
66G+
6+G5
6+G5
6.G*
6.G+
6+G6
/*G.
,,*G+
,,.G/
/-G6
/5G7
88G5
,,8G5
,*,G8
/6G,
8,G8
8+G.
87G6
,--G,
,/+G,
,.*G+
8/G8
/-G*
7.G*
=$"H&CD
EF
,/+G,
A0;"(&&3$
#":
3&CD
E2I<$"%F
..*8
/*-+/+
A'#$&C2%F&&&&J&&&&=0
B$%&CH
EF
QE%@&#-@B%.%
#$=B<%
,".<
!"#$%&
'()'
*"+%
,"-
.+%#
(/((
)/((
'/((
0/((
1/((
2/((
3/((
4/((
5/((
6/((
)(/((
))/((
)'/((
)0/((
)1/((
)2/((
)3/((
)4/((
)5/((
)6/((
'(/((
')/((
''/((
'0/((
789:;"<
789:<%"#
!"##$%&#
'(()&
**
**
**
*++
,,-
++,,-
++,,-
++,,-
++,,-
++,,
-++,,
-++,,
-++,,
-++
,,-
++,,-
++,,-
++,,-
**
**
10)=6
)2432'
!./)$0
.(1)2
+3+45
+67*,
+67*,
++,-3
++657
+-846
3***
-38
,8*
-4--5
6*537
+4+87
67,++
375-
4-5*6
86++7
7685+
86,
87,
67,++
533+-
88,-6*
456*3
356*6
-5,4,
-8*45
)'61=)
14'010
9/)':$
))&$:;';<
4--5
4+88
4+88
4+88
4+88
4+7+
8,63
38,
8-3
8334+
4**8
8*,++
83657
8488
*43
,874
778+86
48+
,7,
8*-6+
,4+6+
+*-86
,,355
,8+57
84,53
8+*43
00'=)
)')'''
=/>('?&@"
?'(';'$)2
8+8+8
8+883
8+883
8+*73
8+*73
8,388
8848
+5,6+
5538
433,
7,*7
768,
38,7
3*45
6587
4,**
5,66
88+77
83,4-
83*86
86,5,
8+*-4
8,74*
88637
'3'=0
6240(
>"+?@
:A#?,
"#<BC@9D
DE)(21
)(21
)(21
)(21
)(21
65)
)'2)
254
352
354
4)4
42(
436
4)4
4)2
363
62)
323
)0()
)1(1
)04)
))60
)(21
)(04
''=5
50'(
C%@DF;
"#<BC@9D
DE(
((
((
((
)'3
)'3
)'3
)'3
)'3
((
()3
)1)
)3(
((
((
((=5
'6'
!%#&?"#<BC@9DD
E)
))
))
)6
)()6
)6)6
)6)6
)))6
)4)4
)4)6
)5)5
)5)5
)(=0
)(4
GD+H?&"
E31
3131
3131
3131
)1(
'16
'16
'16
'(6
'(6
'(5
'(5
'(5
'15
'15
)6(
)05
)05
)05
)04
310=4
)01)
G%"E&9B@%F
&%#B:B@E?F?@
)(01
)(01
)(01
)(01
)(01
)(01
)'5
233
34)
3'6
343
240
3')
324
40(
4)4
35'
36'
)(03
)(10
)'05
)'('
))6(
))50
'(=1
4126
ADE?@%BAD
+&:C&"&?D
F120
120
120
120
120
120
40330
330
4040
4040
4040
4040
40120
120
120
10'
120
120
4=2
'4'2
AD+&BIJJ?@%
))41
))41
))41
))41
))41
))41
))41
12)
)1)1
221
221
221
221
221
('526
'526
'54)
'54)
)')'
))53
))53
))53
'4=6
)()5(
*9K#@9:,
D+LK
%325
325
325
325
325
325
325
06)
0404
0404
0404
0404
223
6)2
6)2
6)2
6)2
6)2
6)2
325
)'=(
105(
*D,,KF
?&<B*%F
&%#
051)
051)
051)
051)
051)
051)
0535
)406
0))6
0465
'13)
'13)
)4)'
)4)'
))44
))44
))44
'13)
2')3
4)52
2514
1(('
1(('
051)
5(=(
'6'()
M$#?@KE&K#%BN%H
D&662
630
630
630
630
33'
622
)'11
)'11
602
602
)'11
610
602
602
602
602
)0(1
)212
'(53
)445
)4)4
)4)4
)))2
'5=(
)(''1
I#H9"F"$%
)6'(
)622
)622
)6'(
)6'(
)6'(
)6'(
)6'(
)()(
)()(
)()(
)()(
)()(
)(34
34)(
)()(
)2=4
240(
*%F&#"EBO
DP%#F,
%F&BI
JJ?@%
((
((
((
(1
11
1)
))
)0
00
''
''
''
(=(
)2A#DP?F@?"EBODP%#F,
%F&BI
JJ?@%
'(
((
((
(0
)2)2
)2)2
)2)2
)2)'
)'2
)')'
)')'
00
(='
4(N?+&#?@&BO
DP%#F,
%F&BI
JJ?@%
5(
((
((
((
3'3'
3'3'
3'3'
3'21
21)4
3'3'
3'3'
55
(=5
0(1
QD@"EBM
;,?F?+&#"&?D
FBIJJ?@%
3(
((
((
())
2626
2616
1616
1616
16')
2626
2626
)')'
(=5
'45
*DK#&
((
((
((
((
))
))
))
))
)'
))
))
))
(=(
4I&9%#
887
887
887
887
887
5*5*
8,*
,8-
,8-
,,8
,8,
,8,
,8,
,8,
,8,
,*7
-*-
+-3
+-3
+-3
+87
+87
+87
2=0
)612
A.;"(&=.B
$%&CD
EF
-4G8
-3G8
-3G8
-6G3
-6G5
-3G,
46G+
88-G4
884G6
5*G5
45G*
8*6G6
8,-G6
8*7G*
45G6
53G-
57G5
8*,G6
876G-
85,G+
8,3G6
8*+G5
5*G6
7-G3
=$"H&CD
EF
85,G+
A.;"(&&1$
#":
1&CD
E0I<$"%F
,+,*
463564
A'#$&C0%F&&&&J&&&&=.
B$%&CH
EF
RE%@&#?@B%F%
#$<B;%
,"F;
Dai
ly lo
ad c
urve
s es
timat
ed fo
rJig
awa
Stat
e by
201
2

SUPPORT FOR THE ELABORATION OF THE MASTER PLAN FOR THE JIGAWA STATE ELECTRIFICATION
ENGR. MANUEL VILLAVICENCIO
!"#$%&
'('(
)"*%
+,-
.*%#
(/((
0/((
'/((
1/((
2/((
3/((
4/((
5/((
6/((
7/((
0(/((
00/((
0'/((
01/((
02/((
03/((
04/((
05/((
06/((
07/((
'(/((
'0/((
''/((
'1/((
89:;<"=
89:;=%"#
!"##$%&#
'(()&
**
**
**
*+,,-.
+,,-.
+,,-.
+,,-.
+,,-.
+,,-.
+,,-.
+,,-.
+,,-.
+,,-.
+,,-.
+,,-.
+,,-.
**
**
342>(
'(3640
!/0)$1
/(2)3
,4.5*
,.445
,.445
,+6-*
,+.67
,868-
85-.+
8,*78
8*,8,
+66,*
,7+74
+-8--
4**.5
8*-8*
++45+
+,66,
+,+46
+-8--
77856
558**4
7658*
45.+6
855*7
.688,
0112>(
264672
90)':$
))&$:;';<
55548
5*-.6
5*-.6
5*-.6
5*-.6
5*7,,
5864-
5.-4,
654-.
5*++4
5,,8,
65.+6
6,8+-
556.4
5*6-.
54587
54,,5
5,484
,4*5*
,7-+.
678+5
647+*
6,-75
54*--
211>5
036'7'
=0>('?&@"
?'(';'$)3
545-7
54584
54584
5455.
5455.
58+7-
5.+.4
5655.
5,*74
55+**
7.*,
748+
-*-8
-*,8
8.*4
5*47,
565.+
5.*,8
65+*+
65*+7
5--*5
54548
58-*6
5.*-4
122>3
0'3527
?"*,@;A#,+
"#=BC@:D
DE0(65
0(65
0(65
0(65
0(65
0(00
0'7(
4(3
5(4
5(7
517
551
571
517
515
505
760
454
012'
0225
0201
0''7
0(65
0(47
'1>3
6354
C%@D-<
"#=BC@:D
DE(
((
((
((
0'7
0'7
0'7
0'7
0'7
((
(04
024
04(
((
((
((>6
1(0
!%#&,"#=BC@:DD
E0
00
00
00(
0(07
0707
07'(
0007
0505
0507
0606
0606
0(>1
00(
FD*G,&"E
4444
4444
4444
44023
'34
'34
'34
'03
'03
'02
'02
'02
'34
'34
074
02'
02'
02'
020
441>6
0161
F%"E&:B@%-&%#B;B@E,-,@
0(44
0(44
0(44
0(44
0(44
0(44
01'
361
470
426
475
370
42(
456
53'
517
5(1
501
0(45
0(53
0'54
0'17
0''5
0'07
'0>0
5466
ADE,@%BAD
*&;C&"&,D-
245
245
245
245
245
245
53461
461
5353
5353
5353
5353
53245
245
245
223
245
245
5>5
'6(7
AD*&BHII,@%
0'0(
0'0(
0'0(
0'0(
0'0(
0'0(
0'0(
243
0236
350
350
350
350
350
('725
'725
'737
'737
0'0'
0'''
0'''
0'''
'6>5
0(272
):J#@:;+
D*KJ
%456
456
456
456
456
456
456
2(1
1717
1717
1717
1717
352
721
721
721
721
721
721
456
0'>2
2303
)D++J-
,&=B)%
-&%#
174(
174(
174(
174(
174(
174(
1765
057'
1'03
1703
'315
'315
0543
0543
0'01
0'01
0'01
'315
3155
52(4
4('6
20'3
20'3
174(
6'>3
1(0((
L$#,@JE&J#%BM%G
D&0('4
771
771
771
771
46'
762
0'6'
0'6'
742
742
0'6'
75'
742
742
742
742
0122
037'
'030
061'
055(
055(
003(
'6>7
0(317
H#G:"-"$%
0757
'(03
'(03
0757
0757
0757
0757
0757
0(0(
0(0(
0(0(
0(0(
0(0(
0(47
470(
0(0(
04>'
37(4
)%-&#"EBN
DO%#-+
%-&BHII,@%
((
((
((
(2
22
20
00
01
11
''
''
''
(>(
03
A#DO,-@,"EBNDO%#-+
%-&BHII,@%
'(
((
((
(1
0303
0303
0303
030'
0'3
0'0'
0'0'
11
(>'
5(
M,*&#,@&BNDO%#-+
%-&BHII,@%
6(
((
((
((
4'4'
4'4'
4'4'
4'32
3205
4'4'
4'4'
66
(>6
1(2
PD@"EBL
<+,-,*&#"&,D-BHII,@%
6(
((
((
(01
5151
5140
4040
4040
40'4
5151
5151
0303
0>(
126
)DJ#&
((
((
((
((
00
00
00
00
0'
00
00
00
(>(
5
H&:%#
5+-
5+-
5+-
5+-
5+-
55+
55+
5.,
64,
64,
6-*
68-
68-
68-
68-
68-
686
8+*
+.5
+.5
+.5
+*6
+*6
+*6
4>6
'242
A/;"(&=/B
$%&CD
EF
8.G7
8,G-
8,G-
86G6
86G.
8,G4
7,G8
5,+G.
5,-G8
5*4G.
5*.G4
56,G+
5+.G6
56,G.
5*+G7
55+G8
558G,
56*G7
6*5G+
66*G,
5+*G8
558G4
5*5G-
-+G-
=$"H&CD
EF
66*G,
A/;"(&&2$
#":
2&CD
E1I<$"%F
6848
748474
A'#$&C1%F&&&&J&&&&=/
B$%&CH
EF
QE%@&#,@B%-%
#$=B<%
+"-<
!"#$%&
'('(
)"*%
+",
-*%#
(.((
/.((
'.((
0.((
1.((
2.((
3.((
4.((
5.((
6.((
/(.((
//.((
/'.((
/0.((
/1.((
/2.((
/3.((
/4.((
/5.((
/6.((
'(.((
'/.((
''.((
'0.((
789:;"<
789:<%"#
!"##$%&#
'(()&
**
**
**
*+,-.-
+,-.-
+,-.-
+,-.-
+,-.-
+,-.-
+,-.-
+,-.-
+,-.-
+,-.-
+,-.-
+,-.-
+,-.-
**
**
31/=/
'0066/
!/0)$1
/(2)3
+45-6
+*56,
+*56,
-7,56
-,4+8
+.44-
8*-*5
8.8.7
575.4
+7***
++7,+
66-+.
8,54-
5,.85
6*74-
+,.4,
+,+.4
66-+.
..-44-
.-.76,
.*+86-
7.-.7
5,+6,
6,76,
/2/3='
2201'2
90)':
$))&$
:;';<
.48*-
.4--6
.4--6
.4--6
.4--6
.4+48
.76*4
.7*+4
4+854
..786
.6.77
4++75
4578,
.48,6
..5,.
.,6.6
.,5,,
.65+,
+4*58
+647,
--5,.
-.867
48.66
.,+4-
16'=6
/466'/
=0>('?&@"
?'(';'$)3
.,6*+
.,+7-
.,+7-
.,+4+
.,+4+
.784,
.86+5
.-8-5
.+7**
.4784
.*8.+
..*.8
,.*,
,*64
8-.+
.4.77
.-8-5
.5,64
4+4*7
4-7*6
4.46*
.,+.-
.,*..
.8*54
056=5
/1''56
>"*?@
:A#?+
"#<BC@9D
DE/'02
/'02
/'02
/'02
/'02
//16
/133
355
5(0
5(2
51(
546
6(/
51(
504
5/2
///2
436
/2'2
/312
/3(3
/064
/'02
/'/2
'3=4
6415
C%@DF;
"#<BC@9D
DE(
((
((
((
/14
/14
/14
/14
/14
((
(/5
/33
/5(
((
((
((=6
01'
!%#&?"#<BC@9DD
E/
//
//
///
//''
''''
''''
/0''
/6/6
/6''
'/'/
'/'/
/(=0
/'2
GD*H?&"
E42
4242
4242
4242
/31
'6'
'6'
'6'
'12
'12
'11
'11
'11
'6(
'6(
''0
/3/
/3/
/3/
/3(
421=0
/24'
G%"E&9B@%
F&%#B:B@E?F?@
/'//
/'//
/'//
/'//
/'//
/'//
/2(
330
453
404
46'
34'
4'5
44(
522
506
466
5/(
/'/0
/'''
/12/
/1(5
/062
/053
'0=6
5406
ADE?@%BAD
*&:C&"&?D
F20/
20/
20/
20/
20/
20/
52444
444
5252
5252
5252
5252
5220/
20/
20/
2(3
20/
20/
5=4
0/6'
AD*&BIJJ?@%
/042
/042
/042
/042
/042
/042
/042
2'6
/324
316
316
316
316
316
(002(
002(
0031
0031
/1/1
/056
/056
/056
0'=4
//6'4
)9K#@9:+
D*LK
%44/
44/
44/
44/
44/
44/
44/
125
1111
1111
1111
1111
32'
/(4'
/(4'
/(4'
/(4'
/(4'
/(4'
44/
/1=/
2/0'
)D++KF
?&<B)%F
&%#
12(/
12(/
12(/
12(/
12(/
12(/
120'
'(04
0321
112(
'550
'550
'((3
'((3
/046
/046
/046
'550
3//'
51/5
352/
1356
1356
12(/
60=4
01'/0
M$#?@KE&K#%BN%H
D&//33
//'5
//'5
//'5
//'5
443
///6
/124
/124
/(62
/(62
/124
//(2
/(62
/(62
/(62
/(62
/2'5
/5/(
'112
'(50
'(/'
'(/'
/0(4
0'=5
//646
I#H9"F"$%
''2(
''6(
''6(
''2(
''2(
''2(
''2(
''2(
////
////
////
////
////
//45
45//
////
/5=1
34/0
)%F&#"EBO
DP%#F+
%F&BI
JJ?@%
((
((
((
(1
11
1/
//
/0
00
''
''
''
(=(
/2A#DP?F@?"EBODP%#F+
%F&BI
JJ?@%
'(
((
((
(0
/2/2
/2/2
/2/2
/2/'
/'2
/'/'
/'/'
00
(='
4(N?*&#?@&BO
DP%#F+
%F&BI
JJ?@%
5(
((
((
((
3'3'
3'3'
3'3'
3'21
21/4
3'3'
3'3'
55
(=5
0(1
QD@"EBM
;+?F?*&#"&?D
FBIJJ?@%
5(
((
((
(/0
4040
403/
3/3/
3/3/
3/'3
4040
4040
/2/2
/=(
015
)DK#&
((
((
((
((
//
//
//
//
/'
//
//
//
(=(
4I&9%#
.+7
.+7
.+7
.+7
.+7
..+
..+
.6-
48-
48-
47*
457
457
457
457
457
454
5+*
+6.
+6.
+6.
+*4
+*4
+*4
3=5
'131
A/;"(&=/B
$%&CD
EF
8+G7
84G6
84G6
8*G8
8.G*
84G+
.*5G+
.64G7
.68G6
.44G.
.4*G.
.+*G4
.5+G,
.+*G-
..,G.
.-*G.
.-4G4
.-8G-
447G7
46*G-
.6,G8
.-4G6
..6G5
,5G-
=$"H&CD
EF
46*G-
A/;"(&&2$
#":
2&CD
E1I<$"%F
-*+*
..*,545
RE%@&#?@B%F%
#$<B;%
+"F;
A'#$&C1%F&&&&J&&&&=/
B$%&CH
EF
Dai
ly lo
ad c
urve
s es
timat
ed fo
rJig
awa
Stat
e by
202
0

SUPPORT FOR THE ELABORATION OF THE MASTER PLAN FOR THE JIGAWA STATE ELECTRIFICATION
ENGR. MANUEL VILLAVICENCIO
B. Meteorological complementary information.
Station
Dataset
Year
Jan Feb Mar April May June July Aug Sept Oct Nov Dec
Birnin-‐kudu
Wind speed [Km/h] 2000 2.0 3.4 2.4 2.8 3.2 3.5 2.5 1.5 1.3 1.6 1.6 1.2
Birnin-‐kudu
Wind speed [Km/h] 2002 -‐ 4.0 4.7 6.1 6.2 6.4 5.1 3.9 3.4 2.8 -‐ -‐
Birnin-‐kudu
Wind speed [Km/h] 2003 3.4 3.6 4.8 5.9 5.8 5.8 4.6 4.4 3.6 3.2 3.6 3.5
Birnin-‐kudu
Wind speed [Km/h] 2004 3.6 4.0 4.1 5.6 6.4 -‐ -‐ -‐ -‐ -‐ -‐ -‐
Birnin-‐kudu Max_temp [ºC] 2000 26.8 24.4 28.7 35.1 34.2 29.2 27.3 27.3 26.0 30.8 29.8 27.2
Birnin-‐kudu Max_temp [ºC] 2002 21.4 25.7 31.9 33.9 33.8 31.4 28.0 26.9 27.8 28.6 -‐ -‐
Birnin-‐kudu Max_temp [ºC] 2003 25.7 28.6 30.3 34.1 33.6 27.6 27.5 26.9 27.8 31.0 29.3 25.6
Birnin-‐kudu Max_temp [ºC] 2004 26.3 23.6 30.1 35.1 33.5 -‐ -‐ -‐ -‐ -‐ -‐ -‐
Birnin-‐kudu
Min_temp [ºC] 2000 14.8 13.5 18.8 25.4 25.2 24.2 22.9 22.4 21 21.9 16.8 13.6
Birnin-‐kudu
Min_temp [ºC] 2002 13.4 15.9 22.3 25.9 25.9 24.8 23.5 22.7 21.6 21.3 -‐ -‐
Birnin-‐kudu
Min_temp [ºC] 2003 13.1 17.2 19.1 24.4 23.5 22.1 22.5 22 21.6 22.7 19.4 14.9
Birnin-‐kudu
Min_temp [ºC] 2004 15.1 14.1 20 25.4 26.4 -‐ -‐ -‐ -‐ -‐ -‐ -‐
Birnin-‐kudu
Rel. Humidity [%] 2000 41.2 35.1 30.8 38.1 36.5 66.2 41.3 81.1 75.5 62 44.7 38.1
Birnin-‐kudu
Rel. Humidity [%] 2002 46.1 41.1 35.1 43.2 56.2 59.8 78.1 85.5 84.1 86.4 -‐ -‐
Birnin-‐kudu
Rel. Humidity [%] 2003 39 31.5 39 43.5 55 78.9 83.3 85.3 82.3 70.6 51.1 49
Birnin-‐kudu
Rel. Humidity [%] 2004 42.5 34.4 42.4 46.8 62.4 -‐ -‐ -‐ -‐ -‐ -‐ -‐
Gumel Wind speed [Km/h] 2000 3.8 4.1 4.5 6.2 -‐ 3.9 4.3 4.0 3.9 3.9 4.3 4.1
Gumel Wind speed [Km/h] 2002 4.5 4.6 4.8 4.6 4.3 4.5 4.3 3.4 3.8 4.2 4.6 -‐

SUPPORT FOR THE ELABORATION OF THE MASTER PLAN FOR THE JIGAWA STATE ELECTRIFICATION
ENGR. MANUEL VILLAVICENCIO
Gumel Wind speed [Km/h] 2003 4.6 4.6 4.1 -‐ 4.5 4.2 3.8 3.6 4.1 5.0 -‐ 4.5
Gumel Wind speed [Km/h] 2004 4.1 5.6 6.6 5.1 5.5 5.3 4.9 4.3 5.8 1.8 -‐ -‐
Gumel Max_temp [ºC] 2000 33.5 32.1 35.2 42.7 -‐ 39.2 31.5 33.0 35.5 38.4 36.3 31.2
Gumel Max_temp [ºC] 2002 27.9 33.0 37.2 40.5 41.4 38.9 35.8 33.2 36.4 36.8 36.4 -‐
Gumel Max_temp [ºC] 2003 33.4 34.6 35.2 39.6 40.1 38.4 32.5 33.0 34.1 38.0 37.2 34.3
Gumel Max_temp [ºC] 2004 32.7 33.9 38.9 41.9 40.9 38.1 37.9 32.9 33.9 38.9 -‐ -‐
Gumel Min_temp
[ºC] 2000 10.9 10.4 17.2 21 -‐ 25 22.6 19 20.1 18.3 13.9 9.2
Gumel Min_temp
[ºC] 2002 10.9 12.3 15.8 21.9 24.7 24.1 23.2 20 20.9 19.4 13.6 -‐
Gumel Min_temp
[ºC] 2003 9.3 10.6 12.5 18.1 21.5 20.5 20.2 21.1 21.4 17.7 14.4 10.5
Gumel Min_temp
[ºC] 2004 9.13 11.5 16.5 22.6 21.2 19.9 20.3 19.2 19.1 16 -‐ -‐
Gumel Rel. Humidity
[%] 2000 15 29 19.6 41 -‐ 54.2 68.2 73 70 43.6 18.9 19.8
Gumel Rel. Humidity
[%] 2002 29.2 29.2 27.2 37.2 41 48.4 49.8 69.8 66.2 43.6 25.6 -‐
Gumel Rel. Humidity
[%] 2003 22.9 25.1 20.5 22.5 44 56.4 10.5 25.3 69.9 41.2 28.8 34
Gumel Rel. Humidity
[%] 2004 28.5 30 29.6 46.1 52.9 67.4 77.7 73.6 68.4 46.1 -‐ -‐ Table 37. Meteroological information. Source: Birmin Kudu and Gumel metrological stations.

SUPPORT FOR THE ELABORATION OF THE MASTER PLAN FOR THE JIGAWA STATE ELECTRIFICATION
ENGR. MANUEL VILLAVICENCIO
C. Solar potential complementary information.
Monthly Averaged Clear Sky Insolation Incident On A Horizontal Surface (kWh/m2/day)
Lat Long Jan Feb Mar April May June July Aug Sept Oct Nov Dec Annual AVG
11 8 5.58 6.33 6.78 7.16 7.02 6.64 6.60 6.64 6.43 6.06 5.68 5.40 6.36 11 9 5.64 6.34 6.77 7.14 7.05 6.73 6.63 6.67 6.46 6.10 5.71 5.34 6.58
11 10 5.69 6.41 6.93 7.25 7.20 6.96 6.67 6.65 6.47 6.16 5.75 5.43 6.74 11 11 5.69 6.39 6.89 7.19 7.10 6.95 6.71 6.67 6.51 6.17 5.68 5.36 6.79
Lat Long Jan Feb Mar April May June July Aug Sept Oct Nov Dec Annual AVG
12 8 5.57 6.42 6.97 7.39 7.34 7.06 6.76 6.69 6.41 6.15 5.81 5.37 6.61 12 9 5.67 6.53 7.05 7.47 7.44 7.23 6.98 6.85 6.58 6.26 5.89 5.41 6.80
12 10 5.63 6.44 6.96 7.36 7.32 7.13 6.93 6.75 6.51 6.22 5.80 5.39 6.80 12 11 5.65 6.47 7.01 7.36 7.20 7.08 6.98 6.75 6.49 6.14 5.81 5.37 6.87
Lat Long Jan Feb Mar April May June July Aug Sept Oct Nov Dec Annual AVG
13 8 5.78 6.63 7.26 7.68 7.62 7.52 7.37 7.18 6.88 6.49 6.05 5.47 6.92
13 9 5.74 6.59 7.24 7.64 7.57 7.41 7.29 7.14 6.84 6.51 6.05 5.48 6.96 13 10 5.61 6.48 7.12 7.54 7.44 7.27 7.13 6.97 6.68 6.36 5.92 5.37 6.91
13 11 5.76 6.60 7.17 7.53 7.43 7.23 7.23 7.04 6.80 6.54 6.01 5.52 7.07 Table 38. Clear Sky factor. Source: NASA.
Monthly Averaged Surface Albedo (0 to 1.0)
Lat Long Jan Feb Mar April May June July Aug Sept Oct Nov Dec
11 8 0.27 0.29 0.29 0.28 0.27 0.26 0.24 0.24 0.23 0.24 0.26 0.27 11 9 0.26 0.28 0.28 0.28 0.28 0.27 0.25 0.24 0.23 0.24 0.26 0.26
11 10 0.28 0.29 0.30 0.29 0.30 0.29 0.27 0.25 0.24 0.25 0.27 0.27 11 11 0.27 0.29 0.29 0.29 0.30 0.29 0.28 0.26 0.24 0.25 0.26 0.27
Lat Long Jan Feb Mar April May June July Aug Sept Oct Nov Dec 12 8 0.30 0.31 0.32 0.32 0.31 0.30 0.28 0.26 0.25 0.27 0.30 0.29
12 9 0.31 0.32 0.33 0.33 0.33 0.33 0.32 0.29 0.28 0.29 0.31 0.30 12 10 0.30 0.31 0.32 0.32 0.32 0.33 0.31 0.28 0.26 0.28 0.29 0.29
12 11 0.30 0.32 0.32 0.32 0.32 0.33 0.32 0.28 0.26 0.27 0.29 0.29
Lat Long Jan Feb Mar April May June July Aug Sept Oct Nov Dec
13 8 0.33 0.35 0.35 0.36 0.37 0.38 0.37 0.34 0.32 0.33 0.34 0.33
13 9 0.32 0.35 0.35 0.35 0.36 0.37 0.37 0.34 0.31 0.33 0.33 0.32 13 10 0.31 0.33 0.33 0.34 0.34 0.36 0.35 0.32 0.29 0.30 0.31 0.31
13 11 0.32 0.35 0.35 0.36 0.37 0.38 0.37 0.34 0.31 0.32 0.33 0.32 Table 39. Surface Albedo. Source: NASA.

SUPPORT FOR THE ELABORATION OF THE MASTER PLAN FOR THE JIGAWA STATE ELECTRIFICATION
ENGR. MANUEL VILLAVICENCIO
D. Biomass potential complementary information.
Sown Area by year of Jigawa State [1000 Ha]
Year Millet Sorghum Groundnut Beans Maize Rice Melon
1995 510 490 160 300 19 14 -‐
1996 700 600 190 308 5 17 -‐
1997 734 678 212 616 12 27 -‐
1998 312 235 23 149 4 27 -‐
1999 420 340 97 220 4 22 5
2000 355 242 68 175 5 23 -‐
2001 287 201 59 211 6 26 -‐
2002 242 184 67 123 12 42 5
2003 277 193 53 147 8 18 -‐
2004 255 189 62 143 8 18 -‐
2005 273 206 63 153 7 19 2
2006 347 167 42 178 6 22 -‐ Table 40. Area Sown of Jigawa State. Source: National Bureau of Statistics 2011.
Crop
Residue type
RPR
Calorific value [GJ/ton]
Moisture content
Maize Wastes 6 18 10%
Rice Wastes 1.7 12 10%
Sorghum Wastes 2.5 18 15%
Cowpeas Straw 2.9 12 10%
Groundnuts Shell, stalk, leaves 0.25 17 8%
Millet Straw, bran 2 13 15%
Soybean Straw 1 -‐ 3.94 13 15%
Sugarcane Bagasse 0.29 17 18% RPR: Residue to Product Ratio.
Table 41. Crop characteristics and properties.
Source: (1) Auke Koopmans and Jaap Koppejan (1997). "Agricultural and Forest Residues – Generation, Utilization and Availability"; (2) Memento de l’agronome : quatrième edition, page 1640; (3) J lamptey and al. 1990, Bioenergy. IDRC/UNU, page 210 (4) CowiConsult, 1984. “Etude d’une utilisation efficace des déchets agricoles comme fuel domestiques au Sénégal”,
page 250.
Specie Daily manure yield as % of liveweight
Min. Animal liveweight [Kg]
Max. Animal liveweight [Kg]
Min. Dung yield [Kg/day]
Max. Dung yield [Kg/day]
LHV [Gj/ton]
Cattle 5 135 800 6.8 40 17.5
Buffalo 5 340 420 17 21 Pigs 2 30 75 0.6 1.5 16
Sheep & goats 3 30 100 0.9 3 15
Chickens 4.5 1.5 3 0.1 0.1 15 LHV: low heating value.
Table 42. Dung yield of different species. Source: (1) Memento de l’agronome : quatrième edition; (2) GTZ, 1989. Biogas plants in animal husbandry.

SUPPORT FOR THE ELABORATION OF THE MASTER PLAN FOR THE JIGAWA STATE ELECTRIFICATION
ENGR. MANUEL VILLAVICENCIO
Annex III
A. Power Systems Costs
Table 43. Power plants capital and operating costs. Source: EIA, 2010.

SUPPORT FOR THE ELABORATION OF THE MASTER PLAN FOR THE JIGAWA STATE ELECTRIFICATION
ENGR. MANUEL VILLAVICENCIO
B. Power optimization inputs
Horizon 2012_min 2012_max 2020_min 2020_max Load type Weekdays Weekend Weekdays Weekend Weekdays Weekend Weekdays Weekend
Hour Target (KW) Target (KW) Target (KW) Target (KW)
0 5529 5529 5808 5808 32937 32937 37421 37421
1 5344 5344 5613 5613 31895 31895 36238 36238
2 5344 5344 5613 5613 31895 31895 36238 36238
3 5202 5202 5464 5464 31124 31124 35362 35362
4 5225 5225 5488 5488 31248 31248 35503 35503
5 5347 5347 5617 5617 31849 31849 36190 36190
6 8024 8024 8428 8428 46794 46794 53177 53177
7 11027 8497 11583 8925 67234 49880 76404 56679
8 11276 8745 11843 9185 69315 51961 78743 59018
9 8651 6121 9085 6427 53731 36377 61030 41305
10 8472 5942 8898 6240 52874 35520 60055 40329
11 9937 7407 10437 7779 61690 44336 70078 50353
12 11941 9411 12542 9884 72585 55231 82462 62737
13 10185 7655 10698 8040 61769 44415 70168 50443
14 8512 5982 8940 6282 52445 35091 59571 39845
15 9188 6658 9650 6992 57285 39931 65073 45347
16 9322 6792 9791 7133 58171 40817 66080 46355
17 9749 7219 10238 7580 60438 43084 68627 48902
18 16613 14083 17449 14791 100706 83352 114406 94681
19 18308 15777 19229 16571 110143 92789 125133 105408
20 12035 12035 12640 12640 70301 70301 79847 79847
21 9889 9889 10386 10386 58329 58329 66244 66244
22 8603 8603 9036 9036 50901 50901 57813 57813
23 7203 7203 7564 7564 42419 42419 48172 48172 Table 44. Primary power load for the HOMER optimization.
C. AC Load: 10% - load 2012 Data source: Synthetic
Daily noise: 10%
Hourly noise: 5%
Scaled annual average:
210,380, 222,168 kWh/d
Scaled peak load: 24,993, 26,393 kW

SUPPORT FOR THE ELABORATION OF THE MASTER PLAN FOR THE JIGAWA STATE ELECTRIFICATION
ENGR. MANUEL VILLAVICENCIO
D. AC Load: 50% - load 2020 Data source: Synthetic
Daily noise: 10%
Hourly noise: 5%
Scaled annual average: 1,266,775, 1,446,770 kWh/d
Scaled peak load: 150,361, 171,725 kW
Load factor: 0.351

SUPPORT FOR THE ELABORATION OF THE MASTER PLAN FOR THE JIGAWA STATE ELECTRIFICATION
ENGR. MANUEL VILLAVICENCIO
E. Generator: Blend Diesel/BioDiesel Price: $ 0.77, 0.77, 1.21, 0.86/L
Lower heating value: 43.2 MJ/kg
Density: 820 kg/m3
Carbon content: 88.0%
Sulfur content: 0.330%
Generator control Check load following: Yes
Check cycle charging: No
Allow systems with multiple generators: Yes
Allow multiple generators to operate simultaneously: Yes
Allow systems with generator capacity less than peak load: Yes
Generator Costs Size (kW) Capital ($) Replacement ($) O&M ($/hr)
715.000 1,124,649 102,057 10.460
810.000 1,210,171 105,218 11.850
915.000 1,320,183 119,554 13.380
1,020.000 1,417,148 124,756 14.920
1,205.000 1,626,219 160,682 17.620
1,450.000 1,955,563 244,987 21.210
1,730.000 2,260,242 291,134 25.300
1,975.000 2,521,125 327,515 28.880
2,230.000 2,802,437 372,228 32.610
F. AC Generator: Gasification fraction Size (kW) Capital ($) Replacement ($) O&M ($/hr)
0.000 0 0 0.000
50,000.000 63,690,000 44,583,000 641.000
200,000.000 130,251,000 91,175,696 749.000
Sizes to consider: 0, 30,000, 50,000, 75,000 kW
Lifetime: 30,000 hrs
Min. load ratio: 30%
Heat recovery ratio: 0%
Fuel used: Biomass
Fuel curve intercept: 0.2 L/hr/kW
Fuel curve slope: 1.5 L/hr/kW
Biomass Resource Data source: Synthetic
Average availability: 100, 150, 200 t/d
Average price: $ 70/t
Carbon content: 5%
Gasification ratio: 0.7 kg gas/kg biomass
LHV of biogas: 12 MJ/kg

SUPPORT FOR THE ELABORATION OF THE MASTER PLAN FOR THE JIGAWA STATE ELECTRIFICATION
ENGR. MANUEL VILLAVICENCIO
G. PV & Converter Systems Size (kW) Capital ($) Replacement ($) O&M ($/yr)
7,000.000 13,975,500 9,782,850 21
Sizes to consider: 0, 180,000, 200,000, 220,000, 250,000, 300,000, 350,000 kW
Lifetime: 20 yr
Tracking system: No Tracking
Slope: 11 deg
Azimuth: 0 deg
Ground reflectance: 20%
H. Solar Resource Latitude: 11 degrees 0 minutes North
Longitude: 10 degrees 0 minutes East
Time zone: GMT +0:00
Data source: Synthetic
Month Clearness Index Average Radiation
(kWh/m2/day)
Jan 0.641 5.610
Feb 0.667 6.320
Mar 0.663 6.750
Apr 0.644 6.780
May 0.629 6.590
Jun 0.605 6.260
Jul 0.543 5.630
Aug 0.510 5.330
Sep 0.555 5.690
Oct 0.610 5.880
Nov 0.638 5.670
Dec 0.626 5.320
Annual average: 6.3 kWh/m²/d