
Project Management, Planning and Control - NIBM eHub
652
-
Upload
khangminh22 -
Category
Documents
-
view
0 -
download
0
Transcript of Project Management, Planning and Control - NIBM eHub


Project Management, Planning and Control

This page intentionally left blank

Project Management, Planning and Control
Managing Engineering, Construction and Manufacturing Projects to PMI,
APM and BSI Standards
Seventh Edition
Eur Ing Albert LesterCEng, FICE, FIMechE, FIStructE, Hon FAPM

Butterworth-Heinemann is an imprint of ElsevierThe Boulevard, Langford Lane, Kidlington, Oxford OX5 1GB, United Kingdom50 Hampshire Street, 5th Floor, Cambridge, MA 02139, United States
Copyright © 2017 Elsevier Ltd. All rights reserved.
No part of this publication may be reproduced or transmitted in any form or by any means, electronic or mechanical, including photocopying, recording, or any information storage and retrieval system, without permission in writing from the publisher. Details on how to seek permission, further information about the Publisher’s permissions policies and our arrangements with organizations such as the Copyright Clearance Center and the Copyright Licensing Agency, can be found at our website: www.elsevier.com/permissions.
This book and the individual contributions contained in it are protected under copyright by the Publisher (other than as may be noted herein).
NoticesKnowledge and best practice in this field are constantly changing. As new research and experience broaden our understanding, changes in research methods, professional practices, or medical treatment may become necessary.
Practitioners and researchers must always rely on their own experience and knowledge in evaluating and using any information, methods, compounds, or experiments described herein. In using such information or methods they should be mindful of their own safety and the safety of others, including parties for whom they have a professional responsibility.
To the fullest extent of the law, neither the Publisher nor the authors, contributors, or editors, assume any liability for any injury and/or damage to persons or property as a matter of products liability, negligence or otherwise, or from any use or operation of any methods, products, instructions, or ideas contained in the material herein.
Library of Congress Cataloging-in-Publication DataA catalog record for this book is available from the Library of Congress
British Library Cataloguing-in-Publication DataA catalogue record for this book is available from the British Library
ISBN: 978-0-08-102020-3
For information on all Butterworth-Heinemann publications visit our website at https://www.elsevier.com/books-and-journals
Publisher: Joe HaytonAcquisition Editor: Brian GuerinEditorial Project Manager: Ana GarciaProduction Project Manager: Jason MitchellDesigner: Maria Inês Cruz
Typeset by TNQ Books and Journals

v
Contents
Foreword to the First Edition �����������������������������������������������������������������������������xviiPreface �������������������������������������������������������������������������������������������������������������xixAcknowledgements ���������������������������������������������������������������������������������������������xxi
Chapter 1: Project Definition ������������������������������������������������������������������������������1Project Definition �����������������������������������������������������������������������������������������������������������1Time-Bound Project �������������������������������������������������������������������������������������������������������3Cost-Bound Project ��������������������������������������������������������������������������������������������������������4Performance (Quality)-Bound Project ���������������������������������������������������������������������������4Safety-Bound Project �����������������������������������������������������������������������������������������������������4
Chapter 2: Project Management ��������������������������������������������������������������������������7Project Manager �������������������������������������������������������������������������������������������������������������8Project Manager’s Charter ���������������������������������������������������������������������������������������������9Project Office �����������������������������������������������������������������������������������������������������������������9Further Reading �����������������������������������������������������������������������������������������������������������10
Chapter 3: Programme and Portfolio Management ����������������������������������������������13Portfolio Management �������������������������������������������������������������������������������������������������15Further Reading �����������������������������������������������������������������������������������������������������������16
Chapter 4: Project Context (Project Environment) �����������������������������������������������17Political ������������������������������������������������������������������������������������������������������������������������18Economic ���������������������������������������������������������������������������������������������������������������������19Social (or Sociological) �����������������������������������������������������������������������������������������������19Technical ����������������������������������������������������������������������������������������������������������������������20Legal ����������������������������������������������������������������������������������������������������������������������������21Environmental ��������������������������������������������������������������������������������������������������������������21Sustainability ���������������������������������������������������������������������������������������������������������������23Further Reading �����������������������������������������������������������������������������������������������������������23

vi Contents
Chapter 5: Business Case ����������������������������������������������������������������������������������25The Project Sponsor �����������������������������������������������������������������������������������������������������25Requirements Management �����������������������������������������������������������������������������������������26Further Reading �����������������������������������������������������������������������������������������������������������27
Chapter 6: Investment Appraisal �����������������������������������������������������������������������29Project Viability �����������������������������������������������������������������������������������������������������������29
Return on Investment ����������������������������������������������������������������������������������������������� 29Net Present Value ����������������������������������������������������������������������������������������������������� 30Payback �������������������������������������������������������������������������������������������������������������������� 33Internal Rate of Return ��������������������������������������������������������������������������������������������� 33Cost/Benefit Analysis ����������������������������������������������������������������������������������������������� 35
Further Reading �����������������������������������������������������������������������������������������������������������36
Chapter 7: Stakeholder Management �����������������������������������������������������������������37Direct Stakeholders ������������������������������������������������������������������������������������������������������37Indirect Stakeholders ���������������������������������������������������������������������������������������������������37
Chapter 8: Project-Success Criteria �������������������������������������������������������������������������������41Key Performance Indicators ����������������������������������������������������������������������������������������42
Chapter 9: Organization Structures �������������������������������������������������������������������43Functional Organization ����������������������������������������������������������������������������������������������43Matrix Organization �����������������������������������������������������������������������������������������������������43Project Organization (Taskforce) ���������������������������������������������������������������������������������44
Chapter 10: Organization Roles ������������������������������������������������������������������������������������47
Chapter 11: Project Life Cycles �������������������������������������������������������������������������������������49
Chapter 12: Work Breakdown Structures �����������������������������������������������������������53Responsibility Matrix ��������������������������������������������������������������������������������������������������58Further Reading �����������������������������������������������������������������������������������������������������������59
Chapter 13: Estimating�������������������������������������������������������������������������������������61Subjective ���������������������������������������������������������������������������������������������������������������������61Parametric ��������������������������������������������������������������������������������������������������������������������62Comparative (by Analogy) �������������������������������������������������������������������������������������������62Analytical ���������������������������������������������������������������������������������������������������������������������62Further Reading �����������������������������������������������������������������������������������������������������������65
Chapter 14: Project Management Plan ���������������������������������������������������������������67Methods and Procedures ����������������������������������������������������������������������������������������������70
Contents vii
Chapter 15: Risk Management ��������������������������������������������������������������������������73Stage 1: Risk Awareness ����������������������������������������������������������������������������������������������74Stage 2: Risk Identification ������������������������������������������������������������������������������������������74Stage 3: Risk Assessment ��������������������������������������������������������������������������������������������76Stage 4: Risk Evaluation ����������������������������������������������������������������������������������������������77Stage 5: Risk Management ������������������������������������������������������������������������������������������79Monitoring �������������������������������������������������������������������������������������������������������������������81Example of Effective Risk Management ���������������������������������������������������������������������82Positive Risk or Opportunity ���������������������������������������������������������������������������������������82Further Reading �����������������������������������������������������������������������������������������������������������83
Chapter 16: Quality Management ����������������������������������������������������������������������85History �������������������������������������������������������������������������������������������������������������������������87Quality Management Definitions ���������������������������������������������������������������������������������87
Quality ���������������������������������������������������������������������������������������������������������������������� 87Quality Policy ����������������������������������������������������������������������������������������������������������� 87Quality Management ������������������������������������������������������������������������������������������������ 87Quality Assurance (QA) ������������������������������������������������������������������������������������������� 88Quality Systems (Quality Management Systems or QMS) �������������������������������������� 88Quality Control (QC) ����������������������������������������������������������������������������������������������� 88Quality Manual ��������������������������������������������������������������������������������������������������������� 88Quality Programme �������������������������������������������������������������������������������������������������� 88Quality Plan �������������������������������������������������������������������������������������������������������������� 88Quality Audit ������������������������������������������������������������������������������������������������������������ 88Quality Reviews ������������������������������������������������������������������������������������������������������� 88Total Quality Management (TQM) �������������������������������������������������������������������������� 89
Explanation of the Definitions �������������������������������������������������������������������������������������89Quality Policy ����������������������������������������������������������������������������������������������������������� 89Quality Management ������������������������������������������������������������������������������������������������ 89Quality Assurance ���������������������������������������������������������������������������������������������������� 89Quality Systems �������������������������������������������������������������������������������������������������������� 90Quality Control ��������������������������������������������������������������������������������������������������������� 90Quality Manual ��������������������������������������������������������������������������������������������������������� 92Quality Programme �������������������������������������������������������������������������������������������������� 92Quality Plan �������������������������������������������������������������������������������������������������������������� 92Quality Audit ������������������������������������������������������������������������������������������������������������ 94Quality Reviews ������������������������������������������������������������������������������������������������������� 94Failure Mode Analysis (Cause and Effect Analysis) ������������������������������������������������ 94Pareto Analysis ��������������������������������������������������������������������������������������������������������� 96Trend Analysis ���������������������������������������������������������������������������������������������������������� 97
Further Reading �����������������������������������������������������������������������������������������������������������98

viii Contents
Chapter 17: Change Management ����������������������������������������������������������������������99Document-Control �����������������������������������������������������������������������������������������������������102Issue Management �����������������������������������������������������������������������������������������������������102
Baseline ������������������������������������������������������������������������������������������������������������������ 103Baseline Review ����������������������������������������������������������������������������������������������������� 104Pre-IBR ������������������������������������������������������������������������������������������������������������������� 104Preparation ������������������������������������������������������������������������������������������������������������� 104Execution ���������������������������������������������������������������������������������������������������������������� 104Postreview �������������������������������������������������������������������������������������������������������������� 104
Further Reading ���������������������������������������������������������������������������������������������������������104
Chapter 18: Configuration Management �����������������������������������������������������������105
Chapter 19: Basic Network Principles ��������������������������������������������������������������107Network Analysis �������������������������������������������������������������������������������������������������������108The Network ��������������������������������������������������������������������������������������������������������������108
Basic Rules ������������������������������������������������������������������������������������������������������������� 109Durations �������������������������������������������������������������������������������������������������������������������112Numbering �����������������������������������������������������������������������������������������������������������������113
Random ������������������������������������������������������������������������������������������������������������������ 113Topological ������������������������������������������������������������������������������������������������������������� 113Sequential ��������������������������������������������������������������������������������������������������������������� 114Coordinates ������������������������������������������������������������������������������������������������������������� 114
Hammocks �����������������������������������������������������������������������������������������������������������������117Ladders ������������������������������������������������������������������������������������������������������������������� 117
Precedence or Activity on Node Diagrams ����������������������������������������������������������������119Constraints �������������������������������������������������������������������������������������������������������������� 125
Bar (Gantt) Charts������������������������������������������������������������������������������������������������������126Time-Scale Networks and Linked Bar Charts �����������������������������������������������������������128Further Reading ���������������������������������������������������������������������������������������������������������130
Chapter 20: Planning Blocks and Subdivision of Blocks ���������������������������������������131Pharmaceutical Factory ���������������������������������������������������������������������������������������������132New Housing Estate ��������������������������������������������������������������������������������������������������132Portland Cement Factory �������������������������������������������������������������������������������������������133Oil Terminal ���������������������������������������������������������������������������������������������������������������133Multi-Storey Block of Offices �����������������������������������������������������������������������������������133Colliery Surface Reconstruction ��������������������������������������������������������������������������������134Bitumen Refinery �������������������������������������������������������������������������������������������������������134Typical Manufacturing Unit���������������������������������������������������������������������������������������135Subdivision of Blocks ������������������������������������������������������������������������������������������������136
Similar Items of Equipment ����������������������������������������������������������������������������������� 137Trades and Disciplines ������������������������������������������������������������������������������������������� 137

Contents ix
Geographical Proximity ����������������������������������������������������������������������������������������� 138Operational Systems ����������������������������������������������������������������������������������������������� 138Stages of Completion ��������������������������������������������������������������������������������������������� 140Banding ������������������������������������������������������������������������������������������������������������������ 140
Chapter 21: Arithmetical Analysis and Floats ����������������������������������������������������143Arithmetical Analysis ������������������������������������������������������������������������������������������������143
Slack ����������������������������������������������������������������������������������������������������������������������� 144Float ������������������������������������������������������������������������������������������������������������������������ 145Total Float ��������������������������������������������������������������������������������������������������������������� 145Calculation of Float ������������������������������������������������������������������������������������������������ 146Free Float ���������������������������������������������������������������������������������������������������������������� 151The Concept of Free Float �������������������������������������������������������������������������������������� 151Interfering Float ������������������������������������������������������������������������������������������������������ 153Independent Float ��������������������������������������������������������������������������������������������������� 154
Critical Path ���������������������������������������������������������������������������������������������������������������155Critical Chain Project Management���������������������������������������������������������������������������156
Chapter 22: The Case for Manual Analysis �������������������������������������������������������157The Planner ����������������������������������������������������������������������������������������������������������������157The Role of the Computer �����������������������������������������������������������������������������������������158Preparation of the Network ����������������������������������������������������������������������������������������158Typical Site Problems ������������������������������������������������������������������������������������������������160The National Economic Development Office Report ������������������������������������������������161
Chapter 23: Lester Diagram ���������������������������������������������������������������������������163Basic Advantages �������������������������������������������������������������������������������������������������������166
Chapter 24: Graphical and Computer Analysis ��������������������������������������������������167Graphical Analysis �����������������������������������������������������������������������������������������������������167
Limitations ������������������������������������������������������������������������������������������������������������� 168Time for Analysis ��������������������������������������������������������������������������������������������������� 171
Computer Analysis ����������������������������������������������������������������������������������������������������174History �����������������������������������������������������������������������������������������������������������������������174
The PC �������������������������������������������������������������������������������������������������������������������� 175Programs ����������������������������������������������������������������������������������������������������������������� 176
Chapter 25: Milestones and Line of Balance ������������������������������������������������������179Milestones ������������������������������������������������������������������������������������������������������������������179Line of Balance ����������������������������������������������������������������������������������������������������������180
Chapter 26: Simple Examples ��������������������������������������������������������������������������185Example 1 ������������������������������������������������������������������������������������������������������������������185Example 2 ������������������������������������������������������������������������������������������������������������������189

x Contents
Example 3 ������������������������������������������������������������������������������������������������������������������192Summary of Operation ����������������������������������������������������������������������������������������������194Example 4 (Using Manual Techniques)���������������������������������������������������������������������195
Chapter 27: Progress Reporting ����������������������������������������������������������������������199Feedback ��������������������������������������������������������������������������������������������������������������������200
Chapter 28: Project Management and Network Planning ������������������������������������207Responsibilities of the Project Managers ������������������������������������������������������������������207Information From Network ����������������������������������������������������������������������������������������208Site-Preparation Contract�������������������������������������������������������������������������������������������209Confidence in Plan �����������������������������������������������������������������������������������������������������210Network and Method Statements �������������������������������������������������������������������������������211Integrated Systems �����������������������������������������������������������������������������������������������������212Networks and Claims �������������������������������������������������������������������������������������������������214
Examples of Claims for Delays ������������������������������������������������������������������������������ 215Force Majeure Claims �������������������������������������������������������������������������������������������� 217
Chapter 29: Network Applications Outside the Construction Industry ������������������221Bringing a New Product onto the Market ������������������������������������������������������������������221Moving a Factory �������������������������������������������������������������������������������������������������������223Centrifugal Pump Manufacture ���������������������������������������������������������������������������������225Planning a Mail Order Campaign ������������������������������������������������������������������������������226Manufacture of a Package Boiler�������������������������������������������������������������������������������228Manufacture of a Cast Machined Part �����������������������������������������������������������������������230
Chapter 30: Resource Loading �������������������������������������������������������������������������235The Alternative Approach ������������������������������������������������������������������������������������������236Further Reading ���������������������������������������������������������������������������������������������������������241
Chapter 31: Cash-Flow Forecasting ������������������������������������������������������������������243Example of Cash-Flow Forecasting ���������������������������������������������������������������������������244
Chapter 32: Cost Control and EVA ������������������������������������������������������������������253SMAC – Man-Hour Control ��������������������������������������������������������������������������������������253Summary of Advantages ��������������������������������������������������������������������������������������������255EVA for Civil Engineering Projects ���������������������������������������������������������������������������261
Planned Costs ��������������������������������������������������������������������������������������������������������� 262Site Overheads �������������������������������������������������������������������������������������������������������� 262Example ������������������������������������������������������������������������������������������������������������������ 263Alternative Payment Schedule ������������������������������������������������������������������������������� 264
Further Reading ���������������������������������������������������������������������������������������������������������265

Contents xi
Chapter 33: Control Graphs and Reports ���������������������������������������������������������267Overall Project Completion ���������������������������������������������������������������������������������������283Earned Schedule ��������������������������������������������������������������������������������������������������������290Integrated Computer Systems ������������������������������������������������������������������������������������290EVA % Complete Assessment �����������������������������������������������������������������������������������291
Chapter 34: Procurement ��������������������������������������������������������������������������������293Procurement Strategy �������������������������������������������������������������������������������������������������295
Supply Chain ���������������������������������������������������������������������������������������������������������� 296Approved Tender List ��������������������������������������������������������������������������������������������� 296
Pre-Tender Survey �����������������������������������������������������������������������������������������������������297Bidder Selection ��������������������������������������������������������������������������������������������������������300Request for Quotation ������������������������������������������������������������������������������������������������302Tender Evaluation ������������������������������������������������������������������������������������������������������302Purchase Order�����������������������������������������������������������������������������������������������������������305Expediting, Monitoring and Inspection ���������������������������������������������������������������������306Shipping and Storage �������������������������������������������������������������������������������������������������307Erection and Installation ��������������������������������������������������������������������������������������������307Commissioning and Handover�����������������������������������������������������������������������������������308Types of Contracts �����������������������������������������������������������������������������������������������������308
Lump Sum Contracts ���������������������������������������������������������������������������������������������� 309Remeasured Contracts �������������������������������������������������������������������������������������������� 309Reimbursable Contracts ����������������������������������������������������������������������������������������� 310Target Contracts������������������������������������������������������������������������������������������������������ 312Design, Build and Operate Contracts ��������������������������������������������������������������������� 312Basic Requirements for Success ���������������������������������������������������������������������������� 313Bonds ���������������������������������������������������������������������������������������������������������������������� 314Letter of Intent �������������������������������������������������������������������������������������������������������� 319Bad Letter ��������������������������������������������������������������������������������������������������������������� 323Good Letter ������������������������������������������������������������������������������������������������������������ 323
Subcontracts ���������������������������������������������������������������������������������������������������������������324Definition of Subcontracts �������������������������������������������������������������������������������������� 324
Subcontract Documents ���������������������������������������������������������������������������������������������325Commercial Conditions – General ������������������������������������������������������������������������� 325Special Conditions �������������������������������������������������������������������������������������������������� 328Technical Specification������������������������������������������������������������������������������������������� 328Description of Work ����������������������������������������������������������������������������������������������� 328Liquidated Damages (or Ascertainable Liquidated Damages) ������������������������������� 329
Insurance ��������������������������������������������������������������������������������������������������������������������330Discounts �������������������������������������������������������������������������������������������������������������������331
Negotiated and Hidden Discounts �������������������������������������������������������������������������� 332Bulk Purchase Discounts ���������������������������������������������������������������������������������������� 332
xii Contents
Annual Order Discounts ����������������������������������������������������������������������������������������� 332Prompt Payment Discount �������������������������������������������������������������������������������������� 333Discount for Retention Bond ���������������������������������������������������������������������������������� 333
Counter-Trade ������������������������������������������������������������������������������������������������������������333Incoterms �������������������������������������������������������������������������������������������������������������������334
Ex Works ���������������������������������������������������������������������������������������������������������������� 334Free Carrier (Named Point) ������������������������������������������������������������������������������������ 334FOR/FOT ���������������������������������������������������������������������������������������������������������������� 336FOB Airport ������������������������������������������������������������������������������������������������������������ 336FAS ������������������������������������������������������������������������������������������������������������������������� 336FOB ������������������������������������������������������������������������������������������������������������������������ 336C&F ������������������������������������������������������������������������������������������������������������������������ 336CIF �������������������������������������������������������������������������������������������������������������������������� 336Freight Carriage – Paid to … ��������������������������������������������������������������������������������� 337Freight Carriage – and Insurance Paid to … ���������������������������������������������������������� 337Ex Ship ������������������������������������������������������������������������������������������������������������������� 337Ex Quay ������������������������������������������������������������������������������������������������������������������ 337Delivered at Frontier����������������������������������������������������������������������������������������������� 337Delivered Duty Paid ����������������������������������������������������������������������������������������������� 338
Further Reading ���������������������������������������������������������������������������������������������������������338
Chapter 35: Value Management ����������������������������������������������������������������������339Further Reading ���������������������������������������������������������������������������������������������������������341
Chapter 36: Health, Safety and Environment ����������������������������������������������������343Construction, Design and Management Regulations �������������������������������������������������349Health and Safety Plan�����������������������������������������������������������������������������������������������350
Pre-Tender Health and Safety Plan ������������������������������������������������������������������������ 350Construction Phase Health and Safety Plan ����������������������������������������������������������� 351
Health and Safety File �����������������������������������������������������������������������������������������������351Warning Signs ������������������������������������������������������������������������������������������������������������351
Chapter 37: Information Management ��������������������������������������������������������������355Objectives and Purpose ����������������������������������������������������������������������������������������������356
Types of Documents ����������������������������������������������������������������������������������������������� 356Authority ���������������������������������������������������������������������������������������������������������������� 356Distribution of Information ������������������������������������������������������������������������������������ 357Storing Information and Virus Protection �������������������������������������������������������������� 357Retrieving Information and Acquisition/Modification Permits ������������������������������ 357Acknowledging Receipt of Information ����������������������������������������������������������������� 357Security Arrangements ������������������������������������������������������������������������������������������� 358

Contents xiii
Disaster Recovery Systems ������������������������������������������������������������������������������������ 358Configuration Control �������������������������������������������������������������������������������������������� 358Distribution Schedule ��������������������������������������������������������������������������������������������� 358Standards to Be Followed ��������������������������������������������������������������������������������������� 359Legal Requirements ������������������������������������������������������������������������������������������������ 359Foreseeable Risks ��������������������������������������������������������������������������������������������������� 359
Data Collection ����������������������������������������������������������������������������������������������������������360Qualitative �������������������������������������������������������������������������������������������������������������� 360Quantitative ������������������������������������������������������������������������������������������������������������ 361
Big Data ���������������������������������������������������������������������������������������������������������������������361Further Reading ���������������������������������������������������������������������������������������������������������361
Chapter 38: Communication ����������������������������������������������������������������������������363Cultural Differences, Language Differences, Pronunciation, Translation
and Technical Jargon �����������������������������������������������������������������������������������������������365Geographical Separation, Location Equipment or Transmission Failure ������������������365Misunderstanding, Attitude, Perception, Selective Listening, Assumptions
and Hidden Agendas ������������������������������������������������������������������������������������������������366Poor Leadership, Unclear Instructions, Unclear Objectives, Unnecessarily
Long Messages and Withholding of Information ����������������������������������������������������366Meetings ��������������������������������������������������������������������������������������������������������������������367Further Reading ���������������������������������������������������������������������������������������������������������368
Chapter 39: Team Building and Motivation �������������������������������������������������������369Team Development ����������������������������������������������������������������������������������������������������371
Forming ������������������������������������������������������������������������������������������������������������������ 371Storming ����������������������������������������������������������������������������������������������������������������� 371Norming ����������������������������������������������������������������������������������������������������������������� 372Performing �������������������������������������������������������������������������������������������������������������� 372Mourning ���������������������������������������������������������������������������������������������������������������� 372
The Belbin Team Types ���������������������������������������������������������������������������������������������372Plant ������������������������������������������������������������������������������������������������������������������������ 373Resource Investigator ��������������������������������������������������������������������������������������������� 373Coordinator ������������������������������������������������������������������������������������������������������������� 373Shaper ��������������������������������������������������������������������������������������������������������������������� 374Monitor/Evaluator �������������������������������������������������������������������������������������������������� 374Team Worker ���������������������������������������������������������������������������������������������������������� 374Implementer ����������������������������������������������������������������������������������������������������������� 374Completer/Finisher ������������������������������������������������������������������������������������������������� 374Specialist ���������������������������������������������������������������������������������������������������������������� 374
Motivation ������������������������������������������������������������������������������������������������������������������374

xiv Contents
Maslow’s Hierarchy of Needs �����������������������������������������������������������������������������������375Herzberg’s Motivational Hygiene Theory �����������������������������������������������������������������377
Hygiene Factors ������������������������������������������������������������������������������������������������������ 377Motivators ��������������������������������������������������������������������������������������������������������������� 377
Further Reading ���������������������������������������������������������������������������������������������������������377
Chapter 40: Leadership ����������������������������������������������������������������������������������379Situational Leadership �����������������������������������������������������������������������������������������������380Professionalism and Ethics ����������������������������������������������������������������������������������������383
Responsibilities to Clients and Employers ������������������������������������������������������������� 383Responsibilities to the Project �������������������������������������������������������������������������������� 384Responsibilities to the Profession of Project Management ������������������������������������ 384
Competence ���������������������������������������������������������������������������������������������������������������384Further Reading ���������������������������������������������������������������������������������������������������������386
Chapter 41: Negotiation ���������������������������������������������������������������������������������387Phase 1: Preparation ��������������������������������������������������������������������������������������������������387Phase 2: Planning �������������������������������������������������������������������������������������������������������388Phase 3: Introductions �����������������������������������������������������������������������������������������������389Phase 4: Opening Proposal ����������������������������������������������������������������������������������������389Phase 5: Bargaining ���������������������������������������������������������������������������������������������������389Phase 6: Agreement ���������������������������������������������������������������������������������������������������390Phase 7: Finalizing �����������������������������������������������������������������������������������������������������390
Chapter 42: Conflict Management and Dispute Resolution ���������������������������������393Conciliation ���������������������������������������������������������������������������������������������������������������395Mediation �������������������������������������������������������������������������������������������������������������������396Adjudication ��������������������������������������������������������������������������������������������������������������396Arbitration �����������������������������������������������������������������������������������������������������������������397Litigation��������������������������������������������������������������������������������������������������������������������398
Chapter 43: Governance ���������������������������������������������������������������������������������401Governance of Project Management��������������������������������������������������������������������������401
Portfolio Direction �������������������������������������������������������������������������������������������������� 403Project Sponsorship ������������������������������������������������������������������������������������������������ 403Project Management Capability ����������������������������������������������������������������������������� 404Disclosure and Reporting ��������������������������������������������������������������������������������������� 404Ethics ���������������������������������������������������������������������������������������������������������������������� 405Evidence ����������������������������������������������������������������������������������������������������������������� 406
Conclusion �����������������������������������������������������������������������������������������������������������������407Further Reading ���������������������������������������������������������������������������������������������������������407

Contents xv
Chapter 44: Project Close-Out and Handover ���������������������������������������������������409Close-Out �������������������������������������������������������������������������������������������������������������������409Handover ��������������������������������������������������������������������������������������������������������������������411
Chapter 45: Project Close-Out Report and Review ���������������������������������������������413Close-Out Report �������������������������������������������������������������������������������������������������������413Close-Out Review ������������������������������������������������������������������������������������������������������414
Chapter 46: Stages and Sequence ��������������������������������������������������������������������415Summary of Project Stages and Sequence�����������������������������������������������������������������415
Chapter 47: Worked Example 1: Bungalow �������������������������������������������������������421Design and Construction Philosophy�������������������������������������������������������������������������421
Chapter 48: Worked Example 2: Pumping Installation ���������������������������������������437Design and Construction Philosophy�������������������������������������������������������������������������437Cash Flow ������������������������������������������������������������������������������������������������������������������442
Chapter 49: Worked Example 3: Motor Car �����������������������������������������������������455Summary ��������������������������������������������������������������������������������������������������������������������466
Business Case ��������������������������������������������������������������������������������������������������������� 466Investment Appraisal ���������������������������������������������������������������������������������������������� 466Project and Product Life Cycle ������������������������������������������������������������������������������ 477Work- and Product-Breakdown Structures ������������������������������������������������������������� 477AoN Network ��������������������������������������������������������������������������������������������������������� 477Risk Register ���������������������������������������������������������������������������������������������������������� 477Earned Value Analysis �������������������������������������������������������������������������������������������� 477Close-Out ��������������������������������������������������������������������������������������������������������������� 477
Chapter 50: Worked Example 4: Battle Tank ����������������������������������������������������479Business Case for Battle Tank Top Secret �����������������������������������������������������������������479
Chapter 51: Primavera P6 ������������������������������������������������������������������������������489Evolution of Project Management Software ��������������������������������������������������������������489
Early Project Management Software ���������������������������������������������������������������������� 489The Enterprise-Level Database ������������������������������������������������������������������������������ 490Systems Integration ������������������������������������������������������������������������������������������������ 490The Scalable Integrated System ����������������������������������������������������������������������������� 491
Oracle Primavera P6 ��������������������������������������������������������������������������������������������������491Project Planning ����������������������������������������������������������������������������������������������������� 491Work Breakdown Structure and Other Analysis Views ������������������������������������������ 491Resource Usage ������������������������������������������������������������������������������������������������������ 492

xvi Contents
Baseline and Other Reference Plans ���������������������������������������������������������������������� 492Progress Tracking ��������������������������������������������������������������������������������������������������� 493Earned Value Analysis �������������������������������������������������������������������������������������������� 493Risk Management ��������������������������������������������������������������������������������������������������� 494Multi-Project System ���������������������������������������������������������������������������������������������� 494Role-Based Access ������������������������������������������������������������������������������������������������� 494Reporting ���������������������������������������������������������������������������������������������������������������� 495Using P6 Through a Project Life Cycle ����������������������������������������������������������������� 496
Chapter 52: Building Information Modelling (BIM)��������������������������������������������509Introduction ���������������������������������������������������������������������������������������������������������������509History of BIM ����������������������������������������������������������������������������������������������������������510What Is BIM ��������������������������������������������������������������������������������������������������������������512UK Government Recommendations ��������������������������������������������������������������������������513How BIM Is Applied in Practice �������������������������������������������������������������������������������514
Tekla Structures ������������������������������������������������������������������������������������������������������ 514Linking Systems Through Open �NET Interfaces �����������������������������������������������������515Tekla BIMsight and Other Collaboration Tools���������������������������������������������������������516Savings With BIM �����������������������������������������������������������������������������������������������������516Sample BIM Projects �������������������������������������������������������������������������������������������������517
Alta Bates Summit Medical Centre – by DPR Construction Inc� �������������������������� 517The National Museum of Qatar (Arup) ������������������������������������������������������������������ 520Leeds Arena, UK, Fisher Engineering Limited ������������������������������������������������������ 521A BIM Strategy Was Essential for Efficiency �������������������������������������������������������� 524Technical Detail ������������������������������������������������������������������������������������������������������ 524
Interoperability and Principle Industry Transfer Standards ���������������������������������������525DXF, DWG, DWF and DGN Formats�������������������������������������������������������������������� 525IGES and STEP ������������������������������������������������������������������������������������������������������ 525SDNF Format ��������������������������������������������������������������������������������������������������������� 526CIS/2 Format ���������������������������������������������������������������������������������������������������������� 526IFC Format ������������������������������������������������������������������������������������������������������������� 526
Further Reading ���������������������������������������������������������������������������������������������������������527
Appendix 1: Agile Project Management ��������������������������������������������������������������529Appendix 2: Abbreviations and Acronyms Used in Project Management �����������������555Appendix 3: Glossary ���������������������������������������������������������������������������������������559Appendix 4: Examination Questions 1: Questions ������������������������������������������������565Appendix 5: Bibliography����������������������������������������������������������������������������������569Appendix 6: Words of Wisdom ��������������������������������������������������������������������������575Appendix 7: Syllabus Summary Bullet Points ������������������������������������������������������577Appendix 8: Sample Examination Questions 2: Bullet Point Answers ���������������������597Index ��������������������������������������������������������������������������������������������������������������621

xvii
Foreword to the First Edition
A key word in the title of this book is ‘control’. This word, in the context of management, implies the observation of performance in relation to plan and the swift taking of corrective action when the performance is inadequate. In contrast to many other publications which purport to deal with the subject, the mechanism of control permeates the procedures that Mr. Lester advocates. In some chapters, such as that on Manual and Computer Analysis, it is there by implication. In others, such as that on Cost Control, it is there in specific terms.
The book, in short, deals with real problems and their real solutions. I commend it therefore both to students who seek to understand the subject and to managers who wish to sharpen their performance.
by Geoffrey TrimbleProfessor of Construction Management
University of Technology, Loughborough

This page intentionally left blank

xix
Preface
The shortest distance between two points is a straight line.Euclid
The longest distance between two points is a shortcut.Lester
The success of the sixth edition has prompted the publishers to suggest an updated version in the form of a seventh edition. For this reason, the bulk of the sixth edition has remained the same, but the chapters dealing with the newer developments in project management such as BIM, Governance and Agile PM have been updated to reflect the latest techniques.
The example of the hotel conversion, given in Chapter 51 (sixth edition) on Primavera P6, only referred to risk analysis in the text, and this has now been augmented by the addition of the risk analysis calculations and the associated tables and graphs.
New facets of project management are appearing all the time, but the topics forming part of Integrative Management, such as business case, control, information management, organization, planning, information management, and stakeholder management are largely unchanged. However, three new topics, i.e., data collection (including Big Data), which is part of information management, baseline reviews and sustainability have now been incorporated. In addition, some subjects such as adjudication, earned schedule and meetings have been expanded.
For readers intending to take the APMP examination, a set of bullet points based on selected topics given in the APM Body of Knowledge (sixth edition) are included in the book as Appendix 7. This list was based on the course notes prepared by the author for students attending the project management course at UCL. Furthermore, the answers to the examination questions in Appendix 4, which have been increased from 50 to 60, are now given in Appendix 8.

xx Preface
The bibliography has been updated, mainly with the addition of books related to the BIM and Agile Project Management both of which are relatively recent additions to the sphere of project management.
As with the sixth edition, the contributions by Graham Collins (Agile Project Management), Clive Robinson (BIM), David Shannon (governance), and Arnaud Morvan (Primavera P6) add great value to this book and are acknowledged with thanks.
Albert Lester

xxi
Acknowledgements
The author and publishers acknowledge with thanks all the individuals and organizations whose contributions were vital in the preparation of this book.
Particular acknowledgement is given to the following four contributors:
Oracle and Milestone Ltd., for providing the description of their highly regarded Primavera P6 computer software package.David Shannon, for writing the chapter on project governance.Clive Robinson of Trimble Solutions Corporation, for contributing the description and procedures for BIM.Graham Collins from UCL, for providing the description of Agile Project Management.
The author would also like to thank the following for their help and cooperation.
The Association for Project Management (APM) for permission to reproduce excerpts from their publication A Guide to Conducting Integrated Baseline Reviews, Directing Change: A Guide to Governance of Project Management and The APM Body of Knowledge.
The National Economic Development Office for permission to reproduce the relevant section of their report ‘Engineering Construction Performance Mechanical & Electrical Engineering Construction, EDC, NEDO December 1976’.
Foster Wheeler Power Products Ltd. for assistance in preparing the text and manuscripts and permission to utilize the network diagrams of some of their contracts.
Mr. Tony Benning, my coauthor of Procurement in the Process Industry, for permission to include texts from that book.
British Standards Institution for permission to reproduce extracts from BS 6079-1-10 [Project Management Life Cycle and BS5499-10-2006 (Safety Signs)].
British standards can be obtained in PDF or hard copy formats from the BSI online shop: www.bsigroup.com/Shop or by contacting BSI customer services for hard copies: Tel: +44 (0)20 8996 9001, Email: [email protected].

xxii Acknowledgements
A.P. Watt for permission to quote the first verse of Rudyard Kipling’s poem, ‘The Elephant’s Child’.
Daimler Chrysler for permission to use their diagram of the Mercedes-Benz 190 car.
The Automobile Association for the diagram of a typical motor car engine.
Mrs. Mary Willis for her agreement to use some of the diagrams in the chapters on Risk and Quality Management.
Jane Walker and University College London for permission to include diagrams in the chapters on Project Context, Leadership and Negotiations.

1Project Management, Planning and Control. http://dx.doi.org/10.1016/B978-0-08-102020-3.00001-2Copyright © 2017 Elsevier Ltd. All rights reserved.
CHAPTER 1
Project Definition
Chapter OutlineProject Definition 1Time-Bound Project 3Cost-Bound Project 4Performance (Quality)-Bound Project 4Safety-Bound Project 4
Project Definition
Many people and organizations have defined what a project is, or should be, but probably the most authoritative definition is that given in BS 6079-2:2000 Project Management Vocabulary, which states that a project is:
A unique process, consisting of a set of co-ordinated and controlled activities with start and finish dates, undertaken to achieve an objectives conforming to specific requirements, includ-ing constraints of time, cost and resources.
The next question that can be asked is ‘Why does one need project management?’ What is the difference between project management and management of any other business or enterprise? Why has project management taken off so dramatically in the last 20 years?
The answer is that project management is essentially management of change, while running a functional or ongoing business is managing a continuum or ‘business-as-usual’.
Project management is not applicable to running a factory making sausage pies, but it will be the right system when there is a requirement to relocate the factory, build an extension, or produce a different product requiring new machinery, skills, staff training, and even marketing techniques.
It is immediately apparent therefore that there is a fundamental difference between project management and functional or line management where the purpose of management is to continue the ongoing operation with as little disruption (or change) as possible. This is reflected in the characteristics of the two types of managers. While the project manager thrives on and is proactive to change, the line manager is reactive to change and hates disruption. In practice, this often creates friction and organizational problems when a change has to be introduced.

2 Chapter 1
Projects may be undertaken either to generate revenue, such as introducing methods for improving cash flow, or be capital projects that require additional expenditure and resources to introduce a change to the capital base of the organization. It is to this latter type of project that the techniques and methods described in this book can be most easily applied.
Fig. 1.1 shows the types of operations suitable for a project type of organization which are best managed as a functional or ‘business-as-usual’ organization.
Both types of operations have to be managed, but only the ones in column (A) require project-management skills.
It must be emphasized that the suitability of an operation being run as a project is indepen-dent of size. Project-management techniques are equally suitable for building a cathedral or a garden shed. Moving house, a very common project for many people, lends itself as effec-tively to project-management techniques such as tender analysis and network analysis as relocating a major government department from the capital city to another town. There just is no upper or lower limit to projects!
As stated in the definition, a project has a definite starting and finishing point and must meet certain specified objectives.
Broadly these objectives, which are usually defined as part of the business case and set out in the project brief, must meet three fundamental criteria: 1. The project must be completed on time. 2. The project must be accomplished within the budgeted cost. 3. The project must meet the prescribed quality requirements.
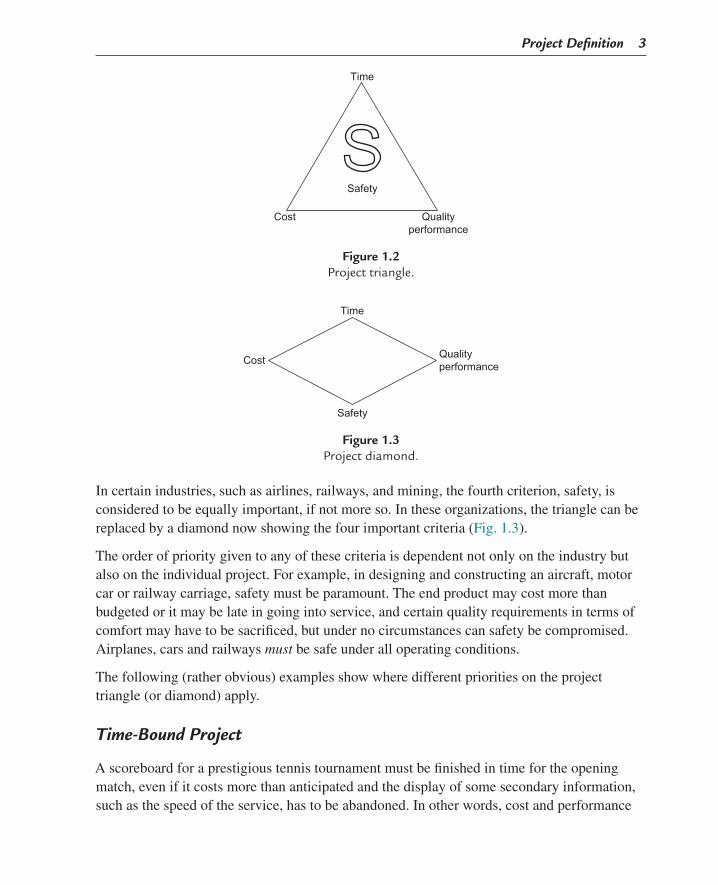
These criteria can be graphically represented by the well-known project triangle (Fig. 1.2). Some organizations like to substitute the word ‘quality’ with ‘performance’, but the principle is the same – the operational requirements of the project must be met, and met safely.
(A) Project organisation (B) Functional or line organisation
Building a houseDesigning a carOrganising a partySetting up a filing systemSetting up retail cash pointsBuilding a process plantIntroducing a new computer system
Manufacturing bricksMass-producing carsServing the drinksDoing the filingSelling goods & operating tillsProducing sausagesOperating credit control procedures
Figure 1.1Organization comparison.
Project Definition 3
In certain industries, such as airlines, railways, and mining, the fourth criterion, safety, is considered to be equally important, if not more so. In these organizations, the triangle can be replaced by a diamond now showing the four important criteria (Fig. 1.3).
The order of priority given to any of these criteria is dependent not only on the industry but also on the individual project. For example, in designing and constructing an aircraft, motor car or railway carriage, safety must be paramount. The end product may cost more than budgeted or it may be late in going into service, and certain quality requirements in terms of comfort may have to be sacrificed, but under no circumstances can safety be compromised. Airplanes, cars and railways must be safe under all operating conditions.
The following (rather obvious) examples show where different priorities on the project triangle (or diamond) apply.
Time-Bound Project
A scoreboard for a prestigious tennis tournament must be finished in time for the opening match, even if it costs more than anticipated and the display of some secondary information, such as the speed of the service, has to be abandoned. In other words, cost and performance
Time
Cost
Safety
Qualityperformance
Figure 1.2Project triangle.
Time
Cost
Safety
Qualityperformance
Figure 1.3Project diamond.

4 Chapter 1
may have to be sacrificed to meet the unalterable starting date of the tournament. (In practice, the increased cost may well be a matter of further negotiation and the temporarily delayed display can usually be added later during the non-playing hours.)
Cost-Bound Project
A local authority housing development may have to curtail the number of housing units and may even overrun the original construction programme, but the project cost cannot be exceeded, because the housing grant allocated by central government for this type of develop-ment was frozen at a fixed sum. Another solution to this problem would be to reduce the specification of the internal fittings instead of reducing the number of units.
Performance (Quality)-Bound Project
An armaments manufacturer has been contracted to design and manufacture a new type of rocket launcher to meet the client’s performance specification in terms of range, accuracy and rate of fire. Even if the delivery has to be delayed to carry out more tests and the cost has increased, the specification must be met. Again, if the weapons were required during a war, the specification might be relaxed to get the equipment into the field as quickly as possible.
Safety-Bound Project
Apart from the obvious examples of public transport given previously, safety is a factor that is required by law and enshrined in the Health and Safety at Work Act.
Not only must safe practices be built into every project, but constant monitoring is an essen-tial element of a safety policy. To that extent, it could be argued that all projects are safety-bound, since, if it became evident after an accident that safety was sacrificed for speed or profitability, some or all of the project stakeholders could find themselves in real trouble, even in jail. This is true for almost every industry, especially agriculture, food/drink production and preparation, pharmaceuticals, chemicals, toy manufacture, aircraft production, motor vehicle manufacture and, of course, building and construction.
A serious accident that may kill or injure people will not only cause anguish among the relatives, but, while not necessarily terminating the project, could very well destroy the company. For this reason the ‘S’ symbol when shown in the middle of the project-manage-ment triangle gives more emphasis of its importance (see Fig. 1.2).
While the other three criteria (Cost, Time and Quality/Performance) can be juggled by the project manager to suit the changing requirements and environment of a project, safety cannot, under any circumstances, be compromised. As any project manager knows, the duration (time) may be reduced by increasing resources (cost), and cost may be saved by

Project Definition 5
sacrificing quality or performance, but any diminution of safety can quickly lead to disaster, death and even the closure of an organization. The catastrophic explosions on the Piper Alpha gas platform in the North Sea in July 1988 killed 167 men and cost millions of dollars to Occidental and its insurers, and the explosion at the Buncefield, England, oil depot in 2009 caused massive destruction of its surroundings and huge costs to Total Oil Co. Additionally, the explosion on its Texas City refinery in March 2005, which killed 15 men and injured 170, and the blowout of the Deepwater Horizon drilling rig in the Gulf of Mexico in April 2010, causing 11 fatalities, have seriously damaged the reputation of BP and resulted in a consider-able drop in its share price. In the transport industry, the series of railway accidents in 2000 resulted in the winding up of British Rail and subsequently one of its main contractors. More recently, Toyota had to recall millions of cars to rectify an unsafe breaking and control system, after which Mr. Toyoda, the Chairman of the company, publicly stated that Toyota’s first priority is safety, the second is quality, and the third is volume (quantity). These occur-rences clearly show that safety must head the list of priorities for any project or organization.
The priorities of the other three criteria can of course change with the political climate or the commercial needs of the client, even within the life cycle of the project, and therefore the project manager has to constantly evaluate these changes to determine the new priorities. Ideally, all the main criteria should be met (and indeed this is the case for many well-run projects), but there are times when the project manager, with the agreement of the sponsor or client, has to make difficult decisions to satisfy the best interests of most, if not all, the stakeholders.
However, the examples given earlier highlight the importance of ensuring a safe operating environment, even at the expense of the other criteria. It is important to note that while a project manager can be reprimanded or dismissed for not meeting any of the three ‘corner criteria’, the one transgression for which a project manager can actually be jailed is not complying with the provisions of the Health and Safety regulations.
If one were to list the four project-management criteria in the order of their importance, the sequence would be safety, performance, time and cost, which can be remembered using the acronym SAPETICA. The rationale for this order is as follows:
If the project is not safe, it can cost lives and/or destroy the constructor and other stakeholders.
If the performance is not acceptable, the project will have been a waste of time and money.
If the project is not on time, it can still be a success, but may have caused a financial loss.
Even if the cost exceeds the budget, the project can still be viable, as extra money can usually be found. The most famous (or infamous) example is the Sydney Opera House, which was so much over budget that the extra money had to be raised via a New South Wales State lottery
but is now celebrated as a great Sydney landmark.

This page intentionally left blank

7Project Management, Planning and Control. http://dx.doi.org/10.1016/B978-0-08-102020-3.00002-4Copyright © 2017 Elsevier Ltd. All rights reserved.
CHAPTER 2
Project Management
It is obvious that project management is not new. Noah must have managed one of the earliest recorded projects in the Bible – the building of the ark. He may not have completed it within the budget, but he certainly had to finish it by a specified time – before the flood — and it must have met his performance criteria, as it successfully accommodated a pair of all the animals.
There are many published definitions of project management (see BS 6079 and ISO 21,500), but the following definition covers all the important ingredients:
The planning, monitoring, and control of all aspects of a project and the motivation of all those involved in it, in order to achieve the project objectives within agreed criteria of time, cost, and performance.
While this definition includes the fundamental criteria of time, cost and performance, the operative word, as far as the management aspect is concerned, is motivation. A project will not be successful unless all (or at least most) of the participants are not only competent but also motivated to produce a satisfactory outcome.
To achieve this, a number of methods, procedures and techniques have been developed, which, together with the general management and people skills, enable the project manager to meet the set criteria of time cost and performance/quality in the most effective ways.
Many textbooks divide the skills required in project management into hard skills (or topics) and soft skills. This division is not exact as some of the skills are clearly interdependent. Furthermore, it depends on the type of organization, type and size of project, authority given to a project manager and which of the listed topics are in his or her remit for a particular project. For example, in many large construction companies, the project manager is not permitted to get involved in industrial (site) disputes as these are more effectively resolved by
Chapter OutlineProject Manager 8Project Manager’s Charter 9Project Office 9Further Reading 10
8 Chapter 2
specialist industrial relations managers who are conversant with the current labour laws, national or local labour agreements and site conditions.
The hard skills cover such subjects as business case, cost control, change management, project life cycles, work breakdown structures, project organization, network analysis, earned value analysis, risk management, quality management, estimating, tender analysis and procurement.
The soft topics include health and safety, stakeholder analysis, team building, leadership, communications, information management, negotiation, conflict management, dispute resolutions, value management, configuration management, financial management, marketing and sales and law.
A quick inspection of the two types of topics shows that the hard subjects are largely required only for managing specific projects, while the soft ones can be classified as general management and are more or less necessary for any type of business operation whether running a design office, factory, retail outlet, financial services institution, charity, public service organization, national or local government or virtually any type of commer-cial undertaking.
A number of organisations, such as APM, PMI, ISO, OGC and licensees of PRINCE (project in a controlled environment), have recommended and advanced their own method-ology for project management, but by and large the differences are on emphasis or sequence of certain topics. For example, PRINCE requires the resources to be determined before the commencement of the time scheduling and the establishment of the completion date, while in the construction industry the completion date or schedule is often stipulated by the customer and the contractor has to provide (or recruit) whatever resources (labour, plant, equipment or finance) are necessary to meet the specified objectives and complete the project on time.
Project Manager
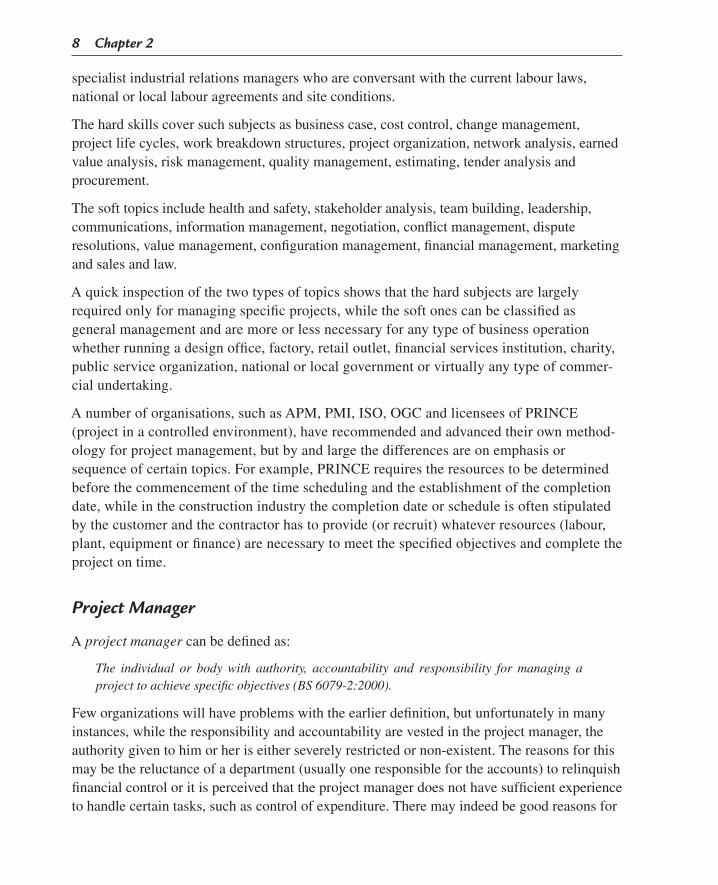
A project manager can be defined as:
The individual or body with authority, accountability and responsibility for managing a project to achieve specific objectives (BS 6079-2:2000).
Few organizations will have problems with the earlier definition, but unfortunately in many instances, while the responsibility and accountability are vested in the project manager, the authority given to him or her is either severely restricted or non-existent. The reasons for this may be the reluctance of a department (usually one responsible for the accounts) to relinquish financial control or it is perceived that the project manager does not have sufficient experience to handle certain tasks, such as control of expenditure. There may indeed be good reasons for

Project Management 9
these restrictions which depend on the size and type of project, the size and type of the organization and of course the personality and experience of the project manager, but if the project manager is supposed to be in effect the managing director of the project (as one large construction organisation liked to put it), he or she must have control over costs and expendi-ture, albeit within specified and agreed limits.
Apart from the conventional responsibilities for time, cost and performance/quality, the project manager must ensure that all the safety requirements and safety procedures are complied with. For this reason, the word safety has been inserted into the project management triangle to reflect the importance of ensuring that various important health and safety require-ments are met. Serious accidents not only have personal tragic consequences, but they can also destroy a project or indeed a business overnight. Lack of attention to safety is just bad business, as any oil, airline, bus or railroad companies can confirm.
Project Manager’s Charter
Because the terms of engagement of a project manager are sometimes difficult to define in a few words, some organizations issue a project manager’s charter, which sets out the respon-sibilities and limits of authority of the project manager. This makes it clear to the project manager what his or her areas of accountability are, and if this document is included in the project management plan, all stakeholders will be fully aware of the role the project manager will have in this particular project.
The project manager’s charter is project-specific and will have to be amended for every manager as well as the type, size, complexity or importance of a project (see Fig. 2.1).
Project Office
The project manager needs to be supported on large projects, either by one or more assistant project managers (one of whom can act as deputy) or a specially created project office. The main duties of such a project office is to establish a uniform organisational approach for systems, processes and procedures, carry out the relevant configuration management func-tions, disseminate project instructions and other information and collect, retrieve or chase information required by the project manager on a regular or ad hoc basis. Such an office can assist greatly in the seamless integration of all the project systems and would also prepare programs, schedules, progress reports, cost analyses, quality reports and a host of other useful tasks that would otherwise have to be carried out by the project manager. In addition, the project office can also be required to service the requirements of a programme or portfolio manager, in which case it will probably have its own office manager responsible for the onerous task of satisfying the different and often conflicting priorities set by the various projects managers. (See also Chapter 10.)

10 Chapter 2
Further Reading
Burke, R. (2011). Advanced project management. Burke Publishing.Cleland, D. I. (2006). Global project management handbook. McGraw-Hill.Gordon, J., & Lockyer, K. (2005). Project management & project network techniques (7th ed.). Prentice Hall.Heldman, K. Project management jump start. Syber.Kerzner, H. (2009). Project management: A managerial approach. Wiley.
PROJECT MANAGER’S CHARTER
1. Project Manager:
Name:Appointment/Position:Date of Appointment:
2. Project Title:
3. Responsibility and Authority given to the Project Manager:
The above named Project Manager has been given the authority,responsibility and accountability for
4. Project Goals and Deliverables are:
a:b:c:
5. The Project will be reviewed.
6. Financial Authority:
The Project Manager’s delegated financial powers are:
7. Intramural Resources:
The following resources have been/are to be made available:
8. Trade-offs:
a: Cost: %b: Time: days/weeks.c: Performance:
9. Charter Review: No charter review is expected to take place forthe duration of this project unless it becomes clear that the PM cannotfulfil his/her duties or a reassessment of the trade-offs is required.
10. Approved:
Sponsor/Client/Customer/Programme Manager:Project Manager:Line Manager:
11. Distribution:
a: Sponsor; b: Programme Manager; c: Line Manager
Figure 2.1Project manager’s charter.

Project Management 11
O’Connell, F. (2010). What you need to know about project management. Wiley.Rad, P. F., & Levin, G. (2002). The advanced project management office. St Lucie Press.Taylor, P. (2011). Leading successful PMOs. Gower.Turner, J. R. (2008). The Gower handbook of project management (4th ed.). Gower.

This page intentionally left blank

13Project Management, Planning and Control. http://dx.doi.org/10.1016/B978-0-08-102020-3.00003-6Copyright © 2017 Elsevier Ltd. All rights reserved.
CHAPTER 3
Programme and Portfolio Management
Programme management can be defined as ‘The co-ordinated management of a group of related projects to ensure the best use of resources in delivering the projects to the specified time, cost and quality/performance criteria’.
A number of organizations and authorities have coined different definitions, but the operative word in any definition is related. Unless the various projects are related to a common objec-tive, the collection of projects would be termed a ‘portfolio’ rather than a ‘programme’.
A programme manager could therefore be defined as ‘The individual to whom responsibility has been assigned for the overall management of the time, cost and performance aspects of a group of related projects and the motivation of those involved’.
Again, different organizations have different definitions for the role of the programme man-ager or portfolio manager. In some companies, he or she would be called manager of projects or operations manager or operations director, etc., but it is generally understood that the programme manager’s role is to coordinate the individual projects that are linked to a com-mon objective. Whatever the definition, it is the programme manager who has the overall picture of the organization’s project commitments.
Many organizations carrying out a number of projects have limited resources. It is the respon-sibility of the programme manager to allocate these resources in the most cost-effective manner, taking into consideration the various project milestones and deadlines as well as the usual cost restrictions. It is the programme manager who may have to obtain further authority to engage any external resources as necessary and decide on their disposition.
As an example, the construction of a large cruise ship would be run by a programme manager who coordinates many (often very large) projects such as the ship’s hull, propulsion system and engines, control systems, catering system and interior design. One of the associated projects might even include recruitment and training of the crew.
A manager responsible for diverse projects such as the design, supply and installation of a computerized supermarket check-out and stock-control system, an electronic scoreboard for a
Chapter OutlinePortfolio Management 15Further Reading 16

14 Chapter 3
cricket ground, or a cheque-handling system for a bank would be a portfolio manager, because although all the projects require computer systems, they are for different clients at different locations and are independent of each other. Despite this diversity of the projects, the portfolio manager, like the project manager, still has the responsibility to set priorities, maximize the efficient use of the organization’s resources and monitor and control the costs, schedule and performance of each project.
As with project management, programme management and the way programmes are managed depend primarily on the type of organization carrying out the programme. There are two main types of organizations: • Clientorganizations• Contractingorganizations
In a client-type organization, the projects or programmes will probably not be the main source of income and may well constitute or require a major change in the management structure and culture. New resources may have to be found and managers involved in the normal running of the business may have to be consulted, educated and finally convinced of the virtues, not only of the project itself but also of the ways it has to be managed.
The programme manager in such an organization has to ensure that the project fits into the corporate strategy and meets the organization’s objectives. He or she has to ensure that established project management procedures, starting with the business case through imple-mentation and ending with disposal, are correctly employed. In other words, the full life-cycle systems using all the ‘soft’ techniques to create a project environment have to be in place in an organization that may well be set up for ‘business-as-usual’, employing only well-established line-management techniques. In addition, the programme manager has to monitor all projects to ensure that they meet the strategic objectives of the organization as well as fulfilling the more obvious requirements of being performed safely, minimizing and controlling risks at the same time meeting the cost, time and performance criteria for every project.
Programme management can, however, mean more than coordinating a number of related projects. The prioritization of the projects themselves, not just the required resources, can be a function of programme management. It is the programme manager who decides which project, or which type of project, is the best investment and which one is the most cost-effective one to start. It may even be advantageous to merge two or more small projects into one larger project, if they have sufficient synergy or if certain resources or facilities can be shared.
Another function of programme management is to monitor the performance of the projects that are part of the programme and check that the expected deliverables have produced the specified benefits, whether to the parent organization or the client. This could take several days or months depending on the project, but unless it is possible to measure these benefits, it is not possible to assess the success of the project or, indeed say, whether the whole exercise is worthwhile. It can be seen therefore that it is just as important for the programme manager
Programme and Portfolio Management 15
to set up the monitoring and close-out reporting system for the end of a project, as the plan-ning and control systems for the start.
In a contracting organization, such a culture change will either not be necessary, as the organization will already be set up on a project basis, or the change to a project-oriented company will be easier because the delivery of projects is after all the ‘raison d’être’ of the organization. Programme management in a contracting organization is therefore more of the coordination of the related or overlapping projects covering such topics as resource manage-ment, cost management and procurement, and ensuring conformity with standard company systems and procedures. The cost, time and performance/quality criteria therefore relate more to the obligations of the contractor (apart from performance) than those of the client.
The life cycles of projects in a contracting organization usually start after the feasibility study has been carried out and finishes when the project is handed over to the client for the opera-tional phase. There are clearly instances when these life-cycle terminal points occur earlier or later, but a contractor is rarely concerned with whether or not the strategic or business objec-tives of the client have been met.
Portfolio Management
The APM Body of Knowledge defines portfolio management as:
The selection and management of all of an organisations projects, programmes and related operational activities taking into account resource restraints.
Portfolio management, which can be regarded as a subset of corporate management, is very similar to programme management, but the projects in the programme manager’s portfolio, though not necessarily related, are still required to meet an organization’s objectives. Furthermore, portfolios (unlike projects or programmes) do not necessarily have a defined start and finish date. Indeed portfolios can be regarded as a rolling set of programmes monitored in a continuous life cycle from the strategic planning stage to the delivery of the programme. In a large organization, a portfolio manager may be in charge of several programme managers, while in a smaller company he or she may be in direct control of a number of project managers.
Companiesdonothaveunlimitedresources,sotheportfoliomanagerhastoprioritizethedeploy-ment of these resources for competing projects, each of which has to be assessed in terms of: 1. Profitability and cost/benefit 2. Return on investment3. Cashflow 4. Risks 5. Prestige 6. Importance of the client7. Companystrategyandobjectives

16 Chapter 3
Portfolio management therefore involves the identification of these project attributes and the subsequent analysis, prioritization, balancing, monitoring and reporting of progress of each project or in the case of large organizations, each programme. As each project develops, different pressures and resource requirements appear, often as a result of contractual changes or the need to rectify errors or omissions. Unforeseen environmental issues may require immediate remedial action to comply with health and safety requirements, and there is always the danger of unexpected resignations of key members of one of the project teams.
A portfolio manager must therefore possess the ability to reassign resources, both human and material (such as office equipment, construction plant and bulk materials), in an effective and economical manner, often in emergency or other stressful situations, always taking into account the cost/benefit calculations, the performance and sustainability criteria and the overall strategic objectives of the organization.
The difference between programme management and portfolio management is that in the former the projects being managed are related in some form, while in the latter, the projects may or may not be related. For example, the projects controlled by a portfolio manager may be as diverse as an update of the company’s IT system to the development of a commercial building or shopping centre.
The portfolio manager will normally be part of the senior management team which deter-mines which projects go ahead and which should be shelved, not started or even abandoned.
Clearlythedegreeofdetailedinvolvementintheindividualprojectsbytheportfoliomanagermust therefore be limited, as no one can be an expert in everything. Instead, the portfolio manager has to ensure that the projects under his control meet the corporate ethical and quality standards as well as the basic criteria of cost, time, performance and the last, but not the least, safety.
As with programme management, the order of priority of the various projects must be estab-lished at an early stage, but as circumstances change (often outside the control of the manager or even the organization) the priorities will have to be adjusted to suit the latest overall strategy or the resources (often financial) of the organization.
Further Reading
APM. (2007). APM introduction to programme management. APM.Bartlett, J. (2010). Managing programmes of business change. Project Manager Today.OGC.(2010).An executive guide to portfolio management. The Stationary Office.PMI. (2008). The standard for portfolio management. PMI.Reiss, G. (2006). The Gower handbook of programme management. Gower.Sanwal, A. (2007). Optimising corporate portfolio management. Wiley.Thiry, M. (2010). Programme management. Gower.Venning,C.(2007).Managing portfolios of change with MSP for programmes and Prince for projects.
The Stationary Office.

17Project Management, Planning and Control. http://dx.doi.org/10.1016/B978-0-08-102020-3.00004-8Copyright © 2017 Elsevier Ltd. All rights reserved.
CHAPTER 4
Project Context (Project Environment)
Projects are influenced by a multitude of factors which can be external or internal to the organization responsible for its management and execution. The important thing for the project manager is to recognize what these factors are and how they impact the project during various phases from inception to final handover, or even disposal.
These external or internal influences are known as the project context or project environment. The external factors making up this environment are the client or customer, various external consultants, contractors, suppliers, competitors, politicians, national and local government agencies, public utilities, pressure groups, the end users and even the general public. Internal influences include the organization’s management, the project team, internal departments (technical and financial) and possibly the shareholders.
Fig. 4.1 illustrates the project surrounded by its external environment.
All these influences are neatly encapsulated by the acronym PESTLE, which stands for: • Political• Economic• Social• Technical• Legal• Environmental
A detailed discussion of these areas of influence is given in the following.
Chapter OutlinePolitical 18Economic 19Social (or Sociological) 19Technical 20Legal 21Environmental 21Sustainability 23Further Reading 23
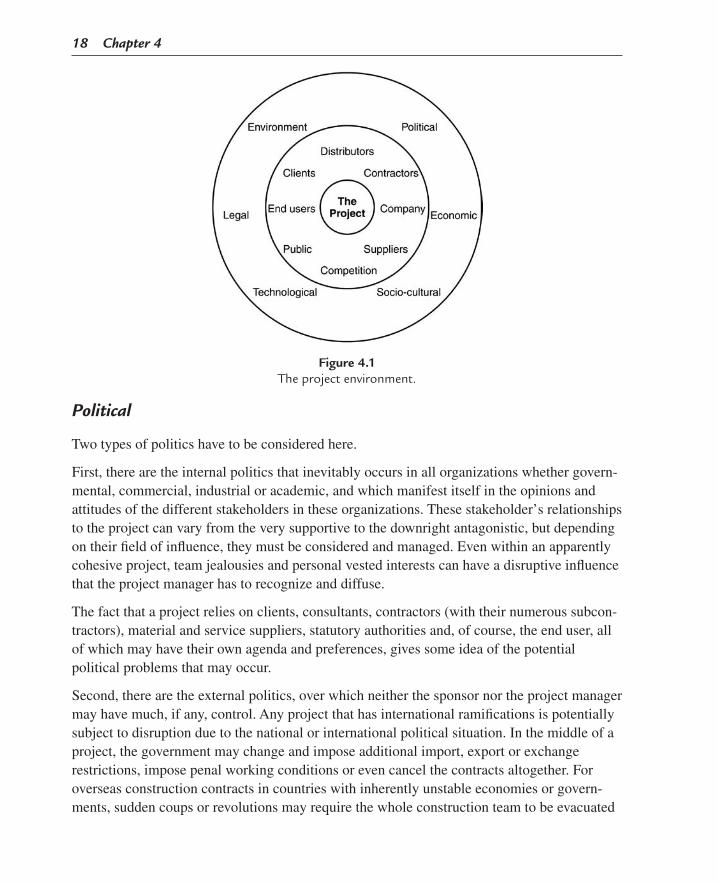
18 Chapter 4
Political
Two types of politics have to be considered here.
First, there are the internal politics that inevitably occurs in all organizations whether govern-mental, commercial, industrial or academic, and which manifest itself in the opinions and attitudes of the different stakeholders in these organizations. These stakeholder’s relationships to the project can vary from the very supportive to the downright antagonistic, but depending on their field of influence, they must be considered and managed. Even within an apparently cohesive project, team jealousies and personal vested interests can have a disruptive influence that the project manager has to recognize and diffuse.
The fact that a project relies on clients, consultants, contractors (with their numerous subcon-tractors), material and service suppliers, statutory authorities and, of course, the end user, all of which may have their own agenda and preferences, gives some idea of the potential political problems that may occur.
Second, there are the external politics, over which neither the sponsor nor the project manager may have much, if any, control. Any project that has international ramifications is potentially subject to disruption due to the national or international political situation. In the middle of a project, the government may change and impose additional import, export or exchange restrictions, impose penal working conditions or even cancel the contracts altogether. For overseas construction contracts in countries with inherently unstable economies or govern-ments, sudden coups or revolutions may require the whole construction team to be evacuated
Figure 4.1The project environment.

Project Context (Project Environment) 19
at short notice. Such a situation should be envisaged, evaluated and planned for as a part of the political risk assessment when the project is first considered.
Even on a less dramatic level, the political interplay between national and local government, lobbyists and pressure groups has to be taken into consideration, as can be appreciated when the project consists of a road bypass, reservoir, power station or airport extension.
Economic
Here again there are two levels of influence: internal or micro-economic, and external or macro-economic.
The internal economics relates to the viability of the project and the soundness of the business case. Unless there is a net gain, whether financial or non-financial, such as required by prestige, environ-mental, social service or national security considerations, there is no point in even considering embarking on a project. It is therefore vital that financial models and proven accountancy tech-niques are applied during the evaluation phase to ensure the economic viability of the project. These tests must be applied at regular intervals throughout the life of a project to check that with the inevitable changes that may be required, it is still worthwhile to proceed. The decision to abort the whole project at any stage after the design stage is clearly not taken lightly, but once the economic argument has been lost, it may be a better option in the end. A typical example is the case of an oil-fired power station that had to be mothballed over halfway through construction, when the price of fuel oil rose above the level at which power generation was no longer economic. It is not uncom-mon for projects to be shelved when the cost of financing the work has to be increased and the resulting interest payments exceed the foreseeable revenues.
The external economics, often related to the political climate, can have a serious influence on the project. Higher interest or exchange rates, and additional taxes on labour, materials or the end product, can seriously affect the viability of the project. A manufacturer may abandon the construction of a factory in its home country and transfer the project abroad if just one of these factors changes enough to make such a move economically viable. Again, changes to fiscal and interest movements must be constantly monitored so that representations can be made to government or the project be curtailed. Other factors that can affect a project are tariff barriers, interstate taxes, temporary embargoes, shipping restrictions such as only being permitted to use Conference Line vessels and special licences.
Social (or Sociological)
Many projects, and indeed most of the construction projects, inevitably affect the community of the areas they are carried out in. It is therefore vital to inform the residents in the affected areas as early as possible of the intent, purpose and benefits of the project to the organization and community.
20 Chapter 4
This may require a public relations campaign to be initiated, which includes meetings, exploratory discussions, consultations at various levels and possible trade-offs. This is particularly important when public funding from central or local government is involved or when public spaces and access facilities are affected. A typical example of a trade-off is when a developer wishes to build a shopping centre, the local authority may demand that it includes a recreation area or leisure park for free use by the public.
Some projects cannot even be started without first being subjected to a public enquiry, environmental impact assessment, route surveys or lengthy planning procedures. There are always pressure groups that have special interests in a particular project, and it is vital that they are given the opportunity to state their case while at the same time informing them of the positive and often less desirable implications. The ability to listen to their point of views and give sympathetic attention to their grievances is essential, but as it is almost impossible to satisfy all the parties, compromises may be necessary. The last things a project manager wants are the constant demonstrations and disruptions while the project is being carried out.
On another level, the whole object of the project may be to enhance the environment and facilities of the community, in which case the involvement of local organizations can be very helpful in focussing on areas which give the maximum benefit, and avoiding pitfalls which only people with local knowledge are aware of. A useful method to ensure local involvement is to set up advisory committees or even invite a local representative to be a part of the project management team.
Technical
It goes without saying that, unless the project is technically sound, it will end in failure. Whether the project involves rolling out a new financial service product or building a power station, the technology must be in place or be developed as the work proceeds. The mecha-nisms by which these technical requirements are implemented have to be firmed up at a very early stage after a rigorous risk assessment of all the realistically available options. Each option may then be subjected to a separate feasibility study and investment appraisal. Alternatives to be considered may include: • Shouldin-houseorexternaldesign,manufactureorinstallationbeused?• Shouldexistingfacilitiesbeusedorshouldnewonesbeacquired?• Shouldone’sownmanagementteambeusedorshouldspecialistprojectmanagersbe
appointed?• Shouldexistingcomponents(ordocuments)beincorporated?• Whatistheanticipatedlifeoftheendproduct(deliverable)andhowsoonmustitbe
updated?

Project Context (Project Environment) 21
• Arematerialsavailableonalong-termbasisandwhatalternativescanbesubstituted?• Whatisthenatureandsizeofthemarketandcanthismarketbeexpanded?
These and many more technical questions have to be asked and assessed before a decision can be made to proceed with the project. The financial implications of these factors can then be fed into the overall investment appraisal, which includes the commercial and financing, and environmental considerations.
Legal
One of the fundamental requirements of a contract, and by implication a project, is that it should be legal. In other words, if it is illegal in a certain country to build a brewery, little protection can be expected from the law.
The relationships between the contracting parties must be confirmed by a legally binding contract that complies with the laws (and preferably customs) of the participating organiza-tions. The documents themselves have to be legally acceptable and equitable, and unfair and unreasonable clauses must be eliminated.
Where suppliers of materials, equipment or services are based in countries other than the main contracting parties, the laws of those countries have to be complied with in order to minimize future problems regarding deliveries and payments.
In the event of disputes, the law under which the contract is administered and adjudicated must be written into the contract together with the location of the court for litigation.
Generally, project managers are strongly advised always to take legal advice from specialists in contract law and especially, where applicable, in international law.
The project context includes the established conditions of contract and other standard forms and documents used by industry, and can also include all the legal, political and commercial requirements stipulated by international bodies as well as national and local governments in their project-management procedures and procurement practices.
Environmental
Some of the environmental aspects of a project have already been alluded to under ‘Social’, from which it became apparent that environmental-impact assessments are highly desirable where they are not already mandatory.
The location of the project clearly has an enormous influence on the cost and completion time. The same type of plant or factory can be constructed in the United Kingdom, in the Sahara desert, in China, or even on an offshore platform, but the problems, costs and

22 Chapter 4
construction times can be very different. The following considerations must therefore be taken into account when deciding to carry out a project in a particular area of the world: • Temperature(daytimeandnighttime)indifferentseasons.• Rainyseasons(monsoon).• Tornadoortyphoonseasons.• Accessbyroad,rail,waterorair.• Groundconditionsandearthquakezones.• Possiblegroundcontamination.• Nearbyriversandlakes.• Istheprojectonshoreoroffshore?• Tidesandstormconditions.• Nearbyquarriesforrawmaterials.• Doestheprojectinvolvetheuseofradioactivematerials?
Most countries now have strict legislation to prevent or restrict emissions of polluting sub-stances whether solids, liquids or gases. In addition, noise restrictions may apply at various times and cultural or religious laws may prohibit work at specified times or on special days in the year.
The following list is a very small sample of over 15,000 web pages covering European Economic Community (EEC) directives and gives some idea of the regulations that may have to be followed when carrying out a project.
EC Directive 85/337/EEC Environmental impact assessment97/11/EEC Assessment of effects on certain public and private projects92/43/EEC Chapter 4 Environment
86/278/EEC Protection of the environment90/313/EEC Sustainable development90/679/EEC Substances hazardous to health79/409/EEC Conservation of natural habitats96/82/EEC Control of major accident hazards
91/156/EEC Control of pollution87/217/EEC Air pollution89/427/EEC Air pollution80/779/EEC Air quality limit values75/442/EEC Ozone-depleting substances89/427/EEC Quality limit of sulphur dioxide
80/1268/EEC Fuel and CO2 emissions91/698/EEC Hazardous waste78/659/EEC Quality standard of water80/68/EEC Groundwater directive
80/778/EEC Spring waters89/336/EEC Noise emissions

Project Context (Project Environment) 23
Sustainability
There are many different definitions of sustainability, but the neatest one is the definition suggestedbytheWorldCommissiononEnvironmentandDevelopment:
‘A process of change in which the exploitation of resources, the direction of investments, the orientation of technological development and institutional change are all in harmony and enhance both current and future potential to meet human needs and aspirations’.
This means that biological systems have to be studied and developed to ensure that the environment, in the form that we desire it, can endure indefinitely. The preservation of existing ecosystems is not only the responsibility of governments and international agencies, but also of corporations and indeed any organization whose activities impact on the environ-ment or the pool of natural resources.
Programme and project managers must therefore ensure that the projects under their control create minimum (ideally zero) pollution of the atmosphere, water resources including sea water, and minimum contamination of minerals, soils and vegetation (including forests), etc. This involves environmental-impact assessments being carried out at the planning stage and developing a mechanism which ensures that the methods and procedures agreed at these meetings are actually carried out.
For corporations this may (as with safety) require a change in the organization’s culture which has to flow down from the boardroom to the construction staff and operators of the facility. There has to be general awareness that the health and availability of resources of future generations cannot the endangered. In practice all these safeguards cost money, and unless we allocate sufficient funds now to protect the environment and ensure the conserva-tion of limited resources, future generations will pay the price.
Further Reading
Longdin, I. (2009). Legal aspects of purchasing and supply chain management (3rd ed.). Liverpool Academic.Wright. (2004). The law for project managers. Gower.

This page intentionally left blank

25Project Management, Planning and Control. http://dx.doi.org/10.1016/B978-0-08-102020-3.00005-XCopyright © 2017 Elsevier Ltd. All rights reserved.
CHAPTER 5
Business Case
Before embarking on a project, it is clearly necessary to understand that there will be a benefit either in terms of money or service, or both. The document that sets out the main advantages and parameters of the project is called the business case and is (or should be) produced by either the client or the sponsor of the project who in effect becomes the owner of the document.
A business case in effect outlines the ‘why’ and ‘what’ of the project as well as making the financial case by including the investment appraisal.
As with all documents, a clear procedure for developing the business case is highly desirable, and the following headings provide some indication of the subjects to be included: 1. Why is the project required? 2. What are we trying to achieve? 3. What are the deliverables? 4. What is the anticipated cost? 5. How long will it take to complete? 6. What quality standards must be achieved? 7. What are the performance criteria? 8. What are key performance indicators (KPIs)? 9. What are the main risks? 10. What are the success criteria? 11. Who are the main stakeholders?
In addition, any known information, such as location, key personnel, resource requirements, should be included so that the recipients, usually a board of directors, are in a position to accept or reject the case for carrying out the project.
The Project Sponsor
It is clear that the business case has to be prepared before the project can be started. Indeed, the business case is the first document to be submitted to the directorate of an organization to
Chapter OutlineThe Project Sponsor 25Requirements Management 26Further Reading 27

26 Chapter 5
enable this body to discuss the purpose and virtues of the project before making any financial commitments. Therefore, it follows that the person responsible for producing the business case cannot normally be the project manager, but must be someone who has a direct interest in the project going ahead. This person, who is often a director of the client’s organization with a special brief to oversee the project, is the project sponsor (sometimes also known as the project champion).
The role of the project sponsor is far greater than being the initiator or champion of the project. Even after the project has started the sponsor’s role is to: 1. Monitor the performance of the project manager 2. Constantly ensure that the project’s objectives and main criteria are met 3. Ensure that the project is run effectively as well as efficiently 4. Assess the need and viability of variations and agree to their implementation 5. Assist in smoothing out difficulties with other stakeholders 6. Support the project by ensuring sufficient resources (especially financial) are available 7. Act as business leader and top-level advocate to the company board 8. Ensure that the perceived benefits of the project are realized
Depending on the value, size and complexity of the project, the sponsor is a key player who, as a leader and mentor, can greatly assist the project manager to meet all the project’s objec-tives and KPIs.
Requirements Management
As has been explained previously, the two main components of a business case are ‘what’ is required and ‘why’ it is required. Requirements management is concerned with the ‘what’.
Clients, end users and indeed most of the stakeholders have their own requirements on what they expect from the project, even if the main objectives were agreed upon. Requirements management is concerned with eliciting, capturing, collating, assessing, analysing, testing, prioritizing, organizing and documenting of all these different requirements. Many of these may of course be the common needs of a number of stakeholders and will therefore be high on the priority list, but it is the project manager who is responsible for deciding on the viability or desirability of a particular requirement and to agree with the stakeholder on whether it should or could be incorporated, taking into account the cost, time and perfor-mance factors associated with the requirement. Once agreed, these requirements become the benchmark against which the success of the project is measured.
Ideally, all the requirements should be incorporated as clear deliverables in the objectives enshrined in the business case and confirmed by the project manager in the project-management plan. However, it is always possible that one or more stakeholders may wish to change these requirements either just before or even after the project scope has been agreed and finalized.

Business Case 27
The effect of such a change of requirement will have to be carefully examined by the project manager, who must take into account any cost implication, effects on the project programme, changes to the procedures and processes needed to incorporate the new requirement and the environmental impact in its widest sense.
In such a situation, the project manager must immediately advise all the relevant stakeholders of the additional cost, time and performance implications and obtain their approval before amending the objectives, scope and cost of the project.
If the change of requirements is requested after the official start of the project, that is, after the cost and time criteria have been agreed, the new requirements will be subject to the normal project (or contract)-change procedure and configuration management described elsewhere.
To log and control the requirement documents during the life of the project, a simple ‘report-ing matrix’, as shown in the following, will be helpful.
No. Document (Requirement) Prepared By Information From Sent or Copied to Issued Date
Testing and periodic reviews of the various requirements will establish their viability and ultimate effect on the outcome of the project. The following are some of the major character-istics that should be examined as part of this testing process: • Feasibility,operabilityandtimeconstraints• Functionality,performanceandqualityrequirementsandreliability• Compliancewithhealthandsafetyregulationsandlocalby-laws• Buildability,delivery(transportability),storageandsecurity• Environmentalandsociologicalimpact• Labour,staffing,outsourcingandtrainingrequirements
There may be occasions where the project manager is approached by a stakeholder, or even the client, to incorporate a ‘minor’ requirement ‘as a favour’. The dangers of agreeing to such a request without following the normal change-management procedures are self-apparent. A small request can soon escalate into a large change once all the ramifications and spin-off effects have become apparent which leads to the all too common ‘scope creep’. All changes to requirements, however small, must be treated as official and handled accordingly. It may of course be politically expedient not to charge a client for any additional requirement, but this is a commercial decision taken by senior management for reasons of creating goodwill, obtaining possible future contracts or succumbing to political pressure.
Further Reading
Gambles, I. (2009). Making the business case. Gower.West, D. (2010). Project sponsorship. Gower.

This page intentionally left blank

29Project Management, Planning and Control. http://dx.doi.org/10.1016/B978-0-08-102020-3.00006-1Copyright © 2017 Elsevier Ltd. All rights reserved.
CHAPTER 6
Investment Appraisal
The investment appraisal, which is a part of the business case, will, if properly structured, improve the decision-making process regarding the desirability or viability of the project. It should examine all the realistic options before making a firm recommendation for the pro-posed case. The investment appraisal must also include a cost/benefit analysis and take into account all the relevant factors such as: • Capitalcosts,operatingcostsandoverheadcosts• Supportandtrainingcosts• Dismantlinganddisposalcosts• Expectedresidualvalue(ifany)• Anycostsavingsthattheprojectwillbring• Anybenefitsthatcannotbeexpressedinmonetaryterms
To enable the comparison to be made of some of the options, the payback, return on capital, netpresentvalue(NPV)andanticipatedprofitmustbecalculated.Inotherwords,theprojectviability must be established.
Project ViabilityReturn on Investment
The simplest way to ascertain whether the investment in a project is viable is to calculate the return on investment(ROI).
If a project investment is £10,000 and gives a return of £2000 per year over 7 years,
Chapter OutlineProject Viability 29
Return on Investment 29Net Present Value 30Payback 33Internal Rate of Return 33Cost/Benefit Analysis 35
Further Reading 36
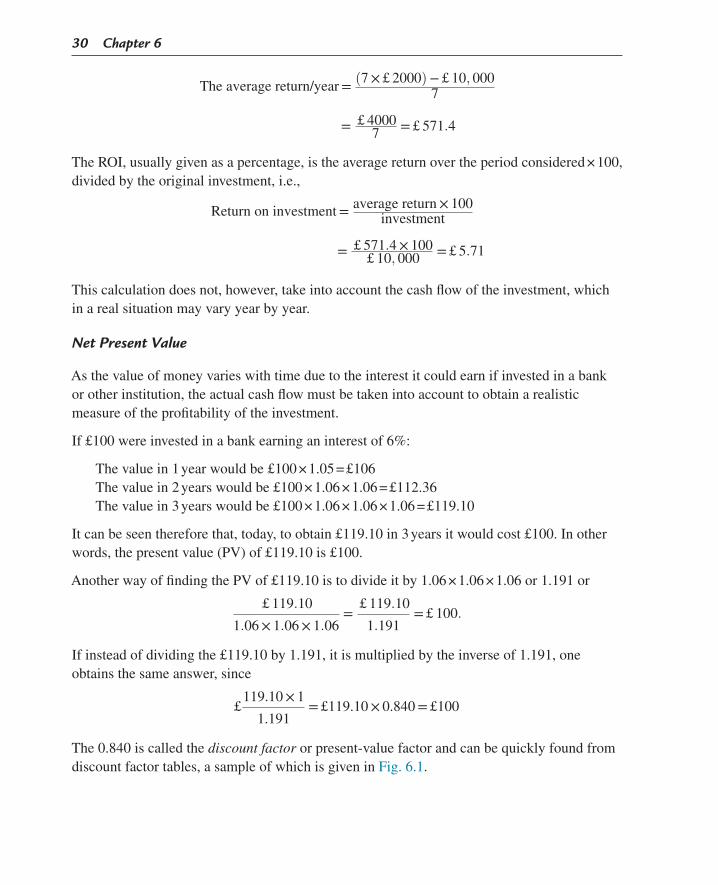
30 Chapter 6
The average return/year = (7 × £ 2000)− £ 10, 0007
= £ 40007 = £ 571.4
TheROI,usuallygivenasapercentage,istheaveragereturnovertheperiodconsidered×100,divided by the original investment, i.e.,
Return on investment = average return × 100investment
= £ 571.4 × 100£ 10, 000 = £ 5.71
This calculation does not, however, take into account the cash flow of the investment, which in a real situation may vary year by year.
Net Present Value
Asthevalueofmoneyvarieswithtimeduetotheinterestitcouldearnifinvestedinabankor other institution, the actual cash flow must be taken into account to obtain a realistic measure of the profitability of the investment.
If £100 were invested in a bank earning an interest of 6%:
Thevaluein1yearwouldbe£100×1.05=£106Thevaluein2yearswouldbe£100×1.06×1.06=£112.36Thevaluein3yearswouldbe£100×1.06×1.06×1.06=£119.10
Itcanbeseenthereforethat,today,toobtain£119.10in3yearsitwouldcost£100.Inotherwords,thepresentvalue(PV)of£119.10is£100.
AnotherwayoffindingthePVof£119.10istodivideitby1.06×1.06×1.06or1.191or
£ 119.10
1.06 × 1.06 × 1.06=
£ 119.10
1.191= £ 100.
Ifinsteadofdividingthe£119.10by1.191,itismultipliedbytheinverseof1.191,oneobtains the same answer, since
£
119.10 × 1
1.191= £119.10 × 0.840 = £100
The 0.840 is called the discount factor or present-value factor and can be quickly found from discount factor tables, a sample of which is given in Fig. 6.1.

Investment A
ppraisal 31
Period123456789101112131415161718192021222324252627282930
Period123456789101112131415161718192021222324252627282930
1%0.99010.98030.97050.96100.95150.01610.93270.92350.91430.90530.89630.88740.87870.87000.86130.85280.84440.83600.82770.81950.81140.80340.79540.78760.77980.77200.76440.75680.74930.7419
2%0.98040.96120.94230.92380.03280.01760.00960.00530.74770.84010.90040.78850.77300.75790.74300.72840.71420.70020.69640.67300.65980.64680.63420.62170.60950.59760.58590.57440.56310.5521
3%0.97090.94260.91510.88850.86260.83750.81310.78940.76640.74410.72240.70140.68100.66110.64190.62320.60500.58740.57030.55370.53750.52190.50870.49190.47760.46370.45020.43710.42430.4120
4%0.96150.92460.88900.85480.82190.79030.75990.73070.70260.67560.64960.62460.60060.57750.55530.53390.51340.49360.47460.45640.43880.42200.40570.39010.37510.36070.34680.33360.32070.3083
5%0.95240.90700.86380.82270.78350.74620.71070.67680.64460.61390.58470.55680.53030.50510.48100.45810.43630.41550.39570.37690.35890.34180.32560.31010.29530.28120.26780.25610.24290.2314
6%0.94340.89000.83960.79210.74730.70500.66510.62740.59190.55840.52680.49700.46880.44230.41730.39360.37140.35030.33050.31180.29420.27750.26180.24700.23300.21980.20740.19560.18460.1741
7%0.93460.87340.81630.76290.71300.66630.62270.58200.54390.50830.47510.44400.41500.38780.36240.33870.31660.29590.27650.25840.24150.22570.21090.19710.18420.17220.16090.15040.14060.1314
8%0.9259
Discount Rate
0.85730.79380.73500.69060.63020.58350.54030.50020.46320.42890.39710.36770.34050.31520.29190.27030.25020.23170.21450.19870.18390.17030.15770.14600.13520.12520.11590.10730.0994
9%0.91740.84170.77220.70840.64990.59630.54700.50190.46040.42240.38750.35550.32620.29920.27450.25190.23110.21200.19450.17840.16370.15020.13780.12640.11600.10640.09760.08960.08220.0754
10%0.90910.82640.75130.68300.62090.56450.51320.46650.42410.38550.35050.31960.28970.26330.23940.21760.19780.17990.16350.14860.13510.12280.11170.10150.09230.08390.07630.06930.06300.0573
11%0.90090.81160.73120.65870.59350.53460.48170.43390.39090.35220.31730.28580.25750.23200.20900.18830.16960.15280.13770.12400.11170.10070.09070.08170.07360.06630.05970.05380.04850.0437
12%0.89290.79720.71180.63550.56740.50660.45230.40390.36060.32200.28750.25670.22920.20460.18270.16310.14560.13000.11610.10370.09260.05260.07380.06590.05880.05250.04690.04190.03740.0334
13%0.88500.78310.69310.61330.54280.49030.42510.37620.33290.29460.26070.23070.20420.19070.15990.14150.12520.11060.09810.08680.07680.06800.06010.06320.04710.04170.03690.03260.02890.0258
14%0.87720.76950.87500.59210.51940.45560.39960.35060.30750.25970.23660.20760.18210.15970.14010.12290.10780.09460.08290.07280.06380.05600.04910.04310.03780.03310.02910.02550.02240.0196
15%0.86960.75610.65750.57180.49720.43230.37590.32690.28430.24720.21490.18690.16250.14130.12290.10690.09290.08080.07030.06110.05310.04620.04020.03490.03040.02640.02300.02000.01740.0151
Figure 6.1Discount factors.
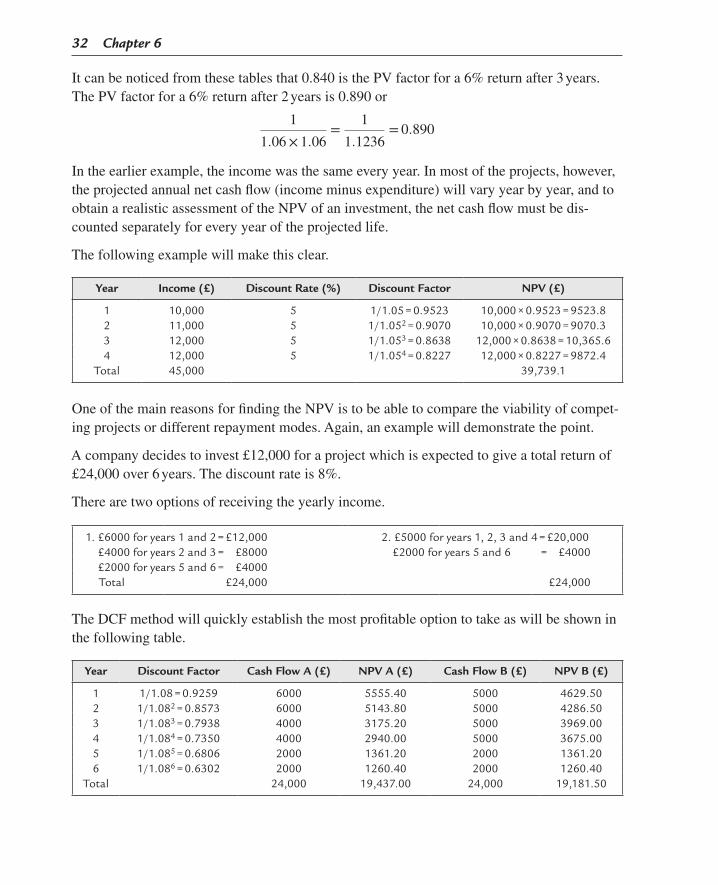
32 Chapter 6
Itcanbenoticedfromthesetablesthat0.840isthePVfactorfora6%returnafter3years.ThePVfactorfora6%returnafter2yearsis0.890or
1
1.06 × 1.06=
1
1.1236= 0.890
In the earlier example, the income was the same every year. In most of the projects, however, theprojectedannualnetcashflow(incomeminusexpenditure)willvaryyearbyyear,andtoobtainarealisticassessmentoftheNPVofaninvestment,thenetcashflowmustbedis-counted separately for every year of the projected life.
The following example will make this clear.
Year Income (£) Discount Rate (%) Discount Factor NPV (£)
1 10,000 5 1/1.05 = 0.9523 10,000 × 0.9523 = 9523.82 11,000 5 1/1.052 = 0.9070 10,000 × 0.9070 = 9070.33 12,000 5 1/1.053 = 0.8638 12,000 × 0.8638 = 10,365.64 12,000 5 1/1.054 = 0.8227 12,000 × 0.8227 = 9872.4
Total 45,000 39,739.1
OneofthemainreasonsforfindingtheNPVistobeabletocomparetheviabilityofcompet-ingprojectsordifferentrepaymentmodes.Again,anexamplewilldemonstratethepoint.
Acompanydecidestoinvest£12,000foraprojectwhichisexpectedtogiveatotalreturnof£24,000 over 6 years. The discount rate is 8%.
There are two options of receiving the yearly income.
1. £6000 for years 1 and 2 = £12,000 2. £5000 for years 1, 2, 3 and 4 = £20,000£4000 for years 2 and 3 = £8000 £2000 for years 5 and 6 = £4000£2000 for years 5 and 6 = £4000Total £24,000 £24,000
TheDCFmethodwillquicklyestablishthemostprofitableoptiontotakeaswillbeshowninthe following table.
Year Discount Factor Cash Flow A (£) NPV A (£) Cash Flow B (£) NPV B (£)
1 1/1.08 = 0.9259 6000 5555.40 5000 4629.502 1/1.082 = 0.8573 6000 5143.80 5000 4286.503 1/1.083 = 0.7938 4000 3175.20 5000 3969.004 1/1.084 = 0.7350 4000 2940.00 5000 3675.005 1/1.085 = 0.6806 2000 1361.20 2000 1361.206 1/1.086 = 0.6302 2000 1260.40 2000 1260.40
Total 24,000 19,437.00 24,000 19,181.50

Investment Appraisal 33
Clearly,Agivesthebetterreturn,andafterdeductingtheoriginalinvestmentof£12,000,thenetdiscountedreturnforA=£7437.00andforB=£7181.50.
ThemathematicalformulaforcalculatingtheNPVisasfollows:
If the annual net benefit is the same for each year for n years, the formula becomes
NPV = B/(1 + r)n.
Asexplainedpreviously,thediscountratecanvaryyearbyyear,sotheraterelevanttotheyear for which it applies must be used when reading off the discount factor table.
Two other financial calculations need to be carried out to enable a realistic decision to be taken as to the viability of the project.
Payback
Payback is the time taken to recover the capital outlay of the project, having taken into account all the operating and overhead costs during this period. Usually, this is based on the undis-counted cash flow. Knowledge of the payback is particularly important when the capital must be recouped as quickly as possible, as would be the case in short-term projects or projects whose end products have a limited appeal due to changes in fashion, competitive pressures or alterna-tiveproducts.Paybackiseasilycalculatedbysummatingallthenetincomesuntilthetotalequalstheoriginalinvestment(e.g.,iftheoriginalinvestmentis£600,000,andthenetincomeis£75,000peryearforthenext10years,thepaybackis£600,000/£75,000=8years).
Internal Rate of Return
Ithasalreadybeenshownthatthehigherthediscountrate(usuallythecostofborrowing)ofaproject,thelowertheNPV.Therefore,theremustcomeapointatwhichthediscountrateissuchthattheNPVbecomeszero.Atthispoint,theprojectceasestobeviableandthedis-count rate is the internal rate of return(IRR).Inotherwords,itisthediscountrateatwhichtheNPVis0.
WhileitispossibletocalculatetheIRRbytrialanderror,theeasiestmethodistodrawagraph as shown in Fig. 6.2.
If NPV = Net Present Valuer = the interest raten = number of years the project yields a return
B1, B2, B3, etc. = the annual net benefits for years 1, 2 and 3, etc.NPV for year 1 = B1/(1 + r)
for year 2 = B1/(1 + r) + B2/(1 + r)2
for year 3 = B1/(1 + r) + B2/(1 + r)2 + B3/(1 + r)3 and so on

34 Chapter 6
Thehorizontalaxisiscalibratedtogivethediscountratesfrom0toanychosenvalue,say20%.TheverticalaxisrepresentstheNPVs,aboveandbelowthehorizontalaxisdenotedby(+)and(−).
Bychoosingtwodiscountrates(onelowandonehigh),twoNPVscanbecalculatedforthesameenvisagednetcashflow.TheseNPVs(preferablyone+veandone−ve)arethenplottedonthegraphandjoinedbyastraightline.Wherethislinecutsthehorizontalaxis,i.e.,wheretheNPViszero,theIRRcanbereadoff.
The basic formulae for the financial calculations are given in the following.
Investment appraisal definitions
0+N
PV–N
PVDiscount rate
%
IRR%
Figure 6.2Internal rate of return (IRR) graph.
NPV = summation of PVs − original investmentNet income = incoming moneys − outgoing moneys
Payback period = no. of years it takes for net income to equal original investment
Profit = total net income − original investmentAverage return/annum = total net income
no. of years
Return on investment (%) = average return × 100
investment= net income × 100
no. of years × investment
IRR = % discount rate for NPV = 0

Investment Appraisal 35
Cost/Benefit Analysis
Oncethecostoftheprojecthasbeendetermined,ananalysishastobecarriedoutwhichcompares these costs with the perceived benefits. The first cost/benefit analysis should be carried out as part of the business case investment appraisal, but in practice such an analysis should really be undertaken at the end of every phase of the life cycle to ensure that the project is still viable. The phase interfaces give management the opportunity to proceed with or, alternatively, abort the project if there is an unacceptable escalation in costs or a diminution of the benefits due to changes in market conditions, such as a reduction in demand caused by political, economic, climatic, demographic or a host of other reasons.
It is relatively easy to carry out a cost/benefit analysis where there is a tangible deliver-ableproducingapredictablerevenuestream.ProvidedthereisanacceptableNPV,theproject can usually go ahead. However, where the deliverables are intangible, such as better service, greater customer satisfaction, lower staff turnover, higher staff morale, etc., there may be considerable difficulty in quantifying the benefits. It will be necessary in such cases to run a series of tests and reviews, and assess the results of interviews and staff reports.
Similarly,whilethecostofredundancypaymentscanbeeasilycalculated,thebenefitsinterms of lower staff costs over a number of years must be partially offset by lower production volumeorpoorercustomerservice.Wherethebenefitscanonlyberealizedoveranumberofyears, a benefit profile curve as shown in Fig.6.3 should be produced, making due allowance fortheNPVofthesavings.
Bene
fitC
ost Time
Figure 6.3Cost/benefit profile.

36 Chapter 6
Following is a list of some of the benefits that have to be considered, from which it will be apparent that some will be very difficult to quantify in monetary terms: • Financial• Statutory• Economy• Riskreduction• Productivity• Reliability• Staffmorale• Costreduction• Safety• Flexibility• Quality• Delivery• Social
Further Reading
Bradley,G.(2010).Fundamentals of project realisation.TheStationaryOffice.Gatti,S.(2007).Project finance in theory and practice.AcademicPress.Goldsmith,L.(2005).Project management accounting. Wiley.Khan,F.,&Parra,R.(2003).Financing large projects.PearsonEducationIndia.Rogers,M.(2001).Engineering project appraisal.BlackwellScience.

37Project Management, Planning and Control. http://dx.doi.org/10.1016/B978-0-08-102020-3.00007-3Copyright © 2017 Elsevier Ltd. All rights reserved.
CHAPTER 7
Stakeholder Management
Almost any person or organization with an interest in a project can be termed a stakeholder.
The type and interest of a stakeholder are of great importance to a project manager since they enable him or her to use these interests to the greatest benefit of the project. The process of listing, classifying and assessing the influence of these stakeholders is termed stakeholder analysis.
Stakeholders can be divided into two main groups: 1. Direct (or primary) 2. Indirect (or secondary)
Direct Stakeholders
This group is made up, as the name implies, of all those directly associated or involved in the planning, administration or execution of the project. These include the client, project sponsor, project manager, members of the project team, technical and financial services providers, internal or external consultants, material and equipment suppliers, site personnel, contractors and subcontractors as well as end users. In other words, people or organizations directly involved in all or some of the various phases of the project are called direct stakeholders.
Indirect Stakeholders
This group covers all those indirectly associated with the project, such as internal managers of the organization and support staff not directly involved in the project, including the HR depart-ment, accounts department, secretariat, senior management levels not directly responsible for the project and, last but not the least, the families of the project manager and team members.
A subsection of indirect stakeholders are those representing the regulatory authorities, such as national and local government, public utilities, licencing and inspecting organizations, technical institutions, professional bodies and personal interest groups such as stockholders, labour unions and pressure groups.
Chapter OutlineDirect Stakeholders 37Indirect Stakeholders 37

38 Chapter 7
Each of these groups can contain: • Positive stakeholders who support the aims and objectives of the project, and• Negative stakeholders who do not support the project and do not wish for it to proceed.
Direct stakeholders mainly consist of positive stakeholders as they are the ones concerned with the design and implementation of the project with the object of completing it within the speci-fied parameters of time, cost and quality/performance. They therefore include the sponsor, the project manager and the project design and construction/installation teams. This group could also have negative stakeholders such as employees of the end user, who would prefer to retain the existing facility because the new installation might result in relocation or even redundancy.
The indirect group probably contains the greatest number of potential negative stakeholders. These could include environmental pressure groups, trade (labour) unions, local residents’ associations and even politicians (usually in opposition) who object to the project on principle or on environmental grounds.
Local residents’ associations can be either positive or negative. For example, when it has been decided to build a bypass road around a town, the residents in the town may well be in favour to reduce the traffic congestion in the town centre, while residents in the outer villages, whose environment will be degraded by additional noise and pollution, will undoubtedly protest and will try to stop the road being constructed. It is these pressure groups who cause the greatest problems to the project manager.
In some situations, statutory/regulatory authorities or even government agencies, who have the power to issue or withhold permits, access, way leaves or other consents, can be consid-ered as negative stakeholders.
Fig. 7.1 shows some of the types of people or organizations in the different groups and subgroups.
Although most negative stakeholders are clearly disruptive and tend to hamper progress, often in ingenious ways, they must nevertheless be given due consideration and afforded the opportunity
Positive stakeholders Negative stakeholdersDirect Indirect Indirect
Internal External Internal External Internal ExternalSponsor Client Management Stockholders Disgruntled
employeesDisgruntled enduser
Project Contractors Accounts dept Banks Pressure groupsmanager Suppliers HR dept Insurers Unions
Consultants Tech. depts Utilities Press (media)Project Families Local Competitorsteam authorities PoliticiansProject Government Residents’office agencies associations
Figure 7.1Stakeholder groups.

Stakeholder Management 39
to state their case. Whether it is possible to change their attitude by debate or argument depends on the strength of their convictions and the persuasiveness of the project supporters.
Diplomacy and tact are essential when negotiating with potentially disruptive organizations, and it is highly advisable to enlist experts to participate in the discussion process. Most of the large organizations employ labour and public relation experts as well as lawyers well versed in methods for dealing with difficult stakeholders. Their services can be of enormous help to the project manager.
Therefore, it can be seen that for the project manager to be able to take advantage of the positive contributions of stakeholders and counter the negative ones most effectively, a detailed analysis must be carried out setting out the interests of each positive and negative stakeholder, the impact of these interests on the project, the probability of occurrence, particularly in the case of action by negative stakeholders and the actions, or reactions, to be taken.
Fig. 7.2 shows how this information can best be presented for analysis.
The Stakeholder column should contain the name of the organization and the main person or contact involved.
The Interest column states whether it is positive or negative, and whether it is financial, technical, environmental, organizational, commercial, political, etc.
The Influence/impact column sets out the possible effects of stakeholder interference, which may be helpful or disruptive. This influence could affect the cost, time or performance criteria of the project. Clearly, stakeholders with financial muscle must be of particular interest.
The Probability column can only be completed following a cursory risk analysis based on experience and other techniques such as brainstorming, Delphi and historical surveys.
The Action column relates to positive stakeholders and lists the best ways to generate support, such as maintaining good personal relations, invitations to certain meetings and updated information.
The Reaction column sets out the tactics to assuage unfounded fears, kill malicious rumours and minimize physical disruption.
The key to all these procedures is a good communication and intelligence gathering system.
Stakeholder Interest Influenceimpact
Probability Action tomaximize support
Reaction tominimize disruption
Figure 7.2Stakeholder analysis.

This page intentionally left blank

41Project Management, Planning and Control. http://dx.doi.org/10.1016/B978-0-08-102020-3.00008-5Copyright © 2017 Elsevier Ltd. All rights reserved.
CHAPTER 8
Project-Success Criteria
One of the topics in the project management plan is project-success criteria. These are the most important attributes and objectives that must be met to enable the project to be termed a success. The most familiar success criteria are completion on time, keeping the project costs within budget, and meeting the performance and quality requirements set out in the specifica-tion. However, in some industries there are additional criteria that are equally or even more important. These can be safety, sustainability, reliability, legacy (long-term performance) and meeting the desired business benefit. It can be argued that all these are enshrined in perfor-mance, but there is undoubtedly a difference of emphasis between industries, organizations and public perceptions. With the realization that climate change has a significant impact on the environment and our future lives, sustainability in the form of conservation of energy and natural resources and the control of carbon emissions have all become performance criteria in their own right, especially as these will be subject to stricter and stricter government legisla-tion across the whole industrial spectrum. In this context, sustainability is of course linked with legacy, as future generations will thrive or suffer depending on our success in meeting these important criteria.
It is always possible that during the life of a project, problems arise that demand that certain changes have to be made which may involve compromises and trade-offs to keep the project either on programme or within the cost boundaries. The extent to which these compromises are acceptable or permissible depends on their scope and nature, and requires the approval of the project manager and possibly also the sponsor and client. However, where such an envis-aged change will affect one of the project-success criteria, a compromise of the affected success criterion may not be acceptable under any circumstance.
For example, if one of the project-success criteria is that the project finishes by or before a certain date, then there can be no compromise of the date, but the cost may increase or quality may be sacrificed.
Success criteria can of course be subjective and depend often on the point of view of the observer. Judging by the conventional criteria of a well-managed project, i.e., cost, time and performance, the Sydney Opera House failed in all three, as it was vastly over budget, very late
Chapter OutlineKey Performance Indicators 42

42 Chapter 8
in completion and is considered to be too small for a grand opera. Despite this, most people consider it to be a great piece of architecture and a wonderful landmark for the city of Sydney.
While it is not difficult to set the success criteria, they can only be achieved if a number of success factors are met. The most important of these are given in the following: • Clearobjectivesandprojectbriefagreedwithclient• Goodprojectdefinition• Goodplanningandschedulingmethods• Accuratetimecontrolandfeedbacksystem• Rigorousperformancemonitoringandcontrolsystems• Rigorouschangecontrol(variations)procedures• Adequateresourceavailability(finance,labour,plant,materials)• Fulltop-managementandsponsorsupport• Competentprojectmanagement• Tightfinancialcontrol• Comprehensivequalitycontrolprocedures• Motivatedandwell-integratedteam• Competentdesign• Goodcontractualdocumentation• Goodinternalandexternalcommunications• Goodclientrelationship• Well-designedreportingsystemtomanagementandclient• Politicalstability• Awarenessofenvironmentalissuesandrelatedlegislation
This list is not exhaustive, but even if one of the functions or systems listed is not performed adequately, the project may well end in failure.
Key Performance Indicators
Akey performance indicator(KPI)isamajorcriterionagainstwhichaparticularpartoftheprojectcanbemeasured.KPIcanbeamilestonethatmustbemet,suchasapredetermineddesign, delivery, installation, production, testing, erection or commissioning stage, a payment date(inorout)oranyotherimportantstageinaproject.Inprocessplants,KPIscanincludethe contractual performance obligations such as output or throughput, pressure, temperature or other quality requirements. Even when the project has been commissioned and handed over,KPIsrelatingtoperformanceoverdefinedtimespans(reliabilityandrepeatability)arestillpartofthecontractualrequirements.SomeKPIscannotbemeasuredorprovenuntiltheproject or the operations following project completion have been running for a number of years, but these, which could also include performance and sustainability criteria, should nevertheless be considered and incorporated at both the planning and execution stages.

43Project Management, Planning and Control. http://dx.doi.org/10.1016/B978-0-08-102020-3.00009-7Copyright © 2017 Elsevier Ltd. All rights reserved.
CHAPTER 9
Organization Structures
Chapter OutlineFunctional Organization 43Matrix Organization 43Project Organization (Taskforce) 44
To manage a project, a company or authority has to set up a project organization, which can supply the resources for the project and service it during its life cycle. There are three main types of project organizations: 1. Functional 2. Matrix 3. Project or taskforce
Functional Organization
This type of organization consists of specialist or functional departments, each with their own departmental manager responsible to one or more directors. Such an organization is ideal for routine operations where there is little variation of the end product. Functional organizations are usually found where items are mass produced, whether they are motor cars or sausages. Each department is expert at its function and the interrelationship between them is well established. In this sense a functional organization is not a project-type organization at all and is only included because when small, individual one-off projects have to be carried out, they may be given to a particular department to manage. For projects of any reasonable size or complexity, it will be necessary to set up one of the other two types of organizations.
Matrix Organization
This is probably the most common type of project organization, since it utilizes an existing functional organization to provide the human resources without disrupting the day-to-day operation of the department.
The personnel allocated to a particular project are responsible to a project manager for meeting the three basic project criteria: time, cost and quality. The departmental manager is,

44 Chapter 9
however, still responsible for their ‘pay and rations’ and their compliance with the depart-ment’s standards and procedures, including technical competence and conformity to com-pany’s quality standards. The members of this project team will still be working at their desks in their department, but will be booking their time to the project. Where the project does not warrant a full-time contribution, only those hours actually expended on the project will be allocated to it.
The advantages of a matrix organization are: 1. Resources are employed efficiently, since staff can switch to different projects if any one
of the project is held up. 2. The expertise built up by the department is utilized and the latest state-of-the-art tech-
niques are immediately incorporated. 3. Special facilities do not have to be provided and disrupting staff movements are
avoided. 4. The career prospects of team members are left intact. 5. The organization can respond quickly to changes of scope. 6. The project manager does not have to be concerned with staff problems.
The disadvantages are: 1. There may be a conflict of priorities between different projects. 2. There may be split loyalties between the project manager and the departmental manager
due to the dual reporting requirements. 3. Communications among team members can be affected if the locations of the depart-
ments are far apart. 4. Executive management may have to spend more time to ensure a fair balance of power
between the project manager and the department manager.
Matrix organizations can sometimes be categorized as strong or weak, depending on the degree of dominance or authority of the project manager or department manager, respectively. This can of course create friction as both sides will try to assert themselves.
However, all the earlier problems can be resolved if senior management ensures (and indeed insists) that there is a good working relationship between the project manager and the depart-ment heads. At times, both sides may have to compromise for sake of the interests of the project and the organization as a whole.
Project Organization (Taskforce)
From a project manager’s point of view, this is the ideal type of project organization, since with such a setup he or she has complete control over every aspect of the project. The project team will usually be located in one area, which can be a room for a small project or a com-plete building for a very large one.

Organization Structures 45
Lines of communication are short and the interaction of the disciplines reduces the risk of errors and misunderstandings. Not only are the planning and technical functions parts of the team but also the project cost control and project accounting staff. This places an enormous burden and responsibility on the project manager, who will have to delegate much of the day-to-day management to special project coordinators whose prime function is to ensure a good commu-nication flow and timely receipt of reports and feedback information from external sources.
On large projects with budgets often greater than £0.5 billion, the project manager’s responsi-bilities are akin to those of a managing director of a medium-size company. He or she is not only concerned with the technical and commercial aspects of the project but must also deal with the staff, financial and political issues, which are often more difficult to delegate.
There is no doubt that for the large projects a taskforce type of project organization is essen-tial, but as with so many areas of business, the key to success lies with the personality of the project manager and his or her ability to inspire the project team to regard themselves as personal stakeholders in the project.
One of the main differences between the two true project organizations (matrix and taskforce) and the functional organization is the method of financial accounting. For the project manager to retain proper cost control during the life of the project, it is vital that a system of project accounting is instituted, whereby all incomes and expenditures, including a previously agreed overhead allocation and profit margin, are booked to the project as if it were a separate self-standing organization. The only possible exceptions are certain corporate financial transactions such as interest payments on loans taken out by the host organization and interest receipts on deposits from a positive cash flow.
Fig. 9.1 shows a diagrammatic representation of the three basic project management organi-zations, functional, project (or taskforce) and matrix.
Managingdirector
Managingdirector
Managingdirector
Functionalheads
Transporting
Test
Production
Design D
ev.
Marketing
Functional
Programmemanager
Programmemanager
Project
Project1
Project2
Project3
Director
Transporting
Test
Production
Design
Dev.
Marketing
Matrix
Project 1 Resources
Project 2
Project 3
Resources
Resources
Figure 9.1Types of organization.

This page intentionally left blank

47Project Management, Planning and Control. http://dx.doi.org/10.1016/B978-0-08-102020-3.00010-3Copyright © 2017 Elsevier Ltd. All rights reserved.
CHAPTER 10
Organization RolesEvery project has a number of key people, who have important roles to play. Each of these role players has specific responsibilities, which, if carried out in their prescribed manner, will ensure a successful project. The following list gives some examples of these organizational roles: • Projectsponsor• Portfoliomanager• Programmemanager• Projectmanager• Projectplanningmanagerorprojectplanner• Costmanagerorcostcontrolmanager• Riskmanager• Procurementmanager• Configurationmanager• Qualitymanager• Projectboardorsteeringcommittee• Projectsupportoffice
In practice, the need for some of these roles depends on the size and complexity of the project and the organizational structure of the company or authority carrying out the project. For example, a small organization carrying out only two or three small projects a year may not require, or indeed be able to afford, many of these roles. Having received the commission from the client, a good project manager supported by a planner, a procurement manager and established well-documented quality control and risk procedures may well be able to deliver the specified requirements.
The detailed descriptions of the earlier roles are given in the relevant sections dealing with each topic, but the last two roles warrant some further discussion.
A project board or steering committee is sometimes set up for large projects to act as a supervising authority, and sometimes as a champion, during the life cycle of the project. Its job is to ensure that the interests of the sponsoring organization (or client) are protected and that the project is run and delivered to meet the requirements of these organizations. The project board appoints the project manager, and the project manager must report to the project board on a regular basis and obtain from it the authority to proceed after certain predeter-mined stages have been reached.

48 Chapter 10
NationalorlocalgovernmentprojectsfollowingthePRINCEmethodologyfrequentlyhaveaproject board, as the project may affect a number of different departments who are all stake-holders to a greater or lesser extent. The board is thus usually constituted from senior manag-ers (or directors) of the departments most closely involved in the project. A project board may also be desirable where the client consists of a number of companies who are temporary partners in a special consortium set up to deliver the project. A typical example is a consor-tium of a number of oil producers who each have a share in a refinery, drilling platform or pipeline either during the construction or operating phase, or both.
Ideally, the board should only be consulted or be required to make decisions on major issues, as unnecessary interference with the normal running of a project will undermine the authority of the project manager. However, there may be instances where fundamental disagreements or differences of interests among functional departments or stakeholders need to be discussed and resolved, and it is in such situations that the project board can play a useful role.
The project support office briefly described in Chapter2 is only required on large projects, where it is desirable to service all the project administration and project technology by a central department or office, supervised by a service manager. The functions most usually carried out by the project support office are the preparation and updating of the project schedule (programme), collection and processing of time sheets, progress reports, project costs and quality reports, operating configuration management and controlling the dissemina-tion of specifications, drawings, schedules and other data.
The project support office is in fact the secretariat of the project and its size, and its constitu-tion will therefore depend on the size of the project, its technical complexity and its adminis-trative procedures and reporting requirements. The administrative procedures and reporting requirements can be very onerous where the client organization is a consortium of companies, each of which requires its own reporting procedures, cost reports and timetable for submission.
Ideally, the accounting system for the project should be self-contained and independent ofthecorporateaccountingsystem.Clearly,amonthlycostreportwillhavetobesubmit-ted to the organization’s accounts department, but project accounting will give speedier and more accurate cost information to the project manager, which will enable him or her to take appropriate action before the costs spiral out of control. The project support office can play a vital role in this accounting function provided that the office staff includes the project accountants. These accountants control not only the direct costs such as labour, materials, equipment and plant but also those indirect costs and expenses related to the project.

49Project Management, Planning and Control. http://dx.doi.org/10.1016/B978-0-08-102020-3.00011-5Copyright © 2017 Elsevier Ltd. All rights reserved.
CHAPTER 11
Project Life Cycles
Most, if not all, projects go through a life cycle that varies with the size and complexity of the project. For medium to large projects, the life cycle will generally follow the following pattern:
1 Concept Basic ideas, business case, statement of requirements, scope2 Feasibility Tests for technical, commercial and financial viability, technical studies,
investment appraisal, discounted cash flow, etc.3 Evaluation Application for funds, stating risks, options, time, cost, performance criteria4 Authorization Approvals, permits, conditions, project strategy5 Implementation Development design, procurement, fabrication, installation, commissioning6 Completion Performance tests, handover to client, post-project appraisal7 Operation Revenue earning period, production, maintenance8 Termination Close-down, decommissioning, disposal
Items seven and eight are not usually included in a project life cycle, where the project ends with the issue of an acceptance certificate after the performance tests have been successfully completed. Where these two phases are included, as, for example, with defence projects, the term extended project life cycle is often used.
The project life cycle of an IT project may be slightly different as the following list shows:
1 Feasibility Definition, cost benefits, acceptance criteria, time, cost estimates2 Evaluation Definitions of requirements, performance criteria, processes3 Function Functional and operational requirements, interfaces, system design4 Authorization Approvals, permits, firming up procedures5 Design and build Detail design, system integration, screen building, documentation6 Implementation Integration and acceptance testing, installation, training7 Operation Data-loading, support setup, handover
Running through the period of the life cycle are control systems and decision stages at which the position of the project is reviewed. The interfaces of the phases of the life cycle form convenient milestones for progress payments and reporting progress to top management, who can then make the decision to abort the project or provide further funding. In some cases the interfaces of the phases overlap, as in the case of certain design and construct contracts, where construction starts before the design is finished. This is known as concurrent engineer-ing and is often employed to reduce the overall project programme.

50 Chapter 11
As the word cycle implies, the phases may have to be amended in terms of content, cost and duration as new information is fed back to the project manager and sponsor. Projects are essentially dynamic organizations that are not only specifically created to effect change, but are also themselves subject to change.
For some projects it may be convenient to appoint a different project manager at a change of phase. This is often done where the first four stages are handled by the development or sales department, who then hands the project over to the operations department for the various stages of implementation and completion phases.
When the decommissioning and disposal is included, it is known as an extended life cycle, since these two stages could occur many years after commissioning and could well be carried out by a different organization.
While all institutions associated with project management stress the importance of the project cycle, both British Standards Institution (BSI) and International Standards Organisation (ISO) preferred describing what operations should be carried out during the various phases, rather than giving the phases specific names.
Different organizations tend to have different descriptions and sequences of the phases, and Fig. 11.1 shows two typical life cycles prepared by two different organizations. The first example, as given by Association for Project Management (APM) in their latest Body of Knowledge, is a very simple generic life cycle consisting of only six basic phases. The second life cycle, as formulated by the Ministry of Defence (MoD), clearly shows the phases required for a typical weapons system, where concept, feasibility and project definition are the responsibility of the MoD; design, development and production are carried out by the
CalendarConcept
Concept
Businesscase
Definition
Feasibility
Development
Disposal
Handover
ProductionIn-service
Design and developmentProject definition
OperationTermination
APM (BoK)
MoD (CADMID)
Project management plan
Figure 11.1Examples of project life cycles.

Project Life Cycles 51
manufacturer; and in-service and disposal are the phases when the weapon is in the hands of the armed forces.
The diagram also shows a calendar scale over the top. While this is not strictly necessary, it can be seen that if the lengths of the bars representing the phases are drawn proportional to the time taken by the phases, such a presentation can be used as a high-level reporting document, showing which phases are complete or partially complete in relation to the original schedule.
The important point to note is that each organization should develop its own life cycle dia-gram to meet its particular needs. Where the life cycle covers all the phases from cradle to grave as it were, it is often called a programme life cycle, since it spans over the full pro-gramme of the deliverable. The term project life cycle is then restricted to those phases that constitute a project within the programme (e.g., the design, development and manufacturing periods).
Fig. 11.2 shows how decision points or milestones (sometimes called trigger points or gates) relate to the phases of a life cycle. At each gate, a check should be carried out to ensure that the project is still viable, that it is still on schedule, that costs are still within budget, that sufficient resources are available for the next phase and that the perceived risks can be managed.
Fig. 11.3 shows how the life cycle of the MoD project shown in Fig. 11.1 could be split into the project life cycle, i.e., the phases under the control of the project team (conception to production), the product life cycle, the phases of interest to the sponsor, which now includes
Shutdown
Handover
Authorization
TerminationOperation
ImplementationFeasibility
Conception
Milestones
Phases
Figure 11.2Project management life cycle.

52 Chapter 11
the in-service performance and lastly the extended life cycle, which includes disposal. From the point of view of the contractor, the project life cycle may only include design, develop-ment and production. Therefore, it can be seen that there are no hard-and-fast rules as to where the demarcation points are, as each organization will define its own phases and life cycles to suit its method of working.
Concept Feasibility Projectdefinition
Design anddevelopment Production In-service Disposal
Project life cycleProduct life cycleExtended life cycle
Figure 11.3Life cycle of MoD project.

53Project Management, Planning and Control. http://dx.doi.org/10.1016/B978-0-08-102020-3.00012-7Copyright © 2017 Elsevier Ltd. All rights reserved.
CHAPTER 12
Work Breakdown Structures
Chapter OutlineResponsibility Matrix 58Further Reading 59
An examination of the project life cycle diagram will show that each phase can be regarded as a project in its own right, although each will be of very different size and complexity. For example, when a company is considering developing a new oil field, the feasibility study phase could be of considerable size although the main project would cover the design, devel-opment and production phases. To be able to control such a project, the phases must be broken down further into stages or tasks, which in turn can be broken down further into subtasks or work packages until a satisfactory and acceptable control structure has been achieved.
The choice of tasks incorporated in the work breakdown structure (WBS) is best made by the project team drawing on their combined experience or by engaging in a brainstorming session.
Once the main tasks have been decided upon, they can in turn be broken down into subtasks or work packages, which should be coded to fit in with the project cost coding system. This will greatly assist in identifying the whole string of relationships from overall operational areas down to individual tasks. For this reason, the WBS is the logical starting point for subsequent planning networks. Another advantage is that a cost allocation can be given to each task in the WBS and, if required, a risk factor can also be added. This will assist in building up the total project cost and creates a risk register for a subsequent, more rigorous risk assessment.
The object of all this is to be able to control the project by allocating resources (human, material and financial) and giving time constraints to each task. It is always easier to control a series of small entities that make up a whole, than to control the whole enterprise as one operation. What history has proven to be successful for armies – which are divided into divisions, regiments, battalions, companies and platoons – or corporations – which have area organizations, manufacturing units and sales territories – is also true for projects, whether they are large, small, sophisticated or straightforward.
The tasks will clearly vary enormously with the type of project in both size and content, but by representing their relationships diagrammatically, a clear graphical picture can be created.

54 Chapter 12
This, when distributed to other members of the project team, becomes a very useful tool for disseminating information as well as a reporting medium to all stakeholders. As the comple-tion of the main tasks are in fact the major project milestones, the WBS is an ideal instrument for reporting progress upwards to senior management, and, for this reason, it is essential that the status of each work package or task is regularly updated.
As the WBS is produced in the very early stages of a project, it will probably not reflect all the tasks that will eventually be required. Indeed, the very act of draughting the WBS often throws up the missing items or work units, which can then be formed into more convenient tasks. As these tasks are decomposed further, they may be given new names such as unit or work package. It is then relatively easy for management to allocate task owners to each task or group of tasks, who have the responsibilities for delivering each task to the normal project criteria of cost, time and quality/performance.
The abbreviation WBS is a generic term for a hierarchy of stages of a project. However, some methodologies like PRINCE call such a hierarchical diagram a product breakdown structure (PBS) (Fig. 12.1). The difference is basically what part of speech is being used to describe the stages. If the words used are nouns, it is, strictly speaking, a PBS, because we are dealing with products or things. If, on the other hand, we are describing the work that has to be performed on the nouns and use verbs, we call it a WBS. Frequently, a diagram starts as a PBS for the first three or four levels and then becomes a WBS as more detail is introduced.
Despite this unfortunate lack of uniformity of nomenclature in the project management fraternity, the principles of subdividing the project into manageable components are the same.
It must be pointed out, however, that the WBS is not a programme, although it looks like a precedence diagram. The interrelationships shown by the link lines do not necessarily imply a time-dependence or indeed any sequential operation.
Engine Transmission SideMembers
CrossMembers
Roofand Floor
Interiorand Trim
PowerUnit Chassis
CarAssembly
BodyShell
0.0
2.0 0.31.0
2.22.11.2 2.31.31.1
Figure 12.1Product breakdown structure.

Work Breakdown Structures 55
The corresponding WBS shown in Fig. 12.2 uses verbs, and the descriptions of the packages or tasks then become: assemble car, build power unit, weld chassis, press body shell, etc.
The degree to which the WBS needs to be broken down before a planning network can be drawn will have to be decided by the project manager, but there is no reason why a whole family of networks cannot be produced to reflect each level of the WBS.
Once the WBS (or PBS) has been drawn, a bottom-up cost estimate can be produced starting at the lowest branch of the family tree. In this method, each work package cost is calculated and arranged in such a way that the total cost of the packages on any branch must add up to the cost of the package of the parent package on the branch above. If the parent package has a cost value of its own, this must clearly be added before the next stage of the process. This is shown in Fig. 12.3, which not only explains the bottom-up estimating process, but also shows
AssembleEngine
AssembleTransmission
Weld SideMembers
Forge CrossMembers
Press Roofand Sides
Fit outInterior
Build PowerUnit
WeldChassis
AssembleCar
0.0
2.0 0.30.1
2.22.11.2 2.31.31.1
AssembleBody Shell
Figure 12.2Work breakdown structure.
A 0.036
B 1.09 + 2 = 11
C 2.022 + 3 = 25
D 1.18 + 1 = 9
G 1.1.15
H 1.1.23
I 2.1.16
J 2.1.22
K 2.2.15
L 2.2.24
E 2.18 + 2 = 10
F 2.29 + 3 = 12
36
922
988
Figure 12.3Cost breakdown structure.

56 Chapter 12
how the packages can be coded to produce a project cost coding system that can be carried through to network analysis and earned value analysis.
The resulting diagram is now a cost breakdown structure (CBS).
It can be seen that a WBS is a powerful tool that can show clearly and graphically who is responsible for a task, how much it should cost and how it relates to the other tasks in the project. It was stated earlier that the WBS is not a programme, but once it has been accepted as a correct representation of the project tasks, it will become a good base for drawing up the network diagram. The interrelationships of the tasks will have to be shown more accurately, and the only additional items of information to be added are the durations.
An alternative to the bottom-up cost allocation is the top-down cost allocation. In this method, the cost of the total project (or subproject) has been determined and is allocated to the top package of the WBS (or PBS) diagram. The work packages below are then forced to accept the appropriate costs so that the total cost of each branch cannot exceed the total cost of the package above. Such a top-down approach is shown in Fig. 12.4.
In practice, both methods may have to be used. For example, the estimator of a project may use the bottom-up method on a WBS or PBS diagram to calculate the cost. When this is given to the project manager, he or she may break this total down into the different departments of an organization and allocate a proportion to each, making sure that the sum total does not exceed the estimated cost. Once names have been added to the work packages of a WBS or PBS it becomes an organization breakdown structure (OBS).
A 0.036
B 1.0
D 1.1
G 1.1.1 H 1.1.2 I 2.1.1 J 2.1.2 K 2.2.1 L 2.2.23 6 2 5 4
E 2.1 F 2.2
C 2.011
9
5
10 12
25
Figure 12.4Top-down cost allocation.

Work Breakdown Structures 57
It did not take long for this similarity to be appreciated, so that another name for such an organization diagram became organization breakdown. This is the family tree of the organiza-tion in the same way that the WBS is in fact the family tree of the project. It is in fact more akin to a family tree or organization chart (organogram).
Fig. 12.5 shows a typical OBS for a manufacturing project such as the assembly of a proto-type motor car. It can be seen that the OBS is not identical in layout to the WBS, as one manager or task owner can be responsible for more than one task.
The OBS shown is typical of a matrix-type project organization where the operations man-ager is in charge of the actual operating departments for ‘pay and rations’, but each depart-mental head (or his or her designated project leader) also has a reporting line to the project manager. If required, the OBS can be expanded into a responsibility matrix to show the responsibility and authority of each member of the organization or project team.
The quality assurance (QA) manager reports directly to the director to ensure independence from the operating and projects departments. He or she will, however, assist all operating departments with producing the quality plans and give ongoing advice on QA requirements and procedures as well as pointing out any shortcomings he or she may discover.
Although the WBS may have been built up by the project team, based on their collective experience or by brainstorming, there is always the risk that a stage or task has been forgotten (Table 12.1).
Director
ProjectManager
Power PlantManager
EngineSuperintendent
nemeroFnemeroFnemeroFnemeroF
TransmissionSuperintendent
Chassis ShopManager
ChassisSuperintendent
BodyworkSuperintendent
Body ShopManager
OperationsManager
QAManager
Figure 12.5Organization breakdown structure.
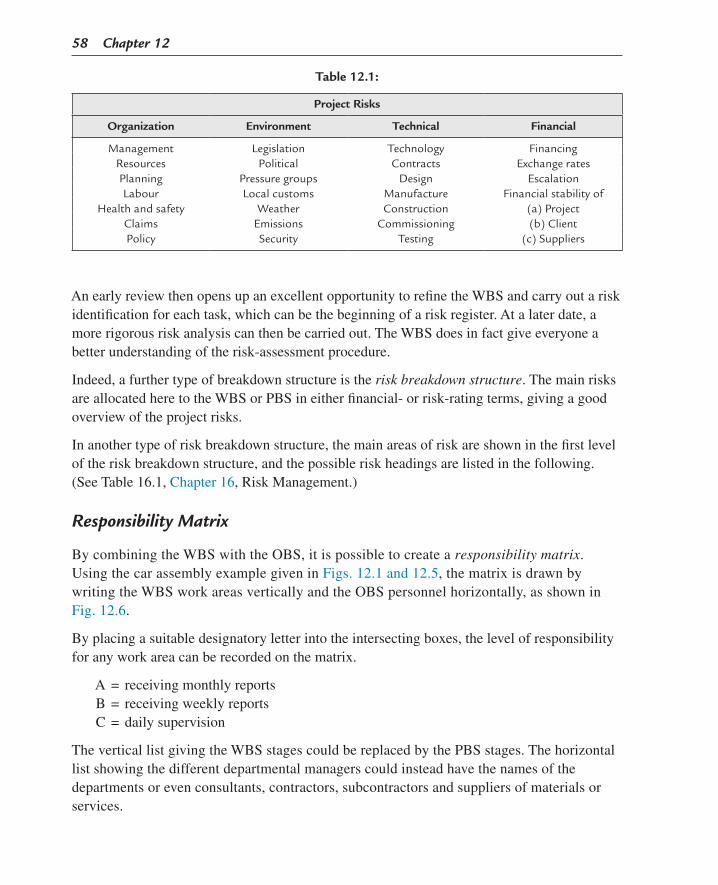
58 Chapter 12
An early review then opens up an excellent opportunity to refine the WBS and carry out a risk identification for each task, which can be the beginning of a risk register. At a later date, a more rigorous risk analysis can then be carried out. The WBS does in fact give everyone a better understanding of the risk-assessment procedure.
Indeed, a further type of breakdown structure is the risk breakdown structure. The main risks are allocated here to the WBS or PBS in either financial- or risk-rating terms, giving a good overview of the project risks.
In another type of risk breakdown structure, the main areas of risk are shown in the first level of the risk breakdown structure, and the possible risk headings are listed in the following. (See Table 16.1, Chapter 16, Risk Management.)
Responsibility Matrix
By combining the WBS with the OBS, it is possible to create a responsibility matrix. Using the car assembly example given in Figs. 12.1 and 12.5, the matrix is drawn by writing the WBS work areas vertically and the OBS personnel horizontally, as shown in Fig. 12.6.
By placing a suitable designatory letter into the intersecting boxes, the level of responsibility for any work area can be recorded on the matrix.
A = receiving monthly reportsB = receiving weekly reportsC = daily supervision
The vertical list giving the WBS stages could be replaced by the PBS stages. The horizontal list showing the different departmental managers could instead have the names of the departments or even consultants, contractors, subcontractors and suppliers of materials or services.
Table 12.1:
Project Risks
Organization Environment Technical Financial
Management Legislation Technology FinancingResources Political Contracts Exchange ratesPlanning Pressure groups Design EscalationLabour Local customs Manufacture Financial stability of
Health and safety Weather Construction (a) ProjectClaims Emissions Commissioning (b) ClientPolicy Security Testing (c) Suppliers

Work Breakdown Structures 59
Further Reading
Haugan, G. T. (2002). Effective work breakdown structures. Kogan Page.
Car AssemblyPower UnitChassisBody ShellEngineTransmissionSide MembersCross MembersRoof and FloorInterior and Trim
Dire
ctor
Pro
ject
Man
ager
Ope
ratio
ns M
anag
er
QA
Man
ager
Pow
er P
lant
Man
ager
Cha
ssis
Sho
p M
anag
er
Bod
y S
hop
Man
ager
Eng
ine
Sup
erin
tend
ent
Tran
smis
sion
Sup
erin
tend
ent
Cha
ssis
Sup
erin
tend
ent
Bod
ywor
k S
uper
inte
nden
t
AAAA
BBBBBBBBBB
AAAAAAAAAA
BBBBBBBBBB
C
CC
C
CC
C
CC
CC
CC
CC
Figure 12.6Responsibility matrix.

This page intentionally left blank

61Project Management, Planning and Control. http://dx.doi.org/10.1016/B978-0-08-102020-3.00013-9Copyright © 2017 Elsevier Ltd. All rights reserved.
CHAPTER 13
Estimating
Estimating is an essential part of project management, since it becomes the baseline for the subsequent cost control. If the estimate for a project is too low, a company may well lose money in the execution of the work. If the estimate is too high, the company may well lose the contract due to overpricing.
As explained in the section on work breakdown structures, there are two basic methods of estimating: top-down and bottom-up. However, unfortunately only in a few situations the costs are available in a form for simply slotting into the work package boxes. Therefore, it is necessary to produce realistic estimates for each package, and indeed for the entire project, before a meaningful cost estimate can be carried out. For most of the estimates that require any reasonable degree of accuracy, the method used must be bottom-up. This principle is used in bills of quantities, which literally start at the bottom of the construction process, the ground clearance and foundations, and work up through the building sequence to the final stages such as painting and decorating.
Estimating the cost of a project requires a structured approach, but whatever method is used, the first thing is to decide the level of accuracy required. This depends on the status of the project and the information available. There are four main estimating methods in use, varying from the very approximate to the very accurate. These are: 1. subjective (degree of accuracy ±20%–40%) 2. parametric (degree of accuracy ±10%–20%) 3. comparative (degree of accuracy ±10%) 4. analytical (degree of accuracy ±5%)
Subjective
At the proposal stage, the contractor may well be able to give only a ‘ballpark figure’ to give a client or sponsor an approximate ‘feel’ of the possible costs. The estimating method used in
Chapter OutlineSubjective 61Parametric 62Comparative (by Analogy) 62Analytical 62Further Reading 65
62 Chapter 13
this case would either be subjective or approximate parametric. In either case, the degree of accuracy would largely depend on the experience of the estimator. When using the subjective method, the estimator relies on his or her experience of similar projects to give a cost indica-tion based largely on ‘hunch’. Geographical and political factors as well as the more obvious labour and material content must be taken into account. Such an approximate method of estimating is often given the disparaging name of ‘guesstimating’.
Parametric
The parametric method would be used at the budget preparation stage, but relies on good historical data-based past jobs or experience. By using well-known empirical formulae or ratios, in which costs can be related to specific characteristics of known sections or areas of the project, it is possible to produce a good estimate on which firm decisions can be based. Clearly, such estimates need to be qualified to enable external factors to be separately assessed. For example, an architect will be able to give a parametric estimate of a new house once he or she is given the cube (height × length × depth) of the proposed building and the standard of construction or finish. The estimate will be in £/cubic metre of structure. Similarly, office blocks are often estimated in £/square metre of floor space. The qualifications would be the location, ground conditions, costs of the land, etc. Another example of a para-metric estimate is when a structural steel fabricator gives the price of fabrication in £/tonnes of steel, depending on whether the steel sections are heavy beams and columns or light latticework. In both cases, the estimate may or may not include the cost of the steel itself.
Comparative (by Analogy)
As an alternative to the parametric method, the comparative method of estimating can be used for the preparation of the budget. When a new project is very similar to another project recently completed, a quick comparison can be made of the salient features. This method is based on the costs of a simplified schedule of major components that were used on previous similar jobs. It may even be possible to use the costs of a similar-sized complete project of which one has had direct (and preferably recent) experience. Due allowance must clearly be made for the inevitable minor differences, inflation and other possible cost escalations. An example of such a compara-tive estimate is the installation of a new computer system in a building when an almost identical (and proven) system was installed 6 months earlier in another building. It must be stressed that such an estimate does not require a detailed breakdown.
Analytical
Once the project has been sanctioned, a working budget estimate will be necessary against which the cost of the project will be controlled. This will normally require an analytical
Estimating 63
estimate or bill of quantities. This type of estimate may also be required where a contractor has to submit a fixed-price tender, since once the contract is signed there can be no price adjustment except by inflation factors or client-authorized variations.
As the name implies, this is the most accurate estimating method, but it requires the project to be broken down into sections, subsections and finally individual components. Each compo-nent must then be given a cost value (and preferably also a cost code) including both the material and labour contents. The values, which are sometimes referred to as ‘norms’, are usually extracted from a database, or company archives, and must be individually updated or factored to reflect the current political and environmental situation.
Examples of analytical estimates are the norms used by the petrochemical industry where a value exists for the installation of piping depending on pipe diameter, wall thickness, material composition, height from ground level and whether flanged or welded. The norm is given as a cost/linear metre, which is then multiplied by the meterage including an allowance for waste. Contingencies, overheads and profits are then added to the total sum.
Quantity surveyors will cost a building or structure by measuring the architect’s drawings and applying a cost to every square metre of wall or roof, every door and window and such systems as heating, plumbing, electrics. Such estimates are known as bills of quantities and together with a schedule of rates for costing variations form the basis of most building and civil engineering contracts. The accuracy of such estimates is better than ±5%, depending on the qualifications accompanying the estimate. The rates used in bills of quantities (when produced by a contractor) are usually inclusive of labour, materials, plant, overheads and anticipated profit, but when produced by an independent quantity surveyor the last two items may have to be added by the contractor.
Unfortunately, such composite rates are not ideal for planning purposes as the time factor only relates to the labour content. To overcome this problem, the UK Building Research Station in 1970 developed a new type of bill of quantities called ‘operational bills’ in which the labour was shown separately from the other components, thus making it compatible with critical path-planning techniques. However, these new methods were never really accepted by industry and especially not by the quantity surveying profession.
A number of estimating books have been published to assist the estimator, which provide the materials and labour costs in great detail for nearly every operation or trade used in the construction business. These costs are separately given for labour based on the number of man-hours required and the materials cost as per the appropriate unit of measurement such as the metre length, square metre or cubic metre. Most of these books also give composite rates including materials, labour, overhead and profit. As rates for materials and labour change every year due to inflation or other factors, these books will have to be republished yearly to reflect the current rates. It is important, however, to
64 Chapter 13
remember that these books are only guides and require the given rates to be factorized depending on site conditions, geographical location and any other factor the estimator may consider to be significant.
The percentage variation at all stages should always be covered by an adequate contingency allowance that must be added to the final estimate to cover for possible, probable and unknown risks, which could be technical, political, environmental, administrative, etc. depending on the results of a more formal risk analysis. The further addition of overheads and profit gives the price (i.e., what the customer is being asked to pay).
It must be emphasized that such detailed estimating is not restricted to the construction (building or civil engineering) industry. Every project, given sufficient time, can be broken down into its labour, material, plant and overhead content and costing can be done very accurately.
Sometimes, an estimate produced by the estimator is drastically changed by senior manage-ment to reflect market conditions, the volume of work currently in the company or the strength of the perceived competition. However, from a control point of view, such changes to the final price should be ignored, which are in any case normally restricted to the overhead and profit portion and are outside the control of the project manager. When such a price adjustment is downward, every effort should be made to recover these ‘losses’ by practising value management throughout the period of the project.
Computer systems and software preparation, which are considerably more difficult to esti-mate than construction work due to their fundamentally innovative and untried processes, can be estimated using the following points: 1. Function-point analysis, where the numbers of software functions, such as inputs, outputs,
files, interfaces, etc. are counted, weighted and adjusted for complexity and importance. Each function is then given a cost value and aggregated to find the overall cost.
2. Lines of code to be used in the program. A cost value can be ascribed to each line. 3. Plain man-hour estimates based on experience of previous or similar work, taking into
account such new factors as inflation, the new environment and the client organization.
While it is important to produce the best possible estimate at every stage, the degree of accuracy will vary with the phase of the project, as shown in Fig. 13.1. As the project develops and additional or more accurate information becomes available, it is inevitable that the estimate becomes more accurate. This is sometimes known as rolling-wave estimat-ing, and while these revised costs should be used for the next estimating stage, once the actual final budget stage has been reached and the price has been accepted by the client, any further cost refinements will only be useful for updating the monthly cost estimate, which may affect the profit or loss without changing the price or control budget as used in earned value methods.

Estimating 65
When estimating the man-hours related to the activities in a network programme, it may be difficult to persuade certain people to commit themselves to giving a firm man-hour estimate. In such cases, just in order to elicit a realistic response, it may be beneficial to employ the ‘three times estimate’ approach, t = (a + 4m + b)/6, as described in Chapter 20. In this formula, t is the expected or most likely time, a is the most optimistic time, b is the most pessimistic time and m is the most probable time.
In most cases m, the most probable time, is sufficient for the estimate, as the numerical difference between this and the result obtained by rigorously applying the formula is very small in most cases.
Further Reading
Stutzke, R. (2005). Software project estimation. Addison-Wesley.Taylor, J. C. (2005). Project cost estimating tools techniques & perspectives. St. Lucie Press.Thacker, N. (2012). Winning your bid. Gower.
Aut
horiz
atio
n
% d
egre
e of
acc
urac
y
Pro
posa
l
Concept Feasibility DefinitionPhases
Design Production
Con
trol b
udge
t
Bud
get u
pdat
e
0
5
10
15
20
25
30
35
40
Figure 13.1Phase/accuracy curve.

This page intentionally left blank

67Project Management, Planning and Control. http://dx.doi.org/10.1016/B978-0-08-102020-3.00014-0Copyright © 2017 Elsevier Ltd. All rights reserved.
CHAPTER 14
Project Management Plan
Chapter OutlineMethods and Procedures 70
As soon as the project manager has received his or her brief or project instructions, he or she must produce a document that distils what is generally a vast amount of information into a concise, informative and well-organized form that can be distributed to all members of the project team and indeed all the stakeholders in the project. This document is called a project management plan (PMP). It is also sometimes just called a project plan, or in some organiza-tions a coordination procedure.
The PMP is one of the key documents required by the project manager and his or her team. It lists the phases and encapsulates all the main parameters, standards and requirements of the project in terms of time, cost and quality/performance by setting out the ‘Why’, ‘What’, ‘When’, ‘Who’, ‘Where’ and ‘How’ of the project. In some organizations the PMP also includes the ‘How much’, that is, the cost of the project. There may, however, be good commercial reasons for restricting this information to key members of the project team.
The contents of a PMP vary depending on the type of project. While it can run to several volumes for a large petrochemical project, it need not be more than a slim binder for a small, unsophisticated project.
There are, however, a number of areas and aspects that should always feature in such a document. These are set out very clearly in Table 1 of BS 6079-1-2002. With the permission of the British Standards Institution, the main headings of the model project plan are given in the following, but augmented and rearranged in the sections given below.
General 1. Foreword 2. Contents, distribution and amendment record 3. Introduction 3.1 Project diary 3.2 Project history

68 Chapter 14
The Why 4. Project aims and objectives 4.1 Business case
The What 5. General description 5.1 Scope 5.2 Project requirement 5.3 Project security and privacy 5.4 Project management philosophy 5.5 Management reporting system
The When 6. Programme management 6.1 Programme method 6.2 Program software 6.3 Project life cycle 6.4 Key dates 6.5 Milestones and milestone slip chart 6.6 Bar chart and network if available
The Who 7. Project organization 8. Project resource management 9. Project team organization 9.1 Project staff directory 9.2 Organizational chart 9.3 Terms of reference (TOR) (a) For staff (b) For the project manager (c) For the committees and working group
The Where 10. Delivery requirements 10.1 Site requirements and conditions 10.2 Shipping requirements 10.3 Major restrictions
The How 11. Project approvals required and authorization limits 12. Project harmonization

Project Management Plan 69
13. Project implementation strategy 13.1 Implementation plans 13.2 System integration 13.3 Completed project work 14. Acceptance procedure 15. Procurement strategy 15.1 Cultural and environmental restraints 15.2 Political restraints 16. Contract management 17. Communications management 18. Configuration management 18.1 Configuration control requirements 18.2 Configuration management system 19. Financial management 20. Risk management 20.1 Major perceived risks 21. Technical management 22. Tests and evaluations 22.1 Warranties and guarantees 23. Reliability management (see also BS 5760: Part 1) 23.1 Availability, reliability and maintainability (ARM) 23.2 Quality management 24. Health and safety management 25. Environmental issues 26. Integrated logistic support (ILS) management 27. Close-out procedure
The numbering of the main headings should be standardized for all projects in the organiza-tion. In this way the reader will quickly learn to associate a clause number with a subject. This will not only enable him or her to find the required information quickly but will also help the project manager when he or she has to write the PMP. The numbering system will in effect serve as a convenient checklist. If a particular item or heading is not required, it is best to simply enter ‘not applicable’ (or NA), leaving the standardized numbering system intact.
In addition to giving all the essential information about the project between two covers, for quick reference, the PMP serves another very useful function. In many organizations, the scope, and technical and contractual terms of the project are agreed on in the initial stages by the proposals or sales department. It is only when the project becomes a reality that the project manager is appointed. By having to assimilate all these data and write such a PMP (usually within 2 weeks of the handover meeting), the project manager will inevitably obtain a thorough understanding of the project requirements as he or she digests the often voluminous documentation agreed on with the client or sponsor.

70 Chapter 14
Clearly, not every project requires the exact breakdown given in this list, and each organiza-tion can augment or expand this list to suit the project. If there are any subsequent changes, it is essential that the PMP is amended as soon as the changes become apparent, so that every member of the project team is immediately aware of the latest revision. These changes must be numbered on the amendment record in the beginning of the PMP, and annotated on the relevant page and clause with the same amendment number or letter.
The contents of the project management plan are neatly summarized in the first verse of the little poem from The Elephant’s Child by Rudyard Kipling:
I keep six honest serving-men(They taught me all I knew);Their names are What and Why and When,And How and Where and Who.
Methods and Procedures
Methods and procedures are the very framework of project management and are necessary throughout the life cycle of the project. All the relevant procedures and processes are set out in the project management plan, where they are customized to suit the particular project.
Methods and procedures should be standardized within an organization to ensure that project managers do not employ their own pet methods or ‘reinvent the wheel’.
All the organization’s standard methods and procedures as well as some of the major systems and processes should be enshrined in a company project manual. This should then be read and signed by every project manager who will then be familiar with the company systems, and thus avoid wasteful and costly duplication. The main contents of such a manual are the methods and procedures covering: • Companypolicyandmissionstatement• Companyorganizationandorganizationchart• Accountabilityandresponsibilities• Estimating• Riskanalysis• Costcontrol• Planningandnetworkanalysis• Earnedvaluemanagement• Resourcemanagement• Changemanagement(changecontrol)• Configurationmanagement• Procurement(bidpreparation,purchasing,expediting,inspection,shipping)• Contractmanagementanddocumentation
Project Management Plan 71
• Qualitymanagementandcontrol• Valuemanagementandvalueengineering• Issuemanagement• Designstandards• Informationmanagementanddocumentdistribution• Communication• Healthandsafety• Conflictmanagement• Close-outrequirementsandreviews
It will be seen that this list is very comprehensive, but in every case a large proportion of the documentation required can be standardized. There are always situations where a particular method or procedure has to be tailored to suit the circumstances or where a system has to be simplified, but the standards set out in the manual form a baseline that acts as a guide for any necessary modification.
Certain UK government departments, a number of local authorities and other public bodies have adopted a project management methodology called PRINCE 2 (an acronym for projects in a controlled environment). This was developed by the Central Computer and Telecommunications Agency (CCTA) for IT and government contracts, but has not found favour in the construction industry due to a number of differences in approach to reporting procedures, management responsibilities and assessing durations with respect to resources.

This page intentionally left blank
73Project Management, Planning and Control. http://dx.doi.org/10.1016/B978-0-08-102020-3.00015-2Copyright © 2017 Elsevier Ltd. All rights reserved.
CHAPTER 15
Risk Management
Chapter OutlineStage 1: Risk Awareness 74Stage 2: Risk Identification 74Stage 3: Risk Assessment 76Stage 4: Risk Evaluation 77Stage 5: Risk Management 79Monitoring 81Example of Effective Risk Management 82Positive Risk or Opportunity 82Further Reading 83
Every day we take risks. If we cross the street, we risk being run over. If we go down the stairs, we risk missing a step and tumbling down. Taking risks is such a common occurrence that we tend to ignore it. Indeed, life would be unbearable if we are constantly worried whether or not we should carry out a certain task or take an action, because the risk is, or is not, acceptable.
With projects, however, this luxury of ignoring the risks cannot be permitted. By their very nature, because projects are inherently unique and often incorporate new techniques and procedures, they are risk prone and the risk has to be considered right from the start. It then has to be subjected to a disciplined regular review and investigative procedure known as risk management.
Before applying risk management procedures, many organizations produce a risk manage-ment plan. This is a document produced at the start of the project that sets out the strategic requirements for risk assessment and the whole risk management procedure. In certain situations the risk management plan should be produced at the estimating or contract-tender stage to ensure that adequate provisions are made in the cost build-up of the tender document.
The project management plan (PMP) should include a résumé of the risk management plan, which will first of all define the scope and areas to which risk management applies, particu-larly the risk types to be investigated. It will also specify which techniques will be used for risk identification and assessment, whether SWOT (strengths, weaknesses, opportunities and

74 Chapter 15
threats) analysis is required and which risks (if any) require a more rigorous quantitative analysis such as Monte Carlo simulation methods.
The risk management plan will set out the type, content, and frequency of reports, the roles of risk owners, and the definition of the impact and probability criteria in qualitative and/or quantitative terms covering cost, time and quality/performance.
The main contents of a risk management plan are as follows: • General introduction. Explaining the need for the risk management process;• Project description. Only required if it is a stand-alone document and not part of the PMP;• Types of risks. Political, technical, financial, environmental, security, safety, programme,
etc.;• Risk processes. Qualitative and/or quantitative methods, maximum number of risks to be
listed;• Tools and techniques. Risk identification methods, size of P–I matrix, computer analysis,
etc.;• Risk reports. Updating periods of risk register, exception reports, change reports, etc.; and• Attachments. Important project requirements, dangers, exceptional problems, etc.
The risk management plan of an organization should follow a standard pattern in order to increase its familiarity (rather like standard conditions of contract), but each project will require a bespoke version to cover its specific requirements and anticipated risks.
Risk management consists of the following five stages, which, if followed religiously, will enable one to obtain a better understanding of the project risks that could jeopardize the cost, time, quality and safety criteria of the project. The first three stages are often referred to as qualitative analysis and are by far the most important stages of the process.
Stage 1: Risk Awareness
This is the stage at which the project team begins to appreciate that there are risks to be considered. The risks may be pointed out by an outsider, or the team may be able to draw on their own collective experience. The important point is that once this attitude of mind is set, i.e., that the project, or certain facets of it, is at risk, it leads very quickly to risk identification.
Stage 2: Risk Identification
This is essentially a team effort at which the scope of the project, as set out in the specification, contract and WBS (if drawn), is examined and each aspect investigated for a possible risk.
To get the investigation going, the team may have a brainstorming session and use a prompt list (based on specific aspects such as legal or technical problems) or a checklist compiled

Risk Management 75
from risk issues from similar previous projects. It may also be possible to obtain an expert opinion or carry out interviews with outside parties. The end product is a long list of activities that may be affected by one or a number of adverse situations or unexpected occurrences. The risks that generally have to be considered may be conveniently split into four main areas as shown in Table 15.1. Any applicable risk in each area can then be examined by a further screening process as shown by the samples given in the following:
Technical New technology or materials, test failuresEnvironmental Unforeseen weather conditions, traffic restrictions
Operational New systems and procedures, training needsCultural Established customs and beliefs, religious holidaysFinancial Freeze on capital, bankruptcy of stakeholder, currency fluctuations
Legal Local laws, lack of clarity of contractCommercial Change in market conditions or customers
Resource Shortage of staff, operatives, plant or materialsEconomic Slow-down of economy, change in commodity pricesPolitical Change of central or local government or government policiesSecurity Safety, theft, vandalism, civil disturbance
Some risks could be categorized in more than one area or section, such as civil unrest, which could be a political as well as a security problem.
The following gives the advantages and disadvantages:
Brainstorming
Advantages Wide range of possible risks suggested for consideration, involves a number of stakeholders
Disadvantages Time-consuming, requires firm control by the facilitator
Prompt List
Advantages Gives benefit of past problems, saves time by focusing on real possibilitiesDisadvantages Restricts suggestions to past experience, past problems may not be applicable
Checklist
Advantages Similar to prompt list: company standardDisadvantages Similar to prompt list
Table 15.1:
Project Risks
Organization Environment Technical Financial
Management Legislation Technology FinancingResources Political Contracts Exchange ratesPlanning Pressure groups Design EscalationLabour Local customs Manufacture Financial stability of
Health and safety Weather Construction (a) ProjectClaims Emissions Commissioning (b) ClientPolicy Security Testing (c) Suppliers

76 Chapter 15
Work Breakdown Structure
Advantages Focused on specific project risksQuick and economical
Disadvantages May limit scope of possible risks
Delphi Technique
Advantages Offers wide experience of expertsCan be wide ranging
Disadvantages Time-consuming if experts are far awayExpensive if experts have to be paidAdvice may not be specific enough
Asking Experts
Advantages Similar to DelphiDisadvantages Similar to Delphi
At this stage, it may be possible to identify who is the best person to manage each risk. This person becomes the risk owner.
To reduce the number of risks being seriously considered from what could well be a very long list, some form of screening will be necessary. Only those risks that pass certain criteria need be examined more closely, which leads to the next stage of risk management:
Stage 3: Risk Assessment
This is the qualitative stage at which the two main attributes of a risk, probability and impact, are examined.
The probability of a risk becoming a reality has to be assessed using experience and/or statistical data, such as historical weather charts or close-out reports from previous projects. Each risk can then be given a probability rating of High, Medium or Low.
In a similar way, by taking into account all the available statistical data, past project histories and expert opinion, the impact or effect on the project can be rated as Severe, Medium or Low.
A simple matrix can now be drawn up which identifies whether a risk should be taken any further. Such a matrix is shown in Fig. 15.1.
Each risk can now be given a risk number, so that it is possible to draw up a simple chart that lists all the risks considered so far. This chart will show the risk number, a short description, the risk category, the probability rating, the impact rating (in terms of High, Medium or Low) and the risk owner who is charged with monitoring and managing the risk during the life of the project.
Fig. 15.2 shows the layout of such a chart.
A quantitative analysis can now follow, known as risk evaluation.

Risk Management 77
Severe
Medium
Medium
Low
Low HighIm
pact
Probability
Nil
Figure 15.1Probability versus impact table. Such a table could be used for each risk worthy of further assessment,
and to assess, for example, all major risks to a project or programme.
Risk Summary Chart
Risk no. Description Probabilityrating
Impactrating Risk owner
Figure 15.2Risk summary chart.
Stage 4: Risk Evaluation
It is now possible to give comparative values, often on a scale 1 to 10, to the probability and impact of each risk and by drawing up a matrix of the risks, an order of importance or priority can be established. By multiplying the impact rating by the probability rating, the exposure rating is obtained. This is a convenient indicator that may be used to reduce the list to only the top dozen that require serious attention, but an eye should nevertheless be kept on even the minor ones, some of which may suddenly become serious if unforeseen circumstances arise.
An example of such a matrix is shown in Fig. 15.3. Clearly, the higher the value, the greater the risk and the more attention it must receive to manage it.

78 Chapter 15
Another way to quantify both the impact and probability is to number the ratings as shown in Fig. 15.4 from one for very low to five for very high. By multiplying the appropriate numbers in the boxes, a numerical (or quantitative) exposure rating is obtained, which gives a measure of seriousness and hence importance for further investigation.
For example, if the impact is rated 3 (i.e. medium) and the probability 5 (very high), the exposure rating is 3 × 5 = 15.
Further sophistication in evaluating risks is possible by using some of the computer software developed specifically to determine the probability of occurrence. These programs use sampling techniques such as ‘Monte Carlo simulations’ that carry out hundreds of iterative sampling calculations to obtain a probability distribution of the outcome.
Very high
Rating
0.8
Value 0.1
Very low
0.2
Low
Probability
Exposure table
0.5
Medium
0.7
High
0.9
Very high
Impact
High 0.5
Medium 0.2
Low 0.1
Very low 0.05
Figure 15.3Exposure table.
5
4
4 5
3
3
2
2
1
1Probability
Impa
ct
(B)9
(A)15
Example:Risk AImpact = 3Probability = 5Risk rating = 3 × 5 = 15Risk BImpact = 3Probability = 3Risk rating = 3 × 3 = 9
Figure 15.45 × 5 matrix.

Risk Management 79
One application of the Monte Carlo simulation is determining the probability to meet a specific milestone (e.g. the completion date) by giving three time estimates to every activity. The program will then carry out a great number of iterations resulting in a frequency/time histogram and a cumulative ‘S’ curve from which the probability of meeting the milestone can be read off (see Fig. 15.5).
At the same time, a Tornado diagram can be produced, which shows the sensitivity of each activity as far as it affects the project completion (see Fig. 15.6).
Other techniques such as sensitivity diagrams, influence diagrams and decision trees have all been developed in an attempt to make risk analysis more accurate or more reliable. It must be remembered, however, that any answer is only as good as the initial assumptions and input data, and the project manager must give serious consideration as to the cost effectiveness of these methods for his/her particular project.
Stage 5: Risk Management
Having listed and evaluated the risks and established a table of priorities, the next stage is to decide how to manage the risks; in other words, what to do about them and who should be
Freq
uenc
y
Pro
babi
lity
%
Time
‘S’ curve
100
50
0
Figure 15.5Frequency/time histogram.
ABCDEFGHIJ
Act
iviti
es
0 5 10 15 20 25 30 35 40 45 50 55 60% sensitivity
Figure 15.6Tornado diagram.

80 Chapter 15
responsible for managing them. For this purpose, it is advisable to appoint a risk owner for every risk that has to be monitored and controlled. A risk owner may, of course, be respon-sible for a number, or even all, of the risks. There are a number of options available to the project manager when faced with a set of risks. These are: • Avoidance• Reduction• Sharing• Transfer• Deference• Mitigation• Contingency• Insurance• Acceptance
These options are perhaps most easily explained by a simple example.
The owner of a semi-detached house decides to replace part of his roof with solar panels to save on his water-heating bill. The risks involved in carrying out this work are as follows:
Risk 1 The installer may fall off the roofRisk 2 The roof may leak after completionRisk 3 The panels may break after installationRisk 4 Birds may befoul the panelsRisk 5 The electronic controls may not workRisk 6 The heat recovered may not be sufficient to heat the water on a cold dayRisk 7 It may not be possible to recover the cost if the house is sold within 2–3 yearsRisk 8 The cost of the work will probably never pay for itselfRisk 9 The cost may escalate due to unforeseen structural problems
These risks can all be managed by applying one or several of the following options:
Risk 1 Transfer Employ a builder who is covered by insuranceRisk 2 Transfer Insist on a 2-year guarantee for the work (at least two
season cycles)Risk 3 Insurance Add the panel replacement to the house insurance
policyRisk 4 Mitigation Provide access for cleaning (this may increase the cost)Risk 5 Reduction Ensure a control unit is used which has been proven for
a number of yearsRisk 6 Contingency Provide for an electric immersion heater for cold spellsRisk 7 Deference Wait for 3 years before selling the houseRisk 8 Acceptance This is a risk one must accept if the work goes aheadRisk 8 Avoidance Don’t go ahead with the workRisk 9 Sharing Persuade the neighbour in the adjoining house to install
a similar system at the same time

Risk Management 81
Monitoring
To keep control of the risks, a risk register should be produced that lists all the risks and their method of management. Such a list is shown in Fig. 15.7. When risk owners are appointed, these will be identified on the register. The risks must be constantly monitored and the register must be reassessed at preset periods, and if necessary amended to reflect the latest position. Clearly, as the project proceeds, the risks reduce in number, so that the contingency sums allocated to cover the risk of the completed activities can be allocated to other sections of the budget. These must be recorded in the register under the heading of risk closure. However, sometimes new rules emerge that must be taken into account.
The summary of the risk management procedure is then as follows: 1. Risk awareness 2. Risk identification (checklists, prompt lists, brainstorming) 3. Risk owner identification 4. Qualitative assessment 5. Quantification of probability 6. Quantification of impact (severity) 7. Exposure rating 8. Mitigation 9. Contingency provision 10. Risk register 11. Software usage (if any) 12. Monitoring and reporting
Project:...........................................Key: H, high: M, medium: L, low
Prepared by: ...............................................................................................
Reference:.....................Date:..............................
Typeof risk Description of risk Risk reduction
strategyContingency
plansRisk
ownerProbability ImpactH M L Perf. Cost Time
Figure 15.7Risk register (risk log).

82 Chapter 15
To aid the process of risk management, a number of software tools have been developed. The most commonly used ones are @Risk, Predict, Pandora and Plantrac Marshal, but new ones will be undoubtedly developed in the future.
Example of Effective Risk Management
One of the most striking and beneficial advantage of risk analysis is associated with the temporary jetties system known as Mulberry Harbour, which was towed across the Channel to supportAlliedlandingsinNormandyonD-Day,June6,1944.
The two jetties (A) at Gold beach for the British army and (B) at Omaha for the American army consisted of floating roadways, pontoons and caissons, protected by breakwaters, which were prefabricated at numerous sites across Britain and towed across the Channel where the caissons were sunk onto the seabed. All site construction of the roadways was carried out by British and American military engineers. The harbours were completed 12 days later on 18 June,andon19Juneanenormousstormblewup,whichby22JunedestroyedtheAmericanand badly damaged the British harbour.
Fortunately, someone carried out a risk analysis that identified the possibility of such a disaster. As a result, the provision had been made for a large quantity of spare units to be ready at British ports to be towed out as replacements. By using these spare sections and cannibalizing the wrecked American harbour, the British harbour could be repaired and until it was abandoned following the capture of Cherbourg 8 months later, more than 7000 tons of vital military supplies per day were delivered to the allied armies in France.
Positive Risk or Opportunity
Although most risks are generally regarded as negative or undesirable, and indeed most mitigation strategies have been devised to reduce the impact or probability of negative risk, paradoxically, there is also such a thing as positive risk or opportunistic risk. This is basically the risk that any entrepreneur or investor takes when he/she invests in a new enterprise. A simple case of ‘Nothing ventured, nothing gained’. A case may also arise where a perceived negative risk becomes a positive risk or opportunity. For example, in an attempt to reduce the risk of skidding, a car manufacturer may invent an anti-skid device that can be marketed independently at a profit. If there had been no risk, there would have been no need for the antidote.
Local authorities tend to use the term ‘positive risk taking’ when referring to the proactive approach of providing services and facilities to certain sections of the community (usually challenged by a disability). However, in addition to discussing and agreeing on their risks with clients, the process is in effect a comprehensive programme of ascertaining, prioritizing and mitigating the perceived risks before they occur.

Risk Management 83
Further Reading
Barkley. (2004). Project risk management. McGraw-Hill.Chapman, C. B., & Ward, S. C. (2003). Project risk management (2nd ed.). Wiley.Garlick, A. (2007). Estimating risk. Gower.Hillson,D.(2009).Managing risk projects. Gower.Hopkinson, M. (2010). The project risk maturity model. Gower.Hulett,D.(2009).Practical schedule risk analysis. Gower.Ward, S., & Chapman, C. (2011). How to manage project opportunity and risk. Wiley.

This page intentionally left blank

85Project Management, Planning and Control. http://dx.doi.org/10.1016/B978-0-08-102020-3.00016-4Copyright © 2017 Elsevier Ltd. All rights reserved.
CHAPTER 16
Quality ManagementQuality is remembered long after the price is forgotten.
Gucci.
Chapter OutlineHistory 87Quality Management Definitions 87
Quality 87Quality Policy 87Quality Management 87Quality Assurance (QA) 88Quality Systems (Quality Management Systems or QMS) 88Quality Control (QC) 88Quality Manual 88Quality Programme 88Quality Plan 88Quality Audit 88Quality Reviews 88Total Quality Management (TQM) 89
Explanation of the Definitions 89Quality Policy 89Quality Management 89Quality Assurance 89Quality Systems 90Quality Control 90Quality Manual 92Quality Programme 92Quality Plan 92Quality Audit 94Quality Reviews 94Failure Mode Analysis (Cause and Effect Analysis) 94Pareto Analysis 96Trend Analysis 97
Further Reading 98
Quality (or performance) forms the third corner of the time–cost–quality triangle, which is the basis of project management.
A project may be completed on time and within the set budget, but if it does not meet the specified quality or performance criteria it will at best attract criticism and at worst be

86 Chapter 16
considered a failure. Striking a balance between meeting the three essential criteria of time, cost and quality is one of the most onerous tasks for a project manager, and in practice usually one will be paramount. When quality is synonymous with safety, as with aircraft or nuclear design, there is no question of which point of the project management triangle is the most important. However, even if the choice is not so obvious, a failure in quality can be expensive and dangerous, and can destroy an organization’s reputation far quicker than it took to build up.
Quality management is therefore an essential part of project management, and as with any other attribute, it does not just happen without a systematic approach. To ensure a quality product it has to be defined, planned, designed, specified, manufactured, constructed (or erected) and commissioned to an agreed set of standards that involve every department of the organization from top management to dispatch.
It is not possible to build quality into a product. If a product meets the specified performance criteria for a minimum specified time, it can be said to be a quality product. Whether the cost of achieving these criteria is high or low is immaterial, but to ensure that the criteria are met will almost certainly require additional expenditure. If these costs are then added to the normal production costs, a quality assured product will normally cost more than an equivalent one that has not gone through a quality control process.
Quality is an attitude of mind, and for it to be most effective, every level of an organization should be involved and committed to achieving the required performance standards by setting and operating procedures and systems which ensure this. It should permeate right through an organization from the board of directors down to the operatives on the shop floor.
Ideally, everyone should be responsible for ensuring that his or her work meets the quality standards set down by the management. To ensure that these standards are met, quality assurance requires checks and audits to be carried out on a regular basis.
However, producing a product that has not undergone a series of quality checks and tests and therefore not met customers’ expectations could be much more expensive, as there will be more returns of faulty goods and fewer returns of customers. In other words, quality assur-ance is good business. It is far better to get it right first time, every time, than to have a second attempt or carry out a repair.
To enable this consistency of performance to be obtained (and guaranteed), the quality assurance, control, review and audit procedures have to be carried out in an organized manner and the following functions and actions need to be implemented: 1. The quality standards have been defined. 2. The quality requirements have been disseminated. 3. The correct equipment has been set up.

Quality Management 87
4. The staff and operatives have been trained. 5. The materials have been tested and checked for conformity. 6. Adequate control points have been set up. 7. The designated components have been checked at predetermined stages and intervals. 8. A feedback and rectification process has been set up. 9. Regular quality audits and reviews are carried out. 10. All these steps, which make up quality control, are enshrined in the quality manual
together with the quality policy, quality plan and quality programme.
History
The first quality standards were produced in the USA for the military as MIL-STD and were subsequently used by NATO.
In the 1970s, the MOD issued the Defence Standard series 05 to 20 (Def. Std.) based on the American MIL-Q-9858A, but it was then superseded by 15 parts of the Allied Quality Assurance Publication (AQAP).
Defence contractors and other large companies adopted the MOD system until BSI produced the BS 5750 series of Quality Systems in 1979. These were updated in 1987 and then became an international standard (ISO), the ISO 9000:1987 series, which also covers the European standard EU 29,000 series.
To understand the subject, it is vital that the definitions of the various quality functions are understood. These are summarized in the following list and explained more fully in the subsequent sections.
Quality Management DefinitionsQuality
The totality of features and characteristics of a product, service or facility that bear on its ability to satisfy a given need.
Quality Policy
The overall quality intentions and direction of an organization as regards quality, as formally expressed by top management.
Quality Management
That aspect of overall quality functions that determines and implements the quality policy.

88 Chapter 16
Quality Assurance (QA)
All planned and systematic actions necessary to provide confidence that an item, service or facility will meet the defined requirements.
Quality Systems (Quality Management Systems or QMS)
These include the organizational structures, responsibilities, procedures, processes and resources for implementing the quality management.
Quality Control (QC)
Those quality assurance actions that provide a means of control and measure the characteris-tics of an item, process or facility to established requirements.
Quality Manual
These are a set of documents that communicates the organization’s quality policy, procedures and requirements.
Quality Programme
A contract (project)-specific document that defines the quality requirements, responsibilities, procedures and actions to be applied at various stages of the contract.
Quality Plan
A contract (project)-specific document defining the actions and processes to be undertaken together with the hold points for reviews and inspections. It also defines the control document, applicable standards, inspection methods and inspection authority. This authority may be internal and/or may include the client’s inspectors or an independent/statutory inspection authority.
Quality Audit
A periodic check to ensure that the quality procedures set out in the quality plan have been carried out.
Quality Reviews
Periodic reviews of the quality standards, procedures and processes to ensure their applicabil-ity to current requirements.

Quality Management 89
Total Quality Management (TQM)
The company-wide approach to quality beyond the prescriptive requirements of a quality management standard such as ISO 9001.
Explanation of the DefinitionsQuality Policy
The quality policy has to be set by top management and issued to the whole organization, so that everyone is aware what the aims of management regarding quality are. The quality policy might be to produce a component that lasts a specific period of time under normal use, withstands a set number of reversing cycles before cracking, withstands a defined load or pressure or, on the opposite scale, lasts only a limited number of years so that a later model can be produced to replace it. A firm of house builders might have a quality policy to build all their houses to the highest standards in only the most desirable locations, or the top management of a car manufacturer might dictate to their design engineers to design a car using components that will not fail for at least 5 years. There is clearly a cost and marketing implication in any quality policy that must be taken into account.
Quality Management
Quality management can be divided into two main areas: quality assurance (QA) and quality control (QC). All the quality functions, such as the procedures, methods, techniques, pro-grammes, plans, controls, reviews and audits, make up the science of quality management.
It also includes all the necessary documentation and its distribution, the implementation of the procedures and the training and appointment of quality managers, testers, checkers, auditors and other staff involved in quality management.
Quality Assurance
Quality assurance (QA) is the process that ensures that adequate quality systems, processes and procedures are in place. It is the term given to a set of documents that provide evidence of how and when the different quality procedures and systems are actually being imple-mented. These documents give proof that quality systems are in place and adequate controls have been set up to ensure compliance with the quality policy. To satisfy him- or herself that the quality of a product he or she needs is to the required standard, the buyer may well ask all tenderers or suppliers to produce their quality assurance documents with their quotations or tenders.

90 Chapter 16
Guidelines for quality management and quality assurance standards are published by various national and international institutions including the British Standards Institution, which publishes the following quality standards:
ISO 9000 Quality management and quality assurance standardsISO 9001 Quality systems – model for quality assurance in design and development, production,
installation and servicingISO 9002 Quality systems – model for quality assurance in production and installationISO 9003 Quality systems – model for quality assurance in inspection and testingISO 9004 Guide to quality management and quality systems elements
ISO 10006 Guidelines for quality in project managementISO 10007 Guidelines for configuration management
Quality Systems
Quality systems or quality management systems, as they are often called, are the structured procedures that in fact enable quality control to be realized. The systems required include the levels of responsibility for quality control, such as hierarchical diagrams (family trees) showing who is responsible to whom and for which part of the quality spectrum they are accountable for, as well as the procedures for recruiting and training staff and operatives. Other systems cover the different quality procedures and processes that may be common to all, as well as for all the components or specifics for particular ones.
Quality systems also include the procurement, installation, operation and maintenance of equip-ment for carrying out quality checks. These cover such equipment as measuring tools, testing bays, non-destructive testing equipment for radiography (x-rays), magnetic particle scans, ultrasonic inspection and all the other different techniques being developed for testing purposes.
Documentation plays an important role in ensuring that the tests and checks have been carried out as planned, and the results accurately recorded and forwarded to the specified authority. Suitable action plans for recovering from deviations of set criteria will also form parts of the quality systems. The sequence of generating the quality-related documentation is shown in Fig. 16.1.
Quality Control
The means to control and measure characteristics of a component, and the methods employed for monitoring and measuring a process or facility are parts of quality control. Control covers the actions to be taken by different staff and operators employed in the quality environment and the availability of the necessary tools to enable this work to be done. Again, the provision of the right documentation to the operatives and their correct, accurate and timely completion has to be controlled. This control covers the design, mate-rial specification, manufacture, assembly and distribution stages. The performance criteria are often set by the feedback from market research and customer requirements, and con-firmed by the top management.
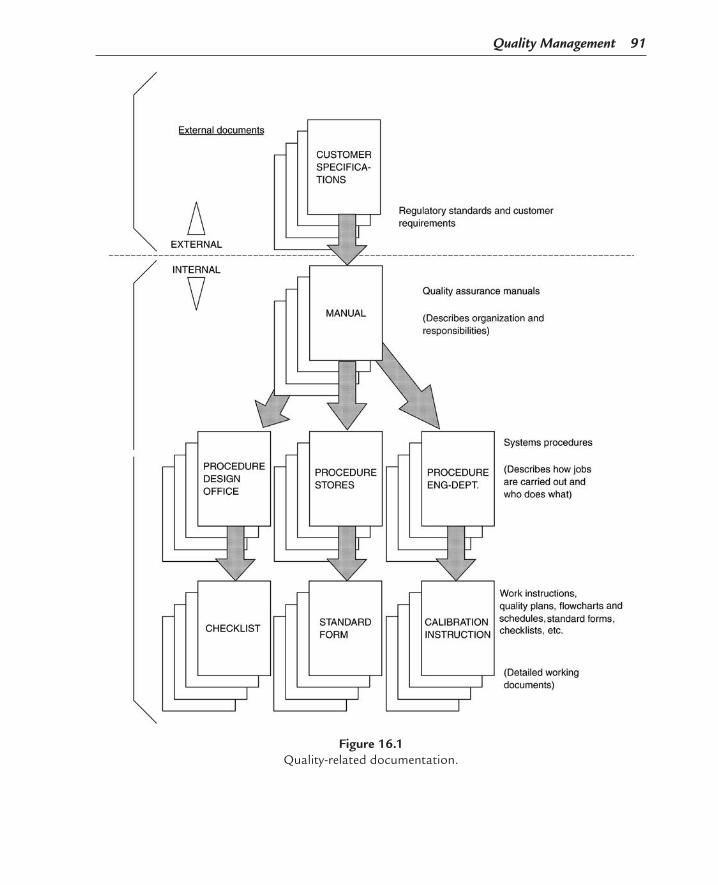
Quality Management 91
Figure 16.1Quality-related documentation.

92 Chapter 16
Quality Manual
The quality manual is in fact the ‘bible’ of quality management. It is primarily a communica-tion document which, between its covers, contains the organization’s quality policy, various quality procedures, quality systems to be used and the list of personnel involved in imple-menting the quality policy. The manual will also contain the various test certificates required for certain operatives such as welders, the types of tests to be carried out on different materi-als and components, and the sourcing trails required for specified materials.
Quality Programme
This is a document written specifically for the project in hand and contains all the require-ments for that project. Various levels and stages for quality checks or tests will be listed together with the names of the staff and operatives required at each stage, along with the reporting procedures and the names or organizations authorized to approve or reject the results, and instruct what remedial action (if required) has to be taken, especially when concessions for non-compliance are requested.
Quality Plan
This is also a contract-specific document that can greatly vary in content and size from company to company. As a general rule it defines in great detail: 1. The processes to be employed; 2. The hold points of each production process; 3. The tests to be carried out for different materials and components, including: 3.1 Dimensional checks and weight checks 3.2 Material tests (physical and chemical) 3.3 Non-destructive tests (radiography, ultrasonic, magnetic particle, etc.) 3.4 Pressure tests 3.5 Leak tests 3.6 Electrical tests (voltage, current, resistance, continuity, etc.) 3.7 Qualification and capability tests for operatives 4. The control documents including reports and concession requests; 5. The standards to be applied for the different components; 6. The method of inspection; 7. The percentage of items or processes (such as welds) to be checked; 8. The inspection authorities, whether internal, external or statutory and 9. The acceptance criteria for the tests and checks.
Most organizations have their own standards and test procedures but may additionally be required to comply with the client’s quality standards. A sample quality plan of components of a boiler is shown in Fig. 16.2.

Quality Management 93
Figure 16.2Quality assurance approval.

94 Chapter 16
The quality plan is part of the project management plan and because of its size is usually attached as an appendix.
Quality Audit
To ensure that various procedures are implemented correctly, regular quality audits must be carried out across the whole spectrum of the quality systems. These audits vary in scope and depth and can be carried out by internal members of staff or external authorities. When an organization is officially registered as being in compliance with a specific quality standard, such as ISO 9000, an annual audit by an independent inspection authority may be carried out to ensure that the standards are still being met.
Quality Reviews
As manufacturing or distribution processes change, a periodic review must be carried out to ensure that the quality procedures are still relevant and applicable in light of the changed conditions. Statutory standards may also have been updated, and these reviews check that the latest versions have been incorporated.
As part of the reviewing process, existing, proposed or new suppliers and contractors have to confirm their compliance with the quality assurance procedures. Fig. 16.3 shows the type of letter that should be sent periodically to all vendors.
All the earlier procedures are sometimes described as the ’tools’ of quality management to which following techniques can be added: • Failuremodeanalysis(causeandeffectanalysis)• Paretoanalysis• Trendanalysis
Failure Mode Analysis (Cause and Effect Analysis)
This technique involves selecting certain (usually critical) items and identifying all the possible modes of failure that could occur during its life cycle. The probability, causes and impact of such a failure are then assessed and the necessary controls and rectification pro-cesses are put in place. Clearly, as with risk analysis, the earlier in the project this process is carried out, the more opportunity there is to anticipate a problem and, if necessary, change the design to ‘engineer’ it out.
The following example illustrates how this technique can be applied to find the main causes affecting the operability of a domestic vacuum cleaner.
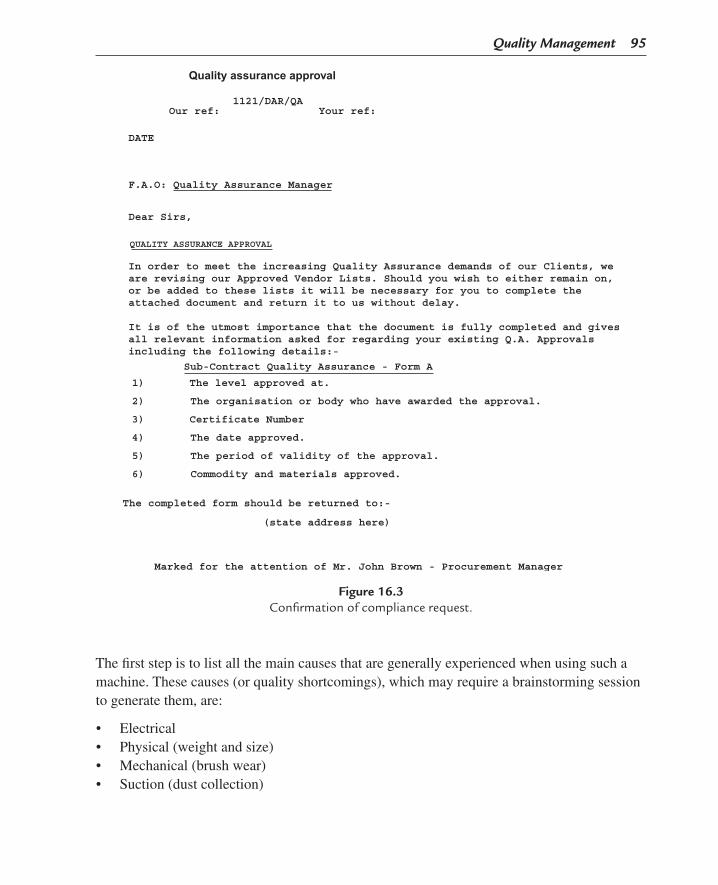
Quality Management 95
The first step is to list all the main causes that are generally experienced when using such a machine. These causes (or quality shortcomings), which may require a brainstorming session to generate them, are: • Electrical• Physical(weightandsize)• Mechanical(brushwear)• Suction(dustcollection)
Figure 16.3Confirmation of compliance request.

96 Chapter 16
The second step is drawing a cause and effect diagram as shown in Fig. 16.4, which is also known as an Ishikawa or fishbone diagram, from which it is possible to see clearly how these causes affect the operation of the vacuum cleaner.
The third step requires all the sub-causes (or reasons) of a main cause to be written against the tributary lines (or fish bones) of each cause. For example, the sub-causes of electrical failure are the lead being too short, thus pulling the plug out of the socket or hauling the cleaner by the lead and causing a break in the cable.
The last step involves an assessment of the number of times over a measured period each cause has resulted in a failure. However, it is highly advantageous to concentrate on those causes that are responsible for the most complaints, and when this has been completed and assessed by applying the next technique, Pareto analysis, appropriate action can be taken to resolve any problem or rectify any error.
Pareto Analysis
In the 19th century, Vilfredo Pareto discovered that in Italy 90% of income was earned by 10% of the population. Further study showed that this distribution was also true for many other situations from political power to industrial problems. He therefore formulated Pareto’s law, which states that ‘In any series of elements to be controlled, a small fraction in terms of the number of elements always account for a large fraction in terms of effect’.
Figure 16.4Cause and effect diagram.

Quality Management 97
In the case of the vacuum cleaner, this is clearly shown in the Pareto chart in Fig. 16.5, which plots the impact Y in terms of percentage of problems encountered against the number of causes X identified. The survey of faults shows that of the four main causes examined, inadequate dust collection is responsible for 76% (nearly 80%) of the failures or complaints. This is why Pareto’s law is sometimes called the 80/20 rule.
The percentage figure can be calculated by tabulating the causes and the number of times they resulted in a failure over a given period, say 1 year, and then converting these into a percent-age of the total number of failures. This is shown in Fig. 16.6. Clearly, such ratios are only approximate and can vary widely, but in general only a relatively small number of causes are responsible for the most serious effects. Anyone who is involved in club committee activities will know that there are always a few keen members who have the greatest influence.
Trend Analysis
Part of the quality control process is to issue regular reports that log non-conformance, accepted or non-accepted variances, delays, cost overruns or other problems. If these reports
Figure 16.5Pareto chart.
Figure 16.6Failure table.

98 Chapter 16
are reviewed on a regular basis, trends may be discerned which, if considered to be adverse, can then be addressed by taking appropriate corrective action. At the same time the opportu-nity can be taken to check whether there has been a deficiency in the procedures or docu-ments and whether other components could be affected. Most importantly, the cause and source of a failure has to be identified, which may require a review of all the suppliers and subcontractors involved.
Further Reading
BSI. (2008). BS EN ISO 90001.2008 Quality management systems requirements. BSI.Rose, K. (2005). Project quality management. J. Ross.
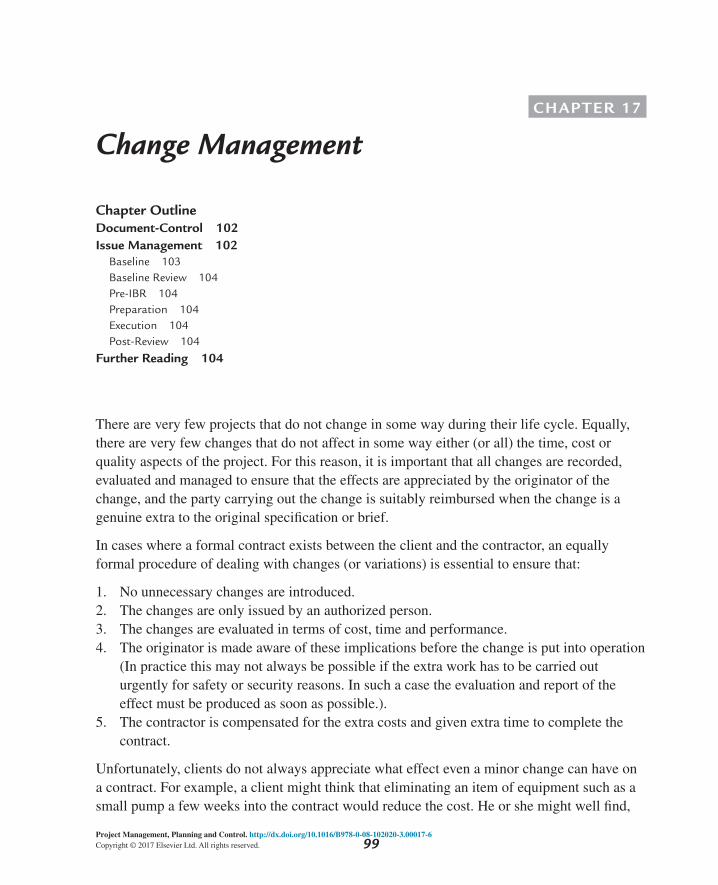
99Project Management, Planning and Control. http://dx.doi.org/10.1016/B978-0-08-102020-3.00017-6Copyright © 2017 Elsevier Ltd. All rights reserved.
CHAPTER 17
Change Management
Chapter OutlineDocument-Control 102Issue Management 102
Baseline 103Baseline Review 104Pre-IBR 104Preparation 104Execution 104Post-Review 104
Further Reading 104
There are very few projects that do not change in some way during their life cycle. Equally, there are very few changes that do not affect in some way either (or all) the time, cost or quality aspects of the project. For this reason, it is important that all changes are recorded, evaluated and managed to ensure that the effects are appreciated by the originator of the change, and the party carrying out the change is suitably reimbursed when the change is a genuine extra to the original specification or brief.
In cases where a formal contract exists between the client and the contractor, an equally formal procedure of dealing with changes (or variations) is essential to ensure that: 1. No unnecessary changes are introduced. 2. The changes are only issued by an authorized person. 3. The changes are evaluated in terms of cost, time and performance. 4. The originator is made aware of these implications before the change is put into operation
(In practice this may not always be possible if the extra work has to be carried out urgently for safety or security reasons. In such a case the evaluation and report of the effect must be produced as soon as possible.).
5. The contractor is compensated for the extra costs and given extra time to complete the contract.
Unfortunately, clients do not always appreciate what effect even a minor change can have on a contract. For example, a client might think that eliminating an item of equipment such as a small pump a few weeks into the contract would reduce the cost. He or she might well find,

100 Chapter 17
however, that the changes in the design documentation, data sheets, drawings, bid requests, etc. will actually cost more than the capital value of the pump, so that the overall cost of the project will increase. Therefore, the watchwords must be: is the change really necessary?
In practice, as soon as a change or variation is requested either verbally or by a change order, it must be confirmed back to the originator with a statement to the effect that the cost and time implications will be advised as soon as possible.
A change of contract-scope notice must then be issued to all departments who may be affected to enable them to assess the cost, time and quality implications of the change.
A copy of such a document is shown in Fig. 17.1, which should contain the following information: • Projectorcontractno.• Changeofscopeno.• Issuedate• Nameoforiginatorofchange• Methodoftransmission(letter,fax,telephone,e-mail,etc.)• Descriptionofchange• Dateofreceiptofchangeorderorinstruction
When all the affected departments have inserted their cost and time estimates, the form is sent to the originator for permission to proceed, or for advice of the implications if the work has had to be started before the form could be completed. The method of handling variations will probably have been set out in the contract documentation, but it is important to follow the agreed procedures, especially if there are time limitations for submitting the claims at a later stage.
As soon as a change has been agreed, the cost and time variations must be added to the budget and programme, respectively, to give the revised target values against which costs and prog-ress will be monitored. However, while all variations have to be recorded and processed in the same way, the project budget can only be changed (increased or decreased) when the varia-tion has been requested by the client. When the change was generated internally, for example, by one of the design departments due to a discovered error, omission or necessary improve-ment, it is not possible to increase the budget (and hence the price) unless the client has agreed to this. The extra cost must still be clearly recorded and monitored but will only appear as an increase (or decrease) in the actual cost column of the cost report. The result will be a reduction or increase of the profit, depending on whether the change required more or fewer resources.
The accurate and timely recording and managing of changes could decide the fate of a project as making profit or losing money.

Change Management 101
FOSTER WHEELERPOWER PRODUCTS LTD.HAMSTEAD ROADLONDON NW1 7QN
ADVICE OF CHANCE OF CONTRACT SCOPEDEPARTMENT: ENGINEERING No 82
To: Contract Management Department
Please note that the scope of the subject contract has been altered due to the change(s)detailed below. To: Contract Management Department
The following is a statement of the manhours and expenses incurred due to ContractVariation Notice
reference dated 17 Dec. 1982
Distribution:Project ManagerEstimating DepartmentManagement ServicesDeaprtmental ManagerManager Engineering (see note 4 below)File
N. SmithJ. Harris
By internal mail
BRIEF DESCRIPTION OF CHANGE AND EFFECT ON DEPARTMENTAL WORK
CHANGE NOTIFIED BY
NOTES
MANHOURS AND COSTS INCURRED IN
Department No.
ICI BILLINGHAM2-32-07059
The provision of an ‘Air to Igniters’ control valve.Scope of work includes purchasing and adding to drawings.The clients preferred-specified vendor for control valves is Fisher Controls.
Manhour requirements are as follows:-Dept 1104-63 manhours (1104 Split)Dept 1102- 8 manhours Req. 60
Drg. 2MH. 1
63
Dept 1105-38 manhours
Minutes of Meeting with client
Client’s telex
Increase
Engineering Manhours
Manhours
Manhours
Manhours
Manhours
Design/drghtg
Tech clerks
TOTAL
COSTS
Remarks
Initiated byN. Smith
Date17.12.82
Date22.12.82
Date
Checked byMWN
Approved by
Decrease
Client’s request by telephone
Client’s Variation Order
Client’s letter
Date of Meeting :Subject of Meeting :
Minute Number :
Date of Telex :Reference :Signed by :
Date of Letter :Reference :
Date of Call :
Date of V.O. :
Name of Contact :
V.O.Ref. :
Signed by :
10.12.1992
69
37
3
109
1104, 1102, 1105
SGP 3641B. Francis
£T.B.A.
1. The ‘change notified by’ section need not be completed if form is used to advise manhours and costs only.
2. This form to be completed IMMEDIATELY ON RECIEPT of definite instructions.
3. Manhours MUST BE REALISTIC. Make FULL ALLOWANCE for all additional and re-cycle work. Take into account ‘chain reaction’ affect throughout department.
4. Submit copy of this form to Manager Engineering if manhours involved exceed 250.
Figure 17.1Change of contract-scope form.

102 Chapter 17
Changemanagementmustnotbeconfusedwiththemanagement of change, which is the art of changing the culture or systems of an organization and managing the human reactions. Such a change can have far-reaching repercussions on the lives and attitudes of all the mem-bers of the organization, from the board level to the operatives on the shop floor. The way such changes are handled and the psychological approaches used to minimize stress and resistance are outside the scope of this book.
Document-Control
Invariably, a change to even the smallest part of a project requires the amendment of one or more documents. These may be programmes, specifications, drawings, instructions and, of course, financial records. The amendment of each document is in itself a change, and it is vital that the latest version of the document is issued to all the original recipients. In order to ensure that this takes place, a document- or version-control procedure, must be a part of the project-management plan.
In practice, a document-control procedure can either be a single page of A4 or several pages of a spreadsheet as a part of the computerized project management system. The format should, however, feature the following columns: • Documentnumber• Documenttitle• Originatorofdocument• Originalissuedate• Issuecode(generalorrestricted)• Nameoforiginator(ordepartment)ofrevision• Revision(orversion)number• Dateofrevision(version)
The sheet should also include a list of recipients.
A separate sheet records the date the revised document is sent to each recipient and the date of acknowledgement of receipt.
Where changes have been made to one or more pages of a multi-page document, such as a project-management plan, it is only necessary to issue the revised pages under a page revision number. This requires a discrete version-control sheet for this document with each clause listed and its revision and date of issue recorded.
Issue Management
An issue is a threat that could affect the objectives or operations of a project. Unlike a risk, which is an uncertain event, an issue is a reality that may have already occurred or is about to occur.

Change Management 103
The difference between an issue and a problem is that an issue is a change or potential change of external circumstances outside the control of the project manager. A problem, on the other hand, is a day-to-day adverse event the project manager has to deal with as a matter of routine. An issue, therefore, has to be brought to the attention of a higher authority such as the project board, steering group or programme manager, since it may well require additional resources, either human, financial or physical (material), which require sanctioning by senior management.
As with other types of changes, a register of issues, often called an issue log, must be set up and kept up to date. This not only records the type, source and date of the issue to be addressed, but also shows to whom it was circulated, the effect in terms of cost, time and performance it has on the project, and how it was resolved. If the issue is large or complex, it may, as with particular risks, be necessary to appoint an issue owner (or resolution owner) who will be responsible for implementing the agreed actions to resolve the matter.
The way an issue is resolved depends clearly on its size and complexity. Again, as with change requests, other departments that may be affected have to be advised and consulted, and in serious situations, special meetings may have to be convened to discuss the matter in depthandsufficientdetailtoenableproposalsforarealisticsolutiontobetabled.Caremustbe taken not to escalate inevitable problems that arise during the course of a project to the status of an issue, as this would take up valuable management time of the members of the steering group or senior management. As is so often the case with project management, judgement and experience are the key attributes for handling the threats and vicissitudes of a project.
Baseline
The three baselines in project management are associated with the three project management criteria, i.e. cost, time and performance. The baselines are set by the project manager at the beginning of the project and are incorporated in the project-management plan. All subsequent data gathered by the project reporting system which affect the cost or duration of the project are compared with the baseline, which can only be changed by agreed variations issued by the client. This is normally shown by a step change in the budget curve (usually straight line) of the earned value set of control curves.
There are instances where the originator of the change to the baseline is the project manager instead of the client. This occurs when the delay or cost overrun is due to an error by the project management team or the contractor. The baseline will be changed, but the cost cannot be passed on to the client. Indeed, if the change delays the completion date, the party respon-sible may be liable for liquidated damages or other form of compensation payment.
Where the change is originated by the client, the project manager has to issue a change of contract-scope notice as shown in Fig. 17.1.

104 Chapter 17
Baseline Review
TheAssociationforProjectManagement(APM)published a book titled Guide to Conducting Integrated Baseline Reviews which sets out the procedures necessary for effective baseline management.
Assetoutinthisbook,theintegratedbaselinereview(IBR)isaformalprocedurecarriedoutat prearranged intervals to assess the status of the project and take remedial action where necessary.Theprocessisdividedintofourmainstages:pre-IBR,preparation,executionandpost-review.
Pre-IBR
Thisiswhentheneed,policy,timing,objectivesandacceptancecriteriaoftheIBRarediscussed and agreed.
Preparation
ThisstageincludesassessingthecompetencesofandrecruitingtheIBRteam,producinganIBRhandbookandcollatingtherequireddocuments.
Execution
In this stage, every facet of the project such as cost, programme and performance is examined and discussed. After collating the discussions and feedback, the results are presented and issuedasafinalIBRreport.
Post-Review
This stage deals with the preparation of an action plan in which all the risks and problems have been identified and logged. A root-cause analysis should be carried out to identify areas which can be improved and remedial actions for this should be assigned to the appropriate membersoftheIBRteam.
Further Reading
APM.(2011).Directing change.APM.Balogun,J.,etal.(2008).Exploring strategic change.Prentice-Hall.Ludovino,E.M.(2016).Change management.EMPressLtd.

105Project Management, Planning and Control. http://dx.doi.org/10.1016/B978-0-08-102020-3.00018-8Copyright © 2017 Elsevier Ltd. All rights reserved.
CHAPTER 18
Configuration Management
Although in the confined project management context, configuration management is often assumed to be synonymous with version-control of documentation or software, it is of course much more far reaching in the total project environment. Developed originally for the aero-space industry, it was created to ensure that changes and modifications to physical components, software, systems and documentation are recorded and identified in such a way that replace-ments, spares and assembly documentation conforms to the version in service. It was also developed to ensure that the design standards and characteristics were reflected accurately in the finished product.
It can be seen that when the projects involve complex systems as in the aerospace, defence or petrochemical industry, configuration management is of the utmost importance as the very nature of these industries involves development work and numerous modifica-tions, not only from the original concept or design but also during the whole life cycle of the product.
Keeping track of all these changes to specifications, drawings, support documentation and manufacturing processes is the essence of configuration management, which can be split into the following five main stages: 1. Configuration management and planning. This covers the necessary standards, proce-
dures, support facilities, resources and training, and sets out the scope, definitions, reviews, milestones and audit dates.
2. Configuration identification. This encompasses the logistics and systems and procedures. It also defines the criteria for selection in each of the project phases.
3. Configuration-change management. This deals with the proposed changes and their investigation before acceptance. At this stage, changes are compared with the configura-tion baseline including defining the stages when formal departure points have reached.
4. Configuration-status accounting. This records and logs the accepted (registered) changes and notifications as well as providing traceability of all baselines.
5. Configuration audit. This ensures that all the previous stages have been correctly applied and incorporated in the organization. The output of this stage is the audit report.
In all these stages, resources and facilities must always be considered, and arrangements must be made to feedback the comments to the management stage.

106 Chapter 18
Essentially, the process of identification, evaluation and implementation of changes requires accurate monitoring and recording, and subsequent dissemination of documentation to the interested parties. This is controlled by a master record index (MRI). An example of such an MRI for controlling documents is shown in Fig. 18.1.
For large, complex and especially multinational projects, where the design and manufacture are carried out in different countries, great effort is required to ensure that the product con-figuration is adequately monitored and controlled. To this end, a configuration-control committee is appointed to head up special interface-control groups and configuration-control boards that investigate and, when accepted, approve all proposed changes.
Business Case Rqmt SR 123
PMP/MLS/34
WBS/PD1
RMP/MLS/1
Project Mgmt Plan
WBS
Risk Mgmt Plan, etc.
Document Title Reference Number Issue
Master Record Index
Documents
Responsibility
Mr Sponsor
Ms MLS PM
Mr MLS Deputy PM
IPMT(Project Team)
PM, Line Mgmt
All Stakeholders
Distribution
Draft A 14/6/86
24/7/86
30/7/86
30/9/86
28/7/86
30/9/86
30/7/86
2/8/86
Draft B
Issue 1
Issue 1
Issue 1
Issue 2
Draft A
Draft A
Date
Figure 18.1Master record index.

107Project Management, Planning and Control. http://dx.doi.org/10.1016/B978-0-08-102020-3.00019-XCopyright © 2017 Elsevier Ltd. All rights reserved.
CHAPTER 19
Basic Network Principles
Chapter OutlineNetwork Analysis 108The Network 108
Basic Rules 109
Durations 112Numbering 113
Random 113Topological 113Sequential 114Coordinates 114
Hammocks 117Ladders 117
Precedence or Activity on Node Diagrams 119Constraints 125
Bar (Gantt) Charts 126Time-Scale Networks and Linked Bar Charts 128Further Reading 130
It is true to say that whenever a process requires a large number of separate but integrated operations, a critical path network can be used to advantage. This does not mean, of course, that other methods are not successful or that the critical path method (CPM) is a substitute for these methods – indeed, in many cases network analysis can be used in conjunction with traditional techniques – but if correctly applied CPM will give a clearer picture of the com-plete programme than other systems evolved to date.
Every time we do anything, we string together, knowingly or unknowingly, a series of activities that make up the operation we are performing. Again, if we so desire, we can break down each individual activity into further components until we end up with the movement of an electron around a nucleus. Clearly, it is ludicrous to go to such a limit, but we can call a halt to this successive breakdown at any stage to suit our requirements. The degree of the breakdown depends on the operation we are performing or intend to perform.
In the United Kingdom, it was the construction industry that first realized the potential of network analysis, and most of the large, if not all, construction, civil engineering and building

108 Chapter 19
firms now use CPM regularly for their larger contracts. However, a contract does not have to be large before CPM can be usefully employed. If any process can be split into 20 or more operations or ‘activities’, a network will show their interrelationship in a clear and logical manner so that it may be possible to plan and rearrange these interrelationships to produce either a shorter or a cheaper project, or both.
Network Analysis
Network analysis, as the name implies, consists of two basic operations: 1. Drawing the network and estimating the individual activity times 2. Analysing these times in order to find the critical activities and the amount of float in the
non-critical ones
The Network
Basically, the network is a flow diagram showing the sequence of operations of a process. Each individual operation is known as an activity and each meeting point or transfer stage between one activity and another is an event or node. If the activities are represented by straight lines and the events by circles, it is very simple to draw their relationships graphi-cally, and the resulting diagram is known as the network. In order to show whether an activity has to be performed before or after its neighbour, arrowheads are placed on the straight lines, but it must be explained that the length or orientation of these lines is quite arbitrary. This format of network is called activity on arrow (AoA), as the activity description is written over the arrow.
It can be seen, therefore, that each activity has two nodes or events; one at the beginning and one at the end (Fig. 19.1). Thus, events 1 and 2 in the figure show the start and finish of activity A. The arrowhead indicates that 1 comes before 2, i.e. the operation flows towards 2.
We can now describe the activity in two ways: 1. By its activity title (in this case, A) 2. By its starting and finishing event nodes 1 to 2
For analysis purposes (except when using a computer), the second method must be used.
1 2A
Figure 19.1
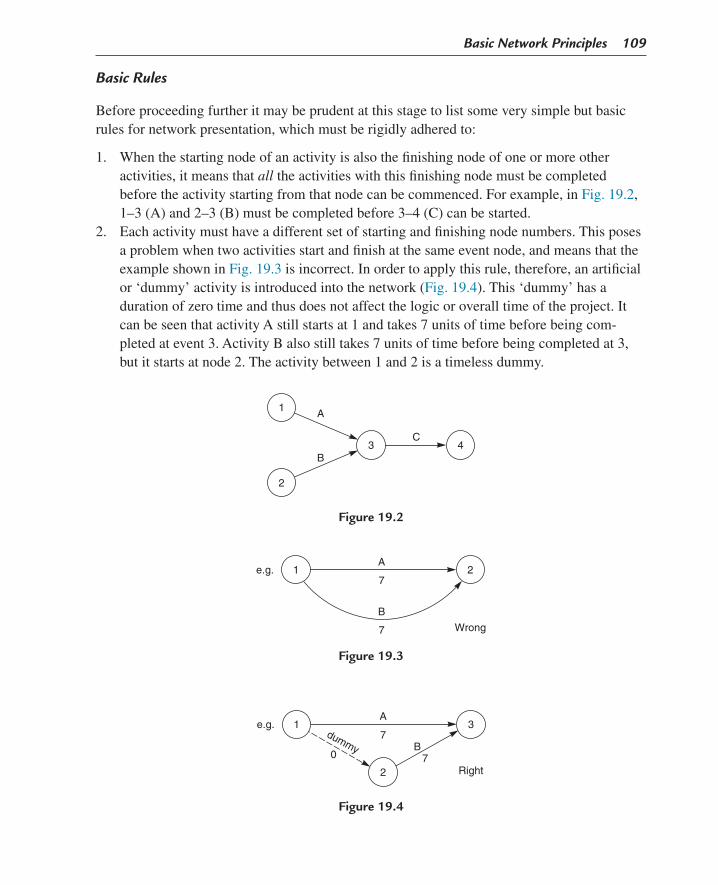
Basic Network Principles 109
Basic Rules
Before proceeding further it may be prudent at this stage to list some very simple but basic rules for network presentation, which must be rigidly adhered to: 1. When the starting node of an activity is also the finishing node of one or more other
activities, it means that all the activities with this finishing node must be completed before the activity starting from that node can be commenced. For example, in Fig. 19.2, 1–3 (A) and 2–3 (B) must be completed before 3–4 (C) can be started.
2. Each activity must have a different set of starting and finishing node numbers. This poses a problem when two activities start and finish at the same event node, and means that the example shown in Fig. 19.3 is incorrect. In order to apply this rule, therefore, an artificial or ‘dummy’ activity is introduced into the network (Fig. 19.4). This ‘dummy’ has a duration of zero time and thus does not affect the logic or overall time of the project. It can be seen that activity A still starts at 1 and takes 7 units of time before being com-pleted at event 3. Activity B also still takes 7 units of time before being completed at 3, but it starts at node 2. The activity between 1 and 2 is a timeless dummy.
1 A
B
2
3C
4
Figure 19.2
1A
7
7
B
2
Wrong
e.g.
Figure 19.3
e.g. 1
0
2
7
7B
A3
Right
dummy
Figure 19.4

110 Chapter 19
3. When two chains of activities are interrelated, this can be shown by joining the two chains either by a linking activity or a ‘dummy’ (Fig. 19.5). The dummy’s function is to show that all the activities preceding it, i.e., 1–2 (A) and 2–3 (B) shown in Fig. 20.5, must be completed before activity 7–8 (F) can be started. Needless to say, activities 5–6 (D), 6–7 (E) and 2–6 (G) must also be completed before 7–8 (F) can be started.
4. Each activity (except the last) must run into another activity. Failure to do so creates a loose end or ‘dangle’ (Fig. 19.6). Dangles create premature ‘ends’ of a part of a project, so that the relationship between this end and the actual final completion node cannot be seen. Hence the loose ends must be joined to the final node (in this case, node 6 in Fig. 19.7) to enable the analysis to be completed.
5. No chain of activities must be permitted to form a loop, i.e., such a sequence that the last activity in the chain has an influence on the first. Clearly, such a loop makes any logic senseless since, if one considers activities 2–3 (B), 3–4 (C), 4–5 (E) and 5–2 (F) in Fig. 19.8, one finds that B, C and E must precede F, yet F must be completed before B can start. Such a situation cannot occur in nature and defies analysis.
e.g. 1
5D E
A2
G
6
B3
C
F
4
87
dum
my
Figure 19.5
e.g. 1 5
D
A2 6
B
3
C
4E
Wrong
Figure 19.6
e.g. 1 5
D
A2 6
B
3
C
4E
Right
dummy
Figure 19.7

Basic Network Principles 111
Apart from strictly following the basic rules 1 to 5 set out earlier, the following points are worth remembering to obtain the maximum benefit from network techniques. 1. Maximize the number of activities that can be carried out in parallel. This obviously
(resources permitting) cuts down the overall programme time. 2. Beware of imposing unnecessary restraints on any activity. If a restraint is convenient
rather than imperative, it should best be omitted. The use of resource restraints is a trap to be particularly avoided since additional resources can often be mustered – even if at additional cost. The exception is when using ‘critical chain’ project management methods.
3. Start activities as early as possible and connect them to the rest of the network as late as possible (Figs. 19.9 and 19.10). This avoids unnecessary restraints and gives maximum float.
4. Resist the temptation to use a conveniently close node point as a ‘staging post’ for a dummy activity used as a restraint. Such a break in a restraint could impose an additional unnecessary restraint on the succeeding activity. In Fig. 19.11 the intent is to restrain activity E by B and D and activity G by D. However, because the dummy from B uses node 6 as a staging post, activity G is also restrained by B. The correct network is shown in Fig. 19.12. It must be remembered that the restraint on G may have to be added at a later stage, so that the effect of B in Fig. 19.11 may well be overlooked.
e.g. 1
5
DA2 6
B3
C4
EFloop
Figure 19.8
bad
Figure 19.9
good
Figure 19.10

112 Chapter 19
5. When drawing ladder networks beware of the danger of trying to economize on dummy activities as described later (Figs. 19.24 and 19.25).
Durations
Having drawn the network in accordance with the logical sequence of the particular project requirements, the next step is to ascertain the duration or time of each activity. These can be estimated in the light of experience, in the same manner that any programme times are usually ascertained, e.g., using standard industry or company norms, but it must be remem-bered that the shorter the durations, the more accurate they usually are.
The durations are then written against each activity in any convenient time unit, but this must, of course, be the same for every activity. For example, referring to Fig. 19.13, if activities 1–2 (A), 2–5 (B) and 5–6 (C) took 3, 2 and 7 days, respectively, one would show this by merely writing these times under the activity.
1 2 3
4 5 6
7 8 9
10 11
A B
C D
E F
G
Figure 19.11
1 2 3
4 5 6
7 8 9
10 11
A B
C D
E F
G
Figure 19.12

Basic Network Principles 113
Numbering
The next stage of network preparation is numbering the events or nodes. Depending on the method of analysis, the following systems shown in Fig. 19.14 can be used.
Random
This method, as the name implies, follows no pattern and merely requires each node number to be different. All computers (if used) can, of course, accept this numbering system, but there is always the danger that a number may be repeated.
Topological
This method was necessary for the original early computer programs, which demanded that the starting node of an activity be smaller than the finishing node of that activity. If this law is applied throughout the network, the node numbers will increase in value as the project moves towards the final activity. It had some value for beginners using network analysis since loops are automatically avoided. However, it is very time-consuming and requires constant back-checking to ensure that no activity has been missed. The real drawback is that if an activity is
1 2
2
2
3
3
4
5 67
8
A B C
D
E
dummy
Figure 19.13
1
1
1
2
3
2 3
4
4
5
5
6
6
7
7
8
13
4 5
11
11 12
Random
Topological
Sequential
(A)
(B)
(C)
Figure 19.14

114 Chapter 19
added or changed, the whole network has to be renumbered from that point onwards. Clearly, this is an unacceptable restriction in practice and, with the development of modern computer programs, can now be consigned to the history books of project planning.
Sequential
This is a random system from an analysis point of view, but the numbers are chosen in blocks so that certain types of activities can be identified by the nodes. The system therefore clarifies activities and facilitates recognition. The method is quick and easy to use, and should always be used whatever method of analysis is employed. Sequential numbering is usually employed when the network is banded (see Chapter 20). It is useful in such circumstances to start the node numbers in each band with the same prefix number, i.e., the nodes in band 1 would be numbered 101, 102, 103, etc. while the nodes in band 2 are numbered 201, 202, 203, etc. Fig. 20.1 would lend itself to this type of numbering.
Coordinates
This method of activity identification can only be used if the network is drawn on a gridded background. In practice, thin lines are first drawn on the back of the translucent sheet of drawing paper to form a grid. This grid is then given coordinates or map references with letters for the vertical coordinate and numbers for the horizontal (Fig. 19.15).
The reason for drawing the lines on the back of the paper is, of course, to leave the grid intact when the activities are changed or erased. A fully drawn grid may be confusing to some people, so it may be preferable to draw a grid showing the intersections only (Fig. 19.16).
1
2
3
4
5
6
7A B C D E F G H J K
Figure 19.15Grid.

Basic Network Principles 115
1
2
3
4
5
6
7
A B C D E F G H J K
Figure 19.16Grid (intersections only).
1
2
3
4
5 A5
A3
A1
A B
B1
B2
B3
B4
C D
Write specfor equip.
Prelimfound. drg.
Purch.equip.
Purch.instr.
Calcs.
Elect.layout
Negotiate with elect. boardC5
Manuf.equip.
Manuf.instr.
Final drg.
Elect.load sum.
Locatesub stn.
Figure 19.17
When activities are drawn, they are confined in length to the distance between two intersections. The node is drawn on the actual intersection so that the coordinates of the intersection become the node number. The number can be written in or the node left blank, as the analyst prefers.
As an alternative to writing the grid letters on the nodes, it may be advantageous to write the letters between the nodes as in Fig. 23.3. This is described in more detail in Chapter 23.
Fig. 19.17 shows a section of a network drawn on a gridded background representing the early stages of a design project. As can be seen, there is no need to fill in the nodes, although, for clarity, activities A1–B1, B1–B2, A3–B3, A3–B4 and A5–C5 have had the node numbers added. The node numbers for ‘electrical layout’ would be B4–C4, and the map reference principle helps to find the activity on the network when discussing the programme on the telephone or quoting it in e-mail.

116 Chapter 19
There is no need to restrict an activity to the distance between two adjacent intersections of coordinates. For example, A5–C5 takes up two spaces. Similarly, any space can also be used as a dummy and there is no restriction on the length or direction of dummies. It is, however, preferable to restrict activities to horizontal lines for ease of writing and subsequent identification.
When required additional activities can always be inserted in an emergency by using suffix letters. For example, if activity ‘preliminary foundation drawings’ A3–B3 had to be preceded by, say, ‘obtain loads’, the network could be redrawn as shown in Fig. 19.18.
Quickly identifying or finding activities on a network can be of great benefit, and the earlier method has considerable advantages over other numbering systems. The use of coordinates is particularly useful in minimizing the risk of duplicating node numbers in a large network. Since each node is, as it were, pre-numbered by its coordinates, the possibility of double numbering is virtually eliminated.
Unfortunately, in the earlier computer programs, if the planner entered any number twice, the results could be disastrous, since the machine will, in many instances, interpret the error as a logical sequence. The following example shows how this is possible. The intended sequence is shown in Fig. 19.19. If the planner by mistake enters a number 11 instead of 15 for the last event of activity D, the sequence will in fact be as shown in Fig. 19.20, but the computer will interpret the error as in Fig. 19.21. Clearly, this will give a wrong analysis. If this little
1
2
3
4
5 A5
A3 A3a
A1
A B
B1
B2
B3
B4
C D
Write specfor equp.
Prelimfound.drg.
Obtainloads
Purch.equp.
Purch.instr.
Calcs.
Elect.layout
Negotiate with elect. boardC5
Figure 19.18
10 11 12 13
161514
a b c
d e
Figure 19.19

Basic Network Principles 117
network had been drawn on a grid with coordinates as node numbers, it would have appeared as in Fig. 19.22. Since the planner knows that all activities on line B must start with a B, the chance of the error occurring is considerably reduced.
Hammocks
When a number of activities are in series, they can be summarized into one activity encom-passing them all. Such a summary activity is called a hammock. It is assumed that only the first activity is dependent on another activity outside the hammock and only the last activity affects another activity outside the hammock.
On bar charts, hammocks are frequently shown as summary bars above the constituent activities and can therefore simplify the reporting document for a higher management who are generally not concerned with too much detail. For example, in Fig. 19.22, activities A1 to A4 could be written as one hammock activity since only A1 and A4 are affected by work outside this activity string.
Ladders
When a string of activities repeats itself, the set of strings can be represented by a configura-tion known as a ladder. For a string consisting of, say, four activities relating to two stages of excavation, the configuration is shown in Fig. 19.23.
10 11 12 13
161114
a b c
d e
Figure 19.20
10 11 12 13
1614
a b c
d e
Figure 19.21
1
A A1a
d
b
eB B1
A2
B2
A3c
A4
B3
2 3 4
Figure 19.22

118 Chapter 19
This pattern indicates that, for example, hand trim of Stage II can only be done if, 1. Hand trim of Stage I is complete 2. Machine excavation of Stage II is complete
This, of course, is what it should be.
However, if the work were to be divided into three stages, the ladder could, on the face of it, be drawn as shown in Fig. 19.24.
Again, in Stage II all the operations are shown logically in the correct sequence, but closer examination of Stage III operations will throw up a number of logic errors that the inexperi-enced planner may miss.
What we are trying to show in the network is that Stage III hand trim cannot be performed until Stage III machine excavation and Stage II hand trim are complete. However, what the diagram says is that, in addition to these restraints, Stage III hand trim cannot be performed until Stage I level bottom is also complete.
Clearly, this is an unnecessary restraint and cannot be tolerated. Therefore, the correct way of drawing a ladder when more than two stages are involved is shown in Fig. 19.25.
We must, in fact, introduce a dummy activity in Stage II (and any intermediate stages), between the starting and completion node of every activity except the last. In this way, the Stage III activities will not be restrained by Stage I activities, except by those of the same type.
Stage I
Stage II
3 3 2 1
1233
Machineexc.
Machineexc.
Handtrim
Handtrim
Levelbottom
Levelbottom
Blind
Blind
Figure 19.23
Stage I
Stage II
Stage III
3 3 2 1
1233
Machineexc.
Machineexc.
3
Machineexc.
Handtrim
Handtrim
3
Handtrim
Levelbottom
Levelbottom
2
Levelbottom
Blind
Blind
1
Blind
Figure 19.24

Basic Network Principles 119
An examination of Fig. 19.26 shows a new dummy between the activities in Stage II, i.e.,
This concept led to the development of a new type of network presentation called the ‘Lester’ diagram, which is described in more detail in Chapter 23. This has considerable advantages over the conventional arrow diagram and the precedence diagram, also described later.
Precedence or Activity on Node Diagrams
Some planners prefer to show the interrelationship of activities by using the node as the activity box and interlinking them by lines. The durations are written in the activity box or node, and are therefore called activity on node (AoN) diagrams. This has the advantage that separate dummy activities are eliminated. In a sense, each connecting line is, of course, a dummy because it is timeless. The network produced in this manner is also called variously a precedence diagram or a circle and link diagram. Precedence diagrams have a number of advantages over arrow diagrams in that 1. No dummies are necessary. 2. They may be easier to understand for people familiar with flowsheets. 3. Activities are identified by one number instead of two, so that a new activity can be
inserted between two existing activities without changing the identifying node numbers of the existing activities.
4. Overlapping activities can be shown very easily without the need for the extra dummies shown in Fig. 19.25.
Analysis and float calculation (see Chapter 21) is identical to the methods employed for arrow diagrams and if the box is large enough, the earliest and latest start and finishing times can also be written.
i.e.Machine
exc.Handtrim
Levelbottom Blind
Figure 19.26
Stage I
Stage II
Stage III
3 3 2 1
1233
Machineexc.
Machineexc.
3
Machineexc.
Handtrim
Handtrim
3
Handtrim
Levelbottom
Levelbottom
2
Levelbottom
Blind
Blind
1Blind
Figure 19.25

120 Chapter 19
A typical precedence network is shown in Fig. 19.27 where the letters in the box represent the description or activity numbers. Durations are shown above-centre, and the earliest and latest starting and finish times are given in the corners of the box, as explained in the key diagram. The top line of the activity box gives the earliest start (ES), duration (D) and earliest finish (EF).
Therefore,
EF = ES + D.
The bottom line gives the latest start and the latest finish. Therefore,
LS = LF − D.
The centre box is used to show the total float.
ES is of course the highest EF of the previous activities leading into it, i.e., the ES of activity E is 8, taken from the EF of activity B.
LF is the lowest LS of the previous activity working backwards, i.e., the LF of A is 3, taken from the LS of activity B.
The ES of activity F is 5 because it can start after activity D is 50% complete, i.e.,
ES of activity D is 3.Duration of activity D is 4.Therefore, 50% of duration is 2.Therefore, ES of activity F is 3 + 2 = 5.
Sometimes, it is advantageous to add a percentage line on the bottom of the activity box to show the stage of completion before the next activity can start (Fig. 19.28). Each vertical line
Figure 19.27AoN diagram.

Basic Network Principles 121
represents 10% completion. In addition to showing when the next activity starts, the percent-age line can also be used to indicate the percentage completion of the activity as a statement of progress once work has started as shown in Fig. 19.29.
There are four other advantages of the precedence diagram over the arrow diagram. 1. The risk of making the logic errors is virtually eliminated. This is because each activity is
separated by a link, so that the unintended dependency on another activity is just not possible.
2. This is made clear by referring to Fig. 19.30, which is the precedence representation of Fig. 19.25.
3. As can be seen, there is no way for an activity like ‘Level bottom’ in Stage I to affect activity ‘Hand trim’ in Stage III, as is the case in Fig. 19.30.
4. In a precedence diagram all the important information of an activity is shown in a neat box.
A close inspection of the precedence diagram (Fig. 19.31) shows that in order to calculate the total float, it is necessary to carry out the forward and backward pass. Once this has been done, the total float of any activity is simply the difference between the latest finishing time (LF) obtained from the backward pass and the earliest finishing time (EF) obtained from the forward pass.
On the other hand, the free float can be calculated from the forward pass alone, because it is simply the difference of the earliest start (ES) of a subsequent activity and the earliest finish-ing time (EF) of the activity in question.
Figure 19.28
Figure 19.29Progress indication.

122 Chapter 19
This is clearly shown in Fig. 19.31.
Despite the earlier-mentioned advantages, which are especially appreciated by people familiar with flow diagrams as used in manufacturing industries, many prefer the arrow diagram because it resembles more closely to a bar chart. Although the arrows are not drawn to scale, they do represent a forward-moving operation and, by thickening up the actual line in approx-imately the same proportion as the reported progress, a ‘feel’ for the state of the job is imme-diately apparent.
One major practical disadvantage of precedence diagrams is the size of the box. The box has to be large enough to show the activity title, duration and earliest and latest times, so that the space taken up on a sheet of paper reduces the network size. By contrast, an arrow diagram is very economical, since the arrow is a natural line over which a title can be written, and the node need be no larger than a few millimetres in diameter – if the coordinate method is used.
The difference (or similarity) between an arrow diagram and a precedence network can be seen most easily by comparing the two methods in the following example. Fig. 19.32 shows a project programme in AoA format and Fig. 19.33 the same programme as a precedence
Figure 19.31Total and free float calculation.
Figure 19.30Logic to precedence diagram.

Basic Network Principles 123
diagram, or AoN format. The difference in the area of paper required by the two methods is obvious (see also Chapter 33).
Fig. 19.33 shows the precedence version of Fig. 19.32.
In practice, the only information necessary when drafting the original network is the activity title, duration and, of course, the interrelationships of the activities. A precedence diagram can therefore be modified by drawing ellipses just big enough to contain the activity title and duration, leaving the computer (if used) to supply the other information at a later stage. The
Figure 19.32Arrow (AoA) network.
0 0
0
11
216
3
6
13
2611
11
11
20
27
0 4
0
15
218
7
6
17
2611
24
12
21
27
0 3
6
2
53
8
5
4
110
2
9
5
0
START A
D
G
MK
B
50% = 4
E
H
NL
C
F
J
FINISH
0 3
6
13
269
11
11
17
2721
13
20
25
27
00 74
60
174
260112
2110
110
214
270210
2613
211
261
270
Activity
Duration
Earlystart(ES)
Earlyfinish(EF)
Latestart(LS)
Latefinish(LF)
CriticalCritical
Critical path
2 lag
Figure 19.33Precedence (AoN) network.

124 Chapter 19
important thing is to establish an acceptable logic before the end date and the activity floats are computed. For explaining the principles of network diagrams in textbooks (and in exami-nations), letters are often used as activity titles, but in practice when building up a network, the real descriptions have to be used.
An example of such a diagram is shown in Fig. 19.34. Care must be taken not to cross the nodes with the links and to insert the arrowheads to ensure the correct relationship.
One problem of a precedence diagram is that when large networks are being developed by a project team, the drafting of the boxes takes up a lot of time and paper space, and the inser-tion of links (or dummy activities) becomes a nightmare, because it is confusing to cross the boxes, which are in fact nodes. Therefore, it is necessary to restrict the links to run horizon-tally or vertically between the boxes, which can lead to congestion of the lines, making the tracing of links very difficult.
When a large precedence network is drawn by a computer, the problem becomes even greater because the link lines can sometimes be so close together that they will appear as one thick black line. This makes it impossible to determine the beginning or end of a link, thus nullify-ing the whole purpose of a network, i.e., to show the interrelationship and dependencies of the activities (see Fig. 19.35).
For small networks with fewer dependencies, precedence diagrams are no problem, but for networks with 200–400 activities per page, it is a different matter. The planner must not feel restricted by the drafting limitations to develop an acceptable logic, and the tendency by some irresponsible software companies to advocate eliminating the manual drafting of a network altogether must be condemned. This manual process is after all the key operation for developing the project network and the distillation of the various ideas and inputs of the team. In other words, it is the thinking part of network analysis. The number crunching can then be left to the computer.
Figure 19.34Logic draft.

Basic Network Principles 125
Once the network has been numbered and the times or durations added, it must be analysed. This means that the earliest start and completion dates must be ascertained and the floats or ‘spare times’ calculated. There are three main types of analysis: 1. Arithmetical 2. Graphical 3. Computer
Since these three different methods (although obviously giving the same answers) require very different approaches, a separate chapter is devoted to each technique (see Chapters 21, 22 and 24 ).
Constraints
By far the most common logical constraint of a network is as given in the examples on the previous pages, i.e., ‘finish to start’ (F–S) where activity B can only start when activity A is complete. However, it is possible to configure other restraints. These are start to start (S–S), finish to finish (F–F) and start to finish (S–F). Fig. 19.36 shows these less usual constraints, which are sometimes used when a lag occurs between the activities. Analysing a network manually with such restraints can be very confusing, and should there be a lag or delay between any two activities, it is better to show this delay as just another activity. In fact, all
Figure 19.35Computer-generated AoN diagram.

126 Chapter 19
these three less usual constraints can be redrawn in the more conventional finish to start (F–S) mode as shown in Fig. 19.37.
When an activity can start before the previous one has been completed, i.e., when there is an overlap, it is known as lead. When an activity cannot start until part of the previous activity has been completed, it is called a lag.
Bar (Gantt) Charts
The bar chart was originally first invented by a Polish engineer, Karol Adamiecki, but it was an American production engineer, Henry Laurence Gantt, who developed it at the beginning of the 20th century, and the chart is consequently known now as the Gantt chart. The Gantt chart was used in a number of planning applications during the World War I and was the main planning tool for production and construction engineers until the invention of the critical path network. Each activity on the Gantt chart is represented by a straight horizontal line. The length of the line is proportional to its duration, and the starting and finishing times specified by the planner are plotted against the calendar scale provided at the top (or bottom) of the paper. The original set of lines is called the base lines, and progress can be monitored against them. By performing this graphical representation for each activity, an overall picture of the required work on a project can be seen at a glance. Progress of an activity can be recorded either by drawing a second line beneath the base line or colouring up the base line to show the progress on a daily, weekly or monthly basis.
F–SBuyland
2
Clearland
2
3
Delay
S–S
F–F
S–F
Digtrench
6
Strip6
Skipdeliv
Laycable
4
Paint7
Fill
After 3
2
2
Figure 19.36Dependencies.

Basic Network Principles 127
If the schedule is first drafted manually on a network, it is very quick to produce a Gantt chart as all the thinking has been done at the network stage. However, when using a computer for scheduling, although the Gantt chart is generated automatically as the data is being inputted, the operation takes longer because the sequences and dependencies have to be considered and firmed up as the activities are being typed in. It is for this reason that the first draft of a schedule should be on a network, as the dependencies and basic logic as well as the durations can be very easily and quickly modified to produce the optimum (earliest) completion date.
A Gantt chart is most useful as a method for showing and allocating resources. When the quantity of a common resource, such as labourers, is recorded against each period of an activity, the vertical addition of the resources for any time period gives the total resources for this period. This can then be shown graphically as a vertical bar or column. By carrying out this operation for all the time periods, a series of vertical bars show what resources are required for the project, which is known as a resource histogram. Fig. 19.38 shows a simple bar chart where progress is represented by the hatched lines below the activity lines. The
F–S
S–S
F–F
S–F
Buyland
2
Digtrench
3
Strip6
Skipdeliv
Delay3
Digtrench
3
Laycable
3
Delay2
Paint7
Fill2
Day 2
Sendoff
Finish0
8
Laycable
1
Clearland
2
Figure 19.37Alternative configurations.

128 Chapter 19
resources (men) have been added for each activity and after vertical summation, converted into a histogram. This is discussed further in Chapter 30.
Time-Scale Networks and Linked Bar Charts
When preparing presentation or tender documents, or when the likelihood of the pro-gramme being changed is small, the main features of a network and bar chart can be
10
9
8
7
6
5
4
3
2
1
0
A
B
C
D
E
F
G
H
J
2 2
1
2
3 3 3 3 3
4 4 4
2
3
2 2 2 2
3 3 3 3 3
2 2
4 4
3
1 1 1
1WEEK 2 3 4 5 6 7 8 9 10 11 12 13 14 15 16 17
1WEEK
MEN
2 3 4 5 6 7 8 9 10 11 12 13 14 15 16 17
2 2 6 4 4 4 7 7 9 5 5 5 5 5 2 4 4
AC
TIV
ITIE
SM
EN
BAR CHART
Histogram
Figure 19.38Gantt (bar) chart and histogram. Note: The horizontal scale on all the graphs must be in day
numbers or week numbers. On no account must they be calendar dates. Numbers must be written on the vertical lines, not in the spaces between the lines.

Basic Network Principles 129
combined in the form of a time-scale network, or a linked bar chart. A time-scale network has the length of the arrows drawn to a suitable scale in proportion to the duration of the activities. The whole network can in fact be drawn on a gridded background where each square of the grid represents a period of time such as a day, week or month. Free float is easily ascertainable by inspection, but total float must be calculated in the conventional manner.
By drawing the activities to scale and starting each activity at the earliest date, a type of bar chart is produced that differs from the conventional bar chart in that some of the activity bars are on the same horizontal line. The disadvantage of such a presentation is that a part of the network has to be redrawn ‘downstream’ from any activity that changes its duration. It can be seen that if one of the early activities changes in either duration or starting point, the whole network has to be modified.
However, a time-scale network (especially if restricted to a few major activities) is a clear and concise communication document for reporting up. It loses its value in communicating down because changes increase with detail and constant revision would be too time-consuming.
A further development of the Gantt chart, called a linked bar chart, is very similar to a normal bar chart, i.e., each activity is on a separate line and the activities are listed vertically at the edge of the paper. However, by drawing vertical lines connecting the end of one activity with the start of another, one can show the dependencies as a Gantt chart format. Unfortunately, these links, like the original bar charts, only show the implied relationship, as opposed to a critical path network, which shows the logically absolute relationship.
Chapter 24 describes the graphical analysis of networks, and it can be seen that if the ends of the activities were connected by the dummies a linked bar chart would result. This would, however, be based on the logic of the original AoA or AoN network.
Fig. 19.39 shows a small time-scale network and Fig. 19.40 shows the same programme drawn as a linked bar chart.
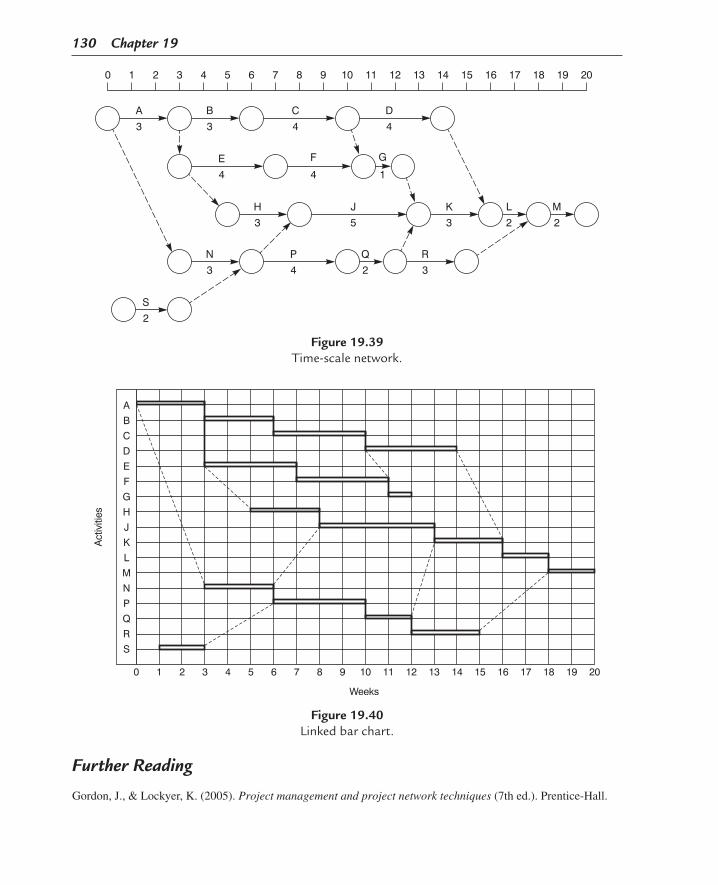
130 Chapter 19
Figure 19.40Linked bar chart.
Figure 19.39Time-scale network.
Further Reading
Gordon, J., & Lockyer, K. (2005). Project management and project network techniques (7th ed.). Prentice-Hall.

131Project Management, Planning and Control. http://dx.doi.org/10.1016/B978-0-08-102020-3.00020-6Copyright © 2017 Elsevier Ltd. All rights reserved.
CHAPTER 20
Planning Blocks and Subdivision of Blocks
Chapter OutlinePharmaceutical Factory 132New Housing Estate 132Portland Cement Factory 133Oil Terminal 133Multi-Storey Block of Offices 133Colliery Surface Reconstruction 134Bitumen Refinery 134Typical Manufacturing Unit 135Subdivision of Blocks 136
Similar Items of Equipment 137Trades and Disciplines 137Geographical Proximity 138Operational Systems 138Stages of Completion 140Banding 140
Before any meaningful programme can be produced, it is essential that careful thought is given to the number and size of the networks required. Not only it is desirable to limit the size of the network, but each ‘block’ of networks should be considered in relation to the following aspects: 1. The geographical location of the various portions or blocks of the project; 2. The size and complexity of each block; 3. The systems in each block; 4. The process or work being carried out in the block when the plant is complete; 5. The engineering disciplines required during the design and construction stage; 6. The erection procedures; 7. The stages at which individual blocks or systems have to be completed, i.e., the construction
programme; 8. The site organization envisaged; and 9. Any design or procurement priorities.
For convenience, a block can be defined as a geographical process area within a project, which can be easily identified, usually because it serves a specific function. The

132 Chapter 20
importance of choosing the correct blocks, i.e., drawing the demarcation lines in the most advantageous way, cannot be overemphasized. This decision has an effect not only on the number and size of planning networks but also on the organization of the design teams and, in the case of large projects, on the organizational structure of the site-management setup.
Because of its importance, a guide is given in the following which indicates the type of block distribution that may be sensibly selected for various projects. The list is obviously limited, but it should not be too difficult to abstract some firm guidelines to suit the project under consideration.
Pharmaceutical Factory
Block A Administration block (offices and laboratories)Block B Incoming goods area, raw material storeBlock C Manufacturing area 1 (pills)Block D Manufacturing area 2 (capsules)Block E Manufacturing area 3 (creams)Block F Boiler house and water treatmentBlock G Air-conditioning plant room and electrical distribution control roomBlock H Finished goods store and dispatch
For planning purposes, general site services such as roads, sewers, fencing and guard houses can be incorporated into Block A or, if extensive, can form a block of their own.
New Housing Estate
Block A Low-rise housing area—NorthBlock B Low-rise housing area—EastBlock C Low-rise housing area—SouthBlock D Low-rise housing area—WestBlock E High-rise—Block 1Block F High-rise—Block 2Block G Shopping precinctBlock H Electricity substation
Obviously, the number of housing areas or high-rise blocks can vary with the size of the development. Roads and sewers and statutory services are part of their respective housing blocks unless they are constructed earlier as a separate contract, in which case they would form their own block or blocks.
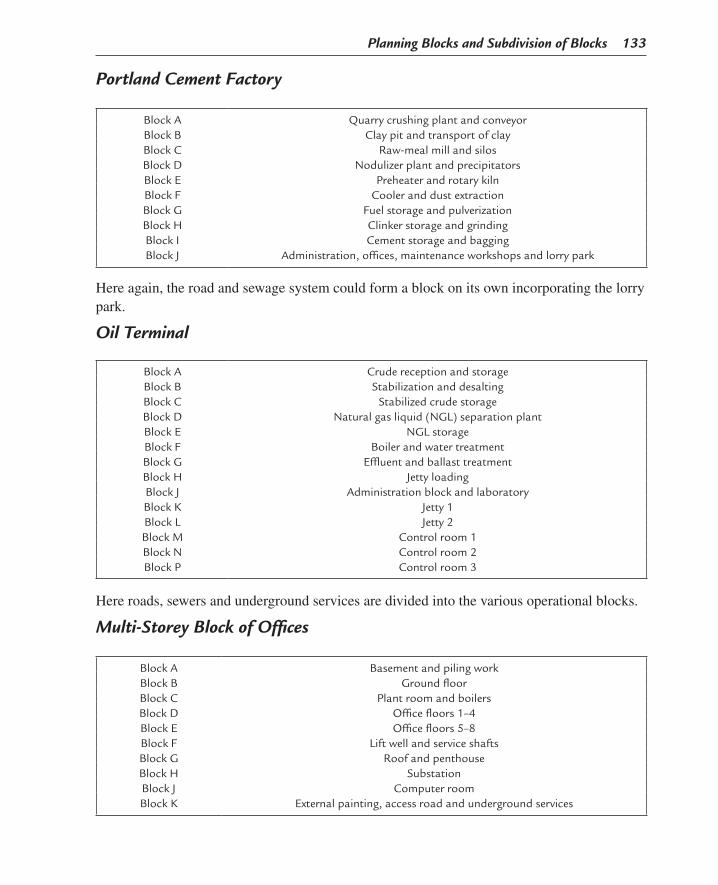
Planning Blocks and Subdivision of Blocks 133
Portland Cement Factory
Block A Quarry crushing plant and conveyorBlock B Clay pit and transport of clayBlock C Raw-meal mill and silosBlock D Nodulizer plant and precipitatorsBlock E Preheater and rotary kilnBlock F Cooler and dust extractionBlock G Fuel storage and pulverizationBlock H Clinker storage and grindingBlock I Cement storage and baggingBlock J Administration, offices, maintenance workshops and lorry park
Here again, the road and sewage system could form a block on its own incorporating the lorry park.
Oil Terminal
Block A Crude reception and storageBlock B Stabilization and desaltingBlock C Stabilized crude storageBlock D Natural gas liquid (NGL) separation plantBlock E NGL storageBlock F Boiler and water treatmentBlock G Effluent and ballast treatmentBlock H Jetty loadingBlock J Administration block and laboratoryBlock K Jetty 1Block L Jetty 2Block M Control room 1Block N Control room 2Block P Control room 3
Here roads, sewers and underground services are divided into the various operational blocks.
Multi-Storey Block of Offices
Block A Basement and piling workBlock B Ground floorBlock C Plant room and boilersBlock D Office floors 1–4Block E Office floors 5–8Block F Lift well and service shaftsBlock G Roof and penthouseBlock H SubstationBlock J Computer roomBlock K External painting, access road and underground services

134 Chapter 20
Clearly, in the construction of a multi-storey building, whether for offices or flats, the method of construction has a great bearing on the programme. There is obviously quite a different sequence required for a block with a central core—especially if sliding formwork is used—than with a more conventional design using reinforced concrete or structural steel columns and beams. The degree of precasting will also have a great influence on the split of the network.
Colliery Surface Reconstruction
Block A Headgear and airlocksBlock B Winding house and winderBlock C Mine car layout and heapstead buildingBlock D Fan house and ductBlock E Picking belt and screen buildingBlock F Wagon loading and bunkeringBlock G Electricity substation, switch room and lamp roomBlock H Administration area and amenitiesBlock J Baths and canteen (welfare block)
Roads, sewers and underground services could be part of Block J or be a separate block.
Bitumen Refinery
Block A Crude line and tankageBlock B Process unitBlock C Effluent treatment and oil/water separatorBlock D Finished product tankageBlock E Road loading facility, transport garage and lorry parkBlock F Rail loading facility and sidingsBlock G Boiler house and water treatmentBlock H Fired heater areaBlock J Administration building, laboratory and workshopBlock K SubstationBlock L Control room
Depending on size, the process unit may have to be subdivided into more blocks, but it may be possible to combine K and L. Again, roads and sewers may be separate or part of each block.

Planning Blocks and Subdivision of Blocks 135
Typical Manufacturing Unit
Block A Incoming goods ramps and storeBlock B Batching unitBlock C Production area 1Block D Production area 2Block E Production area 3Block F Finishing areaBlock G Packing areaBlock H Finished goods store and dispatchBlock J Boiler room and water treatmentBlock K Electrical switch roomBlock L Administration block and canteen
Additional blocks can, of course, be added where complexity or geographical location dictates this.
It must be emphasized that these typical block breakdowns can, at best, be a rough guide, but they do indicate the splits that are possible. When establishing the boundaries of a block, the main points given at the beginning of this chapter must be considered.
The interrelationship and interdependence between blocks during the construction stage is, in most cases, remarkably small. The physical connections are usually only a number of pipes, conveyors, cables, underground services and roads. None of these offer any serious interface problems and should not, therefore, be permitted to unduly influence the choice of blocks. Construction restraints must, of course, be taken into account, but they too must not be allowed to affect the basic block breakdown.
This very important point is only too frequently misunderstood. On a refinery site, for exam-ple, a delay in the process unit has hardly any effect on the effluent treatment plant except, of course, right at the end of the job.
In a similar way, the interrelationship at the design stage is often overemphasized. Design networks are usually confined to work in the various engineering departments and need not include such activities as planning and financial approvals or acceptance of codes and standards. These should preferably be obtained in advance by project management. Once the main flow sheets, plot plans and piping and instrument diagrams have been drafted (i.e., they need not even have been completed), design work can proceed in each block with a consider-able degree of independence. For example, the tank farm may be designed quite indepen-dently of the process unit or the NGL plant, etc. and the boiler house has little effect on the administration building or the jetties and loading station.
In the case of a single building being divided into blocks, the roof can be designed and detailed independently of the other floors or the basement, provided, of course, that the

136 Chapter 20
interface operations such as columns, walls, stairwell, lift shaft and service ducts have been located and more or less finalized. In short, therefore, the choice of blocks is made as early as possible, taking into account all or most of the factors mentioned before, with particular attention being given to design and construction requirements.
This split into blocks or work areas, of course, takes place in practice in any design office or site, whether the programme is geared to it or not. One is, in fact, only formalizing an already well-proven and established procedure. Depending on size, most work areas in the design office are serviced by squads or teams, even if they only consist of one person in each discipline who looks after that particular area. The fact that on a small project the person may look after more than one area does not change the principle; it merely means that the team is half an operator instead of one.
Natural breakdown into work areas is even more obvious on site. Most disciplines on a site are broken down into gangs, with a ganger or foreman in charge, and, depending again on size and complexity, one or more gangs are allocated to a particular area or block. On very large sites, a number of blocks are usually combined into a complete administrative centre with its own team of supervisors, inspectors, planners, subcontract administrators and site engineers, headed by an area manager.
No difficulty should, therefore, be experienced in obtaining the cooperation of an experienced site manager when the type, size and number of blocks are proposed. Indeed, this early discussion serves as an excellent opportunity to involve the site team in the whole planning process, the details of which are added later. By that time, the site team is at least aware of the principles and a potential communication gap, so frequently a problem among construction people, has been bridged.
Subdivision of Blocks
One major point that requires stressing covers the composition of a string of activities. It has already been mentioned that the site should be divided into blocks that are compatible with the design networks. However, each block could in itself be a very large area and a complex operational unit. It is necessary, therefore, to subdivide each block into logical units. There are various ways for doing this. The subdivision could be by: 1. Similar items of equipment 2. Trades and disciplines 3. Geographical proximity 4. Operational systems 5. Stages of completion
Each subdivision has its own merits and justifies further examination.

Planning Blocks and Subdivision of Blocks 137
Similar Items of Equipment
Here the network shows a series of strings that collect together similar items of equipment, such as pumps, tanks, vessels, boilers and roads. This is shown in Fig. 20.1.
Advantages: 1. Equipment items are quickly found. 2. Interface with design network is easily established.
Trades and Disciplines
This network groups the work according to type. It is shown in Fig. 20.2.
Advantages: 1. Suitable when it is desirable to clear a trade off the site as soon as completed and 2. Eases resource loading of individual trades.
Set pump
Erecttankbott.
Harden
Erectroof
Insulate
Hardening
Constructpad
Alignmotor
Erectshell
Erectexchanger
Castfounds.
Castfounds.
Castpipes
Constructbase
Excavate
Excavate
Excavate
Pump A
Tank A
Exchanger A
Pump B
Tank B
Exchanger B
Pump C
Tank C
Exchanger C
Figure 20.1Similar items of equipment.

138 Chapter 20
Geographical Proximity
It may be considered useful to group together activities that are geographically close to each other without further segregation into types or trades. This is shown in Fig. 20.3.
Advantages: 1. Makes a specific area self-contained and eases control. 2. Coincides frequently with natural subdivision on site for construction management.
Operational Systems
Here the network consists of all the activities associated with a particular system such as the boiler plant, the crude oil loading and the quarry crushing and screening. A typical system network is shown in Fig. 20.4.
Advantages: 1. Easy to establish and monitor the essential interrelationships of a particular system; 2. Particularly useful when commissioning is carried out by system since a complete
‘package’ can be programmed very easily; and 3. Ideal where stage completion is required.
Establishsite
RACKexcavate
PUMPSexcavate
BLG.excavate
Blg.founds
Blg.structure
Blg.finishes Panels
Carparks
Sub stn.struct
Electgear
Laycables
POND levelground
Excavatepond
Laydrains
Buildroads
Buildfootpaths
Concretepond Piping Testing
Shutter &reinf.
Shutterreinf.
Shutterreinf.
Castfounds
Castfounds
Erectsteel
Delivermachines
Erect H.machines
Erect L.machines
Electricconnect
Instrument
Commission
Laypipes
Figure 20.2Trades and disciplines.
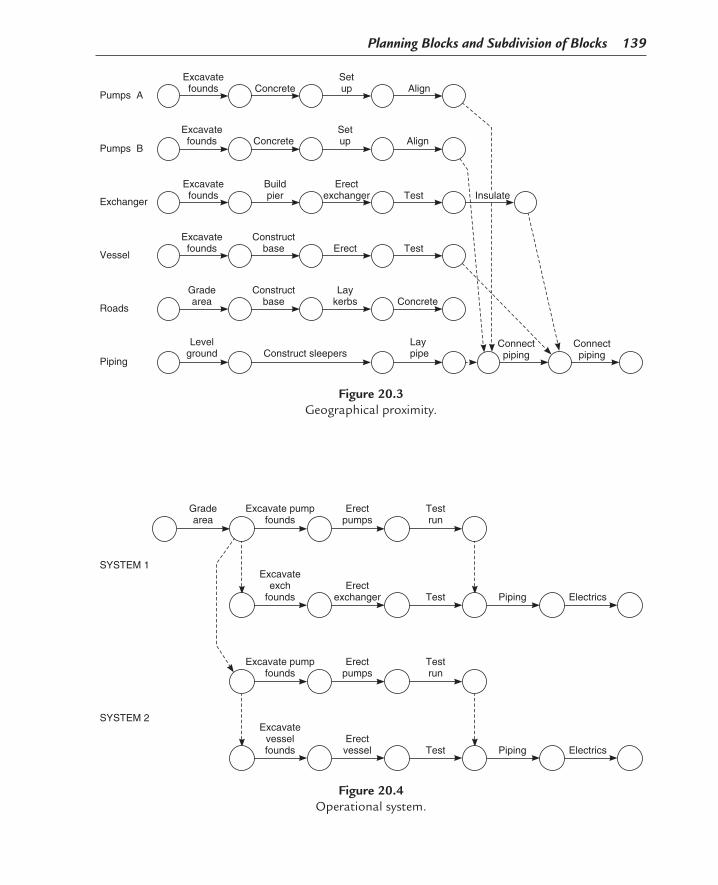
Planning Blocks and Subdivision of Blocks 139
Align
Align
Test
Test
Concrete
Laypipe
Setup
Setup
Erectexchanger
Erect
Laykerbs
Connectpiping
Connectpiping
Concrete
Concrete
Buildpier
Constructbase
Constructbase
Construct sleepers
Excavatefounds
Excavatefounds
Excavatefounds
Excavatefounds
Gradearea
Levelground
Pumps A
Pumps B
Exchanger
Vessel
Roads
Piping
Insulate
Figure 20.3Geographical proximity.
SYSTEM 1
SYSTEM 2
Gradearea
Excavate pumpfounds
Excavateexch
founds
Excavate pumpfounds
Excavatevesselfounds
Erectpumps
Erectexchanger
Erectpumps
Erectvessel
Testrun
Test
Testrun
Test
Piping
Piping
Electrics
Electrics
Figure 20.4Operational system.

140 Chapter 20
Stages of Completion
If particular parts of the site have to be completed earlier than others (i.e., if the work has to be handed over to the client in well-defined stages), it is essential that each stage is pro-grammed separately. There will, of course, be interfaces and links with preceding and suc-ceeding stages, but within these boundaries the network should be self-contained.
Advantages: 1. Attention is drawn to activities requiring early completion; 2. Predictions for completion of each stage are made more quickly; 3. Resources can be deployed more efficiently; and 4. Temporary shut-off and blanking-off operations can be highlighted.
In most cases, a site network is in fact a combination of a number of the earlier subdivisions. For example, if the boiler plant and water-treatment plant are first required to service an existing operational unit, it would be prudent to draw a network based on operational systems but also incorporating stages of completion. In practice, geographical proximity would almost certainly be equally relevant since the water-treatment plant and boiler plant would be adjacent.
It must be emphasized that the networks shown in Figs. 20.1–20.4 are representative only and do not show the necessary interrelationships or degree of detail normally shown in a practical construction network. The oversimplication on these diagrams may in fact contradict some of the essential requirements discussed in other sections of this book, but it is hoped that the main point, i.e., the differences between the various types of construction network formats, is highlighted.
Banding
If we study Fig. 20.1 we note that it is very easy to find a particular activity on the network. For example, if we wanted to know how long it would take to excavate the foundations of exchanger B, we would look down the column excavate until we found the line exchanger b, and the intersection of this column and line shows the required excavation activity. This simple identification process was made possible because Fig. 20.1 was drawn using very crude subdivisions or bands to separate the various operations.
For certain types of work, this splitting of the network into sections can be of immense assistance in finding required activities. By listing various types of equipment or materials vertically on the drawing paper and writing the operations to be performed horizontally, one produces a grid that almost defines the activity. In some instances, the line of operations may be replaced by a line of departments involved. For example, the involvement of electrical

Planning Blocks and Subdivision of Blocks 141
department in designing a piece of equipment can be found by reading across the equipment line until one comes to the electrical department column.
The principle is shown clearly in Fig. 20.5, and it can be seen that the idea can be applied to numerous types of networks. A few examples of banding networks are given in the following, but these are only for guidance since the actual selection of bands depends on the type of work to be performed and the degree of similarity of operation between the different equipment items.
Vertical Listing (Horizontal Line) Horizontal Listing (Vertical Column)
Equipment OperationsEquipment Departments
Material OperationsDesign stages Departments
Construction stages SubcontractsDecision stages Departments
Approvals Authorities (clients)Operations Department responsibilitiesOperations Broad time periods
It may, of course, be advantageous to reverse the vertical and horizontal bands; when considering, for example, the fifth item on the list, the subcontracts could be listed verti-cally and the construction stages horizontally. This would most likely be the case when the subcontractors perform similar operations since the actual work stages would then follow logically across the page in the form of normally timed activities. It may indeed be benefi-cial to draw a small trial network of a few (say, 20–30) activities to establish the best banding configuration.
It can be seen that banding can be combined with the coordinate method of numbering by simply allocating a group of letters of the horizontal coordinates to a particular band.
Banding is particularly beneficial on master networks which cover, by definition, a number of distinct operations or areas, such as design, manufacture, construction and commissioning. Fig. 20.5 is an example of such a network.
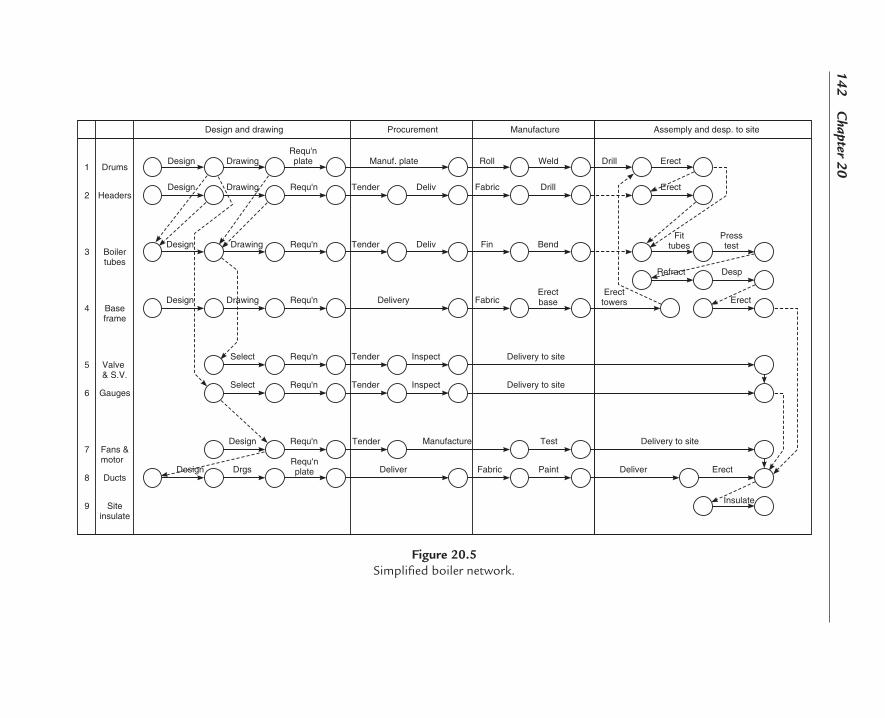
142 C
hapter 20Design
Design and drawing
Drums1
Headers2
Boilertubes
3
Baseframe
4
Valve& S.V.
5
Gauges6
Fans &motor
7
Ducts8
Siteinsulate
9
Procurement Manufacture Assemply and desp. to site
Design
Design
Design
Design
Drawing
Drawing
Drawing
Drawing
Select
Select
Design
Drgs
Requ'nplate
Requ'n
Requ'n
Requ'n
Requ'n
Requ'n
Requ'n
Requ'nplate
Manuf. plate
Tender
Tender
Delivery
Tender
Tender
Tender
Deliver
Deliv
Deliv
Inspect
Inspect
Manufacture
Roll
Fabric
Fin
Fabric
Fabric
Weld
Drill
Bend
Erectbase
Test
Delivery to site
Delivery to site
Paint
Drill
Erecttowers
Delivery to site
Deliver
Erect
Erect
Fittubes
Refract
Presstest
Desp
Erect
Erect
Insulate
Figure 20.5Simplified boiler network.
143Project Management, Planning and Control. http://dx.doi.org/10.1016/B978-0-08-102020-3.00021-8Copyright © 2017 Elsevier Ltd. All rights reserved.
CHAPTER 21
Arithmetical Analysis and Floats
Chapter OutlineArithmetical Analysis 143
Slack 144Float 145Total Float 145Calculation of Float 146Free Float 151The Concept of Free Float 151Interfering Float 153Independent Float 154
Notation 155Definitions 155
Critical Path 155Critical Chain Project Management 156
Arithmetical Analysis
This method is the classical technique and can be performed in a number of ways. One of the easiest methods is to add up the various activity durations on the network itself and writing the sum of each stage in a square box at the end of that activity, i.e., next to the end event (Fig. 21.1). It is essential that each route is examined separately and where the routes meet, the largest sum total must be inserted in the box. When the complete network has been summed in this way, the earliest starting will have been written against each event.
Now the reverse process must be carried out. The last event sum is now used as a base from which the activities leading into it are subtracted. The results of these subtractions are entered in the triangular boxes against each event (Fig. 21.2). Similar to the addition process for calculating the earliest starting times, a problem arises when a node is reached where two routes or activities meet. Since the latest starting times of an activity are required, the smallest result is written against the event.
The two diagrams are combined in Fig. 21.3. The difference between the earliest and latest times gives the ‘float’, and if this difference is zero (i.e., if the numbers in the squares and triangles are the same) the event is on the critical path.

144 Chapter 21
A table can now be prepared setting out the results in a concise manner (Table 21.1).
Slack
The difference between the latest and earliest times of any event is called ‘slack’. Since each activity has two events, a beginning event and an end event, it follows that there are two slacks for each activity. Thus, the slack of the beginning event can be expressed as TLB − TEB and called beginning slack, and the slack of the end event, appropriately called end slack, is TLE − TEE. The concept of slack is useful when discussing various types of float, since it simplifies the definitions.
0
13
A B3 8
C2
5
0
5
3
3
D
2
24
6
1311
4
1
E G
F7
14 1410
dumm
y
Figure 21.2Backward pass.
1 2 3 4 7
00
3
A B33 88
C
5
0
5
3
D
2
2
3
6
1311 11
4
1
E G
F7
14141010
Figure 21.3
0
13
A B C
3 8
25
0
5
3
3
3
D
2
24
6
4
11 1
E G
F7
1410
dumm
y
Figure 21.1Forward pass.
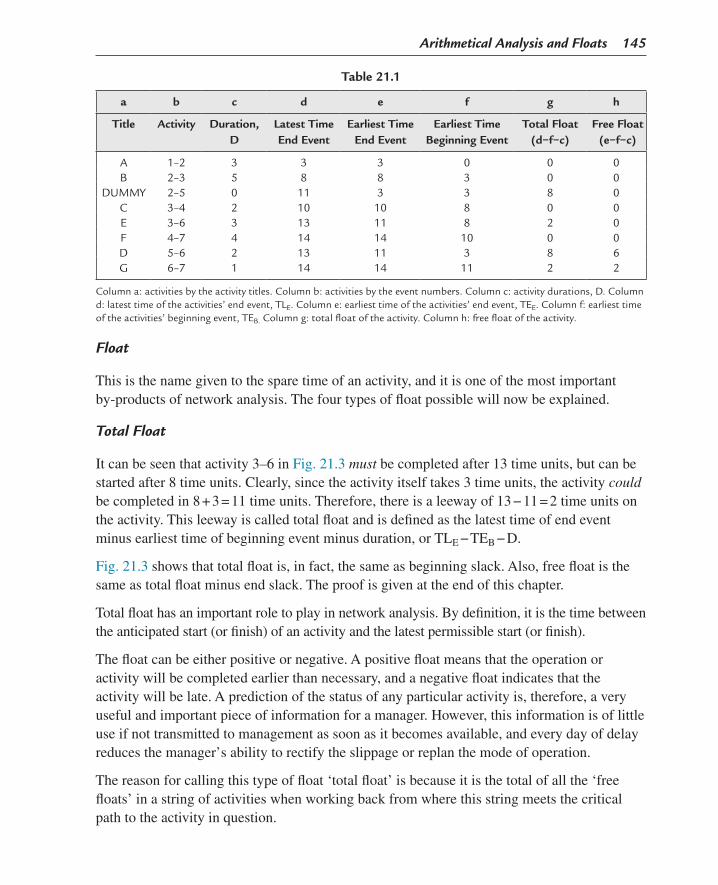
Arithmetical Analysis and Floats 145
Float
This is the name given to the spare time of an activity, and it is one of the most important by-products of network analysis. The four types of float possible will now be explained.
Total Float
It can be seen that activity 3–6 in Fig. 21.3 must be completed after 13 time units, but can be started after 8 time units. Clearly, since the activity itself takes 3 time units, the activity could be completed in 8 + 3 = 11 time units. Therefore, there is a leeway of 13 − 11 = 2 time units on the activity. This leeway is called total float and is defined as the latest time of end event minus earliest time of beginning event minus duration, or TLE − TEB − D.
Fig. 21.3 shows that total float is, in fact, the same as beginning slack. Also, free float is the same as total float minus end slack. The proof is given at the end of this chapter.
Total float has an important role to play in network analysis. By definition, it is the time between the anticipated start (or finish) of an activity and the latest permissible start (or finish).
The float can be either positive or negative. A positive float means that the operation or activity will be completed earlier than necessary, and a negative float indicates that the activity will be late. A prediction of the status of any particular activity is, therefore, a very useful and important piece of information for a manager. However, this information is of little use if not transmitted to management as soon as it becomes available, and every day of delay reduces the manager’s ability to rectify the slippage or replan the mode of operation.
The reason for calling this type of float ‘total float’ is because it is the total of all the ‘free floats’ in a string of activities when working back from where this string meets the critical path to the activity in question.
Table 21.1
a b c d e f g h
Title Activity Duration, D
Latest Time End Event
Earliest Time End Event
Earliest Time Beginning Event
Total Float (d−f−c)
Free Float (e−f−c)
A 1–2 3 3 3 0 0 0B 2–3 5 8 8 3 0 0
DUMMY 2–5 0 11 3 3 8 0C 3–4 2 10 10 8 0 0E 3–6 3 13 11 8 2 0F 4–7 4 14 14 10 0 0D 5–6 2 13 11 3 8 6G 6–7 1 14 14 11 2 2
Column a: activities by the activity titles. Column b: activities by the event numbers. Column c: activity durations, D. Column d: latest time of the activities’ end event, TLE. Column e: earliest time of the activities’ end event, TEE. Column f: earliest time of the activities’ beginning event, TEB. Column g: total float of the activity. Column h: free float of the activity.
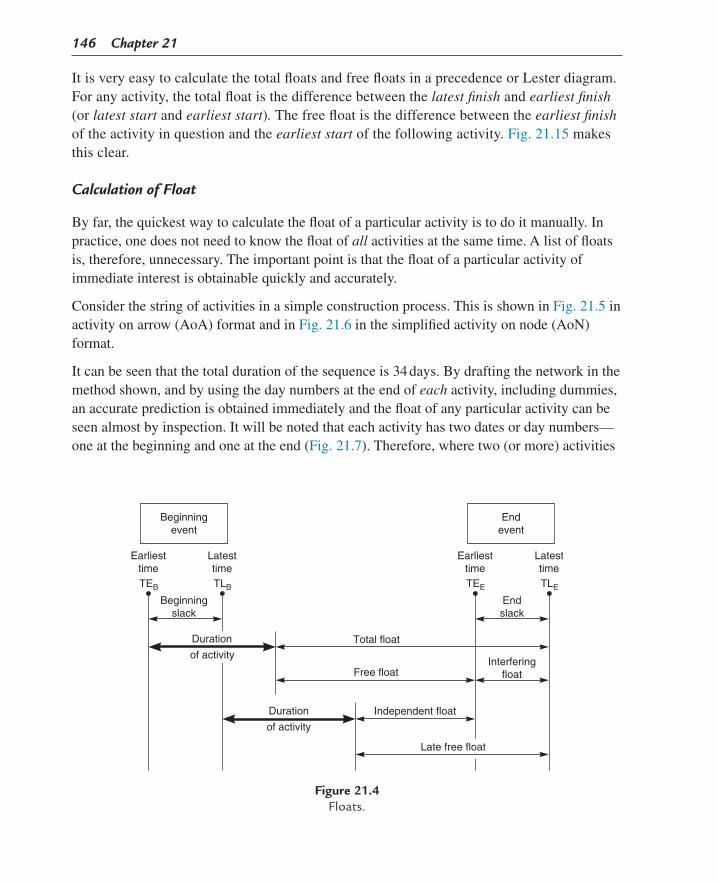
146 Chapter 21
It is very easy to calculate the total floats and free floats in a precedence or Lester diagram. For any activity, the total float is the difference between the latest finish and earliest finish (or latest start and earliest start). The free float is the difference between the earliest finish of the activity in question and the earliest start of the following activity. Fig. 21.15 makes this clear.
Calculation of Float
By far, the quickest way to calculate the float of a particular activity is to do it manually. In practice, one does not need to know the float of all activities at the same time. A list of floats is, therefore, unnecessary. The important point is that the float of a particular activity of immediate interest is obtainable quickly and accurately.
Consider the string of activities in a simple construction process. This is shown in Fig. 21.5 in activity on arrow (AoA) format and in Fig. 21.6 in the simplified activity on node (AoN) format.
It can be seen that the total duration of the sequence is 34 days. By drafting the network in the method shown, and by using the day numbers at the end of each activity, including dummies, an accurate prediction is obtained immediately and the float of any particular activity can be seen almost by inspection. It will be noted that each activity has two dates or day numbers—one at the beginning and one at the end (Fig. 21.7). Therefore, where two (or more) activities
Beginningevent
EarliesttimeTEB
EarliesttimeTEE
LatesttimeTLB
LatesttimeTLE
Endevent
Beginningslack
Endslack
InterferingfloatFree float
Independent float
Total floatDuration
of activity
Duration
of activity
Late free float
Figure 21.4Floats.
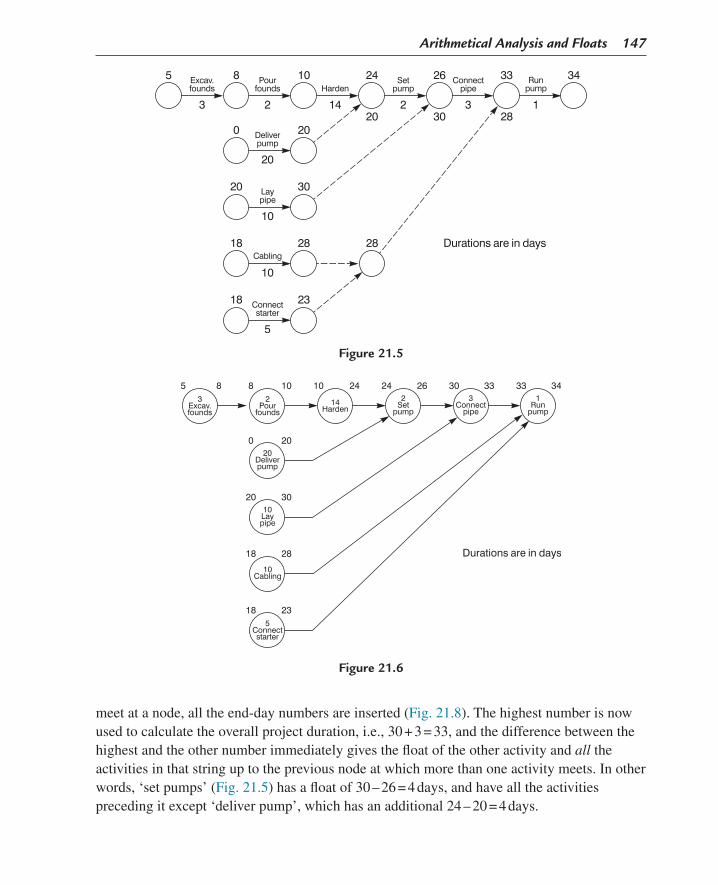
Arithmetical Analysis and Floats 147
meet at a node, all the end-day numbers are inserted (Fig. 21.8). The highest number is now used to calculate the overall project duration, i.e., 30 + 3 = 33, and the difference between the highest and the other number immediately gives the float of the other activity and all the activities in that string up to the previous node at which more than one activity meets. In other words, ‘set pumps’ (Fig. 21.5) has a float of 30 – 26 = 4 days, and have all the activities preceding it except ‘deliver pump’, which has an additional 24 – 20 = 4 days.
Figure 21.5
Figure 21.6

148 Chapter 21
If, for example, the electrical engineer needs to know for how long he can delay the cabling because of an emergency situation on another part of the site, without delaying the project, he can find the answer right away. The float is 33 – 28 = 5 days. If the labour he needs for the emergency can be drawn from the gang erecting the starters, he can gain another 28 – 23 = 5 days. This gives him a total of 10 days’ grace to start the starter installation without affecting the total project time.
A few practice runs with small networks will soon emphasize the simplicity and speed of this method. We have in fact only dealt in this exposition with small—indeed, tiny—networks. How about large ones? It would appear that this is where the computer is essential, but, in fact, a well-drawn network can be analysed manually just as easily, whether it is large or small. Provided the very simple base rules are adhered to, a very fast-forward pass can be inserted. The float of any string can then be seen by inspection, i.e., by simply subtracting the lower node number from the higher node number, which forms the termination point of the string in question. This point can be best illustrated by the example given in Fig. 21.9. For simplicity, the activities have been given letters instead of names, since the importance lies in understanding the principle, and the use of letters helps to identify the string of activities. In this example, there are 50 activities. Normally, a practical network should have between 200 and 300 activities maximum (i.e., 4–6 times the number of activities shown), but this does not pose any greater problem. All the times (day numbers) were inserted, and the floats of activi-ties in strings A, B, C, E, F, G and H were calculated in 5 minutes. A 300-activity network would, therefore, take 30 minutes.
It can in fact be stated that any practical network can be ‘timed’, i.e., the forward pass can be inserted and the important float reported in 45 minutes. It is, furthermore, very easy to find the
Figure 21.7
3326
30
24
20
10
0
Connectpipe
SetpumpHarden
Deliverpump
3214
10
3020 Laypipe
10
Figure 21.8

Arithmetical Analysis and Floats 149
critical path. Clearly, it runs along the strings of activities with the highest node times. This is most easily calculated by working back from the end. Therefore the path runs through Aj, Ah, dummy, Dh, Dg, Df, De, Dd, Dc, Db and Da.
An interesting little problem arises when calculating the float of activity Ce, since there are two strings emanating from the end node of that activity. By conventional backward pass methods—and indeed this is how a computer carries out the calculation—one would insert the backward pass in the nodes starting from the end (see Fig. 21.10). When arriving at Ce,
A
B
C
D
E
F
G
H
Aa
Ba
Ca
Da
Ea
Fa
Ga
Ha
Ab
Bb
Cb
Db
Eb
Fb
Gb
Hb
Ac
Bc
Cc
Dc
Fc
Gc
Hc
Ad
Cd
Dd
Fd
Gd
Ae
Ce
De
Ec
Fe
Af
Cf
Df
Ed
Ge
Ag
Cg
Dg Dh
Ee
Gf Gg
Ah
EgEf
Gh
Aj
2
1
9
15
10
3
1
8
3
7
2
6
1
6
2
4
2
4
7
2
7
5
2
6
1
4
4
10
4
2
9
12
10
7
8
7
6
2
8
5
8 2
4
6 4
343653
3
12
3
4
0
0
0
0
0
0
0
0
2
1
9
15
10
3
1
8
5
8
11
21
11
9
3
12
7
12
18
23
11 36
16
8
14
14
13
19
27
11
20
12
17
21
19
23
30
30
24Duration in days
28
29
43
27
32
36
34
51
33
38
36
53
35
42
56
36
45
60
45
32
Figure 21.9
Figure 21.10

150 Chapter 21
one finds that the latest possible time is 40 when calculating back along string Cg–Cf, while it is 38 when calculating back along string Ag–Af. Clearly, the actual float is the difference between the earliest date and the earliest of the two latest dates, i.e., day 38 instead of day 40. The float of Ce is therefore 38 – 21 = 17 days.
As described earlier, the calculation is tedious and time-consuming. A far quicker method is available by using the technique shown in Fig. 21.9, i.e., one simply inserts the various forward passes on each string and then looks at the end node of the activity in question—in our case, activity Ce. It can be seen by following the two strings emanating from Ce that string Af–Ag joins Ah at day 36. String Cf–Cg, on the other hand, joins Ah at day 34. The float is, therefore, the smallest difference between the highest day number and one of the two day numbers just mentioned. Therefore, the float of activity Ce is 53 − 36 = 17 days. Cf and Cg, of course, have a float of 53 − 34 = 19 days.
The time required to inspect and calculate the float by the second method is literally only a few minutes. All one has to do is to run through the paths emanating from the end node of the selected activity and note the highest day number where the strings meet the critical path. The difference between the day number of the critical string and the highest number on the tributary strings (emanating from the activity in question) is the float.
Suppose we now wish to find the float of activity Gb:
Follow string Fd–FeFollow string Gc–Gd–GeFollow string Gf–Gg–GhFollow string Ef–Eg–AhFe and Gd meet at Ge; therefore, they can be ignored.
String Gf–Gh meets Aj at day 45String Ef–Eg meets Ah at day 36
Therefore the float is either 56 − 45 = 11or 53 − 36 = 17
Clearly, the correct float is 11 since it is the smaller of the two. The time taken to inspect and calculate the float was exactly 21 seconds.
All the floats calculated earlier were total floats. Free float can only occur on activities entering a node when more than one enters that node. It can be calculated very easily by subtracting the total float of the incoming activity from the total float of the outgoing activity, as shown in Fig. 21.11. It should be noted that one of the activities entering the node must have zero free float.
When more than one activity leaves a node, the value of the free float to be subtracted is the lowest of the outgoing activity floats, as shown in Fig. 21.12.

Arithmetical Analysis and Floats 151
Free Float
Some activities, e.g., 5–6, (Fig. 21.13) as well as having total float have an additional leeway. It will be noted that the activities 3–6 and 5–6 both affect the activity 6–7. However, one of these two activities will delay 6–7 by the same time unit by which it itself may be delayed. The remaining activity, on the other hand, may be delayed for a period without affecting 6–7. This leeway is called free float, and can only occur in one or more activities where several of them meet at one event, i.e., if x activities meet at a node, it is possible that x – 1 of these have free float. This free float may be defined as earliest time of end event minus earliest time of beginning event minus duration, or TEE − TEB − D.
The Concept of Free Float
Students often find it difficult to understand the concept of free float. The mathematical defini-tions are unhelpful, and the graphical representation of Fig. 21.4 can be confusing. The easiest way to understand the difference between total and free float is to inspect the end node of the activity in question. As stated earlier, free float can only occur where two or more activities enter a node. If the earliest end times (i.e., the forward pass) for each individual activity are placed against the node, the free float is simply the difference between the highest number of the earliest time on the node and the number of the earliest time of the activity in question.
In the example given in Fig. 21.13, the earliest times are placed in squares; so following the same convention it can be seen from the figure (which is a redrawing of Fig. 21.1 with all the earliest and latest node times added) that:
Figure 21.11
Figure 21.12

152 Chapter 21
Fig. 21.14 shows the equivalent precedence (AoN) diagram from which the free float can be easily calculated by subtracting the early finish time of the preceding node from the early start time of the succeeding node.
Free float of activity D = 11 − 5 = 6.
Free float of activity G = 14 − 12 = 2.
Activity E, because it is not on the critical path, has total float of 13 − 11 = 2 but has no free float.
The check of the free float by the formal definition is as follows:
Free float = TEE − TEB − DFor activity D = 11 − 3 − 2 = 6For activity G = 14 − 11 − 1 = 2
The check of the total float by the formal definitions is given as follows:
Total float = TLE − TEB − DFor activity E = 13 − 8 − 3 = 2D = 13 − 3 − 2 = 8G = 14 − 11 − 2 = 2
0
0
13
A B C
3
3
8
8
25
0
5
53
3
310
D
2
24
6
4
11
11
11
13
1
E G
F7
12
14
14
10
10
dumm
y
Figure 21.13
0 3 3 3 2
2
2 2
4
0
14
14
10 10
100 3 3
8
8
8
10
10
83
3 3
11
111 11 12
1313 13 14
11-5 = 6
8
8
5
5
0 0
A B
D E G
C F
FF
Figure 21.14

Arithmetical Analysis and Floats 153
It was stated earlier that the total float is the same as beginning slack. This can be shown by rewriting the definition of total float = TLE − TEB − D as total float = TLE − D − TEB but TLE − D = TLB. Therefore:
Total float = TLB − TEB
= Beginning slack
To show that free float = total float − end slack, consider the following definitions:
Free float = TLE − TEB − D (21.1)
Total float = TLE − TEB − D (21.2)
End slack = TLE − TEE (21.3)
Subtracting Eq. (21.3) from Eq. (21.2):
= TLE − TEB − D − TLE − TEE
= TLE − TEB − D − TLE + TEE
= TEE − TEB − D= Free float
Therefore:
Eq. (21.1) = Eq. (21.2) − Eq. (21.3) or free float = total float − end slack.
If a computer is not available, free float on an arrow diagram can be ascertained by inspec-tion, since it can only occur when more than one activity meets a node. This was described in detail earlier with Figs. 21.5 and 21.6. If the network is in the precedence format, the calculation of free float is even easier. All one has to do is to subtract the early finish time in the preceding node from the early start time of the succeeding node. This is clearly shown in Fig. 21.15, which is the precedence equivalent to Fig. 21.5.
One of the phenomena of a computer printout is the comparatively large number of activities with free float. Closer examination shows that the majority of these are in fact dummy activities. The reason for this is, of course, obvious, since, by definition, free float can only exist when more than one activity enters a node. As dummies nearly always enter a node with another (real) activity, they all tend to have free float. Unfortunately, no computer program exists that automatically transfers this free float to the preceding real activity, so the benefit of the free float is not immediately apparent and is consequently not taken advantage of.
Interfering Float
The difference between the total and free float is known as interfering float. Using the previ-ous notation, this can be expressed as,
(TLE−TEB−D)− (TEE−TEB−D) = TLE−TEB−D−TEE + TEB + D= TLE−TEE

154 Chapter 21
i.e., as the latest time of the end event minus the earliest time of the end event. It is, therefore, the same as the end slack.
Independent Float
The difference between the free float and the beginning slack is known as independent float:
Since free float = TEE − TEB − DBeginning slack = TLB − TEB
Independent float = TEE − TEB − D − (TLB − TEB)
= TEE − TEB − D
This problem does not exist with precedence diagrams as there are no dummy activities in this network format.
Thus, independent float is given by the earliest time of the end event minus the latest time of the beginning event minus the duration.
In practice, neither the interfering float nor the independent float finds much application, and for this reason they will not be referred to in later chapters. The use of computers for network analysis enables these values to be produced without difficulty or extra cost, but they only tend to confuse the user and are therefore best ignored.
Summarizing all the earlier definitions, Fig. 21.4 and the following expressions can be of assistance.
Figure 21.15

Arithmetical Analysis and Floats 155
NotationDB = duration of activityTEB = earliest time of beginning eventTEE = earliest time of end eventTLB = latest time of beginning eventTLE = latest time of end event
Definitions
Beginning slack = TLB − TEB
End slack = TLE − TEE
Total float = TLE − TEB − D
Free float = TEE − TEB − DInterfering float = TLE − TLB (end slack)Independent float = TEE − TLB − DLast free float = TLE − TLB − D
Because float is such an important part of network analysis and because it is frequently quoted—or misquoted—by computer protagonists as another reason why computers must be used, a special discussion of the subject may be helpful to those readers not too familiar with its use in practice.
Of the three types of float shown on a printout, i.e., the total float, free float and independent float, only the first—the total float—is in general use. Where resource smoothing is required, knowledge of free float can be useful, since the activities with free float can be moved back-wards or forwards in time without affecting any other activity. Independent float, on the other hand, is really quite a useless piece of information and should be suppressed (when possible) from any computer printout. Of the many managers, site engineers and planners interviewed, none has been able to find a practical application of independent float.
Critical Path
Some activities have zero total float, i.e., no leeway is permissible for their execution, and hence any delays incurred on the activities will be reflected on the overall project duration. These activities are therefore called critical activities, and every network has a chain of such critical activities running from the beginning event of the first activity to the end event of the last activity, without a break. This chain is called the critical path.
A project network has more than one critical path frequently, i.e., two or more chains of activities all have to be carried out within the stipulated duration to avoid a delay to the completion date. In addition, a number of activity chains may have only one or two units of float, therefore, for all intents and purposes, they are also critical. It can be seen, therefore, that it is important to keep an eye on all activity chains that are either critical or near-critical, since a small change in duration of one chain could quickly alter the priorities of another.
156 Chapter 21
One disadvantage of the arithmetical method of analysis using the table or matrix shown in Table 21.1 is that all the floats must be calculated before the critical path can be ascertained. This method (which has only been included for historical interest) is very laborious and is therefore not recommended.
In any case, this drawback is eliminated when the method of analysis shown in Fig. 21.9 is employed.
Critical Chain Project Management
This planning technique differs from conventional CPA in that resource restraints and depen-dencies are considered as well as operation logic. This requires buffers to be introduced to allow for possible resource issues. Progress monitoring can then be carried out by measuring the rate at which the buffers are used up instead of just recording the individual task performance.
In practice, this method is probably most appropriate where resources are not easily assess-able at the planning stage. Contingencies in the form of buffers must therefore be incorpo-rated with the result that the overall duration will probably be longer, and as a consequence the planned completion date will more likely be met.
In the construction industry, where the program completion date is often set by the client, i.e., the opening of a venue or start of production, the project program will be based on the construction logic of the operational activities, which must then be provided with the neces-sary resources (plant, material and labour) to carry out the work. It is inconceivable that at the start of a project a contractor in the construction industry would tell his or her client that the project cannot be completed by the specified date because the necessary resources cannot be obtained.

157Project Management, Planning and Control. http://dx.doi.org/10.1016/B978-0-08-102020-3.00022-XCopyright © 2017 Elsevier Ltd. All rights reserved.
CHAPTER 22
The Case for Manual Analysis
Chapter OutlineThe Planner 157The Role of the Computer 158Preparation of the Network 158Typical Site Problems 160The National Economic Development Office Report 161
Although network analysis is applicable to almost every type of organization, as shown by the examples in Chapter 29, most of the planning functions described in this book have been confined to those related to engineering construction projects. The activities described cover the full spectrum of operations from the initial design stage, through detailing of drawings and manufacture, up to and including construction, in other words, from conception to handover.
In this age of specialization, there is a trend to create specialist groups to do the work previ-ously carried out by the members of more conventional disciplines. One example is teaching, where teaching methods, previously devised and perfected by practising teachers, are now developed by a new group of people called educationalists.
Another example of specialization is planning. In the days of bar charts, planning was carried out by engineers or production staff using well-known techniques to record their ideas on paper and transmit them to other members of the team. Nowadays, however, the specialist planner or scheduler has come to the fore, leaving the engineer time to get on with engineering.
The Planner
Planning, in its own right, does not exist. It is always associated with another activity or operation, i.e., design planning, construction planning, production planning, etc. It is logical, therefore, that a design planner should be or should have been a designer, a construction planner should be familiar with construction methods and techniques and a production planner should be knowledgeable in the process and manufacturing operations of production – whether it be steelwork, motors cars or magazines.
In construction, as long as the specialist planner has graduated from one of the accepted engineering disciplines and is familiar with the problems of a particular project, a realistic

158 Chapter 22
network can be probably produced. By calling in specialists to advise in the fields with which the engineer not completely conversant, it can be ensured that the network will be received with confidence by all the interested parties.
The real problem arises when the planner does not have the right background, i.e., when he or she has not spent a time designing or has not experienced the holdups and frustrations of a construction site. Strangely enough, the less familiar a planner is with the job being planned, the less is the inclination to seek help. This may well be due to the engineer’s inability to ask the right questions, or reluctance to discuss technical matters for fear of revealing the personal lack of knowledge. One thing is certain: A network that is not based on sound technical knowledge is not realistic, and an unrealistic network is dangerous and costly, since decisions may well be made for the wrong reasons.
All that has been said so far is a truism that can be applied not only to planning but to any human activity where experts are required in order to achieve the acceptable results. However, in most disciplines, it does not take long for the effects of an inexperienced assistant to be discovered, mainly because the results of the work done can be monitored and assessed within a relatively short time period. In planning, however, the effects of a programme decision may not be felt for months, so it may be very difficult to ascertain the cause of the subsequent problem or failure.
The Role of the Computer
Unfortunately, the use of computers has enabled inexperienced planners to produce impres-sive outputs that are frequently utterly useless. There is a great danger in shifting the empha-sis from the creation of the network to the analysis and report production of the machine, so that many people believe that to carry out an analysis of a network one must have a computer. In fact, the computer is only a sophisticated number cruncher. It does not see the whole picture, including access problems, political or cultural restraints, labour issues and staff idiosyncrasies. The kernel of network analysis is the drafting, checking, refining and redraft-ing of the network itself, an operation that must be carried out by a team of experienced participants of the job being planned. To understand this statement, it is necessary to go through the stages of network preparation and subsequent updating.
Preparation of the Network
The first function of the planner in conjunction with the project manager is to divide the project into manageable blocks. The name is appropriate since, like building blocks, they can be handled individually and shaped to suit the job but are still only a part of the whole structure to be built.
The Case for Manual Analysis 159
The number and size of each block is extremely important since, if correctly chosen, a block can be regarded as an entity that suits both the design and the construction phases of a project. Ideally, the complexity of each block should be about the same, but this is rarely possible in practice since other criteria such as systems and geographical location have to be considered. If a block is very complex, it can be broken down further, but a more convenient solution may be to produce more than one network for such a block. The aim should be to keep the number of activities down to 200–300, so that they can be analysed manually if necessary.
As the planner sketches his or her logic roughly, and in pencil on the back of an old drawing, the construction specialists are asked to comment on the type and sequence of the activities. In practice, these sessions – if properly run – generate an enthusiasm that is a delight to experience. Often consecutive activities can be combined to simplify the network, thus easing the subsequent analysis. Gradually, the job is ‘built’, difficulties are encountered and over-come, and even specialists who have never been involved in network planning before are carried away by this visual unfolding of the programme.
The next stage is to ask each specialist to suggest the duration of the activities in his disci-pline. These are entered onto the network without question. Now comes the moment of truth. Can the job be built on time? With all the participants present, the planner adds up the dura-tions and produces the forward pass. Almost invariably, the total time is longer than the deadlines permit. This is when the real value of network analysis emerges. Logics are re-examined, durations are reduced and new construction methods are evolved to reduce the overall time. When the final network – rough though it may be – is complete, a sense of achievement can be felt pervading the atmosphere.
This procedure, which is vital to the production of a realistic programme, can, of course, only be carried out if the ‘blocks’ are not too large. If the network has more than 300 activities, it may well pay the planner or project manager to re-examine that section of the programme with a view to dividing it into two smaller networks. If necessary, it is always possible to draw a master network, usually quite small, to link the blocks together.
One of the differences between the original program evaluation & revue technique program and the normal CPM programs was the facility to enter three time estimates for every activity. The purpose of the three estimates is to enable the computer to calculate and subsequently use the most probable time, on the assumption that the planner is unwilling or unable to commit to one time estimate. The actual duration used is calculated from the expression known as the β distribution:
te =
a + 4m + b
6
where te is the expected time, a the optimistic time, b the pessimistic time and m the most likely time.

160 Chapter 22
However, this degree of sophistication is not really necessary, since the planner can insert what the most probable time considered. For example, a foreman, upon being pressed, estimated the times for a particular operation to be:
Optimistic = 5 daysPessimistic = 10 daysProbable = 7 days
The planner will probably insert 7 days or 8 days. The computer, using the earlier distribution, would calculate:
tc = 5 + (4 × 7) + 106
= 7.16 days
With the much larger variables found in real-life projects, such finesse is a waste of time. A single time estimate by an experienced planner is all that is required.
Typical Site Problems
Once construction starts, problems begin to arise. Drawings or other data arrive late on-site, materials are delayed, equipment is held up, labour becomes scarce or goes on strike, under-ground obstructions are found, the weather deteriorates, etc.
Each new problem must be examined in the light of the overall project programme. It will be necessary to repeat the initial planning meeting to revise the network, to reflect on these problems and to possibly help reduce their effects. It is at these meetings that ingenious innovations and solutions are suggested and tested.
For example, Fig. 22.1 shows the sequence of a section of a pipe rack. Supposing the delivery of pipe will be delayed by four weeks, completion now looks like week 14. However, some-one suggests that the pump bases can be cast early with starter bars bent down to bond the plinths at a later date. The new sequence appears in Fig. 22.2. Completion time is now only week 11, a saving of 3 weeks.
0 Erectsteel
Deliverpipe
Erectpipe
Removecrane
Cast basesand plinthsunder rack
Duration in weeks
2
2
2
3
5 6 10
1
Figure 22.1

The Case for Manual Analysis 161
This type of approach is the very heart of successful networking and keeps the whole pro-gramme alive. It is also very rapid. The very act of discussing problems in the company of interested and knowledgeable colleagues generates an enthusiasm that carries the project forward. With good management, this momentum is passed right down the line to the people who are actually doing the work at the sharp end.
The National Economic Development Office Report
Perhaps the best evidence that networks are most effective when kept simple is given by the National Economic Development Office (NEDO) report, which is still applicable today even though it was produced way back in the early 1980s.
The relevant paragraphs are reproduced in the following by permission of Her Majesty’s Stationery Office. 1. Even if it is true that UK clients build more complex plants, it should still be possible to plan
for and accommodate the extra time and resources this would entail. By and large the UK projects were more generously planned but, none the less, the important finding of the case studies is that, besides taking longer, the UK projects tended also to encounter more overrun against planned time. There was no correlation across the case studies between the sophistica-tion with which programming was done and the end result in terms of successful completion on time. On the German power station the construction load represented by the size and height of the power station was considerable, but the estimated construction time was short and was achieved. This contrasts with the UK power stations, where a great deal of effort and sophisti-cation went into programming, but schedules were overrun. On most of the case studies, the plans made at the beginning of the project were thought realistic at that stage, but they varied in their degree of sophistication and in the importance attached to them.
2. One of the British refineries provided the one UK example where the plan was recog-nized from the start by both client and contractor to be unrealistic. None the less, the contractor claimed that he believed planning to be very important, particularly in the circumstances of the United Kingdom, and the project was accompanied by a wealth of data collection. This contrasts with the Dutch refinery project where planning was clearly effective but where there was no evidence of very sophisticated techniques.
0 Erectsteel
Deliver pipe
Erectpipe
Castplinths
Removecrane
Castbases
Hard’ngtime
2
2
2 + 4 = 6
3
3 3
6 7 10 11
1 11
Figure 22.2
162 Chapter 22
There is some evidence in the case studies to suggest that UK clients and contractors put more effort into planning, but there is no doubt that the discipline of the plan was more easily maintained on the foreign projects. Complicated networks are useful in developing an initial programme, but subsequently, though they may show how badly one has done, they do not indicate how to recover the situation. Networks need, there-fore, to be developed to permit simple rapid updates, pointing where action must be taken. Meanwhile the evidence from the foreign case studies suggests that simple techniques, such as bar charts, can be successful.
3. The attitudes to planning on UK1 and the Dutch plant were very different, and this may have contributed to the delay of UK1 although it is impossible to quantify the effect. The Dutch contractor considered planning to be very important, and had two site planning engineers attached to the home office during the design stage. The programme for UK1 on the other hand was considered quite unrealistic by both the client and the contractor, not only after the event but while the project was under way, but neither of them consid-ered this important in itself.
In the case of UK1, it was not until the original completion date arrived that the construction was rescheduled to take 5 months longer. At this point, the construction was only 80% com-plete and in the event there was another 8 month’s work to do. Engineering had been 3 months behind schedule for some time. A wealth of progress information was being collected but no new schedule appears to have been made earlier.
Progress control and planning was clearly a great deal more effective on the Dutch project; the contractor did not believe in particularly sophisticated control techniques, however.
Clearly, modern computer programs are more sophisticated and user-friendly, and have far greater functionality, but it is precisely because these programs are so attractive that there is a risk of underestimating, or even ignoring, the fundamental and relatively simple planning process described earlier in this chapter.

163Project Management, Planning and Control. http://dx.doi.org/10.1016/B978-0-08-102020-3.00023-1Copyright © 2017 Elsevier Ltd. All rights reserved.
CHAPTER 23
Lester Diagram
Chapter OutlineBasic Advantages 166
With the development of the network grid, the drafting of an arrow diagram enables the activities to be easily organized into disciplines or work areas and eliminates the need to enter reference numbers into the nodes. Instead, the grid reference numbers (or letters) can be fed into the computer. The grid system also makes it possible to produce acceptable arrow diagrams on a computer that can be used ‘in the field’ without converting them into the conventional bar chart. An example of a computer-generated arrow diagram is shown in Fig. 23.1. It can be noticed that the link lines never cross the nodes.
A grid system can, however, pose a problem when it becomes necessary to insert an activity between two existing ones. In practice, resourceful planners can overcome the problem by combining the new activity with one of the existing activities.
If, for example, two adjoining activities were ‘Cast Column, 4 days’ and ‘Cast Beam, 2 days’, and it was necessary to insert ‘Strike Formwork, 2 days’ between the two activities, the planner would simply restate the first activity as ‘Cast Column and Strike Formwork, 6 days’ (Fig. 23.2).
While this overcomes the drafting problem, it may not be acceptable from a cost-control point of view, especially if the network is geared to an earned value analysis (EVA) system (see Chapter 32). Furthermore, the fact that the grid numbers were on the nodes meant that when it was necessary to move a string along one or more grid spaces, the relationship between the grid number and the activity changed. This could complicate the EVA analysis. To overcome this, the grid number was placed between the nodes (Fig. 23.3).
It can be argued that a precedence network lends itself admirably to a grid system, because the grid number is always and permanently related to the activity and is therefore ideal for EVA. However, the problem of the congested link lines (especially the vertical ones) remains.
Now, however, the perfect solution has been found. It is in fact a combination of the arrow diagram and precedence diagram, and like the marriage of Henry VII, which ended the Wars of the Roses, this marriage should end the war of the networks!
The new diagram, which could be called the ‘Lester’ diagram, is simply an arrow diagram where each activity is separated by a short link in the same way as in a precedence network (Fig. 23.4).

164 Chapter 23
Figure 23.2
Figure 23.1Activity on arrow network drawn on grid.
In this way, it is possible to eliminate or at least reduce logic errors, show total float and free float as easily as in a precedence network, but it has the advantages of an arrow diagram in speed of drafting, clarity of link presentation and the ability to insert new activities in a grid system without altering the grid number–activity relationship. Fig. 23.5 shows all these features.

Lester Diagram 165
Figure 23.3
Figure 23.4Lester diagram principle.
Figure 23.5Lester diagram.

166 Chapter 23
If a line or box is drawn around any activity, the similarity between the Lester diagram and precedence diagram becomes immediately apparent (see Fig. 23.6).
Although all the examples in subsequent chapters use arrow diagrams, or precedence diagrams, ‘Lester’ diagrams could be substituted in most cases. The choice of technique is largely one of personal preference and familiarity. Provided the user is satisfied with one system and is able to extract the maximum benefit, there is little point in changing to another.
Basic Advantages
The advantages of a Lester diagram are: 1. Faster to draw than precedence diagram – about the same speed as an arrow diagram; 2. As in a precedence diagram: a. Total float is vertical difference; b. Free float is horizontal difference; 3. Room under arrow for duration and total float value; 4. Logic lines can cross the activity arrows; 5. Requires less space on paper when drafting the network; 6. Good for examinations due to speedy drafting and elimination of node boxes; 7. Can be updated for progress by ‘redding’ up activity arrows as arrow diagram; 8. Uses same procedures for computer inputting as precedence networks; 9. Output from computer similar to precedence network; 10. Can be used on a grid; 11. Less chance of error when calculating backward pass due to all lines emanating from one
node point instead of one of the four sides of a rectangular node; 12. Shows activity as flow lines rather than points in time; 13. Looks like an arrow diagram, but is in fact more like a precedence diagram; 14. No risk of individual link lines being merged into a thick black line when printed out and 15. No possibility of creating the type of logic error often associated with ladders.
Figure 23.6

167Project Management, Planning and Control. http://dx.doi.org/10.1016/B978-0-08-102020-3.00024-3Copyright © 2017 Elsevier Ltd. All rights reserved.
CHAPTER 24
Graphical and Computer Analysis
Graphical Analysis
It is often desirable to present the programme of a project in the form of a bar chart, and when the critical path and floats are found by either arithmetical or computer methods, the bar chart has to be drawn as an additional task. (Most computer programs can actually print a bar chart, but these often run to several sheets.)
As explained in Chapter 30, bar charts, while they are not as effective as networks for the actual planning function, are still one of the best methods for allocating and smoothing resources. If resource listing and subsequent smoothing is an essential requirement, graphical analysis can give the best of both worlds. Naturally, any network, however analysed, can be converted very easily into a bar chart, but if the network is analysed graphically the bar chart can be ‘had for free’, as it were.
Modern computer programs will of course almost automatically produce the bar charts (or Gantt charts) from the inputs. Indeed, the input screen itself often generates the bar chart as the data are entered. However, when a computer is not available or the planner is not conver-sant with the particular computer program, the graphical method becomes a useful alternative.
The following list gives some of the advantages over other methods, but before the system is used on large jobs, planners are strongly advised to test it for themselves on smaller contracts so that they can appreciate the shortcut methods and thus save even more planning time. 1. The analysis is extremely rapid, much quicker than the arithmetical method. This is
especially the case when, after some practice, the critical path can be found by inspection. 2. As the network is analysed, the bar chart is generated automatically and no further labour
need be expended to do this at a later stage.
Chapter OutlineGraphical Analysis 167
Limitations 168Time for Analysis 171
Computer Analysis 174History 174
The PC 175Programs 176

168 Chapter 24
3. The critical path is produced before the floats are known. (This is in contrast to the other methods, where the floats have to be calculated first before the critical path can be seen.) The advantage of this is that users can see at once whether the project time is within the specified limits, permitting them to make adjustments to the critical activities without bothering about the uncritical ones.
4. Since the results are shown in bar chart form, they are more readily understood by persons familiar with this form of programme. The bar chart will show the periods of heavy resource loading more vividly compared to a printout, and highlights the periods of comparative inactivity. Smoothing is therefore much more easily accomplished.
5. By marking the various trades or operational types in different colours, a rapid approxi-mate resource-requirement schedule can be built up. The resources in any one time period can be ascertained by simply adding up vertically, and any smoothing can be done by utilizing the float periods shown on the chart.
6. The method can be employed for single or multi-start projects. For multi-project work, two or more bar charts can (provided they are drawn to the same time and calendar scale) be superimposed on transparent paper and the amount of resource overlap can be seen very quickly.
Limitations
The limitations of the graphical method are basically the size of the bar chart paper and therefore, the number of activities. Most programmes are drawn on either A1 or A0 size paper and the number of different activities must be compressed into the 840 mm width of this sheet. (It may, of course, be possible to divide the network into two, but then the interlinking activities must be carefully transferred.) Normally, the division between bars is about 6 mm, which means that a maximum of 120 activities can be analysed. However, bearing in mind that in a normal network, 30% of the activities are dummies, a network of 180–200 activities could be analysed graphically on one sheet.
Briefly, the mode of operation is as follows: 1. Draw the network in arrow diagram or precedence format and write in the activity titles
(Figs. 24.1 or 24.2). Although a forward pass has been carried out on both these dia-grams, this is not necessary when using the graphical method of analysis.
2. Insert the durations. 3. List the activities on the left-hand vertical edge of a sheet of graph paper (Fig. 21.11)
showing: a. activity title b. duration (in days, weeks, etc.) c. node no (only required when using these for bar chart generation) 4. Draw a time scale along the bottom horizontal edge of the graph paper.

Graphical and Computer Analysis 169
5. Draw a horizontal line from day 0 of the first activity, which is proportional to the dura-tion (using the time scale selected), e.g., 6 days would mean a line six divisions long (Fig. 24.3). To ease identification an activity letter or no. can be written above the bar.
6. Repeat this operation with the next activity on the table starting on day 0. 7. When using activity on arrow networks, mark dummy activities by writing the end time
of the dummy next to the start time of the dummy, e.g., 4 → 7 would be shown as 4,7 (Fig. 21.13).
8. All subsequent activities must be drawn with their start time (start day no.) directly below the end time (end day no.) of the previous activity having the same time value (day no.).
9. If more than one activity has the same end time (day no.), draw the new activity line from the activity end time (day no.) furthest to the right.
10. Proceed in this manner until the end of the network.
Figure 24.1Activity on arrow network.
Figure 24.2Activity on node network.

170 Chapter 24
11. The critical path can now be traced back by following the line (or lines), which runs back to the start without a horizontal break.
12. The break between consecutive activities on the bar chart is the free float of the preceding activity.
13. The summation of the free floats in one string, before that string meets the critical path, is the total float of the activity from which the summation starts, e.g., in Fig. 21.11 the total float of activity K is 1 + 1 + 2 = 4 days, the total float of activity M is 1 + 2 + 3 days, and the total float of activity N is 2 days.
The advantage of using the start and end times (day nos.) of the activities to generate the bar chart is that there is no need to carry out a forward pass. The correct relationship is given automatically by the disposition of the bars. This method is therefore equally suitable for arrow and precedence diagrams.
An alternative method can however be used by substituting the day numbers by the node numbers. Clearly, this method, which is sometimes quicker to draw, can only be used with arrow diagrams, because precedence diagrams do not have node numbers. When using this method, the node numbers are listed next to the activity titles (Fig. 24.5) and the bars are drawn from the starting node of the first activity with a length equal to the duration. The next bar starts vertically below the end node with the same node number as the starting node of the activity being drawn.
As with the day no. method, if more than one activity has the same end node number, the one furthest to the right must be used as a starting time. Fig. 24.4 shows the same network with the node numbers inserted, and Fig. 24.5 shows the bar chart generated using the node numbers.
24131842537326
PNMLKJHGFEDCBADays
Days
A
B
D
E
10 15F
15 17G
17 21H
J
10 13L
13 14M
21 23P
15 19N
Free float
FF
FF
Freefloat
C.P.
0 6
6
8
8
C 11
10
9
7
7
8
8 K
0
0
0 1 2 3 4 5 6 7 8 9 10 11 12 13 14 15 16 17 18 19 20 21 22 23
Figure 24.3Bar chart.

Graphical and Computer Analysis 171
Fig. 24.6 shows a typical arrow diagram, and Fig. 24.7 shows a bar chart generated using the starting and finishing node numbers. Note that these node numbers have been listed on the left-hand edge together with the durations to ease plotting.
Time for Analysis
Probably the most time-consuming operation in bar chart preparation is the listing of the activity titles, and for this there is no shortcut. The same time, in fact, must be expended typing the titles straight into the computer. However, in order to arrive at a quick answer, it is
11
3
8
2
6
6
0CBA
21
4
17
2
15
5
10
3
7
7
0HGFED
2
21
4
15 23
1
13
3
10
1
8
8
0PNMLKJ
1512104
2117151070
2117 231613124
4321
987651
1413 151211101
Figure 24.4Arrow diagram.
14-1513-1412-1311-1210-111-108-97-86-75-61-53-42-31-2
PNMLKJHGFEDCBANode no.
Days
A
B
3 4,7C
D
E
6 7,13F
G
8 9,14H
J
10 11K
11 12L
12 13M
14 15P
13 14N
Free float
FF
FF
Freefloat
C.P.
1 2
2
55 6
7 8
3
1
1 10
0 1 2 3 4 5 6 7 8 9 10 11 12 13 14 15 16 17 18 19 20 21 22 23
Figure 24.5Bar chart.

172 C
hapter 24
5
12
9
17
24
42
26
22
33
4
11
8
15
23
38
20
21
3
8
7
10
1533
2
6
6
7
14
30
10
20
1120
25
45
27
28
34
Test
Hardcore
Floor boardsstairs
Plumberg. fl.
Elect.g. fl.
Lay & jointpipes
Brickworkto DPC
Deliver plumb. fittings
Deliver elect. fittings
Concretebed
Concretefloors
Joists1st floor
Evacuatetrench
Evacuatefoots
Delivertimber
Groundslab
Windows deliver
Joistsroof
Plumber1st fl.
Joiner1st fix.
1
2
4
5
5
3
5
3
3
2
3
3
6
7
3
3
3
5
3
1Drains
1Foundations
BrickworkGround slab
1WindowsDoor frames
Critical activities
Dummy activities
Time periods in work days
1CarpenterRoofing
1Plumber
1Electrician
1JoinerFinishes
19
40
1835
32
54
37 38
16
33
1733
31
52
36
13
30
1222
30
50
29
35
Brickwork1 to roof
Fix frames1st fl.
Feltroof
PainterClearsite
Deckingroof
Joiner2nd fix
BrickworkG to1
Fix framesg. fl.
Elect.1st fl.
Plaster
7
2
2
10 3
2
10
10
2
5
6
4
4530 50
3833 45 50
50 54 80 837060
Figure 24.6Arrow diagram of house.
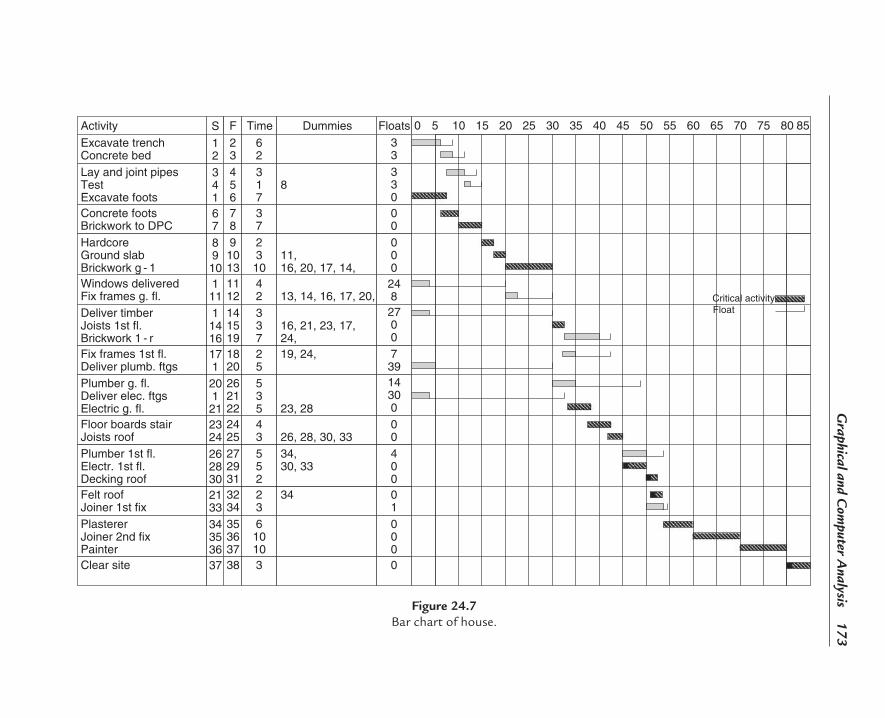
Graphical and C
omputer A
nalysis 173
S
12
67
171
2324
2133
37
111
341
8910
11416
20121
262830
343536
F
23
78
1820
2425
3234
38
1112
456
91013
141519
262122
272931
353637
Time Dummies
62
37
25
19, 24,
43 26, 28, 30, 33
23
34
3
42 13, 14, 16, 17, 20,
317
8
2310
11,16, 20, 17, 14,
337
16, 21, 23, 17,24,
535 23, 28
552
34,30, 33
61010
Activity
Excavate trenchConcrete bed
Concrete footsBrickwork to DPC
Fix frames 1st fl.Deliver plumb. ftgs
Floor boards stairJoists roof
Felt roofJoiner 1st fix
Clear site
Windows deliveredFix frames g. fl.
Lay and joint pipesTestExcavate foots
HardcoreGround slabBrickwork g - 1
Deliver timberJoists 1st fl.Brickwork 1 - r
Plumber g. fl.Deliver elec. ftgsElectric g. fl.
Plumber 1st fl.Electr. 1st fl.Decking roof
PlastererJoiner 2nd fixPainter
Floats
00
00
739
33
01
0
248
000
330
400
14300
2700
000
0 5 10 15 20 25 30 35 40 45 50 55 60 65 70 75 80 85
FloatCritical activity
Figure 24.7Bar chart of house.

174 Chapter 24
only necessary at the initial stage to insert the node numbers, and once this listing has been done (together with the activity times) the analysis is very rapid. It is possible to determine the critical path for a 200-activity network (after the listing has been carried out) in less than an hour. The backward pass for ascertaining floats takes about the same time.
Computer Analysis
Most manufacturers of computer hardware, and many suppliers of computer software, have written programs for analysing critical path networks using computers. While the various commercially available programs differ in detail, they all follow a basic pattern, and give, by and large, a similar range of outputs. In certain circumstances, a contractor may be obliged by contractual commitments to provide a computerized output report for the client. Indeed, when a client organization has standardized on a particular project management system for control-ling the overall project, the contractor may well be required to use the same proprietary system, so that the contractor’s reports can be integrated into the overall project control system on a regular basis.
History
The development of network analysis techniques more or less coincided with that of the digital computer. The early network analysis programs were, therefore, limited by the storage and processing capacity of the computer as well as the input and output facilities.
The techniques employed mainly involved producing punched cards (one card for each activity) and feeding them into the machine via a card reader. These procedures were time-consuming and tedious, and, because the punching of the cards was carried out by an operator who usually understood little of the program or its purpose, mistakes occurred, which only became apparent after the printout was produced.
Even then, the error was not immediately apparent – only the effect. It then often took hours to scan through the reams of printout sheets before the actual mistake could be located and rectified. To add to the frustration of the planner, the new printout may still have given ridiculous answers because a second error was made on another card. In this way, it often required several runs before a satisfactory output could be issued.
In an endeavour to eliminate punching errors, attempts were made to use two separate opera-tors, who punched their own set of input cards. The cards were then automatically compared and, if not identical, were thrown out, indicating an error. Needless to say, such a practice cost twice as much in manpower.
Because these early computers were large and very expensive, usually requiring their own air-conditioning equipment and a team of operators and maintenance staff, few commercial

Graphical and Computer Analysis 175
companies could afford them. Computer bureaux were therefore set up by the computer manufacturers or special processing companies, to whom the input sheets were delivered for punching, processing and printing.
The cost of processing was usually a lump sum fee plus x pence per activity. Since the computer could not differentiate between a real activity and a dummy one, planners tended to go to considerable pains to reduce the number of dummies to save cost. The result was often a logic sequence, which may have been cheap in computing cost but was very expensive in application, since frequently important restraints were overlooked or eliminated. In other words, the tail wagged the dog – a painful phenomenon in every sense. It was not surprising, therefore, that many organizations abandoned computerized network analysis or, even worse, discarded the use of network analysis altogether as being unworkable or unreliable.
There is no doubt that manual network analysis is a perfectly feasible alternative to using computers. Indeed, one of the largest petrochemical complexes in Europe was planned entirely using a series of networks, all of which were analysed manually.
The PC
The advent of the personal computer (PC) significantly changed the whole field of computer processing. In place of the punched card or tape, we now have the computer keyboard and video screen, which enable the planner to input the data directly into the computer without filling in input sheets and relying on a punch operator. The information is taken straight from the network and displayed on the video screen as it is ‘typed’ in. In this way, the data can be checked or modified almost instantaneously.
Provided sufficient information has been entered, trial runs and checks can be carried out at any stage to test the effects and changes envisaged. Modern planning programs (or project management systems, as they are often called) enable the data to be inputted in a random manner to suit the operator, provided, of course, that the relationship between the node numbers (or activity numbers) and duration remains the same.
There are some programs that enable the network to be produced graphically on the screen as the information – especially the logic sequence – is entered. This, as claimed, eliminates the need to draw the network manually. Whether this practice is as beneficial as suggested is very doubtful.
For a start, the number of activities that can be viewed simultaneously on a standard video screen is very limited, and the scroll facility that enables larger networks to be accommodated does not enable an overall view to be obtained at a glance. The greatest drawback of this practice, however, is the removal of the team spirit from the network planning process, which is engendered when a number of specialists sit down with the planner around a conference table to ‘hammer out’ the basic shape of the network. Most problems have more than one solution, and the discussions and suggestions, both in terms of network logic and durations,

176 Chapter 24
are invaluable when drafting the first programs. These meetings are, in effect, a brainstorming session at which the ideas of various participants are discussed, tested and committed to paper. Once this draft network has been produced, the planner can very quickly input it into the computer and call up a few test runs to see whether the overall completion date can, in fact, be achieved. If the result is unsatisfactory, logic and/or duration changes can be dis-cussed with the project team before the new data are processed again by the machine. The speed of the new hardware makes it possible for the computer to be a part of the planning conference, so that (provided the planner/operator is quick enough) the ‘what if’ scenarios can be tested while the meeting is in progress. A number of interim test runs can be carried out to establish the optimum network configuration before proceeding to the next stage. Even more important, errors and omissions can be corrected and durations of any or all activities can be altered to achieve a desired interim or final completion date.
The relatively low cost of the modern PCs has enabled organizations to install planning offices at the head office and sites as well as at satellite offices, associate companies and offices of vital suppliers, contractors and subcontractors. All these PCs can be linked to give simultaneous printouts as well as supply up-to-date information to the head office where the master network is being produced. In other words, the information technology (IT) revolution has made an important impact on the whole planning procedure, irrespective of the type or size of organization.
The advantages of PCs are as follows: 1. The great reduction in the cost of the hardware, making it possible for small companies,
or even individuals, to purchase their own computer system. 2. The proliferation of inexpensive, proven software of differing sophistication and com-
plexity, enabling relatively untrained planners to operate the system. 3. The ability to allow the planner to input his or her own program or information via a
keyboard and VDU. 4. The possibility to interrogate and verify the information at any stage on the video screen. 5. The speed with which information is processed and printed out either in numerical
(tabular) or graphical form.
Programs
During the last few years a large number of proprietary programs have been produced and marketed. All these programs have the ability to analyse networks and produce the standard output of early and late starts and the three main types of float, i.e., total, free and indepen-dent. Most programs can deal with either arrow diagrams or precedence diagrams, although the actual analysis is only carried out via one type of format.
The main differences between the various programs available at the time of writing are the additional facilities available and the degree of sophistication of the output. Many of the

Graphical and Computer Analysis 177
programs can be linked with ‘add-on’ programs to give a complete project management system covering not only planning but also cost control, material control, site organization, procurement, stock control, EVA, etc. It is not possible to describe the various intricacies of all the available systems within the confines of this chapter, nor is it the intention to compare one system with another. Such comparison can be made in terms of cost, user-friendliness, computing power, output sophistication, functionality or range of add-ons. Should such surveys be required, it is best to consult the internet or some of the specialist computer magazines or periodicals, which carry out such comparisons from time to time.
Most of the programs more commonly available can be found on the internet, but to give a better insight into the versatility of a modern program, one of the more sophisticated systems is described in some detail in Chapter 51. The particular system was chosen because of its ability to be linked with the EVA system described in Chapter 32 of this book. The chosen system, Primavera P6, is capable of fully integrating critical path analysis with earned value analysis and presenting the results on one sheet of A4 paper.
At the time of publication, about 140 project management programs were listed and compared for functionality in Wikipedia. Many of these will probably not exist anymore by the time this book is being read, while no doubt many more will have been created to take their place. It is futile therefore to even attempt to list them. The cost of these systems can vary between $150 and $6000, and the reader is therefore advised to investigate each ‘offer’ in some depth to ensure value for money. A simple inexpensive system may be adequate for a small organiza-tion running small projects or wishing to become familiar with computerized network analy-sis. Larger companies, whose clients may demand more sophisticated outputs and reports, may require the more expensive systems. Indeed, the choice of a particular system may well be dictated by the lead company of a consortium or the client, as described earlier.
It is recommended that the decision to produce any but the most basic printouts, as well as any printouts of reports or summaries, be delayed until the usefulness and degree of detail of a report has been studied and discussed with department managers. There is always a danger with computer outputs that recipients request more reports than they can digest, merely because they know they are available at the press of a button. Too much information or paper becomes self-defeating, since the very bulk frightens the reader to the extent of it not being read at all.
With the proliferation of the PC and the expansion of IT, especially the internet, many of the project management techniques can now be carried out online. The use of e-mail and intranets allows information to be distributed to the many stakeholders of a project almost instanta-neously. Where time is important – and it nearly always is – such a fast distribution of data or instructions can be of enormous benefit to the project manager. It does, however, require all information to be carefully checked before dissemination, precisely because so many people receive it at the same time. (See Chapter 52 on BIM.) It is an unfortunate fact that computer errors are more serious for just this reason as well as the naive belief that computers are infallible. Unfortunately, as with all computer systems, RIRO, rubbish in, rubbish out applies.

This page intentionally left blank

179Project Management, Planning and Control. http://dx.doi.org/10.1016/B978-0-08-102020-3.00025-5Copyright © 2017 Elsevier Ltd. All rights reserved.
CHAPTER 25
Milestones and Line of Balance
Milestones
Important deadlines in a project programme are highlighted by specific points in time called milestones. These are timeless activities usually at the beginning or end of a phase or stage and are used for monitoring purposes throughout the life of the project. Needless to say, they should be SMART, which is an acronym for Specific, Measurable, Achievable, Realistic, Timebound. Often milestones are used to act as trigger points for progress payments or deadlines for receipt of vital information, permits or equipment deliveries.
Milestone reports are a succinct way of advising top management of the status of the project and should act as a spur to the project team to meet these important deadlines. This is espe-cially important if they relate to large tranches of progress payments.
Milestones are marked on bar charts or networks by a triangle or diamond and can be turned into a monitoring system in their own right when used in milestone slip charts, sometimes also known as trend charts.
Fig. 25.1 shows such a slip chart, which was produced at reporting period five of a project. The top scale represents the project calendar, and the vertical scale represents the main reporting periods in terms of time. If both calendars are drawn to the same scale, a line drawn from the top left-hand corner to the bottom right-hand corner will be at 45 degrees to the two axes.
The pre-planned milestones at the start of the project are marked on the top line with a black triangle (▼).
As the project progresses, the predicted or anticipated dates of achievement of the milestones are inserted so that the slippage (if any) can be seen graphically. This should then prompt management action to ensure that the subsequent milestones do not slip! At each reporting stage, the anticipated slippages of milestones as given by the programme are re-marked with an × while those that have not been re-programmed are marked with an O. Milestones that have been met will be on the diagonal and will be marked with a triangle (∇).
Chapter OutlineMilestones 179Line of Balance 180

180 Chapter 25
As the programmed slippage of each milestone is marked on the diagram, a pattern emerges, which acts not only as a historical record of the slippages, but can also be used to give a crude prediction of future milestone movements.
A slip chart showing the status at reporting period 11 is shown in Fig. 25.2. It can be seen that milestone A was reached in week 22 instead of the original prediction of week 16. Milestones B, C and D have all slipped, with the latest prediction for B being week 50, for C being week 62, and for D being week 76. It will be noticed that before reporting period 11, the programmed predictions are marked X, and the future predictions, after week 11, are marked O.
If a milestone is not on the critical path, it may well slip on the slip chart without affecting the next milestone. However, if two adjacent milestones on the slip chart are on the critical path, any delay on the first one must cause a corresponding slippage on the second. If this is then marked on the slip chart, it will in effect become a prediction, which will then alert the project manager to take action.
Once the milestone symbol meets the diagonal line, the required deadline has been achieved.
Line of Balance
Network analysis is essentially a technique for planning one-off projects, whether this is a construction site, a manufacturing operation, a computer software development or a move to
1
2
3
4
5
6
7
8
9
1011
12
13
14
15
16
17
18
19
20
807672686460565248444036322824
A B C D
2220161284
Mon
itorin
g pe
riod
Period 5
Week
Completion line
Reference coordinatesfor completion line
64:16
Figure 25.1Milestone slip chart.
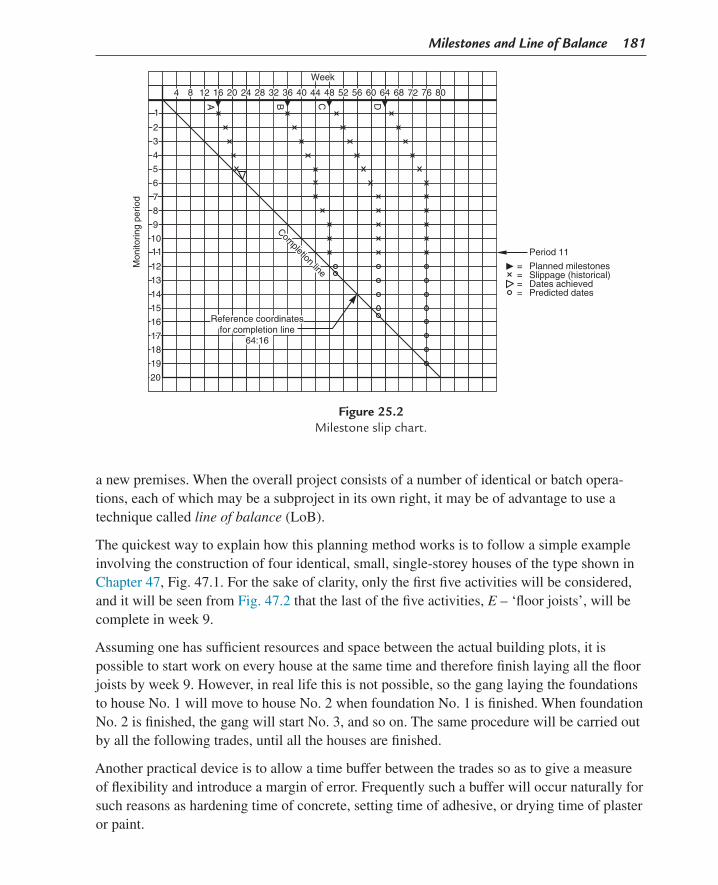
Milestones and Line of Balance 181
a new premises. When the overall project consists of a number of identical or batch opera-tions, each of which may be a subproject in its own right, it may be of advantage to use a technique called line of balance (LoB).
The quickest way to explain how this planning method works is to follow a simple example involving the construction of four identical, small, single-storey houses of the type shown in Chapter 47, Fig. 47.1. For the sake of clarity, only the first five activities will be considered, and it will be seen from Fig. 47.2 that the last of the five activities, E – ‘floor joists’, will be complete in week 9.
Assuming one has sufficient resources and space between the actual building plots, it is possible to start work on every house at the same time and therefore finish laying all the floor joists by week 9. However, in real life this is not possible, so the gang laying the foundations to house No. 1 will move to house No. 2 when foundation No. 1 is finished. When foundation No. 2 is finished, the gang will start No. 3, and so on. The same procedure will be carried out by all the following trades, until all the houses are finished.
Another practical device is to allow a time buffer between the trades so as to give a measure of flexibility and introduce a margin of error. Frequently such a buffer will occur naturally for such reasons as hardening time of concrete, setting time of adhesive, or drying time of plaster or paint.
1
2
3
4
5
6
7
8
9
1011
12
13
14
15
16
17
18
19
20
807672686460565248444036322824
A B C D
20161284
Mon
itorin
g pe
riod
Period 11
Week
= Planned milestones= Slippage (historical)= Dates achieved= Predicted dates
Completion line
Reference coordinatesfor completion line
64:16
Figure 25.2Milestone slip chart.

182 Chapter 25
Table 47.1 can now be partially redrawn showing the buffer time, which was originally included in the activity duration. The new table is now shown as Table 25.1.
Fig. 25.3 shows the relationship between the trades involved. Each trade (or activity) is represented by two lines. The distance between these lines is the duration of the activity. The distance between the activities is the buffer period. As can be seen, all the work of activities A to E is carried out at the same rate, which means that for every house, enough resources are available for every trade to start as soon as its preceding trade is finished. This is shown to be the case in Fig. 25.3.
However, if only one gang is available on the site for each trade, e.g., if only one gang of concreters laying the foundations (activity B) is available, concreting on house two cannot start until ground clearance (activity A) has been completed. The chart would then be as shown in Fig. 25.4. If instead there were two gangs of concreters available on the site, the foundations for house two could be started as soon as the ground has been cleared.
Building the dwarf wall (activity C) requires only 1.9 weeks per house, which is a faster rate of work than laying foundations. To keep the bricklaying gang going smoothly from one house to the next, work can only start on house one in week 7.2, i.e., after the buffer of about 2.5 weeks following the completion of the foundations of house 1. In this way, by the time the dwarf walls are started on house 4, the foundations (activity B) of house four will just have been finished. (In practice of course there would be a further buffer to allow the concrete to harden sufficiently for the bricklaying to start.)
As the oversite concreting (activity D) only takes 0.9 weeks, the one gang of labourers doing this work will have every oversite completed well before the next house is ready for them. Their start date could be delayed if necessary by as much as 3.5 weeks, since apart from the buffer, this activity (D) has also 1 week float.
Table 25.1
Activity LetterActivity
Description
Adjusted Duration (weeks) Dependency
Total Float (weeks) Buffer (weeks)
A Clear ground 2.0 Start 0 0.0B Lay foundations 2.8 A 0 0.2C Build dwarf
walls1.9 B 0 0.1
D Oversite concrete
0.9 B 1 0.1
E Floor joists 1.8 C and D 0 0.2

Milestones and Line of Balance 183
It can be seen therefore from Fig. 25.4 that by plotting these operations with the time as the horizontal axis and the number of houses as the vertical axis, the following becomes apparent.
If the slope of an operation is less (i.e., flatter) than the slope of the preceding operation, the chosen buffer is shown at the start of the operation. If, on the other hand, the slope of the succeeding operation is steeper, the buffer must be inserted at the end of the previous opera-tion, since otherwise there is a possibility of the trades clashing when they get to the last house.
What becomes very clear from these diagrams is the ability to delay the start of an operation (and use the resources somewhere else) and still meet the overall project programme.
Weeks
1
2
3
4
A
0 1 2 3 4 5 6 7 8 9 10 11 12 13 14 15 16
A
B
B
C
C
D
D
E
E
Hou
ses
Network(House1)
Bar chart(House1)
BufferCompletion of floor joists (E)= (2 × 4) + 3 + 2 + 2= 8 + 3 + 2 + 2 = 15 weeks
E
E
C
C
D
D
B
B
A
A
Figure 25.3Line of balance.
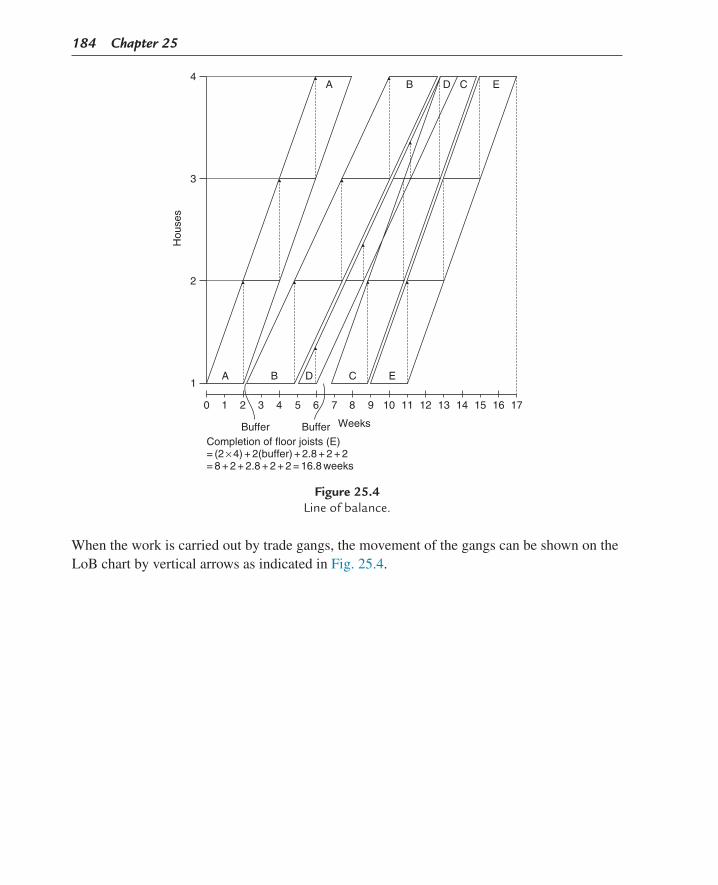
184 Chapter 25
When the work is carried out by trade gangs, the movement of the gangs can be shown on the LoB chart by vertical arrows as indicated in Fig. 25.4.
0 1 2 3 4 5 6 7 8
Weeks
9 10 11 12 13 14 15 16 17
1
2
3
4
A
A
B
B
C
C
D
D
E
E
Hou
ses
Buffer BufferCompletion of floor joists (E)= (2 × 4) + 2(buffer) + 2.8 + 2 + 2= 8 + 2 + 2.8 + 2 + 2 = 16.8 weeks
Figure 25.4Line of balance.

185Project Management, Planning and Control. http://dx.doi.org/10.1016/B978-0-08-102020-3.00026-7Copyright © 2017 Elsevier Ltd. All rights reserved.
CHAPTER 26
Simple Examples
To illustrate the principles set out in Chapter 20, let us now examine two simple examples.
Example 1
For the first example let us consider the rather mundane operation of getting up in the morn-ing, and let us look at the constituent activities between the alarm going off and boarding our train to the office.
The list of activities – not necessarily in their correct sequence – is roughly as follows:
Chapter OutlineExample 1 185Example 2 189Example 3 192Summary of Operation 194Example 4 (Using Manual Techniques) 195
Time (min)
A Switch off the alarm clock 0.05B Lie back and collect your thoughts 2.0C Get out of the bed 0.05D Go to the bathroom 0.10E Wash or shower 6.0F Brush teeth 3.0G Brush hair 3.0H Shave (if you are a man) 4.0J Boil water for tea 2.0K Pour tea 0.10L Make toast 3.0M Fry eggs 4.0N Serve breakfast 1.0P Eat breakfast 8.0Q Clean shoes 2.0R Kiss the wife goodbye 0.10S Don coat 0.05T Walk to the station 8.0

186 Chapter 26
The operations listed earlier can be represented diagrammatically in a network. This would look something like that shown in Fig. 26.1.
It will be seen that the activities are all joined in one long string, starting with A (switch off the alarm) and ending with V (board the train). If we give each activity a time duration, we can easily calculate the total time taken to perform the complete operation by simply adding up the individual durations. In the example given, this total time – or project duration – is 50.45 minutes. In theory, therefore, if any operation takes a fraction of a minute longer, we will miss our train. Consequently, each activity becomes critical and the whole sequence can be seen to be on the critical path.
In practice, however, we will obviously try to make up the time lost on an activity by speed-ing up a subsequent one. Thus, if we burn the toast and have to make a new piece, we can make up the time by running to the station instead of walking. We know that we can do this because we have a built-in margin or float in the journey to the station. This float is, of course, the difference between the time taken to walk and run to the station. In other words, the path is not as critical as it might appear, i.e., we have not pared each activity down to its minimum duration in our original sequence or network. We had something up our sleeve.
A
H
Q
B
J
R
C
K
S
D
L
T
E
M
U
F
N
V
G
P
.05
4
2
2
2
.1
.05
.1
.05
.1
3
8
6
4
3
3
1
1
3
8
Figure 26.1
Time (min)
U Queue and buy ticket 3.0V Board the train 1.0
50.45
Cont’d

Simple Examples 187
However, let us suppose that we cannot run to the station because we have a bad knee; how can then we make up for the lost time? This is where network analysis comes in. Let us look at the activities succeeding the making of toast (L) and see how we can make up the lost time of, say, 2 minutes. The remaining activities are:
M
4 1 8 8 3 12 .1 .05
N P Q R S T U V
Figure 26.2
Times (min)
M Fry eggs 4.0N Serve breakfast 1.0P Eat breakfast 8.0Q Clean shoes 2.0R Kiss the wife goodbye 0.10S Don coat 0.05T Walk to the station 8.0U Queue and buy ticket 3.0V Board the train 1.0
27.15
The total time taken to perform these activities is 27.15 minutes.
Therefore the first question is, do we have any activity which is unnecessary? Yes. We need not kiss the wife goodbye. But this only saves us 0.1 minute, and the saving is of little benefit. Besides, it could have serious repercussions.
The second question must therefore be, are there any activities which we can perform simul-taneously? Yes. We can clean our shoes while the eggs fry. The network shown in Fig. 26.2 can thus be redrawn as demonstrated in Fig. 26.3. The total now from M to V adds up to 25.15 minutes. We have, therefore, made up our lost 2 minutes without apparent extra effort. All we have to do is to move the shoe-cleaning box to a position in the kitchen where we can keep a sharp eye on the eggs while they fry.
Encouraged by this success, let us now re-examine the whole operation to see how else we can save a few minutes, since a few moments extra in bed are well worth saving. Let us therefore see what other activities can be performed simultaneously: 1. We could brush our teeth under the shower. 2. We could put the kettle on before we shaved so that it boils while we shave. 3. We could make the toast while the kettle boils or while we fry the eggs. 4. We could forget about the ticket and pay the ticket collector at the other end. 5. We could clean our shoes while the eggs fry as previously discussed.

188 Chapter 26
Having considered the earlier list, we eliminate (1) since it is not nice to spit into the bathtub, and (4) is not possible because we have an officious guard on our barrier. So we are left with (2), (3) and (5). Let us see what our network looks like now (Fig. 26.4). The total duration of the operation or programme is now 43.45 minutes, a saving of 7 minutes or over 13% for no additional effort. All we did was to resequence the activities. If we moved the washbasin near the shower and adopted the ‘brush your teeth while you shower’ routine, we could save another 3 minutes, and if we bought a season ticket we would cut another 3 minutes off our time. It can be seen, therefore, that by a little careful planning we could well spend an extra 13 minutes in bed – all at no extra cost or effort.
If a saving of over 25% can be made on such a simple operation as getting up, it is easy to see what tremendous savings can be made when planning complex manufacturing or construction operations.
Let us now look at our latest network again. From A to G the activities are in the same sequence as on our original network. H and J (shave and boil water) are in parallel. H takes 4 minutes and J takes 2. We therefore have 2 minutes float on activity J in relation to H. To get the total project duration we must, therefore, use the 4 minutes of H in our adding-up process, i.e., the longest duration of the parallel activities.
Similarly, activities L, M and Q are being carried out in parallel and we must, therefore, use M (fry eggs) with its duration of 4 minutes in our calculation. Activity L will,
M
Q
4 1 8 8 3 12
2
.1 .05
N P Q R S T U V
Figure 26.3
A HB
J
R
C
K S
D
L T
E
M
Q
U
F
N V
G
P
.05 4
2
2
2
.1
.05
.1 .05
.1
3 8
6
4
3
3
1 1
3
8
Figure 26.4

Simple Examples 189
therefore, have 1 minute float while activity Q has 2 minutes float. It can be seen, there-fore, that activities H, L and Q could all be delayed by their respective floats without affecting the overall programme. In practice, such a float is absorbed by extending the duration to match the parallel critical duration or left as a contingency for disasters. In our example it may well be prudent to increase the toast-making operation from 3 min-utes to 4 by reducing the flame on the grill in order to minimize the risk of burning the bread.
Example 2
Let us now look at another example. Suppose we decide to build a new room into the loft space of our house. We decide to coordinate the work ourselves because the actual building work will be carried out by a small jobbing builder, who has little idea of planning, while the drawings will be prepared by a freelance architect who is not concerned with the meaning of time. If the start of the programme is the brief to the architect and the end is the fitting of carpets, let us draw up a list of activities we wish to monitor to ensure a speedy completion of the project. The list would be as follows:
Days
A Brief architect 1B Architect produces plans for planning
permission7
C Obtain the planning permission 60D Finalize the drawings 10E Obtain tenders 30F Adjudicate bids 2G Builder delivers materials 15H Strip roof 2J Construct dormer 2K Lay floor 2L Tile the dormer walls 3M Felt the dormer roof 1N Fit window 1P Move the CW tank 1Q Fit doors 1R Fit the shelves and cupboards 4S Fit the internal lining and insulation 4T Run electric cables 2U Cut a hole in existing ceiling 1V Fit stairs 2W Plaster walls 2X Paint 2Y Fit the carpets 1
156

190 Chapter 26
Rather than drawing out all these activities in a single long string, let us make a preliminary analysis on which activities can be carried out in parallel. The following immediately spring to mind: 1. Final drawings can be prepared while planning permission is obtained. 2. It may even be possible to obtain tenders during the planning permission period, which is
often extended. 3. The floor can be laid while the dormer is being tiled.
The preliminary network would, therefore, be as shown in Fig. 26.5.
If all the activities were carried out in series, the project would take 156 days. As drawn in Fig. 26.5 the duration of the project is 114 days. This already shows a considerable saving by utilizing the planning permission period for finalizing drawings and obtaining tenders.
However, we wish to reduce the overall time even further, so we call the builder in before we start work and go through the job with him. The first question we ask is, how many men he will employ. He says between two and four. We then make the following suggestions: 1. Let the electrician run the cables while the joiners fit the stairs. 2. Let the plumber move the tank while the roof of the dormer is being constructed. 3. Let the glazier fit the windows while the joiner fits the shelves. 4. Let the roofer felt the dormer while the walls are being tiled. 5. Fit the doors while the cupboards are being built.
The builder may object that this requires too many men, but you can tell him that his overall time will be reduced and he will probably gain in the end. The revised network is shown in Fig. 26.6. The total project duration is now reduced to 108 days. The same network in prece-dence format [activity on node, (AoN)] is shown in Fig. 26.7.
A1
B7
R4
C60
K2
S4
D10
L
T
E30
M
U1
F
N
V W2 2
X2
Y1
G
P1 1
Q
2
2 2H
2J
15
3
1 1
Figure 26.5
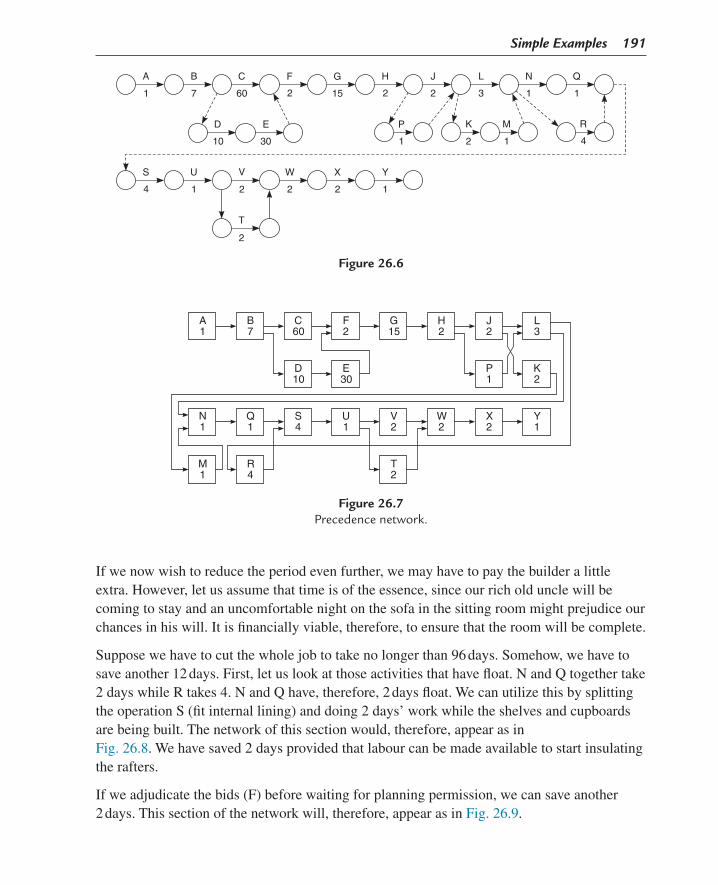
Simple Examples 191
If we now wish to reduce the period even further, we may have to pay the builder a little extra. However, let us assume that time is of the essence, since our rich old uncle will be coming to stay and an uncomfortable night on the sofa in the sitting room might prejudice our chances in his will. It is financially viable, therefore, to ensure that the room will be complete.
Suppose we have to cut the whole job to take no longer than 96 days. Somehow, we have to save another 12 days. First, let us look at those activities that have float. N and Q together take 2 days while R takes 4. N and Q have, therefore, 2 days float. We can utilize this by splitting the operation S (fit internal lining) and doing 2 days’ work while the shelves and cupboards are being built. The network of this section would, therefore, appear as in Fig. 26.8. We have saved 2 days provided that labour can be made available to start insulating the rafters.
If we adjudicate the bids (F) before waiting for planning permission, we can save another 2 days. This section of the network will, therefore, appear as in Fig. 26.9.
A
1
B
7
R
4
C
60
K
2
S
4
D
10
E
30
M
U
1
F
V W
2
T
2
2
X
2
Y
1
G
P
1
2 2
H
2
J
3 1
L N
1
Q
15
1
Figure 26.6
A1
N1
M1
B7
Q1
C60
S4
D10
T2
R4
P1
F2
U1
E30
K2
G15
V2
H2
W2
J2
X2
L3
Y1
Figure 26.7Precedence network.
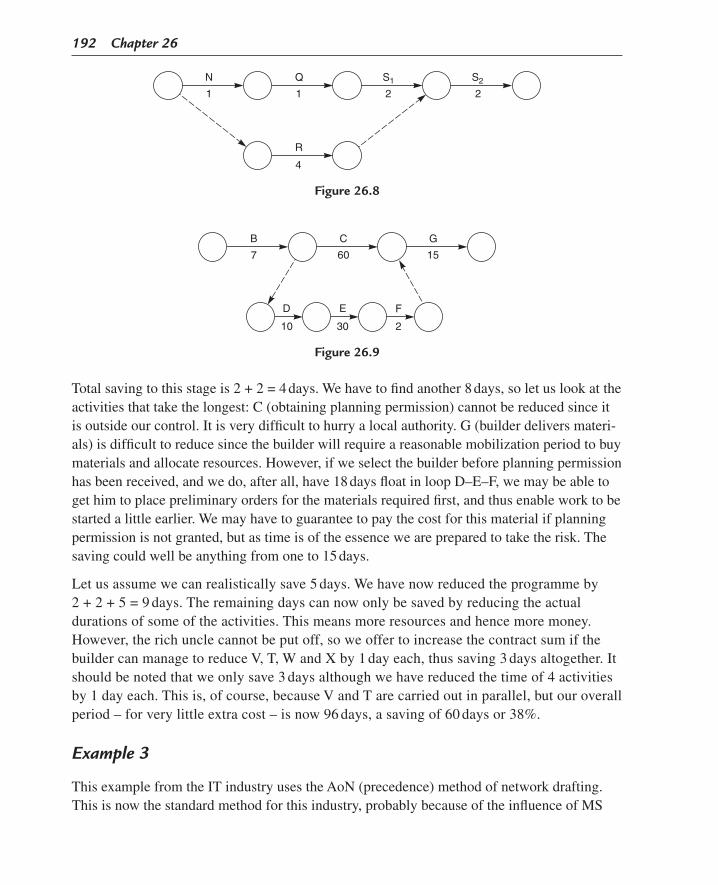
192 Chapter 26
Total saving to this stage is 2 + 2 = 4 days. We have to find another 8 days, so let us look at the activities that take the longest: C (obtaining planning permission) cannot be reduced since it is outside our control. It is very difficult to hurry a local authority. G (builder delivers materi-als) is difficult to reduce since the builder will require a reasonable mobilization period to buy materials and allocate resources. However, if we select the builder before planning permission has been received, and we do, after all, have 18 days float in loop D–E–F, we may be able to get him to place preliminary orders for the materials required first, and thus enable work to be started a little earlier. We may have to guarantee to pay the cost for this material if planning permission is not granted, but as time is of the essence we are prepared to take the risk. The saving could well be anything from one to 15 days.
Let us assume we can realistically save 5 days. We have now reduced the programme by 2 + 2 + 5 = 9 days. The remaining days can now only be saved by reducing the actual durations of some of the activities. This means more resources and hence more money. However, the rich uncle cannot be put off, so we offer to increase the contract sum if the builder can manage to reduce V, T, W and X by 1 day each, thus saving 3 days altogether. It should be noted that we only save 3 days although we have reduced the time of 4 activities by 1 day each. This is, of course, because V and T are carried out in parallel, but our overall period – for very little extra cost – is now 96 days, a saving of 60 days or 38%.
Example 3
This example from the IT industry uses the AoN (precedence) method of network drafting. This is now the standard method for this industry, probably because of the influence of MS
N
1
Q
1
R
4
S1 S2
2 2
Figure 26.8
B
7
C
60
G
15
D
10
E
30
F
2
Figure 26.9

Simple Examples 193
Project and because networks in IT are relatively small compared to the very large networks in construction, which can have between 200 and several thousand activities. The principles are of course identical.
A supermarket requires a new stock-control system linked to a new check-out facility. This involves removing the existing checkout, designing and manufacturing new hardware and writing new software for the existing computer, which will be retained.
The main activities and durations (all in days) for this project are as follows:
Days
A Obtain a brief from the client (the supermarket owner)
1
B Discuss the brief 2C Conceptual design 7D Feasibility study 3E Evaluation 2F Authorization 1G System design 12H Software development 20J Hardware design 40K Hardware manufacture 90L Hardware delivery (transport) 2M Removal of existing checkout 7N Installation of new equipment 6P Testing on site 4Q Handover 1R Trial operation 7S Close out 1
The network for this project is shown in Fig. 26.10 from which it can be seen that there are virtually no parallel activities, so only two activities, M (removal of existing checkout) and H (software development), have any float. However, the float of M is only one day, so for all intents and purposes it is also critical. It may be possible, however, to start J (hardware design) earlier after G (system design) is 50% complete. This change is shown on the network in Fig. 26.11. As a result of this change, the overall project period has been reduced from 179 days to 173 days. It could be argued that the existing checkout (M) could be removed earlier, but the client quite rightly wants to make sure that the new equipment is ready for dispatch before removing the old one. As the software developed under H is only required at the time of the installation (N), there is still plenty of float (106 days) even after the earlier start of hardware design (J) to make sure everything is ready for the installation of the new equipment (N).
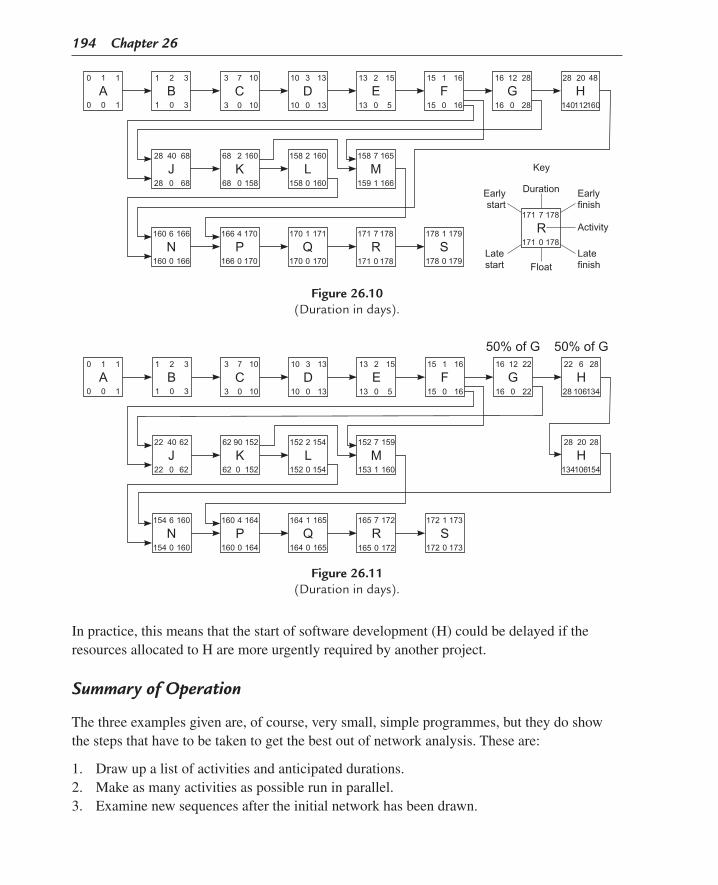
194 Chapter 26
In practice, this means that the start of software development (H) could be delayed if the resources allocated to H are more urgently required by another project.
Summary of Operation
The three examples given are, of course, very small, simple programmes, but they do show the steps that have to be taken to get the best out of network analysis. These are: 1. Draw up a list of activities and anticipated durations. 2. Make as many activities as possible run in parallel. 3. Examine new sequences after the initial network has been drawn.
J
N
CA B
K
P
D
L
Q R S
E F G H
M68
166
10
160
170
13
160
171
15
165
178 179
16 28 48
68
166
10
158
170
13
160
170
5
166
178 179
16 28 160
40
6
7
2
4
3
2
1
2
7
7
0
0
0
0
0
0
0
0
0
1
0
0
1
0 0 112
28
160
3321
301
110
100
68
166
10
158
170
13
158
171 178
15 1 16 12 28 20
28
160
3
68
166
10
158
170
13
159
171 178
15 16 140
R178
178
7
0
171
171
DurationEarlystart
Earlyfinish
Activity
Latestart
Latefinish
Key
Float
Figure 26.10(Duration in days).
J
N
CA B
K
P
D
L
Q R S
E F G
50% of G 50% of G
H
M62
160
10
152
164
13
154
165
15
159
172 173
16 22 28
62
160
10
152
164
13
154
165
5
160
172 173
16 22 134
40
6
7
90
4
3
2
1
2
7
7
0
0
0
0
0
0
0
0
0
1
0
0
1
0 0 106
22
154
3321
301
110
100
62
160
10
152
164
13
152
165 172
15 1 16 12 22 6
22
154
3
62
160
10
152
164
13
153
165 172
15 16 28
H28
154106
28 20
134
Figure 26.11(Duration in days).

Simple Examples 195
4. Start a string of activities as early as possible and terminate as late as possible. 5. Split activities into two or more steps if necessary. 6. If time is vital, reduce durations by paying more for extra resources. 7. Always look for new techniques in the construction or operation being programmed.
It is really amazing what savings can be found after a few minutes’ examination, especially after a good night’s sleep.
Example 4 (Using Manual Techniques)
An example of how the duration of a small project can be reduced quite significantly using manual techniques is shown by following the stages shown in Fig. 26.13.
The project involves the installation of a pump, a tank and the interconnecting piping, which has to be insulated. Fig. 26.12 shows the diagrammatic representation of the scheme, which does not include the erection of the pipe bridge over which the line has to run. All the net-works in Fig. 26.13 are presented in activity on arrow, AoN and bar chart format, which clearly show the effect of overlapping activities. Fig. 26.13A illustrates all the five operations in sequence. This is quite a realistic procedure, but it takes the maximum amount of time – 16 days. By erecting the tank and pump at the same time (Fig. 26.13B), the overall duration has been reduced to 14 days. Fig. 26.13C shows a further saving of 3 days by erecting the pipe over the bridge while also erecting the pump and tank, giving an overall time of 11 days. When the pipe laying is divided into three sections (D1, D2 and D3), it is possible to weld the last two sections at the same time, thus reducing the overall time to 10 days (Fig. 26.13D). Further investigation shows that while the last two sections of pipe are being welded it is possible to insulate the already completed section. This reduces the overall duration to 8 days (Fig. 26.13E).
It can be argued, of course, that an experienced planner can foresee all the possibilities right from the start, and produce the network and bar chart shown in Fig. 26.13E without going through all the previous stages. However, most mortals tend to find the optimum solution to a problem by stages, using the logical thought processes as outlined earlier. A sketch pad and
Pump B
Pipe bridgeRoad
Tank A
Last butt
Test
Lastbutt D3 D1
D2
D3
E1 E2E2
C
Figure 26.12Pipe bridge.

196 C
hapter 26
AoN Bar ChartAoA
(A)
(B)
(C)
(D)
(E)
Figure 26.13Small pipeline project.

Simple Examples 197
pocket calculator are all that is required to run through these steps. A computer at this stage would certainly not be necessary.
It must be pointed out that although the example shown is only a very small project, such problems occur almost daily and valuable time can be saved by just running through a number of options before the work actually starts. In many cases, the five activities will be represented by only one activity, e.g., ‘install lift pump system’ on a larger construction network, and while this master network may be computerized, the small ‘problem networks’ are far more easily analysed manually.

This page intentionally left blank

199Project Management, Planning and Control. http://dx.doi.org/10.1016/B978-0-08-102020-3.00027-9Copyright © 2017 Elsevier Ltd. All rights reserved.
CHAPTER 27
Progress Reporting
Chapter OutlineFeedback 200
Having drawn the network programme, it is now necessary to develop a simple but effective system of recording and reporting progress. The conventional method of recording progress on a bar (Gantt) chart is to thicken up or hatch in the bars, which are purposely drawn ‘hollow’ to allow this to be done. When drafting the network, activities are normally repre-sented by single solid lines (Fig. 27.1), but the principle of thickening up can still be applied. The simplest way is to thicken up the activity line and black in the actual node point (Fig. 27.2). If an activity is only partially complete (say 50%), it can be easily represented by only blacking in 50% of the activity (Fig. 27.2). It can be seen, therefore, that in the case of the string of activities shown in Fig. 27.2, the first activity is complete while the second one is half complete. By rights, therefore, the week number at that stage should be 4 + 50% of 6 = 7. However, this presupposes that the first activity has not been delayed and finished on week 4 as programmed.
How, then, can one represent the case of the first activity finishing, say, 2 weeks late (week 6)? The simple answer is to cross out the original week number (4) and write the revised week number next to it, as shown in Fig. 27.3. If the duration of the second activity cannot be reduced, i.e., if it still requires 6 weeks as programmed, it will be necessary to amend all the subsequent week numbers as well (Fig. 27.4).
This operation will, of course, have to be carried out every time there is a slippage, and it is prudent, therefore, to leave sufficient space over the node point to enable this to be done. Alternatively, it may be more desirable to erase the previous week numbers and insert the new ones, provided, of course, the numbers are written in pencil and not ink. At first sight, the job of erasing some 200 node numbers on a network may appear to be a tedious and time-con-suming exercise. However, in practice, such an updating function poses no problems. A reasonably experienced planner can update a complete network consisting of about 200 activities in less than 1 hour. When one remembers that in most situations only a small proportion of the activities on a network require updating, the speed of the operation can be appreciated.

200 Chapter 27
Naturally, only the earliest dates are calculated, since this answers the most important questions, i.e., 1. When can a particular activity start? 2. When will the whole project be completed?
At this stage, there is no need to calculate floats since these can be ascertained rapidly as and when required, as explained in Chapter 21.
Precedence (activity on node) networks can be updated as shown in Chapter 19, Figs. 19.2 and 19.3.
Feedback
Apart from reporting progress, it is also necessary to update the network to reflect logic changes and delays. This updating, which has to be on a regular basis, must reflect two main types of information: 1. What progress, if any, has been achieved since the last update or reporting stage? 2. What logic changes have to be incorporated to meet the technical or programme
requirements?
0
4 6 5
4 10 15
50%complete
Figure 27.2
Figure 27.3
Figure 27.4
0
4 6 5
4 10 15
21 22 23 24
Figure 27.1Weeks.

Progress Reporting 201
To enable planners to incorporate this information on a revised or updated network, they must be supplied with data in an organized and regular manner. Many schemes – some very complex and some very simple – have been devised to enable this to happen. Naturally, the simpler the scheme, the better, and the less the paper used, the more the information on the paper will be used.
The ideal situation is, therefore, one where no additional forms whatsoever are used, and this ideal can indeed be reached by using the latest IT systems.
However, unless the operatives in the field have the facilities to electronically transmit the latest updated position direct to the planning engineer’s computer, a paper copy of the updated net-work will still have to be produced on site and sent back to the planning engineer. Provided that: 1. The networks have been drawn on small sheets, i.e., A3 or A4, or have been photographi-
cally reduced to these sizes. 2. If a photocopier is available, updating the network is merely a question of thickening
the completed or partially completed activities, amending any durations where neces-sary and taking a photostat copy. This copy is then returned to the planner, preferably electronically. When a logic change is necessary, the amendment is made on a copy of the last network and this too is returned to the planner. If all the disciplines or depart-ments do this, and return their feedback regularly to the planner, a master network incorporating all these changes can be produced and the effects on other disciplines calculated and studied.
There may be instances where a department manager may want to change a sequence of activities or add new items to his or her particular part of the network. Such logic changes are most easily transmitted to the planner electronically, or, in the absence of such facilities, by placing an overlay over that portion of the network that has to be changed and sketching in the new logic freehand.
When logic changes have been proposed – for this is all a department can do in isolation at this stage – the effect on other departments only becomes apparent when a new draft network has been produced by the planner. Before accepting the situation, the planner must either inform the project manager or call a meeting of all the interested departments to discuss the implications of the proposed logic changes. In other words, the network becomes what it should always be – a focal point for discussion, a means by which the job can be seen graphi-cally, so that it can be amended to suit any new restraints or requirements.
In many instances, it will be possible for the planner to visit the various departments and update the programme by asking a few pertinent questions. This reduces the amount of paper even more and has, of course, the advantage that logic changes can be discussed and provi-sionally agreed right away. On a site, where the contract has been divided into a number of operational areas, this method is particularly useful since area managers are notorious for shunning paperwork – especially reports. Even very large projects can be controlled in this manner, and the personal contact again helps to generate the close relationship and involve-ment so necessary for good morale.

202 Chapter 27
Where an efficient cost-reporting system is in operation, and provided that this is geared to the network, the feedback for the programme can be combined with the weekly cost-report information issued in the field or shop.
A good example of this is given in Chapter 32, which describes the earned value analysis (EVA) cost-control system. In this system, the cost-control and cost-reporting procedures are based on the network so that the percentage complete of an operation can be taken from the site returns and entered straight onto the network. The application of EVA is particularly interesting, since the network can be either electronically or manually analysed while the cost report is produced by a computer, both using the same database.
One of the greatest problems found by main contractors is the submission of updated pro-grammes from sub-suppliers or subcontractors. Despite clauses in the purchase order or subcontract documents, requiring the vendor to return a programme within a certain number of weeks of order date and update it monthly, many suppliers just do not comply. Even if programmes are submitted as requested, they vary in size and format from a reduced com-puter printout to a crude bar chart, which shows activities possibly useful to the supplier but quite useless to the main contractor or client.
One reason for this production of unsatisfactory information is that the main contractor (or consultant) was not specific enough in the contract documents setting out exactly what information is required and when it is needed. To overcome this difficulty, the simplest way is to give the vendor a pre-printed bar chart form as part of the contract documents, together with a list of suggested activities which must appear on the programme.
A pre-printed table, as drawn in Fig. 27.5, shows by the letter X which activities are important for monitoring purposes, for typical items of equipment or materials. The list can be modified by the supplier if necessary, and obviously each main contractor can draw up his own require-ments depending on the type of industry he is engaged in, but the basic requirements from setting out drawings to final test certificates are included. The dates by which some of the key documents are required should, of course, be given in the purchase order or contract docu-ment, since they may be linked to stage payments and/or penalties such as liquidated damages.
The advantages of the main contractor requesting the programme (in the form of a bar chart) to be produced to his or her own format, a copy of which is shown in Fig. 27.6, are as follows: 1. All the returned programmes are of the same size and type, and can be more easily
interpreted and filed by the main contractor’s staff. 2. Where the supplier is unsophisticated, the main contractor’s programme is of educational
value to the supplier. 3. Since the format is ready-made, the supplier’s work is reduced and the programme will
be returned by him earlier. 4. Since all the programmes are on A4 size paper, they can be reproduced and distributed
more easily and speedily.

Progress Reporting
203
Figure 27.5Suggested activities for a manufacturer’s bar chart.

204 C
hapter 27
Figure 27.6Manufacturer’s bar chart.

Progress Reporting 205
To ensure that the supplier has understood the principles and uses the correct method for populating the completed bar chart, an instruction sheet, as shown in Fig. 27.7, should be attached to the blank bar chart.
Figure 27.7

This page intentionally left blank

207Project Management, Planning and Control. http://dx.doi.org/10.1016/B978-0-08-102020-3.00028-0Copyright © 2017 Elsevier Ltd. All rights reserved.
CHAPTER 28
Project Management and Network Planning
Chapter OutlineResponsibilities of the Project Managers 207Information From Network 208Site-Preparation Contract 209Confidence in Plan 210Network and Method Statements 211Integrated Systems 212Networks and Claims 214
Examples of Claims for Delays 215Example 1 215Example 2 216
Force Majeure Claims 217Example 3 217Example 4 218
Responsibilities of the Project Managers
It is not easy to define the responsibilities of a project manager, mainly because the scope covered by such a position varies not only from industry to industry but also from one com-pany to another. However, three areas of responsibility are nearly always part of the project manager’s brief: 1. To build the job to specification and to satisfy the operational (performance, quality and
safety) requirements. 2. To complete the project on time. 3. To build the job within previously established budgetary constraints.
The last two are, of course, connected; generally, it can be stated that if the job is on schedule, the cost has either not exceeded the budget, or additional resources have been supplied by the contractor to rectify his own mistakes or good grounds exist for claiming any extra costs from the client. It is far more difficult to obtain extra cash if the programme has been exceeded and the client has also suffered loss due to the delay.

208 Chapter 28
Time, therefore, is vitally important, and the control of time, whether at the design stage or the construction stage, should be a matter of top priority with the project manager. It is surprising, therefore, that so few project managers are fully conversant with the mechanics of network analysis and its advantages over other systems. Even if it had no other function but to act as a polarizing communication document, it would justify its use in preference to other methods.
Information From Network
A correctly drawn and regularly updated network can be used to give vital information and has following beneficial effects on the project. 1. It enables the interaction of the various activities to be shown graphically and clearly. 2. It enables spare time or float to be found where it exists so that advantage can be taken to
reduce resources, if necessary. 3. It can pinpoint potential bottlenecks and trouble spots. 4. It enables conflicting priorities to be resolved in the most economical manner. 5. It gives an up-to-date picture of progress. 6. It acts as a communication document between all disciplines and stakeholders. 7. It shows all interested parties the intent of the method of construction. 8. It acts as a focus for discussion at project meetings. 9. It can be expanded into subnets showing greater detail, or contracted to show the chief
overall milestones. 10. If updated in coloured pencil, it can act as a spur between rival gangs of workers. 11. It is very rapid and cheap to operate and is a base for earned value analysis (EVA). 12. It is quickly modified if circumstances warrant it. 13. It can be used when formulating claims, as evidence of disruption due to late decisions or
delayed drawings and equipment. 14. Networks of past jobs can be used to draft proposal networks for future jobs. 15. Networks stimulate discussion provided everyone concerned is familiar with them. 16. It can assist in formulating a cash-flow chart to minimize additional funding.
To get the maximum benefit from networks, a project manager should be able to read them as a musician reads music. He should feel the slow movements and the crescendos of activities and combine these into a harmonious flow until the grand finale is reached.
To facilitate the use of networks at discussions, the sheets should be reduced photographi-cally to A3 (approximately 42 cm × 30 cm). In this way, a network can be folded once and kept in a standard A4 file, which tends to increase its usage. Small networks can, of course, be drawn on A3 or A4 size sheets in the first place, thus saving the cost of subsequent reduc-tion in size.

Project Management and Network Planning 209
It is often stated that networks are not easily understood by the man in the field, the area manager or the site foreman. This argument is usually supported by statements that the field men were brought up on bar charts and can, therefore, understand them fully, or that they are confused by all the computer printouts, which take too long to digest. Both statements are true. A bar chart is easy to understand and can easily be updated by hatching or colouring in the bars. It is also true that computer output sheets can be overwhelming by their complexity. Even if the output is restricted to a discipline report, only applicable to the person in question, confusion is often caused by the mass of data. As is so often the case, network analysis and computerization are regarded as being synonymous, and the drawbacks of the latter are then invoked (often quite unwittingly) to discredit the former.
The author’s experience, however, contradicts the argument that site people cannot or will not use networks. On the contrary, once the foreman or chargehand understands and appreciates what a network can do, he will prefer it to a bar chart. This is illustrated by the following example, which describes an actual situation on a contract.
Site-Preparation Contract
The job described was a civil-engineering contract comprising the construction of oversite base slabs, roads, footpaths and foul and stormwater sewers for a large municipal housing scheme consisting of approximately 250 units. The main contractor, who confined his site activities to the actual house building, was anxious to start work as soon as possible to get as much done before the winter months. It was necessary, therefore, to provide him with good roads and a fully drained site.
Contract award was June and the main contractor was programmed to start building opera-tions at the end of November the same year. To enable this quite short civil-engineering stage to be completed on time, it was decided to split the site into four main areas that could be started at about the same time. The size and location of these areas was dictated by such considerations as access points, site clearance (including a considerable area of woodland), natural drainage and house-building sequence.
Once this principle was established by management, the general site foreman was called in to assist in the preparation of the network, although it was known that he had never even heard of, let alone worked to, a critical path programme.
After explaining the basic principles of network techniques, the foreman was asked where he would start work, what machines he would use, which methods of excavation and construc-tion he intended to follow, etc. As he explained his methods, the steps were recorded on the back of an old drawing print by the familiar method of lines and node points (arrow diagram). Gradually, a network was evolved which grew before his eyes and his previous fears and scepticism began to melt away.

210 Chapter 28
When the network of one area was complete, the foreman was asked for the anticipated duration of each activity. Each answer was religiously entered on the network without query, but when the forward pass was made, the overall period exceeded the contract period by several weeks. The foreman looked worried, but he was now involved. He asked to be allowed to review some of his durations and reassess some of the construction methods. Without being pressurized, the man, who had never used network analysis before, began the process that makes network analysis so valuable, i.e., he reviewed and refined the plan until it complied with the contractual requirements. The exercise was repeated with the three other areas, and the following day the whole operation was explained to the four chargehands who were to be responsible for those areas.
Four separate networks were then drawn, together with four corresponding bar charts. These were pinned on the wall of the site hut with the instruction that one of the programmes, either network or bar chart, to be updated daily. Great stress was laid on the need to update regu-larly, since it is the monitoring of the programme that is so often neglected once the plan has been drawn. The decision on which of the programmes was used for recording progress was left to the foreman, and it is interesting to note that the network proved to be the format he preferred.
Since each chargehand could compare the progress in his area with that of the others, a competitive spirit developed quite spontaneously to the delight of management. The result was that the job was completed 4 weeks ahead of schedule without additional cost. These extra weeks in October were naturally extremely valuable to the main contractor, who could get more units weatherproof before the cold period of January to March. The network was also used to predict cash flow, which proved to be remarkably accurate. (The principles of this are explained in Chapter 31.)
It can be seen, therefore, that in this instance a manual network enabled the project manager to control both the programme (time) and the cost of the job with minimum paperwork. This was primarily because the men who actually carried out the work in the field were involved and were convinced of the usefulness of the network programme.
Confidence in Plan
It is vitally important that no one, but no one, associated with a project must lose faith in the programme or the overall plan. It is one of the prime duties of a project manager to ensure that this faith exists. When small cracks do appear in this vital bridge of understanding between the planning department and the operational departments, the project manager must do everything in his power to close them before they become chasms of suspicion and despondency. It may be necessary to re-examine the plan, or change the planner or hold a meeting explaining the situation to all parties, but a plan in which the participants have no faith is not worth the paper it is drawn on.

Project Management and Network Planning 211
Having convinced all parties that the network is a useful control tool, the project manager must now ensure that it is kept up to date and the new information transmitted to all the interested parties as quickly as possible. This requires exerting a constant pressure on the planning department, or planning engineer, to keep to the ‘issue deadlines’, and equally learning on the operational departments to return the feedback documents regularly. To do this, the project manager must use a combination of education, indoctrination, charm and rank pulling, but the feedback must be returned as regularly as the issue of the company’s pay cheque.
The returned document might only say ‘no change’, but if this vital link is neglected, the network ceases to be a live document. The problem of feedback for the network is automati-cally solved when using the EVA cost control system (explained in Chapter 32), since the man-hour returns are directly related to activities, thus giving a very accurate percentage completion of each activity.
It would be an interesting and revealing experience to carry out a survey among project managers of large projects to obtain their unbiased opinion on the effectiveness of networks. Most of the managers, with whom this problem was discussed, felt that there was some merit in network techniques, but, equally, most of them complained that too much paper was being generated by the planning department.
Network and Method Statements
More and more clients and consultants require contractors to produce method statements as part of their construction documentation. Indeed, a method statement for certain complex operations may be a requirement of ISO 9000 Part I. A method statement is basically an explanation of the sequence of operations augmented by a description of the resources (i.e., cranes and other tackle) required for the job. It must be immediately apparent that a network can be of great benefit, not only in explaining the sequence of operations to the client but also for concentrating the writer’s mind when the sequence is committed to paper. In the same way the designer produces a freehand sketch of his ideas, a construction engineer will also be able to draw a freehand network to crystallize his thoughts.
The degree of detail will vary with the complexity of the operation and the requirements of the client or consultant, but it will always be a clear graphical representation of the sequences, which can replace pages of narrative. Any number of activities can be ‘extracted’ from the network for further explanation or in-depth discussion in the accompanying written statement.
The network, which can be produced manually or by computer, will mainly follow conventional lines and can, of course, be in arrow diagram or precedence format. For certain operations, however, such as structural steelwork erection, it may be

212 Chapter 28
advantageous to draw the network in the form of a table, where the operations (erect column, erect beam, plumb, level, etc.) are in horizontal rows. In this way, a highly organized, easy-to-read network can be produced. Examples of such a procedure are shown in Figs. 28.1 and 28.2. There are doubtless other situations where this system can be adopted, but the prime objective must always be clarity and ease of understanding. Complex networks only confuse clients and reflect a lack of appreciation of the advan-tages of method statements.
Integrated Systems
The trend is to produce and operate integrated project management systems. By using the various regular inputs generated by the different operating departments, these systems can, on demand, give the project manager an up-to-date status report of the job in terms of time, cost and resources. This facility is particularly valuable once the project has reached the construc-tion stage. The high cost of mainframe machines and the unreliability of regular feedback – even with the use of terminals – have held back the full utilization of computing facilities in the field, especially in remote sites. The PCs, with their low cost, mobility and ease of opera-tion, have changed all this so that effective project-control information can be generated on the spot.
A1
2
3
4
5
6
1
2
3
4
5
S
N
EW
6
B C D E F G
A B C D E F G
Mob
ile
Cra
ne tr
ack
1st l
ift2n
d lif
t
Plan
Bracing
Elevation
Crane
Tank
Tank
Level 1
Level 2
Figure 28.1Structural framing plan.

Project Management and Network Planning 213
Figure 28.2Network of method statement.

214 Chapter 28
The following list shows the types of management functions that can be successfully carried out either in the office, in the workshop or on site by a single computer installation: • Costaccounting• Materialcontrol• Plantmovement• Machineloading• Man-hourandtimesheetanalysis• Progressmonitoring• Networkanalysisandscheduling• Riskanalysis• Technicaldesigncalculations,etc.
Additional equipment is available to provide presentation in graphic form such as bar charts, histograms, S-curves and other plots. If required, these can be in a number of colours to aid in identification.
The basis of all these systems is, however, still a good planning method based on well-defined and realistic networks and budgets. If this base is deficient, all comparisons and controls will be fallacious. Therefore, the procedures described in Chapters 20 and 21 still apply. In fact, the more sophisticated the analysis and data processing, the more accurate and meaningful the base information has to be. This is because the errors tend to be multiplied by further manipulation, and the wider dissemination of the output will, if incorrect, give more people the wrong data on which to base management decisions.
Networks and Claims
From the contractor’s point of view, one of the most useful (and lucrative) applications of network presentation arises when it is necessary to formulate claims for extension of time, disruption to anticipated sequences or delays of equipment deliveries. There is no more convincing system than a network to show a professional consultant how his late supply of design information has adversely affected progress on site, or how a late delivery has dis-rupted the previously anticipated and clearly stated method of construction.
It is, of course, self-evident that to make the fullest use of the network for claim purposes, the method of construction must have been previously stated, preferably also in network form. A wise contractor will include a network showing the anticipated sequences with his tender, and indicate clearly the deadlines by which drawings, details and equipment are required.
In most cases, the network will be accepted as a fair representation of the construction programme, but it is possible that the client or consultant will try to indemnify themselves by such statements as that they (the consultant) do not necessarily accept the network as the only logical sequence of operations. Therefore, it is up to the contractor to use his skills and experience to construct the works in light of circumstances prevailing at the time.

Project Management and Network Planning 215
Such vague attempts to forestall genuine claims for disruption carry little weight in a serious discussion among reasonable people, and count even less should the claim be taken to arbitra-tion or adjudication. The contractor is entitled to receive his access, drawings and free issue equipment in accordance with his stated method of construction, as set out in his tender, and all the excuses or disclaimers by the client or consultant cannot alter this right. Those contrac-tors who have appreciated this facility have undoubtedly profited handsomely by making full use of network techniques, but these must, of course, be prepared accurately.
To obtain the maximum benefit from the network, the contractor must show the following: 1. The programme was reasonable and technically feasible. 2. It represented the most economical construction method. 3. Any delays in the client’s drawings or materials will either lengthen the overall pro-
gramme or increase costs, or both. 4. Any acceleration carried out by him to reduce the delay caused by others resulted in
increased costs. 5. Any absorption of float caused by the delay increased the risk of completion on time and
had to be countered by acceleration in other areas or by additional costs.
The last point is an important one, since ‘float’ belongs to the contractor. It is the contractor who builds it into his programme. It is the contractor who assesses the risks and decides which activities require priority action. The mere fact that a delayed component only reduces the float of an activity, without affecting the overall programme, is not a reason for withhold-ing compensation if the contractor can show increased costs were incurred.
Examples of Claims for Delays
The following examples show how a contractor could incur (and probably reclaim) costs by late delivery of drawings or materials by the employer.
Example 1
To excavate a foundation, the network in Fig. 28.3 was prepared by the contractor. The critical path obviously runs through the excavation, giving the path through the reinforcing
25
34
28
36
10
32
5
30
5
20
0
5
Pre-bentsteel deliv.
Setcages
Make upcages
Cleararea
Concrete
Assimilate
Steeldrgs
Prelimdrgs
BlindShutr.Excavate
15
2
3
2
5
210
5
15
Figure 28.3

216 Chapter 28
steel supply and fabrication a float of four days. If the drawings are delayed by four days, both paths become critical and, in theory, no delays occur. However, in practice, the contrac-tor may now find that the delay in the order for reinforcing steel has lost him his place in the queue of the steel supplier, since he had previously advised the supplier that information would be available by day 10. Now that the information was only given to the supplier on day 14, labour for the cages was diverted to another contract and, to meet the new delivery of day 29, overtime will have to be worked. These overtime costs are claimable.
In any case, the four-day float, which the contractor built in as an insurance period, has now disappeared, so even if the steel had arrived by day 29 and the cage fabrication took longer than three days, a claim would have been justified.
Example 2
The network in Fig. 28.4 shows a sequence for erecting and connecting a set of pumps. The first pump was promised to be delivered by the client on a ‘free issue’ basis in week 0. The second pump was scheduled for delivery in week 4. In the event, both pumps were delivered together in week 4. The client argued that since there was a float of 4 days on pump 1, there was no delay to the programme since handover could still be effected by week 16.
What the programme does not show, and what it need not show, are the resource restraints imposed by the contractor to give him economical working. A network submitted as a contrac-tual document need only show the logic from an operationalpointofview.Resourcerestraintsare not logic restraints since they can be overcome by merely supplying additional resources.
The contractor rightly pointed out that he always intended to utilize the float on the first set of pumps to transfer the pipe fitters and electricians to the second pump as soon as the first pump was piped up and electrically connected. The implied network, utilizing the float economi-cally, was therefore as shown in Fig. 28.5.
Now, to meet the programme, the contractor has to employ two teams of pipefitters and electricians, which may have to be obtained at additional cost from another site and certainly
Pump 1
Deliv.Erect
pumps
Erectpumps
Conn.pipes
Conn.pumps
Electconn.
Electconn.
Testrun
Days
Handover
Testrun
Deliv.
Pump 2
0
4
4
4
44
4
37
11
11 12
16 17
1
1 115
38
Figure 28.4

Project Management and Network Planning 217
requiring additional supervision if the two pumps are geographically far apart. Needless to say, if the contractor shows the resource restraints in his contract network, his case for a reimbursement of costs will be that much easier to prove.
Force Majeure Claims
The causes giving rise to force majeure claims are usually specified in the contract, and there is generally no difficulty in claiming extension of time for the period of a strike or (where permitted) the duration of extraordinary bad weather. What is more difficult to prove is the loss of time caused by the effect of a force majeure situation. It is here where a network can help the contractor to state his case.
Example 3
A boiler manufacturer has received two orders from different clients and has programmed the two contracts through his shops in such a way that as one boiler leaves the assembly area, the parts of the second boiler can be placed into position ready for assembly. The simplified network is shown in Fig. 28.6. Because the factory had only one assembly bay, boiler no. 2
12Days
16 17
11
15
7
11
4
8
0
4
Testrun
Testrun
Handover
Electconn.
Electconn.
Conn.pumps
Erectpumps
Erectpump
Deliv.
Deliv.Conn.pipes
1
1 1
4
4
3
3
4Pump 1
4Pump 2
12117
Figure 28.5
OrderNo.1
OrderNo.2
Platedeliv.
Rollplates
Weldseams Assemble Test
TestAssembleWeld
seams
Bendtube
Bendtubes
Rollplates
Platedeliv.
060
60
20
25
30
8010 90
9570
60
5
5
100100
165
165
165 170
230225
80
80
65
7570
55
5
Figure 28.6
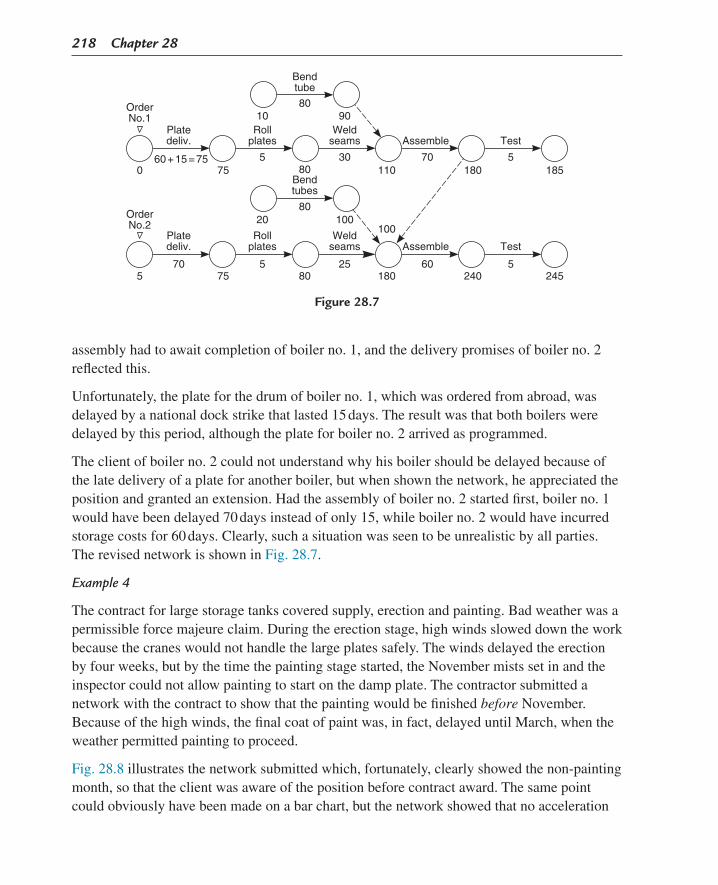
218 Chapter 28
assembly had to await completion of boiler no. 1, and the delivery promises of boiler no. 2 reflected this.
Unfortunately, the plate for the drum of boiler no. 1, which was ordered from abroad, was delayed by a national dock strike that lasted 15 days. The result was that both boilers were delayed by this period, although the plate for boiler no. 2 arrived as programmed.
The client of boiler no. 2 could not understand why his boiler should be delayed because of the late delivery of a plate for another boiler, but when shown the network, he appreciated the position and granted an extension. Had the assembly of boiler no. 2 started first, boiler no. 1 would have been delayed 70 days instead of only 15, while boiler no. 2 would have incurred storage costs for 60 days. Clearly, such a situation was seen to be unrealistic by all parties. The revised network is shown in Fig. 28.7.
Example 4
The contract for large storage tanks covered supply, erection and painting. Bad weather was a permissible force majeure claim. During the erection stage, high winds slowed down the work because the cranes would not handle the large plates safely. The winds delayed the erection by four weeks, but by the time the painting stage started, the November mists set in and the inspector could not allow painting to start on the damp plate. The contractor submitted a network with the contract to show that the painting would be finished before November. Because of the high winds, the final coat of paint was, in fact, delayed until March, when the weather permitted painting to proceed.
Fig. 28.8 illustrates the network submitted which, fortunately, clearly showed the non-painting month, so that the client was aware of the position before contract award. The same point could obviously have been made on a bar chart, but the network showed that no acceleration
OrderNo.1
OrderNo.2
Platedeliv.
Rollplates
Weldseams Assemble Test
TestAssembleWeld
seams
Bendtube
Bendtubes
Rollplates
Platedeliv.
060 + 15 = 75
75
20
25
30
8010 90
11070
60
5
5
100100
180
180 185
245240
80
80
80
7570
55
5
Figure 28.7
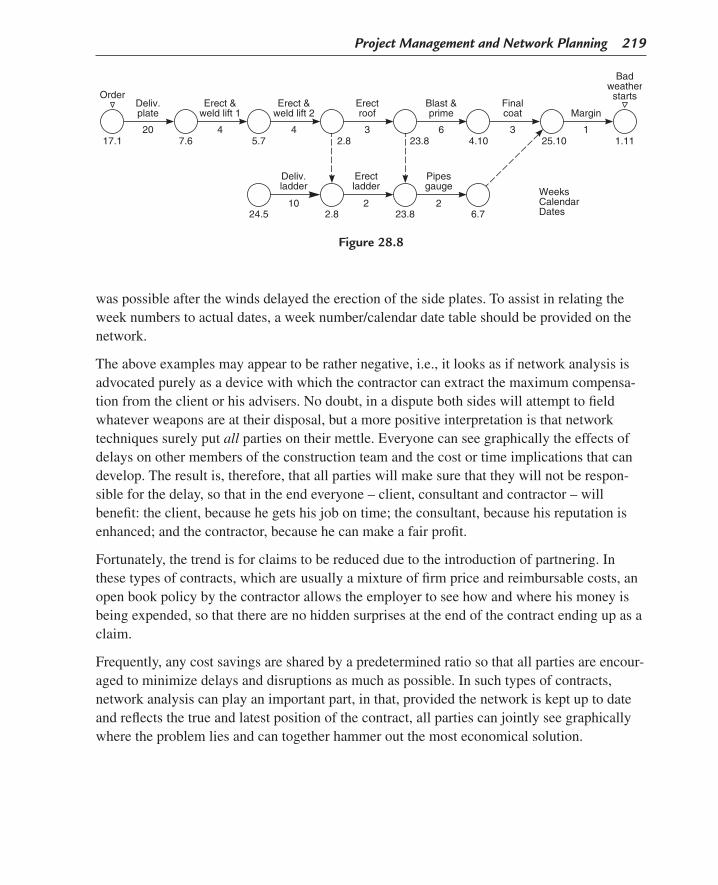
Project Management and Network Planning 219
was possible after the winds delayed the erection of the side plates. To assist in relating the week numbers to actual dates, a week number/calendar date table should be provided on the network.
The above examples may appear to be rather negative, i.e., it looks as if network analysis is advocated purely as a device with which the contractor can extract the maximum compensa-tion from the client or his advisers. No doubt, in a dispute both sides will attempt to field whatever weapons are at their disposal, but a more positive interpretation is that network techniques surely put all parties on their mettle. Everyone can see graphically the effects of delays on other members of the construction team and the cost or time implications that can develop. The result is, therefore, that all parties will make sure that they will not be respon-sible for the delay, so that in the end everyone – client, consultant and contractor – will benefit: the client, because he gets his job on time; the consultant, because his reputation is enhanced; and the contractor, because he can make a fair profit.
Fortunately, the trend is for claims to be reduced due to the introduction of partnering. In these types of contracts, which are usually a mixture of firm price and reimbursable costs, an open book policy by the contractor allows the employer to see how and where his money is being expended, so that there are no hidden surprises at the end of the contract ending up as a claim.
Frequently, any cost savings are shared by a predetermined ratio so that all parties are encour-aged to minimize delays and disruptions as much as possible. In such types of contracts, network analysis can play an important part, in that, provided the network is kept up to date and reflects the true and latest position of the contract, all parties can jointly see graphically where the problem lies and can together hammer out the most economical solution.
OrderDeliv.plate
Deliv.ladder
Erectladder
Pipesgauge
Erect &weld lift 1
Erect &weld lift 2
Erectroof
Blast &prime
Finalcoat Margin
WeeksCalendarDates
Badweatherstarts
17.1 7.6 5.7
24.5 23.82.8 6.7
2.8 23.8 4.10 25.104
10
3
2 2
6 3 11.11
420
Figure 28.8

This page intentionally left blank

221Project Management, Planning and Control. http://dx.doi.org/10.1016/B978-0-08-102020-3.00029-2Copyright © 2017 Elsevier Ltd. All rights reserved.
CHAPTER 29
Network Applications Outside the Construction IndustryChapter OutlineBringing a New Product onto the Market 221Moving a Factory 223Centrifugal Pump Manufacture 225Planning a Mail Order Campaign 226Manufacture of a Package Boiler 228Manufacture of a Cast Machined Part 230
Most of the examples of network analysis in this book are taken from the construction industry, mainly because network techniques are particularly suitable for planning and progressing the type of operations found in either the design office or on a site. However, many operations outside the construction industry that comprise a series of sequential and/or parallel activities can benefit from network analysis – indeed, the Polaris project is an example of such an application.
The following examples are included, therefore, to show how other industries can make use of network analysis, but as can be seen from Chapter 26, even the humble task of getting up in the morning can be networked. When network analysis first came into existence, a men’s magazine even published a critical path network of seduction!
Bringing a New Product onto the Market
The operations involved in launching a new product require careful planning and coordina-tion. The example shows how network techniques were used to plan the development, manu-facture and marketing of a new type of water metre for use in countries where these are installed on all premises.
The list of operations is first grouped into five main functions:
A ManagementB Design and developmentC ProductionD Purchasing and supplyE Sales and marketing

222 Chapter 29
Each main function is then divided into activities that have to be carried out in defined sequences and by specific times. The management function would therefore include the following of product:
The design and development function would consist of:
Once the decision has been made to proceed with the water metre, the production department will carry out the following activities:
The purchasing and supply function involves the procurement of all the necessary raw materials and bought-out items, and includes the following activities:
A–1 Definition of product Size, range, finish, production rate, etc.2 Costing Selling price, manufacturing costs3 Approvals for expenditure Plant materials, tools and jigs, storage
advertising, training, etc.4 Periodic reviews5 Instruction to proceed with stages
B–1 Product design brief2 Specification and parts list3 Prototype drawings4 Prototype manufacture5 Testing and reports6 Preliminary costing
C–1 Production planning2 Jig tool manufacture3 Plant and machinery requisition4 Production schedules5 Materials requisitions6 Assembly line installation7 Automatic testing8 Packing bay9 Inspection procedures
10 Labour recruitment and training11 Spares schedules
D–1 Material enquiries2 Bought-out items enquiries3 Tender documents4 Evaluation of bids5 Long-delivery orders6 Short-delivery orders7 Carton and packaging8 Instruction leaflets, etc.9 Outside inspection

Network Applications Outside the Construction Industry 223
The sales and marketing function will obviously interlink with the management function and consists of the following activities:
E−1 Sales advice and feedback2 Sales literature Photographs, copying, printing, films,
displays, packaging3 Recruitment of sales staff4 Sales campaign and public relations5 Technical literature Scope and production6 Market research
Obviously, the above breakdowns are only indicative and the network shown in Fig. 29.1 gives only the main items to be programmed. The actual programme for such a product would be far more detailed and would probably contain about 120 activities.
The final presentation for those who prefer it could then be in a bar chart form covering a time span of approximately 18 months from conception to main production run.
Moving a Factory
One of the main considerations in moving the equipment and machinery of a manufacturing unit from one site to another is to carry out the operation with the minimum loss of produc-tion. Obviously, at some stage manufacturing must be halted unless certain key equipment is duplicated, but if the final move is carried out during the annual works’ holiday period the loss of output can be minimized.
Consideration must therefore be given to the following points: 1. Identifying equipment or machines which can be temporarily dispensed with; 2. Identifying essential equipment and machines; 3. Dismantling problems of each machine; 4. Re-erection on the new site; 5. Service connections; 6. Transport problems – weight, size, fragility, route restrictions; 7. Orders in pipeline; 8. Movement of stocks; 9. Holiday periods; 10. Readiness of new premises; 11. Manpower availability; 12. Overall cost; 13. Announcement of move to customers and suppliers; 14. Communication equipment (telephone, e-mail, fax); 15. Staff accommodation during and after the move; 16. Trial runs; and 17. Recruitment and staff training.

224 C
hapter 29
Defineproduct
Assy. linedrgs
Supplierlist
Packagedesign
Photos
Writesales lit
Fieldcampaign
Leafletdesign
Test rigdrg.
Jigdesign
Designbrief
Prelimcost
Tenderdocs
Tenderdocs
Packagetender
Printlit.
Evacuateresponse
Tenderperiod
Test rigmanuf.
Jigtender
Tooltender
Recruitlabour
Techreview
Spec
Prototypedesign
Approvestage 1
Tenderperiod
Tenderperiod
Tenderperiod
Mailinglists
Review
Tenderperiod
Test rigassy.
Delivery
Delivery Train
Jigassy.
Delivery
Evaluate
Evaluate
Maillit.
Delivery
Evaluate
Partslist
Drgs
Prototypemanuf
Assy. linelayout
Boughtitems
Re-cost
Assy. lineassembly
Shortdelivery
Delivery
Recruitstaff
Evaluateresponse
Longdelivery
Assembly
Equipmentlist
Approvestage 2
Pilotrun
Tests
Mock-up
Finalcost
Test
Productionrun
Report
Report
1
aAManagement
b
BDesign and
development
c
CProduction
d
= Purchaseorder
e
DPurchasingand supply
f
ESales andMarketing
g
h
j
k
l
m
n
p
q
2 3 4 5 6 7 8 9Approvestages
Pack
Test
Pack
Figure 29.1New product.

Network Applications Outside the Construction Industry 225
By collecting these activities into main functions, a network can be produced that will facili-tate the organization and integration of the main requirements. The main functions would therefore be:
A Existing premises and transportB New premises – commissioningC Services and communicationsD Production and salesE Manpower, staffing
The network for the complete operation is shown in Fig. 29.2. It will be noticed that, as with the previous example, horizontal banding (as described in Chapter 19) is of considerable help in keeping the network disciplined.
By transferring the network onto a bar chart, it will be possible to arrange for certain activities to be carried out at weekends or holidays. This may require a rearrangement of the logic, which, though not giving the most economical answer in a physical sense, is still the best overall financial solution when production and marketing considerations are taken into account.
Centrifugal Pump Manufacture
The following network shows the stages required for manufacturing centrifugal pumps for the process industry. The company providing these pumps has no foundry, so the un-machined castings have to be bought in.
Assuming that the drawings for the pump are complete and the assembly line set-up, a large order for a certain range of pumps requires the following main operations: 1. Order castings – bodies, impellers, etc.; 2. Order raw materials for shafts, seal plates, etc.; 3. Order seals, bearings, keys, bolts; 4. Machine castings, impellers, shafts; 5. Assemble; 6. Test; 7. Paint and stamp; 8. Crate and dispatch; and 9. Issue installation and maintenance instructions and spares list.
Fig. 29.3 shows the network of the various operations complete with coordinate node num-bers, durations and earliest start times. The critical path is shown by a thickened line and total float can be seen by inspection. For example, the float of all the activities on line C is 120 − 48 = 72 days. Similarly, the float of all activities on line D is 120 − 48 = 72 days.
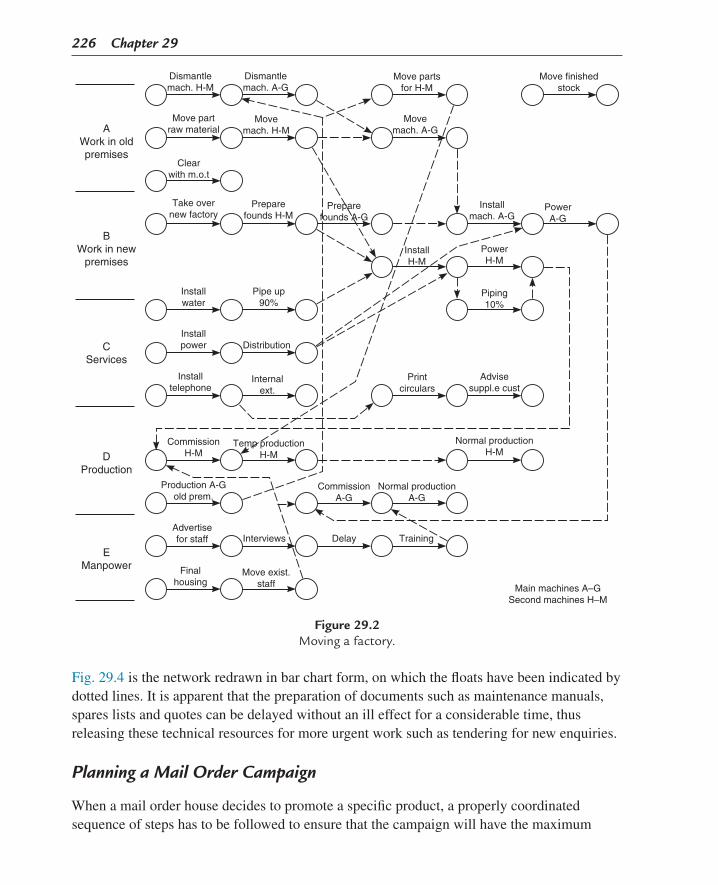
226 Chapter 29
Fig. 29.4 is the network redrawn in bar chart form, on which the floats have been indicated by dotted lines. It is apparent that the preparation of documents such as maintenance manuals, spares lists and quotes can be delayed without an ill effect for a considerable time, thus releasing these technical resources for more urgent work such as tendering for new enquiries.
Planning a Mail Order Campaign
When a mail order house decides to promote a specific product, a properly coordinated sequence of steps has to be followed to ensure that the campaign will have the maximum
Dismantlemach. H-M
Take overnew factory
Installwater
Installpower
Installtelephone
CommissionH-M
Advertisefor staff
Production A-Gold prem.
Finalhousing
Printcirculars
Training
Normal productionA-G
InstallH-M
Move partraw material
Clearwith m.o.t
Dismantlemach. A-G
Preparefounds H-M
Pipe up90%
Distribution
Internalext.
Temp productionH-M
Interviews Delay
CommissionA-G
Move exist.staff
Advisesuppl.e cust
Normal productionH-M
PowerH-M
Piping10%
Movemach. H-M
Move partsfor H-M
Preparefounds A-G
Movemach. A-G
Move finishedstock
PowerA-G
Installmach. A-G
AWork in oldpremises
BWork in new
premises
CServices
DProduction
EManpower
Main machines A–GSecond machines H–M
Figure 29.2Moving a factory.

Network Applications Outside the Construction Industry 227
impact and success. The following example shows the activities required for promoting a new set of record albums and involves both the test campaign and the main sales drive.
The two stages are shown separately on the network (Fig. 29.5) since they obviously occur at different times, but in practice intermediate results could affect the management decisions on packaging and text on the advertising leaflet. At the end of the test, shot management will have to decide on the percentage of records to be ordered to meet the initial demand.
In practice, the test shot will consist of three or more types of advertising leaflets and record packaging, and the result of each type will have to be assessed before the final main campaign leaflets are printed.
Depending on the rate of return of orders, two or more record-ordering and dispatch stages will have to be allowed for. These are shown on the network as b1 and b2.
110
5
90
48
48
48
121
125
126.5
30
4
30
18
18
18
120
120
54
9848
124.5
124.5
126
28
3
28
17
17
17
119
98
54
124
124
39
25
7 A
2
7 B
3 C
3 D
3 E
117 F
97 G
53 H
123 J
39 K
18.5 L
20 M
0
1
0
0
0
0
122
18
18
18
Manufacture
Do
Delivery
Delivery
Inspection
Assembly
Paint
Invoice
Evaluate
Do
Do
Do
Do
Drillbody
Balance
Stamp
Test cert
Tenderperiod
Do
Do
Do
Do
Machinebody
Machineimpeller
Machineshaft
Vol andpress test
Advicenote
Sparesquote
Tender docpump body
Tender doc.impeller
Tender doc.bearings
Tender doc.seals
Tender doc.shaft steel
Assembleon test rig
Maintenancemanual
Preparedocuments
Spareslist
80
60
30
30
30
1
0.5
0.5
2
2
1
1
1
1
0.5
3
21
21
14
14
2
1
1
1
0.5
5
1
1
0.5
2
IProcurementand outsideinspection
IIMachining
andassembly
IIITest anddespatch
IVDocuments
117
7
97
126
112
6
92
53
122
125.5
Delivery
Do
Despatch
Inspection
Do
Delivery
Inspection
Crate
5
5
0.539
2
2
5
1
0.5
7
7
3
3
3
Figure 29.3Pump manufacture (duration in days).

228 Chapter 29
A
B
C
D
E
1
1
1
1
1
1
1
2
2
2
2
2
2
2
2
2
2
2
2
2
2
2
22
3
3
3
3
3
2
3
3
3
3
3
3
3
3
3
3
3
4
4
4
4
4
7
5
3
3
3
4
4
4
4
4
4
4
4
5
5
5
5
5
5
4
4
4
4
5
5
5
56
6
6
6
6
76
32
A
B
C
D
E
C
D
E
F
G
KK
L
M1M
L1L2
G
J
H
B
B
A5
56
67A
0 20
Critical pathFloat
40
A1A2A3A4A5A6B1B2B3B4B5B6C1C2C3C4D1D2D3D4E1E2E3E4E5F2F3G2G3G4G5H2J1J2J3J4J5J6K1K3L1L2L4M1M2
Beg.A2A3A4A5A6A7B2B3B4B5B6B7C2C3C4C5D2D3D4D5E2E3E4E5E6F3F4G3G4G5G6H3J2J3J4J5J6J7K2K4L2L3L5M2M3
End7
212
8025722
60253
141
303
141
303
121
305211111111.5.5.5.521.5.5.5.525
D
60 80
Days
100 120
Figure 29.4Pump manufacture – critical path analysis.
Manufacture of a Package Boiler
The programme in this example covers the fabrication and assembly of a large package boiler of about 75,000 kg of superheated steam per hour at 30 bar g and a temperature of 300°C. The separate economizer is not included.

Network Applications Outside the Construction Industry 229
Delivery
Finalize pamphletfor b
Waitingperiod
Waitingperiod
Pack & dispb1
Pack & dispb2
Invoice b1 Invoice b2
Waitingperiod
Finalize packfor b
Processreplies 2
Printinga1 a2 a3
Order packinga1 a2 a3
Deliver‘free ride’
Mail finalb pamphlets
Delivery
Delivery
Increasepacking line
Mail pamphletsa1 a2 a3
Deliverpacking
Assessreturn
records
Processreplies 1
Prepareenvelopes
Approval
Deliverrecords a
Approval
Print‘free ride’
Issue packinstruction
Prepareenvelopes
Delivery
Order recordsb1
Order recordsb2
Delivery
Recruitlabour
Compile maillist a
Write copya1 a2 a3
Orderrecords a
Design packinga1 a2 a3
Decide on‘free ride’
Assessreplies
Set uppacking line
Compile maillist b
Order & print b pamphlet
Assess prelimb orders
Order printb pack
Testcampaign
A
Testcampaign
B
Print packinga1 a2 a3
Pack &dispatcha1 a2 a3
Figure 29.5Mail order campaign.
The drum shells, drum ends, tubes, headers, doors and nozzles are bought out, leaving the following manufacturing operations: 1. Weld drums (longitudinal and circumferential seams); 2. Weld on drum ends; 3. Weld on nozzles and internal supports; 4. Drill drum for tubes; 5. Stress relieve top and bottom drums;

230 Chapter 29
6. Bend convection bank tubes; 7. Fit and expand tubes in drums – set up erection frame; 8. Weld fins to furnace tubes, pressure test; 9. Produce waterwall panels; 10. Gang bend panels; 11. Erect wall panels; 12. Weld and drill headers; stress relieve; 13. Weld panels to headers; 14. Weld on casing plates; 15. Attach peepholes, access doors, etc.; 16. Pressure test; 17. Seal-weld furnace walls; 18. Fit burners and seals; 19. Air test – inspection; 20. Insulate; 21. Prepare for transport; and 22. Dispatch.
There are four main bands in the manufacturing programme:
The programme assumes that all materials have been ordered and will be available at the right time. Furthermore, in practice, sub-programmes would be necessary for panel fabrication, which includes blast cleaning the tubes and fin bar, automatic welding, interstage inspection, radiography and stress relieving. Fig. 29.6 shows the main production stages covering a period of approximately 7 months.
Manufacture of a Cast Machined Part
The casting, machining and finishing of a steel product can be represented in network form as shown in Fig. 29.7. It can be seen that the total duration of the originally planned operation is 38 hours, but the aim was to reduce this manufacturing period to make this product more competitive. By incorporating the principle, that efficiency can be increased if some of the operations on a component can be performed while it is on the move between workstations, it is obviously possible to reduce the overall manufacturing time. The obvious activities that can be carried out while the component is actually being transported (usually on a conveyor system) is cooling off, painting and paint drying. As can be seen from Fig. 29.8 such a change in the manufacturing procedure saves 3 hours.
A Drum manufactureB Panel and tube manufactureC AssemblyD Insulation and preparation for dispatch

Weld intern.supp. & stubs
Do
Gang bend
Weld onpeep holes
Form burneropening
Stressrelieve
Weldheader
FitD-wall
Fitintervals
Weld pins
Insulation
Prep. fortransport
Stressrelieve
Do
Weld onstuds
Presstest
Presstest
Refractseals
Weld drumends
Radiograph
Radiograph
Do
Do
Do
Weld up panel
Drillholes
Weldlugs
Fit conv. bank& expand
Erectrisers
Fitroof
Air test
Final check
Drill tubeholes
Do
Attachheaders
Attachheaders
Assembles.h.
Removeframe
Fitsuper heat
Installrefract
Cladding
Dispatch
Weld drumcircumference
Do
Do
Do
Fin weld
Weld ends andradiograph
Bend convecttubes
Bend s.h.tubes
Setdrums
Erect rearpanel
Seal weld
Fit burners
Name plate
Weld drumlongitudinal
Do
Do
Do
Clean tubes
Weldnozzles
Cleantubes
Erect const.frame
Erect frontpanel
Fit casing
A
B
C
D
WaterDrum
SteamDrum
D-wallPanel
RearWall
FrontWall
Headers
Tubes
Superheater
Erection
Insulation
Finishes
Figure 29.6Boiler manufacture.
Figure 29.7(Original).

232 Chapter 29
Any further time savings now require a reduction in duration of some of the individual activities. The first choice must obviously be those with the longest durations, i.e., 1. Make pattern (8 hours); 2. Cool off (6 hours); and 3. Dry paint (8 hours).
These operations require new engineering solutions. For example, in activity (1), the pattern may have to be split, with each component being made by a separate pattern maker. It may also be possible to subcontract the pattern to a firm with more resources. Activity (2) can be reduced in time by using forced-draught air to cool the casting before fettling. Care must, of course, be taken not to cool it at such a rate that it causes cracking or other metallurgical changes. Conversely to activity (2), the paint drying in activity (3) can be speeded up by blowing warm air over the finished component. If the geographical layout permits, it may be possible to take the heated air from the cooling process, pass it through a filter and use it to dry the paint.
Further time reductions are possible by reducing the machining time of the milling and drilling operations. This may mean investing in cutters or drills that can withstand higher cutting speeds. It may also be possible to increase the speed of the different conveyors, which, even on the revised network, make up 1 hour of the cycle time.
For those planners who are familiar with manufacturing flow charts it may be an advantage to draw the network in precedence (activity on node) format (see Chapter 19). Such a represen-tation of the initial and revised networks is shown in Figs. 29.9 and 29.10, respectively.
Figure 29.8(Revised).

Network Applications Outside the Construction Industry 233
Figure 29.9(Original).
Figure 29.10(Revised).

234 Chapter 29
It is important to remember that the network itself does not reduce the overall durations. Its first function is to show in a graphic way the logical interrelationship of the production processes and the conveying requirement between the manufacturing stages. It is then up to the production engineer or controller to examine the network to see where savings can be made. This is, in fact, the second function of the network – to act as a catalyst for the thought processes of the user to give him the inspiration to test a whole series of alternatives, until the most economical or fastest production sequence has been achieved.
The use of a PC at this stage will, of course, enable the various trial runs to be carried out quite rapidly, but, as can be seen, even a manual series of tests takes no longer than a few minutes. As explained in Chapter 21, the first operation is to calculate the shortest forward pass – a relatively simple operation – leaving the more complex calculations of float to the computer when the final selection has been made.
235Project Management, Planning and Control. http://dx.doi.org/10.1016/B978-0-08-102020-3.00030-9Copyright © 2017 Elsevier Ltd. All rights reserved.
CHAPTER 30
Resource Loading
Chapter OutlineThe Alternative Approach 236Further Reading 241
Most of the modern computer programs incorporate facilities for resource loading, resource allocation and resource smoothing. Indeed, the Primavera P6 program shown in Chapter 51 features such a capability.
In principle, the computer aggregates a particular resource in any time period and compares this with a previously entered availability level for that resource. If the availability is less than the required level, the program will either: 1. Show the excess requirement in tabular form, often in a different colour to highlight the
problem; or 2. Increase the duration of the activity requiring the resource to spread the available
resources over a longer period, thus eliminating the unattainable peak loading.
The more preferable action by the computer is option (1), i.e., the simple report showing the overrun of resources. It is then up to management to make the necessary adjustments by either extending the time period – if the contractual commitments permit – or mobiliz-ing additional resources. In practice, of course, the problem is complicated by such issues as available access or working space as well as financial, contractual or even political restraints. Often it may be possible to make technical changes that alter the resource mix. For example, a shortage of carpenters used for formwork erection may make it necessary to increase the use of precast concrete components with a possible increase in cost but a decrease in time. Project management is more than just writing and monitoring programs. The so-called project management systems marketed by software companies are really only there to present to the project manager, on a regular basis, the position of the project to date and the possible consequences unless some form of remedial action is taken. The type of action and the timing of it rest fairly and squarely on the shoulders of management.

236 Chapter 30
The options by management are usually quite wide, provided sufficient time is taken to think them out. It is in such situations that the ‘what if’ scenarios are a useful facility on a com-puter. However, the real implication can only be seen by ‘plugging’ the various alternatives into the network on paper and examining the downstream effects in company with the various specialists, who, after all, have to do the actual work. There is no effective substitute for good teamwork.
The Alternative Approach
Resource smoothing can, of course, be done very effectively without a computer – especially if the program is not very large. Once a network has been prepared, it is very easy to convert it into a bar chart, since all the ‘thinking’ has already been completed. Using the earliest starting and finishing times, the bars can be added to the gridded paper in minutes. Indeed, the longest operation in drawing a bar chart (once a network has been completed) is writing down the activity descriptions on the left-hand side of the paper. By leaving sufficient vertical space between the bars and dividing the grid into week (or day) columns, the resource levels for each activity can be added. Generally, there is no need to examine more than two types of resources per chart, since only the potentially restrictive or quantitatively limited ones are of concern. When all the activity bars have been marked with the resource value, each time period is added up vertically and the total entered in the appropriate space. The next step is to draw a histogram to show the graphical distribution of the resources. This will immediately highlight the peaks and troughs, and trigger off the next step – resource smoothing.
Manual resource smoothing is probably the most practical method, since unprogrammable factors such as access, working space, hard-standing for cranes, personality traits of foremen, etc., can only be considered by a human when the smoothing is carried out. Nevertheless, the smoothing operation must still follow the logical pattern given below: 1. Advantage should be taken of float. In theory, activities with free float should be the first
to be extended, so that a limited resource can be spread over a longer time period. In practice, however, such opportunities are comparatively rare, and for all normal opera-tions, all activities with total float can be used for the purpose of smoothing. The floats can be indicated on the bars by dotted line extensions, again read straight off the net-work by subtracting the earliest from the latest times of the beginning node of the activity.
2. When the floats have been absorbed and the resources are distributed over the longer activity durations, another vertical addition is carried out from which a new histogram can be drawn. A typical network, bar chart and histogram are shown in Fig. 30.1.
3. If the peaks still exceed the available resources for any time period, logic changes will be required. These changes are usually carried out on the network, but it may be possible to

Resource Loading 237
make some of them by ‘sliding’ the bars on the bar chart. For example, a common problem when commissioning a process or steam-raising plant is a shortage of suitably qualified commissioning engineers. If the bars of the bar chart are cut out and pasted onto cardboard, with the resources written against each time period on the activity bar, the various opera-tions can be moved on the time-scaled bar chart until an acceptable resource level is obtained. The reason it is not always necessary to use the network is that in a commission-ing operation there is often considerable flexibility as to which machine is commissioned first. Whether pump A is commissioned before or after compressor B is often a matter of personal choice rather than logical necessity. When an acceptable solution has been found, the strips of bar can be held on to the backing sheet with an adhesive putty (Blu-Tack) and (provided the format is of the necessary size) photocopied for distribution to interested parties.
2312 19
12
10
8
4
7
4
0
0
0
Ae AfAdAcAb
BcBbBa
Aa
74 42
4
6
1
2
7
4
Aaxy
Resource X
Resource Y
52
12
34
11
47
12
34
–1
46
12
34
45
12
33
2.54
51
Histogram for ‘X’
23
2.53
51
22
2.53
51
22
31
11
2–
1.52
51
11
1.51
51
11
23
12
11
13
12
–1
32
32
32
32
32
32
22
22
22
22
11
11
11
11
21
21
21
21
11
11
1–
1–
xy
xy
xy
xy
xy
xy
xy
xy
Ab 7
Ac 6
Ad 5
Ae 4
Res
ourc
es
Af 3
Ba 2
Bb 1
Bc 0
0 1 2 3 4 5 6 7 8 9 10 11 12 13 14 15 16 17 18 19 20 21 22 23 24
Figure 30.1Bar chart and histogram.

238 Chapter 30
4. If the weekly (or daily) aggregates are totalled cumulatively it is sometimes desirable to draw the cumulative curve (usually known as the S-curve, because it frequently takes the shape of an elongated letter S), which gives a picture of the build-up (and run-down) of the resources over the period of the project. This curve is also useful for showing the cumulative cash flow, which, after all, is only another resource. An example of such a cash-flow curve is given in Chapter 45.
The following example shows the above steps in relation to a small construction project where there is a resource limitation. Fig. 30.2 shows the activity on arrow configuration and Fig. 30.3 shows the same network in activity on node configuration. Fig. 30.4 shows their translation into a bar (or Gantt) chart where the bars are in fact a string of resource numbers.
9
9
11
11
5
8
7
5
17
17
3
7
5
15
15
16
2
3
3
3
12
15
0
04
1
4
6
Network (weeks)
D
K
N
Q
2
1
2
C
J
M
2
1
S
R
18
1T
1
4
2
B
H
L
3
1
F
P
2
3
A
G
3
4
E
O
Figure 30.2
2A
1B
2C
4D
3E
3F
3G
4H
2L
1J
2M
1K
4N
6Q
4O
1P
2S
1R
1T
15
0
3
3
7
5
8
7
5
11
15
16
17
12 12 150 2 2 3 3 5 5 9 9
3
7
5
8
7
9
11
11
15 16
17
17
18
Weeks
Figure 30.3

Resource Loading 239
For simplicity, all the resources shown are of the same type (e.g., welders). By adding up the resources of each week, a totals table can be drawn, from which it can be seen that in week 9 the resource requirement is 14. This amount exceeds the availability, which is only 11 welders, and an adjustment is therefore necessary. Closer examination of the bar chart reveals a low resource requirement of only 6 in week 12. A check on the network (Fig. 30.2) shows that there is 15 − 9 = 6 weeks’ float on activity K. This activity can therefore be used to
R = Resource per weekResource table (early start)X = FloatMAX R = 11
Time taken todraw table and curve:Start 11.38 4 minFinish 11.42Time 19 acts = 4 minTime 200 acts = 45 min
Act R
A 3 3 3
3 33
4
4 4 4 4
4
4 4 4 4
4 4
2
2
2
XX
XXX
X X XX41
2
2
5 5
2
2 2 2
23
3 3 3 3 X X X X XX
X
33
3 3 3
3 3 3
150140130120110100908070
605040
3020
10
2
2 2 2
4
24
23321
452
34
23242
6
6
6
6 12 19 28 37 48 59 70 80 88 96 106 113 120 127 133 139 141
6
7
7
9
9
9
9
11
11
11
11
14
11
14
10 8
8
8
8
10
6 6
6
6
6
2
2
7
7
7
7
7
7121086420
BC
DE
FGH
JKLMNO
PQ
RST
1 2 3 4 5 6 7 8 9 10 11 12 13 14 15 16 17 18
Total
Rev.
His
togr
am
WeeksRevised
histogram
Cum. reso
urces
Figure 30.4Histogram and ‘S’ curve.

240 Chapter 30
smooth the resources. By delaying activity K by three weeks, the resource requirement is now:
Week 9, –10Week 12, –10
A histogram and a cumulative resource curve are drawn from the revised totals table. The latter can also be used as a planned performance curve, as the resources (if men) are directly proportional to man-hours. It is interesting to note that any ‘dip’ or ‘peak’ in the cumulative resource curve indicates a change of resource requirement, which should be investigated. A well-planned project should have a smooth resource curve following approximately the shape of letter S.
The method described may appear to be lengthy and time-consuming, but the example given by Figs. 30.2 (or 30.3) and 30.4, including the resource smoothing and curve plotting, took exactly 6 minutes. Once the activities and resources have been listed on graph paper, the bar chart drafting and resource smoothing of a practical network of approximately 200 activities can usually be carried out in about 1 hour.
Most of the modern computers’ project-management programs have resource smoothing facilities, which enable the base to be re-positioned on the screen to give the required resource total for any time period.
However, it is advisable not to do this automatically as the machine cannot make allowances for congestion of work area, special skills of operators, clients’ preferences and other factors only apparent to the people on the job.
Fig. 30.5 shows the relationship between the networks, bar chart, histogram and cumulative S-curve.
It should be noted that the term used for redistributing the resources was ‘resource smooth-ing’. Some authorities also use the term ‘resource levelling’, by which they mean flattening out the histogram to keep the resource usage within the resource availability for a particular time period. However, to do this without moving the position of some of the activities is just about impossible. Whether the resources are ‘levelled’ to reduce the unacceptable peaks due to resource restraints or ‘smoothed’ to produce a more even resource usage pattern, activities have to be readjusted along the time scale by utilizing the available float. To ascribe different meanings to the terms smoothing and levelling is therefore somewhat hair-splitting, since in both cases the operations to be carried out are identical. If the resource levels are so restricted that even the critical activities have to be extended, the project completion will inevitably be delayed.

Resource Loading 241
Further Reading
Schwindt, C. (2005). Resource allocation in project management. Springer.
Figure 30.5Network, bar chart, histogram and ‘S’ curve.

This page intentionally left blank
243Project Management, Planning and Control. http://dx.doi.org/10.1016/B978-0-08-102020-3.00031-0Copyright © 2017 Elsevier Ltd. All rights reserved.
CHAPTER 31
Cash-Flow Forecasting
Chapter OutlineExample of Cash-Flow Forecasting 244
It has been stated in Chapter 30 that it is very easy to convert a network into a bar chart, especially if the durations and week (or day) numbers have been inserted. Indeed, the graphi-cal method of analysis actually generates the bar chart as it is developed.
If we now divide this bar chart into a number of time periods (say, weeks or months) it is possible to see, by adding up vertically, what work has to be carried out in any time period. For example, if the time period is in months, then in any particular month we can see that one section is being excavated, other is being concreted and another is being scaffolded and shuttered, etc.
From the description, we can identify the work and can then find the appropriate rate (or total cost) from the bills of quantities. If the total period of that work takes 6 weeks and we have used up 4 weeks in the time period under consideration, then approximately two-thirds of the value of that operation has been performed and could be certificated.
By this process, it is possible to build up a fairly accurate picture of anticipated expenditure at the beginning of the job, which in itself might well affect the whole tendering policy. Provided the job is on programme, the cash flow can be calculated, but, naturally, due allow-ance must be made for the different methods and periods of retentions, billing and reimburse-ment. The cost of the operation must therefore be broken down into six main constituents: • Iabour• Plant• Materialsandequipment• Subcontracts• Siteestablishment• Overheadsandprofit
By drawing up a table of the main operations as shown in the network, and splitting up the cost of these operations (or activities) into the six constituents, it is possible to calculate the

244 Chapter 31
average percentage what each constituent contains in relation to the value. It is very impor-tant, however, to deduct the values of the subcontracts from any operation and treat these subcontracts separately. The reason for this is, of course, that a subcontract is self-contained and is often of a specialized nature. To break up a subcontract into labour, plant, materials, etc., would not only be very difficult (since this is the prerogative of the subcontractor) but would also seriously distort the true distribution of the remainder of the project.
Example of Cash-Flow Forecasting
The simplest way to explain the method is to work through the example described in Figs. 31.1–31.6. This is a hypothetical construction project of three identical simple unheated warehouses with a steel framework on independent foundation blocks, profiled steel roof and
Roof sheeting
Side sheeting
Steel frame(painted)
R.C slab
Mass concrete base
Cross section of building(unheated warehouse)
Site clearance movement
G.L.
BIg.‘A’
BIg.‘B’
BIg.‘C’
Contract value £488 400Programme period 40 weeks = 10 payment periodsRetentions 10%Payment delays:–
In period = 0 + 1 month + 2 months
Labouroh & p (direct & s/c)
Sub contractSite establ
PaintMaterials
Figure 31.1Warehouse building.

Cash-Flow
Forecasting 245
1
Building ‘C’
Building ‘B’
Building ‘A’
2
Site clear Site clear Site clear
Founds exc
Founds exc
Founds conc
Founds conc
Harden
Harden
Steel erect
Steel erect
Re-bar lay
Re-bar lay
Slab conc
Slab conc
Roof sheet
Roof sheet
Sides sheet
Sides sheet
Paint
Paint
2
22 2
4
5
15
10
6 7 8 9 10 11 12 13 14
33
4 6
4
4 4 4 23 3 5 22
4 3 3 5 342 2
6 1210
14 16 20 23 27 29 32 38 40
16
16 17 18 19 20 21 22 23 24
Founds exc Founds conc Harden Steel erect Re-bar lay Slab conc Roof sheet Sides sheet Paint
40
831
4 4 4 23 3 5 2212 14 18 21 25 27 30 36 38
41 42 43 44 45 46 47 48 49
Founds exc Founds conc Harden Steel erect Re-bar lay Slab conc Roof sheet Sides sheet Paint
60
629
4 4 4 23 3 5 2210 12 16 19 23 25 28 34 36
61 62 63 64 65 66 67 68 69
19 23 25 28 33 36
Founds exc Founds conc Harden Steel erect Re-bar lay Slab conc Roof sheet Sides sheet Paint30 31 32 33 34 35 36 37 38 39
4 4 3 3 5 342 2
4 8 10 14 17 21 23 25 31 34
Founds exc Founds conc Harden Steel erect Re-bar lay Slab conc Roof sheet Sides sheet Paint
50 51 52 53 54 55 56 57 58 594 4 3 3 5 342 2
2 86 12 15 19 21 24 29 32
3
Durations in weeks
Figure 31.2Construction network.
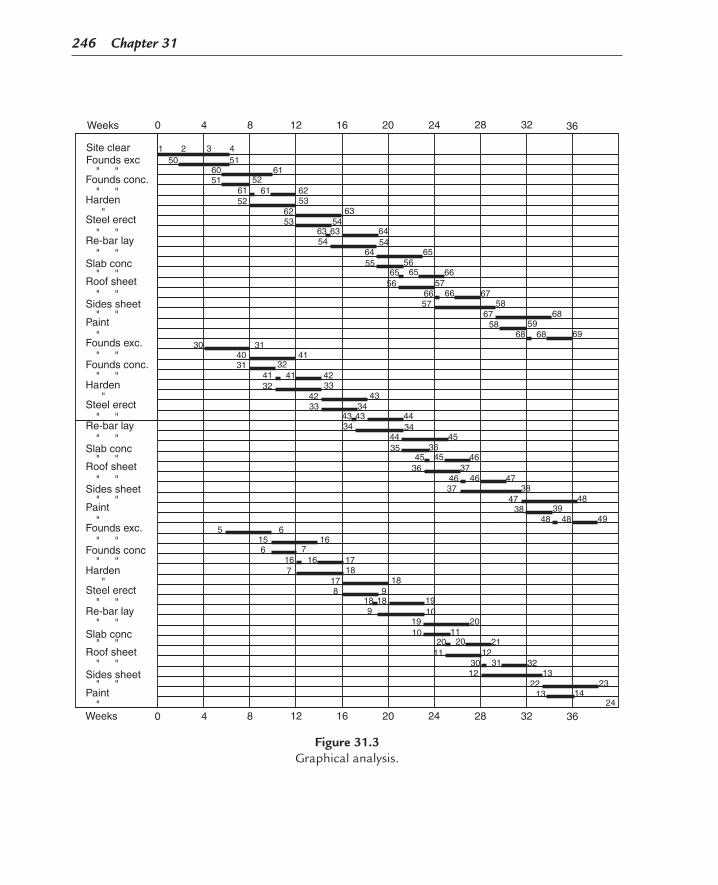
246 Chapter 31
Weeks 0 4 8 12 16 20 24 28 32 36
Site clearFounds exc
1 250 51
52
52
5160 61
63
6253
636354
5464
65
66
6758
595868 68
68
69
67
5766 66
65 655564
56
56
57
54
6253
6161
30 31
32
32
3140 41
43
4233
434334
3444
45
46
4738
393848 48
48
49
47
3746 46
45 453544
36
36
37
34
4233
4141
5 6
7
7
615 16
18
1718
18189
1019
20
21
3213
141323
24
22
1230 31
20 201019
11
11
12
9
178
1616
3 4
Founds conc.
Harden
Steel erect
Re-bar lay
Slab conc
Roof sheet
Sides sheet
Paint
Founds exc.
Founds conc.
Harden
Steel erect
Re-bar lay
Slab conc
Roof sheet
Sides sheet
Paint
Founds exc.
Founds conc
Harden
Steel erect
Re-bar lay
Slab conc
Roof sheet
Sides sheet
Paint
Weeks 0 4 8 12 16 20 24 28 32 36
Figure 31.3Graphical analysis.

Cash-Flow
Forecasting 247
One building Units in $ × 100
ActivityDurationweeks
Totalvalue
Clear site
Founds exc.
Founds conc.
Steel erect
Re-bar lay
Slab conc.
Sides sheet
Paint
Total direct
Total sub-contr.
Grand total
For 3 blgs
Roof sheet
" "
" "
" "
" "
" "
" "
" "
"
2 62
94
9471
71
220
220106
106
717166
66
66
44
743 250
885
1628
4884
100100
2
2
2
2
3
3
3
3
3
2
5
5
44
4
4
Labour Plant Materials Sub Contr Site Estb. OH & P
Value % Value % Value % Value % Value % Value %
3040
4020
20
2020
30
30
_ _
__
_
_
__
_
_
_
_
_
__
__
_
_
_
_
_
__
__
_
_
_
_
_
_
_
_
_
_
_
_
_
_
_
_
_
_
_
48 20 32 3 5
5
5
5
5
5
50 7
88
8
8
88
8 8
88
86
66
6
6
4
63 8
9
982
10 10
1010
89
9
9
9
999
99
6
6
20
20
8
7 7
7 7
4 7
6 66 6
91
91
91
91
91
91
90
90
43
43
3030
60
6030
30 42
60
6090
90
60
40
42
56
56
42200
200
4214
14
1414
40
40
1010
10
10
4343
28
28
28
28
28
28
34 140 19 240 32
803 91
Figure 31.4Earned value table.

248 C
hapter 31
0 4 8 12 16 20 24 281 2 3 4 5 6 7 8
Site clearFound exc.
" "" "
Found conc." "" "
HardenSteel erect
" "" "
Re-bay lay" "" "
Slab conc." "" "
Roof sheet" "" "
Side sheet" "" "
Paint"
ABCABC
ABCABCABCABCABCAB
" C
PeriodWeeks
62 6262
47 47 47 47
47 47 47 47
47 47 47 47
71 71
71
71
71
71
220 220
147 147 7373
220 220
79 792727
79 792727
79 7927 27
35 3536 36
35 3536 36
7171
66
66
66
66
44 4422 22
80 20 60 40
44 4422
44
66 44
66
80
80
20
20
60
60
40
40
Units in $ 100Sub-contr.
36 409 10
32
Figure 31.5Bar charts and costs.

Cash-Flow
Forecasting 249
Total S/C – – – 367 660 381 318 438%919
%34193278
0221100
1
Del
ay
33433
2167441691517
7470
118
311733
583
343
40360
44815385
1433136
1533355
2636
448
303
33128
36812570
1182629
125
1229
368
166
154(12)
1715833551213
58
13
171
71
71 237 540 883 1624 2581 3235 3837 4416 4768 4884
154 485 888 1413 2229 2993 3535 3962 4281 4396
–83 –55 +5 –211 –352 –242 –302 –454 –487 –488–71
(71)
60060
2478447791720
8485
143334152060
907
741
525(216)
34734
36815989
1503337
1594169
600173734
849
957
816(141)
28929
2849754912022
974779
347332229
602
654
764110
39939
36127
1133
1289
150289203
39
474
602
542(60)
S/COH & P
In 90%Net flow
DirectLabourPlantMaterialSite est.OH & P
OutflowLabourPlantMaterialS/CSite est.OH & PS/C OH&P
Total value
Out
0 4 8 12 16 20 24 28PeriodWeek
1 2 3 4 5 6 7 8
354 128
32232
5491
3993
32
354
579
427(152)
11612
711
322
12
116
128
352
319(33)
116
115(1)
32 36 40 449 10 11
–
+
Cumul.out
Cumul.in
Cumul.net
$ 100
$ 100
$ 100
Figure 31.6Cash-flow chart.

250 Chapter 31
side cladding and a reinforced-concrete ground slab. It has been assumed that as once an area of site has been cleared excavation work can start, and the sequences of each warehouse are identical. The layout is shown in Fig. 31.1 and the network for the three warehouses is shown in Fig. 31.2.
Fig. 31.3 shows the graphical analysis of the network separated for each building. The floats can be easily seen by inspection, e.g., there is a two-week float in the first paint activity (58–59) since there is a gap between the following dummy 59–68 and activity 68–69. The speed and ease of this method soon become apparent after a little practice.
The bar chart in Fig. 31.5 has been drawn straight from the network (Fig. 31.2) and the costs in $100 units added from Fig. 31.4. For example, in Fig. 31.4 the value of foundation excavationforanyonebuildingis$9400perfour-weekactivity.Sincetherearetwofour-week activities, the total is $18,800. To enable the activity to be costed in the corresponding measurement period, it is convenient to split this up into two-weekly periods of $4700. Hence in Fig. 31.5, foundation excavation for building A is shown as follows:
47 in period 147 + 47 = 94 in period 247 in period 3
The summation of all the costs in any period is shown in Fig. 31.6.
Fig. 31.6 clearly shows the effect of the anticipated delays in payment of certificates and settlement of contractor’s accounts. For example, material valued at 118 in period 2 is paid to the contractor after 1 month in period 3 (part of the 331, which is 90% of 368, the total value of period 2), and is paid to the supplier by the contractor in period 4 after the 2-month delay period.
From Fig. 31.6 it can be seen that it has been decided to extract overhead and profit monthly asthejobproceeds,butthisisapolicythatisnotfollowedbyeverycompany.Similarly,thepayment delays may differ in practice, but the principle would be the same.
Fig. 31.6 shows the total outflow and inflow for each time period, and the net differences between the two. When these values are plotted on graphs as in Figs. 31.7 and 31.8, it can be seen that there are only three periods of positive cash flow, i.e., periods 3, 4 and 7. However, while this shows the actual periods when additional moneys have to be made available to fund the project, it does not show, because the gap between the outflow and inflow is so large for most of the time, that for all intents and purposes the project has a negative cash flow throughout its life.
This becomes apparent when the cumulative outflows and inflows, tabulated in the last three lines of Fig. 31.6, are plotted on a graph as in Figs. 31.9 and 31.10. From these it can be seen that cumulatively, a positive cash flow (a mere $500) is in period 4.

Cash-Flow Forecasting 251
This example shows that the project is not self-financing and will possibly only show a profit when the 10% retention moneys have been released. To restore the project to a positive cash flow, it would be necessary to negotiate a sufficiently large mobilization fee at the start of the project to ensure that the contract is self-financing.
1000
900
800
700
600
500
400
300
200
100
0Week
Period0 2
1 2 3 4 5 6
Inflo
w
Out
flow
7 8 9 10 114 6 8 10 12 14 16 18 20 22 24 26 28 30 32 34 36 38 40 42 44
Figure 31.7Cash-flow graph.
300
200
100
0
–100
–200
–300Week
Period0 2
1 2 3 4 5 6 7 8 9 10 114 6 8 10 12 14 16 18 20 22 24 26 28 30 32 34 36 38 40 4442
Net
–––
+ +
Figure 31.8Cash-flow graph.

252 Chapter 31
5000
4500
4000
3500
3000
2500
2000
1500
1000
500
0Week
Period
Cumulative curves
0 21 2 3 4 5 6 7 8 9 10 11
4 6 8 10 12 14 16 18 20 22 24 26 28 30 32 34 36 38 40 42 44
Inflo
w
Out
flow
Figure 31.9Cumulative curves.
Cumulative curves
20
10
0
–100
–200
–300
–400
–500Week
Period0 2
1 2 3 4 5 6 7 8 9 10 114 6 8 10 12 14 16 18 20 22 24 26 28 30 32 34 36 38 40 4442
Net –
+–
Figure 31.10

253Project Management, Planning and Control. http://dx.doi.org/10.1016/B978-0-08-102020-3.00032-2Copyright © 2017 Elsevier Ltd. All rights reserved.
CHAPTER 32
Cost Control and EVA
Chapter OutlineSMAC – Man-Hour Control 253Summary of Advantages 255EVA for Civil Engineering Projects 261
Planned Costs 262Site Overheads 262Example 263Alternative Payment Schedule 264
Further Reading 265
Apart from ensuring that their project is completed on time, all managers, whether in the office, workshop, factory or on-site, are concerned with the cost. There is little consolation in finishing on time, when, from a cost point of view, one wished the job had never started.
Cost control has been a vital function of management since the days of the pyramids, but only too frequently is the term confused with mere cost reporting. The cost report is usually part of every manager’s monthly report to his superiors, but an account of the past month’s expendi-ture is only stating historical facts. What the manager needs is a regular and up-to-date monitoring system that enables him to identify the expenditure with specific operations or stages, determine whether the expenditure was cost-effective, plot or calculate the trend and then take immediate action if the trend is unacceptable.
Network analysis forms an excellent base for any cost-control system, since the activities can each be identified and costed, so that the percent completion of an activity can also give the proportion of expenditure, if that expenditure is time related. Therefore, the system is ideal for construction sites, drawing offices or factories where the basic unit of control is the man-hour.
SMAC – Man-Hour Control
Site man-hours and cost (SMAC)1 is a cost-control system developed in 1978 specifically on a critical path network base for either manual or computerized cost and progress monitoring,
1 SMAC is the proprietary name given to the cost-control program developed by Foster Wheeler.

254 Chapter 32
which enables performance to be measured and trends to be evaluated, thus providing the project manager with an effective instrument for further action. The system, which is now known as earned value analysis (EVA), can be used for all operations where man-hours or costs have to be controlled, and since most functions in an industrial (and now more and more commercial) environment are based on man-hours and can be planned with critical path networks, the utilization of the system is almost limitless.
The following operations or activities could benefit from the system: 1. Construction sites 2. Fabrication shops 3. Manufacturing (batch production) 4. Drawing offices 5. Removal services 6. Machinery commissioning 7. Repetitive clerical functions 8. Road maintenance
The criteria laid down when the system was first mooted were: 1. Minimum site (or workshop) input. Site staff should spend their time managing the
contract and not filling in unnecessary forms. 2. Speed. The returns should be monitored and analysed quickly so that the action can be
taken. 3. Accuracy. The man-hour expenditure must be identifiable with specific activities that are
naturally logged on time sheets. 4. Value for money. The useful man-hours on an activity must be comparable with the actual
hours expended. 5. Economy. The system must be inexpensive to operate. 6. Forward looking. Trends must be seen quickly so that remedial action can be taken when
necessary.
The final system satisfied all these criteria with the additional advantage that the percent complete returns become a simple but effective feedback for updating the network programme.
One of the most significant differences between EVA and the conventional progress-reporting systems is the substitution of ‘weightings’ given to individual activities, by the concept of ‘value hours’. If each activity is monitored against its budget hours (or the hours allocated to that activity at the beginning of the contract) then the ‘value hour’ is simply the percent complete of that activity multiplied by its budget hours. In other words, it is the useful hours against the actual hours recorded on the time sheets.
If all the value hours of a project are added up and the total divided by the total budget hours, the overall percent complete of the project is immediately seen.

Cost Control and EVA 255
The advantage of this system over the weighting system is that activities can be added or eliminated without having to ‘re-weight’ all the other activities. Furthermore, the value hours are a tangible parameter, which, if plotted on a graph against actual hours, budget hours and predicted final hours, give the manager a ‘feel’ of the progress of the job that is second to none. The examples in Tables 32.1 and 32.2 show the difference between the two systems.
Summary of Advantages
Comparing the weighting and value-hours systems, the following advantages of the latter are immediately apparent: 1. The basic value-hours system requires only six columns against the weighting system’s seven. 2. There is no need to carry out a preliminary time-consuming ‘weighting’ at the beginning
of the job. 3. Activities can be added, removed or have the durations changed without the need to
recalculate the weightings of each activity. This saves hundreds of man-hours on a large project.
4. The value hours are easily calculated and can even, in many cases, be assessed by inspection. 5. Errors are easily seen, as the value can never be more than the budget. 6. Budget hours, actual hours, value hours and forecast hours can all be plotted on one graph
to show the trend. 7. The method is ideal for assessing the value of work actually completed for progress payments
to main and subcontractors. Since it is based on man-hours, it truly represents construction progress independent of material or plant costs, which so often distort the assessment.
Table 32.1: Weighting system.
1 2 3 4 5 6 7
Activity No. Activity Budget × 100 Weighting % Complete % WeightedActual
Hours × 100
1 A 1000 0.232 100 23.2 14002 B 800 0.186 50 9.3 6003 C 600 0.140 60 8.4 3004 D 1200 0.279 40 11.2 8505 E 300 0.070 70 4.9 2506 F 400 0.093 80 7.4 600
Total 4300 1.000 64.4 4000
Overall % complete = 64.4%
Predicted final hours = 4000
0.644= 6211 × 100 hours
Efficiency = 4300 × 0.644
4000= 69.25

256 Chapter 32
The efficiency (output/input) for each activity is obtained by dividing the value hours by the actual hours. This is also known as the cost performance index (CPI).
The analysis can be considerably enhanced by calculating the efficiency and forecast final hours for each activity and adding these to the table.
The forecast final hours are obtained by either: 1. Dividing the budget hours by the efficiency; or 2. Dividing the actual hours by the % complete.
Both these methods give the same answer as the following proof (using the same abbrevia-tions) shows: 1. Final hours = budget
efficiency = BG
Efficiency (CPI) = valueactual = earned value
actual = EC (value is always the numerator)
Hence, final hours = budgetvalue/actual = budget
value × actual = B × CE
But value = budget ×% complete = B × D
2. Hence, final hours =budget × actual
budget × complete=
actual
complete=
B × C
B × D=
C
D
Example 1 shows the earned value table for a small project consisting of three activities where there was reasonable progress.
Table 32.2: Value hours (earned value) system.
1 2 3 4 5 6
Activity No. Activity Budget × 100 % Complete Value Hours × 100 Actual Hours × 100
1 A 1000 100 1000 14002 B 800 50 400 6003 C 600 60 360 3004 D 1200 40 480 8505 E 300 70 210 2506 F 400 80 320 600
Total 4300 2770 4000
Overall % complete = 2770
4300= 64.4
Predicted final hours = 4000
0.644= 6211 × 100 hours
Efficiency = 2770
4000= 69.25

Cost Control and EVA 257
The overall percentage complete of the work can be obtained by adding all the value hours in column E and dividing them by the total budget hours in column B, i.e., E/B.
Thus, overall percentage complete =
total value
total budget=
E
B=
540
1800= 0.3 or 30%
The forecast final hours F =
total actual
overall %=
600
0.3= 2000
C
D
As total efficiency of the project (CPI) =
value
actual=
540
600= 0.9 or 90
E
C
Alternatively , the forecast final hours F =
budget
efficiency=
1800
0.9= 2000
B
G
It can be seen that the difference between the calculated final hours of 2000, and the sum of the values of column F of 1950, is only 50 hours or 2.5%, and this tends to be the variation on projects with a large number of activities.
When an analysis is carried out after a period of poor progress as shown in the table of Example 2, the increase in the forecast final hours and the decrease in the efficiency become immediately apparent. An examination of the table shows that this is due to the abysmal efficiencies (column G) of activities 1 and 2.
In this example, the overall % complete is:
E/B = 310/1800 = 0.17222 or 17.222The efficiency (CPI) is E/C = 310/600 = .5167 or 52 approxThe forecast final hours are C/D = 600/0.17222 = 3484or B/G = 1800/0.5167 = 3484
This is still a large overrun, but it is considerably less than the massive 8750 hours produced by adding up the individual forecast final hours in column F.
Example 1: Reasonable progress.
A B C D E F G
ActivityBudget Hours
Actual Hours % Complete
Value Hours B × D
Forecast Final Hours C/D
Efficiency (CPI) E/C
1 1000 200 20 200 1000 1.002 200 100 50 100 200 1.003 600 300 40 240 750 0.80
Total 1800 600 540 1950

258 Chapter 32
Clearly, such a discrepancy of 5266 hours in Example 2 calls for an examination. The answer lies in the offending activities 1 and 2, which need to be restated so that the actual hours reflect the actual situation on the job. For example, if it is found that activities 1 and 2 required rework to such an extent that the original work was completely wasted and the job had to be started again, it is sensible to restate the actual hours of these activities to reflect this, i.e., all the abor-tive work is ‘written off’ and a new assessment of 0% complete is made from the starting point of the rework. There is little virtue in handicapping the final forecast with the gross inefficiency caused by unforeseen rework problems. Such a restatement is shown in Example 2a.
Comparing Examples 2 and 2a it will be noted that: 1. The total budget hours are the same, i.e., 1800. 2. The total actual hours are now only 350 in Example 2a because 180 hours have been
written off for activity 1A and 70 hours have been written off for activity 2A. 3. The value hours are the same, i.e., 310. 4. The overall % complete is the same. 5. The forecast final hours are now only 1700 because although the 250 aborted hours had to
be included, the efficiency of the revised activities 1 and 2B has improved; 6. The overall efficiency is 310/350 = 0.885 or 88.5%.
Example 2: Very poor progress due to rework.
A B C D E F G
ActivityBudget Hours
Actual Hours % Complete
Value Hours B × D
Forecast Final Hours
C/DEfficiency (CPI) E/C
1 1000 200 5 50 4000 0.252 200 100 10 20 4000 0.203 600 300 40 240 750 0.80
Total 1800 600 310 8750
Example 2a: Very poor progress due to rework.
A B C D E F G
ActivityBudget Hours
Actual Hours % Complete
Value Hours B × D
Forecast Final Hours C/D
Efficiency (CPI) E/C
1A 0 0 100 0 180 01B 1000 20 5 50 400 2.52A 0 0 100 0 70 02B 200 30 10 20 300 0.673 600 300 40 240 750 0.80
Total 1800 350 310 17001A or 2A are the works that have been written off.

Cost Control and EVA 259
The forecast final hours calculated by dividing the budget hours by the efficiency comes to 1800/0.885 = 2033 hours. This is more than the 1700 hours obtained by adding all the values in column F, but the difference is only because the percent complete assessment of activities is so diverse.
In practice, such a difference is both common and acceptable because: 1. On medium or large projects, wide variations of % complete assessments tend to follow
the law of ‘swings and roundabouts’, and cancel each other out. 2. In most cases, therefore, the sensible method of forecasting the final hours is to either: a. Divide the budget hours by the efficiency, i.e., B/G or b. Divide the actual hours by the % complete, i.e., C/D. Both of course, give the same
answer. 3. The column F (forecast final hours) is in most cases not required, but should it be neces-
sary to find the forecast final hours of a specific activity, this can be done at any stage by simply dividing the actual hours of that activity by its percent complete.
4. It must be remembered that comparing the forecast final hours with the original budget hours is only a reporting function and its use should not be given too much emphasis. A much more important comparison is that between the actual hours and the value hours as this is a powerful and essential control function.
As stated earlier, two of the criteria of the system were the absolute minimum amount of form-filling for reporting progress and the accurate assessment of percent complete of spe-cific activities. The first requirement is met by cutting down the reporting items to three essentials: 1. The activity numbers of the activities worked on in the reporting period (usually one
week). 2. The actual hours spent on each of these activities, taken from the time cards. 3. The assessment of the percent complete of each reported activity. This is made by the
‘man on the spot’.
The third item is the most likely one to be inaccurate, since any estimate is a mixture of fact and opinion. To reduce this risk (and thus comply with the second criterion, i.e., accuracy) the activities on the network have to be chosen and ‘sized’ to enable them to be estimated, measured or assessed in the field, shop or office by the foreman or supervisor in charge. This is an absolute prerequisite of success, and its importance cannot be over-emphasized.
Individual activities must not be so complex or long (in time) that further breakdown is necessary in the field, nor should they be so small as to cause unnecessary paperwork. For example, the erection of a length of ducting and supports (Fig. 32.1) could be split into the activities shown in Figs. 32.2 and 32.3.

260 Chapter 32
4
7
Erect duct A
Erect duct B
3
6
Erect frame A
Erect beams B
2
5
Erect frame 2
Erect frame 3
1
Erect frame 1
7
7
3
3
4
4
4
Figure 32.2
Duct and support network.
2
4
Erectduct A
Erectduct B
1
3
Erect frames 1, 2& beams A
Erect frames 3& beams B
7
7
11
7
Figure 32.3
Duct and support network (condensed).
10m
10m
Duct B
Duct A
Frame 1
Frame 3
Frame 2
Beams A
Beams B
Figure 32.1
Duct support.

Cost Control and EVA 261
Any competent supervisor can see that if the two columns of frame 1 (Activity 1) have been erected and stayed, the activity is about 50% complete. He may be conservative and report 40% or optimistic and report 60%, but this ±20% difference is not important in the light of the total project. When all these individual estimates are summated, the discrepancies tend to cancel out. What is important is that the assessment is realistic and checkable. Similarly, if 3 m of the duct between frames 1 and 2 have been erected, it is about 30% complete. Again, a margin on each side of this estimate is permissible.
However, if the network were prepared as shown in Fig. 32.3 the supervisor may have some difficulty in assessing the percent complete of activity 1 when he had erected and stayed the columns of frame 1. He now has to mentally compute the man-hours to erect and stay two columns in relation to four columns and four beams. The percent complete could be between 10% and 30%, with an average of 20%. The ± percentage difference is now 50%, which is more than double the difference in the first network. It can be seen therefore that the possibility of error and the amount of effort to make an assessment or both is greater.
Had the size of each activity been reduced to each column, beam or brace, the clerical effort would have been increased and the whole exercise would have been less viable. It is impor-tant therefore to consult the men in the field or on the shop floor before drafting the network and fixing the sequence and duration of each activity.
EVA for Civil Engineering Projects
Most civil engineering contracts have an in-built earned value system, because the monthly re-measure is in fact a valuation of the work done. By using the composite rates in the bill of quantities or the schedule of rates, the monetary value of the work done to date can be easily established. This can then be translated into a curve and the value at any time period can then be divided by the corresponding value of the cash flow curve (which is in effect the planned work) to give the approximate % complete [schedule performance index (SPI)]. However, these values do not give a true picture of the work actually done, as the rates in the bills include overheads and profit as well as contingency allowance.
In order to compare actual costs with earned value, it is necessary to take the contin-gency, profit and overhead portion out of the unit rates so that only true labour, material and plant costs remain. This reduction could be between 5% and 10%. Re-measuring of the completed work can then take place as normal in the conventional physical units of m, m2, m3, tonne, etc. The measured quantities are then multiplied by the new (reduced) rates to give the useful work done in monetary terms and become in effect the earned value.

262 Chapter 32
Planned Costs
These can be taken from the S-curve of the histogram or cash flow curve. These will include labour, materials and plant costs, but they must again be at the reduced rate, i.e., without overheads and profit.
Budget Costs
Labour Total assessed time for activity × average labour rateMaterials Estimated purchase price of materials required for this activityPlant Where plant is exclusive to the activity, e.g., scaffolding
• plant hire cost (external or internal) for the planned period of the activity
• e.g., £/day × anticipated number of days the plant is requiredWhere plant is shared with other activities, e.g., dumper truck
• an approximate % assessment of usage must be made for each activity
Actual Costs
Labour Time sheet hours × average labour rateMaterials Invoice cost of material quantities used to date, or unit rate of material × quantity
used to datePlant Where plant is exclusive to activity
• invoiced plant hire rate, e.g., £/day × number of days worked to date
When plant is shared with other activities: • assessed % of plant hire rate, e.g., £/day × number of days worked to date
Site Overheads
Establishment and indirect labour costs cannot be a part of the EVA system. However, they must be recorded separately. The indirect labour costs must be plotted on the bottom of the EVA set of curves to ensure that they have not been inflated to off-set overruns of direct labour costs.
As with the normal EVA system, at any particular point in time,
Earned value (EV) = Measured work in £, $, euros etc.Overall % complete = EV/total original budgetEfficiency (CPI) = EV/actual costsSPI = EV/planned costs

Cost Control and EVA 263
Where there are no bills of quantities, labour costs can still be used for monitoring prog-ress using the EVA system. Material and plant costs can never be used for monitoring progress.
To operate such an EVA system, the budget costs, planned costs and actual costs (and the calculated earned value) must be broken down into labour, materials and plant for each activity, as each is measured differently. For any particular point in time, it is quite possible to have installed the planned materials and expended the associated plant costs and yet have an overrun or under run of labour costs, depending on the effectiveness of supervision, method of working, climatic conditions or a myriad of other factors.
It can be seen, therefore, that this breakdown of each activity into three cost items can be very time-consuming and for this reason, the conventional monthly measurement of completed work based on the rates in the bills of quantities is the preferred method used by most compa-nies in the civil engineering and building industries.
Example
A large storage tank consist of 400 steel plates, which, at $150 each, gives a material cost of $60,000 (for simplicity, other material costs have been ignored).
The duration for erecting and testing is 6 weeks.
The labour (mostly welding) man-hours are 1200, which at $20/hour, gives a labour cost of $24,000.
Again, for simplicity, plant costs (cranes and welding sets) are regarded as site overheads and can be ignored.
All the plates arrive on site on day 1 and have to be paid for on day 28.
Work starts as soon as the plates have been unloaded (by others).
By day 7 (1 week later) 60 plates have been erected and welded.
Therefore at day 7, the percent complete is 60/400 = 15%.
The EV calculations are carried out weekly and the time sheets show that after the first week, the men have booked a total of 200 man-hours.
Therefore, the earned value is 15% of 1200 = 180, so that the efficiency (CPI) = 180/200 = 90%.
If the men are paid production bonuses, they would not get a bonus for this week as the productivity bonus (as agreed with the unions) only starts at 97% efficiency.

264 Chapter 32
The costs incurred to date are therefore only labour costs and are 200 × $20 = $4000.
At day 28 (after 4 weeks) 300 plates have been erected.
The % complete is now 300/400 = 75%.
The total man-hours booked to date are now 850.
The earned value can be seen to be 75% of 1200 = 900.
As the efficiency (CPI) is now 900/850 = 105%, the men get their bonuses.
The cost to date is now 850 × $20 = $17,000 plus the total material cost of $60,000 = $77,000.
Note that all the material has to be paid for – not just the material erected.
Alternative Payment Schedule
Supposing the terms of the contract were that the tank contractor had to be paid weekly for material and labour. He would therefore be paid as follows:
At the end of week 1:
Labour: 180 man-hours = $3600 (earned value, not actual cost)Material: 60 plates at $150/plate = 150 × 60 = $9000 (plates erected)The total payment is therefore $3600 + 9000 = $12,600 (ignoring retentions).
It can be seen therefore that the materials can be a useful aid in assessing percent complete, and although in order to obtain the total costs, they must be added to the labour costs, they cannot be part of the EVA. In other words, with the exception of the individual percentage complete assessment, the earned value, CPI, SPI, anticipated final cost and anticipated final completion time can only be calculated from the labour data.
The types of work that lend themselves to a similar treatment as the storage tank are: • Pipeworkmeasuredinmetres• Cablerunsmeasuredinmetres• Insulationmeasuredinmetresorsquaremetres• Steelworkmeasuredintonnes• Refractoryworkmeasuredinsquaremetres• Equipmentmeasuredinnumberofpieces,etc.
All labour must of course be measured in man-hours or money units.
If plant costs have to be booked to the work package, they can be treated in a similar way to equipment, except that payments (when the plant is hired) are usually made monthly.

Cost Control and EVA 265
Further Reading
APM. (2002). Earned value management: APM guidelines. APM.Lewis, J. P. (2005). Project planning scheduling and control. McGraw-Hill.

This page intentionally left blank

267Project Management, Planning and Control. http://dx.doi.org/10.1016/B978-0-08-102020-3.00033-4Copyright © 2017 Elsevier Ltd. All rights reserved.
CHAPTER 33
Control Graphs and Reports
Chapter OutlineOverall Project Completion 283Earned Schedule 290Integrated Computer Systems 290EVA % Complete Assessment 291
In addition to the numerical report shown in Fig. 33.5, two very useful management control graphs can be produced: 1. Showing budget hours, actual hours, value hours and predicted final hours, all against a
common time base; and 2. Showing percent planned, percent complete and efficiency, against a similar time base.
The actual shape of the curves on these graphs give the project manager an insight into the running of the job, enabling appropriate action to be taken.
Fig. 33.1 shows the site returns of man-hours of a small project over a nine-month period, and, for convenience, the table of percent complete and actual and value hours is drawn on the same page as the resulting curves. In practice, a greater number of activities would not make such a compressed presentation possible.
A number of interesting points are ascertainable from the curves: 1. There was obviously a large increase in site labour between the fifth and sixth months, as
shown by the steep rise of the actual hours curve. 2. This has resulted in increased efficiency. 3. The learning curve given by the estimated final hours has flattened in month 6 making the
prediction both consistent and realistic. 4. Month 7 showed a divergence of actual and value hours (indicated also by a loss of
efficiency), which was corrected (probably by management action) by month 8. 5. It is possible to predict the month of actual completion by projecting all the curves
forward. The month of completion is then given: a. When the value hours curve intersects the budget line; and b. When the actual hours curve intersects the estimated final hours curve.

268 C
hapter 33
Figure 33.1Control curves.

Control Graphs and Reports 269
In this example, one could safely predict completion of the project in month 10.
It will be appreciated that this system lends itself ideally to computerization, giving the project manager the maximum information with very minimum site input. The sensitivity of the system is shown by the immediate change in efficiency when the value hours diverged from the actual hours in month 7. This alerts management to investigate and apply corrections.
For maximum benefit, the returns and calculations should be carried out weekly. By using the normal weekly time cards very little additional site effort is required to complete the returns, and with the aid of a good computer program the results should be available 24 hours after the returns are received.
An example of the application of a manual earned value analysis (EVA) is shown in Figs 33.2–33.9. The site-construction network of a package boiler installation is given in Fig. 33.2. Although the project consisted of three boilers, only one network, that of boiler no. 1 is shown. In this way, it was possible to control each boiler construction separately and compare performances. The numbers above the activity description are the activity numbers, while those below are the durations. The reason for using activity numbers for identifying each activity, instead of more conventional beginning and end event numbers, is that the identifier must always be uniquely associated with the activity description.
If the event numbers (in this case the coordinates of the grid) were used, the identifier could change if the logic were amended or other activities were inserted. In a sense, the activity number is akin to the node number of a precedence diagram, which is always associated with its activity. The use of precedence diagrams and computerized EVA is therefore a natural marriage, and to illustrate this point, a precedence diagram is shown in Fig. 33.3.
Once the network has been drawn, the man-hours allocated to each activity can be repre-sented graphically on a bar chart. This is shown in Fig. 33.4. By adding up the man-hours for each week, the totals, cumulative totals and each week’s percentage of the total man-hours can be calculated. If these percentages are then plotted as a graph, the planned percent-com-plete curve can be drawn. This is shown in Fig. 33.7.
All the work described up to this stage can be carried out before work starts on site. The only other operation necessary before the construction stage is to complete the left-hand side of the site-returns analysis sheet. This is shown in Fig. 33.5, which covers only periods four to nine of the project. The columns to be completed at this stage are: 1. The activity number 2. The activity title 3. The budget hours

270 C
hapter 33
4Erect
gallery
9Weld duct
3Erect
gas duct
2Set upecon
11Erect
gas duct
16Erectfloor
1Set upboiler
5Erect gas duct
2
2
2½
2
1
½ 2
27Inst seal aw fan
31Erect gallery
30Erect b.d. cooler
37Erect gallery
Fromboiler 3
½
31
2½
12Erect
gallery
22Erect s.b. pipe
28Erect seal air pipe
32Erect w.b. piping
35Erect s.v. supp
29Erect feed pipe
15Insulate
18Erect s.v.
vent
24Insulate
Commission
6Erect duct-stack
17Erectfloor
8Insulate
14Hydrotest
20Erect
f.d. fan
23Hydrotest
10Weld duct-stack
21Inst soot blower
25Erect sat st. pipe
26Erect b.d. drain
7Erect
gas duct
13Erect
m.s. pipe
19Erect
air duct
1
3½
3
3½
1
2½
2
1
2
1
1
3
1
1
½
2
2
5
3
2
2½
33Inst and electric
36Erect s.v. pipe
34Insulate pipe
5
1
2
BA C D E F G H J K L M N
1
2
3
4
5
6
7
8
9
10
11
12
13
14
15
16
17
18
Figure 33.2Boiler No. 1. Network arrow diagram.

Control G
raphs and Reports
271
Figure 33.3Boiler No. 1. Precedence diagram.

272 C
hapter 33
Figure 33.4Boiler No. 1. Bar chart and man-hour loadings.

Control G
raphs and Reports
273
Figure 33.5Earned value analysis sheet.

274 Chapter 33
Once work has started on site, the construction manager reports weekly on the progress of each activity worked on during that week. All he has to state is: 1. The activity number 2. The actual hours expended in that week 3. The percent complete of that activity to date
If the computation is carried out manually, the figures are entered on the sheet (Fig. 33.5) and the following values calculated weekly: 1. Total man-hours expended this week (W column) 2. Total man-hours to date (A column)
Fin
al
13,2
75
14,4
68
12,5
89
11,0
19
11,5
48
11,2
60
11,1
41
11,2
77
11,0
95
Val
ue
342
560
1461
2468
3152
5030
6628
8513
10,0
95
Act
.
385
680
1561
2314
3118
4824
6239
8120
9477
1 2 3 4 5 6 7 8Week No.
9 10 11 12 13 14 15 16
2 000
4 000
6 000
8 000
10 000
12 00011 758
14 000
16 000
HistoricalProjections
Budget
Value
Actual
Final
Com
plet
ion
date
wee
k 11
Man
hour
s
Figure 33.6Boiler No. 1. Man hour–time curves.

Control Graphs and Reports 275
3. Percent complete of project (% column) 4. Total value hours to date (V column) 5. Efficiency 6. Estimated final hours
Alternatively, the site returns can be processed by computer and the resulting printout of part of a project is shown in Fig. 33.8. Whether the information is collected manually or electroni-cally, the return can be made on a standard time sheet with the only addition being a % complete column. In other words, no additional forms are required to collect information for EVA. There are in fact only three items of data to be returned to give sufficient information: 1. The activity number of the activity actually being worked on in that time period; 2. the actual hours being expended on each activity worked on in that time period; and 3. The cumulative % complete of each of these activities.
120
110
100
90
80
70
Efficiency AEfficiency W
Planned% completion
Actual% completion
E = efficiency to dateW = efficiency for this week
60%
50
40
30
20
10
01 2 3 4 5 6 7 8
Week no.9 10 11 12 13 14 15 16
Pro
babl
e co
mp.
Pla
nned
com
p.pe
riod.
11 12
Figure 33.7Boiler No. 1. Percentage–time curves.
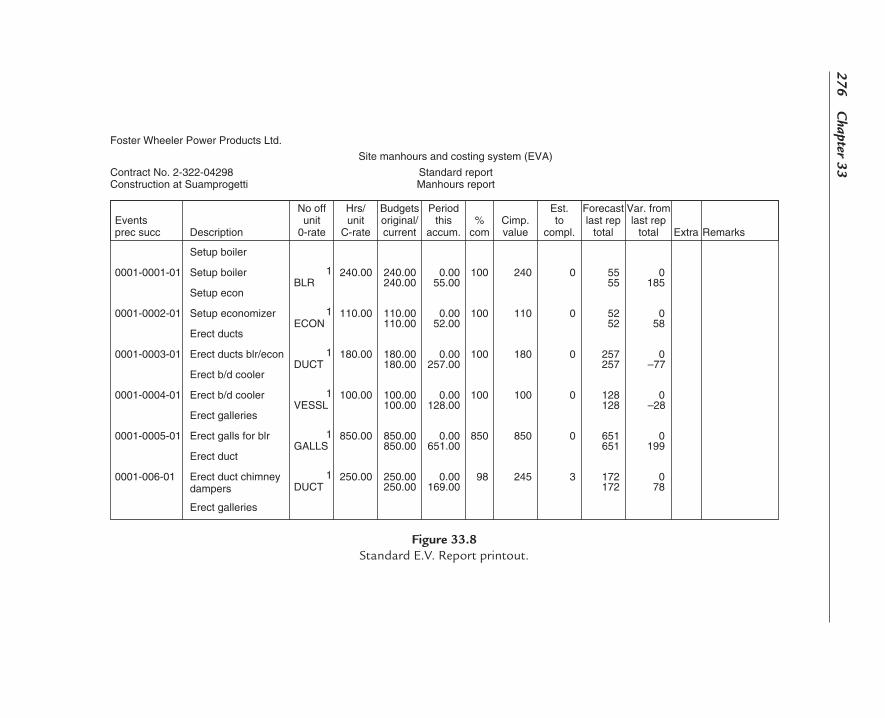
276 C
hapter 33
Foster Wheeler Power Products Ltd.
Contract No. 2-322-04298Construction at Suamprogetti
Standard reportManhours report
Site manhours and costing system (EVA)
Eventsprec succ Description Remarks
No offunit
0-rate
Hrs/unit
C-rate
Budgetsoriginal/current
Periodthis
accum.Cimp.value
Est.to
compl. Extra
Forecastlast rep
total
Var. fromlast rep
total%
com
0001-0001-01
0001-0002-01
0001-0003-01
0001-0004-01
0001-0005-01
0001-006-01
Setup boiler
Setup boiler
Setup econ
Setup economizer
Erect ducts
Erect ducts blr/econ
Erect b/d cooler
Erect b/d cooler
Erect galleries
Erect galls for blr
Erect duct
Erect duct chimneydampers
Erect galleries
BLR
ECON
DUCT
VESSL
GALLS
DUCT
1
1
1
1
1
1
240.00
110.00
180.00
100.00
850.00
250.00
240.00240.00
110.00110.00
180.00180.00
100.00100.00
850.00850.00
250.00250.00
0.0055.00
0.0052.00
0.00257.00
0.00128.00
0.00651.00
0.00169.00
240
110
180
100
850
245
0
0
0
0
0
3
5555
5252
257257
128128
651651
172172
0185
058
0–77
0–28
0199
078
100
100
100
100
850
98
Figure 33.8Standard E.V. Report printout.

Control Graphs and Reports 277
All the other information required for computation and reporting (such as activity titles and activity man-hour budgets) will already have been inputted and stored in the computer. A typical modified time sheet is shown in Fig. 33.9.
A complete set of printouts produced by a modern project-management system are shown in Figs 33.10–33.14. It will be noted that the network in precedence format has been produced by the computer, as have the bar chart and curves. In this program, the numeri-cal EVA has been combined with the normal critical path analysis from one database, so that both outputs can be printed and updated at the same time on one sheet of paper. The reason the totals of the forecast hours are different from the manual analysis is that the computer calculates the forecast hours for each activity and then adds them up, while in the manual system the total forecast hours are obtained by simply dividing the actual hours by the percent complete rounded off to the nearest 1%.
As mentioned earlier, if the budget hours, actual hours, value hours and estimated final hours are plotted as curves on the same graph, their shape and relative positions can be extremely
WEEKLY TIMESHEET
Name
Projectno.
Activity/document no.
Mon. Tues. Wed. Thu. Fri. Sat. Sun. Total % complete
Week ending
Remarks
Staff no.
Signed Date Approved Date
Figure 33.9Weekly time sheet.
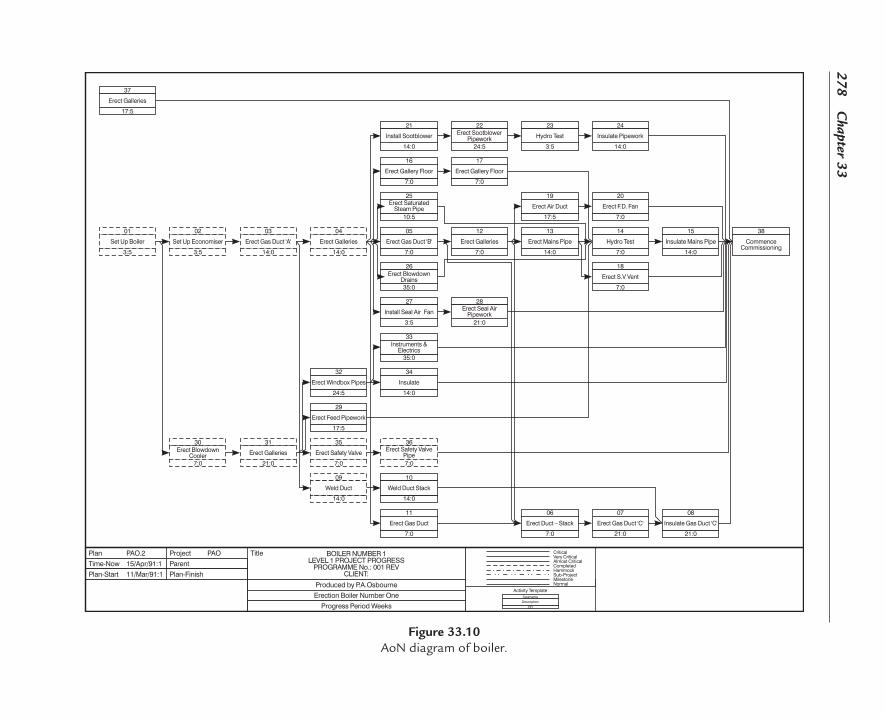
278 C
hapter 33
Figure 33.10AoN diagram of boiler.

Control G
raphs and Reports
279
Figure 33.11Bar chart.

280 C
hapter 33
ActivityNumber Description
Programme statusagainst target
Actionrequired
01 Set up boiler 240 240 230 100% 240 0 230 10 104 3:5 0:0 3/MAR/91 6/MAR/91 3/MAR/91 6/MAR/91 3/MAR/91 6/MAR/91 3/MAR/91 6/MAR/91 0:0 1 day (s) slippage Complete
02 Set up economiser 110 110 90 100% 110 0 90 20 122 3:5 0:0 6/MAR/91 9/MAR/91 6/MAR/91 9/MAR/91 6/MAR/91 9/MAR/91 6/MAR/91 9/MAR/91 0:0 On target Complete
03 Erect gas duct ‘A’ 180 180 155 100% 180 0 155 25 116 14:0 0:0 10/MAR/91 23/MAR/91 10/MAR/91 23/MAR/91 10/MAR/91 23/MAR/91 10/MAR/91 23/MAR/91 0:0 On target Complete
04 Erect galleries 850 850 810 100% 850 0 810 40 105 14:0 0:0 24/MAR/91 6/APR/91 24/MAR/91 6/APR/91 24/MAR/91 6/APR/91 24/MAR/91 6/APR/91 0:0 On target Complete
05 Erect gas duct ‘B’ 263 263 200 60% 158 133 133 –70 79 7:0 2:8 7/APR/91 17/APR/91 7/APR/91 13/APR/91 7/APR/91 13/APR/91 7/APR/91 / / –3:8 4 day (s) slippage Yes
Yes
Yes
Yes
Yes06 Erect duct – stack 0 200 0 0% 0 200 200 0 0 7:0 7:0 24/APR/91 1/MAY/91 21/APR/91 27/APR/91 21/APR/91 27/APR/91 / / / / 3:8 4 day (s) slippage
07 Erect gas duct ‘C’ 0 200 0 0% 0 200 200 0 0 21:0 21:0 1/MAY/91 22/MAY/91 28/APR/91 18/MAY/91 28/APR/91 18/MAY/91 / / / / 3:8 4 day (s) slippage
08 Insulater gas duct ‘C’ 0 0 0 0% 0 0 0 0 0
0 0 0 0
0 0 0 0
0 0 0 0
0 0 0 0
21:0 21:0 22/JUN/91 12/JUN/91 19/MAY/91 8/JUN/91 19/MAY/91 8/JUN/91 / / / / 3:8 4 day (s) slippage
09 Weld duct 70 70 65 100% 70 0 65 5 108 14:0 0:0 24/MAY/91 6/APR/91 24/MAR/91 6/APR/91 24/MAR/91 6/APR/91 24/MAR/91 6/APR/91 0:0 On target Complete
10 Weld duct stack 108 200 0 0% 0 200 200 0 0 14:0 14:0 15/APR/91 28/APR/91 5/MAY/91 18/MAY/91 7/APR/91 20/APR/91 / / / / 20:0 8 day (s) slippage
11 Erect gas duct ‘C’ 125 250 92 60% 150 61 153 97 163 7:0 2:8 7/APR/91 17/APR/91 7/APR/91 20/APR/91 7/APR/91 13/APR/91 7/APR/91 / / 3:2 4 day (s) slippage
12 Erect galleries 0 500 0 0% 0 500 500 0 0 7:0 7:0 17/APR/91 24/APR/91 14/APR/91 20/APR/91 14/APR/91 20/APR/91 / / / / –3:8 4 day (s) slippage
13 Erect mains pipe 0 270 0 0% 0 270 270 0 0 14:0 14:0 24/APR/91 8/MAY/91 5/MAY/91 18/MAY/91 21/APR/91 4/MAY/91 / / / / 10:2 4 day (s) slippage
14 Hydro test 0 60 0 0% 0 60 60 0 0 7:0 7:0 13/MAY/91 19/MAY/91 19/MAY/91 25/MAY/91 12/MAY/91 18/MAY/91 / / / / 6:0 1 day (s) slippage
15 Insulate mains pipe 0 0 0 0% 0 14:0 14:0 20/MAY/91 2/JUN/91 26/MAY/91 8/JUN/91 19/MAY/91 1/JUN/91 / / / / 6:0 1 day (s) slippage Complete
16 Erect galley floor 850 850 420 60% 510 280 700 150 121 7:0 2:8 7/APR/91 17/APR/91 7/APR/91 11/MAY/91 7/APR/91 13/APR/91 7/APR/91 / / 24:2 4 day (s) slippage Complete
17 Erect galley floor 0 700 0 0% 0 700 700 0 0 7:0 7:0 17/APR/91 24/APR/91 12/MAY/91 18/MAY/91 14/APR/91 20/APR/91 / / / / 24:2 4 day (s) slippage
18 Erect S.V. vent 0 145 0 0% 0 145 145 0 0 7:0 7:0 8/MAY/91 15/MAY/91 2/JUN/91 8/JUN/91 5/MAY/91 11/MAY/91 / / / / 24:2 4 day (s) slippage
19 Erect air duct 0 203 0 0% 0 203 203 0 0 17:5 17:5 24/APR/91 12/MAY/91 15/MAY/91 1/JUN/91 21/APR/91 8/MAY/91 / / / / 20:7 4 day (s) slippage
20 Erect F.D. fan 0 240 0 0 240 240 0 0 7:0 7:0 12/MAY/91 19/MAY/91 2/JUN/91 8/JUL/91 8/MAY/91 15/MAY/91 / / / / 20:7 4 day (s) slippage
21 Install sootblowers 70 140 65 55% 77 53 118 22 118 14:0 6:3 7/APR/91 21/APR/91 7/APR/91 27/APR/91 7/APR/91 20/APR/91 7/APR/91 / / 6:7 0 day (s) slippage
22 Erect sootblower pipework 0 400 0 0%
0%
0 400 400 0 0 24:5 24:5 21/APR/91 15/MAY/91 28/APR/91 22/MAY/91 21/APR/91 15/MAY/91 / / / / 6:7 0 day (s) slippage
23 Hydro test 0 10 0 0% 0 10 10 0 0 3:5 3:5 15/MAY/91 19/MAY/91 22/MAY/91 25/MAY/91 15/MAY/91 18/MAY/91 / / / / 6:7 0 day (s) slippage
24 Insulate pipework 0 0 0 0% 0 14:0 14:0 19/MAY/91 2/JUN/91 26/MAY/91 8/JUN/91 19/MAY/91 1/JUN/91 / / / / 6:7 0 day (s) slippage
25 Erect saturated steam pipe 150 218 125 60% 131 83 208 10 105 10:5 4:2 7/APR/91 19/APR/91 7/APR/91 18/MAY/91 7/APR/91 17/APR/91 7/APR/91 / / 29:8 2 day (s) slippage
26 Erect blowdown drains 148 741 130 20% 148 520 650 91 114 35:0 28:0 7/APR/91 12/MAY/91 7/APR/91 18/MAY/91 7/APR/91 11/MAY/91 7/APR/91 / / 6:0 1 day (s) slippage
27 Install seal air fan 50 50 0 0% 0 50 50 0 0 3:5 3:5 7/APR/91 18/APR/91 7/APR/91 8/JUN/91 7/APR/91 10/APR/91 7/APR/91 / / 51:5 8 day (s) slippage
28 Erect seal air pipework 54 328 45 20% 66 180 225 103 146 21:0 16:8 10/APR/91 1/MAY/91 10/APR/91 8/JUN/91 10/APR/91 1/MAY/91 10/APR/91 / / 38:2 0 day (s) slippage
29 Erect feed pipework 173 273 145 60% 164 97 242 31 113 17:5 7:0 3/APR/91 21/APR/91 3/APR/91 18/MAY/91 3/APR/91 20/APR/91 3/APR/91 / / 27:0 1 day (s) slippage
30 Erect blowdown cooler 100 100 105 100% 100 0 105 –5 95 7:0 0:0 6/MAR/91 13/MAR/91 6/APR/91 13/MAR/91 6/MAR/91 13/MAR/91 6/MAR/91 13/MAR/91 0:0 1 day (s) slippage Complete
31 Erect galleries 950 950 865 100% 950 0 865 85 110 21:0 0:0 13/MAR/91 3/APR/91 13/MAR/91 3/APR/91 13/MAR/91 3/APR/91 13/MAR/91 3/APR/91 0:0 1 day (s) slippage Complete
32 Erect windbox pipes 819 1819 760 30% 546 1773 2533 –714 72 24:5 17:2 3/APR/91 2/MAY/91 3/APR/91 4/MAY/91 3/APR/91 27/APR/91 3/APR/91 / / 2:8 1 day (s) slippage
33 Instruments & electrics 0 0 0 0% 0 35:0 35:0 2/MAY/91 6/JUN/91 5/MAY/91 8/JUN/91 28/APR/91 1/JUN/91 / / / / 2:8 4 day (s) slippage
34 Insulate 0 0 0 0% 0
0 0 0 00
14:0 14:0 2/MAY/91 16/MAY/91 26/MAY/91 8/JUN/91 28/APR/91 11/MAY/91 / / / / 23:8 4 day (s) slippage
35 Erect safety valve 500 500 460 100% 500 0 460 40 109 7:0 0:0 3/APR/91 10/APR/91 3/APR/91 10/APR/91 3/APR/91 10/APR/91 3/APR/91 10/APR/91 0:0 1 day (s) slippage Complete
36 Erect safety valve pipe 80 80 80 100% 80 0 80 0 100 7:0 0:0 11/APR/91 14/APR/91 11/APR/91 14/APR/91 11/APR/91 14/APR/91 11/APR/91 14/APR/91 0:0 1 day (s) slippage Complete
37 Erect galleries 0 618 0 0% 0 618 618 0 0 17:5 17:5 25/APR/91 12/MAY/91 22/MAY/91 8/JUN/91 25/APR/91 12/MAY/91 / / / / 27:5 On target4 day (s) slippage38 Commence commissioning 0 0 0 0% 0:0 0:0 12/JUN/91 12/JUN/91 9/JUN/91 9/JUN/91 9/JUN/91 9/JUN/91 / / / / –3:8 Yes
Total 5882 11758 4842 43% 5029 6977 11819 –61 104
Pla
nned
to d
ate
Bud
get
hour
s
Act
ual
hour
s
% Com
plet
e
Val
ueho
urs
Est
imat
eco
mp
For
ecas
tho
urs
Var
ianc
e+
/–
EF
F1 O
rigdu
rtn
Rem
durt
n
Ear
lyst
art
Ear
lyF
inis
h
Late
star
t
Late
finis
h
Tar
get
star
t
Tar
get
finis
h
Act
ual
star
t
Act
ual
finis
h
Flo
atre
mai
n
Figure 33.12Combined CPA and EVA print out.
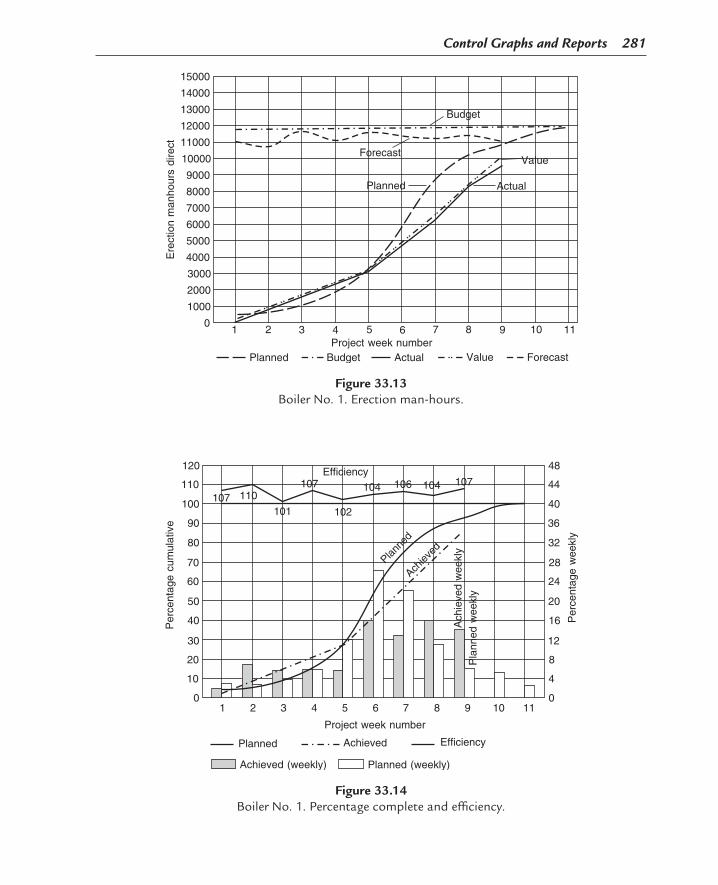
Control Graphs and Reports 281
15000
14000
13000
12000
11000
10000
9000
8000
7000
6000
5000
4000
3000
2000
1000
01 2 3 4 5 6 7 8 9 10 11
Forecast
Forecast
Value
Value
Actual
Actual
Budget
Budget
Planned
Planned
Project week number
Ere
ctio
n m
anho
urs
dire
ct
Figure 33.13Boiler No. 1. Erection man-hours.
120
110
100
90
80
70
60
50
40
30
20
10
01 2 3 4 5 6 7 8 9 10 11
Per
cent
age
cum
ulat
ive
Project week number
Planned Achieved Efficiency
Achieved (weekly) Planned (weekly)
48
44
40
36
32
28
24
20
16
12
8
4
0
Per
cent
age
wee
kly
Pla
nned
wee
kly
Ach
ieve
d w
eekl
y
Planne
d
Achiev
ed
Efficiency107 104 106 104 107
107 110
101 102
Figure 33.14Boiler No. 1. Percentage complete and efficiency.

282 Chapter 33
revealing in terms of profitability and progress. For example, it can be seen from Fig. 33.6 that the contract was potentially running at a loss during the first three weeks, since the value hours were less than the actual hours. Once the two curves crossed, profitability returned and in fact increased, as indicated by the diverging nature of the value- and actual-hour curves. This trend is also reflected by the final-hours curve dipping below the budget-hour line.
The percentage–time curves in Fig. 33.7 enable the project manager to compare actual percent complete with the planned. This is a better measure of performance than comparing actual hours expended with planned hours expended. There is no virtue in spending the man-hours in accordance with a planned rate. What is important is the percent complete in relation to the plan and whether the hours spent were useful hours. Indeed, there should be every incentive to spend less hours than planned, provided that the value hours are equal or greater than the actual and the percent complete is equal or greater than the planned.
The efficiency curve in Fig. 33.7 is useful, since any drop is a signal for management action. Curve ‘A’ is based on the efficiency calculated by dividing the cumulative value hours by the cumulative actual hours for every week. Curve ‘W’ is the efficiency by dividing the value hours generated in a particular week by the actual hours expended in that week. It can be seen that Curve ‘W’ (shown only for the periods 5–9) is more sensitive to change and is therefore a more dramatic warning device to management.
Finally, by comparing the curves in Figs 33.6 and 33.7, the following conclusions can be drawn:
1. Value hours exceed actual hours (Fig. 33.6). This indicates that the site is efficiently run. 2. Final hours are less than budget hours (Fig. 33.6). This implies that the contract will
make a profit. 3. The efficiency is over 100% and rising (Fig. 33.7). This bears out conclusion 1. 4. The actual percent complete curve (Fig. 33.7), although less than the planned, has for the
last four periods been increasing at a greater rate than the planned (i.e., the line is at a steeper angle). Hence, the job may well finish earlier than planned (probably in week 11).
5. By projecting the value-hour curve forward to meet the budget-hour line, it crosses in week 11 (Fig. 33.6).
6. By projecting the actual-hour curve to meet the projection of the final-hour curve, it intersects in week 11 (Fig. 33.6). Hence, week 11 is the probable completion date.
The computer printout shown in Fig. 33.8 is updated weekly by adding the man-hours logged against individual activities. However, it is possible to show the cost of both the historical and current man-hours in the same report. This is achieved by feeding the average man-hour rate for the contract into the machine at the beginning of the job and updating it when the rate changes. Hence, the new hours will be multiplied by the current rates. A separate report can also be issued to cover the indirect hours such as supervision, inspection, inclement weather and general services.

Control Graphs and Reports 283
Since the value-hour concept is so important in assessing the labour content of a site or works operation, the following summary showing the computation in non-numerical terms can be of help:
If
B = Budget hours (total)C = Actual hours (total)D = Percent completeE = Value hours (earned value) (total)F = Forecast final hoursG = Percent efficiency (CPI)
Then:
E = B × D, D = E/B × 100, G = E/C × 100 , F = C/DorB/G
Overall Project Completion
Once the man-hours have been ‘costed’, they can be added to other cost reports of plant, equipment, materials, subcontracts, etc. so that an overall percent completion of a project can be calculated for valuation purposes on the only true common denominator of a project – money.
The total value to date divided by the revised budget × 100 is the percent complete of a job. The value-hour concept is entirely compatible with the conventional valuation of costing such as value of concrete poured, value of goods installed, cost of plant utilized – activities, which can, by themselves, be represented on networks at the planning stage.
Table 33.1 shows how the two main streams of operations, i.e., those categories measured by cost and those measured by man-hours can be combined to give an overall picture of the percent complete in terms of cost and overall cost of a project. While the operations shown relate to a construction project, a similar table can be drawn for a manufacturing process, covering such operations as design, tooling, raw material purchase, machinery, assembly, testing, packing.
Cost of overheads, plant amortization, licences, etc. can, of course, be added like any other commodity. An example giving quantities and cost values of a small job involving all the categories shown in Table 33.1 is presented in Tables 33.2–33.4. It can be seen that in order to enable an overall percent complete to be calculated, all the quantities of the estimate (Table 33.2) have been multiplied by their respective rates – as in fact would be done as part of any budget – to give the estimated costs.
Table 33.3 shows the progress after a 16-week period, but in order to obtain the value hours (and hence the cost value) of category D it was necessary to break down the man-hours into work packages that could be assessed for percent completion. Thus, in Table 33.4, the pipelines A and

284 Chapter 33
Table 33.1
Basic Method of Measurement Cost (Money) Man-Hours
Method of Measurement
Category
Bills of Quantities A
Lump Sum B
Rates C
Rate/Hour D
Type of activity Earth moving Tanks Mechanical plant Erection of: piping, electrical work,
instrumentation, machinery,
steelwork; testing, commissioning
Civil work Equipment (com-pressors, pumps,
towers, etc.)
CranesPainting
InsulationPiping supply
ScaffoldingTransport
Base for comparison of progress
Total of bills of quantities
Total of equipment items
Plant estimate Man-hour budget
Periodic valuation Measured quantities
Cost of items delivered
Cost of plant on-site
Value hours = % complete × budget
Method of assessment
Field measurement Equipment count Plant count Physical % complete
Percent complete for reporting
Measured quantities × rates
Delivered cost Cost of plant on-site
Value hours
Total in bill of quantities
Total equipment cost
Plant estimate Man-hour budget
Total cost = measured quantity × rates + cost of items delivered + cost of plant on-site + actual hours × rate
Total site percentage complete =100 (cost of A + cost of B + adjusted cost of C + value hours of D × average rate)
Total budget
Methods of measurement
Table 33.2: Example showing effect of percent complete of different categories.
Estimate Category Item Unit Quantity Rate ($/Hour) Cost $
A Concrete M3 1000 25 25,000pipe 6-inch M 2000 3 6000
Painting M2 2500 10 25,00056,000
B Tanks No 3 20,000 60,000Pumps No 1 8000 8000Pumps No 1 14,000 14,000
82,000
C Cranes Hours 200 6015 12,600(hire) Hours 400 6000
Welding 18,000
D Pipe fitters Hours 4000 4} Av. 16,000Welders Hours 6000 5} 4.6 30,000
10,000 46,000

Control Graphs and Reports 285
B were assessed as 35% and 45% complete, and the pump and tank connections were found to be 15% and 20% complete, respectively. Once the value hours (3180) were found, they could be multiplied by the average cost per man-hour to give a cost value of $14628.
Table 33.5 shows the summary of the four categories. An adjustment should therefore also be made to the value of plant utilization category C since the two are closely related. The adjusted value total would therefore be as shown in column V.
Table 33.3: Progress after 16 weeks.
Category Item Unit Quantity Rate ($/Hour) Cost $
A Concrete poured
M3 900 25 22,500
Pipe 6-inch supplied
M 1000 3 3000
Painting M2 500 10 5,000
Complete :30, 500
56, 000× 100 = 54.46
30,500
B Tanks delivered No 2 20,000 40,000Pumps A No 1 8000 8000Pumps B No 1 –
Complete :48, 000
82, 000× 100 = 58.53
48,000
Table 33.4
Category Item Unit Quantity Rate ($/Hour) Cost $
C Cranes on-site Hours 150 60 9000Welding plant Hours 200 15 3000
Complete:12,000
18,000× 100 = 66.66
12,000
D Pipe fitters Hours 1800 4 7200Welders Hours 2700 5 13,500
20,700
Erection work Budget M/HPercent
complete Value hours Actual hours
Pipeline A 3800 35 1330 1550Pipeline B 2800 45 1260 1420
Pump connection 1800 15 270 220Tank connection 1600 20 320 310
10,000 3180 3500
Complete :3180
10, 000× 100 = 31.80
Cost value (Av.) = 3180 × 4.6 = $14,628
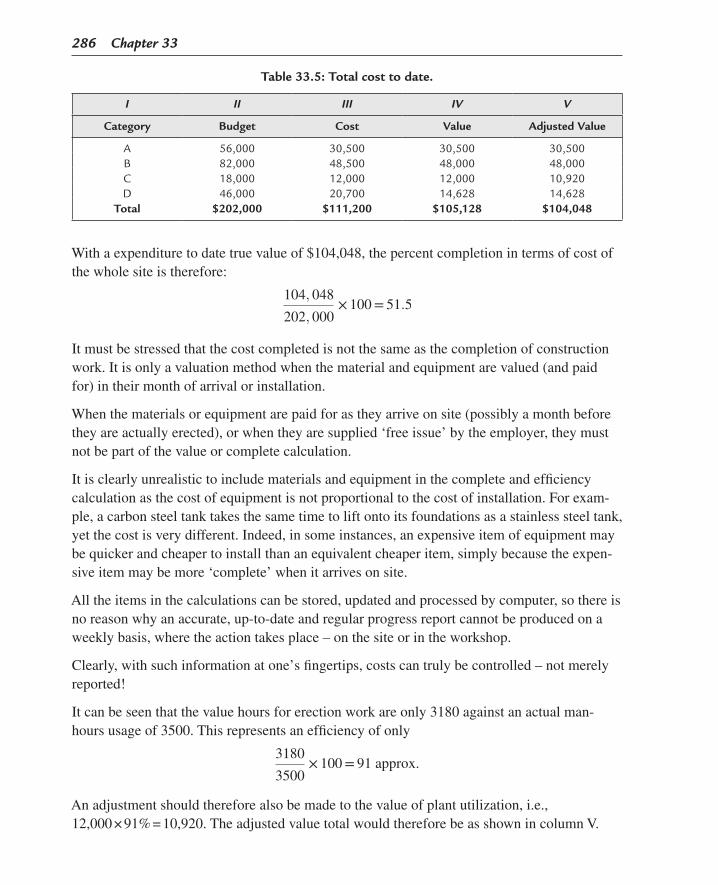
286 Chapter 33
With a expenditure to date true value of $104,048, the percent completion in terms of cost of the whole site is therefore:
104, 048
202, 000× 100 = 51.5
It must be stressed that the cost completed is not the same as the completion of construction work. It is only a valuation method when the material and equipment are valued (and paid for) in their month of arrival or installation.
When the materials or equipment are paid for as they arrive on site (possibly a month before they are actually erected), or when they are supplied ‘free issue’ by the employer, they must not be part of the value or complete calculation.
It is clearly unrealistic to include materials and equipment in the complete and efficiency calculation as the cost of equipment is not proportional to the cost of installation. For exam-ple, a carbon steel tank takes the same time to lift onto its foundations as a stainless steel tank, yet the cost is very different. Indeed, in some instances, an expensive item of equipment may be quicker and cheaper to install than an equivalent cheaper item, simply because the expen-sive item may be more ‘complete’ when it arrives on site.
All the items in the calculations can be stored, updated and processed by computer, so there is no reason why an accurate, up-to-date and regular progress report cannot be produced on a weekly basis, where the action takes place – on the site or in the workshop.
Clearly, with such information at one’s fingertips, costs can truly be controlled – not merely reported!
It can be seen that the value hours for erection work are only 3180 against an actual man-hours usage of 3500. This represents an efficiency of only
3180
3500× 100 = 91 approx.
An adjustment should therefore also be made to the value of plant utilization, i.e., 12,000 × 91% = 10,920. The adjusted value total would therefore be as shown in column V.
Table 33.5: Total cost to date.
I II III IV V
Category Budget Cost Value Adjusted Value
A 56,000 30,500 30,500 30,500B 82,000 48,500 48,000 48,000C 18,000 12,000 12,000 10,920D 46,000 20,700 14,628 14,628
Total $202,000 $111,200 $105,128 $104,048

Control Graphs and Reports 287
The SMAC system described on the previous pages was developed in 1978 by Foster Wheeler Power Products, primarily to find a quicker and more accurate method for assessing the % complete of multi-discipline, multi-contractor construction projects.
However, about 10 years earlier the Department of Defense in the USA developed an almost identical system called cost, schedule, control system (CSCS), which was generally referred to as EVA. This was mainly geared to the cost control of defence projects within the USA, and apart from UK subcontractors to the American defence contractors, was not disseminated widely in the UK.
While the principles of SMAC and EVA are identical, inevitably a difference in terminology is developed, which has caused considerable confusion to students and practitioners. Fig. 33.16 lists these abbreviations and their meaning, and Fig. 33.17 shows the comparison between the now accepted EVA ‘English’ terms (shown in bold) and the CSCS jargon (shown in italics).
The CSCS also introduced four new parameters for cost efficiency and, for want of a better word, time efficiency: 1. The cost variance: this is the arithmetical difference at any point between the earned value
and the actual cost. 2. The schedule variance: this is the arithmetical difference between the earned value and
the scheduled (or planned) cost. However, comparing progress in time by subtracting the planned cost from the earned value is somewhat illogical as both are measured in mon-etary terms. It would make more sense to use parameters measured in time to calculate the time variance. This can be achieved by subtracting the actual duration [Actual time expended (ATE)] for a particular earned value from the originally planned duration (OD) for that earned value. This is shown clearly in Fig. 33.15. It can be seen that if the project is late, the result will be negative. There are therefore two schedule variances (SV):
a. SV (cost), which is measured on the cost scale of the graph; and b. SV (time), which is measured on the time scale. 3. The cost efficiency is called the cost performance index (CPI) and is earned value/actual
cost. 4. The ‘time efficiency’ is called the schedule performance index (SPI) and is earned value/
scheduled (or planned) cost. Again, as with the schedule variance, measuring efficiency in time by dividing the earned
value by the planned cost, which are both measured in monetary terms or man-hours, is equally illogical and again it would be more sensible to use parameters measured in time. Therefore, by dividing the planned duration for a particular earned value by the actual duration for that earned value, a more realistic index can be calculated. All time measure-ments must be in terms of hours, day numbers, week numbers, etc. – not calendar dates.
There are therefore now two SPIs: a. SPI (cost) measured on the cost scale, i.e., earned value/scheduled cost; and b. SPI (time) measured on the time scale, i.e., planned duration/actual duration.

288 Chapter 33
Time‘now’
Forecast costoverrun
Forecast costof project
Original estimatedproject budget
Actual costsof workperformed
Schedulevariance(time)
Schedulevariance(cost)
Forecastproject
time slip
Cost variance
Final plannedcosts (Budgetat completion)
Final estimatedcost (Estimatedat completion)
Planned costs(Budgeted costof work scheduled)
Plannedcompletion
Actualcompletion
TimeATE
OD
Earned value(Budgeted cost of work performed)
Est
imat
ed c
ost t
o co
mpl
ete
Cos
t
Figure 33.15Earned value chart reproduced from BS 6079 ‘Guide to Project Management’ by permission of
British Standards Institution.
ECTC is Estimated Cost To CompleteBAC is Budget At Competition (current) (budget)BCWS is Budgeted Cost of Work Scheduled (current) (planned)BCWP is Budgeted Cost of Work Performed (earned value)ACWP is Actual Cost of Work Performed (actual)OD is Original Duration planned for the work to dateATE is the Actual Time Expended for the work to datePTPT is the planned Total Project TimeEAC is Estimated Cost at CompletionETPT is Estimated Project TimeCPI is Cost Performance Index = BCWP/ACWP = EfficiencySPI is Schedule Performance = BCWP/BCWS (cost based) = OD/ATE = % complete
Figure 33.16

Control Graphs and Reports 289
Figure 33.17Comparison of EV terms.

290 Chapter 33
In practice, the numerical difference between these two quotients is small, so that SPI (cost), which is easier to calculate, is sufficient for most purposes, bearing in mind that the result is still only a prediction based on historical data.
In 1996, the National Security Industrial Association (NISA) of America published their own Earned Value Management System (EVMS), which dropped the terms such as actual cost of work performed, budgeted cost of work performed and budgeted cost of work scheduled (BCWS) used in CSCS, and adopted the simpler terms of earned value, actual and schedule instead.
Since then, the American Project Management Institute (PMI), the British Association for Project Management (APM) and the British Standards Institution (BSI) have all discarded the CSCS abbreviations and also adopted the full English terms. In all probability, this will be the future universal terminology.
Fig. 33.17 clearly shows the earned value terms in both English (in bold) and EV jargon (in italics).
Earned Schedule
It has long been appreciated that Schedule Performance Index (cost) (SPIcost) based on the cost differences of the earned value and planned curves is somewhat illogical. An index reflecting schedule changes should be based on the time differences of a project. For this reason, Schedule Performance Index (time) (SPItime) is a more realistic approach and gives more accurate results, although in practice the numerical differences between SPIcost and SPItime are not very great. SPItime for any point in time, or the current time, can be obtained by dropping a vertical line from the planned curve (BCWS) to the time baseline. This is time now (ATE). Next, dropping a vertical line from the point on the planned curve, where the planned value is equal to the earned value to the time baseline, gives the original planned duration (OD).
This duration from the start date to (OD) is referred to as ‘Earned Schedule’
SPItime is therefore OD/ATE, i.e., the time efficiency. See Fig. 33.18.
Similar to budget cost/CPI = the final predicted cost, estimated duration/SPItime = final comple-tion time. It is important to remember that all units of durations on the time scale must be in day, week or month numbers, not in calendar dates.
Integrated Computer Systems
Until 1992, the EVA system was run as a separate computer program in parallel with a conventional CPM system. Now, however, a number of software companies have produced project-management programs that fully integrate critical path analysis with EVA. One of the best programs of this type, Primavera P6, is fully described in Chapter 51.

Control Graphs and Reports 291
The system can, of course, be used for controlling individual work packages, whether carried out by direct labour or by subcontractors, and by multiplying the total actual man-hours by the average labour rate, the cost to date is immediately available. The final results should be carefully analysed and can form an excellent base for future estimates.
As previously stated, apart from printing the EVA information and conventional CPM data, the program also produces a computer drawn network. This is drawn in precedence format.
The information shown on the various reports include: 1. The man-hours spent on any activity or group of activities 2. The percent complete of any activity 3. The overall percent complete of the total project 4. The overall man-hours expended 5. The value (useful) hours expended 6. The efficiency of each activity 7. The overall efficiency 8. The estimated final hours for completion 9. The approximate completion date 10. The man-hours spent on extra work 11. The relationship between programme and progress 12. The relative performance of subcontractors or internal subareas of work
EVA % Complete Assessment
For updating purposes, it is necessary to assess the percent complete of each EVA-related activity on the schedule. This is in fact a measure of the work done to date and involves different units of measurement, depending on the type of work involved. For example, the
EARNED SCHEDULE
PLANNED (BCWS)
EV (BCWP)
ACTUAL (ACWP)
TIMESV (TIME)
SV (COST)
TIMENOW
= SPI (time) ODOD
ATE
ATE
CO
ST
Figure 33.18

292 Chapter 33
unit for cables laid is the metres actually installed, while for paintwork, it is the area in m2 of paint applied on date.
Fig. 33.19 gives an overview of some of the units used on a construction contract. This is only for assessment of percent complete. The EVA calculations must still be in man-hours or monetary units.
Application % complete
Count plates for & completeMeasure tank surface area
Lineal metres erectedNo. of pipes taken from stack
No. of items installedAllow for testing 50%
No. of panels installede.g. 2 of 4 - 50%
Metres of cables had andtested
No. of connections completed
Metres of lagging installedArea of laggingNo. of lagging boxes fitted
Area of paintworkNo. of rooms completedMetres of painted piping
Tonnage erectedNo. of items erected
No. of units installed and tested
Stages completed
% complete visually assessed
Storage tank
Piping
Equipment
Switchgear
Electric cables
Wiring
Insulation
Painting
Steelwork
Computers
Software
General
Figure 33.19

293Project Management, Planning and Control. http://dx.doi.org/10.1016/B978-0-08-102020-3.00034-6Copyright © 2017 Elsevier Ltd. All rights reserved.
CHAPTER 34
Procurement
Chapter OutlineProcurement Strategy 295
Supply Chain 296Approved Tender List 296
Pre-Tender Survey 297Bidder Selection 300Request for Quotation 302Tender Evaluation 302Purchase Order 305Expediting, Monitoring and Inspection 306Shipping and Storage 307Erection and Installation 307Commissioning and Handover 308Types of Contracts 308
Lump Sum Contracts 309Remeasured Contracts 309Reimbursable Contracts 310Target Contracts 312Design, Build and Operate Contracts 312
Free Standing 313Levies on the Public Sector 313Joint Ventures 313
Basic Requirements for Success 313Bonds 314
Bid Bond 315Advance Payment Bond 315Performance Bond 319Retention (or Maintenance) Bond 319
Letter of Intent 319Bad Letter 323Good Letter 323
Subcontracts 324Definition of Subcontracts 324
Subcontract Documents 325Commercial Conditions – General 325Special Conditions 328Technical Specification 328

294 Chapter 34
Procurement is the term given to the process of acquiring goods or services.
The importance of procurement in a project can be appreciated by inspecting the pie chart (Fig. 34.1) from which it can be seen that for a typical capital project, procurement represents over 80% of the contract value.
The main functions involved in the procurement process are: 1. Procurement strategy 2. Approved tender list 3. Pre-tender survey 4. Bidder selection 5. Request for quotation (RfQ) 6. Tender evaluation 7. Purchase order 8. Expediting, monitoring and inspection 9. Shipping and storage 10. Erection and installation 11. Commissioning and handover
Description of Work 328Liquidated Damages (or Ascertainable Liquidated Damages) 329
Insurance 330Discounts 331
Negotiated and Hidden Discounts 332Bulk Purchase Discounts 332Annual Order Discounts 332Prompt Payment Discount 333Discount for Retention Bond 333
Counter-Trade 333Incoterms 334
Ex Works 334Free Carrier (Named Point) 334FOR/FOT 336FOB Airport 336FAS 336FOB 336C&F 336CIF 336Freight Carriage – Paid to … 337Freight Carriage – and Insurance Paid to … 337Ex Ship 337Ex Quay 337Delivered at Frontier 337Delivered Duty Paid 338
Further Reading 338

Procurement 295
These main functions contain a number of operations designed to ensure that the desired goods are correctly described and ordered, delivered when and where required and conform to the specified quality and performance criteria.
The functions are described further followed by a more detailed discussion of the types of contracts and supporting requirements.
Procurement Strategy
Before any major purchasing operation is considered, a purchasing strategy must be drawn up which sets out the criteria to be followed. These include: • Theneedandpurposeoftheproposedpurchase.• Shouldtheitemsbeboughtorleased?• Shouldtheitemsbemadein-house?• Willtherebeaconstructionelementinvolved?Ifyes,itwillbenecessarytodrawup
subcontractdocumentation.Ifnoconstructionorassemblyelement,astraightpurchaseorder will suffice.
• Howmanycompanieswillbeinvitedtotender?
Capital equipment27%
Manufacturing14%
Material formanufacturing
22%
Instruments.electronics.values, etc.
18%
Site costsincluding labour
5%
Site labour6%
Design & D O1%Other home office
costs7%
Figure 34.1Total project investment breakdown. Procurement value = 18 + 27 + 14 + 22 = 81%.
296 Chapter 34
• Willtherebeopenorselectivetendering?Thiswilloftendependonthevalueandstrate-gic or security restrictions. European Union regulations require contracts (subject to certain conditions) over a certain value to be opened up for bidding to competent suppli-ers in all member states.
• Arethereprohibitedareasforpurchaseorrestrictiveshippingconditions?• Whatarethemajorrisksassociatedwiththepurchaseateverystage?• Whatisthecountryofjurisdictionforsettlingdisputesandwhatdisputesprocedureswill
beincorporated?• Whatcontractlawisapplicable,whatlanguagewillbeused,andinwhatcurrencywill
thegoodsbepaidfor?• Howwillbidsbeopenedandassessedandbywhom?Withpublicauthoritiestendersare
usually opened by a committee.
Supply Chain
Every purchaser must bear in mind that most items of equipment contain components that are outsourced by the manufacturer or subcontractor to specialist companies. These companies may themselves subcontract subcomponents to other specialists, so that the original purchaser is utterly dependent on each subcontractor being technically and commercially rigorous and astute to ensure that the basic criteria of reliability, repeatability and sustainability are main-tained through the whole supply chain.
The technical failure of any component, or the non-compliance with the relevant environmen-tal and health and safety legislation, can have serious repercussions on the reputation and profitability of the purchaser. The problem has been exacerbated by the globalization of many manufacturing organizations where the inspection of the actual component or manufacturer’s premises may be difficult and costly. A monitoring and reporting mechanism must therefore be set up right through the supply chain to ensure that technical and environmental standards are maintained.
This issue has to be confronted by every manufacturing industry whether it be construction, engineering, electronics, pharmaceuticals, textiles, toys, etc.
Approved Tender List
Whentheprocurementstrategyhasbeenagreed,alistofapproved(orclient-nominated)tenderers can be drawn up.
For many large infrastructure or power plant projects, it is beneficial to obtain the advice of specialist suppliers or contractors during the design stage. This will then inevitably lead to the possibility of reducing the number of competitive bids or even contravening (in Europe) EUprocurementlaws.Inpractice,manysuchprojectswillbeconstructedbyconsortia

Procurement 297
comprisingcivil,mechanicalandelectricalcontractorsandmanufacturers,sothatthisriskhas been transferred from the client/operator to the consortium.
Mostmajorcompaniesoperatearegisterofthevendorswhohavecarriedoutworkonearliercontracts and have reached the required level of performance. These are generally referred to as ‘approved vendor lists’ and should only contain the names of those vendors who have been surveyed and whose capacities have been clearly established.
The use of computers enables such lists to be very sophisticated and almost certainly to contain information on company capacity and performance together with the details of all the workthecontractorhascarriedoutandthelevelofhisperformanceineachcase.
Lists are normally prepared on a commodity basis, but they are only of real use if they are constantly updated.
A typical entry against a vendor on such a list includes: • Companynameandaddress• Telephone,telexandtelefaxno.• Companyannualturnover• Listofmainproducts• Valueoflastorderplaced• Performanceratingon: • Adherence to price • Adherence to delivery • Adherence to quality requirements• Abilitytoprovidedocumentsontime• Cooperationduringdesignstage• Responsestoemergencysituations
Manyorganizationsalsokeepasecondlist,comprisingcompaniesthathaveexpressedtheirwishtobeconsideredforcertainareasofwork,butarenotontheapprovedvendorslist.Whentheopportunityarisesforsuchcompaniestobeconsidered,theyshouldbesentthepre-qualification questionnaires shown in Fig. 34.2 and, if necessary, be visited by an inspector.
Inthisway,thelistwillbeadynamicdocumentontowhichnewcompaniesareaddedandfrom which unsatisfactory companies are removed.
Pre-Tender Survey
The approved vendor list is a useful tool, but it cannot be so comprehensive as to cover every commodityandserviceineverycountryoftheworld.Fornewcommoditiesornewmarkets,therefore, a pre-tender survey is necessary. This is particularly important when a contractor is

298 C
hapter 34
Figure 34.2

Procurement
299
Figure 34.2 cont’d

300 Chapter 34
abouttoundertakeworkinanewcountrywithwhoselawsandbusinesspracticesheisnotfamiliar.
The summary should be as comprehensive as possible and the buyer should draw information from every available source. The subject is discussed in more detail later in this chapter under ‘Overseas bidder selection’, but the principles are equally applicable to surveys carried out in the UK or USA.
Bidder Selection
Before an enquiry can be issued, a list of bidders has to be compiled. Although the names of qualifiedcompanieswillalmostcertainlybetakenfromthepurchaser’sapprovedvendorlist,the actual selection of the prospective bidder for a particular enquiry requires careful consideration.
During the preparation stage of the equipment requisition, a number of suitable companies may well have been suggested to the buyer by the project manager, the engineering depart-ment,theconstructiondepartmentand,ofcourse,theclient.Whileallthis,oftenunsolicited,advice must be given serious consideration, the final choice is the responsibility of the procurementmanager.Inmostcases,however,theclient’sandprojectmanager’ssuggestionswill be included.
Thenumberofcompaniesinvitedtobiddependsontheproduct,themarketconditionsandthe‘imposed’namesbytheclient.Innocase,however,shouldthenumberofinvitedbiddersbelessthan3,ormorethan10.Inpractice,abidlistofsixcompaniesgivesareasonablespread of prices, but if too many of the invited companies refuse to bid, further names can be added to ensure a return of at least three valid tenders.
To ensure that the minimum number of good bids is obtained, some purchasers tend to favour a long bidder’s list. This practice is costly and time-consuming, especially if the support documentation, such as specifications and drawings, is voluminous. A far better method is to telephone prospective bidders before the enquiry is sent out and, after describing the bid packageinbroadterms,obtaintheassurancefromthecompaniesinquestionthattheywillindeedsubmitabidwhenthedocumentsarereceived.Inthisway,thelistcanbekepttoareasonablesize.Ifavendorsubsequentlyrefusestobid,herunstheriskofbeingcrossedoffthe next bid list.
Whiletheapprovedvendorlistisanexcellentstartingpointforbidderselection,furtherresearch is necessary to ensure that the selected companies are able to meet the quality and programme requirements. The prospective vendor must be experienced in manufacturing the item in question, have the capacity to produce the quantity in time, be financially stable and meet all the necessary technical and contractual requirements.

Procurement 301
Thebuyerwhokeepsintouchwiththemarketconditionscanoftenobtainusefulinformationfrom colleagues in other companies, from technical journals and even the daily press on the workloadorfinancialstatusofaparticularsupplier.Anannouncementinthefinancialcol-umns that a company has obtained an order for 10,000 pumps to be delivered over two years shouldtriggeroffaninvestigationintothecompany’stotalcapacity,beforeitisaskedtobidfor more pumps. Loading up a good supplier until he is overstretched and becomes a bad supplier is not in the best interest of either party.
Whenapurchaserletsitbeknownthatacertainenquirywillbeissued,thebuyerwillundoubtedly be contacted by many companies eager to be invited to bid. The information given by the salesman of one company must be compared with the, often contradictory, informationfromtheoppositionbeforearealisticdecisioncanbetaken.Onlybybeingfamiliarwiththeproductandthemarketforcesatthetimeoftheenquiry,canthebuyermakeobjectivejudgements.Onnoaccountshouldvendorsbeincludedonabidlisttokeepsales-menatbayorjusttomakeupnumbers.
Foritemsnotusuallyorderedbyapurchaser,adifferentapproachisnecessary.Inallprob-ability, no approved vendors list exists for such a product and unless someone in the procure-mentdepartment,orinoneoftheothertechnicaldepartments,knowsofsuitablesuppliers,acertain amount of research has to be carried out by the buyer.
The most obvious sources of suitable vendors are the various technical trade directories and technicalindexesavailableonmicrofilmormicrofiche.Inaddition,atelephonecalltotherelevanttradeassociationwilloftenyieldagoodcropofprospectivesuppliers.Whateverthesource, and whoever is chosen for the preliminary list, it will be prudent to send a question-naire to all the selected companies, requesting the following details: • Fullcompanynameandaddress(postalandwebsite)• Telephone,faxno.ande-mailaddress• Companyannualturnover• Nameofbank• Namesofthreereferences• Confirmationthatthespecifiedproductcanbesupplied• Whatproportionwillbesubcontracted• Nameofparentcompany–ifany
Itisclearfromtheabovethatthesequestionsmustbeaskedwellinadvanceoftheenquirydate.Itisnecessary,therefore,forthebuyertoscantherequisitionscheduleassoonasitisissuedtoextractsuchmaterialsanditemsforwhichnovendorslisthasbeencompiled.Inother words, the buyer will have to perform one of the most important functions of project management–forwardplanning.

302 Chapter 34
Request for Quotation
The procurement manager will first of all: • Produceafinalbidlistofcompetenttenderers• Decideontheminimumandmaximumnumberofbidstobeinvited• Ensurethatthespecificationandtechnicaldescriptionofgoodsorservicestobepurchased
are complete• Decideonthetypeofdeliveryandinsurancesrequired(ex-works,FAS,FOB,etc.)• Agreetotheprogrammewithdeliverydatesforinformationandgoodswiththeproject
manager• Decideonthemostappropriategeneralconditionsofpurchaseorcontract• Draftthespecialconditionsofcontract(ifrequired)• Decidethetypeandnumberofdocumentrequirements(manuals)• Agreewithprojectmanagerontheamountofliquidateddamagesrequiredagainstlatedelivery• DraftandissuetheRfQletter• EnclosewiththeRfQthelistofdrawingsandotherdatarequiredforsubmittingbids
Itisimportanttoincludeanyspecialrequirementsoverandabovetheusualconditionsofcontract with the enquiry documents. Failure to do so might generate claims for extras once the contract is underway. Such additional requirements may include special delivery needs andrestrictions,accessrestrictions,monitoringproceduressuchasEVA,inspectionfacilitiesand currency restrictions, etc. Discounts and bonus payments are best discussed at the inter-views with the preferred supplier/contractor after the tenders have been opened.
The following information must be requested from tenderers in the RfQ: • Priceanddeliveryasspecified• Discountsandtermsofpaymentrequired• Dateofissueofadvancedatetechnicaldata,layoutdrawings,settingplans,etc.• Productionanddeliveryprogramme• Expeditingscheduleforsuborders• Spareslistsandquotationforspares• Guaranteesandwarrantiesoffered• Alternativeproposalforpossibleconsideration
Tender Evaluation
The procurement manager must next: • Decideonbidopeningprocedureandopenbids• Receiveandlogthebidsastheyarrive• Assesspreviousexperienceandcheckreferencecontractsorsites• Checkfinancialstabilityofbidders

Procurement 303
• Checklistofpastclients• Setupbiddersmeetings• Interviewsiteorinstallationmanagerorforeman(ifapplicable)• Discussquantitydiscounts• Negotiateearlyorotherpaymentdiscounts• Obtainparentcompanyguaranteeswhenthecontractiswithasubsidiarycompany• Agreethemaintenance(guarantee)period• Discussandagreebid,performance,maintenanceandadvancepaymentbonds• Producebidsummary(bidtabulation)(Fig. 34.3)• Carryouttechnicalevaluation• Carryoutcommercialevaluation
The following are the main items that have to be compared when assessing competing bids: • Basiccost• Extras• Deliveryandshippingcost• Insurance• Costoftestingandinspection• Costofdocumentation• Costofrecommendedspares• Discounts• Deliveryperiod• Termsofpayment• Retentionsguarantees• Compliancewithpurchaseconditions
All the vendors’ prices must, of course, be compared with the estimator’s budgets, which will also appear on the sheet.
Ifthevalueofthebids(oratleastonebid)iswithinthebudget,thebidevaluationscanproceedasdescribedbelow.If,ontheotherhand,allthebidsarehigherthanthebudget,ameeting has to be convened with the project manager at which one of the four decisions has tobetaken,dependinglargelyontheoverallprojectprogramme: 1. Ifthereistime,theenquirycanbereissuedtoanewlistofvendors,spreadingtheareato
include overseas suppliers, provided foreign suppliers are not excluded by the terms of the contract.
2. Review the original design or design standards to see whether savings can be made. Whilesuchsavingsmaybedifficulttomakewithequipmentitems,whichhavetomeetspecified technical requirements, it may be possible to effect cost savings in the type of finish,orthematerialsofconstruction.Forexample,atankthatwasoriginallyspecifiedas galvanized may be acceptable with a good paint finish.
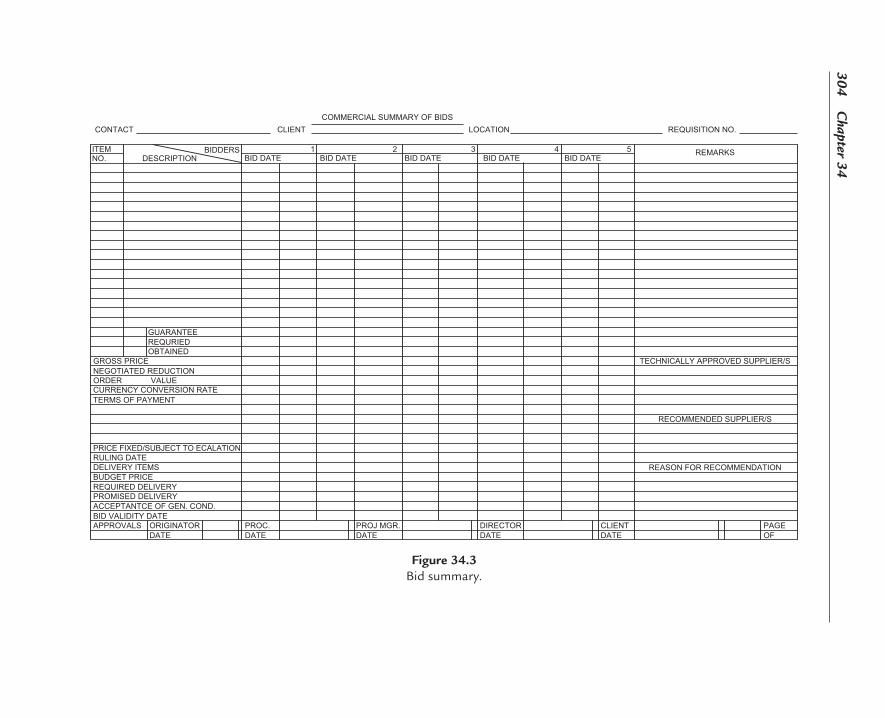
304 C
hapter 34
Figure 34.3Bid summary.

Procurement 305
3. Ifthereisnotimetoreissuetheenquiryitmaybenecessarytocallinthetwolowestbiddersandeithernegotiatetheirpricesdowntothebudgetleveloraskthemtorebidwithinafewdaysonthebasisofafewquicklyascertainabledesignchanges.
4. Ifitisdiscoveredthattheoriginalbudgetestimatewastoolow,thelowestbid(iftechni-cally and commercially acceptable) will have to be submitted for approval by the project manager.
Thesecommercialcomparisonsmustbecarriedoutforeveryenquiry.However,anadditionaltechnical assessment must be produced when the material and equipment is other than a general commodity item, which only has to comply with a material specification.
Although the purpose of this evaluation process is to find the cheapest bidder who complies with the specification and contractual requirements, the technical capability of the bidder as wellastheirtrackrecordoftimelycompletionandpastrelationships(goodorbad)withotherstakeholdersshouldalsobetakenintoconsideration.Thismayofcoursebeaprobleminitself with government contracts, where there can always be accusations of favouritism or even nepotism if the least expensive bidder has not been selected.
Purchase Order
Whentheselectedbidhasbeenagreed,thepurchaseorderorcontractdocumentmustbeissuedwith all the same attachments, which were part of the RfQ. The only additional documents are those containing the terms and conditions agreed at the bidder’s meeting or other written agreements made during the bid evaluation process. These will include: • Theproceduresforpaymentsassetoutincontract• Thestagesforissuinginterimandfinalacceptancecertificates
Any changes to the specification or drawings, etc. after the date of the purchase order will be issued as a variation order and controlled using established configuration management procedures.
As the contract proceeds, the procurement manager must: • Setprioritiesfromprogrammeandrevisionstoprogramme,ifnecessary• Setoutbondedareasandmarkingwhenadvancepaymentsareconsidered• Arrangetocarryoutregularexpeditingandcheckexpeditingreports• Carryoutstageinspectionandspecifiedtests,andcheckinspectionandtestreports• Carryoutroutesurvey(ifrequired)• Issuefinaldeliveryinstructionfordocumentsandgoods• Issuepackinginstructions• Issueshippinginformation,sailingtimes• Adviseonshippingrestrictions(conferencelinesrequirements,etc.)

306 Chapter 34
• Adviseoncurrentsiteconditionsforstorage• Greeandfinalizeclose-outprocedures• Obtaindetailsofaftersalesservice
Expediting, Monitoring and Inspection
Between the time of issuing the purchase order or contract documents and the actual delivery of the goods or services, the progress of the production (manufacture) of the goods must be monitored if quality and delivery dates are to be maintained.
The contract documentation will have (or should have) included the appropriate portion of the overall project programme. From this, the contractor or supplier will be required to produce his own construction or manufacturing programme. This should be issued to the main con-tractororclientwithintwoorthreeweeksofreceiptoforderandcanbeusedtomonitorprogress.
Itisbeneficialifanexpediterorinspectorvisitstheworksorofficesofthesupplierwithintwoweeksofcontractawardtoensurethat: 1. The contract documents have been received and understood 2. The contractor’s or supplier’s own programme has been started or is ready to be issued 3. The supplier or contractor has all the information he or she needs
Atregularintervalsanexpediterwillthenvisitthesupplierandcheckthatthesupplier’sownprogramme is being met and, in particular, that sub-orders for materials and components have been placed, bearing in mind the lead times for these items. Any slippage to either the pur-chaser’s or supplier’s programme must be reported immediately to the project manager so thatappropriateactioncanbetaken.Wheretimeisoftheessence,anumberofoptionsareavailabletobringthedeliveryofthegoodsbackonschedule.Theseare: 1. The purchaser’s programme may have sufficient float (permissible delay) in the delivery
string,whichmaymakefurtheractionunnecessary,butpressuretodelivertothereviseddate must now be applied.
2. Ifthereisnofloatavailable,thesuppliermustbeurgedtoworkovertimeand/orweek-endstospeedupmanufacture.Itmaybeworthwhileforthepurchasertopayforthesepremium man-hours in full or in part, as even if liquidated damages are imposed and obtained, the financial cost of delay, in addition to loss of prestige or reputation, is often very much greater than the value of any liquidated damages received.
3. Ifthereisnoliquidateddamagesclauseinthepurchaseagreementorcontractbutdeliv-ery by a stated date is a fundamental requirement, the purchaser may threaten the supplier with legal proceedings, breach of contract or any other device, but while this may punish the supplier, it will not deliver the goods. For this reason, early warning of slippage is essential.

Procurement 307
Because of the danger from the imposition of damages at large, due to possible delayed delivery, prudent suppliers, and especially contractors, should request that a liquidated damages clause be inserted into the contract, even if this has not been originally provided.
Similarly, an inspector will visit the supplier early on to ensure that the necessary materials and certificates of conformity are either on order or available for inspection.
This expediting and inspection process should continue until all the items are delivered or the specified services are commenced.
Shipping and Storage
To ensure that the materials or equipment are delivered on time and at the correct location, checksshouldbecarriedouttoensurethat,inthecaseofoverseasprocurement,therearenoshipping, landing or customs problems. Overland deliveries of large components may require a route survey to ensure that bridges are high or strong enough, roads wide enough and the necessary local authority permits and police escorts are in place.
Special attention must be given to contracts when dealing with the construction industry. Here,thetimingofdeliverieshastobecarefullycalculatedtoensurethatthereissufficientunloading and storage space, adequate cranage is available, there is no interference with other site users and that adequate temporary protective materials are ready.
Inthecaseofurbanconstruction,interferencewithtrafficorthegeneralpublicmustbeminimized.
Erection and Installation
Onceonsite,fabrication,erectionandinstallationworkshouldberegularlymonitoredusingearned value techniques, which are related to the construction programme. Only in this way can the efficiency of a subcontractor be assessed and predictions as to final cost and comple-tion can be made.
As the cost of delays to completion can be many times greater than the losses to production or usage of the facility being constructed, the imposition of liquidated damages (even if pos-sible) will not recover the losses and are at best a deterrent. A far better safeguard against late completion is the insistence that realistic and updated construction programmes are produced, regularly(preferablyweekly)monitoredand,withtheaidofnetworkanalysisandEVAtechniques,keptontarget.Althoughthismayrequireadditionalresourcesandincentives,itmay well be the best option.
As most construction contracts will have been placed on the basis of an agreed set of condi-tionsofcontracts(whethergeneralorspecial),itwillbenecessarytocheckthatthe

308 Chapter 34
conditions are fully met, in particular those relating to quality, stage completion and health andsafety.Itisalsonecessarytoensurethatadequatedrawingsandcommissioningproce-dures are ready when that stage of the contract commences.
Throughout the manufacturing or construction process, documents such as operating and maintenance procedures, spares lists and as-built drawings must be collated and indexed to enablethemtobehandedoverinacompletestatewhentheofficialhandovertakesplace.
Commissioning and Handover
Beforeaplantishandedoverforoperation,itmustbecheckedandtested.Thisprocessiscalled commissioning and involves both the contractor and operator of the completed facility.
Careful planning is necessary, especially if the plant is the part of an existing facility that has tobekeptfullyoperationalwithminimaldisruptionduringthecommissioningprocess.Integrationwithexistingsystems(especiallywhencomputersareinvolved)hastobeseam-less, and this may require the existing and new systems to be operated concurrently until all the teething problems have been resolved.
Incertaintypesofplants,equipmentwillhavetobeoperated‘cold’,i.e.,withouttheoperat-ing fluids (gases, liquids or even solids) being passed through the system. Only when this stage has been successfully completed can ‘hot’ commissioning commence with the required media being processed in the final operating condition (temperature, viscosity, pressure voltage, etc.) and at the specified rates of usage (flow, wattage, velocity, etc.).
Itisoftenconvenienttoinvolvetheoperatingpersonnelinthecommissioningprocesssothatthey can become familiar with the new systems and operating procedures.
AfterthevarioustestsandpilotrunshavebeencompletedandtheoperatingcriteriaandKPIshave been met to the satisfaction of the client, the new facility can be formally handed over for operation. This involves handing over all the stipulated documents, such as built drawings, operating and maintenance instructions, lubrication schedules and spares lists, as well as commissioning records, test certificates of equipment, materials and operators, certificates of origins and compliance, guarantees and warranties.
A close-out report will have to be written, which records the major events and problems encountered during the manufacturing, construction and commissioning stages. This will be indexed and filed to enable future project managers to learn from past experience.
Types of Contracts
Contracts consist of three main types: 1. Lump sum contracts 2. Remeasured contracts 3. Reimbursable contracts

Procurement 309
Itispossibletohaveasubcontractthatisacombinationoftwoorevenallthreetypes.Forexample, a mechanical erection subcontract could have design content that is a lump sum fixed fee, a remeasured piping erection portion and a reimbursable section for heavy lifts in which the client wants to be deeply involved. The main differences between the three types are as follows.
Lump Sum Contracts
A prerequisite to a lump sum (a fixed price) contract, with or without an escalation clause, is a complete set of specifications and construction drawings. These documents will enable the subcontractortoobtainaclearpictureoftheworks,assessthescopeandqualityrequirementsandproduceatenderthatisnotinflatedbyunnecessaryriskallowancesorhedgedwithnumerous qualifications.
The trend in the USA is to have all the designs and drawings complete before tenders are invitedand,providedsuchusualriskitemsassub-soil,climaticandseismicconditionsareclearly given, a good competitive price can be expected.
Most lump sum contract documents should, however, contain a schedule of rates, so thatvariationscanbequicklyandamicablycostedandagreed.Clearly,thesevariationsshouldbekepttoaminimumandmustnotexceedreasonablelimits,sincetheratesused by the subcontractor are based on the tender drawings and quantities and a major change could affect his man-hour distribution, supervision level and site organization. A common rough limit accepted as reasonable is a value of variations of 15% of the contract value.
Itmustbestatedthatavariationcanbeadecreaseaswellasanincreaseinscopeandalthough the quantities may be reduced by the client, the reduction in price will not be proportionaltothatreduction.Indeed,whenasubcontractincludesadesignelement,areduction in hardware (say the elimination of a small pump), may increase the contract value due to costly drawing changes and cancellation charges.
Remeasured Contracts
MostcivilengineeringsubcontractsintheUKareletasremeasuredcontracts.Inotherwords,theworkismeasuredandcosted(usuallymonthly)asitisperformedinaccordancewithapriced bill of quantities agreed between the purchaser and the subcontractor. The documents that are required for the tender are: 1. Specifications2. Generalarrangementdrawings 3. Bills of quantities

310 Chapter 34
The bills of quantities are usually prepared by a quantity surveyor employed by the purchaser and are in fact only approximate, since the only drawings available for producing the bills are thegeneralarrangementdrawingsandafewdetailsorsketchespreparedbythedesigners.Obviously, the more details available, the more accurate the bills of quantities are, but since oneoftheobjectivesofthistypeofcontractistoinvitetendersasquicklyaspossibleafterthebasic design stage, full details are rarely available for the quantity surveyor. The subcontractor pricestheitemsinthebillsofquantities,takingintoaccounttheinformationgiveninthedrawings, the specification, the preambles in the bills and, of course, the location and condi-tions of the proposed site.
Although the items in the bills of quantities are often described in great detail, they are includedonlyforcostingpurposesanddonotconstituteaspecification.Inthesameway,thequantities given in the bill are for costing purposes only and are no guarantee that they will be the actual quantities required.
As with lump sum contracts, variations, which inevitably occur, must not exceed reasonable limits in either direction, since these could invalidate the unit rates inserted by the subcontrac-tor. For example, if the bills of quantities call for 10,000 m3 of excavation of a depth of 2 m, and it subsequently transpires that only 1000 m3 have to be excavated, the subcontractor is entitled to demand a rerating of this item on the grounds that a different excavator would have to be employed, which costs more per cubic metre than the machine envisaged at the time of tender.
Inremeasuredsubcontracts,itisacommonpracticetocarryoutamonthlyvaluationonsiteas a basis for progress payments to the subcontractor. These valuations consist of three parts: 1. Valueofmaterialsonsite,butnotyetincorporatedintheworks2. Valueofworkexecutedandmeasuredinaccordancewiththemethodofmeasurement
stated in the bills of quantities 3. Assessed value of preliminary items and provisional sums set out in the bills
The value of materials, which have been paid for in a previous month (when they were delivered,butnotyetincorporatedintheworks),isdeductedfromthemeasuredworksinthesubsequent month (by which time they were incorporated) since the billed rates will include the cost of materials as well as labour and plant.
At the end of the contract period, the final account will require a complete reconciliation of the cost and values, so that any overpayments or underpayments will be balanced out.
Reimbursable Contracts
Whenaclient(orpurchaser)wishestoplaceacontractasearlyaspossible,butisnotinaposition to supply adequate drawings or specifications, or when the scope has not been fully defined, a reimbursable contract is the most convenient vehicle.

Procurement 311
Initssimplestform,thecontractor(orsubcontractor)willsupplyallthematerials,equipment,plant and labour as and when required, and will invoice the client at cost, plus an agreed percentage to cover overheads and profit. To ensure ‘fair play’, the client has the right to audit thecontractor’sbooks,checkhisinvoicesandlabourreturns,etc.,buthehaslittlecontroloverhismethodofworkingorefficiency.Indeed,sincethecontractorwillearnapercentageoneveryhourworked,hehaslittleincentiveineitherminimizinghisman-hourexpenditureor finishing the job early.
To overcome the obvious deficiencies of a straight reimbursable (or cost-plus) contract, a number of variations have been devised over the years to give the contractor an incentive to be efficient and/or finish the job on time.
Most cost reimbursable contracts have two main components: 1. A fee component that can cover design costs, site and project management costs, over-
heads and profits 2. A prime cost component covering equipment, materials, consumables, plant, site labour,
subcontracts and site establishment
Insomecases,thesiteestablishmentmaybeinthefeecomponentorthedesigncostsmaybein the prime cost portion. The very flexibility of a reimbursable contract permits the most convenient permutation to be adopted.
By agreeing to have the fee portion ‘fixed’, the contractor has an incentive to finish the job as quicklyaspossible,sincehisfeeandprofitsarerecoverableoverashorterperiodandhecanthen release his resources for another contract. Furthermore, since he only recovers his prime costexpenditureatcost,hehasabsolutelynoadvantageinextendingthecontract–indeed,his reputation will hardly be enhanced if he finishes late and costs the client more money.
Ifthescopeofworkisincreasedbytheclient,thecontractorwillusuallybeentitledtoanincrease of the fixed fee by an agreed percentage, but frequently such an increase only comes into effect if the scope charge exceeds by 10% of the original contract value.
The factors to be considered when deciding on the constitution of the fixed fee and prime cost components are: 1. Time available for design 2. Extent of the client’s involvement in planning and design 3. Extent of the client’s involvement in site supervision and inspection4. Needtopermitoperationsofadjacentpremisestocontinueduringconstruction.Thisis
particularly important in extensions for factories, hotels, hospitals or process plants 5. Financial interest of the client in the contractor’s business or vice versa 6. Location of site in relation to the main area of equipment manufacture7. Importanceoffinishingbyaspecifieddate,e.g.,weatherwindowsforoffshoreoperations
or committed sales of product

312 Chapter 34
8. Method of sharing savings or other incentives; it can be seen that if both parties are in agreement a contract can be tailored to suit the specific requirements, but the client still has only an estimate of the final cost
Target Contracts
To counter some of the disadvantages of the straight reimbursable contracts, target contracts havebeendevised.Inthesecontracts,anestimateoftheworkshasbeenpreparedbytheemployer (or his consultants) and agreed with a selected contractor. The prime cost is then frozen as a target cost the contractor must not exceed. The fee component is fixed, but it can also be calculated to be variable in such a way that the contractor has an incentive to complete theworksbelowtargetoronprogrammeorboth.
Again, there are numerous variations of this theme, but the following are the more common methods of operation: 1. Ifthefinalmeasuredprimecostsarelessthanthetargetvalue,thedifferenceisshared
betweenthepartiesinapreviouslyagreedproportion.Ifthefinalcostsexceedthetargetvalue, the contractor pays the difference in full. The fee portion remains fixed.
2. As in 1, but the fee portion increases by an agreed percentage as the prime cost portion decreases. This gives the contractor a double incentive to complete the contract below the target value and thus increase the fee and ensure savings.
3. Asin1,butthefeeportionincreasesbyanagreedpercentageforeveryweekofcomple-tion prior to the contractual completion date.
4. The employer pays the final prime cost or the target cost, whichever is lower, but the difference, if any, is not shared with the contractor. The fee, however, is increased if there is a saving of prime cost or time or both.
Ifthecontractorisresponsibleforpurchasingequipmentaspartoftheprimecostportion,theprocurement costs such as purchasing, expediting and inspection may be reimbursable at an hourlyrate(subjecttoanannualreview),butalldiscounts,includingbulkandpromptpaymentdiscounts, must be credited to the employer. The contractor still has an incentive to obtain the best possible prices, since the prime cost will be lower.
Design, Build and Operate Contracts
These types of contracts have been developed since 1992 to reduce the financial burden on the publicpurse.Thisprocessisknownasprivatepublicpartnership(PPP).AsubsetofPPPisprivatefinanceinitiative(PFI).Thesenewtypesofcontractshaveanumberofvariationsasdescribedbelow,buttheirmainpurposeisfortheprivatesectortotakemost,ifnotall,ofthefinancialriskandemploytheirspecialistknowledgeandcommercialexperience,notalwaysavailableinthepublicsector.Generally,aspecialservicecompany,knownasaspecialservicevehicle(SPV)is

Procurement 313
formed, consisting of the contractors (building, maintenance and operating) and the financiers (bankorotherfinancehouse)toconstruct,maintainandoperatetheassetforacontractuallyagreed period. This company then signs the contract with the public authority (central or local) and arranges any leases with the actual operating organization, such as a prison or hospital.
ThebigdifferencebetweenPFIandmoreconventionalcontractsisthatthecontractorfinances the whole project from his own resources, and then recoups the cost and profit from the operation revenues or from levies charged on the public sector organization that awarded the contract. The following three examples explain the different types.
Free Standing
AtypicalexampleofthistypeofPFIcontractiswherethepublicauthoritydraftsaperfor-mancespecificationforanewbridgeandasksanumberoflargecontractorstosubmitcostedschemes. The successful contractor then designs, builds and maintains the bridge for a specified period. During this operating period, the cost and profit are recovered by the con-tractor/operator from tolls charged for the crossing. The contractor carries theriskthatthevolume of traffic will not reach the anticipated levels to yield the required revenues, possibly because the end user, the general public, considers the tolls to be too high.
Levies on the Public Sector
An example of such a contract is where the government requires a new prison. The successful contractor designs and builds the prison to the client’s specification and operates it in accor-dance with the standards laid down by the prison service. As the end users, the prisoners, can hardly be expected to pay rent, an operating levy is charged on the prison service to cover building, financing and operating costs plus profit.
Joint Ventures
JointventurePFIprojectsareoftenusedforroadconstructionwheretherearenotollchargesontheroadusers.Here,thedesignandconstructioncostsaresharedbyanagreedamountbythe public and private sector, and the contractor recovers his costs by a fee based on a benefit/revenue formula agreed in advance.
Inallthesetypesofcontracts,thecontractorisnotchosenonthebasisofthecheapestprice,butontheviabilityofhisbusinesscase,designconcept,experience,technicalexpertise,trackrecordandfinancialbacking.Inmanycases,thecontractorleadsaconsortiumofspecialistcontractors, design consultants and financial institutions.
Basic Requirements for Success
Whicheverformulaisagreedupon,itisclearthatinanyreimbursablecontract,theemployerretainsameasureofcontrolandhenceaconsiderableresponsibility.Iftheemployerisalso

314 Chapter 34
involved in the design process, the release of process information, construction drawings and operatingproceduresmustformpartoftheprogrammeandshouldbemarkedasaseriesofkeydatesthatmustbekeptifadherencetotheprogrammeisimperative.
The success of a contract (or subcontract) depends, however, on more factors than a well-drawn-upsetofcontractconditions,andthefollowingpointsmustnotbeoverlooked: 1. Goodcostcontrolofprimecostitems2. Goodsitemanagement 3. Careful planning and programming 4. Punctual release of information to site 5. Timely deliveries of equipment and materials 6. Elimination of late design changes7. Goodlabourrelations8. Goodrelationshipbetweencontractingparties
The main types of contracts are summarized in Fig. 34.9.
Bonds
Abondisaguaranteegivenbythirdparty,usuallyabankorinsurancecompany,thatspeci-fied payments will be made by the supplier or contractor to the client if certain stipulated requirements have not been met. There are four main types of bonds a client may require to be lodged before a contract is signed. These are shown in order of submission: 1. Bid bond 2. Advance payment bond 3. Performance bond 4. Retention bond
Any of these bonds can be either conditional or on-demand. Conditional bonds, which are usually issued by an insurance company or similar financial institution, carry a single charge that is independent of the time the bond is in force and can only be called if certain predeter-mined conditions have been met. Such a condition might include that the supplier or contrac-tor has to agree that the bond is called (i.e., that the money is paid to the client), or that the client or purchaser must prove loss to the satisfaction of the issuing house due to the default ofthesupplier.Whilesuchabondmaybeveryadvantageoustothesupplier,itisoftenregarded as unacceptable to a purchaser, since the collection and submission of evidence of default or proof of loss can be a time-consuming business.
The on-demand bond, on the other hand, has no such restrictions. As the name implies, it enables the purchaser to call in the bond as soon as and when he or she believes that a default by the supplier has occurred. Such a bond is normally issued by a recognized

Procurement 315
bankandwillbepaidwithoutquestionandwithouttheneedforjustificationassoonasthe demand for payment is made by the purchaser. Clearly, the main element of such a bondistrust.Boththebankandthesuppliertrustthepurchasertobereasonableandhonourable not to call the bond until the contractual terms permit it. These bonds cost more than a conditional bond and are only for a fixed duration, usually a particular stage of the project. They can, however, be extended for a further period for an additional fee (see Fig. 34.4).
Apart from the benefit of speedier payment should there be a default by the supplier, another advantage to the purchaser of such a bond is that, as the cost of the bond depends on the bank’sperceptionoftheriskandthesupplier’sfinancialrating,ameasureofthesupplier’sstanding can be obtained. A low bond fee usually means that the supplier is regarded by the bankasreliableandfinanciallystable.
Bid Bond
Inmajorcontracts,manyoverseasclientsrequireabidbondtobesubmittedwiththetenderdocuments. The purpose of this bond, which is usually an on-demand bond, is to discour-age the tenderer from withdrawing his bid after submission. This can be of considerable potential danger to a tenderer who discovers, after the bids have been dispatched, that there was an error in his tender price or that other contractual requirements have been over-looked.Unlesshispricewasoriginallyhigherthanthatofhiscompetitors,theunfortunatetendererhastodecidewhethertoproceedwithapotentiallyloss-makingcontractortoforfeit his bond.
The client will undoubtedly argue that the main purpose of the bond is to eliminate frivolous bids and ensure that those bids submitted are not only serious but also firm.
However,therecanbeconsiderablefinancialdisadvantagestoatenderersinceabidbond,ifissuedbyhisbank,isequivalenttoanoverdraft,sothattheworkingcapitalcanbegreatlyreducedforaconsiderableperiod.Whenoneconsidersthatitcantakebetweenthreemonthsandayeartoknowwhetheralargecontracthasbeenwonorlost,thelossinfinancingfacilities and interest charges for the bond can be so great as to deter all but the largest contractors from tendering.
Advance Payment Bond
There are circumstances when a seller requires payments to be made before the goods are delivered. This arrangement is frequently required to finance expensive raw materials. The purchasermayalsowishtomakeadvancepaymentstoreserveaplaceinthemanufacturingqueue or, as in the case of public authorities, to meet an expenditure deadline.
Until the goods are delivered, however, the purchaser has little or no guarantee that the advance payments will not be completely lost, should the supplier go into liquidation or

316 Chapter 34
thedirectorsdisappeartoSouthAmerica.Toeliminatethisrisk,thepurchaserrequiresthesuppliertodepositwithhimabond,usuallyunderwrittenbyabank,whichguaran-tees a refund should any of the above misfortunes of the above type occur. The bond usually has a time limit that is often geared to a physical stage of the contract, such as the receipt by the purchaser of preliminary drawings or the arrival of raw materials. The
Figure 34.4Bank guarantee draft.
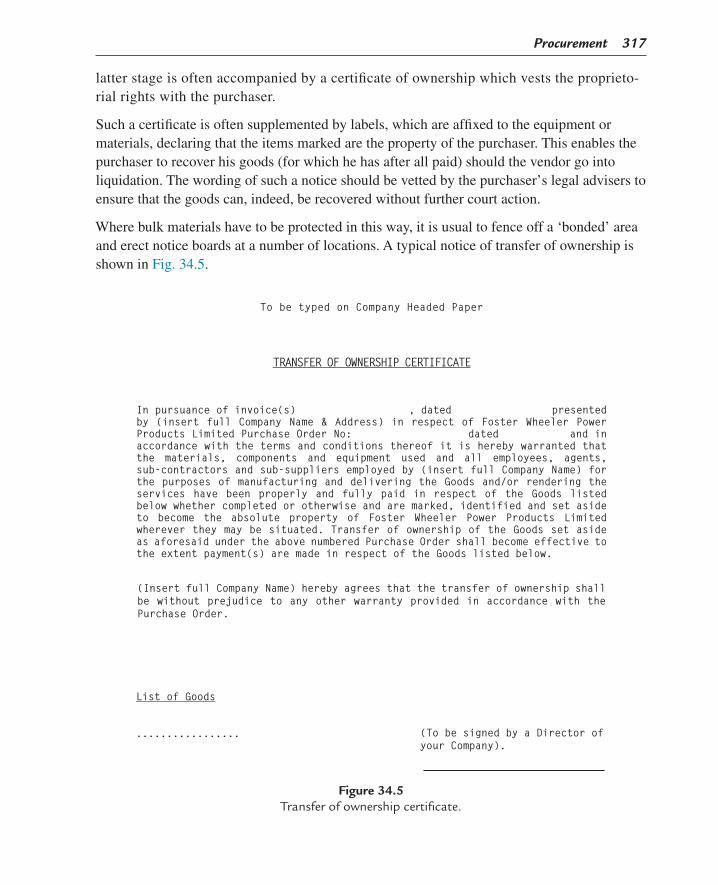
Procurement 317
latter stage is often accompanied by a certificate of ownership which vests the proprieto-rial rights with the purchaser.
Such a certificate is often supplemented by labels, which are affixed to the equipment or materials,declaringthattheitemsmarkedarethepropertyofthepurchaser.Thisenablesthepurchaser to recover his goods (for which he has after all paid) should the vendor go into liquidation. The wording of such a notice should be vetted by the purchaser’s legal advisers to ensure that the goods can, indeed, be recovered without further court action.
Wherebulkmaterialshavetobeprotectedinthisway,itisusualtofenceoffa‘bonded’areaand erect notice boards at a number of locations. A typical notice of transfer of ownership is shown in Fig. 34.5.
Figure 34.5Transfer of ownership certificate.

318 Chapter 34
Whileanadvancepaymentbondwillusuallyberequiredforprogresspaymentsforworkcarriedoutoffsite,itisnotnormallyrequiredforworkonsite,sincethecompletedworksarethe immediate property of the purchaser and could be finished by another subcontractor in the caseofbankruptcyordefault(seeFig. 34.6).
Figure 34.6Advance payment bond draft.

Procurement 319
Performance Bond
This type of bond is more usually associated with subcontracts and is an underwritten guaran-teebyabankorotherfinancialinstitutionthatthesubcontractorwillperformhiscontractandcompletetheworkasspecified.
Even if the subcontractor is paid by progress payments, the purchaser may still suffer consid-erablelossandfrustrationiftheworksarenotcompletedduetothesubcontractorwithdraw-ing from site.
The performance bond should be of sufficient value to cover the cost of finding and negotiat-ing with a new subcontractor and paying for the additional costs that the new subcontractor may incur. There may, of course, be the additional costs of delays in completing the project, which are often far greater than the difference in price of two subcontractors.
Usually, the value of a performance bond is between 2.5% and 5% of the contract value, which covers most contingencies.
Once the certificate of substantial completion has been issued, the performance bond is returned to the subcontractor. Alternatively, the bond can be extended to cover the maintenanceperiodandthustakestheplaceoftheretentionbond(seefollowingsection), provided, of course, that the percentage of the contract value is the same for both bonds (see Fig. 34.7).
Retention (or Maintenance) Bond
Many purchase orders and most subcontracts require a retention fund to be established during the life of the manufacturing or construction stage. The purpose of a retention bond is to release the monies held by the purchaser at the end of the construction period and yet give the purchaser the available finance to effect any necessary repairs or replace-ments if the subcontractor or vendor fails to fulfil his contractual obligations during the maintenance period. The value of the bond is exactly equal to the value of the retention fund (usually between 2.5% and 10% of the contract value), and is issued by either a bankoraninsurancecompany.
Whenthemaintenanceperiodhasexpiredandthefinalcertificateofacceptancehasbeenissued, the retention bond is returned by the purchaser to the subcontractor, who in turn returnsittohisbank(seeFig. 34.8).
Letter of Intent
Ifprotractednegotiationscreatedasituationwhereitisvitaltoissueanorderquicklytomeetthe overall project programme, it may be necessary to issue a letter or fax of intent. Formal purchaseorders,especiallyifextensiveamendmentshavetobeincorporated,cantakedaysif

320 Chapter 34
Figure 34.7Performance bond.

Procurement 321
Figure 34.8Retention bond.

322 Chapter 34
notweekstotype,copyanddistribute.Adevicemustthusbefoundtogivethevendoraformal instruction to proceed to enable the agreed delivery period to be maintained.
The letter of intent fulfils this function, but unless properly drafted it can turn out to be a very dangerousdocumentindeed.Invariably,thebuyertendstobebrief,restrictingtheletterorfaxto essentials only. The danger lies in the fact that by being too brief, he may underdefine the contract, leaving the position open for an unscrupulous or genuinely confused vendor to lodge claimsforextras.Tomakemattersworse,instructionstoproceedmayhavetobegivenbefore
Figure 34.9Summary of main types of contract.

Procurement 323
a number of apparently minor contractual points have been fully agreed, and while the buyer may try to build a safeguard into the letter by a clause, such as: ‘This authority is given subject to final agreement being reached on the outstanding matters already noted’, he has not, in fact, protected anybody.
The following examples show how a letter or fax of intent should not and should be drafted.
Bad Letter
Following our Invitation to Bid and your quotation No. 2687 of …… together with all subsequent documentation, please accept this fax as your instruction to proceed with the works.
This Authority is given subject to final agreement being reached on the outstanding matters already noted.
Good Letter
This fax gives the vendor the right to start work and incur costs which can be recovered by him even if the final negotiations breakdown and the formal contract is not issued. A fax of intent should be drafted on the following lines:
Following an Invitation to Bid of the …… and your quotation No. 2687 of …… together with Amendments Nos. 1, 2, 3 and 4, and Minutes of Meeting of ……, and ……, please proceed with the design portion of the works and the preparation of sub-order requisitions to a max. value of £2000 to maintain a contract completion of ……
The firm order for the remainder of the contract of the agreed value of £59,090 (subject to adjustment) will be issued if the outstanding matters, i.e., amount of liquidated damages and cost of extended drive shafts are agreed by the ……
This fax of intent is undoubtedly longer, but it contains all the essential information and tells the vendor what his limits of expenditure are before the final order is placed. The vendor also knowsthescopeofsupply(includingalltheagreedamendments)andthedatebywhichtheequipment has to be delivered. By releasing the vendor to commence the design and suborder preparation, the delivery date will not be jeopardized, provided, of course, that the stated outstanding issues are resolved.
The vendor realizes that he may, in fact, still lose the order if he does not come to terms with the purchaser, and this gives him an incentive to complete the deal.
The fax also states what the contract sum (subject to the negotiated adjustments) will be and what the items are that are subject to adjustment.
Clearly, the best procedure is to be in a position to issue the formal purchase order as soon as the negotiationshavebeencompleted.Thiscanbedoneprovidedthebuyerworksuptothepreparationof the purchase order during the negotiation phase. As clauses or specification details are amended and agreed, they are added to the draft purchase order document so that when the final meeting has takenplace,anylast-minuteextraparagraphscanbeaddedandthepriceanddeliveryboxesfilledin.Itshouldthenbepossibletosendthefinaldrafttothetypingsectionwithin24hours.
A further advantage of following the above procedure is that the buyer is aware of, and can makequickreferenceto,thecurrentstatusofthediscussionswiththevendorsothathecanbrief other members of the organization at short notice.

324 Chapter 34
SubcontractsDefinition of Subcontracts
The difference between a subcontract and a purchase order is that the subcontract has a site labour content. The extent of this content can vary from one operative to hundreds of men. The important point is that the presence of the man on site requires documents to be included in the enquiryandcontractpackagethatsetoutthesiteconditionsforlabourandadvisethesubcon-tractorofthelimitationsandrestrictionsonthesite.Whilethisdistinctionisundoubtedlytrue,there are numerous cases where the decision between issuing a relatively simple purchase order or a full set of subcontract documents is not quite as straightforward as it would appear.
For example, if an order is placed for a gas turbine and it is required that the manufacturers send a commissioning engineer to site to supervise setting up and commissioning, does this constituteasitelabourcontentornot?Similarly,ifacontrolpanelvendorpreferstocompletethe wiring of a panel on site (possibly due to programming requirements) and has then to sendtwoorthreetechnicianstosite,canthisbeclassedasasubcontract?
There are undoubtedly good reasons why, if at all possible, the issuing of a full set of subcontract documentsshouldbeavoided.Thecostofcollatingandissuingwhatisoftenaverythicksetofcontractual requirements, site conditions, specifications, safety regulations, etc., is obviously greater than the few pages that constitute a normal purchase order. Furthermore, the vendor has to read and digest all these instructions and warnings and may well be inclined to increase his price tocoverforconditionsthatmaynotevenrelatetohistypeofwork.Ontheotherhand,ifavendorbringsamanontothesitewhoperformssimilarworktoothersiteoperativesbutispaidmore,orbelongstoanunacceptabletradeunion(ornounion),orworkslongerhours,orenjoysunspecifiedconditions better than the other men, the effect on site labour relations may be catastrophic. The costofevenhalfaday’sstrikeisinfinitelygreaterthanabundleofcontractdocuments.
Itcanbeseen,therefore,thatthereisagreyareathatcanonlyberesolvedinthelightofactualsiteconditionsknownatthetime,plusaknowledgeofthescopeofworktobecarriedout by the vendor’s site personnel. The following guidelines may be of some assistance in deciding the demarcation between a purchase order and a subcontract, but the final decision must reflect the specific labour content and site conditions.
Typical subcontracts are as follows: • Demolition• Siteclearanceandfencing• Civilengineering• Steelerection• Buildingworkanddecorating• Mechanicalerectionandpiping• Electricalandinstrumentationinstallation• Insulationapplication

Procurement 325
• Painting• Specialisttrayerection• Specialisttelecommunicationinstallations• Specialisttankerection• Specialistboilerorheatererection• Watertreatment• Effluenttreatment• Siterefractoryworks• Sitecleaning(includingofficecleaning)• Securityandnightwatchmen• Radiographyandothernon-destructivetesting(NDT)
Subcontract Documents
The documentation required for a subcontract can be roughly classified into three main groups: 1. Commercial conditions 2. Technical specification 3. Site requirements
Although all three types of documents are interrelated, they cover very different aspects of the contract and are therefore prepared by different departments in the purchaser’s organization.
The commercial conditions are usually standardized for a particular contract or industry, and if not actually written by the commercial or legal department, are certainly vetted and agreed by them.
The technical specification may be prepared by the relevant technical department and includes thenecessarytechnicaldescription,materialandworkspecifications,standards,drawings,data sheets, etc.
The site requirements originate from the construction department or client and set out the site conditions, labour restrictions, safety and welfare requirements, and programme (sometimes called the schedule).
The subcontract manager’s function is to pull these three sets of documents together and produce one combined set of papers that tell the subcontractor exactly what he must do, how, where and when.
Commercial Conditions – General
Theconditionsofsubcontract,likethegeneralormainconditionsofcontract,aremosteffectiveif they follow a standardized and familiar form. Most civil engineers are conversant with the InstitutionofCivilEngineers’(ICE)GeneralConditionsofContractandNEC3,andeverymechanicalengineershouldhaveatleasttheknowledgeofMF/1/aspublishedbytheInstitutionofMechanicalEngineers(I.Mech.E.)andtheInstitutionofElectricalEngineers(IEE).In1993,

326 Chapter 34
theICEpublishedtheNewEngineeringContract(NEC),calledtheEngineeringandConstructionContract(ECC).ThishassincebeenupdatedandisnowknownasNEC3.TheNECfamilyofcontractsnowcoverscontractconditionsformaincontractors,subcontractors,professional services, supply and adjudicators. A table of the more important standard conditions of contract, which frequently form the basis of the subcontract conditions, is given in Fig. 34.10, but it is not imperative that any of these standard conditions be used. Many large companies, such as oil companies, chemical manufacturers or nationalized industries, have their own conditionsofcontract.Inturn,manyofthecontractors,whethercivilormechanical,havetheirownconditionsofsubcontract.Generally,thetermsandclausesofalltheseconditionsarefairlysimilar, since if they were unreasonably onerous, contractors would either not quote or would loadtheirtendersaccordingly.However,therearedifferencesinanumberofclausesaprospec-tive tenderer would be well advised to heed. Such differences are often incorporated by the purchaser in the light of actual unfortunate experiences he has no intention of repeating. One can well imagine the commercial officer writing these conditions and applying the adage that the difference between a wise man and a fool is that a wise man learns from his experience.
The alternative to using standard conditions, whether issued by established institutions or by the purchaser’s organization, is to write tailor-made general conditions for a particular project. This is usually only viable when the project is very large and when a multitude of subcontracts is envisaged. There are considerable advantages for the purchaser or main contractor in tailoring the conditions to a particular project, since in this way the same base documents can be used for everydiscipline.Inotherwords,insteadofthecivilcontractorbeinggovernedbytheICEconditions, the piping erection contractor by model form ‘A’, and the insulation contractor by theThermalInsulationContractorsAssociation(TICA)conditions,allthesubcontractorsmustworktothesamegeneralconditionswrittenespeciallyfortheproject.Toensurethatthevariousdisciplinescanworktoonesetofconditions,greatcaremustbetakenintheircompilation.Since most of the clauses must be applicable to all the subcontracts, they should be of a general nature. Clauses specific to a particular discipline or trade are collected together in what are knownas‘specialconditionsofsub-contract’.Thesearedescribedlater.
Obviously, such a comprehensive set of conditions will contain clauses that are not relevant to some of the disciplines. This problem is overcome by either incorporating a list of non- relevant clauses in the accompanying special conditions, or relying on the common sense of all parties to ignore clauses that are not usually applicable by custom and practice. For example, a clause relating to underground hazards (usually in a civil contract) would be irrelevant in an insulation contract.
The advantages of a common set of general conditions are: 1. There is no confusion at the issuing stage as to which conditions of contract must be used
for a specific subcontract. 2. The site subcontract administrator becomes conversant with the terms of the contract and
will thus find it easier to administer them.

Procurement 327
3. Thereisnoriskofcontradictionbetweencertaintermsthatmayhaveadifferentinterpre-tationindifferentstandardconditions.AtypicalexampleisClause24intheI.Mech.E.model form ‘A’ of general conditions of contract. This clause lists industrial disputes as a reasonforgrantinganextensionoftime.ThecorrespondingclauseintheICEconditions(Clause 4A) does not list this particular occurrence as a valid claim for extension of time. Clearly, it is highly desirable that such an important factor as industrial disputes has the same implications for all contractors on a particular site.
Figure 34.10Standard conditions of contract.

328 Chapter 34
Special Conditions
As mentioned earlier, one way of advising the tenderer that certain clauses in the general conditions are not applicable to his particular contract is to list all those non-applicable conditionsinaspecialconditionsofcontractthatformpartofthepackage.
Wherethegeneralconditionshavenot been tailor-made for a contract, the special conditions contain all those clauses peculiar to a particular site, especially the labour relations proce-dures.Intheory,generalconditionsofcontractapplytoanysiteintheUK(overseassitesusually require separate conditions), so that particular items such as site establishment requirements,utilityfacilities,security,sitecarparking,siteagreementnotificationsandotherspecial clauses must be drawn to the attention of the tenderer in a separate document. Because of the specific nature of these clauses, special conditions of contract usually precede the generalconditionsinthehierarchyofimportance.Inotherwords,amodificationorqualifica-tioninthespecialconditionstakesprecedenceovertheunqualifiedclauseinthegeneralconditions. Other clauses in the special conditions are terms of payment and, of course, the form of agreement.
Technical Specification
The technical portion of the subcontract document consists of six main sections: 1. Descriptionofwork 2. Specification and test requirements 3. Bills of quantities (if applicable) 4. List of drawings 5. List of reports to be submitted and details of cost codes6. Paymentsschedule(ifrelatedtoworkpackages)
Some organizations also include the planning schedule and insurance requirements in this section, but these two items are more logically part of the site requirements and will be dealt with later.
Description of Work
This section is divided into two parts: 1. Description of the site and a general statement of the objectives relating to the project as a
whole2. Descriptionofthatportionoftheworkrelatingtothesubcontractinquestion
Thus, part 1 states the purpose of the project (e.g., to produce 1000 tonnes of cement per day using the dry process, etc.). Part 2 describes (in the case of a civil subcontract) which
Procurement 329
structures are in concrete, which are steel with cladding, the extent of roads, pavings and sewers,andthesoilconditionslikelytobeencountered.
Needlesstosay,moredetailedtechnicaldescriptionswillappearonthedrawings,inthetechnical specifications and in the bills of quantities, giving, in effect, the scope of the subcontract.
Liquidated Damages (or Ascertainable Liquidated Damages)
Liquidated damages have been defined by Lord Dunedin in a court case in 1913 as ‘a genuine covenanted pre-estimate of damages’, and as such is the compensation payment by a vendor toapurchaserwhenthegoodsarenotdeliveredbythecontractdate.Incasesofsubcontracts,liquidated damages can be imposed if the contract is not completed by the agreed date.
Liquidated damages are not penalties. They are primarily designed to cover the losses suf-fered by a purchaser because the goods or services were not available to him by the agreed date. As the amount of liquidated damages was agreed by both parties in advance, the pur-chaser does not have to prove he has lost money. The fact that the goods are late is sufficient reason for claiming the damages.
Over the years, however, liquidated damages have been assessed in quite an arbitrary way that bears no relationship to the losses suffered. Usually, they are calculated as a percentage of the contractvalueandvarywiththenumberofdaysorweeksforwhichthegoodshavebeendelayed.
InmostcasestheCourtswillupholdsuchaclause,providedtheactualamountofliquidateddamagesislessthantheamountthatcouldhavebeenrealisticallyshownastheloss.Itisarguedthatbothpartiesknewatthetimeofsigningthecontractthatthelosswouldprobablybegreater,butagreedtothelowerfigure.If,ontheotherhand,theamountisgreaterthanthereal loss and the vendor could demonstrate to the Courts that the purchaser was, in fact, imposing a penalty, then the clause would not be enforceable.
Anormalfigureusedforassessingliquidateddamagesis0.5%perweekofdelaywithamaximum of 2.5%. This means that the vendor’s maximum liability becomes operative after a 5weeks’delayandislimitedto2.5%ofthecontractvalue.Ifthepurchaserdoesnotreallyneedthegoods,evenafterfiveweeks’delay,hecanstillclaimhis2.5%,whichis,infact,pure profit. On the other hand, if, because of the delay of one item of equipment, the whole plant remains inoperative, his losses could be enormous. The receipt of a miserable 2.5% of the value of one relatively small item is insignificant.
Itcanthusbeseenthattherealpurposeofliquidateddamagesistoencouragethevendortodeliverontime,sincealossof2.5%representsalargeproportionofhisprofit.Itisquitenaïve to suggest that the vendor should pay the true value of a loss that could be suffered by a purchaser, which could be many times greater than the cost of the goods in question.

330 Chapter 34
Ifnoliquidateddamagesclauseisincludedinthepurchaseorder,thepurchasermayclaimdamages at large, and may, indeed, recover the full, or a substantial proportion of the full amount of his loss, due to the goods being delayed. For this reason, many vendors actually request that a liquidated damages clause is inserted, so that their liability is limited to the agreed amount.
For large subcontracts, it is prudent to produce some form of calculation for assessing the amount of liquidated damages, since if they are challenged, they must be shown to be reason-able. There are a number of ways these can be assessed: 1. Ifthewholeplantwaspreventedfromproducingthedesiredproduct,thelossofnetprofit
perweekofproductioncanbeusedasabasis.2. Iftheworksarenonprofitearning,suchasaroadorreservoir,theadditionalweekly
interest payment on the capital cost is a realistic starting point.3. Ifthedelayeditemsholdupworkbyanothersubcontractor,thewaitingtimeforplantand
additional site overheads are considered as real losses. To these could be added the standbytimeoflabour,ifitcannotberedirectedtootherwork.
Liquidated damages may be imposed on the total contract or on sections. This means that the late delivery of layout or even final drawings could be subject to liquidated damages. The amount of these damages could easily be calculated as the man-hours of waiting time by engineers being held up for information.
After all these calculations have been produced, the total value of the damages must be comparedwiththecontractvalueofthegoods.Iftheamountishighinrelationtothecontractvalue, it must be reduced to a figure that a vendor can accept. At the end of the day, if the purchaser requires the goods, he must find a vendor who is prepared to supply them.
Insurance
Normallyapurchaser–contractorrequireshisgoodstobefullyinsuredfromthepointofmanufactureuptothestagewhentheclienthastakenoverthewholeproject.Inpractice,thisinsurance is affected in a number of stages, which vary with the terms of the main contract between the contractor and his client. The more usual methods adopted are as follows: 1. Themanufacturerinsuresthegoodsfromthetimetheyleavehisworkstothetimethey
are off-loaded on site. The insurance cover for this stage ceases when the contractor’s craneliftsthegoodsoffthetransport.Thecontractor’sall-riskinsurancepolicynowcoversthegoodsuntiltheyareactuallytakenoverbytheclient.
2. Themanufacturerinsuresthegoodsasabove–theclient’s overall site insurance policy coversthegoodsassoonastheyareliftedoffthetransport.Insuchcircumstances,thegoods will be paid for at the next payment stage and will become the property of the

Procurement 331
client, although they may, in fact, not yet be erected or installed. Depending on the terms of the conditions of purchase, the goods will have become the property of the purchaser when delivered to the site or were paid for, whichever was earlier.
For large capital projects, the second method is the more common for the following reasons: 1. Alargesitemayinvolveanumberofcontractors,allofwhomhavetoinsuretheirworks.
The cost of this insurance will, if provided by the different contractors, have to be paid eventuallybytheclientaspartofthecontractsum.Bytakingouthisowninsuranceforthetotalvalueofallthevariouscontractors’works,theclientwillbeabletonegotiatefarbettertermswithalargeinsurancecompanythanifthedifferentworkswereinsuredindividually.
2. Most contractors require payments for materials delivered or erected in accordance withagreedtermsofpayment,whichformpartofthecontract.Whenthesepaymentsaremade,thatportionofthefinishedworksbecomesthepropertyoftheclient.Itisreasonable,therefore,fortheclienttoberesponsiblefortheinsurancealso.Itcanbeseen that if the contractor’s insurance were to cover the goods from receipt on site to the date of payment, a whole series of insurance changeover dates would have to be agreed. The additional administrative problems would be both time-consuming and costly.
3. Inmanycases,thenewworkswillbeconstructedonasitecloseto,orevenintegratedin,an existing operational plant owned or run by the client. Any damage to the existing plant, due to an accident on the new plant, can be covered by the same insurance policy.
4. The project, though large in itself, may only be a part of an even bigger project, e.g., an onshore oil terminal may be part of a major development of an offshore oil field involving anumberofoilrigs.Insuchasituation,theclientwillnegotiateamassiveinsurancepolicy, perhaps with a consortium of insurers, at a really attractive rate.
Needlesstosay,thegoodswillonlybecoveredbytheclient’spolicyoncetheyhavearrivedonthejobsite.Ifthegoodshavetobestoredtemporarilyinanoff-sitewarehouse,thecontractor will have to arrange for insurance, even if the goods have been paid for in the form of advance payments.
Theexactstage,atwhichtheinsuranceriskpassesfromthesellertothebuyer,dependson the conditions of the purchaser and the shipping terms. For a more detailed explanation,seethesectiononIncoterms,whichdiscussestheshippingresponsibilitiesused internationally by all the trading nations.
Discounts
During the pre-order discussions with the prospective supplier, the buyer must try to reducethepriceasmuchaspossible.Thiscanbeachievedbyaskingthesuppliertogive

332 Chapter 34
apricereductionintheformofadiscount.These,oftenconsiderable,reductionscantakethe form of: 1. Negotiatedandhiddendiscounts2. Bulkpurchasediscounts 3. Annual order discounts 4. Prompt payment discounts 5. Discount for retention bond
Negotiated and Hidden Discounts
There comes a stage during most negotiations when all the technical points have been resolvedandallthecommercialconditionsagreed.However,thefinalpricecanstillbeunresolved since the very technical and commercial points discussed have probably affected the original bid. This is the time for the buyer to bring up the question of discounts. The arguments put forward could be: 1. The technical requirements are now to a different specification requiring less material, etc. 2. The commercial conditions are now less onerous.
Boththesechangescouldwarrantapricereduction.If,ontheotherhand,theoppositeisthecase, i.e., the specification is higher or the conditions harsher, a ‘hidden discount’ can be obtained by insisting that the price remain as tendered. To clinch the deal, the vendor may wellagreetothisatthisstage.AsalesmanwouldbeveryloathtoreturntohisHeadOfficewithout an order, having got so far in the negotiations.
Itmustberememberedthatthereisnosuchthingasafixedprofitpercentage.Mostsalesmenareallowedtonegotiatebetweenprescribedlimits,anditisthebuyer’sjobtotakeadvantageofthesemargins.Whenthebidanalysisisprepared,thediscountsobtainedshouldbeshownseparatelysothatthebidpricecanbecheckedagainsttheoriginaltenderdocuments.Thisisespecially important if the bid price is made up of a number of individual prices that have to be compared with those of competitors.
Bulk Purchase Discounts
Whenlargequantitiesofaparticularmaterialhavetobepurchased,thevendor,inordertomaketheoffermoreattractive,mayofferabulkpurchasediscountonthebasisthatsomeoftheeconomiesofscalecanbesharedwiththepurchaser.Ifsuchadiscountisnotvolunteeredby the vendor, it can still be suggested by the buyer.
Annual Order Discounts
A vendor may offer (or be persuaded to offer) a discount if the purchaser buys goods whose total value over a year exceeds a predetermined amount. This will encourage a purchaser to

Procurement 333
order all similar items of equipment, say electric motors, from the same vendor. The items may be of different size or specification, but will still be obtained from the same supplier. At theendoftheyear,apercentageofthetotalvalueofallordersispaidbacktothepurchaseras a discount.
Prompt Payment Discount
Although the conditions of sale may stipulate payment within 30 days of the date of the invoice (assuming the item has been received by the purchaser in good condition), many companies tend not to pay their bills unless the vendor has issued repeated requests or even threatened legal action. To encourage the prompt payment of invoices, an additional discount is frequently offered. The value of this is usually only a few percent and reflects the financing charges the vendor may have to pay due to late receipt of cash.
Discount for Retention Bond
Most contracts or subcontracts contain a retention clause, which requires a percentage of the contractvaluetoberetainedbythepurchaserforaperiodof6–12months.Toimprovethevendor’s cash flow, a retention bond can often be accepted by the purchaser, which guarantees the retention value, but this will deprive the purchaser of the use of these monies during the retention period. To compensate the purchaser for this, a vendor may offer a discount, which in effect is a proportion of the interest charges the vendor would have to pay for borrowing theretentionsumfromabank.Ausualprocedureistosplittheinterestcharges50:50betweenthepurchaserandthevendor.Inthisway,bothpartiesgainbythetransaction.
Itcanbeseenthatdiscountscanfrequentlybeobtainedfromasupplier,especiallyifitisabuyer’smarket.Inmostreimbursablecostcontracts,alldiscountsexceptpromptpaymentdiscounts must be passed on to the client for whom the goods or services have been pur-chased. For this reason, all negotiations including the discounts offered must be open and properly documented so that they can stand up to any subsequent audit.
Counter-Trade
Despite the name, this is not meant to refer to trade carried out over a shop counter, although thisuseofthetermiscommonlyappliedtogoodscollectedfromawholesaler’spremises.Inthe case of international business, the term refers to the payment for goods or services by somethingotherthanmoney.Inotherwords,itisakintogoodold-fashionedbarter.
The difference between barter and counter-trade is that in barter, one type of goods or ser-vices are exchanged for another without money being involved, while in counter-trade, the goods supplied by the buyer are delivered to a third party who sells them (usually at a profit) for the benefit of the seller who then receives cash.

334 Chapter 34
Asimpleexampleillustrateshowthesystemworks:apotentialclientinadevelopingcountrymayneedtoextendhisproductionfacilities.Hisbusinessmaybeexpandingandhighly profitable, but because of government restrictions the company has no access to hardcurrency.Itisinthecountry’snationalinteresttoencourageindustrialgrowthathome, but not to increase its national debt by borrowing dollars or pounds. A new approachisneededandonesolutionistoresorttocounter-trade.If,forexample,thecountry is rich in some natural resources, such as coal, this may be the most convenient commodity to trade-off against the proposed factory extension. The expanding company will buy the coal from the mine in local currency. The UK supplier will provide the production facility expansion and receive an appropriate quantity of coal as payment.
Incoterms
Worldtradeinevitablyrequiresgoodstobeshippedfromonecountrytoanother.Rawmaterials must be transported from the less developed countries to the developed ones, from which finished goods are sent in the opposite direction. Both movements have to be packed,insured,transported,clearedthroughcustomsandunloadedattheirpointofdestination, and in order to standardize the different conditions required by the trading partners,Incoterms(Fig. 34.11) were developed. These trade terms cover 14 main varia-tionsandencompassthespectrumofcostandriskofshipmentsfrom‘exworks’wherethebuyerhasalltheriskandpaysallthecosts,to‘delivereddutypaid’wherethesellercontracts to cover delivery costs and insurance.
Ex Works
‘Exworks’meansthattheseller’sonlyresponsibilityistomakethegoodsavailableathispremises(i.e.,worksorfactory).Inparticular,sellerisnotresponsibleforloadingthegoodsin the vehicle provided by the buyer, unless otherwise agreed. The buyer bears the full cost andriskinvolvedinbringingthegoodsfromtheretothedesireddestination.Thistermthusrepresents the minimum obligation for the seller.
Free Carrier (Named Point)
This term has been designed to meet the requirements of modern transport, particularly such ‘multi-modal’transportascontaineror‘roll-onroll-off’trafficbytrailersandferries.Itisbasedonthe same main principle as FOB, except that the seller fulfils his obligations when he delivers the goodsintothecustodyofthecarrieratthenamedpoint.Ifnoprecisepointcanbementionedatthe time of the contract of sale, the parties should refer to the place or range where the carrier shouldtakethegoodsintohischarge.Theriskoflossofordamagetothegoodsistransferredfrom seller to buyer at the time and not at the ship’s rail. ‘Carrier’ means any person by whom or

Procurement 335
Figure 34.11Incoterms.
336 Chapter 34
in whose name a contract of carriage by road, rail, air, sea or a combination of modes, has been made.Whenthesellerhastofurnishabilloflading,waybillorcarrier’sreceipt,heorshedulyfulfils this obligation by presenting such a document issued by a person so defined.
FOR/FOT
FORandFOTmean‘freeonrail’and‘freeontruck’.Thesetermsaresynonymoussincetheword‘truck’relatestotherailwaywagons.Theyshouldonlybeusedwhenthegoodsaretobe carried by rail.
FOB Airport
FOB airport is based on the same main principle as the ordinary FOB term. The seller fulfils hisobligationsbydeliveringthegoodstotheaircarrierattheairportofdeparture.Theriskofloss of or damage to the goods is transferred from the seller to the buyer when the goods have been so delivered.
FAS
FAS means ‘free alongside ship’. Under this term the seller’s obligations are fulfilled when the goods have been placed alongside the ship on the quay or in lighters. This means that the buyerhastobearallcostsandrisksoflossofordamagetothegoodsfromthatmoment.Itshouldbenotedthat,unlikeFOB,thistermrequiresthebuyertoclearthegoodsforexport.
FOB
FOB means ‘free on board’. The goods are placed on board a ship by the seller at a port of shipmentnamedinthesalescontract.Theriskoflossofordamagetothegoodsistransferredfrom the seller to the buyer when the goods pass the ship’s rail.
C&F
C&F means ‘cost and freight’. The seller must pay the cost and freight necessary to bring the goodstothenameddestination,buttheriskoflossofordamagetothegoods,aswellasofany cost increases, is transferred from the seller to the buyer when the goods pass the ship’s rail in the port of shipment.
CIF
CIFmeans‘cost,insuranceandfreight’.ThistermisbasicallythesameasC&Fbutwiththeadditionthatthesellerhastoprocuremarineinsuranceagainsttheriskoflossofordamage

Procurement 337
to the goods during carriage. The seller contracts with the insurer and pays the insurance premium.
Freight Carriage – Paid to …
LikeC&F,‘freightorcarriage–paidto…’ means that the seller pays the freight for the carriageofthegoodstothenameddestination.However,theriskoflossofordamagetothegoods, as well as of any cost increases, is transferred from the seller to the buyer when the goodshavebeendeliveredintothecustodyofthefirstcarrierandnotattheship’srail.Itcanbe used for all modes of transport including multi-modal operations and container, or roll-on orroll-offtrafficbytrailersandferries.Whenthesellerhastofurnishabilloflading,waybillor carrier’s receipt, he or she duly fulfils this obligation by presenting such a document issued by the person with whom the contracted for carriage to the named destination was signed.
Freight Carriage – and Insurance Paid to …
This term is the same as ‘freight or carriage paid to …’ but with the addition that the seller hastoprocuretransportinsuranceagainsttheriskoflossofordamagetothegoodsduringthe carriage. The seller contracts with the insurer and pays the insurance premium.
Ex Ship
‘Exship’meansthatthesellershallmakethegoodsavailabletothebuyeronboardtheshipatthedestinationnamedinthesalescontract.Thesellerhastobearthefullcostandriskinvolved in bringing the goods there.
Ex Quay
‘Exquay’meansthatthesellermakesthegoodsavailabletothebuyeronthequay(wharf)atthedestinationnamedinthesalescontract.Thesellerhastobearthefullcostandriskinvolved in bringing the goods there.
There are two ‘ex quay’ contracts in use, namely ‘ex quay (duty paid)’ and ‘ex quay (duties on buyer’s account)’ in which the liability to clear the goods for import are to be met by the buyer instead of by the seller.
Parties are recommended to use the full description of these terms always, namely ‘ex quay (duty paid)’ and ‘ex quay (duties on buyer’s account)’, or uncertainty may arise as to who is to be responsible for the liability to clear the goods for import.
Delivered at Frontier
‘Delivered at frontier’ means that the seller’s obligations are fulfilled when the goods have arrivedatthefrontier–butbefore‘thecustomsborder’ofthecountrynamedinthesales
338 Chapter 34
contract. The term is primarily intended to be used when goods are to be carried by rail or road, but it may be used irrespective of the mode of transport.
Delivered Duty Paid
Whiletheterm‘exworks’signifiestheseller’sminimumobligation,theterm‘delivereddutypaid’,whenfollowedbywordsnamingthebuyer’spremises,denotestheotherextreme–theseller’s maximum obligation. The term ‘delivered duty paid’ may be used irrespective of the mode of transport.
Ifthepartieswishthesellertoclearthegoodsforimportbutthatsomeofthecostspayableupontheimportofthegoodsshouldbeexcluded–suchasVATand/orothersimilartaxes–thisshouldbemadeclearbyaddingwordstothiseffect(e.g.,‘exclusiveofVATand/ortaxes’).
Further Reading
Boundy, C. (2010). Business contracts handbook.Gower.Broome, J. C. (2002). Procurement routes for partnering: a practical guide. Thomas Telford.El-Reedy, M. A. (2011). Construction management for industrial projects.Wiley.Fisher, R., & Shapiro, D. (2007). Building agreements.RandomHouse.Grimsey,D.,&Lewis,M.K.(2007).Public private partnerships. Edward Elgar.Lewis,H.(2005).Bids, tenders and proposals. Kogan Page.Thacker,N.(2012).Winning your bid.Gower.Turner,R.,&Wright,D.(2011).The commercial management of projects. Ashgate.Ward,G.(2008).The project manager’s guide to purchasing.Gower.Yescombe, E. (2002). Public–private partnerships. Academic Press.

339Project Management, Planning and Control. http://dx.doi.org/10.1016/B978-0-08-102020-3.00035-8Copyright © 2017 Elsevier Ltd. All rights reserved.
CHAPTER 35
Value Management
Chapter OutlineFurther Reading 341
In a constantly changing environment, methods and procedures must be constantly chal-lenged and updated to meet the needs and aspirations of one or more of the stakeholders of a project. This need for constant improvement was succinctly expressed for the first time by Henry Ford when he said he could not afford to be without the latest improvement of a machine.
Value management and its subset, value engineering, aim to maximize the performance of an organization from the board room to the shop floor. Value management is mainly concerned with the strategic question of ‘what’ should or could be done to improve performance, while value engineering concentrates more on the tactical issues of ‘how’ these changes should be done.
Value can be defined as a ratio of function/cost, so in its simplest terms, the aim is to increase the functionality or usefulness of a product while reducing its overall cost. It is the constant search for reducing costs across all the discipline and management structures of an organiza-tion without sacrificing quality or performance that makes value management and value engineering such an essential and rewarding requirement.
The first hurdle to overcome in encouraging a value-management culture is inertia. The inherent conservatism of ‘if it ain’t broke, don’t fix it’ must be replaced with ‘how can a good thing be made better?’. New materials, better techniques, faster machines, more sophisticated programs and more effective methods are constantly being developed, and in a competitive global economy, it is the organization that can harness these developments and adapt them to its own products or services that will survive.
The search and questioning must therefore start at the top. Once the strategy has been estab-lished, the process can be delegated. The implementation, which could cover every depart-ment and may include prototyping, modelling and testing, must then be monitored and checked to ensure that the exercise has indeed increased the function/cost ratio. This process is called value analysis.

340 Chapter 35
The objectives should be one or more of the following: eliminating waste, saving fuel, reducing harmful emissions, reducing costs, speeding production, improving deliveries, improving performance, improving design, streamlining procedures, cutting overheads, increasing functionality and increasing marketability. All this requires is to ‘think value’ and challenge past practices, even if they were successful.
In an endeavour to discover what areas of the business should be subjected to value analysis, brainstorming sessions or regular review meetings can be organized, but while such meetings are fundamentally unstructured, they require a good facilitator to prevent them from straying too far off the intended route.
Value analysis can be carried out at any stage of the project as can be seen from the simplified life-cycle diagram of Fig. 35.1. For the first two phases, it is still at the ‘What’ stage and can be called value planning, while during the implementation phase it is now at the ‘How’ stage and is known as value engineering. The diagram has been drawn to show value management during the project phases, i.e., before handover. However, value management can be equally useful when carried out during the operation and demolition phases in order to reduce the cost or manufacturing time of a product, or simplify the dismantling operations, especially when, as with nuclear power stations, the decommissioning phase can be a huge project in its own right.
In addition to brainstorming, a number of techniques have been developed to systemize or structure the value-engineering process of which one of the best known ones is function analysis system technique (FAST). This technique has following defined stages: 1. Collect and collate all the information available about the product to be studied from all
the relevant departments, clients, customers and suppliers. 2. Carry out a functional analysis using the ‘Verb and Noun’ technique.
Value Planning
Generic
Value Planning
Briefing
Inception FeasibilityOutline
ProposalsSchemeDesign
DetailDesign
ProductionInformation
Bills ofQuantitles
TenderAction
Construction Evaluation
Sketch Plans Working Drawings Construction Operation
Value Engineering Value Analysis
RIBA
ConceptFeasibility& or PD.
Implementation could includeDesign, Development,
(Procurement) & ProductionOperation Shut-down
Value Engineering
VA VA VA
VA
Figure 35.1Value management and the project life cycle.

Value Management 341
This breaks down the product into its components and the function (verb) of each component is defined. The appropriate noun can then be added to enable a cost value to be ascertained. This is explained in the following example.It has been decided to analyse a prefabricated double glazed widow unit. The functions in terms of verbs and nouns are:
Each function and component can now be given a cost value and its percentage of the total cost calculated.
3. Find alternative solutions. For example, it may be possible to reduce the thickness of the glass but still maintain the heat-loss characteristics by increasing the air gap between the panes. It may also be cheaper to incorporate the lock in the handles instead as a separate fitting.
4. Evaluation. The suggested changes are now costed and analyzed for a possible saving and the function/cost ratio compared with the original design.
5. Acceptance. The proposed changes must now be approved by management in terms of additional capital expenditure, marketability, sales potential, customer response, etc.
6. Implementation. This is the production and distribution stage. 7. Audit. This is carried out after the product has been on the market for a predetermined
time and will confirm (or otherwise) that the exercise has indeed given the perceived additional value or function/cost ratio. If the results were negative, the process may have to be repeated.
Value management is not only meeting the established success criteria or key performance indexs but improving them by periodic reviews. Having previously carried out a stakeholder analysis and identifying their needs, it should be possible to meet these requirements even if the costs have been reduced. Indeed customer satisfaction may well be improved and environ-mental damage reduced, resulting in a win–win situation for all the parties.
Further Reading
Davies, R. H., & Davies, A. J. (2011). Value management. Gower.European Committee for Standardisation. (2012). CEN. FprEN 1627:2012 (E)Value Management.Schwartz, M. (2016). The art of business value. Portland, Oregon: IT Revolution.
Verbs Nouns
Transmit Light, glassEliminate Draughts, sealsMaintain Heat, double glazingFacilitate Cleaning access, reversibility
Secure Handles, locking catches

This page intentionally left blank

343Project Management, Planning and Control. http://dx.doi.org/10.1016/B978-0-08-102020-3.00036-XCopyright © 2017 Elsevier Ltd. All rights reserved.
CHAPTER 36
Health, Safety and Environment
In the light of some spectacular company collapses following serious lapses and shortcomings in safety, health and safety is now on the very top of the project-management agenda. Apart from the pain and suffering caused to employees and the public by accidents attributable to lax maintenance of safety standards, the inability to provide high standards of safety and a healthy environment is just bad business. Good reputations built up over years can be destroyed in a day due to one serious accident caused by negligence or lack of attention to safety standards. In addition, under the Corporate Manslaughter Act 2007, directors of companies can now be held responsible for fatalities caused by contraventions of H&S regulations.
It is for this reason that the British Standards Institution’s ‘Guide to project management in the construction industry’ BS 6079 Part 4: 2006 has placed the ‘S’ for safety in the centre of the project-management triangle, indicating that a project manager can juggle the priorities between cost, time and performance, but he must never compromise safety.
Health and Safety was given a legal standing with the British Health and Safety at Work Act 1974. This creates a legal framework for employers to ensure that a working environment is maintained in which accidents and unhealthy and hazardous practices are kept to a minimum.
Subsequent legislation included: • ManagementofHealthandSafetyRegulations1992• ControlofAsbestosatWorkRegulations1987• NoiseatWork1989• Workplace(H,S&Welfare)Regulation1992• PersonalProtectiveEquipmentRegulation1992• ManualHandlingOperationsRegulations1992• FatalAccidentsAct1976• CorporateManslaughterAct2007
Chapter OutlineConstruction, Design and Management Regulations 349Health and Safety Plan 350
Pre-Tender Health and Safety Plan 350Construction Phase Health and Safety Plan 351
Health and Safety File 351Warning Signs 351

344 Chapter 36
• AswellasaraftofEuropeanCommunitydirectivessuchasECDirective90/270/EEC.TheActsetupaHealthandSafetyExecutivethathaswidepowerstoallowitsinspectorsto enter premises and issue improvement or prohibition notices as well as instigating prosecutions where an unsafe environment has been identified. The Act also gives legal responsibilities to employers, employees, self-employed persons, designers, manufacturers, suppliers and persons generally in control of premises where work is performed.
Eachofthesegroupshasbeenidentifiedastotheirresponsibilitiesforhealth,safetyandwelfare, which broadly are as follows.
Employer • Provideandmaintainsafeequipment• Providesafeandhealthysystems• Provideasafeandhealthyworkplace• Ensuresafehandlingandstorageofchemicalsandtoxicsubstances• Drawupahealthandsafetypolicystatement• Provideinformation,training,instruction,andsupervisionrelatingtosafetyissues
Employee • Cooperatewithemployer• Takecareofone’sownhealthandsafety• Lookafterthehealthandsafetyofothers• Donotmisusesafetyequipment• Donotinterferewithsafetydevices
Self-employed • Mustnotputotherpeopleatriskbytheirmethodofworking
Designers, manufacturers, suppliers and installers • Mustusesafesubstances• Mustensuredesignsaresafe• Mustensuretestingandconstructionoperationsaresafe• Mustprovideinformation,instructionsandproceduresforsafeoperationanduse
People in control of premises • Ensurethepremisesaresafeandhealthy
To ensure that the requirements of the Health and Safety at Work Regulations are met, employers are required to manage the introduction and operation of safety measures by following the procedures: • Settingupplanning,controlandmonitoringprocedures• Trainingandappointingcompetentpersons

Health, Safety and Environment 345
• Establishingemergencyprocedures• Carryingoutregularriskassessments• Auditingandreviewingprocedures• Disseminatinghealthandsafetyinformation
The Act is given teeth by the formation of an enforcement authority called the Health and Safety Executive(HSE),whichappointsinspectorswithwidepowerstoconductinvestigations,enter premises and sites, take photographs and samples, issue, where necessary, improvement or prohibition notices and even initiate prosecution.
However,awell-runorganizationwillmakesurethatvisitsfromtheHSEarenotrequired.The watchword should always be: prevention is better than cure. Accidents do not just happen. They are caused by poor maintenance, inappropriate equipment, unsafe practices, negligence, carelessness, ignorance and any number of human frailties.
Because accidents are caused, they can be prevented, but this requires a conscious effort to identify and assess the risks that can occur, and then make sure that any possibility of accident or hazard is avoided. Such risk assessment is a legal requirement and does assist in increasing the awareness of health and safety, and reducing the high costs of accidents.
The most common forms of accidents in commercial, manufacturing and construction or even domestic premises are caused by the following factors: • Equipmentfailure• Fire• Electricity• Hazardoussubstances• Unhealthyconditions• Poordesign• Unsafeoperatingpractices• Noiseandlighting
Eachoftheabovefactorscanbeexaminedtofindwhathazardsorshortcomingscouldcausean accident.
Equipment failure • Poormaintenance• Sharpedgestocomponents• Pointsofentrapmentorentanglement• Ejectionoffinishedproducts• Hightemperaturesofexposedsurfaces• Ill-fittingorinsecureguards• Nosafetyfeatures(overloadorpressurereliefdevices)• Badlysitedemergencystopbuttons

346 Chapter 36
• Lackofoperatingmanualsorprocedures• Lackofoperatortraining• Tirednessofoperator
Fire • Overheatedequipment• Sparksfromelectricalequipment• Nakedflames• Hotsurfaces• Hotliquids• Combustibleliquids• Combustiblerubbish• Explosivegases• Smoking• Blockedvents• Deliberatesabotage(arson)• Lackoffireextinguishers
Electricity • Poorinsulation• Badearthing• Overratedfuses• Lackofoverloadprotectors• Underratedcablesorswitches• Unprotectedcircuits• Noautomaticcircuitbreakers• Nowarningsigns• Trailingcables• Unqualifiedoperatorsorinstallers• Poormaintenance• Lackoftestingfacilities• Dirtyequipment
Hazardous substances • Badlysealedcontainers• Corrodedcontainers• Poorstorage• Unlockableenclosures• Lackofsign-outprocedures• Poorventilation
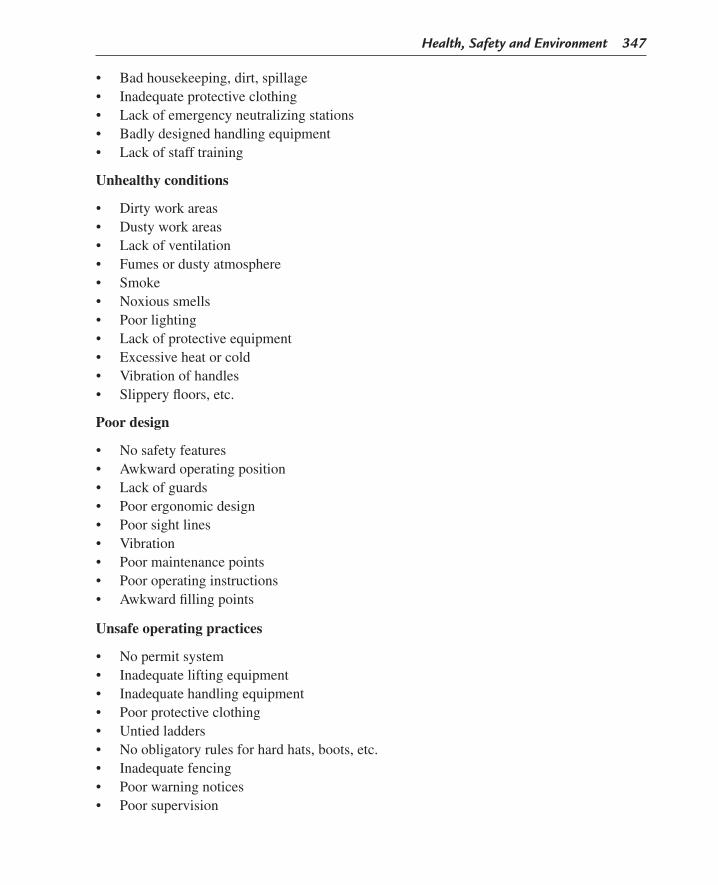
Health, Safety and Environment 347
• Badhousekeeping,dirt,spillage• Inadequateprotectiveclothing• Lackofemergencyneutralizingstations• Badlydesignedhandlingequipment• Lackofstafftraining
Unhealthy conditions • Dirtyworkareas• Dustyworkareas• Lackofventilation• Fumesordustyatmosphere• Smoke• Noxioussmells• Poorlighting• Lackofprotectiveequipment• Excessiveheatorcold• Vibrationofhandles• Slipperyfloors,etc.
Poor design • Nosafetyfeatures• Awkwardoperatingposition• Lackofguards• Poorergonomicdesign• Poorsightlines• Vibration• Poormaintenancepoints• Pooroperatinginstructions• Awkwardfillingpoints
Unsafe operating practices • Nopermitsystem• Inadequateliftingequipment• Inadequatehandlingequipment• Poorprotectiveclothing• Untiedladders• Noobligatoryrulesforhardhats,boots,etc.• Inadequatefencing• Poorwarningnotices• Poorsupervision

348 Chapter 36
• Poorreportingprocedures• Nohazardwarninglights,etc.• Blockedorinadequateemergencyexits• Noemergencyprocedures• Nosafetyofficer• Poorevacuationnotices• Longworkinghours
Noise and lighting • Excessivenoise• High-pitchednoise• Vibrationandreverberation• Inadequatenoiseenclosures• Inadequatesilencers• Noearprotectors• Poorlydesignedbaffles• Poorlighting• Glare• Intermittentlightflashes• Poorvisibility• Hazeormist
All the above hazards can be identified and either eliminated or mitigated. Clearly, such a risk assessment must be carried out at regular intervals, say every 6 months, as conditions change, and new practices may be incorporated as the project develops.
Apart from the direct effect of accidents and health-related illness on the individual who may suffer great physical and mental pain, the consequences are far reaching. The following list gives some indication of the implications: • Costofmedicalcare• Costofrepairorreplacement• Absenceofinjuredparty• Costoffinesandpenalties• Costofcompensationclaims• Lossofcustomerconfidence• Lossofpublicimage• Lossofmarketduetodisruptionofsupply• Lossofproduction• Damagesfordelays• Lossofmorale• Higherinsurancepremiums

Health, Safety and Environment 349
• Legalcosts• Possiblelossofliberty(imprisonment)• Closurecosts
Construction, Design and Management Regulations
A special set of regulations came into force in 1994 to cover work in the construction indus-try, which has a poor safety record. These regulations are called the Construction (Design and Management) Regulation 1994(CDM).Theseareconcernedwiththemanagementofhealthand safety, and apply to construction projects including not only the client and contractors but also the designers, associated professional advisers and, of course, the site workers. The duties of the five main parties covered by these regulations are the following: 1. Client a. Ensureadequateresourcesareavailabletosothattheprojectcanbecarriedout
safely. b. Appoint only competent designers, contractors and planning supervisors. c. Provide planning supervisor with relevant health and safety information. d. Ensurehealthandsafetyplanhasbeenpreparedbeforestartofconstruction. e. Ensurehealthandsafetyfileisavailableforinspectionattheendofproject. These duties do not apply to domestic work where the client is the householder. 2. Designer a. Designstructuresthataresafeandincorporatesafeconstructionmethods. b. Minimize the risk to health and safety while structures are being built and
maintained. c. Provide adequate information on possible risks. d. Safe designs to be inherent in drawings, specifications and other documents. e. Reducerisksatsource,andavoidriskstohealthandsafetywherepracticable. f. Cooperate with planning supervisor and other designers. 3. Planning supervisor a. Coordinate the health and safety aspects of the design and planning phases. b. Help draw up the health and safety plan. c. Keep the health and safety file. d. Ensuredesignerscooperatewitheachotherandcomplywithhealthandsafetyneeds. e. NotifytheprojecttotheHSE. f. Give advice on health and safety to clients, designers and contractors. 4. Main contractor a. Take into account health and safety issues during tender preparation. b. Developandimplementsitehealthandsafetyplan. c. Coordinate activities of subcontractors to comply with health and safety legislation. d. Provide information and training for health and safety.
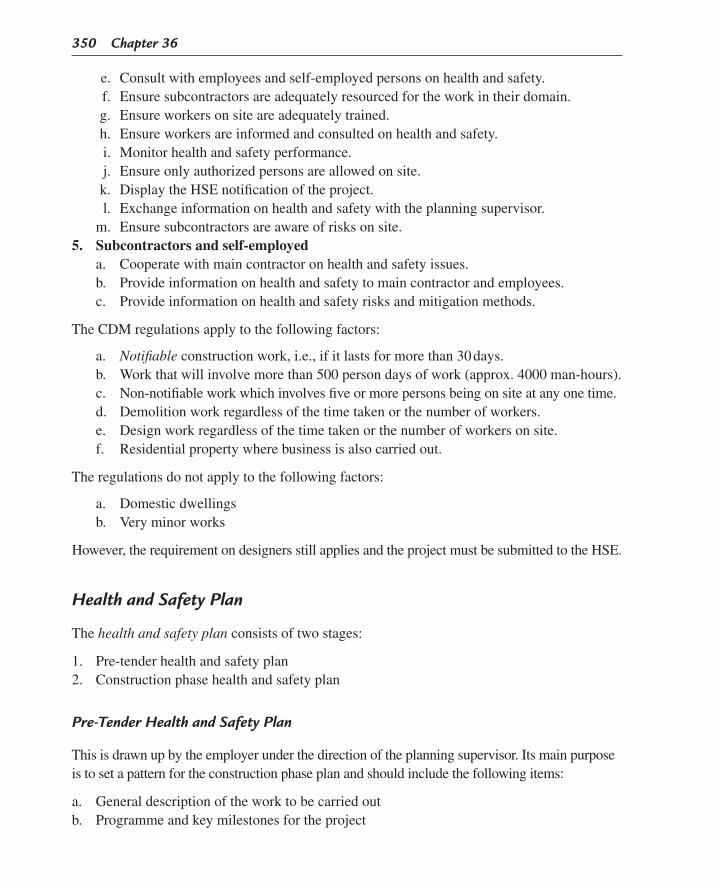
350 Chapter 36
e. Consult with employees and self-employed persons on health and safety. f. Ensuresubcontractorsareadequatelyresourcedfortheworkintheirdomain. g. Ensureworkersonsiteareadequatelytrained. h. Ensureworkersareinformedandconsultedonhealthandsafety. i. Monitor health and safety performance. j. Ensureonlyauthorizedpersonsareallowedonsite. k. DisplaytheHSEnotificationoftheproject. l. Exchangeinformationonhealthandsafetywiththeplanningsupervisor. m. Ensuresubcontractorsareawareofrisksonsite. 5. Subcontractors and self-employed a. Cooperate with main contractor on health and safety issues. b. Provide information on health and safety to main contractor and employees. c. Provide information on health and safety risks and mitigation methods.
TheCDMregulationsapplytothefollowingfactors:
a. Notifiable construction work, i.e., if it lasts for more than 30 days. b. Workthatwillinvolvemorethan500persondaysofwork(approx.4000man-hours). c. Non-notifiableworkwhichinvolvesfiveormorepersonsbeingonsiteatanyonetime. d. Demolitionworkregardlessofthetimetakenorthenumberofworkers. e. Designworkregardlessofthetimetakenorthenumberofworkersonsite. f. Residentialpropertywherebusinessisalsocarriedout.
The regulations do not apply to the following factors:
a. Domesticdwellings b. Veryminorworks
However,therequirementondesignersstillappliesandtheprojectmustbesubmittedtotheHSE.
Health and Safety Plan
The health and safety plan consists of two stages: 1. Pre-tender health and safety plan 2. Construction phase health and safety plan
Pre-Tender Health and Safety Plan
This is drawn up by the employer under the direction of the planning supervisor. Its main purpose is to set a pattern for the construction phase plan and should include the following items: a. General description of the work to be carried outb. Programme and key milestones for the project

Health, Safety and Environment 351
c. Table of risks envisaged at this stage and their effects on workers and staffd. Information to be submitted by the contractor to demonstrate his capabilities regarding
resources and managemente. Information to be submitted by the contractor regarding the preparation of the health and
safety plan for the construction phase and welfare arrangements
Construction Phase Health and Safety Plan
This plan is prepared by the main contractor and has to be submitted to the planning supervi-sor for approval before work can start on site. Its main constituents are as follows: a. Health and safety arrangements for all persons on site or who may be affected by the
construction workb. Managing and monitoring the health and safety of construction workc. Detailedarrangementsofthesitewelfarefacilitiesd. Evidenceofarrangementsforkeepingthehealthandsafetyfile
Health and Safety File
The health and safety file is a record of events on site relating to health and safety, and in particu-lar, the risks encountered and their mitigations as well as possible risks still to be anticipated. The file must be handed to the client at the end of the contract to enable him to manage and deal with possible risks during the carrying out of subsequent renovations or repairs.
The planning supervisor is responsible for ensuring that the file is compiled properly as the project proceeds and that it is handed to the client at the end of the project.
The client must make the file available to all persons involved in future designs of similar structures or those concerned with alterations, additions, maintenance or demolition of the structure.
Warning Signs
Standard warning signs have been developed to draw attention to prohibit certain actions, take certain safety precautions or warn of particular environmental hazards.
These signs are colour- and shape-coded to indicate quickly what the type of warning is. The following samples of signs, taken from BS 5499-10-2006, are the most common ones in use, but the selection is not exhaustive: • Hazardsignshaveayellowbackgroundinatriangle(Fig.36.1).• Prohibitionsignsarearedcirclewithareddiagonal(Fig.36.2).• Mandatorysignshaveabluebackground,usuallyinarounddisc(Fig.36.3).• Safeconditionsignshavegreenbackgroundinasquare(Fig.36.4).

Figure 36.1Hazard signs [yellow background (Grey in print versions)].
Figure 36.2Prohibition signs [red circles (Light grey in print versions)].

Figure 36.3Mandatory signs [blue background (Light grey in print versions)].
Figure 36.4Safe condition signs [green background (Light grey in print versions)].

This page intentionally left blank

355Project Management, Planning and Control. http://dx.doi.org/10.1016/B978-0-08-102020-3.00037-1Copyright © 2017 Elsevier Ltd. All rights reserved.
CHAPTER 37
Information Management
Chapter OutlineObjectives and Purpose 356
Types of Documents 356Authority 356Distribution of Information 357Storing Information and Virus Protection 357Retrieving Information and Acquisition/Modification Permits 357Acknowledging Receipt of Information 357Security Arrangements 358Disaster Recovery Systems 358Configuration Control 358Distribution Schedule 358Standards to Be Followed 359Legal Requirements 359Foreseeable Risks 359
Data Collection 360Qualitative 360Quantitative 361
Big Data 361Further Reading 361
Information, together with communication, is the very lifeblood of project management. From the very beginning of a project, information is required to enable someone to prepare a cost and time estimate, and it is the accuracy and ease of acquisition of this information that determines the quality of the estimate.
The success of a project depends greatly on the smooth and timely acquisition, preparation, exchange, dissemination, storage and retrieval of information, and to enable all these func-tions to be carried out efficiently, an information system enshrined in an information policy plan is an essential ingredient of the project management plan.
As with many procedures, a policy document issued by management is the starting point of an information system. If issued at a corporate level, such an information policy document ensures not only that certain defined procedures are followed for a particular project, but that every project carried out by the organization follows the same procedures and uses the same systems.

356 Chapter 37
The following list indicates the most important topics to be set out in an information policy plan: 1. Objectives and purpose for having an information management plan 2. Types of documents to be covered by the plan 3. Authority for producing certain documents 4. Methods of distribution of information 5. Methods for storing information and virus protection 6. Methods for retrieving information and acquisition/modification permits 7. Methods for acknowledging receipt of information 8. Security arrangements for information, especially classified documents 9. Disaster recovery systems 10. Configuration control for different types of information 11. Distribution schedule for different documents 12. Standards to be followed 13. Legal requirements regarding time period for information retention 14. Foreseeable risks associated with information
This information management plan sets out the basic principles, but the actual details of some of the topics must then be tailored to a particular project. For example, the document distribution schedule, which sets out which document is produced by whom and who receives it, must clearly be project-specific. Similarly, the method of distribution depends on the availability of an IT system compatible with the types of information to be dissemi-nated and the types and styles of documents produced.
Objectives and Purpose
The purpose of explaining the objectives of the policy document is to convince the readers that it is not bureaucratic red tape, but an essential aid to a smooth-running project. There is no doubt that there are numerous projects being run that do not have such a document, but in these cases the procedures are either part of another document or are well known and understood by all parties due to company custom and practice.
Types of Documents
The types of documents covered include correspondence with clients and suppliers, specifications, data sheets, drawings, technical and financial reports, minutes of meetings, records of telephone conversations and other selected data. All these data will be subject to configuration management to ensure correct distribution and storage.
Authority
Certain types of documents can only be issued by specified personnel. This covers mainly financial and commercial documents such as purchase orders, invoices and cheques.

Information Management 357
Distribution of Information
Distribution of information can be done electronically or by hard copy. While in most cases, the sender has the option of which one to use, certain documents may only be sent by a specified method. For example, in some organizations legal documents may be e-mailed or faxed but must also be followed up with hard copies by mail. Generally nowadays, most data are available electronically and can be accessed by selected stakeholders using appropriate access codes or passwords.
Storing Information and Virus Protection
Most data can be stored electronically either by the sender or the receiver, but where special measures have to be taken, suitable instructions must be given. Data must be protected against viruses and hackers, and must be arranged and filed in a structured manner according to a predetermined hierarchy based on departmental or operational structures such as work breakdown structures or work areas. In some cases, hard copies of documents and drawings will have to be filed physically where electronic means are not available, as, for example, on remote construction sites. Important documents such as building leases, official purchase orders and contracts require storage space that must be both easily accessible and safe from natural disasters and theft. Special fire and waterproof storage facilities may have to be installed.
Retrieving Information and Acquisition/Modification Permits
Retrieving data electronically will generally not be a problem provided a good configura-tion-management system and effective indexing and identification methods are in place. In many cases, only certain personnel will be able to access the file and of these only a proportion will have the authority to make changes. Appropriate software will have to be installed to convert data from external sources, in the form of e-mails, faxes, spread sheets or other computerized data transmission processes, into a format compatible with the database in use. When handling hard copies, the method of filing documents in a central filing system must be firmly established and an order of search agreed upon. For example, the filing could be by suppliers’ names (alphabetically), by product type, by order number, by requisition number or by date. Again, some organizations have a corporate system, while others file by project. Whatever system is used, an enormous amount of time will be wasted searching for documents if the filing system is badly designed and, equally importantly, not kept up to date regularly.
Acknowledging Receipt of Information
In many cases, it may be necessary to ensure that the information sent is received and read. The policy of acknowledging certain documents must therefore be set down. A recipient may

358 Chapter 37
glance at a letter or scan an e-mail without appreciating its importance. To ensure that the receiver has understood the message, a request must be made to reply either electronically or, in the case of a hard copy, by asking for the return of an attached ‘confirmation of receipt’ slip. This is particularly important when documents such as drawings go to a number of different recipients. Only by counting the return slips can the sender be sure that all the documents are received.
Security Arrangements
Classified or commercially sensitive documents usually have a restricted circulation. Special measures must therefore be put in place to ensure the documents do not fall into the wrong hands. In some government departments, all desks must be cleared every evening and all documents locked away. Electronic data in this category requires special passwords that may have to be changed periodically. Documents no longer required must be shredded and where necessary incinerated. It is known that some private investigators have retrieved the wastepa-per bags from the outside of offices and reassembled the paper shreds.
Disaster Recovery Systems
In light of both major natural disasters, such as earthquakes and hurricanes, and terrorist attacks, disaster recovery, also known as business continuity, is now a real necessity. Arrangements must be made to download important data regularly (usually daily) on disk, tape or even film and store them in a location far enough removed from the office to ensure that they can be retrieved if the base data has been destroyed. It will also be necessary to make arrangements for the replacement of any hardware and software systems that may have been destroyed or corrupted.
Configuration Control
Configuration management is an integral part of information management. Version control, change control and distribution control are vital to ensure that everybody works to the latest issue and is aware of the latest decisions, instructions or actions. The subject is discussed in more detail in the chapter on configuration management, but the information policy plan must draw attention to the configuration-management procedures and systems being employed.
Distribution Schedule
The distribution of documents can be controlled either by a central computerized data distribution system activated by the originator of the document or by a special department charged with operating the agreed configuration-management system. One of the key

Information Management 359
sections of the project-management plan is the document distribution schedule, which sets out who originates a document and who receives it in tabular form. If hard copies have to be sent, especially in the case of drawings, the number of copies for each recipient must also be stated. If this schedule is lodged with the project office or the distribution clerk, the right persons will receive the right number of copies of latest version of a document at the right time. While most document distribution will be done electronically, hard copies may still be required for remote locations or unsophisticated contractors, suppliers or even clients.
Standards to Be Followed
Standard procedures relating to information management must be followed wherever possible. These standards may be company standards or guidelines, codes of practice or recommendations issued by national or international institutions. The British Standards Institution has issued guides or codes of practice for configuration management, project management, risk management and design management, all of which impact on information management. An International Standard BS ISO 15489-I-2001 ‘Information and Documentation – Records Management – Part 1 – General’ is of particular importance.
Legal Requirements
Every project is constrained by the laws, statutory instruments and other legal requirements of the host country. It is important that stakeholders are aware of these constraints and it is a part of the information-management process to disseminate these standards to all the appropriate personnel. The Freedom of Information Act and Data Protection Act are just two such legal statutes that have to be observed. There may also be legal requirements for storing documents (usually for about 7 years) before they can be destroyed.
Foreseeable Risks
All projects carry a certain amount of risk, and it is vital that warnings of these risks are disseminated in a timely fashion to all the relevant stakeholders. In addition to issuing the usual risk register, which lists the perceived risks and the appropriate mitigation strategies, warnings of unexpected or serious risks, imminent political upheaval or potential climatic disasters must be issued immediately to enable effective countermeasures to be taken. This requires a preplanned and rehearsed set of procedures to be set up that can be implemented very rapidly. The appointment of an information risk manager will be part of such a procedure.
An important part of information management is issuing reports. A project manager has to receive reports from other members of the organization to enable him to assess the status of

360 Chapter 37
the project and in turn produce his own reports to higher management. Systems must be set up to ensure that these reports are produced accurately, regularly and timely. The usual reports required by a project manager cover progress, cost, quality, exceptions, risks, earned value, trends, variances and procurement or production status. These data will then be condensed into the regular (usually monthly) progress report to the programme manager, sponsor or client as the case may be. Templates and standard formats greatly assist in the production of these reports and modern technology enables much of these data to be converted into graphs, charts and diagrams, but presentation can never be a substitute for accuracy.
Data Collection
As the technical advances of IT expand, more and more data will be collected and screened by more and more organisations and companies. These data are then used for a great number of reasons ranging from security and defence to stock control, marketing, design and planned maintenance, as well as populating expert systems.
The way the data is collected also varies from direct face to face or telephone interviews and questionnaires, through data-logging techniques as used by utility companies to read domes-tic or commercial metre usage, to the sophisticated methods used by the security services to monitor phone conversations and internet traffic.
However, while the quantity of the data may be impressive, it will be useless, if not danger-ous, if the quality is suspect. Equally important is the timing, as late data can seriously affect the making of a decision or the issue of a report.
A case in point is the need for vigorous expediting of data required by procurement departments and design engineers from manufacturers or subcontractors. For this reason, the methods described in Chapter 34 (expediting, monitoring and inspection) should form part of the stan-dard procedures of any design organization. Fig. 34.2 shows a typical questionnaire sent out to prospective bidders to enable their capability, competence and financial stability to be assessed.
Another example is given in Fig. 27.5 which shows what information is required from differ-ent suppliers to enable the designers to incorporate the information into their overall scheme. Accompanying such a table would be the organization’s conditions of purchase and the dates for which the different data are required. For example, in the case of pumps, setting plans and information on flanges are required before impeller details.
There are two main types of data collection: qualitative (depth) and quantitative (breadth).
Qualitative
This method includes such techniques as structured interviews, direct observation, discussion groups. Much depends on the skills of the interviewer or discussion leader who must retain an

Information Management 361
open mind and not ask leading questions. Advantages include high-response rates and the ability to explore in greater depth after an initial analysis.
Quantitative
This covers questionnaires sent by mail or e-mail, telephone surveys, sample surveys based on a large number of participants, etc. Such surveys, which take into account age, ethnicity, income bracket and geographical location are often used by governments, academic researchers, retail businesses and manufacturers. The results of such surveys can affect policies and marketing strategies.
There should be a corporate strategy on data management which covers the operation of central data base, access to data, security, methods of quality verification, evaluation tech-niques, dissemination and any time or cost constraints.
Big Data
This is the term given to the collection, storing, analysing, categorizing and distributing large amounts of data which is too voluminous to be handled by a conventional relational database.
The collection, analysis and processing of Big Data is carried out by almost every facet of modern society including central and local government, industry, medical services, commercial and financial institutions, scientific institutions, retailers, food distributors and, of course, survey organizations. A recent House of Commons Science and Technology select committee report said that 90% of the world’s electronic data was created in the last two years and would grow yearly by 40% per year for the next 10 years. The capture of this amount of data and its analysis will have an enormous impact on industry and public services worldwide.
The mechanism for collecting Big Data is equally diverse, covering mobile phone networks, internet, mail shots, aerial photography, radio frequency identification, mass surveys and remote sensors. One example of preparing for Big Data is the provision of special brackets on construction plant for the multitude of sensors required to capture the data.
All this information must be tested for accuracy before it can be analysed, categorized and distributed to the users who require it for security, marketing or scientific purposes. Speed of dissemination is important as this will enable better and faster decisions to be made.
Further Reading
Laudon, K. C. (2008). Management of information systems (11th ed.). Prentice-Hall.Marchewska, J. T. (2012). Information technology project management with CD-rom (4th ed.). Wiley.

This page intentionally left blank

363Project Management, Planning and Control. http://dx.doi.org/10.1016/B978-0-08-102020-3.00038-3Copyright © 2017 Elsevier Ltd. All rights reserved.
CHAPTER 38
Communication
Chapter OutlineCultural Differences, Language Differences, Pronunciation, Translation and Technical Jargon 365Geographical Separation, Location Equipment or Transmission Failure 365Misunderstanding, Attitude, Perception, Selective Listening, Assumptions and Hidden Agendas 366Poor Leadership, Unclear Instructions, Unclear Objectives, Unnecessarily Long Messages and Withholding of Information 366Meetings 367Further Reading 368
While it is vital that a project manager has a good information system, without an equally good communication system such information would not be available when it is needed.
Generally, all external communications of a contractual nature, especially changes in scope or costs, must be channelled via the project manager or his/her office. This applies particularly to communications with the client and suppliers/subcontractors. The danger of not doing this is that an apparent small change agreed between technical experts could have considerable financial or program (or even political) repercussions due to the experts not being aware of the whole picture.
Unless a project manager decides to do everything him/herself, which should certainly not be the case, he/she has to communicate his/her ideas, plans and instructions to others. This requires communication, whether verbally, in writing, by mail, electronically or by carrier pigeon.
Communications can be formal and informal, and while contractual, organizational and technical information should always follow the formal route, communication between team members is often most effective when carried out informally. There are many occasions when a project manager has the opportunity to meet his/her team members, client or other stakeholders, all of which will enable him/her to discuss problems, obtain information, elicit opinions and build up trusting relationships which are essential for good project management.

364 Chapter 38
Management by walkabout is an accepted method of informal communication, which not only enables an exchange of information and ideas to take place, often in a relaxed atmo-sphere, but also has the advantage of seeing what is actually going on as well as setting the framework for establishing personal relationships.
Probably more errors occur in a project due to bad communications than any other cause. Ideas and instructions are often misunderstood, misinterpreted, misheard or just plainly ignored for one reason or another; in other words the communication system has broken down. Every communication involves a sender and a receiver. The sender has a responsibility to ensure that the message is clear and unambiguous, and the receiver has to make sure that it is correctly understood, interpreted, confirmed and acted upon.
There are a number of reasons why and how failures in communication can occur. The most common of these, generally known as communication barriers, are the following: • Culturaldifferences• Languagedifferences• Pronunciation• Translationerrors• Technicaljargon• Geographicalseparationoflocations• Equipmentortransmissionfailure• Misunderstanding• Attitudeduetopersonalityclash• Perceptionproblemsduetodistrust• Selectivelisteningduetodislikeofsender• Assumptionsandprejudice• Hiddenagendas• Poorleadershipcausingunclearinstructions• Unclearobjectives• Poordocumentdistributionsystem• Poordocumentretentionsystemorarchiving• Poorworkingenvironment,suchasbackgroundnoise• Unnecessarilylongmessages• Informationoverload,suchastoomanye-mails• Withholdingofinformation• Poormemoryorknowledgeretention
Clearly,someofthesebarriersarecloselyrelated.Someofthesehavebeencollectedandwillbe discussed in more detail in the following sections, together with the techniques which can be used to overcome these communication problems.

Communication 365
Cultural Differences, Language Differences, Pronunciation, Translation and Technical Jargon
Problems may arise because different cultures have different customs, etiquettes and trading practices. In some instances, where two countries use the same language, a particular word mayhaveatotallydifferentmeaning.ThisoccursnotonlybetweenEnglandandAmericabut,forexample,alsobetweenGermanyandAustria,whoare,assomecynicsmightsay,all‘divided by a common language’.
Forexample,aliftinEnglandwouldbeanelevatorintheUSAandawatertapwouldbeafaucet. Most project managers will be familiar with the English term planned being called scheduledintheUSA.Inaddition,regionalaccentsandvariationsinpronunciationcancausemisunderstandingsinverbalcommunications.Thesolutionissimple.Alwaysspeakclearlyand confirm the salient points in writing.
Confusioncanoccurwithdates.IntheUSAthemonthprecedestheday,whileintheUKthedayprecedesthemonth.Itisbestthereforetoalwayswritethemonthinwords;i.e.,3August2016 instead of 3.8.2016.
FormsofaddressmaybefairlyinformalinsomecountrieslikeUKortheUSA,butunlessoneknows the other party well, the formal personal pronoun sie or vous must be used in Germany or France, respectively. The incorrect form of address could easily cause offence. It is advisable, therefore, to seek guidance or attend a short course before visiting a country where such rules apply.
Incorrect translations are not only a source of amusement but can be a real danger. To overcome such errors, the translator should always be a native speaker of the language the text is translated into. This will enable the correct word for a particular context to be chosen and the right nuances to be expressed.
Most disciplines or industries have their own technical jargon which can cause difficulties or misunderstandings when the recipient is from a different environment or culture. There may be reluctance of the receiver to admit to his/her ignorance of the terms used, which can cause errors or delays in the execution of an instruction. The sender should, therefore, refrain from using jargon or colloquialisms, but by the same token, it is up to the receiver to request that any unfamiliar term be explained as it is mentioned.
Geographical Separation, Location Equipment or Transmission Failure
Where stakeholders of a project are located in different offices or sites, good electronic transmission equipment is essential. The necessary equipment must be correctly installed, regularly checked and properly maintained. Generally, it is worthwhile to install the latest updates, especially if these increase the speed of transmission, even if they do not reduce the

366 Chapter 38
often high-operating and high-transmission costs. Where persons in countries with different time zoneshavetobecontacted,caremustbetakentotaketheseintoconsideration.Aperson,fromwhom one wants a favour, will not be very cooperative if woken up at four o’clock in the morning!
Misunderstanding, Attitude, Perception, Selective Listening, Assumptions and Hidden Agendas
Sendersandreceiversofcommunicationsarehumanbeingsandarethereforepronetoprejudice, bias, tiredness and other failings, often related to their mood or health at the time. Misunderstandings can occur due to bad hearing or eyesight, or because there was not suffi-cient time to properly read and digest the message. Cases are known where, because the receiver did not like or trust the sender, the transmitted information was perceived as being unimportant or not relevant and was therefore not been acted upon with the urgency it actu-ally required. The receiver may believe the sender to have a hidden agenda or indeed have his/her own agenda, and may therefore deliberately not cooperate with a request. To avoid these pitfalls, all parties must be told in no uncertain manner that the project has priority over their personal opinions. It also helps to arrange for occasional face-to-face meetings to take place.
It is not unusual for the receiver to make assumptions which were not intended. For example, the sender may request a colleague to book some seats to a theatre. The receiver may assume the sender wants the best seats when the opposite may be true. The fault here lies with the sender who was not specific in his/her request.
Poor Leadership, Unclear Instructions, Unclear Objectives, Unnecessarily Long Messages and Withholding of Information
Instructions, whether verbal or written, must be clear and unambiguous. They should also be as short as possible as the receiver’s as well as the sender’s time is often costly. Winston Churchill required all important documents to be condensed onto ‘one sheet of foolscap paper’(approximatelythesizeofanA4sheet).Timeismoney,andthehigheroneisinthehierarchy,themoreexpensivetimebecomes.Aswithinstructions,objectivesmustalsobesetout clearly and unequivocally. It is often advantageous to add simple sketches to written communications. These are often more explicit than long descriptions.
When information has to be communicated to a number of recipients, it may not be advisable to tell everything to everybody. For example, an instruction to a technical department may not includethecostofcertainquotedcomponents.Someinformationisoftenonlydisseminatedon a ‘need to know’ basis. The sender therefore has the responsibility to decide which parts of the documentation are required by each receiver. Clearly, particular care has to be taken with sensitive or classified information, which may be subject to commercial distribution restric-tionsoreventheOfficialSecretsAct.

Communication 367
It can be seen that while there are many potential communication barriers, they can all be overcome by good communication planning and sensitive project management.
Anexampleofhowonesattitudecanbeaffectedbyreceivinggoodorbadcommunicationsisclearly shown by the following scenario.
You are standing on a railway platform waiting for a late train, and you hear the usual bland announcement which simply says:
‘Thistrainwillbe40minuteslate.Wearesorryfortheinconveniencethishascaused.’This will probably make you angry and blame the train operators for incompetence.
If,ontheotherhand,theannouncementsays:‘Thistrainwillbedelayedby40minutesduetoa young girl falling onto the line at the last station’, you will be mollified and probably quite sympathetic to the operators who now have the problem of dealing with a very unhappy circumstance.
The difference is that in the second announcement you were given an explanation.
Meetings
Meetings are an essential part of project management, as they enable two or more stakehold-ers to communicate and discuss issues in such a way that quick decisions can be made and implemented. The meeting may be face to face or via video link, teleconference or other virtual system.
The main types of meetings are as follows:
Board meetings at director levelPre-bid meetings with prospective suppliers or subcontractorsKickoffmeetingsatthestartoftheproject;thesemaybeintheofficeoronsiteProgress meetings at regular (usually monthly) intervalsSitemeetingswhichmaybeadhocorrelatedtoprogressAdhocmeetingstodiscussunforeseenissuesTechnical meetings between expertsMeetings with other stakeholders (clients, public authorities, contractors etc.)Team or staff meetings
Whatever the type or purpose, meetings should always be structured, starting with apologies for absence, approval of the last meeting’s minutes and discussions arising from points relatingtothepreviousmeeting.Apreviouslydrawn-upagendaandattendancelistshouldbedistributed in advance to all attendees. The chairman/chairwoman of the meeting should ensure that the subject matter being discussed does not stray from the topic in question and must resist the temptation of spending too much time on their pet subject or on areas which

368 Chapter 38
arehis/herbasedisciplineorexpertise.Similarly,unlesstheissueisurgentorcrucial,discussions of details by experts should be cut short and deferred to a follow-up meeting at which the subject can be discussed and examined in greater depth.
If the project manager is not present at such a meeting, one of the attendees must issue a short report on the results of the discussions and the recommendations made.
For all meetings, minutes should be kept of all the topics discussed and circulated to all attendeeswithinafewdaysofthemeeting.Allminutesofmeetingsshouldincludeanactioncolumn for each topic, which contains the name of the person designated to perform the action and the date by which it is to be completed.
Meetings are costly as they are usually attended by people of managerial rank, experts or specialists, all of whom command high salaries. For this reason, meetings should be attended only by persons related to the issues discussed and only for as long as their topic is being discussed. Once the discussion to which they contributed has been concluded, departmental managers and specialists should be allowed to return to their departments.
There is some truth in the old cynical saying which states that ‘The success of a meeting is inversely proportional to the number of people present’.
Guidelines for managing meetings should be a part of the company standards, which should include a standardized format for minutes of meetings.
Further Reading
DeVito,J.A.(2012).The interpersonal communications book. Pearson.

369Project Management, Planning and Control. http://dx.doi.org/10.1016/B978-0-08-102020-3.00039-5Copyright © 2017 Elsevier Ltd. All rights reserved.
CHAPTER 39
Team Building and Motivation
Large or complex projects usually require many different skills that cannot be found in one person. For this reason, teams have to be formed whose members are able to bring their various areas of expertise and experience together to fulfil the needs of the project and meet the set criteria. The project manager is usually the team leader and it may be his or her responsibility to select the members of the team, although in many instances he or she may be told by the senior management or HR department who will be allocated to the team. If the project is run as a matrix-type organization, the different specialist team members will almost certainly be selected by the relevant functional department manager, so that the project manager has to accept whoever has been allocated.
There are considerable advantages in operating as a team, which need not require all the members to be fully allocated to the project all the time. Nevertheless, the project
Chapter OutlineTeam Development 371
Forming 371Storming 371Norming 372Performing 372Mourning 372
The Belbin Team Types 372Plant 373Resource Investigator 373Coordinator 373Shaper 374Monitor/Evaluator 374Team Worker 374Implementer 374Completer/Finisher 374Specialist 374
Motivation 374Maslow’s Hierarchy of Needs 375Herzberg’s Motivational Hygiene Theory 377
Hygiene Factors 377Motivators 377
Further Reading 377
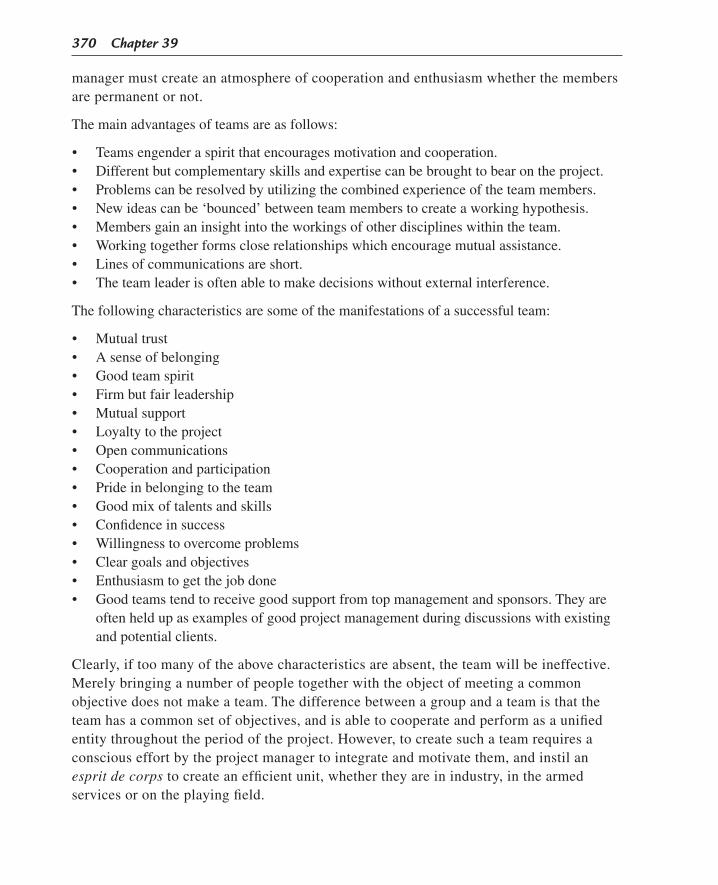
370 Chapter 39
manager must create an atmosphere of cooperation and enthusiasm whether the members are permanent or not.
The main advantages of teams are as follows: • Teamsengenderaspiritthatencouragesmotivationandcooperation.• Differentbutcomplementaryskillsandexpertisecanbebroughttobearontheproject.• Problemscanberesolvedbyutilizingthecombinedexperienceoftheteammembers.• Newideascanbe‘bounced’betweenteammemberstocreateaworkinghypothesis.• Membersgainaninsightintotheworkingsofotherdisciplineswithintheteam.• Workingtogetherformscloserelationshipswhichencouragemutualassistance.• Linesofcommunicationsareshort.• Theteamleaderisoftenabletomakedecisionswithoutexternalinterference.
The following characteristics are some of the manifestations of a successful team: • Mutualtrust• Asenseofbelonging• Goodteamspirit• Firmbutfairleadership• Mutualsupport• Loyaltytotheproject• Opencommunications• Cooperationandparticipation• Prideinbelongingtotheteam• Goodmixoftalentsandskills• Confidenceinsuccess• Willingnesstoovercomeproblems• Cleargoalsandobjectives• Enthusiasmtogetthejobdone• Goodteamstendtoreceivegoodsupportfromtopmanagementandsponsors.Theyare
often held up as examples of good project management during discussions with existing and potential clients.
Clearly,iftoomanyoftheabovecharacteristicsareabsent,theteamwillbeineffective.Merelybringinganumberofpeopletogetherwiththeobjectofmeetingacommonobjective does not make a team. The difference between a group and a team is that the team has a common set of objectives, and is able to cooperate and perform as a unified entity throughout the period of the project. However, to create such a team requires a conscious effort by the project manager to integrate and motivate them, and instil an esprit de corps to create an efficient unit, whether they are in industry, in the armed services or on the playing field.

Team Building and Motivation 371
Team Development
Building a team takes time, and its size and constituency may change over the life of the project to reflect the different phases. Team development was researched by Tuckman who found that a team has to undergo four stages before it can be said to operate as a successful entity. These stages are: 1. Forming 2. Storming 3. Norming4. Performing
To these could be added a fifth stage termed mourning, which occurs when the project is completed and the team is being disbanded.
Forming
Asthewordimplies,thisisthestagewhenthedifferentteammembersfirstcometogether.Whilesomeofthemmayknoweachotherfrompreviousprojects,otherswillbenew and unsure, not only of themselves but also of what they will be required to do. There will be an inevitable conflict between the self-interest of the team member and the requirements of the project, which may impose pressures caused by deadlines and cost restraints.
Clearly,atthisstagetheprojectmanagerwillhaveto‘sell’theprojecttotheteamandexplainwhat role each member will play. There may well be objections from some people who feel that their skills are not being given full rein, or conversely that they do not consider them-selves to be well suited for a particular position. The project manager must listen to and discuss such problems, bearing in mind that the final decision rests with him or her and once decided, must be adhered to. There is no virtue in forcing a square peg into a round hole.
Storming
Oncetheteamhasbeennominallyformedandthemainrolesallocated,thestormingstagewill start. Here the personalities and aspirations of the individuals will become apparent. The more dominant types may wish to increase their sphere of influence or their limits of author-ity, while the less aggressive types may feel they are being sidelined. There will be some jockeying for position and some attempts to write their own terms of reference, and it is at this stage that the conflict-management skills of the project manager are most needed. It is vital that the project manager asserts his or her authority and ensures that the self-interests of the individual become subservient to the needs of the project.

372 Chapter 39
Norming
Whenthestormingisover,theprojectshouldrunsmoothlyintothenormingstage.Here,all the team members have settled down and accepted their roles and responsibilities, althoughtheprojectmanagermayuseamoreparticipativeapproachanddosome‘finetuning’.Theimportantthingistoensurethattheteamishappytoworktogether,fullyaware of the project objectives and the required regulations and standards, and is motivated to succeed.
Performing
Atthisstage,theteamcannowbeconsideredaproperlyintegratedworkingentitywitheverymemberconfidentofhisorherrole.Alltheenergywillbefocusedonthewell-beingoftheprojectratherthantheindividual.Communicationsarewellestablishedandmoraleishigh.Theprojectmanager can now concentrate on the work at hand, but must still exercise a degree of maintenance ontheteam.Theorganizationshouldnowrunas‘onwell-oiledcasters’witheveryonebeingfullyaware of the three main project criteria: cost, time and quality/performance.
Mourning
Thereisaninevitableanticlimaxwhenaprojecthascometoanend.Membersofaproject team probably feel what soldiers feel at the end of a war. There is a mixture of relief, satisfaction and apprehension of what is to follow. Unless there is another similar project ready to be started, the team will probably be disbanded. Some people will return to their base discipline departments, some will leave on their own accord and some will be made redundant. There is a sense of sadness when friendships break up and relation-ships built up over many months, based on respect and mutual cooperation, suddenly cease.
The project manager now has to take on the mantle of a personnel officer and keep the team spirit alive right up to the end. There is always a risk, on large long-running projects, that as the end of the project approaches some people will leave before final completion to ensure further employ-ment without a break. It may then be necessary for the organization to offer termination bonuses to key staff to persuade them to stay on, so as to ensure there are sufficient resources to finish the job.
The Belbin Team Types
Whilethemainrequirementofateammembermustbehisorherexpertiseorexperienceinhis or her particular field, in the ideal team, not only the technical skills but also the character-isticsoftheteammembersshouldcomplementeachother.AstudyofteamcharacteristicswascarriedoutbyMeredithBelbinafternineyearsofresearchattheIndustrialTraining

Team Building and Motivation 373
ResearchUnitinCambridge.Attheendofthestudy,Belbinidentifiedninemaintypesthatare needed to a greater or lesser extent to make up the ideal team.
Unfortunately, in practice, it is highly unlikely that the persons with the right skills and ideal personalcharacteristicswillbesittingonabenchwaitingtobechosen.Moreoftenthannot,the project manager has to take whatever staff is assigned by top management or functional managers. However, the benefit of the Belbin characteristics can still be obtained by recogniz-ingwhatBebin‘type’eachteammemberis,andthenexploitinghisorherstrengths(andrecognizing the weaknesses) to the benefit of the project. In any case, most people are a mix of Belbin characteristics, but some will no doubt be more dominant than others.
The nine Belbin characteristics are as follows: • Plant• Resourceinvestigator• Coordinator• Shaper• Monitor/evaluator• Teamworker• Implementor• Completer/finisher• Specialist
The strengths and weaknesses of each of these characteristics are as follows.
Plant
Such persons are creative, innovative, imaginative, self-sufficient and relish solving difficult problems often using new ideas and fresh approaches. Their unorthodox behaviour may make them awkward to work with and their dislike of criticism, discipline and protocol may make them difficult to control.
Resource Investigator
These persons are very communicative, probably extroverted, show curiosity in new ideas and areenthusiasticinrespondingtonewchallenges.Oncetheinitialchallengeorfascinationisover, their interest tends to wane.
Coordinator
Coordinatorsareself-controlled,stable,calm,self-confident,canclarifygoalsandobjectivesandaregoodatdelegatingandmaximizingpeople’spotentials.Whengiventheopportunitythey tend to hold the stage.

374 Chapter 39
Shaper
Thesepersonsareoutgoing,dynamicandthriveonpressure.Driveandcouragetoshapeevents, overcome difficulties and a desire to challenge inertia or complacency are part of their character. They may therefore be anxious, impatient and easily irritated by delays and blockages.
Monitor/Evaluator
These people are sober, prudent and are able to evaluate the options. They have a good sense of judgement, are analytical and can make critical and accurate appraisals. They could be easily judgemental and their tactless criticism may be destructive.
Team Worker
Such persons are cooperative, sensitive, socially orientated and help to build a good team. They are often only noticed when they are absent. They may have difficulties in making decisions and tend to follow the crowd.
Implementer
Disciplinedandreliable,conservativeandpractical,suchpersonsturnideasintoactionssystematically and efficiently. They could be inflexible and averse to new unconventional methods.
Completer/Finisher
Such people are painstaking, conscientious and self-controlled perfectionists with a strong sense of urgency. They are good at checking and seeking out errors and omissions. They tend to be over-concerned with minor faults and find it hard to give in.
Specialist
Specialists supply skills that are in short supply. They tend to be single-minded, self-reliant and dedicated to their profession. Their independence is not easily controlled, especially if they know they are difficult to replace. Being absorbed in their speciality, they may at times have difficulty in seeing the larger picture.
Motivation
Thesimplestdictionarydefinitionofmotivationis‘thedesiretodo’.Thestrengthordegreedependsontheindividual’scharacterandthereasonorcauseofthedesire.Inmanycases,the

Team Building and Motivation 375
individual may be self-motivated, due to an inner conviction that a particular action or behaviour is necessary for personal, political or religious reasons, but in a project context, it may be necessary for an external stimulant to be applied. It is undoubtedly the function of a project manager to motivate all the members of the project team and convince them that the project is important and worthwhile. The raison d’etre and perceived benefits, be they politi-cal, economic, social or commercial, must be explained in simple but clear terms so that each team member appreciates the importance of his or her role in the project. In a wartime scenario, motivation can well be a question of survival and is often the result of national pride or convincing propaganda, but such clear objectives are seldom the case in a normal peace-time project, which means that the project manager has to provide the necessary motivation, encouragement and enthusiasm.
Thereislittledoubtthatalargepartofthesuccessofthe2012LondonOlympicswasduetothe collaborative approach, the team spirit of the design/construction team and the motivation to complete the project on time, for what was regarded by everybody as a project of national pride and international importance.
Apartfromtheinitialindoctrinationandsubsequentpeptalks,aprojectmanagercanrein-force the message by the conventional management practices of giving credit where it is due, showing appreciation of good performance and offering help where an individual shows signs of stress or appears to be struggling, mentally or physically.
Agoodexampleoftheeffectofmotivatingpeoplebyexplainingtheobjectiveofaprojectoreven a work package is shown in the following little story.
Amanwalkingalongastreetnoticesthatabricklayerbuildingawallisverylethargic,clearlynot enthusiastic and looks generally unhappy about his work.
‘Whyareyousounhappy?’heaskstheworkman.
‘Ihavejustbeentoldtobuildthiswall.Justplacingonebrickonanotherismonotonousandboring’wasthereply.
The man walked further up the street and met another bricklayer clearly building the other end of the same wall. This workman, on the other hand, worked quickly, was clearly inter-ested in the work and whistled a happy tune while he laid the bricks.
‘Whyareyousohappy?’heaskedtheman.
Themanlookedupwithshiningeyesandsaidproudly:‘Iambuildingacathedral’.
Maslow’s Hierarchy of Needs
A.H.Maslowcarriedoutresearchonwhypeopleworkandwhysomearemoreenthusiasticthan others. He discovered that in general there was, what he called, a hierarchy of human

376 Chapter 39
needs, which had to be satisfied in an ascending order. These can be conveniently demon-strated as a series of steps in a flight of stairs where a person has to climb one step before proceedingtothenext(seeFig. 39.1).
ThefivelevelsonMaslow’sneedsare:physiological, security and safety, social, esteem and self-actualization.Maslowarguedthatthefirstneedsaretheonesthatenablethehumanbodytoperform its functions, i.e., air for the lungs, food and water for the digestive system, exercise for themusclesand,ofcourse,sexforthecontinuationofthespecies.Oncetheseneedshavebeenmet, the next requirement is shelter, security in employment and a safe environment. This is then followed by social acceptance in the society one frequents, such as at work, clubs or pubs and, of course, the family. The next step is self-esteem, which is the need to be appreciated and respected.Praise,attention,recognitionandageneralsenseofbeingwanted,allgenerateself-confidence and well-being. The last aspiration is self-actualization. This is the need to maximizeallofone’spotentials,utilizeone’sabilitiesfullyandbeabletomeetnewchallenges.
Asinalltheories,thereareexceptions.Theproverbialstarvingartistinhisgarretismoreconcerned about his esteem and self-actualization than his security or even social acceptance. Similarly, the ideals of missionaries take precedence over the desire for physical comfort. However, for the majority of wage or salary earners, the theory is valid and must be of benefit to those wishing to understand and endeavouring to fulfil the needs of people in their charge.
Physiological
Security and Safety
Social
Esteem
Self-actualization
Maslow’s Hierarchy of Needs
Food, drink,air, exercise,sex
Employmentinsurance, homelife, security
Belonging to agroup, club, family,sports team
Recognition,attention,appreciation,reiteration
Developmentof personality,respondingto challenge
Figure 39.1Maslow’s hierarchy of needs.

Team Building and Motivation 377
Herzberg’s Motivational Hygiene Theory
Herzberg has tried to simplify the motivational factors by suggesting two types: • Hygienefactors• Motivators
Hygiene Factors• Physiologicalneeds• Security• Safety• Social
Motivators• Recognitionofachievement• Interestingwork• Responsibility• Jobfreedom• Pleasantworkingconditions• Advancementandgrowthprospects
ThehygienefactorsrepresentthefirstthreestepsofMaslow’sneeds,i.e.,physiologicalneeds, security and safety, and social. The motivators are then esteem and self-actualization. From a management point of view, the first three can almost be taken for granted, as without reasonable pay or security, staff will not stay. To obtain the maximum commitment from an employee(orevenoneself)motivatorssuchasrecognitionofachievement,interestingorchallenging work, responsibility, job freedom, pleasant working conditions and possibility of advancement and growth must be present.
Ingeneral,peoplelikedoingwhattheyaregoodatandwhatgivesthemsatisfaction.Atthesame time, they tend to shun what they are less able at or what bores them. It is of benefit to the organization therefore to reinforce these behaviours, once they have been identified.
Further Reading
Katzenbach,J.R.,&Smith,D.K.(2005).The wisdom of teams. Harper Business.Turner,J.R.(2003).People in project management.Gower.

This page intentionally left blank

379Project Management, Planning and Control. http://dx.doi.org/10.1016/B978-0-08-102020-3.00040-1Copyright © 2017 Elsevier Ltd. All rights reserved.
CHAPTER 40
Leadership
Chapter OutlineSituational Leadership 380Professionalism and Ethics 383
Responsibilities to Clients and Employers 383Responsibilities to the Project 384Responsibilities to the Profession of Project Management 384
Competence 384Further Reading 386
Continued
Adaptability Ability to change to new environment or client’s needs
Attitude Positive can-do outlook, optimism despite setbacksCharisma Presence and power to attract attention and
influence peopleCognitive ability Ability to weigh up options, give clear instructions
Commitment Will to succeed and achieve set goalsCommon sense Ability not to be hoodwinked by irrational sugges-
tions or solutions
Leadership can be defined as the ability to inspire, persuade or influence others to follow a course of action or behaviour towards a defined goal. In a political context, this can be for good or evil, but in a project environment it can generally be assumed that good leadership is a highly desirable attribute of a project manager.
Leadership is not the same as management. Leadership is about motivating, influencing and setting examples to teams and individuals, while management is concerned with the adminis-trative and organizational facets of a project or company. Therefore, it can be seen that a good project manager should be able to combine his leadership and management skills for the benefit of the project.
Whether leadership is attributed to birth, environment or training is still a subject for debate, but the attributes required by a leader are the same. The following list gives some of the most essential characteristics to be expected from a good leader. To dispel the impression that there is a priority of qualities, they are given in alphabetical order.

380 Chapter 40
While these ‘paragonial’ attributes (apart from being charismatic) sadly do not seem to be necessary in a politician, they are desirable in a project leader and in fact many good project managers do possess these qualities which, in practice, result in the following abilities: • Goodcommunicationskills,suchasgivingclear,unambiguousinstructionsandlistening
to others before making decisions.• Inspiringtheteambyclearlysettingouttheaimsandobjectives,andstressingtheimpor-
tance of the project to the organization or indeed, where this is the case, the country.• Fosteringaclimateinwhichnewsuggestionsandideasareencouragedandgivingdue
credit when and where these can be implemented.• Allocatingtherolesandtaskstotheselectedmembersoftheteamtosuittheskills,
abilities and personal characteristics of each member irrespective of race, creed, colour, sex or orientation.
• Gainingtheconfidenceandrespectoftheteammembersbyresolvingpersonnelissuesfairly, promptly and sympathetically.
Situational Leadership
Situational leadership simply means that the management style has to be adapted to suit the actual situation the leader finds himself or herself in.
AccordingtoHerseyandBlanchard,whomadeastudyofthissubjectasfarbackas1960,managers or leaders must change their management style according to the level of maturity of the individual or group. Maturity can be defined as an amalgam of education, ability,
Creativity Able to do some innovative or lateral thinking
Drive Energy, willpower and determination to push forward
Fairness Fair and considerate attitude to human needs and staff problems
Flexibility Willingness to modify ideas and procedures to new circumstances
Honesty Trustworthy, reliable, will not tolerate cover-upsIntegrity Ability to make sound moral judgements, approach-
able, principledIntelligence Clear thinking and ability to understand conflicting
argumentsOpen-mindedness Open to new ideas and suggestions even if
unconventionalPrudence Ability to weigh up and take risks without being
recklessSelf-confidence Trust in own decisions and abilities without being
self-righteousTechnical knowledge Understanding of technical needs of the project and
deliverables

Leadership 381
confidence and willingness to take responsibility. Depending on this level of maturity, a leader must then decide, when allocating a specific task, whether to give firm, clear instructions without inviting questions or delegating the performance of the task, giving the follower a virtual freehand. These are the extreme outer (opposite) points of a behavioural curve.Inbetweenthesetwoextremesliesthebulkofmanagementbehaviour.Forconve-nience, the level of maturity can be split into four categories:
Category 1Low skill, low confidence, low motivationCategory 2Medium skill, fair confidence, fair ability, good motivationCategory 3Goodskill,fairconfidence,goodability,highmotivationCategory 4Highskill,highconfidence,highability,highmotivation
The degree of direction or support given to the follower will depend on the leader’s percep-tion of the follower’s maturity, but always in relation to a specific task. Clearly, a person can be more confident about one task or another, depending largely on his or her level of experi-ence of that task, but situational leadership theory can only be applied to the situation (task) to be performed at this particular time.
The simplest way to illustrate situational behaviour is to look at the way tasks are allocated in the army.
High task, low support
Asergeantwillgivecleardirectiontoacategory1recruit,whichheorshewillnotexpecttobe questioned on. There will be little technical or emotional support – just plain orders to perform the task.
High task, high support
Acaptainwillgiveanordertothesergeant(category2)butwilllistentoanyquestionsoreven suggestions the sergeant may make, as this follower may have considerable experience.
Low task, high support
Acolonelwillsuggestacourseofactiontoamajorbutwillalsodiscussanyfearsorprob-lems that may arise before deciding on the exact tactics.
Low task, low support
Acommanderinchiefwilloutlinehisstrategytohisgeneralstaff,listentotheirviewsandwill then let them get on with implementing the tasks without further interference.

382 Chapter 40
Clearly, in every case the leader must continue to monitor the performance of any follower or group,butthiswillvarywiththedegreeofconfidencetheleaderhasinthefollower.Atthelowestlevel,itcouldbeacheckeveryhalfanhour.Atthehighestlevel,itcouldbeamonthlyreport.
It is not possible to apply mathematical models to managing people who are not only diverse from one another, but can also change themselves day by day depending on their emotional or physical situation at the time.
Fig.40.1 shows the four maturity categories set against the behaviour grid. It also superim-poses a development curve that indicates the progression of behavioural changes from the lowest to the highest, assuming that the follower’s maturity develops over the period of the project.
The leader can help to develop the maturity of the follower by gradually reducing the task behaviour, which means explaining the reasons for instructions and increasing the support by praising or rewarding achievements as soon as they occur. There should be a high degree of encouragement by openly discussing mistakes without direct criticism or apportioning blame. Phased monitoring and a well-structured feedback mechanism will highlight a problem before it gets out of hand, but probably the most important point to be hammered home is the conviction that the leader and follower are on the same side, have the same common interest to reduce the effect of errors and must therefore work together to resolve problems as soon as they become apparent.
It is the fear of criticism that inhibits the early disclosure of problems or mistakes, which tend to get worse unless confronted and rectified as soon as possible. Even senior managers risk instant dismissal if they deliberately submit incorrect information or unduly withhold an unpalatable financial position from the board of directors.
High
HighLow
Low Directive behaviour
Delegating
Enco
urag
ing C
oaching
Structuring
Supportivebehaviour
Figure 40.1Situational leadership. Source: Hersey and Blanchard

Leadership 383
Leaders who are confident in their abilities and able to practise the low-task, low-support style will be able to delegate without completely abdicating their own accountability.
Delegation means transferring both the responsibility and authority to another person, but still retaining the right to monitor the performance as and when required. Clearly, if this monitor-ing takes place too frequently or too obtrusively, the confidence of the follower is soon undermined.Generallyspeaking,amonthlyreportisareasonablemethodofretainingoverallcontrol, provided of course that the report is up to date, honest and technically correct.
Professionalism and Ethics
Allthemajorprofessionalinstitutionsexpecttheirmemberstoobserverulesofconductthathave been designed to ensure that the standards of ethical behaviour set out in the charter and by laws of the institution are adhered to.
The rules set out the duties of professional members towards their employers and clients, their profession and its institution, their fellow members, the general public and the environment. These rules apply equally to professionals in full- or part-time employment and to those acting as professional consultants or advisers on a fee-basis for and on behalf of private or public clients. Contravention of this code could result in disciplinary proceedings and pos-sible suspension, or even expulsion from the institution.
Project management is a relatively new profession when compared with the established professions such as law, medicine, architecture, accountancy, civil engineering and surveying.
AstandardcodeofconductwasthereforeproducedbytheAssociationforProjectManagement(APM),whichsetsouttherequiredstandardsofprofessionalbehaviourexpected from a project manager. These duties and responsibilities can be divided into three main categories as follows.
FurtherDiscussiononEthicsIsGiveninChapter43(Governance)
Responsibilities to Clients and Employers• Ensurethatthetermsofengagementandscopeareagreedbybothparties.• Actresponsiblyandhonestlyinallmatters.• Acceptresponsibilityforownactions.• Declarepossibleconflictsofinterest.• Treatalldataandinformationasconfidential.• Actinthebestinterestoftheclientoremployer.• Whererequired,provideadequateprofessionalindemnityinsurance.• Desistfromsubcontractingworkwithouttheclient’sconsent.

384 Chapter 40
Responsibilities to the Project• Neithergivenoracceptgiftsorinducements,otherthanofnominalvalue,fromindividu-
als or organizations associated with the project.• Forecastandreportrealisticvaluesintermsofcost,timeandperformance,andquality.• Ensuretherelevanthealthandsafetyregulationsareenforced.• Monitorandcontrolalltasks.• Ensuresufficiencyandefficientuseofresourcesasandwhenrequired.• Takestepstoanticipateandpreventcontractualdisputes.• Actfairlyandequitablyinresolvingdisputesifcalledupontodoso.
Responsibilities to the Profession of Project Management• Onlyacceptassignmentsforwhichheorsheconsidershimselforherselftobe
competent.• Participateincontinualprofessionaldevelopment.• Encouragefurthereducationandprofessionaldevelopmentofstaff.• Refusetoactasprojectmanagerinplaceofanotherprofessionalmemberwithoutinstruc-
tions from the client and prior notification to the other project manager.• Alwaysactinamannerthatwillnotdamagethestandingandreputationoftheprofes-
sion, or the relevant professional institution.
Normally,oneoftheconditionsofmembershipofaprofessionalinstitutionisthatoneaccepts the rules of conduct without question and that any decision by the disciplinary committee is final.
Competence
The competence of a project manager can best be described as an amalgam of technical knowledge, experience, ability to handle people and the ability to work in a sometimes stressful environment.
Asponsororseniordirectorofanorganizationmustbereasonablysurethatapersondesignated as project manager or project director has the attributes described above and is thereforequalifiedfortheparticularprojecttobeundertaken.Asprojectsvaryinsizeandcomplexity, the competence of the project manager will also vary, and it is the job of the sponsor to ensure that the project manager’s competence profile matches the requirements of the project.
While some organizations have developed their own competence framework for their own staff, the need for a more universal set of metrics was clearly a step in the right direction so that smaller organizations with limited resources and less developed managerial maturity could benefit from an accepted standard.

Leadership 385
Forthisreason,theAssociationforProjectManagement(APM)designedandpublishedtheuser-friendlyAPMCompetenceFrameworkin2015,andwiththeirkindpermissionsomeoftheir major suggestions for measuring competence are described below.
The framework applies equally to project management, programme management, portfolio management,projectcontextandtheprojectoffice.Amanagerinanyofthesefivekeyconcepts must satisfy the three relevant domains of technical competence, behavioural competenceandcontextualcompetence.Ofthese,thetechnicaldomainandthebehaviouraldomainhavebeenfleshedoutby30and9competenceelementsrespectively,whichcanbemeasured relatively easily to enable an assessment to be made of the manager’s competence for the specific project to be undertaken.
The table in Fig.40.2showstheelementsforthetwodomainsbasedontheAPMBodyofKnowledge6thedition.
Technical Competence Behavioural Competence
Concept CommunicationProject success & benefit management TeamworkStakeholder management LeadershipRequirements management Conflict managementProject risk management NegotiationEstimating Human resource managementBusiness case Behavioural characteristicsMarketing and sales Learning and developmentProject review Professionalism and ethicsDefinitionScope managementModelling and testingMethods and proceduresProject quality managementSchedulingResource managementInformation management & reportingProject management planConfiguration managementChange controlImplementationTechnology managementBudgeting & Cost managementProcurementIssue manageentDevelopmentValue managementEarned value managementValue engineeringHandover & close-out
Figure 40.2The elements for the two domains based on the APM Body of Knowledge 6th edition.

386 Chapter 40
TheAPMthendefinesfourlevelsofcompetenceAtoD,whichdescribetheexperiencerequired for each level ranging from project director, through two levels of project manager to associateprojectmanager.Ascoringmatrixforknowledgeandexperiencecanthenbedrawnup either by a senior manager or by self-assessment.
In practice, many assessments on competence are made (often informally) at the job interview.Anexperiencedseniormanagercan,byaskingtherightquestionsandstudyingtheapplicant’s CV, obtain a fairly good idea of the technical and behavioural competence of the interviewee. Experience on a similar project in terms of size and complexity, which was successfully completed, is probably the best measure of competence.
Further Reading
Hersey,P.H.,&Blanchard,K.H.(2012).Management of organisational behaviour.Prentice-Hall.Lewis,J.P.(2003).Project leadership.McGraw-Hill.
387Project Management, Planning and Control. http://dx.doi.org/10.1016/B978-0-08-102020-3.00041-3Copyright © 2017 Elsevier Ltd. All rights reserved.
CHAPTER 41
Negotiation
However well a project is managed, it is inevitable that sooner or later a disagreement will arise between two persons or parties, be they different stakeholders or members of the same project team. If this disagreement escalates to become a formal dispute, a number of dispute resolutions exist (see Chapter 42) that have been designed to resolve the problem. However, it is far better, and certainly cheaper, if the disagreement, which may be financial, technical or organizational, can be resolved by negotiation.
Negotiation can be defined as an attempt to reach a result by discussion acceptable to both parties. This does not mean that either one or both parties are particularly happy with the outcome, but whatever compromise has been agreed, business or relationships between the parties can continue.
The ideal negotiation will end in a win–win situation, where both parties are satisfied that their main goals have been met, even at the expense of some minor concessions. More often, however, one party is not able to achieve the desired result and may well leave the negotiating table aggrieved, but the fact that the work can continue and the dispute does not escalate to a higher level, or that a commercial deal is struck rather than a complete breakdown of a business relationship, indicates that the negotiation has been successful.
Once it has been agreed by both parties to enter into negotiation, both parties should follow a series of phases or stages to achieve maximum benefit from the negotiation.
Phase 1: Preparation
As with claims or legal proceedings, negotiations will have a greater chance of succeeding if the arguments are backed by good documentation. The preparation phase consists largely of collecting
Chapter OutlinePhase 1: Preparation 387Phase 2: Planning 388Phase 3: Introductions 389Phase 4: Opening Proposal 389Phase 5: Bargaining 389Phase 6: Agreement 390Phase 7: Finalizing 390

388 Chapter 41
and collating these documents, and distilling them into a concise set of data suitable for discussion. These data could be technical data, test results and commercial forecasts, and could include precedents of previous discussions. There is really no limit as to what this back-up documentation should be, but the very act of reading these data and condensing them into a few pages will give the negotiator a clear picture of what the issues are. (See Fig. 41.1 for stages of negotiation.)
Phase 2: Planning
It is pointless even considering a negotiating process if there is no intention to compromise. The degree of compromise and the limits of concessions that can be accepted have to be established in this phase. There is usually a threshold, below (or above), that must be respected, and the upper and lower limits in terms of time, delivery, money and payment arrangements as well as the different levels of compromise for each area must be established in advance. There must be a clear appreciation of what concessions can be accepted and at what stage one must either concede or walk away.
Generally, the party that has the most to gain from a negotiated settlement is automatically in the weaker position. In addition, factors such as financial strength, future business relation-ships, possible publicity (good or bad), time pressures and legal restraints must all be taken into consideration.
Figure 41.1Negotiation stages.

Negotiation 389
The location of the negotiations must be given some consideration as it may be necessary to call in advisers or experts at some stage. There is some psychological advantage in having the negotiation on one’s home ground and for this reason the other party may insist on a neutral venue such as a hotel or conference centre.
Phase 3: Introductions
Negotiations are carried out by people and the establishment of a good relationship and rapport can be very beneficial. Knowledge of the other party’s cultural background and business norms can help to put the other side at ease, especially where social rituals are important to them. Past cooperative ventures should be mentioned, and a discussion of common acquaintances, alliances and interests all help to break the ice and tend to put all parties at their ease. A quick overview of the common goals as well as the differences may enable the parties to focus on the important issues, which can then be categorized for the subsequent stages.
Phase 4: Opening Proposal
One of the parties must make an initial offer that sets out their case and requirements. The wording of this opening would give some indication of the flexibility as an inducement to reaching a mutually acceptable settlement. Often the requirements of the opening gambit are inflated to increase the negotiation margin, but the other party will probably adopt the same tactics. It is at this opening stage that the other party’s body language such as hand gestures, posture, eye movements and facial expressions can give clues as to the acceptance or non-acceptance of particular suggestions or offers. The common identification of important points will help to lead the discussion into the next phase.
Phase 5: Bargaining
The purpose of bargaining is to reach an agreement that lies somewhere between the initial extreme positions taken by the parties. Both parties may employ well-known tactics such as veiled threats, artificial explosions of anger or outrage, threats of walking out or other devices, but this is all part of the process. Often a concession on one aspect can be balanced by an enhancement on another. For example, a supplier may reduce his price to the level required by the buyer, provided his production (and hence his delivery) period can be increased by a few weeks or months. The buyer has to decide which aspect takes priority: money or time.
Concessions should always be traded for a gain in another area, which may not be necessarily in the same units or terms. For example, a reduction in price can be balanced by an increase in the number of units ordered or a later delivery. There should always be a number of issues on the table for discussion, so that quid pro quo deals can be struck between them.

390 Chapter 41
Phase 6: Agreement
Negotiations are only successful if they end with an agreement. If both parties walk away without an agreement, one or other (or possibly both) of the negotiators have not done their job and the case will probably end up in adjudication, arbitration or litigation. Concessions, which are not just given away, should not be regarded as a sign of weakness, but a realization that the other party has a valid point of view that merits some consideration. Both parties should be satisfied enough to wish to continue working or trading together and both are probably aware that there is always the risk that the legal costs of an action can exceed the amount in dispute. This realization often concentrates the mind to agree on a settlement. It may even be prudent, if there is no great time pressure, to leave the door open for a further discussion at a later date, or allow the future discussions to take place at a higher level of management.
Phase 7: Finalizing
When an agreement has been reached, the deal has to be formalized by a written statement setting out the terms of the agreement. This must be signed by both parties attending the negotiations. In some cases the agreement reached will be subject to ratification by senior management, but if the settlement is reasonable, such confirmation is usually given without question (Fig. 41.2).
It is a fact that the further a person is removed from the ‘coal face’ of the dispute, the more likely he or she is to ratify a settlement.
It must be pointed out that the negotiations involving labour disputes are best carried out by specialist negotiators with experience in industrial relations and national agreements, local working practices and labour laws. The procedures for such negotiations, which often end up with applications to conciliation boards or tribunals, are outside the scope of this book.
I Win
Win/Win Win/Lose
Win/Lose Lose/Lose
You
Win
You
Lose
I Lose
Figure 41.2Negotiation outcomes.

Negotiation 391
However, differences of opinion can sometimes be reconciled by resorting to mediation involving the help of an independent third party.
When an agreement between the parties appears to be impossible, but neither party relishes the idea of potentially expensive and drawn-out arbitration or litigation, a practical next step would be for both parties to consider resorting to the relatively inexpensive and quick process of mediation. If this procedure fails, there is still the option of adjudication. Both these dispute resolution procedures are described more fully in Chapter 42.

This page intentionally left blank

393Project Management, Planning and Control. http://dx.doi.org/10.1016/B978-0-08-102020-3.00042-5Copyright © 2017 Elsevier Ltd. All rights reserved.
CHAPTER 42
Conflict Management and Dispute Resolution
Chapter OutlineConciliation 395Mediation 396Adjudication 396Arbitration 397Litigation 398
Conflict management covers a wide range of areas of disagreement from smoothing out a simple difference of opinion to settling a major industrial dispute.
Projects, as life in general, tend to have conflicts. Wherever there is a wide variety of indi-viduals with different aspirations, attitudes, views and opinions there is a possibility that what may start out as a misunderstanding escalates into a conflict. It is one of the functions of a project manager to sense where such a conflict may occur and, once it has developed, to resolve it as early as possible to prevent a full-blown confrontation that may end in a strike, mass resignations or a complete stoppage of operations.
Conflicts can be caused by differences in opinions, cultural background or customs, project objectives, political aspirations or personal attitudes. Other factors that tend to cause conflicts are poor communications, weak management, competition for available resources, unclear objectives and arguments over methods and procedures.
Conflict between organizations can often be traced back to loose contractual arrangements, sloppy or ambiguous documentation and non-confirmation in writing of statements or instructions.
Thomas and Kilman published a study on conflict management and suggested five techniques that can be employed for resolving conflicts. These are: • Forcing• Confrontingtheproblem• Compromising• Smoothing• Withdrawing

394 Chapter 42
Forcing involves one party using its authority acquired by virtue of position in the organization, rank or technical knowledge to force through its point of view. While such a situation is not uncommon in the armed forces where it is backed up by strict discipline, it should only be used in a project environment where there is a health and safety issue, or in an emergency posing a risk of serious physical damage. In most of the situations where forcing has been used to solve a conflict, one party almost certainly feels aggrieved with a consequent adverse effect on morale and future cooperation.
Confronting the problem is, by contrast, a more positive method. In this situation, both parties will try to examine what the actual issue is and will make a concerted effort to resolve it by reasoning and showing mutual respect for each other’s point of view. The most likely situation where this method will succeed is when both the parties realize that failure to agree will be disastrous for everybody, and when success will enhance both their posi-tions, especially when it is understood that future cooperation is vital for the success of the project. Often there are useful by-products such as innovative solutions or a better under-standing of the wider picture.
Compromising is probably the most common method to resolve disputes, but generally both parties have to give up something or part with something, whether it is a point of principle, a financial claim, pension rights or an improvement in conditions. This means that the settlement may only be temporary and the dispute may well flare up again when one of the parties believes itself to be in a better bargaining position. No one really wins, yet both lose something and it may well be the subject of regret later when the effects of the compromise become apparent. Often commercial or time (programme) pressures make it necessary to reach a quick compromise solution, which means that if these pressures had not existed a more rational discussion could have produced a more lasting result.
Smoothing is basically one party acceding to the other party’s demands because a more robust stance would not be in their best interest. This could occur where one party has more author-ity or power (financial, political or organizational) or where the arguments put forward are morecogent.Smoothingdoesnotmeancompletesurrender,asitmayjustnotbeopportuneor politically wise at this particular time to be more assertive.
Withdrawing in effect means avoiding the issue or ignoring it. While this may appear to be a sign of weakness, there may be good reasons for taking this stance. One may be aware that the dispute will blow over when the other party’s anger has cooled down or a confrontation is likely to inflame the situation even more. One may also feel that the possibility of winning the argument is small, so that by making what may be considered a small concession, good relations are maintained. In practice, this procedure is only suitable for minor issues since by ignoring important ones, the problem is only shelved and will have to be resolved at a later date. If the issue is a major one and unlikely to be resolved by the other four options, it may

Conflict Management and Dispute Resolution 395
still be correct for one or both parties to withdraw and agree to take the dispute to adjudica-tion, arbitration or litigation as described later.
Whatever techniques are adopted in resolving disputes, the personality of the project manager or facilitator plays a major role. Patience, tact, politeness and cool-headedness are essential irrespec-tive of the strength or weakness of the technical case. Any agreement or decision made by a human being is to a large extent subjective, and human attributes (or even failings) such as honour, pride, status or face-saving must be taken into account. It is good politics to allow the losing party to keep their self-respect and self-esteem. Team members may or may not like each other, but any such feelings must not be allowed to detract from the professionalism required to do their job.
In general, confrontation is preferable to withdrawal, but to follow such a course, project managers should practise the following: • Bearolemodelandsetanexampletotheteammembersinshowingempathywiththe
conflicting parties.• Keepanopen-doorpolicyandencourageearlydiscussionbeforeitfestersintoamore
serious issue.• Hearpeopleoutandallowthemtoopenupbeforemakingcomments.• Lookforahiddenagendaandtrytofindoutwhatisreallygoingonastheconflictmay
have different (very often personal) roots.
When a dispute involves organizations outside the project team, such as suppliers, subcontrac-tors or labour unions, professional specialized assistance is essential in the form of commer-cial lawyers or industrial (labour) relations officers.
When the conflict is between two organizations and no agreement can be reached by either discussions or negotiations between the parties, it may be necessary to resort to one of the following five established methods of dispute resolution available to all parties to a contract. These, roughly in order of cost and speed, are: • Conciliation• Mediation• Adjudication• Arbitration• Litigation
Conciliation
The main purpose of conciliation, which is not used very often in commercial disputes, is to establish communications between the parties so that negotiations can be resumed. Conciliators should not try to apportion blame, but to focus on the common interests of the parties and the systemic reasons for the breakdown of relationships.

396 Chapter 42
Mediation
In mediation, the parties in dispute contact and engage a third party either directly or via the mediation service of one of the established professional institutions. Although the parties retain control over the final outcome, which is not enforceable, the mediator, who is impartial and often experienced in such disputes, has control over the proceedings and pace of the mediation process. The mediator must on no account show him or herself to be judgemental or give advice oropinions,evenifrequestedtodoso.Hisorhermainfunctionistoclarifyandexploreallthecommon interests and issues as well as possible options, which may lead to a mutually beneficial and acceptable settlement. Once an agreement has been reached, it must be recorded in writing.
If mediation is started early enough before the differences become entrenched, the possibility of an amicable settlement is high. Provided legal advisers are not employed, the only costs are the fees of the mediator, which makes the procedure much cheaper and certainly quicker than any of the three more formal and legally binding dispute resolution procedures described below.
Adjudication
Although adjudication has always been an option in resolving disputes, it requires the agree-ment of both parties. This also means that both parties have to agree as to who would be the adjudicator. As this in itself could be a source of disagreement, it was not a common method ofdisputeresolutionuntilthe1996ConstructionAct,moreaccuratelycalled‘HousingGrants,ConstructionandRegenerationAct1996’(nowreplacedbytheLocalDemocracy,EconomicDevelopment&ConstructionAct2009),waspassed.ThisActallowedonepartytoapplytooneofanumberofregisteredinstitutionscalledtheAdjudicatorNominatingBody(ANB)toappointanindependentadjudicator.Theotherpartyisthenobligedbylawtoacceptboth the adjudication process and the nominated adjudicator. Certain types of contracts are not covered such as mining (extraction), oil and gas, and power generation.
The process of adjudication has to follow strict procedures which can vary slightly depending ontheANB,mostofwhomhaveproducedtheirownsetofadjudicationprocedures.IntheabsenceofsuchanANBprocedurebeingavailable,theactrequiresthattheproceduretobefollowedisthatsetoutinthe‘TheSchemeforConstructionContracts(EnglandandWales)Regulations1998’knownasthe‘Scheme’.AslightlydifferentschemeappliesforScotland,butmostproceduresdrawnupbythevariousANBsfollowtheprinciplesofthescheme.Theinitiating party, called the referring party,canchoosewhichANBtouseandcanalsodecidewhethertousetheschemeorthechosenANB’sprocedure.
The procedure to be followed is as follows: 1. The referring party serves a notice of adjudication to the other party of the dispute, known
as the responding party and to the adjudicator.

Conflict Management and Dispute Resolution 397
2. Onceappointed,theadjudicatormustfollowthetermsspecifiedinthecontract. 3. The adjudicator invites the referring party, to submit details of the dispute, called the
referral, which must also be sent to the responding party. 4. The adjudicator issues a programme giving the dates by which the specified documents
must be submitted. 5. After about 7 days, the responding party must issue a response in which they put forward
their case. 6. The adjudicator then reviews these submissions together with any other papers or evi-
dence he may request, and is obliged to give a ruling (called a decision)within28daysafterthereferral.However,thereferringpartycangrantanextensionofafurther14days.Furtherextensionoftimeisonlypossiblewiththeagreementofbothparties.Although,in the early days of adjudication, the adjudicator had to be requested to give reasons for his decision, in most cases giving reasons is now the norm.
In practice, project management principles should be used, e.g., only one person should be nominated from each party to communicate with the other parties including the adjudicator. Confirmation of receipt for all letters, e-mails and faxes should be requested and filed with the original. As with all documents, it is vital to read the small print.
Originally, the adjudicator dealt direct with the two disputing parties. Now both parties appoint lawyers or claims consultants to prepare their case. This has inevitably increased the cost and led to an emphasis on procedure, often resulting in subjecting the adjudicator to intimidatory tactics and a challenge to the adjudicator’s jurisdiction. As the adjudicator cannot confirm his own jurisdiction, this causes some confusion which may have to be decided by a court.
At times, the decision by the adjudicator is challenged by consultants or lawyers based purely on alleged non-compliance of procedure, and this too will have to be decided by a court.
While a court will generally uphold an adjudicator’s decision, a Court of Appeal ruling in 2012(PCHarringtonContractorsLtd.vSystechInternationalLtd.[2012]EWCACiv1371)stipulates that if the adjudicator’s decision has been revoked as a result of default or miscon-duct, the adjudicator loses his fees unless a special clause is inserted in the adjudicator’s contract with the parties, which provides for payment even in the event of an unenforceable decision.Feeschargedbytheadjudicatorareleviedjointlyandseverally,sothatifonepartyrefuses to pay, the other party is liable for payment including interest for late payment.
Arbitration
Manycontractscontainanarbitrationclause,which,inthecaseofadispute,requirestheparties to either agree to the appointment of an arbitrator or ask one of the recognized chartered institutions to appoint an independent arbitrator. The arbitrator asks for

398 Chapter 42
submissions from both parties (preferably in writing), and has the power to open up all the books and documents relating to the dispute, call witnesses and seek expert opinions. In most cases, both the sides will be assisted by legal and technical advisers, which could generate considerable costs. Unlike an adjudicator, the arbitrator has the right to award all or part of the costs of the case against one or both of the parties as he sees fit. Generally, there is a three-month time limit, but this can be extended by the arbitrator, if necessary.
In some cases, especially in overseas contracts, it may be necessary to appoint two arbitrators. If these cannot agree on an award, the matter has to be resolved by a third person called an umpire.
In a technical dispute, the arbitrator should ideally be an expert in that field, but if the dispute is of a non-technical nature, it may in the end be better to have the matter resolved by litiga-tion, i.e., in the courts. This, however, means that the privacy afforded by arbitration will be lost.
Arbitration was designed to be speedier and cheaper than court proceedings, but nowadays both parties appoint a galaxy of legal advisers and expert witnesses, which may make arbitra-tion as, if not more, costly as court action. As with adjudication, it is now necessary for the arbitrator to give reasons with his decision.
Litigation
Any dispute can be taken to court whether it is technical, contractual, financial, legal, environmental, personal, etc., provided that there is an applicable basis for legal action. A court procedure which is more formal, and, being in open court, lacks the privacy of arbitration, involves the employment of solicitors and barristers who present the case to the judge. In addition, there will be expert witnesses recruited by both parties whose evidence may be given under oath and be subject to cross-examination. If such proceed-ings are not settled before they go to trial, they tend to be very expensive both in terms of the award and subsequent damages, if the case is lost, and also in costs, i.e., the court fees and especially the legal fees incurred by both sets of legal teams, which can soon escalateifthecasetakesmanyweeksormonths.Further,therulesofwhatevidencecanbe presented and how it is presented are not as flexible in court as they are in arbitration. Finally,thecourttimetableandtheneedtocomplywithcertainpre-trialproceduresmaymeanitcantakesomemonthsorevenyearsforalitigationcasetogettotrial.Forthesereasons, every effort should be made to settle technical and contractual disputes by one of the other two methods of dispute resolution. In fact when an arbitration clause is part of the contract, a court will require the arbitration procedure to be followed before permit-ting it to be heard by a judge.

Conflict Management and Dispute Resolution 399
The benefits of litigation are that the services of the judge are free and the ruling could be of publicinterestthusactingasanimportantprecedentforfuturecases.Furthermore,althoughthere is certainty of enforcement of the award, there is a right of appeal to a higher court.
Needless to say, a well-managed project, benefiting from the use of tight but fair and equi-table contract documents and change procedures, should never require the project manager to invokeanyofthesestages.Mostargumentsanddisagreementsshouldberesolvedasearlyaspossible by discussions and negotiations before the dispute festers and anger turns into hostility.

This page intentionally left blank

401Project Management, Planning and Control. http://dx.doi.org/10.1016/B978-0-08-102020-3.00043-7Copyright © 2017 Elsevier Ltd. All rights reserved.
CHAPTER 43
Governance
Chapter OutlineGovernance of Project Management 401
Portfolio Direction 403Project Sponsorship 403Project Management Capability 404Disclosure and Reporting 404Ethics 405Evidence 406
Conclusion 407Further Reading 407
Governance of Project Management
Organizations require their objectives set, and the determination of the means of attaining these objectives and of monitoring performance. As summarized by the UK Financial Reporting Council, corporate governance is the system by which companies are directed and controlled. This governance applies to all ongoing and once-off activities of an organization. Its application to once-off activities is termed as governance of project management (GoPM).
Within a company, the board of directors are responsible for governance. However, governance achievement is not done by any one body, but involves relationships between interested parties. For corporations, these interested parties include the board, management, shareholders as well as the legislature and other stakeholders. For public sector organizations, social enterprises and other non-corporate organization, the parties responsible for and providing governance will differ.
The delivery of governance requires such activities as annual general meetings, board meetings, benchmarking, standard procedures, assurance, marketing and press releases. Awareness of and responding to changes in context within any of the STEEPLE (social, technical, economic, environmental, political, legal and regulatory, ethical) factors is another key competence. Good practice is evidenced both by observed behaviour as also by core documents such as of memorandum of understanding, adopted policies, job descriptions, delegated authority schedules and management reports as well as by sustainable results.
Once-off activities are best managed through the discipline of project management; hence the importance to all organizations for their GoPM. GoPM is the framework within which

402 Chapter 43
projects are managed. The governance of any one particular project is therefore a specific subset of the GoPM, i.e., the governance of all the portfolio, programme and project management in an organization.
All changes in organizations are brought about through once–off activities. Competence in and capacity for change is increasingly recognized as a competitive advantage in the business world and a requirement in the public sector. Hence, the importance of GoPM is now widely appreciated as a key enabler for effective and sustainable performance. This significance is reinforced by the requirement for companies to issue strategic reports which in turn depend on governance of change initiatives lasting more than one year.
To assist directors and equivalents to ensure that good governance applies to project management throughout their enterprise, 13 principles can be identified. These are published by the Association for Project Management (APM) in ‘Directing change: A guide to governance of project management’. With the kind permission of APM, these principles are repeated below: 1. The Board has overall responsibility for the governance of project management. 2. The organization differentiates between projects and non project-based activities. 3. Roles and responsibilities for the governance of project management are defined clearly.
(For a particular project this should be enshrined in the project management plan.) 4. Disciplined governance arrangements, supported by appropriate cultures, methods,
resources and controls are applied throughout the project life cycle. Every project has a sponsor. (From conception to termination.)
5. There is a demonstrably coherent and supporting relationship between the project portfolio and the business strategy and policies, for example ethics and sustainability. (This should be part of the business case.)
6. All projects have an approved plan containing authorization points at which the business case, inclusive of cost, benefit and risk is reviewed. Decisions made at authorization points are recorded and communicated.
7. Members of delegated authorization bodies have sufficient representation, competence, authority and resources to enable them to make appropriate decisions. (These are normally covered in the composition, terms of reference and responsibilities of the individuals and committees.)
8. Project business cases are supported by relevant and realistic information that provides a reliable basis for making authorization decisions. (This is the basis of producing and maintaining the business case.)
9. The board or its delegated agents decide when independent scrutiny of projects or project management systems is required and implement such assurance accordingly.
10. There are clearly defined criteria for reporting project and for the escalation of risks and issues to the levels required by the organization. (These are set out in the project management plan.)
11. The organization fosters a culture of improvement and of frank internal disclosure of project information.

Governance 403
12. Project stakeholders are engaged at a level that is commensurate with their importance to the organization and in a manner that fosters trust.
13. Projects are closed when they are no longer justified as part of the organization’s portfolio.
The main components of portfolio, programme and project management which need to be examined to ensure compliance with these principles of good governance are: 1. Portfolio direction 2. Project sponsorship 3. Project management capability 4. Disclosure and reporting
Portfolio Direction
It must be confirmed that: • Theprojectportfolioanditsconstituentpartsarealignedwiththebusinessobjectivesof
the organization which cover profitability, reputation, customer service, sustainability, security and growth, and the impact of the various projects is acceptable to the ongoing operations of the organization.
• Thefinancialcontrolsincludingplanningandexpenditurereviewprocesses,areappliedto both the portfolio and to individual programmes and projects.
• Theorganizationdiscriminateseffectivelybetweenactivitiesrequiringprojectmanagementand other activities that should be managed as non-project operations. Priorities of projects in the portfolio are periodically reviewed to ensure that the mix meets the corporate strategy.
• Projectrisksareregularlyassessedtodeterminetheircombinedimpactontheorganizationas a whole.
• Theorganization’scapacityisconsistentwiththeprojectportfolio.• Thesponsoringorganizationandexternalstakeholderssuchassuppliers,customers,
backers, finance providers and regulators must be sufficiently engaged and involved to ensure a sustainable development of the organization as well as being aligned with project successes.
Project Sponsorship
To ensure that the governance is applied, it is essential that: • Allprojectshavecompetentsponsorswhorepresentthewholeorganizationandwhocan
make clear and timely decisions.• Sponsorsdevotesufficienttimetotheirprojectsfromconcepttocloseoutandfinal
hand-over.
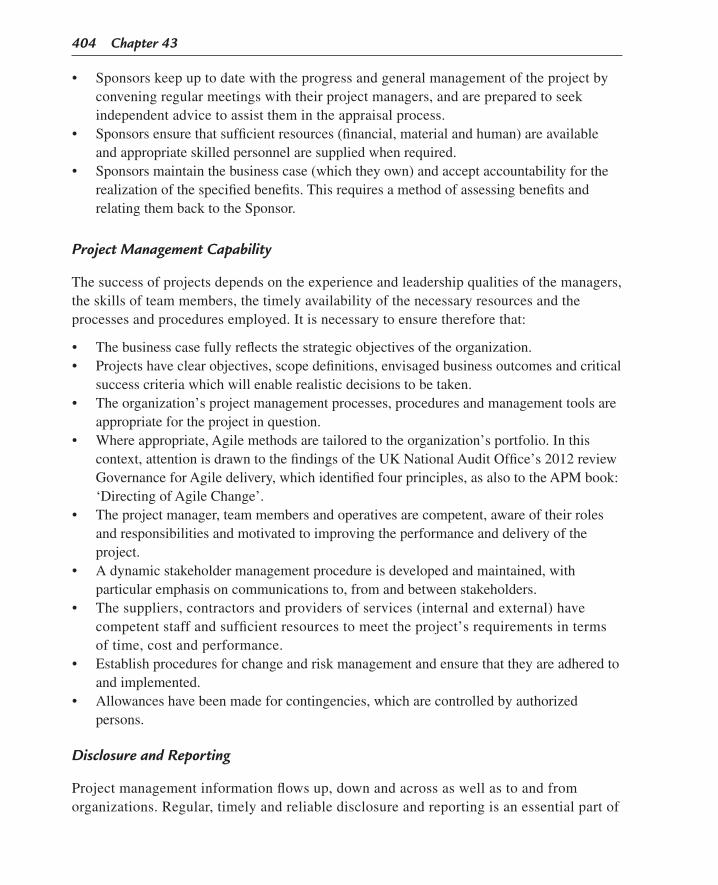
404 Chapter 43
• Sponsorskeepuptodatewiththeprogressandgeneralmanagementoftheprojectbyconvening regular meetings with their project managers, and are prepared to seek independent advice to assist them in the appraisal process.
• Sponsorsensurethatsufficientresources(financial,materialandhuman)areavailableand appropriate skilled personnel are supplied when required.
• Sponsorsmaintainthebusinesscase(whichtheyown)andacceptaccountabilityfortherealization of the specified benefits. This requires a method of assessing benefits and relating them back to the Sponsor.
Project Management Capability
The success of projects depends on the experience and leadership qualities of the managers, the skills of team members, the timely availability of the necessary resources and the processes and procedures employed. It is necessary to ensure therefore that: • Thebusinesscasefullyreflectsthestrategicobjectivesoftheorganization.• Projectshaveclearobjectives,scopedefinitions,envisagedbusinessoutcomesandcritical
success criteria which will enable realistic decisions to be taken.• Theorganization’sprojectmanagementprocesses,proceduresandmanagementtoolsare
appropriate for the project in question.• Whereappropriate,Agilemethodsaretailoredtotheorganization’sportfolio.Inthis
context, attention is drawn to the findings of the UK National Audit Office’s 2012 review Governance for Agile delivery, which identified four principles, as also to the APM book: ‘Directing of Agile Change’.
• Theprojectmanager,teammembersandoperativesarecompetent,awareoftheirrolesand responsibilities and motivated to improving the performance and delivery of the project.
• Adynamicstakeholdermanagementprocedureisdevelopedandmaintained,withparticular emphasis on communications to, from and between stakeholders.
• Thesuppliers,contractorsandprovidersofservices(internalandexternal)havecompetent staff and sufficient resources to meet the project’s requirements in terms of time, cost and performance.
• Establishproceduresforchangeandriskmanagementandensurethattheyareadheredtoand implemented.
• Allowanceshavebeenmadeforcontingencies,whicharecontrolledbyauthorizedpersons.
Disclosure and Reporting
Projectmanagementinformationflowsup,downandacrossaswellastoandfromorganizations. Regular, timely and reliable disclosure and reporting is an essential part of

Governance 405
good project management. Checks should be carried out to ensure that the reporting procedures comply with company policies.
Top-level reports on any project should cover: • Progress• Financialforecasts• Completionforecasts• Majorrisk-relatedissues• Majorqualityproblems• Overallperformanceproblems• Complianceordeviationswithkeyperformanceindicators• Anyindependentassurance
Periodic appraisal is recommended, by peer and/or external groups, of the complexity and valueofinformationflowsincludingreportstoensurethattheminimumeffortisexpendedtoproduce only the necessary information. It is relevant that under the UK Corporate Governance Code, companies should monitor their risk management and internal control systems and, at least annually, carry out a review of their effectiveness, and report on that review in the annual report.
The culture of the organization should encourage honest and open reports. It should not deter whistle blowers. The insights of Hirschman’s exit, voice and loyalty model should be applied to work for continual improvement.
Ethics
GoPM should require that project management complies with the sponsoring organization’s policies including that on ethics. It is therefore the duty of project management practitioners to be fully informed about their organization’s and their profession’s policies on ethics. As a good example, the UK National Audit Office includes in its own Code of Conduct the statement: That all those who are members or students of professional bodies must uphold the codes of ethics of those bodies in addition to their obligations under this Code.
The practice of openness and disclosure together with a basic trait of honesty will ensure that potential or actual corrupt practices are exposed and rejected. There are, however, contexts where such standards do not exist. Indeed, it may be difficult, if not impossible, to carry out business operations in certain countries unless ‘on-costs’, often called euphemistically mobilization costs, introduction fees or facilitation payments, are added to the contract sum. Such allowances are often added to the fees paid to the agent representing the organization in that country and that is the end of the matter as far as the company is concerned. Care must be taken in all cases to comply with the requirements of the UK Bribery Act 2010 or where applicable the US Foreign Corruption Practices Act 1977.

406 Chapter 43
Another difficulty to ethical application and monitoring of principles is where corporate control is confused due to complex arrangements made through tax havens where sources of finance, ruling regulations, effective ownership, interest and dividend payments are obscured. Such cases are increasingly common. Professionals should take care that they are operating within their codes of conduct, particularly with regard to the public interest. It is not sufficient to rely on the stewardship performance of institutional investors or on regulators.
On a more personal level, there is always the dilemma of how far one can go when giving or receiving seasonal gifts, entertaining clients or being entertained by suppliers. Perhaps the clearest answer to this question was given by a senior manager of a construction company to a project manager who asked for clarification as to what gifts are acceptable or permissible. The advice given was: ‘You can accept anything, provided you can carry it home in your stomach’. The National Audit Office’s Code of Conduct gives three pages of excellent guidance on this topic.
Evidence
With the increased focus on governance, second and third parties such as clients, investors, suppliers and regulators are looking for evidence of good governance. Some have developed scoring systems for the maturity of governance, inclusive of the governance of change. Difficulties must be recognized in this external scoring.
Governance arrangements for an organization should be tailored to its own needs. As found in the 2015 research sponsored by the UK Institute of Directors, it is unlikely that any standard scheme of measurement will usefully apply across organizations at different stages of development or in differing sectors and cultures. Difficulties arising in applying standard governance models especially where one organization does not have sole control of one or more projects.
Particular governance issues arise in the public sector, such as political direction, confidentiality constraints and the difficulty in applying professional codes of conduct. These require different treatment compared to that in the private sector as successfully demonstrated by the National Audit Office which commends an approach to gifts and hospitality based on three principles: purpose,proportionalityandavoidanceofconflictofinterest.
The evidence is mixed as to whether organizations that score higher on objective governance schemes perform better for stakeholders. Some sectoral studies, such as in the oil and gas sector, show a positive relationship, but some wider studies do not. Nevertheless, the 2014 qualitative research by APM found that effective governance was one of the top three factors in project success. However, there is anecdotal evidence from highly successful technology companies such as Apple and Google that the best judges of appropriate governance are their own leaders rather than third party standard setters.

Governance 407
The quality of applied governance is also difficult to measure. The reality is that dynamic governance decisions can be made under stress and subject to group dynamics that are not recorded. Assurance schemes too often rely entirely on verifiable documented evidence. These capture only a part of the significant reality, such as in the case of Royal Bank of Scotland in UK in 2007 where excellence in reported governance compliance preceded a major crisis which was subsequently attributed to ‘a real failure in corporate governance’ including inappropriate behaviour.
Conclusion
Too many projects fail not because of poor project management, but because the project’s governance regime and application is poorly developed, not integrated into the wider governance of the organization and therefore damaging. Implementing the principles above through the four components described with the proper ethical approach will go a long way to ensure the reliable delivery of projects contributing to sustainable organizational success. A conditional questioning approach is preferred to any one standard.
Further Reading
APM. (2016). Directing change, a guide to governance of project management.Carver, J., & Mayhew Carver, M. (2009). The policy governance model & role of the board member. Jossey Boss.Leblanc, R. (2016). A handbook of board governance. John Wiley.Lock, D. (2013). Gower book of people in project management. Gower.Ludovino, E. M. (2016). Change management. EM Press Ltd.Muller, R. (2009). Project governance. Gower.Crane, A., & Matten, D. (2010). Business ethics (3rd ed.). Oxford University Press.Taylor, P. (2016). The social project manager. Routledge.Trevino, L., & Nelsom, K. (2010). Managing business ethics (5th ed.). Wiley.

This page intentionally left blank

409Project Management, Planning and Control. http://dx.doi.org/10.1016/B978-0-08-102020-3.00044-9Copyright © 2017 Elsevier Ltd. All rights reserved.
CHAPTER 44
Project Close-Out and Handover
Chapter OutlineClose-Out 409Handover 411
Close-Out
Most projects involving construction or installation work include a commissioning stage during which the specified performance tests and operating trials are carried out with the objective of proving to the client that the deliverables are as specified and conform to the required performance criteria. The snagging process, which should have taken place immediately prior to the start of commissioning, often overlaps the commissioning stage so that adjustments and even minor modifications may be necessary. Commissioning is often carried out with the assistance of the client’s operatives, to ensure that the person who runs the plant or system learns how to operate the controls and make necessary adjustments. This is as true for a computer installation as a power station.
On more complex projects, it may be necessary to run special training and familiarization programmes for clients’ staff and operatives, in both workplace and classrooms.
When the project is complete and all the deliverables are tested and approved, the project must be officially closed out. This involves a number of checks to be made and documents to be completed to ensure that there is no ‘drip’ of man-hours being booked against the project. Unless an official, dated close-out instruction is issued to all members of the project team, there is always a risk of time and money being expended on additional work not originally envisaged. Even where the work was envisaged, there is the possibility of work being dragged out because no firm cut-off date has been imposed.
All contracts (and subcontracts) must be properly closed out and (if possible) all claims and back charges (including liquidated damages) agreed and settled.
A few unpopular, but necessary, tasks prior to commissioning are collation, indexing and binding of all the operating and maintenance manuals, drawings, test certificates, lubrication schedules, guarantees and priced spare lists that should have been collected and stored during the course of the project. Whether this documentation is in electronic format or hard

410 Chapter 44
copy, the process is the same. Indeed some client organizations require both, and the cost of preparing this documentation is often underestimated.
Many of these documents obtained and collated during various phases of the project have to be bound and handed over to the client enabling the plant or systems to be operated and maintained. It goes without saying that all these documents have to be checked and updated to reflect the latest version and as-built condition.
The following list gives some of the documents that fall into this category: • Stageacceptancecertificates.• Finalhandovercertificate.• Operatinginstructionsinelectronicorhardcopyformatorboth.• Maintenanceinstructionsormanuals.• Alistofoperationalandstrategicspareswithcurrentpricelistsandanticipateddelivery
periods as obtained from the individual suppliers. These are divided into operating and strategic spares.
• Lubricationschedules.• Quality-controlrecordsandaudittrails.• Materialtestcertificatesincludingconfirmationofsuccessfultestingofoperatives’
(especially welders’) test certificates and performance test results.• Radiographyandothernon-destructivetesting(NDT)records.• Adossierofthevariousequipment,materialandsystemguaranteesandwarranties.• Equipmenttestandperformancecertificates.
On completion, the site must be cleared; all temporary buildings, structures and fences have to be removed and access roads must be made good.
Arrangements should be made to dispose unused equipment or surplus materials. These may be sold to the client at a discounted rate or stored for use on another project. However, certain materials, such as valves, instruments and even certain piping and cables, cannot be used on other jobs unless the specified test certificates and certificates of origin are literally wired to the item being stored. Materials that do not fall into these categories will have to be sold for scrap and the proceeds credited to the project.
Project managers who want to appreciate their team may decide to use this money for a closing-down party. The team will now have to be disbanded, a process that is the ‘mourning’ stage of the Tuckman team phases. On large projects that required the team to work together for many months or years, the close-out can be a terrible anticlimax and the human aspect must be handled diplomatically and sympathetically.

Project Close-Out and Handover 411
Handover
The formal handover involves an exchange of documents, which confirm that the project has been completed by the contractor or supplier and accepted by the client. These documents, which include the signed acceptance certificate, will enable the contractor to submit his final payment certificate, subject to agreed retentions. If a retention bond has been accepted by the client, payment has to be made in full.

This page intentionally left blank

413Project Management, Planning and Control. http://dx.doi.org/10.1016/B978-0-08-102020-3.00045-0Copyright © 2017 Elsevier Ltd. All rights reserved.
CHAPTER 45
Project Close-Out Report and Review
Chapter OutlineClose-Out Report 413Close-Out Review 414
Close-Out Report
Currently, most organizations require the project manager to produce a close-out report at the end of the project. This is often regarded by some project managers as a time-consuming chore, as in many cases the project manager would already have been earmarked for a new project which he or she is keen to start as soon as possible.
Provided a reasonably detailed project diary has been kept by the project manager throughout the various stages of the project, the task of producing a close-out report is not as onerous as it would appear. Certainly if the project included a site construction stage, the site manager’s diary, which is in most companies an obligatory document, will yield a mass of useful data for incorporation in the close-out report. The information given in the report should cover not only what went wrong and why, but also the successes and achievements in overcoming any particularly interesting problem.
The following is a list of some of the topics that should be included in a close-out report: • Degreetowhichtheoriginalobjectiveshavebeenmet• Degreeofcompliancewiththeprojectbrief(businesscase)• DegreetowhichtheoriginalKPIshavebeenachieved• Levelofsatisfactionexpressedbyclientorsponsor• Comparisonbetweenoriginal(budgeted)costandactualfinalcost• Reasonsforcostoverruns(ifany)• Majorchangesincorporateddueto: • Client’s approved requirements • Internalmodificationscausedbyerrorsoromissions • Otherpossiblereasons(statutory,environmental,legal,health,andsafety,etc.)• Comparisonbetweenoriginalprojecttimeandactualtotaltimeexpended• Reasonsfortimeoverrunsorunderruns• Majordelaysandthecausesofthesedelays

414 Chapter 45
• Specialactionstakentoreduceormitigateparticulardelays• Importantorinterestingornovelmethodsadoptedtoimproveperformance• Performanceandattitudeofprojectteammembersingeneralandsomeinparticular• Performanceofconsultantsandspecialadvisers• Performanceofcontractors,subcontractors,andsuppliers• Attitudeandbehaviourofclient’sprojectmanager(iftherewasone)• Attitudeandbehaviourofclient’sstaffandemployees• Commentsontheeffectivenessofthecontractdocuments• Commentsontheclarityorotherwiseofspecifications,datasheets,orotherdocuments• Recommendationsforactionsonfuturesimilarprojects• Recommendationsforfuturedocumentationtocloseloopholes• Commentsonthepreparationandapplication/operationofmajorprojectmanagement
toolssuchasCPA,EVA,anddatagathering/processing
The report will be sent to the relevant stakeholders and discussed at a formal close-out meetingatwhichthestakeholderswillbeabletoexpresstheirviewsonthesuccess(orotherwise)oftheproject.Attheendofthismeetingtheprojectcanbeconsideredtobeformally closed.
Close-Out Review
Usingtheclose-outreportasabasis,thefinaltaskoftheprojectmanageristocarryoutapost-projectreview(orapost-implementationreview),whichshouldcoverashorthistoryofthe project and an analysis of the successes and failures together with a description of how these failures were handled.
The review will also discuss the performance of the project team and the contributions (positiveandnegative)oftheotherstakeholders.Allthisinformationcanthenbeexaminedbyfutureprojectmanagersemployedonsimilarprojectsorworkingwiththesameclient/stakeholders,sothattheycanbemadeawareofthedifficultiesandissuesencounteredandensure(asfarasispracticable)thatthesameproblemsdonotarise.Learningfrom previousmistakesisanaturalprocessdevelopedfromchildhood.Evenmorebeneficialandcertainlywiderreaching,islearningfromotherpeople’smistakes.Forexample,whereanewprojectmanagerfindsthathehastodealwithpeople,eitherintheclient’sor contractor’scamps,whoweredescribedas‘difficult’inapreviousclose-outreport,heorsheshouldcontactthepreviousprojectmanagerandfindoutthebestwaysof‘handling’these people.
For this reason the close-out review, together with the more formal close-out report, has to be properlyindexedandarchivedinhardcopyorelectronicformatforeasyretrieval.
The motto is: ‘Forewarned is Forearmed’.

415Project Management, Planning and Control. http://dx.doi.org/10.1016/B978-0-08-102020-3.00046-2Copyright © 2017 Elsevier Ltd. All rights reserved.
CHAPTER 46
Stages and Sequence
Chapter OutlineSummary of Project Stages and Sequence 415
Summary of Project Stages and Sequence
The following are the stages and sequences in diagrammatic and tabular format: 1. Fig. 46.1 shows the normal sequence of controls of a project from business case to
close-out. 2. Fig. 46.2 provides a diagrammatic version of the control techniques for the different
project stages. 3. Fig. 46.3 is a hierarchical version of the project sequence, which also shows the chapter
numbers in the book where the relevant stage or technique is discussed. 4. Table 46.1 is a detailed tabular breakdown of the sequence for a project control system,
again from business case to project close-out.
While the diagrams cover most types of projects, it must be understood that projects vary enormously in scope, size and complexity. The sequences and techniques given may therefore have to be changed to suit any particular project. Indeed certain techniques may not be applicable in their entirety or may have to be modified to suit different requirements. The
principles are, however, fundamentally the same.

416 Chapter 46
Figure 46.1Project sequence.

Stages and Sequence 417
Figure 46.2Control techniques.

418 Chapter 46
Business case
Investment appraisal (2)
Budget
Project life cycle (4)
WBS (5)
CPM (11)
Gantt chart (16)
Milestones/slip chart (16)
Resource histogram (25)
Cumulative ‘S’ curve (25)
Cost/EVA (27)
Comparative curves (27)
Cash flow (26)
Cash in & out curves (26)
Close-out report (32)
Cost/benefit analysis DCF/NPV (2)
Objectives Phases (4)Stages (4)
Structure Matrix/task force
Risk (8)
Risk plan (8)
Risk register (8)
PMP (7)
Configuration (10)
Change control (10)
Change forms (10)
Dist. schedule
OBS (5)
Organogram (5)
Responsibility matrix (5)
PBS (5) CBS (5) QA (9)
Estimates (6) Qual. plan (9)
Time sheets (27)
Computer analysis (17)
Line of balance (16)
Number in parentheses ( )indicates chapter number.
Figure 46.3Detailed project sequence.
Table 46.1: Sequence for project control system.
Business caseCost/benefit analysis
Set objectivesDCF calculations
Establish project life cycleEstablish project phases
Produce project management planProduce budget (labour, plant, materials, overheads, etc.)
Draw work breakdown structureDraw product breakdown structure
Draw organization breakdown structureDraw responsibility matrix
List all possible risksCarry out risk analysis
Draw up risk management planProduce risk register

Stages and Sequence 419
Draw up activity listDraw network logic (freehand)
Add activity durationsCalculate forward pass
Revise logic (maximize parallel activities)Calculate second forward pass
Revise activity durationsCalculate third forward pass
Calculate backward passMark critical path (zero float)
Draw final network on grid systemAdd activity numbers
Draw bar chart (Gantt chart)Draw milestone slip chart
Produce resource tableAdd resources to bar chart
Aggregate resourcesDraw histogram
Smooth resources (utilize float)Draw cumulative ‘S’ curve (to be used for EVA)
List activities in numerical orderAdd budget values (person hours)
Record weekly actual hours (direct and indirect)Record weekly % complete (in 5% steps)
Calculate value hours weeklyCalculate overall % complete weeklyCalculate overall efficiency weekly
Calculate anticipated final hours weeklyDraw time/person hour curves (budget, planned, actual, value, anticipated final)
Draw time/% curves (% planned, % complete, % efficiency)Analyse curves
Take appropriate management actionCalculate cost per activity (labour, plant, materials)
Add costs to bar chart activitiesAggregate costs
Draw curve for plant and material costs (outflow)Draw curve for total cash OUT (this includes labour costs)
Draw curve for total cash INAnalyse curves
Calculate overdraft requirementsSet up information distribution system
Set up weekly monitoring and recording systemSet up system for recording and assessing changes and extra work
Set up reporting systemManage risks
Set up regular progress meetingsWrite close-out report
Close-out review
Table 46.1: Sequence for project control system.—cont’d

This page intentionally left blank

421Project Management, Planning and Control. http://dx.doi.org/10.1016/B978-0-08-102020-3.00047-4Copyright © 2017 Elsevier Ltd. All rights reserved.
CHAPTER 47
Worked Example 1: Bungalow
Chapter OutlineDesign and Construction Philosophy 421
The previous chapters described various methods and techniques developed to produce meaningful and practical network programmes. In this chapter, most of these techniques are combined in two fully worked examples. One is mainly of a civil engineering and building nature and the other is concerned with mechanical erection – both are practical and could be applied to real situations.
The first example covers the planning, man-hour control and cost control of a construction project of a bungalow. Before any planning work is started, it is advantageous to write down the salient parameters of the design and construction, or what is grandly called the ‘design and construction philosophy’. This ensures that everyone who participates in the project knows not only what has to be done, but why it is being done in a particular way. Indeed, if the design and construction philosophy is circulated before the programme, time- and cost-saving suggestions may well be volunteered by some recipients which, if acceptable, can be incorporated into the final plan.
Design and Construction Philosophy 1. The bungalow is constructed on strip footings. 2. External walls are in two skins of brick with a cavity. Internal partitions are in plaster-
board on timber studding. 3. The floor is suspended on brick piers on an oversite concrete slab. Floorboards are T & G
pine. 4. The roof is tiled on timber-trussed rafters with external gutters. 5. Internal finish is plaster on brick finished with emulsion paint. 6. Construction is by direct labour specially hired for the purpose. This includes specialist
trades such as electrics and plumbing. 7. The work is financed by a bank loan, which is paid four-weekly on the basis of a regular
site measure. 8. Labour is paid weekly. Suppliers and plant hires are paid 4 weeks after delivery. Materials
and plant must be ordered 2 weeks before site requirement.

422 Chapter 47
9. The average labour rate is £5 per hour or £250 per week for a 50-hour working week. This covers labourers and tradesmen.
10. The cross-section of the bungalow is shown in Fig. 47.1 and the sequence of activities is set out in Table 47.1, which shows the dependencies of each activity. All durations are in weeks. The network in Fig. 47.2 is in activity on arrow (AoA) format and the equivalent network in activity on node (AoN) format is shown in Fig. 47.3.
The activity letters refer to the activities shown on the cross-section diagram of Fig. 47.1, and on subsequent tables only these activity letters will be used. The total float column can, of course, only be completed when the network shown in Fig. 47.2 has been analysed (see Table 47.1).
Table 47.2 shows the complete analysis of the network including TLe (latest time end event), TEe (earliest time beginning event), total float and free float. It will be noted that none of the activities have free float. As mentioned in Chapter 21, free float is often confined to the dummy activities, which have been omitted from the table.
Ground clearing
Figure 47.1Bungalow (six rooms).
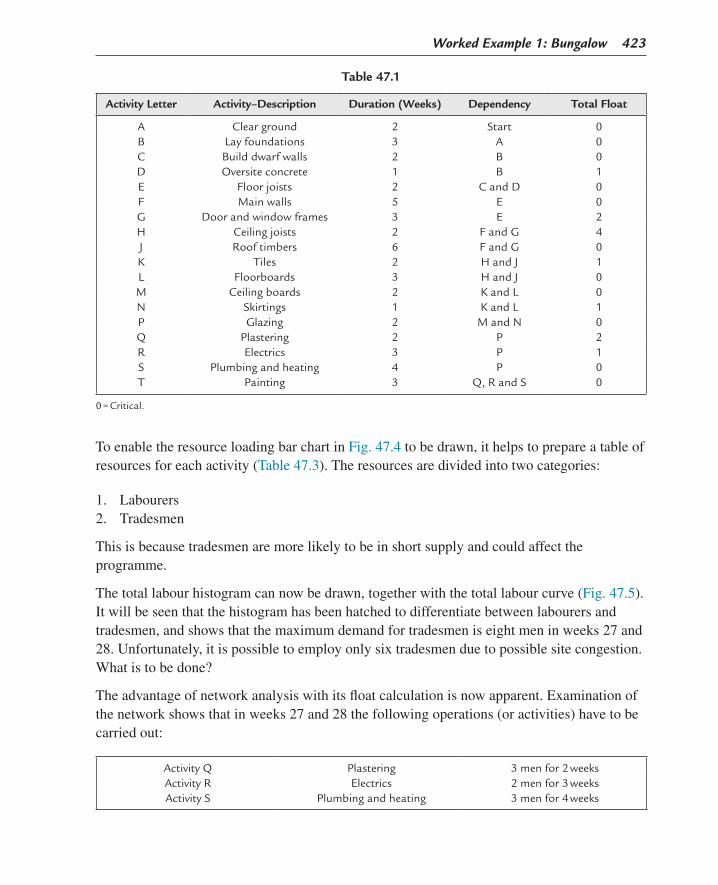
Worked Example 1: Bungalow 423
To enable the resource loading bar chart in Fig. 47.4 to be drawn, it helps to prepare a table of resources for each activity (Table 47.3). The resources are divided into two categories: 1. Labourers 2. Tradesmen
This is because tradesmen are more likely to be in short supply and could affect the programme.
The total labour histogram can now be drawn, together with the total labour curve (Fig. 47.5). It will be seen that the histogram has been hatched to differentiate between labourers and tradesmen, and shows that the maximum demand for tradesmen is eight men in weeks 27 and 28. Unfortunately, it is possible to employ only six tradesmen due to possible site congestion. What is to be done?
The advantage of network analysis with its float calculation is now apparent. Examination of the network shows that in weeks 27 and 28 the following operations (or activities) have to be carried out:
Activity Q Plastering 3 men for 2 weeksActivity R Electrics 2 men for 3 weeksActivity S Plumbing and heating 3 men for 4 weeks
Table 47.1
Activity Letter Activity–Description Duration (Weeks) Dependency Total Float
A Clear ground 2 Start 0B Lay foundations 3 A 0C Build dwarf walls 2 B 0D Oversite concrete 1 B 1E Floor joists 2 C and D 0F Main walls 5 E 0G Door and window frames 3 E 2H Ceiling joists 2 F and G 4J Roof timbers 6 F and G 0K Tiles 2 H and J 1L Floorboards 3 H and J 0M Ceiling boards 2 K and L 0N Skirtings 1 K and L 1P Glazing 2 M and N 0Q Plastering 2 P 2R Electrics 3 P 1S Plumbing and heating 4 P 0T Painting 3 Q, R and S 0
0 = Critical.

424 C
hapter 47
7
26
25
23
9
27
15
5
24
22
12 17 19 20
6
14
Forward pass
Backward pass
18
10
16
3
21
11
4
13
8
21E
S
F
T
C
R
H P QMK
D
J NL
G
BA
2
4
5
3
2
3
2 2 222
1
6 13
3
32
9
31
31
29
14
34
22
7
30
27
16 25 25 27
6
20 24
1412
23
5
27
14
5
14
9
20
9
31
31
31
14
34
23
7
31
27
2025 25
27
7
20 25
14
23
5
27
14
6
14
11
20
Figure 47.2Network of bungalow (duration in weeks).

Worked Example 1: Bungalow 425
The first step is to check which activities have floats. Consulting Table 47.2 reveals that Q (plastering) has 2 weeks float and R (electrics) has 1 week float. By delaying Q (plastering) by 2 weeks and accelerating R (electrics) to be carried out in 2 weeks by 3 men per week, the maximum total in any week is reduced to 6. Alternatively, it may be possible to extend Q (plumbing) to 4 weeks using 2 men per week for the first 2 weeks and 1 man per week for the next 2 weeks. At the same time, R (electrics) can be extended by 1 week by employing 1 man per week for the first 2 weeks, and 2 men per week for the next 2 weeks. Again, the maximum total for weeks 27–31 is 6 tradesmen.
The new partial disposition of resources and revised histograms after the two alternative smoothing operations are shown in Figs 47.6 and 47.7. It will be noted that: 1. The overall programme duration has not been exceeded because the extra durations have
been absorbed by the float. 2. The total number of man weeks of any trade has not changed, i.e., Q (plastering) still has
6 man weeks and R (electrics) still has 6 man weeks.
If it is not possible to obtain the necessary smoothing by utilizing and absorbing floats, the network logic may be amended, but this requires a careful reconsideration of the whole construction process.
The next operation is to use the EVA system to control the work on site. Multiplying for each activity, the number of weeks required to do the work by the number of men employed yields the number of man weeks. If this is multiplied by 50 (the average number of working hours in a week), the man-hours per activity can be obtained. A table can now be drawn up listing the activities, durations, number of men and budget hours (Table 47.4).
0 2
A2
00 2
2 5
B3
02 5
5 7
C2
05 7
5 6
D1
16 7
23ES
LS
ACTDUR’N
LFT.FLOAT
E.F25
K2
221 23
9 12
G3
211 14
14 20
J6
014 20
20 22
K2
121 23
23 25
M2
023 25
25 27
P2
025 27
27 30
R3
028 31
27 31
S4
027 31
31 34
T3
031 34
7 9
E2
07 9
9
F5
09 14
14 14
H2
218 20
16 20
L3
020 23
23 23
N1
124 25
24 27
Q2
229 31
29
Figure 47.3Network diagram of bungalow AoN format.

426 C
hapter 47Table 47.2
a b c d e F g h
Activity Letter Node No. Duration TLe TEe TEb
d-f-c Total Float e-f-c Free Float
A 1–2 2 2 2 0 0 0B 2–3 3 5 5 2 0 0C 3–5 2 7 7 5 0 0D 4–6 1 7 6 5 1 0E 5–7 2 9 9 7 0 0F 7–9 5 14 14 9 0 0G 8–10 3 14 12 9 2 0H 11–12 2 20 16 14 4 0J 13–14 6 20 20 14 0 0K 14–15 2 23 22 20 1 0L 14–16 3 23 23 20 0 0M 16–17 2 25 25 23 0 0N 16–18 1 25 24 23 1 0P 19–20 2 27 27 25 0 0Q 21–23 2 31 29 27 2 0R 21–24 3 31 30 27 1 0S 22–25 4 31 31 27 0 0T 26–27 3 34 34 31 0 0

Worked Example 1: Bungalow 427
Table 47.3: Labour resources per week.
Activity Letter
Resource A Labourers
Resource B Tradesmen Total
A 6 6B 4 2 6C 2 4 6D 4 – 4E – 2 2F 2 4 6G – 2 2H – 2 2J – 2 2K 2 3 5L – 2 2M – 2 2N – 2 2P – 2 2Q 1 3 4R – 2 2S 1 3 4T – 4 4
Figure 47.4Resource loaded bar chat.
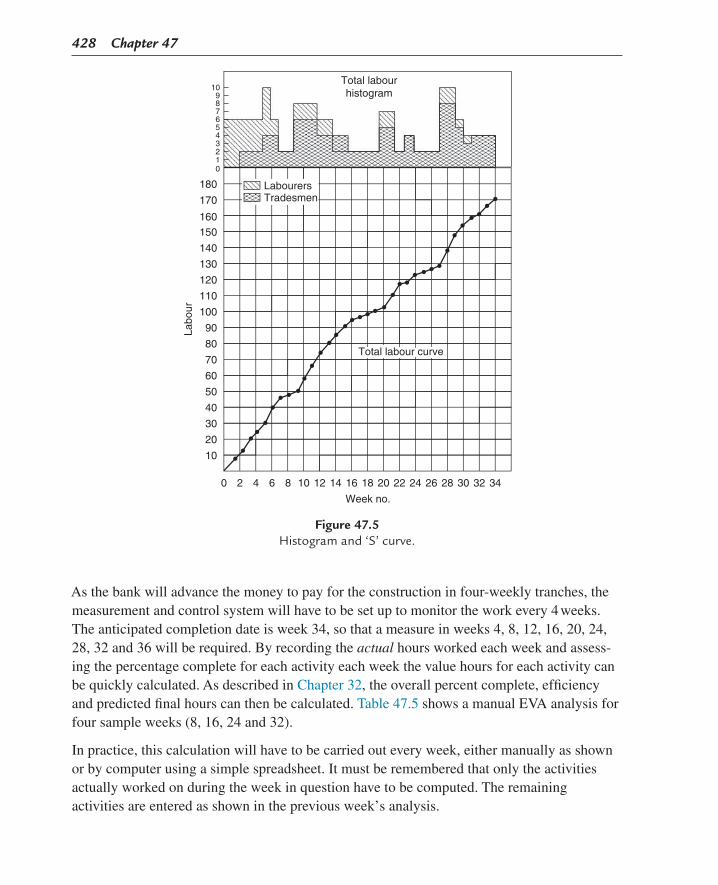
428 Chapter 47
As the bank will advance the money to pay for the construction in four-weekly tranches, the measurement and control system will have to be set up to monitor the work every 4 weeks. The anticipated completion date is week 34, so that a measure in weeks 4, 8, 12, 16, 20, 24, 28, 32 and 36 will be required. By recording the actual hours worked each week and assess-ing the percentage complete for each activity each week the value hours for each activity can be quickly calculated. As described in Chapter 32, the overall percent complete, efficiency and predicted final hours can then be calculated. Table 47.5 shows a manual EVA analysis for four sample weeks (8, 16, 24 and 32).
In practice, this calculation will have to be carried out every week, either manually as shown or by computer using a simple spreadsheet. It must be remembered that only the activities actually worked on during the week in question have to be computed. The remaining activities are entered as shown in the previous week’s analysis.
170
180
0123456789
10
160150
140
130
120
110
100
90
80
70
60
50
40
30
20
10
0 2 4 6 8 10 12 14 16 18
Week no.
Labo
ur
20 22 24 26 28 30 32 34
Total labourhistogram
Total labour curve
LabourersTradesmen
Figure 47.5Histogram and ‘S’ curve.

Worked Example 1: Bungalow 429
Figure 47.6Resource smoothing ‘A’.
Figure 47.7Resource smoothing ‘B’.

430 Chapter 47
For purposes of progress payments, the value hours for every 4-week period must be multiplied by the average labour rate (£5 per hour) and when added to the material and plant costs, the total value for payment purposes is obtained. This is shown later in this chapter.
At this stage it is more important to control the job, and for this to be done effectively, a set of curves must be drawn on a time base to enable the various parameters to be compared. The relationship between the actual hours and value hours gives a measure of the efficiency of the work, while that between the value hours and planned hours gives a measure of progress. The actual and value hours are plotted straight from the EVA analysis, but the planned hours must be obtained from the labour expenditure curve (Fig. 47.5) and multiplying the labour value (in men) by 50 (the number of working hours per week). For example, in week 16, the total labour used to date is 94 man weeks, giving 94 × 50 = 4700 man-hours.
The complete set of curves (including the efficiency and percent complete curves) is shown in Fig. 47.8. In practice, it may be more convenient to draw the last two curves on a separate sheet, but provided the percentage scale is drawn on the opposite side to the man-hour scale; no confusion should arise. Again, a computer program can be written to plot these curves on a weekly basis as shown in Chapter 32.
Table 47.4
a b c d
Activity LetterDuration (Weeks) No. of Men
b × c × 50 Budget Hours
A 2 6 600B 3 6 900C 2 6 600D 1 4 200E 2 2 200F 5 6 1500G 3 2 300H 2 2 200J 6 2 600K 2 5 500L 3 2 300M 2 2 200N 1 2 100P 2 2 200Q 2 4 400R 3 2 300S 4 4 800T 3 4 600
Total 8500

Worked Exam
ple 1: Bungalow
431
Table 47.5
Period Week 8 Week 16 Week 24 Week 32
BudgetActual Cum. % V
Actual Cum. % V
Actual Cum. % V
Actual Cum. % V
A 600 600 100 600 600 100 600 600 100 600 600 100 600B 900 800 100 900 800 100 900 800 100 900 800 100 900C 600 550 100 600 550 100 600 550 100 600 550 100 600D 200 220 90 180 240 100 200 240 100 200 240 100 200E 200 110 40 80 180 100 200 180 100 200 180 100 200F 1500 – – – 1200 80 1200 1550 100 1500 1550 100 1500G 300 – – – 300 100 300 300 100 300 300 100 300H 200 – – – 180 60 120 240 100 200 240 100 200J 600 – – – 400 50 300 750 100 600 750 100 600K 500 – – – – – – 500 100 500 550 100 500L 300 – – – – – – 250 80 240 310 100 300M 200 – – – – – – 100 60 120 180 100 200N 100 – – – – – – 50 40 40 110 100 100P 200 – – – – – – – – – 220 100 200Q 400 – – – – – – – – – 480 100 400R 300 – – – – – – – – – 160 60 180S 800 – – – – – – – – – 600 80 640T 600 – – – – – – – – – 100 10 60
Total 8500 2280 27.8 2360 4450 52 4420 6110 70.6 6000 7920 90.4 7680Efficiency 103 99 98 96
Estimated final hours
8201 8557 8654 8761

432 Chapter 47
Once the control system has been set up, it is essential to draw up the cash flow curve to ascertain what additional funding arrangements are required over the life of the project. In most cases where project financing is required, the cash flow curve will give an indication of how much will have to be obtained from the finance house or bank and when. In the case of this example, where the construction is financed by bank advances related to site progress, it is still necessary to check that the payments will, in fact, cover the outgoings. It can be seen from the curve in Fig. 47.10 that virtually permanent overdraft arrangements will have to be made to enable the men and suppliers to be paid regularly.
When considering cash flow, it is useful to produce a table showing the relationship between the usage of a resource, the payment date and the receipt of cash from the bank to pay for it – even retrospectively. It can be seen in Table 47.6 that 1. Materials have to be ordered 4 weeks before use. 2. Materials have to be delivered 1 week before use. 3. Materials are paid for 4 weeks after delivery. 4. Labour is paid in the same week of use. 5. Measurements are made 3 weeks after use. 6. Payment is made 1 week after measurement.
Figure 47.8Control curves.
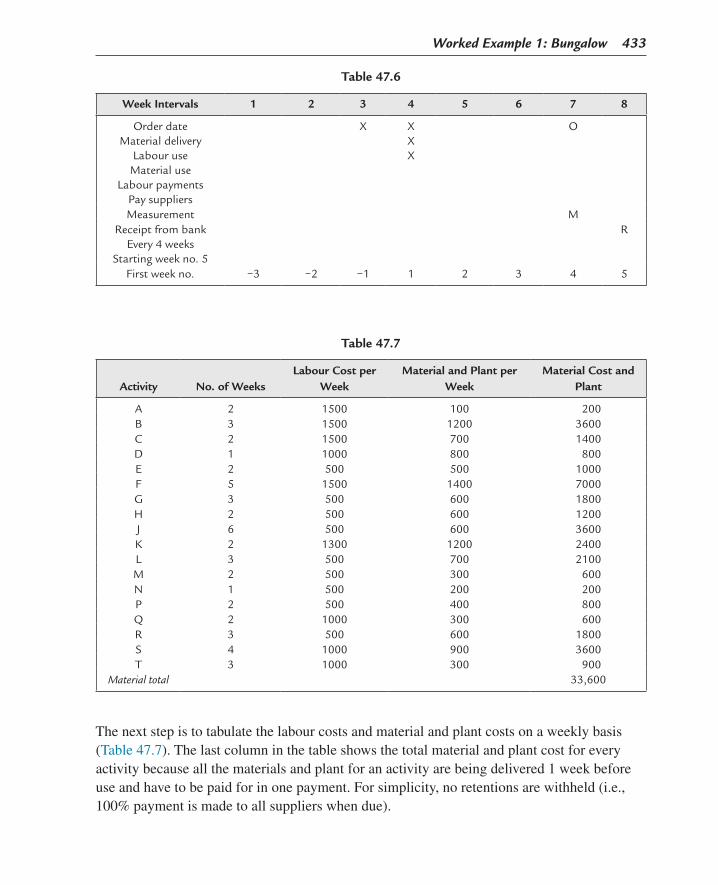
Worked Example 1: Bungalow 433
Table 47.6
Week Intervals 1 2 3 4 5 6 7 8
Order dateMaterial delivery
Labour useMaterial use
Labour paymentsPay suppliers
X XXX
O
Measurement MReceipt from bank
Every 4 weeksStarting week no. 5
R
First week no. −3 −2 −1 1 2 3 4 5
The next step is to tabulate the labour costs and material and plant costs on a weekly basis (Table 47.7). The last column in the table shows the total material and plant cost for every activity because all the materials and plant for an activity are being delivered 1 week before use and have to be paid for in one payment. For simplicity, no retentions are withheld (i.e., 100% payment is made to all suppliers when due).
Table 47.7
Activity No. of WeeksLabour Cost per
WeekMaterial and Plant per
WeekMaterial Cost and
Plant
A 2 1500 100 200B 3 1500 1200 3600C 2 1500 700 1400D 1 1000 800 800E 2 500 500 1000F 5 1500 1400 7000G 3 500 600 1800H 2 500 600 1200J 6 500 600 3600K 2 1300 1200 2400L 3 500 700 2100M 2 500 300 600N 1 500 200 200P 2 500 400 800Q 2 1000 300 600R 3 500 600 1800S 4 1000 900 3600T 3 1000 300 900
Material total 33,600

434 C
hapter 47
Figure 47.9Resource bar chart.

Worked Example 1: Bungalow 435
A bar chart (Fig. 47.9) can now be produced, which is similar to that shown in Fig. 47.4. The main difference is that instead of drawing bars, the length of the activity is represented by the weekly resource. As there are two types of resources – men and materials and plant – each activity is represented by two lines. The top line represents the labour cost in £100 units and the lower line the material and plant cost in £100 units. When the chart is completed, the resources are added vertically for each week to give a weekly total of labour out (i.e., men being paid, line 1) and material and plant out (line 2). The total cash out and the cumulative outflow values can now be added in lines 3 and 4, respectively.
The chart also shows the measurements every 4 weeks, starting in week 4 (line 5), and the payments 1 week later. The cumulative total cash is shown in line 6. To enable the outflow of materials and plant to be shown separately on the graph in Fig. 47.10, it was necessary to enter the cumulative outflow for material and plant in row 7. This figure shows the cash flow curves (i.e., cash in and cash out). The need for a more-or-less permanent overdraft of approx-imately £10,000 is apparent.
Figure 47.10Cash flow curves.

This page intentionally left blank

437Project Management, Planning and Control. http://dx.doi.org/10.1016/B978-0-08-102020-3.00048-6Copyright © 2017 Elsevier Ltd. All rights reserved.
CHAPTER 48
Worked Example 2: Pumping Installation
Design and Construction Philosophy 1. A 3-tonne vessel arrives on-site complete with nozzles and manhole doors in place. 2. Pipe gantry and vessel support steel arrive in small pieces. 3. Pumps, motors and bedplates arrive as separate units. 4. Stairs arrive in sections with treads fitted to a pair of stringers. 5. Suction and discharge headers are partially fabricated with weldolet tees in place. Slip-on
flanges to be welded on site for valves, vessel connection and blanked-off ends. 6. Suction and discharge lines from pumps to have slip-on flanges welded on site after
trimming to length. 7. Drive, couplings to be fitted before fitting of pipes to pumps, but not aligned. 8. Hydro test to be carried out in one stage, hydro pump connection at discharge header end
and vent at the top of vessel. Pumps have drain points. 9. Resource restraints require Sections A and B of suction, and discharge headers to be
erected in series. 10. Suction to pumps is prefabricated on site from slip-on flange at valve to field weld at
high-level bend. 11. Discharge from pumps is prefabricated on site from slip-on flange at valve to field weld
on high-level horizontal run. 12. Final motor coupling alignment to be carried out after hydro test in case pipes have to be
re-welded and aligned after test. 13. Only pumps no. 1 and 2 will be installed.
In this example, it is necessary to produce a material take-off from the layout drawings so that the erection man-hours can be calculated. The man-hours can then be translated into man days and, by assessing the number of men required per activity, into activity durations. The man-hour assessment is, of course, made in the conventional manner by multiplying the operational units, such as numbers of welds or tonnes of steel, by the man-hour norms used by the construction organization. In this exercise, the norms used are those published by the
Chapter OutlineDesign and Construction Philosophy 437Cash Flow 442

438 Chapter 48
OCPCA (Oil and Chemical Plant Contractors Association). These are the base norms that may or may not be factorized to take account of market, environmental, geographical or political conditions of the area in which the work is carried out. It is obvious that the rate for erecting a tonne of steel in the UK is different from erecting it in the wilds of Alaska.
The sequence of operations for producing a network programme and EVA analysis is as follows: 1. Study layout drawing or piping isometric drawings (Fig. 48.1). 2. Draw a construction network. Note that at this stage, it is only possible to draw the logic
sequences (Fig. 48.2) and allocate activity numbers. 3. From the layout drawing, prepare a take-off of all the erection elements, such as number
of welds, number of flanges, weight of steel, number of pumps. 4. Tabulate these quantities on an estimate sheet (Fig. 48.3) and multiply these by the
OCPCA norms given in Table 48.1 to give the man-hours per operation. 5. Decide which operations are required to make up an activity on a network and list these
in a table. This enables the man-hours per activity to be obtained.
Figure 48.1Isometric drawing. FW, field weld; BW, butt weld; SO, slip-on.
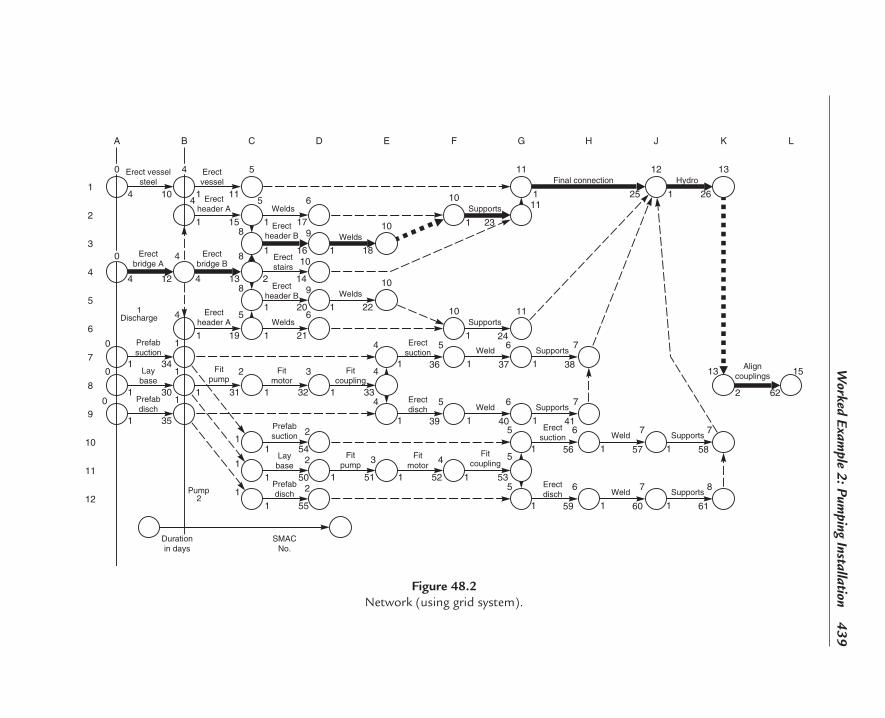
Worked Exam
ple 2: Pumping Installation
439
Welds
Welds
Fitcoupling
Fitcoupling
Welds
Erectheader B
Erectstairs
Erectheader B
Welds
Fitmotor
Fitmotor
Final connection
Supports
Supports
Supports
Supports
Erectvessel
Erectheader A
Erectbridge B
Erectheader A
Fitpump
Fitpump
Aligncouplings
Supports
Supports
Weld
Weld
Weld
Weld
Erect vesselsteel
Erectbridge A
Prefabsuction
Prefabsuction
Laybase
Laybase
Prefabdisch
Prefabdisch
SMACNo.
Hydro
Erectsuction
Erectsuction
Erectdisch
Erectdisch
10
34
54
30
50
31 32
5251
33
53
35
55
12 13 14
1
1 1
1
1
1
1
1
1
1
1
1
1
1
1
1
1
1
1
1
11
11
15 17
18
22
16
20
2119
5
5 6
4 8
8
5 6
9
10
910
10
10
10 11
11 12 13
8
4
0
0
02 62
1513
1 23
25 26
24
36
56
39
59
37
57
40
60
38
58
41
61
4
1
1
1
1
1
1
1
1
1
11
1
1
1 2 3 4
5
4
5
5
6
6
7
7
7
4
5
5
6
6
7
7
8
1
1
4 4 2
4
1111
Durationin days
4
0
0
A B C D E F G H J K L
1
2
3
4
5
6
7
8
9
10
11
12
2
2 43
2Pump2
1
1
1
Discharge
Figure 48.2Network (using grid system).

440 C
hapter 48
Figure 48.3
EVA analysis.
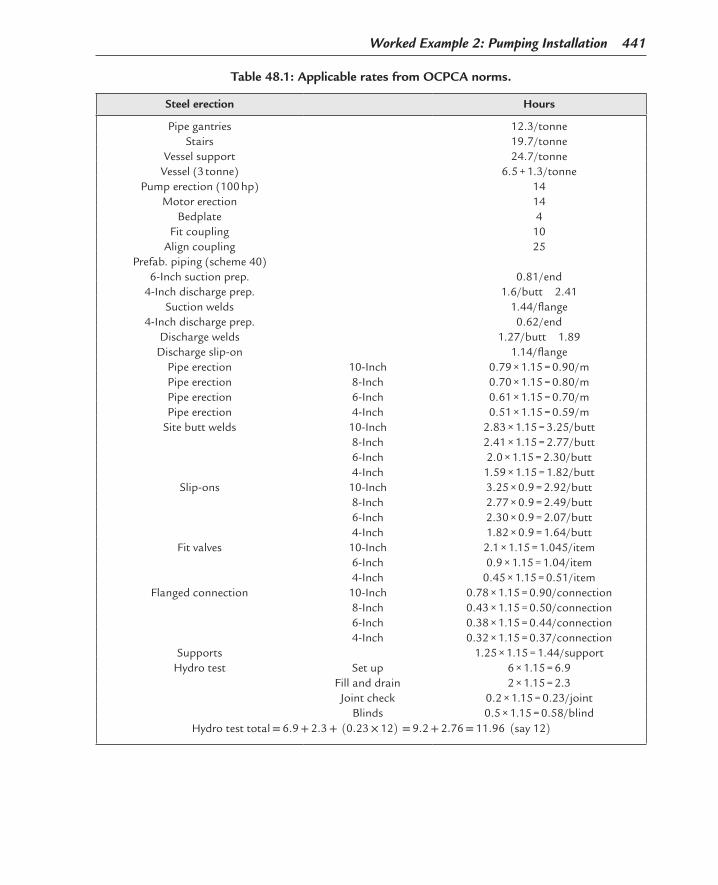
Worked Example 2: Pumping Installation 441
Table 48.1: Applicable rates from OCPCA norms.
Steel erection Hours
Pipe gantries 12.3/tonneStairs 19.7/tonne
Vessel support 24.7/tonneVessel (3 tonne) 6.5 + 1.3/tonne
Pump erection (100 hp) 14Motor erection 14
Bedplate 4Fit coupling 10
Align coupling 25Prefab. piping (scheme 40)
6-Inch suction prep. 0.81/end4-Inch discharge prep. 1.6/butt 2.41
Suction welds 1.44/flange4-Inch discharge prep. 0.62/end
Discharge welds 1.27/butt 1.89Discharge slip-on 1.14/flange
Pipe erection 10-Inch 0.79 × 1.15 = 0.90/mPipe erection 8-Inch 0.70 × 1.15 = 0.80/mPipe erection 6-Inch 0.61 × 1.15 = 0.70/mPipe erection 4-Inch 0.51 × 1.15 = 0.59/m
Site butt welds 10-Inch 2.83 × 1.15 = 3.25/butt8-Inch 2.41 × 1.15 = 2.77/butt6-Inch 2.0 × 1.15 = 2.30/butt4-Inch 1.59 × 1.15 = 1.82/butt
Slip-ons 10-Inch 3.25 × 0.9 = 2.92/butt8-Inch 2.77 × 0.9 = 2.49/butt6-Inch 2.30 × 0.9 = 2.07/butt4-Inch 1.82 × 0.9 = 1.64/butt
Fit valves 10-Inch 2.1 × 1.15 = 1.045/item6-Inch 0.9 × 1.15 = 1.04/item4-Inch 0.45 × 1.15 = 0.51/item
Flanged connection 10-Inch 0.78 × 1.15 = 0.90/connection8-Inch 0.43 × 1.15 = 0.50/connection6-Inch 0.38 × 1.15 = 0.44/connection4-Inch 0.32 × 1.15 = 0.37/connection
Supports 1.25 × 1.15 = 1.44/supportHydro test Set up 6 × 1.15 = 6.9
Fill and drain 2 × 1.15 = 2.3Joint check 0.2 × 1.15 = 0.23/joint
Blinds 0.5 × 1.15 = 0.58/blindHydro test total = 6.9 + 2.3 + (0.23 × 12) = 9.2 + 2.76 = 11.96 (say 12)

442 Chapter 48
6. Assess the number of men required to perform any activity. By dividing the activity man-hours by the number of men the actual working hours and consequently working days (durations) can be calculated.
7. Enter these durations in the network programme. 8. Carry out the network analysis, giving floats and the critical path (Table 48.2). 9. Draw up the EVA analysis sheet (Table 48.3) listing activities, activity (SMAC) numbers
and durations. 10. Carry out EVA analysis at weekly intervals. The basis calculations for value hours,
efficiency, etc. are shown in Table 48.4. 11. Draw a bar chart using the network as a basis for start and finish of activities (Fig.
48.4). 12. Place the number of men per week against the activities on the bar chart. 13. Add up vertically per week and draw the labour histogram and S-curve. 14. Carry out a resource-smoothing exercise to ensure that labour demand does not exceed
supply for any particular trade. In any case, high peaks or troughs are signs of inefficient working and should be avoided here (Fig. 48.5). (Note: This smoothing operation only takes place with activities which have float.)
15. Draw the project control curves using the weekly EVA analysis results to show graphi-cally the relationship between:
a. budget hours b. planned hours c. actual hours d. value hours e. predicted final hours (Fig. 48.6) 16. Draw control curves showing: a. percent complete (progress) b. efficiency (Fig. 48.6)
The procedures outlined above will give a complete control system for time and cost for the project as far as site work is concerned.
Cash Flow
Cash flow charts show the difference between expenditure (cash outflow) and income (cash inflow). Since money is the common unit of measurement, all contract components such as man-hours, materials, overheads and consumables have to be stated in terms of money values.
It is convenient to set down the parameters that govern the cash-flow calculations before calculating the actual amounts. For example, consider the following: 1. There are 1748 productive hours in a year (39 h/week × 52) – 280 days of annual holidays,
statutory holidays, sickness and travelling allowance and induction.

Worked Example 2: Pumping Installation 443
Table 48.2: Total float.
M SMAC no.Duration (Days)
Backward Pass TLe
Forward Pass TEe TEe Total Float
Welding Activity
10 14 10 4 0 611 1 11 5 4 612 4 4 4 0 013 4 8 8 4 014 2 11 10 8 115 1 8 5 4 316 1 9 9 8 017 1 10 6 5 4 X18 1 10 10 9 0 X19 1 9 5 4 420 1 10 9 8 121 1 11 6 5 5 X22 1 11 10 9 1 X23 1 11 11 10 024 1 12 11 10 125 1 12 12 11 0 X26 1 13 13 12 030 1 5 1 0 431 1 7 2 1 532 1 8 3 2 533 1 9 4 3 534 1 8 1 0 7 X35 1 8 1 0 7 X36 1 10 5 4 537 1 11 6 5 5 X38 1 12 7 6 539 1 10 5 4 540 1 11 6 5 5 X41 1 12 7 6 550 1 6 2 1 451 1 7 3 2 452 1 8 4 3 453 1 9 5 4 454 1 9 2 1 7 X55 1 9 2 1 7 X56 1 10 6 5 457 1 11 7 6 4 X58 1 12 8 7 459 1 10 6 5 460 1 11 7 6 4 X61 1 12 8 7 462 1 15 15 13 0

444 C
hapter 48
Table 48.3: EVA analysis.
EVA no.
EVA Budget Man-Hours
Day 5 Day 10 Day 15
A % V A % V A % V
Erect vessel steelwork 10 62 70 100 62 70 100 62 70 100 62Erect vessel 11 11 12 100 11 12 100 11 12 100 11
Erect bridge sect. A 12 62 60 100 62 60 100 62 60 100 62Erect bridge sect. B 13 62 40 50 31 65 100 62 65 100 62
Erect stairs 14 30 – – – 35 100 30 35 100 3010-Inch suct. Head.
Erect A15 9 10 100 9 10 100 9 10 100 9
10-Inch suct. Head. Erect B
16 8 – – – 8 100 8 8 100 8
10-Inch suct. Head. Welds A
17 15 – – – 18 100 15 18 100 15
10-Inch suct. Head. Welds B
18 4 – – – 5 100 4 5 100 4
8-Inch disch. Head. Erect A
19 6 6 80 5 6 100 6 6 100 6
8-Inch disch. Head. Erect B
20 10 – – – 11 80 8 12 100 8
8-Inch disch. Head. Welds A
21 3 – – – 3 100 3 3 100 3
8-Inch disch. Head. Welds B
22 3 – – – – – – 3 100 3
Suction header supports
23 6 – – – 7 60 4 8 100 6
Discharge header supports
24 6 – – – – – – 6 100 6
Final connection 25 1 – – – – – – 1 100 1Hydro test 26 12 – – – – – – 10 100 12
Base plate pump 1 30 4 3 100 14 3 100 4 3 100 4Fit pump 1 31 14 14 100 14 14 100 14 14 100 14Fit motor 32 14 12 100 14 12 100 14 12 100 14
Fit coupling 1 33 10 12 100 10 12 100 10 12 100 10

Worked Exam
ple 2: Pumping Installation
445
Prefab. suction pipe 1 34 6 10 100 6 10 100 6 10 100 6
Prefab. discharge pipe 1
35 5 4 80 4 5 100 5 5 100 5
Erect suction pipe 1 36 7 – – – 8 100 7 8 100 7Weld suction pipe 1 37 7 – – – 5 100 7 5 100 7Support suction pipe
138 4 – – – 4 80 3 5 100 5
Erect discharge pipe 1 39 6 5 70 4 7 100 6 7 100 6Weld discharge pipe 1 40 4 – – – 4 100 4 4 100 4
Support discharge pipe 1
41 4 – – – 2 50 2 3 100 4
Basic plate pump 2 50 4 3 100 4 3 100 4 3 100 4Fit pump 2 51 14 14 100 14 14 100 14 14 100 14Fit motor 2 52 14 12 100 14 12 100 14 12 100 14
Fit coupling 2 53 10 10 100 10 10 100 10 10 100 10Prefab. suction pipe 2 54 6 10 100 6 10 100 6 10 100 6Prefab. discharge pipe
255 5 6 100 5 6 100 5 6 100 5
Erect suction pipe 2 56 7 5 60 4 8 100 7 8 100 7Weld suction pipe 2 57 7 – – – 5 100 7 5 100 7Support suction pipe
258 4 – – – 2 40 2 4 100 4
Erect discharge pipe 2 59 6 6 70 4 8 100 6 8 100 6Weld discharge pipe 2 60 4 – – – 5 100 4 5 100 4
Support discharge pipe 2
61 4 – – – 3 70 3 4 100 4
Align couplings 1 and 2
62 50 – – – – – – 16 10 20
Totals 530 324 56 297 482 84 448 525 94 500

446 Chapter 48
2. Each man-hour costs, on average, £5 in actual wages. 3. After adding payments for productivity, holiday credits, statutory holidays, course
attendance, radius and travel allowance, the taxable rate becomes £8.40/hour. 4. The addition of other substantive items such as levies, insurance, protective clothing and
non-taxable fares, and lodging increases the rate by £2.04 to £10.44/hour.
5. The ratio of other substantive items to taxable costs is 2.04
8.40= 0.243.
6. An on-cost allowance of 20% is made up of:
Consumables 5%Overheads 10%
Profit 5%Total 20%
7. The total charge-out rate is, therefore, 10.44 × 1.2 = £12.53/hour. 8. In this particular example: a. The men are paid at the end of each day at a rate of £8.40/hour. b. The other substantive items of £2.04/hour are paid weekly. c. Income is received weekly at the charge-out rate of £12.53/hour. 9. A week consists of five working days.
Table 48.4: EVA calculations.
Day 5 Day 10 Day 15
Budget man-hours 530 530 530Actual man-hours 324 482 525Value man-hours 297 448 500Percent complete 297 448 500
530 530 530 = 56% = 85% = 94%
Est. final man-hours 324 482 5250.56 0.85 0.94
= 597 = 567 = 559Efficiency 297 448 500
324 482 525 = 92% = 93% = 95%A = Actual man-hoursB = Budget man-hoursV = Value man-hours
V = Value man-hours = Percent complete × B of activity
Σ Percent complete = ΣBΣV
Efficiency = VA
Est. final = APercent complete
Activities shifted: 17, 12, 22, 35, 55, 19
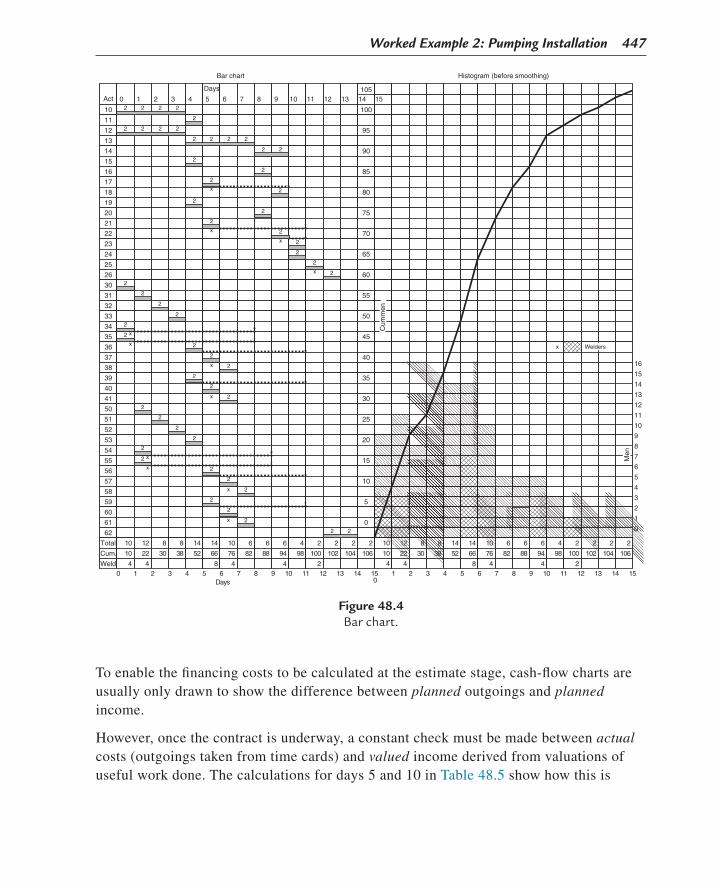
Worked Example 2: Pumping Installation 447
10 100
11
12 95
13
14 90
15
16 85
17
18 80
19
20 75
21
22 70
23
24 65
25
26 60
30
31 55
32
33 50
34
35 45
36
37 40
38
39 35
40
41 30
50
51 25
52
53 20
54
55 15
56
57 10
58
59 5
60
61 0
62
Total 10 12 8 8 14 14 10 6 6 6 4 2 2 2
Cum. 10 22 30 38 52 66 76 82 88 94 98 100 102 104 106
Weld 4 4 8 4 4 20 1 2 3 4 5 6
Days7 8 9 10 11 12 13 14
Act 0 1 22
2
2
2
2
2
2
2
2
2
2
2
2
2
2
2
2
2
2
2
2
2
2
2
2
2
2
2
2
2
2
2
2
2
2
2
2
2
2
2
2
2
x
x
x
x
x
x
x
x
x
x
x
x
2
2
2
2
2
2
2
2
2
2
2
3 4 5
Days
Bar chart
6 7 8 9 10 11 12 13 14
Cum
men
10 12 8 8 14 142
10 22 30 38 52 66
4 4
01 2 3 4 515
Histogram (before smoothing)
15
0
1
2
3
4
5
6
7
8
9
10
11
12
13
14
15
16
Men
10 6 6 6 4 2 2 2 2
76 82 88 94 98 100 102 104 106
8 4 4 26 7 8 9 10 11 12 13 1514
105
x Welders
Figure 48.4Bar chart.
To enable the financing costs to be calculated at the estimate stage, cash-flow charts are usually only drawn to show the difference between planned outgoings and planned income.
However, once the contract is underway, a constant check must be made between actual costs (outgoings taken from time cards) and valued income derived from valuations of useful work done. The calculations for days 5 and 10 in Table 48.5 show how this is

448 Chapter 48
carried out. When these figures are plotted on a chart as in Fig. 48.7 it can be seen that for:
Days 0–5 The cash flow is negative (i.e., outgoings exceed income).Days 5–8 The cash flow is positive.Days 8–10 The cash flow is negative.Days 10–15 The cash flow is positive.On day 15 The total value is recovered assuming there are no retentions.
The planned costs of the other substantives can be calculated for each period by multiplying the planned cumulative outgoings by the ratio of 0.243.
Figure 48.5Bar chart after resource smoothing.
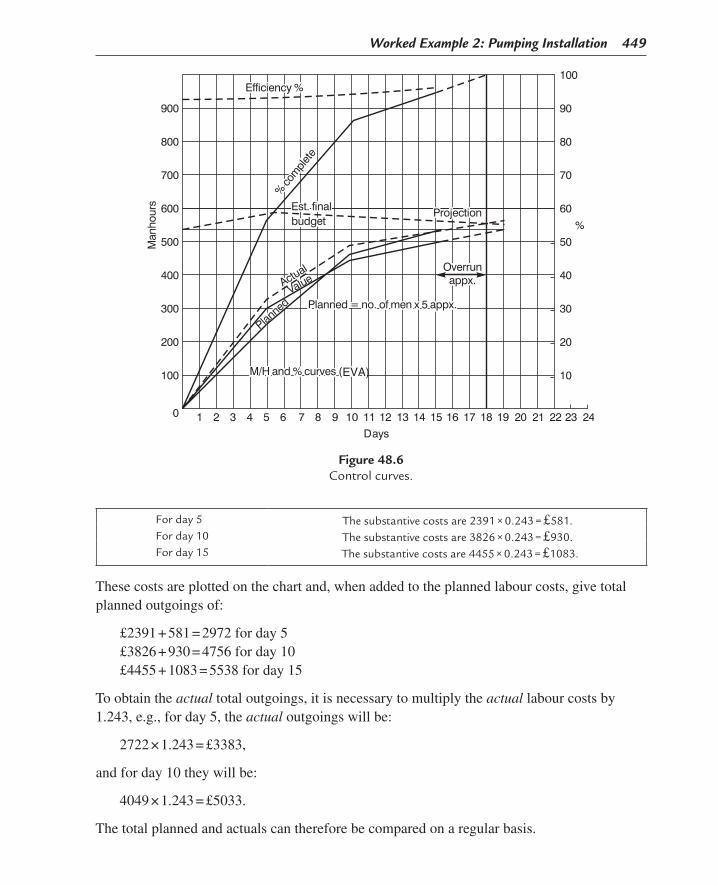
Worked Example 2: Pumping Installation 449
For day 5 The substantive costs are 2391 × 0.243 = £581.For day 10 The substantive costs are 3826 × 0.243 = £930.For day 15 The substantive costs are 4455 × 0.243 = £1083.
These costs are plotted on the chart and, when added to the planned labour costs, give total planned outgoings of:
£2391 + 581 = 2972 for day 5£3826 + 930 = 4756 for day 10£4455 + 1083 = 5538 for day 15
To obtain the actual total outgoings, it is necessary to multiply the actual labour costs by 1.243, e.g., for day 5, the actual outgoings will be:
2722 × 1.243 = £3383,
and for day 10 they will be:
4049 × 1.243 = £5033.
The total planned and actuals can therefore be compared on a regular basis.
EVA)
Figure 48.6Control curves.

450 C
hapter 48
Table 48.5: Cash values.
ActivityEVA no.
Duration (Days)
EVA (Budget)
Man-Hours
Planned Cost at
£8.40 Per
Hour
Planned Price at
£12.53 Per
Hour
Day 5 Day 10
Actual Man-Hours
Actual Cost at
£8.40Value Hours
Value (Price)
at
£12.53
Actual Man-Hours
Actual Cost at
£8.40Value Hours
Value (Price)
at
£12.53
Erect vessel
steelwork
10 4 62 521 777 70 588 62 777 70 588 62 777
Erect vessel
11 1 11 92 138 12 101 11 138 12 101 11 138
Erect bridge sect. A
12 4 62 521 777 60 504 62 777 60 504 62 777
Erect bridge sect. B
13 4 62 521 777 40 336 31 388 65 546 62 777
Erect stairs
14 2 30 252 376 – – – – 35 294 30 376
10-Inch suct.
Head. Erect A
15 1 9 76 113 10 84 9 113 10 84 9 113
10-Inch suct.
Head. Erect B
16 1 8 67 100 – – – – 8 67 8 100
10-Inch suct.
Head. Welds A
17 1 15 126 188 – – – – 18 151 15 188
10-Inch suct.
Head. Welds B
18 1 4 34 50 – – – – 5 42 4 50

Worked Exam
ple 2: Pumping Installation
451
8-Inch disch. Head. Erect A
19 1 6 50 75 6 50 5 63 6 50 6 75
8-Inch disch. Head. Erect B
20 1 10 84 125 – – – – 11 92 8 100
8-Inch disch. Head.
Welds A
21 1 3 25 38 – – – – 3 25 3 38
8-Inch disch. Head.
Welds B
22 1 3 25 38 – – – – – – – –
Suction header
supports
23 1 6 50 75 – – – – 7 59 4 50
Discharge header
supports
24 1 6 50 75 – – – – – – – –
Final connec-
tion
25 1 1 8 13 – – – – – – – –
Hydro test 26 12 101 150 – – – – – – – –Base plate
pump 130 1 4 34 50 3 25 4 50 3 25 4 50
Fit pump 1
31 14 118 175 14 118 14 175 14 118 14 175
Fit motor 1
32 1 14 118 175 12 101 14 175 12 101 14 175
Fit coupling 1
33 1 10 84 125 12 101 10 125 12 101 10 125
Prefab. Suct. Pipe
1
34 1 6 50 75 10 84 6 75 10 84 6 75
Continued

452 C
hapter 48
Prefab. discharge
pipe 1
35 1 5 42 63 4 34 4 50 5 42 5 63
Erect suction pipe 1
36 1 7 59 88 – – – – 8 67 7 88
Weld suction pipe 1
37 1 7 59 88 – – – – 5 42 7 88
Support suction pipe 1
38 1 4 34 50 – – – – 4 34 3 38
Erect discharge
pipe 1
39 1 6 50 75 5 42 4 50 7 59 6 75
Weld discharge
pipe 1
40 1 4 34 50 – – – – 4 34 4 50
Support discharge
pipe 1
41 1 4 34 50 – – – – 2 17 2 25
Base plate pump 2
50 1 4 34 50 3 25 4 50 3 25 4 50
Fit pump 2
51 1 14 118 175 14 118 14 175 14 118 14 175
Fit motor 2
52 1 14 118 175 12 101 14 175 12 101 14 175
Fit coupling 2
53 1 10 84 125 10 84 10 125 10 84 10 125
Table 48.5: Cash values.—cont’d
ActivityEVA no.
Duration (Days)
EVA (Budget)
Man-Hours
Planned Cost at
£8.40 Per
Hour
Planned Price at
£12.53 Per
Hour
Day 5 Day 10
Actual Man-Hours
Actual Cost at
£8.40Value Hours
Value (Price)
at
£12.53
Actual Man-Hours
Actual Cost at
£8.40Value Hours
Value (Price)
at
£12.53

Worked Exam
ple 2: Pumping Installation
453
Prefab. suction pipe 2
54 1 6 50 75 10 84 6 75 10 84 6 75
Prefab. discharge
pipe 2
55 1 5 42 63 6 50 5 63 6 50 5 63
Erect suction pipe 2
56 1 7 59 88 5 42 4 50 8 67 7 88
Weld suction pipe 2
57 1 7 59 88 – – – – 5 42 7 88
Support suction pipe 2
58 1 4 34 50 – – – – 2 17 2 25
Erect discharge
pipe 2
59 1 6 50 75 6 50 4 50 8 67 6 75
Weld discharge
pipe 2
60 1 4 34 50 – – – – 5 42 4 50
Support discharge
pipe 2
61 1 4 34 50 – – – – 3 25 3 38
Align couplings 1 and 2
62 2 50 420 627 – – – – – – – –
530 4455 6640 324 2722 297 3719 482 4049 448 5613

454 Chapter 48
Figure 48.7Bar chart and stepped ‘S’ curve.

455Project Management, Planning and Control. http://dx.doi.org/10.1016/B978-0-08-102020-3.00049-8Copyright © 2017 Elsevier Ltd. All rights reserved.
CHAPTER 49
Worked Example 3: Motor Car
Chapter OutlineSummary 466
Business Case 466Investment Appraisal 466Project and Product Life Cycle 477Work- and Product-Breakdown Structures 477AoN Network 477Risk Register 477Earned Value Analysis 477Close-Out 477
The example in this chapter shows how all the tools and techniques described so far can be integrated to give a comprehensive project-management system. The project chosen is the design, manufacture and distribution of a prototype motor car, and while the operations and time scales are only indicative and do not purport to represent a real-life situation, the exam-ple shows how the techniques follow each other in a logical sequence.
The prototype motor car being produced is illustrated in Fig. 49.1 and the main components of the engine are shown in Fig. 49.2. It can be seen that the letters given to the engine compo-nents are the activity identity letters used in planning networks.
An oversight of the main techniques and their most important constituents are discussed as follows.
As with all projects, the first document to be produced is the business case, which should also include the chosen option investigated for the investment appraisal. In this exercise, the questions to be asked (and answered) are shown in Table 49.1.
It is assumed that the project requires an initial investment of £60 million and that over a 5-year period, 60,000 cars (units) will be produced at a cost of £5000 per unit. The assump-tions are that the discount rate is 8%. There are two options for phasing the manufacture: 1. That the factory performs well for the first 2 years but suffers some production problems
in the next 3 years (option 1). 2. That the factory has teething problems in the first 3 years but goes into full production in
the last 2 (option 2).

Figure 49.2The parts of an overhead-camshaft engine.
Figure 49.1Motor car.

Worked Example 3: Motor Car 457
Table 49.1
Business Case
Why do we need a new model?What model will it replace?
What is the market?Will it appeal to the young, the middle aged, families, the elderly, women, trendies, yobos?
How many can we sell per year in UK, the USA, EEC and other countries?What is the competition for this type of car and what is their price?
Will the car rental companies buy it?What is the max. and min. selling price?
What must be the max. manufacturing cost and in what country will it be built?What name shall we give it?
Do we have a marketing plan?Who will handle the publicity and advertising?
Do we have to train the sales force and maintenance mechanics?What should be the insurance category?
What warranties can be given and for how long?
What are the main specifications regarding:Safety and theftproofing?
Engine size (cc) or a number of sizes?Fuel consumption?
Emissions (pollution control)?Catalytic converter?
Max. speed?Max. acceleration?Size and weight?
Styling?
Turning circle and ground clearance?
What ‘extras’ must be fitted as standard?ABS
Power steeringAir bags
Electric windows and roofCruise control
Air conditioningWhat percentage can be recycled
Investment Appraisal (Options)
Should it be a saloon, coupé, estate, people carrier, convertible, 4 × 4 or mini?Will it have existing or newly designed engine?Will it have existing or new platform (chassis)?
Do we need a new manufacturing plant or can we build it in an existing one?Should the engine be cast iron or aluminium?
Should the body be steel, aluminium or fibreglass?Do we use an existing brand name or devise a new one?
Will it be fuelled on petrol, diesel, electricity or hybrid power unit?DCF of investment returns, NPV, cash flow?

458 Chapter 49
The discounted cash flow (DCF) calculations can be produced for both options as shown in Tables 49.2 and 49.3.
To obtain the internal rate of return (IRR), an additional discount rate (in this case 20%) must be applied to both options. The resulting calculations are shown in Tables 49.4 and 49.5 and the graph showing both options is shown in Fig. 49.3. This gives an IRR of 20.2% and 15.4%, respectively.
It is now necessary to carry out a cash-flow calculation for the distribution phase of the cars. To line up with the DCF calculations, two options have to be examined. These are shown in Tables 49.6 and 49.7 and the graphs in Figs. 49.4 and 49.5 for options 1 and 2, respectively. An additional option 2a, in which the income in years 2 and 3 is reduced from £65,000K to £55,000K, is shown in the cash-flow curves of Fig. 49.6.
All projects carry an element of risk and it is prudent to carry out a risk analysis at this stage. The types of risks that can be encountered, the possible actual risks and the mitiga-tion strategies are shown in Table 49.8. A risk log (or risk register) for five risks is given in Fig. 49.7.
Once the decision has been made to proceed with the project, a project life cycle diagram can be produced. This is shown in Fig. 49.8 together with the constituents of the seven phases envisaged.
The next stage is the product-breakdown structure (Fig. 49.9), followed by a combined cost-breakdown and organization-breakdown structures (Fig. 49.10). By using these two, the responsibility matrix can be drawn up (Fig. 49.11).
It is now necessary to produce a programme. The first step is to draw an activity list show-ing the activities and their dependencies and durations. These are shown in the first four columns of Table 49.9. It is now possible to draw the critical path network in either activity on node format (Fig. 49.12), activity on arrow format (Fig. 49.13) or as a Lester diagram (Fig. 49.14).
After analysing the network diagram, the total and free floats of the activities can be listed (Table 49.10).
In addition to the start and finish, there are four milestones (days 8, 16, 24 and 30). These are described and plotted on the milestone slip chart (Fig. 49.15).
The network programme can now be converted into a bar chart (Fig. 49.16) on which the resources (in men per day), as given in the fifth column of Table 49.9, can be added. After summating the resources for every day, it has been noticed that there is a peak requirement of 12 men in days 11 and 12. As this might be more than the available resources, the bar chart can be adjusted by utilizing the available floats to smooth the resources and eliminate the peak demand. This is shown in Fig. 49.17 by delaying the start of activities D and F.

Worked Exam
ple 3: Motor C
ar 459
Table 49.2
DCF of Investment Returns (Net Present Value)
Initial Investment £60,000K 5 year periodTotal car production 60,000 units @ £5000/Unit
Option 1
Year Production Units Income (£K) Cost (£K) Net Return (£K) Discount Rate (%) Discount Factor Present Value (£K)
1 15,000 100,000 75,000 25,000 8 0.926 23,1502 15,000 100,000 75,000 25,000 8 0.857 21,4253 10,000 65,000 50,000 15,000 8 0.794 11,9104 10,000 65,000 50,000 15,000 8 0.735 11,0255 10,000 65,000 50,000 15,000 8 0.681 10,215
Totals 95,000 77,725Net present value (NPV) = 77,725 − 60,000 = £17,725K
Profit = £95,000K − £60,000K = £35,000KAverage rate of return (undiscounted) = £95,000/5 = £19,000K per annum
Return on investment = £19,000/£60,000 = 31.66%
Table 49.3
DCF of Investment Returns (Net Present Value)
Initial Investment £60,000K 5 year periodTotal car production 60,000 units @ £5000/Unit
Option 2
Year Production Units Income (£K) Cost (£K) Net Return (£K) Discount Rate (%) Discount Factor Present Value (£K)
1 10,000 65,000 50,000 15,000 8 0.926 13,8902 10,000 65,000 50,000 15,000 8 0.857 12,8553 10,000 65,000 50,000 15,000 8 0.794 11,9104 15,000 100,000 75,000 25,000 8 0.735 18,3755 15,000 100,000 75,000 25,000 8 0.681 17,025
Totals 95,000 74,055Net present value (NPV) = 74,055 − 60,000 = £14,055K
Profit = £95,000K − £60,000K = £35000KAverage rate of return (undiscounted) = £95,000/5 = £19,000K per annum
Return on investment = £19,000/£60,000 = 31.66%

460 C
hapter 49
Table 49.4
Internal Rate of Return (IRR)
Option 1
Year Net Return (£K) Discount Rate (%) Discount Factor Present Value (£K)
Discount Rate (%) Discount Factor Present Value (£K)
1 25,000 15 0.870 21,750 20 0.833 20,8252 25,000 15 0.756 18,900 20 0.694 17,3503 15,000 15 0.658 9870 20 0.579 86854 15,000 15 0.572 8580 20 0.482 72305 15,000 15 0.497 7455 20 0.402 6030
Totals 60,000 66,555 60,120Less investment −60,000 −60,000
Net present value £6555K £120KInternal rate of return (from graph) = 20.2%
Table 49.5
Internal Rate of Return (IRR)
Option 2
Year Net Return (£K) Discount Rate (%) Discount Factor Present Value (£K)
Discount Rate (%) Discount Factor Present Value (£K)
1 15,000 15 0.870 13,050 20 0.833 12,4952 15,000 15 0.756 11,340 20 0.694 10,4103 15,000 15 0.658 9870 20 0.579 86854 25,000 15 0.572 14,300 20 0.482 12,0505 25,000 15 0.497 12,425 20 0.402 10,050
Totals 60,000 60,985 53,690Less investment −60,000 −60,000
Net present value £985K −£6310KInternal rate of return (from graph) = 15.4%

Worked Example 3: Motor Car 461
In Fig. 49.18, the man days of the unsmoothed bar chart have been multiplied by 8 to convert them into man-hours. This was necessary to carry out earned value analysis. The daily man-hour totals can be shown as a histogram and the cumulative totals are shown as an S-curve. In a similar way, Fig. 49.19 shows the respective histogram and S-curve for the smoothed bar chart.
It is now possible to draw up a table of actual man-hour usage and percent-complete assessment for reporting day nos. 8, 16, 24 and 30. These, together with the earned values for these periods are shown in Table 49.11. Also shown are the efficiency [(cost performance index) CPI], (schedule performance index) SPI, and predicted final-completion costs and times as calculated at each reporting day.
Using the unsmoothed bar chart histogram and S-curve as a planned man-hour base, the actual man-hours and earned value man-hours can be plotted on the graph in Fig. 49.20. This graph also shows the percent complete and percent efficiency at each of the four reporting days.
Finally, Table 49.12 shows the actions required for the closeout procedure.
Figure 49.3IRR curves.

462 C
hapter 49
Table 49.6
Cash Flow
Option 1
Year 1 2 3 4 5 CumulativeCapital £K 12,000 12,000 12,000 12,000 12,000Costs £K 75,000 75,000 50,000 50,000 50,000Total £K 87,000 87,000 62,000 62,000 62,000 360,000
Cumulative 87,000 174,000 236,000 298,000 360,000Income £K 100,000 100,000 65,000 65,000 65,000 395,000
Cumulative 100,000 200,000 265,000 330,000 395,000
Table 49.7
Cash Flow
Option 2
Year 1 2 3 4 5 CumulativeCapital £K 12,000 12,000 12,000 12,000 12,000Costs £K 50,000 50,000 50,000 75,000 75,000Total £K 62,000 62,000 62,000 87,000 87,000 360,000
Cumulative 62,000 124,000 186,000 273,000 360,000Income £K 65,000 65,000 65,000 100,000 100,000 395,000
Cumulative 65,000 130,000 195,000 295,000 395,000

Worked Example 3: Motor Car 463
Figure 49.4Cash flow chart, option 1.
If income falls to £55 000K in years 2 and 3:
Income £K = 65 000 55 000 55 000 100 000 100 000Cumulative = 65 000 120 000 175 000 275 000 375 000
Figure 49.5Cash flow chart, option 2.
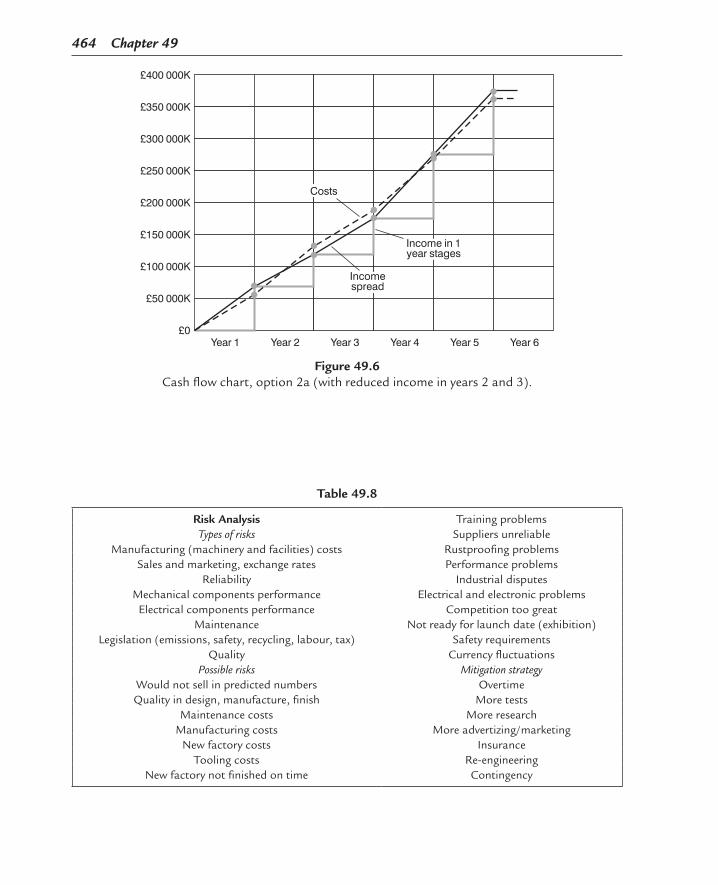
464 Chapter 49
Figure 49.6Cash flow chart, option 2a (with reduced income in years 2 and 3).
Table 49.8
Risk Analysis Training problemsTypes of risks Suppliers unreliable
Manufacturing (machinery and facilities) costs Rustproofing problemsSales and marketing, exchange rates Performance problems
Reliability Industrial disputesMechanical components performance Electrical and electronic problems
Electrical components performance Competition too greatMaintenance Not ready for launch date (exhibition)
Legislation (emissions, safety, recycling, labour, tax) Safety requirementsQuality Currency fluctuations
Possible risks Mitigation strategyWould not sell in predicted numbers OvertimeQuality in design, manufacture, finish More tests
Maintenance costs More researchManufacturing costs More advertizing/marketing
New factory costs InsuranceTooling costs Re-engineering
New factory not finished on time Contingency

Worked Exam
ple 3: Motor C
ar 465
Figure 49.7Copyright © 1996 WPMC Ltd. All rights reserved.
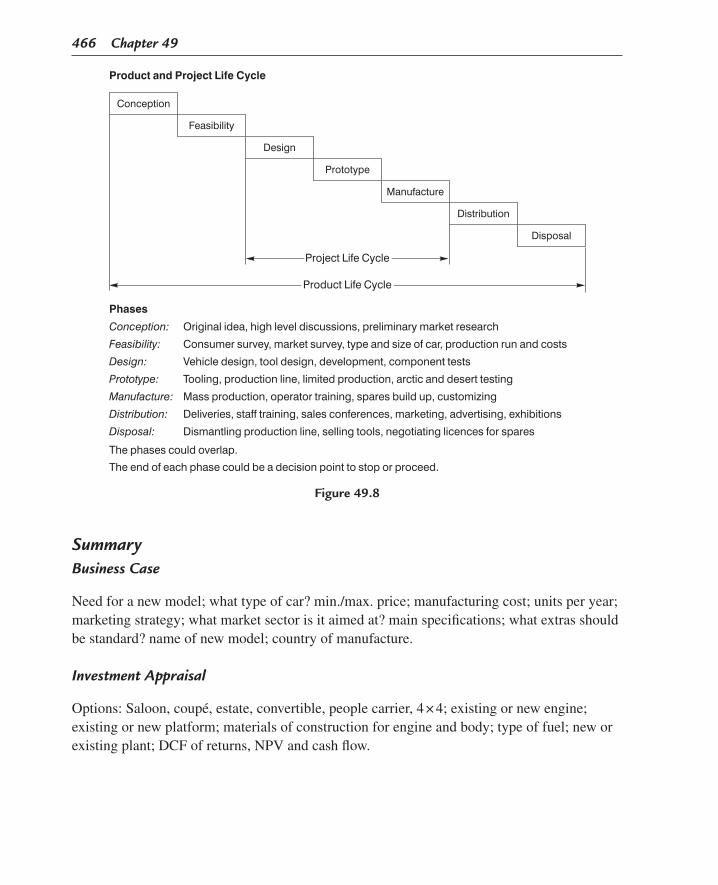
466 Chapter 49
SummaryBusiness Case
Need for a new model; what type of car? min./max. price; manufacturing cost; units per year; marketing strategy; what market sector is it aimed at? main specifications; what extras should be standard? name of new model; country of manufacture.
Investment Appraisal
Options: Saloon, coupé, estate, convertible, people carrier, 4 × 4; existing or new engine; existing or new platform; materials of construction for engine and body; type of fuel; new or existing plant; DCF of returns, NPV and cash flow.
Figure 49.8

Figure 49.9
Figure 49.10

468 Chapter 49
Figure 49.11
Table 49.9: Activity list of motor car engine manufacture and assembly (10 off), 8 hours/day.
Activ. Letter Description DependencyDuration
DaysMen Per
DayMan-Hours
Per DayTotal
Man-Hours
A Cast block and cylinder head
Start 10 3 24 240
B Machine block A 6 2 16 96C Machine cylinder
headB 4 2 16 64
D Forge and mc. flywheel
E 4 2 16 64
E Forge crankshaft Start 8 3 24 192F Machine
crankshaftE 5 2 16 80
G Cast pistons A 2 3 24 48H Machine pistons G 4 2 16 64J Fit piston rings H 1 2 16 16K Forge connecting
rodE 2 3 24 48
L Machine conn. rod
K 2 2 16 32
M Fit big end shells L 1 1 8 8N Fit little end bush M 1 1 8 8O Assemble engine B, F, J, N 5 4 32 160P Fit flywheel D, O 2 4 32 64Q Fit cylinder head C, P 2 2 16 32R Fit camshaft and
valvesQ 4 3 24 96
Total 1312

Worked Example 3: Motor Car 469
Figure 49.12
Figure 49.13

470 C
hapter 49
Figure 49.14
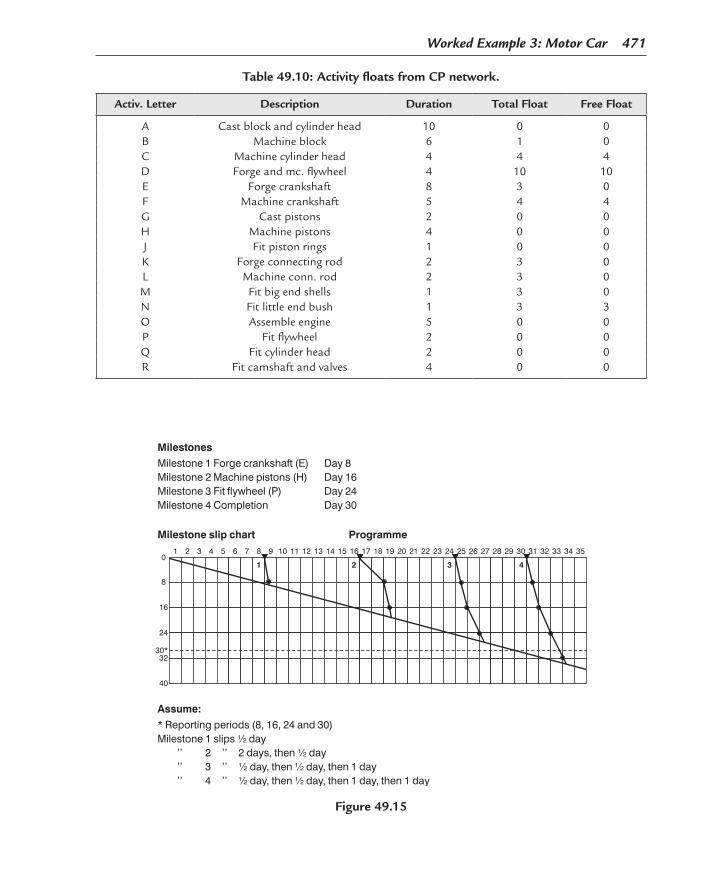
Worked Example 3: Motor Car 471
Table 49.10: Activity floats from CP network.
Activ. Letter Description Duration Total Float Free Float
A Cast block and cylinder head 10 0 0B Machine block 6 1 0C Machine cylinder head 4 4 4D Forge and mc. flywheel 4 10 10E Forge crankshaft 8 3 0F Machine crankshaft 5 4 4G Cast pistons 2 0 0H Machine pistons 4 0 0J Fit piston rings 1 0 0K Forge connecting rod 2 3 0L Machine conn. rod 2 3 0M Fit big end shells 1 3 0N Fit little end bush 1 3 3O Assemble engine 5 0 0P Fit flywheel 2 0 0Q Fit cylinder head 2 0 0R Fit camshaft and valves 4 0 0
Figure 49.15

472 Chapter 49
Days
Q
P
O
N
M
L
K
J
H
G
F
E
D
C
B
A
1 2 3 4 5 6 7 8 9 10 11 12 13 14 15 16 17 18 19 20 21 22 23 24 25 26 27 28 29 30 31 32 33 34 35
TotalCum.mday
6
6
6
12
6
18
6
24
6
30
6
36
6
42
6
48
9
57
9
66
12
78
12
90
7
97
5
102
4
106
4
110
4
114
6
120
6
126
6
132
4
136
4
140
4
144
4
148
2
150
2
152
3
155
3
158
3
161
3
164
3 3 3 3 3 3 3 3 3 3
1
4 4 4 4 4
4 4
2 2
3 3 3 3
2 2 2
2
2
2
2
2
2
2
2
2
2 2 2
2 2 2 2
3 3 3 3 3 3 3 3
2
2
2
2
2 2 2
3
3
3
3
1
Bar chart of prototype motor cars (10 off)
Figure 49.16Unsmoothed.
Days
Q
P
O
N
M
L
K
J
H
G
F
E
D
C
B
A
1 2 3 4 5 6 7 8 9 10 11 12 13 14 15 16 17 18 19 20 21 22 23 24 25 26 27 28 29 30 31 32 33 34 35
TotalCum.mday
6
6
6
12
6
18
6
24
6
30
6
36
6
42
6
48
5
53
5
58
8
66
8
74
7
81
7
88
6
94
6
100
6
106
6
112
8
120
8
128
6
134
6
140
4
144
4
148
2
150
2
152
3
155
3
158
3
161
3
164
3 3 3 3 3 3 3 3 3 3
1
4 4
2
4
2
4
2
4
2
4 4
2 2
3 3 3 3
2 2 2
2
2
2
2
2
2
2
2
2
2
2
2
2
2 2 2
3 3 3 3 3 3 3 3
2 2
2
3
3
3
3
1
Bar chart of prototype motor cars (10 off) After moving D to start at day 18and moving F to start at day 12
Figure 49.17Smoothed.

Worked Example 3: Motor Car 473
Figure 49.18

474 Chapter 49
Figure 49.19
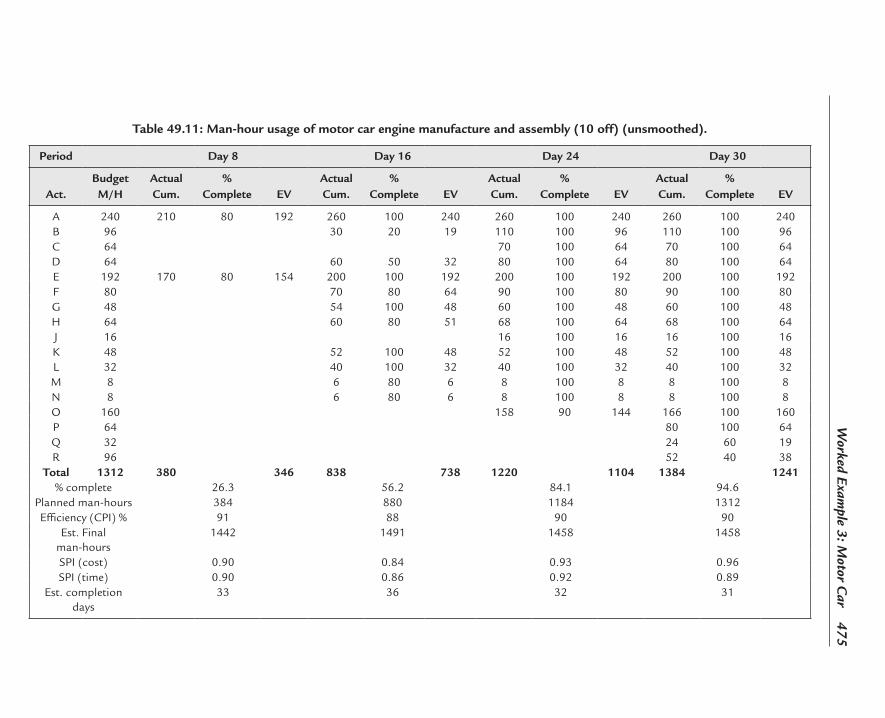
Worked Exam
ple 3: Motor C
ar 475
Table 49.11: Man-hour usage of motor car engine manufacture and assembly (10 off) (unsmoothed).
Period Day 8 Day 16 Day 24 Day 30
Act.Budget M/H
Actual Cum.
% Complete EV
Actual Cum.
% Complete EV
Actual Cum.
% Complete EV
Actual Cum.
% Complete EV
A 240 210 80 192 260 100 240 260 100 240 260 100 240B 96 30 20 19 110 100 96 110 100 96C 64 70 100 64 70 100 64D 64 60 50 32 80 100 64 80 100 64E 192 170 80 154 200 100 192 200 100 192 200 100 192F 80 70 80 64 90 100 80 90 100 80G 48 54 100 48 60 100 48 60 100 48H 64 60 80 51 68 100 64 68 100 64J 16 16 100 16 16 100 16K 48 52 100 48 52 100 48 52 100 48L 32 40 100 32 40 100 32 40 100 32M 8 6 80 6 8 100 8 8 100 8N 8 6 80 6 8 100 8 8 100 8O 160 158 90 144 166 100 160P 64 80 100 64Q 32 24 60 19R 96 52 40 38
Total 1312 380 346 838 738 1220 1104 1384 1241% complete 26.3 56.2 84.1 94.6
Planned man-hours 384 880 1184 1312Efficiency (CPI) % 91 88 90 90
Est. Final man-hours
1442 1491 1458 1458
SPI (cost) 0.90 0.84 0.93 0.96SPI (time) 0.90 0.86 0.92 0.89
Est. completion days
33 36 32 31

476 Chapter 49
Figure 49.20Unsmoothed resources.
Table 49.12
Close-Out
Close-out meeting store standard toolsSell special tools and drawings to Ruritania
Clear machinery from factorySign lease with supermarket that bought the site
Sell spares to dealersSell scrap materials
Write report and highlight problemsPress release and photo opportunity for last car
Give away 600,000th production car to special lottery winner

Worked Example 3: Motor Car 477
Project and Product Life Cycle
Conception Original idea, submission to top managementFeasibility Feasibility study, preliminary costs, market survey
Design Vehicle and tool design, component testsPrototype Tooling, production line, environmental tests
Manufacture Mass production, trainingDistribution Deliveries, staff training, marketing
Disposal Dismantling of plant, selling tools
Work- and Product-Breakdown StructuresDesign, prototype, manufacture, testing, marketing, distribution, training.Body, chassis, engine, transmission, interior and electronics.Cost-breakdown structure, organization-breakdown structure, responsibility matrix.
AoN Network
Network diagram, forward and backward pass, floats, critical path, examination for overall time reduction, conversion to bar chart with resource loading, histogram, reduction of resource peaks, cumulative S-curve; milestone slip chart.
Risk Register
Types of risks: manufacturing, sales, marketing, reliability, components failure, maintenance, suppliers, legislation, quality; qualitative and quantitative analysis; probability and impact matrix; risk owner; mitigation strategy and contingency.
Earned Value Analysis
EVA of manufacture and assembly of engine, calculate earned value, CPI, SPI, cost at completion, final-project time, draw curves of budget hours, planned hours, actual hours earned value, percent complete and efficiency over four reporting periods.
Close-OutClose-out meetingClose-out reportInstruction manualsTest certificatesSpares listsDispose of surplus materials

This page intentionally left blank

479Project Management, Planning and Control. http://dx.doi.org/10.1016/B978-0-08-102020-3.00050-4Copyright © 2017 Elsevier Ltd. All rights reserved.
CHAPTER 50
Worked Example 4: Battle Tank
Chapter OutlineBusiness Case for Battle Tank Top Secret 479
Business Case for Battle Tank Top Secret
Memo: From: General Johnson
To: The Department of Defence
1 September 2006
Subject: new battle tank
It is imperative that we urgently draw up plans to design, evaluate, test, build and commission a new battle tank Figs 50.1–50.13.
The ‘What’
A new battle tank which 1. Has a 90 mm cannon; 2. Has a top speed of at least 70 mph; 3. Weighs less than 60 tonnes fully loaded and fuelled; 4. Has spaced and active armour; 5. Has at least two machine gun positions including the external turret machine gun; 6. Has a crew of not more than four men (or women); 7. Has a gas turbine engine and a fuel tank to give a range of 150 miles (240 km); 8. Has the cost not exceeding $5500000 each; 9. Has 500 units ready for operations by February 2008.
The ‘Why’ 1. The existing battle tanks will be phased out (and worn out) in 2008. 2. Ruritania is developing a tank which is superior to our existing tanks in every way. 3. The existing tank at 80 tonnes is too heavy for 50% of our road bridges. 4. The diesel engine is too heavy and unreliable in cold weather. 5. The armour plate on our tanks can be penetrated by the latest anti-tank weapon. 6. A new tank has great export potential and could become the standard tank for NATO.

480 Chapter 50
Figure 50.1Battle tank.
ConceptFeasibility
DefinitionDesign
Product’nIn-service
DisposalProject life cycle
Product life cycle
Extended life cycle
Life cycles
= Decision points
Figure 50.2Life cycles and phases.

Worked Example 4: Battle Tank 481
Tank0.0
Frame1.1
Suspens.1.2
Armour2.1
Interior2.2
Engine4.1
Transm.4.2
Barrel3.2.1
Breach3.2.2
Sight3.2.3
Casting3.1
Cannon3.2
M/c.Gun3.3
Electro3.4
Turret3.0
Body2.0
Chassis1.0
Drive4.0
Figure 50.3Product breakdown structure (PBS).
Tank0.0
Frame1.1
Suspens.1.2
Armour2.1
Interior2.2
Engine4.1
Transm.4.2
Barrel3.2.1
Breach3.2.2
Sight3.2.3
M/c.Gun3.3
Electro3.4
Turret3.0
Body2.0
Chassis1.0
Drive4.0
Casting3.1
Cannon3.2
Assemble
Assemble
Weld
Weld
Fit
Fit Furnish
Cast
Forge Machine Assemble
llatsnItiFtiF
Build Attach
Install
Figure 50.4Work breakdown structure (WBS).

482 Chapter 50
Tank0.0
Frame1.1
Suspens.1.2
Armour2.1
Interior2.2
Engine4.1
Transm.4.2
Barrel3.2.1
Breach3.2.2
Sight3.2.3
M/c.Gun3.3
Electro3.4
Turret3.0
Body2.0
Chassis1.0
Drive4.0
Casting3.1
Cannon3.2
$5500 K
1000 K
600 K 400 K 700 K
500 K
80 K 250 K 70 K
400 001K K 800 K
800 008K K 400 K
1500 K 1800 K 1200 K
Figure 50.5Cost breakdown structure (CBS).
Tank0.0
Frame1.1
Suspens.1.2
Armour2.1
Interior2.2
Engine4.1
Transm.4.2
Barrel3.2.1
Breach3.2.2
Sight3.2.3
M/c.Gun3.3
Electro3.4
Turret3.0
Body2.0
Chassis1.0
Drive4.0
Casting3.1
Cannon3.2
P. Jones
L. Hobbs F. Green P. Holt
F. Mann
S. Lloyd M. Chaps F. Brough
ynoS.AskraP.CyeloF.L
remlaP.LsnoT.AdyoB.J
F. Black C. Gray R. White
R. Smith
Figure 50.6Organization breakdown structure (OBS).

Worked Example 4: Battle Tank 483
C. G
ray
F. M
ann
L. F
oley
C. P
arks
A. S
ony
S. L
loyd
M. C
haps
F. B
roug
h
Turret
Casting
Cannon
M/c Gun
Electro.
Barrel
Breach
Sight
R A A A
A
A A A A
C R
C R
C C
C C
C C
R
–
– –
C C –
C C C A R––
–
–
–
––
C C C
C
C A
R
C R
C
R C
A –
C C C
A A C
C
A
R = ResponsibleC = Must be consultedA = Must be advised– = Not affected
C
A
A
A
Figure 50.7Responsibility matrix.
26
Electron
Cannon
Calibr
M/c Gun
Turretcast Machine Fit A Fit B
Finaltest
1615
161
15
C.P.
Duration weeks
422
2
8
88
6
6
116
5
0
0
0
0
0
27 1195
8 11
8 8 11
118
3
Figure 50.8Activity on arrow network (AoA).

484 Chapter 50
0 2 2Cast
5 5 5
0 8 8Cannon
5 0 8
0 6 6M/c Gun
5 5
5
11
0 6 6Electron
2 2
2
8
8 3 11Calibr
8 0 11
2 2
4FF 1
4Machine
7 5 9
8 2 10Fit A
9 1 11
11 4 15Fit B
11 0
C.P.
Duration weeksFF = Free Float
15
15 1 16Fin. test
15 0 16
FF
FF
FF
Figure 50.9Activity on node network (AoN).
Machine Fit A2 5 2 1
Fit B4 0
Turretcast
0
52 5
2
7
CannonC.P.
0
08 0
8
8
M/c Gun0 6
56 5
11
Electron0 6
26 2
8
2
7
4
9
10
11
11
11
Finaltest
Duration weeks
1 0
15
15
16
16
15
15
8
9
Calibr
Duration Totalfloat
3 0
11
11
8
8
Activ.
Duration Totalfloat
ES
LS
EF
LF
Figure 50.10‘Lester’ diagram.
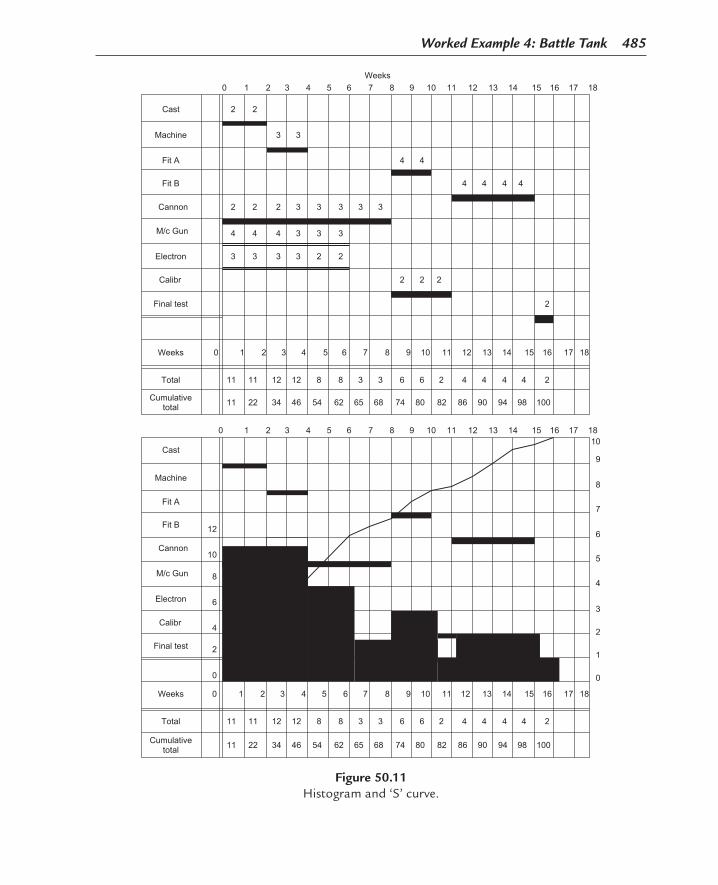
Worked Example 4: Battle Tank 485
Figure 50.11Histogram and ‘S’ curve.

486 C
hapter 50Activity
M/H Week 4 Week 8 Week 12 Week 16
nalPnalPnalPnalPgduB tcAtcAtcAtcA %%%% VEVEVEVE
081081061
200
001001
100
061001081061 160
240 200
043003
600
850
820
700
250
110
850
820
320
320
840
840
640
100
100
10
100
100
240
256
840
840
640
144
64
200 100
100
50
20 32
100
100
100
100
240
240
180 100 160
192180
600
620
420 780 756
700
140
756
512
700
0905
90
80
80
80
60
60
40
500 504
256300
80
Casting
Machine 240
320
640
840
840
640
240
80
4000 1840 1760
38.3%
.870 87%
.832
.80
4598
19.2
=
=
=
=
== =
=
=
=
=
=
=
=
=
=
=
=
=
=
=
=
=
=
1532 2720 2480 2424 3440 3270 3184 4000 4050 3632
(Cost)
Fit A
Fit B
Cannon
M/C Gun
Electronic
Calibrate
Test
Total
% Complete
CPI (Efficiency)
SPI (Cost)
SPI (Time)
Final cost
Final time
Budget man hours = duration × no. of men × skeewninoitaruDkeew/srh04
15324000
24244000
31843270
3184344010.312
698.379.
79.6% 90.8%
90%
.908
.856
4462
17.6
97%
.925%
.858%
4110
17.3
4000.973
16.925
36844000
36324000
363240503632400013.716
4000.896
16.908
24242480
24242720
6.78
.977
.891
.837
4094
17.9
98%
60.6%
4000.977
16.891
15321760
15321840
4000.870
16.832
3.24
Figure 50.12Earned value table.

Worked Example 4: Battle Tank 487
4600
4400
4200
4000
3800
3600
3400
3200
3000
2800
2600
2400
2200
2000
1800
1600
1400
1200
1000
800
600
400
200
100
0
1
1
2 3 4 5 6 7 8 9 10 11 12 13 14 15 16 170
10
20
30
40
50
60
70
80
90
100
Week
Plan’s(BSWS)
Actual(ACWP)
E.V.(BOWP)
% Complete
CPI (Efficiency)
SPI
38%
.87 = 87% .977 = 98% .973 = 97% .896 = 90%
.908.925.891.832
61% 80% 91%
Budget
% EfficiencyActual
Planned
E.V.
% Complete
%
1532
2424
3184
3632
4050
4000
3270
3440
2840
2720
1760
1840
Report dates
Figure 50.13Control curves.

488 Chapter 50
Major risks 1. The cost may escalate due to poor project management. 2. The delivery period may be later than required due to incompetence of the contractors. 3. The fuel consumption of the gas turbine may not give the required range. 4. Ruritania will have an even better tank by 2008. 5. No matter how good our tank is, NATO will probably buy the new German Leopard Tank. 6. Heavy tanks may eventually be replaced by lighter airborne armoured vehicles.

489Project Management, Planning and Control. http://dx.doi.org/10.1016/B978-0-08-102020-3.00051-6Copyright © 2017 Elsevier Ltd. All rights reserved.
CHAPTER 51
Primavera P6
Chapter OutlineEvolution of Project Management Software 489
Early Project Management Software 489The Enterprise-Level Database 490Systems Integration 490The Scalable Integrated System 491
Oracle Primavera P6 491Project Planning 491Work Breakdown Structure and Other Analysis Views 491Resource Usage 492Baseline and Other Reference Plans 492Progress Tracking 493Earned Value Analysis 493Risk Management 494Multi-Project System 494Role-Based Access 494Reporting 495Using P6 Through a Project Life Cycle 496
Evolution of Project Management SoftwareEarly Project Management Software
Early project management software packages were mostly scheduling engines. Users of the packages were specialists and the software did automate some low-level tasks, such as calculating early and late dates, but overall the users had to understand how these worked in order to manipulate the software and make sense of the results.
As more refinements were introduced, they were typically geared towards refining the detailed understanding of the work, resource and cost plans. As the models were getting more precise, the user-base also had to become more skilled to use these extra functions.
Also, simple IT limitations, such as price and availability of computer memory, usually meant that each project had its own files. This made it difficult to spread best practices through the organizations, led to duplication of effort to redefine data structures for each project and also made it difficult and time-consuming to aggregate reporting to all levels of the organization.

490 Chapter 51
Although those tools achieved a good modelling of projects, in accordance with principles described in this book, they had limitations for a wider use, in particular:
The production of reports to all levels of the organization was labour intensive, used different tools and data sets for different reporting levels, and the full process was time-consuming, meaning that decisions frequently had to be based on information that was already out of date.
Different specialists worked with different data sets, leading to disconnects between various plans. For instance, many companies had planning engineers and cost engineers working in different packages. This sometimes led to having multiple versions of the truth.
The need of a specialized user workforce restricted them mainly to large projects. Organizations working on smaller projects were frequently scared by the perceived complexity of the packages and therefore avoided them.
The Enterprise-Level Database
To address the first point above, software companies started to look at ways to get all levels of information into a central database. As networks developed, it became feasible to have people sitting in different locations either publish all their information to a central data repository, or even work straight into a central database.
This helped reporting at various levels of the organization, as well as preventing wasting effort by recreating data structures for each project. Although this improves timeliness of high-level reports while reducing their labour intensiveness, the improvement is not significant for individual projects.
Systems Integration
Working with centralized systems allowed companies to link them with automated interfaces. This makes it possible for each participant in the management of the project to work in the tool that best matches their needs, while providing views and reports that combine information from those different systems. This helps with the second point mentioned above, by making sure that the information has a single point of entry and that all reports are using the same original data set.
Getting systems that were designed and configured separately to share information usually requires making some compromises. Each system will lose some flexibility, and decisions made when initially setting up the systems may have to be reversed to ensure data compatibility. Additionally, upgrading any of the systems involved can only be done
Primavera P6 491
after making sure the integration still works or is upgraded. As separate systems have separate upgrade cycles, this maintenance can be costly.
The Scalable Integrated System
Some project management software vendors now provide systems that in their design, although developed individually to provide good functionality in their respective domains, include connexion points with the other packages contained in the solution. This makes integration between the systems much easier to build and maintain. Each package can be implemented and run individually, but when used with other packages, the link is natural enough to feel like the solution was developed as a single system.
These solutions are scalable both in terms of size of the content – from a single project to a department, or even all projects in a company – and in terms of functions to be covered. This also makes their implementation more flexible as benefits come quickly from the first func-tions implemented and other modules can be added later on.
Oracle Primavera P6
Oracle Primavera P6 (referred to as P6 in the rest of this chapter) is an integrated system. As of version 8, Oracle has embedded in P6 a number of other systems. Each of those can be implemented separately and will work as a standalone solution, but when used together they will behave as a single integrated system.
Project Planning
The core of P6 is its scheduling engine. This is based on the planning tools developed by Primavera Systems since 1983. The scheduling engine uses the critical path method to calculate dates and total float. While incorporating advanced scheduling functions, Primavera made sure each of these functions remained simple enough so that the main skills required to properly analyse the project information relate to project management rather than the software.
Work Breakdown Structure and Other Analysis Views
The default reporting in P6 is based on the WBS. Summarization at all levels of the WBS is automatic, and managers can easily access this information to the level that is relevant to them. However, cost, resource usage and day-to-day organization of the work on the project sometimes require viewing the project from different angles. For this, P6 lets users define as many coding structures as they like, at project, resource or activity level. These codes can be hierarchical or flat.

492 Chapter 51
With simple ways to summarize, group and filter activities, this allows building views of the project plan relevant to any actor of the project. This goes from a client view relating to the contract to all the way down to a resource-specific view by system, location or any other relevant way to organize the information.
These views can be saved for an easy access in the future, and can also be shared with any other user of the system. The same principles apply at all levels of the system, so that a user fluent with detailed activity-level views can also build portfolio or resource assignment level ones.
Resource Usage
P6 offers a resource pool shared between the projects to make it possible to analyse resource requirements at any level, from a single WBS element to a complete portfolio of projects, or even for the company as a whole.
P6 allows to model resources as labour, equipment, facilities and material. Once described in the dictionary, resources can be assigned to activities in the project. Once the activities have been scheduled, this provides profiles of resource requirements.
Resources can be assigned unit prices, should the company decide to model costs on the schedule based on the usage of the resources modelled. Costs can also be modelled as expense items, which are direct cost assignments that do not require resources to be created in the dictionary. Expense items can relate to vendors, cost category, cost account or any other analysis angle deemed desirable for analysis or reporting.
Should there be a need to identify resources more precisely than they are known at the time the baseline is taken (e.g., analysis of named individual time is required, but only the skills needed are known at the time the baseline is taken), P6 also allows resourcing of activities by role. This allows the user to book a budget on the schedule without knowing exactly which resource is going to do the job.
Baseline and Other Reference Plans
P6 can save any number of versions of a schedule to be used as references and compare to the current schedule when required. This can include the baseline, any re-baseline following a change order, any periodic copy of the schedule or what-if analysis versions of the schedule that someone may want to compare with the current schedule.
Each reference plan contains a full copy of all the information contained in the schedule. It is therefore possible to compare schedule information – such as dates, duration and float – resource
Primavera P6 493
information – such as requirements or actual usage – and cost information – such as budget, earned value or actual cost.
Baselines can also be updated by copying a selected subset of the current project infor-mation into an existing baseline. This makes it much easier to adjust the content of the baseline to the current scope without affecting the part of the project that was not affected by change management. As any number of reference plans can be maintained, this enables earned value analysis against the original baseline, or against a current baseline reflecting the current scope of the project.
Progress Tracking
P6 has very flexible rules for tracking progress to allow each organization to track only information deemed to be relevant. Progress-related quantities such as remaining duration, actual and remaining units, and cost can be linked or entered separately. This allows each company to decide on what information should be tracked, while making reporting available for all based on the level of detail that can be gathered.
Depending on the requirements, progress can be displayed based on the current schedule or mapped on the baseline in the form of a progress line.
As different organizations find different information to be relevant, it is possible to choose from many percentages to report progress, such as (but not limited to) physical percent complete, labour unit percent complete, material cost percent complete or cost percent of budget.
P6 also calculates the variance between the baseline and the current schedule in terms of duration, dates and units of resources by type or costs.
Earned Value Analysis
As P6 tracks dates, resource usage and costs at detailed level, and as reference plans, including the baseline, are maintained with the same level of detail, earned value analysis can be performed at any level required. As for any information in the system, earned value information can be summarized according to any angle considered useful for analysis, be it through the use of the WBS or any coding.
P6 calculates and aggregates earned value information automatically. This can be displayed as easily as any current plan information. If the decision is made to track the relevant information, earned value fields available in P6 include for both labour units and total cost: actual, planned value, earned value, estimate to complete, estimate at completion, cost

494 Chapter 51
performance index, schedule performance index, as well as cost, schedule and variances at completion.
Based on the level of confidence in progress tracking, it is possible to define different rules for the calculation of earned value. It is also possible to consider the cost performance index and schedule performance index to date in the calculation of the estimate to complete.
Risk Management
As standard, P6 includes a risk register. As with the rest of P6, this risk register can be configured to contain the relevant information for a company. Probability, impact type and impact ranges can be defined to reflect the important factors for a specific company. The system allows the definition of as many impacts categories as needed, to help reflect quantifiable impacts, such as schedule and costs, as well as other impacts, such as image, health and safety or environment.
Once qualified with levels or probability and impacts, P6 will rate the risk based on a configurable risk-rating matrix. The overall rating of a risk can combine the impact ratings in different ways, by selecting the highest one, the average of the impacts or the average of the impact ratings.
Running a Monte Carlo analysis on a schedule requires Primavera risk analysis. It is possible to store 3-point estimates in the P6 schedule though, so the uncertainty can be maintained within the main schedule.
Multi-Project System
Even though schedules are split in projects in the database, P6 handles multiple projects as if they were just subsets of activities, part of the same total group. This means that reporting makes no difference between single and multi-project content, but also that scheduling can be done across all the projects.
Even while opening only one of a group of interdependent projects, the user has a choice between taking into account interdependencies or not during the scheduling calculations. Similarly, one can analyse resource utilization based on only the schedule he or she is working with, or include requirements from other projects. If needed, projects can be prioritized so as to only consider projects of a high enough priority in the resource analysis.
Role-Based Access
There are two main ways to access P6: through the web or by using the optional Windows client. The later requires a high bandwidth between the client and the database server, or the
Primavera P6 495
use of virtualization technology such as Citrix or Terminal Services. It is a powerful tool, but the high number of functions available makes it feel complex for users who do not have much time to learn it. This makes it a specialist tool, perfect for planners or central project office people, but less appealing to people who only have limited interactions with planning.
The web access of P6 lets users connect to the P6 database through a web browser-based application. It is both simpler and more complete. It is simpler in that, when looking at a specific function, the interface is not quite as busy as the Windows client. Yet, it is more complete in that it provides views and functions that are geared towards the different roles participants of the project may play in the project.
From the resource assigned to a few tasks on a project to a company director interested only in traffic light type reporting on cost and schedule for each project, P6 Web can display relevant information to each person involved based on their involvement. Resources can see the tasks they are assigned to, including detailed information about those tasks and documents that may be attached to the tasks to help complete them. Planners can see the schedule, with similar functionality to what the optional Windows client provides. Project managers can see high-level reporting and analysis on the schedule, costs and resources, with drill-down capability to find where the problem is. Resource managers can view how busy their team is across all the projects in the company, as well as details of what each individual is working on. Executives and directors can have portfolio or programme-level traffic light type report-ing, with high-level schedule, cost, resource or earned value figure summarized at any level that makes sense to them.
For each role identified, the administrator can provide a dashboard that will contain easy access to each report and function needed for that role. The content of those reports and function portlets will be based on the individual, the activities he is assigned to, the projects he is in charge of, or the portfolios that are relevant to that user. As users could have several roles, they can subscribe to several dashboards.
Reporting
Most of the reporting out of Oracle Primavera P6 is based on viewing or printing on-screen layouts. In agreement with the role-based access described above, P6 offers many ways to present and aggregate the project information based on the person accessing this information. These ways of viewing project information are usually enough for most people. However, should people prefer to get reports delivered in other formats, it is possible to use Oracle BI Publisher, which comes bundled with P6 licences.
With BI Publisher, users can schedule reports to be run at specific times, and either made available on a website or sent by e-mail. These reports can be created in a number of formats, including MS Office tools and Adobe PDF.

496 Chapter 51
Using P6 Through a Project Life Cycle
The following pages describe the planning, execution and control of a project using P6.

Primavera P6 497

498 Chapter 51

Primavera P6 499

500 Chapter 51

Primavera P6 501

502 Chapter 51

Primavera P6 503


Primavera P6 505

506 Chapter 51

Primavera P6 507

508 Chapter 51

509Project Management, Planning and Control. http://dx.doi.org/10.1016/B978-0-08-102020-3.00052-8Copyright © 2017 Elsevier Ltd. All rights reserved.
CHAPTER 52
Building Information Modelling (BIM)
Chapter OutlineIntroduction 509History of BIM 510What Is BIM 512UK Government Recommendations 513How BIM Is Applied in Practice 514
Tekla Structures 514
Linking Systems Through Open .NET Interfaces 515Tekla BIMsight and Other Collaboration Tools 516Savings With BIM 516Sample BIM Projects 517
Alta Bates Summit Medical Centre – by DPR Construction Inc. 517The National Museum of Qatar (Arup) 520
Challenges 520Leeds Arena, UK, Fisher Engineering Limited 521A BIM Strategy Was Essential for Efficiency 524Technical Detail 524
Interoperability and Principle Industry Transfer Standards 525DXF, DWG, DWF and DGN Formats 525IGES and STEP 525SDNF Format 526CIS/2 Format 526IFC Format 526
Further Reading 527
Introduction
Technology to access and control construction information is constantly changing based upon cost or timesaving requirements, and the relevant project information is always required to be accessible and editable on various devices and platforms. For example, even preparing this chapter has involved storing information on The Cloud, interfaced from a smartphone, tablets, various laptops and PCs, all on different platforms, and this is just for controlling text and a few graphical files. The construction industry is moving to digital integrated design team project delivery on platforms such as Trimble Connect (www.connect.trimble.com) or Bentley ProjectWise, with all of the required information (specification, models, point clouds,

510 Chapter 52
drawings, reports, etc.) being available at any stage of the contract and beyond. Each project design team can be formed from many different players depending on the actual work requirements and content. For example, a design team could include the client; architect; engineer; MEP (mechanical, electrical and piping); contractors; etc. One of the processes that support these developments is building information modelling (BIM). BIM is not a single 3D application, but a process that streamlines the product model content and delivery.
It is worth concentrating on the ‘Information’ part of B’I’M before addressing the actual BIM process itself. Information always needs to be collected and contained in a physical object or system. From a historical point of view, this could have been on many drawings or nowadays a ‘project library’ could be made available for the reader or viewer. This really is the same with BIM; however, the whole project information is not just available as an online encyclopaedia, but broken down to object-level nuggets of information for ease of reference.
A product model can be built or defined with a 3D or 4D application, where the latter is the 3D information which also encapsulates the relevant time information. This can also include manufacturing information, start and completion dates, maintenance information and even the required special demolition procedures, as the model can support the full life cycle of the building or project. However, the BIM model is not limited to just 4D information, as costing can also be included, which is sometimes referred to as 5D information, or anything else that the user wants to track (nD information) and control.
Sometimes, BIM is thought to be just another service that provides users with instant online access to an ever-increasing stream of constantly evolving, instantly updating digital data. However, if the processes are in place then real project control is possible. Many times it is said that: ‘Nowadays to change a pump physically on a building site is relatively simple. However, changing all of the 3D models, drawings, sketches, specifications etc. is the hard and time-consuming part.’ Adopting the BIM process will revolutionize this, as the information has only to be changed once with authoring the application, after which the rest of the design team members can simply reinsert the new ‘reference model’, with all the latest information, ensuring all the models are up to date.
History of BIM
2D drawing systems have been used since the early 1990s only as ‘electronic drawing boards’, copying and pasting details or ‘blocks’ to reproduce drawings quicker than the older manual processes. However, as far as interoperability was concerned there were no real advantages. Various applications allowed different drawings or blocks to be imported into the working drawing, using some form of ‘XREF’ options, which really was the start of the reference model concept.
Building Information Modelling (BIM) 511
General computer-aided design (CAD) tools were used for a while, leading to bespoke solutions which were developed to suit each industry or design team member’s requirement. For example, tools used by architects would require different functionalities from the toolkit required by engineers. Also, a structural engineering application would have different drawing requirements from a mechanical, electrical and piping (MEP) solution. It is interesting to note that in many companies the technicians will produce the drawings, with engineers just resolving typical project sections or sketches.
In the building and construction sector, ‘information modelling’, is normally defined as the computer representation of a building or structure, including all the relevant information required for the manufacture and construction of the modelled elements. The elements or objects are required to be intelligent and should therefore know what they are; how they should behave in different circumstances and know their own properties and valid relationships. A simple example of this would be the reinforcement in a pad foundation. If the foundation size is modified, then the embedded reinforcement should dynamically update and reposition itself accordingly. This is very different from a computer-generated model, which is constructed for purely visualization purposes, where every object is a non-related element.
The structural steelwork industry is normally recognized as the lead sector in 3D modelling solutions, and their developments can be traced back over the last 30 years with applications such as the forerunner of Tekla Structures. This type of applications allowed the 3D steel frame to be modelled and the connection applied by the user-defined macros, which allowed the automatic production of general arrangement drawings, fabrication details and then, after a few more years, the development of links to CNC (computer numerically controlled) machines, for cutting and drilling of steel profiles and fittings.
Once the 3D modelling technology was extended to include parametric modelling (true solid objects), clash detection systems were then developed. Hard or soft (allowing for access) clash detection allows application to identify any possible material overlapping conditions or objects existing in the same space.
Nowadays, globally unique ID or globally unique identifier (GUID) is available in most applications, which are unique strings usually stored as a 128-bit integer associated with the objects. The GUID is used to track the objects between applications for change management. Some systems allow the support for internal and external GUIDs. The term GUID usually, but not always, refers to Microsoft’s universally unique identifier (UUID) standard.
In the initial stages of BIM, only drawings and reports were made available to others, as the actual BIM model was always confined to the office where the more powerful computers were situated. However, as computers advanced, the models are now accessible on laptops and, over the last few years even on tablets for site use, either located on the device or available from the cloud.
512 Chapter 52
What Is BIM
So what is BIM? It could simply be defined as a rapidly evolving collaboration tool that facilitates integrated design and construction management. The importance of ‘I’ in BIM should never be underestimated, as this becomes a project or support for the company’s enterprise framework and not just a means for ‘building models’. This information means that more work can be done earlier in the project to support green issue concepts, as less waste saves both materials and energy.
BIM enables multidimensional models including space constraints, time, costs, materials, design and manufacturing information, finishes, etc. to be created and even allows the support for information-based real-time collaboration. This information can be used to drive other recent technologies including city-sized models, augmented reality equipment used on site, point clouds of existing buildings and equipment, radiofrequency identification (RFID) tags to track components from manufacture to site and even the use of 3D printers.
It may be useful to consider the players who would want to have access to the BIM models. Not limiting the list they could include – the internal and external clients, local authorities, architects, engineers (structural, civil and MEP), main contractors, steelwork and concrete subcontractors, formwork contractors and all site personnel. Until recent years BIM has just been available as a solution for architects, engineers and steelwork contractors, etc., leaving everyone else just to work with 2D drawings that may be industry-specific, but not being totally readable without knowledge of that environment.
Various references have been made to architects’ BIM model or the structural BIM. However, they really are the same, as the boundaries between their models and their content are reduc-ing all the time. Architects’ BIM models will include structural member; however, the models that they produce do not normally require including the material grades, reactions and fin-ishes, whereas the model produced by the steelwork contractor will include at least the manufacturing details and all the information necessary to order, fabricate, deliver and erect the members. The MEP contractor could also define the site fixings on their version of the model, as the contractor will want to know when the assemblies will be delivered to site, where it will be fixed or poured, and how much the item costs. The client’s view of the same member would be for control and for possible site maintenance. For this reason, various models are created in the ‘best-of-breed’ authoring applications and shared with other design-team members as reference models, which are normally in the form of industry foundation class (IFC) files for all structures except the plant and offshore markets, where CIMsteel Integration Standards (cis/2) and dgn format files are the dominant interoperability transfer model formats.
It is so much easier to work with a BIM model and to explore the building in 3D with rich information, than looking at hundreds or thousands of drawings and having to understand the

Building Information Modelling (BIM) 513
industry drawing conventions. Now a user can simply click on to an object and obtain all the information that they require either through the native object, if on the authoring application, or through the reference model or even from a viewer or collaboration tool directly from the cloud.
UK Government Recommendations
The UK and other global governments have expressed support for BIM over recent years. However, in March 2011, the UK government published a BIM strategy paper, full details of which can be downloaded from www.bimtaskgroup.org. In fact, the UK government has made it clear that BIM level 2 needs to be adopted on all of their projects by 2016, to save the model objects from being rebuilt many times within the same project by different design team members.
The main aims and objectives of the working group are to: • Identifyhowmeasuredbenefitscouldbebroughttotheconstructionindustrythroughthe
increased use of BIM methodologies;• IdentifywhattheUKgovernment,asaclient,needstodotoencouragethewidespread
adoption of BIM;• ReviewtheinternationaladoptionofBIMincludingthesolutionsbytheUSFederal
government; and• LookintogovernmentBIMpolicytoassisttheUKconsultantandcontractorbaseto
maintain and develop their standing in the international markets.
The general recommendations were to: • Leavecomplexityandcompetitioninthesupplychain;• Beveryspecificwithsupply-chainpartners;• Measureandmakeactiveuseofoutputs;• Provideappropriatesupportinfrastructure;• Takeprogressivesteps;and• Haveacleartargetforthe‘trailingedge’oftheindustry.
The report also defines the project BIM maturity levels, from level 0 to level 3 and as a quick summary: • Level0iswherejustCADtoolshavebeenadopted.• Level1iswhere2Dand3Dinformationisusedtodefinedstandards.• Level2iswhereBIMapplicationsareusedwithfullyintegratedmodelcollaboration.• Level3iswhereBIMmodelsareusedforproject/buildinglifecycle
management.

514 Chapter 52
The UK Government’s main targets in the report were: • 20%reductionincosts.• Level2BIMby2016.• COBieinformationshouldbeavailablefordecision-makingatcriticalpointsinthe
design and construction process.
COBie information is a formal schema that helps design teams to organize architectural BIM object information into spreadsheets that are normally shared with other project players for facility management.
Also with the initiative from the BIMForum (www.bimforum.org), there is currently much interest inthelevelofdevelopment(LOD)oftheBIMmodelobjects,sotheclientcanobtainaclearpicture of their expected BIM deliverable quality. For full information see www.bimforum.org/lod.
In very general terms, these levels are: • LOD100–Agraphicallyrepresentedobjectmainlyusedforcost.• LOD200–Agenericobjectwithapproximatesize,shapeandlocation.• LOD300–Design-specifiedobjectwithfullspecific,size,shapeandlocationofbrackets
and corbels, etc.• LOD350–Actualobjectmodelwithfullspecification,size,shape,location.• LOD400–Similarto350,plusallrelevantprojectinformationandfinishesincluding
rebars and accessories for concrete members and all fittings for steel members.• LOD500–Similarto400includingasite-verifiedreports,testcertificatesandCE
marking information.
How BIM Is Applied in Practice
If a BIM model is created or being amended on the authoring application, it is normally referred to as a physical or native model, which can be enhanced using normal authoring tools. If the model is required to be fixed (not editable) by one design team member, then an IFC file or other reference models are normally adopted, where objects can be commented upon but not changed by other members of the design team.
Tekla Structures
Tekla Structures is a multi-material BIM software tool that streamlines the construction design and delivery process from the planning stage through design and manufacturing, providing a collaborative solution for the cast-in-place (in situ)/precast concrete, steelwork, timber, engineering and construction segments.
The structural BIM is the part of the BIM process where the majority of multi-material structural information is created and refined. These are normally created by the structural
Building Information Modelling (BIM) 515
engineer as the architects generally just work with space, mass, texture and shapes, and not with building objects in the same way as defined in the structural BIM. However, the connec-tion between the architects models and structural BIM is a very obvious way to help in the future development of intelligent integration, and these should be always available in the form of reference models in the same way that the XREF function is used in a 2D drawing. These reference models could also be used as 2D information for collaboration with non-BIM applications.
The model starts to evolve during the engineering stage, where conceptual decisions of the structural forms are made. It is sometimes thought that the design portion of analysis and design (A&D) is just the pure physical sizing of the structural elements. It is in fact more than that, as it should also include the engineering and the ‘value engineering’ of the project, including all materials, their relationships and their reference to the architectural and service objects, together with possible links to other design application using .NET technology to form an application programming interface, or API as it is more commonly known.
In its basic form, .NET is a flexible programming platform for connecting information, people, systems and devices together using a programming environment and tools based upon the Microsoft Visual Studio .NET developments. There are over 30 programming languages that are .NET enabled which allow true object information to be seamlessly transferred between systems. So, for example, element information and geometry can be passed from modelling applications to any other .NET enabled system. These could be A&D systems, management information systems (MIS), cost control or just systems used for internal bespoke company development down to the humble excel spreadsheet.
One of the principal advantages of the structural BIM is that the project is built for the first time in the memory of the computer, before any physical materials are involved. This allows the scheme to be refined to a greater extent, allowing full clash checking facilities, automatic drawing production, bar-bending schedules and report preparation. Modern application also allow the drawings and reports to be automatically updated should the model be amended, thus change management can be controlled and different design solution scenarios can be considered at any time together with having links back to the A&D systems if required.
For further information on the Tekla Structures or the applications authors Trimble Solutions Corporation, see www.tekla.com. For web tutorials on Tekla Structures or for general BIM lessons information see www.campus.tekla.com.
Linking Systems Through Open .NET Interfaces
Sometimes, using industry standard files is not appropriate when tight linking of applications is required. For example, a user may want to share design information among modelling systems and say an A&D application; MIS; enterprise solutions; connection and fire

516 Chapter 52
engineering applications; project management systems or planning systems. In such a case, the objects, a simplified form of the object or just the object attributes, can be passed between systems using the Open .NET interface as defined above. This same interface could also be used for model transfer or for repetitive processes such as drawing and report creation.
Tekla BIMsight and Other Collaboration Tools
Tekla BIMsight is a free BIM collaboration tool which is available for anyone to download and install. It runs on a normal PC environment and is an easy to access application that presents the complete project including all necessary building information from different construction disciplines. It is also much more than a viewer as the user can communicate using the various IFCs and other models not just from Tekla Structures.
With Tekla BIMsight the user can: • CombinemultiplemodelsandfileformatsfromavarietyofBIMapplicationsintoone
project;• Sharebuildinginformationforcoordinationbetweendifferenttradesanddeliverables;• Identifyandcommunicateproblemareas:checkclashes;managechanges;approve
comments and assign work in 3D by storing a history of different view locations and descriptions in the model;
• Measuredistancesdirectlyinthemodeltoverifydesignrequirementsandconstructiontolerances;
• Controlthevisualizationandtransparencyofdifferenttypesofpartsinthemodeltomakeit easier to understand complex and congested areas of the project; and
• Querypropertiessuchasprofile,materialgrade,lengthandweightfromparts.
Tekla BIMsight can be downloaded from www.teklabimsight.com which also includes video tutorials and a user forum.
In addition to Tekla BIMsight, Trimble Solutions Corporation also produces Field3D (www.teklabimsight.com/tekla-field3d), which is an enhanced collaboration tool that runs on both Apple and Android devices and also has a cloud service option.
Savings With BIM
Recentreportsfromanumberofglobalorganizationshaveconfirmedthataround50%ofstructural engineers are adopting BIM on a regular basis.
It is always hard to establish the return on investment and project savings with regard to any software systems. However, as the BIM project is created within the memory of the computer before involving any materials or site personnel’s time the change is inexpensive. Various reports and white papers regarding the cost of change and constant remodelling was one of the reasons for the UK Governments BIM initiative.

Building Information Modelling (BIM) 517
Sample BIM ProjectsAlta Bates Summit Medical Centre – by DPR Construction Inc.
A $289 million, 13-storey, patient-care pavilion and future home of over 200 licenced beds is a new addition to the Alta Bates Summit Medical Campus (ABSMC) and the facility is due to open in January 2014. DPR’s highly collaborative integrated project delivery (IPD) team was faced with many challenges during this project. The use of Tekla Structures and Tekla BIMsight has grown significantly since start of construction in 2010. Modelling scopes within Tekla Structures includes structural steel, cast-in-place concrete, reinforcing bar, miscella-neous steel and light gauge drywall framing.
Seismic design requirements set forth by the Office of Statewide Healthcare Planning and Development in addition to a hybrid steel and concrete shear wall structure required in-depth coordination between rebar and steel-fabrication models. These coordination efforts between multiple trade partners could not have been achieved without the use of this highly collaborative and detailed BIM platform. Since subcontractors Herrick Steel and Harris Salinas Rebar were both detailing with Tekla, it was very useful to provide the rebar detailer with the steel model during detailing to identify constructability issues with anchor bolts, stiffener plates and other connection details that were not shown in the engineering design model.
More recently, the ABSMC Project had implemented the concept of dynamic detailing within Tekla Structures on both the reinforcing steel and drywall framing. By referencing in the structural steel Tekla model along with IFC models of the MEP&FP systems, Harris Salinas Rebar and DPR Self-Perform Drywall were able to identify conflicts during the process of modelling, as opposed to the traditional method of modelling in a silo and having to rework the modelling after clash detection. This workflow results in a more efficient, streamlined workflow with fewer chances for modelling errors.
The DPR Self-Perform Drywall detailer, Robert Cook, has developed an efficient workflow to detail the rebar using multiple custom components. Robert Cook is also creating drywall framing assembly spool sheets that can be printed to 11″×17″ or viewed on an iPad to help the site team to increase efficiency and quality while reducing rework. As all the ductwork is fabricated and assembled directly from the model, DPR drywall is now able to install framing around the duct and pipe openings prior to MEP installation, and be confident that the fram-ing is in the right location to align with the prefabricated ductwork and piping.
In addition to Tekla Structures, Tekla products have been used to convey differences between site conditions and the design model related to the exterior skin and expansion joints. The ABSMC project requires seismic expansion joints where surrounded on three sides by the existing hospital campus and around a 5-storey pedestrian bridge. The comment tool, dimen-sioning tool and photo attachments were used to convey coordination and constructability issues to the designer, fabricator and installer.

518 Chapter 52
Actual drywall framing around the MEP equipment.
Model of the drywall framing around the MEP equipment.
Tekla BIMsight showing model to site comparisons.

Building Information Modelling (BIM) 519
Drywall assembly ‘spool sheet’ from Tekla structures.
PCP tower adjacent to the existing hospital.

520 Chapter 52
Architect’s rendering of the Alta Bates Summit Medical Centre.
The National Museum of Qatar (Arup)
TheNationalMuseumofQatarinDohaistheflagshipprojectforanimportantseriesofculturalandeducationalprojectswhichwerecommissionedbytheQatarigovernment.The project, which drew inspiration from the desert rose, now started on site and was in the planning phase since 2008. The desert rose is a crystalline formation found below ground in saline regions of the desert. When imagined as a building, the result is a 4-storey, 300 × 200 m2 sculpture of intersecting discs which are up to 80 metres in diameter.
The evolved structural solution consists of radially and orthogonally framed steel trusses, supporting fibre-reinforced concrete cladding panels to create the required aesthetic and performance characteristics of the building envelope.
Challenges
The key challenges for the design were the highly complex geometry of the disc interactions. No two discs were the same and no two discs intersected each other in precisely the same way. The galleries and other key spaces in the building were created by the interstices between the discs; any alteration to the architecture involved moving discs and thereby moving the structure within the discs. This led to an evolution of systems and processes which were required to handle, manipulate and develop geometric ideas from the architects, so that engineering solutions could be established before communicating these in their most useful form to the wider project community.
For this reason, the following structural modelling (for analysis, design and manufacturing and construction) needed to address the following requirements: • Positiontheelementsinthecorrectplaceinthe3Dspacewithinthecladdingenvelope.

Building Information Modelling (BIM) 521
• Generateandmodelelementsasefficientlyandautomaticallyaspossibleinordertokeepup with iterations of the architectural arrangement.
• Facilitatecross-disciplinecoordination,bothwiththeArupMEPdesignand3Dmodel-lingteamsinLondon,plusthearchitecturalteambasedinGenevaandParistogetherwiththeclientinQatar.
National Museum of Qatar.
Showing the complex building geometry.
Leeds Arena, UK, Fisher Engineering Limited
LeedsArenaistheUK’sfirstpurpose-built,fan-shapedarena.Usingthisformofgeometryallowsevery spectator to have a perfect view of the centre stage. The main facades are rounded and have a domed effect which terminates with a flat roof. Formed with two columns, one sloping outwards and the second spliced to the top and cranked inwards, these curving elevations are clad with a honeycomb design of glazed panels which contain lights of changing colours.

522 Chapter 52
Leeds Arena project.
The steel framed structure of the roof is supported by a series of 13 trusses spanning up to 70 metres across the auditorium with five central trusses being supported over the stage area by a 170 tonne trussed girder and plated columns, which form the 54 metre long × 10.5 metre deep proscenium arch. The proscenium arch truss was delivered to site in 32 separate sec-tions; a total of nine trailer loads. Assembling the truss took 3 weeks, using two large mobile cranes.
Section through the Leeds Arena project.
The bowl terraced seating is formed from precast concrete units supported on a radial steel-work structure, braced and tied into two main concrete stair cores which provide the required stability. Acoustic resistance is a major design factor for a venue of this size, which is situated within a city centre and required the structure to be shrouded in a skin of precast concrete wall panels with a concrete roof topping on a metal deck.
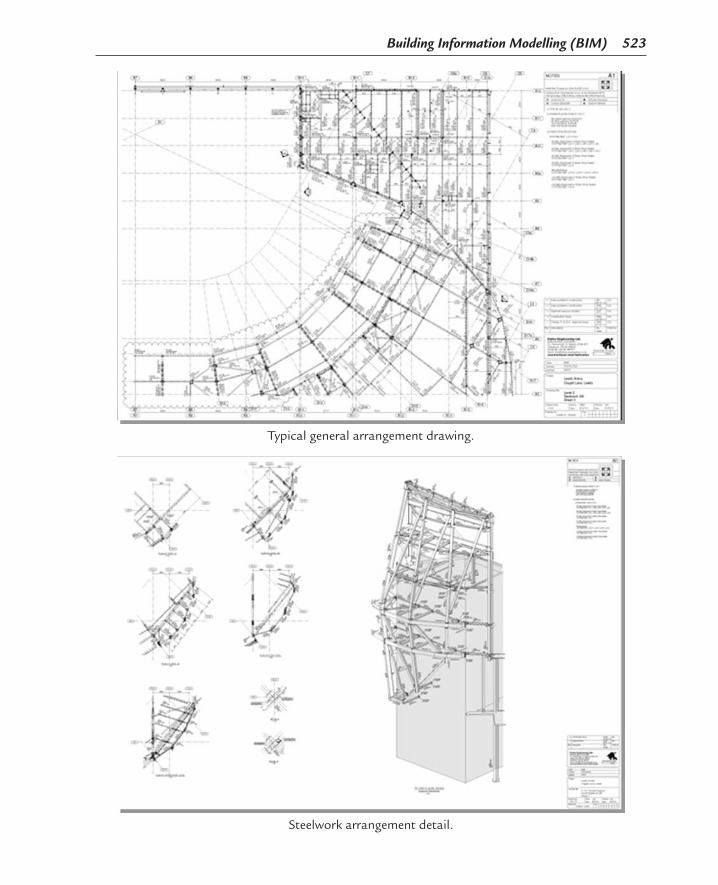
Building Information Modelling (BIM) 523
Typical general arrangement drawing.
Steelwork arrangement detail.

524 Chapter 52
A BIM Strategy Was Essential for Efficiency
With so many subcontractors providing major structural element, all of which required prefabricated connections to interface with the complex geometry, it was clear from the start of the project that a BIM strategy was essential to obtain the necessary project efficiencies through the evolving design and collaboration process. The BIM model proved invaluable to all parties involved as it was passed between the design team and contractors for clash detection and for the resolution of incomplete design issues. This greatly assisted the project programming, sequencing and general constructability.
Model of the bowl terraced seating.
Arena during construction.
Technical Detail
For readers who are interested in more technical details, the following section may be of interest. The various industry abbreviations and acronyms are explained below.

Building Information Modelling (BIM) 525
Interoperability and Principle Industry Transfer Standards
3D interoperability between various building and construction applications are generally achieved through industry standard formats, such as dwg; DXF; SDNF; cis/2 and IFC, with the older systems being listed first. Other bespoke links have been adopted in the past based uponXML(extendedmark-uplanguagewhichisbasicallyanextensionofHTMLusedforcreating websites) or special file formats. Excel sheets have also been used in the form of reports or to enhance various applications. It is generally accepted to adopt the full BIM process, as only IFC files are advanced enough to support all of the objects of building models.
DXF, DWG, DWF and DGN Formats
DXF (drawing exchange format) was developed by Autodesk for enabling data interoperabil-ity between AutoCAD and other programs. As the file format does not contain any form of part ID, it is not possible to track changes between different physical objects contained within different versions of a file.
DWG – File format used for 2D and 3D CAD data and is the standard file format for Autodesk products.
DWF (design web format) – a secure file format developed by Autodesk for efficient distribu-tion and communication of rich design data, normally created with DWG drawings. However, it is rarely seen within the BIM environment.
DGN – the standard reference file transfer between plant design programs. Originally developed by MicroStation, which is now part of Bentley Systems Inc., it is similar to DWG in that it is only a graphical data format, but does contain part ID’s unique for the given model.
IGES and STEP
Initial graphics exchange specification (IGES) defines a neutral data format that allows the digital exchange of information among CAD systems. It was defined by the U.S. National Bureau of Standards and is largely been replaced by the Standard for the Exchange of Product Model Data (STEP) over recent years.
The International Standardization Organization (ISO) is concerned with creating the stan-dards for the computer interpretable representation and exchange of product manufacturing information, so STEP files are available across many manufacturing industries. In the con-struction market, it is normal to only see files relating to ISO 103003 AP230 and these are generally treated as reference files.

526 Chapter 52
SDNF Format
Steel detailing neutral file (SDNF) was originally defined for electronic data exchange between structural engineers, A&D and design systems to steelwork modelling systems. Version 3.0 is the latest format supported by the software industry and this format has been used for many years for transferring even complex plant structures between system such as Tekla Structures and plant design systems such as Intergraph’s PDS or Aveva’s PDMS applications.
As a quick overview, the SDNF files are split into packets and records. The main packets are defined as follows and generally not all items are supported by all applications:
Packet 00 – Title packetPacket10–LinearmembersPacket 20 – Plate elementsPacket 22 – Hole elementsPacket 30 – Member loadsPacket 40 – Connection detailsPacket 50 – GridsPacket 60 – Curved members
CIS/2 Format
The CIS (CIMsteel Integration Standards) is one of the results of the European Eureka CIMsteel project. The current version ‘cis/2’ is an extended and enhanced second-generation release of the format, which was developed to facilitate a more integrated method of working through the sharing and management of information within, and among, the companies involved in the planning, design, analysis and construction of steel framed buildings and structures. There are a number of different format versions, analysis, physical and manufac-turing formats for steel structures, and the physical format has been widely used in the structural steelwork sector in the past.
The only downside of this format is that true multi-material objects cannot be defined as the standard really just concentrates on steel objects. However, an extended cis/2 format has been adopted by Intergraph and Tekla to link the Smart 3D plant design application to Tekla Structures within the last few years.
IFC Format
The latest and most complete transfer standard used within the BIM environment is the industry foundation class (IFC) as defined by the buildingSMART organization (www.buildingsmart.com) which was formally called the International Alliance of Interoperability.

Building Information Modelling (BIM) 527
The organization defines itself as ‘buildingSMART is all about the sharing of information between project team members and across the software applications that they are commonly used for the design, construction, procurement, maintenance and operations’. Data interoper-ability is the key enabler to achieving the goal of a buildingSMART process. BuildingSMART has developed a common data schema that makes it possible to hold and exchange relevant data between different software applications. The data schema comprises interdisciplinary building information as used throughout its life cycle. The current version of the standard is 2×3, whilst the next version IFC4 has been defined and many applications are currently being undated to adopt this latest standard.
True building objects as defined by architectural, engineering, MEP and other systems can be shared with IFC. This allows the users to use the systems that they know, or that are best for creating the objects which are normally referred to as ‘best-of-breed’ systems. Adopting the IFC standard allows true object information to be shared between the major modelling applications. Different IFC formats and flavours are available, so the users need to know which one is adopted and this can normally be determined just by looking at the header part of the IFC file.
Further Reading
Briscoe, D. (2015). Beyond BIM. Routledge.Kumar, B. (2016). A practical guide adopting BIM in construction projects. Whittles.Paterson, G. (2015). Getting to grips with BIM. Routledge.Sauchez, A. X. (2016). Delivering value with BIM. Routledge.Saxon, R. (2016). BIM for construction clients. NBS.

This page intentionally left blank

529Copyright © 2017 Graham collins. Published by Elsevier Ltd. All rights reserved.
APPENDIX 1
Agile Project ManagementGraham CollinsFaculty of Engineering Sciences, University College London
Having an adaptable process of development that can respond to rapidly changing economic conditions is one way organizations can compete effectively. Agile project management enhances the ability of teams and organizations to react to these changes. Traditional approaches to project management often entail following a set plan, and if there is any divergence from this plan the project manager is often expected to correct this or seek approval for any revised plan. Agile approaches, however, recognize that goals will inevitably change and that achieving value for the client should be the most important consideration.
It is often the case that during a development process the requirements will have substantially changed. The longer the time interval from requirements gathering to delivery, the more likely the client will indicate that what has been developed does not meet their needs. Also, it is unlikely that many of the requirements will still be considered important after a few months or even at the start of development. During workshops with clients, it often occurs that every participant volunteers at least one requirement, but if after outlining this list there is a voting opportunity for the priority of these requirements, it is likely many of them are not voted for at all. It is not only that the client team needs to see a prototype, often to understand what they truly want, but it is also likely that any software developed may change the business processes to such an extent as to make the original requirements even more obsolete.
One way to reduce the risk of development being detached from what is actually required by the client is to provide a more frequent feedback to the client including what is being developed. Agile project management accelerates the feedback cycle and actively involves the customer in the prioritization of the requirements and design of the product. Delivering a product after 12 or 18 months runs the risk that the business needs have changed or that the client team realizes on viewing the software it is not what they actually want. It is better to have a set regular feedback cycle continually prioritizing the most valuable functionality and delivering some thread of working software for the client to comment on. Producing a tangible software or product at regular intervals and having a continual communication cycle, involving the client, is at the heart of agile methods.
Traditional planning is typically based on the concept of delivering a project within a set budget within a set schedule. The agile philosophy encompasses delivering high value products or

530 Appendix 1
software as rapidly as possible. Ensuring that this delivery benefits from regular feedback enhances this value. It also ensures that within a fixed time the greatest value in terms of the functionality as prioritized by the client is delivered. The shift for both the organization and the project manager is one from delivery of a project to schedule and budget to one of delivery of the highest value within the time and other constraints set.
It is through a cycle of iterations and release, with continual working software of product developments, that trust is built, and the client can see that every release is providing increased functionality and business value.
The Paradox
Managers typically wish to know how much and how long a project will take and yet they still want to have the flexibility to respond to the business environment and embrace innovation. How can we achieve flexibility and respond to change, and at the same time follow a plan? The answer is partly in granularity, considering the capabilities at a high level of abstraction for planning and allowing development teams to define specific tasks according to the needs of the project. Agile is inherently measurable because of the clear regular cycles and internal and external measures. At a high level of abstraction, these are the regular releases defined by the needs of the project, domain and agile method, often every 90–120 days. Within these there are the iterations of 1 month or shorter cycles. And furthermore, within a day there is the daily cycle identifying what has been delivered, what are the problems and what will be done next. Within this, especially in software development, there are cycles that are achieved within even shorter periods by development teams using test-driven development and automated testing techniques.
Definitions of Success Are Part of the Problem
If we measure success in terms of achieving the original specifications, then measuring agile projects that are designed to incorporate changes in goals to achieve maximum business value to the client are bound to be problematic. What is needed is to base measures on what the client considers of value and for this to be updated continually. In agile methods, and particu-larly with the Scrum method, this is achieved via the product owner who is the client repre-sentative on the team. Typically, the product owner is part of the development team who represents and works closely with the client or client team to determine the most valuable capabilities and constituent features. At the start of each iteration, they will all be involved in prioritizing features from capabilities they have identified into a finer detail of functionality expected from the system. Dependent on the method, the requirements may be in the form of user stories to gain some idea of how users will use the system. It is through this process that the product owner with the development team prioritizes the most valuable stories for the coming iteration. This cycle continues so that at any given point the project has delivered the highest value functionality as defined by the client.

Agile Project Management 531
One advantage of reducing cycle time is that the team soon learns what is working and what is not, and can correct the development as necessary. Another advantage is that valuable working software or products are brought into use earlier, starting to contribute economic benefits, so that the project reaches the breakeven point and provides a return on investment (ROI) sooner.
What Is Agile?
Jim Highsmith (2010) outlines that being agile is not a silver bullet to solving your develop-ment or project management problems. He characterizes agile in two statements: ‘Agility is the ability to both create and respond to change in order to profit in a turbulent business environment. Agility is the ability to balance flexibility and stability’ (Highsmith, 2002).
The concept of iterative and incremental development is not new, and developers in the 1980s and 1990s were designing light methods aimed at involving the development teams and customers in closer collaboration. An alliance of these developers met in Snowbird, Utah, in February 2001 to see if there was anything in common between the various methodologies being used at the time. They agreed on an agile manifesto and values (below) supporting the manifesto. The latest updates to this can be found at www.AgileAlliance.org: • Ourhighestpriorityistosatisfythecustomerthroughearlyandcontinuousdeliveryof
valuable software.• Welcomechangingrequirements,evenlateindevelopment.Agileprocessesharness
change for the customer competitive advantage.• Deliverworkingsoftwarefrequently,fromacoupleofweekstoacoupleofmonths,with
a preference to the shorter time scale.• Businesspeopleanddevelopersmustworktogetherdailythroughouttheproject.• Buildprojectsaroundmotivatedindividuals.Givethemtheenvironmentandsupportthey
need, and trust them to get the job done.• Themostefficientandeffectivemethodofconveyinginformationtoandwithinadevel-
opment team is face-to-face conversation.• Workingsoftwareistheprimarymeasureofprogress.• Agileprocessespromotesustainabledevelopment.• Thesponsors,developerandusersshouldbeabletomaintainaconstantpaceindefinitely.• Continuousattentiontotechnicalexcellenceandgooddesignenhancesagility.• Simplicity–theartofmaximizingtheamountofworkdone–isessential.• Thebestarchitectures,requirementsanddesignsemergefromself-organizingteams.• Atregularintervalstheteamreflectsonhowtobecomemoreeffective,thentunesand
adjusts its behaviour accordingly.
One of the most important aspects of agile processes is the continual reflection and adaption. Many of these values have also been adopted by agile project management approaches,

532 Appendix 1
especially the concepts embedded within one of the methods, scrum, including set iteration lengths termed sprints, daily stand-up meetings and reviews, as part of the process. At the end of each sprint, a tangible product is delivered and at the end of a series of sprints, a release, the current working version of the product is released to the customer for detailed review.
Lean
Lean processes are typified by reduced inventories and cycle times. There are many concepts that agile and lean have in common particularly in processes to remove waste and rework. The background to the lean movement can be seen in the Japanese manufacturing sector and also in the Six Sigma quality improvement initiatives. As with many agile methods and approaches, some of the ideas have their roots in previous practices.
Grant Rule (2011), during his guest lecture at UCL, 2010, outlined the similar concepts used in the production line techniques of building warships at the height of the Venetian empire, several hundred years prior to the concept of automotive production lines. During this period of expansion, the wooden warships were to protect the trading interest of the Venetians and due to the limited space in the Arsenale the inventory and waste was kept to a minimum and the pressure of conflicts meant that they had to reduce cycle times and release ships to protect their routes and territories as frequently as possible. This would be the equivalent of producing working software frequently to customers. There is evidence of continual improvement in the process although whether this allowed teams’ time for reflection and self-organisation is highly unlikely.
The importance of frequent releases of software is central in agile project management. This enables feedback from the client to build trust and an effective product that provides the highest value within the given time. As requirements often fit into a profile similar to Pareto analysis with only 20% of the functions used 80% of the time, delivering the highest value and functionality first will often be sufficient as many of the additional requirements may be obsolete, seldom used or need to be changed.
To take full advantage of agile methods, lean practices need to be adopted across the organi-zation(Salloway,Beaver,andTrott,2010).Itiscertainlythecasethatthemajorchallengesinan organization are often the necessary cultural changes, which include the empowerment of teams, creating an environment of trust to allow the teams to determine their own approach to development.
Agile is not a panacea. There is no set recipe to follow, but there are some patterns that perhaps all projects should follow. One pattern is the idea of time-boxing every aspect of the project cycle. This is not just a defined time but as short as possible time to speed up the feedback and associated learning cycle. This includes the discussions with clients as well as the review meetings.

Agile Project Management 533
Two Levels of Planning
Agile techniques encourage planning at two levels of abstraction. The customer or client, represented by the product owner, usually has an initial idea for the capabilities of the product being developed. This allows for a high-level capability plan to be developed in which the capabilities can be valued. Dean Leffingwell (2007) suggests a value feature approach in which the features are assigned priority and value, giving immediately some indication of value of the project as well as an approach to track progress in terms of value at a high level.
At an iteration level, the capabilities need to be decomposed further into features and stories and be prioritized. It is this that gives the second level of tracking and can be achieved in terms of stories and size estimated in terms of story points. The team then decides how these tasks are broken down and commit to a daily level of delivery of this work.
Terminology
As with any professional practice, there is often terminology that may be difficult for the outsider to interpret. In law, Latin phases are often used, although increasingly in other areas such as medicine it appears that the language is converging to more readily understandable terms.AglossaryofagiletermscanbefoundintheGuidetoAgilePracticeshttp://guide.agilealliance.org/. Perhaps it is that sometimes those not involved in agile project manage-ment and development are somewhat perplexed by terms such as scrum and planning poker. Is this some kind of game we are playing? Well, part of the answer is yes, as the highly interactive and collaborative planning process has been termed a ‘game’ by some leading agileproponents(Cockburn,2002).Agameinvolvingthecustomeratitscoreanddeliveringthe highest business value within a given period.
How Does a Generic Agile Development and Project Run?
A workshop may be needed to determine the overall process and project management approach. Different agile techniques favour different approaches, and use different terms. All outline the need for prioritization of requirements. In some methods, such as feature driven development (FDD), these are known as features and are similar to other approaches that incorporate an understanding of how the user makes use of the system, such as by user stories.
User stories tend to have more clarity if developed in conjunction with the client, and time is spent on considering how they will be tested. The user stories are stored in a product backlog and the product owner or representative from the client organization determines the value of each of these and prioritizes. The development team then determines which are done within

534 Appendix 1
the next iteration. This is achieved by an initial planning meeting at the start of the iteration often lasting only 2 hours in which the stories are estimated by the development team as to how long these will take. The team also takes into account the priority within the product backlog as to which stories are to be developed for the next iteration, and reviews this when the iteration is completed.
Stand-up Meeting
At the start of each day, there is a stand-up meeting. The idea is to keep the meeting short to a maximum of 15 minutes and to encourage comments to be kept succinct. Here team members outline briefly what they did yesterday, what were the impediments to getting certain tasks done and what they are going to achieve today. Tasks and who is doing them are summarized on the whiteboard, and because these commitments are made to the group there tends to be motivation to achieve what individuals have outlined as their tasks. After the short meeting, any technical problem discussed will often immediately be resolved by others in the group depending on whether it is an architecture, programming or resource issue. There is regular feedback. Typically, there is a retrospective or review at the end of each iteration to outline what went well and what did not go as well, but there are also daily reviews and the stand-up meeting helps highlight problems early.
The key is a built-in system of reviews at every level.
With my research groups after their projects, I asked them, if they were allowed to repeat their projects how long would they take to achieve the same results? Most had been working nearly 6 months and agreed that to repeat their work and achieve the same results would take less than half the time. Much of this is due to the learning curve, working out how to solve a problem, deciding the valid metrics, developing effective testing procedures, designing the tests and introducing automated testing procedures wherever possible. This is the importance of speeding up the cycle time to get results quickly and learn from them. To develop code and deliver this to the client after six months without a review with the client is a recipe for disaster. They will invariably say that this is not quite what they had envisaged. The feedbacks are necessary both for team learning and also to ensure that the teams are delivering the right product for the customer and ensuring that what they deliver is of the highest value and quality. (Collins 2013)
It is important for the research groups to consider the value of the project management approaches and consider them as assisting rather than being an overhead. Techniques in testing clarify the goals and if testing is automated should accelerate the process. A more facilitative approach to project management is required both in research and development. Within the scrum method, this is supported by role of the ScrumMaster whose function is to ensure that the processes determined by the group are followed.

Agile Project Management 535
Estimation
In traditional approaches, managers estimate and try to establish predictable plans, and any deviation from these is seen as a problem with the development team. This approach, often combined with a waterfall sequence of requirements for gathering, design, development and testing, is often a failure. The long list of requirements that may have taken months to gather is often out of date before the design is started. This is why it is so important to build some-thing for the client to see at regular intervals to check that what is being built meets the requirements.
MikeCohn(2004)humorouslypointedoutinhisbookonuserstories,usingananalogybased on shopping, that seemingly trivial tasks often take several hours to complete. This is a way of introducing several important points about over-optimism in estimation, and not allowing enough time for technical development or thorough testing.
Of course, there are times when project managers may deliberately tell senior management what they want to hear, and agreeing to an unrealistically short schedule that the development team has no hope of achieving. With agile project management, these aspects are substantially reduced. First, the ‘death march’ scenario of no time and unrealistic planning from the project manager is avoided because the teams estimate their own work. The priorities determined by the client in fact decide what should be drawn from the product backlog and incorporated into the next iteration. This backlog can then be used as a clear measure to protect the team from unreasonable additional demands. If further tasks are added to the product backlog, it is the priority of each task that determines the urgency. As only a certain number of stories in terms of relative difficulty and duration in story points can be achieved in any iteration, there is an immediate indication of whether it may be feasible or even if it is a priority to add the new stories into the current iteration. The work is then delivered at a sustainable pace in a predictable way, and the project schedule is fine-tuned as more process and project metrics become available.
One aspect of agile is using the ‘wisdom of crowds’, tapping into the fact that groups can estimate with better predicted outcomes and faster than individual team members. Earlier approaches have used Delphi techniques based on averages and giving higher ranking to central values. In recent years, a popular technique that has been adopted by the agile com-munity is ‘planning poker’. This allows the rapid estimation of user stories and will allow, based on these estimates, the team to plan a realistic set of user stories and constituent tasks for the current iteration. It is based on the concept that those doing the work are best placed to do the estimation. Also, as many of the benefits of estimation are quite quickly achieved, putting in more effort has decreasingly diminishing returns on accuracy.
Each of the development teams has a set of cards marked with a series of Fibonacci numbers. These are made up of the previous two numbers added, 1, 2, 3, 5, 8, 13, with the larger card

536 Appendix 1
not necessarily fitting in the sequence, say 100. There are other variants of this series that begin with 0 and 0.5, others based on multiples of 10 and others even with a question mark for the decisions that are difficult to initially make. The idea is that it is relatively easy to determine how long a task will take relative to another task, but this becomes more difficult as the size increases. As it becomes more difficult to differentiate between consecutive numbers as the task becomes bigger, the widening gap makes it easier to estimate (e.g., it is easier to determine whether a task will take closer to 8 or 13 units than say 11 and 13 time units).
For each user story, each member of the team estimates in story points the relative effort it is going take to develop and places their selected card with the value face down. As soon as everyone has done this, they turn their cards over to reveal their estimate at the same time. There may be consensus on the numbers say 3, 3, 3 and 5 in which case the card representing the generally agreed value is taken. However, if there is variation, a low and a high number say, those who selected these values outline their perspective, and may be in light of this there are assumptions and technical issues that the others have not considered, and there is another round of voting. If there is consensus the team can move on to the next story. Rounds without discussion, as outlined by Amr Elssamadisy (2009), allow reflection and consensus, but may have the consequence of individuals being too influenced by the perceived leaders in the group.
If the team is working with user stories, then they need to estimate the relative size of these storiesatthebeginningoftheiterationasateam.MikeCohn(2004)pointsoutthiscanbedone in story points, which can be relative to the team’s own working practices and experi-ence. However, the true measure of working becomes apparent from the team’s own measures of velocity, how many of their story points they are completing within a week or iteration. This measure can then be used as yesterday’s weather, to provide improved estimates of the rate of work, and better baseline as the measures for completion of user stories and their constituenttaskstoaccomplishthese(Cohn,2006)(Fig. A-1).
The team uses its own measures such as velocity and ‘burndown’ charts that show the remain-ing stories to be developed. As capabilities and features become increasingly clear and stable from management, and the team acquires a sustainable development rate, the test data will support the figures to show when the project will be complete. The test data including per-centage passing acceptance tests, the amount of code changes (churn) and the defect rates are going to be of particular importance in software development and will be used in conjunction to establishing realistic estimates for the overall completion of the project.
Technical Debt
During the planning process of the iteration, it is essential to consider the quality of the product and ensure attributes such as scalability and security. These may not always be outlined by the customer or the product owner, but to avoid technical debt and the code being

Agile Project Management 537
difficult to maintain and extend these issues need to be addressed. It is important in the planning process that architectural issues are dealt with. One way to help achieve this is to consider not just the user functionality or user stories but also tasks that have to be achieved in order to keep the architecture aspects required. This can be achieved through a dependency mappingasoutlinedbyBrownetal.(2010).
Defining the Architecture of the System
The architecture of a system describes its overall structure, components, interfaces and behaviour.Definitionsvarybutoftenincludetheperspectivesorviewsofthestructure(Bass,Clements,andKazman,2003).Oneareathatisemphasizedbyoneinstanceofthegenericunified process (UP) and rational unified process (RUP) is the concept of requirements. In this case, it is often user functionality via user cases and subsets of scenarios that shows what functionality a user or actor requires of the system.
Some agile methods such as extreme programming (XP) favour the use of understanding of the system in an exploratory way, via development of code, improving the design without affecting the behaviour, i.e., refactoring. So, for instance, developing a security check in a banking system would necessitate understanding the structure and coding this feature would verify and quickly establish an architecture, if a model is not already available.
Unless the architectural issues are addressed, there will be inconsistencies in performance as the system is scaled. These defects will require ever more refactoring in order to avoid design
0
10
20
30
40
50
5
15
25
35
45
Stor
y Po
ints
06/01
/06
13/01
/06
20/01
/06
27/01
/06
03/02
/06
10/02
/06
17/02
/06
24/02
/06
Velocity
Figure A-1Chart showing velocity or work achieved in story points during each iteration. This can help the
team to determine the amount of story points they can realistically achieve in future iterations, and when the backlog is likely to be complete.

538 Appendix 1
problems. Therefore, some consideration of the design is necessary to avoid later problems. This process of consideration of the planning of the architecture is termed architectural runway, allow-ing for a smooth transition and rework and to avoid technical debt. Planning ahead, the architec-turecanbeallocatedonaplannedprocessasadvocatedinagilearchitectureprovisioning(Brownet al., 2010). Here, architectural elements that are necessary for quality attributes (non-functional) such as security are allocated to the iteration backlog and provisioned within this period to care-fully outline both functional and non-functional requirements, which are so important in determin-ing scaling and performance factors. The rationale for architecture decisions should be recorded and can be incorporated within iteration planning as shown in Fig. A.2. An alternative but similar approach would be to include design spikes at the last responsible moment (LRM) to ensure the flexibility of the architecture. When there is a choice of architecture, this can then allow for a different approach to estimation of value. Instead of using a static cost–benefit analysis, which is normally based on static estimates and architecture, an investigation of alternative options, and theirrelativefuturechangescanbeinvestigatedandinterpretedviareal-optionsanalysis(BahsoonandEmmerich,2004).Thisapproach,whichwasoriginallydevelopedinthefinancialmarkets,isincreasingly used to determine the dynamically changing nature of viable options in areas such as provisioningofresourcesasincloudprovisioningwithintheITsector(Collins,2011).Thenatureof engineering is changing and increasingly ‘composing systems from open source, commercial, andproprietarycomponents’(Bosch,2011),andinagileenvironmentswherethefocusisonearlyexploration the ‘selection and trade-off decisions’ should be captured including the rationale that willhelptounderstandwhytheproductisbetterandwhyitisbeingbuilt(CMMI,2010).Paretooptimality and how this can be applied to balancing requirements as well as trade-off decisions for goals within project and programme management is a current area of research within the Faculty ofEngineeringSciencesatUCL.
Sharing Knowledge and Reflection
Research teams are well known for their synergy. Jeff Sutherland (2005) outlines this enthusi-asm in agile projects and Dean Leffingwell (2007) outlines these concepts including how teams can create new points of view and resolve problems through dialogue. Within workshops, particularly in scientific research and innovation, it is useful to allow dialogue, not having to defend your idea, and further time to explore possibilities. This is refreshing, as often the stress is on discussions to resolve issues within a specified time period, i.e., time-boxing. Leffingwell also points out that in the spirit of scrum, amongst its many attributes including commitment and autonomy, ‘leaders provide creative chaos’. This is precisely the concept that Sir Paul Nurse,duringtheBBCDavidDimblebylecturein2012,wasconveyingwhenhewasoutlininghowtocreateacollaborativeenvironmentforresearcherstoexcelatthefutureCrickInstitute.
For each project, the degree of understanding of goals, emergent design needs to be consid-ered and appropriate patterns need to be in place. Agile development and research both need process and governance frameworks.
Agile Project Management 539
Earned Value
With traditional project management progress is based on tracking the intermediate tasks, such as production of the requirements document and the design artefacts, which can be achieved without a demonstrable or working product. Allowing measures to be unrelated to working products can give a false sense of progress.
With agile the focus is on whether the software works, whether it is what the client intended or it is of value. This is done through continual feedback via releases to demonstrate and allow feedback to improve the product and value.
To track progress towards goals in technology and IT projects where there is emergent design, this needs to be achieved at a higher level of abstraction. In research projects, a clear idea of initial goals or exploration of concepts still needs careful planning; otherwise, it will be unlikely that funding will be granted.
There may be an exploratory phase equivalent to a feasibility study in which one or two workshops are planned to outline strategy or develop architecture to develop the technology. This initial phase will have clear goals and should have clear rationale for those invited. As this is bounded by time and consultants and facilitator costs, the budget can be easily ascer-tained. This is likely if parties agree to an exploratory design phase, then a development phase.
During the initial phase, in order to define the scope or boundaries of the research or develop-ment, it will cover the goals that will in many instances then be broken down further to capabilities according to the type of innovation or development project.
Capabilities,atermoftenusedinmilitaryprojects,determinewhatisrequiredwithoutdetermining how this will be achieved. If this is a software development project, these may be subdivided into features and stories. Sometimes, the term epic in agile development is often used for a larger aggregation of features.
User stories represent what the client or product owner requires. These requirements are often written as a short outline on a card and then decomposed further to tasks. The product owner discusses with the team the prioritization and order of development with regard to develop-ment issues including software architecture.
The use of earned value management (EVM) is well developed in certain sectors of project management including the construction industry and is being increasingly mandated in defenceprojectsintheUK.Thiscanbeappliedtoagileandsoftwaredevelopment.Theessence of agile development is this shared collaborative communication between client and development team, ensuring value for the client and a motivated development team. Although management may be used to using earned value measures, this needs to be developed for the agile process so that the development team does not see this as an overhead, and both groups

540 Appendix 1
can work collaboratively together. One criticism, however, of EVM is that this does not give any indication of the quality. One benefit of adapting this approach in conjunction with agile project management is that processes that improve quality, such as refactoring, are often incorporated into agile development practices.
If EVM is required by senior management or through the governance process of the project, one approach is to create a reporting on two levels; one for the capability tracking and one based on stories as shown in Fig. A-3, which can be generated with minimal overhead as part of the planning process.
In agile development, there is continual prioritization at the iteration level, which is designed to be the same duration. Earned value can be applied to these user stories, but there is a subtle difference in application. The reconciliation seems difficult, as the user stories are continually under prioritization according to the client as to what they consider the most valuable user story. These stories are stored on a backlog for selection during each iteration, and the team estimates how large they are in terms of story points.
The stories according to prioritization are selected for the iteration by the client on their perceived value. If the table is prefaced with the functional value or business value, the order of priority can be much clearer, although the highest priority should be at the top of the backlog, and the development process then pulls the next set of stories and set of tasks.
Iteration 1 Iteration 2 Iteration 3
User- stories & non-functional requirements (quality attributes)
Rationale (for architectural decisions)
Architecture backlog
Iteration n
Figure A-2Architectural elements in iteration planning (Collins, 2011). Based on Brown, N., Nord, R., & Ipek, O.
November/December 2010. Enabling agility through architecture. CrossTalk.

Agile Project Management 541
As can be seen from the figure, the earned value can be derived from the amount of completed work. For the first story, with the highest priority on the list and business value, the story was completed and therefore earned all the points.
Although the story took slightly longer than expected (i.e., 120 hours), it was complete and therefore earned the full earned value of 100. When the story was not complete, it was allocated zero. From these figures, schedule performance index (SPI) and cost performance index(CPI)canbeascertainedtogiveanindicationofprogress(Collins,2006).
Some have argued that velocity is more important. This is not the same as earned value. Velocity is the rate at which a team works and is a useful internal measure as are burndown charts, which show the remaining work and can act as a motivator for the team.
However, while it can be seen that earned value is valid within an iteration, there are different interpretations of how this could work at higher levels of abstraction and the value to project managementataprojectlevel.CraigLarman(2004)suggeststheuseofestimatesintermsofbudgets. This is most easily achieved in terms of hours of work. He also outlines the concept of re-calculating the planned work for each iteration, and the baseline is updated as more informa-tion arises. For the tasks to earn value, it is prudent to only consider these when fully completed. However, assessing this needs careful consideration as the development of each story is usually considered finished when all tests including integration and acceptance tests are completed.
It can be seen that using a simple spreadsheet as a by-product of the team’s estimates, an EV system can be used as an indicator of progress in terms of business value.
Emerging Trends for Agile Project Management
Agile project management provides the opportunity to rapidly deliver software, services and products to satisfy the demands of ever-changing customer needs. The need to rapidly develop software and digital processes using agile methods has become increasingly important in order to compete in digital markets, indeed for many organizations it is becoming vital for their survival.
Business value of story
Story points
Points earned
Planned developer hours
Actuallogged hours
Earned value
3 10 10 100 120 1002 8 8 60 60 602 4 4 60 80 601 2 0 20 0 0
24 22 240 260 220
Figure A-3Earned value derived from stories completed at the end of an iteration. Story points are an estimate
of the relative time that the development team thinks the work will take to complete.

542 Appendix 1
One of the trends is the provision of a continuous delivery of software and services. This approach uses concepts from agile methods and lean manufacturing, incorporating frequent releases and automation wherever possible. Regular feedback from customers ensures the quality of deployments and what is delivered actually meets customer needs.
Continuousdeliverycanbefarmoreeffectivewiththeintegrationofdevelopmentteamswithdeliveryteams.Considerablefurthergainscanbemadeifsoftware,serviceandprojectdelivery can be integrated with other business processes. The challenge for managers is to ensure that all relevant processes are optimized, providing an opportunity to reduce the cost and complexity of processes across the organization.
Agile projects are becoming increasingly data-driven to ensure that they are meeting the goals of the project and aligned to what the customer requires. The progress of projects is now often tracked real time, based on working software or solutions and feedback from customers. It is the governance and compliance aspects of project management that are increasing in impor-tance in agile approaches, ensuring that process improvement, business goals and regulations are being met.
The following sections examine some of the major trends and challenges: understanding customer needs, use of data and visualizations, achieving collaboration across teams and providing teams with autonomy so they can select whichever lean and agile methods they consider add value to achieve the business strategy.
Delivering Enterprise Agility
Although there has been considerable success in software delivery using agile methods, the challengenow,asRigbyetal.(2016)outlineintheirHarvardBusinessReviewarticle,Embracing Agility, is that many organizations need to capitalize on agility across the organi-zation. In an increasingly competitive market, it is necessary to gain the advantages of adaptability provided by agile processes. Evidence for the economic benefit has been shown bysurveysextendingbackto2007bytheCenterforInformationSystemsResearch(CISR)atMIT Sloan, indicating that agile firms can increase profits by 37% (Weill, 2007). In addition, PeterWeillandStephanieWoerner(2016)haveshownthereisasignificantincreaseinrevenue and profit margins for organizations that embrace digitalization and understand their customers better.
ResearchpublishedbyMcKinseyshowedthatmanyorganizationsareusingagileprojectmanagementtodelivergoodsandserviceswithgreaterefficiency(Comella-Dordaetal.,2016).Thisalsobringsfurtherchallengesfrom‘alwayson’customerswhoexpectcontinualavailability and reliability. To take advantage of new market opportunities and adapt dynami-cally requires not just adaptability within delivery pipelines but across the enterprise. As Ross, Weill and Robertson explain in their book, Creating a Foundation for Business

Agile Project Management 543
Execution, to keep up with the changing business environment, it is also necessary to have flexibilitywithinthedigitalprocessesandenterprisearchitecture(Rossetal.,2006).Itiswithagile project management that organizations can take advantage of these new digital business opportunities and accelerate time to market.
Understanding Business Value and Customer Value
Forming strategic partnerships and looking for ideas outside the organization is one way to accelerate innovation. This can be aided by more agile approaches allowing teams to decide how to structure these conversations and change how teams share information at the start of projects, via workshops or alternatively hackathons.1 These approaches provide an insight into the processes and value streams of different groups. For a customer, this may give further insight in their value stream, from their request to fulfilment of their order.
Agile processes are increasingly integrated with different perspectives so that the teams better understandthecustomer’sjourney.Customerneedsareincreasingly incorporated at an earlier stage, not just after the engineering solution, as we now often see, integrated with agile processesthemappingofthecustomerexperience(CX).2 Processes need careful design and consideration, whether they are providing value for the business or customer, or both. For example, it is of limited value if, an app helping a customer locate a store selling a product they want (via geo-location on their smart phone), if this system is not integrated into the supply chain and the store takes weeks to order the product. The whole supply chain needs to be considered. Mark Schwartz highlights in his book, The Art of Business Value, that manag-ers need to ensure that the meaning of value is considered from the perspective of the business, partnersandwhatthecustomervalues(Swartz,2016).
Integration of Processes
Many organizations are using agile project management to meet customer needs and improve the integration of their processes. Siemens is an example of a global organization who are not just focused on agile software development but use agile project management to focus on business value, reducing lead times and release times, and getting feedback from their cus-tomers. These processes allow flexibility, so that if something does not meet needs of the business, or the customer, it can be adapted. Siemens also integrate their application lifecycle management (ALM) to their product lifecycle management (PLM), for example, with the
1 Hackathons are where teams including domain experts, coders (software programmers) and project managers intensively work together and rapidly develop a prototype, often over only 1 or 2 days.
2 Humble et al. (2015) made a distinction between customers, that pay for software and are often involved in the development, and users that may use the software in their day-to-day work and may also contribute to develop-mentthroughsocialnetworks.Differentperspectivesneedtobeconsideredwhetherthisisvia(CX)oruserexperience (UX) or other design approaches.

544 Appendix 1
manufacture of embedded systems. The sharing of information across these processes makes production of these embedded systems seamless and lowers production costs. It also allows requirements to be traced more easily. Integrating PLM software and agile software develop-ment practices enhances information systems and is seen as a necessity to help deliver the corporate strategy. This not only allows the consolidation of different systems but also enables global engineering groups to collaborate and launch products as one team, reducing time to market.
Siemens also achieve rapid feedback within their prototyping, for example, within their autonomous robot manufacturing systems, part of Siemens agile manufacturing systems (SiAMS).AtSiemensCorporateTechnologyCentrePrincetoncampustheyarebuildingmechanical spider-like robots to work in hard to access areas, in manufacturing or surface preparation. They are optimizing them to work together using algorithms that mimic the knowledgesharingandcollaborationofhumanagileteams(Siemens,2016).Infact,theserobots are being designed for other attributes you may expect from small agile empowered teams, self-improvement and the ability to share tasks autonomously.
To fully capitalize on agile processes, enterprises do not need just high performing individual agile projects but take advantage of agile methods across the organization so that the entire supply chain is examined and optimized.
Continuous Delivery
Problems typically arise when teams work in isolation. Integrating the teams responsible for development and operations (DevOps) allows for a continuous delivery pipeline. Releases of small functionality can be made available in smaller increments to get feedback from customers and reduce risk. If there is a problem with a release, the fact that only a small amount of software is affected means that this can be quickly rectified. This is further enhanced by what is known as blue-green deployment, having two identical production streams ‘blue’ and ‘green’.Bluewillbeliveandhavetheproductiontraffic,whilegreenwillbeinthefinalstageof testing. When green is fully tested and ready, it is switched so that it is live, eliminating downtime. Additionally, if a problem did occur then there could be an immediate roll back to the blue version further reducing risk.
Cultural Shift
DevOps can be considered as a cultural shift, encapsulating the philosophy of cross-func-tional teams, with both development and operations collaborating effectively to improve the flow and delivery of products. To be fully effective this needs to involve other related business units as well. This can be easier to achieve in organizations that fully embrace agile methods than have a bimodal solution, where traditional and agile modes coexist. However, having

Agile Project Management 545
predictable outcomes and moving to a more exploratory state, if managed effectively, can facilitate the transition from traditional processes to digital processes while reducing risk of a ‘big-bang’, an all at once, transition.
A natural progression in DevOps is to ensure that all relevant aspects of the business and development are involved in the process, including the quality assurance and the project management office (PMO). The PMO supports the delivery of projects in an organization, monitors review of the delivery of projects and provides decision support.
The conditions for project success, as indicated by the Association of Project Management survey (APM, 2015) includes, ‘effective governance, the project needs to have clear reporting linesandeffectivecommunicationbetweenallparties’.Governanceframeworksensuregoalsand standards are being followed and allow organizations to make investment decisions. When integrating agile practices, the role of the PMO needs to be considered to ensure a suitable fit to the strategy. However, it can be a challenge for the PMO to have the necessary andup-to-dateskillstoprovideadviceforcontinuousdeliveryteams.LloydsBankhasrecognized that having a technical capability within the PMO is vital, and Sanjeev Sharma, CTO,DevOpsTechnicalSalesandAdoption,IBM,explainedattheDevOpsSummitLondonthat the banks embed an expert from the DevOps team within the PMO to facilitate this process(Sharma,2016).
For agile focused organizations, where the priority is to favour digital transformation, there is often a need for a specialized PMO. This structure can be thought of as analogous to the structure of programmes, with PMOs having different specialities supporting relevant groups of projects. This can enhance governance and compliance in global organizations as with IBM,whichadoptedthiskindofstructurewithspecializedPMOsforeachofitsproductlines.However,asGuyBarlowpointsoutinhisOracleblog,thereal-timesharingofinforma-tionbecomesevenmorecriticaliftheroleofthePMOisdecentralized(Barlow,2014).
DevOps when integrated with other business units responsible for understanding the customer needs, quality assurance (QA) and the PMO can considerably accelerate the successful deploymentofsoftwareandservices.Collaborationacrossallteamsrelatedtodeliveryanddeployment, ensures a reliable and resilient delivery pipeline of software being continually adapted to customer needs.
Data-Driven
These changes throw up new challenges so that software and enterprises are increasingly becoming data-driven.
There is a shift in agile project management towards projects being driven by real-time data. It is through this continual experimentation using empirical methods and agile and lean
546 Appendix 1
approaches, based on the scientific method, that projects can be managed in fast moving digital environments. Although the planning may be reduced within exploratory and fast moving digital projects, feedback as to whether the project is meeting the goals of customers and the business is often enhanced. Organizations are realizing that the project management aspects of agile processes are ideally suited for the necessary governance, compliance and tracking that the strategy and customer needs have been met.
NASA’s regular feedback from development of their customer-centric software from their nightly builds also helps them keep track. The priority for NASA’s teams is to place emphasis on tracking the code and their goals through daily feedback from their customers rather than upfront planning (Trimble and Webster, 2013). Their measure of progress is increasingly working code. This analytics is becoming more important in continuous delivery where problems can be identified in real time.
It is the ability to rapidly get feedback from customers that is changing project planning to an emphasis on data driven processes establishing whether we are meeting customer goals. This maybeintheformofA/Btesting,whereaportionoftheweb-trafficisbeingdriventoonegroup of customers to see if there is an improvement in sales, and if so then the whole traffic is switched to the new version. Humble, Molesky and O’Reilly outline in their book, Lean Enterprise, that this method using data from this method is used by technology organizations, such as Amazon and Microsoft, to see if features in their projects will even add value before it is built (Humble et al., 2015).
As organizations move to continuous delivery, this throws up further challenges. Managers need to provide an environment of psychological safety and trust, in order that their teams are willing to experiment and continually improve, via processes, such as improvement katas,3 as Humble etal.(2015)outline.SkeltonandO’Dell(2016)pointoutthatitistheculturalissues,supportingteams via manageable workloads and ensuring software architecture aligned to team structure thatisimportant.JoeMcKendrick,quotingtheCTOofAmazon,WernerVogel,outlinesthatAmazon makes it ‘easy for developers to “push-button” deploy their application’ and release updates for customers, in effect, achieving deployments at a rate equivalent to one every second (McKendrick,2015).IforganizationsaretoreplicatethesuccessofGoogleandAmazon,andbe able to adapt their processes within seconds and meet the ever-changing needs of customers, agile and lean methods incorporating rapid feedback and real-time data are required.
Shared Vision
To avoid silos of ideas and to ensure projects take into account all necessary viewpoints, workshops are typically held. Facilitated workshops at the start of projects are integral to
3 Improvement katas are one approach to process improvement. One feature is the setting goals with clear targets, for each iteration.
Agile Project Management 547
many agile approaches, such as the dynamic systems development method (DSDM, 2008).RallySoftware,nowpartofCATechnologies,alsointegratesitsworkshopswithrelease planning. Their approach which termed, ‘agile big room planning’ is designed to ensure business units across the organization are brought together and collaborate from the beginning so that everyone is on the same page. As part of this process, teams co-locate to participate in the planning process. This ensures communication with the business, that the project is aligned with the business goals and that the entire organization is engaged and has an input to delivery of the product or service being developed. Seagate, a data storage organization, adopted this method to identify bottle-necks in its processes and improve predictability, achieving a regular cadence for release planning.
ResearchbyDingsøyretal.(2016)hasshownthatitisimportantinagilesoftwaredevelop-mentthatteamshaveasharedmentalmodel(Dingsøyr,2016).Havingthissharedvisionisequally important as we scale projects and integrate other units across the organization. This can be enhanced by visualization tools, which can be adopted for DevOps, to bring the tasks for both streams of operation and delivery into better coordination.
Kanbanisaleanconceptthatisbecomingincreasinglyadoptedtoimprovevisibilityofprogress across teams, reduce waste and ensure that work in progress (WIP) is kept to a minimum. Tasks are written on coloured sticky notes, which are placed on a whiteboard, calledaKanbanboard,totracktheprogressacrossstagesofdevelopment.JaguarLandRover usesKanbansoftwaretoreduceleadtimeandimproveflow.Thesoftwarealsoallows continuous feedback, allowing different engineering teams to add comments and improve the decisions. The visibility of progress is further enhanced, by showing the status of each activity,includingassessment.Whenactivitiesareassessedeither,‘assessedOK’,or‘notOK’is posted. The latter is linked within the software to different categories, why the assessment has not met the required standard and real-time discussions as to further work that needs to be completed.Keydecisionsarealsorecordedincludingarchitecturehardpoints,suchaswheelbase or position of seat with respect to other features. The discussions and diagrams illustrating any problem arising can also be shown at the same time, so that a seamless resolution of issues can be achieved.
Systematic, an international software company has successfully deployed and scaled agile methods for its software development. Agile processes are applied across the entire organiza-tion, including their management systems, improving visibility and reducing the document workload. Their teams have been an early adopter of visualization and automation and within their continuous delivery pipelines for clients. This has resulted in Systematic being one of thefirstorganizationstobeaccreditedtheCapabilityMaturityModelIntegration(CMMI)level 5 showing the high level of repeatability within its processes. This efficiency allows a focus on business critical areas and customer satisfaction.

548 Appendix 1
Ensuring Everyone Contributes
Agile teams are increasingly using open source messaging apps, such as Slack, for sharing their communications. This has partly given rise to enterprise agile development, increasingly providing a more interactive environment and often allowing developers to discuss and share ideas in a social way.Communicationtoolsincorporatingasocialdimensioncanensurethatawiderrangeofideasis explored. Executives are starting to recognize that harnessing the creativity of external stake-holders as well as that of their internal teams can improve knowledge sharing and be a catalyst for innovation. Harrysson and co-researchers showed that social technologies can invigorate collabo-rationandhelpdevelopstrategicinsights(Harryssonetal.,2016).
One of the challenges of scaling agile project management is often the boundary between teams, particularly with external stakeholders (Strode, 2012). Here, the communication strategy needs to be carefully managed. It is often a project manager needed in this role to coordinate these teams, although there are various approaches to scaling and designating roles basedonscrum,includingthescaledagileframeworkoutlinedbyRichardKnasterandDeanLeffingwell(KnasterandLeffingwell,2016).Itishoweverrecognizedinmethodsthatarepresentative with detailed knowledge of the business (or product owner) is central to the prioritizationofgoals,andshould,asMikeCohnemphasizes,ideallycomefromthebusinessdomaintofullyappreciateandcommunicatethebusinesspriorities(Cohn,2014).
Aligning teams to the architecture of the system can enhance communications between development teams. Aligning teams to traditional functions can cause a considerable amount of additional work with hand-offs, and waiting for teams to deliver work to other teams in the process. It is important to design teams according to the communication structures using Conway’sLaw:whichoutlinesthatorganizationsare‘constrainedtoproducedesignswhichare a copies of communication structures of these organisations’. Sam Newman outlines the need for flexible architectures and that these provide opportunities for modular architectures toreflectthestructuresofteamstoimproveefficiencyofcommunications(Newman,2014).
Nvidia uses agile methods throughout its development processes. For example, in the devel-opment of its graphics processors, it arranges real-time interaction with customers to enhance their designs. It not only uses real-time interaction and feedback from customers during development of the products, but also uses its products in the design of the building to facili-tate interaction and collaboration. Deborah Shoquist, Nvidia’s vice-president for operations was quoted in the International New York Times outlining the use of their ‘computational powerandtechnologytomodeltheirnewbuildinginSiliconValley’(Markoff,2016).Nvidiais using its highly interactive rendering software in conjunction with their graphics processors to design its offices. This allows teams of architects, designers and engineers to work in collaboration with state-of-the-art virtual reality (VR). These design teams can make changes to problems that only become apparent when they interact with the 3D visual model, avoiding costly alterations later in the project.

Agile Project Management 549
Dingsøyretal.(2016)haveshownthevalidityofagileprinciplesandcleargoals.Theyhavealso established that it is important that decisions are discussed. Even discussions where there is disagreement for the processes or technical approach required have been shown to improve teamwork. In addition, research published in the IEEE journal Software by Van Heeach et al. (2014)indicatesthatitisalsoimportanttorecordkeydecisions.This,forexample,hasbeenshown to be effective in the design of their decision-centric architecture reviews, where not only the decision chosen but also alternatives are documented, the pros and cons for the chosen solution, as well as envisaged future issues which may occur. Those disagreeing with a decision need to have their viewpoints heard, if the teams are going to value each other’s opinions and accelerate their learning and performance.
Agile Does Not Mean an End to Planning
Unfortunately, there is still the misconception among some senior executives that agile does not need a process and that agile is tantamount to anarchy. Rigby et al. highlighted this impressionwithintheirHarvardBusinessReviewarticle(Rigbyetal.,2016).However,totruly take advantage of agile project management and processes, the reverse is true: clear lines of communication, roles and responsibilities are necessary. There is also need for a consensus-driven approach that is equitable, inclusive and transparent.
A documented architecture certainly provides clarity but the strategy and business processes still need to be considered in terms of the operating environment and changes in regulation. The throwaway aside bytheCEOofthemiddlewaresoftwarecompanySoftwareAG‘ifyouareagileyoudon’tneedastrategy’reportedbyDavidCassidyPCPro,August2016,suggeststhat if you are an agile organization and adopt their enterprise software suite a strategy is not required(Cassidy,2016).Itiscertainlyunlikelythatmodularsoftwareaimedatworkflowcanfully understand your customer and business needs, security and data storage issues. If anything agile should enable the technical teams to focus in depth on architecture and devel-opment, and therefore free up more time for management to focus on the strategy of their organization. Agile development will also allow teams to rapidly hone-in on the desired needs of customers and test whether the strategy is correct and evolve this to their needs. With the adoption of continuous delivery, you cannot have a monolithic architecture but need a modu-lar architecture, such as microservices: small domain-focused services. A modular architec-ture certainly helps but still needs careful consideration, if this is going to be resilient and scalable.
Delivering Value Not Bureaucracy
Agile teams are typically provided autonomy, so that the team decides which agile practices and tools they should adopt and make them more productive as a team. Spotify reduces bureaucracy by encouraging its teams to prioritize agile principles over specific practices as

550 Appendix 1
well as encourage the teams, called ‘squads’, to select processes they consider add value. So, for example, a squad may omit burndown charts if they consider this does not add to their effectiveness. Spotify also ensures that members treat each other as equals: every aspect is designed to reflect this. Even the label for role of ScrumMaster, which can be construed as someone in-charge, rather than mastery of a process, is termed an ‘agile coach’, as explained byHenrikKniberg,toemphasizethatthisroleshouldbeaservantleader(Kniberg,2014).Typically agile teams are empowered and determine what is important to deliver the function-ality.BrianBergsteinillustrates,withanexamplefromMIT,thatmanagersalsoneedtorecognize that it is the high level of collaboration, and sometimes a willingness to break the rules,whichtriggersinnovations(Bergstein,2016).Throughouttheagileprocessesmanagersand teams need to ensure that bureaucracy is kept to a minimum.
An observation from history provides a reminder of the importance of autonomy. In writing about the industrial production within the Arsenale, the shipyard in Venice, during the 17th century, Joanne Ferraro outlines that the government of the time ‘was successful in co-opting workers’ support by permitting them considerable self-governance’ (Ferraro, 2012). This is one aspect that can be applied today in project management in adopting agile processes, providing trust for teams to make their own decisions, but balancing this with direction and clarity of goals. Providing the appropriate balance of autonomy and governance is key, if we are to support disparate groups to contribute and deliver as one team.
Summary
In agile development, it is often about trends emerging rather than making guesses about the future. Walker Royce wrote about the indicators for converging on the solution and the indicators for value and progress (Royce, 2011). The way to gain credibility is through working with the client on a joint understanding of a problem, how to measure progress and when to converge on the solution. This creates the real value, not only to the business, but to the self-worth of the team.
Agile project management is about achieving value collaboratively for the project and client team, and the organizations concerned. This is not just about the bottom line but achieving something at work, feeling valued and sharing knowledge with colleagues to achieve that next breakthrough. This is the true value of agile for individuals, the team and the organization.
At UCL at the front of projects are different types of workshops, examples of agile patterns that bring the right mix of researchers and project managers and support staff to solve problems. These vary from the Town Hall meetings where the challenge and opportunity is outlined to more detailed workshops allowing discussions and dialogue. The agile project management and development approaches favour the time-boxed approach to discussions, and estimation and often adding more time does not necessarily give a better outcome. It is these workshops which are often the driver for new innovations and approaches to

Agile Project Management 551
development. The use of a trained facilitator is often vital with large programmes. It is important that staff with different technical approaches can outline their view. It may be that the idea is rejected in favour of an alternative idea discussed at the meeting. The key is fair process and that the team are deciding the direction. This is the essence of agile allowing the client to work with the development team collaboratively to decide capabili-ties they wish to develop and prioritizing the functionality and user stories, or in the case of research the investigations. (Collins, Graham, UCL Research and Consulting projects (2003–2013), 2013)
It is self-evident that if one member of a team suggests a technical solution, another may disagree and point out an alternative, and why in certain circumstances it is a better resolution.
Developing real-time modelling agile approaches with colleagues had a significant impact on communication and indirectly in one project resolving political issues by the clear focus on the technical problem rather than individuals. During a consulting assignment my colleagues in a small consulting group were asked to outline our object and business modelling approach. We had been asked for a solution and found on arrival at the client site already strained working relationships with a development project that had been on-going for over a year. It was agreed to use our agile modelling approach to clarify the goals of the project and be clear on the direction. It was clear things were not going well, the project manager complained that he didn’t know what kind of project he was working on, as it wasn’t properly defined by the programme director. He didn’t know whether it was a business transformation project or a business improvement project. The client really wanted the project management problems to be resolved and not upset the director of the consulting firm under contract. It was a mess and an expensive mess with technical teams having worked for a considerable time. Without a real-time modelling solution and experience in forming a unified team this impasse would not have been resolved.
Getting buy-in wasn’t just a problem of clarifying the goals but getting support by under- standing each of the stakeholder’s goals, communicating the direction over a short iteration with a clear product and defined time and engaging all stakeholders already working on the project.
The leader must be seen by others not to be gaining personally. In the case of the programme that had to be put back on track, it was imperative to listen to other parties and support each of their objectives so that the programme could move forward. Self-interest other than wishing for a successful outcome was not in the cards. Likewise, the leaders in agile project management must lead by trusting their team and allow their team to deliver the project in a self-determined way. Self-organizing teams and allowing them to report on progress are areas that the leader must embrace in agile project management. Much of what has been written on agile has been on what the teams do and how they track their progress. The burndown chart, keeping progress visible and keeping tasks visible on the wall are for the team and the team leader.Keepingkeytasksandcommunicationsvisible,thisisthe‘whitebox’ofprogress

552 Appendix 1
reporting. It is the leader in agile project management who needs to understand this iterative process and be a resource provider, to remove all impediments to the team, who must trust his or her team to deliver in the technical approach they consider best. It is this beyond anything that defines the change to a leadership culture in agile.
The challenge in agile project management is not prescriptive plans and practices to follow, but to populate the project-planning process with appropriate patterns that are effective and add real value. For the time being, the challenge must be to balance the planning so that you can achieve the flexibility to deliver increasingly complex projects and rapidly add new developments to enterprises and research establishments.
Bibliography
Adkins, L. (2010). Coaching agile teams. Pearson Education Inc.APM, 2015, Available online https://www.apm.org.uk/sites/default/files/Conditions%20for%20Project%20
Success_web_FINAL_0.pdf.Bahsoon,R.,&Emmerich,W.(2004).Evaluatingarchitecturalstabilitywithrealoptionstheory.InProceedings of
the 20th IEEE International Conference on Software Maintenance (ICSM’04).Barlow,G.(September29,2014).HastheroleofthePMOpeaked?[Blog].InThe future of decentralised
management, enterprise portfolio management (EPPM). Oracle. Available online https://blogs.oracle.com/eppm/entry/has_the_pmo_peaked_a.
Bass,L.,Clements,P.,&Kazman,R.(2003).Softwarearchitectureinpractice.InSEI series in software engineer-ing (2nd ed.). Addison-Wesley.
Bergstein,B.(2016).EmTech: A legendary MIT building’s lesson’s on innovation. Available online https://www.technologyreview.com/s/531011/emtech-a-legendary-mit-buildings-lessons-on-innovation/.
Bosch,J.(May16–20,2011).InKeynote abstract Saturn Conference San Francisco. SEI.Brown,N.,Nord,R.,&Ipek,O.(November/December2010).Enablingagilitythrougharchitecture.CrossTalk.Carroll,J.,&Morris,D.(2015).Agile project management in easy steps.Cassidy,D.(August2016).Ifyouareagileyoudon’tneedastrategy.PCPro(262),122.CMMI®forDevelopment.(November2010).Version 1.3 CMMI-DEV, V1.3. SEI.Cockburn,A.(2002).Agile software development. Addison-Wesley.Cohn,M.(2004).User stories applied. Addison-Wesley.Cohn,M.(2006).Agile estimating and planning. Addison-Wesley.Cohn,M.(2009).Succeeding with agile: Software development using scrum. Addison-Wesley.Collins,G.(June12–15,2006).ExperienceindevelopingmetricsforagileprojectscompatiblewithCMMIbest
practice. In SEI SEPG Conference Amsterdam.Collins,G.(2011a).Post-graduate course GZ07, academic year 2010–11.DepartmentofComputerScience,
FacultyofEngineeringSciences,UCL.Collins,G.(2011b).Developingagilesoftwarearchitectureusingreal-optionanalysisandvalueengineering.In
SEI SEPG Conference Dublin June 2011.Collins,G.(2013).Experience as lead consultant on commercial consulting project 1999–2000 included in GZ07
post-graduate teaching for GZ07 course.DepartmentofComputerScience,FacultyofEngineeringSciences,UCL.
Comella-Dorda,S.,Lohiya,S.,&Speksnijder,G.(May2016).An operating model for company-wide agile development.McKinseyandCompany.Availableonlinehttp://www.mckinsey.com/business-functions/business-technology/our-insights/an-operating-model-for-company-wide-agile-development.
Dingsøyr,T.,Fægri,T.E.,Dybå,T.,Haugset,B.,&Lindsjørn,Y.(2016).Teamperformanceinsoftwaredevelop-ment: research results versus agile principles. IEEE Software, 33(4),106–110.

Agile Project Management 553
DSDM. (2008). Facilitation approach handbook. Available online: https://www.dsdm.org/content/facilitated-workshops.
Elssamadisy, A. (2009). Agile adoption patterns: A roadmap to organisational success. Addison-Wesley.Ferraro, J. M. (2012). Venice, history of the floating city.CambridgeUniversityPress,184–185.Goodpasture,J.(2010).Project management, the agile way. Ross Publishing Inc.Highsmith, J. (2002). Agile software development ecosystems. Addison-Wesley.Highsmith, J. (2009). Agile project management (2nd ed.). Addison-Wesley Professional.Highsmith, J. (2010). Agile project management (2nd ed.). Addison-Wesley.Humble,J.,Molesky,J.,&O’Reilly,B.(2015).Lean enterprise: How high performance organisations innovate at
scale. O’Reilly Media.Jones,S.(2016).Agile project management, quick start guide.CreateSpaceIPP.Knaster,R.,&Leffingwell,D.(2016).SAFe® 4.0 distilled: Applying the scaled agile framework® for lean
software and systems engineering. Addison-Wesley.Kniberg,H.(March24,2014).Spotify engineering culture [video], spotify. Available online: http://abs.spotify.
com/2014/03/27/spotify-engineering-culture-part-1/.Larman,C.(2004).Agile & iterative development: A manager’s guide. Addison-Wesley.Layton,M.C.(2012).Agile project management for dummies. John Wiley.Leffingwell, D. (2007). Scaling software agility: Best practices for large enterprises.Addison-Wesley(Chapter21
withKenSchwaber).Markoff,J.(July19,2016).Using virtual reality to create a new corporate headquarters.InternationalNewYork
Times,MediaTechnologyBusiness,15.Martin,H.,Detlef,S.,&Asin,T.(2016).The evolution of social technologies.McKinsey&Company.Available
online http://www.mckinsey.com/industries/high-tech/our-insights/the-evolution-of-social-technologies.McKendrick,J.(March24,2015).How amazon handles a new software deployment every second. ZDNet.
Available online: http://www.zdnet.com/article/how-amazon-handles-a-new-software-deployment-every-second/.
Newman,S.(June30,2014).Demystifying Conway’s Law.[blog]ThoughtWorks.Availableonlinehttps://www.thoughtworks.com/insights/blog/demystifying-conways-law.
Rigby,D.,Sutherland,J.,&Takeuchi,H.(May2016).Embracingagile:howtomastertheprocessthat’strans-forming management. Harvard Business Review,40–50.
Ross,J.W.,Weill,P.,&Robertson,D.C.(2006).Enterprise architecture as strategy: Creating a foundation for business execution.HarvardBusinessReviewPress.
Royce, W. (2011). Measuring agility and architectural integrity. International Journal of Software Informatics, 5(3),415–433.
Rule,P.G.(February3,2011).What do we mean by “Lean”? Guest lecture for professional practice series. DepartmentofComputerScience,FacultyofEngineeringSciences,UCL.
Schwaber,K.(2004).Agile project management. Microsoft.Schwartz,M.(2016).The art of business value. Portland, Oregon: IT Revolution.Shalloway,A.,Beaver,G.,&Trott,J.R.(2010).Lean-agile software development: achieving enterprise agility.
Addison-Wesley.Sharma,S.,CTO,DevOpsTechnicalSalesandAdoptionIBM.June30,2016.Innovate,learnanddisrupt:A
practical discussion on becoming agile. Enterprise DevOps Summit London.Shore, J. (2007). The art of agile development. O’Reilly.Siemens.(April20,2016).Autonomous systems: Spider workers. Available online http://www.siemens.com/
innovation/en/home/pictures-of-the-future/digitalization-and-software/autonomous-systems-siemens-research-usa.html.
Skelton,M.,&O’Dell,C.(2016).Continuous delivery with windows and NET. O’Reilly Media.Strode,D.,Huff,S.,Hope,B.,&Link,S.(2012).Co-ordinationofco-locatedagilesoftwaredevelopmentprojects.
Journal of Systems and Software, 85, 1222–1238.Sutherland, J. (2005). Future of scrum: support for parallel pipelining of sprints in complex projects.Denver,CO:
Agile(Conference).

554 Appendix 1
Trimble,J.,&Webster,C.(Jan.2013).Fromtraditional,tolean,toagiledevelopment:findingtheoptimalsoftware engineering cycle. In 46th Hawaii International Conference on System Sciences(pp.4826–4833).
VanHeesch,U.,Eloranta,V.-P.,Avgeriou,P.,Koskimies,K.,&Harrison,N.(2014).Decisioncentricarchitecturereviews. IEEE Software, 31(1),69–76.
Weill,P.(June14,2007).IT Portfolio management and it savvy: Rethinking it investments as a portfolio.CentreforSystemsResearch(CISR)MITSloanSchoolofManagement.
Weill,P.,&Woerner,S.(2015).ThrivinginanincreasinglydigitalEcosystem.MIT Sloan Management Review, 56(4).
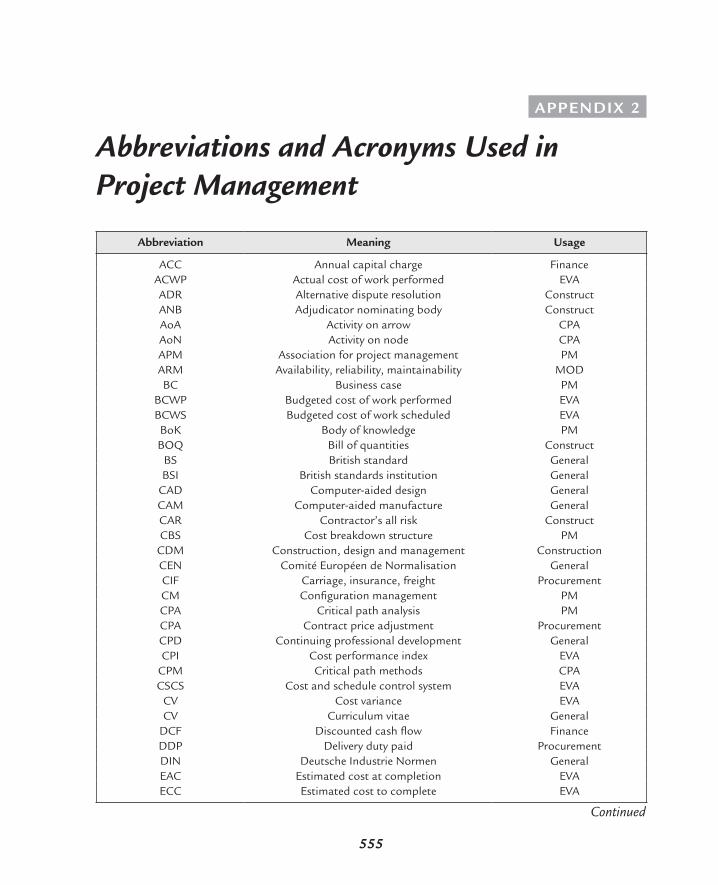
555
APPENDIX 2
Abbreviations and Acronyms Used in Project Management
Abbreviation Meaning Usage
ACC Annual capital charge FinanceACWP Actual cost of work performed EVAADR Alternative dispute resolution ConstructANB Adjudicator nominating body ConstructAoA Activity on arrow CPAAoN Activity on node CPAAPM Association for project management PMARM Availability, reliability, maintainability MODBC Business case PM
BCWP Budgeted cost of work performed EVABCWS Budgeted cost of work scheduled EVABoK Body of knowledge PMBOQ Bill of quantities Construct
BS British standard GeneralBSI British standards institution General
CAD Computer-aided design GeneralCAM Computer-aided manufacture GeneralCAR Contractor’s all risk ConstructCBS Cost breakdown structure PM
CDM Construction, design and management ConstructionCEN Comité Européen de Normalisation GeneralCIF Carriage, insurance, freight ProcurementCM Configuration management PMCPA Critical path analysis PMCPA Contract price adjustment ProcurementCPD Continuing professional development GeneralCPI Cost performance index EVA
CPM Critical path methods CPACSCS Cost and schedule control system EVA
CV Cost variance EVACV Curriculum vitae General
DCF Discounted cash flow FinanceDDP Delivery duty paid ProcurementDIN Deutsche Industrie Normen GeneralEAC Estimated cost at completion EVAECC Estimated cost to complete EVA
Continued

556 Appendix 2
Abbreviation Meaning Usage
ECHR European Convention of Human Rights GovernanceEU European Union GovernanceEV Earned value EVA
EVA Earned value analysis PMEVMS Earned value management system EVAFCC Forecast cost to complete EVAFF Free float CPA
FLAC Four letter acronym GeneralFMEA Failure mode and effect analysis MODFOB Free on board ProcurementFOR Free on rail Procurement
HAZOP Hazard and operability GeneralHR Human resources GeneralHSE Health and safety executive GeneralH&S Health and safety GeneralIA Investment appraisal Finance
IPMA International Project Management Association PMIPMT Integrated Project Management Team PMIPR Intellectual property rights GeneralIRR Internal rate of return FinanceIS Information systems General
ISEB Information Systems Examination Board GeneralISO International Organization for Standardization GeneralIT Information technology General
ITT Invitation to tender ProcurementJIT Just in time GeneralKPI Key performance indicator PMLAD Liquidated ascertainable damages ConstructLCC Life cycle costing PMLD Liquidated damages Construct
LOB Line of balance ConstructLRM Liner responsibility matrix PMMOD Ministry of Defence GeneralMTO Material take-off ConstructNDT Non-destructive testing Construct
NOSCOS Needs, objectives, strategy and organizations control system
MOD
NPV Net present value FinanceOBS Organization breakdown structure PMOD Original duration EVA
OGC Office of government trading GeneralORC Optimal replacement chart FinanceORM Optimal replacement method Finance
P3 Projects, programmes and portfolios PMPBS Product breakdown structure PM
—Cont’d

Abbreviations and Acronyms Used in Project Management 557
Abbreviation Meaning Usage
PDM Precedence diagram method CPAPEP Project execution plan PMPID Project initiation document PM
PERT Program evaluation and review technique CPAPFI Private finance initiative FinancePM Project management PMPM Project manager PMPMI Project management institute PMPMP Project management plan PMPPE Post-project evaluation PMPPP Public–private partnership FinancePRD Project definition PMQA Quality assurance GeneralQC Quality control General
QMS Quality management system GeneralQP Quality plan General
R&D Research and development GeneralRFQ Request for quotation ProcurementRR Rate of return FinanceSFR Sinking fund return Finance
SMART Specific, measurable, achievable, realistic, timebound
MOD
SOR Schedule of rates ConstructSOW Statement of work PMSPI Schedule performance index EVA
SRD Sponsor’s requirement definition PMSV Schedule variance EVA
TCP Time, cost and performance PMTF Total float CPA
TQM Total quality management GeneralTOR Terms of reference GeneralUCL University College London PMVA Value analysis GeneralVE Value engineering GeneralVM Value management General
WBS Work breakdown structure PM
Acronyms Used in Project Management
ARM Availability, reliability, maintainabilityBIM Building information modelling
CAD/CAM Computer-aided design/Computer-aided manufactureCADMID Concept, assessment, demonstration, monitoring,
in-service, disposalCFIOT Concept, feasibility, in-service, operation, termination
Continued

558 Appendix 2
CS2 (CSCS) Cost and schedule control systemEMAC Engineering man-hours and costFLAC Four letter acronym
HASAWA Health and Safety at Work ActIPMA International Project Management Association
NAPNOC No agreed price, no contractNEDO National Economic Development OfficeNIMBY Not in my backyard
NOSCOS Needs, objectives, strategy and organization control system
NOSOCS&R Needs, objectives, strategy, organization control, system and risk
PAYE Pay as you earnPERT Program evaluation and review technique
PESTLE Political, economic, sociological, technological, legal, environmental
PRAM Project risk analysis and managementPRINCE Projects in a controlled environmentRAMP Risk analysis and management for projects
RIDDOR Reporting of Injuries, Diseases & Dangerous Occurrences Regulations
RIRO Rubbish in–rubbish outSAPETICO Safety, performance, time, cost
SMAC Site man-hours and costSMART Specific, measurable, achievable, realistic and time
boundSOW Statement of work
SWOT Strengths, weaknesses, opportunities and threats
—Cont’d

559
APPENDIX 3
GlossaryActivity An operation on a network which takes time (or other resources) and is indicated by an arrow.Actual cost of work performed (ACWP) Cumulative actual cost (in money or man-hours) of work booked in a
specific period.Actual hours The man-hours actually expended on an activity or contract over a defined period.Adjudication Procedure for resolving a dispute by appointing an independent adjudicator.Advance payment bond Bond given in return for advanced payment by client.Analytical estimates Accurate estimate based on build-up of all material and labour requirements of the project.AoA Activity on arrow.AoN Activity on node.Arbitration Dispute resolution by asking an arbitrator to make a decision.Arithmetical analysis A method for calculating floats arithmetically.Arrow A symbol on a network to represent an activity or dummy.Arrow diagram A diagram showing the interrelationships of activities.Back end The fabrication, construction, and commissioning stage of a project.Backward pass A process for subtracting durations from previous events, working backwards from the last event.Banding The subdivision of a network into horizontal and vertical sections or bands to aid identification of
activities and responsibilities.Bar chart See Gantt chart.Belbin type One of nine characteristics of a project team member as identified by Meredith Belbin’s research
programme.Beta (β) distribution Standard distribution giving the expected time te = (a + 4m + b)/6.Bid bond Bond required with quotation to discourage withdrawal of bid.Bond Guarantee given (for a premium) by a bank or building society as a surety.Budget Quantified resources to achieve an objective, task or project by a set time.Budgeted cost of work performed (BCWP) See Earned value.Budgeted cost of work scheduled (BCWS) Quantified cost (in money or man-hours) of work scheduled
(planned) in a set time.Budget hours The hours allocated to an activity or contract at the estimate or proposal stage.Business case The document setting out the information and financial plan to enable decision makers to approve
and authorize the project.Calendar Time scale of programme using dates.Capital cost The project cost as shown in the balance sheet.Cash flow Inward and outward movement of money of a contract or company.Change control The process of recording, evaluating and authorizing project changes.Change management The management of project variations (changes) in time, cost and scope.Circle and link method See Precedence diagram.Close-out procedure The actions implemented and documents produced at the end of a project.Close-out report The report prepared by the project manager after project close-out.Comparative estimates Estimates based on similar past project costs.Computer analysis The method for calculating floats, etc., using a computer.Conciliation The first stage of dispute resolution using a conciliator to improve communications and
understanding.

560 Appendix 3
Configuration management The management of the creation, maintenance and distribution of documents and standards.
Conflict management Management of disputes and disagreements using a number of accepted procedures.Contingency plan Alternative action plan to be implemented when a perceived risk materializes.Cost/benefit analysis Analysis of the relationship between the cost and anticipated benefit of a task or project.Cost breakdown structure (CBS) The hierarchical breakdown of costs when allocated to the work packages of a
WBS.Cost code Identity code given to a work element for cost control purposes.Cost control The ability to monitor, compare and adjust expenditures and costs at regular and sufficiently
frequent intervals to keep the costs within budget.Cost performance index The ratio of the earned value (useful) cost and the actual cost.Cost reporting The act of recording and reporting commitments and costs on a regular basis.Cost variance The arithmetical difference between the earned value cost and the actual cost. This could be
positive or negative.Counter-trade Payment made of goods or services with materials or products that can be sold to pay for the
items supplied.CPA Critical path analysis. The technique for finding the critical path and hence the minimum project duration.CPM Critical path method. See CPACPS Critical path scheduling. See CPA.Critical activity An activity on the critical path which has zero float.Critical path A chain of critical activities, i.e., the longest path of a project.Dangle An activity that has a beginning node but is not connected at its end to a node that is part of the network.Deliverable The end product of a project or defined stage.Dependency The restriction on an activity by one or more preceding activities.Direct cost The measurable cost directly attributed to the project.Discounted cash flow (DCF) Technique for comparing future cash flows by discounting by a specific rate.Distribution schedule A tabular record showing by whom and to whom the documents of a project are
distributed.Dummy activity A timeless activity used as a logical link or restraint between real activities in a network.Duration The time taken by an activity.Earliest finish The earliest time at which an activity can be finished.Earliest start The earliest time at which an activity can be started.Earned value hours See Value hours.End event The last event of a project.Estimating Assessment of costs of a project.EVA Earned value analysis.Event The beginning and end node of an activity, forming the intersection point with other activities.Expediting Action taken to ensure ordered goods are delivered on time. Also known a progress chasing.Feasibility study Analysis of one or more courses of action to establish their feasibility or viability.Feedback The flow of information to a planner for updating the network.Float The period by which a non-critical activity can be delayed.Free float The time by which an activity can be delayed without affecting a following activity.Forward pass A process for adding durations to previous event times starting at the beginning of a project.Front end The design and procurement stage of a project. This may or may not include the manufacturing period
of equipment.Functional organization Management structure of specialist groups carrying out specific functions or services.Gantt chart A programming technique in which activities are represented by bars drawn to a time scale and
against a time base.Graphical analysis A method for calculating the critical path and floats using a linked bar chart technique.Graphics Computer-generated diagrams.Grid Lines drawn on a network sheet to act as coordinates of the nodes.

Glossary 561
Hammock An activity covering a number of activities between its starting and end node.Hardware The name given to a computer and its accessories.Herzberg’s theory The hygiene factors and motivators that drive human beings.Histogram A series of vertical columns whose height is proportional to a particular resource or number of
resources in any time period.Incoterms International trade terms for shipping and insurance of freight.Independent float The difference between free float and the slack of a beginning event.Indirect cost Cost attributable to a project, but not directly related to an activity or group within the project.Input The information and data fed into a computer.Interface The meeting point of two or more networks or strings.Interfering float The difference between the total float and the free float. Also the slack of the end event.Internal rate of return (IRR) The discount rate at which the net present value is zero.Investment appraisal Procedure for analysing the viability of an investment.Key performance indicators (KPI) Major criteria against which the project performance is measured.Ladder A string of activities which repeat themselves in a number of stages.Lag The delay period between the end of one activity and the start of another.Latest finish The latest time at which an activity can be finished without affecting subsequent activities.Latest start The latest time at which an activity can be started without delaying the project.Lead The time between the start of one activity and the start of another.Leadership The ability to inspire and motivate others to follow a course of action.Lester diagram Network diagram that combines the advantages of arrow and precedence diagrams.Letter of intent Document expressing intention by client to place an order.Line of balance Planning technique used for repetitive projects, subprojects or operations.Litigation Act of taking a dispute to a court of law for a hearing before a judge.Logic The realistic interrelationship of the activities on a network.Logic links The link line connecting the activities of a precedence diagram.Loop A cycle of activities that returns to its origin.Manual analysis The method for calculating floats and the critical path without the use of a computer.Maslow’s hierarchy of needs The five stages of needs of an individual.Master network Coordinating network of subnetworks.Matrix The table of activities, durations and floats used in arithmetical analysis.Matrix organization Management structure where functional departments allocate selected resources to a
project.Mediation Attempt to settle a dispute by joint discussions with a mediator.Menu Screen listing of software functions.Method statement Narrative or graphical description of the methods envisaged to construct or carry out selected
operations.Milestone Key event in a project which takes zero time.Milestone slip chart Graph showing and predicting the slippage of milestones over the project period.Negative float The time by which an activity is late in relation to its required time for meeting the programme.Negotiation Attempt to reach a result by discussion which is acceptable to all sides.Net present value (NPV) Aggregate of discounted future cash flows.Network A diagram showing the logical interrelationships of activities.Network analysis The method used for calculating the floats and critical path of a network.Network logic The interrelationship of activities of a planning network.Node The intersection point of activities. An event.Organization breakdown structure (OBS) Diagrammatic representation of the hierarchical breakdown of
management levels for a project.Organogram Family tree of an organization showing levels of management.Output The information and data produced by a computer.P3 Primavera Project Planner.
562 Appendix 3
Parametric estimates Estimates based on empirical formulae or ratios from historical data.Pareto’s law Doctrine which shows that approx. 20% of causes create 80% of problems. Also known as 80/20
rule.Path The unbroken sequence of activities of a network.Performance bond Bond that can be called by client if contractor fails to perform.PERT Program evaluation and review technique. Another name for CPA.PESTEL Political, economic, sociological, technical, legal, environmental.Phase A division of the project life cycle.Portfolio management Management of a group of projects not necessarily related.Post project review History and analysis of successes and failures of project.Planned cost The estimated (anticipated) cost of a project.Precedence network A method of network programming in which the activities are written in the node boxes and
connected by lines to show their interrelationship.Preceding event The beginning event of an activity.Printout See Output.Procurement Operation covering tender preparation, bidder selection, purchasing, expediting, inspection,
shipping and storage of goods.Product breakdown structure (PBS) Hierarchical decomposition of a project into various levels of products.Program The set of instructions given to a computer.Programme A group of related projects.Programme management Management of a group of related projects.Programme manager Manager of a group of related projects.Progress report A report that shows the time and cost status of a project, giving explanations for any deviations
from the programme or cost plan.Project A unique set of co-ordinated and controlled activities to introduce change within defined time, cost, and
quality/performance parameters.Project context See Project environment.Project environment The internal and external influences of a project.Project close-out The shutting down of project operations after completion.Project life cycle All the processes and phases between the conception and termination of a project.Project management The planning, monitoring and controlling of all aspects of a project.Project management plan (PMP) A document which summarizes of all the main features encapsulating the why,
what, when, how, where and who of a project.Project manager The individual who has the authority, responsibility and accountability to achieve the project
objectives.Project organization Organization structure in which the project manager has full authority and responsibility of
the project team.Project task force See Task force.Quality assurance Systematic actions required to provide confidence of quality being met.Quality audit Periodic check that quality procedures have been carried out.Quality control Actions to control and measure the quality requirements.Quality management The management of all aspects of quality criteria, control, documentation and assurance.Quality manual Document containing all the procedures and quality requirements.Quality plan A plan that sets out the quality standards and criteria of the various tasks of a project.Quality policy Quality intentions and directions set out by top management.Quality programme Project-specific document that defines the requirements and procedures for the various
stages.Quality review Periodic review of standards and procedures to ensure applicability.Quality systems Procedures and processes and resources required to implement quality management.Random numbering The numbering method used to identify events (or nodes) in which the numbers follow no
set sequence.

Glossary 563
Requirements management Capture and collation of the client’s or stakeholders’ perceived requirements.Resource The physical means necessary to carry out an activity.Resource levelling See Resource smoothing.Resource smoothing The act of spreading the resources over a project to use the minimum resources at any one
time and yet not delay the project.Responsibility code Computer coding for sorting data by department.Responsibility matrix A tabular presentation showing who or which department is responsible for set work items
or packages.Retention bond Bond given in return for early payment of retention monies.Retentions Moneys held by employer for period of maintenance (guarantee) period.Return on capital employed Profit (before interest and tax) divided by the capital employed given as a
percentage.Return on investment (ROI) Average return over a specified period divided by the investment given as a
percentage.Risk The combination of the consequences and likelihood of occurrence of an adverse event or threat.Risk analysis The systematic procedures used to determine the consequences or assess the likelihood of
occurrence of an adverse event or threat.Risk identification Process for finding and determining what could pose a risk.Risk management Structured application of policies, procedures and practices for evaluating, monitoring and
mitigating risks.Risk management plan Document setting out strategic requirements for risk assessment and procedures.Risk register Table showing the all identified risks, their owners, degree of P/I and mitigation strategy.Schedule See Programme.Schedule performance index The ratio of earned value cost (or time) and the planned cost (or time).Schedule variance The arithmetical difference between the earned value cost (or time) and the planned cost
(or time).Sequential numbering The numbering method in which the numbers follow a pattern to assist in identifying the
activities.Situational leadership Adaptation of management style to suit the actual situation the leader finds him/herself in.Slack The period between the earliest and latest times of an event.Slip chart See Milestone slip chart.SMAC Site man-hour and cost. The name of the computer program developed by Foster Wheeler Power Products
Limited for controlling man-hours in the field.Software The programs used by a computer.Sponsor The individual or body who has primary responsibility for the project and is the primary risk taker.Stakeholder Person or organization who has a vested interest in the project. This interest can be positive or
negative.Statement of work (SOW) Description of a work package that defines the project performance criteria and
resources.Start event The first event of a project or activity.Subcontract Contract between a main contractor and specialist subsidiary contractor (subcontractor).Subjective estimates Approximate estimates based on ‘feel’ or ‘hunch’.Sub-network A small network that shows a part of the activities of a main network in greater detail.Succeeding event The end event of an activity.Task The smallest work unit shown on a network programme (see also Activity).Task data The attributes of a task such as duration, start and end date, and resource requirement.Task force Project organization consisting of a project team that includes all the disciplines and support services
under the direction of a project manager.Teamwork The act of working harmoniously together in a team to produce a desired result.Time estimate The time or duration of an activity.Toolbar The list of function icons on a computer screen.

564 Appendix 3
Topological numbering A numbering system where the beginning event of an activity must always have a higher number than the events of any activity preceding it.
Total float The spare time between the earliest and latest times of an activity.Total quality management (TQM) Company-wide approach to quality beyond prescriptive requirements.Updating The process of changing a network or programme to take into account progress and logic variations.Value engineering The systems used to ensure the functional requirements of value management are met.Value hours The useful work hours spent on an activity. This figure is the product of the budget hours and the
percentage complete of an activity or the whole contract.Value management Structured means aimed at maximizing the performance of an organization.Variance Amount by which a parameter varies from its specified value.Weightings The percentage of an activity in terms of man-hours or cost of an activity in relation to the contract as
a whole, based on the budget values.Work breakdown structure (WBS) Hierarchical decomposition of a project into various levels of management
and work packages.Work package Group of activities within a specified level of a work breakdown structure.

565
APPENDIX 4
Examination Questions 1: Questions
The following pages show 60 typical examination questions that may appear in the APM PMQ examination. The answers are given in appendix 8. The numbers in brackets refer to the relevant chapter numbers in the book. 1. List 12 items (subjects) which should be set out in a PMP. (14) 2. Explain the purpose and structure of a WBS. (12) 3. Describe the most usual risk identification techniques. (15) 4. Explain the risk management procedure. (15) 5. Set out the risks associated with travelling from Bath to London by road. Draw a risk
register (log) and populate it with at least four perceived risks. (15) 6. Describe a change management procedure. Draw up two forms relating to change
management. (17) 7. Draw a bar chart for the following activities:
Activity Duration (days) Preceding activity
A 5 –B 7 AC 9 AD 7 BE 2 CF 6 CG 2 E & DH 3 FJ 4 G & H
What is the end date? What is the effect of B slipping by 3 days. (19) 8. Explain the difference between project management and programme management. (2&3) 9. Explain the purpose of stakeholder management and describe the difference
(with examples of positive and negative stakeholders). (7) 10. Explain what is meant by configuration management. (18) 11. Describe a risk management plan and give its contents. (15) 12. State four risk mitigation strategies excluding contingencies. (15) 13. Explain the main tools used in quality management. (16)
566 Appendix 4
14. Explain the main topics of a quality management system. (16) 15. Describe the purpose of milestones and draw a milestone slip chart showing how
slippage is recorded. (25) 16. Explain the advantages of EVA over other forms of progress monitoring. (32) 17. Explain the purpose of a project life cycle and draw a typical life cycle diagram.
Explain what is meant by product life cycle and expanded life cycle. (11) 18. Describe what documents are produced at the various stages of a life cycle. (11) 19. Explain the difference between the three main types of project organization. (9) 20. Explain what is meant by communication management. Give eight barriers to good
communication and explain how to overcome them. (38) 21. Explain the advantages of a project team; list six features and give four barriers
to team building. (39) 22. Describe what is meant by conflict management and list five techniques. (42) 23. Describe the purpose of Belbin test and explain the characteristics of the eight Belbin
types. (39) 24. Explain Herzberg’s motivation theory and Maslow’s theory of needs. (39) 25. Explain the main constituents of a business case. Who owns the business case. (5) 26. Explain what are the qualities which make a leader. (40) 27. Describe the main stages of a negotiation process. (41) 28. Explain what is meant by cash flow. Draw the format of a cash flow chart. (31) 29. Describe a close-out procedure. List six documents that must be prepared and handed
over to the client on close-out. (45) 30. Describe six topics to be considered as part of a procurement strategy. List four
types of contract. (34) 31. Describe the selection process for employing contractors or subcontractors. (34) 32. List and explain the phases of a project as suggested by Tuckman. (39) 33. Describe what is meant by the project environment. (4) 34. List 10 reasons why a project may fail and suggest ways to rectify these failures. (15,16,36) 35. Explain the role of a programme manager and show the advantages to the
organization of such a position. (3) 36. What is meant by requirement management. (5) 37. Describe the principal reasons for an investment appraisal and give the constituents
of such an appraisal. (6) 38. What are the four main types of estimating techniques and what is their approximate
degree of accuracy. (13) 39. What is meant by resource levelling and resource smoothing. (30) 40. Describe the roles of the client, sponsor, project manager and a supplier. (10) 41. List at least six documents that have to be handed over at the end of a project. (44) 42. Describe six common generic causes of accidents in industry. (36)

Examination Questions 1: Questions 567
43. Draw a work breakdown structure for the manufacture of a bicycle. Limit the size to four levels of detail. (12)
44. What is meant by internal rate of return (IRR)? Show how this can be obtained graphically. (6)
45. Describe the functions carried out by a project office. (2) 46. What is the purpose of a post project review. (45) 47. Describe three methods of conflict resolution when mediation has failed. (42) 48. State four main characteristics of a good project manager. (2) 49. Describe two pros and cons of an AoA network and an AoN network. (19) 50. Describe two pros and cons of DCF and payback. (6) 51. What is meant by portfolio management. (3) 52. What are success criteria. (37) 53. Describe a change Register. (17) 54. What is meant by Information Management. (37) 55. Explain what is meant by value management. (35) 56. Explain the difference between project management and line management. (1) 57. What is meant by matrix project management. (9) 58. What is benefit analysis. (6) 59. What is meant by project governance. (43) 60. Give eight topics of an information management plan. (37)

This page intentionally left blank

569
APPENDIX 5
BibliographyAdair, J. (2010). Decision making and problem solving strategies. Kogan Page.Adams, J., & Adams, J. R. (1997). Principles of project management. PMI.Adkins, L. (2010). Coaching agile teams. Pearson Education Inc.Alvesson, M. (2002). Understanding organisational culture. Sage.Andersen, E. (2008). Rethinking project management. Pearson.Andrews, N. (2011). Contract law. Cambridge University Press.APM. (2016). A guide to conducting integrated baseline reviews. APM.APM. (1998). Contract strategy for successful project management. APM.APM. (1998). Standard terms for the appointment of a project manager. APM.APM. (2002). Earned value management: APM guidelines. APM.APM. (2004). Project risk analysis and management (PRAM) guide (2nd ed.). APM.APM. (2007). APM introduction to programme management. APM.APM. (2007). Co-directing change. APM.APM. (2008). Interfacing risk and earned value management. APM.APM. (2008). Introduction to project planning. APM.APM. (2009). Benefits management. APM.APM. (2009). Sponsoring change. APM.APM. (2010). Benefits realisation. APM.APM. (2010). From physical change to benefits in the built environment. APM.APM. (2010). The earned value management compass. APM.APM. (2010). The scheduling maturity model. APM.APM. (2011). APM code of professional conduct. APM.APM. (2011). Directing change. APM.Bagueley, P. (2010). Improve your project management: Teach yourself. Hodder & Stoughton.Bahsoon, R., & Emmerich, W. (2004). Evaluating architectural stability with real options theory. In Proceedings of
the 20th IEEE International Conference on Software Maintenance (ICSM’04).Balogun, J., et al. (2008). Exploring strategic change. Prentice-Hall.Barkley. (2004). Project risk management. McGraw-Hill.Barkley. (2006). Integrated project management. McGraw-Hill.Barnes, P., & Davies, N. (2015). BIM in principle and practice. Thomas Telford.Bartlett, J. (2005). Right first and every time. Project Manager Today.Bartlett, J. (2010). Managing programmes of business change. Project Manager Today.Bass, L., Clements, P., & Kazman, R. (2003). Software architecture in practice SEI series in software engineering
(2nd ed.). Addison-Wesley.Basu, R. (2011). Managing project supply chains. Gower.Benko, C., & McFarlane, W. (2003). Connecting the dots. Harvard Business School.Boddy, D., & Buchannan, D. (1002). Take the lead. Prentice-Hall.Boddy, D. (2002). Managing projects. Prentice-Hall.Bosch, J. (May 16–20, 2011). Keynote abstract Saturn Conference San Francisco. SEI.Boundy, C. (2010). Business contracts handbook. Gower.Bourne, L. (2009). Stakeholder relationship management. Gower.Bradley, G. (2010a). Benefit realization management. Gower.

570 Appendix 5
Bradley, G. (2010b). Fundamentals of benefit realization. The Stationary Office.Briscoe, D. (2015). Beyond BIM. Routledge.Broome, J. C. (2002). Procurement routes for partnering: A practical guide. Thomas Telford.Brown, N., Nord, R., & Ozkaya, I. (November/December 2010). Enabling agility through architecture crosstalk.Brulin, G., & Svensson, L. (2012). Managing sustainable development programmes. Gower.BSI, BS EN ISO 9000:2000. (2000a). Quality management systems, fundamentals and vocabulary. BSI.BSI, BS EN ISO 9000:2000. (2000b). Quality management systems, guidelines for performance
improvement. BSI.BSI, PAS 2001:2001. (2001). Knowledge management. BSI.BSI, BS EN ISO 9000:2003. (2003). Quality management systems, guidelines for quality management in
projects. BSI.BSI, PD 7501:2003. (2003a). Managing culture and knowledge. BSI.BSI, PD 7502:2003. (2003b). Guide to measurements in knowledge management. BSI.BSI, PD 7506:2005. (2005). Linking knowledge management with other organizational functions and
disciplines. BSI.BSI, BS EN ISO 900012008. (2008). Quality management systems, requirements. BSI.BSI, BS 6079-1:2010. (2010). Guide to project management. BSI.BSI, BS31100:2011. (2011). Risk management. BSI.Burke, R., & Barron, S. (2007). Project management leadership. Burke Publishing.Burke, R. (2011). Advanced project management. Burke Publishing.Camilleri, E. (2011). Project success. Gower.Cappels, T. (2003). Financially focused project management. J. Ross.Carroll, J., & Morris, D. (2015). Agile project management in easy steps.Carroll, T. (2006). Project delivery in business-as-usual organizations. Gower.Carver, J., & Carver, M. M. (2009). The policy governance model & role of the board member. Jossey Boss.Cavanagh, M. (2012). Second order project management. Gower.Chapman, C. B., & Ward, S. C. (2003). Project risk management (2nd ed.). Wiley.Cialdini, R. B. (2008). Influence, science and practice (5th ed.). Pearson.CIOB. (2009). Code of practice for project management for construction and development (4th ed.). Wiley.Cleden, D. (2009). Managing project uncertainty. Gower.Cleden, D. (2011). Bid writing for project managers. Gower.Cleland, D. I. (2006). Global project management handbook. McGraw-Hill.Cleland, D. I. (2007). Project management: Strategic design and implementation. McGraw-Hill.CMMI. (November 2010). CMMI® for development, version 1.3 CMMI-DEV, V1.3. SEI.Cockburn. (2002). Alistair, Agile software development. Addison-Wesley.Cohn, M. (2006). Agile estimating and planning. Addison-Wesley.Cohn, M. (2009). Succeeding with Agile: Software development using scrum. Addison-Wesley.Collett, P. (2003). The book of tells. Doubleday.Collins, G. (June12–15, 2006). Experience in developing metrics for Agile projects compatible with CMMI best
practice. In SEI SEPG Conference, Amsterdam.Collins, G. (June 2011). Developing Agile software architecture using real-option analysis and value engineering.
In SEI SEPG Conference, Dublin.Costin, A. A. (2008). Managing difficult projects. Butterworth-Heinemann.Covey, S. (2004). 7 Habits of highly effective people. Simon & Schuster.Crane, A., & Matten, D. (2010). Business ethics (3rd ed.). Oxford University Press.Davies, R. H., & Davies, A. J. (2011). Value management. Gower.Davis, T., & Pharro, R. (2003). The relationship manager. Gower.De Mascia, S. (2012). Project psychology. Gower.De Vito, J. A. (2011). Human communications (12th ed.). Allyn & Bacon.De Vito, J. A. (2012). The interpersonal communications book. Pearson.

Bibliography 571
Dent, F. E., & Brent, M. (2006). Influencing skills and techniques for business success. Palgrave Macmillan.Diab, P. R. (2011). Sidestep complexity. PMI.El-Reedy, M. A. (2011). Construction management for industrial projects. Wiley.Elssamadisy, A. (2009). Agile adoption patterns: A roadmap to organisational success. Addison-Wesley.European Committee for Standardisation. (2004a). CWA 14924-4:2004, European guide to good practice in
knowledge management. Guidelines for Measuring KM. CEN.European Committee for Standardisation. (2004b). CWA 14924-5:2004, European guide to good practice in
knowledge management. KM Terminology. CEN.European Committee for Standardisation. (2012). FprEN 16271:2012 (E), value management. CEN.Ferraro, M. (2012). Venice, history of the floating city. Cambridge University Press.Field, M., & Keller, L. (1998). Project management. Cengage Learning EMEA.Fisher, R., & Shapiro, D. (2007). Building agreement. Random House.Fisher, R., Ury, W., & Patton, B. (2003). Getting to Yes. Random House.Forsberg, K., Mooz, H., & Cotterman, H. (2000). Visualising project management. Wiley.Frigenti, E., & Comninos, D. (2002). The practice of project management. Kogan Page.Gambles, I. (2009). Making the business case. Gower.Gardiner, P. D. (2005). Project management, a strategic planning approach. Palgrave Macmillan.Garlick, A. (2007). Estimating risk. Gower.Gatti, S. (2007). Project finance in theory and practice. Academic Press.Goldsmith, L. (2005). Project management accounting. Wiley.Goleman, D., Boyatzis, R., & McKee, A. (2002). Primal leadership. Harvard Business School Press.Goleman, D. (2007). Social intelligence. Hutchinson.Goodpasture, J. (2010). Project management, the Agile way. Ross Publishing Inc.Gordon, J., & Lockyer, K. (2005). Project management and project network techniques (7th ed.). Prentice-Hall.Graham, N. (2010). Project management for dummies. Wiley.Grimsey, D., & Lewis, M. K. (2007). Public private partnerships. Edward Elgar.Hancock, D. (2010). Tame, Messy and Wicked risk leadership. Gower.Harrison, F., & Lock, D. (2004). Advanced project management. Gower.Haugan, G. T. (2002). Effective work breakdown structure. Kogan Page.Heldman, K. (2011). Project management jump start. Syber.Hersey, P. H., & Blanchard, K. H. (2012). Management of organizational behaviour. Prentice-Hall.Highsmith, J. (2002). Agile software development ecosystems. Addison-Wesley.Highsmith, J. (2009). Agile project management (2nd ed.). Addison-Westley Professional.Highsmith, J. (2010). Agile project management (2nd ed.). Addison-Wesley.Hillson, D. A., & Murray-Webster, R. (2005). Understanding and managing risk attitude. Gower.Hillson, D. A. (2003). Effective opportunity management for projects. Marcel Dekker.Hillson, D. (2009). Managing risk in projects. Gower.Holzer, D. (2016). BIM manager’s handbook. John Wiley.Hopkinson, M. (2010). The project risk maturity model. Gower.Hulett, D. (2009). Practical schedule risk analysis. Gower.Hulett, D. (2011). Integrated cost-schedule risk analysis. Gower.Humble, J., Molesky, J., & O’Reilly, B. (2015). Lean enterprise: How high performance organisations innovate at
scale. O’Reilly Media.ISO, ISO 31000:2009. (2009). Risk management – principles and guidelines. ISO.ISO, ISO/FDIS 21500. (2012). Guidance on project management. ISO.Johnson, G., & Scholes, K. (2004). Exploring corporate strategy. Prentice-Hall.Jones, S. (2016). Agile project management, quick start guide (Create Space IPP).Katzenbach, J. R., & Smith, D. K. (2005). The wisdom of teams. Harper Business.Kemp. (2004). Project management demystified. McGraw-Hill.Kerzner, H. (2004). Advanced project management. Wiley.

572 Appendix 5
Kerzner, H. (2009). Project management. Wiley.Khan, F., & Parra, R. (2003). Financing large projects. Pearson Education Asia.Knaster, R., & Leffingwell, D. (2016). SAFe® 4.0 Distilled: Applying the scaled Agile framework® for lean
software and systems engineering. Addison-Wesley.Kor, R., & Wijnen, G. (2007). 59 Checklists for project and programme managers. Gower.Kumar, B. (2016). A practical guide adopting BIM in construction projects. Whittles.Larman, C. (2004). Agile and iterative development: A Manager’s guide. Addison-Wesley.Laudon, K. C. (2008). Management information systems (11th ed.). Prentice-Hall.Layton, M. C. (2012). Agile project management for dummies. John Wiley.Leach, L. P. (2005). Critical chain management. Artech House.Leblanc, R. (2016). A handbook of board governance. John Wiley.Leffingwell, D. (2007). Scaling software agility: Best practices for large enterprises. Addison-Wesley
(Chapter 21 with Schwaber, K.).Lewis, J. P. (2003). Project leadership. McGraw-Hill.Lewis, H. (2005). Bids, tenders and proposals. Kogan Page.Lewis, J. P. (2005). Project planning, scheduling and control. McGraw-Hill.Linstead, S., Fulop, L., & Lilley, S. (2009). Management and organization. Palgrave Macmillan.Lock, D. (2007). Project management (9th ed.). Gower.Lock, D. (2013). Gower book of people in project management. Gower.Longdin, I. (2009). Legal aspects of purchasing and supply chain management (3rd ed.). Liverpool Academic.Ludovino, E. M. (2016). Change management. EM Press Ltd.Mantel, S. J., et al. (2011). Project management in practice (4th ed.). Wiley.Marchewka, J. T. (2012). Information technology project management with CD-ROM (4th ed.). Wiley.Margerison, C., & McKann, D. (2000). Team management: Practical new approach management books.Martin, N. (2010). Project politics. Gower.Maylor, H. (2005). Project management. Prentice-Hall.Meredith, J. R., & Mantel, S. J. (2010). Project management: A managerial approach. Wiley.Minter, M., & Szczepanek, T. (2009). Images of projects. Gower.Morris, P., Pinto, J. K., & Soderlund, J. (2011). The Oxford handbook on project management. Oxford University Press.Muller, R., & Turner, R. (2010). Project-oriented leadership. Gower.Muller, R. (2009). Project governance. Gower.Neil, J., & Harpham, A. (2012). Spirituality and project management. Gower.Newton, R. (2006). Project management, step by step. Pearson.Newton, R. (2009). The project manager. Pearson.Nickson, D. (2008). The bid manager’s handbook. Gower.Nieto-Rodriguez, A. (2012). The focused organization. Gower.Nokes, S. (2007). The definitive guide to project management (2nd ed.). Pearson.O’Connell, F. (2010). What you need to know about project management. Wiley.O’Connell, F. (2011). All you need to know about project management. Capstone Publishing.Oakes, G. (2008). Project reviews. Assurance and governance. Gower.Obeng, E. (2002). Perfect projects. Pentacle Works.OGC. (2007). Managing successful programmes. The Stationary Office.OGC. (2008). Portfolio, programme and project offices. The Stationary Office.OGC. (2009). Directing successful projects with PRINCE 2. The Stationary Office.OGC. (2009). Managing successful projects with PRINCE 2. The Stationary Office.OGC. (2010). An executive guide to portfolio management. The Stationary Office.OGC. (2011). Management of portfolios. The Stationary Office.Paterson, G. (2015). Getting to grips with BIM. Routledge.Pennypacker, J. S., & Dye, L. D. (2002). Managing multiple projects. Marcel Dekker.Pennypecker, J. S., & Retna, S. (2009). Project portfolio management. Wiley.

Bibliography 573
Pidd, M. (2004). Systems modelling: Theory and practice. Wiley.Pinto, J. (2010). Project management (2nd ed.). Pearson.PMI. (2013). Project management body of knowledge. PMI.PMI. (2001). PMI practice standard for work breakdown structures. PMI.PMI. (2003). Organizational project management maturity model (OPM3): Overview. PMI.PMI. (2004). Practice standard for configuration management. PMI.PMI. (2006). Government extension to the PMBOK guide. PMI.PMI. (2007). Project manager competency development framework. PMI.PMI. (2008). A guide to the project management body of knowledge. PMI.PMI. (2008). Organizational project management maturity model (OPM3): Knowledge foundation. PMI.PMI. (2008). The standard for portfolio management. PMI.PMI. (2008). The standard for program management. PMI.PMI. (2009). Practice standard for project risk management. PMI.Rad, P. F., & Levin, G. (2002). The advanced project management office. St Lucie Press Project.Rad, P. F. (2001). Project estimating and cost management VA: Management concepts.Reiss, G., et al. (2006). Gower handbook of programme management. Gower.Reiss, G. (2006). The Gower handbook of programme management. Gower.Remington, K., & Pollack, J. (2007). Tools for complex projects. Gower.Remington, K., & Pollack, J. (2008). Tools for complex projects. Gower.Remington, K. (2011). Leading complex projects. Gower.Robertson, S., & Robertson, J. (2006). Mastering the requirements process. Addison-Wesley.Rodriguez, A. (2012). Earned value management for projects. Gower.Rogers, M. (2001). Engineering project appraisal. Blackwell Science.Rose, K. (2005). Project quality management. J. Ross.Ross, J. W., Weill, P., & Robertson, D. C. (2006). Enterprise architecture as strategy: Creating a foundation for
business execution. Harvard Business Review Press.Royce, W. (2011). Measuring agility and architectural integrity. International Journal of Software Informatics,
5(3), 415–433.Sant, T. (2004). Persuasive business proposals. Amacom.Sanwal, A. (2007). Optimising corporate portfolio management. Wiley.Sauchez, A. X. (2016). Delivering value with BIM. Routledge.Saxon, R. (2016). BIM for construction clients. NBS.Schwaber, K. (2004). Agile project management. Microsoft.Schwartz, M. (2016). The art of business value. Portland, Oregon: IT Revolution.Schwindt, C. (2005). Resource allocation in project management. Springer.Senaratne, S., & Sexton, M. (2011). Managing change in construction projects. Wiley.Shalloway, A., Beaver, G., & Trott, J. R. (2010). Lean-agile software development: Achieveing enterprise agility.
Addison-Wesley.Shermon, D. (Ed.). (2009). Systems cost engineering. Gower.Shore, J. (2007). The art of agile development. O’Reilly.Shtub, A., Bard, J., & Globerson, S. (2004). Project management. Pearson.Skelton, M., & O’Dell, C. (2016). Continuous delivery with Windows and .NET. O’Reilly Media.Sleeper. (2006). Design for six sigma statistics. McGraw-Hill.Smith, C. (2007). Making sense of project realities. Gower.Spencer, L.M., Spencer, S.M. (1003). Competence at work. Wiley.Srevens, R., et al. (1998). Systems engineering. Addison-Wesley.Stenzel, C., & Stenzel, J. (2002). Essentials of cost management. Wiley.Stutzke, R. (2005). Software project estimation. Addison-Wesley.Sutherland, J. (2005). Future of scrum: Support for parallel pipelining of sprints in complex projects. Denver,
CO: Agile. Conference.

574 Appendix 5
Sutt, J. (2011). Manual of construction project management. Wiley.Taylor, J. C. (2005). Project cost estimating tools, techniques and perspectives. St. Lucie Press.Taylor, P. (2011). Leading successful PMOs. Gower.Taylor, P. (2016). The social project manager. Routledge.Thacker, N. (2012). Winning your bid. Gower.Thiry, M. (2010). Programme management. Gower.Thiry, M. (2012). Project based organizations. Gower.Trevino, L., & Nelsom, K. (2010). Managing business ethics (5th ed.). Wiley.Turner, R., & Wright, D. (2011). The commercial management of projects. Ashgate.Turner, J. R. (2003). People in project management. Gower.Turner, R. (2003). Contracting for project management. Gower.Turner, J. R. (2008). The Gower handbook of project management (4th ed.). Gower.Ursiny, T. (2003). The coward’s guide to conflict. Sourcebooks.Venning, C. (2007). Managing portfolios of change with MSP for programmes and PRINCE 2 for projects.
The Stationary Office.Ward, S., & Chapmen, C. (2011). How to manage project opportunity and risk. Wiley.Ward, G. (2008). The project manager’s guide to purchasing. Gower.Wearne, S. H. (1993). Principles of engineering organizations. Thomas Telford Publications.Weaver, R. G., & Farrell, J. D. (1997). Managers as facilitators. Berret-Koehler.Webb, A. (2003). The project manager’s guide to handling risk. Gower.Wenger, E., McDermott, R., & Snyder, W. (2002). Cultivating communities of practice. Harvard Business
School Press.West, D. (2010). Project sponsorship. Gower.Williams, D., & Parr, T. (2006). Enterprise programme management. Palgrave Macmillan.Winch, G. M. (2010). Managing construction projects. Blackwell.Wright, D. (2004). Law for project managers. Gower.Yang. (2005). Design for six sigma in service. McGraw-Hill.Yescombe, E. (2002). Principles of project finance. Academic Press.Yescombe, E. (2007). Public-private partnerships. Butterworth-Heinemann.Young, T. L. (2001). Successful project management. Kogan Page.Young, T. L. (2003). Handbook of project management. Kogan Page.

575
APPENDIX 6
Words of Wisdom
Cash flow More businesses go bust because of poor cash flow than low profitability
Cash flow A bird in the hand is worth two in the bushClaims You need three things for a successful claim:
1. Good backup documentation 2. Good backup documentation 3. Good backup documentation
Communication Listen carefully before talking; you have two ears and one mouth
Communication Read twice, write once (for examinations)Contract A verbal contract is not worth the paper it is (not) written onContract Do not use two if one will doControl The wheel that squeals gets the grease
Delegation Do not keep a dog and bark yourselfGeneral If it looks wrong, it probably is wrongGeneral If it looks too good to be true, it probably isGeneral A wise man learns from experience, a fool does notGeneral If in doubt, say nowtGeneral Every problem has a solutionGeneral The early bird gets the wormGeneral To take off, go against the wind, not with itPlanning The shortest distance between two points is a straight linePlanning The longest distance between two points is a shortcutPlanning Forewarned is forearmedPlanning It is later than you think
Procurement If you do not inspect it arrives wrongProcurement If you do not expedite it arrives late
Quality Quality is remembered long after the price is forgottenQuality A good product goes outQuality A bad product comes back
Risk Nothing ventured, nothing gainedSafety It is better to be old than boldSafety Look before you leapSafety The most important bolt is the one that is loose

This page intentionally left blank

577
APPENDIX 7
Syllabus Summary Bullet Points
Selected topics from APM BoK, sixth edition. 1.0 Context
EnvironmentExternal influencesGovernanceHost organizationInternal influencesLegislationP3PESTLESettingStakeholdersStructured approach
1.1 GovernanceApproval gatesAssurance scheme in forceCoherent business strategyCompliance with external regulationsContinual improvement policyCorporate ethicsDefined rolesFostering trustFrank disclosure and reportingGood communicationsPortfolio directionProject management capabilityProject sponsorshipRisk awarenessStakeholder engagement
578 Appendix 7
1.1.1 Project managementDefinition of project managementDefined start and finishMotivation of all involvedPlanning, monitoring and controlling all aspects of the projectProject charterTime, cost and performance requirement
1.1.2 Programme managementAssign prioritiesCollection of related projectsCoordinate resourcesOversee project managersPrepare overall milestone planReduce riskResolve conflicts between project managers
1.1.3 Portfolio managementAllocate resources and eliminate bottlenecksAssess risks of projects in portfolioCarry out cost benefit analysis of projectsDecide on timing of project startsEnsure good cash flow and profitabilityMonitor performance of all projectsPrioritize projects against the needs of the organizationProjects can be related or not related
1.1.4 InfrastructureAccess to all tools and techniquesAssurance of governanceMaintenance of infrastructurePermanent organizational structureProject officeSecretariatSpecialist skill supply when requiredTechnical supportTraining and coaching programmes
1.1.5 Knowledge managementCorporate functionExperience recorded for future useExternal and internal sourcesOwnership of knowledge

Syllabus Summary Bullet Points 579
Implementation mechanismKnowledge captureLessons learned logMaintenance of knowledge repositoryStorage of knowledge
1.1.6 Life cycleBS 6079: Conception, feasibility, implementation, operation, terminationEnsures unnecessary expenditureGo or No-Go gatesNumber of phasesReview after each phaseTrigger for further funding
1.1.7 Success factorsDefine benefits and agree measureEnsure senior management commitmentIdentify and assess benefitsImplement proper governanceProvide good communicationsSet and monitor KPIs (key performance indicators)Set success criteria
1.1.8 SponsorshipBusiness case ownerCommunication skillsGovernanceOversees delivery of benefitResponsible to Board or clientSteering group memberSupporting role to project or programme
1.2.1 EnvironmentContext in which project is undertakenClient, company, contractor, supplier, consultant, end user, public, utilitiesPESTLE (Political, Economic, Sociological, Technical, Legal, Environmental)Takes account of internal and external forces
1.2.2 Operations managementApplies to product-based and service industriesFor routine activitiesInputs are resources, e.g. capital, people, materials and equipmentOutputs are products, services, solutions, information and distributionMust work with P3 projects

580 Appendix 7
1.2.3 Strategic managementChoice of strategyExternal influences and demandsMission statementsOpportunitiesStakeholders’ requirementsStrategic analysisStrategic implementation
2.1.1 CommunicationAssumptionsBarriers to communication:Bad translationCulturalDislike of senderEquipment failureGroup thinkHidden agendaJargonLanguage and pronunciationMisunderstandingsPerception, attitude, lack of trustPersonality clashPoor document distribution, lost filesPoor knowledge retentionPoor working environmentUnclear objectivesUnnecessary long messagesWithholding information
2.1.2 Conflict managementAdjudicationArbitrationCompromiseConciliationConfrontingForcingMediationMitigationSmoothing

Syllabus Summary Bullet Points 581
Thomas and KilmanWithdrawing
2.1.3 DelegationClear lines of authorityClear specification of instructionCommunication skillsEnsure person delegated is trainedKnowledge of person delegatedLanguage problemMonitor action takenMotivationPlan what can be delegatedWork done by others
2.1.4 InfluencingCultural and contextual awarenessCommunication skillsCompliance with commitmentsInfluencing techniquesNegotiation skillsSensory awarenessTrust and understandingUnderstand own attitude
2.1.5 LeadershipAbility to adapt to changeAbility to influence rather than directAbility to listenCommunication skillsDecision makingDoes not panicFairnessInitiativeIntegrityKeeps a cool headMotivationNegotiation skillsSituational leadershipWider perspective

582 Appendix 7
2.1.6 NegotiationAgreementBargainingBuild up relationshipConcessionsDocumentation of settlementExchange informationPlanning and case preparationSet minimum acceptances
2.1.7 TeamworkAdvantages of project team:Away days, discussions training eventsBelbin team rolesCommon objectivesComplementary skillsFocusHerzberg’s motivation theoryIncreased productivityInformal communicationsMaslow’s hierarch of needsMotivation for projectStrong identity with projectTeam spiritTuckman team phasesWill to succeedWork satisfaction
2.2 ProfessionalismAccountabilityBreadth and depth of knowledgeCertificationCode of ethicsCode of practiceCommitmentCPDProfessional institutionsPublic interestResponsibilitySpecialized knowledge

Syllabus Summary Bullet Points 583
2.2.1 Communities of practice (CoP)Best practiceCollective competenceCommon interest in project managementDissemination of knowledgeMotivationMutual supportNew knowledge generatedRepertoire of resourcesShared experience
2.2.2 CompetenceCombined skill, knowledge and experienceCompetence frameworksCompetency assessmentsDefined expectationsDefines rolesDefines statements of workPractical experienceTechnical expertiseTheoretical understanding
2.2.3 Ethics frameworkAwareness of cultural differencesKnowledge of legal boundariesMoral leadershipPersonal code of conductProfessionalismTransparency of actionsUK Bribery Act
2.2.4 Learning and developmentAbility levelsAPMP qualificationContinual improvementCPD CertificatesLearning and development programmeLearning objectivesMentoringPerformance management

584 Appendix 7
Performance reviewsPRINCE two qualificationSupport for development
3.1.1 Business caseCould include investment appraisalDefines ‘Why’ and ‘What’Includes major risksMight include success/failure criteriaOutline cost, time and performance/quality criteriaOutline objectivesOwned by sponsor or clientRequirements (SOR)Should have assessed other optionsShould have identified and considered all stakeholdersSubmitted to Board for approval
3.1.2 ControlACWP, BCWP, BCWSAchievement pointsBar chartBaselineCost performance index (CPI)Cybernetic controlDecision pointsEarned value management (EVM)Earned scheduleFeedback requirementGantt chartMilestone slip chartPayment pointProgrammeResource smoothingSchedule performance index (SPI)Time varianceTime sheetsTracking
3.1.3 Information managementBig dataConfidentiality

Syllabus Summary Bullet Points 585
Collation and distributionCollection and captureDisseminationProcurement and maintenance of equipmentStoring and archiving
3.1.4 OrganizationFunctional organizationGeneric organization structureMatrix organizationPRINCE two
Portfolio organization structureProgramme organization structureProject officeProject organization structureSteering groupTask force
3.1.5 PlanningBible of project owned by project managerCovers the Why, What, When, Where, How, Who and How much (Kipling poem)Concept, Definition, Development, Delivery, ClosureContents set out in BS 6079MilestonesProject management planSets out baseline of projectUpdated regularly with good configuration management

586 Appendix 7
3.1.6 Stakeholder managementFinancial muscleInfluence of stakeholders to be assessedMalleabilityNegative stakeholders, pressure groups, environmental groups, planning authoritiesPersonal involvementPolitical bias or affinityPositive stakeholders, project team, client, contractors, sponsorPower to affect project AoAStakeholder prioritizationVested interest
3.2 Scope management (WBS)Can be product based or work basedDivides project into manageable packagesDoes not show interdependenciesFoundation for planning, CP network and bar chartGives better definition of workGood basis for risk identification processHelps to create responsibility matrixLeads to PBS, CBS, OBS and RBSShows hierarchy of work packagesTask-orientated family treeTop down and bottom up estimating
3.2.1 Benefits managementBenefits management planBenefits modellingCapture baseline measurementsCovers projects, programmes and portfoliosImplementation of changeMeasurable impactMonitoring performanceOpportunities capturePerformance indicatorsRealization of business benefitsTangible benefits quantifiable
3.2.2 Change controlAuthorization document giving change effect on cost, time and performanceChange control process

Syllabus Summary Bullet Points 587
Change control registerChange request formCustomer responsibility: impact assessment, evaluation agreementDepartments must assess time and cost effect on themDifference between external and internal change, effect on budgetFeedback to customer who has the right to cancel after assessment
3.2.3 Configuration management (CM)Configuration auditControl of configuration itemsCM planningCovers documents, drawings and componentsItem identificationStatusVerification
3.2.4 Change managementAssess, prepare, plan, implement, sustainCarnall change management modelGeneric change managementKotter change management modelLewin change management model
3.2.5 Requirements managementAnalyse requirementsCollect requirements from stakeholdersEnsure no contradictionsEnsure no misinterpretationJustify requirementsPrioritizeSet up baseline requirementsSpecify requirementUpdateVerify by inspection, tests, demonstration
3.2.6 Solutions developmentAlternative functionalityBaseline requirementsEvaluation and selectionImplementation (possibly phased)Modelling and simulation

588 Appendix 7
Progressive testingReduce capital costValidation against requirementValue improvementVerification of solution
3.3.1 Resource schedulingAggregationAvailability limitsBar chartHistogramNetwork analysisPerformance curvesResource levellingResource schedulingResource smoothingReusable resources
3.3.2 Time schedulingAoA or AoN (precedence) networksCritical path (CP) has zero floatEstimate durationsGantt chartLester diagramMaximize parallel activitiesPERTResource histogramResource smoothing, peak reductionS curve3-point estimating for durations
3.4 Financial and cost managementCommit fundsCost/benefit analysisControl expendituresEstimating costsEvaluate outcomeFinancial governanceJustify costsReviewsSecure funding
Syllabus Summary Bullet Points 589
3.4.1 Budgeting and cost controlAccrualsAnalytical estimatingBill of quantitiesBottom-up estimatingBudget preparationCash-flow forecastComparative estimatingContingenciesCosting and monitoring methodsCBS (cost breakdown structure)CommitmentsEstimatingParametric estimatingSchedule of ratesSubjective estimatingTop-down estimating
3.4.2 FundingBuild, own, operate & transfer (BOOT)Budget holderCapital expenditure (CAPEX)Combined fundingCredit guaranteesGrantsInternal & external fundingLoansOperational expenditure (OPEX)OverdraftsPrivate finance initiative (PIF)Public private partnership (PPP)Share issueValuationsVenture capital (VC)
3.4.3 Investment appraisalAverage return per annumAdvantages of DCF, NPV:Compares competing projectsTime value of money

590 Appendix 7
Advantaged of payback:Can be discountedSimpleIntangible benefits:Impact on businessMarketingPrestigeSocial benefitsIRR, graphical solutionReturn of investment percentRisks to be consideredStakeholder views to be considered
3.5 Risk managementAssessment, priorities, probability, SWOT, decision trees, Ishikawa diagram Delphi, WBSIdentification techniques, brainstorming, check list, prompt list, interviewsRisk management plan, diagrams, P-I matrix, risk log, techniquesRisk management process, software tools, Monte Carlo, predict, 3-point estimatingQualitative analysisQuantitative analysisRisk ownerRisk registerTypes of risk, political, economic, technical, security, environmental
3.5.1 Risk contextClient requirementCompany risk policyPESTLEPositive and negative riskRisk averseness, risk seeking, risk neutral, risk appetiteRisk management plan
3.5.2 Risk techniquesAssumption analysisBrainstormingCheck listsDelphi techniquesDocument reviewsInterviewsPrompt listsQuestionnaires
Syllabus Summary Bullet Points 591
SWOT analysisWBS
3.6 Quality managementAcceptance criteriaFitness for purposeISO 900Quality assuranceQuality auditsQuality circlesQuality controlQuality manualQuality planQuality standardsTQM (total quality management)Zero defect
3.6.1 P3 assuranceAssurance processAssurance providersAuditsExternal assurance providersGovernance processesIntegrated assuranceQuality management planRegulatory complianceSponsor ledSupport functions reviewsRisk registerSecurityStakeholder confidence
3.6.2 ReviewsAgenda for review meetingsBusiness case reviewDeliverables reviewFrequency set out in quality management planGate reviewsManagement processes reviewP3 assurancePost project reviewReport to ownersTriggered by events

592 Appendix 7
3.7 Resource managementAcquired through procurementObtained internally or externallyReplenishable resourcesRenewable resourcesResource allocationResource levellingResource schedulingResource smoothingService agreementShared infrastructure
3.7.1 ContractAgreement between two partiesBespoke contractClose-outConsiderationCompetitive contractContracts: NEC, ICE, IMech.E, IChem.E, JCTCost plus contractDisputes procedureFinal accountGeneral conditions of contractHand overIncentivesJoint Contract Tribunal (JCT)Legal documentLiquidated penaltiesMaintenance periodOffer and acceptanceSpecial conditions of contractStandard contractSubcontractsTarget contractTime, cost and performance requirements
3.7.2 MobilizationAccommodation for labourDemobilization strategyFacilities on site

Syllabus Summary Bullet Points 593
Internal or external resourcesPlant and machinery requirementsPremises and sitesRecruitmentResource availabilitySoftware availabilityTelecommunicationsTemporary facilities
3.7.3 ProcurementBased on value for moneyBid meetings and attendees by contractorCash flow and payment termsConstruction included or notContractor selection criteriaDiscounts requiredExpediting and inspection requirements IGuarantees and liabilitiesIncentivesIncludes all feasible optionsLetter of intentLiquidated penaltiesLong lead itemsMin. and max. number of biddersOperating and maintenance manualPackaging and storage requirementsPartnering or notProcurement areas, UK, EU, USA, Country of user, etc.Shipping restrictions, INCO termsSingle source of supply or competitionSpares listTender opening policyTypes of contract
3.7.4 Provider selection and managementContractual terms and conditionsIdentifying providersInterviewsManaging providersMonitoring progress

594 Appendix 7
Part of procurement functionPre-qualification processQuestionnairesSelecting and appointing providersSelection processTendering policyVetting providers
4.1 AccountingBalance sheetBusiness management requirementsCollecting financial informationCommunicating financial informationCorporate accountingFinancial accountingLegal requirementsProfit and loss statementProject accountingStakeholder needs
4.2 Health and safetyCDM (Construction, Design and Management) RegulationsCommon law duties (negligence)Consumer Protection Act 1987Dangerous substancesH&S standardsInformation and trainingManagement of Health and Safety Regulations (1992)Laws: HSWA 1974 (Health and Safety at Work Act)Protective clothingReportingSafe environmentSafe plant and equipment, safe workplace and access
4.3 Human resource management (HRM)Database of staffDevelopment of peopleDispute resolutionEmployee relationsHRM policyLegal requirementsManaging people

Syllabus Summary Bullet Points 595
Pay reviewsPeople related activitiesPersonal developmentPromotionRecruitmentRedundancy
4.4 LawAwareness of lawsEuropean Convention of Human Rights (ECHR)Civil lawCompensationCriminal lawIntellectual property lawJurisdictionLegal dutiesLegal systemPrecedentsProcessesRightsStatutory instrumentsWorking time directives
4.5 SecurityAsset protectionConfidential data protectionGuardsMinimize disruptionPersonnel securityResource requirementsRisk mitigationSecurity assessmentSecurity policySite security
4.6 SustainabilityBiological systemsEco systemEnvironmental impact assessmentMinimum contaminationZero pollution aim

This page intentionally left blank

597
APPENDIX 8
Sample Examination Questions 2: Bullet Point Answers 1. Project-management plan (PMP)
Reflects the PM’s understanding of the projectShould be written by the PMThis enables him/her to fully understand the sponsor’s requirementsMust be updated regularly with good configuration managementIs in fact the bible of the projectCovers: Why, What, When, How, Where, Who and How much (Kipling poem)Not to be confused with a time schedule (plan)Can be known by other names by different companiesContents well set out in BS 6079Contents to includeReasons for planning, baseline programme, responsibility matrix, document distribution schedule, procedures for monitoring and control, resource allocation, network prepara-tion, estimating, risk management, health and safety, change control, configuration management, etc.
2. Work breakdown structure (WBS)Next stage after conception from project life cycleDivides the project into manageable packagesCan be product-based or work-basedShows hierarchy of work packagesLeads to assignment of work packages and resourcesTask-oriented family treeLeads to PBS, CBS, OBS and RBSHelps in creating a responsibility matrixFoundation for planning and CP networkWBS called PBS in PRINCE methodologyGives better definition of workActs as check list to find missing stages and areas of workGood basis for risk identification processDoes not show interdependenciesTeam members have good picture of main stagesTop down and bottom up estimating leads to network, bar chart, histogram S curve

598 Appendix 8
3. Risk identification techniquesAssumption analysis
Specific, quickSubjective, related to assumptions, restricted
BrainstormingCost-effective, wide ranging, involves participants, assists communication and understandingThrows up wild ideas, requires good facilitation, risks may be exaggerated, group must be restricted, participants must be chosen
Check lists or prompt listsPast experience tapped, good coverage, focused on right areas, rapid responseRestricted to items on list, lacks originality, could miss new problems
Delphi techniqueCan be conducted by phone, post, e-mail or fax, taps expert opinion, possibility of agreementRequires the relevant experts, takes time, requires good coordination
Document reviewsSimple to do, authoritative, very useful if document is a close-out reportCould take a long time, identification of risks may be difficult
InterviewsConfidential, specific, enables risks to be analysed, allows discussionRequires good interviewing technique, time-consuming, requires subsequent comparison of results
QuestionnairesStructured questions and answers, encourages originality, can be answered at any time, allows for additional ideas if requestedRepetitions have to be compared, responses could be fatuous, could take time
SWOT (Strengths, Weaknesses, Opportunities, Threats) analysisHighly focused, lists opportunities as well as threats, structuredNeeds good control, parts not necessarily risk
WBS (Work Breakdown Structure)Each stage or task can be investigated for risk content
4. Risk management procedureTypes of risk, political, economic, technical, security, environmentalRisk management plan, diagrams, P-I 3 × 3 matrix, risk log, techniquesRisk management process, software tools, Monte Carlo, @Risk, Predict, 3-point estimatingIdentification, techniques, brain storming, check list, prompt list, interviews, WBS, DelphiAssessment, priorities, impact, probability, SWOT, decision trees, Ishikawa diagrams
Sample Examination Questions 2: Bullet Point Answers 599
Qualitative analysis, quantitative analysis, risk owner, risk registerRisk management should be initiated at start of projectAll projects have riskRisk identificationRisk history or diaryRisk ownerRisk log or registerQualitative analysisQuantitative analysis, Monte Carlo, @Risk, Predict3-point estimatingImpact/probability matrixH, M & L assessmentManaging risk
5. Travel risksMotorway congestionBad weather (ice, snow, storm)Car breakdownRoadworksTyre punctureFeeling ill or sickNo parking space at destination
For risk register (log) see 53 6. Change management
Customer responsibility: impact assessment, evaluation, agreementSponsor responsibility: authorization, review, benefit assessmentProject manager responsibility: control procedure, monitoring, evaluation, implementationDifference between external and internal change, effect on budgetChange control process, stakeholder inputAll departments must assess time and cost effect of change on them
Key documentsChange request formChange record: This records the effects of the change on the projectChange control registerChange authorization: This gives the effect of the change on cost, time and performanceFeedback to customer (who has right to cancel) after examining the consequencesChange register
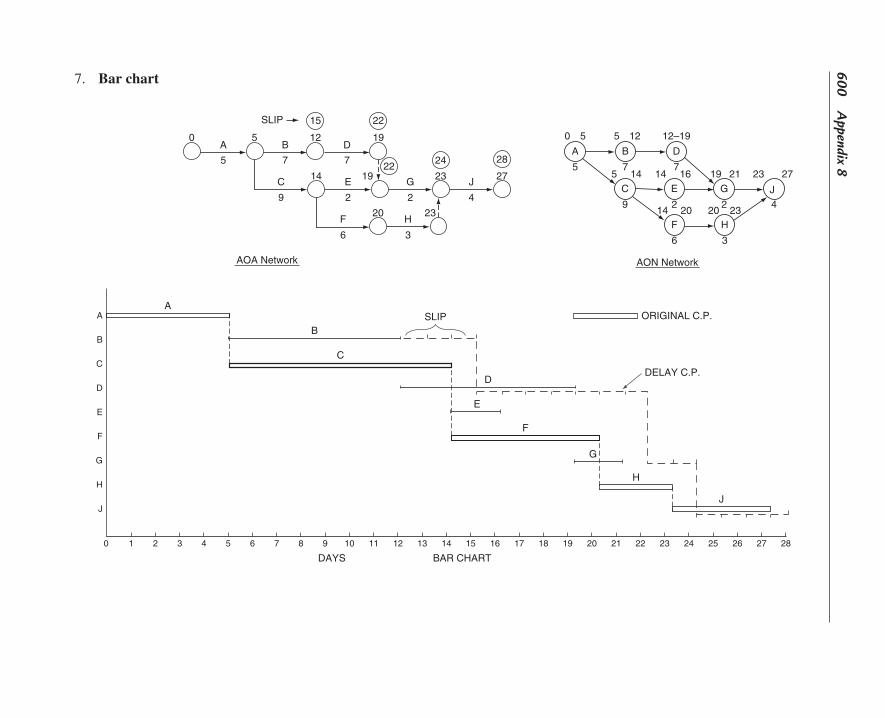
600 A
ppendix 8
AA
BSLIP
AOA Network
SLIP
A B
CC
DD
E GG JE
F H F H
J23 232127 27
4
0 5
55
5
12
15 22
14 14 14
14
1922
24 28
19
2 2
20 23 20202 2 4
16
23
3 36 6
19A B
0 5 5 12 12–19
99
77 7
7
AON Network
DELAY C.P.
ORIGINAL C.P.
C
D
E
F
G
H
J
B
C
D
E
F
G
H
J
0 1 2 3 4 5 6 7 8 9
DAYS BAR CHART
10 11 12 13 14 15 16 17 18 19 20 21 22 23 24 25 26 27 28
7. Bar chart
Sample Examination Questions 2: Bullet Point Answers 601
8. Project and programme managementProject is unique process to achieve a set objectiveHas a defined start and finishConstraints are time, cost and resourcesProject managers changeOrganization can be task force, matrix or functionalDefinition of a programmeA collection of related projectsAdvantages and role of programme managerCoordinate resourcesAssign prioritiesOversee project managersReduce riskPrepare overall milestone planResolve conflicts between project managers
9. Stakeholder managementPositive stakeholders: project team, client, contractorsNegative stakeholders: pressure groups, environmental groups, planning authoritiesInfluence of stakeholders to be assessed, e.g.Power to affect projectFinancial muscleMalleabilityPersonal involvementVested interestPolitical bias or affinityStakeholder prioritization
10. Configuration management (CM)Covers documents, drawings and componentsCM planningItem identificationControl of configuration itemsStatusVerification audit
11. Risk management planIntroduction: Why risk management, company policyPurpose of process: Client requirement, environmental, health and safety, project viabilityScope of process, Political, Economic, Sociological, Technical, Environmental, LegalDescription of projectSpecific aspects to be covered: innovations, erection, finance, sabotage, securityType of organization: functional matrix, task force

602 Appendix 8
Roles and responsibilities: managers, risk ownersTools and techniques required: Monte Carlo, @Risk, Predict, etc.Deliverables: risk register, matrix, action plans, contingency plans, etc.Mitigation
12. Risk mitigationTransferenceInsuranceReductionEliminationDeferenceAcceptance
13. Quality tools
Quality Objectives Specifications
Quality systems Company systems, ISO 9000Quality plan Analysis, inspection, recording, degree of testing
Quality assurance Procedures, processesQuality control CheckingQuality manual Contains all the above
Checking and testing Verification, sampling, validation, certificatesQuality audit Check that procedures are being adhered to
Quality reviewsPareto analysis 80/20 rule
Cause and effect analysis, Ishikawa or fishbone diagram, decision trees
Brainstorming (could lead to risk assessment)Check lists
Process flow sheetsConcentration diagrams
Activity samplingRanking and rating
Bathtub curvesPoka Yoka
Qualification certificates, e.g. welders qualification tests
14. Quality managementQuality planningQuality assuranceQuality controlQuality standardsFitness for purposeMeets acceptance criteria

Sample Examination Questions 2: Bullet Point Answers 603
Total quality management (TQM)Right first time and zero defectQuality circlesISO 9000Quality audits
15. MilestonesImportant stagesPayment points (expenditures or receipts)Achievement pointsHigh-level programmeMilestone slip charts show record and predictionsMilestone scheduleMarked on Gantt chartsTarget on networksOften written into a contractApproval for change and date
For milestone slip chart see Chapter 25 16. Earned value management (EVA)
Reasons for EVA:Shows difference between work planned, work booked (on time sheets) and work performedAbbreviations: BCWS, ACWP and BCWP. Note: BCWS is planned (not budget)These abbreviations are now being phased outEV = BCWP = budget × percent completeControl curves: budget, planned, actual, earned value, percent complete, efficiency (CPI)Interpretation and solution if CPI and SPI are negativeCalculations: CPI = BCWP/ACWP, SPI (cost) = BCWP/BCWSCost and time variances: cost variance = BCWP − ACWPTime variance = BCWP − BCWS; Final cost = Original budget/CPIFinal time = Planned time/SPI (time) or SPI (cost)Should be geared to CP network, which can be updated from EVA feedbackIf returns of percent complete are on time sheets, regular feedback is guaranteedComputer programs have been developed to do the calculationsAdvantages:Shows trends, shows estimating errors, predicts final cost and completion time using curves and approx. calculationsPercent complete of multi-discipline, multi-contractor project possibleTrend can be seen early on in project and corrective action can be takenShows cost and time position on one reportShows percent complete and efficiency on one graphical report

604 Appendix 8
Weakness:Difficulty in assessing percent completeWrong budget estimatesPoor feedback systemTime sheets essential
17. Project life cycleNo. of phasesStandard life cyclesBS 6079: Conception, feasibility, implementation, operation, terminationCommon phases:Initiation, conception, feasibility, definition, design, development, production, manufacture, installation, implementation, commissioning, operation, disposalExtended life cycle includes disposal. Different industries have different life cyclesAdvantages:Ensure no unnecessary expenditureReview possible after each phase. Go or no-go gatesTrigger for further fundingEach phase a control stage with checkpointsBasis for WBSPhases can be split again into stagesPhases called stages in PRINCE used in ITDifferent phases can have different project managersGives top management an overall picture of projectGives a rough progress position (crude bar chart)Phases can be costed for control purposesCan show up resource and continuity problemsShows milestonesDeveloped by sponsor and project manager
18. Stage documents
Conception Business case, DCFFeasibility WBS, OBS, CBS, risk register
Implementation PMP, CP network, resource chart, milestone chart, EVA
Operation Operating manualsTermination Handover certificate, maintenance manuals, spares list
19. Organizations The three project organizations are a. Functional b. Project (task force) c. Matrix [combination of (a) and (b)]

Sample Examination Questions 2: Bullet Point Answers 605
Functional organizationEach department responsible for its own workSuitable for business as usualIdeal for routine operations and mass productionProject manager usually appointed from one department for small change projects
Project organization (Task force)Used on large projectsTeam created especially for the projectTeam located in one office or building for good interactionGood communicationProject manager has full responsibility for cost, time and performanceTeam includes design, procurement and construction specialists
Matrix organizationMost common type of organizationPersonnel allocated to project by departmentsPM responsible for time cost and qualityDepartment manager responsible for the work by his/her department
See also 56 and 57 20. Communication management
Ensures good communication systemsClear instructions and messagesAll external communications via project managerImportance of documents to be in writingCommunication by walk-aboutCommunications can be formal or informal
Barriers to communicationCulturalGeographical locationLanguage, pronunciationBad translationTechnical jargonPerception, attitude, lack of trustPoor leadership, unclear objectivesMisunderstandingPersonality clashDislike of sender, selective listeningGroup thinkBad equipment or equipment failure

606 Appendix 8
Poor working environment, noisy officePoor document distribution system, lost filesUnnecessarily long messagesWithholding informationAssumptionsHidden agendaPoor knowledge retentionPoor distribution and selective listening
Overcoming barriers to communicationSimple messagesFollow-up by testingConfirm in writingImprove office facilitiesBring team togetherImprove motivationMaintain equipmentCan all be overcome by good planning, good equipment maintenance and ensur-ing the instructions are clear and unambiguous?It is helpful to give the reason for an instruction as this will help to ensure the cooperation.Initial lectures on the etiquette and customs of the different cultures reduce misunderstandings. Translations should always be made by a native speaker of the language into which the document is translated.
21. Team building and teamworkAdvantages of project teamComplementary skillsIncreased productivityProject manager supportInformal communicationsStrong identity with projectCommon objectivesMotivation for projectWill to succeedFocusGood team spiritOther methods used to build teamsOrganized events, training, away days, discussionsThe main characteristics of a successful team areMutual trustFirm but fair leadership

Sample Examination Questions 2: Bullet Point Answers 607
Mutual support and loyaltyOpen communicationsCooperation and full participationPride in the project and a sense of belongingGood mix of technical skills and talentClear understanding of goals and objectivesEnthusiasm and confidence in successGood support from top managementApart from technical skills, different personality traits can be utilized to build up a balanced team and ensure that ‘round pegs’ are not driven into square holes.For example, while some people like checking details, others prefer to be concerned with the wider picture.By assembling the team with the different Belbin types, a balanced and competent workforce can be created.
Barriers to team buildingHigh staff turnoverPoor leadershipGeographical separationInternal conflict and unresolved conflictLow moraleLack of motivationIll-defined objectivesPoor environmentLack of trustToo many changesPoorly defined roles and responsibilitiesPoor communications
22. Conflict managementWithdrawingSmoothingConfrontingForcingCompromisingThomas & KilmanMediationConciliationAdjudicationArbitrationMitigationLitigation

608 Appendix 8
23. Belbin team rolesBalanced team, individuals in the correct slot. The roles arePlantShaperResource investigatorCoordinatorMonitor evaluatorImplementerTeam workerCompleter finisherSpecialistNot always possible to find the correct typeProject manager must use resources available
24. MotivationHerzberg motivational theory
Recognition of achievementAdvancement and growth prospectsPleasant working conditionsIncreased responsibilityJob freedomInteresting workPerks
Maslow hierarchy of needsPhysiological needsSecuritySafetySocialEsteemSelf-actualization
25. Business caseDefines ‘Why’ and ‘What’ the requirements areOutlines objectivesOutlines cost, time and performance/quality criteriaMight include success/failure criteriaShould include major risksCan have other names such as brief, scheme, statement of work (SOW) statement of requirements (SOR)Owned by sponsor or clientCould include investment appraisal and possibly DCF/NPV, etc.Should have assessed other optionsShould have identified and considered all other stakeholdersSubmitted to board for approval

Sample Examination Questions 2: Bullet Point Answers 609
26. Leadership and leadership qualitiesAbility to influence rather than directNegotiation skillMotivationInitiativeCommunication skillsAbility to listenFairnessFirmness
27. NegotiationPlanning and case preparationSet minimum acceptancesBuild up relationshipExchange informationBargainingConcessionsAgreementDocumentation of settlement
28. Cash flowCosting and monitoring methodsCash flow forecast (outflow and inflow)Cash flow curves (see Chapter 31 for diagram)Cost breakdown structureEVA for monitoring costsBudget preparationCommitmentsAccruals
See 36 ‘estimating’ 29. Handover and close-out
Acceptance by clientAcceptance certificateTransfer of responsibility to sponsor or operatorTransfer of ownership to clientDeliverables completed and handed overAcceptance certificate receivedOperating instruction handed overSpares lists handed overTransfer responsibility to user/clientMaterial disposal arranged. This coversSell surplus material to client if possibleReturn surplus to contractor’s storesReturn redundant office equipment and materials
610 Appendix 8
Sell unusable materials as scrapClear site, remove huts and temporary fencesMake good roads and other areas (stockyards)Complete all contract documentationComplete all audit trails and file documents
30. Procurement strategyBased on value for moneyIncludes all feasible optionsSingle source supply or competitionPartnering or notIs construction included?Is delivery to site included?Standard or special contract conditionsTypes of pricing, firm, fixed, target, cost plus, reimbursable, schedule of ratesContractor selection criteriaContractor bid meetings and attendees by contractorsMinimum and maximum number of biddersTender opening policyLetter of intent possibilitiesLimitations of procurement areas – UK, EC, Western countries, country of final userLong lead itemsSignatures for different levels of contractsTypes of contractlump sumremeasuredreimbursabletarget, designbuild and operate
31. Contractor selectionExpediting and inspection requirementsProcurement and delivery scheduleLiquidated damagesIncentivesDiscounts requiredCash flow and payment termsShipping restrictions INCO termsGuarantees and liabilitiesPackaging and storage requirementsSpares lists

Sample Examination Questions 2: Bullet Point Answers 611
Operating and maintenance manualsAfter-sales service
32. Tuckman team phases Team development may change to reflect phase changes Tuckman found teams undergo stages
Forming Start of projectStorming Jockeying for position; potential staff conflictNorming Smooth running
Performing Fully integrated working and high moraleMourning End of project, breakup of team
Project manager must take care staff does not leave too soon as project nears the end. 33. Project context environment
Context within which project is undertakenTakes account of internal and external forcesClient, company, contractors, suppliers, consultants, public, end users, etc.PESTLE (Political, Economic, Sociological, Technical, Legal, Environmental)
34. Why do projects fail?Poor planning and cost controlIncompetent project managementSponsor support lackingClient makes too many changesChanges too large or extensiveLate safety requirementsCosts underestimatedLack of change controlLax configuration managementEnvironmental changesUnforeseen climatic conditionsIntegration problemsTechnical and teething problemsInadequate resources of staff and equipmentPoor working conditionsUncooperative line managementSabotage and political upheavalCost, time and performance requirements not metInadequate support from top managementInadequate specificationLoose agreement with clientLoose contractual conditionsIll-trained staff or operatives
612 Appendix 8
Fundamental design faultsLate deliveries of information and equipmentInsufficient inspection and expeditingPoor cash flowInsolvency of subcontractorUnclear original brief causing misunderstandingCommissioning problems stakeholder management
35. See answer to question 8. 36. Estimating
Sets out what information and data are required from:Clients, end-users, other stakeholdersHow information is captured, collated, assessedHow data are analysed and testedChanges must be logged, reviewed and tested
37. Investment appraisalDFC, NPV
Advantages: time value of money, compares competing projectsDisadvantages: complex, wrong estimates, relies on accurate discount rate
PaybackAdvantages: simple, can be discountedDisadvantages: time value ignored, cash flow after payback period ignoredIRR, graphical solution, average return per annum, return on investment percentIntangible benefits: marketing, impact on business, prestige, social benefits, environmental benefitsConsider other options, risks, accounting practices, stakeholder views
38. See answer to question 36. 39. Resource management
Resource allocationResource histogramResource schedulingResource levelling due to constraints, i.e. lack of labour, materials, plant, etc.Resource smoothing uses up float to reduce labour usageReplenishable resources and renewable resources
40. Organizational rolesSteering group or steering committeeFunction of project office (if established)Role of client and end user: Specifies and operates finished plantRole of sponsor: Owns business case, monitors performance, ensures resources, ensures benefits are realized, agrees variations

Sample Examination Questions 2: Bullet Point Answers 613
Role of project manager: Controls cost, time and performance of project, responsible for quality and safety, reports to sponsor and stakeholdersProject manager’s charterStakeholdersContractors and suppliers responsibilities; supply specified equipment, materials and plant and manpower to meet set programme and performance requirements.
41. Handover documentsHandover certificateEquipment listOperating manualsMaintenance manualsSpares listGuaranteesLubrication schedule
42. Health and safetyH and S StandardsLaws: HSWA 1974 (Health and Safety at Work Act)Management of Health and SafetyRegulations 1992 coversSafe plant and equipmentDangerous substancesSafe workplace and accessProtective clothingSafe environmentInformation and trainingReportingCDM (Construction, Design and Management) RegulationsConsumer Protection Act 1987Common law duties (negligence) apply
Accident causesLack of safety trainingBadly maintained equipmentInadequate protective clothing and headgearUnsecured ladders and scaffoldingPoor unsafe designUnprotected pits and trenchesUnsafe construction of trench supportsIgnorance of safety proceduresInadequate protection when using toxic substancesInadequate safety warning signs

614 Appendix 8
43. WBS of bicycleAssembly drawingFrameHandlebarsWheels and tyresPedalsGears and chainSaddle and carrierMudguardsLights and bell
44. See answer to question 37.For graphical solution see Chapter 6, Fig. 6.2
45. Project officeCollection and collation of reports and time sheets, etc.Administrative support to project managerDissemination of instructionsOperation of configuration management systemAdministration of change controlLibrary for standards and proceduresRecords progress informationProduces curves and tabular information for use by project managerWrites up and distributes minutes of meetings
46. Post-project review and evaluationReviews should be held throughout the projectClose-out meeting with project teamEvaluation against success criteriaPrepare post-project appraisal and write close-out reportInclude abstracts from project diary and site diary where necessaryHighlight problems encountered, cost and time overruns, special delaysReport on project team performanceRecommendations for future projects, learning from experienceEvaluate project-management processEvaluate techniques employed
47. See answer to question 22. 48. Project manager
Characteristics:Knowledge of planning toolsAbility to control costsAbility to get on with peopleDoes not panic when things go wrongIs fair but firm

Sample Examination Questions 2: Bullet Point Answers 615
Ability to negotiateAppreciation of importance of safetyAbility to write clear, concise reportsGood communicator and listenerCan motivate the team he/she leadsIs aware of corporate priorities and policiesLeads by example
49. AoA and AoN networks (CPA)AoA network proAs activities and durations are on the link lines (arrows), they can be more fully describedCan be drawn rapidly by hand without instrumentsProgress can be updated by ‘redding’ up the lines in proportion of percent completeAs activities take time, they are more logically represented by an arrowStreams of activities can be interlinked with dummy activities which can cross other activitiesCan be drawn on a grid with links being able to cross activitiesAoN (precedence) networks proActivities and durations are shown in or above the nodesThere is no requirement for dummy activitiesActivities are defined by one number instead of two as in AoACan be drawn on a grid, but links cannot cross activity nodesLester diagram is a combination of both, gives best of both worlds
50. See answer to question 37. 51. Portfolio management
If projects are not directly related, it is portfolio managementPrioritize projects against needs of organizationAllocate resources and eliminate bottlenecksAssess risks of projects in portfolioDecide on timing of project startsMonitor performance of all projectsEnsure good cash flow and profitabilityCarry out cost–benefit analysis of projectsPortfolio management is a subset of corporate managementIt is concerned with the organization, planning and control of a number of projects which are not necessarily connected with each other.Its function is to ensure that the projects in the portfolio are aligned with the organization’s strategy and meet the cost, programme, quality and performance criteria.
52. Project success criteriaThe success of a project can be measured by the following criteriaCompletion on time

616 Appendix 8
Performance in accordance with the specified requirementsMeeting the quality standardsCompletion within cost budgetCompliance with Health & Safety regulations
53. Change registerEssential headings on change registerProject titleDate of request to changeName of instigatorDescription of changeReason for changeTime and cost estimates from each departmentPM’s summary of effectsApproval of change and date
54. Information managementInformation management is concerned with the following functionsAcquisition of informationData collectionPreparation of dataDissemination to interested parties (stakeholders)Storage, retrieval and archivingCollection and capturing of informationCollation and distributionProcurement and maintenance of equipmentConfidentialityModern IT systems permit huge amount of data to be collected.This requires processing for both quantity and quality.Timing is also essential, as late dissemination can seriously affect decisions.All this has to be done efficiently by using an information system which is enshrined in an information policy plan.
55. Value managementIn a constantly changing environment, systems, procedures and products must be regu-larly examined and updated to meet the needs of the stakeholders’ value management and its subset value engineering is concerned with the strategic question of what should be done to improve performance without affecting the quality. Its aim is to improve the functionality of a product or system while reducing the overall cost.Techniques include:Functional analysisInvestigate alternative solutions to meet function requirementsVerbs and nouns technique

Sample Examination Questions 2: Bullet Point Answers 617
EvaluationAcceptance, implementation and audit
56. Project management versus functional line management PM advantages:
Greater efficiency and effectiveness in employing tools and techniques used in project managementOne person, the project manager, is responsibleSponsor knows at start what the deliverables will beSponsor can see the PMP and be assured the correct procedures are being usedDedicated manager in charge of cost, expenditure and programme, strong commitmentMore line organizations are moving towards project management for changeMonitoring and control through life of projectSingle line of communication with all parties, especially external partiesSingle line of reportingProject manager is trained to handle the stresses of changeLearning from experience through post-project reviewsProject-management good training for top management due to wider visionLine managers may be distracted by having to deal with line management functionsSpirit of dedicated project team not present in functional organization, high motivationNo competition for resources from other departments
Disadvantages:Less job security than in functional organizationAt times could be inefficient due to delays in informationCould develop parochialism and arroganceProject objectives could eclipse company objectivesNot as strong specialist skills as functional departmentNot as efficient in resources as functional departmentReporting line not as clear as in functional departmentThe difference between project management and line management is that the project has a defined start and end date with a set cost budget and performance criteria.Line management on the other hand deals with the day-to-day business-as-usual operations of the company.For this reason the matrix type of project management is arguably the preferred project organization, as the normal business is not disrupted while the changes such as new systems or structures, which require project management, can be accommodated.
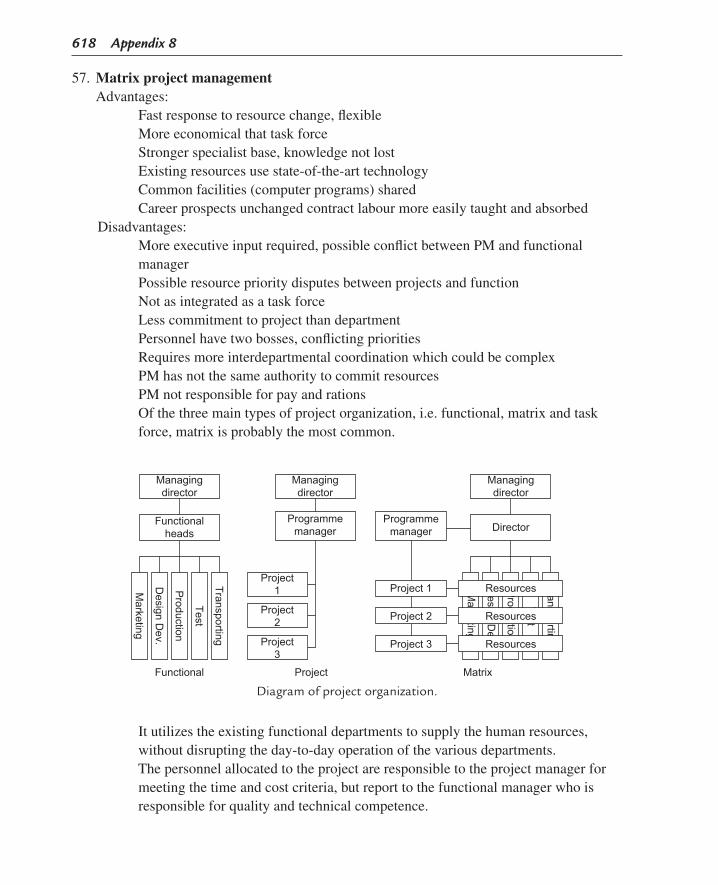
618 Appendix 8
57. Matrix project management Advantages:
Fast response to resource change, flexibleMore economical that task forceStronger specialist base, knowledge not lostExisting resources use state-of-the-art technologyCommon facilities (computer programs) sharedCareer prospects unchanged contract labour more easily taught and absorbed
Disadvantages:More executive input required, possible conflict between PM and functional managerPossible resource priority disputes between projects and functionNot as integrated as a task forceLess commitment to project than departmentPersonnel have two bosses, conflicting prioritiesRequires more interdepartmental coordination which could be complexPM has not the same authority to commit resourcesPM not responsible for pay and rationsOf the three main types of project organization, i.e. functional, matrix and task force, matrix is probably the most common.
Diagram of project organization.
It utilizes the existing functional departments to supply the human resources, without disrupting the day-to-day operation of the various departments.The personnel allocated to the project are responsible to the project manager for meeting the time and cost criteria, but report to the functional manager who is responsible for quality and technical competence.

Sample Examination Questions 2: Bullet Point Answers 619
As the functional manager is in charge for ‘pay and rations’ and recommendation for promotion, there may be a conflict of interest which has to be managed and can be a real challenge for the project manager.
58. Project success and benefit analysisDefine benefits and agree on method to measure benefitsSet success criteriaSet and monitor key performance indicators (KP)Resource histogram, resource smoothing, peak reduction and ‘S’ curvePERT and use of 3-point estimates for durationsMaximizing parallel activities to reduce overall timeOptions to be examined as part of business caseNon-financial benefits may be difficult to quantifySydney opera house was a success, but a failure in terms of cost and time
59. Project governanceProject governance covers:Structure to obtain objectivesMonitoring performanceStandard proceduresQuality AssuranceCorporate Policy and transparencyDelegation of authorityReporting proceduresEthics
60. Information managementTopics included in the information management plan are:Types of documentAuthority and standardsDistributionRetrievalAcquisition/modification permitsAcknowledgements of receiptsSecurity of dataDisaster recoveryConfiguration controlDistribution of documentsAll these have to be done efficiently by using an information system that is embedded in an information policy plan

This page intentionally left blank

621
Index‘Note: Page numbers followed by “f” indicate figures and “t” indicate tables.’
AAbbreviations, 524Abnormal loads, 307Acceptance certificate, 49Acceptance criteria, 92Accidents (types), 345Accuracy of estimates, 63Acknowledging receipt of
information, 357–358Acquisition/modification permits,
357Acronyms, 524Activity, 108, 119–126Activity list, 458, 468tActivity on arrow (AoA), 108, 146,
147f, 164f, 169, 169f, 195Activity on arrow network (AoA),
483fActivity on node (AoN), 119, 146,
190, 191f, 278f, 477Actual cost of work performed
(ACWP), 290Actual hours, 254, 256, 258Adjudication, 396–397Adjudicator Nominating Body
(ANB), 396Advance payments bond, 315–318Alta Bates Summit Medical
Campus (ABSMC). See also Building information Modelling (BIM)
actual drywall framing around, 518f
architects rendering of, 520fdrywall assembly ‘spool sheet’,
519fdrywall framing model around,
518f
dynamic detailing implemen-tation, 517
PCP tower, 519frebar using multiple custom
components, 517seismic design requirements, 517Tekla BIMsight, 517
Analysis & Design (A&D), 515Analytical estimating, 62–65Annual order discount, 332–333APM. See Association for Project
Management (APM)Approvals of changes, 99Approved tender list, reader. See
Tender listArbitration, 397–398Arithmetical analysis, 143–156Arrow diagram, 171f–172fAsking experts, 75–76Association for Project
Management (APM), 8, 383, 385, 385f, 402
@ Risk, 82Authority of project manager, 8–9Availability, 235Average rate of return (ARR), 459t,
461fAvoidance, 80
BBackward pass, 144f, 149–150,
171–174Banding, 140–141Bank bonds (on demand bonds),
314–315Bank guarantee draft, 316fBar charts, 117, 126–128, 167,
170f, 248f
Bargaining, 389Barriers to communication, 364Baseline review, 104Base lines, 126, 492–493Basic principles (networks), 209Battle tank, 479–488Belbin types, 372–374Best-of-breed systems, 527Beta distribution, 159Bid bond, 315Bidder selection, 300–301Bid (enquiry) documents, 300Bid summary, 304fBig Data, 361Bills of quantities, 61, 310BIM. See Building information
Modelling (BIM)Bitumen refinery, 134Boiler network (AoA), 142fBoiler network (AoN), 169f, 278fBonded areas, 317Bonds (performance, advance
payment, retention), 314–319
Bottom up estimates, 55–56, 61Brainstorming, 53, 74–75, 175–176British Association for Project
Management (APM), 290British Standards Institution (BSI),
290BSI, 50. See also British Standards
Institution (BSI)Budget, 254–255Budget at completion (BAC), 288fBudgeted cost of work performed
(BCWP), 290Budgeted cost of work scheduled
(BCWS), 290

622 Index
Buffer, 156, 181–182Building information Modelling
(BIM)applied in practice, 514–515CAD tools, 511CIS/2 format, 526DGN, 525DWF, 525DWG, 525DXF, 525enabling multidimensional
models, 5125D information, 510GUID and UUID, 511IFC format, 526–527IGES, 525information modelling, 509–528information part, 510interoperability, 525–527Leeds Arena in UK, 521–523linking systems through open.
NET interfaces, 515–516National Museum of Qatar,
520–521principle industry transfer
standards, 525–527references, 512savings with, 516SDNF format, 526STEP, 525structural steelwork industry, 511Tekla BIMsight, 5163D modelling technology, 5112D drawing systems, 510UK Government Recommenda-
tions, 513–514Building Research Station, 63buildingSMART organization,
526–527Bulk purchase discount, 332Bungalow, 421–436, 422fBusiness case, 14, 25, 402, 404,
455, 466, 479–488
CCash flow, 30, 33, 243, 262,
442–449Cash flow curve, 238, 261, 432,
435f, 458, 464fCash flow forecasting, 243–252Cash-flow graph, 251f
Cash flow table, 249fCash values, 450t–453tCast-in-place concrete (CIP
concrete), 517Cast machine part, 230–234Cause and effect diagram, 228fCCTA. See Central Computer
and Telecommunications Agency (CCTA)
CDM regulations, 349–350Central Computer and Telecommu-
nications Agency (CCTA), 71
Centrifugal pump manufacture, 225–226
Change control, 70, 358Change issue log, 103Change management, 99–104Change management advice form,
101fChange requests, 103Check list, 303CIMsteel Integration Standards
(CIS), 526CIMsteel Integration Standards
(cis/2), 512Claims, 214–219Clean up of site, 410Client’s changes, 103Client’s operatives, 409Client-type organization, 14Close-out, 409–412, 414, 477Close-out party, 410Close-out report, 413–414Close-out review, 413–414Cold commissioning, 308Colliery surface reconstruction, 134Commercial conditions of contract,
325–327Commercial programs, 174Commissioning, 308Commissioning close out report,
308Communication, 44–45, 363–368Communication barriers, 364Company objectives, 15Comparative estimating, 62Competence, 384–386Completer/finisher, 374Completion (overall), 283–290Computer analysis, 167–178
Computer numerically controlled machines (CNC machines), 511
Computer programs, 113–114, 116–117, 162, 167
Computer role, 158Concessions, 388–390Conciliation, 395Concurrent engineering, 49Configuration audit, 105Configuration change management,
105Configuration control, 358Configuration identification, 105Configuration management, 105Configuration planning, 105Configuration status accounting,
105Conflict management, 393–400Confronting, 394Construction Design and
Management (CDM)regulations, 349–350
Construction network, 245fContext, reader. See Project contextContingency, 81Contract documentation, 306Contracting organization, 15Contracts, 308–323Control curves, 268f, 432f, 449f,
487fControl graphs. See Control curvesControl of configured items, 106Cook, Robert, 517Coordinates, 114–117Coordinator, 373Corporate strategy, 14, 403Cost/benefit analysis, 29, 35–36,
35fCost-bound project, 4Cost breakdown structure (CBS),
55f, 56, 482fCost control, 202, 253–266Cost performance index (CPI), 256,
287Cost reports, 48, 283Cost, schedule, control system
(CSCS), 287Cost variance, 287Cost vs. benefit, 35–36Counter trade, 333–334

Index 623
Court of Appeal ruling, 397CPI. See Cost performance index
(CPI)Critical chain project management,
156Critical path, 143, 155–156,
167–168, 177, 209Critical path analysis. See Critical
path methods (CPM)Critical path methods (CPM), 107CSCS. See Cost, schedule, control
system (CSCS)Cultural differences, 365
DDangle, 110, 110fData collection
qualitative, 360–361quantitative, 361
Decision, 397Delphi technique, 75–76Dependencies, 124, 126fDescription of works, 120–121Design and build, 49tDesign, build and operate contract,
312–313Design Web Format (DWF),
525DGN, 525Direct costs, 315–317Disaster recovery systems, 358Disclosure & reports, 404–405Discounted cashflow (DCF), 32,
458, 459tDiscount factors, 30, 31fDiscount rate, 31f, 33–34, 455Discounts, 331–333Discounts (quantity, early
payment), 310Dispute resolution, 393–400Distribution schedule, 358–359Documentation, 90Document control, 102Document distribution, 358–359Document types, 356.NET, 515Drawing eXchange Format (DXF),
525Drywall framing model, 517Dummy activity, 109, 111Durations, 112
Duty payment, 334DWG, 525
EEarliest finish, 120–121, 146Earliest start, 120–121, 146Earned schedule, 290, 291fEarned value, 256t, 261, 264, 461Earned value analysis (EVA),
253–266, 269, 273f, 477, 493–494
Earned value curves. See Control curves
Earned value management. See Earned value analysis (EVA)
Earned value table, 247f, 486fEC directives, 22t, 344Efficiency, 256–257, 446tEmissions, 22Enterprise-level database, 490Environmental pressure groups, 38Equipment, 137, 193, 214–215,
223, 365–366Erection, 307–308Escalation, 62Estimated cost at completion
(EAC), 288fEstimated project time (EPT), 288fEstimate sheet, 438, 440fEstimating, 61–66Estimating books, 63–64Ethics, 383–384, 405–406EVA. See Earned value analysis
(EVA)EVA % complete assessment,
291–292Evidence, 406–407Expediting, 306–307Extended life cycle, 50–52External economics, 19
FFailure mode and effect analysis,
94–96Feasibility, 49t, 50–51Feedback, 200–205Final forecast hours, 283tFishbone diagram. See Ishikawa
(fish bone) diagram5D information, 510
Float, 143–156Force majeure claims, 217–219Forcing, 394Foreseeable risks, 359–360Formal handover of contract
documents, 411Forming, storming, norming,
performing, mourning, 371–372
Forms of contract ECC/NEC, ICI, FIDIC, I ChemE, 325–326
Forward pass, 144f, 148–149Free float, 121, 122f, 145–146, 151Free standing contract, 313Functional organization, 43, 45Function analysis system technique,
340Function point analysis, 64Funding, 49
GGantt chart. See Bar chartsGeneral computer-aided design
tools (CAD tools), 511General conditions of contract,
325–327Geographical location, 131, 135Geographical proximity, 136, 138,
139fGeographical separation, 365–366Globally unique identifier (GUID),
511Governance
disclosure, 404–405evidence, 406–407reporting, 404–405sponsorship, 403–404
Graphical analysis, 129, 167–174, 246f, 250
Grids, 526Guarantees, 302, 308Guide to project management, BS
6079, 288f, 343
HHammocks, 117–119, 117fHandover, 308, 409–412Handover documents, 308Hard skills, 7–8Hazardous substances, 346Hazard signs, 352f

624 Index
Health and safety, 343–354Health and Safety at Work Act, 343Health and Safety Executive (HSE),
345Health and safety file, 351Health and safety legislation, 343Health and safety plan, 350–351Herzberg motivational theory, 377Hidden agenda, 366Hierarchy of human needs,
375–376High level reporting document, 51Histogram, 79, 79f, 236, 237f, 239f,
423, 428f, 461, 485fHonesty, 383, 405Hornet computer program, 277Hot commissioning, 308Hotel conversion, 311Housing Grants, Construction and
Regeneration Act 1966, 396Hygiene factors, 377
IIdentification, 74–76, 106Impact, 76Impact/probability matrix, 77fImplementer, 374Incoterms, 334–338Independent float, 154–155Industry Foundation Class (IFC),
526–527Industry Foundation Class files
(IFC files), 512Inflation, 63–64Inflow, 250Information distribution, 357Information from networks,
208–209Information management, 355–362Information modelling, 509–528Information policy plan, 355–356Information technology (IT), 176Initial Graphics Exchange Specifi-
cation (IGES), 525Inspection, 121, 306–307Installation, 307–308Insurance, 80, 330–331Insurance company bonds, 314Integrated baseline review (IBR), 104Integrated computer system,
290–291
Integrated project delivery (IPD), 517
Integrated systems, 212–214Integration of material costs, 262Integrity, 379t–380tInterfering float, 153–154Internal economics, 19Internal rate of return (IRR), 33–34,
34f, 458, 460t, 461fInternational Standardization
Organization (ISO), 525Investment appraisal, 29–36, 455,
457tInvestment breakdown, 295fIshikawa (fish bone) diagram, 96,
96fISO, 8Issue management, 102–104
baseline, 103baseline review, 104execution, 104post-review, 104pre-IBR, 104preparation, 104
IT. See Information technology (IT)
JJargon, 365Joint ventures, 313
KKey performance indicators (KPI),
42Kipling poem, 70
LLadder, 117–119Lag, 126Language, 365Latest finish, 146Latest start, 119–120, 146Lead, 120Leadership, 379–386Leak tests, 92Leeds Arena in UK
BIM strategy for efficiency, 524bowl terraced seating model, 522general arrangement drawing,
511project, 522fsection through, 522f
steel-framed structure, 522steelwork arrangement detail,
523ftechnical detail, 524
Legal requirements, 359Lester diagram, 119, 163–166, 458,
470f, 484fLetter of intent, 322–323Life cycle, 49–52Life cycle diagram, 53, 340Life cycles BS 6079, 288fLine of balance (LoB), 179–184Lines of code, 64Linked bar chart, 128–129Linking systems through open.
NET interfaces, 515–516Liquidated damages, 307,
329–330Litigation, 398–399Long messages, 366–367Lubrication schedules, 410Lump sum contract, 309
MMail order campaign, 226–227Maintenance bond. See Retention
bondMaintenance instructions, 225Major risks, 488Make good roads and fences, 410Management information systems
(MIS), 515Management of change,
99–104Mandatory signs, 353fMan hour report, 276fMan hour/time curve, 274fManual analysis, 157–162Manual resource smoothing, 236Manufacturing bar chart activities,
204fManufacturing bar chart format,
195Manufacturing unit, 135–136Marketing a new product,
221–223Maslow’s hierarchy of needs,
375–376Master record index (MRI), 106Materials, 262–264Matrix organization, 43–44

Index 625
Maturity, 380–381Max. and min number of bidders,
300Mechanical, electrical, and piping
(MEP)actual drywall framing around,
518fdrywall framing model around,
518fMediation, 295–297Meetings, 101f, 175–176, 367–368Methods and procedures, 70–71Methods of measurement, 284tMethod statement, 211–212Milestones, 179–184Milestone slip chart, 179,
180f–181fMinistry of Defence (MoD), 50–51,
52fMisunderstandings, 366Mitigation, 80MoD. See Ministry of Defence
(MoD)Modern computer programs, 167Monitor/evaluator, 374Monitoring, 81–82, 81f, 306–307Monte Carlo analysis, 494Monte Carlo simulation, 73–74, 78Motivation, 374–375Motivators, 377Motor car, 455–478Mourning, 372Moving a factory, 223–225, 226fMulti-project system, 494Multi-storey office block,
133–134
NNational Economic Development
Office (NEDO) report, 161–162
National Museum of Qatarchallenges for design, 520–521structural modelling, 520structural solution, 520
Negative cash flow, 250Negative stakeholders, 38, 38fNegotiated discounts, 332Negotiation, 387–392Negotiation agreement, 390Negotiation bargaining, 389
Negotiation finalizing, 390–391, 390f
Negotiation introductions, 389Negotiation outcomes, 390fNegotiation planning, 388–389Negotiation preparation, 387–388,
388fNegotiation proposals, 389Net present value (NPV), 29–33Network, 108–112, 236, 240, 422,
424f–425f, 438, 439fclaims, 214–219method statements, 211–212
Network analysis, 219. See also Critical path methods
Network blocks, 131Network grid, 163Network preparation, 158–160Network principles, 107–130Network rules, 109–112New housing estate, 132Non construction networks, 221Norming, 372Notice of adjudication, 396NPV. See Net present value (NPV)Numbering, 113–117
OOCPCA man hour norms, 441tOffice of Statewide Healthcare
Planning and Development, 517
OGC, 8Oil and Chemical Plant Contractors
Association (OCPCA), 437–438
Oil terminal, 133Openmindedness, 379t–380tOperating instructions, 410Operational systems, 136, 138Options, 479Oracle Primavera P6
analysis views, 491–492baselines, 492–493earned value analysis, 493–494multi-project system, 494progress tracking, 493project planning, 491reference plans, 492–493reporting, 495resource usage, 492
risk management, 494role-based access, 494–495through project life cycle,
496–508work breakdown structure,
491–492Organization breakdown structure
(OBS), 56, 57f, 458, 467f, 482f
Organization matrix. See Responsi-bility matrix
Organization roles, 47–48Organization structures, 43–46Outflow, 250Outputs, 158Overall project completion, 160Overhead-camshaft engine, 455,
456fOverheads, 63, 261–263
PP6. See Primavera P6Package boiler, 228–230Parametric estimaing, 62Parent company guarantees, 303Pareto analysis (80/20 rule), 96–97Pareto chart, 97, 97fPayback, 33Payment schedule, 264Perceived benefit, 26Percentage (%) complete, 202,
256–259, 267, 277, 281fPercentage (%) complete curve,
269Percent (%) complete, 461Percent (%) complete curve, 430Performance bond, 319Performance bound project, 4Performance criteria, 85–86Performance of team, 414Performance tests, 409Performing, 372Personal computer (PC), 175–176PERT, 159PESTLE, 17Pharmaceutical factory, 132Phases, 49Pilot runs, 308P-I matrix, 74Planner, 157–158Planning, 7

626 Index
Planning blocks, 131–142Plant, 373, 409PMI, 8Political environment, 18–19, 74Political restraint, 235Portfolio management, 15–16Portland cement factory, 133Positive cash flow, 250Positive stakeholders, 38, 38fPrecedence diagram. See Activity
on nodePreceding node, 152Predict, 82Pre-planned milestones, 179Pre-qualification questionnaire, 297Present-value factor, 30Present value table, 31fPressure tests, 92Pre-tender survey, 297–300Price, 64, 100Primary stakeholders, 37Primavera P6, 177, 489–508PRINCE, 8, 71Private finance initiative (PFI),
312–313Probability, 39, 494Procurement, 69, 293–338Procurement strategy, 295–297Product-breakdown structure, 458,
467fProduct breakdown structure (PBS),
54, 54f, 481fProduct life cycle, 51–52, 477Professionalism, 383–384Profit, 30, 32, 63, 250–251Programme life cycle, 51Programme management, 14, 68Programming, 176–177Progress reporting, 199–206Progress tracking, 493Prohibition signs, 352fProject
board, 47–48champion, 25–26charter, 9, 10fcompletion, 42context, 17definition, 1–3diamond, 3, 3feconomic, 19environment, 17, 21–22
governance, 401–408investment breakdown, 295flegal, 21life cycle. See Life cyclemanagement, 7management and planning,
207–220manager, 47–48, 495managers charter, reader. See
Project charterobjectives, 7office, reader. See Project support
officeorganization, 43–46project management plan (PMP),
67social, 19–20sponsor, 25–26success criteria, 41–42support office, 48team. See Team buildingtechnical, 20–21triangle, 2, 3fviability, 29–36
Project management, 7OGC, 8
Project management software evolution
early project management software packages, 489–490
enterprise-level database, 490production of reports, 490scalable integrated system, 491simple IT limitations, 489systems integration, 490–491
Project managerBS 6079, 8
Project manager capability, 404, 495
Project managersresponsibilities, 207–208
Project manager’s authority, 8–9Project manager’s responsibility, 8Prompt list, 74–75Prompt payment discount, 333Pronunciation, 365Protective equipment, 345Protective materials, 307PTPT, 288fPublic private partnership (PPP),
312–313
Public sector levies, 313Pumping installation, 437–454Purchase order, 305–306Purchaser, 296, 301, 314–315
QQualification test, 92Qualitative analysis, 74Qualitative data collection,
360–361Quality
assurance, 88–90assurance form, 93faudit, 88, 94control, 88, 90criteria, 15management, 85–98manual, 88, 92plan, 88, 92–94policy, 87, 89programme, 88, 92quality assurance (QA), 57review, 88, 94standard ISO 9000 series, 90tsystems, 88, 90tools, reader. See Quality control
Quality/performance criteria, 15Quantitative analysis, 76Quantitative data collection, 361Quantity surveyors, 63
RRadio-frequency identification
(RFID), 512Random numbering, 113Recommendation for future, 414Reference plans, 492–493Referral, 397Referring party, 396Reimbursable contract, 310–312Remeasured contract, 309–310Reporting, 495Request for quotation (RfQ), 302Requirements management, 26–27Resource
aggregation, 235allocation, 235investigator, 240, 373leveling. See Resource
smoothingloading, 235–242

Index 627
management. See Resource loading
smoothing, 235–236, 240, 429f, 448f
Resource bar chart, 434fResource histogram, 127–128, 128fResource loaded bar chat, 427fResponding party, 396Response, 397Responsibility, 397Responsibility matrix, 58, 59f, 458,
468t, 483fRetention bond, 319, 321fRetention bond discount, 333Retention money, 251Retrieving information, 357Return on investment (RoI), 29–30,
516Reviews, 88, 94, 303, 341Risk
analysis, 79, 82, 458assessment, 76, 77fawareness, 74check list. See Check listevaluation, 76–79exposure table, 78fidentification, 74–76log, reader. See Risk registermanagement, 73–84management plan, 73monitoring, 81–82Mulberry Harbour, 82number, 76opportunity, 82owner, 76positive risk, 82reduction, 80register, 81risk breakdown structure (RBS),
58software, 82summary chart, 77f, 81types, 58
Risk management, 494Risk register, 477ROI. See Return on investment (RoI)Role-based access, 494–495Role of project manager, 9Rolling wave, 64Route surveys, 307Rudyard Kipling poem, 70
SSafe condition signs, 353fSafety, 4–5, 343–354Safety-bound project, 4–5Safety plan, 350–351Safety signs, 351Scalable integrated system, 491Scaled networks, 113–114Schedule of rates, 63Schedule performance index (SPI),
287, 494Schedule variance, 287Scheme for Construction Contracts,
396S-curve, 238, 240, 262Secondary stakeholders, 37–39Security arrangements, 358Shaper, 374Shipping, 307Shipping restrictions/problems, 19,
305Similar equipment, 137Simple examples, 185–198Site man-hours and cost (SMAC),
253–255Site preparation contract,
209–210Situational leadership, 380–383Slack, 144Slip chart. See Milestone slip
chartSMAC. See Site man-hours and
cost (SMAC)Small pipeline project, 196fSMART, 179Smoothing, reader. See Resource
smoothingSoft skills, 7–8Spares lists, 308Specialist, 374SPI cost, 287, 477SPI time, 287, 290Sponsor requirements, 26–27Sponsor role, 26Stage inspection, 305Stages, 54Stages and sequences, 415–420Stages of completion, 136Stakeholder analysis, 37, 39fStakeholder identification. See
Stakeholder analysis
Stakeholder management, 37–40Stakeholders (direct), 37Stakeholders (indirect), 37–39Standard conditions of contract,
325–326Standard for the Exchange of
Product Model Data (STEP), 525
Standards, 359Steel detailing neutral file format
(SDNF format), 526Storage, 307Storing information/virus
protection, 357Storming, 371Strikes, 393Structural framing plan, 212fStructural steelwork industry,
511Subcontracts, 324–325Subdivision of blocks, 131–142Subjective estimating, 61–62Succeeding node, 152Success/failure criteria, 302,
313–314Surplus material disposal, 477Sustainability, 23SWOT, 73–74System integration, 69, 212–214Systems integration, 490–491
TTable of PMP topics in BS 6079, 8Target contract, 312Task. See ActivityTask force, 44–45Team building, 369–378Team development, 371–372Team performance, 14–15Team worker, 374Technical specification, 328Tekla BIMsight
conveying differences, 517showing model to site
comparisons, 518fTekla structures
drywall assembly ‘spool sheet’, 519f
dynamic detailing implementation, 517
Tender evaluation, 302–305

628 Index
Tender list, 296–297Terms of payment, 303, 3313D modelling technology, 511Three point estimating, 159, 494Time-bound project, 3–4Time efficiency, 287Time scaled network, 128–129Time sheet, 254, 263Time value of money. See Net
present valueTop down estimating, 61Topological numbering, 113–114Tornado diagram, 79, 79fTotal float, 120–121, 145–146, 422,
443t, 491Total quality management (TQM),
89Trade unions, 38Transfer of ownership certificate,
317fTranslation, 365Transmission failures, 365–366Trend analysis, 97–98
Trend charts. See Milestone slip chart
Tuckman team development, 317f2D drawing systems, 510Types of contract, firm, fixed,
target, cost plus, reimbursable, 308–323
Types of risk, reader. See Risk typesTypical site problems, 160–161
UUK Government Recommendations
aims and objectives, 513project BIM maturity levels, 513
Universally unique identifier (UUID), 511
Unsmoothed resources, 476fUpdating, 199–200, 254, 282,
291–292
VValidity date, 304fValue analysis, 8, 339–340
Value engineering, 71, 339Value hours, 254–255, 256tValue management, 71, 339–342Value planning, 340
WWarning signs, 351Warranties, 308Weighting system, 255, 255tWhy and what, 25, 68Withdrawing, 315, 319Work breakdown structure (WBS),
53–61, 357, 418t–419t, 481fWorked examples
battle tank, 479–488, 480fbungalow, 421–436motor car, 455–478pumping installation, 437–454
ZZero float, 418t–419tZero time, 109