
Untitled - NIBM eHub
433
-
Upload
khangminh22 -
Category
Documents
-
view
7 -
download
0
Transcript of Untitled - NIBM eHub


Essentials of Marketing Research
Fourth Edition
Joseph F. Hair, Jr.
University of South Alabama
Mary Celsi
California State University–Long Beach
David J. Ortinau
University of South Florida
Robert P. Bush
Houston Baptist University
www.MyEbookNiche.eCrater.com

ESSENTIALS OF MARKETING, FOURTH EDITION
Published by McGraw-Hill Education, 2 Penn Plaza, New York, NY 10121. Copyright © 2017 by McGraw-Hill
Education. All rights reserved. Printed in the United States of America. Previous editions © 2013, 2010, and
2008. No part of this publication may be reproduced or distributed in any form or by any means, or stored in a
database or retrieval system, without the prior written consent of McGraw-Hill Education, including, but not
limited to, in any network or other electronic storage or transmission, or broadcast for distance learning.
Some ancillaries, including electronic and print components, may not be available to customers outside the
United States.
This book is printed on acid-free paper.
1 2 3 4 5 6 7 8 9 QVS 21 20 19 18 17 16
ISBN 978-0-07-811211-9
MHID 0-07-811211-7
Chief Product Officer, SVP Products & Markets: G. Scott Virkler
Vice President, General Manager, Products & Markets: Michael Ryan
Managing Director: Susan Gouijnstook
Executive Brand Manager: Meredith Fossel
Brand Manager: Laura Hurst Spell
Director, Product Development: Meghan Campbell
Marketing Manager: Elizabeth Schonagen
Digital Product Analyst: Kerry Shanahan
Director, Content Design & Delivery: Terri Schiesl
Program Manager: Mary Conzachi
Content Project Manager: Jeni McAtee
Buyer: Sandy Ludovissy
Cover image: Mutlu Kurtbas/Getty Images
Content Licensing Specialist: Shannon Manderscheid, text
Cover Image: Mutlu Kurtbas/Getty Images
Compositor: MPS Limited
Printer: Quad/Graphics
All credits appearing on page or at the end of the book are considered to be an extension of the copyright page.
Library of Congress Cataloging-in-Publication Data
Hair, Joseph F., author.
Essentials of marketing research / Joseph F. Hair, Jr., University of South Alabama, Mary W. Celsi,
California State University/Long Beach, David J. Ortinau, University of South Florida, Robert P. Bush,
Houston Baptist University.
Fourth edition. | New York, NY : McGraw-Hill Education, [2017]
LCCN 2016030404 | ISBN 9780078112119 (alk. paper)
LCSH: Marketing research.
LCC HF5415.2 .E894 2017 | DDC 658.8/3—dc23 LC record available at https://lccn.loc.gov/2016030404
The Internet addresses listed in the text were accurate at the time of publication. The inclusion of a website does
not indicate an endorsement by the authors or McGraw-Hill Education, and McGraw-Hill Education does not
guarantee the accuracy of the information presented at these sites.
mheducation.com/highered
www.MyEbookNiche.eCrater.com

iii
To my wife Dale, our son Joe III, wife Kerrie, and grandsons Joe IV and Declan.
—Joseph F. Hair, Jr., Mobile, Alabama
To my father and mother, William and Carol Finley.
—Mary Wolfinbarger Celsi, Long Beach, CA
To my late mom, Lois and my sister and brothers and their families.
—David J. Ortinau, Tampa, FL
To my late wife Donny Kathleen, and my two boys, Michael and Robert, Jr.
—Robert P. Bush, Sr., Houston, TX
Dedication
www.MyEbookNiche.eCrater.com

iv
About the Authors
Joseph F. Hair is Professor of Marketing and the Cleverdon Chair of Business at the Uni-
versity of South Alabama, and Director of the DBA degree program in the Mitchell College
of Business. He formerly held the Copeland Endowed Chair of Entrepreneurship at Lou-
isiana State University. He has published more than 60 books, including market leaders
Multivariate Data Analysis, 7th edition, Prentice Hall, 2010, which has been cited more than
125,000 times; Marketing Research, 4th edition, McGraw-Hill/Irwin, 2009; Principles of
Marketing, 12th edition, Thomson Learning, 2012, used at over 500 universities globally; A
Primer in Partial Least Squared Structural Equation Modeling (PLS-SEM), 2nd edition,
Sage, 2017; and Essentials of Business Research Methods, 3rd edition, Taylor & Francis,
2016. In addition to publishing numerous referred manuscripts in academic journals such as
Journal of Marketing Research, Journal of Academy of Marketing Science, Journal of Busi-
ness/Chicago, Journal of Advertising Research, and Journal of Retailing, he has presented
executive education and management training programs for numerous companies, has been
retained as consultant and expert witness for a wide variety of firms, and is frequently an
invited speaker on research methods and multivariate analysis. He is a Distinguished Fellow
of the Academy of Marketing Science, the Society for Marketing Advances (SMA), and has
served as president of the Academy of Marketing Sciences, the SMA, the Southern Mar-
keting Association, the Association for Healthcare Research, the Southwestern Marketing
Association, and the American Institute for Decision Sciences, Southeast Section. Professor
Hair was recognized by the Academy of Marketing Science with its Outstanding Marketing
Teaching Excellence Award, and the Louisiana State University Entrepreneurship Institute
under his leadership was recognized nationally by Entrepreneurship Magazine as one of the
top 12 programs in the United States.
Mary W. Celsi is a Professor of Marketing at California State University, Long Beach. She
has published research in several top journals, including Journal of Marketing, Journal of
Consumer Research Journal of Retailing, California Management Review, and Journal
of the Academy of Marketing Science. She has expertise in qualitative and quantitative
research methods. Her publications span a wide range of interests, from internal marketing
to digital marketing and consumer culture theory. Her research has been cited more than
5,000 times in scholarly publications.
David J. Ortinau is Professor of Marketing at the University of South Florida (USF).
His Ph.D. in Marketing is from Louisiana State University. He began his teaching ca-
reer at Illinois State University and after completing his degree moved to USF in Tampa.
Dr. Ortinau continues to be recognized for both outstanding research and excellence in
teaching at the undergraduate, graduate, and doctorate levels. His research interests range
from research methodologies and scale measurement development, attitude formation,
and perceptual differences in retailing and services marketing environments to interac-
tive electronic marketing technologies and their impact on information research problems.
www.MyEbookNiche.eCrater.com

About the Authors v
He consults for a variety of corporations and small businesses, with specialties in customer
satisfaction, service quality, service value, retail loyalty, and imagery. Dr. Ortinau has pre-
sented numerous papers at national and international academic conferences. He continues
to make scholarly contributions in such prestigious publications as the Journal of the Acad-
emy of Marketing Science, Journal of Retailing, Journal of Business Research, Journal of
Marketing Theory and Practice, Journal of Healthcare Marketing, Journal of Services
Marketing, Journal of Marketing Education, and others. He is a co-author of marketing
research textbooks titled Marketing Research: In a Digital Information Environment,
4e (2009) as well as guest co-editor of several JBR Special Issues on Retailing. He is an
editorial board member for JAMS, JBR, JGSMS, and JMTP as well as an Ad Hoc reviewer
for several other journals. He has multiple “Outstanding Editorial Reviewer” Awards from
JAMS, JBR, and JMTP, and recently served as the JBR co-associate editor of Marketing
and is a member of JMTP Senior Advisory Board. Professor Ortinau remains an active
leader in the Marketing Discipline. He has held many leadership positions in the Society
for Marketing Advances (SMA), including President; Founder and Chairman of Board of
the SMA Foundation; and is a 2001 SMA Fellow. He has been chair of the SMA Doctoral
Consortiums in New Orleans, Orlando, and Atlanta. Dr. Ortinau has been an active mem-
ber of the Academy of Marketing Science (AMS) since the early 1980s, serving AMS in a
wide variety of positions such as 2004 AMS Conference Program co-chair, AMS Doctoral
Colloquium, Meet the Journal Editorial Reviewers, and special sessions on Research Meth-
ods as well as How to Publish Journal Articles. Recently, Dr. Ortinau served as the Pro-
gram Co-chair of the 2016 AMS World Marketing Congress in Paris, France and became a
member of AMS Board of Governors.
Robert P. Bush is a Professor of Marketing, and Associate Dean of the Archie W. Dunham
College of Business, Houston Baptist University. He formerly held the Alumni and Friends
Endowed Chair in Business at Louisiana State University at Alexandria. Throughout his
academic career, he has served as reviewer and special editor for several major Marketing
Journals. He has authored, edited, or coauthored six textbooks, published over 25 articles
in leading Marketing Journals, and has over 30 publications in national and international
proceedings.
www.MyEbookNiche.eCrater.com

vi
Preface
We have prepared this edition with great optimism, but at the same time some degree of
trepidation. We live in a global, highly competitive, rapidly changing world that increas-
ingly is influenced by information technology, social media, artificial intelligence, and
many other recent developments. The earlier editions of our text Essentials of Marketing
Research became a premier source for new and essential marketing research knowledge.
Many of you, our customers, provided feedback on previous editions of this book as well
as our longer text, Marketing Research. Some of you like to do applied research projects
while others emphasize case studies or exercises at the end of the chapters. Others have
requested additional coverage of both qualitative and quantitative methods. Students and
professors alike are concerned about the price of textbooks. This fourth edition of Essen-
tials of Marketing Research was written to meet the needs of you, our customers. The text
is concise, highly readable, and value-priced, yet it delivers the basic knowledge needed for
an introductory text. We provide you and your students with an exciting, up-to-date text,
and an extensive supplement package. In the following section, we summarize what you
will find when you examine, and we hope, adopt, the fourth edition of Essentials.
Innovative Features of this Book
First, in the last few years, data collection has migrated quickly to online approaches, and
by 2015 reached about 80 percent of all data collection methods. The movement to online
methods of data collection has necessitated the addition of considerable new material on
this topic. The chapters on sampling, measurement and scaling, questionnaire design, and
preparation for data analysis all required new guidelines on how to deal with online related
issues. Social media monitoring and marketing research online communities are expanding
research methods and are addressed in our chapter on qualitative and observational research.
Second, to enhance student analytical skills we added additional variables to the con-
tinuing case on the Santa Fe Grill and Jose’s Southwestern Café. Also, there is now a
separate data set based on a survey of the employees of the Santa Fe Grill. Findings of the
Santa Fe Grill customer and employee data sets are related and can be compared qualita-
tively to obtain additional insights. The competitor data for the continuing case enables
students to make comparisons of customer experiences in each of the two restaurants and
to apply their research findings in devising the most effective marketing strategies for the
Santa Fe Grill. The exercises for the continuing case demonstrate practical considerations
in sampling, qualitative and observational design, questionnaire design, data analysis and
interpretation, and report preparation, to mention a few issues. Social media monitor-
ing and marketing research online communities are expanding research methods and are
addressed in our chapter on qualitative and observational research.
Third, we have updated the Marketing Research Dashboards in each chapter to
include new features that focus on timely, thought-provoking issues in marketing research.
Examples of topics covered include ethics, privacy and online data collection, particularly
www.MyEbookNiche.eCrater.com

Preface vii
clickstream analysis, the role of Twitter and Linked-In in marketing research, and improv-
ing students’ critical thinking skills.
Fourth, other texts include little coverage of the task of conducting a literature review to
find background information on the research problem. Our text has a chapter that includes
substantial material on literature reviews, including guidelines on how to conduct a litera-
ture review and the sources to search. Because students rely so heavily on the Internet,
the emphasis is on using Google, Yahoo!, Bing, and other search engines to execute the
background research. In our effort to make the book more concise, we integrated secondary
sources of information with digital media searches. This material is in Chapter 3.
Fifth, our text is the only one that includes a separate chapter on qualitative data analysis.
Other texts discuss qualitative data collection, such as focus groups and in-depth interviews, but
then say little about what to do with this kind of data. In contrast, we dedicate an entire chapter
to the topic that includes interesting new examples and provides an overview of the seminal
work in this area by Miles and Huberman, thus enabling professors to provide a more balanced
approach in their classes. We also explain important tasks such as coding qualitative data and
identifying themes and patterns. An important practical feature in Chapter 9 of the third edition
is a sample report on a qualitative research project to help students better understand the differ-
ences between quantitative and qualitative reports. We also have an engaging, small-scale quali-
tative research assignment on product dissatisfaction as a new MRIA at the end of the chapter
to help students more fully understand how to analyze qualitative research. We think you and
your students will find this assignment to be an engaging introduction to qualitative analysis.
Sixth, as part of the “applied” emphasis of our text, Essentials has two pedagogical
features that are very helpful to students’ practical understanding of the issues. One is the
boxed material mentioned above entitled the Marketing Research Dashboard that sum-
marizes an applied research example and poses questions for discussion. Then at the end
of every chapter, we feature a Marketing Research in Action (MRIA) exercise that enables
students to apply what was covered in the chapter to a real-world situation.
Seventh, as noted above, our text has an excellent continuing case study throughout
the book that enables the professor to illustrate applied concepts using a realistic example.
Our continuing case study, the Santa Fe Grill Mexican Restaurant, is a fun example stu-
dents can relate to given the popularity of Mexican restaurant business themes. As men-
tioned above, for this edition we added an employee data set so students can complete a
competitive analysis, including application of importance-performance concepts, and also
relate the employee findings to the customer perceptions. Because it is a continuing case,
professors do not have to familiarize students with a new case in every chapter, but instead
can build on what has been covered earlier. The Santa Fe Grill case is doubly engaging
because the story/setting is about two college student entrepreneurs who start their own
business, a goal of many students. Finally, when the continuing case is used in later chap-
ters on quantitative data analysis, a data set is provided that can be used with SPSS and
SmartPLS to teach data analysis and interpretation skills. Thus, students can truly see how
marketing research information can be used to improve decision making.
Eighth, in addition to the Santa Fe Grill case, there are four other data sets in SPSS
format. The data sets can be used to assign research projects or as additional exercises
throughout the book. These databases cover a wide variety of topics that all students can
identify with and offer an excellent approach to enhance teaching of concepts. An over-
view of these cases is provided below:
Deli Depot is an expanded version of the Deli Depot case included in previous edi-
tions. An overview of this case is provided as part of the MRIA (Marketing Research
in Action) feature in Chapter 10. The sample size is 200.
www.MyEbookNiche.eCrater.com

viii Preface
Remington’s Steak House is introduced as the MRIA in Chapter 11. Remington’s
Steak House competes with Outback and Longhorn. The focus of the case is analyzing
data to identify restaurant images and prepare perceptual maps to facilitate strategy
development. The sample size is 200.
QualKote is a business-to-business application of marketing research based on an
employee survey. It is introduced as the MRIA in Chapter 12. The case examines the
implementation of a quality improvement program and its impact on customer satis-
faction. The sample size is 57.
Consumer Electronics is based on the rapid growth of the digital recorder/player mar-
ket and focuses on the concept of innovators and early adopters. The case overview
and variables as well as some data analysis examples are provided in the MRIA for
Chapter 13. The sample size is 200.
Ninth, the text’s coverage of quantitative data analysis is more extensive and much
easier to understand than other books’. Specific step-by-step instructions are included on
how to use SPSS and SmartPLS to execute data analysis for many statistical techniques.
This enables instructors to spend much less time teaching students how to use the software
the first time. It also saves time later by providing a handy reference for students when
they forget how to use the software, which they often do. For instructors who want to cover
more advanced statistical techniques, our book is the only one that includes this topic. In
the fourth edition, we have added additional material on topics such as common methods
bias, selecting the appropriate scaling method, and a table providing guidelines to select
the appropriate statistical technique. Finally, we include an overview of the increasingly
popular variance based approach to structural modeling (PLS-SEM) and much more exten-
sive coverage of how to interpret data analysis findings.
Tenth, as noted earlier, online marketing research techniques are rapidly changing the
face of marketing, and the authors have experience with and a strong interest in the issues
associated with online data collection. For the most part, other texts’ material covering
online research is an “add-on” that does not fully integrate online research considerations
and their impact. In contrast, our text has extensive new coverage of these issues that is
comprehensive and timely because it was written in the last year when many of these
trends are now evident and information is available to document them.
Pedagogy
Many marketing research texts are readable. But a more important question is, “Can
students comprehend what they are reading?” This book offers a wealth of pedagogical
features, all aimed at answering the question positively. Below is a list of the major peda-
gogical elements available in the fourth edition:
Learning Objectives. Each chapter begins with clear Learning Objectives that stu-
dents can use to assess their expectations for and understanding of the chapter in view
of the nature and importance of the chapter material.
Real-World Chapter Openers. Each chapter opens with an interesting, relevant
example of a real-world business situation that illustrates the focus and significance
of the chapter material. For example, Chapter 1 illustrates the emerging role of social
networking sites such as Twitter in enhancing marketing research activities.
Marketing Research Dashboards. The text includes boxed features in all chapters
that act like a dashboard for the student to understand emerging issues in marketing
research decision making.
www.MyEbookNiche.eCrater.com

Preface ix
Key Terms and Concepts. These are boldfaced in the text and defined in the page
margins. They also are listed at the end of the chapters along with page numbers to
make reviewing easier, and they are included in the comprehensive marketing research
Glossary at the end of the book.
Ethics. Ethical issues are treated in the first chapter to provide students with a basic
understanding of ethical challenges in marketing research. Coverage of increasingly
important ethical issues has been updated and expanded from the second edition, and
includes online data collection ethical issues.
Chapter Summaries. The detailed chapter Summaries are organized by the Learning
Objectives presented at the beginning of the chapters. This approach to organizing
summaries helps students remember the key facts, concepts, and issues. The Summa-
ries serve as an excellent study guide to prepare for in-class exercises and for exams.
Questions for Review and Discussion. The Review and Discussion Questions are care-
fully designed to enhance the self-learning process and to encourage application of the
concepts learned in the chapter to real business decision-making situations. There are two
or three questions in each chapter directly related to the Internet and designed to provide
students with opportunities to enhance their digital data gathering and interpretative skills.
Marketing Research in Action. The short MRIA cases that conclude each of the chap-
ters provide students with additional insights into how key concepts in each chapter can be
applied to real-world situations. These cases serve as in-class discussion tools or applied
case exercises. Several of them introduce the data sets found on the book’s Web site.
Santa Fe Grill. The book’s continuing case study on the Santa Fe Grill uses a single
research situation to illustrate various aspects of the marketing research process. The Santa
Fe Grill continuing case, including competitor Jose’s Southwestern Café, is a specially
designed business scenario embedded throughout the book for the purpose of questioning
and illustrating chapter topics. The case is introduced in Chapter 1, and in each subsequent
chapter, it builds on the concepts previously learned. More than 30 class-tested examples
are included as well as an SPSS and Excel formatted database covering a customer survey
of the two restaurants. In earlier editions, we added customer survey information for
competitor Jose’s Southwestern Café, as well as employee survey results for the Santa Fe
Grill, to further demonstrate and enhance critical thinking and analytical skills.
McGraw-Hill Connect®: connect.mheducation.com
Continually evolving, McGraw-Hill Connect® has been redesigned to provide the only true
adaptive learning experience delivered within a simple and easy-to-navigate environment,
placing students at the very center.
∙ Performance Analytics—Now available for both instructors and students, easy-to-
decipher data illuminates course performance. Students always know how they are
doing in class, while instructors can view student and section performance at-a-glance.
∙ Mobile—Available on tablets, students can now access assignments, quizzes, and results
on-the-go, while instructors can assess student and section performance anytime, anywhere.
∙ Personalized Learning—Squeezing the most out of study time, the adaptive engine
within Connect creates a highly personalized learning path for each student by identify-
ing areas of weakness and providing learning resources to assist in the moment of need.
This seamless integration of reading, practice, and assessment ensures that the focus is on
the most important content for that individual.
www.MyEbookNiche.eCrater.com

x Preface
LearnSmart®
LearnSmart, the most widely used adaptive learning resource, is proven to improve grades.
By focusing each student on the most important information they need to learn, Learn-
Smart personalizes the learning experience so they can study as efficiently as possible.
SmartBook®
SmartBook—an extension of LearnSmart—is an adaptive eBook that helps students focus
their study time more effectively. As students read, SmartBook assesses comprehension
and dynamically highlights where they need to study more.
Instructor Library
The Connect Instructor Library is your repository for additional resources to improve student
engagement in and out of class. You can select and use any asset that enhances your lecture.
Instructor’s Resources. Specially prepared Instructor’s Manual and Test Bank and
PowerPoint slide presentations provide an easy transition for instructors teaching with
the book the first time.
Data Sets. Six data sets in SPSS format are available in the Connect Library, which
can be used to assign research projects or with exercises throughout the book. (The
concepts covered in each of the data sets are summarized earlier in this Preface.)
SmartPLS Student Version. Through an arrangement with SmartPLS
(www.smartple.de), we provide instructions on how to obtain a free student ver-
sion of this powerful new software for executing structural modeling, multiple
regression, mediation, and many other interesting types of analyses. Specific instruc-
tions on how to obtain and use the software are available in the Connect Library.
SPSS Student Version. This powerful software tool enables students to analyze up
to 50 variables and 1,500 observations. SPSS data sets are available that can be used
in conjunction with data analysis procedures included in the text. Licensing informa-
tion is available from IBM Analytics for Education: www.ibm.com/analytics/us/en
/industry/education
Acknowledgments
The authors took the lead in preparing the fourth edition, but many other people
must be given credit for their significant contributions in bringing our vision to real-
ity. We thank our colleagues in academia and industry for their helpful insights
over many years on numerous research topics: David Andrus, Kansas State Uni-
versity; Barry Babin, Louisiana Tech University; Joseph K. Ballanger, Stephen F.
Austin State University; Ali Besharat, University of South Florida; Kevin Bittle,
Johnson and Wales University; Mike Brady, Florida State University; John R.
Brooks, Jr., Houston Baptist University; Mary L. Carsky, University of Hart-
ford; Gabriel Perez Cifuentes, University of the Andes; Vicki Crittenden, Boston
College; Diane Edmondson, Middle Tennessee State University; Keith Ferguson,
Michigan State University; Frank Franzak, Virginia Commonwealth University;
Susan Geringer, California State University, Fresno; Anne Gottfried, University of
Southern Mississippi; Timothy Graeff, Middle Tennessee State University; Dana Harrison,
www.MyEbookNiche.eCrater.com

Preface xi
East Tennessee State University; Harry Harmon, Central Missouri State University;
Lucas Hopkins, Florida State University; Gail Hudson, Arkansas State
University; Beverly Jones, Kettering University; Karen Kolzow-Bowman, Morgan State
University; Michel Laroche, Concordia University; Bryan Lukas, University of Melbourne;
Vaidotas Lukosius, Tennessee State University; Lucy Matthews, Middle Tennessee State
University; Peter McGoldrick, University of Manchester; Martin Meyers, University of
Wisconsin, Stevens Point; Arthur Money, Henley Management College; Vanessa Gail
Perry, George Washington University; Ossi Pesamaa, Jonkoping University; Emily J.
Plant, University of Montana; Michael Polonsky, Deakin University; Charlie Ragland,
Indiana University; Molly Rapert, University of Arkansas; Mimi Richard, University of
West Georgia; John Rigney, Golden State University; Jeff Risher, Kennesaw State Uni-
versity; Wendy Ritz Fayetteville State University; Jean Romeo, Boston College; Lawrence
E. Ross, Florida Southern University; Phillip Samouel, Kingston University; Carl Saxby,
University of Southern Indiana; Donna Smith, Ryerson University; Marc Sollosy, Marshall
University; Bruce Stern, Portland State University; Goran Svensson, University of Oslo;
Armen Taschian, Kennesaw State University; Drew Thoeni, University of North Florida ;
Gail Tom, California State University, Sacramento; John Tsalikis, Florida International
University; Steve Vitucci, University of Central Texas; Tuo Wang, Kent State University;
David Williams, Dalton State University;
Mary Conran
Fox School of Business at Temple University
Curt John Dommeyer
California State University at Northridge
Lee Ann Kahlor
University of Texas at Austin
Sungho Park
Arizona State University
Our sincere thank goes also to the helpful reviewers who made suggestions and shared
their ideas for the fourth edition:
Finally, we would like to thank our editors and advisors at McGraw-Hill Education. Thanks
go to Laura Hurst Spell, sponsoring editor; Elizabeth Schonagen, marketing manager; and
Jenilynn McAtee, project manager.
Joseph F. Hair, Jr.
Mary W. Celsi
David J. Ortinau
Robert P. Bush
www.MyEbookNiche.eCrater.com

xii
Brief Contents
Part 1 The Role and Value of Marketing
Research Information 1 1 Marketing Research for Managerial
Decision Making 2
2 The Marketing Research Process
and Proposals 24
Part 2 Designing the Marketing Research
Project 47 3 Secondary Data, Literature Reviews,
and Hypotheses 48
4 Exploratory and Observational Research
Designs and Data Collection Approaches 74
5 Descriptive and Causal Research Designs 106
Part 3 Gathering and Collecting
Accurate Data 133 6 Sampling: Theory and Methods 134
7 Measurement and Scaling 158
8 Designing the Questionnaire 190
Part 4 Data Preparation, Analysis,
and Reporting the Results 219 9 Qualitative Data Analysis 220
10 Preparing Data for Quantitative Analysis 246
11 Basic Data Analysis for Quantitative Research 272
12 Examining Relationships in Quantitative
Research 316
13 Communicating Marketing Research Findings 352
Glossary 382
Endnotes 400
Name Index 404
Subject Index 406
www.MyEbookNiche.eCrater.com

xiii
Contents
Part 1 The Role and Value of Marketing Research Information 1
1 Marketing Research for Managerial
Decision Making 2
Geofencing 3
The Growing Complexity of Marketing
Research 4
MARKETING RESEARCH DASHBOARD:
CONDUCTING INTERNATIONAL
MARKETING RESEARCH 4
The Role and Value of Marketing Research 6
Marketing Research and
Marketing Mix Variables 6
Marketing Theory 9
MARKETING RESEARCH DASHBOARD:
THE PERFECT PRICING EXPERIMENT? 10
The Marketing Research Industry 10
Types of Marketing Research Firms 10
Changing Skills for a Changing Industry 11
Ethics in Marketing Research Practices 12
Ethical Questions in General
Business Practices 12
Conducting Research Not Meeting
Professional Standards 13
Abuse of Respondents 14
Unethical Activities of the
Client/Research User 15
MARKETING RESEARCH DASHBOARD 15
Unethical Activities by the Respondent 16
Marketing Research Codes of Ethics 16
CONTINUING CASE STUDY: THE SANTA
FE GRILL MEXICAN RESTAURANT 17
Emerging Trends 17
Marketing Research in Action 18
Continuing Case: The Santa Fe Grill 18
Summary 20
Key Terms and Concepts 20
Review Questions 21
Discussion Questions 21
Appendix A 22
2 The Marketing Research Process
and Proposals 24
Solving Marketing Problems
Using a Systematic Process 25
Value of the Research Process 26
Changing View of the Marketing
Research Process 26
Determining the Need for
Information Research 27
MARKETING RESEARCH
DASHBOARD: DECISION
MAKERS AND RESEARCHERS 28
Overview of the Research Process 29
Transforming Data into Knowledge 30
Interrelatedness of the Steps and the
Research Process 31
Phase I: Determine the Research Problem 31
Step 1: Identify and Clarify
Information Needs 32
Step 2: Define the Research Questions 34
Step 3: Specify Research Objectives
and Confirm the Information Value 36
Phase II: Select the Research Design 36
Step 4: Determine the Research
Design and Data Sources 36
MARKETING RESEARCH DASHBOARD:
MEASURING EFFECTIVENESS
OF ONLINE ADVERTISING FORMATS 37
Step 5: Develop the Sampling
Design and Sample Size 38
Step 6: Examine Measurement
Issues and Scales 38
Step 7: Design and Pretest
the Questionnaire 39
Phase III: Execute the Research Design 39
Step 8: Collect and Prepare Data 39
Step 9: Analyze Data 39
Step 10: Interpret Data to
Create Knowledge 40
Phase IV: Communicate the Results 40
www.MyEbookNiche.eCrater.com

xiv Contents
Step 11: Prepare and Present
the Final Report 41
Develop a Research Proposal 41
Marketing Research in Action 42
What Does a Research Proposal Look Like? 42
Summary 44
Key Terms and Concepts 45
Review Questions 45
Discussion Questions 46
Part 2 Designing the Marketing Research Project 47
3 Secondary Data, Literature Reviews,
and Hypotheses 48
Will Brick-and-Mortar Stores
Eventually Turn into Product Showrooms? 49
Value of Secondary Data and
Literature Reviews 50
Nature, Scope, and Role of
Secondary Data 50
Conducting a Literature Review 51
Evaluating Secondary Data Sources 51
Secondary Data and the Marketing
Research Process 53
Internal and External Sources
of Secondary Data 54
Internal Sources of Secondary Data 54
External Sources of Secondary Data 54
CONTINUING CASE STUDY:
THE SANTA FE GRILL MEXICAN
RESTAURANT USING
SECONDARY DATA 58
MARKETING RESEARCH
DASHBOARD: TRIANGULATING
SECONDARY DATA SOURCES 62
Synthesizing Secondary Research for the
Literature Review 62
Developing a Conceptual Model 63
Variables, Constructs, and
Relationships 63
Developing Hypotheses and Drawing
Conceptual Models 64
CONTINUING CASE STUDY: THE SANTA
FE GRILL MEXICAN RESTAURANT
DEVELOPING RESEARCH QUESTIONS
AND HYPOTHESES 67
Hypothesis Testing 67
Marketing Research in Action 69
The Santa Fe Grill Mexican Restaurant 69
Summary 70
Key Terms and Concepts 71
Review Questions 71
Discussion Questions 71
4 Exploratory and Observational
Research Designs and Data
Collection Approaches 74
Customer Territoriality in “Third Places” 75
Value of Qualitative Research 76
Overview of Research Designs 77
Overview of Qualitative and Quantitative
Research Methods 77
Quantitative Research Methods 77
Qualitative Research Methods 78
Qualitative Data Collection Methods 81
In-Depth Interviews 81
Focus Group Interviews 82
Phase 1: Planning the Focus
Group Study 85
Phase 2: Conducting the Focus
Group Discussions 87
Phase 3: Analyzing and Reporting
the Results 89
Advantages of Focus Group
Interviews 89
Purposed Communities/Private
Community 89
Other Qualitative Data Collection
Methods 91
Ethnography 91
Case Study 91
Projective Techniques 92
CONTINUING CASE:
THE SANTA FE GRILL 92
Observation Methods 93
Unique Characteristics of Observation
Methods 94
Types of Observation Methods 94
Selecting the Observation Method 96
Benefits and Limitations of
Observation Methods 97
Social Media Monitoring and the
Listening Platform 97
Netnography 99
Marketing Research in Action 100
Reaching Hispanics through Qualitative
Research 100
Summary 102
Key Terms and Concepts 103
www.MyEbookNiche.eCrater.com

Contents xv
Review Questions 104
Discussion Questions 104
5 Descriptive and Causal
Research Designs 106
Magnum Hotel’s Loyalty Program 107
Value of Descriptive and Causal Survey
Research Designs 108
Descriptive Research Designs
and Surveys 108
Types of Errors in Surveys 109
Sampling Errors 109
Nonsampling Errors 110
Types of Survey Methods 110
Person-Administered Surveys 111
Telephone-Administered Surveys 112
Self-Administered Surveys 115
Selecting the Appropriate Survey Method 118
Situational Characteristics 118
Task Characteristics 119
Respondent Characteristics 120
Causal Research Designs 122
The Nature of Experimentation 123
Validity Concerns with Experimental
Research 124
MARKETING RESEARCH DASHBOARD:
RETAILERS USE EXPERIMENTS
TO TEST DISCOUNT STRATEGY 125
Comparing Laboratory and Field
Experiments 126
Test Marketing 127
Marketing Research Dashboard 128
Riders Fits New Database into
Brand Launch 128
Summary 130
Key Terms and Concepts 131
Review Questions 131
Discussion Questions 132
Part 3 Gathering and Collecting Accurate Data 133
6 Sampling: Theory
and Methods 134
Mobile Web Interactions Explode 135
Value of Sampling in Marketing
Research 136
Sampling as a Part of the
Research Process 136
The Basics of Sampling Theory 137
Population 137
Sampling Frame 138
Factors Underlying Sampling
Theory 138
Tools Used to Assess the Quality
of Samples 139
MARKETING RESEARCH IN ACTION
CONTINUING CASE STUDY: THE SANTA
FE GRILL 139
Probability and Nonprobability Sampling 140
Probability Sampling Designs 140
MARKETING RESEARCH DASHBOARD:
SELECTING A SYSTEMATIC RANDOM
SAMPLE FOR THE SANTA FE GRILL 142
MARKETING RESEARCH
DASHBOARD: WHICH IS
BETTER—PROPORTIONATELY OR
DISPROPORTIONATELY STRATIFIED
SAMPLES? 145
Nonprobability Sampling Designs 146
Determining the Appropriate
Sampling Design 148
Determining Sample Sizes 148
Probability Sample Sizes 148
CONTINUING CASE STUDY:
THE SANTA FE GRILL 149
Sampling from a Small Population 150
MARKETING RESEARCH
DASHBOARD: USING SPSS
TO SELECT A RANDOM SAMPLE 150
Nonprobability Sample Sizes 151
Other Sample Size Determination
Approaches 151
MARKETING RESEARCH DASHBOARD:
SAMPLING AND ONLINE SURVEYS 151
Steps in Developing a Sampling Plan 152
Marketing Research in Action 154
Developing a Sampling Plan for a
New Menu Initiative Survey 154
Summary 155
Key Terms and Concepts 156
Review Questions 156
Discussion Questions 156
7 Measurement and Scaling 158
Santa Fe Grill Mexican Restaurant:
Predicting Customer Loyalty 159
Value of Measurement in
Information Research 160
Overview of the Measurement Process 160
www.MyEbookNiche.eCrater.com

xvi Contents
What Is a Construct? 161
Construct Development 161
Scale Measurement 163
MARKETING RESEARCH DASHBOARD:
UNDERSTANDING THE DIMENSIONS
OF BANK SERVICE QUALITY 163
Nominal Scales 164
Ordinal Scales 164
Interval Scales 165
Ratio Scales 166
Evaluating Measurement Scales 167
Scale Reliability 167
Validity 168
Developing Scale Measurements 169
Criteria for Scale Development 169
Adapting Established Scales 172
Scales to Measure Attitudes and Behaviors 173
Likert Scale 173
Semantic Differential Scale 174
Behavioral Intention Scale 176
Comparative and Noncomparative
Rating Scales 177
Other Scale Measurement Issues 180
Single-Item and Multiple-Item Scales 180
Clear Wording 180
Misleading Scaling Formats 181
Marketing Research in Action 184
What Can You Learn from a Customer
Loyalty Index? 184
Summary 186
Key Terms and Concepts 187
Review Questions 187
Discussion Questions 188
8 Designing the Questionnaire 190
Can Surveys Be Used to Develop
University Residence Life Plans? 191
Value of Questionnaires in
Marketing Research 192
Pilot Studies and Pretests 192
Questionnaire Design 193
Step 1: Confirm Research
Objectives 193
Step 2: Select Appropriate
Data Collection Method 194
Step 3: Develop Questions
and Scaling 194
MARKETING RESEARCH DASHBOARD:
“FRAMING” YOUR QUESTIONS CAN
INTRODUCE BIAS! 198
Step 4: Determine Layout and
Evaluate Questionnaire 203
MARKETING RESEARCH DASHBOARD:
SMART QUESTIONNAIRES
ARE REVOLUTIONIZING SURVEYS 204
Step 5: Obtain Initial
Client Approval 207
Step 6: Pretest, Revise, and
Finalize the Questionnaire 207
Step 7: Implement the Survey 207
The Role of a Cover Letter 208
MARKETING RESEARCH DASHBOARD:
COVER LETTER USED WITH THE
AMERICAN BANK SURVEY 209
Other Considerations in Collecting Data 210
Supervisor Instructions 210
Interviewer Instructions 211
Screening Questions 211
Quotas 211
Call or Contact Records 211
Marketing Research in Action 212
Designing a Questionnaire to
Survey Santa Fe Grill Customers 212
Summary 217
Key Terms and Concepts 218
Review Questions 218
Discussion Questions 218
Part 4 Data Preparation, Analysis, and Reporting the Results 219
9 Qualitative Data Analysis 220
Why Women are “Claiming
the Throttle” 221
Nature of Qualitative Data Analysis 222
Qualitative versus Quantitative Analyses 222
The Process of Analyzing
Qualitative Data 223
Managing the Data
Collection Effort 223
Step 1: Data Reduction 223
Step 2: Data Display 230
Step 3: Conclusion Drawing/
Verification 231
Writing the Report 235
Analysis of the Data/Findings 236
Conclusions and Recommendations 237
CONTINUING CASE: SANTA FE GRILL:
USING QUALITATIVE RESEARCH 238
Marketing Research in Action 239
www.MyEbookNiche.eCrater.com

Contents xvii
A Qualitative Approach to Understanding
Product Dissatisfaction 239
Summary 240
Key Terms and Concepts 241
Review Questions 242
Discussion Questions 242
Appendix A 243
Advertising’s Second Audience:
Employee Reactions to Organizational
Communications 243
10 Preparing Data for Quantitative
Analysis 246
Scanner Data Improves Understanding
of Purchase Behavior 247
Value of Preparing Data for Analysis 248
Validation 249
Editing and Coding 251
Asking the Proper Questions 251
Accurate Recording of Answers 251
Correct Screening Questions 252
Responses to Open-Ended Questions 255
The Coding Process 256
MARKETING RESEARCH DASHBOARD:
DEALING WITH DATA FROM DATA
WAREHOUSES 258
Data Entry 259
Error Detection 259
Missing Data 259
Organizing Data 261
Data Tabulation 261
One-Way Tabulation 261
Descriptive Statistics 264
Graphical Illustration of Data 264
Marketing Research in Action 267
Deli Depot 267
Summary 270
Key Terms and Concepts 271
Review Questions 271
Discussion Questions 271
11 Basic Data Analysis for Quantitative
Research 272
Data Analysis Facilitates Smarter Decisions 273
Value of Statistical Analysis 274
Measures of Central Tendency 274
MARKETING RESEARCH DASHBOARD:
SPLITTING THE DATABASE INTO SANTA
FE’S AND JOSE’S CUSTOMERS 276
SPSS Applications—Measures of
Central Tendency 276
Measures of Dispersion 277
SPSS Applications—Measures of
Dispersion 278
Preparation of Charts 281
How to Develop Hypotheses 281
MARKETING RESEARCH DASHBOARD:
STEPS IN HYPOTHESIS DEVELOPMENT
AND TESTING 282
Analyzing Relationships of
Sample Data 283
Sample Statistics and Population
Parameters 283
Choosing the Appropriate Statistical
Technique 283
Univariate Statistical Tests 286
SPSS Application—Univariate
Hypothesis Test 287
Bivariate Statistical Tests 287
Cross-Tabulation 288
MARKETING RESEARCH DASHBOARD:
SELECTING THE SANTA FE GRILL
CUSTOMERS FOR ANALYSIS 288
Chi-Square Analysis 290
Calculating the Chi-Square Value 291
SPSS Application—Chi-Square 292
Comparing Means: Independent
Versus Related Samples 293
Using the t-Test to Compare
Two Means 294
SPSS Application—Independent
Samples t-Test 295
SPSS Application—Paired
Samples t-Test 296
Analysis of Variance (ANOVA) 297
SPSS Application—ANOVA 298
n-Way ANOVA 300
SPSS Application—n-Way
ANOVA 301
Perceptual Mapping 304
Perceptual Mapping Applications
in Marketing Research 305
CONTINUING CASE STUDY:
THE SANTA FE GRILL 305
Marketing Research in Action 306
Examining Restaurant Image Positions—
Remington’s Steak House 306
Summary 313
Key Terms and Concepts 313
Review Questions 314
Discussion Questions 314
www.MyEbookNiche.eCrater.com
xviii Contents
12 Examining Relationships
in Quantitative Research 316
Data Mining Helps Rebuild Procter &
Gamble as a Global Powerhouse 317
Examining Relationships
between Variables 318
Covariation and Variable Relationships 319
Correlation Analysis 322
Pearson Correlation Coefficient 323
SPSS Application—Pearson
Correlation 323
Substantive Significance of the
Correlation Coefficient 325
Influence of Measurement Scales on
Correlation Analysis 326
SPSS Application—Spearman
Rank Order Correlation 326
What Is Regression Analysis? 327
Fundamentals of Regression Analysis 328
Developing and Estimating the
Regression Coefficients 330
SPSS Application—Bivariate
Regression 330
Significance 332
Multiple Regression Analysis 333
Statistical Significance 334
Substantive Significance 334
Multiple Regression Assumptions 335
SPSS Application—Multiple
Regression 335
What Is Structural Modeling? 339
An Example of Structural Modeling 341
Marketing Research in Action 345
The Role of Employees in Developing a
Customer Satisfaction Program 345
Summary 348
Key Terms and Concepts 349
Review Questions 349
Discussion Questions 349
13 Communicating Marketing
Research Findings 352
It Takes More than Numbers to
Communicate 353
Value of Communicating
Research Findings 354
Marketing Research Reports 354
MARKETING RESEARCH DASHBOARD:
CRITICAL THINKING AND MARKETING
RESEARCH 357
Format of the Marketing
Research Report 357
Title Page 358
Table of Contents 358
Executive Summary 358
Introduction 359
Research Methods and Procedures 360
Data Analysis and Findings 361
Conclusions and Recommendations 372
Limitations 374
Appendixes 374
Common Problems in Preparing
the Marketing Research Report 374
The Critical Nature of Presentations 375
Guidelines for Preparing Oral
Presentations 375
Guidelines for Preparing the Visual
Presentation 376
Marketing Research in Action 377
Who Are the Early Adopters of
Technology? 377
Summary 380
Key Terms and Concepts 381
Review Questions 381
Discussion Questions 381
Glossary 382
Endnotes 400
Name Index 404
Subject Index 406
www.MyEbookNiche.eCrater.com

The Role and
Value of
Marketing
Research
Information
P a r t 1
www.MyEbookNiche.eCrater.com

Marketing Research for Managerial Decision Making
C h a p t e r 1
www.MyEbookNiche.eCrater.com

Learning Objectives After reading this chapter, you will be able to:
1. Describe the impact marketing research has on marketing decision making.
2. Demonstrate how marketing research fits into the marketing planning process.
3. Provide examples of marketing research studies.
4. Understand the scope and focus of the marketing research industry.
5. Recognize ethical issues associated with marketing research.
6. Discuss new skills and emerging trends in marketing research.
Geofencing
Over the past 15 years, the Internet has sparked a number of significant innova-
tions in marketing research, from online surveys, to mobile surveys, to social
media monitoring. The newest Internet technology to influence both marketing
and marketing research may be geofencing. Geofencing is a virtual fence that is
placed around a geographic location in the real world. Location-enabled smart-
phone applications can detect entry and exit from these virtual fences. A geo-
fence can be as small as a coffee shop or as wide as a city block. Companies such
as Starbucks have used these virtual fences as a way to offer customers in-store
benefits such as ease of checkout and local in-store deals.1 In-store deals can be
customized based on the the shopper’s previous purchases or other information
available in the shopper’s profile.
For marketing researchers, geofencing offers a number of possible ways for
information to be gleaned from customers. The applications often possess the
ability to monitor purchasing behavior as well as the time of day of visits, the
number of visits, and the length of visits (often called “loitering time”).2 Perhaps
most interesting is the possibility of using geofencing to capture in-the-moment
feedback. Early research comparing surveys fielded by geofencing applications
to traditional surveys suggests that consumers more accurately report their ex-
periences immediately after they occur.3 An additional potential benefit for re-
searchers is that online browsing behavior can be matched to data on in-store
behavior.
Geofencing should be particularly helpful with collecting data from younger
customers who often do not participate in traditional surveys.4 Of course, con-
sumers must agree to turn on their location-based apps if researchers are to
collect data. On the other hand, potential research respondents can easily be of-
fered relevant rewards for participating in research based on geofencing apps.
The popularity of retail store apps that include geofencing components along
with the value of “in-context” feedback for marketers makes it likely that the use
of geofencing to collect marketing research information will grow in the next
few years.
www.MyEbookNiche.eCrater.com
4 Part 1 The Role and Value of Marketing Research Information
The Growing Complexity of Marketing Research
Technology and the growth of global business are increasing the complexity of marketing
research. Digital technologies bring a great deal of opportunities for marketing research
but create challenges as well. Internet-based tools, including web-based surveys, interac-
tive and social networking tools like Facebook and Twitter, and mobile phones are radically
remolding data collection. “Big data,” a term used to describe the large and complex
datasets that information technology enables organizations to gather and store, requires
innovative tools to extract insight for businesses and marketers. Some new techniques, such
as neuromarketing—which involves scanning the brains of research subjects while show-
ing them ads, for instance—have not yet proven themselves, and may or may not eventu-
ally provide useful insights to marketers. Many new data collection tools, including Twitter,
clickstream tracking, GPS, and geofencing, pose serious questions in regard to consumer
privacy. The current variety of available tools and techniques makes choosing a method for
a particular research project increasingly challenging. An additional level of complexity in
research design occurs whenever the research effort is global. In our first Marketing Research
Dashboard, we address issues in conducting international marketing research. Never before
has the research landscape been more complex or more exciting for marketing researchers.
Many marketing research firms have a presence in a large
number of countries. For example, Gfk Research (www
.gfk.com) advertises that it performs marketing research
in over 100 countries. Still, performing research in coun-
tries around the world poses some challenges. A great
deal of marketing theory and practice to date has been
developed in the United States. The good news is that
many theories and concepts developed to explain con-
sumer behavior are likely to be applicable to other con-
texts. For example, the idea that consumers may purchase
items that reflect their self-concepts and identities likely
applies to many countries. Second, marketing research
techniques, including sampling, data collection, qualitative
and quantitative techniques, and statistical analyses, are
tools that are likely to be almost universally applicable.
But there are many challenges. Some marketing
researchers study a country’s culture and make broad
conclusions about the applicability of their findings. How-
ever, culture may strongly affect some kinds of purchases
and not others. Second, some target segments and sub-
cultures exist across countries, so performing research
that focuses on cultural differences at the level of coun-
tries may too narrowly define a target market. Last, Yoram
Wind and Susan Douglas argue that while consumers in
different countries tend to behave somewhat differently,
there is often more variance in behavior within a coun-
try than between countries. Thus, research making broad
conclusions about consumer culture in a particular coun-
try may not be useful to a company marketing a specific
product to a specific segment. More specific research
applicable to the specific marketing opportunity or prob-
lem is likely to be necessary.
Research on emerging markets, such as Latin America,
Africa, and the Middle East, is important as these market-
places are growing, but the lack of existing secondary data
and market research suppliers in these areas of the world
presents challenges for businesses who would like to bet-
ter understand these marketplaces. Developing research
capabilities in these areas is complicated by the fact that
identifying representative samples is difficult because
existing reliable demographic data in these markets may
not be available. Translating survey items into another lan-
guage may change their meaning even when the precau-
tion of backtranslation is used to identify potential issues.
Moreover, establishing conceptual equivalence in surveys
may be difficult; for example, the Western notion of “truth”
is not applicable in the Confucian philosophy.
Building relationships with marketing research compa-
nies in the countries where firms want to collect information
is the preferred strategy as firms within countries already
have useful knowledge about research challenges and
solutions. However, marketing research is not always highly
regarded by managers in emerging marketplaces. This may
be true for several reasons. Consumer acceptance and par-
ticipation in surveys may be low. The cost of poor business
decisions may be lower and thus the perceived need for
research to minimize risk is lessened. And, researchers who
engage in both qualitative and quantitative techniques often
MARKETING RESEARCH DASHBOARD CONDUCTING INTERNATIONAL MARKETING RESEARCH
(Continued )
www.MyEbookNiche.eCrater.com

Chapter 1 Marketing Research for Managerial Decision Making 5
Despite the explosion of new marketing research tools and concepts, established tools
such as hypothesis testing, construct definition, reliability, validity, sampling, and data anal-
ysis remain essential to evaluating the uses and value of new data collection approaches.
Traditional data collection methods such as focus groups, mystery shopping, and computer-
aided telephone interviewing (CATI) are still relevant and widely used tools. Companies
increasingly are choosing hybrid research techniques involving multiple research methods
to overcome the weaknesses inherent in single methodologies.
The American Marketing Association defines marketing research as the function
that links an organization to its market through the gathering of information. This informa-
tion facilitates the identification and definition of market-driven opportunities and prob-
lems, as well as the development and evaluation of marketing actions. Finally, it enables
the monitoring of marketing performance and improved understanding of marketing as a
business process.5 Organizations use marketing research information to identify new prod-
uct opportunities, develop advertising strategies, and implement new data-gathering meth-
ods to better understand customers.
Marketing research is a systematic process. Tasks in this process include designing methods
for collecting information, managing the information collection process, analyzing and interpret-
ing results, and communicating findings to decision makers. This chapter provides an overview
of marketing research and its fundamental relationship to marketing. We first explain why firms
use marketing research and give some examples of how marketing research can help companies
make sound marketing decisions. Next we discuss who should use marketing research, and when.
The chapter provides a general description of the ways companies collect marketing
research information. We present an overview of the marketing research industry in order
to clarify the relationship between the providers and the users of marketing information.
The chapter closes with a description of the role of ethics in marketing research, followed
by an appendix on careers in marketing research.
Marketing research The
function that links an
organization to its market
through the gathering of
information.
MARKETING RESEARCH DASHBOARD CONDUCTING INTERNATIONAL MARKETING RESEARCH (Continued )
have to adjust methodology to more successfully interact
with consumers in emerging marketplaces.
Technology presents both opportunities and barriers for
international marketing research. 3Com commissioned Harris
Interactive to conduct the world’s largest interactive Internet-
based poll. Fully 1.4 million respondents in 250 countries
around the world participated in Project Planet. In many coun-
tries, respondents entered their answers in an online survey.
In remote areas without telephones and computers, interview-
ers were sent with portable handheld tablets for data entry.
When interviewers returned from the field, the data could be
uploaded to the database. In this research effort, 3Com was
able to reach even technologically disenfranchised communi-
ties. While the results were based on a convenience rather
than a representative sample, the effort still represents an
important, if imperfect global effort at collecting meaningful
cross-cultural information.
What does the future hold? Research firms and companies
who can successfully develop methods and concepts that
will aid them to better understand and serve marketplaces
around the world are likely to be more competitive in a global
marketplace. The research firms who are able to provide
actionable information will be those who study consumer
behavior in context, work with local marketing research firms
to develop sound marketing research infrastructure, apply
new technologies appropriately to collect valid and reliable
data, and develop the analytical sophistication to understand
segments within and across country boundaries.
Sources: Yoram Wind and Susan Douglas, “Some Issues in
International Consumer Research,” European Journal of Marketing,
2001, pp. 209–217; C. Samuel Craig and Susan P. Douglas,
“Conducting International marketing Research in the 21st Century,”
3rd Edition, John Wiley & Sons Ltd, Chichester, West Sussex, England
2005; B. Sebastian Reiche and Anne Wil Harzing, “Key Issues in
International Survey Research,” Harzing.com, June 26, 2007, www
.harzing.com/ intresearch_keyissues.htm, accessed August 11, 2011;
Fernando Fastoso and Jeryl Whitelock, “Why is so Little Marketing
Research on Latin America Published in High Quality Journals
and What Can We Do About It?” International Marketing Research,
2011, Vol. 28(4), pp. 435-439; Holmes, Paul “3Com’s Planet Project: An
Interactive Poll of the Human Race,” http://www.holmesreport.com
/casestudyinfo/581/3Coms-Planet-Project-An-Interactive-Poll-of
-the-Human-Race.aspx, May 28, 2011, accessed August 13, 2011.
www.MyEbookNiche.eCrater.com

6 Part 1 The Role and Value of Marketing Research Information
The Role and Value of Marketing Research
Many managers with experience in their industry can make educated guesses based on
their experience. But markets and consumer tastes change, sometimes rapidly. No matter
how much experience that managers might have with their marketplace, they occasionally
find that their educated guesses miss the mark. Behavioral decision theorists such as Dan
Ariely, author of Predictably Irrational, have documented that even experienced individu-
als can be very wrong in their decision making even when the decision they are making
has important consequences.6 And many managerial decisions involve new contexts where
experience may be absent or even misleading. For example, organizations may be consid-
ering new strategies, including marketing to a new segment, using new or evolving media
to appeal to their customers, or introducing new products.
Marketing research draws heavily on the social sciences both for methods and theory.
Thus, marketing research methods are diverse, spanning a wide variety of qualitative and
quantitative techniques and borrowing from disciplines such as psychology, sociology, and
anthropology. Marketing research can be thought of as a toolbox full of implements designed
for a wide variety of purposes. Tools include surveys, focus groups, experiments, and ethnog-
raphy, just to name a few. The size of the toolbox has grown in recent years with the advent of
“big data,” social media, Internet surveys, and mobile phones. And international marketing
problems and opportunities have brought complexity to marketing problems and opportuni-
ties along with special challenges for marketing researchers who seek to understand these
markets. The size and diversity of the toolbox represent exciting opportunities for marketing
researchers to grow and develop innovative ways of learning about markets and consumers.
Whether you work for a small, medium, or large business, it is highly likely that sooner
or later you or your organization will buy research, commission research, or even engage in
do-it-yourself (DIY) research. While some research methods involve techniques that are hard
to master in one course, the essential material in a one-semester course can take you a long
way toward being a better research client and will enable you to do some projects on your own.
You probably already know that not all research efforts are equally well executed, and
poorly conceived efforts result in information that is not useful for decision making. As
well, some secondary research may initially appear to be relevant to a decision, but after
reviewing the methodology or sample employed by the research firm, you may decide
that the research is not useful for your decision problem. Moreover, even well-executed
research has some weaknesses and must be critically evaluated. Developing the knowledge
and critical stance to evaluate research efforts will help you determine how and when to
apply the research that is available to marketing problems at hand.
Marketing research can be applied to a wide variety of problems involving the four
Ps: price, place, promotion, and product. Additionally, marketing research is often used
to research consumers and potential consumers in vivid detail, including their attitudes,
behaviors, media consumption, and lifestyles. Marketers are also interested in consumer
subcultures, as products are often used to enact and support subculture participation. Last,
marketing academics and consultants often perform theoretical research that helps mar-
keters understand questions applicable to a broad variety of marketing contexts. Below,
we explain how marketing research applies to the traditional four Ps; to studying consum-
ers and consumer subcultures; and the role of theoretical research in marketing.
Marketing Research and Marketing Mix VariablesProduct Product decisions are varied and include new product development and introduc-
tion, branding, and positioning products. New product development often involves a great
www.MyEbookNiche.eCrater.com

Chapter 1 Marketing Research for Managerial Decision Making 7
deal of research identifying possible new product opportunities, designing products that
evoke favorable consumer response, and then developing an appropriate marketing mix for
new products. Concept and product testing or test marketing provide information for deci-
sions on product improvements and new-product introductions. Concept testing identifies
any weaknesses in a product concept prior to launching a product. Product testing attempts
to answer two fundamental questions: “How does a product perform for the customer?”
and “How can a product be improved to exceed customer expectations?”
Branding is an important strategic issue both for new and existing products. Some mar-
keting firms such as Namestomers specialize in branding, both identifying possible names and
then performing consumer research to choose which name effectively communicates product
attributes or image. Even for brands with established identities, research must be undertaken
regularly to enable early detection of changes in meaning and attitudes toward a brand.
Positioning is a process in which a company seeks to understand how present or possible
products are perceived by consumers on relevant product attributes. Perceptual mapping
is a technique that is often used to picture the relative position of products on two or more
dimensions important to consumers in making their choice to purchase. To create the map,
consumers are asked to indicate how similar or dissimilar a group of relevant brands or
products is to each other. The responses are used to construct perceptual maps that transform
the positioning data into a picture or graph that shows how brands are viewed relative to
one another. Perceptual mapping reflects the criteria customers use to evaluate brands,
typically representing major product features important to customers in selecting products
or services. See Exhibit 1.1 for an example of a perceptual map of the Fast Food market.
Place/Distribution Distribution decisions in marketing include choosing and evaluating
locations, channels, and distribution partners. Retailers, including online retailers, undertake
a wide variety of studies, but some needs of retailers are unique. Market research studies
peculiar to retailers include trade area analysis, store image studies, in-store traffic patterns,
Perceptual mapping A
technique used to picture the
relative position of products
on two or more product
dimensions important to
consumer purchase
decisions.
Exhibit 1.1 Perceptual Map of the Fast Food Market
High Price
High Quality Low Quality
Starbucks
Panera
Domino’s
Pizza
McDonald’s
Subway
El Pollo
LocoBurger
King
Low Price
www.MyEbookNiche.eCrater.com

8 Part 1 The Role and Value of Marketing Research Information
and location analysis. Because retailing is a high customer-contact activity, much
retailing research focuses on database development through optical scanning at the point of
purchase. Retailers match data collected at the point of purchase with information on the
media customers consume, type of neighborhoods they live in, and the stores they prefer to
patronize. This information helps retailers select the kind of merchandise to stock and to
understand the factors that influence their customers’ purchase decisions.
Online retailers face some unique challenges and data-gathering opportunities.
E-tailers can determine when a website is visited, how long the visit lasts, which pages
are viewed, and which products are examined and ultimately purchased, and whether or
not products are abandoned in online shopping carts. Online retailers who participate in
search engine marketing have access to search analytics that help them choose keywords to
purchase from search engines. In behavioral targeting, e-tailers work with content sites to
display ads based on data collected about user behaviors. For example, Weather.com may
display ads for a specific pair of shoes that a customer has recently viewed while shopping
online at Zappos.com.
In recent years, shopper marketing has received a lot of attention. The purpose
of shopper research is “to help manufacturers and retailers understand the entire pro-
cess consumers go through in making a purchase, from prestore to in-store to point-of-
purchase.”7 Shopper marketing addresses product category management, displays, sales,
packaging, promotion, and marketing. Marketing research helps businesses to understand
when, where, and how consumers make decisions to purchase products that helps retailers
provide the right strategy at the right time to influence consumer choices.
Promotion Promotional decisions are important influences on any company’s sales. Billions
of dollars are spent yearly on various promotional activities. Given the heavy level of expen-
ditures on promotional activities, it is essential that companies know how to obtain good re-
turns from their promotional budgets. In addition to traditional media, digital media, such as
Google, YouTube, and social media such as Facebook, all present special challenges to busi-
nesses that require reliable metrics to accurately gauge the return on advertising dollars spent.
Market researchers must develop meaningful metrics and then collect the data for those met-
rics. “Analytics” is the application of statistics to quantify performance. For example, Google
analytics reports a number of statistics that measure the performance and value of a marketer’s
search engine marketing program, for example, clickthroughs and purchases.
The three most common research tasks in integrated marketing communications
are advertising effectiveness studies, attitudinal research, and sales tracking. Marketing
research that examines the performance of a promotional program must consider the total
program as each effort often affects others in the promotional mix.
Price Pricing decisions involve pricing new products, establishing price levels in test mar-
keting, and modifying prices for existing products. Marketing research provides answers to
questions such as the following:
1. How large is the demand potential within the target market at various price levels?
What are the sales forecasts at various price levels?
2. How sensitive is demand to changes in price levels?
3. Are there identifiable segments that have different price sensitivities?
4. Are there opportunities to offer different price lines for different target markets?
A pricing experiment intended to help Amazon.com choose the optimal price for DVDs is
featured in the Marketing Research Dashboard.
Retailing research Research
investigations that focus on
topics such as trade area anal-
ysis, store image/perception,
in-store traffic patterns, and
location analysis.
Behavioral targeting
Displaying ads at one
website based on the user’s
previous surfing behavior.
Shopper marketing
Marketing to consumers
based on research of the
entire process consumers
go through when making a
purchase.
www.MyEbookNiche.eCrater.com

Chapter 1 Marketing Research for Managerial Decision Making 9
Consumers and Markets
Segmentation Studies Creating customer profiles and understanding behavioral charac-
teristics are major focuses of any marketing research project. Determining why consumers
behave as they do with respect to products, brands, and media is an important goal of a great
deal of marketing research. Marketing decisions involving all four Ps are more successful
when target market demographics, attitudes, and lifestyles are clear to decision makers.
A major component of market segmentation research is benefit and lifestyle studies
that examine similarities and differences in consumers’ needs. Researchers use these studies
to identify segments within the market for a particular company’s products. The objective
is to collect information about customer characteristics, product benefits, and brand prefer-
ences. This data, along with information on age, family size, income, and lifestyle, can be
compared to purchase patterns of particular products (e.g., cars, food, electronics, financial
services) to develop market segmentation profiles. Segmentation studies are also useful for
determining how to design communications that will resonate with a target market.
While segmentation studies are useful, more detailed information may sometimes be
needed about cultures or subcultures that businesses seek to serve. Marketers may use eth-
nographic (or netnographic) research to study consumer behavior as activities embedded
in a cultural context and laden with identity and other symbolic meanings. Ethnography
requires extended observation of consumers in context. Ethnography can highlight problems
and opportunities for marketers that are based on consumers’ actual behavior. For example,
when asked about light in the operating room, surgeons said that they had plenty of light. But
when an ethnographer watched operations, he noticed that surgeons often struggled to get
enough light as they worked. As a result of this research, a company introduced a throw-away
light stick for use during operations.8 Studying consumer culture and subculture requires
immersion by trained, skillful observers. Studying consumers ethnographically broadens
businesses’ understanding of how consumers view and use products in their day-to-day lives.
Marketing TheorySome readers see the word theory and stop listening and reading. But theory is often quite
useful and relevant. Kurt Lewin, a pioneer of social, organizational, and applied psychol-
ogy famously wrote, “There is nothing so practical as a good theory.”9 The purpose of
theory is to generalize relationships between concepts in a way that is applicable to a wide
variety of business and often other settings. Thus, marketing theory is important to many
businesses. Theory is so important that many major companies are members of Marketing
Science Institute (MSI.org), which grants money to academics studying marketing prob-
lems that businesses and industry are trying to understand.
Some examples of practical theory most marketing students learn are useful in dem-
onstrating how important theory is to the field of marketing. For example, adoption and
diffusion theory (adopted from sociology) has helped marketers understand how new
products are adopted and spread through the market and the characteristics of products
and adopters that aid or inhibit adoption. Another example of useful theory comes from
services marketing research, where marketing researchers have learned that five charac-
teristics—reliability, empathy, responsiveness, assurance, and tangibles—are important to
consumers across a wide variety of services contexts. Information overload theory explains
why consumers are much more likely to purchase after sampling from a set of 6 versus
24 flavors.10 In sales research, likability, similarity, and trustworthiness are characteristics
that are linked to a salesperson’s success. These few examples show how theory can be
useful to thinking about business problems and opportunities. In Chapter 3, you will learn
about developing conceptual models.
Benefit and lifestyle studies
Examine similarities and
differences in consumers’
needs. Researchers use
these studies to identify two
or more segments within
the market for a particular
company’s products.
www.MyEbookNiche.eCrater.com

10 Part 1 The Role and Value of Marketing Research Information
The Marketing Research Industry
The marketing research industry has experienced unparalleled growth in recent years.
According to an Advertising Age study, revenues of U.S. research companies have grown
substantially in recent years.11 The growth in revenues of international research firms has
been even more dramatic. Marketing research firms have attributed these revenue increases
to postsale customer satisfaction studies (one-third of research company revenues), retail-
driven product scanning systems (also one-third of all revenues), database development for
long-term brand management, and international research studies.
Types of Marketing Research FirmsMarketing research providers can be classified as either internal or external, custom or
standardized, or brokers/facilitators. Internal research providers are typically organiza-
tional units that reside within a company. For example, IBM, Procter & Gamble, Kraft
Foods, and Kodak all have internal marketing research departments. Kraft Foods and other
firms enjoy many benefits by keeping the marketing research function internal. These ben-
efits include research method consistency, shared information across the company, lower
research costs, and ability to produce actionable research results.
Other firms choose to use external sources for marketing research. External sources,
usually referred to as marketing research suppliers, perform all aspects of the research,
including study design, questionnaire production, interviewing, data analysis, and report
preparation. These firms operate on a fee basis and commonly submit a research proposal
to be used by a client for evaluation and decision purposes. An example of a proposal is
provided in the Marketing Research in Action at the end of Chapter 2.
Many companies use external research suppliers because the suppliers can be more
objective and less subject to company politics and regulations than internal suppliers.
E-tailing presents almost the perfect opportunity for a mar-
ket research project testing the price elasticity of prod-
ucts. For example, Amazon.com ran a large-scale pricing
experiment for several DVDs offered for sale on its website.
Customers received random prices (reflecting discounts
between 20 and 40 percent) on 68 DVDs when they visited
Amazon’s site. While the differences were mostly only a
few dollars, for a few titles, the price differences were much
larger. For example, consumers purchasing The X-Files:
The Complete Second Season paid prices ranging from
$89.99 to $104.99 for a DVD set with a list price of $149.99.
The experimental methodology used by Amazon to
determine the optimal price is standard and is widely
used both in online and offline settings. Consumers are
randomly offered different prices. Then the retailer col-
lects sales data to determine which price performs best.
The problem for Amazon was that the giant is both large
and online where consumers can easily share information.
Consumers got together and learned they paid different
prices for the same DVD on the same day. For example,
the E-commerce Times reported that when they checked
the price for the DVD Mission Impossible it was $17.99, but
several hours later the price was $20.99.
Consumers were outraged and accused Amazon of
deceptive pricing policies. As a result, Amazon apologized,
admitted they had made a mistake, and agreed to give
back the difference between the price paid on any of the
affected DVDs and the lowest possible price offered. As
a result, Amazon refunded an average of $3.10 to 6,896
customers. Even the best-laid plans for marketing research
studies can sometimes create problems.
Sources: Lori Enos, “Amazon Apologizes for Pricing Blunder.”
E-commerce Times, September 28, 2000, www.ecommercetimes
.com/story/4411.html; Keith Regan, “Amazon’s Friendly Deception,”
E-commerce Times, September 18, 2000, www.eccomercetimes
.com/story/4310.html, accessed August 13, 2011; Troy Wolverton,
“Amazon Backs Away from Test Prices,” September 12, 2000, news.
cnet.com/2100-1017-245631.html, accessed August 13, 2011.
MARKETING RESEARCH DASHBOARD THE PERFECT PRICING EXPERIMENT?
www.MyEbookNiche.eCrater.com

Chapter 1 Marketing Research for Managerial Decision Making 11
Also, many external suppliers provide specialized talents that, for the same cost, inter-
nal suppliers could not provide. And finally, companies can choose external suppliers on
a study-by-study basis and thus gain greater flexibility in scheduling studies as well as
match-specific project requirements to the talents of specialized research firms.
Marketing research firms also provide research that is customized or standard-
ized. Customized research firms provide specialized, highly tailored services to the
client. Many customized research firms concentrate their activities in one specific
area such as brand-name testing, test marketing, or new-product development. For
example, Namestormers assists companies in brand-name selection and recognition;
Survey Sampling Inc., which recently added mobile sampling to its portfolio, con-
centrates solely on sample development; and Retail Diagnostics Inc. specializes in
collecting research in store environments. In contrast, standardized research firms
provide more general services. These firms also follow an established, common
approach in research design so the results of a study conducted for one client can
be compared to norms from studies done for other clients. Examples of these firms
are Burke Market Research, which conducts day-after advertising recall; AC Nielsen
(separate from Nielsen Media Research), which conducts store audits for a variety
of retail firms; and Arbitron Ratings, which provides primary data collection on
radio audiences.
Many standardized research firms also provide syndicated business services,
which include the purchase of diary panels, audits, and advertising recall data made
or developed from a common data pool or database. A prime example of a syndicated
business service is a database established through retail optical scanner methods. This
database, available from AC Nielsen, tracks the retail sales of thousands of brand-name
products. The data can be customized for a variety of industries (e.g., snack foods,
over-the-counter drugs, or cars) to indicate purchase profiles and volume sales in a
given industry.
Changing Skills for a Changing IndustryMarketing research employees represent a vast diversity of cultures, abilities, and person-
alities. As marketing research firms expand their geographic scope to Europe, Asia, and
the Pacific Rim, the requirements for successfully executing marketing research projects
will change dramatically. Many fundamental skill requirements will remain in place, but
new and innovative practices will require a unique skill base that is more comprehensive
than ever before. Individuals who are logical and perceptive about human emotions find
marketing research to be a rewarding career.
In a survey of 100 marketing research executives, fundamental business skills were
rated high for potential employees. Communication skills (verbal and written), inter-
personal skills (ability to work with others), and statistical skills were the leading attri-
butes in job aptitude.12 More specifically, the top five skills executives hope to find
in candidates for marketing research positions are (1) the ability to understand and
interpret secondary data, (2) presentation skills, (3) foreign-language competency,
(4) negotiation skills, and (5) information technology proficiency.13 In addition to quan-
titative, teamwork, and communication skills, the Bureau of Labor Statistics empha-
sizes the importance of being detail oriented, patient, and persistent for market and
survey researchers.14 In the future, analyzing existing databases, multicultural interac-
tion, and negotiation are likely to be important characteristics of marketing research-
ers. Marketing research jobs are discussed further in the careers appendix at the end of
this chapter.
Customized research
firms Research firms that
provide tailored services
for clients.
Standardized research
firms Research firms that
provide general results fol-
lowing a standard format so
that results of a study con-
ducted for one client can
be compared to norms.
Syndicated business
services Services provided
by standardized research
firms that include data
made or developed from
a common data pool or
database.
www.MyEbookNiche.eCrater.com
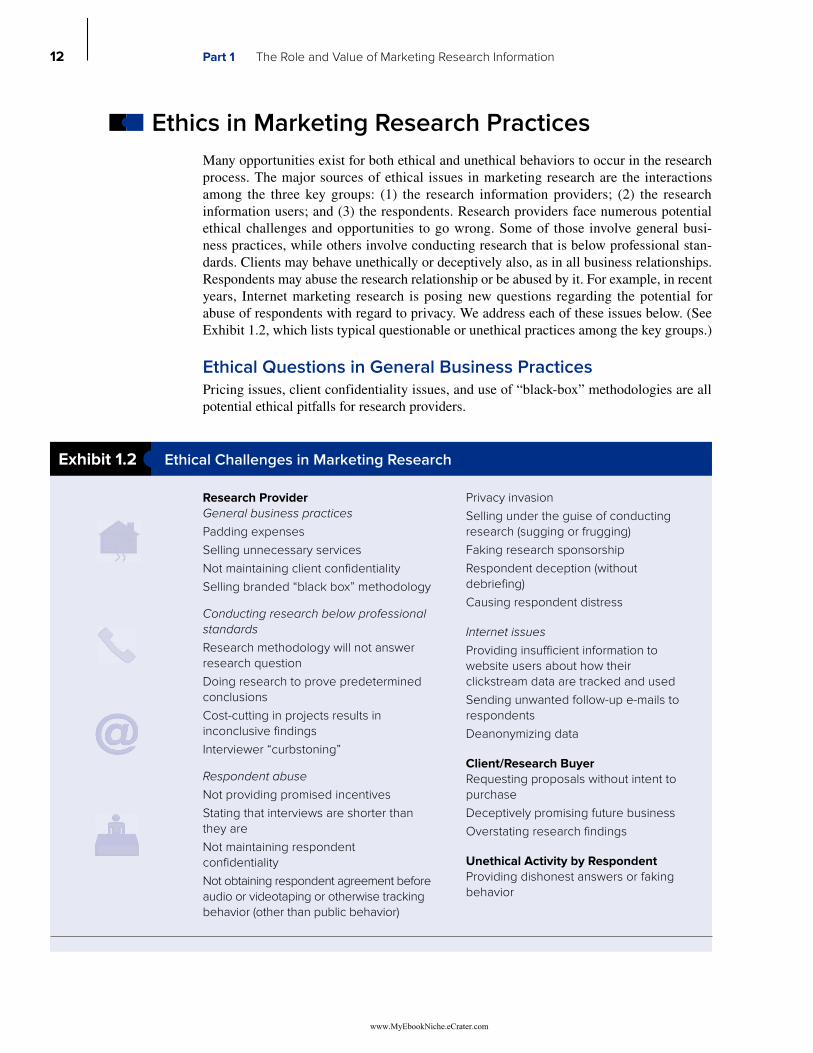
12 Part 1 The Role and Value of Marketing Research Information
Ethics in Marketing Research Practices
Many opportunities exist for both ethical and unethical behaviors to occur in the research
process. The major sources of ethical issues in marketing research are the interactions
among the three key groups: (1) the research information providers; (2) the research
information users; and (3) the respondents. Research providers face numerous potential
ethical challenges and opportunities to go wrong. Some of those involve general busi-
ness practices, while others involve conducting research that is below professional stan-
dards. Clients may behave unethically or deceptively also, as in all business relationships.
Respondents may abuse the research relationship or be abused by it. For example, in recent
years, Internet marketing research is posing new questions regarding the potential for
abuse of respondents with regard to privacy. We address each of these issues below. (See
Exhibit 1.2, which lists typical questionable or unethical practices among the key groups.)
Ethical Questions in General Business PracticesPricing issues, client confidentiality issues, and use of “black-box” methodologies are all
potential ethical pitfalls for research providers.
Exhibit 1.2 Ethical Challenges in Marketing Research
Research Provider
General business practices
Padding expenses
Selling unnecessary services
Not maintaining client confidentiality
Selling branded “black box” methodology
Conducting research below professional
standards
Research methodology will not answer
research question
Doing research to prove predetermined
conclusions
Cost-cutting in projects results in
inconclusive findings
Interviewer “curbstoning”
Respondent abuse
Not providing promised incentives
Stating that interviews are shorter than
they are
Not maintaining respondent
confidentiality
Not obtaining respondent agreement before
audio or videotaping or otherwise tracking
behavior (other than public behavior)
Privacy invasion
Selling under the guise of conducting
research (sugging or frugging)
Faking research sponsorship
Respondent deception (without
debriefing)
Causing respondent distress
Internet issues
Providing insufficient information to
website users about how their
clickstream data are tracked and used
Sending unwanted follow-up e-mails to
respondents
Deanonymizing data
Client/Research Buyer
Requesting proposals without intent to
purchase
Deceptively promising future business
Overstating research findings
Unethical Activity by Respondent
Providing dishonest answers or faking
behavior
www.MyEbookNiche.eCrater.com

Chapter 1 Marketing Research for Managerial Decision Making 13
First, the research firm may engage in unethical pricing. For example, after quoting
a fixed overall price for a proposed research project, the researcher may tell the decision
maker that variable-cost items such as travel expenses, monetary response incentives, or
fees charged for computer time are extra, over, and above the quoted price. Such “soft”
costs can be easily used to pad the total project cost. Another unethical practice found all
too often in marketing research is the selling of unnecessary or unwarranted research ser-
vices. While it is perfectly acceptable to sell follow-up research that can aid the decision
maker’s company, selling nonessential services is unethical.
Research firms are required to maintain client confidentiality. This requirement can
be a challenge for firms that specialize in industries (e.g., cars) and regularly collect data
about various competitors and the industry in general. Occasionally, a new client may ask
for a study very similar to one recently conducted for another client. It may be tempting to
simply share the previous results, but those results belong to another client.
A common practice among research firms is selling branded “black-box”
methodologies. These branded techniques are quite varied and include proprietary scaling,
sampling, sample correction, data collection methods, market segmentation, and special-
ized indexes (e.g., customer satisfaction, loyalty, or quality indexes). Some techniques that
are branded do involve sufficient disclosure, so a methodology is not a black box just
because it is branded. Methodologies are called black-box methodologies when they are
propri etary, and research firms will not fully disclose how the methodology works.
While the desire to maintain a proprietary technique is understandable, without access
to the inner workings of the technique, research buyers and others cannot assess its valid-
ity. Of course, no one forces clients to choose black-box methodologies. If clients are
unable to get sufficient insight into the method’s strengths and weaknesses prior to pur-
chase, they can choose other suppliers.
Conducting Research Not Meeting Professional StandardsResearch providers may occasionally conduct research that does not meet professional
standards. For example, a client may insist that a research firm use a particular method-
ology even though the research firm feels the methodology will not answer the research
question posed by the client. Fearful of losing the business entirely, a firm may go along
with their client’s wishes. Or a research provider may agree to do a study even though the
firm does not have the expertise to conduct the kind of study needed by the client. In this
case, the client should be referred to another research provider.
Another unethical situation may arise because of client pressure to perform research
to prove a predetermined conclusion. If researchers consciously manipulate the research
methodology or reporting to present a biased picture just to please a client, they are engag-
ing in unethical behavior.
One additional pressure that may result in unprofessional research efforts is cost-
cutting. A client may not provide a sufficient budget to do a research project that will
provide useful information. For example, cost-cuts could result in sample size reductions.
As a result, the findings may have large margins of error (e.g., +/−25 percent). The pro-
vider should advise the client that the results are likely to provide unreliable results before
engaging in the research.
Interviewers working for research firms may also engage in unethical behavior. A practice
of falsifying data known to many researchers and field interviewers is called curbstoning, or
rocking-chair interviewing. Curbstoning occurs when the researcher’s trained interviewers or
observers, rather than conducting interviews or observing respondents’ actions as directed in the
study, will complete the interviews themselves or make up “observed” respondents’ behaviors.
Curbstoning Data
collection personnel
filling out surveys for fake
respondents.
Branded “black-box”
methodologies
Methodologies
offered by research firms
that are branded and do
not provide information
about how the methodol-
ogy works.
www.MyEbookNiche.eCrater.com

14 Part 1 The Role and Value of Marketing Research Information
Other data falsification practices include having friends and relatives fill out surveys, not using
the designated sample of respondents but rather anyone who is conveniently available to com-
plete the survey, or not following up on the established callback procedures indicated in the
research procedure. To minimize the likelihood of data falsification, research companies typi-
cally randomly verify 10 to 15 percent of the interviews through callbacks.
Abuse of RespondentsIn addition to unethical general business practices and research conducted below profes-
sional standards, abuse of respondents can be a problem. There are several potential ways
to abuse respondents in marketing research. Research firms may not provide the promised
incentive (contest awards, gifts, or money) to respondents for completing interviews or
questionnaires. A second way to abuse respondents is to state that interviews are very short
when in reality they may last an hour or more. Respondents are also abused if research firms
use “fake” sponsors. Clients sometimes fear that identification of the sponsor will affect
respondent answers to research questions. While a research firm does not have to reveal its
client to respondents, it is nevertheless unethical to create fake sponsors for a study.
Occasionally, it may be necessary to deceive consumers during a study. For example,
an experimental study induced consumer variety seeking by having subjects read a “scien-
tific study” claiming that changing hair products frequently improves hair health and clean-
liness. At the end of any study involving deception, subjects must be “debriefed” and the
deception must be explained. Importantly, in no case can respondents be psychologically
or physically harmed. An egregious example of doing harm was a study of complaint han-
dling in which a researcher sent letters to restaurant owners stating that he and his wife had
been food poisoned at their establishment on their anniversary. Restaurant owners receiv-
ing the letters were deceived in a manner that caused them undue concern and anxiety.
Researchers typically promise respondents anonymity to encourage cooperation and
honesty in their responses. Respondents’ confidentiality is breached if their names are
shared with the sponsoring company for sales follow-up or if respondents’ names and
demographic data are given to other companies without their approval. In fact, some
“research” is conducted for the purpose of collecting names. This practice, known as
sugging or frugging, is completely unethical and has a negative impact on the entire
industry because it leads to consumers turning down legitimate research inquiries
because they do not want to be solicited.
Market researchers should not invade customer privacy. While public behavior may be
audiotaped or videotaped without prior agreement, behavior in private, including during research
interviews, may not be taped without respondents’ consent. This issue is even more complicated
and controversial in online settings where consumer behavior is digitally tracked (e.g., in click-
stream analysis) and conversations about the company and its products are collected and analyzed.
Are the online research methods that track consumers without their consent unethi-
cal even when the behavior being tracked is in some sense public and all identifiers are
removed from the data stream? What about the use of “cookies,” the digital identification
files that are placed on individuals’ computers by websites and used to collect information
about behavior and interests so that advertising and content may be adjusted to consumer
needs? While cookies are usually designed to maintain consumer privacy with respect to
identity at least, they still nevertheless collect and utilize consumer data. Doubleclick, a
business that serves ads to websites all over the Internet, has received a great deal of scru-
tiny from privacy advocates over the years. Doubleclick uses cookies that collect informa-
tion from Internet surfers across all the websites it serves and is thus able to assemble a
great deal of information about individual (unidentified) consumers.
Subject debriefing Fully
explaining to respondents
any deception that was
used during research.
Sugging/frugging Claiming
that a survey is for research
purposes and then asking
for a sale or donation.
www.MyEbookNiche.eCrater.com

Chapter 1 Marketing Research for Managerial Decision Making 15
The Marketing Research Association (MRA) has developed guidelines for Internet
marketing research issues. The MRA suggests that websites post a privacy policy to explain
how data are used. Similarly, researchers must discontinue follow-up e-mails if requested
to by respondents. Recently, researchers have shown that it is possible to “deanonymize”
information on the Internet by combining different publicly available records available at social
networks.15 The MRA guidelines prohibit market researchers from deanonymizing data.
MRA guidelines do allow clickstream tracking. But as with other public behavior, online
actions may be observed but any identifying information must be removed from the
data file. Other digital technologies such as GPS also result in privacy-related issues (see
Marketing Research Dashboard on p. 15).
Unethical Activities of the Client/Research UserOpportunities for unethical behavior also confront the client or decision maker who
requires research data. One such unethical behavior is decision makers requesting detailed
research proposals from several competing research providers with no intention of actually
selecting a firm to conduct the research. In this case, the “clients” solicit the proposals for
the purpose of learning how to conduct the necessary marketing research themselves. They
obtain first drafts of questionnaires, suggested sampling frames and sampling procedures,
and knowledge on data collection procedures. Then, unethically, they may use the informa-
tion to either perform the research project themselves or bargain for a better price among
interested research companies.
Unfortunately, another common behavior among unethical decision makers at firms
requiring marketing research information is promising a prospective research provider a
long-term relationship or additional projects in order to obtain a very low price on the
initial research project. Then, after the researcher completes the initial project, the client
forgets about the long-term promises.
Clients may also be tempted to overstate results of a marketing research project. They
may claim, for instance, that consumers prefer the taste of their product when in actual test-
ing, the difference between products was statistically insignificant, even if slightly higher
for the sponsoring firm’s products.
Deanonymizing data
Combining different
publicly available
information, usually
unethically, to determine
consumers’ identities,
especially on the Internet.
Research and Data Privacy: The ChallengeAre there ethical dimensions to GPS as a research tool?
Acme Rent-A-Car of New Haven, Connecticut, placed
GPS units on all its rental cars. Thus, the rent-a-car com-
pany knows every place a customer goes. Not only do
they know where you stop, but how fast you drive on
the way there. Acme began sending their customers
speeding tickets based on GPS tracking. Eventually
a customer sued, alleging that Acme was violating a
driver’s privacy. Thus far, the courts have ruled in the
customer’s favor.
Insurance companies also are using GPS technology.
What can they find out? They can learn whether you drive
at night or on interstate highways, both of which are more
dangerous, whether and how often you exceed the speed
limit or run stop signs, or whether you stop at a bar on
the way home and how long you stay there. Thus, not
only can they research driving behavior much better than
they could in the past, but are also able to address issues
related to pricing. For example, GPS systems used by Pro-
gressive Insurance have resulted in drastically reduced
rates for some customers and substantially increased
rates for others. Drive less, as shown by the GPS, and you
pay less. Drive within the speed limit, and you pay less.
Just fair isn’t it? But some consumer advocates argue that
this is a violation of people’s right to privacy.
Sources: Annette Cardwell, “Building a Better Speed Trap,”
Smartbusiness.com, December/January 2002, p. 28; Ira Carnahan,
“Insurance by the Minute,” Forbes, December 11, 2000, p. 86;
Will Wade, “Insurance Rates Driven by GPS,” Wired, October 3, 2003.
MARKETING RESEARCH DASHBOARD
www.MyEbookNiche.eCrater.com

16 Part 1 The Role and Value of Marketing Research Information
Unethical Activities by the RespondentThe primary unethical practice of respondents or subjects in any research endeavor is
providing dishonest answers or faking behavior. The general expectation in the research
environment is that when a subject has freely consented to participate, she or he will pro-
vide truthful responses.
Research respondents frequently provide untrue answers when they must answer ques-
tions related to their income or to their indulgence in certain sensitive types of behavior
such as alcohol consumption or substance abuse.
Consumers may have the prospect of earning money by participating in marketing
research surveys and focus groups. To be able to participate in more surveys or groups,
would-be respondents may lie to try to match the characteristics that screeners are seeking.
For example, potential participants may say they are married when they are not, or may say
they own a Toyota, even though they do not. But the reason marketing researchers pay focus
group or survey participants is that their research requires them to talk to a specific type of
participant. Lying by respondents to make money from participating in marketing research is
unethical. Worse than that from the researcher’s point of view, it undermines the validity of
the research.
Marketing Research Codes of EthicsMany marketing research companies have established internal company codes of
ethics derived from the ethical codes formulated by larger institutions that gov-
ern today’s marketing research industry. The Code of Ethics for the American
Marketing Association applies to all marketing functions, including research, and
can be viewed at www.marketingpower.com. ESOMAR, the world organiza-
tion for enabling better research into markets, consumers, and societies, publishes a
marketing research code of ethics on their website at www.esomar.org. The Mar-
keting Research Society summarizes the central principles in ESOMAR’s code
as follows:16
1. Market researchers will conform to all relevant national and international laws.
2. Market researchers will behave ethically and will not do anything that might damage
the reputation of market research.
3. Market researchers will take special care when carrying out research among children
and other vulnerable groups of the population.
4. Respondents’ cooperation is voluntary and must be based on adequate, and not mis-
leading, information about the general purpose and nature of the project when their
agreement to participate is being obtained and all such statements must be honored.
5. The rights of respondents as private individuals will be respected by market research-
ers, and they will not be harmed or disadvantaged as the result of cooperating in a
market research project.
6. Market researchers will never allow personal data they collect in a market research
project to be used for any purpose other than market research.
7. Market researchers will ensure that projects and activities are designed, carried out,
reported and documented accurately, transparently, objectively, and to appropriate
quality.
8. Market researchers will conform to the accepted principles of fair competition.
www.MyEbookNiche.eCrater.com

Chapter 1 Marketing Research for Managerial Decision Making 17
Emerging Trends
The general consensus in the marketing research industry is that five major trends are
becoming evident: (1) increased emphasis on secondary data collection methods;
(2) movement toward technology-related data management (optical scanning data, database
technology, customer relationship management); (3) expanded use of digital technology
for information acquisition and retrieval; (4) a broader international client base; and
(5) movement beyond data analysis toward a data interpretation/information management
environment.
The organization of this book is consistent with these trends. Part 1 (Chapters 1 and 2)
explores marketing research information and technology from the client’s perspective,
including how to evaluate marketing research projects. Part 2 (Chapters 3–5) provides an
innovative overview of the emerging role of secondary data, with emphasis on technology-
driven approaches for the design and development of research projects. The chapters in
Part 2 also discuss traditional marketing research project design issues (survey methods
and research designs) as well as collection and interpretation of qualitative data including
research techniques emerging in social media environments.
Part 3 of the book (Chapters 6–8) covers sampling, attitude measurement and scaling,
and questionnaire design. The impact of growing online data collection on these issues is
explained. Part 4 (Chapters 9–13) prepares the reader for management, categorization, and
analysis of marketing research data, both qualitative and quantitative. A chapter on analyzing
qualitative data explains the basic approach to carrying out this type of analysis. Computer
applications of statistical packages give readers a hands-on guide to analyzing quantitative
data. Part 4 concludes by showing how to effectively present marketing research findings.
Each chapter in the book concludes with a feature called “Marketing Research in
Action.” The goal of the examples and illustrations in the Marketing Research in Action
feature is to facilitate the student’s understanding of chapter topics and especially to pro-
vide the reader with a “how-to” approach for marketing research methods.
To illustrate marketing research principles and con-
cepts in this text, we have prepared a case study
that will be used throughout most of the chap-
ters in the book. The case study looks at the Santa
Fe Grill Mexican Restaurant, which was started
18 months ago by two former business students at the
University of Nebraska, Lincoln. They had been room-
mates in college and both had an entrepreneurial desire.
After graduating, they wanted to start a business instead
of working for someone else. The two owners used
research to start their business and to make it prosper.
The Marketing Research in Action that concludes this
chapter provides more details about this continuing case.
Exercises relating to the continuing case about the Santa
Fe Grill are included in each chapter either in the body of
the chapter or in the Marketing Research in Action feature.
For example, Chapter 3 has a secondary data assign-
ment. When sampling is discussed in Chapter 6, different
sampling approaches are evaluated, and we point out
sample size issues for the Santa Fe Grill as well as why
the research company recommended exit interviews. Simi-
larly, the questionnaire used to collect primary data for this
continuing case is given in Chapter 8 to illustrate measure-
ment and questionnaire design principles. In all the data
analysis chapters, we use the continuing case study data
to illustrate statistical software and the various statistical
techniques for analyzing data. The focus on a single case
study of a typical business research problem will enable
you to more easily understand the benefits and pitfalls of
using research to improve business decision making.
CONTINUING CASE STUDY: THE SANTA FE GRILL MEXICAN RESTAURANT
www.MyEbookNiche.eCrater.com

18 Part 1 The Role and Value of Marketing Research Information
MARKETING RESEARCH IN ACTIONContinuing Case: The Santa Fe Grill
The Santa Fe Grill Mexican restaurant was started 18 months ago by two former business
students at the University of Nebraska, Lincoln. They had been roommates in college and
both wanted to become entrepreneurs. After graduating they wanted to start a business
instead of working for someone else. The students worked in restaurants while attending
college, both as waiters and one as an assistant manager, and believed they had the knowl-
edge and experience necessary to start their own business.
During their senior year, they prepared a business plan in their entrepreneurship
class for a new Mexican restaurant concept. They intended to start the restaurant in
Lincoln, Nebraska. After a demographic analysis of that market, however, they decided
that Lincoln did not match their target demographics as well as they initially thought
it would.
After researching the demographic and competitive profile of several markets, they
decided Dallas, Texas, would be the best place to start their business. In examining the
markets, they were looking for a town that would best fit their target market of singles and
families in the age range of 18 to 50. The population of Dallas was almost 5.5 million peo-
ple, of which about 50 percent were between the ages of 25 and 60. This indicated there
were a lot of individuals in their target market in the Dallas area. They also found that about
55 percent of the population earns between $35,000 and $75,000 a year, which indi-
cated the market would have enough income to eat out regularly. Finally, 56 percent
of the population was married, and many of them had children at home, which was
consistent with their target market. More detailed demographic information for the area
is shown below.
The new restaurant concept was based upon the freshest ingredients, complemented
by a festive atmosphere, friendly service, and cutting-edge advertising and marketing strat-
egies. The key would be to prepare and serve the freshest “made-from-scratch” Mexican
foods possible. Everything would be prepared fresh every single day. In addition to their
freshness concept, they wanted to have a fun, festive atmosphere, and fast, friendly service.
The atmosphere would be open, brightly lit, and bustling with activity. Their target market
would be mostly families with children, between the ages of 18 and 49. Their marketing
programs would be memorable, with the advertising designed to provide an appealing,
slightly offbeat positioning in the market.
The Santa Fe Grill was not successful as quickly as the owners had anticipated.
To improve the restaurant operations, the owners needed to understand what aspects
of the restaurant drive customer satisfaction and loyalty, and where they were falling
short in serving their customers. So they decided to conduct three surveys. One was
designed to obtain information from current customers of the Santa Fe Grill. A second
survey would collect information from customers of their primary competitor, Jose’s
Southwestern Café. The third survey was designed to collect data from the employees
who worked for the Santa Fe Grill. They believed the employee survey was impor-
tant because employee experiences might be affecting how customers evaluated the
restaurant.
The Santa Fe Grill was located on an outparcel on the east side near the main
entrance of the Cumberland Mall. The mall has 75 or more stores and is considered
very successful for the area. A market research company was located in the mall so they
www.MyEbookNiche.eCrater.com

Chapter 1 Marketing Research for Managerial Decision Making 19
decided to use a mall intercept approach to collect customer data. Another Mexican res-
taurant that had been in business longer and appeared to be more successful was also on
an outparcel at the same mall, but its location was on the west side of the mall. The goal
was to complete interviews with 250 individuals who had recently eaten at the Santa
Fe Grill and 150 diners who had recently eaten at Jose’s Southwestern Café. Addition-
ally, employees of the Santa Fe Grill were asked to log on to a website to complete the
employee survey.
Over a period of two weeks, a total of 405 customer interviews were completed—
152 for Jose’s and 253 for the Santa Fe Grill. Of the employee survey, 77 questionnaires
were completed. The owners believe the surveys will help them to identify the restaurant’s
strengths and weaknesses, enable them to compare their restaurant to a nearby competitor,
and develop a plan to improve the restaurant’s operations.
Selected Demographics for Geographic Area (10-mile radius of Santa Fe Grill)
Households by Type Number Percent
Total households 452,000 100
Family households 267,000 59
With children under 18 years 137,000 30
Non-Family households 185,000 41
Householder living alone 148,850 33
Householder 65 years and over 29,570 7
Households with individuals under 18 years 157,850 35
Households with individuals 65 years and over 74,250 16
Average household size 2.6 people
Average family size 3.4 people
Gender and Age Number Percent
Male 599,000 51
Female 589,000 49
Total 1,188,000
Under 20 years 98,800 29
20 to 34 years 342,000 29
35 to 44 years 184,000 16
45 to 54 years 132,500 11
55 to 59 years 44,250 4
60 years and over 13,000 11
Median Age (years) 32
18 years and over 873,000 74
Hands-On Exercise1. Based on your understanding of Chapter 1, what kind of information about products,
services, and customers should the owners of Santa Fe Grill consider collecting?
2. Is a research project actually needed? Is the best approach a survey of customers?
Should employees also be surveyed? Why or why not?
www.MyEbookNiche.eCrater.com

20 Part 1 The Role and Value of Marketing Research Information
Summary
Describe the impact marketing research has on mar-
keting decision making.
Marketing research is the set of activities central to all
marketing-related decisions regardless of the complexity
or focus of the decision. Marketing research is respon-
sible for providing managers with accurate, relevant,
and timely information so that they can make market-
ing decisions with a high degree of confidence. Within
the context of strategic planning, marketing research
is responsible for the tasks, methods, and procedures a
firm will use to implement and direct its strategic plan.
Demonstrate how marketing research fits into the
marketing planning process.
The key to successful planning is accurate information—
information related to product, promotion, pricing, and
distribution. Marketing research also helps organizations
better understand consumers and markets. Last, market-
ing research is used to develop theory that is useful in a
broad range of marketing problems.
Provide examples of marketing research studies.
Marketing research studies support decision making for
all marketing mix variables as well as providing infor-
mation about markets and cultures. Examples of research
studies include concept and product testing; perceptual
mapping; trade area analysis, store image studies, in-
store traffic pattern studies, and location analysis; shop-
per marketing research; advertising effectiveness studies,
attitude research and sales tracking; pricing studies for
new and existing products; segmentation and consumer
culture studies; and marketing theory development.
Understand the scope and focus of the marketing
research industry.
Generally, marketing research projects can be conducted
either internally by an in-house marketing research staff
or externally by independent or facilitating marketing
research firms. External research suppliers are normally
classified as custom or standardized, or as brokers or
facilitators.
Recognize ethical issues associated with marketing
research.
Ethical decision making is a challenge in all industries,
including marketing research. Ethical issues in market-
ing research occur for the research information user, the
research information provider, and the selected respon-
dents. Specific unethical practices among research
providers include unethical general business practices,
conducting research below professional standards,
respondent abuse, and issues specific to the Internet
such as violation of privacy. Unethical behavior by
clients includes requesting research proposals with no
intent to follow through, promising more business that
never materializes to secure low-cost research services,
and exaggerating research findings. Respondents can
be unethical when they provide dishonest answers or
fake behavior.
Discuss new skills and emerging trends in marketing
research.
Just as the dynamic business environment causes firms
to modify and change practices, so does this changing
environment dictate change to the marketing research
industry. Specifically, technological and global changes
will affect how marketing research will be conducted in
the future. Necessary skills required to adapt to these
changes include (1) the ability to understand and inter-
pret secondary data, (2) presentation skills, (3) for-
eign-language competency, (4) negotiation skills, and
(5) information technology proficiency.
Key Terms and Concepts
Behavioral targeting 8
Benefit and lifestyle studies 9
Branded “black-box” methodologies 13
Curbstoning 13
Customized research firms 11
Deanonymizing data 15
Marketing research 5
Perceptual mapping 7
Retailing research 8
Shopper marketing 8
www.MyEbookNiche.eCrater.com

Chapter 1 Marketing Research for Managerial Decision Making 21
Standardized research firms 11
Subject debriefing 14
Sugging/frugging 14
Syndicated business services 11
Review Questions
1. What is the role of marketing research in organizations?
2. What improvements in retailing strategy might be at-
tributed to the results obtained from shopper market-
ing studies?
3. Discuss the importance of segmentation research.
How does it affect the development of market plan-
ning for a particular company?
4. What are the advantages and disadvantages for com-
panies maintaining an internal marketing research
department? What advantages and disadvantages can
be attributed to the hiring of an external marketing
research supplier?
5. As the marketing research industry expands, what
skills will future executives need to possess? How
do these skills differ from those currently needed
to function successfully in the marketing research
field?
6. Identify the three major groups of people involved in
the marketing research process, and then give an ex-
ample of an unethical behavior sometimes practiced
by each group.
7. Sometimes respondents claim they are something
they are not (e.g., a Toyota owner or a married
person) so they will be selected to participate in
a focus group. Sometimes respondents do not ac-
curately reflect their personal income. Is it always
unethical for a respondent to lie on a survey? Why
or why not?
Discussion Questions
1. EXPERIENCE MARKETING RESEARCH. Go
online to one of your favorite search engines (Yahoo!,
Google, etc.) and enter the following search term: mar-
keting research. From the results, access a directory of
marketing research firms. Select a particular firm and
comment on the types of marketing research studies
it performs.
2. EXPERIENCE MARKETING RESEARCH.
Use Google to find a local marketing research firm.
E-mail that company and ask to have any job descrip-
tions for positions in that company e-mailed back to
you. Once you obtain the descriptions, discuss the
particular qualities needed to perform each job.
3. You have been hired by McDonald’s to lead a mys-
tery shopper team. The goal of your research is to
improve the service quality at the McDonald’s res-
taurant in your area. What attributes of service qual-
ity will you attempt to measure? What customer or
employee behaviors will you closely monitor?
4. Contact a local business and interview the owner/
manager about the types of marketing research per-
formed for that business. Determine whether the
business has its own marketing research department
or if it hires an outside agency. Also, determine
whether the company takes a one-shot approach
to particular problems or is systematic over a long
period of time.
5. EXPERIENCE MARKETING RESEARCH. As
the Internet has grown as a medium for conducting
various types of marketing research studies, there is
growing concern about ethical issues. Identify and
discuss three ethical issues pertinent to research con-
ducted using the Internet.
Now go to the Internet and validate your
ethical concerns. Check out ESOMAR’s website
(ESOMAR.org) and search for ethical issues related
to the Internet. What unethical practices are possible
in Internet research?
www.MyEbookNiche.eCrater.com

22
Appendix A
Careers in Marketing Research with a Look at Federal Express
Career opportunities in marketing research vary by industry, company, and size of company. Different posi-
tions exist in consumer products companies, industrial goods companies, internal marketing research depart-
ments, and professional marketing research firms. Marketing research tasks range from the very simple, such
as tabulation of questionnaires, to the very complex, such as sophisticated data analysis. Exhibit A.1 lists some
common job titles and the functions as well as compensation ranges for marketing research positions.
Exhibit A.1 Marketing Research Career Outline
Compensation Range
Position* Duties (Annual, in Thousands)
Director, research
and analytical
services
Statistician
Research analyst
Senior research
manager
Project director
Librarian
Administrative
coordinator
Marketing research
vice president
Directs and manages business
intelligence initiatives, data reports,
and/or data modeling efforts.
Acts as expert consultant on application
of statistical techniques for specific
research problems. Many times
responsible for research design and
data analysis.
Plans research project and executes
project assignments. Works in
preparing questionnaire. Makes
analysis, prepares report, schedules
project events, and sets budget.
Works closely with client to define
complex business challenges; oversees
one or more research managers.
Hires, trains, and supervises field
interviewers. Provides work schedules
and is responsible for data accuracy.
Builds and maintains a library of primary
and secondary data sources to meet
the requirements of the research
department.
Handles and processes statistical
data. Supervises day-to-day office
work.
Develop and manage clients within an
entire geography, sector or industry.
$63 to $163
$90 to $110
$35 to $81
$85K
$60 to $90
$35 to $56
$35 to $50
$125+
*Positions are general categories and not all companies employ all of the positions.
www.MyEbookNiche.eCrater.com

Chapter 1 Marketing Research for Managerial Decision Making 23
Most successful marketing research people are intelligent and creative; they also pos-
sess problem- solving, critical-thinking, communication, and negotiation skills. Marketing
researchers must be able to function under strict time constraints and feel comfortable
working with large volumes of data. Federal Express (FedEx), for example, normally seeks
individuals with strong analytical and computer skills to fill its research positions. Candi-
dates should have an undergraduate degree in business, marketing, or information systems.
Having an MBA will usually give an applicant a competitive advantage.
As is the case with many companies, the normal entry-level position in the marketing
research area at Federal Express is the assistant research analyst. While learning details of
the company and the industry, these individuals receive on-the-job training from a research
analyst. The normal career path includes advancement to information technician and then
research director and/or account executive.
Marketing research at Federal Express is somewhat unusual in that it is housed in the
information technology division. This is evidence that, while the research function is inte-
grated throughout the company, it has taken on a high-tech orientation. Marketing research
at FedEx operates in three general areas:
1. Database development and enhancement. This function is to establish relationships
with current FedEx customers and use this information for the planning of new
products.
2. Cycle-time research. Providing more information for the efficient shipping of pack-
ages, tracking of shipments, automatic replenishment of customers’ inventories, and
enhanced electronic data interchange.
3. Market intelligence system. Primarily a logistical database and research effort to pro-
vide increased customer service to catalog retailers, direct marketing firms, and elec-
tronic commerce organizations.
The entire research function is led by a vice president of research and information technol-
ogy, to whom four functional units report directly. These four units are responsible for the
marketing decision support system operation, sales tracking, new business development, and
special project administration.
If you are interested in pursuing a career in marketing research, a good way to start is
to visit www.careers-in-marketing.com/mr.htm.
Exercise
1. Go to the web home page for Federal Express, and identify the requirements that
FedEx is seeking in marketing research personnel. Write a brief description of these
requirements, and report your finding to the class.
2. If you were seeking a marketing research position at FedEx, how would you prepare
yourself through training and education for such a position? Put together a one-year
plan for yourself identifying the college courses, special activities, interests, and
related work experience you would engage in to obtain a marketing research position
at FedEx.
www.MyEbookNiche.eCrater.com

The Marketing Research Process and Proposals
C h a p t e r 2
www.MyEbookNiche.eCrater.com

Learning Objectives After reading this chapter, you will be able to:
1. Describe the major environmental factors influencing marketing research.
2. Discuss the research process and explain the various steps.
3. Distinguish between exploratory, descriptive, and causal research designs.
4. Identify and explain the major components of a research proposal.
Solving Marketing Problems Using a Systematic Process
Bill Shulby is president of Carolina Consulting Company, a marketing strategy
consulting firm based in Raleigh-Durham, North Carolina. He recently worked
with the owners of a regional telecommunications firm located in Texas on im-
proving service quality processes. Toward the end of their meeting, one of the
owners, Dan Carter, asked him about customer satisfaction and perceptions of
the company’s image as they related to service quality and customer retention.
During the discussion, Carter stated that he was not sure how the company’s
telecommunications services were viewed by current or potential customers. He
said, “Just last week, the customer service department received 11 calls from
different customers complaining about everything from incorrect bills to taking
too long to get DSL installed. Clearly, none of these customers were happy about
our service.” Then he asked Shulby, “What can I do to find out how satisfied our
customers are overall and what can be done to improve our image?”
Shulby explained that conducting a marketing research study would answer
Carter’s questions. Dan Carter responded that the company had not done research
in the past so he did not know what to expect from such a study. Shulby then gave
several examples of studies the Carolina Consulting Company had conducted for
other clients and explained how the information had been used, making sure not
to disclose any confidential information. Carter then asked, “How much would
it cost me to do this study and how long would it take to complete?” Shulby then
explained he would like to ask a few more questions so he could better under-
stand the issues, and he then would prepare a research proposal summarizing the
approach to be used, the deliverables from the study, the cost, and the time frame
for completion. The proposal would be ready in about a week, and they would
meet to go over it in detail.
www.MyEbookNiche.eCrater.com

26 Part 1 The Role and Value of Marketing Research Information
Value of the Research Process
Business owners and managers often identify problems they need help to solve. In such
situations, additional information typically is needed to make a decision or to solve a prob-
lem. One solution is a marketing research study based on a scientific research process. This
chapter provides an overview of the research process as well as a preview of some of the
core topics in the text.
Changing View of the Marketing Research Process
Organizations, both for-profit and not-for-profit, are increasingly confronted with new and
complex challenges and also opportunities that are the result of changing legal, political,
cultural, technological, and competitive issues. Perhaps the most influential factor is the
Internet. The rapid technological advances and its growing use by people worldwide are
making the Internet a driving force in many current and future developments in marketing
research. Traditional research philosophies are being challenged as never before. For exam-
ple, there is a growing emphasis on secondary data collection, analysis, and interpretation as
a basis of making business decisions. Secondary data are information previously collected
for some other problem or issue. A by-product of the technology advances is the ongoing
collection of data that is placed in a data warehouse and is available as secondary data to
help understand business problems and to improve decisions. In contrast, primary data are
information collected specifically for a current research problem or opportunity.
Many large businesses (e.g., Dell Computers, Bank of America, Marriott Hotels,
Coca-Cola, IBM, McDonald’s, and Walmart) are linking purchase data collected in-store
and online with customer profiles already in company databases, thus enhancing their
ability to understand shopping behavior and better meet customer needs. But even medium-
sized and small companies are building databases of customer information to serve current
customers more effectively and to attract new customers.
Another development is increased use of gatekeeper technologies (e.g., caller ID and
automated screening and answering devices) as a means of protecting one’s privacy against
intrusive marketing practices such as by telemarketers and illegal scam artists. Similarly,
many Internet users either block the placement of cookies or periodically erase them in
order to keep marketers from tracking their behavior. Marketing researchers’ ability to col-
lect consumer data using traditional methods such as mail and telephone surveys has been
severely limited by the combination of gatekeeper devices and recent federal and state data
privacy legislation. For example, marketing researchers must contact almost four times
more people today to complete a single interview than was true five years ago. Similarly,
online marketers and researchers must provide opt-in/opt-out opportunities when solicit-
ing business or collecting information. Advances in gatekeeper technologies will continue
to challenge marketers to be more creative in developing new ways to reach respondents.
A third development affecting marketing decision makers is firms’ widespread expansion
into global markets. Global expansion introduces marketing decision makers to new sets of
cultural issues that force researchers to focus not only on data collection tasks, but also on data
interpretation and information management activities. For example, one of the largest full-
service global marketing information firms, NFO (National Family Opinion) Worldwide, Inc.,
located in Greenwich, Connecticut, with subsidiaries in North America, Europe, Australia,
Asia, and the Middle East, has adapted many of its measurement and brand tracking services
to accommodate specific cultural and language differences encountered in global markets.
Secondary data Information
previously collected for
some other problem or issue.
Primary data Information
collected for a current
research problem or
opportunity.
Gatekeeper technologies
Technologies such as caller
ID that are used to prevent
intrusive marketing prac-
tices such as by telemarket-
ers and illegal scam artists.
www.MyEbookNiche.eCrater.com

Chapter 2 The Marketing Research Process and Proposals 27
Fourth, marketing research is being repositioned in businesses to play a more important
role in strategy development. Marketing research is being used increasingly to identify new
business opportunities and to develop new product, service, and delivery ideas. Market-
ing research is also being viewed not only as a mechanism to more efficiently execute
CRM (customer relationship management) strategies, but also as a critical component
in developing competitive intelligence. For example, Sony uses its PlayStation website
(www.playstation.com) to collect information about PlayStation gaming users and to
build closer relationships. The PlayStation website is designed to create a community of
users who can join PlayStation Underground, where they will “feel like they belong to a
subculture of intense gamers.” To achieve this objective, the website offers online shop-
ping, opportunities to try new games, customer support, and information on news, events,
and promotions. Interactive features include online gaming and message boards, as well as
other relationship-building aspects.
Collectively, these key influences are forcing managers and researchers to view market-
ing research as an information management function. The term information research reflects
the evolving changes occurring in the market research industry affecting organizational
decision makers. Indeed, a more appropriate name for the traditional marketing research
process is now the information research process. The information research process is
a systematic approach to collecting, analyzing, interpreting, and transforming data into
decision-making information. While many of the specific tasks involved in marketing
research remain the same, understanding the process of transforming data into usable infor-
mation from a broader information processing framework expands the applicability of the
research process in solving organizational problems and creating opportunities.
Determining the Need for Information Research
Before we introduce and discuss the phases and specific steps of the information research
process, it is important that you understand when research is needed and when it is not.
More than ever, researchers must interact closely with managers to recognize business
problems and opportunities.
Decision makers and researchers frequently are trained differently in their approach to
identifying and solving business problems, questions, and opportunities, as illustrated in
the accompanying Marketing Research Dashboard. Until decision makers and marketing
researchers become closer in their thinking, the initial recognition of the existence of a
problem or opportunity should be the primary responsibility of the decision maker, not the
researcher. A good rule of thumb is to ask “Can the decision-making problem (or question)
be solved based on past experience and managerial judgment?” If the response is “no,”
research should be considered and perhaps implemented.
Decision makers often initiate the research process because they recognize problem
and opportunity situations that require more information before good plans of action can
be developed. Once the research process is initiated, in most cases decision makers will
need assistance in defining the problem, collecting and analyzing the data, and interpreting
the data.
There are several situations in which the decision to undertake a marketing research
project may not be necessary.1 These are listed and discussed in Exhibit 2.1.
The initial responsibility of today’s decision makers is to determine if research
should be used to collect the needed information. The first question the decision maker
must ask is: Can the problem and/or opportunity be solved using existing information and
Information research
process A systematic
approach to collecting,
analyzing, interpreting, and
transforming data into
decision-making
information.
www.MyEbookNiche.eCrater.com

28 Part 1 The Role and Value of Marketing Research Information
managerial judgment? The focus is on deciding what type of information (secondary
or primary) is required to answer the research question(s). In most cases, decision mak-
ers should undertake the information research process any time they have a question or
problem or believe there is an opportunity, but do not have the right information or are
unwilling to rely on the information at hand to solve the problem. In reality, conducting
secondary and primary research studies costs time, effort, and money. Another key mana-
gerial question deals with the availability of existing information. With the assistance of
the research expert, decision makers face the next question: Is adequate information avail-
able within the company’s internal record systems to address the problem? If the necessary
marketing information is not available in the firm’s internal record system, then a custom-
ized marketing research project to obtain the information should be considered.
With input from the research expert, decision makers must assess the time constraints
associated with the problem/opportunity: Is there enough time to conduct the necessary
research before the final managerial decision must be made? Decision makers often need
Management Decision Makers . . .Tend to be decision-oriented, intuitive thinkers who want
information to confirm their decisions. They want addi-
tional information now or “yesterday,” as well as results
about future market component behavior (“What will sales
be next year?”), while maintaining a frugal stance with
regard to the cost of additional information. Decision mak-
ers tend to be results oriented, do not like surprises, and
tend to reject the information when they are surprised.
Their dominant concern is market performance (“Aren’t we
number one yet?”); they want information that allows cer-
tainty (“Is it or isn’t it?”) and advocate being proactive but
often allow problems to force them into reactive decision-
making modes.
Marketing Researchers . . . Tend to be scientific, technical, analytical thinkers who love
to explore new phenomena; accept prolonged investiga-
tions to ensure completeness; focus on information about
past behaviors (“Our trend has been . . .”); and are not cost
conscious with additional information (“You get what you
pay for”). Researchers are results oriented but love sur-
prises; they tend to enjoy abstractions (“Our exponential
gain . . .”), the probability of occurrences (“May be,” “Tends
to suggest that . . .”); and they advocate the proactive need
for continuous inquiries into market component changes,
but feel most of the time that they are restricted to doing
reactive (“quick and dirty”) investigations due to manage-
ment’s lack of vision and planning.
MARKETING RESEARCH DASHBOARD DECISION MAKERS AND RESEARCHERS
Exhibit 2.1 Situations When Marketing Research Might Not Be Needed
Situation Factors and Comments
Insufficient time frames When the discovery of a problem situation leaves inadequate
time to execute the necessary research activities, a decision maker may have to use
informed judgment. Competitive actions/reactions sometimes emerge so fast that marketing
research studies are not a feasible option.
Inadequate resources When there are significant limitations in money, manpower, and/or
facilities, then marketing research typically is not feasible.
Costs outweigh the value When the benefits to be gained by conducting the research are
not significantly greater than the costs, then marketing research is not feasible.
www.MyEbookNiche.eCrater.com

Chapter 2 The Marketing Research Process and Proposals 29
information in real time. But in many cases, systematic research that delivers high-quality
information can take months. If the decision maker needs the information immediately,
there may not be enough time to complete the research process. Sometimes organizations
fear that a window of opportunity in a marketplace will close quickly, and they do not
have time to wait. Another fundamental question focuses on the availability of marketing
resources such as money, staff, skills, and facilities. Many small businesses lack the funds
necessary to consider doing formal research.
A cost-benefit assessment should be made of value of the research compared to the
cost: Do the benefits of having the additional information outweigh the costs of gathering
the information? This type of question remains a challenge for today’s decision makers.
While the cost of doing marketing research varies from project to project, generally the
cost can be estimated accurately. On the other hand, determining the true value of the
expected information remains difficult.
Some business problems cannot be solved with marketing research. This suggests the
question: Will the research provide useful feedback for decision making? A good example
is in the area of “really new” products. In 1996, Charles Schwab conducted research asking
their customers if they would be interested in online trading. The research came back with
a resounding “no.” At the time, most consumers did not have Internet access and were not
able to imagine they would be interested in online trading. Schwab ignored the research
and developed their online trading capability. They could have saved time and money by
not doing the research at all.
Doing research can tip your hat to competitors: Will this research give our competitors
too much information about our marketing strategy? For example, when a firm offers a
potential new product in a test market, they reveal a great deal to their competitors about the
product and the accompanying promotional efforts. Also, some competitors will actively
disrupt market testing. Competitors might reduce their prices during the market test to
prevent the company from collecting accurate information. This practice is called jamming.
Overview of the Research Process
The research process consists of four distinct but related phases: (1) determine the research
problem; (2) select the appropriate research design; (3) execute the research design; and
(4) communicate the research results (see Exhibit 2.2). The phases of the process must be
completed properly to obtain accurate information for decision making. But each phase can
be viewed as a separate process that consists of several steps.
Exhibit 2.2 The Four Phases of the Information Research Process
PHASE I PHASE II PHASE III PHASE IV
Execute the
Research Design
Determine the
Research Problem
Select the
Appropriate
Research Design
Communicate the
Research Results
www.MyEbookNiche.eCrater.com

30 Part 1 The Role and Value of Marketing Research Information
The four phases are guided by the scientific method. This means the research proce-
dures should be logical, objective, systematic, reliable, and valid.
Transforming Data into KnowledgeThe primary goal of the research process is to provide decision makers with knowl-
edge that will enable them to solve problems or pursue opportunities. Data become
knowledge when someone, either the researcher or the decision maker, interprets the
data and attaches meaning. To illustrate this process, consider the Magnum Hotel. Cor-
porate executives were assessing ways to reduce costs and improve profits. The VP of
finance suggested cutting back on the “quality of the towels and bedding” in the rooms.
Before making a final decision, the president asked the marketing research department to
interview business customers.
Exhibit 2.3 summarizes the key results. A total of 880 people were asked to indicate
the degree of importance they placed on seven criteria when selecting a hotel. Respondents
used a six-point importance scale ranging from “Extremely Important = 6” to “Not At All
Important = 1.” The average importance of each criterion was calculated for both first-time
and repeat customers and statistically significant differences were identified. These results
did not confirm, however, whether “quality towels and bedding” should be cut back to
reduce operating costs.
When shown the results, the president asked this question: “I see a lot of numbers,
but what are they really telling me?” The director of marketing research responded by
explaining: “Among our first-time and repeat business customers, the ‘quality of the
hotel’s towels and bedding’ is considered one of the three most important selection cri-
teria impacting their choice of a hotel to stay at when an overnight stay is required. In
addition, they feel ‘cleanliness of the room and offering preferred guest card options’
are of comparable importance to the quality of towels and bedding. But first-time cus-
tomers place significantly higher importance on cleanliness of the room than do repeat
customers (5.7 vs. 5.5). Moreover, repeat customers place significantly more importance
Scientific method Research
procedures should be
logical, objective, systematic,
reliable, and valid.
Knowledge Information
becomes knowledge when
someone, either the
researcher or the decision
maker, interprets the data
and attaches meaning.
Exhibit 2.3 Summary of Differences in Selected Hotel-Choice Criteria:
Comparison of First-Time and Repeat Business Customers
Total First-Time Customers Repeat Customers
(n = 880) (n = 440) (n = 440)
Meana Mean Mean
Hotel Selection Criteria Value Value Value
Cleanliness of the room 5.6 5.7 5.5b
Good-quality bedding and towels 5.6 5.5 5.6
Preferred guest card options 5.5 5.4 5.7b
Friendly/courteous staff and employees 5.1 4.8 5.4b
Free VIP services 5.0 4.3 5.3b
Conveniently located for business 5.0 5.2 4.9b
In-room movie entertainment 3.6 3.3 4.5b
aImportance scale: a six-point scale ranging from 6 (extremely important) to 1 (not at all important).
bMean difference in importance between the two customer groups is significant at p < 0.05.
www.MyEbookNiche.eCrater.com

Chapter 2 The Marketing Research Process and Proposals 31
on the availability of our preferred guest card loyalty program than do first-time
customers (5.7 vs. 5.4).” Based on these considerations, the executives decided they
should not cut back on the quality of towels or bedding as a way to reduce expenses and
improve profitability.
Interrelatedness of the Steps and the Research ProcessExhibit 2.4 shows in more detail the steps included in each phase of the research
process. Although in many instances researchers follow the four phases in order indi-
vidual steps may be shifted or omitted. The complexity of the problem, the urgency for
solving the problem, the cost of alternative approaches, and the clarification of infor-
mation needs will directly impact how many of the steps are taken and in what order.
For example, secondary data or “off-the-shelf ” research studies may be found that
could eliminate the need to collect primary data. Similarly, pretesting the question-
naire (step 7) might reveal weaknesses in some of the scales being considered (step 6),
resulting in further refinement of the scales or even selection of a new research design
(back to step 4).
Phase I: Determine the Research Problem
The process of determining the research problem involves three interrelated activities:
(1) identify and clarify information needs; (2) define the research questions; and (3) spec-
ify research objectives and confirm the information value. These three activities bring
researchers and decision makers together based on management’s recognition of the need
for information to improve decision making.
Exhibit 2.4 Phases and Steps in the Information Research Process
Phase I: Determine the Research Problem
Step 1: Identify and clarify information needs
Step 2: Define the research questions
Step 3: Specify research objectives and confirm the information value
Phase II: Select the Research Design
Step 4: Determine the research design and data sources
Step 5: Develop the sampling design and sample size
Step 6: Examine measurement issues and scales
Step 7: Design and pretest the questionnaire
Phase III: Execute the Research Design
Step 8: Collect and prepare data
Step 9: Analyze data
Step 10: Interpret data to create knowledge
Phase IV: Communicate the Research Results
Step 11: Prepare and present final report
www.MyEbookNiche.eCrater.com

32 Part 1 The Role and Value of Marketing Research Information
Step 1: Identify and Clarify Information NeedsGenerally, decision makers prepare a statement of what they believe is the problem before
the researcher becomes involved. Then researchers assist decision makers to make sure
the problem or opportunity has been correctly defined and the information requirements
are known.
For researchers to understand the problem, they use a problem definition process.
There is no one best process. But any process undertaken should include the following
components: researchers and decision makers must (1) agree on the decision maker’s
purpose for the research, (2) understand the complete problem, (3) identify measurable
symptoms and distinguish them from the root problem, (4) select the unit of analysis, and
(5) determine the relevant variables. Correctly defining the problem is an important
first step in determining if research is necessary. A poorly defined problem can produce
research results that are of little value.
Purpose of the Research Request Problem definition begins by determining the
research purpose. Decision makers must decide whether the services of a researcher are
really needed. The researcher helps decision makers begin to define the problem by asking
the decision maker why the research is needed. Through questioning, researchers begin to
learn what the decision maker believes the problem is. Having a general idea of why
research is needed focuses attention on the circumstances surrounding the problem.
The iceberg principle holds that decision makers are aware of only 10 percent of the
true problem. Frequently the perceived problem is actually a symptom that is some type
of measurable market performance factor, while 90 percent of the problem is not visible
to decision makers. For example, the problem may be defined as “loss of market share”
when in fact the problem is ineffective advertising or a poorly trained sales force. The real
problems are below the waterline of observation. If the submerged portions of the problem
are omitted from the problem definition and later from the research design, then decisions
based on the research may be incorrect. Referring to the iceberg principle, displayed in
Exhibit 2.5, helps researchers distinguish between the symptoms and the causes.
Understand the Complete Problem Situation The decision maker and the researcher
must both understand the complete problem. This is easy to say but quite often difficult to
accomplish. To gain an understanding, researchers and decision makers should do a situa-
tion analysis of the problem. A situation analysis gathers and synthesizes background in-
formation to familiarize the researcher with the overall complexity of the problem. A
situation analysis attempts to identify the events and factors that have led to the situation,
as well as any expected future consequences. Awareness of the complete problem situation
provides better perspectives on the decision maker’s needs, the complexity of the problem,
and the factors involved. A situation analysis enhances communication between the re-
searcher and the decision maker. The researcher must understand the client’s business, in-
cluding factors such as the industry, competition, product lines, markets, and in some cases
production facilities. To do so, the researcher cannot rely solely on information provided
by the client because many decision makers either do not know or will not disclose the
information needed. Only when the researcher views the client’s business objectively can
the true problem be clarified.
Identify and Separate Out Symptoms Once the researcher understands the overall
problem situation, he or she must work with the decision maker to separate the
possible root problems from the observable and measurable symptoms that may have
Situation analysis Gathers
and synthesizes background
information to familiarize
the researcher with the
overall complexity of the
problem.
www.MyEbookNiche.eCrater.com

Chapter 2 The Marketing Research Process and Proposals 33
been initially perceived as being the problem. For example, as we mentioned, many
times managers view declining sales or loss of market share as problems. After exam-
ining these issues, the researcher may see that they are the result of more specific is-
sues such as poor advertising execution, lack of sales force motivation, or inadequate
distribution. The challenge facing the researcher is one of clarifying the real problem
by separating out possible causes from symptoms. Is a decline in sales truly the prob-
lem or merely a symptom of lack of planning, poor location, or ineffective sales
management?
Exhibit 2.5 The Iceberg Principle
The iceberg principle states that in many business problem situations, the decision maker is
aware of only 10 percent of the true problem. Often what is thought to be the problem is
nothing more than an observable outcome or symptom (i.e., some type of measurable market
performance factor), while 90 percent of the problem is neither visible to nor clearly
understood by decision makers. For example, the problem may be defined as “loss of market
share” when in fact the problem is ineffective advertising or a poorly trained sales force. The
real problems are submerged below the waterline of observation. If the submerged portions
of the problem are omitted from the problem definition and later from the research design,
then decisions based on the research may be less than optimal.
Decision Maker
Researcher
Marginal
Performance
of Sales Force
Unethical
Treatment of
Customers
Inappropriate
Delivery
System
Low-Quality
Products
Real Business/Decision
Problems
Obvious Measurable
Symptoms
Unhappy
Customers
Decreased
Market
Share
Loss
of
Sales Low
Traic
Poor Image
Decision Problem Definition
www.MyEbookNiche.eCrater.com

34 Part 1 The Role and Value of Marketing Research Information
Determine the Unit of Analysis As a fundamental part of problem definition, the re-
searcher must determine the appropriate unit of analysis for the study. The researcher must
be able to specify whether data should be collected about individuals, households, organi-
zations, departments, geographical areas, or some combination. The unit of analysis will
provide direction in later activities such as scale development and sampling. In an automo-
bile satisfaction study, for example, the researcher must decide whether to collect data from
individuals or from a husband and wife representing the household in which the vehicle is
driven.
Determine the Relevant Variables The researcher and decision maker jointly determine
the variables that need to be studied. The types of information needed (facts, predictions,
relationships) must be identified. Exhibit 2.6 lists examples of variables that are often in-
vestigated in marketing research. Variables are often measured using several related ques-
tions on a survey. In some situations, we refer to these variables as constructs. We will
discuss constructs in Chapters 3 and 7.
Step 2: Define the Research QuestionsNext, the researcher must redefine the initial problem as a research question. For the
most part, this is the responsibility of the researcher. To provide background informa-
tion on other firms that may have faced similar problems, the researcher conducts a
review of the literature. The literature review may uncover relevant theory and vari-
ables to include in the research. For example, a literature review of new software
adoption research would reveal that two factors—ease of use and functionality—are
often included in studies of software adoption because these variables strongly predict
Unit of analysis Specifies
whether data should be
collected about individuals,
households, organizations,
departments, geographical
areas, or some
combination.
Exhibit 2.6 Examples of Variables/Constructs Investigated in Marketing
Variables/Constructs Description
Brand Awareness Percentage of respondents having heard of a designated
brand; awareness could be either unaided or aided.
Brand Attitudes The number of respondents and their intensity of feeling
positive or negative toward a specific brand.
Satisfaction How people evaluate their postpurchase consumption
experience with a particular product, service, or company.
Purchase Intention The number of people planning to buy a specified object
(e.g., product or service) within a designated time period.
Importance of Factors To what extent do specific factors influence a person’s
purchase choice.
Demographics The age, gender, occupation, income level, and other
characteristics of individuals providing the information.
www.MyEbookNiche.eCrater.com

Chapter 2 The Marketing Research Process and Proposals 35
adoption and usage. While the literature review ordinarily does not provide data that
answer the research question, it can supply valuable perspectives and ideas that may be
used in research design and in interpretation of results. Literature reviews are described
in more detail in Chapter 3.
Breaking down the problem into research questions is one of the most important
steps in the marketing research process because how the research problem is defined
influences all of the remaining research steps. The researcher’s task is to restate the ini-
tial variables associated with the problem in the form of key questions: how, what, where,
when, or why. For example, management of Lowe’s Home Improvement, Inc. was con-
cerned about the overall image of Lowe’s retail operations as well as its image among
customers within the Atlanta metropolitan market. The initial research question was, “Do
our marketing strategies need to be modified to increase satisfaction among our current
and future customers?” After Lowe’s management met with consultants at Corporate
Communications and Marketing, Inc. to clarify the firm’s information needs, the consul-
tants translated the initial problem into the specific questions displayed in Exhibit 2.7.
With assistance of management, the consultants then identified the attributes in each
research question. For example, specific “store/operation aspects” that can affect satis-
faction included convenient operating hours, friendly/courteous staff, and wide assort-
ment of products and services.
After redefining the problem into research questions and identifying the information
requirements, the researcher must determine the types of data (secondary or primary) that
will best answer each research question. Although final decision on types of data is part
of step 4 (Determine the Research Design and Data Sources), the researcher begins the
process in step 2. The researcher asks the question, “Can the specific research question be
addressed with data that already exist or does the question require new data?” To answer
this question, researchers consider other issues such as data availability, data quality, and
budget and time constraints.
Finally, in step 2 the researcher determines whether the information being requested is
necessary. This step must be completed before going on to step 3.
Exhibit 2.7 Initial and Redefined Research Questions for Lowe’s Home Improvement, Inc.
Initial research question
Do our marketing strategies need to be modified to increase satisfaction among our current
and future customer segments?
Redefined research questions
What store/operation aspects do people believe are important in selecting a retail
hardware/lumber outlet?
How do customers evaluate Lowe’s retail outlets on store/operation aspects?
What are the perceived strengths and weaknesses of Lowe’s retail operations?
How do customers and noncustomers compare Lowe’s to other retail hardware/lumber
outlets within the Atlanta metropolitan area?
What is the demographic/psychographic profile of the people who patronize Lowe’s retail
outlets in the Atlanta market?
www.MyEbookNiche.eCrater.com

36 Part 1 The Role and Value of Marketing Research Information
Step 3: Specify Research Objectives and Confirm the Information ValueThe research objectives should be based on the development of research questions in
step 2. Formally stated research objectives provide guidelines for determining other steps
that must be taken. The assumption is that if the objectives are achieved, the decision
maker will have the information needed to answer the research questions.
Before moving to Phase II of the research process, the decision maker and the
researcher must evaluate the expected value of the information. This is not an easy task
because a number of factors come into play. “Best judgment” answers have to be made
to the following types of questions: “Can the information be collected at all?” “Can the
information tell the decision maker something not already known?” “Will the information
provide significant insights?” and “What benefits will be delivered by this information?”
In most cases, research should be conducted only when the expected value of the informa-
tion to be obtained exceeds the cost of the research.
Phase II: Select the Research Design
The main focus of Phase II is to select the most appropriate research design to achieve the
research objectives. The steps in this phase are outlined below.
Step 4: Determine the Research Design and Data SourcesThe research design serves as an overall plan of the methods used to collect and analyze the
data. Determining the most appropriate research design is a function of the research objec-
tives and information requirements. The researcher must consider the types of data, the data
collection method (e.g., survey, observation, in-depth interview), sampling method, sched-
ule, and budget. There are three broad categories of research designs: exploratory, descrip-
tive, and causal. An individual research project may sometimes require a combination of
exploratory, descriptive, and/or causal techniques in order to meet research objectives.
Exploratory research has one of two objectives: (1) generating insights that will help
define the problem situation confronting the researcher or (2) deepening the understanding
of consumer motivations, attitudes, and behavior that are not easy to access using other
research methods. Examples of exploratory research methods include literature reviews
of already available information, qualitative approaches such as focus groups and in-depth
interviews, or pilot studies. Literature reviews will be described in Chapter 3. Exploratory
research is discussed in Chapter 4.
Descriptive research involves collecting quantitative data to answer research ques-
tions. Descriptive information provides answers to who, what, when, where, and how
questions. In marketing, examples of descriptive information include consumer attitudes,
intentions, preferences, purchase behaviors, evaluations of current marketing mix strat-
egies, and demographics. In the nearby Marketing Research Dashboard, we highlight
Lotame Solutions, Inc., a firm that developed a research methodology called “Time Spent”
to measure how many seconds various online advertising formats are visible to individual
consumers, which provides information to advertising decision makers.
Descriptive studies may provide information about competitors, target markets, and
environmental factors. For example, many chain restaurants conduct annual studies that
describe customers’ perceptions of their restaurant as well as primary competitors. These
studies, referred to as either image assessment surveys or customer satisfaction surveys,
Exploratory research
Generates insights that will
help define the problem
situation confronting the
researcher or improves the
understanding of consumer
motivations, attitudes,
and behavior that are not
easy to access using other
research methods.
Descriptive research
Collects quantitative data to
answer research questions
such as who, what, when,
where, and how.
www.MyEbookNiche.eCrater.com

Chapter 2 The Marketing Research Process and Proposals 37
describe how customers rate different restaurants’ customer service, convenience of loca-
tion, food quality, and atmosphere. Some qualitative research is said to be descriptive, in
the sense of providing rich or “thick” narrative description of phenomena. However, in the
marketing research industry, the term descriptive research usually means numeric rather
than textual data. Descriptive designs are discussed in Chapter 5.
Causal research collects data that enables decision makers to determine cause-
and-effect relationships between two or more variables. Causal research is most appro-
priate when the research objectives include the need to understand which variables (e.g.,
advertising, number of salespersons, price) cause a dependent variable (e.g., sales, cus-
tomer satisfaction) to move.
Understanding cause-effect relationships among market performance factors enables
the decision maker to make “If–then” statements about the variables. For example, as a
result of using causal research methods, the owner of a men’s clothing store in Chicago can
predict that, “If I increase my advertising budget by 15 percent, then overall sales volume
should increase by 20 percent.” Causal research designs provide an opportunity to assess
and explain causality among market factors. But they often can be complex, expensive, and
time consuming. Causal research designs are discussed in Chapter 5.
Secondary and Primary Data Sources The sources of data needed to address research
problems can be classified as either secondary or primary, as we have discussed earlier. The
sources used depend on two fundamental issues: (1) whether the data already exist; and
(2) if so, the extent to which the researcher or decision maker knows the reason(s) why the
Causal research Collects
data that enables decision
makers to determine
cause-and-effect
relationships between two
or more variables.
To help companies make better advertising placement
decisions on websites, Lotame Solutions, Inc., developed
a technology called Time Spent that measures how much
time online ads are visible (completely unobstructed) to
individual consumers. The company recently reported
a finding that questions conventional wisdom about the
effectiveness of three common online ad formats: the
medium rectangle, the leaderboard, and the skyscraper.
Scott Hoffman, CMO of Lotame, says the three advertis-
ing formats are often seen as interchangeable in the online
marketplace. But the findings indicate they are not equiva-
lent, at least on the basis of amount of time online viewers
spend viewing each of the ads. In Lotame’s study of nearly
150 million ads, the 300 by 250 pixel format known in the
industry as the “medium rectangle” averaged 13 seconds
of viewing exposure per user served, as compared to
only 5.4 seconds for the long and skinny “leaderboard”
format (728 × 90 pixels), and 1.9 seconds for the thin but
tall “skyscraper” format (160 × 600 pixels). Even though
the findings challenge conventional wisdom, they are not
altogether surprising. Leaderboards often appear on the
top of pages, so are out of range as soon as a user scrolls
down a page. A skyscraper may not fully load before
a user scrolls down a page. The medium rectangle is often
close to the middle of a web page where the user spends
the most time.
Lotame has also conducted research on the effective-
ness of online display ads. Their findings indicate a signifi-
cantly increased likelihood in intent to recommend products
among Internet users who have seen an online display ad.
The findings regarding time spent by the Time Spent
method (i.e., number of seconds of viewing exposure for
the online ad formats) and display ads have implications
for both online publishers and online advertisers. The
three advertising formats are not equal.
Sources: Adapted from Joe Mandese, “Finding Yields New Angle
on Rectangle, Reaps Far More User Time than Leaderboards,
Skyscrapers,” Mediapost.com, April 7, 2009, www.mediapost.com
/publications/?fa Articles.showArticle&art_aid 103585&passFuseAction
PublicationsSearch.showSearchResults&art_searched Lotame&page
_number 0#, accessed December 2011; “Lotame Research Finds
‘Rectangle’ Online Ads Provide Best Exposure, Beating ‘Leaderboards’
by Nearly Two and a Half to One,” April 7, 2009, www.lotame.com
/press/releases/23/, accessed December 2011; and “Display Ads Lift
Branding Metrics,” www.lotame.com/ 2011/06/display-ads-lift-branding
-metrics/, accessed December 2011.
MARKETING RESEARCH DASHBOARD MEASURING EFFECTIVENESS OF ONLINE ADVERTISING FORMATS
www.MyEbookNiche.eCrater.com

38 Part 1 The Role and Value of Marketing Research Information
existing secondary data were collected. Sources of such secondary data include a compa-
ny’s data warehouse, public libraries and universities, Internet websites, or commercial
data purchased from firms specializing in providing secondary information. Chapter 3
covers secondary data and sources.
Primary data are collected directly from firsthand sources to address the current
research problem. The nature and collection of primary data are covered in Chapters 4–8.
Step 5: Develop the Sampling Design and Sample SizeWhen conducting primary research, consideration must be given to the sampling design.
If secondary research is conducted, the researcher must still determine that the population
represented by the secondary data is relevant to the current research problem. Relevancy of
secondary data is covered in Chapter 3.
If predictions are to be made about market phenomena, the sample must be representa-
tive. Typically, marketing decision makers are most interested in identifying and solving
problems associated with their target markets. Therefore, researchers need to identify the rel-
evant target population. In collecting data, researchers can choose between collecting data
from a census or a sample. In a census, the researcher attempts to question or observe all
the members of a defined target population. For small populations, a census may be the best
approach. For example, if your marketing research professor wanted to collect data regarding
student reactions to a new lecture she just presented, she would likely survey the entire class,
not merely a sample.
A second approach, used when the target population is large, involves selection of a
sample from the defined target population. Researchers must use a representative sample of the
population if they wish to generalize the findings. To achieve this objective, researchers develop
a sampling plan as part of the overall research design. A sampling plan serves as the blueprint
for defining the appropriate target population, identifying the possible respondents, establishing
the procedures for selecting the sample, and determining the appropriate sample size. Sampling
plans can be classified into two general types: probability and nonprobability. In probability
sampling, each member of the defined target population has a known chance of being
selected. For example, if the population of marketing majors at a university is 500, and 100
are going to be sampled, the “known chance” of being selected is one five or 20 percent.
Probability sampling gives the researcher the opportunity to assess sampling error. In
contrast, nonprobability sampling plans cannot measure sampling error and thus limit the
generalizability of the research findings. Qualitative research designs often use small sam-
ples, so sample members are usually hand-selected to ensure a relevant sample. For example,
a qualitative study of Californians’ perceptions of earthquake risk and preparedness included
residents who had been close to sizable earthquakes and those who had not. In addition,
researchers attempted to include representatives of major demographic groups in California.
Sample size affects the accuracy and generalizability of research results. Researchers
must therefore determine how many people to include or how many objects to investigate.
We discuss sampling in more detail in Chapter 6.
Step 6: Examine Measurement Issues and ScalesStep 6 is an important step in the research process for descriptive and causal designs.
It involves identifying the concepts to study and measuring the variables related to the
research problem. Researchers must be able to answer questions such as: How should a
variable such as customer satisfaction or service quality be defined and measured? Should
researchers use single- or multi-item measures to quantify variables? In Chapter 7, we
discuss measurement and scaling.
Target population The
population from which the
researcher wants to collect
data.
Census The researcher
attempts to question or
observe all the members of
a defined target population.
Sample A small number
of members of the target
population from which the
researcher collects data.
www.MyEbookNiche.eCrater.com
Chapter 2 The Marketing Research Process and Proposals 39
Although most of the activities involved in step 6 are related to primary research,
understanding these activities is important in secondary research as well. For example,
when using data mining with database variables, researchers must understand the measure-
ment approach used in creating the database as well as any measurement biases. Other-
wise, secondary data may be misinterpreted.
Step 7: Design and Pretest the QuestionnaireDesigning good questionnaires is difficult. Researchers must select the correct type of ques-
tions, consider the sequence and format, and pretest the questionnaire. Pretesting obtains
information from people representative of those who will be questioned in the actual survey.
In a pretest, respondents are asked to complete the questionnaire and comment on issues
such as clarity of instructions and questions, sequence of the topics and questions, and
anything that is potentially difficult or confusing. Chapter 8 covers questionnaire design.
Phase III: Execute the Research Design
The main objectives of the execution phase are to finalize all necessary data collection
forms, gather and prepare the data, and analyze and interpret the data to understand the
problem or opportunity. As in the first two phases, researchers must be cautious to ensure
potential biases or errors are either eliminated or at least minimized.
Step 8: Collect and Prepare DataThere are two approaches to gathering data. One is to have interviewers ask questions
about variables and market phenomena or to use self-completion questionnaires. The other
is to observe individuals or market phenomena. Self-administered surveys, personal inter-
views, computer simulations, telephone interviews, and focus groups are just some of the
tools researchers use to collect data.
A major advantage of questioning over observation is questioning enables research-
ers to collect a wider array of data. Questioning approaches can collect information about
attitudes, intentions, motivations, and past behavior, which are usually invisible in obser-
vational research. In short, questioning approaches can be used to answer not just how a
person is behaving, but why.
Once primary data are collected, researchers must perform several activities before
data analysis. Researchers usually assign a numerical descriptor (code) to all response
categories so that data can be entered into the electronic data file. The data then must
be examined for coding, data-entry errors, inconsistencies, availability, and so on. Data
preparation is also necessary when information is used from internal data warehouses.
Chapter 10 discusses data preparation.
Step 9: Analyze DataIn step 9, the researcher analyzes the data. Analysis procedures vary widely in sophistication
and complexity, from simple frequency distributions (percentages) to summary statistics
(mean, median, and mode) and multivariate data analysis. In qualitative research studies,
textual and/or visual information is examined, categorized, and even sometimes tabulated.
Different procedures enable the researcher to statistically test hypotheses for significant dif-
ferences or correlations among several variables, evaluate data quality, and test models of
cause-effect relationships. Chapters 9–12 provide an overview of data analysis approaches.
www.MyEbookNiche.eCrater.com

40 Part 1 The Role and Value of Marketing Research Information
Step 10: Interpret Data to Create KnowledgeKnowledge is created for decision makers in step 10—interpretation. Knowledge is created
through engaged and careful interpretation of results. Interpretation is more than a narra-
tive description of the results. It involves integrating several aspects of the findings into
conclusions that can be used to answer the research questions.
Phase IV: Communicate the Results
The last phase of the research process is reporting the research findings to management.
The overall objective often is to prepare a nontechnical report that is useful to decision
makers whether or not they have marketing research backgrounds.
Exhibit 2.8 General Outline of a Research Proposal
TITLE OF THE RESEARCH PROPOSAL
I. Purpose of the Proposed Research Project
Includes a description of the problem and research objectives.
II. Type of Study
Discusses the type of research design (exploratory, descriptive, or causal), and
secondary versus primary data requirements, with justification of choice.
III. Definition of the Target Population and Sample Size
Describes the overall target population to be studied and determination of the
appropriate sample size, including a justification of the size.
IV. Sample Design and Data Collection Method
Describes the sampling technique used, the method of collecting data (e.g.,
observation or survey), incentive plans, and justifications.
V. Specific Research Instruments
Discusses the method used to collect the needed data, including the various types of scales.
VI. Potential Managerial Benefits of the Proposed Study
Discusses the expected values of the information to management and how the initial
problem might be solved, including the study’s limitations.
VII. Proposed Cost for the Total Project
Itemizes the expected costs for completing the research, including a total cost figure
and anticipated time frames.
VIII. Profile of the Research Company Capabilities
Briefly describes the researchers and their qualifications as well as a general
overview of the company.
IX. Optional Dummy Tables of the Projected Results
Gives examples of how the data might be presented in the final report.
www.MyEbookNiche.eCrater.com

Chapter 2 The Marketing Research Process and Proposals 41
Step 11: Prepare and Present the Final ReportStep 11 is preparing and presenting the final research report to management. The
importance of this step cannot be overstated. There are some sections that should be
included in any research report: executive summary, introduction, problem defini-
tion and objectives, methodology, results and findings, and limitations of study. In
some cases, the researcher not only submits a written report but also makes an oral
presentation of the major findings. Chapter 13 describes how to write and present
research reports.
Develop a Research Proposal
By understanding the four phases of the research process, a researcher can develop a
research proposal that communicates the research framework to the decision maker.
A research proposal is a specific document that serves as a written contract between the
decision maker and the researcher. It lists the activities that will be undertaken to develop
the needed information, the research deliverables, how long it will take, and what it
will cost.
The research proposal is not the same as a final research report quite obviously. They
are at two different ends of the process, but some of the sections are necessarily similar.
There is no best way to write a research proposal. If a client asks for research propos-
als from two or three different companies for a given research problem, they are likely
to be somewhat different in the methodologies and approach suggested for the problem.
Exhibit 2.8 shows the sections that should be included in most research proposals. The
exhibit presents only a general outline. An actual proposal can be found in the Marketing
Research in Action at the end of the chapter.
Research proposal A
specific document that
provides an overview of
the proposed research and
methodology, and serves
as a written contract be-
tween the decision maker
and the researcher.
www.MyEbookNiche.eCrater.com

42 Part 1 The Role and Value of Marketing Research Information
MARKETING RESEARCH IN ACTIONWhat Does a Research Proposal Look Like?
Magnum Hotel Preferred Guest Card Research Proposal
The purpose of the proposed research project is to collect attitudinal, behavioral, motiva-
tional, and general demographic information to address several key questions posed by
management of Benito Advertising and Johnson Properties, Inc., concerning the Magnum
Hotel Preferred Guest Card, a recently implemented marketing loyalty program. Key ques-
tions are as follows:
1. Is the Preferred Guest Card being used by cardholders?
2. How do cardholders evaluate the privileges associated with the card?
3. What are the perceived benefits and weaknesses of the card, and why?
4. Is the Preferred Guest Card an important factor in selecting a hotel?
5. How often and when do cardholders use their Preferred Guest Card?
6. Of those who have used the card, what privileges have been used and how often?
7. What improvements should be made regarding the card or the extended privileges?
8. How did cardholders obtain the card?
9. Should the Preferred Guest Card membership be complimentary or should cardholders
pay an annual fee?
10. If there should be an annual fee, how much should it be? What would a cardholder be
willing to pay?
11. What is the demographic profile of the people who have the Magnum Hotel Preferred
Guest Card?
To collect data to answer these questions, the research will be a structured, nondis-
guised design that includes both exploratory and descriptive research. The study will be
descriptive because many questions focus on identifying perceived awareness, attitudes,
and usage patterns of Magnum Hotel Preferred Guest Card holders as well as demographic
profiles. It will be exploratory since it is looking for possible improvements to the card and
its privileges, the pricing structure, and the perceived benefits and weaknesses of the cur-
rent card’s features.
The target population consists of adults known to be current cardholders of the
Magnum Hotel Preferred Guest Card Program. This population frame is approximately
17,000 individuals across the United States. Statistically a conservative sample size would
be 387. But realistically, a sample of approximately 1,500 should be used to enable exami-
nation of sample subgroups. The size is based on the likely response rate for the sampling
method and questionnaire design, a predetermined sampling error of ± 5 percent and a
confidence level of 95 percent, administrative costs and trade-offs, and the desire for a
prespecified minimum number of completed surveys.
Probability sampling will be used to draw the sample from the central cardholder data-
base. Using a mail survey, cardholders randomly selected as prospective respondents will
be mailed a personalized self-administered questionnaire. Attached to the questionnaire
will be a cover letter explaining the study as well as incentives for respondent participation.
www.MyEbookNiche.eCrater.com

Chapter 2 The Marketing Research Process and Proposals 43
Given the nature of the study, the perceived type of cardholder, the trade-offs regarding
costs and time considerations, and the use of incentives to encourage respondent participa-
tion, a mail survey is more appropriate than other methods.
The questionnaire will be self-administered. That is, respondents will fill out the sur-
vey in the privacy of their home and without the presence of an interviewer. All survey
questions will be pretested using a convenience sample to assess clarity of instructions,
questions, and administrative time dimensions. Response scales for the questions will con-
form to questionnaire design guidelines and industry judgment.
Given the nature of the proposed project, the findings will enable Magnum Hotel’s
management to answer questions regarding the Preferred Guest Card as well as other mar-
keting strategy issues. Specifically, the study will help management:
∙ Better understand the types of people using the Preferred Guest Card and the extent
of usage.
∙ Identify issues that suggest evaluating (and possibly modifying) current marketing
strategies or tactics for the card and its privileges.
∙ Develop insights concerning the promotion and distribution of the card to additional
segments.
Additionally, the proposed research project will initiate a customer database and infor-
mation system so management can better understand customers’ hotel service needs and
wants. Customer-oriented databases will be useful in developing promotional strategies as
well as pricing and service approaches.
Proposed Project Costs
Questionnaire/cover letter design and reproduction costs $ 3,800
Development, Typing, Pretest, Reproduction (1,500),
Envelopes (3,000)
Sample design 2,750
Administration/data collection costs 4,800
Questionnaire packet assembly
Postage and P.O. Box
Address labels
Coding and predata analysis costs 4,000
Coding and setting of final codes
Data entry
Computer programming
Data analysis and interpretation costs 7,500
Written report and presentation costs 4,500
Total maximum proposed project cost* $27,350
*Costing policy: Some items may cost more or less than what is stated on the proposal. Cost reductions, if any, will
be passed on to the client. Additionally, there is a ± 10 percent cost margin for data collection and analysis activities
depending on client changes of the original analysis requirements.
Research for this proposed project will be conducted by the Marketing Resource
Group (MRG), a full-service marketing research firm located in Tampa, Florida, that has
conducted studies for many Fortune 1,000 companies. The principal researcher and project
coordinator will be Dr. Alex Smith, senior project director at MRG. Smith holds a PhD in
marketing from Louisiana State University, an MBA from Illinois State University, and a
www.MyEbookNiche.eCrater.com

BS from Southern Illinois University. With 25 years of marketing research experience, he
has designed and coordinated numerous projects in the consumer packaged-goods prod-
ucts, hotel/resort, retail banking, automobile, and insurance industries. He specializes in
projects that focus on customer satisfaction, service/product quality, market segmentation,
and general consumer attitudes and behavior patterns as well as interactive electronic mar-
keting technologies. In addition, he has published numerous articles on theoretical and
pragmatic research topics.
Hands-On Exercise1. If this proposal is accepted, will it achieve the objectives of management?
2. Is the target population being interviewed the appropriate one?
3. Are there other questions that should be asked in the project?
44 Part 1 The Role and Value of Marketing Research Information
Summary
Describe the major environmental factors influenc-
ing marketing research.
Several key environmental factors have significant impact
on changing the tasks, responsibilities, and efforts associ-
ated with marketing research practices. Marketing research
has risen from a supporting role within organizations
to being integral in strategic planning. The Internet and
e-commerce, gatekeeper technologies and data privacy leg-
islation, and new global market structure expansions are all
forcing researchers to balance their use of secondary and
primary data to assist decision makers in solving decision
problems and taking advantage of opportunities. Research-
ers need to improve their ability to use technology-driven
tools and databases. There are also greater needs for faster
data acquisition and retrieval, analysis, and interpretation
of cross-functional data and information among decision-
making teams within global market environments.
Discuss the research process and explain the various
steps.
The information research process has four major phases,
identified as (1) determine of the research problem;
(2) select the appropriate research design; (3) execute the
research design; and (4) communicate the results. To achieve
the overall objectives of each phase, researchers must be able
to successfully execute 11 interrelated task steps: (1) iden-
tify and clarify information needs; (2) define the research
problem and questions; (3) specify research objectives and
confirm the information value; (4) determine the research
design and data sources; (5) develop the sampling design
and sample size; (6) examine measurement issues and
scales; (7) design and pretest questionnaires; (8) collect and
prepare data; (9) analyze data; (10) interpret data to create
knowledge; and (11) prepare and present the final report.
Distinguish between exploratory, descriptive, and
causal research designs.
The main objective of exploratory research designs is to
create information that the researcher or decision maker
can use to (1) gain a clear understanding of the problem;
(2) define or redefine the initial problem, separating the
symptoms from the causes; (3) confirm the problem and
objectives; or (4) identify the information requirements.
Exploratory research designs are often intended to provide
preliminary insight for follow-up quantitative research.
However, sometimes qualitative exploratory methods are
used as standalone techniques because the topic under
investigation requires in-depth understanding of a com-
plex web of consumer culture, psychological motiva-
tions, and behavior. For some research topics, quantitative
research may be too superficial or it may elicit responses
from consumers that are rationalizations rather than true
reasons for purchase decisions and behavior.
Descriptive research designs produce numeric
data to describe existing characteristics (e.g., attitudes,
intentions, preferences, purchase behaviors, evalua-
tions of current marketing mix strategies) of a defined
target population. The researcher looks for answers to
how, who, what, when, and where questions. Informa-
tion from descriptive designs allows decision makers to
draw inferences about their customers, competitors, tar-
get markets, environmental factors, or other phenomena.
www.MyEbookNiche.eCrater.com

Chapter 2 The Marketing Research Process and Proposals 45
Finally, causal research designs are most useful
when the research objectives include the need to under-
stand why market phenomena happen. The focus of
causal research is to collect data that enables the deci-
sion maker or researcher to model cause-and-effect rela-
tionships between two or more variables.
Identify and explain the major components of a re-
search proposal.
Once the researcher understands the different phases
and task steps of the information research process,
he or she can develop a research proposal. The pro-
posal serves as a contract between the researcher and
decision maker. There are nine sections suggested for
inclusion: (1) purpose of the proposed research proj-
ect; (2) type of study; (3) definition of the target popu-
lation and sample size; (4) sample design, technique,
and data collection method; (5) research instruments;
(6) potential managerial benefits of the proposed
study; (7) proposed cost structure for the project; (8)
profile of the researcher and company; and (9) dummy
tables of the projected results.
Key Terms and Concepts
Causal research 37
Census 38
Descriptive research 36
Exploratory research 36
Gatekeeper technologies 26
Information research process 27
Knowledge 30
Primary data 26
Research proposal 41
Sample 38
Scientific method 30
Secondary data 26
Situation analysis 32
Target population 38
Unit of analysis 34
Review Questions
1. Identify the significant changes taking place in to-
day’s business environment that are forcing man-
agement decision makers to rethink their views of
marketing research. Also discuss the potential impact
that these changes might have on marketing research
activities.
2. In the business world of the 21st century, will it be
possible to make critical marketing decisions without
marketing research? Why or why not?
3. How are management decision makers and informa-
tion researchers alike? How are they different? How
might the differences be reduced between these
two types of professionals?
4. Comment on the following statements:
a. The primary responsibility for determining
whether marketing research activities are neces-
sary is that of the marketing research specialist.
b. The information research process serves as a
blueprint for reducing risks in making marketing
decisions.
c. Selecting the most appropriate research design is
the most critical task in the research process.
5. Design a research proposal that can be used to ad-
dress the following decision problem: “Should the
Marriott Hotel in Pittsburgh, Pennsylvania, reduce
the quality of its towels and bedding in order to im-
prove the profitability of the hotel’s operations?”
www.MyEbookNiche.eCrater.com

46 Part 1 The Role and Value of Marketing Research Information
Discussion Questions
1. For each of the four phases of the information
research process, identify the corresponding steps
and develop a set of questions that a researcher
should attempt to answer.
2. What are the differences between exploratory,
descriptive, and causal research designs? Which
design type would be most appropriate to address
the following question: “How satisfied or dissatis-
fied are customers with the automobile repair ser-
vice offerings of the dealership from which they
purchased their new 2013 BMW?”
3. When should a researcher use a probability sampling
method rather than a nonprobability method?
4. EXPERIENCE MARKETING RESEARCH. Go
to the Gallup poll organization’s home page at www
.gallup.com.
a. Several polls are reported on their home page. After
reviewing one of the polls, outline the different phases
and task steps of the information research process that
might have been used in the Gallup Internet poll.
b. Is the research reported by the poll exploratory,
descriptive, or causal? Explain your choice.
www.MyEbookNiche.eCrater.com

Designing
the Marketing
Research Project
P a r t 2
www.MyEbookNiche.eCrater.com

Secondary Data, Literature Reviews, and Hypotheses
C h a p t e r 3
www.MyEbookNiche.eCrater.com

Learning Objectives After reading this chapter, you will be able to:
1. Understand the nature and role of secondary data.
2. Describe how to conduct a literature review.
3. Identify sources of internal and external secondary data.
4. Discuss conceptualization and its role in model development.
5. Understand hypotheses and independent and dependent variables.
Will Brick-and-Mortar Stores Eventually Turn into Product Showrooms?
Research conducted during the recent holiday shopping season provided evidence
of an important and growing trend in shopping: using one’s mobile phone while
shopping in a store as an aid in making purchasing decisions. Pew American and
Internet Life conducted a study of 1,000 U.S. adults regarding their mobile phone
use while shopping. Over half of consumers (52 percent) reported using their
mobile phone to help them make a purchase decision while shopping in a bricks-
and-mortar store during the holiday season.
There were three specific ways the mobile phones were used. First, fully
38 percent of respondents reported using the cell phone to call a friend for advice
while in a store. Second, 24 percent of respondents used mobile devices to search
for online product reviews. Last, one in four shoppers used their mobile phone to
compare prices, for example, using Amazon’s barcode scan service to search for
more competitive prices.
Some categories of consumers were more likely to use the mobile phone
to help them while shopping in brick-and-mortar stores. Younger (18–49), non-
white, and male consumers were more likely to use their cell phones to search
for product information, but the trend is also evident in white and female shopper
populations. The research findings show that brick-and-mortar businesses can
easily lose business to shoppers looking for better or more competitively priced
products. Online retailers have opportunities to increase their sales, especially if
they can provide timely information and good prices to shoppers using mobile
devices. Another trend relevant to marketers is highlighted by the research as
well: while friends and family have always had an important role in recommend-
ing products, their availability via mobile devices has enhanced their influence.
Businesses and marketers will increasingly have to implement tactics that help
them to influence customers in an environment where both personal and online
sources are easily available at the point of decision.
Pew Internet and American Life’s research on mobile phone use while shop-
ping is available at their website and is published at several other media sites as
www.MyEbookNiche.eCrater.com

well. Their study is an example of secondary data, and in this case, the research is available
for free. Yet, the information may have relevance to a broad variety of businesses, includ-
ing offline and online retailers, mobile app developers, and wireless carriers. To use the
study effectively, most businesses will have to evaluate how applicable the findings are to
their particular industry. For example, to better understand the in-store mobile usage trend,
the industries that could benefit might search for other free online sources of similar infor-
mation, purchase additional secondary research that is more specific to their industry, and
if necessary, conduct primary research.1
50 Part 2 Designing the Marketing Research Project
Value of Secondary Data and Literature Reviews
This chapter focuses on the types of secondary data available, how they can be used, the
benefits they offer, and the impact of the Internet on the use of secondary data. We also
explain how to conduct background research as part of a literature review and how to report
information found in completing a literature review. A literature review is an important
step in developing an understanding of a research topic and supports the conceptualization
and development of hypotheses, the last topic in this chapter.
Nature, Scope, and Role of Secondary DataOne of the essential tasks of marketing research is to obtain information that enables man-
agement to make the best possible decisions. Before problems are examined, researchers
determine whether useful information already exists, how relevant the information is, and
how it can be obtained. Existing sources of information are plentiful and should always be
considered first before collecting primary data.
The term secondary data refers to data gathered for some other purpose than the
immediate study. Sometimes it is called “desk research” while primary research is called
“field research.” There are two types of secondary data: internal and external. Internal
secondary data are collected by a company for accounting purposes, marketing programs,
inventory management, and so forth.
External secondary data are collected by outside organizations such as federal
and state governments, trade associations, nonprofit organizations, marketing research
services, or academic researchers. Secondary data also are widely available from the
Internet and other digital data sources. Examples of these digital information sources
include information vendors, federal and government websites, and commercial
websites.
The role of secondary data in marketing research has changed in recent years.
Traditionally, secondary data were viewed as having limited value. The job of obtain-
ing secondary data often was outsourced to a corporate librarian, syndicated data
collection firm, or junior research analyst. With the increased emphasis on business
and competitive intelligence and the ever-increasing availability of information from
online sources, secondary data research has gained substantial importance in market-
ing research.
Secondary research approaches are increasingly used to examine marketing prob-
lems because of the relative speed and cost-effectiveness of obtaining the data. The role
of the secondary research analyst is being redefined to that of business unit information
Secondary data Data not
gathered for the immediate
study at hand but for some
other purpose.
Internal secondary
data Data collected by
the individual company for
accounting purposes or
marketing activity reports.
External secondary
data Data collected by out-
side agencies such as the
federal government, trade
associations, or periodicals.
www.MyEbookNiche.eCrater.com

Chapter 3 Secondary Data, Literature Reviews, and Hypotheses 51
professional or specialist linked to the information technology area. This individual creates
contact and sales databases, prepares competitive trend reports, develops customer reten-
tion strategies, and so forth.
Conducting a Literature Review
A literature review is a comprehensive examination of available secondary information related
to your research topic. Secondary data relevant to your research problem obtained in a literature
review should be included in the final report of findings. This section of the report typically is
labeled “background research,” or “literature review.” Secondary research alone may some-
times provide the answer to your research question, and no further research will be required.
But even if analysts plan to conduct primary research, a literature review can be helpful
because it provides background and contextual information for the current study; clarifies
thinking about the research problem and questions that are the focus of the study; reveals
whether information already exists that addresses the issue of interest; helps to define
important constructs of interest to the study; and suggests sampling and other method-
ological approaches that have been successful in researching similar topics.
Reviewing available literature helps researchers stay abreast of the latest thinking
related to their topic of interest. In most industries, there are some widely known and cited
studies. For example, the Interactive Advertising Bureau (IAB) is an industry organization
whose members are a “Who’s Who” of online publishers and advertisers. The IAB has
conducted a number of high-profile studies that are well known to industry members and
available on their website. The studies report what works and doesn’t work in online adver-
tising. An analyst conducting research in the area of online advertising who is not familiar
with major published studies, such as those conducted by the IAB, would likely have dif-
ficulty establishing their expertise with clients, many of whom are aware of these studies.
An important reason for doing a literature review is that it can help clarify and define
the research problem and research questions. Suppose an online advertiser wants to study
how consumers’ engagement with online advertising affects their attitude toward the brand,
website visits, and actual purchase behavior. A literature review would uncover other pub-
lished studies on the topic of consumer advertising engagement, as well as the different
ways to define and measure consumer engagement.
A literature review can also suggest research hypotheses to investigate. For example,
a literature review may show that frequent Internet shoppers are more likely to be engaged
with online advertising; that engagement increases positive attitudes toward the brand; or
that younger people are more likely to become engaged with an online ad. The studies you
locate may not provide answers to specific research questions. But they will provide some
ideas for issues and relationships to investigate.
Importantly, literature reviews can identify scales to measure variables and research
methodologies that have been used successfully to study similar topics. For instance, if
a researcher wants to measure the usability of a website, a literature review will locate
published studies that suggest checklists of important features of usable sites. Reviewing
previous studies will save researchers time and effort because new scales will not need to
be developed from scratch.
Evaluating Secondary Data SourcesLiterature reviews may include a search of popular, scholarly, government, and commer-
cial sources available outside the company. An internal search of available information
Literature review A
comprehensive examination
of available information that
is related to your research
topic.
www.MyEbookNiche.eCrater.com

52 Part 2 Designing the Marketing Research Project
within the company also should be conducted. With the advent of the Internet, conduct-
ing a literature review has become both easier and harder. It is easier in the sense that
a wide variety of material may be instantly available. Thus, finding relevant published
studies has become easier than ever. But wading through the search results to find the
studies that are actually of interest can be overwhelming. It is important, therefore, to
narrow your topic so that you can focus your efforts before conducting a search for
relevant information.
With the increasing emphasis on secondary data, researchers have developed criteria
to evaluate the quality of information obtained from secondary data sources. The criteria
used to evaluate secondary data are:
1. Purpose. Because most secondary data are collected for purposes other than the one
at hand, the data must be carefully evaluated on how it relates to the current research
objective. Many times the data collected in a particular study is not consistent
with the research objectives at hand. For example, industry research may show
that today’s consumers are spending less on new cars than they did in the 1980s.
But a car company may be more interested in a specific demographic group,
for example, high-income women, or the market for a specific type of car, for
example, luxury sedans.
2. Accuracy. Accuracy is enhanced when data are obtained from the original source of
the data. A lot of information in industries may be cited repeatedly without checking
the original source.
In addition to going back to the original source of the data, it is important to
evaluate whether or not the data are out of date. For example, a researcher tracking
the sales of imported Japanese autos in the U.S. market needs to consider changing
attitudes, newly imposed tariffs that may restrict imports, and even fluctuations in the
exchange rate.
3. Consistency. When evaluating any source of secondary data, a good strategy is to
seek out multiple sources of the same data to assure consistency. For example, when
evaluating the economic characteristics of a foreign market, a researcher may try to
gather the same information from government sources, private business publications
(Fortune, Bloomberg Businessweek), and specialty import/export trade publications.
Researchers should attempt to determine the source(s) of any inconsistencies in the
information they gather.
4. Credibility. Researchers should always question the credibility of the second-
ary data source. Technical competence, service quality, reputation, training, and
expertise of personnel representing the organization are some of the measures of
credibility.
5. Methodology. The quality of secondary data is only as good as the methodol-
ogy employed to gather it. Flaws in methodological procedures can produce
results that are invalid, unreliable, or not generalizable beyond the study
itself. Therefore, the researcher must evaluate the size and description of the
sample, the response rate, the questionnaire, and the data collection method (telephone,
mobile device, or personal interview).
6. Bias. Researchers must determine the underlying motivation or hidden agenda, if any,
of the organization that collected the secondary data. It is not uncommon to find sec-
ondary data sources published to advance the interests of commercial, political, or
other special interest groups. Researchers must consider whether the organization re-
porting the data is motivated by a certain purpose. For example, statistics on animal
www.MyEbookNiche.eCrater.com

Chapter 3 Secondary Data, Literature Reviews, and Hypotheses 53
extinction reported by the National Hardwood Lumber Association or, alternatively,
by the People for the Ethical Treatment of Animals (PETA) should be validated before
they can be relied on as unbiased sources of information.
Secondary Data and the Marketing Research ProcessIn many areas of marketing research, secondary research plays a subordinate role to pri-
mary research. In product and advertising concept testing, focus groups, and customer
satisfaction surveys, only primary research can provide answers to marketing problems.
But in some situations, secondary data by itself can address the research problem. If the
problem can be solved based on available secondary data alone, then the company can save
time, money, and effort.
The amount of secondary information is indeed vast. Secondary data often sought
by researchers include demographic characteristics, employment data, economic statistics,
competitive and supply assessments, regulations, and international market characteristics.
Exhibit 3.1 provides examples of specific variables within these categories.
Exhibit 3.1 Key Descriptive Variables Sought in Secondary Data Search
Demographics
Population growth: actual and projected
Population density
In-migration and out-migration patterns
Population trends by age, race, and ethnic
background
Employment Characteristics
Labor force growth
Unemployment levels
Percentage of employment by occupation
categories
Employment by industry
Economic Data
Personal income levels (per capita and
median)
Type of manufacturing/service firms
Total housing starts
Building permits issued
Sales tax rates
Competitive Characteristics
Levels of retail and wholesale sales
Number and types of competing retailers
Availability of financial institutions
Supply Characteristics
Number of distribution facilities
Cost of deliveries
Level of rail, water, air, and road
transportation
Regulations
Taxes
Licensing
Wages
Zoning
International Market Characteristics
Transportation and exporting requirements
Trade barriers
Business philosophies
Legal system
Social customs
Political climate
Cultural patterns
Religious and moral backgrounds
www.MyEbookNiche.eCrater.com

54 Part 2 Designing the Marketing Research Project
Several kinds of secondary sources are available, including internal, popular, aca-
demic, and commercial sources. We describe each of these categories of secondary
sources.
Internal and External Sources of Secondary Data
Secondary data are available both within the company and from external sources. In this
section, we look at the major internal and external sources of secondary data.
Internal Sources of Secondary DataThe logical starting point in searching for secondary data is the company’s own internal
information. Many organizations fail to realize the wealth of information their own records
contain. Additionally, internal data are the most readily available and can be accessed at
little or no cost at all. But while this appears to be a good rationale for using internal data,
researchers must remember that most of the information comes from past business activi-
ties. Nevertheless, internal data sources can be highly effective in helping decision makers
plan new-product introductions or new distribution outlets.
Generally, internal secondary data consist of sales, accounting, or cost
information. Exhibit 3.2 lists key variables found in each of these internal sources of sec-
ondary data.
Other types of internal data that exist among company records can be used to comple-
ment the information thus far discussed. Exhibit 3.3 outlines other potential sources of
internal secondary data.
A lot of internal company information is available for marketing research activi-
ties. If maintained and categorized properly, internal data can be used to analyze prod-
uct performance, customer satisfaction, distribution effectiveness, and segmentation
strategies. These forms of internal data are also useful for planning new-product intro-
ductions, product deletions, promotional strategies, competitive intelligence, and cus-
tomer service tactics.
External Sources of Secondary DataAfter searching for internal secondary data, the next logical step for the researcher to focus on
is external secondary data. Primary sources of external secondary data include: (1) popular
sources; (2) scholarly sources; (3) government sources; (4) North American Industry
Classification System (NAICS); and (5) commercial sources.
Popular Sources Many popular sources are available both in the library and on the Inter-
net. Examples of popular sources include Bloomberg Businessweek, Forbes, Harvard Busi-
ness Review, Wired, and so on. Most popular articles are written for newspapers and
periodicals by journalists or freelance writers. Popular sources are often more current than
scholarly sources and are written using less technical language. However, the findings and
ideas expressed in popular sources often involve secondhand reporting of information.
Moreover, while scholarly findings are reviewed by peers prior to publication, findings
reported in journalistic publications receive much less scrutiny.2
Many business students are already familiar with the business articles and
resources offered by ABI/Inform or Lexus/Nexus. These databases can be searched
www.MyEbookNiche.eCrater.com

Chapter 3 Secondary Data, Literature Reviews, and Hypotheses 55
Exhibit 3.2 Common Sources of Internal Secondary Data
1. Sales invoices
a. Customer name
b. Address
c. Class of product/service sold
d. Price by unit
e. Salesperson
f. Terms of sales
g. Shipment point
2. Accounts receivable reports
a. Customer name
b. Product purchased
c. Total unit and dollar sales
d. Customer as percentage of sales
e. Customer as percentage of regional
sales
f. Profit margin
g. Credit rating
h. Items returned
i. Reason for return
3. Quarterly sales reports
a. Total dollar and unit sales by:
Customer Geographic segment
Customer segment Sales territory
Product Sales rep
Product segment
b. Total sales against planned
objectives
c. Total sales against budget
d. Total sales against prior periods
e. Actual sales percentage
increase/decrease
f. Contribution trends
4. Sales activity reports
a. Classification of customer accounts
Mega
Large
Medium
Small
b. Available dollar sales potential
c. Current sales penetration
d. Existing bids/contracts by
Customer location
Product
Exhibit 3.3 Additional Sources of Secondary Data
Source Information
Customer letters General satisfaction/dissatisfaction data
Customer comment cards Overall performance data
Mail-order forms Customer name, address, items purchased, quality,
cycle time of order
Credit applications Detailed biography of customer segments (demographic,
socioeconomic, credit usage, credit ratings)
Cash register receipts Dollar volume, merchandise type, salesperson, vendor,
manufacturer
Salesperson expense reports Sales activities, competitor activities in market
Employee exit interviews General internal satisfaction/dissatisfaction data,
internal company performance data
Warranty cards Sales volume, names, addresses, zip codes, items
purchased, reasons for product return
Past marketing research studies Data pertaining to the situation in which the marketing
research was conducted
www.MyEbookNiche.eCrater.com
56 Part 2 Designing the Marketing Research Project
through online library gateways at most colleges and universities. The databases cover
many publications that are “walled off” and thus not available through major search
engines. For example, both The New York Times and The Wall Street Journal pro-
vide excellent business news. However, search engines currently do not access the
archives of these and other prominent newspapers. Most libraries pay for access to
many newspaper and business publications through arrangements with ABI/Inform
and Lexus/Nexus.
A great deal of information is available on the Internet without subscription to
library databases. Search engines continually catalog this information and return the
most relevant and most popular sites for particular search terms. Google, Yahoo!,
and Bing are all good at locating published studies. Before performing an online
search, it is useful to brainstorm several relevant keywords to use in search engines.
For example, if you are interested in word-of-mouth marketing, several terms might
make useful search terms: buzz marketing, underground marketing, and stealth
marketing.
Some popular sources are publications staffed by writers who are marketing practi-
tioners and analysts. For instance, the contributors at www.Clickz.com who write articles
about a wide variety of online marketing issues are specialists in the areas they cover.
Therefore, the opinions and analyses they offer are timely and informed by experience.
Nevertheless, their opinions, while reflective of their experience and in-depth knowledge,
have not been investigated with the same level of care as those available in scholarly
publications.
One more possible source is marketing blogs. Many marketing writers and analysts
have their own blogs. These sources must be chosen very carefully because anyone can
write and post a blog. Only a blog that is written by a respected expert is worthy of men-
tion in your literature review. Exhibit 3.4 lists some marketing blogs of note. Good blogs
that are written by high-profile practitioners and analysts are often provocative and up to
date. They often suggest perspectives that are worthy of consideration in the design and
execution of your study.
Exhibit 3.4 Marketing Blogs of Note
Hootsuite
Unbounce
OKDork
Buffer
Customer.io
MarketingProfs
Mailchimp
Kissmetrics
Drip
e-Consulting.com
Vidyard
Seth’s Blogs
DuctTapeMarketing
Hubspot
BrandSavant
TopRank
LinkedInPulse
Social Media Examiner
Sources: Orinna Weaver, “The Best Blogs of 2015” Radius.com, https://radius.com/2015/03/10/the-best-marketing
-blogs-of-2015/ (March 10, 2015); Dusti Arab, “Top 16 Marketing Blogs to Follow in 2015”, Instapage, Inc., https:
//instapage.com/landing-pages, January 22, 2016; Jay Baer, “My Top 33 Digital Marketing Blogs,” Convince & Convert,
http://www.convinceandconvert.com/digital-marketing/my-top-33-digital-marketing-blogs/, accessed February 7, 2016.
www.MyEbookNiche.eCrater.com

Chapter 3 Secondary Data, Literature Reviews, and Hypotheses 57
Blog writers may also provide insightful commentary and critical analysis of pub-
lished studies and practices that are currently being discussed by experts in the field. How-
ever, even blogs written by the most respected analysts express viewpoints that may be
speculative and unproven. When writing your literature review, you will want to be clear in
noting that these blogs are often more opinion than fact.
All popular sources you find on the web need to be carefully evaluated. Check the
“About Us” portion of the website to see who is publishing the articles or studies to see if
the source of the material is reputable. Another issue to consider is that marketing studies
found on websites sometimes promote the business interest of the publisher. For instance,
studies published by the IAB have to be carefully scrutinized for methodological bias
because the IAB is a trade organization that represents businesses that will benefit when
Internet advertising grows. Ideally, you are looking for the highest quality information by
experts in the field. When sources are cited and mentioned more often, studies or blogs are
more likely to be credible.3
Scholarly Sources Google has a specialized search engine dedicated to scholarly articles
called Google Scholar. Using Google’s home page search function rather than Google
Scholar will identify some scholarly articles, but will include many other kinds of results
that make scholarly articles difficult to identify. If you go to Google Scholar, and type “on-
line shopping,” for instance, Google Scholar (www.Scholar.Google.com) will list pub-
lished studies that address online shopping. Google Scholar counts how many times a
study is referenced by another document on the web and lists that number in the search
results; the result says “cited by” and lists the number of citations. The number of citation
counts is one measure of the importance of the article to the field.
Some of the studies listed by Google Scholar will be available online from any loca-
tion. You may have access to others only when you are at school or through a library
gateway. Most colleges and universities pay fees for access to scholarly published papers.
If you are on campus while you are accessing these sources, many journal publishers
read the IP address of the computer you are using, and grant access based on your loca-
tion. In particular, articles in JSTOR, which hosts many of the top marketing journals,
may be accessible through any computer linked to your campus network. However, some
journals require you to go through the library gateway to obtain access whether you are
on or off campus.
Both popular and scholarly sources can be tracked using web-based bookmarking
tools such as Delicious, Google Bookmarks, Xmarks, Bundlr, and Diigo that will help you
organize your sources. Using these bookmarking tools, you can keep track of the links for
research projects, take notes about each of the sites, and “tag” the links with your choice of
search terms to make future retrieval of the source easy. Bookmarking tools also facilitate
exchanges with a social network so they can be very helpful in sharing sources with mul-
tiple members of the research team.
Government Sources Detail, completeness, and consistency are major reasons for using
U.S. government documents. In fact, U.S. Bureau of the Census reports are the statistical
foundation for most of the information available on U.S. population and economic activi-
ties. You can find census reports and data at census.gov. Exhibit 3.5 lists some of the com-
mon sources of secondary data available from the U.S. government.
There are two notes of caution about census data and often other types of second-
ary data. First, census data are collected only every 10 years with periodic updates, so
www.MyEbookNiche.eCrater.com

58 Part 2 Designing the Marketing Research Project
researchers always need to consider the timeliness of census data. Second, census data
include only a limited number of topics. As with other secondary data, predefined cat-
egories of variables such as age, income, and occupation may not always meet user
requirements.
A final source of information available through the U.S. government is the Catalog of
Government Publications (http://catalog.gpo.gov/F). This catalog indexes major market
research reports for a variety of domestic and international industries, markets, and institu-
tions. It also provides an index of publications available to researchers from July 1976 to
the current month and year.
Exhibit 3.5 Common Government Reports Used as Secondary Data Sources
U.S. Census Data
Census of Agriculture
Census of Construction
Census of Government
Census of Manufacturing
Census of Mineral Industries
Census of Retail Trade
Census of Service Industries
Census of Transportation
Census of Wholesale Trade
Census of Housing
Census of Population
U.S. Census Reports
Economic Indicators
County Business Patterns
American Fact Finder
Foreign Trade
Additional Government Reports
Economic Report of the President
Federal Reserve Bulletin
Statistics of Income
Survey of Current Business
Monthly Labor Review
The owners of the Santa Fe Grill believe secondary data
may be useful in better understanding how to run a res-
taurant. Based on what you have learned in this chapter
about secondary data, that should be true.
1. What kinds of secondary data are likely to be useful?
2. Conduct a search of secondary data sources for
material that could be used by the Santa Fe Grill
owners to better understand the problems/opportunities
facing them. Use Google, Yahoo!, Twitter, or other search
tools to do so.
3. What key words would you use in the search?
4. Summarize what you found in your search.
CONTINUING CASE STUDY THE SANTA FE GRILL MEXICAN RESTAURANT USING SECONDARY DATA
www.MyEbookNiche.eCrater.com

Chapter 3 Secondary Data, Literature Reviews, and Hypotheses 59
North American Industry Classification System (NAICS) An initial step in any sec-
ondary data search is to use the numeric listings of the North American Industry
Classification System codes. NAICS codes are designed to promote uniformity in data
reporting by federal and state government sources and private business. The federal gov-
ernment assigns every industry an NAICS code. Businesses within each industry report all
activities (sales, payrolls, taxation) according to their code. Currently, there are 99 two-
digit industry codes representing everything from agricultural production of crops to envi-
ronmental quality and housing.
Within each two-digit industry classification code is a four-digit industry group
code representing specific industry groups. All businesses in the industry represented
by a given four-digit code report detailed information about the business to vari-
ous sources for publication. For example, as shown in Exhibit 3.6, NAICS code 12 is
assigned to coal mining and NAICS code 1221 specifies bituminous coal and lignite,
surface extraction. It is at the four-digit level where the researcher will concentrate most
data searches. NAICS data are now accessible on the Internet at www.census.gov/eos
/www/naics/.
Commercial Sources—Syndicated Data A major trend in marketing research is to-
ward a greater dependency on syndicated data sources. The rationale for this is that
companies can obtain substantial information from a variety of industries at a relatively
low cost.
Exhibit 3.6 Sample List of North American Industry Classification System Codes
Numeric Listing
10—Metal Mining
1011 Iron Ores
1021 Copper Ores
1031 Lead & Zinc Ores
1041 Gold Ores
1044 Silver Ores
1061 Ferroalloy Ores except Vanadium
1081 Metal Mining Services
1094 Uranium, Radium & Vanadium Ores
1099 Metal Ores Nec*
12—Coal Mining
1221 Bituminous Coal & Lignite—Surface
1222 Bituminous Coal—Underground
1231 Anthracite Mining
1241 Coal Mining Services
13—Oil & Gas Extraction
1311 Crude Petroleum & Natural Gas
1321 Natural Gas Liquids
1381 Drilling Oil & Gas Wells
1382 Oil & Gas Exploration Services
1389 Oil & Gas Field Services Nec*
14—Nonmetallic Minerals except Fuels
1411 Dimension Stone
1422 Crushed & Broken Limestone
1423 Crushed & Broken Granite
1429 Crushed & Broken Stone Nec*
1442 Construction Sand & Gravel
1446 Industrial Sand
*Not elsewhere classified.
Source: Ward Business Directory of U.S. Private and Public Companies, 2007, Gale Cengage Learning.
North American Industry
Classification System
(NAICS) A system that
codes numerical industrial
listings designed to promote
uniformity in data report-
ing procedures for the U.S.
government.
www.MyEbookNiche.eCrater.com

60 Part 2 Designing the Marketing Research Project
Syndicated data, or commercial data, are market research data that are collected,
packaged, and sold to many different firms. The information is in the form of tabulated
reports prepared specifically for a client’s research needs, often tailored to specific
reporting divisions—examples might include sales of consumer product categories
such as coffee, detergents, toilet tissue, carbonated beverages, and so on. Reports also
may be organized by geographic region, sales territory, market segment, product class,
or brand.
Suppliers traditionally have used two methods of data collection: consumer panels and
store audits. A third method that has increased rapidly in recent years is obtained using
optical-scanner technology. Scanner data are most often obtained at the point of purchase
in supermarkets, drugstores, and other types of retail outlets.
Consumer panels consist of large samples of households that have agreed to provide
detailed data for an extended period of time. Information provided by these panels typically
consists of product purchase information or media habits, often on the consumer pack-
age goods industry. But information obtained from optical scanners is increasingly being
used as well.
Panels typically are developed by marketing research firms and use a rigorous data
collection approach. Respondents are required to record detailed behaviors at the time of
occurrence on a highly structured questionnaire. The questionnaire contains a large number
of questions related directly to actual product purchases or media exposure. Most often this
is an ongoing procedure whereby respondents report data back to the company on a weekly
or monthly basis. Panel data are then sold to a variety of clients after being tailored to the
client’s research needs.
A variety of benefits are associated with panel data. These include (1) lower cost than
primary data collection methods; (2) rapid availability and timeliness; (3) accurate reporting
of socially sensitive expenditures, for example, beer, liquor, cigarettes, generic brands; and
(4) high level of specificity, for instance, actual products purchased or media habits, not
merely intentions or propensities to purchase.
There are two types of panel-based data sources: those reflecting actual purchases of
products and services and those reflecting media habits. The discussion below provides
examples of both types.
A variety of companies offer panel-based purchasing data. NPD Group (www.npd.com)
provides syndicated research for numerous industry sectors, including automotive, beauty,
technology, entertainment, fashion, food, office supplies, software, sports, toys, and wire-
less. NPD’s online consumer panel consists of more than 2 million registered adults
and teens who have agreed to participate in their surveys. The consumer panel data can
be combined with retail point-of-sale information to offer more complete information
about markets.
Two of NPD’s most commonly used data sources are the Consumer Report on
Eating Share Trends (CREST) and National Eating Trends (NET). CREST tracks con-
sumer purchases of restaurant and prepared meals and snacks in France, Germany,
Japan, Spain, the United Kingdom, the United States, and Canada. NET provides con-
tinuous tracking of in-home food and beverage consumption patterns in the United
States and Canada.
TSN Global offers a myriad of research services, including product tests, concept
tests, and attitude, awareness, and brand-usage studies. The research firm has a net-
work of online managed access panels that includes North America, Europe, and Asia
Pacific. Consumers can sign up to participate in their online panels at Mysurvey.com. TSN
Globals’ panels offer not only speed and low cost, but also the ability to efficiently manage
international studies.
Syndicated (or commercial)
data Data that has been
compiled according to some
standardized procedure;
provides customized data for
companies, such as market
share, ad effectiveness, and
sales tracking.
Consumer panels Large
samples of households that
provide specific, detailed
data on purchase behavior
for an extended period
of time.
www.MyEbookNiche.eCrater.com

Chapter 3 Secondary Data, Literature Reviews, and Hypotheses 61
Mintel has offices in locations around the world, including London, Chicago,
Shanghai, Mumbai, Sao Paulo, and Tokyo. The firm tracks consumer spending across
34 countries. Mintel provides syndicated data for specific industries such as beauty,
food and drink, and household and personal care. As well, the research firm studies
everything about new products, as it collects and categorizes information about 33,000
new products every month by using local shoppers to obtain information directly from
the field.4
The following list describes additional syndicated data companies and the consumer
panels they maintain:
∙ J. D. Power and Associates maintains a consumer panel of car and light-truck owners
to provide data on product quality, satisfaction, and vehicle dependability.
∙ GfK Roper Consulting offers subscription to their syndicated services. Their reports
are available for the United States and Worldwide, providing information about de-
mographics, lifestyles, values, attitudes, and buying behavior. Their panels collec-
tively are representative of 90 percent of the world’s GDP.5
∙ Creative and Response Research Services maintains a consumer panel called
Youthbeat (www.crresearch.com) that provides monthly tracking of kids’,
tweens’, and teens’ opinions of music, media usage, gaming, shopping, cell
phones, and awareness of causes. The research provides an “encyclopedic view of
youth marketing that covers the world of children from the time they enter grade
school through the time they leave high school.”6 Youthbeat also has a panel of
parents as well.
Media panels and consumer panels are similar in procedure, composition, and
design. They differ only in that media panels primarily measure media consumption
habits as opposed to product or brand consumption. As with consumer panels, numerous
media panels exist. The following are examples of the most commonly used syndicated
media panels.
Nielsen Media Research is by far the most widely known and accepted source of
media panel data. The flagship service of Nielsen is used to measure television audiences,
but in recent years, “TV is no longer a distinct medium, but a form of information and
entertainment that connects multiple platforms and reaches audiences at every possible
touchpoint.”7
Nielsen collects data on television viewing habits through a device, called a people
meter, connected to a television set. The people meter continuously monitors and records
when a television set is turned on, what channels are being viewed, how much time is
spent on each channel, and who is watching. Nielsen also measures content downloading,
listening, and viewing on screens other than the TV. Nielsen’s data are used to calculate
media efficiency measured as cost per thousand (CPM), that is, how much it costs to reach
1,000 viewers. CPM measures a program’s ability to deliver the largest target audience at
the lowest cost.
Nielsen Audio conducts ongoing data collection for media, including radio,
television, cable, and out of home. They are perhaps best known for radio audience
measurement. The research firm uses an electronic measurement device called the
Portable People Meter (PPM) to estimate national and local radio audiences. The PPM
is a portable, passive electronic measuring system about the size of a cell phone that
tracks consumer exposure to media and entertainment. Survey participants carry the
PPM throughout the day, and it tracks TV watching and radio listening. The data are
used by media planners, advertising agencies, and advertisers.
Media panels Similar to
consumer panels but the in-
formation focuses on media
usage behavior.
www.MyEbookNiche.eCrater.com

62 Part 2 Designing the Marketing Research Project
Store audits consist of formal examination and verification of how much of a particu-
lar product or brand has been sold at the retail level. Based on a collection of participating
retailers (typically discount, supermarket, and drugstore retailers), audits are performed
on product or brand movement in return for detailed activity reports and cash compensa-
tion to the retailer. The audits then operate as a secondary data source. Store audits pro-
vide two unique benefits: precision and timeliness. Many of the biases of consumer panels
are not found in store audits. By design, store audits measure product and brand movement
directly at the point of sale (usually at the retail level).
Key variables measured in a store audit include beginning and ending inventory levels,
sales receipts, price levels, price inducements, local advertising, and point-of-purchase
(POP) displays. Collectively, these data allow users of store audit services to generate
information on the following factors:
∙ Product/brand sales in relation to competition.
∙ Effectiveness of shelf space and POP displays.
∙ Sales at various price points and levels.
∙ Effectiveness of in-store promotions and point-of-sale coupons.
∙ Direct sales by store type, product location, territory, and region.
Synthesizing Secondary Research for the Literature ReviewDivergent perspectives and findings need to be included in your literature review. It is
likely that the findings of some studies will be inconsistent with each other. These differ-
ences may include estimates of descriptive data, for example, the percentage of people
who buy from catalog marketers, the amount of dollars spent on advertising, or online
retail sales numbers. Reports may also disagree as to the nature of theoretical relation-
ships between variables.
Researchers often need to dig into the details of the methodology that is used to define
variables and collect data. For example, differences in estimates of online retail spending
are caused by several factors. Three major causes of discrepancies in online retail esti-
mates are (1) the inclusion (or not) of travel spending, which is a major category of online
Store audits Formal
examination and
verification of how much
of a particular product or
brand has been sold at the
retail level.
Estimating the market penetration of new technolo-
gies—from DVRs to iPhones to Twitter—is important for
managers because it impacts business decisions, from
promotions to pricing to new-product development. Man-
agers need accurate measurements and data in order to
improve their strategic and tactical planning. Getting accu-
rate measurements, however, can be surprisingly difficult.
A case in point is the DVR, a device that uses a hard drive
to record television shows. The DVR was introduced to the
U.S. marketplace in 2000. A few months after introduction of
the DVR, one published estimate concluded that the device
had been adopted by 16 percent of all U.S. households. The
astonishing growth led some marketers to proclaim the end
of traditional advertising because consumers use DVRs to
skip ads. Knowledge Metrics/SRI, a business specializing in
household technology, used multiple sources of information
to check the estimate. Initially, their own survey research
suggested a high adoption rate for the DVR as well. But
some fact-checking brought their results into question. The
research firm reviewed 10-K filings of the two major DVR
firms. Those firms had only shipped a few hundred thousand
units, which meant that less than 1 percent of TV households
had adopted the DVR at that time.
Based on this information, Knowledge Metrics realized that
they needed to improve their survey questions regarding DVR
ownership. They learned that consumers experienced con-
fusion when they were asked about the concept of a DVR.
Using a revised and improved questionnaire, they learned in a
subsequent study that the actual incidence of ownership was
less than 0.5 percent of TV households, and not 16 percent.8
MARKETING RESEARCH DASHBOARD TRIANGULATING SECONDARY DATA SOURCES
www.MyEbookNiche.eCrater.com
Chapter 3 Secondary Data, Literature Reviews, and Hypotheses 63
spending; (2) methodological differences, for instance, some reports make estimates based
on surveying retailers while others survey customers; and (3) there is always some degree
of sampling error. It is not enough to say that reports differ in their findings. You want to
make intelligent judgments about the sources that may be causing the differences.
Developing a Conceptual Model
In addition to providing background for your research problem, literature reviews can
also help conceptualize a model that summarizes the relationships you hope to predict.
If you are performing purely exploratory research, you will not need to develop a model
before conducting your research. In Chapter 2, we learned that once you have turned
your research objectives into research questions, the information needs can be listed and
the data collection instrument can be designed. Some of your information needs might
involve trying to understand relationships between variables. For example, you might
be interested in learning whether or not variables such as respondents’ ratings of quality
of the product, customer service, and brand image will predict overall satisfaction with
the product. If one or more of your research questions require you to investigate rela-
tionships between constructs, then you need to conceptualize these relationships. The
conceptualization process is aided by developing a picture of your model that shows
the predicted causal relationship between variables.
Variables, Constructs, and RelationshipsTo conceptualize and test a model, you must have three elements: variables, constructs,
and relationships. A variable is an observable item that is used as a measure on a ques-
tionnaire. Variables have concrete properties and are measured directly. Examples of vari-
ables include gender, marital status, company name, number of employees, how frequently
a particular brand is purchased, and so on. In contrast, a construct is an unobservable,
abstract concept that is measured indirectly by a group of related variables.
Some examples of commonly measured constructs in marketing include service qual-
ity, value, customer satisfaction, and brand attitude. Constructs that represent characteris-
tics of respondents may also be measured, for example, innovativeness, opinion leadership,
and deal proneness. In Exhibit 3.7, we show a group of items identified in a literature
review that can be used to measure the construct “market maven,” defined as an individual
who has a lot of information about products and who actively shares that information.
Researchers often use the words “variable” and “construct” interchangeably, but constructs
are always measured by one or more indicator variables.
Relationships are associations between two or more variables. When modeling
causal relationships, variables or constructs in relationships can be either independent or
dependent variables. An independent variable is the variable or construct that predicts
or explains the outcome variable of interest. A dependent variable is the variable or con-
struct researchers are seeking to explain. For example, if technology optimism and house-
hold income predict new technology adoption, then technology optimism and household
income are independent variables, and product adoption is the dependent variable.
A literature review will help you identify, define, and measure constructs. Neverthe-
less, after conducting a literature review and consulting secondary research, an analyst may
believe there is not enough information to design a full-scale study. There may be several
sources of uncertainty: the definition of important constructs; the identification of variables
Variable An observable
item that is used as a
measure on a questionnaire.
Construct An unobservable
concept that is measured by
a group of related variables.
Relationships Associations
between two or more
variables.
Independent variable The
variable or construct that
predicts or explains the
outcome variable of
interest.
Dependent variable The
variable or construct
researchers are seeking to
explain.
www.MyEbookNiche.eCrater.com
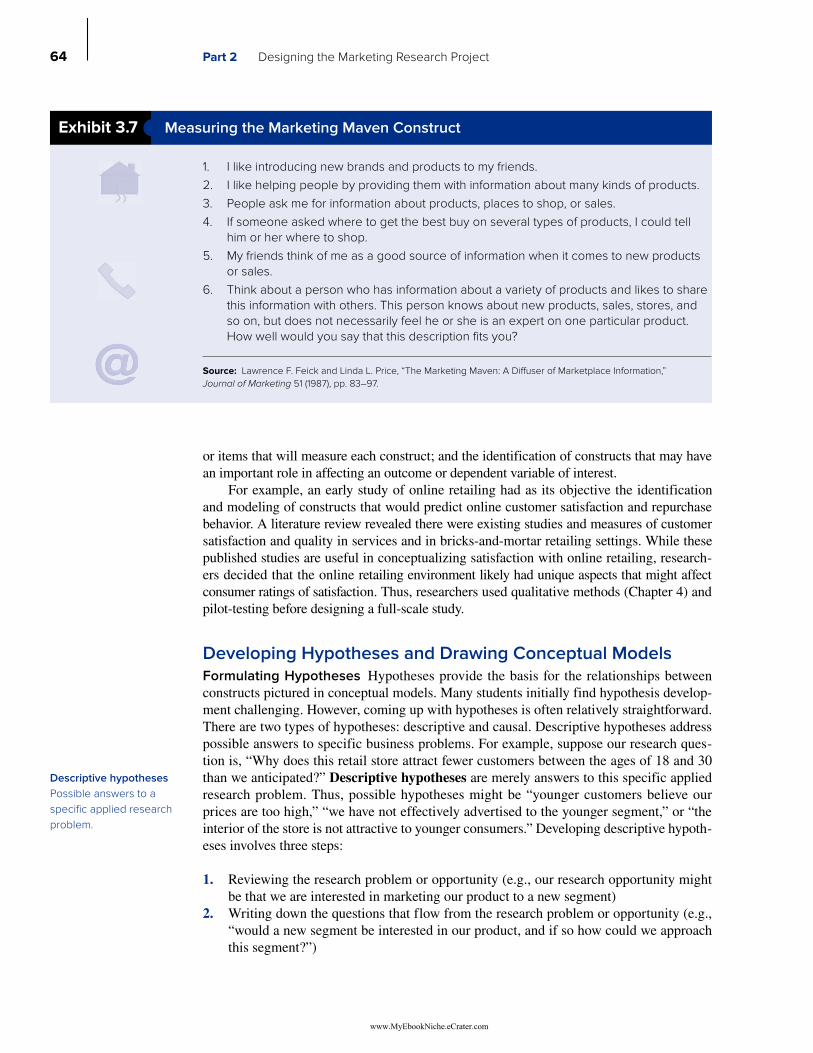
64 Part 2 Designing the Marketing Research Project
or items that will measure each construct; and the identification of constructs that may have
an important role in affecting an outcome or dependent variable of interest.
For example, an early study of online retailing had as its objective the identification
and modeling of constructs that would predict online customer satisfaction and repurchase
behavior. A literature review revealed there were existing studies and measures of customer
satisfaction and quality in services and in bricks-and-mortar retailing settings. While these
published studies are useful in conceptualizing satisfaction with online retailing, research-
ers decided that the online retailing environment likely had unique aspects that might affect
consumer ratings of satisfaction. Thus, researchers used qualitative methods (Chapter 4) and
pilot-testing before designing a full-scale study.
Developing Hypotheses and Drawing Conceptual ModelsFormulating Hypotheses Hypotheses provide the basis for the relationships between
constructs pictured in conceptual models. Many students initially find hypothesis develop-
ment challenging. However, coming up with hypotheses is often relatively straightforward.
There are two types of hypotheses: descriptive and causal. Descriptive hypotheses address
possible answers to specific business problems. For example, suppose our research ques-
tion is, “Why does this retail store attract fewer customers between the ages of 18 and 30
than we anticipated?” Descriptive hypotheses are merely answers to this specific applied
research problem. Thus, possible hypotheses might be “younger customers believe our
prices are too high,” “we have not effectively advertised to the younger segment,” or “the
interior of the store is not attractive to younger consumers.” Developing descriptive hypoth-
eses involves three steps:
1. Reviewing the research problem or opportunity (e.g., our research opportunity might
be that we are interested in marketing our product to a new segment)
2. Writing down the questions that flow from the research problem or opportunity (e.g.,
“would a new segment be interested in our product, and if so how could we approach
this segment?”)
Descriptive hypotheses
Possible answers to a
specific applied research
problem.
Exhibit 3.7 Measuring the Marketing Maven Construct
1. I like introducing new brands and products to my friends.
2. I like helping people by providing them with information about many kinds of products.
3. People ask me for information about products, places to shop, or sales.
4. If someone asked where to get the best buy on several types of products, I could tell
him or her where to shop.
5. My friends think of me as a good source of information when it comes to new products
or sales.
6. Think about a person who has information about a variety of products and likes to share
this information with others. This person knows about new products, sales, stores, and
so on, but does not necessarily feel he or she is an expert on one particular product.
How well would you say that this description fits you?
Source: Lawrence F. Feick and Linda L. Price, “The Marketing Maven: A Diffuser of Marketplace Information,”
Journal of Marketing 51 (1987), pp. 83–97.
www.MyEbookNiche.eCrater.com

Chapter 3 Secondary Data, Literature Reviews, and Hypotheses 65
3. Brainstorming possible answers to the research questions (the potential target segment
would be interested in this product if we made some modifications to the product and
sold the product in outlets where the segment shops)
Causal hypotheses are theoretical statements about relationships between variables.
The theoretical statements are based on previous research findings, management experi-
ence, or exploratory research. For example, a business might be interested in predicting the
factors that lead to increased sales. Independent variables that may lead to sales include
advertising spending and price. These two hypotheses can formally be stated as follows:
Hypothesis 1: Higher spending on advertising leads to higher sales.
Hypothesis 2: Higher prices lead to lower sales.
Causal hypotheses help businesses understand how they can make changes that, for exam-
ple, improve awareness of new products, service quality, customer satisfaction, loyalty, and
repurchase. For example, if researchers want to predict who will adopt a new technological
innovation, there is a great deal of existing research and theory on this topic. The research sug-
gests, for example, that more educated, higher income individuals who are open to learning are
more likely to adopt new technologies, while technology discomfort leads to lower likelihood of
adoption. The hypotheses could be summarized as follows:
∙ Individuals with more education are more likely to adopt a new technological innovation.
∙ Individuals who are more open to learning are more likely to adopt a new technologi-
cal innovation.
∙ Individuals who have more income are more likely to adopt a new technological
innovation.
∙ Individuals who have higher technology discomfort are less likely to adopt a new
technological innovation.
The first three hypotheses suggest positive relationships. A positive relationship
between two variables is when the two variables increase or decrease together. But negative
relationships can be hypothesized as well. Negative relationships suggest that as one vari-
able increases, the other one decreases. For example, the last hypothesis suggests that indi-
viduals exhibiting higher technology discomfort are less likely to adopt a new technological
innovation.
The literature review, secondary data, and exploratory research may all provide informa-
tion that is useful in developing both descriptive and causal hypotheses. Experience with a
research context can help decision makers and researchers develop hypotheses as well. Both cli-
ents and research firms may have a great deal of experience over time with a particular research
context that is useful in conceptualizing hypotheses for future studies. For example, restaurant
owners know a lot about their customers as do managers of retail clothing stores. They learn
this over time by observing customers’ behavior and listening to the questions that they ask.
Good hypotheses have several characteristics. First, hypotheses follow from
research questions. For example, if a researcher asks, “what leads customers to per-
ceive that a service is high quality,” the hypotheses are educated guesses about the
answers to that question. For example, we might hypothesize that service provider
competence and empathy lead to higher perceptions of service quality. A second
important characteristic of a good hypothesis is that it is written clearly and simply. If
the hypothesis is a causal hypothesis, it must have both an independent and dependent
variable in the statement. In our example about predictors of service quality, empathy
Causal hypotheses
Theoretical statements
about relationships
between variables.
Positive relationship An
association between two
variables in which they
increase or decrease
together.
Negative relationship An
association between two
variables in which one
increases while the other
decreases.
www.MyEbookNiche.eCrater.com
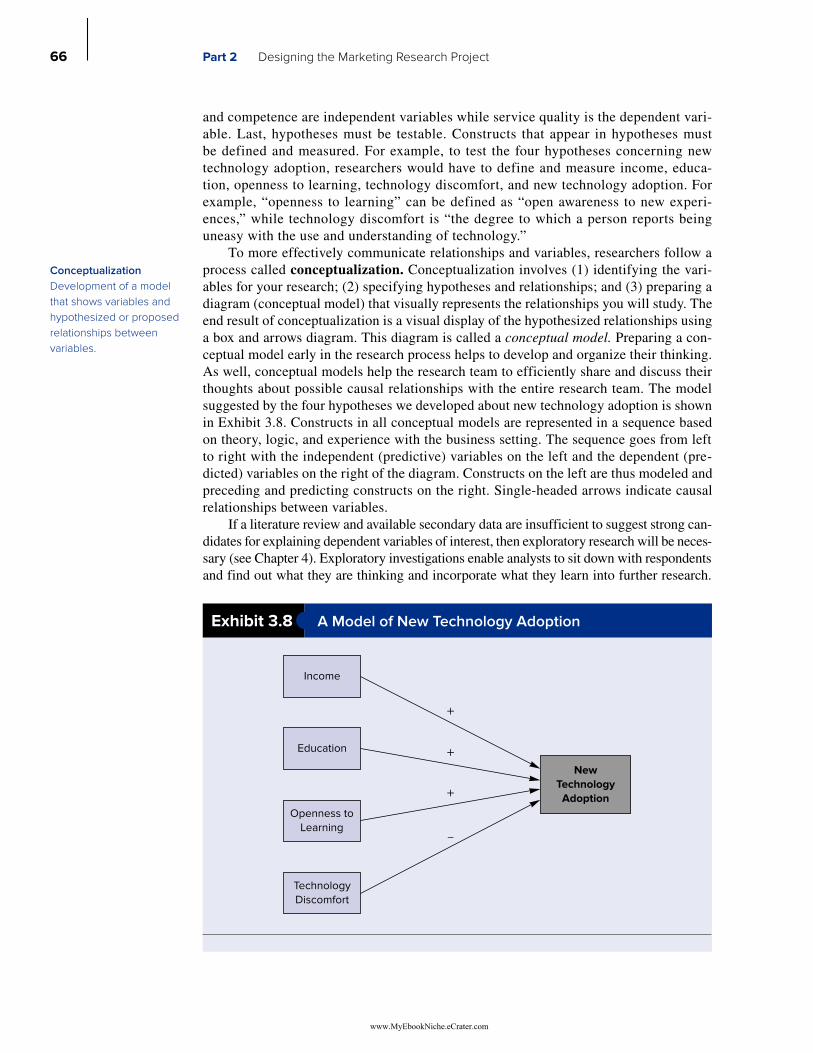
66 Part 2 Designing the Marketing Research Project
and competence are independent variables while service quality is the dependent vari-
able. Last, hypotheses must be testable. Constructs that appear in hypotheses must
be defined and measured. For example, to test the four hypotheses concerning new
technology adoption, researchers would have to define and measure income, educa-
tion, openness to learning, technology discomfort, and new technology adoption. For
example, “openness to learning” can be defined as “open awareness to new experi-
ences,” while technology discomfort is “the degree to which a person reports being
uneasy with the use and understanding of technology.”
To more effectively communicate relationships and variables, researchers follow a
process called conceptualization. Conceptualization involves (1) identifying the vari-
ables for your research; (2) specifying hypotheses and relationships; and (3) preparing a
diagram (conceptual model) that visually represents the relationships you will study. The
end result of conceptualization is a visual display of the hypothesized relationships using
a box and arrows diagram. This diagram is called a conceptual model. Preparing a con-
ceptual model early in the research process helps to develop and organize their thinking.
As well, conceptual models help the research team to efficiently share and discuss their
thoughts about possible causal relationships with the entire research team. The model
suggested by the four hypotheses we developed about new technology adoption is shown
in Exhibit 3.8. Constructs in all conceptual models are represented in a sequence based
on theory, logic, and experience with the business setting. The sequence goes from left
to right with the independent (predictive) variables on the left and the dependent (pre-
dicted) variables on the right of the diagram. Constructs on the left are thus modeled and
preceding and predicting constructs on the right. Single-headed arrows indicate causal
relationships between variables.
If a literature review and available secondary data are insufficient to suggest strong can-
didates for explaining dependent variables of interest, then exploratory research will be neces-
sary (see Chapter 4). Exploratory investigations enable analysts to sit down with respondents
and find out what they are thinking and incorporate what they learn into further research.
Conceptualization
Development of a model
that shows variables and
hypothesized or proposed
relationships between
variables.
Exhibit 3.8 A Model of New Technology Adoption
Income
Education
Openness to
Learning
Technology
Discomfort
New
Technology
Adoption
+
+
+
–
www.MyEbookNiche.eCrater.com
Chapter 3 Secondary Data, Literature Reviews, and Hypotheses 67
The research then takes place in stages. In the first stage, researchers use exploratory
research to identify variables, constructs, and relationships that can then be followed up in
another study. A conceptual model becomes a theoretical model when the literature review
or exploratory research is sufficient to support the model’s pictured relationships between
variables.
When you prepare your literature review, a section of that review will be dedicated to
presenting your model, also called a conceptual framework. This section of your literature
review integrates the information previously reviewed, and uses the review to support the
development of the relationships pictured in the model. In this section, researchers clearly
explain why they expect these relationships to exist, citing theory, business practice, or
some other credible source. Based on the framework they have developed, researchers will
next design research and collect empirical data that will address the hypotheses sketched
in their theoretical model.
Hypothesis Testing
Once researchers have developed hypotheses, they can be tested. As we have already seen,
a hypothesis suggests relationships between variables. Suppose we hypothesize that men
and women drink different amounts of coffee during the day during finals. The inde-
pendent variable in this case is gender, while the dependent variable is number of cups
of coffee. We collect data and find that the average number of cups of coffee consumed
Hypothesis An empirically
testable though yet
unproven statement
developed in order to
explain phenomena.
The owners have concluded that they need to know more
about their customers and target market. To obtain a bet-
ter understanding of each of these issues, they logged on
to the Yahoo.com and Google.com search engines. They
also spent some time examining trade literature. From this
review of the literature, some “Best Practices” guidelines
were found on how restaurants should be run. Below is a
summary of what was found:
If you do not have enough customers, first examine
the quality of your food, the items on your menu, and
the service.
Examine and compare your lunch and dinner custom-
ers and menu for differences.
Your waitstaff should be consistent with the image of
your restaurant. How your employees act and be-
have is very important. They must be well groomed,
knowledgeable, polite, and speak clearly and
confidently.
Menu items should represent a good value for the
money.
Service should be efficient, timely, polished, and cordial.
The cleanliness and appearance of your restaurant
strongly influence the success of your business.
Follow the marketing premise of “underpromise and
overdeliver!”
Empower your employees to make decisions to keep
your customers happy. Train your employees on what
to do to resolve customer complaints instead of com-
ing to the manager.
Create a pleasant dining atmosphere, including furni-
ture and fixtures, decorations, lighting, music, and
temperature.
Learn more about your female customers. For family
outings and special occasions, women make the de-
cision on where to dine about 75 percent of the time.
With this information, the owners next need to specify the
research questions and hypotheses to be examined.
1. What research questions should be examined?
2. What hypotheses should be tested?
3. Should the literature search be expanded? If yes,
how?
CONTINUING CASE STUDY THE SANTA FE GRILL MEXICAN RESTAURANT DEVELOPING RESEARCH QUESTIONS AND HYPOTHESES
www.MyEbookNiche.eCrater.com

68 Part 2 Designing the Marketing Research Project
by female students per day during finals is 6.1, and the average number of cups of cof-
fee consumed by males is 4.7. Is this finding meaningful? The answer appears to be
straightforward (after all, 6.1 is larger than 4.7), but sampling error could have distorted
the results enough so that we conclude there are no real differences between men’s and
women’s coffee consumption.
Intuitively, if the difference between two means is large, one would be more confident
that there is, in fact, a true difference between the sample means of the two groups. But
another important component to consider is the size of the sample used to calculate the
means because the size of the sample and the variance in the sample affect sample error.
To take sample error into account, we must place an interval around our estimate of the
mean. Once we do this, the two means may not be different enough to conclude that men
and women consume different amounts of coffee during finals.
In hypothesis development, the null hypothesis states that there is no relationship
between the variables. In this case, the null hypothesis would be that there is no differ-
ence between male and female coffee consumption. The null hypothesis is the one that
is always tested by statisticians and market researchers. Another hypothesis, called the
alternative hypothesis, states that there is a relationship between two variables. If the null
hypothesis is accepted, we conclude that the variables are not related. If the null hypoth-
esis is rejected, we find support for the alternative hypothesis, that the two variables
are related.
A null hypothesis refers to a population parameter, not a sample statistic. The
parameter is the actual value of a variable, which can only be known by collecting data
from every member of the relevant population (in this case, all male and female col-
lege students). The sample statistic is an estimate of the population parameter. The data
will show that either the two variables are related (reject the null hypothesis) or that
once sampling error is considered, there is not a large enough relationship to conclude
the variables are related. In the latter case, the researcher would not be able to detect a
statistically significant difference between the two groups of coffee drinkers. It is impor-
tant to note that failure to reject the null hypothesis does not necessarily mean the null
hypothesis is true. This is because data from another sample of the same population
could produce different results.
In marketing research, the null hypothesis is developed so that its rejection leads to an
acceptance of the alternative hypothesis. Usually, the null hypothesis is notated as H0 and
the alternative hypothesis is notated as H1. If the null hypothesis (H0) is rejected, then the
alternative hypothesis (H1) is accepted. The alternative hypothesis always bears the burden
of proof.
Null hypothesis A
statistical hypothesis that is
tested for possible rejection
under the assumption that
it is true.
Alternative hypothesis
The hypothesis contrary
to the null hypothesis, it
usually suggests that two
variables are related.
Parameter The true value
of a variable.
Sample statistic The
value of a variable that is
estimated from a sample.
www.MyEbookNiche.eCrater.com

Chapter 3 Secondary Data, Literature Reviews, and Hypotheses 69
MARKETING RESEARCH IN ACTIONThe Santa Fe Grill Mexican Restaurant
The owners of the Santa Fe Grill Mexican Restaurant were not happy with the slow growth
rate of the restaurant’s operations and realized they needed to obtain a better understanding
of three important concepts: customer satisfaction, restaurant store image, and customer
loyalty. Using, in part, their practical business knowledge and what they learned as busi-
ness students at the University of Nebraska, Lincoln, they developed several key questions:
1. What makes up customer satisfaction?
2. How are restaurant images created?
3. How is customer loyalty achieved?
4. What are the interrelationships between customer satisfaction, store images, and cus-
tomer loyalty?
Not really knowing where to begin, they contacted one of their past professors, who taught
marketing research at the university, to gain some guidance. Their professor suggested they
begin with a literature review of both scholarly and popular press research sources. Using their
Internet search skills, they went to Lexus-Nexus, Google, and Google Scholar (www.Scholar
.Google.com) and found a wealth of past research and popular press articles on customer
satisfaction, store image, and customer loyalty.
After reviewing a number of articles, the owners understood that customer satisfaction
relates to a restaurant’s ability to meet or exceed its customers’ dining expectations about a
variety of important restaurant attributes such as food quality, acceptable service, competi-
tive prices, restaurant atmosphere, and friendly/courteous staff. Regarding restaurant store
image, they learned that image is really an overall impression expressed in either a posi-
tive or negative judgment about the restaurant’s operations. In addition, customer loyalty
reflects customers’ willingness to “recommend a restaurant to their friends, family, and/or
neighbors,” as well as provide positive word of mouth.
Hands-On Exercise1. Based on your understanding of the material presented in Chapter 3 and the above
key research questions, should the owners of the Santa Fe Grill Mexican restaurant
go back and restate their questions? If “no,” why not? If “yes,” why? Suggest how the
research questions could be restated.
2. Regarding the owners’ desire to understand the interrelationships between customer
satisfaction, restaurant store image, and customer loyalty, develop a set of hypotheses
that might be used to investigate these interrelationships.
www.MyEbookNiche.eCrater.com

70 Part 2 Designing the Marketing Research Project
Summary
Understand the nature and role of secondary data.
The task of a marketing researcher is to solve the prob-
lem in the shortest time, at the least cost, with the highest
level of accuracy. Therefore, before any marketing research
project is conducted, the researcher must seek out existing
information that may facilitate a decision or outcome for
a company. Existing data are commonly called secondary
data. If secondary data are to be used to assist the decision-
making process or problem-solving ability of the manager,
they need to be evaluated on six fundamental principles:
(1) purpose—how relevant are the data to achieving the
specific research objectives at hand?; (2) accuracy of
information; (3) consistency—do multiple sources of the
data exist?; (4) credibility—how were the data obtained?
what is the source of the data?; (5) methodology—will
the methods used to collect the data produce accurate and
reliable data?; and (6) biases—was the data-reporting pro-
cedure tainted by some hidden agenda or underlying moti-
vation to advance some public or private concern?
Describe how to conduct a literature review.
A literature review is a comprehensive examination of
available information that is related to your research topic.
When conducting a literature review, researchers locate
information relevant to the research problems and issues
at hand. Literature reviews have the following objectives:
provide background information for the current study;
clarify thinking about the research problem and questions
you are studying; reveal whether information already
exists that addresses the issue of interest; help to define
important constructs of interest to the study; and suggest
sampling and other methodological approaches that have
been successful in studying similar topics.
Identify sources of internal and external secondary
data.
Internal secondary data are obtained within the com-
pany. Company internal accounting and financial infor-
mation is a major source. These typically consist of sales
invoices, accounts receivable reports, and quarterly sales
reports. Other forms of internal data include past mar-
keting research studies, customer credit applications,
warranty cards, and employee exit interviews.
External secondary data are obtained outside the com-
pany. Because of the volume of external data available,
researchers need a data search plan to locate and extract the
right data. A simple guideline to follow is: define goals the
secondary data need to achieve; specify objectives behind
the secondary search process; define specific characteristics
of data that are to be extracted; document all activities
necessary to find, locate, and extract the data sources;
focus on reliable sources of data; and tabulate all the data
extracted. The most common sources of external secondary
data are popular, scholarly, government, and commercial.
Discuss conceptualization and its role in model
development.
Literature reviews can also help you conceptualize a model
that summarizes the relationships you hope to predict.
If you are performing purely exploratory research, you
will not need to develop a model before conducting your
research. Once you have turned your research objectives
into research questions, the information needs can be listed
and the data collection instrument can be designed. How-
ever, if one or more of your research questions require you
to investigate relationships between variables, then you need
to conceptualize these relationships. The conceptualization
process is aided by developing a picture of your model that
shows the predicted causal relationships between variables.
To conceptualize and test a model, you must have three ele-
ments: variables, constructs, and relationships.
Understand hypotheses and independent and depen-
dent variables.
A variable is an observable item that is used as a measure on
a questionnaire. A construct is an unobservable concept that
is measured by a group of related variables. Some examples
of commonly used constructs in marketing research include
service quality, value, customer satisfaction, and brand atti-
tude. Constructs that represent characteristics of respondents
may also be measured, for example, innovativeness, opin-
ion leadership, and deal proneness. There are two kinds of
hypotheses: descriptive and causal. Descriptive hypotheses
are possible answers to specific, applied research problems
while causal hypotheses are theoretical statements about rela-
tionships between variables. Relationships are associations
between two or more variables. The relationships are often
illustrated visually by drawing conceptual models. When
modeling relationships, variables or constructs depicted in
relationships can be either independent or dependent vari-
ables. An independent variable is the variable or construct
that predicts or explains the outcome variable of interest. A
dependent variable is the variable or construct researchers
are seeking to explain; that is, the outcome. For example, if
technology optimism and household income predict Internet
adoption by seniors, then technology optimism and house-
hold income are independent variables, and Internet adoption
is the dependent variable.
www.MyEbookNiche.eCrater.com

Chapter 3 Secondary Data, Literature Reviews, and Hypotheses 71
Key Terms and Concepts
Alternative hypothesis 68
Causal hypotheses 65
Conceptualization 66
Construct 63
Consumer panels 60
Dependent variable 63
Descriptive hypothesis 64
External secondary data 50
Hypothesis 67
Independent variable 63
Internal secondary data 50
Literature review 51
Media panels 61
Negative relationship 65
North American Industry Classification
System (NAICS) 59
Null hypothesis 68
Parameter 68
Positive relationship 65
Relationships 63
Sample statistic 68
Secondary data 50
Store audits 62
Syndicated (or commercial)
data 60
Variable 63
Review Questions
1. What characteristic separates secondary data from pri-
mary data? What are three sources of secondary data?
2. Explain why a company should use all potential
sources of secondary data before initiating primary
data collection procedures.
3. List the six fundamental principles used to assess the
validity of secondary data.
4. What are the various reasons to conduct a literature
review?
5. What should you look for in assessing whether or not
an Internet resource is credible?
6. A researcher develops hypotheses that suggest
consumers like ads better when they (1) are truthful;
(2) creative; and (3) present relevant information.
Picture the conceptual model that would show these
relationships. Which variables are the independent
and which the dependent variables?
7. What are relationships? What is a positive relation-
ship? What is a negative relationship? Give an exam-
ple of a positive and a negative relationship.
8. What is the difference between a parameter and a
sample statistic?
Discussion Questions
1. It is possible to design a study, collect and analyze
data, and write a report without conducting a litera-
ture review? What are the dangers and drawbacks of
conducting your research without doing a literature
review? In your judgment, do the drawbacks out-
weigh the advantages? Why or why not?
2. EXPERIENCE MARKETING RESEARCH.
Visit several of the marketing blogs listed in Exhibit
3.4. Do these blogs have any information that might
be relevant to practitioners who are conducting
research in the topic areas that the blogs address?
Why or why not?
3. EXPERIENCE MARKETING RESEARCH.
Using Google Scholar, identify 10 or so references
that are relevant to the topic of service quality. Iden-
tify four or five that you think would be helpful to
designing a survey to measure the service quality
received at a restaurant. List the title of each study,
and explain why you think they are relevant to the
study you are designing.
www.MyEbookNiche.eCrater.com

72 Part 2 Designing the Marketing Research Project
4. EXPERIENCE MARKETING RESEARCH. Go
online and find the home page for your particular state.
For example, www.mississippi.com would get you
to the home page for the State of Mississippi. Once
there, seek out the category that gives you informa-
tion on county and local statistics. Select the county
where you reside and obtain the vital demographic and
socioeconomic data available. Provide a demographic
profile of the residents in your community.
5. EXPERIENCE MARKETING RESEARCH. Go
to the home page of the U.S. census, www.census
.gov. Select the category “Economic Indicators” and
browse the data provided. What did you learn from
browsing this data?
6. You are thinking about opening a new quick service
restaurant on your campus after you graduate. What
information about your potential consumers would
you try to find from secondary research to help you
understand your target market?
7. You are planning to open a coffee shop in one of two
areas in your local community. Conduct a secondary
data search on key variables that would allow you to
make a logical decision on which area is best suited
for your proposed coffee shop.
8. Based on your experiences in college, draw and
label a conceptual model that shows the factors
that lead to your satisfaction (or dissatisfaction)
with a course.
www.MyEbookNiche.eCrater.com

This page intentionally left blank
www.MyEbookNiche.eCrater.com

Exploratory and Observational Research Designs and Data Collection Approaches
C h a p t e r 4
www.MyEbookNiche.eCrater.com

Learning Objectives After reading this chapter, you will be able to:
1. Identify the major differences between qualitative and quantitative research.
2. Understand in-depth interviewing and focus groups as questioning techniques.
3. Define focus groups and explain how to conduct them.
4. Discuss purposed communities and private communities.
5. Explain other qualitative data collection methods such as ethnography, case studies, netnography, projective techniques, and the ZMET.
6. Discuss observation methods and explain how they are used to collect primary data.
7. Discuss the growing field of social media monitoring.
Customer Territoriality in “Third Places”
Territorial behavior involves personalization or marking of a place or object so as
to communicate individual or group ownership. Scholars have long studied and
understood territoriality at work and at home. But in recent decades, businesses
such as Starbucks and Panera Bread have provided space for customers to social-
ize and work, sometimes lingering long past when food and beverages have been
consumed. These spaces have been called “third places,” a place in addition to
work and home where individuals may spend extended time working or studying.
An ethnographic study of Starbucks noted territorial behavior at the café, point-
ing out that almost all patrons keep to themselves, rarely conversing with other
customers that they do not know, creating a “virtual gated community” around
themselves when they spend time at Starbucks.
A team of researchers followed up this study by trying to understand territo-
rial behaviors in a more detailed fashion. Their multimethod qualitative research
used observation (including participant observation), photographs, and in-depth
interviews to develop a more complete picture of how and why customers engage
in territoriality, and how other customers and employees respond. Observation
in context helped the researchers to both learn and document how customers
behaved in “third places.” The authors observed territorial behaviors for over 100
hours and described them in field notes. With customers’ permission, researchers
took pictures of territorial behavior.
The researchers then performed 36 in-depth interviews with customers,
using some of the pictures they took during the observational phase of their
research. The purpose of the in-depth interviews was to glean insights into cus-
tomer motivations for territorial behavior. Finally, the researchers used a tech-
nique they called “narrative inquiry” to get participants to tell stories about their
experiences with territoriality in a way that is less threatening than answering
direct questions. Informants were asked to write stories about pictures that
showed territorial behaviors such as marking space or territorial intrusion.
The next step was to code and categorize the textual and pictorial data for
“themes.” The researchers learned that customers often strategically spread items to
mark places and claim territory. Purchase or even mere use of an item with the retail
www.MyEbookNiche.eCrater.com

establishment’s logo is often sufficient to give customers territorial “rights,” which discourages
other customers to sit, consume, and linger. Some consumers may see the café as an extension of
home and thus engage in behavior that strains norms for behavior in public places, for example,
washing sand from the beach out of their hair in the bathroom sink or changing their clothes at
the café. Employees are often faced with mediating territorial disputes between customers.
There are implications for cafés that are positioned as third places. Territorial behavior
can both promote and inhibit the approach behavior of customers. Customers of third space
businesses cocreate their experiences, but in doing so, they affect the experiences of other
customers. These businesses need to take positions on territorial behaviors, making rules
that work for most customers, and designing space to accommodate customers wherever
possible. As well, some cafés may want to create a “fourth space” for customer groups
looking primarily for a semistructured workplace.
Source: Merlyn A. Griffiths and Mary C. Gilly (2012), “Dibs! Customer Territorial Behaviors,” Journal of
Services Research, 15(2), p. 131–149; Bryant Simon, Everything but the Coffee (Berkeley: University of
California Press, 2009); Irwin Altman, The Environment and Social Behavior: Privacy, Personal Space, Territory,
Crowding (Monterey, CA: Wadsworth, 1975).
76 Part 2 Designing the Marketing Research Project
Value of Qualitative Research
Management quite often is faced with problem situations where important questions cannot
be adequately addressed or resolved with secondary information. Meaningful insights can
be gained only through the collection of primary data. Recall that primary data are new data
gathered specifically for a current research challenge. They are typically collected using a
set of systematic procedures in which researchers question or observe individuals and record
their findings. The method may involve qualitative or quantitative research or both (we will
study the difference in this chapter). As the journey through Phase II of the research process
(Select the Appropriate Research Design) continues, attention may move from gathering
secondary data to collecting primary data. This chapter begins a series of chapters that dis-
cuss research designs used for collecting primary data. As noted in earlier chapters, research
objectives and information requirements are the keys to determining the appropriate type of
research design for collecting data. For example, qualitative research often is used in explor-
atory research designs when the research objectives are to gather background information
and clarify the research problems and to create hypotheses or establish research priorities.
Quantitative research may then be used to follow up and quantify the qualitative findings.
Qualitative research results may be sufficient for decision making in certain situations.
For example, if the research is designed to assess customer responses to different advertis-
ing approaches while the ads are still in the storyboard phase of development, qualitative
research is effective. Qualitative research may also be sufficient when feedback in focus
groups or in-depth interviews (IDI) is consistent, such as overwhelmingly favorable (or
unfavorable) reactions toward a new product concept.1 Finally, some topics are more appro-
priately studied using qualitative research. This is particularly true for complex consumer
behaviors that may be affected by factors that are not easily reducible to numbers, such as
consumer choices and experiences involving cultural, family, and psychological influences
that are difficult to tap using quantitative methods.
Occasionally, qualitative research is conducted as a follow-up to quantitative research.
This happens when quantitative findings are contradictory or ambiguous and do not fully
answer research questions. This chapter begins with an overview of the three major types of
research designs. We then introduce several qualitative research methods used in exploratory
www.MyEbookNiche.eCrater.com

Chapter 4 Exploratory and Observational Research Designs 77
research designs. The chapter ends with a discussion of observation, which can be collected
and analyzed qualitatively or quantitatively, and how it is used by marketing researchers.
Overview of Research Designs
Recall that the three major types of research designs are exploratory, descriptive, and
causal. Each type of design has a different objective. The objective of exploratory research
is to discover ideas and insights to better understand the problem. If Apple were to experi-
ence an unexpected drop in sales of its iPhone, they might conduct exploratory research
with a small sample of current and previous customers, or mine conversations in social
media sites and blogs on the Internet to identify some possible explanations. This would
help Apple to better define the actual problem.
The objective of descriptive research is to collect information that provides answers
to research questions. For example, Coca-Cola would use descriptive research to find out
the age and gender of individuals who buy different brands of soft drinks, how frequently
they consume them and in which situations, what their favorite brand of soft drink is and
reasons why, and so forth. This type of research enables companies to identify trends, to
test hypotheses about relationships between variables, and ultimately to identify ways to
solve previously identified marketing problems. It also is used to verify the findings of
exploratory research studies based on secondary research or focus groups.
The objective of causal research is to test cause-and-effect relationships between spe-
cifically defined marketing variables. To do this, the researcher must be able to explicitly
define the research question and variables. Examples of causal research projects would be
to test the following hypotheses: “Introducing a new energy drink will not reduce the sale
of current brands of Coca-Cola soft drinks.” “Use of humorous ads for Apple Macs versus
PCs will improve the image of Apple products in general.” “A 10 percent increase in the
price of Nike shoes will have no significant effect on sales.”
Depending on the research objective, marketing researchers use all three types of
research designs. In this chapter, we focus on exploratory designs. In the following chapters,
we discuss descriptive and causal designs in more detail.
Overview of Qualitative and Quantitative Research Methods
There are differences in qualitative and quantitative approaches, but all researchers inter-
pret data and tell stories about the research topics they study.2 Prior to discussing qualitative
techniques used in exploratory research, we give an overview of some of the differences
between qualitative and quantitative research methods. The factors listed in Exhibit 4.1
summarize the major differences. Study Exhibit 4.1 carefully.
Quantitative Research MethodsQuantitative research uses formal questions and predetermined response options
in questionnaires administered to large numbers of respondents. For example, think of
J. D. Power and Associates conducting a nationwide mail survey on customer satisfac-
tion among new car purchasers or American Express doing a nationwide survey on travel
behaviors with telephone interviews. With quantitative methods, the research problems
Quantitative research
Research that places heavy
emphasis on using formal
standard questions and
predetermined response
options in questionnaires
or surveys administered
to large numbers of
respondents.
www.MyEbookNiche.eCrater.com

78 Part 2 Designing the Marketing Research Project
are specific and well defined, and the decision maker and researcher have agreed on the
precise information needs.
Quantitative research methods are most often used with descriptive and causal
research designs but are occasionally associated with exploratory designs. For example, a
researcher may pilot test items on a questionnaire to see how well they measure a construct
before including them in a larger study. Quantitative analysis techniques may be applied to
qualitative data (e.g., textual, image, or video). These projects may be exploratory as they
seek to detect and measure early problems or successes with products, services, or market-
ing communication efforts for example.
The main goals of quantitative research are to obtain information to (1) make accurate
predictions about relationships between market factors and behaviors, (2) gain meaningful
insights into those relationships, (3) validate relationships, and (4) test hypotheses. Quanti-
tative researchers are well trained in construct development, scale measurement, question-
naire design, sampling, and statistical data analysis. Increasingly, marketing researchers are
learning to turn qualitative conversational data on the Internet into quantitative analytical
measures. We address this special category of quantitative techniques under observation
later in this chapter. Finally, quantitative researchers must be able to translate numerical
data into meaningful narrative information, ultimately telling a compelling story that is
supported by data. Finally, quantitative methods are often statistically projectible to the
target population of interest.
Qualitative Research MethodsQualitative data consists of text, image, audio or video data. The data may be naturally
occurring (as on Internet blog and product review sites), or be collected from answers to
Exhibit 4.1 Major Differences between Qualitative and Quantitative Research Methods
Factor Qualitative Methods Quantitative Methods
Goals/objectives Discovery/identification of new ideas, Validation of facts, estimates, relationships
thoughts, feelings; preliminary understanding
of relationships; understanding of hidden
psychological and social processes
Type of research Exploratory Descriptive and causal
Type of questions Open-ended, unstructured, probing Mostly structured
Time of execution Relatively short time frame Typically significantly longer time frame
Representativeness Small samples, only the sampled individuals Large samples, with proper sampling
can represent population
Type of analysis Content analysis, interpretative Statistical, descriptive, causal
predictions
Researcher skills Interpersonal communications, observation, Statistical analysis, interpretation of
interpretation of text or visual data numbers
Generalizability May be limited Generally very good, can infer facts
and relationships
www.MyEbookNiche.eCrater.com

Chapter 4 Exploratory and Observational Research Designs 79
open-ended questions from researchers. Qualitative data may be analyzed qualitatively
or quantitatively, but in this section we focus on qualitative analysis. While qualitative
research data collection and analysis can be careful and rigorous, most practitioners
regard qualitative research as being less reliable than quantitative research. However,
qualitative research may probe more deeply. Qualitative researchers seek to under-
stand research participants rather than to fit their answers into predetermined categories
with little room for qualifying or explaining their choices. Thus, qualitative research
often uncovers unanticipated findings and reactions. Therefore, one common objective
of qualitative research is to gain preliminary insights into research problems. These
preliminary insights are sometimes followed up with quantitative research to verify the
qualitative findings.
A second use of qualitative research is to probe more deeply into areas that quan-
titative research may be too superficial to access, such as subconscious consumer
motivations.3 Qualitative research enables researchers and clients to get closer to their
customers and potential customers than does quantitative research. For example, video
and textual verbatims enable participants to speak and be heard in their own words in the
researcher’s report.
Qualitative researchers usually collect detailed data from relatively small samples by
asking questions or observing behavior. Researchers trained in interpersonal communi-
cations and interpretive skills use open-ended questions and other materials to facilitate
in-depth probing of participants’ thoughts. Some qualitative research involves analysis
of “found” data, or existing text. For example, qualitative researchers who want to better
understand teen consumer culture might analyze a sample of social media entries posted
by teens. In most cases, qualitative data is collected in relatively short time periods. Data
analysis typically involves content analysis and interpretation. To increase the reliability
and trustworthiness of the interpretation, researchers follow consistent approaches that are
extensively documented.
The semistructured format of the questions and the small sample sizes limit the research-
er’s ability to generalize qualitative data to the population. Nevertheless, qualitative data have
important uses in identifying and understanding business problems. For example, qualitative
data can be invaluable in providing researchers with initial ideas about specific problems
or opportunities, theories and relationships, variables, or the design of scale measurements.
Finally, qualitative research can be superior for studying topics that involve complex psycho-
logical motivations not easily reduced to survey formats and quantitative analyses.
Qualitative research methods have several advantages. Exhibit 4.2 summarizes the
major advantages and disadvantages of qualitative research. An advantage of qualita-
tive research, particularly for focus groups and IDIs, is that it can be completed relatively
quickly. Due in part to the use of small samples, researchers can complete investigations
in a shorter period of time and at a significantly lower cost than is true with quantitative
methods. Another advantage is the richness of the data. The unstructured approach of qual-
itative techniques enables researchers to collect in-depth data about respondents’ attitudes,
beliefs, emotions, and perceptions, all of which may strongly influence their behaviors as
consumers.
The richness of qualitative data can often supplement the facts gathered through other
primary data collection techniques. Qualitative techniques enable decision makers to gain
firsthand experiences with customers and can provide revealing information that is con-
textualized. For example, an ethnographic study of Thanksgiving traditions conducted in
consumers’ homes during their celebrations discovered that the term “homemade” is often
applied to dishes that are not made from scratch, but instead use at least some premade,
branded ingredients.4
Qualitative research The
collection of data in the
form of text or images using
open-ended questions, ob-
servation, or “found” data.
www.MyEbookNiche.eCrater.com

80 Part 2 Designing the Marketing Research Project
Qualitative research methods often provide preliminary insights useful in develop-
ing ideas about how variables are related. Similarly, qualitative research can help define
constructs or variables and suggest items that can be used to measure those constructs.
For example, before they can successfully measure the perceived quality of online shop-
ping experiences from their customers’ perspective, retailers must first ascertain the factors
or dimensions that are important to their customers when shopping online. Qualitative
data also play an important role in identifying marketing problems and opportunities. The
in-depth information enhances the researcher’s ability to understand consumer behavior.
Finally, many qualitative researchers have backgrounds in the social sciences, such as
sociology, anthropology, or psychology, and thus bring knowledge of theories from their
discipline to enhance their interpretation of data. For example, a study of grooming behav-
ior of young adults conducted by an anthropologist described grooming behavior as “ritual
magic.”5 The legacy of psychology and psychiatry in developing qualitative techniques is
seen in the emphasis on subconscious motivations and the use of probing techniques that
are designed to uncover motives.6
Although qualitative research produces useful information, it has some potential dis-
advantages, including small sample sizes and the need for well-trained interviewers or
observers. The sample size in a qualitative study may be as few as 10 (individual in-
depth interviews), and is rarely more than 60 (the number of participants in five six focus
groups). Occasionally, companies will undertake large-scale qualitative studies involving
thousands of IDIs and hundreds of focus groups, as Forrester Research did to support the
development of their e-commerce consulting business,7 but this is the exception, not the
rule. While researchers often handpick respondents to represent their target population,
the resulting samples are not representative in the statistical sense. Qualitative researchers
emphasize their samples are made up of “relevant” rather than representative consumers.
The lack of representativeness of the defined target population may limit the use of quali-
tative information in selecting and implementing final action strategies.
Exhibit 4.2 Advantages and Disadvantages of Qualitative Research
Advantages of Qualitative Research Disadvantages of Qualitative Research
Except for ethnography, data can be Lack of generalizability
collected relatively quickly or may already
exist as naturally occurring conversations
on the Internet
Richness of the data Difficulty in estimating the magnitude of
phenomena being investigated
Accuracy of recording marketplace Low reliability
behaviors (validity)
Preliminary insights into building models Difficulty finding well-trained investigators,
and scale measurements interviewers, and observers
Insights from qualitative researchers with Reliance on subjective interpretive skills
training in social and behavioral sciences of qualitative researcher
www.MyEbookNiche.eCrater.com

Chapter 4 Exploratory and Observational Research Designs 81
Qualitative Data Collection Methods
A number of approaches can be used to collect qualitative data. Focus groups are the
most frequently used qualitative research method (Exhibit 4.3). But the use of projective
techniques, ethnography, and similar approaches has been growing in recent years.
In-Depth InterviewsThe in-depth interview, also referred to as a “depth” or “one-on-one” interview, involves
a trained interviewer asking a respondent a set of semistructured, probing questions usually
in a face-to-face setting. The typical setting for this type of interview is either the respon-
dent’s home or office, or some type of centralized interviewing center convenient for the
respondent. Some research firms use hybrid in-depth interviewing techniques combining
In-depth interview A data-
collection method in which
a well-trained interviewer
asks a participant a set of
semistructured questions in
a face-to-face setting.
Exhibit 4.3 Percent of Research Providers and Clients Already
Using Qualitative Data Collection Methods, 2015
Method Percent
Traditional in-person focus groups 68
Traditional in-person, in-depth interviews (IDIs) 53
Telephone IDIs 31
In-store observation 25
Bulletin Board Studies 21
Online focus groups with Webcams 12
Chat-based online focus groups 16
Online focus groups with webcams 17
Interviews/focus groups using online communities 25
Blog monitoring 8
Mobile (e.g., diaries, images, video) 24
Telephone focus groups 6
Online IDIs with webcams 12
Chat-based IDIs 6
Automate Interviewing 3
Other qualitative method 19
Source: Greenbook Research Industry Trends 2015 Report, www.greenbook.org, accessed March 6, 2016, p. 10.
Which of these qualitative data methods have you used most this year?
(Select up to five.)
www.MyEbookNiche.eCrater.com

82 Part 2 Designing the Marketing Research Project
Internet and phone interviewing. In these cases, the conversation can be extended over
several days giving participants more time to consider their answers.8 Use of the Internet
also enables consumers to be exposed to visual and audio stimuli, thus overcoming the
major limitation of IDIs over the phone. Two more IDI methods have emerged in recent
years: online IDIs using webcams and online text-based chat.
A unique characteristic of in-depth interviewing is that the interviewer uses probing
questions to elicit more detailed information on the topic. By turning the respondent’s
initial response into a question, the interviewer encourages the respondent to further
explain the first response, creating natural opportunities for more detailed discussion of the
topic. The general rule is that the more a subject talks about a topic, the more likely he or
she is to reveal underlying attitudes, motives, emotions, and behaviors.
The major advantages of in-depth interviewing over focus groups include (1) rich
detail that can be uncovered when focusing on one participant at a time; (2) lower likeli-
hood of participants responding in a socially desirable manner because there are no other
participants to impress; and (3) less cross talk that may inhibit some people from partici-
pating in a focus group. In-depth interviewing is a particularly good approach to use with
projective techniques, which are discussed later in this chapter.
Skills Required for Conducting In-Depth Interviews For in-depth interviewing to be
effective, interviewers must have excellent interpersonal communications and listening
skills. Important interpersonal communication skills include the interviewer’s ability to ask
questions in a direct and clear manner so respondents understand what they are responding
to. Listening skills include the ability to accurately hear, record, and interpret the respon-
dent’s answers. Most interviewers ask permission from the respondent to record the inter-
view rather than relying solely on handwritten notes.
Without excellent probing skills, interviewers may allow the discussion of a specific
topic to end before all the potential information is revealed. Most interviewers have to
work at learning to ask good probing questions. For example, IDIs of business students
about what they want in their coursework often reveal that “real-world projects” are impor-
tant learning experiences. But what do they really mean by “real-world projects”? What
specifically about these projects makes them good learning experiences? What kinds of
projects are more likely to be labeled as “real-world projects”? It takes time and effort to
elicit participants’ answers, and ending a sequence of questions relatively quickly, as is the
tendency in everyday conversation, is not effective in in-depth interviewing.
Interpretive skills refer to the interviewer’s ability to accurately understand the respon-
dent’s answers. Interpretive skills are important for transforming the data into usable infor-
mation. Finally, the personality of the interviewer plays a significant role in establishing a
“comfort zone” for the respondent during the question/answer process. Interviewers should
be easygoing, flexible, trustworthy, and professional. Participants who feel at ease with an
interviewer are more likely to reveal their attitudes, feelings, motivations, and behaviors.
Steps in Conducting an In-Depth Interview There are a number of steps to be con-
cerned in planning and conducting an IDI. Exhibit 4.4 highlights those steps. Have a close
look at Exhibit 4.4 as we conclude this brief discussion of in-depth interviewing.
Focus Group InterviewsThe most widely used qualitative research method in marketing is the focus group, some-
times called the group depth interview. The focus group interview has its roots in the
behavioral sciences. Focus group research involves bringing a small group of people
together for an interactive and spontaneous discussion of a particular topic or concept.
Focus group research A
qualitative data collection
method in which responses
to open-ended questions
are collected from a small
group of partici p ants
who interactively and
spontaneously discuss topics
of interest to the researcher.
www.MyEbookNiche.eCrater.com

Chapter 4 Exploratory and Observational Research Designs 83
Exhibit 4.4 Steps in Conducting an In-Depth Interview
Steps Description and Comments
Step #1: Understand Initial Questions/Problems
Define management’s problem situation and questions.
Engage in dialogues with decision makers that focus on bringing clarity
and understanding of the research problem.
Step #2: Create a Set of Research Questions
Develop a set of research questions (an interview guide) that focuses on the
major elements of the questions or problems.
Arrange using a logical flow moving from “general” to “specific” within topic areas.
Step #3: Decide on the Best Environment for Conducting the Interview
Determine best location for the interview based on the characteristics of the
participant and select a relaxed, comfortable interview setting.
Setting must facilitate private conversations without outside distractions.
Step #4: Select and Screen the Respondents
Select participants using specific criteria for the situation being studied.
Screen participants to assure they meet a set of specified criteria.
Step #5: Respondent Greeted, Given Interviewing Guidelines, and Put at Ease
Interviewer meets participant and provides the appropriate introductory
guidelines for the interviewing process.
Obtain permission to tape and/or videorecord the interview.
Use the first few minutes prior to the start of the questioning process to create
a “comfort zone” for the respondent, using warm-up questions.
Begin the interview by asking the first research questions.
Step #6: Conduct the In-Depth Interview
Use probing questions to obtain as many details as possible from the
participant on the topic before moving to the next question.
When interview is completed, thank respondents for participating, debrief as
necessary, and give incentives.
Step #7: Analyze Respondent’s Narrative Responses
Summarize initial thoughts after each interview. In particular, write down
categories that may be used later in coding transcripts, a process referred
to as memoing.
Follow up on interesting responses that appear in one interview by adding
questions to future interviews.
After all data are collected, code each participant’s transcripts by classifying
responses into categories.
Step #8: Write Summary Report of Results
A summary report is prepared.
The report is similar to writing a report for a focus group.
www.MyEbookNiche.eCrater.com

84 Part 2 Designing the Marketing Research Project
Focus groups typically consist of 8 to 12 participants who are guided by a professional
moderator through a semistructured discussion that most often lasts about two hours. By
encouraging group members to talk in detail about a topic, the moderator draws out as
many ideas, attitudes, and experiences as possible about the specified issue. The funda-
mental idea behind the focus group approach is that one person’s response will spark com-
ments from other members, thus creating synergy among participants.
In addition to the traditional face-to-face method, focus groups are now conducted
online as well. These groups can be either text or video based. Text-based groups are
like chat rooms, but with some enhancements. For example, moderators can use video
demonstrations, and “push” or “spawn” websites to participants’ browsers. Thus, online
focus groups are especially appropriate for web-based advertising of products and services
because they can be tested in their natural environment.
Online focus groups can be conducted relatively quickly because of the ease of participa-
tion and because the focus group transcript is produced automatically during the group. While
body language cannot be assessed with text-based online focus groups and asking follow-
up questions is somewhat more difficult than it is in 3D or traditional offline focus groups,
there are advantages to online focus groups. Software can be used to slow down the responses
of more dominant participants, thus giving everyone a chance to participate. Low incidence
populations are easier to reach online, more geographically diverse samples can be drawn,
response rates can be higher because of increased convenience for participants who can log
in from anywhere, and responses often are more candid because there is less social pressure
when participants are not face to face.9 One study that compared offline and online focus
groups found that while comments were briefer online, they were more colorful and contained
far more humor, a finding that suggests participants are more relaxed in the online setting.10
A variation of online focus groups is the bulletin board format. In the bulletin board
format, 10–30 participants agree to respond over a period of three to seven days. Participants
post to the boards two to three times a day. The moderator posts questions and manages the
discussion that unfolds over several days. This format enables people to participate who might
otherwise not be able to and is especially useful for specific groups that are difficult to recruit,
such as purchasing agents, executives, or medical professionals. In recent years, marketing
research companies who offer bulletin boards have added several features, including the ability
to post from mobile devices, webcam technology, concept evaluation and image markup tools,
and journaling tools. Journaling tools make it possible for participants to respond to questions
at any time by text, picture, or video. Journaling makes it possible for participants to provide
real-time feedback rather than to rely on their memories after the relevant event occurs.
The primary disadvantage of text-based online focus groups is they lack face-to-face
interaction. Thus, some online focus group providers are now offering video formats. One
example is QualVu (www.qualvu.com), a firm that offers a format called the VideoDiary.
The VideoDiary is like a message board where moderators and participants record their
questions and answers, which results in an extended visual dialogue. The video answers
average 3.5 minutes in length and are described as “rich and candid.”11 Researchers can
post text, pictures, or video for participants to view. QualVu also offers speech-to-text
transcription, video clip creation, and note-taking. Using tools available from QualVu,
researchers can easily create a video clip playlist that can be integrated into a PowerPoint
report and delivered in person or online.
Conducting Focus Group Interviews There is no single approach used by all re-
searchers. But focus group interviews can be divided into three phases: planning the
study, conducting the focus group discussions, and analyzing and reporting the results
(see Exhibit 4.5).
Bulletin board An online
research format in which
participants agree to post
regularly over a period of
four to five days.
www.MyEbookNiche.eCrater.com

Chapter 4 Exploratory and Observational Research Designs 85
Phase 1: Planning the Focus Group StudyThe planning phase is important to the success of focus groups. In this phase, research-
ers and decision makers must have a clear understanding of the purpose of the study,
a definition of the problem, and specific data requirements. The purpose of the focus
groups ultimately determines whether face-to-face or online focus groups are the most
appropriate. Other important factors in the planning phase relate to decisions about who
the participants should be, how to select and recruit respondents, and where to have the
focus group sessions.
Focus Group Participants In deciding who should be included as participants in a focus
group, researchers must consider the purpose of the study as well as who can best provide
the necessary information. The first step is to consider all types of participants that should
be represented in the study. Demographics such as age, sex, and product-related behaviors
such as purchase and usage behavior are often considered in the sampling plan. The objec-
tive is to choose the type of individuals who will best represent the target population of
interest. Depending on the research project the target population might include heavy
users, opinion leaders, or consumers currently considering a purchase of the product, for
example.
The number of groups conducted usually increases with the number of participant vari-
ables (e.g., age and geographic area) of interest. Most research issues can be covered with
four to eight groups. Use of more than 10 groups seldom uncovers substantial new infor-
mation on the same topic. Although some differences in opinion between participants are
desirable because they facilitate conversation, participants should be separated into different
groups when differences are likely to result in opinions being withheld or modified. For
example, including top management with middle management in the same employee focus
group can inhibit discussion. Similarly, multiple groups are used to obtain information from
different market segments. Depending on the topic being discussed, desirable commonali-
ties among participants may include occupation, education, income, age, or gender.
Exhibit 4.5 Three-Phase Process for Developing a Focus Group Interview
Phase 1: Planning the Focus Group Study
Researcher must understand the purpose of the study, the problem definition, and specific
data requirements.
Key decisions are who the appropriate participants will be, how to select and recruit
participants, how many focus groups will be conducted, and where to have the sessions.
Phase 2: Conducting the Focus Group Discussions
Moderator’s guide is developed that outlines the topics and questions to be used.
Questions are asked, including follow-up probing.
Moderator ensures all participants contribute.
Phase 3: Analyzing and Reporting the Results
Researcher debriefs all the key players involved to compare notes.
Data obtained from the participants are analyzed using content analysis.
A formal report is prepared and presented.
www.MyEbookNiche.eCrater.com

86 Part 2 Designing the Marketing Research Project
Selection and Recruitment of Participants Selecting and recruiting appropriate par-
ticipants are important to the success of any focus group. The general makeup of the target
population needs to be represented in the focus groups.
To select participants for a focus group, the researcher must first develop a screening
approach that specifies the characteristics respondents must have to qualify for participa-
tion. The first questions are designed to eliminate individuals that might provide biased
comments in the discussion or report the results to competitors. The next questions ensure
that potential respondents meet the demographic criteria and can come at the scheduled
time. A final open-ended question is used to evaluate how willing and able the individual
might be to talk (or respond online) openly about a particular topic. This question is related
to the general topic of the focus groups and gives the potential respondents a chance to
demonstrate their communications skills.
Researchers also must choose a method for contacting prospective participants.
They can use lists of potential participants either supplied by the company sponsor-
ing the research project or a screening company that specializes in focus group inter-
viewing, or purchased from a list vendor. Other methods include snowball sampling,
random telephone screening, and placing ads in newspapers, on bulletin boards, or on
the Internet.
Because small samples are inherently unrepresentative, it is usually not possible to
recruit a random sample for qualitative methods. Therefore, researchers select sample
members purposively or theoretically. Purposive sampling involves selecting sample
members because they possess particular characteristics. For example, sample members
may be chosen because they are typical members of their category, or because they are
extreme members (e.g., heavy users or opinion leaders). A stratified purposive sample
may be chosen so that various target group members (e.g., low-income and high-income
consumers) are included or to provide comparisons between groups. Theoretical sampling
occurs when earlier interviews suggest potentially interesting participants not initially con-
sidered in the sampling plan. For example, if discussions with parents reveal that teenagers
often have input into household technology purchases, a focus group with teens may be
added to the research plan.
Size of the Focus Group Most experts agree that the optimal number of participants in
face-to-face focus group interviews is from 10 to 12. Any size smaller than eight partici-
pants is not likely to generate synergy between participants. In contrast, having too many
participants can easily limit each person’s opportunity to contribute insights and observa-
tions. Recruiters may qualify more than 12 participants for a focus group because inevita-
bly someone will fail to show. But if more than 12 do show up, some participants are paid
and sent home so the group will not be too large.
Focus Group Locations Face-to-face focus groups can be held in the client’s confer-
ence room, the moderator’s home, a meeting room at a church or civic organization, or
an office or hotel meeting room, to name a few. While all of these sites are acceptable, in
most instances the best location is a professional focus group facility. Such facilities
provide specially designed rooms for conducting focus group interviews. Typically, the
room has a large table and comfortable chairs for up to 13 people (12 participants and a
moderator), a relaxing atmosphere, built-in recording equipment, and a one-way mirror
so that researchers and the client can view and hear the discussions without being seen.
Also available is digital video cameras that record the participants’ nonverbal communi-
cation behaviors.
Purposive sampling
Selecting sample members
to study because they
possess attributes
important to understanding
the research topic.
Stratified purposive
sampling Selecting sample
members so that groups
can be compared.
Theoretical sampling
Selecting sample members
based on earlier interviews
that suggest that particular
types of participants will
help researchers better
understand the research
topic.
www.MyEbookNiche.eCrater.com

Chapter 4 Exploratory and Observational Research Designs 87
Phase 2: Conducting the Focus Group DiscussionsThe success of face-to-face focus group sessions depends heavily on the modera-
tor’s communication, interpersonal, probing, observation, and interpretive skills. The
focus group moderator must be able not only to ask the right questions but also to
stimulate and control the direction of the participants’ discussions over a variety of
predetermined topics. The moderator is responsible for creating positive group dynam-
ics and a comfort zone between himself or herself and each group member as well as
among the members themselves.
Preparing a Moderator’s Guide To ensure that the actual focus group session is produc-
tive, a moderator’s guide must be prepared. A moderator’s guide is a detailed outline of
the topics and questions that will be used to generate the spontaneous interactive dialogue
among group participants. Probes or follow-up questions should appear in the guide to help
the moderator elicit more information. Moderator’s guides must be developed and used for
both face-to-face and online focus group sessions.
Consider asking questions in different ways and at different levels of generality. A
common question is to ask what participants think of a specific brand or a product. Asking
a focus group to talk about Mercedes-Benz automobiles, for example, will elicit comments
about the quality and styling of the vehicle. But a moderator can also ask the question
in a more novel way, for instance, “What does the Mercedes-Benz think of you?” This
question elicits entirely different information—for example, that the car company thinks
participants are the kind of people who are willing to spend a lot of money for the prestige
of owning the brand.12
Asking key questions in imaginative ways can draw out important information. In
a focus group about Oldsmobile, participants were asked, “If the Oldsmobile were an
animal, what kind of animal would it be?” Among the answers were “faithful hound,”
and “dinosaur,” which reveals something about the challenges Oldsmobile faces as
a brand. Participants were also asked, “What kind of person drives an Oldsmobile?”
One participant answered “a middle-aged salesperson,” and when asked where the
salesman bought his suit, the answer was “Sears.” Again, these answers to indirect
questions about brand image may sometimes reveal more information than direct
questions.
The level of question is also important. For example, asking participants how they feel
about transportation, trucks, or luxury cars will all result in different responses than asking
more specifically about Mercedes.13 The level of questions chosen should be dictated by
the research problem.
Beginning the Session When using face-to-face focus groups, after the participants sit
down there should be an opportunity (about 10 minutes) for sociable small talk, coupled
with refreshments. The purpose of these presession activities is to create a friendly, warm,
comfortable environment in which participants feel at ease. The moderator should briefly
discuss the ground rules for the session: Participants are told that only one person should
speak at a time, everyone’s opinion is valued, and that there are no wrong answers. If a
one-way mirror or audio/video equipment is being used, the moderator informs partici-
pants they are being recorded and that clients are sitting behind the one-way mirror. Some-
times group members are asked to introduce themselves with a few short remarks. This
approach breaks the ice, gets each participant to talk, and continues the process of building
positive group dynamics and comfort zones. After completing the ground rules and intro-
ductions, the moderator asks the first question, which is designed to engage participants in
the discussion.
Focus group moderator
A person who is well
trained in the interpersonal
communication skills and
professional manners
required for a focus group.
Moderator’s guide A
detailed outline of the
topics, questions, and
subquestions used by the
moderator to lead the focus
group session.
www.MyEbookNiche.eCrater.com

88 Part 2 Designing the Marketing Research Project
Main Session Using the moderator’s guide, the first topic area is introduced to the
participants. It should be a topic that is interesting and easy to talk about. As the dis-
cussion unfolds, the moderator must use probing questions to obtain as many details as
possible. If there is good rapport between group members and the moderator, it should
not be necessary to spend a lot of time merely asking selected questions and receiving
answers. In a well-run focus group, participants interact and comment on each others’
answers.
The most common problem that inexperienced moderators have is insufficient depth
of questioning. For example, a moderator of a focus group on videogaming might ask
participants, “Why do you enjoy gaming?” A likely answer is “it’s fun.” If the question-
ing stops at this point, not much is learned. The moderator must follow up by asking what
exactly makes gaming fun. It may take several follow-up questions to all participants to
elicit all relevant information.
Moderators may give participants exercises to help stimulate conversation. For exam-
ple, in a focus group on the topic of online shopping, participants received index cards
with instructions to write down their favorite website, along with three reasons the site was
their favorite site. The answers on the cards then became the basis for further conversa-
tion. Word association can also be used to start conversations about specific topics. For
example, participants can be asked to write down all the words that come to mind when a
specific company, brand, or product is mentioned. An easel or a whiteboard can be used so
that the moderator can write words and comments to facilitate group interaction about the
various words that participants wrote down.
Moderators for face-to-face focus groups must have excellent listening skills. Par-
ticipants are more likely to speak up if they think they are being heard and that their
opinion is valued. A moderator can show that she is paying attention by looking at par-
ticipants while they are talking and nodding at appropriate times, for instance. If a mod-
erator looks away or checks her watch, participants will sense that she is not genuinely
interested in what they have to say. Similarly, it is very important to give all participants
a chance to talk and to keep one or two participants from dominating the conversation.
If someone has been quiet, a moderator should ask that person a question and include
them in the conversation. Moderators should generally refrain from interruption and
should remain neutral about the topic at hand. Thus, in a discussion about videogames,
a moderator should not indicate his opinion of videogaming in general, specific video-
games, or anything else that would unduly influence the feedback garnered from the
focus group.
Moderators should try to see the topic of discussion from the participants’ point of
view. When a participant gives feedback that is useful, but which may be uncomfortable for
the participant, moderators should support the disclosure by saying something like “thanks
so much for bringing that up,” or “that’s really helpful for us to know.” Make room for
alternative opinions. A moderator can always ask, “does someone else have a different
opinion?” in order to ensure that a specific topic is not being closed too quickly before an
important viewpoint is expressed.
Closing the Session After all of the prespecified topics have been covered, participants
should be asked a closing question that encourages them to express final ideas or opinions.
The moderator may present a final overview of the discussion and then ask the partici-
pants, “Have we missed anything?” or “Do you think we’ve missed anything in the discus-
sion?” Responses to these types of closing questions may reveal some thoughts that were
not anticipated. Participants should be thanked for participating and given the promised
incentive gift or cash.
www.MyEbookNiche.eCrater.com

Chapter 4 Exploratory and Observational Research Designs 89
Phase 3: Analyzing and Reporting the ResultsDebriefing The researchers and the sponsoring client’s representatives should conduct
debriefing and wrap-up activities as soon as possible after focus group members leave the
session. Debriefing analysis gives the researcher, client, and moderator a chance to com-
pare notes. Individuals that have heard (or read) the discussion need to know how their
impressions compare to those of the moderator. Debriefing is important for both
face-to-face and online focus groups.
Content Analysis Qualitative researchers use content analysis to create meaningful findings
from focus group discussions. Content analysis requires the researcher to systematically
review transcripts of individual responses and categorize them into larger thematic categories.
Although first “topline” reactions are shared during debriefing, more formal analysis will
reveal greater detail and identify themes and relationships that were not remembered and
discussed during debriefing. Face-to-face focus groups need to have transcripts converted to
electronic format, but online groups are already in electronic format. Software can then be
used with the electronic transcripts to identify and summarize overall themes and topics for
further discussion. Qualitative data analysis is discussed in more detail in Chapter 9.
Advantages of Focus Group Interviews There are five major advantages to using focus group interviews. They stimulate new ideas,
thoughts, and feelings about a topic; foster understanding of why consumers act or behave
in certain market situations; allow client participation; elicit wide-ranging participant
responses; and bring together hard-to-reach informants. Because group members interact
with each other, the social influence process that affects consumer behavior and attitudes
can be observed. For example, a review of Coca-Cola’s research concerning New Coke
found that the social influence effects apparent in focus groups were more predictive of the
failure of New Coke than were individual interviews.14
As with any exploratory research design, focus group interviews are not a perfect
research method. The major weaknesses of focus groups are inherently similar to all quali-
tative methods: the findings lack generalizability to the target population, the reliability of
the data is limited, and the trustworthiness of the interpretation is based on the care and
insightfulness of researchers. Focus groups have an additional drawback: the possibility
that group dynamics contaminate results. While the interaction between participants can
be a strength of focus group research, groupthink is possible as well. Groupthink happens
when one or two members of the focus group state an opinion and other members join the
bandwagon. Groupthink is most likely when participants do not have a previously well-
formed opinion on issues discussed in the group.
Purposed Communities/Private CommunityPurposed communities are online social networks that may be specific to marketing
research, or they may be broader brand communities, the primary purpose of which is
marketing but are also used to provide research insights.15 For example, MyStarbucksIdea
.com is a brand community whose primary focus is producing new ideas, but the site is also
used for research.
Private communities are purposed communities, the primary purpose of which
is research. Consumers and customers are recruited for the purpose of answering ques-
tions and interacting with other participants within the private community. In online
Debriefing analysis An
interactive procedure in
which the researcher and
moderator discuss the sub-
jects’ responses to the top-
ics that outlined the focus
group session.
Content analysis The
systematic procedure of
taking individual responses
and grouping them into
larger theme categories or
patterns.
Groupthink A phenomenon
in which one or two
members of a group state
an opinion and other
members of the group are
unduly influenced.
Purposed communities
Online brand communities
that can be used for research.
Private communities
Purposed communities
whose primary purpose is
research.
www.MyEbookNiche.eCrater.com

90 Part 2 Designing the Marketing Research Project
communities, most people participate because they think they can improve products and
marketing communication for a brand or product about which they care. For some com-
munities, such as the Harley-Davidson owner community, individuals participate for free
and feel honored to do so.16 Participants are made to feel like part of the inner circle, with
intrinsic incentives driving participation.
Participant samples are usually handpicked to be representative of the relevant
target market, or they are devoted fans of the brand. Communispace originated private com-
munities and currently operates more than 500 communities for clients such as Proctor &
Gamble, Kraft Foods, The Home Depot, BP, Novartis, Verizon, Walmart, and Godiva
Chocolates. PepsiCo’s director of shopper insights, Bryan Jones, summarizes the benefits
of private communities: “Through the evolution of technology, marketers and research-
ers now have unparalleled access to consumers and the ability to quickly and efficiently
communicate with them in real time. Research that cost tens of thousands of dollars and
took weeks and months in the past can now be accomplished in days or hours and deliver
similar insights for much less money.”17
Because of the start-up costs involved, most companies outsource community devel-
opment to a provider, but the site is client branded. Techniques are evolving along with
technology. Private community participants are increasingly asked to use mobile phones
to provide real-time feedback, as well as posting pictures and video to the community.
Private communities may be short or long term, and may involve small or large numbers
of participants, from 25 in small groups up to 2,000 for larger groups. There is some con-
troversy about whether private communities should be long term, or whether they are more
productive when focused on specific issues for shorter periods of times. One shortcoming
of long-term private communities is that members may become more positive about brands
and products over time because of their participation in the community and may provide
increasingly positive feedback.
EasyJet, a European low-cost airline, has been utilizing a private community that
has 2,000 customers for nearly a decade. The community is queried about a variety of
issues, including concept screening, product development, and overall customer experi-
ence. According to Sophie Dekker, EasyJet’s customer research manager, they have been
able “to conduct more research, for more areas of the business, in a faster time frame but
within the same budgetary constraints.”18 Similarly, Godiva Chocolate used a sample of
400 chocoholics, all women, to help them understand what kinds of products and promo-
tions would help them sell their premium chocolate in a difficult economy. The com-
munity helped Godiva to focus on baskets of chocolate priced $25 or less and to develop
a heart-shaped lollipop for Valentine’s Day that sold for $5.50. Godiva’s participants are
passionate about chocolate; they often log in to the community every day and participate
for monthly gift certificates worth $10.19
Private community members may be asked to engage in other research projects such
as surveys or in-person ethnography. In-person ethnography asks community members
to chronicle an emotion (e.g., what annoys you?), process (e.g., shopping in a grocery
store), or ritual (Thanksgiving dinner) using mobile devices. While engagement is much
more limited than in traditional ethnography, in-person ethnography does create in-context
observations that would be difficult or expensive to record using other research methods.20
Short-term private communities may run from two weeks all the way up to three
months and typically range from 25 to 300 members. These short-term private commu-
nities are less like communities because of their short-term nature, but are often more
focused on specific issues. Because these private communities are similar to traditional
qualitative focus groups, albeit being more up to date, these short-term communities are
increasingly successful at competing with their more traditional counterpart.21
www.MyEbookNiche.eCrater.com

Chapter 4 Exploratory and Observational Research Designs 91
Other Qualitative Data Collection Methods
In addition to IDIs, focus groups, and observation, there are several other qualitative data
collection methods used by marketing researchers. We provide a brief overview of these
methods here.
EthnographyMost qualitative methods do not allow researchers to actually see consumers in their
natural setting. Ethnography, however, is a distinct form of qualitative data collection
that seeks to understand how social and cultural influences affect people’s behavior and
experiences. Because of this unique strength, ethnography is increasingly being used to
help researchers better understand how cultural trends influence consumer choices. Eth-
nography records behavior in natural settings, often involves the researcher in extended
experience in a cultural or subcultural context, called participant observation, pro-
duces accounts of behaviors that are credible to the persons who are studied, and
involves triangulation among multiple sources of data.22 An ethnography of skydiving,
for example, employed multiple methods, using observation of two skydiving sites over
a two-year time period, participant observation of one researcher who made over 700
dives during the research, and IDIs with skydiving participants with varying levels of
experience.23
There is no one given set of data collection tools used in ethnography. Participant
observation is often used because observers can uncover insights by being part of a cul-
ture or subculture that informants cannot always articulate in interviews. However, some
research questions do not require participant involvement to provide answers to questions.
In nonparticipant observation, the researcher observes without entering into events. For
example, Whirlpool’s corporate anthropologist Donna Romero conducted a study for a
line of luxury jetted bathtubs. She interviewed 15 families in their homes and videotaped
participants as they soaked in bathing suits. Last, Romero asked participants to create a
journal of images that included personal and magazine photos. From her research, Romero
concluded that bathing is a “transformative experience . . . it’s like getting in touch with the
divine for 15 minutes.”24
Because of social media, consumers are used to reporting what they do, when they
do it, and why. Thus, mobile ethnography, where consumers provide pictures and videos
concerning the research topic in real time, is growing. Consumers can film themselves
shopping for particular items, or using products and services, for instance. While not as
extensive as traditional ethnography, these methods do provide the ability for researchers
to analyze consumers in context.
Case StudyCase study research focuses on one or a few cases in depth, rather than studying many
cases superficially (as does survey research).25 The case or element studied may be a
process (e.g., the organizational purchase decision for large dollar items), a household,
an organization, a group, or an industry. It is particularly useful in studying business-to-
business purchase decisions because they are made by one or only a few people. Case
study research tracks thinking by the same individual, group, or organization using
multiple interviews over several weeks and can therefore obtain subconscious thinking
and study group interaction over time as problems, projects, and processes are defined
and redefined.
Ethnography A form of
qualitative data collection that
records behavior in natural
settings to understand how
social and cultural influences
affect individuals’ behaviors
and experiences.
Participant observation An
ethnographic research
technique that involves
extended observation of
behavior in natural settings
in order to fully experience
cultural or subcultural
contexts.
Case study An exploratory
research technique that
intensively investigates
one or several existing
situations that are similar
to the current problem/
opportunity situation.
www.MyEbookNiche.eCrater.com

92 Part 2 Designing the Marketing Research Project
Projective TechniquesProjective techniques use indirect questioning to encourage participants to freely proj-
ect beliefs and feelings into a situation or stimulus provided by the researcher. Partici-
pants are asked to talk about what “other people” would feel, think, or do, interpret or
produce pictures, or project themselves into an ambiguous situation. Indirect questioning
methods are designed to more nearly reveal a participant’s true thoughts than do direct
questions, which often prompt people to give rational, conscious, and socially desirable
responses.
Projective techniques were developed by clinical psychologists and can be used in con-
junction with focus groups or IDIs. These techniques include word association tests, sen-
tence completion tests, picture tests, thematic apperception tests (TAT), cartoon or balloon
tests, role-playing activities, and the Zaltman Metaphor Elicitation Technique (ZMET).
The stimuli should be ambiguous enough to invite individual participant interpretation, but
still specific enough to be associated with the topic of interest.
The major disadvantage of projective techniques is the complexity of interpretation.
Highly skilled researchers are required and they can be expensive. There is a degree of sub-
jectivity in all qualitative research analyses, but even more so when projective techniques
are used. The background and experiences of the researcher influence the interpretation of
data collected by projective techniques.
Word Association Tests In this type of interview, a respondent is read a word or a pre-
selected set of words, one at a time, and asked to respond with the first thing that comes to
mind regarding that word. For example, what comes to your mind when you hear the words
mobile phone or book, or brand names such as Target or Nike? Researchers study the re-
sponses to word association tests to “map” the underlying meaning of the product or
brand to consumers.
Projective techniques An
indirect method of
questioning that enables
a subject to project beliefs
and feelings onto a third
party, into a task situa-
tion, or onto an inanimate
object.
Word association test A
projective technique
in which the subject is
presented with a list of
words or short phrases,
one at a time, and asked
to respond with the first
thought [word] that comes
to mind.
A business consultant with experience in the restaurant
industry is hired by the owners of the Santa Fe Grill. After
an initial consultation, the business consultant recom-
mends two areas to examine. The first area focuses on
the restaurant operations. The proposed variables to be
investigated include:
Prices charged.
Menu items offered.
Interior decorations and atmosphere.
Customer counts at lunch and dinner.
Average amount spent per customer.
The second area to learn more about are what factors
Santa Fe Grill customers consider in selecting a restau-
rant. Variables to be examined in the project include:
Food quality.
Food variety.
Waitstaff and other restaurant employees.
Pricing.
Atmosphere.
Dining out habits.
Customer characteristics.
The owners value your opinion of the research project
and ask you the following questions:
Do the two areas of the research project proposed
by the consultant include all the areas that need to be
researched? If not, which others need to be studied?
Can these topics be fully understood with qualitative
research alone? Is quantitative research needed as
well?
CONTINUING CASE: THE SANTA FE GRILL
www.MyEbookNiche.eCrater.com

Chapter 4 Exploratory and Observational Research Designs 93
Sentence Completion Tests In sentence completion tests, participants are presented
with sentences and asked to complete them in their own words. When successful, sentence
completion tests reveal hidden aspects about individuals’ thoughts and feelings toward the
object(s) studied. From the data collected, researchers interpret the completed sentences to
identify meaningful themes or concepts. For example, let’s say the local Chili’s restaurant
in your area wants to find out what modifications to its current image are needed to attract
a larger portion of the college student market segment. Researchers could interview college
students in the area and ask them to complete the following sentences:
People who eat at Chili’s are .
Chili’s reminds me of .
Chili’s is the place to be when .
A person who gets a gift certificate for Chili’s is .
College students go to Chili’s to .
My friends think Chili’s is .
The Zaltman Metaphor Elicitation Technique (ZMET) The Zaltman Metaphor
Elicitation Technique is the first marketing research tool to be patented in the United
States. It is based on the projective hypothesis, which holds that a good deal of thought,
especially thought with emotional content, is processed in images and metaphors rather
than words.26 In contrast to surveys and focus groups, the most widely used techniques in
marketing research, which rely heavily on verbal stimuli, the ZMET uses a visual method.
Gerald Zaltman of Olson Zaltman Associates explains that “consumers can’t tell you what
they think because they just don’t know. Their deepest thoughts, the ones that account for
their behavior in the marketplace, are unconscious [and] . . . primarily visual.”27
Several steps are followed in the ZMET. When recruited, participants are told the topic
of the study, for example, Coke. Participants are asked to spend a week collecting 10 to
15 pictures or images that describe their reaction to the topic (in this case, Coke) and to
bring the pictures to their interview. Each participant is asked to compare and contrast pic-
tures and to explain what else might be in the picture if the frame were to be widened. Then,
participants construct a “mini-movie,” which strings together the images they have been dis-
cussing and describes how they feel about the topic of interest. At the end of the interview,
participants create a digital image, which is a summary image of their feelings. When the
ZMET was used to study Coke, the company discovered something they already knew—
that the drink evokes feelings of invigoration and sociability. But it also found something
they did not know—that the drink could bring about feelings of calm and relaxation. This
paradoxical view of Coke was highlighted in an ad that showed a Buddhist monk meditating
in a crowded soccer field, an image taken from an actual ZMET interview.28
Observation Methods
Researchers use observation methods to collect primary data about human behavior and
marketing phenomena regardless of the nature of research designs (e.g., exploratory,
descriptive, or causal). Observation research can involve collection of either qualitative
or quantitative data and may result in qualitative or quantitative summaries and analy-
ses of the collected information. The primary characteristic of observational techniques
is that researchers must rely on their observation skills rather than asking participants
predetermined questions. That is, with in-person or video observation, the researchers
watch and record what people or objects do instead of asking questions. Researchers
Sentence completion
test A projective technique
where subjects are given
a set of incomplete
sentences and asked to
complete them in their own
words.
Zaltman Metaphor
Elicitation Technique
(ZMET) A visual research
technique used in in-depth
interviewing that encour-
ages research participants
to share emotional and
subconscious reactions to
a particular topic.
www.MyEbookNiche.eCrater.com

94 Part 2 Designing the Marketing Research Project
occasionally combine questioning methods (e.g., IDIs with key informants, surveys, focus
groups) with observational research to help them clarify and interpret their findings.
Information about the behavior of people and objects can be observed: physical actions
(e.g., consumers’ shopping patterns or automobile driving habits), expressive behaviors
(e.g., tone of voice and facial expressions), verbal behavior (e.g., phone conversations),
temporal behavior patterns (e.g., amount of time spent shopping online or on a particular
website), spatial relationships and locations (e.g., number of vehicles that move through a
traffic light or movements of people at a theme park), physical objects (e.g., which brand
name items are purchased at supermarkets or which make/model SUVs are driven), and so
on. This type of data can be used to augment data collected with other research designs by
providing direct evidence about individuals’ actions.
Observation research involves systematic observing and recording of behavioral pat-
terns of objects, people, events, and other phenomena. Observation is used to collect data
about actual behavior, as opposed to surveys in which respondents may incorrectly report
behavior. Observation methods require two elements: a behavior or event that is observable
and a system of recording it. Behavior patterns are recorded using trained human observ-
ers or devices such as video cameras, cameras, audiotapes, computers, handwritten notes,
radio frequency identification (RFID) chips or some other recording mechanism. The main
weakness of nonparticipant observation methods is they cannot be used to obtain informa-
tion on attitudes, preferences, beliefs, emotions, and similar information. A special form
of observational research, ethnography, involves extended contact with a natural setting
and can even include researcher participation. However, because of the time and expense
involved, true ethnographies are rarely undertaken by marketing researchers.
Unique Characteristics of Observation MethodsObservation can be described in terms of four characteristics: (1) directness; (2) awareness;
(3) structure; and (4) type of observing mechanism. Exhibit 4.6 is an overview of these
characteristics and their impact. Have a close look at Exhibit 4.6.
Types of Observation MethodsThe type of observation method refers to how behaviors or events will be observed.
Researchers can choose between human observers and technological devices. With human
observation, the observer is either a person hired and trained by the researcher or is a mem-
ber of the research team. To be effective, the observer must have a good understanding of
the research objectives and excellent observation and interpretation skills. For example,
a marketing research professor could use observation skills to capture not only students’
verbal classroom behavior but also nonverbal communication exhibited by students dur-
ing class (e.g., facial expressions, body postures, movement in chairs, hand gestures). If
assiduously practiced by the professor, this enables her or him to determine, in real time, if
students are paying attention to what is being discussed, when students become confused
about a concept, or if boredom begins to set in.
In many situations, the use of mechanical or electronic devices is more suitable than a
person in collecting the data. Technology-mediated observation uses a technology to cap-
ture human behavior, events, or marketing phenomena. Devices commonly used include
video cameras, traffic counters, optical scanners, eye tracking monitors, pupilometers,
audio voice pitch analyzers, psychogalvanometers, and software. The devices often reduce
the cost and improve the flexibility and accuracy of data collection. For example, when
the Department of Transportation conducts traffic-flow studies, air pressure lines are laid
Observation research
Systematic observation and
recording of behavioral
patterns of objects,
people, events, and other
phenomena.
Technology-mediated
observation Data collection
using some type of
mechanical device to capture
human behavior, events, or
marketing phenomena.
www.MyEbookNiche.eCrater.com

Chapter 4 Exploratory and Observational Research Designs 95
across the road and connected to a counter box that is activated every time a vehicle’s
tires roll over the lines. Although the data are limited to the number of vehicles passing
by within a specified time span, this method is less costly and more accurate than using
human observers to record traffic flows. Other examples of situations where technology-
mediated observation would be appropriate include security cameras at ATM locations to
detect problems customers might have in operating an ATM, optical scanners and bar-code
technology (which relies upon the universal product code or UPC) to count the number and
types of products purchased at a retail establishment, turnstile meters to count the number
of fans at major sporting or entertainment events, and placing “cookies” on computers to
track Internet usage behavior (clickstream analysis).
Advances in technology are making observation techniques more useful and cost
effective. For example, AC Nielsen upgraded its U.S. Television Index (NTI) system
by integrating its People Meter technology into the NTI system. The People Meter is a
technology-based rating system that replaces handwritten diaries with electronic measur-
ing devices. When the TV is turned on, a symbol appears on the screen to remind viewers
to indicate who is watching the program using a handheld electronic device similar to a
TV remote control. Another device attached to the TV automatically sends prespecified
information (e.g., viewer’s age, gender, program tuned to, time of program) to Nielsen’s
computers. Data are used to generate overnight ratings for shows as well as demographic
profiles of the audience for various shows.
Scanner technology, a type of electronic observation, is rapidly replacing traditional
consumer purchase diary methods. Scanner-based panels involve a group of participating
households that are assigned a unique bar-coded card that is presented to the clerk at the
checkout register. The household’s code number is matched with information obtained from
scanner transactions during a defined period. Scanner systems enable researchers to observe
and develop a purchase behavior database on each household. Researchers also can combine
offline tracking information with online-generated information for households, providing
more complete customer profiles. Studies that mix online and offline data can show, for
Scanner-based panel A
group of participating
households that have
a unique bar-coded
card as an identification
characteristic for inclusion
in the research study.
Exhibit 4.6 Unique Characteristics of Observation
Characteristic Description
Directness The degree to which the researcher or trained observer actually
observes the behavior or event as it occurs. Observation can be
either direct or indirect.
Awareness The degree to which individuals consciously know their
behavior is being observed and recorded. Observation can be
either disguised or undisguised.
Structure The degree to which the behavior, activities, or events to be
observed are known to the researcher before doing the
observations. Observation can be either structured or
unstructured.
Observing mechanism How the behavior, activities, or events are observed and
recorded. Alternatives include trained human observers and
technological devices.
www.MyEbookNiche.eCrater.com

96 Part 2 Designing the Marketing Research Project
instance, if panel members who are exposed to an online ad or website made an offline pur-
chase after their exposure. Scanner data provide week-by-week information on how products
are doing in individual stores and track sales against price changes and local ads or promotion
activities. They also facilitate longitudinal studies covering longer periods of time.
Scanner technology is also used to observe and collect data from the general popula-
tion. Market research companies work with drug stores, supermarkets, and other types of
retail stores to collect data at check-out counters. The data include products purchased,
time of day, day of week, and so forth. Data on advertising campaigns as well as in-store
promotions is integrated with the purchase data to determine effectiveness of various mar-
keting strategies.
Perhaps the fastest growing observational research approaches involve the Internet.
The Internet, various digital devices, and RFID are enhancing the ability of marketers to
electronically track a growing number of behaviors. Online merchants, content sites, and
search engines all collect quantitative information about online behavior. These companies
maintain databases with customer profiles and can predict probable response rates to ads,
the time of day and day of week the ads are likely to be most effective, the various stages
of potential buyers in the consideration process for a particular product or service, and the
type and level of engagement with a website. Extensive qualitative data from social media
is increasingly being harvested on the Internet. The data involves online conversations about
products, services, brands, and marketing communications that occur in social media. RFID
has expanded the ability to electronically track consumers. PathTracker is a system that
consists of RFID tags that are affixed to shopping carts. These signals are picked up every
few seconds by antennae around the perimeter of the store. Researchers can match purchase
records with path data. One group of researchers used PathTracker data to learn how con-
sumers shop in grocery stores. They found that consumers become more purposeful and less
exploratory the more time they spend in the store; are more likely to allow themselves to
purchase shop for “vice” products after they’ve purchased items in “virtue” categories; and
other shoppers may discourage consumers from shopping in a specific store zone.29
Selecting the Observation MethodThe first step in selecting the observation method is to understand the information require-
ments and consider how the information will be used later. Without this understanding,
selecting the observation method is significantly more difficult. First researchers must
answer the following questions:
1. What types of behavior are relevant to the research problem?
2. How much detail of the behavior needs to be recorded?
3. What is the most appropriate setting (natural or artificial) to observe the behavior?
Then the various methods of observing behaviors must be evaluated. Issues to be con-
sidered include:
1. Is a setting available to observe the behaviors or events?
2. To what extent are the behaviors or events repetitious and frequently exhibited?
3. What degree of directness and structure is needed to observe the behaviors or events?
4. How aware should the subjects be that their behaviors are being observed?
5. Which observation method is most appropriate: in-person or technology-mediated?
The researcher can now determine the proposed method’s ability to accurately observe
and record the behavior or activity. The costs involved—time, money, and manpower—
www.MyEbookNiche.eCrater.com

Chapter 4 Exploratory and Observational Research Designs 97
also must be determined and evaluated. Finally, potential ethical issues associated with the
proposed observation method must be considered.
Benefits and Limitations of Observation MethodsObservation methods have strengths and weaknesses (see Exhibit 4.7). Among the major
benefits is that observation enables collection of actual behavior or activities rather than
reported activities. This is especially true in situations where individuals are observed
in a natural setting using a disguised technique. In addition, observation methods reduce
recall error, response bias, and refusal to participate, as well as interviewer errors. Finally,
data can often be collected in less time and at a lower cost than through other types of
procedures.
Social Media Monitoring and the Listening PlatformSocial media monitoring is observational research based on analyzing conversations in
social media, for example, Facebook, Twitter, blogs, and product review sites. The moni-
toring provides marketing researchers with a rich source of existing, authentic information
from the river of news that is being organically shared in social networks online. Blogs,
social networking sites, and online communities provide a natural outlet for consumers to
share experiences about products, brands, and organizations. The difference between social
media monitoring and private communities (covered previously) is that in social media
research, the data (text, images, and video) already exists and is not created by interaction
with researchers. Thus, one strength of social media monitoring is that researchers can
observe people interacting with each other unprompted by the potential bias of interview-
ers and questions. Another advantage of social media monitoring is individuals who may
not fill out surveys or agree to focus groups might nevertheless share their experiences
with online social networks.
But social media monitoring has several weaknesses. For example, while the
expense is forecasted to decrease, it currently costs thousands of dollars a month just
to monitor a few well-chosen keywords.30 Second, many of the automated techniques
for classifying textual data are unproven so the accuracy of the information is unknown.
Third, the sample of people interacting about the brand, product, or advertising cam-
paign is a self-selected sample that may not be representative of consumer reactions in
the target market. In fact, different social media monitoring tools often produce different
results.31 Last, some social media sites are not publicly available for researchers to mine.
Social media monitoring
Research based on
conversations in social
media.
Exhibit 4.7 Benefits and Limitations of Observation
Benefits of Observation Limitations of Observation
Accuracy of recording actual behavior Difficult to generalize findings
Reduces many types of data collection error Cannot explain behaviors or events
unless combined with another method
Provides detailed behavioral data Problems in setting up and recording
behavior(s) or events
www.MyEbookNiche.eCrater.com

98 Part 2 Designing the Marketing Research Project
For example, most of Facebook is not open to the public. Given all these issues, it is not
surprising that analysts suggest viewing results from social monitoring media programs
in the context of the organization’s larger research program.32 One industry observer
cautions: “Traditional quantitative research has well-established methods of assessing
reliability and validity. The methods of assessing the trustworthiness of [traditional]
qualitative research are less precise but well established. By contrast, the views about
social media research vary widely.”33
A listening platform or post is an integrated approach to monitoring and analyz-
ing media sources to provide insights that support marketing decision making. In the
past, larger companies often paid for a service that would read and clip articles from
newspapers and magazines. Listening platforms are a technologically enhanced version of
this older service. Reasons for deploying a listening platform include monitoring online
brand image, complaint handling, discovering what customers want, tracking trends, and
determining what one’s competitors are doing.34 Listening platforms are in their infancy
and are ripe for a large number of research innovations in coming years.35 Some research
firms combine the data mined through their online listening platform with additional
online and offline data, for example, sales, awareness, clickstream measures, and inven-
tory movement.
The qualitative data available from social media monitoring can be analyzed qualita-
tively, quantitatively, or both. Currently, most social media monitoring tools seek to seam-
lessly mix qualitative and quantitative analyses. The earliest application of quantitative
methods is simple counts of mentions of keywords. Another emerging, but controversial,
quantitative tool is sentiment analysis, also called opinion mining. Sentiment analysis
relies on the emerging field of natural language processing (NLP) that enables automatic
categorization of online comments into positive or negative categories. Initial research
applied sentiment analysis tools to product, movie, and restaurant reviews.36 Quantitative
measures of sentiment are still limited as a large amount of data is currently unclassifiable
or incorrectly classified with current automation tools. But more advanced sentiment analy-
sis tools are being developed to go beyond grouping by category and enable classification
by emotions such as sad, happy, or angry.37 Thus, in the next few years, sentiment analysis
methods are likely to be improved substantially, with their use becoming more pervasive.
Common features of social monitoring software include sentiment scoring, identification
of influencers who are talking about your brand, and measurement of social media cam-
paigns such as when conversations are happening and the share of conversations that are
about your brand.
In addition to quantitative metrics, online conversations are typically mined for
qualitative insights as well. Online conversations about the topic of interest may be
too numerous to efficiently analyze manually. But qualitative researchers can sample
comments for intensive analysis. Sampling can be random or can involve oversampling
among especially active and connected web posters. In addition to being useful as an
independent tool to provide in-depth opinions, qualitative analysis of conversations
provides relevant categories of issues and opportunities for automated tools to follow up
and quantify.
Social media analytics have some limitations that make it unlikely that the technique
will ever fully replace traditional marketing research methods. Many consumers use social
media rarely if ever. Moreover, the consumers who engage most heavily in social media
conversations about products and brands are more likely to be “eager shoppers.”38 Never-
theless, social media monitoring has already provided researchers with a ready source of
existing feedback. As the techniques evolve and improve, they are expected to continue
to grow.39
Listening platform/post
An integrated system that
monitors and analyzes
social media sources to
provide insights that will
support marketing decision
making.
Sentiment analysis/opinion
mining The application
of technological tools
to identify, extract, and
quantify subject information
in textual data.
www.MyEbookNiche.eCrater.com

Chapter 4 Exploratory and Observational Research Designs 99
NetnographyNetnography is an observational research technique that requires deep engagement with
one or more social media communities. What differentiates netnography from the other
social media research techniques is the extensive contact and analysis of online communi-
ties and the use of participant observation. These online communities are often organized
around interests in industries, products, brands, sports teams, or music groups, and contain
fanatic consumers who are lead users or innovators. Rob Kozinets, who developed netnog-
raphy, used the technique to study an online community of “coffeephiles.” Kozinets con-
cluded that devotion to coffee among the members of the community was almost religious:
“Coffee is emotional, human, deeply and personally relevant—and not to be commodified . . .
or treated as just another product.”40
In netnography, researchers must (1) gain entrée into the community, (2) gather and analyze
data from members of the community, (3) ensure trustworthy interpretation of the data, and
(4) provide opportunities for feedback on the research report from members of the com-
munity (see Chapter 9 for interpretation and analysis of qualitative data). Before gaining
entrée, researchers develop research questions and search to identify online forums that
will provide the answers to their research questions. Generally, researchers prefer to col-
lect data from higher traffic forums with larger numbers of discrete message posters and
greater between-member interactions.41
Netnography A research
technique that requires
deep engagement with
online communities.
www.MyEbookNiche.eCrater.com

100 Part 2 Designing the Marketing Research Project
MARKETING RESEARCH IN ACTIONReaching Hispanics through Qualitative Research
More than 55.4 million (17.4 percent of the U.S. population) are classified as Hispanic.
The Hispanic/Latino population is diverse as it flows from many Spanish-speaking coun-
tries around the world characterized by different levels of acculturation. When Hispanics
become acculturated, they often strongly identify with both America and their country of
origin, an effect that persists across generations. A minority of Hispanics use Spanish as
their primary language, with most Hispanics preferring to speak both Spanish and English.
Vice president of multicultural business development at Horowitz Associates, Adriana
Waterston, emphasizes that approaching the Hispanic segment “has never been exclusively
about language as much as cultural relevance.”1 Other researchers have concluded that
whatever is the country of origin, themes are relevant in Spanish-speaking communities:
family, moral values, religion, music, cooking, dancing, and socializing.
How do these findings influence marketing research? Ricardo Lopez, president of
Hispanic Research, Inc., asserts that qualitative research is especially appropriate for
the Hispanic marketplace and emphasizes that the population has to be approached dif-
ferently in order for research to be useful. Quantitative research methods are structured,
linear, and dry, suggesting government and academic research rather than connection.
In contrast, Latinos prefer qualitative approaches that involve tangents, storytelling, and
an expressive process often characterized as lively. This style of interaction is especially
noticeable among less-acculturated Latino populations but is evident among acculturated
Hispanics as well. Participants in qualitative research projects should be treated like a
guest in your home as it is important to form a strong emotional connection to facilitate
interaction. Face-to-face focus groups, IDIs, and ethnography are all appropriate for the
Latino marketplace. When a relevant population can be recruited that has access to the
Internet, IDIs using webcams, bulletin board focus groups, and private communities can
also produce high-quality insights into Hispanic populations for clients.
Private communities are increasingly being utilized with Hispanics, including
those who prefer to participate in Spanish as well as those who prefer to communi-
cate in English. Communi space has recruited Hispanics of all ages, nationalities,
and acculturation levels to participate in Spanish-language brand communities. The
facilitators of research among these communities recommend a different approach
for engaging these consumers. Facilitators allow members to make the commu-
nity their space where participants can form close bonds, trading advice and per-
sonal stories. Also, participants should be allowed to build personal relationships
with each other and the facilitators, replicating the sense of family so important in
Hispanic culture. Finally, more facilitation is needed in Hispanic private communi-
ties not only because this segment values connectedness, but also because more help
is needed for technical issues. If the extra work is invested, the insights generated can
be extraordinary.
Traditional marketing research among Hispanics has often focused too heavily on
classifying the marketplace in terms of language, acculturation, and generation. Perhaps
this is because of overreliance on quantitative research approaches. One strength of quali-
tative research is the ability to tap deeper contextual, psychological, and cultural issues. As
the Latino marketplace continues to grow, marketing researchers will need to adjust their
research approach, continually identifying “culturally relevant ways to interact.”2
www.MyEbookNiche.eCrater.com

Chapter 4 Exploratory and Observational Research Designs 101
Hands-On ExerciseUsing the material from the chapter and the earlier information, answer each of the follow-
ing questions.
1. Should marketing researchers working with Latinos concentrate solely on qualitative
research? Explain your answer.
2. Could qualitative research be used to improve quantitative methods such as surveys?
Explain your answer.
3. What challenges do researchers face in conducting research with the Latino market-
place online? How can researchers minimize the effects of these difficulties?
4. Think of one or two cultures or subcultures with which you are at least somewhat familiar.
Would qualitative research be especially useful for these cultures? Why or why not?
Sources: Sharon R. Ennis, Merarys Rios-Vargas, and Nora G. Albert, “The Hispanic
Population: 2010,” United States Census Bureau, U.S. Department of Commerce,
Economics and Statistics Administration, May 2011; Manila Austin and Josué Jansen,
“¿Me Entiende?: Revisiting Acculturation,” Communispace.com/UploadedFiles
/ResearchInsights/Research_Patterns/MacroTrends_MeEntiendes.pdf, accessed
January 16, 2012; Horowitz Associates, “Horowitz Associates Study Reveals That
for Many U.S. Latinos Biculturalism Is Key to Self-Identity,” July 7, 2011, www
.horowitzassociates.com/press-releases/horowitz-associates-study-reveals-that
-for-many-u-s-latinos-biculturalism-is-key-to-self-identity, accessed January 17, 2012;
Ricardo Antonio Lopez, “U.S. Hispanic Market—Qualitative Research Practices and
Suggestions,” QRCA Views, Spring 2008, pp. 44–51; Hispanic Research, Inc., “Online
Research,” accessed January 16, 2012; Hispanic Research Inc., “Qualitative Research,”
accessed January 16, 2012; Katrina Lerman, “Spanish-language Facilitators Share Their
Best Tips,” MediaPost Blogs, February 12, 2009, www.mediapost.com/publications
/article/100194/, accessed January 14, 2012; Thinknow Research, “Communities,”
Thinknowresearch.com/communities, accessed January 17, 2012.
References1. Horowitz Associates, “Horowitz Associates Study Reveals that for Many U.S. Latinos
Biculturalism Is Key to Self-Identity,” July 7, 2011, www.horowitzassociates.com
/press-releases/horowitz-associates-study-reveals-that-for-many-u-s-latinos
- biculturalism-is-key-to-self-identity, accessed January 17, 2012.
2. Manila Austin and Josué Jansen, “¿Me Entiende?: Revisiting Acculturation,”
Communispace.com/UploadedFiles/ResearchInsights/Research_Patterns
/MacroTrends_MeEntiendes.pdf, accessed January 16, 2012, p. 34.
www.MyEbookNiche.eCrater.com

102 Part 2 Designing the Marketing Research Project
Summary
Identify the major differences between qualitative
and quantitative research.
In business problem situations where secondary infor-
mation alone cannot answer management’s questions,
primary data must be collected and transformed into
usable information. Researchers can choose between
two general types of data collection methods: quali-
tative or quantitative. There are many differences
between these two approaches with respect to their
research objectives and goals, type of research, type
of questions, time of execution, generalizability to tar-
get populations, type of analysis, and researcher skill
requirements.
Qualitative methods may be used to generate
exploratory, preliminary insights into decision prob-
lems or address complex consumer motivations that
may be difficult to study with quantitative research.
Qualitative methods are also useful to understand the
impact of culture or subculture on consumer decision
making and to probe unconscious or hidden motivations
that are not easy to access using quantitative research.
Qualitative researchers collect detailed amounts of data
from relatively small samples by questioning or observ-
ing what people do and say. These methods require the
use of researchers well trained in interpersonal com-
munication, observation, and interpretation. Data typi-
cally are collected using open-ended or semistructured
questioning formats that allow for probing attitudes or
behavior patterns or observation techniques for cur-
rent behaviors or events. While qualitative data can be
collected quickly (except in ethnography), it requires
good interpretative skills to transform data into useful
findings. The small nonrandom samples that are typi-
cally used make generalization to a larger population of
interest questionable.
In contrast, quantitative or survey research meth-
ods place heavy emphasis on using formal, structured
questioning practices where the response options have
been predetermined by the researcher. These questions
tend to be administered to large numbers of respondents.
Quantitative methods are directly related to descriptive
and causal types of research projects where the objec-
tives are either to make more accurate predictions about
relationships between market factors and behaviors or
to validate the existence of relationships. Quantitative
researchers are well trained in scale measurement, ques-
tionnaire design, sampling, and statistical data analyses.
Understand in-depth interviewing and focus groups
as questioning techniques.
An IDI is a systematic process of asking a subject a set
of semistructured, probing questions in a face-to-face
setting. Focus groups involve bringing a small group
of people together for an interactive and spontane-
ous discussion of a particular topic or concept. While
the success of in-depth interviewing depends heavily
on the interpersonal communication and probing skills
of the interviewer, success in focus group interviewing
relies more on the group dynamics of the members, the
willingness of members to engage in an interactive dia-
logue, and the moderator’s abilities to keep the discus-
sion on track.
In-depth interviewing and focus groups are both
guided by similar research objectives: (1) to provide
data for defining and redefining marketing problem situ-
ations; (2) to provide data for better understanding the
results from previously completed quantitative survey
studies; (3) to reveal and understand consumers’ hid-
den or unconscious needs, wants, attitudes, feelings,
behaviors, perceptions, and motives regarding services,
products, or practices; (4) to generate new ideas about
products, services, or delivery methods; and (5) to dis-
cover new constructs and measurement methods.
Define focus groups and explain how to conduct
them.
A face-to-face focus group is a small group of people
(8–12) brought together for an interactive, spontaneous
discussion. Focus groups can also be conducted online.
The three phases of a focus group study are planning the
study, conducting the actual focus group discussions, and
analyzing and reporting the results. In the planning of a
focus group, critical decisions have to be made regard-
ing whether to conduct face-to-face or online focus
groups, who should participate, how to select and recruit
the appropriate participants, what size the group should
be, what incentives to offer to encourage and reinforce
participants’ willingness and commitment to participate,
and where the group sessions should be held.
Discuss purposed communities and private
communities.
Purposed communities are online social networks that
may be specific to marketing research, or they may be
broader brand communities whose primary purpose is
www.MyEbookNiche.eCrater.com
Chapter 4 Exploratory and Observational Research Designs 103
marketing but are also used to provide research insights.
Private communities are purposed communities whose
primary purpose is research. Consumers and custom-
ers are recruited for the purpose of answering questions
and interacting with other participants within the private
community. Participant samples are usually handpicked
to be representative of the relevant target market, or they
are devoted fans of the brand. Private communities may
be short or long term, and may involve small or large
numbers of participants, from 25 in small groups up to
2,000 for larger groups.
Discuss other qualitative data collection methods
such as ethnography, case studies, projective tech-
niques, and the ZMET.
There are several useful qualitative data collection meth-
ods other than IDIs and focus groups. These methods
include ethnography and case studies, which both involve
extended contact with research settings. Researchers
may also use projective techniques such as word asso-
ciation tests, sentence completion tests, and the ZMET,
which use indirect techniques to access consumers’ feel-
ings, emotions, and unconscious motivations. These
techniques are less frequently used than are focus groups
but are considered useful approaches for understanding
more emotional and less rational motivations.
Discuss observation methods and explain how they
are used to collect primary data.
Observation methods can be used by researchers in
all types of research designs (exploratory, descrip-
tive, causal). The major benefits of observation are the
accuracy of collecting data on actual behavior, reduction
of confounding factors such as interviewer or respon-
dent biases, and the amount of detailed behavioral data
that can be recorded. The unique characteristics that
underline observation data collection methods are their
(1) directness, (2) subject’s awareness, (3) structure, and
(4) observing mechanism. The unique limitations of
observation methods are lack of generalizability of the
data, inability to explain current behaviors or events, and
the complexity of observing the behavior.
Discuss the growing field of social media monitoring.
Social media monitoring is research based on analyz-
ing conversations in social media, for example, Face-
book, Twitter, blogs, and product review sites. The
monitoring provides marketing researchers with a rich
source of existing, authentic information and organic
conversations in social networks online. The data from
these conversations may be analyzed qualitatively and
quantitatively. One strength of social media monitor-
ing is that researchers can observe people interact-
ing with each other unprompted by the potential bias
of interviewers and questions. Another advantage of
social media monitoring is individuals who may not
fill out surveys or agree to focus groups might nev-
ertheless share their experiences with online social
networks. Weaknesses include expense, accuracy of
automatic categorization, and the non-representativeness
of online posts. However, expenses are forecasted to
fall, while the accuracy and depth of categorization
tools is expected to increase over time.
Key Terms and Concepts
Bulletin board 84
Case study 91
Content analysis 89
Debriefing analysis 89
Ethnography 91
Focus group moderator 87
Focus group research 82
Groupthink 89
In-depth interview 81
Listening platform/post 98
Moderator’s guide 87
Netnography 99
Observation research 94
Participant observation 91
Private communities 89
Projective techniques 92
Purposed communities 89
Purposive sampling 86
Qualitative research 79
Quantitative research 77
www.MyEbookNiche.eCrater.com

104 Part 2 Designing the Marketing Research Project
Scanner-based panel 95
Sentence completion test 93
Sentiment analysis/opinion mining 98
Social media monitoring 97
Stratified purposive sampling 86
Technology-mediated observation 94
Theoretical sampling 86
Word association test 92
Zaltman Metaphor Elicitation Technique
(ZMET) 93
Review Questions
1. What are the major differences between quantitative
and qualitative research methods? What skills must a
researcher have to develop and implement each type
of design?
2. Compare and contrast the unique characteristics,
main research objectives, and advantages/disadvan-
tages of the in-depth and focus group interviewing
techniques.
3. Explain the pros and cons of using qualitative
research in each of the following situations:
a. Adding carbonation to Gatorade and selling it as a
true soft drink.
b. Finding new consumption usages for Arm &
Hammer baking soda.
c. Inducing customers who have stopped shopping at
Sears to return to Sears.
d. Advising a travel agency that wants to enter the
cruise ship vacation market.
4. What are the characteristics of a good focus group mod-
erator? What is the purpose of a moderator’s guide?
5. Why is it important to have 8 to 12 participants in a
focus group? What difficulties might exist in meeting
that objective?
6. Why are the screening activities so important in the
selection of focus group participants? Develop a
screening form that would allow you to select partici-
pants for a focus group on the benefits and costs of
leasing new automobiles.
7. What are the advantages and disadvantages of online
focus group interviews compared to face-to-face
group interviews?
8. What are the advantages and disadvantages of ethnog-
raphy as compared to other qualitative techniques?
9. Develop a word association test that will provide
some insight to the following information research
question: What are college students’ perceptions of
their university’s student union?
Discussion Questions
1. What type of exploratory research design (obser-
vation, projective technique, in-depth interview,
focus group, case study, ethnography, netnography,
ZMET) would you suggest for each of the following
situations and why?
a. A jewelry retailer wants to better understand why
men buy jewelry for women and how they select
what they buy.
b. An owner of a McDonald’s restaurant is planning
to build a playland and wants to know which play
equipment is most interesting to children.
c. Victoria’s Secret wants to better understand
women’s body images.
d. The senior design engineer for the Ford Motor
Company wishes to identify meaningful design
changes to be integrated into the 2018 Ford Taurus.
e. Apple wants to better understand how teen-
agers discover and choose popular music to
download.
f. Nike wants to better understand the concepts of
customization and personalization to support the
online product customization services provided
by NikeID.
2. Develop a moderator’s guide that could be used in
a focus group interview to investigate the following
question: What does “cool” mean to teens and how
do teens decide what products are “cool”?
3. Apple hires you to study Apple’s brand image with
college students on your campus. Draft a list of
10 questions you would ask in a focus group. Make
sure you think of alternative ways to ask questions
instead of simply asking direct questions.
www.MyEbookNiche.eCrater.com
Chapter 4 Exploratory and Observational Research Designs 105
4. Thinking about how most participants are recruited
for focus groups, identify and discuss three ethi-
cal issues the researcher and decision maker must
consider when using a focus group research design
to collect primary data and information.
5. Conduct an in-depth interview and write a brief
summary report that would allow you to address the
following decision question: What do students want
from their educations?
6. Outback Steak, Inc., is concerned about the shift-
ing attitudes and feelings of the public toward the
consumption of red meat. Chris Sullivan, CEO and
cofounder of Outback Steak, Inc., thinks that the
“red meat” issues are not that important because
his restaurants also serve fish and chicken entrées.
Select any two “projective interviewing” techniques
that you think would be appropriate in collect-
ing data for the above situation. First, defend your
choice of each of your selected projective interview-
ing techniques. Second, describe in detail how each
of your two chosen techniques would be applied to
Sullivan’s research problem at hand.
7. EXPERIENCE MARKETING RESEARCH.
Visit QualVu.com and locate information about
their video diary technique (a video is located and
other information can be found on the site). Is
this technique superior to text-based online focus
groups? Why or why not? How does the online
diary compare to face-to-face focus groups?
8. EXPERIENCE MARKETING RESEARCH. Visit
Context Research Group at www.contextresearch
.com. Review one of the studies they have online.
Could the research topic be addressed with surveys
or focus groups? What insights, if any, do you think
the researchers gained because they used ethnogra-
phy rather than surveys or focus groups?
9. EXPERIENCE MARKETING RESEARCH.
Visit Trackur.com (www.trackur.com) and read
about the services Trackur offers. Some analysts
have referred to the practice of mining social media
as being similar to conducting a focus group. Is min-
ing media similar to conducting a focus group? Why
or why not?
10. Visit Communispace at Communispace.com. Read
their information about what they do and some of
the news or case histories at their site. After review-
ing the website, evaluate whether and to what extent
private communities might replace focus groups.
www.MyEbookNiche.eCrater.com

Descriptive and Causal Research Designs
C h a p t e r 5
www.MyEbookNiche.eCrater.com

Learning Objectives After reading this chapter, you will be able to:
1. Explain the purpose and advantages of survey research designs.
2. Describe the types of survey methods.
3. Discuss the factors influencing the choice of survey methods.
4. Explain experiments and the types of variables used in causal designs.
5. Define test marketing and evaluate its usefulness in marketing research.
Magnum Hotel’s Loyalty Program
Magnum Hotel’s management team recently implemented a new loyalty program
designed to attract and retain customers traveling on business. The central feature
was a VIP hotel loyalty program for business travel customers offering privileges
to members not available to other hotel patrons. The program was similar to the
airline industry’s “frequent flier” programs. To become a member of the preferred
guest program, a business traveler had to complete an application using a dedicated
link on the hotel’s website. There was no cost to join and no annual fee to mem-
bers. But benefits increased as members stayed at the hotels more often. Magnum
Hotel’s database records for the program indicated the initial costs associated with
the program were approximately $55,000 and annual operating costs were about
$85,000. At the end of the program’s third year, there were 17,000 members.
At a recent management team meeting, the CEO asked the following ques-
tions concerning the loyalty program: “Is the loyalty program working?” “Does it
give us a competitive advantage?” “Has the program increased the hotel’s market
share of business travelers?” “Is the company making money from the program?”
“Is the program helping to create loyalty among our business customers?” Sur-
prised by this line of questions, the corporate VP of marketing replied by saying
those were great questions but he had no answers at that time. After having his
assistants examine corporate records, the marketing VP realized all he had was a
current membership listing and the total program costs to date of about $310,000.
Information had not been collected on the attitudes and behaviors of program
members, and his best estimate of revenue benefits was about $85,000 a year.
The VP then contacted Alex Smith, senior project director at Marketing
Resource Group (MRG). After a meeting they identified two major problems:
1. Magnum Hotel needed information to determine whether or not the com-
pany should continue the loyalty program.
2. Attitudinal, behavioral, motivational, and demographic information was needed
to design promotional strategies to attract new members, retain current members,
and increase the frequency of members staying at Magnum Hotel properties.
www.MyEbookNiche.eCrater.com

Before undertaking a survey, they decided to conduct qualitative exploratory research
using in-depth interviews with the General Managers of several Magnum Hotel properties
and focus group sessions with loyalty program members. This additional information was
used to develop the following research questions:
∙ What are the usage patterns among Magnum Hotel Preferred Guest loyalty program
members?
∙ What is business travelers’ awareness of the loyalty program?
∙ How important is the loyalty program as a factor in selecting a hotel for business
purposes?
∙ Which features of the loyalty program are most valued? Which are least valued?
∙ Should Magnum Hotel charge an annual fee for membership in the loyalty program?
∙ What are the differences between heavy users, moderate users, light users, and
nonusers of the loyalty program?
Can qualitative research adequately answer these questions, or is quantitative research
needed?
108 Part 2 Designing the Marketing Research Project
Value of Descriptive and Causal Survey Research Designs
Some research problems require primary data that can be gathered only by obtaining infor-
mation from a large number of respondents considered to be representative of the tar-
get population. Chapter 4 covered qualitative methods that are based on smaller samples.
This chapter discusses quantitative methods of collecting primary data generally involving
much larger samples, including survey designs used in descriptive and causal research.
We begin this chapter by discussing the relationship between descriptive research
designs and survey methods. We then provide an overview of the main objectives of survey
research methods. The next section examines the various types of survey methods and the
factors influencing survey method selection. The remainder of the chapter reviews causal
research designs, including experiments and test marketing.
Descriptive Research Designs and Surveys
We begin with an explanation of the relationships among descriptive research designs,
quantitative research, and survey methods. Selection of a descriptive research design is
based on three factors: (1) the nature of the initial problem or opportunity; (2) the research
questions; and (3) the research objectives. When the research problem/opportunity is either
to describe characteristics of existing market situations or to evaluate current marketing
mix strategies, then a descriptive research design is the appropriate choice. If research
questions include issues such as who, what, where, when, and how for target populations
or marketing strategies, then a descriptive research design also is most appropriate. Finally,
if the task is to identify relationships between variables or determine whether differences
exist between groups, then descriptive research designs are generally best.
www.MyEbookNiche.eCrater.com

Chapter 5 Descriptive and Causal Research Designs 109
Two general approaches are used to collect data for descriptive research: asking ques-
tions and observation. Descriptive designs frequently use data collection methods that
involve asking respondents structured questions about what they think, feel, and do. Thus,
descriptive research designs often result in the use of survey research methods to collect
quantitative data from large groups of people through the question/answer process. But
with the emergence of scanner data and tracking of digital media behavior, observation is
being used more often in descriptive designs.
The term “descriptive” is sometimes used to describe qualitative research, but the meaning
is different than when the word is used to describe quantitative research. Qualitative research
is descriptive in the sense that it often results in vivid and detailed textual descriptions of con-
sumers, consumption contexts, and culture. Quantitative studies are descriptive in the sense
that they use numbers and statistics to summarize demographics, attitudes, and behaviors.
Survey research methods are a mainstay of quantitative marketing research and are
most often associated with descriptive and causal research designs. The main goal of quan-
titative survey research methods is to provide facts and estimates from a large, represen-
tative sample of respondents. The advantages and disadvantages of quantitative survey
research designs are summarized in Exhibit 5.1.
Types of Errors in Surveys
Errors can reduce the accuracy and quality of data collected by researchers. Survey
research errors can be classified as being either sampling or nonsampling errors.
Sampling ErrorsAny survey research design that involves collecting data from a sample will have some
error. Sampling error is the difference between the findings based on the sample and the
true values for a population. Sampling error is caused by the method of sampling used and
the size of the sample. It can be reduced by increasing sample size and using the appropri-
ate sampling method. We learn more about sampling error in Chapter 6.
Survey research methods
Research procedures for
collecting large amounts of
data using question-and-
answer formats.
Exhibit 5.1 Advantages and Disadvantages of Quantitative Survey Research Designs
Advantages of Survey Methods
Can accommodate large sample sizes so that results can be generalized to the target
population
Produce precise enough estimates to identify even small differences
Easy to administer and record answers to structured questions
Facilitate advanced statistical analysis
Concepts and relationships not directly measurable can be studied
Disadvantages of Survey Methods
Questions that accurately measure respondent attitudes and behavior can be challenging
to develop
In-depth data difficult to obtain
Low response rates can be a problem
www.MyEbookNiche.eCrater.com

110 Part 2 Designing the Marketing Research Project
Nonsampling ErrorsErrors that occur in survey research design not related to sampling are called nonsampling
errors. Most types of nonsampling errors are from four major sources: respondent error,
measurement/questionnaire design errors, incorrect problem definition, and project adminis-
tration errors. We discuss respondent errors here and the other types of errors in later chapters.
Nonsampling errors have several characteristics. First, they tend to create “systematic
variation” or bias in the data. Second, nonsampling errors are controllable. They are the
result of some human mishap in either design or survey execution. Third, unlike random
sampling error that can be statistically measured, nonsampling errors cannot be directly
measured. Finally, one nonsampling error can create other nonsampling errors. That is, one
type of error, such as a poorly worded question, causes respondent mistakes. Thus, non-
sampling errors reduce the quality of the data being collected and the information being
provided to the decision maker.
Respondent Errors This type of error occurs when respondents either cannot be reached,
are unwilling to participate, or intentionally or unintentionally respond to questions in ways
that do not reflect their true answers. Respondent errors can be divided into non response
error and response error.
Nonresponse error is a systematic bias that occurs when the final sample differs from
the planned sample. Nonresponse error occurs when a sufficient number of the preselected
prospective respondents in the sample refuse to participate or cannot be reached. Non-
response is caused by many factors. Some people do not trust the research sponsor or have
little commitment about responding,1 while others resent what is perceived as an invasion
of their privacy. The differences between people who do respond and those who do not can
be striking. For example, some research has shown that for mail surveys, respondents tend
to be more educated than nonrespondents and have higher scores on related variables such
as income. In addition, women are more likely than men to respond.2 Methods for improv-
ing response rates include multiple callbacks (or online contacts), follow-up mailings,
incentives, enhancing the credibility of the research sponsor, indicating the length of time
required to complete online or other types of questionnaires, and shorter questionnaires.3
When researchers ask questions, respondents search their memory, retrieve thoughts,
and provide them as responses. Sometimes respondents give the correct answer, but other
times they give what they believe is the socially desirable response—whatever makes them
look more favorable—or they may simply guess. Respondents may forget when reporting
their past behavior, so human memory is also a source of response errors. When respon-
dents have impaired memory or do not respond accurately, this is termed response error
or faulty recall. Memory is subject to selective perception (noticing and remembering what
we want to) and time compression (remembering events as being more recent than they
actually were). Respondents sometimes use averaging to overcome memory retrieval prob-
lems, for example, telling the interviewer what is typically eaten for dinner on Sunday,
rather than what was actually consumed on the previous Sunday.
Types of Survey Methods
Improvements in information technology and telecommunications have created new survey
approaches. Nevertheless, survey methods can be classified as person-administered, self-
administered, or telephone-administered. Exhibit 5.2 provides an overview of the major
types of survey methods.
Respondent errors Consist
of both nonresponse error
and response error.
Nonresponse error A
systematic bias that occurs
when the final sample
differs from the planned
sample.
Response error When
respondents have impaired
memory or do not respond
accurately.
www.MyEbookNiche.eCrater.com

Chapter 5 Descriptive and Causal Research Designs 111
Person-Administered SurveysPerson-administered survey methods have a trained interviewer that asks questions and
records the subject’s answers. Exhibit 5.3 highlights some of the advantages and disadvan-
tages associated with person-administered surveys.
In-Home Interviews An in-home interview is a face-to-face structured question-and-
answer exchange conducted in the respondent’s home. Interviews are also occasionally
conducted in office environments. This method has several advantages. The interviewer
can explain confusing or complex questions, and use visual aids. Respondents can try new
products or watch potential ad campaigns and evaluate them. In addition, respondents are
in a comfortable, familiar environment thus increasing the likelihood of respondents’ will-
ingness to answer the survey’s questions.
In-home interviewing may be completed through door-to-door canvassing of geo-
graphic areas. This canvassing process is one of the disadvantages of in-home interview-
ing. Interviewers who are not well supervised may skip homes they find threatening or even
fabricate interviews. In-home and in-office interviews are expensive and time consuming.
Person-administered
surveys Data collection
techniques that require
the presence of a trained
human interviewer who
asks questions and records
the subject’s answers.
In-home interview A
structured question-
and-answer exchange
conducted in the
respondent’s home.
Exhibit 5.2 Major Types of Survey Research Methods
Type of Survey Research Description
Person-Administered
In-home interview An interview takes place in the respondent’s home or,
in special situations, within the respondent’s work
environment (in-office).
Mall-intercept Interview Shopping patrons are stopped and asked for feedback
during their visit to a shopping mall.
Telephone-Administered
Traditional telephone interview An interview takes place over the telephone. Interviews
may be conducted from a central telephone location or
the interviewer’s home.
Computer-assisted telephone A computer is used to assist in a telephone interview.
interview (CATI)
Wireless phone surveys Wireless phones are used to collect data. The surveys
may be text-based or web-based.
Self-Administered
Mail survey Questionnaires are distributed to and returned from
respondents via the postal service or overnight delivery.
Online surveys The Internet is used to ask questions and record
responses from respondents.
Mail panel survey Surveys are mailed to a representative sample of
individuals who have agreed in advance to participate.
Drop-off survey Questionnaires are left with the respondent to be
completed at a later time. The surveys may be picked
up by the researcher or returned via mail.
www.MyEbookNiche.eCrater.com
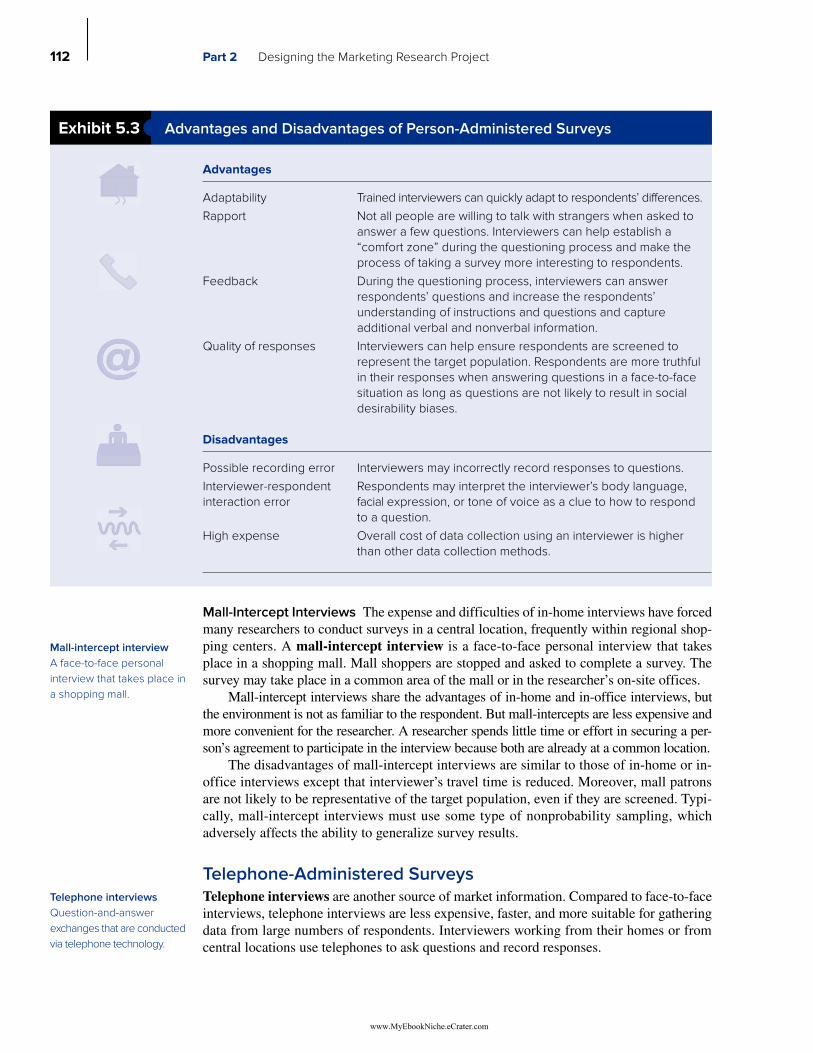
112 Part 2 Designing the Marketing Research Project
Mall-Intercept Interviews The expense and difficulties of in-home interviews have forced
many researchers to conduct surveys in a central location, frequently within regional shop-
ping centers. A mall-intercept interview is a face-to-face personal interview that takes
place in a shopping mall. Mall shoppers are stopped and asked to complete a survey. The
survey may take place in a common area of the mall or in the researcher’s on-site offices.
Mall-intercept interviews share the advantages of in-home and in-office interviews, but
the environment is not as familiar to the respondent. But mall-intercepts are less expensive and
more convenient for the researcher. A researcher spends little time or effort in securing a per-
son’s agreement to participate in the interview because both are already at a common location.
The disadvantages of mall-intercept interviews are similar to those of in-home or in-
office interviews except that interviewer’s travel time is reduced. Moreover, mall patrons
are not likely to be representative of the target population, even if they are screened. Typi-
cally, mall-intercept interviews must use some type of nonprobability sampling, which
adversely affects the ability to generalize survey results.
Telephone-Administered SurveysTelephone interviews are another source of market information. Compared to face-to-face
interviews, telephone interviews are less expensive, faster, and more suitable for gathering
data from large numbers of respondents. Interviewers working from their homes or from
central locations use telephones to ask questions and record responses.
Mall-intercept interview
A face-to-face personal
interview that takes place in
a shopping mall.
Telephone interviews
Question-and-answer
exchanges that are conducted
via telephone technology.
Exhibit 5.3 Advantages and Disadvantages of Person-Administered Surveys
Advantages
Adaptability Trained interviewers can quickly adapt to respondents’ differences.
Rapport Not all people are willing to talk with strangers when asked to
answer a few questions. Interviewers can help establish a
“comfort zone” during the questioning process and make the
process of taking a survey more interesting to respondents.
Feedback During the questioning process, interviewers can answer
respondents’ questions and increase the respondents’
understanding of instructions and questions and capture
additional verbal and nonverbal information.
Quality of responses Interviewers can help ensure respondents are screened to
represent the target population. Respondents are more truthful
in their responses when answering questions in a face-to-face
situation as long as questions are not likely to result in social
desirability biases.
Disadvantages
Possible recording error Interviewers may incorrectly record responses to questions.
Interviewer-respondent Respondents may interpret the interviewer’s body language,
interaction error facial expression, or tone of voice as a clue to how to respond
to a question.
High expense Overall cost of data collection using an interviewer is higher
than other data collection methods.
www.MyEbookNiche.eCrater.com

Chapter 5 Descriptive and Causal Research Designs 113
Telephone survey methods have a number of advantages over face-to-face survey methods.
One advantage is that interviewers can be closely supervised if they work out of a central loca-
tion. Supervisors can record calls and review them later, and they can listen in on calls. Review-
ing or listening to interviewers ensures quality control and can identify training needs.
Although there is the added cost of the telephone call, they are still less expensive than
face-to-face interviews. Telephone interviews facilitate interviews with respondents across
a wide geographic area, and data can be collected relatively quickly. Another advantage
of telephone surveys is that they enable interviewers to call back respondents who did not
answer the telephone or who found it inconvenient to grant interviews when first called.
Using the telephone at a time convenient to the respondent facilitates collection of infor-
mation from many individuals who would be almost impossible to interview personally. A
last advantage is that random digit dialing can be used to select a random sample.
The telephone method also has several drawbacks. One disadvantage is that pictures
or other nonaudio stimuli cannot be presented over the telephone. Recently some research
firms overcame this disadvantage by using the Internet to show visual stimuli during tele-
phone interviewing. A second disadvantage is that some questions become more complex
when administered over the telephone. For example, imagine a respondent trying to rank
eight to ten products over the telephone, a task that is much less difficult in a mail survey.
Third, telephone surveys tend to be shorter than personal interviews because some respon-
dents hang up when a telephone interview becomes too lengthy. Telephone surveys also
are limited, at least in practice, by national borders; the telephone is seldom used in inter-
national research. Finally, many people are unwilling to participate in telephone surveys so
refusal rates are high and have increased substantially in recent years.
Many people are annoyed by telephone research because it interrupts their privacy,
their dinner, or their relaxation time. Moreover, the increased use of telemarketing and the
illegal and unethical act of “sugging,” or selling under the guise of research, has contrib-
uted to a poor perception of telephone interviewing among the public.
Computer-Assisted Telephone Interviews (CATI) Most research firms have computer-
ized the central location telephone interviewing process. With faster, more powerful comput-
ers and affordable software, even very small research firms can use computer-assisted
telephone interviewing (CATI) systems. Interviewers are equipped with a hands-free headset
and seated in front of a keyboard, touch-screen computer terminal, or personal computer.
Most computer-assisted telephone interview systems have one question per screen.
The interviewer reads each question and records the respondent’s answer. The program
automatically skips questions that are not relevant to a particular respondent. CATI systems
overcome most of the problems associated with manual systems of callbacks, complex
quota samples, skip logic, rotations, and randomization.
Although the major advantage of CATI is lower cost per interview, there are other
advantages as well. Sometimes people need to stop in the middle of an interview but are
willing to finish at another time. Computer technology can send inbound calls to a particu-
lar interviewer who “owns” the interview and who can complete the interview at a later
time. Not only is there greater efficiency per call, there also can be cost savings.
CATI eliminates the need for separate editing and data entry tasks associated with
manual systems. The possibility for coding or data entry errors is eliminated with CATI
because it is impossible to accidentally record an improper response from outside the set of
prelisted responses established for a given question.
Results can be tabulated in real time at any point in the study. Quick preliminary
results can be beneficial in determining when certain questions can be eliminated because
enough information has been obtained or when some additional questions are needed
Computer-assisted
telephone interview
(CATI) Integrated
telephone and computer
system in which the
interviewer reads the
questions from a computer
screen and enters respon-
dents’ answers directly into
the computer program.
www.MyEbookNiche.eCrater.com

114 Part 2 Designing the Marketing Research Project
because of unexpected patterns uncovered in the earlier part of the interviewing process.
Use of CATI systems continues to grow because decision makers have embraced the cost
savings, quality control, and time-saving aspects of these systems.
Wireless Phone Surveys In a wireless phone survey, data are collected from wireless phone
users. Wireless phone surveys are growing in use due to the high percentage of wireless phone
usage, the availability of wireless phone applications (apps), and the rapid decline in landline
phone penetration. Many research firms are expanding usage of wireless phone surveys as a
result of two advantages over Internet and landline phone surveys: immediacy and portability.
Wireless phone surveys provide immediacy in the sense that consumers can fill out surveys
close to the moments of shopping, decision making, and consuming. For example, wireless
phone surveys have been used to (1) capture impulse purchases as they are made and con-
sumed, (2) collect data about side effects in real time from patients who are participating in
pharmacological testing, and (3) survey wireless customers. A company named Kinesis Survey
Research offers researchers the option of attaching a miniature bar code reader to a mobile
phone that will discretely collect and store bar codes of purchased items. Finally, wireless phone
panels may be especially appropriate for surveying teens, early adopters, and impulse buyers.4
Researchers primarily survey in either text-based or web-based formats. In short mes-
saging (text messaging) format, the respondent can access the survey and display it as text
messages on a wireless phone screen. The texting format is used for simple polling and very
short surveys. In Europe, mobile phone penetration rates are very high and text message
usage is higher than in the United States, so it is often preferred to wireless web surveys.5
In the United States, wireless web surveys are used more often than text message
surveys. As compared to text messaging, the web facilitates a continuous session, with no
time delay between questions and receipt of responses. Wireless web surveys tend to be
cheaper for both the recipient and administrator of the survey. Wireless web surveys also
permit some functionality associated with CATI and Internet surveys to be used, including
conditional branching and display of images. When CATI abilities are added to wireless
web surveys, the result is called CAMI, or computer-aided mobile interviewing.6 Mobile
surveys can be combined with pictures, audio clips, and videos taken by respondents. The
images can be collected and linked to survey responses.
Marketing researchers usually do not call wireless phone users to solicit participation
as often as they do over landlines. One reason is that Federal Communications Commission
(FCC) regulations prevent the use of autodialing. Thus, when potential respondents are called,
each one must be dialed by hand. Second, wireless phone respondents may incur a cost when
taking a survey. Third, wireless phone respondents could be anywhere when they are called,
meaning they are likely to be distracted by other activities, and may disconnect in the middle of
the call. Safety is a potential issue since the respondents could be driving when they get the call
from researchers.7 Typically, respondents are recruited using a solicitation method other than
the mobile phone, such as landlines, the Internet, mall-intercept, or in-store. Wireless panels are
created from participants who have “opted in” or agreed to participate in advance.
We have already mentioned that immediacy is an advantage of wireless web surveys.
A second advantage of wireless surveys is their ability to reach mobile phone-only house-
holds, which are increasing. For example, a recent study indicated nearly one out of every
six homes in the United States (15.8 percent) had only wireless telephones by the end of
2007, up from 6.1 percent in 2004. Moreover, in states such as New York and New Jersey,
landlines have plummeted 50 percent or more since 2000.8 Thus, one motivation for the
market research industry to use wireless phone surveys is their need to obtain represen-
tative samples.9 Wireless-only households are skewed by gender, race, income, and age.
Therefore, utilizing wireless phone surveys along with other methods enables research
firms to reach consumers they otherwise could not include in their surveys.
Wireless phone survey
Method of conducting a
marketing survey in which
the data are collected using
wireless phones.
www.MyEbookNiche.eCrater.com

Chapter 5 Descriptive and Causal Research Designs 115
Several challenges are facing the use of wireless phone surveys. Because of limited
screen space, wireless phone surveys are not suitable for research that involves long and/or
complex questions and responses. Second, even though mobile phones have some capac-
ity to handle graphics, that capacity is somewhat limited. Third, wireless panels currently
provide relatively small sample sizes. In spite of these challenges, this method of surveying
is expected to increase over the next decade.
Self-Administered SurveysA self-administered survey is a data collection technique in which the respondent reads
survey questions and records his or her own responses without the presence of a trained
interviewer. The advantages and disadvantages of self-administered surveys are shown in
Exhibit 5.4. We discuss four types of self-administered surveys: mail surveys, mail panels,
drop-off, and Internet.
Self-administered survey
A data collection technique
in which the respondent
reads the survey questions
and records his or her own
answers without the presence
of a trained interviewer.
Exhibit 5.4 Advantages and Disadvantages of Self-Administered Surveys
Advantages
Low cost per survey With no need for an interviewer or computerized
assistance device, self-administered surveys are by far
the least costly method of data acquisition.
Respondent control Respondents are in total control of how fast, when, and
where the survey is completed, thus the respondent
creates his/her own comfort zone.
No interviewer-respondent bias There is no chance of introducing interviewer bias or
interpretive error based on the interviewer’s body
language, facial expression, or tone of voice.
Anonymity in responses Respondents are more comfortable in providing honest
and insightful responses because their true identity is
not revealed.
Disadvantages
Limited flexibility The type of data collected is limited to the specific
questions initially put on the survey. It is impossible to
obtain additional in-depth data because of the lack of
probing and observation capabilities.
High nonresponse rates Most respondents will not complete and return the survey.
Potential response errors The respondent may not fully understand a survey
question and provide incorrect responses or mistakenly
skip sections of the survey. Respondents may
unconsciously commit errors while believing they are
responding accurately.
Slow data acquisition The time required to obtain the data and enter it into a
computer file for analysis can be significantly longer
than other data collection methods.
Lack of monitoring capability Not having an interviewer present can increase
misunderstanding of questions and instructions.
www.MyEbookNiche.eCrater.com

116 Part 2 Designing the Marketing Research Project
Mail Surveys Mail surveys typically are sent to respondents using the postal service. An
alternative, for example, in business-to-business surveys where sample sizes are much
smaller, is to send questionnaires out by overnight delivery. But overnight delivery is much
more expensive.
This type of survey is inexpensive to implement. There are no interviewer-related
costs such as compensation, training, travel, or search costs. The costs include postage,
printing, and the cost of the incentive. Another advantage is that mail surveys can reach
even hard-to-interview people.
One major drawback is lower response rates than with face-to-face or telephone inter-
views, which create nonresponse bias. Another problem is that of misunderstood or skipped
questions. People who simply do not understand a question may record a response the
researcher did not intend or expect. Finally, mail surveys are slow since there can be a signifi-
cant time lag between when the survey is mailed and when it is returned.
Mail Panel Surveys To overcome some of the drawbacks of mail surveys, a researcher may
choose a mail panel survey method. A mail panel survey is a questionnaire sent to a group
of individuals who have agreed to participate in advance. The panel can be tested prior to the
survey so the researcher knows the panel is representative. This prior agreement usually re-
sults in high response rates. In addition, mail panel surveys can be used for longitudinal re-
search. That is, the same people can be questioned several times over an extended period.
This enables the researcher to observe changes in panel members’ responses over time.
The major drawback to mail panels is that members are often not representative of the
target population at large. For example, individuals who agree to be on a panel may have a
special interest in the topic or may simply have a lot of time available.
Drop-Off Surveys A popular combination technique is termed the drop-off survey. In this
method, a representative of the researcher hand-delivers survey forms to respondents. Com-
pleted surveys are returned by mail or picked up by the representative. The advantages of
drop-off surveys include the availability of a person who can answer general questions,
screen potential respondents, and create interest in completing the questionnaire. The disad-
vantage of drop-offs is they are more expensive than mail surveys.
Online Survey Methods The most frequently used survey method today in marketing
research is online surveys, which collect data using the Internet (see Exhibit 5.5). Why has
the use of online surveys grown so rapidly in a relatively short time? There are several
reasons. An important advantage for online surveys is they are less expensive per respon-
dent than other survey methods. There is no cost of copying surveys or buying postage, and
no interviewer cost. Surveys are self-administered, and no coding is necessary. Thus, the
results are ready for statistical analysis almost immediately.
The ability of Internet surveys to collect data from hard-to-reach samples is another
important reason for the growth of online surveys. Some market research firms main-
tain large panels of respondents that can be used to identify specific targets, for example,
allergy sufferers, or doctors. One of the largest online panels, Harris Interactive, has a
worldwide panel that numbers in the millions. Their specialty panels include executives,
teens, and gays, lesbians, and transgender individuals. Access to hard-to-reach samples is
also possible through community, blog, or social networking sites dedicated to specific
demographic or interest groups, such as seniors, fans of The Simpsons, coffee lovers, or
Texas Instrument calculator enthusiasts, just to name a few.10
Other advantages of online surveys include the improved functional capabilities of
website technologies over pen and pencil surveys. One functional improvement is the
Mail surveys Surveys sent
to respondents using the
postal service.
Mail panel survey A
questionnaire sent to a
group of individuals who
have agreed in advance to
participate.
Drop-off survey A self-
administered questionnaire
that a representative of the
researcher hand-delivers
to selected respondents;
the completed surveys are
returned by mail or picked
up by the representative.
Online surveys Survey
data collected using the
Internet.
www.MyEbookNiche.eCrater.com

Chapter 5 Descriptive and Causal Research Designs 117
ability to randomize the order of questions within a group, so that the effects of question
order on responses are removed. Another important improvement over other types of sur-
veys is that missing data can be eliminated. Whenever respondents skip questions, they
are prompted to answer them before they can move to the next screen. Third, marketing
research firms are now learning how to use the improved graphic and animation capabili-
ties of the web. Scaling methods that previously were difficult to use are much easier in an
online format. For example, Qualtrics has a slider scale that facilitates the use of graphic
rating scales, which are superior to traditional Likert scales, and ranking questions can be
completed by respondents by clicking and dragging the items into the appropriate order.
Words that might describe the respondent’s personality, a brand, a product, or a retailer
can be animated to move from left to right, with the respondent clicking on the appropriate
words. Pictures and videos can be used, so that full color 3D pictures and videos of store
interiors, products, ads, or movie reviews can be shown in the context of online surveys.
Graphic improvements to survey design can make tasks more realistic and more engaging
for respondents although online survey designers must carefully test the graphics to ensure
they do not bias responses or add unnecessary complexity.
In addition to using online panels created by marketing research firms, companies
may survey their own customers using their existing e-mail lists to send out invitations to
participate in surveys. Small businesses can use online survey creation software, offered
by businesses like www.qualtrics.com, www.surveygizmo.com, www.Zoomerang.com
and www.Surveymonkey.com, to design an online survey and collect data relatively eas-
ily and inexpensively. Qualtrics is used by many universities and companies globally. Sur-
vey Gizmo is used by companies such as Walgreens, Skype, and ING to collect data from
customers and employees. Both companies provide extensive support documentation for
developing online surveys. Many online retailers use research contests to gather informa-
tion as well as increase customer engagement with their company. For instance, graphic
designers post pictures of possible T-shirts at www.Threadless.com. Designs that garner
the most votes are printed and offered for sale on the site.
While the benefits of online surveys include low cost per completed interview, quick
data collection, and the ability to use visual stimuli, Internet samples are rarely rep-
resentative and nonresponse bias can be high. About 70 percent of individuals in the
Exhibit 5.5 Usage of Types of Survey Methods
Method Percent
Online surveys 88
CATI (Computer-assisted telephone interviewing) 39
Face-to-face/Intercepts 32
CAPI (Computer-assisted personal interviewing) 24
Social media monitoring 33
Mobile phone surveys 44
Mail 1 1
Other 1 1
Note: Percentages represent frequency of usage of methods.
Source: Greenbook Research Industry Trends 2015 Report, pp. 11–21, www.greenbook.org, accessed March 2016.
www.MyEbookNiche.eCrater.com

118 Part 2 Designing the Marketing Research Project
United States have home access to the Internet, which limits the ability to generalize to
the general population. Propensity scoring can be used to adjust the results to look more
like those a representative sample would have produced, but the accuracy of this pro-
cedure must be evaluated. With propensity scoring, the responses of underrepresented
sample members are weighted more heavily to adjust for sampling inadequacies. For
example, if respondents who are 65 or older are only half as likely to be in an Internet
sample as their actual incidence in the population, each senior would be counted twice in
the sample. The primary disadvantage with propensity scoring is that respondents who
are demographically similar may be otherwise different.
Selecting the Appropriate Survey Method
Researchers must consider situational, task, and respondent factors when choosing a sur-
vey method. The following sections describe situational, task, and respondent characteris-
tics in more detail.
Situational CharacteristicsIn an ideal situation, researchers could focus solely on the collection of accurate data. We
live in an imperfect world, however, and researchers must cope with the competing objec-
tives of budget, time, and data quality. In choosing a survey research method, the goal is
to produce usable data in as short a time as possible at the lowest cost. But there are trade-
offs. It is easy to generate large amounts of data in a short time if quality is ignored. But
excellent data quality often can be achieved only through expensive and time-consuming
methods. In selecting the survey method, the researcher commonly considers a number of
situational characteristics in combination.
Budget The budget includes all the resources available to the researcher. While budgets
are commonly thought of in terms of dollar amount, other resources such as staff size can
also constrain research efforts. Budget determinations are frequently much more arbitrary
than researchers would prefer. However, it is rare when the budget is the sole determinant
of the survey method. Much more commonly, the budget is considered along with data
quality and time in selecting a survey method.
Completion Time Frame Long time frames give researchers the luxury of selecting the
method that will produce the highest quality data. In many situations, however, the afford-
able time frame is much shorter than desired, forcing the researcher to choose a method
that may not be ideal. Some surveys, such as direct mail or personal interviews, require
relatively long time frames. Other methods, such as Internet surveys, telephone surveys, or
mall intercepts, can be done more quickly.
Quality Requirements Data quality is a complex issue that encompasses issues of scale
measurement, questionnaire design, sample design, and data analysis. A brief overview of
three key issues will help explain the impact of data quality on the selection of survey
methods.
Completeness of Data Completeness refers to the depth and breadth of the data. Hav-
ing complete data allows the researcher to paint a total picture, fully describing
the information from each respondent. Incomplete data will lack some amount
Propensity scoring Used
to adjust survey results to
be more like those a rep-
resentative sample would
have produced.
www.MyEbookNiche.eCrater.com

Chapter 5 Descriptive and Causal Research Designs 119
of detail, resulting in a picture that is somewhat vague or unclear. Personal inter-
views and Internet surveys tend to be complete, while mail surveys may not be. In
some cases, the depth of information needed to make an informed decision will
dictate that a personal survey is the appropriate method.
Data Generalizability Data that are generalizable accurately represent the popula-
tion being studied and can be accurately projected to the target population. Data
collected from mail surveys are frequently less generalizable than those collected
from phone interviews or personal interviews due to low response rates. Small
sample size will limit the generalizability of data collected using any technique.
Generalizability often is a problem with online surveys as well.
Data Precision Precision refers to the degree of accuracy of a response in relation to
some other possible answer. For example, if an automobile manufacturer needs
to know the type of colors that will be popular for their new models, respondents
can indicate that they prefer bright colors for their new automobiles. In contrast, if
“red” and “blue” are the two most preferred colors, the automobile manufacturer
needs to know exactly that. Moreover, if “red” is preferred over “blue” by twice
as many respondents, then the degree of exactness (precision) is two-to-one. This
indicates that a more precise measure of the respondents’ preference for “red”
over “blue” is needed, even though both colors are popular with respondents. Mail
and Internet surveys can frequently deliver precise results, but might not always
produce the most generalizable results, most often because of the difficulty of
obtaining a representative sample. Telephone surveys may be generalizable but
might lack precision due to short questions and brief interview times.
Task CharacteristicsResearchers ask respondents to engage in tasks that take time and effort. Task characteris-
tics include: (1) task difficulty; (2) required stimuli; (3) amount of information asked from
respondents; and (4) sensitivity of the research topic.
Difficulty of the Task Answering some kinds of survey questions can be somewhat dif-
ficult for respondents. For example, product or brand preference testing may involve com-
paring and rating many similar products and therefore can be laborious for the respondents.
In general, more complex survey environments require more highly trained individuals to
conduct the interviews. Regardless of the difficulty of the survey task, the researcher
should try to make it as easy as possible for respondents to answer the questions.
Stimuli Needed to Elicit the Response Frequently, researchers need to expose respon-
dents to some type of stimulus in order to elicit a response. Common examples of stimuli are
products (as in taste tests) and promotional visuals (as in advertising research). An interviewer
is often needed in situations where respondents must touch or taste something. The Internet
and personal surveys can be used whenever visual stimuli are required in the research.
The actual form of the personal interview may vary. It is not always necessary to
design a one-on-one interview. For example, people may come in groups to a central loca-
tion for taste testing, or people in mall-intercepts can be shown video to obtain their opin-
ions on advertising.
Amount of Information Needed from the Respondent Generally speaking, if a large
amount of detailed information is required from respondents, the need for personal interaction
with a trained interviewer increases. As with any survey method, however, collecting more
Generalizable Projectable to
the population represented
by the sample in a study.
www.MyEbookNiche.eCrater.com

120 Part 2 Designing the Marketing Research Project
data lowers response rates and increases respondent fatigue. The survey researcher’s goal is to
achieve the best match between the survey method and the amount of information needed.
Research Topic Sensitivity In some cases, the research problem requires researchers to
ask socially or personally sensitive questions. Topic sensitivity is the degree to which a
specific survey question leads the respondent to give a socially acceptable response. When
asked about a sensitive issue, some respondents will feel they should give a socially ac-
ceptable response even if they actually feel or behave otherwise. Phone and face-to-face
interaction increases the tendency to report socially desirable attitudes and behavior. Less
desirable behaviors such as cigarette smoking are likely to be underreported during per-
sonal interviews while desirable behaviors such as recycling are likely to be overreported.
Even behaviors that are seemingly benign may be under- or overreported based on the so-
cial desirability of the behavior. For example, Quaker Oats conducted a study using both an
online and mall-intercept survey. They found that the online sample reported significantly
more daily snacking behavior. Quaker Oats concluded that the online respondents were
more honest.11 In addition, some respondents simply refuse to answer questions they con-
sider too personal or sensitive. Others may even terminate the interview.
Respondent CharacteristicsSince most marketing research projects target prespecified groups of people, the third
major factor in selecting the appropriate survey method is the respondents’ characteristics.
The extent to which members of the target group of respondents share common character-
istics influences the survey method selected.
Diversity Diversity of respondents refers to the degree to which respondents share charac-
teristics. The more diverse the respondents the fewer similarities they share. The less di-
verse the respondents the more similarities they share. For example, if the defined target
population is specified as people who have access to the Internet, then diversity is low and
an Internet survey can be an effective and cost-efficient method. However, if the defined
target population does not have convenient access to the Internet, Internet surveys will fail.
There are cases where the researcher may assume a particular personal characteristic
or behavior is shared by many people in the defined target population, when in fact very
few share that characteristic. For example, the rates of unlisted telephone numbers vary
significantly by geographic area. In some areas (e.g., small rural towns in Illinois), the rate
of unlisted numbers is very low (<10%), while in others (e.g., large cities like New York or
Los Angeles), the rate is very high (>50%).
Incidence Rate The incidence rate is the percentage of the general population that is the
focus of the research. Sometimes researchers are interested in a segment of the general
population that is relatively large and the incidence rate is high. For example, the incidence
rate of auto drivers is very high in the general population. In contrast, if the defined target
group is small in relation to the total general population, then the incidence rate is low. The
incidence rate of airplane pilots in the general population is much lower than that of car
drivers. Normally, the incidence rate is expressed as a percentage. Thus, an incidence rate
of 5 percent means that 5 out of 100 members of the general population have the qualifying
characteristics sought in a given study.
Complicating the incidence factor is the persistent problem of contacting prospective
respondents. For example, researchers may have taken great care in generating a list of pro-
spective respondents for a telephone survey, but may then discover that a significant number
Topic sensitivity The
degree to which a survey
question leads the
respondent to give a socially
acceptable response.
Incidence rate The
percentage of the general
population that is the subject
of the market research.
www.MyEbookNiche.eCrater.com

Chapter 5 Descriptive and Causal Research Designs 121
of them have moved, changed their telephone number, or simply been disconnected (with
no further information), resulting in the incidence rate being lower than initially anticipated.
When incidence rates are very low, researchers will spend considerably more time and
money in locating and gaining the cooperation of enough respondents. In low-incidence sit-
uations, personal interview surveys would be used very sparingly because it costs too much
to find that rare individual who qualifies. Here a direct mail survey may be the best choice.
In other cases, telephone surveys can be very effective as a method of screening. Individuals
who pass the telephone screen, for example, could receive a mail survey. In doing survey
research, researchers have the goal of reducing search time and costs of qualifying prospec-
tive respondents while increasing the amount of actual, usable data.
Respondent Participation Respondent participation involves three components: the respon-
dent’s ability to participate, the respondent’s willingness to participate, and the respondent’s
knowledge. Ability to participate refers to the ability of both interviewers and respondents to
get together in a question-and-answer interchange. The ability of respondents to share thoughts
with interviewers is an important selection consideration. It is frustrating to researchers to find
qualified respondents willing to respond but for some reason unable to participate in the study.
For example, personal interviews require uninterrupted time. Finding an hour to interview
busy executives can present real problems for both researchers and executives. Similarly, while
they might like to participate in a mall-intercept survey, some shoppers may be in a hurry to
pick up children from day care or school. An optometrist may have only five minutes until the
next patient. The list of distractions is endless. A method such as a mail survey, in which the
time needed to complete the questions does not need to be continuous, may be an attractive
alternative in such cases. As the above examples illustrate, the inability-to-participate problem
is very common. To get around it, most telephone surveys, for example, allow for respondents
to be called back at a more convenient time. This illustrates the general rule that marketing
researchers make every possible effort to respect respondents’ time constraints.
A second component of survey participation is prospective respondents’
willingness to participate or their inclination to share their thoughts. Some people will
respond simply because they have some interest in the subject. Others will not respond
because they are not interested, wish to preserve their privacy, are too busy or otherwise
occupied, or find the topic objectionable for some reason. Nevertheless, a self-selection
process is in effect. The type of survey method influences the self-selection process. For
example, people find it much easier to ignore a mail survey or hang up on a telephone call
than to refuse a person in a mall-intercept or personal in-home interview.
Knowledge level is the degree to which the selected respondents feel they have the
knowledge or experience to answer questions about the survey topic. Respondents’ knowl-
edge levels play a critical role in whether or not they agree to participate, and directly
impacts the quality of data collected. For example, a large manufacturer of computer soft-
ware wanted to identify the key factors small wholesalers use to decide what electronic
inventory tracking system (EITS) they would need for improving their just-in-time deliv-
ery services to retailers. The manufacturer decided to conduct a telephone survey among
a selected group of 100 small wholesalers who do not currently use any type of EITS. In
the process of trying to set up the initial interviews, the interviewers noticed that about
80 percent or the responses were “not interested.” In probing that response, they discovered
that most of the respondents felt they were not familiar enough with the details of EITS to
be able to discuss the survey issues. The more detailed the information needed, the higher
respondents’ knowledge level must be to get them to participate in the survey.
Marketing researchers have developed “best practices” to increase participation levels. One
strategy is offering some type of incentive. Incentives can include both monetary “gifts” and
Ability to participate The
ability of both the
interviewer and the
respondent to get together
in a question-and-answer
interchange.
Willingness to participate
The respondent’s inclina-
tion or disposition to share
his or her thoughts.
Knowledge level Degree
to which the selected
respondents feel they
have knowledge of or
experience with the
survey’s topics.
www.MyEbookNiche.eCrater.com

122 Part 2 Designing the Marketing Research Project
nonmonetary items such as a pen, a coupon to be redeemed for a product or service, or entry
into a drawing. Another strategy is to personally deliver questionnaires to potential respondents.
In survey designs involving group situations, researchers can use social influence to increase
participation, for example, mentioning that neighbors or colleagues have already participated.
But incentive strategies should not be promoted as “rewards” for respondent participation
because this often is the wrong motivator for people deciding to participate in surveys.
In summary, researchers try to get as much participation as possible to avoid problems
associated with nonresponse bias.
Causal Research Designs
Causal research designs differ from exploratory or descriptive research designs in several
ways. First, the primary focus of causal research is to obtain data that enables researchers
to assess “cause-effect” relationships between two or more variables. In contrast, data from
exploratory and survey research designs enables researchers to assess noncausal relation-
ships between variables. The concept of causality between several independent variables
(X) and one dependent variable (Y) in research designs specifies relationships that are
investigated in causal research studies and stated as “If X, then Y.”
Three fundamental conditions must exist in order to accurately conclude that a cause-
effect relationship exists between variables. Researchers must establish that there is temporal
order between the independent X and the dependent Y variables such that variable X (or a
change in X) must occur prior to observing or measuring variable Y (or a change in Y). Sec-
ond, researchers must establish that collected data confirm there is some type of meaning-
ful association between variable X and variable Y. Finally, researchers must account for (or
control for) all other possible variables other than X that might cause a change in variable Y.
Another difference between causal and descriptive research is that causal research
requires researchers to collect data using experimental designs. An experiment involves
carefully designed data collection procedures in which researchers manipulate a proposed
causal independent variable and observe (measure) the proposed effect on a dependent
variable, while controlling all other influencing variables. Exploratory and survey research
designs typically lack the “control” mechanism of causal designs. Typically, researchers
use either a controlled laboratory environment where the study is conducted in an artificial
setting where the effect of all, or nearly all, uncontrollable variables is minimized. In a field
environment, researchers use a natural setting similar to the context of the study in which
one or more of the independent variables are manipulated under conditions controlled as
carefully as the situation will permit. Finally, while exploratory and descriptive designs
almost always involve data collection using surveys, experimental designs collect data using
both surveys and observation. In fact, in recent years, one of the most often executed experi-
mental designs is online research that observes online activity to determine which marketing
mix variables are likely to influence website traffic patterns and ultimately purchases.
A third difference is the framing of research questions for causal designs. In exploratory
and survey research designs, initial research questions are typically framed broadly and
hypotheses focus on the magnitude and/or direction of the association, and not on causality.
To illustrate noncausal hypotheses, consider the example of a corporate merchandise VP
of Macy’s department stores who is concerned about the decreased revenues generated by
current marketing tactics. Several questions needing answers are framed as: “Should Macy’s
current marketing tactics (store, product, service, etc.) be modified to increase revenues and
market share?” “Do merchandise quality, prices, and service quality significantly impact
customer satisfaction, in-store traffic patterns, and store loyalty?” and “Should Macy’s
Causal research Studies
that enable researchers
to assess “cause-effect”
relationships between two
or more variables.
Independent variables
Variables whose values are
directly manipulated by the
researcher.
Dependent variables Mea-
sures of effects or outcomes
that occur as a result of
changes in levels of the
independent or causing
variable(s).
Experiment An empirical
investigation that tests for
hypothesized relation-
ships between dependent
variables and manipulated
independent variables.
www.MyEbookNiche.eCrater.com

Chapter 5 Descriptive and Causal Research Designs 123
expand its marketing efforts to include a mobile commerce option?” While these questions
suggest examining associations (or broad relationships) between the specified variables,
none of the questions focus on determining the causality of relationships. Consequently,
researchers would use exploratory or descriptive survey research designs.
In contrast, questions examining causal relationships between variables are framed
with the focus being on the specific impact (or influence) one variable causes on another
variable. To illustrate, Macy’s VP of merchandise might ask the following types of ques-
tions: “Will exchanging customer service policy A (e.g., merchandise returns) with
customer service policy B lead to a significant increase in store loyalty among current
customers?” “Can the profitability of the casual women’s clothing line be improved by
increasing prices by 18 percent?” “Will decreasing the current number of brands of shoes
from eight to four significantly lower the sales in the shoe department?” and “Will offering
storewide sales of ‘buy one get a second one for half price’ versus a ‘20 percent discount’
lead to a marked increase in store traffic patterns?” Accurate answers to these questions
can be obtained only through some type of controlled causal research design.
The Nature of ExperimentationExploratory and descriptive research designs are useful for many types of studies. But
they do not verify causal links between marketing variables. In contrast, experiments are
causal research designs and can explain cause-and-effect relationships between variables/
constructs and determine why events occur.
Marketing research often involves measurement of variables. Recall that a variable is an
observable, measurable element, such as a characteristic of a product or service or an attitude
or behavior. In marketing, variables include demographics such as age, gender and income,
attitudes such as brand loyalty and customer satisfaction, outcomes such as sales and profits,
and behaviors such as media consumption, website traffic, purchase, and product usage.
When conducting an experiment, researchers attempt to identify the relationships
between variables of interest. Let’s consider, for example, the following research question:
“How long does it take a customer to receive an order from the drive-through at a Wendy’s
fast-food restaurant?” The time it takes to receive a food order is a variable that can be mea-
sured quantitatively. That is, the different values of the order time variable are determined by
some method of measurement. But how long it takes a particular customer to receive a food
order is complicated by a number of other variables. For instance, what if there were ten cars
waiting in line, or it was 12:00 noon, or it was raining? Other factors such as the number of
drive-up windows, the training level of order takers, and the number of customers waiting also
are variables. Consequently, all of these variables can have an effect on the order time variable.
Other variables include the make of the car the person is driving, the number of
brothers or sisters they have, and the quantity of food ordered. The first two variables are
unlikely to have an effect on order time. But there is likely to be a relationship between the
quantity of items in the order and waiting time. If it is true that the quantity of food ordered
increases customer wait time at a drive-through, the researcher can conclude that there is
a relationship between food quantity ordered and waiting time. In causal research designs
involving experiments, the focus is on determining if there is systematic change in one
variable as another variable changes.
Experimental research is primarily a hypothesis-testing method that examines hypoth-
eses about relationships between independent and dependent variables. Researchers
develop hypotheses and then design an experiment to test them. To do so, researchers
must identify the independent variables that might bring about changes in one or more
dependent variables. Experiments and other causal designs are most appropriate when the
researcher wants to find out why certain events occur, and why they happen under certain
Variable A concept or
construct that can vary or
have more than one value.
www.MyEbookNiche.eCrater.com
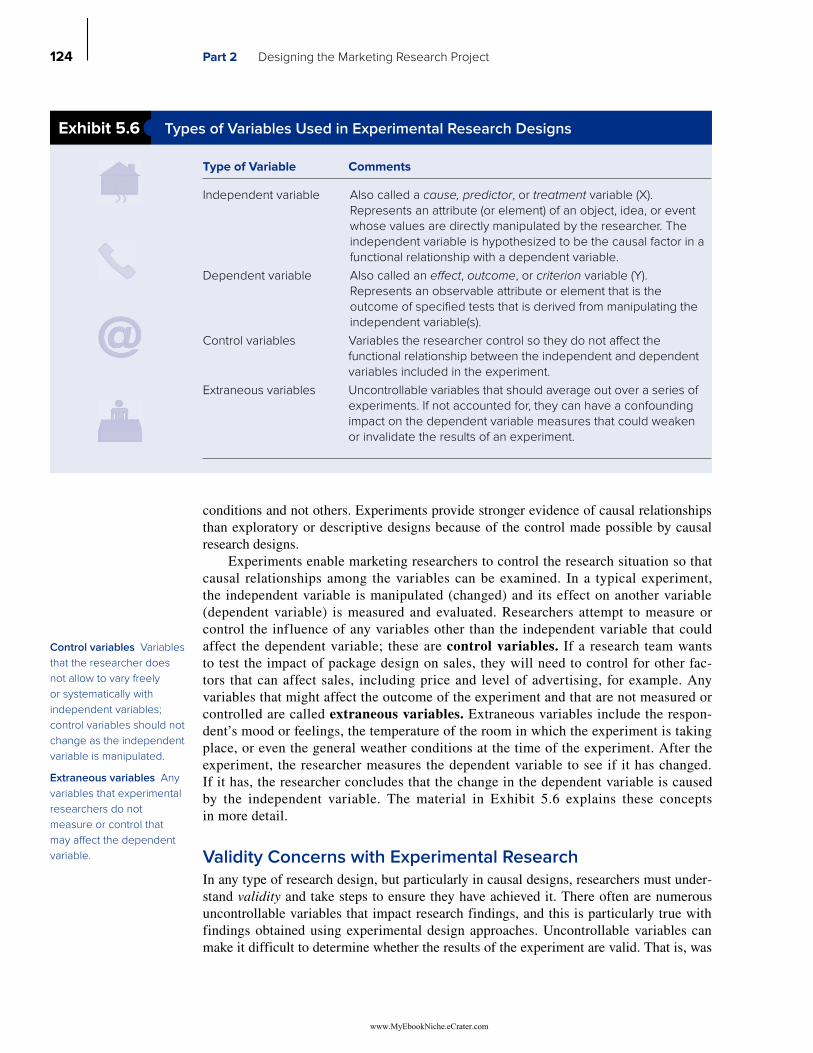
124 Part 2 Designing the Marketing Research Project
conditions and not others. Experiments provide stronger evidence of causal relationships
than exploratory or descriptive designs because of the control made possible by causal
research designs.
Experiments enable marketing researchers to control the research situation so that
causal relationships among the variables can be examined. In a typical experiment,
the independent variable is manipulated (changed) and its effect on another variable
(dependent variable) is measured and evaluated. Researchers attempt to measure or
control the influence of any variables other than the independent variable that could
affect the dependent variable; these are control variables. If a research team wants
to test the impact of package design on sales, they will need to control for other fac-
tors that can affect sales, including price and level of advertising, for example. Any
variables that might affect the outcome of the experiment and that are not measured or
controlled are called extraneous variables. Extraneous variables include the respon-
dent’s mood or feelings, the temperature of the room in which the experiment is taking
place, or even the general weather conditions at the time of the experiment. After the
experiment, the researcher measures the dependent variable to see if it has changed.
If it has, the researcher concludes that the change in the dependent variable is caused
by the independent variable. The material in Exhibit 5.6 explains these concepts
in more detail.
Validity Concerns with Experimental ResearchIn any type of research design, but particularly in causal designs, researchers must under-
stand validity and take steps to ensure they have achieved it. There often are numerous
uncontrollable variables that impact research findings, and this is particularly true with
findings obtained using experimental design approaches. Uncontrollable variables can
make it difficult to determine whether the results of the experiment are valid. That is, was
Control variables Variables
that the researcher does
not allow to vary freely
or systematically with
independent variables;
control variables should not
change as the independent
variable is manipulated.
Extraneous variables Any
variables that experimental
researchers do not
measure or control that
may affect the dependent
variable.
Exhibit 5.6 Types of Variables Used in Experimental Research Designs
Type of Variable Comments
Independent variable Also called a cause, predictor, or treatment variable (X).
Represents an attribute (or element) of an object, idea, or event
whose values are directly manipulated by the researcher. The
independent variable is hypothesized to be the causal factor in a
functional relationship with a dependent variable.
Dependent variable Also called an effect, outcome, or criterion variable (Y).
Represents an observable attribute or element that is the
outcome of specified tests that is derived from manipulating the
independent variable(s).
Control variables Variables the researcher control so they do not affect the
functional relationship between the independent and dependent
variables included in the experiment.
Extraneous variables Uncontrollable variables that should average out over a series of
experiments. If not accounted for, they can have a confounding
impact on the dependent variable measures that could weaken
or invalidate the results of an experiment.
www.MyEbookNiche.eCrater.com
Chapter 5 Descriptive and Causal Research Designs 125
the change in the dependent variable caused by the independent variable or something
else? Validity is the extent to which the conclusions drawn from a particular research
design, such as an experiment, are true. The issue of validity, particularly external validity,
becomes more important in developing experimental research designs due to controlled
environments, variable manipulation, and measurement considerations.
Internal Validity Internal validity refers to the extent to which the research design ac-
curately identifies causal relationships. In other words, internal validity exists when the
researcher can rule out competing explanations for the conclusions about the hypothesized
relationship. The following example illustrates the importance of ruling out competing
hypotheses and thus establishing internal validity. A bakery in White Water, Wisconsin,
wanted to know whether or not putting additional frosting on its cakes would cause cus-
tomers to like the cakes better. Researchers used an experiment to test the hypothesis that
customers prefer additional frosting on their cakes. However, when the amount of frosting
was increased, it also made the cakes more moist. Customers reacted favorably to this
change. But was the favorable reaction caused by the moistness of the cakes or by the ad-
ditional frosting? In this case, moistness is an extraneous variable.
External Validity External validity means the results of the experiment can be generalized
to the target population. For example, imagine that a food company wants to find out if its new
dessert would appeal to a market segment between the ages of 18 and 35. It would be too
costly to ask every 18- to 35-year-old in the United States to taste the product. But using
experimental design methods, the company can randomly select individuals in the target popu-
lation (ages 18–35) and assign them to different treatment groups, varying one component of
the dessert for each group. Respondents in each treatment group would then taste the new
dessert. If 60 percent of the respondents indicated they would purchase the product, and if in
fact 60 percent of the targeted population did purchase the new product when it was marketed,
then the results of the study would be considered externally valid. Random selection of
Validity The extent to
which the conclusions
drawn from an experiment
are true.
Internal validity The extent
to which the research
design accurately identifies
causal relationships.
External validity The
extent to which a causal
relationship found in a
study can be expected to
be true for the entire target
population.
Walk into any large retail store and you will find price
promotions being offered on big national brands. These
discounts are primarily funded by manufacturers and may
not be profitable for many retailers. While lower prices can
increase sales of national brands, they may also hurt sales
of private label store brands that earn higher margins.
One retailer decided to conduct experiments to deter-
mine how it could protect its market share on private label
store brands by promoting these brands at the same time
national brands were on sale.
Six experimental conditions were designed using
one control and five discount levels ranging from 0 to
35 percent for private label store brands. The retailer
divided its stores into six groups and the treatments were
randomized across the groups. Each store had a mixture
of the experimental conditions distributed across different
products being studied. Examples of experimental
conditions were Store A, in which private label store
brands for men’s shirts were discounted 20 percent, and
private label store brands of men’s socks were full price.
Similarly, in Store B, Men’s socks were discounted and
men’s shirts were not. The experimental designs enabled
the retailer to control for variations in sales that might
occur because the store groups were not identical.
The test revealed that matching the national brand pro-
motions with small discounts on private label store brands
generated 10 percent more profit than by not promoting
the private label store brands. The retailer now automati-
cally discounts private label store brands when national
brands are being promoted.
What major benefits can retailers learn by conducting
such experiments? Do you feel these experiments would
produce similar results for brick and mortar stores as well
as on line stores? Explain and justify your answers.
MARKETING RESEARCH DASHBOARD RETAILERS USE EXPERIMENTS TO TEST DISCOUNT STRATEGY
www.MyEbookNiche.eCrater.com

126 Part 2 Designing the Marketing Research Project
subjects and random assignment to treatment conditions are usually necessary for external
validity, but they are not necessarily sufficient to confirm that the findings can be generalized.
Examples of experimental designs used in marketing research are illustrated in Exhibit 5.7.
Comparing Laboratory and Field ExperimentsMarketing researchers use two types of experiments: (1) laboratory and (2) field.
Laboratory (lab) experiments are conducted in an artificial setting. If a researcher
recruits participants for an experiment where several different kinds of ads are shown and
asks them to come to a research facility to view and evaluate the TV ads, this would be a
laboratory experiment. The setting is different than would be natural for viewing TV ads,
which would be in the home, and is therefore considered artificial. Laboratory experiments
Laboratory (lab) experiments
Causal research designs
that are conducted in an
artificial setting.
Exhibit 5.7 Types of Experimental Research Designs in Marketing Research
Pre-experimental Designs
One-shot study A single group of test subjects is exposed to the independent variable
treatment X, and then a single measure on the dependent variable is
obtained (Y).
One-group, pretest-posttest First a pretreatment measure of the dependent variable is obtained (Y),
then the test subjects are exposed to the independent treatment X, and
then a posttreatment measure of the dependent variable is obtained (Y).
Static group comparison There are two groups of test subjects: one group is the experimental
group (EG), which is exposed to the independent treatment. The second
group is the control group (CG) and is not given the treatment. The
dependent variable is measured in both groups after the treatment.
True Experimental Designs
Pretest-posttest, control group Test subjects are randomly assigned to either the experimental or
control group, and each group receives a pretreatment measure of the
dependent measure. Then the independent treatment is exposed to
the experimental group, after which a posttreatment measure of the
dependent variable is obtained.
Posttest-only, control group Test subjects are randomly assigned to either the experimental or
control group. The experimental group is then exposed to the
independent treatment, after which a posttreatment measure of the
dependent variable is obtained.
Solomon Four Group This method combines the “pretest-posttest, control group” and
“posttest-only, control group” designs and provides both direct and
reactive effects of testing. It is not often used in marketing research
because of complexity and lengthy time requirements.
Quasi-experimental Designs
Nonequivalent control group This design is a combination of the “static group comparison” and the
“one-group, pretest-posttest” pre-experimental designs.
Field experiment This is a causal design that manipulates the independent variables in
order to measure the dependent variable in the natural setting of the
event or test.
www.MyEbookNiche.eCrater.com

Chapter 5 Descriptive and Causal Research Designs 127
enable the researcher to control the setting and therefore achieve high internal validity. But
the trade-off is that laboratory experiments lack external validity.
Field experiments are performed in natural or “real” settings. Field experiments are
often conducted in retail environments such as malls or supermarkets. These settings provide
a high level of realism. But high levels of realism mean the independent and extraneous
variables are difficult to control. Problems with control occur in several ways. For example,
conducting a field experiment of a new product in a supermarket requires the retailer’s per-
mission to put the product in the store. Given the large number of new-product introduc-
tions each year, retailers are becoming more hesitant about adding new products. Even if the
retailer cooperates, proper display and retailer support are needed to conduct the experiment.
Besides realism and control, there are at least three other issues to consider when deciding
whether to use a field experiment: (1) time frames; (2) costs; and (3) competitive reactions.
Field experiments take longer to complete than laboratory experiments. The planning stage—
which can include determining which test market cities to use and which retailers to approach
with product experiments, securing advertising time, and coordinating the distribution of
the experimental product—adds to the length of time needed to conduct field experiments.
Field experiments are more expensive to conduct than laboratory experiments because of the
high number of independent variables that must be manipulated. For example, the cost of an
advertising campaign alone can increase the cost of the experiment. Other items adding to the
cost of field experiments are coupons, product packaging development, trade promotions, and
product sampling. Because field experiments are conducted in a natural setting, competitors
can learn about the new product almost as soon as it is introduced and respond by using heavy
promotional activity to invalidate the results of the experiment or by rushing similar products
to market. If secrecy is desired, then laboratory experiments are generally more effective.
Test MarketingThe most common type of field experiment, test marketing, is a special type of experi-
mental design used to assess customer attitudes toward new product ideas, service delivery
alternatives, or marketing communication strategies. Test marketing is the use of experi-
ments to obtain information on market performance indicators. For example, marketing
mix variables (product, price, place, and promotion) are manipulated and changes in
dependent variables such as sales volume or website traffic are measured.
Test marketing, often referred to as a controlled field experiment, has three broad
applications in marketing research. First, test marketing has long been used to pilot test
new product introductions or product modifications. This approach tests a product on a
small-scale basis with realistic market conditions to determine if the product is likely to be
successful in a national launch. Second, test marketing is used to explore different options
of marketing mix elements. Different marketing plans, using different variations of market-
ing mix elements are tested and evaluated relative to the likely success of a particular prod-
uct. Third, product weaknesses or strengths, or inconsistencies in the marketing strategies
are frequently examined in test marketing. In sum, the main objectives of test marketing are
to predict sales, identify possible customer reactions, and anticipate adverse consequences
of marketing programs. Test marketing measures the sales potential of a product or service
and evaluates variables in the marketing mix.
The cost of conducting test marketing experiments can be high. But with the failure
rate of new consumer products and services estimated to be between 80 and 90 percent,
many companies believe the expense of conducting test marketing can help them avoid the
more expensive mistake of an unsuccessful product or service rollout. Read the Marketing
Research Dashboard to see how the Lee Apparel Company used test marketing procedures
to build a unique customer database to successfully launch a new brand of female jeans.
Field experiments Causal
research designs that
manipulate the independent
variables in order to measure
the dependent variable in a
natural setting.
Test marketing Using
controlled field experiments
to gain information on
specified market
performance indicators.
www.MyEbookNiche.eCrater.com

128 Part 2 Designing the Marketing Research Project
MARKETING RESEARCH DASHBOARDRiders Fits New Database into Brand Launch
The Lee Apparel Company used market test data from a field experiment to build a cus-
tomer database and help successfully launch a new brand of jeans. A few years ago, the
company decided to market a new apparel line of jeans under the name Riders. The manage-
ment team seized the opportunity to begin building a customer database. Unlike the typical
process of building a customer database around promotions, merchandising, and advertising
efforts that directly benefit retailers, their goal was to use marketing dollars to build both the
brand and the database. The initial launch of the Riders apparel line went well with rollouts
in the company’s Midwest and Northeast regional markets. The initial positioning strategy
called for the products to be priced slightly higher than competitive brands and marketed
at mass-channel retailers like Ames, Bradlee’s, Caldor, Target, and Venture. During the
first year, the communication program emphasized the line’s “comfortable fit,” and within
two years, the rollouts went national, using major retail channels like Walmart.
Initially, Riders used a spring promotion called “Easy Money” to generate product trial
and to gather name, address, and demographic information about the line’s first customers.
These data were collected using a rebate card and certificate from the retailer. Upon com-
pleting and mailing the rebate card to Riders, the customer was rewarded with a check in
the mail. This initial market test provided valuable data on each customer, such as the exact
type of product purchased, how much was spent, whom they bought for, where they heard
of the Riders brand, and their lifestyle interests. As part of the test market, Riders supported
the effort with point-of-purchase (POP) displays and promotions in Sunday newspaper cir-
culars. In addition, the management team funded the promotion and handled all develop-
ment, redemption, and fulfillment in-house. Results of the first test market were as follows:
A total of $1.5 million in certificates were distributed yielding a 2.1 percent response, or just
over 31,000 customer names. About 20 percent of the buyers bought more than one item.
Another part of the test market design was the follow-up phone survey among new
customers three months after the initial promotion. Of the customers surveyed, 62 percent
had purchased Riders products. The survey provided detailed information to salespeople
and consumers. Riders then repeated the test market design, adding a postcard mailing to
existing database names. The promotional effort netted over 40,000 new customer names
and information for the database. It also proved the responsiveness of database customers—
33.8 percent of the database customers who received the postcard promotion came into the
store to make a purchase, compared to a 2.8 percent response to the POP and circular ads.
To build a successful customer database from test market designs, the critical first step
is figuring out the most efficient way to gather the names. The second step is deciding how
you want to use the information with customers, prospects, and retailers. Finally, you begin
the process of testing and evaluating the relationships, and applying what you have learned
to build customer loyalty.
Focus on Retail PartnershipsThe main goal of the test marketing was to create valuable information that could be used
to build relationships with Riders consumers and those retail accounts Riders depended on
for distribution. The growing philosophy within the Riders brand management team was
“The more we know about our customers, the better the decisions we’ll be able to make
www.MyEbookNiche.eCrater.com

Chapter 5 Descriptive and Causal Research Designs 129
in dealing both with them and with our retailers.” Moreover, the detailed information such
as hard dollar results of each promotion as well as the demographic profiles is shared with
retailers, as is the research showing the consumer behavior benefits. For example, a track-
ing study found that purchase intent of database customers was twice that of nondatabase
customers in a given trade area. Unaided brand awareness likewise was high (100 percent,
compared to 16 percent of the general population), and awareness of Riders advertising
was 53 percent compared to 27 percent.
The Riders team believed so strongly in tying database information with promotional
efforts that they insisted a database component be part of any chain-specific promotions.
Management hoped to convince the retailers to build their own database capabilities to
share their information. For example, retail account information can identify more product
and promotion opportunities. Riders believed the real payoff comes when both manufac-
turer and retailer use data, from either source, to do a better job of attracting and keeping
the key assets for both channel members—the customer. Riders must continue convinc-
ing retailers that putting Riders merchandise on their shelves is bringing people into their
stores. From test marketing to creating complete customer databases, the Riders team has
begun to put a major part of its marketing investment into image-building advertising strat-
egies focused on print and television media.
For instance, they say, “The more we know about our customers and their prefer-
ences, the better we’ll be able to hone our advertising messages and media buys, pinpoint
what kind of promotions work best, and understand what new products we ought to be
developing. As competitive pressures continue to mount, Riders expects detailed customer
information to become more valuable in helping define the brand position clearly. Defining
ourselves and what’s different about Riders products is going to be an increasingly impor-
tant element in drawing customers who have a great many choices to stores where Riders
products are on the shelves. Although it initially began with test markets guiding the devel-
opment of a complete customer database program, it’s now the databases that are guiding
the inclusion of key elements in our test market research. Riders’ ultimate goal is creating a
tool that is going to make its products more attractive to retailers and to consumers.”
Hands-On ExerciseUsing your knowledge from reading about market tests, answer the following questions:
1. What was Lee Apparel Company’s overall goal for conducting such an extensive test
market of its new line of jeans under the brand name “Riders”? In your opinion did the
company achieve its goal? Why or why not?
2. Identify and explain the strengths and weaknesses associated with the test market
process used by the Lee Apparel Company.
3. In your opinion, should the company give consideration to the development and
implementation of Internet-based test marketing strategies? Why or why not?
www.MyEbookNiche.eCrater.com

130 Part 2 Designing the Marketing Research Project
Summary
Explain the purpose and advantages of survey re-
search designs.
The main advantages of using descriptive survey research
designs to collect primary data from respondents are
large sample sizes are possible, generalizability of results,
ability to distinguish small differences between diverse
sampled groups, ease of administering, and the ability to
identify and measure factors that are not directly measur-
able (such as customer satisfaction). In contrast, disad-
vantages of descriptive survey research designs include
the difficulty of developing accurate survey instruments,
inaccuracy in construct definition and scale measurement,
and limits to the depth of the data that can be collected.
Describe the types of survey methods.
Survey methods are generally divided into three generic
types. One is the person-administered survey, in which
there is significant face-to-face interaction between
the interviewer and the respondent. The second is the
telephone-administered survey. In these surveys, the
telephone is used to conduct the question-and-answer
exchanges. Computers are used in many ways in telephone
interviews, especially in data recording and telephone-
number selection. The third type is the self-administered
survey. In these surveys, there is little, if any, actual
face-to-face contact between the researcher and prospec-
tive respondent. The respondent reads the questions and
records his or her answers. Online surveys are the most
frequent method of data collection, with almost 60 percent
of all data collection being completed with online surveys.
Discuss the factors influencing the choice of survey
methods.
There are three major factors affecting the choice of
survey method: (1) situational characteristics; (2) task
characteristics; and (3) respondent characteristics.
With situational factors, consideration must be given
to elements such as available resources, completion
time frame, and data quality requirements. Also, the
researcher must consider the overall task requirements
and ask questions such as “How difficult are the tasks?”
“What stimuli (e.g., ads or products) will be needed to
evoke responses?” “How much information is needed
from the respondent?” and “To what extent do the
questions deal with sensitive topics?” Finally, research-
ers must consider the diversity of the prospective
respondents, their likely incidence rate, and the degree
of survey participation. Maximizing the quantity and
quality of data collected while minimizing the cost and
time of the survey generally requires the researcher to
make trade-offs.
Explain experiments and the types of variables used
in causal designs.
Experiments enable marketing researchers to control the
research situation so that causal relationships among
the variables can be examined. In a typical experiment,
the independent variable is manipulated (changed) and
its effect on another variable (dependent variable) is
measured and evaluated. During the experiment, the
researcher attempts to eliminate or control all other vari-
ables that might impact the relationship being measured.
After the manipulation, the researcher measures the
dependent variable to see if it has changed. If it has, the
researcher concludes that the change in the dependent
variable is caused by the manipulation of the indepen-
dent variable.
To conduct causal research, the researcher must
understand the four types of variables in experimental
designs (independent, dependent, extraneous, control)
as well as the key role of random selection and assign-
ment of test subjects to experimental conditions. Theory
is important in experimental design because researchers
must conceptualize as clearly as possible the roles of
the four types of variables. The most important goal of
any experiment is to determine which relationships exist
among different variables (independent, dependent).
Functional (cause-effect) relationships require care-
ful measurement of change in one variable as another
variable changes.
Define test marketing and evaluate its usefulness in
marketing research.
Test markets are a specific type of field experiment com-
monly conducted in natural field settings. Data gathered
from test markets provide both researchers and practitio-
ners with invaluable information concerning customers’
attitudes, preferences, purchasing habits/patterns, and
demographic profiles. This information can be useful in
predicting new product or service acceptance levels and
advertising and image effectiveness, as well as in evalu-
ating current marketing mix strategies.
www.MyEbookNiche.eCrater.com

Chapter 5 Descriptive and Causal Research Designs 131
Key Terms and Concepts
Ability to participate 121
Causal research 122
Computer-Assisted Telephone Interview (CATI) 113
Control variables 124
Dependent variables 122
Drop-off survey 116
Experiment 122
External validity 125
Extraneous variables 124
Field experiments 127
Generalizable 119
Incidence rate 120
Independent variables 122
In-home interview 111
Internal validity 125
Knowledge level 121
Laboratory (lab) experiments 126
Mall-intercept interview 112
Mail panel survey 116
Mail surveys 116
Nonresponse error 110
Online surveys 116
Person-administered survey 111
Propensity scoring 118
Respondent errors 110
Response error 110
Self-administered survey 115
Survey research methods 109
Telephone interviews 112
Test marketing 127
Topic sensitivity 120
Validity 125
Variable 123
Willingness to participate 121
Wireless phone survey 114
Review Questions
1. Identify and discuss the advantages and disadvan-
tages of using quantitative survey research methods
to collect primary data in marketing research.
2. What are the three factors that affect choice of ap-
propriate survey method? How do these factors dif-
fer in person-administered surveys as opposed to
self-administered surveys?
3. Explain why survey designs that include a trained
interviewer are more appropriate than computer-
assisted survey designs in situations where the
task difficulty and stimuli requirements are
extensive.
4. Explain the major differences between in-home in-
terviews and mall-intercept interviews. Make sure
you include their advantages and disadvantages.
5. How might measurement and design errors affect
respondent errors?
6. Develop three recommendations to help researchers
increase the response rates in direct mail and telephone-
administered surveys.
7. What is “nonresponse”? Identify four types of non-
response found in surveys.
8. What are the advantages and disadvantages associ-
ated with online surveys?
9. How might a faulty problem definition error affect
the implementation of a mail survey?
10. Explain the difference between internal validity and
external validity.
11. What are the advantages and disadvantages of field
experiments?
www.MyEbookNiche.eCrater.com

132 Part 2 Designing the Marketing Research Project
Discussion Questions
1. Develop a list of the factors used to select from
person-administered, telephone-administered, self-
administered, and computer-assisted survey designs.
Then discuss the appropriateness of those selection
factors across each type of survey design.
2. What impact, if any, will advances in technology have
on survey research practices? Support your thoughts.
3. EXPERIENCE MARKETING RESEARCH.
Go to the Gallup Poll site (www.gallup.com) and
locate information about the Gallup World Poll. After
reviewing the material, make a list of the challenges
in conducting polls that represent 7 billion citizens
across the world.
4. EXPERIENCE MARKETING RESEARCH. Go
to Kinesis Research (www.kinesissurvey.com) and
find and view the short wireless survey demonstra-
tion video. What are the advantages and disadvan-
tages of wireless surveys?
5. Comment on the ethics of the following situations:
a. A researcher plans to use invisible ink to code
his direct mail questionnaires to identify those
respondents who return the questionnaire.
b. A telephone interviewer calls at 10:00 p.m. on a
Sunday and asks to conduct an interview.
c. A manufacturer purchases 100,000 e-mail ad-
dresses from a national e-mail distribution house
and plans to e-mail out a short sales promotion
under the heading of “We Want to Know Your
Opinions.”
6. The store manager of a local independent grocery
store thought customers might stay in the store lon-
ger if slow, easy-to-listen-to music were played over
the store’s intercom system. After some thought, the
manager considered whether he should hire a mar-
keting researcher to design an experiment to test the
influence of music tempo on shoppers’ behaviors.
Answer the following questions:
a. How would you operationalize the independent
variable?
b. What dependent variables do you think might be
important in this experiment?
c. Develop a hypothesis for each of your dependent
variables.
www.MyEbookNiche.eCrater.com

Gathering and
Collecting
Accurate Data
P a r t 3
www.MyEbookNiche.eCrater.com

Sampling: Theory and Methods
C h a p t e r 6
www.MyEbookNiche.eCrater.com

Learning Objectives After reading this chapter, you will be able to:
1. Explain the role of sampling in the research process.
2. Distinguish between probability and nonprobability sampling.
3. Understand factors to consider when determining sample size.
4. Understand the steps in developing a sampling plan.
Mobile Web Interactions Explode
Mobile devices are taking over the wired world, and web interactions with mobile
phones are exploding. More than Almost 90% of adults are internet users and more
than 70% are smartphone users. Almost 40% of smartphone owners use messaging
apps such as iMessage, WhatsApp or Kik, more than 20% use apps that automatically
delete sent messages, such as Snapchat. Smartphone users are accessing all kinds of
content from news and information, to social networking sites and blogs, stock re-
ports and entertainment, and are making payments of services like ApplePay. News
and information (such as maps and directions) are still the most popular content in
the mobile world, with literally millions of daily users. And not only are more people
accessing the web while on the go, they’re doing so with mobile applications for
smartphones like Apple’s iPhone, Samsung, and more recently phones manufactured
in China. Research studies indicate almost 90% of marketers use or plan to use search
engine marketing, yet less than one-half of retail marketers and consumer-product/
goods marketers expect to use mobile search in their marketing mixes. Media com-
panies are most receptive, with about 80 percent planning to use mobile search in
their promotion mixes. Forrester Research studies indicate that 80 percent of market-
ers use or plan to use search engine marketing (SEM), yet less than a third of retail
marketers and one-half of consumer-product/goods marketers expect to use mobile
search in their marketing mixes. Media companies are most receptive, with about
70 percent planning to use mobile search in their promotion mixes.
While Americans are embracing the mobile web as smartphone capabili-
ties increase, most people are still not willing to give up their nice big desktop
monitors and laptops for the mobile web only. But as the mobile web becomes
more important (and secure), regular and mobile Internet access will begin to
merge. Two reasons consumers resist mobile search activities are (1) searching
on a 2-inch mobile screen is not yet a good user experience and (2) consumers
mistakenly believe a mobile search should be the same as an Internet search. The
findings of one study by UpSnap, a search firm that offers free weather, sports
scores, and subscription content, indicate that users must remember that mobile
search is not the Internet on a phone and mobile search needs to be considered as
one alternative to finding a specific, quick hit.
www.MyEbookNiche.eCrater.com

From a marketing research perspective, there are two key questions to be asked about
mobile interaction usage studies. First, What respondents should be included in a study about
consumer acceptance of mobile search? And second, How many respondents should be
included in each study? These might be difficult questions to answer for companies that do not
have good customer demographics, attitudes, and behavior databases. But specialty research
firms like Survey Sampling International (SSI) can help. SSI (www.ssisamples.com) has the
technology and skills to generate samples that target consumers and/or businesses based on
lifestyles, topics of interest, and demographics such as age, presence of children, occupation,
marital status, education level, and income. The firm is well respected for its Internet, RDD,
telephone, B2B, and mail sampling designs. As you read this chapter, you will learn the
importance of knowing which groups to sample, how many elements to sample, and the differ-
ent methods available to researchers for selecting high-quality, reliable samples.1
Value of Sampling in Marketing Research
Sampling is a concept we practice in our everyday activities. Consider, for example, going
on a job interview. Making a good first impression in a job interview is important because
based on the initial exposure (i.e., sample), people often make judgments about the type
of person we are. Similarly, people sit in front of their TV with a remote control in their
hand and rapidly flip through a number of different channels, stopping a few seconds to
take a sample of the program on each channel until they find a program worth watching.
Next time you have a free moment, go to a bookstore like Barnes and Noble and observe
sampling at its best. People at a bookstore generally pick up a book or magazine, look
at its cover, and read a few pages to get a feel for the author’s writing style and content
before deciding whether to buy the book. When people go automobile shopping, they
want to test-drive a particular car for a few miles to see how the car feels and performs
before deciding whether to buy it. One commonality in all these situations is that a deci-
sion is based on the assumption that the smaller portion, or sample, is representative of
the larger population. From a general perspective, sampling involves selecting a relatively
small number of elements from a larger defined group of elements and expecting that
the information gathered from the small group will enable accurate judgments about the
larger group.
Sampling as a Part of the Research ProcessSampling is often used when it is impossible or unreasonable to conduct a census. With
a census, primary data is collected from every member of the target population. The best
example of a census is the U.S. Census, which takes place every ten years.
It is easy to see that sampling is less time-consuming and less costly than conducting a
census. For example, American Airlines may want to find out what business travelers like
and dislike about flying with them. Gathering data from 2,000 American business travelers
would be much less expensive and time-consuming than surveying several million travel-
ers. No matter what type of research design is used to collect data, decision makers are
concerned about the time and cost required, and shorter projects are more likely to fit the
decision maker’s time frames.
Samples also play an important indirect role in designing questionnaires. Depending
on the research problem and the target population, sampling decisions influence the type
Sampling Selection of a
small number of elements
from a larger defined target
group of elements and ex-
pecting that the information
gathered from the small
group will allow judgments
to be made about the
larger group.
Census A research study
that includes data about ev-
ery member of the defined
target population.
136 Part 3 Gathering and Collecting Accurate Data
www.MyEbookNiche.eCrater.com

Chapter 6 Sampling: Theory and Methods 137
of research design, the survey instrument, and the actual questionnaire. For example, by
having a general idea of the target population and the key characteristics that will be used
to draw the sample of respondents, researchers can customize the questionnaire to ensure
that it is of interest to respondents and provides high-quality data.
The Basics of Sampling Theory
PopulationA population is an identifiable group of elements (e.g., people, products, organizations)
of interest to the researcher and pertinent to the information problem. For example, Mazda
Motor Corporation could hire J. D. Power and Associates to measure customer satisfac-
tion among automobile owners. The population of interest could be all people who own
automobiles. It is unlikely, however, that J. D. Power and Associates could draw a sample
that would be truly representative of such a broad, heterogeneous population—any data
collected would probably not be applicable to customer satisfaction with Mazda. This lack
of specificity unfortunately is common in marketing research. Most businesses that col-
lect data are not really concerned with total populations, but with a prescribed segment.
In this chapter, we use a modified definition of population: defined target population. A
defined target population consists of the complete group of elements (people or objects)
that are identified for investigation based on the objectives of the research project. A
precise definition of the target population is essential and is usually done in terms of ele-
ments, sampling units, and time frames. Sampling units are target population elements
actually available to be used during the sampling process. Exhibit 6.1 clarifies several
sampling theory terms.
Population The identifiable
set of elements of inter-
est to the researcher and
pertinent to the information
problem.
Defined target population
The complete set of
elements identified for
investigation.
Sampling units The target
population elements avail-
able for selection during
the sampling process.
Exhibit 6.1 Examples of Elements, Sampling Units, and Time Frames
Mazda Automobiles
Elements
Sampling unit
Time frame
Adult purchasers of automobiles
New Mazda automobile purchasers
January 1, 2012 to September 30, 2013
Nail Polish
Elements
Sampling units
Time frame
Females between the ages of 18 and 34 who purchased
at least one brand of nail polish during the past 30 days
U.S. cities with populations between 100,000 and 1 million
people
June 1 to June 15, 2013
Retail Banking Services
Elements
Sampling units
Time frame
Households with checking accounts
Households located within a 10-mile radius of Bank of
America’s central location in Charlotte, North Carolina
January 1 to April 30, 2013
www.MyEbookNiche.eCrater.com

138 Part 3 Gathering and Collecting Accurate Data
Sampling FrameAfter defining the target population, the researcher develops a list of all eligible sampling
units, referred to as a sampling frame. Some common sources of sampling frames are
lists of registered voters and customer lists from magazine publishers or credit card com-
panies. There also are specialized commercial companies (for instance, Survey Sampling,
Inc., American Business Lists, Inc., and Scientific Telephone Samples) that sell databases
containing names, addresses, and telephone numbers of potential population elements.
Although the costs of obtaining sampling lists will vary, a list typically can be purchased
for between $150 and $300 per 1,000 names.2
Regardless of the source, it is often difficult and expensive to obtain accurate, repre-
sentative, and current sampling frames. It is doubtful, for example, that a list of individuals
who have eaten a taco from Taco Bell in a particular city in the past six months will be
readily available. In this instance, a researcher would have to use an alternative method
such as random-digit dialing (if conducting telephone interviews) or a mall-intercept inter-
view to generate a sample of prospective respondents.
Factors Underlying Sampling TheoryTo understand sampling theory, you must know sampling-related concepts. Sampling con-
cepts and approaches are often discussed as if the researcher already knows the key popula-
tion parameters prior to conducting the research project. However, because most business
environments are complex and rapidly changing, researchers often do not know these
parameters prior to conducting research. For example, retailers that have added online shop-
ping alternatives for consumers are working to identify and describe the people who are
making their retail purchases over the Internet rather than at traditional “brick-and-mortar”
stores. Experts estimate that the world’s online population exceeds 570 million people,3
but the actual number of online retail shoppers is more difficult to estimate. One of the
major goals of researching small, yet representative, samples of members of a defined target
population is that the results of the research will help to predict or estimate what the true
population parameters are within a certain degree of confidence.
If business decision makers had complete knowledge about their defined target popu-
lations, they would have perfect information about the realities of those populations, thus
eliminating the need to conduct primary research. Better than 95 percent of today’s marketing
problems exist primarily because decision makers lack information about their problem
situations and who their customers are, as well as customers’ attitudes, preferences, and
marketplace behaviors.
Central Limit Theorem The central limit theorem (CLT) describes the theoretical char-
acteristics of a sample population. The CLT is the theoretical backbone of survey research
and is important in understanding the concepts of sampling error, statistical significance,
and sample sizes. In brief, the theorem states that for almost all defined target populations,
the sampling distribution of the mean (x) or the percentage value (p) derived from a simple
random sample will be approximately normally distributed, provided the sample size is
sufficiently large (i.e., when n is > or = 30). Moreover, the mean (x) of the random sample
with an estimated sampling error (Sx ) fluctuates around the true population mean (μ) with a stan-
dard error of σ / n and an approximately normal sampling distribution, regardless of the
shape of the probability frequency distribution of the overall target population. In other
words, there is a high probability that the mean of any sample (x) taken from the target
population will be a close approximation of the true target population mean (μ), as one
increases the size of the sample (n).
Sampling frame The list of
all eligible sampling units.
Central limit theorem (CLT)
The sampling distribution
derived from a simple
random sample will be
approximately normally
distributed.
www.MyEbookNiche.eCrater.com

Chapter 6 Sampling: Theory and Methods 139
With an understanding of the basics of the CLT, the researcher can do the following:
1. Draw representative samples from any target population.
2. Obtain sample statistics from a random sample that serve as accurate estimates of the
target population’s parameters.
3. Draw one random sample, instead of many, reducing the costs of data collection.
4. More accurately assess the reliability and validity of constructs and scale measurements.
5. Statistically analyze data and transform it into meaningful information about the target
population.
Tools Used to Assess the Quality of SamplesThere are numerous opportunities to make mistakes that result in some type of bias in any
research study. This bias can be classified as either sampling error or nonsampling error.
Random sampling errors could be detected by observing the difference between the sample
results and the results of a census conducted using identical procedures. Two difficulties
associated with detecting sampling error are (1) a census is very seldom conducted in sur-
vey research and (2) sampling error can be determined only after the sample is drawn and
data collection is completed.
Sampling error is any bias that results from mistakes in either the selection process for
prospective sampling units or in determining the sample size. Moreover, random sampling
error tends to occur because of chance variations in the selection of sampling units. Even if
the sampling units are properly selected, those units still might not be a perfect representa-
tion of the defined target population, but they generally are reliable estimates. When there
is a discrepancy between the statistic estimated from the sample and the actual value from
the population, a sampling error has occurred. Sampling error can be reduced by increas-
ing the size of the sample. In fact, doubling the size of the sample can reduce the sampling
error, but increasing the sample size primarily to reduce the standard error may not be worth
the cost.
Nonsampling error occurs regardless of whether a sample or a census is used. These
errors can occur at any stage of the research process. For example, the target population
may be inaccurately defined causing population frame error; inappropriate question/scale
measurements can result in measurement error; a questionnaire may be poorly designed
Sampling error Any type
of bias that is attributable to
mistakes in either drawing
a sample or determining
the sample size.
Nonsampling error A bias
that occurs in a research
study regardless of whether
a sample or census is used.
The business consultant has recommended a survey of
Santa Fe Grill customers. To interview the customers, the
consultant has suggested several approaches for collect-
ing the data. One is to ask customers to complete the
questionnaires at their table either before or after they
get their food. Another is to stop them on the way out of
the restaurant and ask them to complete a questionnaire.
A third option is to give the questionnaire to them and
ask that they complete it at home and mail it back, and a
fourth option is to intercept them in the mall. A fifth option
is to load software on the computer, write a program to
randomly select customers, and when they pay their bill,
give them instructions on how to go to a website and
complete the survey. The last option, however, is most
expensive because setting up the Internet survey is more
expensive than handing paper surveys to customers in
the restaurant.
The consultant has been brainstorming with other res-
taurant industry experts on how to best collect the data.
He has not yet decided which options to suggest to the
owners.
1. Which of the data collection options is best? Why?
2. Should data be collected from customers of competi-
tive restaurants? If yes, what are some possible ways
to collect data from their customers?
MARKETING RESEARCH IN ACTION CONTINUING CASE STUDY THE SANTA FE GRILL
www.MyEbookNiche.eCrater.com

140 Part 3 Gathering and Collecting Accurate Data
causing response error; or there may be other errors in gathering and recording data or
when raw data are coded and entered for analysis. In general, the more extensive a study,
the greater the potential for nonsampling errors. Unlike sampling error, there are no statis-
tical procedures to assess the impact of nonsampling errors on the quality of the data col-
lected. Yet, most researchers realize that all forms of nonsampling errors reduce the overall
quality of the data regardless of the data collection method. Nonsampling errors usually are
related to the accuracy of the data, whereas sampling errors relate to the representativeness
of the sample to the defined target population.
Probability and Nonprobability Sampling
There are two basic sampling designs: (1) probability and (2) nonprobability. Exhibit 6.2
lists the different types of both sampling methods.
In probability sampling, each sampling unit in the defined target population has a
known probability of being selected for the sample. The actual probability of selection for
each sampling unit may or may not be equal depending on the type of probability sampling
design used. Specific rules for selecting members from the population for inclusion in the
sample are determined at the beginning of a study to ensure (1) unbiased selection of the
sampling units and (2) proper sample representation of the defined target population. Prob-
ability sampling enables the researcher to judge the reliability and validity of data collected
by calculating the probability that the sample findings are different from the defined target
population. The observed difference can be partially attributed to the existence of sampling
error. The results obtained by using probability sampling designs can be generalized to the
target population within a specified margin of error.
In nonprobability sampling, the probability of selecting each sampling unit is not
known. Therefore, sampling error is not known. Selection of sampling units is based on
intuitive judgment or researcher knowledge. The degree to which the sample is representa-
tive of the defined target population depends on the sampling approach and how well the
researcher executes the selection activities.
Probability Sampling DesignsSimple Random Sampling Simple random sampling is a probability sampling proce-
dure. With this approach, every sampling unit has a known and equal chance of being se-
lected. For example, an instructor could draw a sample of ten students from among
30 students in a marketing research class. The instructor could write each student’s name
on a separate, identical piece of paper and place all of the names in a hat. Each student
Probability sampling Each
sampling unit in the defined
target population has a
known probability of being
selected for the sample.
Nonprobability sampling
Sampling designs in which
the probability of selection
of each sampling unit is
not known. The selection
of sampling units is based
on the judgment of the
researcher and may or may
not be representative of the
target population.
Simple random sampling
A probability sampling proce-
dure in which every sampling
unit has a known and equal
chance of being selected.
Exhibit 6.2 Types of Probability and Nonprobability Sampling Methods
Probability Sampling Methods Nonprobability Sampling Methods
Simple random sampling Convenience sampling
Systematic random sampling Judgment sampling
Stratified random sampling Quota sampling
Cluster sampling Snowball sampling
www.MyEbookNiche.eCrater.com

Chapter 6 Sampling: Theory and Methods 141
would have an equal, known probability of selection. Many software programs including
SPSS have an option to select a random sample.
Advantages and Disadvantages Simple random sampling has several advantages. The
technique is easily understood and the survey’s results can be generalized to the defined tar-
get population with a prespecified margin of error. Another advantage is that simple random
samples produce unbiased estimates of the population’s characteristics. This method guaran-
tees that every sampling unit has a known and equal chance of being selected, no matter the
actual size of the sample, resulting in a valid representation of the defined target population.
The primary disadvantage of simple random sampling is the difficulty of obtaining a com-
plete and accurate listing of the target population elements. Simple random sampling requires
that all sampling units be identified. For this reason, simple random sampling works best for
small populations where accurate lists are available.
Systematic Random Sampling Systematic random sampling is similar to simple ran-
dom sampling but requires that the defined target population be ordered in some way, usu-
ally in the form of a customer list, taxpayer roll, or membership roster. In research practices,
systematic random sampling has become a popular method of drawing samples. Compared
to simple random sampling, systematic random sampling is less costly because it can be
done relatively quickly. When executed properly, systematic random sampling creates a
sample of objects or prospective respondents that is very similar in quality to a sample
drawn using simple random sampling.
To use systematic random sampling, the researcher must be able to secure a com-
plete listing of the potential sampling units that make up the defined target population.
But unlike simple random sampling, there is no need give the sampling units any special
code prior to drawing the sample. Instead, sampling units are selected according to their
position using a skip interval. The skip interval is determined by dividing the number of
potential sampling units in the defined target population by the number of units desired in
the sample. The required skip interval is calculated using the following formula:
Defined target population list size
Desired sample sizeSkip interval =
For instance, if a researcher wants a sample of 100 to be drawn from a population of
1,000, the skip interval would be 10 (1,000/100). Once the skip interval is determined, the
researcher would then randomly select a starting point and take every 10th unit until he or
she had proceeded through the entire target population list. Exhibit 6.3 displays the steps
that a researcher would take in drawing a systematic random sample.
Advantages and Disadvantages Systematic sampling is frequently used because it is a
relatively easy way to draw a sample while ensuring randomness. The availability of lists
and the shorter time required to draw a sample versus simple random sampling makes sys-
tematic sampling an attractive, economical method for researchers. The greatest weakness
of systematic random sampling is the possibility of hidden patterns in the list of names that
create bias. Hidden patterns represent populations that researchers may be interested in
studying, but often are hard to reach or “hidden”. Such populations may be hidden because
they exhibit some type of social stigma (certain medical conditions), illicit or illegal behav-
iors (drug usage), or are atypical or socially marginalized (homeless). Another difficulty is
the number of sampling units in the target population must be known. When the size of the
target population is large or unknown, identifying the number of units is difficult, and esti-
mates may not be accurate.
Systematic random
sampling Similar to simple
random sampling but the
defined target population
is ordered in some way,
usually in the form of a
customer list, taxpayer roll,
or membership roster, and
selected systematically.
www.MyEbookNiche.eCrater.com

142 Part 3 Gathering and Collecting Accurate Data
Exhibit 6.3 Steps in Drawing a Systematic Random Sample
Note: The researcher must visualize the population list as being continuous or “circular”; that is, the drawing process must continue past those names
that represent the Z’s and include names representing the A’s and B’s so that the 1,200th name drawn will basically be the 25th name prior to the first
drawn name (i.e., Carol V. Clark).
Obtain a List of Potential Sampling Units That Contains an Acceptable Frame of the Target
Population Elements.
Example: Current list of students (names, addresses, telephone numbers) enrolled at your
university or college from the registrar’s oice.
Determine the Total Number of Sampling Units Making Up the List of the Defined Target
Population’s Elements and the Desired Sample Size.
Example: 30,000 current student names on the list. Desired sample size is 1,200 students, for a
confidence level of 95%, P value equal to 50%, and tolerance sampling error of ± 2.83
percentage points.
Compute the Needed Skip Interval by Dividing the Number of Potential Sampling Units on the
List by the Desired Sample Size.
Example: 30,000 current student names on the list, desired sample of 1,200, so the skip interval
would be every 25th name.
Using a Random Number-Generation System, Randomly Determine a Starting Point to
Sample the List of Names.
Examples: Select: Random number for starting page of the multiple-page listing (e.g., 8th page).
Select: Random number for name position on that starting page (e.g., Carol V. Clark).
With Carol V. Clark as the First Sample Unit, Apply the Skip Interval to Determine the
Remaining Names That Should Be Included in the Sample of 1,200.
Examples: Clark, Carol V. (Skip 25 names).
Cobert, James W. (Skip 25 names).
Damon, Victoria J. (Skip 25 names; repeat process until all 1,200 names are drawn).
Step 1
Step 2
Step 3
Step 4
Step 5
MARKETING RESEARCH DASHBOARD SELECTING A SYSTEMATIC RANDOM
SAMPLE FOR THE SANTA FE GRILL
Over the past three years, the owners of the Santa Fe
Grill have compiled a listing of 1,030 customers arranged
in alphabetical order. A systematic sample of 100 custom-
ers’ opinions is the research objective. Having decided
on a sample size of 100 to be selected from the sampling
frame of 1,030 customers, the owner calculates the size of
the interval between successive elements of the sample by
computing 1,030/100. The size of the interval is determined
by dividing the target population (sampling frame) size by the
desired sample size (1,030/100 = 10.3). In situations such as
this, where the result is a decimal instead of a round number,
you round to the nearest integer. Thus, we have effectively
partitioned the sampling frame into 100 intervals of size 10.
From the numbers in the interval of 1 to 10, we then must
randomly select a number to identify the first element for the
systematic sample. If, for example, that number is 4, then we
begin with the 4th element in the sampling frame and every
10th element thereafter is chosen. The initial starting point
is the 4th element and the remaining elements selected for
the sample are the 14th, 24th, 34th, and so on until the final
element chosen is the 1,024th. This will result in a sample of
103 customers to be interviewed in the survey.
www.MyEbookNiche.eCrater.com
Chapter 6 Sampling: Theory and Methods 143
Stratified Random Sampling Stratified random sampling involves the separation of
the target population into different groups, called strata, and the selection of samples from
each stratum. Stratified random sampling is similar to segmentation of the defined target
population into smaller, more homogeneous sets of elements.
To ensure that the sample maintains the required precision, representative samples
must be drawn from each of the smaller population groups (stratum). Drawing a stratified
random sample involves three basic steps:
1. Dividing the target population into homogeneous subgroups or strata.
2. Drawing random samples from each stratum.
3. Combining the samples from each stratum into a single sample of the target population.
As an example, if researchers are interested in the market potential for home security sys-
tems in a specific geographic area, they may wish to divide the homeowners into several
different strata. The subdivisions could be based on such factors as assessed value of the
homes, household income, population density, or location (e.g., sections designated as
high- and low-crime areas).
Two common methods are used to derive samples from the strata: proportionate and
disproportionate. In proportionately stratified sampling, the sample size from each stra-
tum is dependent on that stratum’s size relative to the defined target population. There-
fore, the larger strata are sampled more heavily because they make up a larger percentage
of the target population. In disproportionately stratified sampling, the sample size
selected from each stratum is independent of that stratum’s proportion of the total defined
target population. This approach is used when stratification of the target population pro-
duces sample sizes for subgroups that differ from their relative importance to the study.
For example, stratification of manufacturers based on number of employees will usually
result in a large segment of manufacturers with fewer than ten employees and a very small
proportion with, say, 500 or more employees. The economic importance of those firms
with 500 or more employees would dictate taking a larger sample from this stratum and
a smaller sample from the subgroup with fewer than ten employees than indicated by the
proportionality method.
An alternative type of disproportionate stratified method is optimal allocation
sampling. In this method, consideration is given to the relative size of the stratum
as well as the variability within the stratum to determine the necessary sample size
of each stratum. The basic logic underlying optimal allocation is that the greater the
homogeneity of the prospective sampling units within a particular stratum, all else
being equal, the fewer the units that would have to be selected to accurately estimate
the true population parameter (u or P) for that subgroup. In contrast, more units would
be selected for any stratum that has considerable variance among its sampling units or
that is heterogeneous.
In some situations, multisource sampling is being used when no single source can
generate a large or low incidence sample. While researchers have shied away from using
multiple sources, mainly because sampling theory dictates the use of a defined single popu-
lation, changing respondent behaviors (e.g., less frequent use of e-mail and more frequent
use of social media) are supporting multisource sampling. For example, if the manufacturer
of golfing equipment used a stratified random sample of country club members as the sam-
pling frame, the likelihood of visitors or invited guests to the country club would be hidden
from the researcher. Excluding these two groups could omit valuable data that would be
available in a multisource approach. Exhibit 6.4 displays the steps that a researcher would
take in drawing a stratified random sample.
Stratified random sampling
Separation of the target
population into different
groups, called strata, and
the selection of samples
from each stratum.
Proportionately stratified
sampling A stratified
sampling method in which
each stratum is dependent
on its size relative to the
population.
Disproportionately strati-
fied sampling A stratified
sampling method in which
the size of each stratum is
independent of its relative
size in the population.
www.MyEbookNiche.eCrater.com

144 Part 3 Gathering and Collecting Accurate Data
Advantages and Disadvantages Dividing the target population into homogeneous
strata has several advantages, including (1) the assurance of representativeness in the sam-
ple; (2) the opportunity to study each stratum and make comparisons between strata; and
(3) the ability to make estimates for the target population with the expectation of greater
precision and less error. The primary difficulty encountered with stratified sampling is
determining the basis for stratifying. Stratification is based on the target population’s
Exhibit 6.4 Steps in Drawing a Stratified Random Sample
Obtain a List of Potential Sampling Units That Contains an Acceptable Frame of the Defined
Target Population Elements.
Example: List of known performance arts patrons (names, addresses, telephone numbers) living in a three-
county area from the current database of the Asolo Performing Arts Centre. Total number of known
patrons on the current database is 10,500.
Using Some Type of Secondary Information or Past Experience with the Defined Target Population, Select
a Stratification Factor for Which the Population’s Distribution Is Skewed (Not Bell-Shaped) and Can Be
Used to Determine That the Total Defined Target Population Consists of Separate Subpopulations of
Elements.
Example: Using attendance records and county location, identify strata by county and number of events
attended per season (i.e., regular, occasional, or rare). Total: 10,500 patrons with 5,900 “regular’’
(56.2%); 3,055 “occasional” (29.1%); and 1,545 “rare” (14.7%) patrons.
Using the Selected Stratification Factor (or Some Other Surrogate Variable), Segment the Defined Target
Population into Strata Consistent with Each of the Identified Separate Subpopulations. That is, use the
stratification factor to regroup the prospective sampling units into their mutually exclusive subgroups.
Then determine both the actual number of sampling units and their percentage equivalents for each
stratum.
Example: County A: 5,000 patrons with 2,500 “regular” (50%); 1,875 “occasional” (37.5%); and 625 “rare”
(12.5%) patrons.
County B: 3,000 patrons with 1,800 “regular” (60%); 580 “occasional” (19.3%); and 620 “rare”
(20.7%) patrons.
County C: 2,500 patrons with 1,600 “regular" (64%); 600 "occasional" (24%); and 300 ”rare” (12%)
patrons.
Determine Whether There Is a Need to Apply a Disproportionate or Optimal Allocation Method to the
Stratification Process; Otherwise, Use the Proportionate Method and Then Estimate the Desired Sample
Sizes.
Example: Compare individual county strata percentage values to overall target population strata values. Let’s
assume a proportionate method and a confidence level of 95% and a tolerance for sampling error of
±2.5 percentage points. Estimate the sample size for total target population with no strata needed and
assuming P = 50%. The desired sample size would equal 1,537 people. Then proportion that size by the
total patron percentage values for each of the three counties determined in step 2 (e.g., County
A = 5,000/10,500 [47.6%]; County B = 3,000/10,500 [28.6%]; County C = 2,500/10,500 [23.8%]). New
sample sizes for each county would be: County A = 732; County B = 439; County C = 366. Now for each
county sample size, proportion the sample sizes by the respective within-county estimates for
“regular,” “occasional,” and “rare” strata percentages determined in step 3·
Select a Probability Sample from Each Stratum, Using either the SRS or SYMRS Procedure.
Example: Use the procedures discussed earlier for drawing SRS or SYMRS samples.
Step 1
Step 2
Step 3
Step 4
Step 5
www.MyEbookNiche.eCrater.com

Chapter 6 Sampling: Theory and Methods 145
characteristics of interest. Secondary information relevant to the required stratification fac-
tors might not be readily available, therefore forcing the researcher to use less desirable
criteria as the factors for stratifying the target population. Usually, the larger the number of
relevant strata, the more precise the results. Inclusion of irrelevant strata, however, will
waste time and money without providing meaningful results.
Cluster Sampling Cluster sampling is similar to stratified random sampling, but is dif-
ferent in that the sampling units are divided into mutually exclusive and collectively ex-
haustive subpopulations called clusters. Each cluster is assumed to be representative of the
heterogeneity of the target population. Examples of possible divisions for cluster sampling
include customers who patronize a store on a given day, the audience for a movie shown at
a particular time (e.g., the matinee), or the invoices processed during a specific week. Once
the cluster has been identified, the prospective sampling units are selected for the sample
by either using a simple random sampling method or canvassing all the elements (a census)
within the defined cluster.
A popular form of cluster sampling is area sampling. In area sampling, the clusters
are formed by geographic designations. Examples include metropolitan statistical areas
(MSAs), cities, subdivisions, and blocks. Any geographical unit with identifiable boundar-
ies can be used. When using area sampling, the researcher has two additional options: the
Cluster sampling A prob-
ability sampling method in
which the sampling units
are divided into mutually
exclusive and collectively
exhaustive subpopulations,
called clusters.
Area sampling A form of
cluster sampling in which
the clusters are formed by
geographic designations.
MARKETING RESEARCH DASHBOARD WHICH IS BETTER—PROPORTIONATELY
OR DISPROPORTIONATELY STRATIFIED SAMPLES?
The owners of the Santa Fe Grill have a list of 3,000 poten-
tial customers broken down by age. Using a statistical for-
mula, they have decided that a proportionately stratified
sample of 200 customers will produce information that is
sufficiently accurate for decision making. The number of
elements to be chosen from each stratum using a propor-
tionate sample based on age is shown in the fourth column
of the table. But if they believe the sample size in each
stratum should be relative to its economic importance,
and the 18 to 49 age group are the most frequent diners
and spend the most when dining out, then the number of
selected elements would be disproportionate to stratum
size as illustrated in the fifth column. The numbers in the
disproportionate column would be determined based on
the judgment of each stratum’s economic importance.
Should proportionate or disproportionate sampling be
used? That is, should the decision be based on economic
importance, or some other criteria?
Number of Elements
Selected for the Sample
(1)
Age Group
(2)
Number of Elements
in Stratum
(3)
% of Elements
in Stratum
(4)
Proportionate
Sample Size
(5)
Disproportionate
Sample Size
18–25 600 20 40 = 20% 50 = 25%
26–34 900 30 60 = 30% 50 = 25%
35–49 270 9 18 = 9% 50 = 25%
50–59 1,020 34 68 = 34% 30 = 15%
60 and Older 210 7 14 = 7% 20 = 10%
Total 3,000 100 200 200
www.MyEbookNiche.eCrater.com
146 Part 3 Gathering and Collecting Accurate Data
one-step approach or the two-step approach. When deciding on a one-step approach, the
researcher must have enough prior information about the various geographic clusters to
believe that all the geographic clusters are basically identical with regard to the specific
factors that were used to initially identify the clusters. By assuming that all the clusters
are identical, the researcher can focus his or her attention on surveying the sampling units
within one designated cluster and then generalize the results to the population. The prob-
ability aspect of this particular sampling method is executed by randomly selecting one
geographic cluster and sampling all units in that cluster.
Advantages and Disadvantages Cluster sampling is widely used because of its cost-
effectiveness and ease of implementation. In many cases, the only representative sampling
frame available to researchers is one based on clusters (e.g., states, counties, MSAs, census
tracts). These lists of geographic regions, telephone exchanges, or blocks of residential
dwellings usually can be easily compiled, thus avoiding the need of compiling lists of all
the individual sampling units making up the target population.
Cluster sampling methods have several disadvantages. A primary disadvantage of
cluster sampling is that the clusters often are homogeneous. The more homogeneous the
cluster, the less precise the sample estimates. Ideally, the people in a cluster should be as
heterogeneous as those in the population.
Another concern with cluster sampling is the appropriateness of the designated cluster
factor used to identify the sampling units within clusters. While the defined target popula-
tion remains constant, the subdivision of sampling units can be modified depending on
the selection of the factor used to identify the clusters. As a result, caution must be used in
selecting the factor to determine clusters in area sampling situations.
Nonprobability Sampling DesignsConvenience Sampling Convenience sampling is a method in which samples are
drawn based on convenience. For example, interviewing individuals at shopping malls or
other high-traffic areas is a common method of generating a convenience sample. The
assumption is that the individuals interviewed at the shopping mall are similar to the
overall defined target population with regard to the characteristic being studied. In real-
ity, it is difficult to accurately assess the representativeness of the sample. Given self-
selection and the voluntary nature of participating in the data collection, researchers
should consider the impact of nonresponse error when using sampling based on conve-
nience only.
Advantages and Disadvantages Convenience sampling enables a large number of re-
spondents to be interviewed in a relatively short time. For this reason, it is commonly used
in the early stages of research, including construct and scale measurement development as
well as pretesting of questionnaires. But using convenience samples to develop constructs
and scales can be risky. For example, assume a researcher is developing a measure of ser-
vice quality and in the preliminary stages uses a convenience sample of 300 undergraduate
business students. While college students are consumers of services, serious questions
should be raised about whether they are truly representative of the general population. By
developing constructs and scales using a convenience sample of college students, the con-
structs might be unreliable if used to study a broader target population. Another major
disadvantage of convenience samples is that the data are not generalizable to the defined
target population. The representativeness of the sample cannot be measured because sam-
pling error estimates cannot be calculated.
Convenience sampling
A nonprobability sampling
method in which samples
are drawn at the conve-
nience of the researcher.
www.MyEbookNiche.eCrater.com

Chapter 6 Sampling: Theory and Methods 147
Judgment Sampling In judgment sampling, sometimes referred to as purposive sam-
pling, respondents are selected because the researcher believes they meet the requirements
of the study. For example, sales representatives may be interviewed rather than customers
to determine whether customers’ wants and needs are changing or to assess the firm’s
product or service performance. Similarly, consumer packaged goods companies such as
Procter & Gamble may select a sample of key accounts to obtain information about con-
sumption patterns and changes in demand for selected products, for example, Crest tooth-
paste or Cheer laundry detergent. The assumption is that the opinions of a group of experts
are representative of the target population.
Advantages and Disadvantages If the judgment of the researcher is correct, the sample
generated by judgment sampling will be better than one generated by convenience
sampling. As with all nonprobability sampling procedures, however, you cannot measure
the representativeness of the sample. Thus, data collected from judgment sampling should
be interpreted cautiously.
Quota Sampling Quota sampling involves the selection of prospective participants accord-
ing to prespecified quotas for either demographic characteristics (e.g., age, race, gender, in-
come), specific attitudes (e.g., satisfied/dissatisfied, liking/disliking, great/marginal/no quality),
or specific behaviors (e.g., regular/occasional/rare customer, product user/nonuser). The pur-
pose of quota sampling is to assure that prespecified subgroups of the population are
represented.
Advantages and Disadvantages The major advantage of quota sampling is that the sample
generated contains specific subgroups in the proportions desired by researchers. Use of quotas
ensures that the appropriate subgroups are identified and included in the survey. Also, quota
sampling reduces selection bias by field workers. An inherent limitation of quota sampling is
that the success of the study is dependent on subjective decisions made by researchers. Since it
is a nonprobability sampling method, the representativeness of the sample cannot be measured.
Therefore, generalizing the results beyond the sampled respondents is questionable.
Snowball Sampling Snowball sampling involves identifying a set of respondents who can
help the researcher identify additional people to include in the study. This method of sampling
is also called referral sampling because one respondent refers other potential respondents.
Snowball sampling typically is used in situations where (1) the defined target population is
small and unique and (2) compiling a complete list of sampling units is very difficult. Consider,
for example, researching the attitudes and behaviors of people who volunteer their time to chari-
table organizations like the Children’s Wish Foundation. While traditional sampling methods
require an extensive search effort both in time and cost to find a sufficient number of prospec-
tive respondents, the snowball method yields better results at a much lower cost. Here the re-
searcher interviews a qualified respondent, then solicits his or her help to identify other people
with similar characteristics. While membership in these types of social circles might not be
publicly known, intracircle knowledge is very accurate. The underlying logic of this method is
that rare groups of people tend to form their own unique social circles.
Advantages and Disadvantages Snowball sampling is a reasonable method of identi-
fying respondents who are members of small, hard-to-reach, uniquely defined target popu-
lations. As a nonprobability sampling method, it is most useful in qualitative research. But
snowball sampling allows bias to enter the study. If there are significant differences be-
tween people who are known in certain social circles and those who are not, there may be
problems with this sampling technique. Like all other nonprobability sampling approaches,
the ability to generalize the results to members of the target population is limited.
Judgment sampling A
nonprobability sampling
method in which partici-
pants are selected accord-
ing to an experienced
individual’s belief that they
will meet the requirements
of the study.
Quota sampling A non-
probability sampling
method in which partici-
pants are selected accord-
ing to prespecified quotas
regarding demographics,
attitudes, behaviors, or
some other criteria.
Snowball sampling A
nonprobability sampling
method, also called referral
sampling, in which a set of
respondents is chosen, and
they help the researcher
identify additional people to
be included in the study.
www.MyEbookNiche.eCrater.com

148 Part 3 Gathering and Collecting Accurate Data
Determining the Appropriate Sampling DesignDetermining the best sampling design involves consideration of several factors. In Exhibit 6.5
we provide an overview of the major factors that should be considered. Take a close look
at Exhibit 6.5 and review your understanding of these factors.
Determining Sample Sizes
Determining the sample size is not an easy task. The researcher must consider how precise
the estimates must be and how much time and money are available to collect the required
data, since data collection is generally one of the most expensive components of a study.
Sample size determination differs between probability and nonprobability designs.
Probability Sample SizesThree factors play an important role in determining sample sizes with probability designs:
1. The population variance, which is a measure of the dispersion of the population, and
its square root, referred to as the population standard deviation. The greater the vari-
ability in the data being estimated, the larger the sample size needed.
2. The level of confidence desired in the estimate. Confidence is the certainty that the true
value of what we are estimating falls within the precision range we have selected. For
example, marketing researchers typically select a 90 or 95 percent confidence level for their
projects. The higher the level of confidence desired is the larger the sample size needed.
3. The degree of precision desired in estimating the population characteristic. Precision
is the acceptable amount of error in the sample estimate. For example, if we want to
estimate the likelihood of returning in the future to the Santa Fe Grill (based on a
Precision The accept-
able amount of error in the
sample estimate.
Exhibit 6.5 Factors to Consider in Selecting the Sampling Design
Selection Factors Questions
Research objectives Do the research objectives call for the use of qualitative or
quantitative research designs?
Degree of accuracy Does the research call for making predictions or inferences about
the defined target population, or only preliminary insights?
Resources Are there tight budget constraints with respect to both dollars and
human resources that can be allocated to the research project?
Time frame How quickly does the research project have to be completed?
Knowledge of the Are there complete lists of the defined target population elements?
target population How easy or difficult is it to generate the required sampling frame
of prospective respondents?
Scope of the research Is the research going be international, national, regional, or local?
Statistical analysis To what extent are accurate statistical projections and/or testing of
needs hypothesized differences in the data required?
www.MyEbookNiche.eCrater.com

Chapter 6 Sampling: Theory and Methods 149
7-point scale), is it acceptable to be within ±1 scale point? The more precise the re-
quired sample results, that is, the smaller the desired error, the larger the sample size.
For a particular sample size, there is a trade-off between degree of confidence and
degree of precision, and the desire for confidence and precision must be balanced. These
two considerations must be agreed upon by the client and the marketing researcher based
on the research situation.
Formulas based on statistical theory can be used to compute the sample size. For prag-
matic reasons, such as budget and time constraints, alternative “ad hoc” methods often are
used. Examples of these are sample sizes based on rules of thumb, previous similar studies,
one’s own experience, or simply what is affordable. Irrespective of how the sample size is
determined, it is essential that it should be of a sufficient size and quality to yield results
that are seen to be credible in terms of their accuracy and consistency.
When formulas are used to determine sample size, there are separate approaches for
determining sample size based on a predicted population mean and a population proportion.
The formulas are used to estimate the sample size for a simple random sample. When the sit-
uation involves estimating a population mean, the formula for calculating the sample size is
n = ( Z B,CL
2 ) ( σ
2
__ e2 )
where
ZB,CL
= The standardized z-value associated with the level of confidence
σμ = Estimate of the population standard deviation (σ) based on some type of prior information
e = Acceptable tolerance level of error (stated in percentage points)
In situations where estimates of a population proportion are of concern, the standard-
ized formula for calculating the needed sample size would be
n = ( Z B,CL
2 ) ( [P × Q]
______ e2 )
where
ZB,CL
= The standardized z-value associated with the level of confidence
P = Estimate of expected population proportion having a desired characteristic based on
intuition or prior information
Q = −[1 − P], or the estimate of expected population proportion not holding the characteris-
tic of interest
e = Acceptable tolerance level of error (stated in percentage points)
When the defined target population size in a consumer study is 500 elements or less,
the researcher should consider taking a census of the population rather than a sample. The
logic behind this is based on the theoretical notion that at least 384 sampling units need
to be included in most studies to have a ±5 percent confidence level and a sampling error
of ±5 percentage points.
The business consultant has recommended a survey of
customers. The restaurant is open seven days a week for
lunch and dinner. The consultant is considering both prob-
ability and nonprobability sampling methods as ways to
collect customer data.
1. Which of the sampling options is best for the survey
of the Santa Fe Grill customers? Why?
2. What are some possible sampling methods with
which to collect data from customers of competitive
restaurants?
CONTINUING CASE STUDY THE SANTA FE GRILL
www.MyEbookNiche.eCrater.com
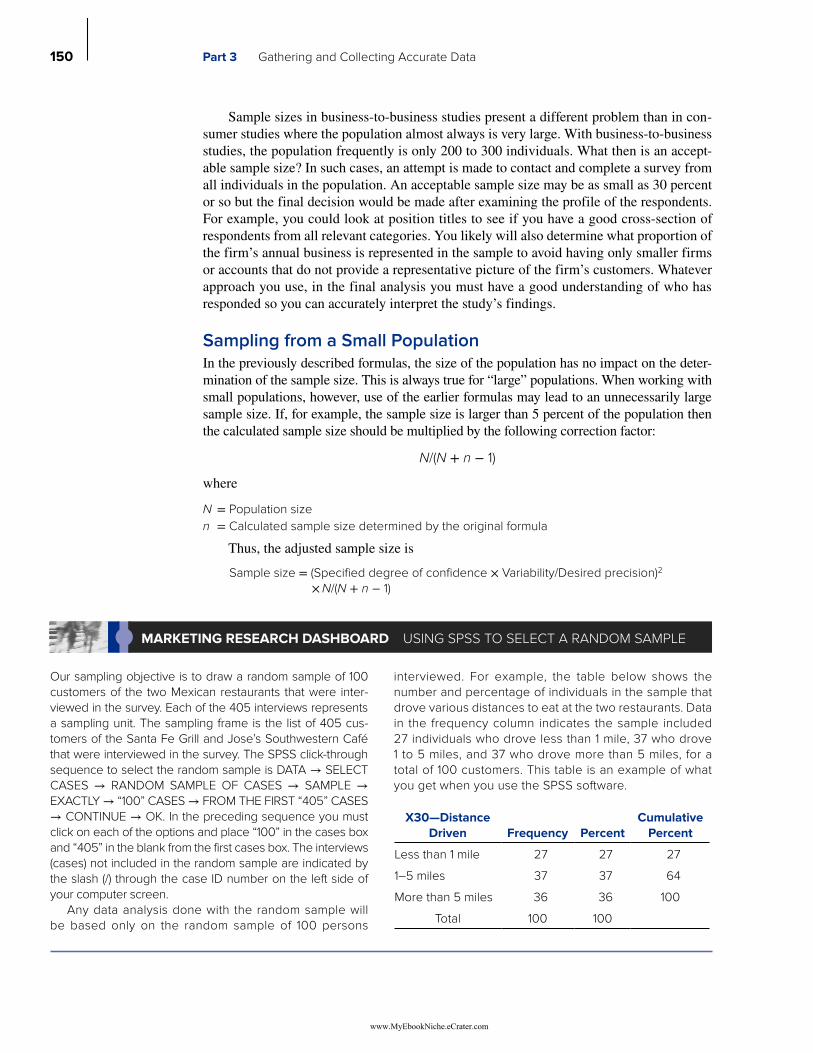
150 Part 3 Gathering and Collecting Accurate Data
Sample sizes in business-to-business studies present a different problem than in con-
sumer studies where the population almost always is very large. With business-to-business
studies, the population frequently is only 200 to 300 individuals. What then is an accept-
able sample size? In such cases, an attempt is made to contact and complete a survey from
all individuals in the population. An acceptable sample size may be as small as 30 percent
or so but the final decision would be made after examining the profile of the respondents.
For example, you could look at position titles to see if you have a good cross-section of
respondents from all relevant categories. You likely will also determine what proportion of
the firm’s annual business is represented in the sample to avoid having only smaller firms
or accounts that do not provide a representative picture of the firm’s customers. Whatever
approach you use, in the final analysis you must have a good understanding of who has
responded so you can accurately interpret the study’s findings.
Sampling from a Small PopulationIn the previously described formulas, the size of the population has no impact on the deter-
mination of the sample size. This is always true for “large” populations. When working with
small populations, however, use of the earlier formulas may lead to an unnecessarily large
sample size. If, for example, the sample size is larger than 5 percent of the population then
the calculated sample size should be multiplied by the following correction factor:
N/(N + n − 1)
where
N = Population size
n = Calculated sample size determined by the original formula
Thus, the adjusted sample size is
Sample size = (Specified degree of confidence × Variability/Desired precision)2
×
N/(N + n − 1)
X30—Distance
Driven Frequency Percent
Cumulative
Percent
Less than 1 mile 27 27 27
1–5 miles 37 37 64
More than 5 miles 36 36 100
Total 100 100
Our sampling objective is to draw a random sample of 100
customers of the two Mexican restaurants that were inter-
viewed in the survey. Each of the 405 interviews represents
a sampling unit. The sampling frame is the list of 405 cus-
tomers of the Santa Fe Grill and Jose’s Southwestern Café
that were interviewed in the survey. The SPSS click-through
sequence to select the random sample is DATA → SELECT
CASES → RANDOM SAMPLE OF CASES → SAMPLE →
EXACTLY → “100” CASES → FROM THE FIRST “405” CASES
→ CONTINUE → OK. In the preceding sequence you must
click on each of the options and place “100” in the cases box
and “405” in the blank from the first cases box. The interviews
(cases) not included in the random sample are indicated by
the slash (/) through the case ID number on the left side of
your computer screen.
Any data analysis done with the random sample will
be based only on the random sample of 100 persons
interviewed. For example, the table below shows the
number and percentage of individuals in the sample that
drove various distances to eat at the two restaurants. Data
in the frequency column indicates the sample included
27 individuals who drove less than 1 mile, 37 who drove
1 to 5 miles, and 37 who drove more than 5 miles, for a
total of 100 customers. This table is an example of what
you get when you use the SPSS software.
MARKETING RESEARCH DASHBOARD USING SPSS TO SELECT A RANDOM SAMPLE
www.MyEbookNiche.eCrater.com

Chapter 6 Sampling: Theory and Methods 151
Nonprobability Sample SizesSample size formulas cannot be used for nonprobability samples. Determining the
sample size for nonprobability samples is usually a subjective, intuitive judgment made
by the researcher based on either past studies, industry standards, or the amount of
resources available. Regardless of the method, the sampling results cannot be used to
make statistical inferences about the true population parameters. Researchers can com-
pare specific characteristics of the sample, such as age, income, and education, and note
that the sample is similar to the population. But the best that can be offered is a descrip-
tion of the sample findings.
Other Sample Size Determination ApproachesSample sizes are often determined using less formal approaches. For example, the
budget is almost always a consideration, and the sample size then will be determined
by what the client can afford. A related approach is basing sample size on similar previ-
ous studies that are considered comparable and judged as having produced reliable and
valid findings. Consideration also is often given to the number of subgroups that will
be examined and the minimum sample size per subgroup needed to draw conclusions
about each subgroup. Some researchers suggest the minimum subgroup sample size
should be 100 while many believe subgroup sample sizes as small as 50 are sufficient.
If the minimum subgroup sample size is 50 and there are five subgroups, then the
total sample size would be 250. Finally, sometimes the sample size is determined by
the number of questions on a questionnaire. For example, typical rules of thumb are
five respondents for each question asked. Thus, if there are 25 questions then the rec-
ommended sample size would be 125. Decisions on which of these approaches, or
combinations or approaches, to use require the judgment of both research experts and
managers to select the best alternative.
Online data collection is increasing rapidly and now rep-
resents almost 60 percent of data collection in the United
States. Below are some of the problems associated with
sampling using online data collection methods:
1. The sampling population is difficult to define and to
reach. E-mail participation solicitation can potentially
contact a broad geographic cross-section of partici-
pants, but who actually responds? For example,
younger demographic groups are less likely to use
e-mail and can more easily be contacted via texting.
Similarly, e-mail solicitations may not reach potential re-
spondents because they are considered junk mail, or
there may be browser or other compatibility issues.
2. Random samples are difficult and perhaps impossible
to select. Lists generally are either unavailable or
unreliable.
3. Some recent research suggests that samples drawn
from opt-in online panels produce survey data that is
less accurate, even after weighting for underrepre-
sented groups. Moreover, the reduced accuracy of
survey data from nonprobability web panels likely off-
sets their lower cost and ability to survey subpopula-
tions with the precision needed for complex research
studies. One study suggests that online samples
should not be “volunteers” recruited online, but
should be solicited using probability methods tied to
landline and mobile telephone contacts.4
4. If random samples cannot be used, then it clearly is
highly questionable to generalize findings.
These problems should not always stop researchers from
using online data collection. Instead, they represent issues that
need to be carefully evaluated before data collection begins.
MARKETING RESEARCH DASHBOARD SAMPLING AND ONLINE SURVEYS
www.MyEbookNiche.eCrater.com
152 Part 3 Gathering and Collecting Accurate Data
Steps in Developing a Sampling Plan
After understanding the key components of sampling theory, the methods of determin-
ing sample sizes, and the various designs available, the researcher is ready to use them
to develop a sampling plan. A sampling plan is the blueprint to ensure the data collected
are representative of the population. A good sampling plan includes the following steps:
(1) define the target population; (2) select the data collection method; (3) identify the sam-
pling frames needed; (4) select the appropriate sampling method; (5) determine necessary
sample sizes and overall contact rates; (6) create an operating plan for selecting sampling
units; and (7) execute the operational plan.
Step 1: Define the Target Population In any sampling plan, the first task of the re-
searcher is to determine the group of people or objects that should be investigated. With
the problem and research objectives as guidelines, the characteristics of the target popula-
tion should be identified. An understanding of the target population helps the researcher to
successfully draw a representative sample.
Step 2: Select the Data Collection Method Using the problem definition, the data
requirements, and the research objectives, the researcher chooses a method for col-
lecting the data from the population. Choices include some type of interviewing
approach (e.g., personal or telephone), a self-administered survey, or perhaps obser-
vation. The method of data collection guides the researcher in selecting the sampling
frame(s).
Step 3: Identify the Sampling Frame(s) Needed A list of eligible sampling units
must be obtained. The list includes information about prospective sampling units (indi-
viduals or objects) so the researcher can contact them. An incomplete sampling frame
decreases the likelihood of drawing a representative sample. Sampling lists can be cre-
ated from a number of different sources (e.g., customer lists from a company’s internal
database, random-digit dialing, an organization’s membership roster, or purchased from
a sampling vendor).
Step 4: Select the Appropriate Sampling Method The researcher chooses between
probability and nonprobability methods. If the findings will be generalized, a probability
sampling method will provide more accurate information than will nonprobability sam-
pling methods. As noted previously, in determining the sampling method, the researcher
must consider seven factors: (1) research objectives; (2) desired accuracy; (3) availability
of resources; (4) time frame; (5) knowledge of the target population; (6) scope of the re-
search; and (7) statistical analysis needs.
Step 5: Determine Necessary Sample Sizes and Overall Contact Rates In this step
of a sampling plan, the researcher decides how precise the sample estimates must be and
how much time and money are available to collect the data. To determine the appropriate
sample size, decisions have to be made concerning (1) the variability of the population
characteristic under investigation, (2) the level of confidence desired in the estimates, and
(3) the precision required. The researcher also must decide how many completed surveys
are needed for data analysis.
Sampling plan The blue-
print or framework needed
to ensure that the data
collected are representa-
tive of the defined target
population.
www.MyEbookNiche.eCrater.com

Chapter 6 Sampling: Theory and Methods 153
At this point the researcher must consider what impact having fewer surveys than ini-
tially desired would have on the accuracy of the sample statistics. An important question is
“How many prospective sampling units will have to be contacted to ensure the estimated
sample size is obtained, and at what additional costs?”
Step 6: Create an Operating Plan for Selecting Sampling Units The researcher must
decide how to contact the prospective respondents in the sample. Instructions should be
written so that interviewers know what to do and how to handle problems contacting pro-
spective respondents. For example, if the study data will be collected using mall-intercept
interviews, then interviewers must be given instructions on how to select respondents and
conduct the interviews.
Step 7: Execute the Operational Plan This step is similar to collecting the data from
respondents. The important consideration in this step is to maintain consistency and
control.
www.MyEbookNiche.eCrater.com

154 Part 3 Gathering and Collecting Accurate Data
MARKETING RESEARCH IN ACTIONDeveloping a Sampling Plan for a New Menu Initiative Survey
Owners of the Santa Fe Grill realize that in order to remain competitive in the restaurant
industry, new menu items need to be introduced periodically to provide variety for current
customers and to attract new customers. Recognizing this, the owners of the Santa Fe Grill
believe three issues need to be addressed using marketing research. The first is should
the menu be changed to include items beyond the traditional southwestern cuisine? For
example, should they add items that would be considered standard American, Italian, or
European cuisine? Second, regardless of the cuisine to be explored, how many new items
(e.g., appetizers, entrées, or desserts) should be included on the survey? And third, what
type of sampling plan should be developed for selecting respondents, and who should those
respondents be? Should they be current customers, new customers, and/or old customers?
Hands-On ExerciseUnderstanding the importance of sampling and the impact it will have on the validity and
accuracy of the research results, the owners have asked the local university if a marketing
research class could assist them in this project. Specifically, the owners have posed the fol-
lowing questions that need to be addressed:
1. How many questions should the survey contain to adequately address all possible
new menu items, including the notion of assessing the desirability of new cuisines?
In short, how can it be determined that all necessary items will be included on the
survey without the risk of ignoring menu items that may be desirable to potential
customers?
2. How should the potential respondents be selected for the survey? Should customers
be interviewed while they are dining? Should customers be asked to participate in the
survey upon exiting the restaurant? Or should a mail or telephone approach be used to
collect information from customers/noncustomers?
Based on the above questions, your task is to develop a procedure to address the following
issues:
1. How many new menu items can be examined on the survey? Remember, all poten-
tial menu possibilities should be assessed but you must have a manageable number
of questions so the survey can be performed in a timely and reasonable manner. Spe-
cifically, from a list of all possible menu items that can be included on the survey,
what is the optimal number of menu items that should be used? Is there a sampling
procedure one can use to determine the maximum number of menu items to place
on the survey?
2. Determine the appropriate sample design. Develop a sample design proposal for the
Santa Fe Grill that addresses the following: Should a probability or nonprobability
sample be used? Given your answer, what type of sampling design should be em-
ployed (simple random, stratified, convenience, etc.)? Given the sample design sug-
gested, how will potential respondents be selected for the study? Finally, determine the
necessary sample size and suggest a plan for selecting the sampling units.
www.MyEbookNiche.eCrater.com

Chapter 6 Sampling: Theory and Methods 155
Summary
Explain the role of sampling in the research process.
Sampling uses a portion of the population to make esti-
mates about the entire population. The fundamentals of
sampling are used in many of our everyday activities.
For instance, we sample before selecting a TV program
to watch, test-drive a car before deciding whether to pur-
chase it, and take a bite of food to determine if our food
is too hot or if it needs additional seasoning. The term
target population is used to identify the complete group
of elements (e.g., people or objects) that are identified
for investigation. The researcher selects sampling units
from the target population and uses the results obtained
from the sample to make conclusions about the target
population. The sample must be representative of the
target population if it is to provide accurate estimates of
population parameters.
Sampling is frequently used in marketing research
projects instead of a census because sampling can sig-
nificantly reduce the amount of time and money required
in data collection.
Distinguish between probability and nonprobability
sampling.
In probability sampling, each sampling unit in the
defined target population has a known probability of
being selected for the sample. The actual probability of
selection for each sampling unit may or may not be equal
depending on the type of probability sampling design
used. In nonprobability sampling, the probability of
selection of each sampling unit is not known. The selec-
tion of sampling units is based on some type of intuitive
judgment or knowledge of the researcher.
Probability sampling enables the researcher to
judge the reliability and validity of data collected by
calculating the probability the findings based on the
sample will differ from the defined target population.
This observed difference can be partially attributed
to the existence of sampling error. Each probability
sampling method, simple random, systematic random,
stratified, and cluster, has its own inherent advantages
and disadvantages.
In nonprobability sampling, the probability of selec-
tion of each sampling unit is not known. Therefore,
potential sampling error cannot be accurately known
either. Although there may be a temptation to general-
ize nonprobability sample results to the defined target
population, for the most part the results are limited to
the people who provided the data in the survey. Each
nonprobability sampling method—convenience, judg-
ment, quota, and snowball—has its own inherent advan-
tages and disadvantages.
Understand factors to consider when determining
sample size.
Researchers consider several factors when determin-
ing the appropriate sample size. The amount of time
and money available often affect this decision. In gen-
eral, the larger the sample, the greater the amount of
resources required to collect data. Three factors that are
of primary importance in the determination of sample
size are (1) the variability of the population character-
istics under consideration, (2) the level of confidence
desired in the estimate, and (3) the degree of precision
desired in estimating the population characteristic. The
greater the variability of the characteristic under inves-
tigation, the higher the level of confidence required.
Similarly, the more precise the required sample results,
the larger the necessary sample size.
Statistical formulas are used to determine the
required sample size in probability sampling. Sample
sizes for nonprobability sampling designs are determined
using subjective methods such as industry standards,
past studies, or the intuitive judgments of the researcher.
The size of the defined target population does not affect
the size of the required sample unless the population is
large relative to the sample size.
Understand the steps in developing a sampling plan.
A sampling plan is the blueprint or framework needed
to ensure that the data collected are representative of
the defined target population. A good sampling plan
will include, at least, the following steps: (1) define the
target population; (2) select the data collection method;
(3) identify the sampling frames needed; (4) select the
appropriate sampling method; (5) determine necessary
sample sizes and overall contact rates; (6) create an oper-
ating plan for selecting sampling units; and (7) execute
the operational plan.
www.MyEbookNiche.eCrater.com

156 Part 3 Gathering and Collecting Accurate Data
Key Terms and Concepts
Area sampling 145
Census 136
Central limit theorem (CLT) 138
Cluster sampling 145
Convenience sampling 145
Defined target population 137
Disproportionately stratified sampling 143
Judgment sampling 147
Nonprobability sampling 140
Nonsampling error 139
Population 137
Precision 148
Probability sampling 140
Proportionately stratified sampling 143
Quota sampling 147
Sampling 136
Sampling error 139
Sampling frame 138
Sampling plan 152
Sampling units 137
Simple random sampling 140
Snowball sampling 147
Stratified random sampling 143
Systematic random sampling 141
Review Questions
1. Why do many research studies place heavy emphasis
on correctly defining a target population rather than a
total population?
2. Explain the relationship between sample sizes and
sampling error. How does sampling error occur in
survey research?
3. The vice president of operations at Busch
Gardens knows that 70 percent of the patrons like
roller-coaster rides. He wishes to have an acceptable
margin of error of no more than ±2 percent and wants
to be 95 percent confident about the attitudes toward
the “Gwazi” roller coaster. What sample size would
be required for a personal interview study among on-
site patrons?
Discussion Questions
1. Summarize why a current telephone directory is not a
good source from which to develop a sampling frame
for most research studies.
2. EXPERIENCE MARKETING RESEARCH: Go to
www. surveysampling.com and select from the menu
“the frame.” Once there, select “archive” and go to a
particular year (e.g., 2012) and review the articles avail-
able on the topic of sampling. Select two articles and
write a brief summary on how sampling affects the abil-
ity to conduct accurate market research.
www.MyEbookNiche.eCrater.com

This page intentionally left blank
www.MyEbookNiche.eCrater.com

Measurement and Scaling
C h a p t e r 7
www.MyEbookNiche.eCrater.com

Learning Objectives After reading this chapter, you will be able to:
1. Understand the role of measurement in marketing research.
2. Explain the four basic levels of scales.
3. Describe scale development and its importance in gathering primary data.
4. Discuss comparative and noncomparative scales.
Santa Fe Grill Mexican Restaurant: Predicting Customer Loyalty
About 18 months after opening their first restaurant near Cumberland Mall in
Dallas, Texas, the owners of the Santa Fe Grill Mexican Restaurant concluded
that although there was another Mexican theme competitor located nearby
(Jose’s Southwestern Café), there were many more casual dining competitors
within a 3-mile radius. These other competitors included several well-established
national chain restaurants, including Chili’s, Applebee’s, T.G.I. Friday’s, and
Ruby Tuesday, which also offered some Mexican food items. Concerned with
growing a stronger customer base in a very competitive restaurant environment,
the owners had initially just focused on the image of offering the best, freshest
“made-from-scratch” Mexican foods possible in hopes of creating satisfaction
among their customers. Results of several satisfaction surveys of current custom-
ers indicated many customers had a satisfying dining experience, but intentions
to revisit the restaurant on a regular basis were low. After reading a popular press
article on customer loyalty, the owners wanted to better understand the factors
that lead to customer loyalty. That is, what would motivate customers to return to
their restaurant more often?
To gain a better understanding of customer loyalty, the Santa Fe Grill own-
ers contacted Burke’s (www.burke.com) Customer Satisfaction Division. They
evaluated several alternatives including measuring customer loyalty, intention to
recommend and return to the restaurant, and sales. Burke representatives indi-
cated that customer loyalty directly influences the accuracy of sales potential
estimates, traffic density is a better indicator of sales than demographics, and
customers often prefer locations where several casual dining establishments are
clustered together so more choices are available. At the end of the meeting, the
owners realized that customer loyalty is a complex behavior to predict.
Several insights about the importance of construct and measurement devel-
opments can be gained from the Santa Fe Grill experience. First, not knowing the
critical elements that influence customers’ restaurant loyalty can lead to intuitive
guesswork and unreliable sales predictions. Second, developing loyal customers
www.MyEbookNiche.eCrater.com

requires identifying and precisely defining constructs that predict loyalty (i.e., customer
attitudes, emotions, behavioral factors). When you finish this chapter, read the Marketing
Research in Action at the end of the chapter to see how Burke Inc. defines and measures
customer loyalty.
160 Part 3 Gathering and Collecting Accurate Data
Value of Measurement in Information Research
Measurement is an integral part of the modern world, yet the beginnings of measurement
lie in the distant past. Before a farmer could sell his corn, potatoes, or apples, both he
and the buyer had to decide on a common unit of measurement. Over time this particular
measurement became known as a bushel or four pecks or, more precisely, 2,150.42 cubic
inches. In the early days, measurement was achieved simply by using a basket or container
of standard size that everyone agreed was a bushel.
From such simple everyday devices as the standard bushel basket, we have progressed
in the physical sciences to an extent that we are now able to measure the rotation of a dis-
tant star, the altitude of a satellite in microinches, or time in picoseconds (1 trillionth of
a second). Today, precise physical measurement is critical to airline pilots flying through
dense fog or to physicians controlling a surgical laser.
In most marketing situations, however, the measurements are applied to things that are
much more abstract than altitude or time. For example, most decision makers would agree
that it is important to have information about whether or not a firm’s customers are going
to like a new product or service prior to introducing it. In many cases, such information
makes the difference between business success and failure. Yet, unlike time or altitude,
people’s preferences can be very difficult to measure accurately. The Coca-Cola Company
introduced New Coke after incompletely conceptualizing and measuring consumers’ pref-
erences, and consequently suffered substantial losses.
Because accurate measurement is essential to effective decision making, this chapter
provides a basic understanding of the importance of measuring customers’ attitudes and
behaviors and other marketplace phenomena. We describe the measurement process and
the decision rules for developing scale measurements. The focus is on measurement issues,
construct development, and scale measurements. The chapter also discusses popular scales
that measure attitudes and behavior.
Overview of the Measurement Process
Measurement is the process of developing methods to systematically characterize or
quantify information about persons, events, ideas, or objects of interest. As part of the mea-
surement process, researchers assign either numbers or labels to phenomena they measure.
For example, when gathering data about consumers who shop for automobiles online, a
researcher may collect information about their attitudes, perceptions, past online purchase
behaviors, and demographic characteristics. Then, numbers are used to represent how indi-
viduals responded to questions in each of these areas.
The measurement process consists of two tasks: (1) construct selection/development
and (2) scale measurement. To collect accurate data, researchers must understand what
Measurement An
integrative process of
determining the intensity
(or amount) of information
about constructs, concepts,
or objects.
www.MyEbookNiche.eCrater.com

Chapter 7 Measurement and Scaling 161
they are attempting to measure before choosing the appropriate scale measurements.
The goal of the construct development process is to precisely identify and define what
is to be measured. In turn, the scale measurement process determines how to precisely
measure each construct. For example, a 10-point scale results in a more precise mea-
sure than a 2-point scale. We begin with construct development and then move to scale
measurement.
What Is a Construct?
A construct is an abstract idea or concept formed in a person’s mind. This idea is a com-
bination of a number of similar characteristics of the construct. The characteristics are
the variables that collectively define the concept and make measurement of the concept
possible. For example, the variables listed below were used to measure the concept of
“customer interaction.”1
∙ This customer was easy to talk with.
∙ This customer genuinely enjoyed my helping her/him.
∙ This customer likes to talk to people.
∙ This customer was interested in socializing.
∙ This customer was friendly.
∙ This customer tried to establish a personal relationship.
∙ This customer seemed interested in me, not only as a salesperson, but also as a person.
By using Agree-Disagree scales to obtain scores on each of the individual variables,
you can measure the overall concept of customer interaction. The individual scores are then
combined into a single score, according to a predefined set of rules. The resultant score
is often referred to as a scale, an index, or a summated rating. In the above example of
customer interaction, the individual variables (items) are scored using a 5-point scale, with
1 = Strongly Disagree and 5 = Strongly Agree.
Suppose the research objective is to identify the characteristics (variables) associated
with a restaurant satisfaction construct. The researcher is likely to review the literature
on satisfaction, conduct both formal and informal interviews, and then draw on his or her
own experiences to identify variables like quality of food, quality of service, and value for
money as important components of a restaurant satisfaction construct. Logical combina-
tion of these characteristics then provides a theoretical framework that represents the sat-
isfaction construct and enables the researcher to conduct an empirical investigation of the
concept of restaurant satisfaction.
Construct DevelopmentMarketing constructs must be clearly defined. Recall that a construct is an unobservable
concept that is measured indirectly by a group of related variables. Thus, constructs are
made up of a combination of several related indicator variables that together define the
concept being measured. Each individual indicator has a scale measurement. The construct
being studied is indirectly measured by obtaining scale measurements on each of the indi-
cators and adding them together to get an overall score for the construct. For example, cus-
tomer satisfaction is a construct while an individual’s positive (or negative) feeling about
a specific aspect of their shopping experience, such as attitude toward the store’s employ-
ees, is an indicator variable.
Construct A hypothetical
variable made up of a set
of component responses or
behaviors that are thought
to be related.
www.MyEbookNiche.eCrater.com

162 Part 3 Gathering and Collecting Accurate Data
Construct development begins with an accurate definition of the purpose of the study
and the research problem. Without a clear initial understanding of the research problem,
the researcher is likely to collect irrelevant or inaccurate data, thereby wasting a great deal
of time, effort, and money. Construct development is the process in which researchers
identify characteristics that define the concept being studied by the researcher. Once the
characteristics are identified, the researcher must then develop a method of indirectly mea-
suring the concept.
Construct development
An integrative process
in which researchers
determine what specific
data should be collected
for solving the defined
research problem.
Exhibit 7.1 Examples of Concrete Features and Abstract Constructs of Objects
Objects
Consumer Concrete properties: age, sex, marital status, income, brand last
purchased, dollar amount of purchase, types of products
purchased, color of eyes and hair
Abstract properties: attitudes toward a product, brand loyalty,
high-involvement purchases, emotions (love, fear, anxiety),
intelligence, personality
Organization Concrete properties: name of company, number of employees,
number of locations, total assets, Fortune 500 rating, computer
capacity, types and numbers of products and service offerings
Abstract properties: competence of employees, quality control,
channel power, competitive advantages, company image,
consumer-oriented practices
Marketing Constructs
Brand loyalty Concrete properties: the number of times a particular brand is
purchased, the frequency of purchases of a particular brand,
amount spent
Abstract properties: like/dislike of a particular brand, the degree
of satisfaction with the brand, overall attitude toward the brand
Customer satisfaction Concrete properties: identifiable attributes that make up a
product, service, or experience
Abstract properties: liking/disliking of the individual attributes
making up the product, positive feelings toward the product
Service quality Concrete properties: identifiable attributes of a service
encounter, for example amount of interaction, personal
communications, service provider’s knowledge
Abstract properties: expectations held about each identifiable
attribute, evaluative judgment of performance
Advertising recall Concrete properties: factual properties of the ad (e.g., message,
symbols, movement, models, text), aided and unaided recall of
ad properties
Abstract properties: favorable/unfavorable judgments, attitude
toward the ad
www.MyEbookNiche.eCrater.com

Chapter 7 Measurement and Scaling 163
At the heart of construct development is the need to determine exactly what is to be
measured. Objects that are relevant to the research problem are identified first. Then the
objective and subjective properties of each object are specified. When data are needed
only about a concrete issue, the research focus is limited to measuring the object’s objec-
tive properties. But when data are needed to understand an object’s subjective (abstract)
properties, the researcher must identify measurable subcomponents that can be used as
indicators of the object’s subjective properties. Exhibit 7.1 shows examples of objects and
their concrete and abstract properties. A rule of thumb is that if an object’s features can
be directly measured using physical characteristics, then that feature is a concrete variable
and not an abstract construct. Abstract constructs are not physical characteristics and are
measured indirectly. The Marketing Research Dashboard demonstrates the importance of
using the appropriate set of respondents in developing constructs.
Scale Measurement
The quality of responses associated with any question or observation technique depends
directly on the scale measurements used by the researcher. Scale measurement involves
assigning a set of scale descriptors to represent the range of possible responses to a ques-
tion about a particular object or construct. The scale descriptors are a combination of
labels, such as “Strongly Agree” or “Strongly Disagree” and numbers, such as 1 to 7,
which are assigned using a set of rules.
Scale measurement assigns degrees of intensity to the responses. The degrees of inten-
sity are commonly referred to as scale points. For example, a retailer might want to know
how important a preselected set of store or service features is to consumers in deciding
where to shop. The level of importance attached to each store or service feature would be
determined by the researcher’s assignment of a range of intensity descriptors (scale points)
to represent the possible degrees of importance associated with each feature. If labels are
Scale measurement The
process of assigning
descriptors to represent the
range of possible responses
to a question about a
particular object or construct.
Scale points Designated
degrees of intensity
assigned to the responses
in a given questioning or
observation method.
Hibernia National Bank needs to identify the areas custom-
ers might use in judging banking service quality. As a result
of a limited budget and based on the desire to work with a
local university marketing professor, several focus groups
were conducted among undergraduate students in a basic
marketing course and graduate students in a marketing
management course. The objective was to identify the ser-
vice activities and offerings that might represent service
quality. The researcher's rationale for using these groups
was that the students had experience in conducting bank
transactions, were consumers, and it was convenient
to obtain their participation. Results of the focus groups
revealed that students used four dimensions to judge a
bank's service quality: (1) interpersonal skills of bank staff;
(2) reliability of bank statements; (3) convenience of ATMs;
and (4) user-friendly Internet access to banking functions.
A month later, the researcher conducted focus groups
among current customers of one of the large banks in the
same market area as the university. Results suggested
these customers used six dimensions in judging a bank's
service quality. The dimensions were: (1) listening skills
of bank personnel; (2) understanding banking needs;
(3) empathy; (4) responses to customers' questions or prob-
lems; (5) technological competence in handling bank trans-
actions; and (6) interpersonal skills of contact personnel.
The researcher was unsure whether customers perceive
bank service quality as having four or six components, and
whether a combined set of dimensions should be used.
Which of the two sets of focus groups should be used to bet-
ter understand the construct of bank service quality? What
would you do to better understand the bank service quality
construct? How would you define banking service quality?
MARKETING RESEARCH DASHBOARD UNDERSTANDING THE DIMENSIONS OF BANK SERVICE QUALITY
www.MyEbookNiche.eCrater.com

164 Part 3 Gathering and Collecting Accurate Data
used as scale points to respond to a question, they might include the following: definitely
important, moderately important, slightly important, and not at all important. If numbers
are used as scale points, then a 10 could mean very important and a 1 could mean not
important at all.
All scale measurements can be classified as one of four basic scale levels: (1) nominal;
(2) ordinal; (3) interval; and (4) ratio. We discuss each of the scale levels next.
Nominal ScalesA nominal scale is the most basic and least powerful scale design. With nominal scales,
the questions require respondents only to provide some type of descriptor as the response.
Responses do not contain a level of intensity. Thus, a ranking of the set of responses is
not possible. Nominal scales allow the researcher only to categorize the responses into
mutually exclusive subsets that do not have distances between them. Thus, the only pos-
sible mathematical calculation is to count the number of responses in each category and to
report the mode. Some examples of nominal scales are given in Exhibit 7.2.
Ordinal ScalesOrdinal scales are more powerful than nominal scales. This type of scale enables respon-
dents to express relative magnitude between the answers to a question and responses can be
rank-ordered in a hierarchical pattern. Thus, relationships between responses can be deter-
mined such as “greater than/less than,” “higher than/lower than,” “more often/less often,”
“more important/less important,” or “more favorable/less favorable.” The mathematical
calculations that can be applied with ordinal scales include mode, median, frequency dis-
tributions, and ranges. Ordinal scales cannot be used to determine the absolute difference
between rankings. For example, respondents can indicate they prefer Coke over Pepsi, but
Nominal scale The type of
scale in which the questions
require respondents to
provide only some type
of descriptor as the raw
response.
Ordinal scale A scale that
allows a respondent to
express relative magnitude
between the answers to a
question.
Exhibit 7.2 Examples of Nominal Scales
Example 1:
Please indicate your marital status.
Married Single Separated Divorced Widowed
Example 2:
Do you like or dislike chocolate ice cream?
Like Dislike
Example 3:
Which of the following supermarkets have you shopped at in the past 30 days? Please check
all that apply.
Albertson’s Winn-Dixie Publix Safeway Walmart
Example 4:
Please indicate your gender.
Female Male Transgender
www.MyEbookNiche.eCrater.com

Chapter 7 Measurement and Scaling 165
researchers cannot determine how much more the respondents prefer Coke. Exhibit 7.3
provides several examples of ordinal scales.
Interval ScalesInterval scales can measure absolute differences between scale points. That is, the inter-
vals between the scale numbers tell us how far apart the measured objects are on a particu-
lar attribute. For example, the satisfaction level of customers with the Santa Fe Grill and
Jose Southwestern Café was measured using a 7-point interval scale, with the end points
1 = Strongly Disagree and 7 = Strongly Agree. This approach enables us to compare the
relative level of satisfaction of the customers with the two restaurants. Thus, with an inter-
val scale we could say that customers of the Santa Fe Grill are more satisfied than custom-
ers of Jose’s Southwestern Café.
In addition to the mode and median, the mean and standard deviation of the respon-
dents’ answers can be calculated for interval scales. This means that researchers can
report findings not only about hierarchical differences (better than or worse than) but
Interval scale A scale that
demonstrates absolute
differences between each
scale point.
Exhibit 7.3 Examples of Ordinal Scales
Example 1:
We would like to know your preferences for actually using different banking methods.
Among the methods listed below, please indicate your top three preferences using a “1” to
represent your first choice, a “2” for your second preference, and a “3” for your third choice
of methods. Please write the numbers on the lines next to your selected methods. Do not
assign the same number to two methods.
Inside the bank Bank by mail
Drive-in (Drive-up) windows Bank by telephone
ATM Internet banking
Debit card
Example 2:
Which one statement best describes your opinion of the quality of an Intel PC processor?
(Please check just one statement.)
Higher than AMD’s PC processor
About the same as AMD’s PC processor
Lower than AMD’s PC processor
Example 3:
For each pair of retail discount stores, circle the one store at which you would be more likely
to shop.
Costco or Target
Target or Walmart
Walmart or Costco
www.MyEbookNiche.eCrater.com

166 Part 3 Gathering and Collecting Accurate Data
also the absolute differences between the data. Exhibit 7.4 gives several examples of
interval scales.
Ratio ScalesRatio scales are the highest level scale because they enable the researcher not only to iden-
tify the absolute differences between each scale point but also to make absolute compari-
sons between the responses. For example, in collecting data about how many cars are owned
by households in Atlanta, Georgia, a researcher knows that the difference between driving
one car and driving three cars is always going to be two. Furthermore, when comparing a
one-car family to a three-car family, the researcher can assume that the three-car family will
have significantly higher total car insurance and maintenance costs than the one-car family.
Ratio scales are designed to enable a “true natural zero” or “true state of nothing”
response to be a valid response to a question. Generally, ratio scales ask respondents to pro-
vide a specific numerical value as their response, regardless of whether or not a set of scale
points is used. In addition to the mode, median, mean, and standard deviation, one can
make comparisons between levels. Thus, if you are measuring weight, a familiar ratio scale,
one can then say a person weighing 200 pounds is twice as heavy as one weighing only
100 pounds. Exhibit 7.5 shows examples of ratio scales.
Ratio scale A scale that
allows the researcher not
only to identify the absolute
differences between
each scale point but also
to make comparisons
between the responses.
Exhibit 7.4 Examples of Interval Scales
Example 1:
How likely are you to recommend Definitely Will Not Definitely Will
the Santa Fe Grill to a friend? Recommend Recommend
1 2 3 4 5 6 7
Example 2:
Using a scale of 0–10, with “10” being Highly Satisfied and “0” being Not Satisfied At All, how
satisfied are you with the banking services you currently receive from (read name of primary bank)?
Answer: _____
Example 3:
Please indicate how frequently you use different banking methods. For each of the banking
methods listed below, circle the number that best describes the frequency you typically use
each method.
Banking Methods Never Use Use Very Often
Inside the bank 0 1 2 3 4 5 6 7 8 9 10
Drive-up window 0 1 2 3 4 5 6 7 8 9 10
24-hour ATM 0 1 2 3 4 5 6 7 8 9 10
Debit card 0 1 2 3 4 5 6 7 8 9 10
Bank by mail 0 1 2 3 4 5 6 7 8 9 10
Bank by phone 0 1 2 3 4 5 6 7 8 9 10
Bank by Internet 0 1 2 3 4 5 6 7 8 9 10
www.MyEbookNiche.eCrater.com

Chapter 7 Measurement and Scaling 167
Evaluating Measurement Scales
All measurement scales should be evaluated for reliability and validity. The following
paragraphs explain how this is done.
Scale ReliabilityScale reliability refers to the extent to which a scale can reproduce the same or similar
measurement results in repeated trials. Thus, reliability is a measure of consistency in
measurement. Random error produces inconsistency in scale measurements that leads to
lower scale reliability. But researchers can improve reliability by carefully designing scaled
questions. Two of the techniques that help researchers assess the reliability of scales are
test-retest and equivalent form.
First, the test-retest technique involves repeating the scale measurement with either the
same sample of respondents at two different times or two different samples of respondents
from the same defined target population under as nearly the same conditions as possible.
The idea behind this approach is that if random variations are present, they will be revealed
by variations in the scores between the two sampled measurements. If there are very few
differences between the first and second administrations of the scale, the measuring scale
is viewed as being stable and therefore reliable. For example, assume that determining the
teaching effectiveness associated with your marketing research course involved the use of
a 28-question scale designed to measure the degree to which respondents agree or disagree
with each question (statement). To gather the data on teaching effectiveness, your profes-
sor administers this scale to the class after the sixth week of the semester and again after
the 12th week. Using a mean analysis procedure on the questions for each measurement
period, the professor then runs correlation analysis on those mean values. If the correla-
tion is high between the mean value measurements from the two assessment periods, the
professor concludes that the reliability of the 28-question scale is high.
There are several potential problems with the test-retest approach. First, some of the
students who completed the scale the first time might be absent for the second administra-
tion of the scale. Second, students might become sensitive to the scale measurement and
Exhibit 7.5 Examples of Ratio Scales
Example 1:
Please circle the number of children under 18 years of age currently living in your household.
0 1 2 3 4 5 6 7 If more than 7, please specify:
Example 2:
In the past seven days, how many times did you go shopping at a retail shopping mall?
_______ # of times
Example 3:
In years, what is your current age?
_______ # of years old
www.MyEbookNiche.eCrater.com

168 Part 3 Gathering and Collecting Accurate Data
therefore alter their responses in the second measurement. Third, environmental or per-
sonal factors may change between the two administrations, thus causing changes in student
responses in the second measurement.
Some researchers believe the problems associated with test-retest reliability technique
can be avoided by using the equivalent form technique. In this technique, researchers create
two similar yet different (e.g., equivalent) scale measurements for the given construct (e.g.,
teaching effectiveness) and administer both forms to either the same sample of respondents
or to two samples of respondents from the same defined target population. In the market-
ing research course “teaching effectiveness” example, the professor would construct two
28-question scales whose main difference would lie in the wording of the item statements,
not the Agree/Disagree scaling points. Although the specific wording of the statements
would be changed, their meaning is assumed to remain constant. After administering each
of the scale measurements, the professor calculates the mean values for each question and
then runs correlation analysis. Equivalent form reliability is assessed by measuring the cor-
relations between the scores on the two scale measurements. High correlation values are
interpreted as meaning high-scale measurement reliability.
There are two potential drawbacks with the equivalent form reliability technique. First,
even if equivalent versions of the scale can be developed, it might not be worth the time,
effort, and expense of determining that two similar yet different scales can be used to mea-
sure the same construct. Second, it is difficult and perhaps impossible to create two totally
equivalent scales. Thus, questions may be raised as to which scale is the most appropriate
to use in measuring teaching effectiveness.
The previous approaches to examining reliability are often difficult to complete in
a timely and accurate manner. As a result, marketing researchers most often use internal
consistency reliability. Internal consistency is the degree to which the individual questions
of a construct are correlated. That is, the set of questions that make up the scale must be
internally consistent.
Two popular techniques are used to assess internal consistency: (1) split-half tests and
(2) coefficient alpha (also referred to as Cronbach’s alpha). In a split-half test, the scale
questions are divided into two halves (odd versus even, or randomly) and the resulting
halves’ scores are correlated against one another. High correlations between the halves
indicate good (or acceptable) internal consistency. A coefficient alpha calculates the aver-
age of all possible split-half measures that result from different ways of dividing the scale
questions. The coefficient value can range from 0 to 1, and, in most cases, a value of less
than 0.7 would typically indicate marginal to low (unsatisfactory) internal consistency. In
contrast, when reliability coefficient is too high (0.95 or greater), it suggests that the items
making up the scale are too consistent with one another (i.e., measuring the same thing) and
consideration should be given to eliminating some of the redundant items from the scale.
Researchers need to remember that just because their scale measurement designs are
reliable, the data collected are not necessarily valid. Separate validity assessments must be
made on the constructs being measured.
ValiditySince reliable scales are not necessarily valid, researchers also need to be concerned about
validity. Scale validity assesses whether a scale measures what it is supposed to measure.
Thus, validity is a measure of accuracy in measurement. For example, if you want to know a
family’s disposable income, this is different from total household income. You may start with
questions about total family income to arrive at disposable income, but total family income by
itself is not a valid indicator of disposable income. A construct with perfect validity contains
www.MyEbookNiche.eCrater.com

Chapter 7 Measurement and Scaling 169
no measurement error. An easy measure of validity would be to compare observed measure-
ments with the true measurement. The problem is that we very seldom know the true measure.
Validation, in general, involves determining the suitability of the questions (statements)
chosen to represent the construct. One approach to assess scale validity involves examining face
validity. Face validity is based on the researcher’s intuitive evaluation of whether the statements
look like they measure what they are supposed to measure. Establishing the face validity of a
scale involves a systematic but subjective assessment of a scale’s ability to measure what it is
supposed to measure. Thus, researchers use their expert judgment to determine face validity.
A similar measure of validity is content validity, which is a measure of the extent
to which a construct represents all the relevant dimensions. Content validity requires
more rigorous statistical assessment than face validity, which only requires intuitive judg-
ments. To illustrate content validity, let’s consider the construct of job satisfaction. A scale
designed to measure the construct job satisfaction should include questions on compensa-
tion, working conditions, communication, relationships with coworkers, supervisory style,
empowerment, opportunities for advancement, and so on. If any one of these major areas
does not have questions to measure it then the scale would not have content validity.
Content validity is assessed before data are collected in an effort to ensure the con-
struct (scale) includes items to represent all relevant areas. It is generally carried out in the
process of developing or revising scales. In contrast, face validity is a post hoc claim about
existing scales that the items represent the construct being measured. Several other types
of validity typically are examined after data are collected, particularly when multi-item
scales are being used. For example, convergent validity is evaluated with multi-item scales
and represents a situation in which the multiple items measuring the same construct share a
high proportion of variance, typically more than 50 percent. Similarly, discriminant valid-
ity is the extent to which a single construct differs from other constructs and represents a
unique construct. Two approaches typically are used to obtain data to assess validity. If
sufficient resources are available, a pilot study is conducted with 100 to 200 respondents
believed to be representative of the defined target population. When fewer resources are
available, researchers assess only content validity using a panel of experts.
Developing Scale Measurements
Designing measurement scales requires (1) understanding the research problem,
(2) establishing detailed data requirements, (3) identifying and developing constructs, and
(4) selecting the appropriate measurement scale. Thus, after the problem and data require-
ments are understood, the researcher must develop constructs and then select the appropriate
scale format (nominal, ordinal, interval, or ratio). If the problem requires interval data, but the
researcher asks the questions using a nominal scale, the wrong level of data will be collected
and the findings may not be useful in understanding and explaining the research problem.
Criteria for Scale DevelopmentQuestions must be phrased carefully to produce accurate data. To do so, the researcher
must develop appropriate scale descriptors to be used as the scale points.
Understanding of the Questions The researcher must consider the intellectual capacity
and language ability of individuals who will be asked to respond to the scales. Researchers
should not automatically assume that respondents understand the questions and response
choices. Appropriate language must be used in both the questions and the answers.
www.MyEbookNiche.eCrater.com

170 Part 3 Gathering and Collecting Accurate Data
Simplicity in word choice and straightforward, simple sentence construction improve under-
standing. All scaled questions should be pretested to evaluate their level of understanding.
Respondents with a high school education or comparable can easily understand and respond
to 7-point scales, and in most instances 10-point and 100-point scales.
Discriminatory Power of Scale Descriptors The discriminatory power of scale de-
scriptors is the scale’s ability to differentiate between the scale responses. Researchers
must decide how many scale points are necessary to represent the relative magnitudes of
a response scale. The more scale points, the greater the discriminatory power of
the scale.
There is no absolute rule about the number of scale points that should be used in creat-
ing a scale. For some respondents, scales should not be more than 5 points because it may
be difficult to make a choice when there are more than five levels. This is particularly true
for respondents with lower education levels and less experience in responding to scales.
The more scale points researchers use, the greater the variability in the data—an important
consideration in statistical analysis of data. Indeed, as noted earlier with more educated
respondents, 10 and even 100-point scales work quite well. Previously published scales
based on 5 points should almost always be extended to more scale points to increase the
accuracy of respondent answers.
Balanced versus Unbalanced Scales Researchers must consider whether to use a bal-
anced or unbalanced scale. A balanced scale has an equal number of positive (favorable)
and negative (unfavorable) response alternatives. An example of a balanced scale is,
Based on your experiences with your new vehicle since owning and driving it,
to what extent are you presently satisfied or dissatisfied with the overall per-
formance of the vehicle? Please check only one response.
_____ Completely satisfied (no dissatisfaction)
_____ Generally satisfied
_____ Slightly satisfied (some satisfaction)
_____ Slightly dissatisfied (some dissatisfaction)
_____ Generally dissatisfied
_____ Completely dissatisfied (no satisfaction)
An unbalanced scale has a larger number of response options on one side, either posi-
tive or negative. For most research situations, a balanced scale is recommended because
unbalanced scales often introduce bias. One exception is when the attitudes of respondents
are likely to be predominantly one-sided, either positive or negative. When this situation is
expected, researchers typically use an unbalanced scale. One example is when respondents
are asked to rate the importance of evaluative criteria in choosing to do business with a
particular company, they often rate all criteria listed as very important. An example of an
unbalanced scale is,
Based on your experiences with your new vehicle since owning and driving it,
to what extent are you presently satisfied with the overall performance of the
vehicle? Please check only one response.
_____ Completely satisfied
_____ Definitely satisfied
_____ Generally satisfied
_____ Slightly satisfied
_____ Dissatisfied
Discriminatory power
The scale’s ability to
discriminate between the
categorical scale responses
(points).
www.MyEbookNiche.eCrater.com

Chapter 7 Measurement and Scaling 171
Forced or Nonforced Choice Scales A scale that does not have a neutral descriptor to
divide the positive and negative answers is referred to as a forced-choice scale. It is forced
because the respondent can only select either a positive or a negative answer, and not a
neutral one. In contrast, a scale that includes a center neutral response is referred to as a
nonforced or free-choice scale. Exhibit 7.6 presents several different examples of both
“even-point, forced-choice” and “odd-point, nonforced” scales.
Some researchers believe scales should be designed as “odd-point, nonforced” scales2
since not all respondents will have enough knowledge or experience with the topic to be
able to accurately assess their thoughts or feelings. If respondents are forced to choose,
the scale may produce lower-quality data. With nonforced choice scales, however, the
so-called neutral scale point provides respondents an easy way to express their feelings.
Many researchers believe that there is no such thing as a neutral attitude or feeling, that
these mental aspects almost always have some degree of a positive or negative orientation
Exhibit 7.6 Examples of Forced-Choice and Nonforced Scale Descriptors
Even-Point, Forced-Choice Rating Scale Descriptors
Purchase Intention (Not Buy–Buy)
Definitely will not buy Probably will not buy Probably will buy Definitely will buy
Personal Beliefs/Opinions (Agreement–Disagreement)
Definitely Somewhat Somewhat Definitely
Disagree Disagree Agree Agree
Cost (Inexpensive–Expensive)
Extremely Definitely Somewhat Somewhat Definitely Extremely
Inexpensive Inexpensive Inexpensive Expensive Expensive Expensive
Odd-Point, Nonforced Choice Rating Scale Descriptors
Purchase Intentions (Not Buy–Buy)
Definitely Probably Neither Will nor Probably Definitely
Will Not Buy Will Not Buy Will Not Buy Will Buy Will Buy
_____
Personal Beliefs/Opinions (Disagreement–Agreement)
Definitely Somewhat Neither Disagree Somewhat Definitely
Disagree Disagree nor Agree Agree Agree
Cost (Inexpensive–Expensive)
Definitely Somewhat Neither Expensive nor Somewhat Definitely
Inexpensive Inexpensive Inexpensive Expensive Expensive
_____ _____ _____ _____ _____
www.MyEbookNiche.eCrater.com

172 Part 3 Gathering and Collecting Accurate Data
attached to them. A person either has an attitude or does not have an attitude about a given
object. Likewise, a person will either have a feeling or not have a feeling. An alterna-
tive approach to handling situations in which respondents may feel uncomfortable about
expressing their thoughts or feelings because they have no knowledge of or experience
with it would be to incorporate a “Not Applicable” response choice.
Negatively Worded Statements Scale development guidelines traditionally suggested
that negatively worded statements should be included to verify that respondents are reading
the questions. In more than 40 years of developing scaled questions, the authors have found
that negatively worded statements almost always create problems for respondents in data
collection. Moreover, based on pilot studies negatively worded statements have been re-
moved from questionnaires more than 90 percent of the time. As a result, inclusion of nega-
tively worded statements should be minimized and even then approached with caution.
Desired Measures of Central Tendency and Dispersion The type of statistical analyses that
can be performed on data depends on the level of the data collected, whether nominal, ordinal,
interval, or ratio. In Chapters 11 and 12, we show how the level of data collected influences the
type of analysis. Here we focus on how the scale’s level affects the choice of how we measure
central tendency and dispersion. Measures of central tendency locate the center of a distribution of
responses and are basic summary statistics. The mean, median, and mode measure central ten-
dency using different criteria. The mean is the arithmetic average of all the data responses. The
median is the sample statistic that divides the data so that half the data are above the statistic value
and half are below. The mode is the value most frequently given among all of the responses.
Measures of dispersion describe how the data are dispersed around a central value.
These statistics enable the researcher to report the variability of responses on a particular
scale. Measures of dispersion include the frequency distribution, the range, and the esti-
mated standard deviation. A frequency distribution is a summary of how many times each
possible response to a scale question/setup was recorded by the total group of respondents.
This distribution can be easily converted into percentages or histograms. The range repre-
sents the distance between the largest and smallest response. The standard deviation is the
statistical value that specifies the degree of variation in the responses. These measures are
explained in more detail in Chapter 11.
Given the important role these statistics play in data analysis, an understanding of
how different levels of scales influence the use of a particular statistic is critical in scale
design. Exhibit 7.7 displays these relationships. Nominal scales can only be analyzed using
frequency distributions and the mode. Ordinal scales can be analyzed using medians and
ranges as well as modes and frequency distributions. For interval or ratio scales, the most
appropriate statistics to use are means and standard deviations. In addition, interval and
ratio data can be analyzed using modes, medians, frequency distributions, and ranges.
Adapting Established ScalesThere are literally hundreds of previously published scales in marketing. The most relevant
sources of these scales are: William Bearden, Richard Netemeyer and Kelly Haws, Handbook
of Marketing Scales, 3rd ed. (Thousand Oaks, CA: Sage Publications, 2011); Gordon Bruner,
Marketing Scales Handbook, 3rd ed. (Chicago, IL: American Marketing Association, 2006),
and the online Measures Toolchest by the Academy of Management, available at: http://
measures.kammeyer-uf.com/wiki/Main_Page. Some of the scales described in these
sources can be used in their published form to collect data. But most scales need to be
adapted to meet current psychometric standards. For example, many scales include double-
www.MyEbookNiche.eCrater.com

Chapter 7 Measurement and Scaling 173
barreled questions (discussed in Chapter 8). In such cases, these questions need to be adapted
by converting a single question into two separate questions. In addition, most of the scales
were developed prior to online data collection approaches and used 5-point Likert scales.
As noted earlier, more scale points create greater variability in responses, which is desirable
in statistical analysis. Therefore, previously developed scales should in almost all instances
be adapted by converting the 5-point scales to 7-, 10-, or even 100-point scales. Moreover,
in many instances, the Likert scale format should be converted to a graphic ratings scale
(described in next section), which provides more accurate responses to scaled questions.
Scales to Measure Attitudes and Behaviors
Now that we have presented the basics of construct development as well as the rules for
developing scale measurements, we are ready to discuss attitudinal and behavioral scales
frequently used by marketing researchers.
Scales are the “rulers” that measure customer attitudes, behaviors, and intentions.
Well-designed scales result in better measurement of marketplace phenomena, and thus pro-
vide more accurate information to marketing decision makers. Several types of scales have
proven useful in many different situations. This section discusses three scale formats: Likert
scales, semantic differential scales, and behavioral intention scales. Exhibit 7.8 shows the
general steps in the construct development/scale measurement process. These steps are fol-
lowed in developing mostly all types of scales, including the three discussed here.
Likert ScaleA Likert scale asks respondents to indicate the extent to which they either agree or dis-
agree with a series of statements about a subject. Usually the scale format is balanced
between agreement and disagreement scale descriptors. Named after its original devel-
oper, Rensis Likert, this scale initially had five scale descriptors: “strongly agree,” “agree,”
“neither agree nor disagree,” “disagree,” “strongly disagree.” The Likert scale is often
Likert scale An ordinal
scale format that asks
respondents to indicate the
extent to which they agree
or disagree with a series of
mental belief or behavioral
belief statements about a
given object.
Exhibit 7.7 Relationships between Scale Levels and Measures
of Central Tendency and Dispersion
Basic Levels of Scales
Measurements Nominal Ordinal Interval Ratio
Central Tendency
Mode Appropriate Appropriate Appropriate Appropriate
Median Inappropriate More Appropriate Appropriate Appropriate
Mean Inappropriate Inappropriate Most Appropriate Most Appropriate
Dispersion
Frequency distribution Appropriate Appropriate Appropriate Appropriate
Range Inappropriate More Appropriate Appropriate Appropriate
Estimated standard deviation Inappropriate Inappropriate Most Appropriate Most Appropriate
www.MyEbookNiche.eCrater.com

174 Part 3 Gathering and Collecting Accurate Data
expanded beyond the original 5-point format to a 7-point scale, and most researchers treat
the scale format as an interval scale. Likert scales are best for research designs that use
self- administered surveys, personal interviews, or online surveys. Exhibit 7.9 provides an
example of a 6-point Likert scale in a self-administered survey.
While widely used, there can be difficulties in interpreting the results produced by a
Likert scale. Consider the last statement in Exhibit 7.9 (I am never influenced by advertise-
ments). The key words in this statement are never influenced. If respondents check “Defi-
nitely Disagree,” the response does not necessarily mean that respondents are very much
influenced by advertisements.
Semantic Differential ScaleAnother rating scale used quite often in marketing research is the semantic differential scale.
This scale is unique in its use of bipolar adjectives (good/bad, like/dislike, competitive/
noncompetitive, helpful/unhelpful, high quality/low quality, dependable/undependable)
as the endpoints of a continuum. Only the endpoints of the scale are labeled. Usually there
Semantic differential scale
A unique bipolar ordinal
scale format that captures a
person's attitudes or feelings
about a given object.
Exhibit 7.8 Construct/Scale Development Process
Steps Activities
1. Identify and define construct Determine construct dimensions/factors
2. Create initial pool of attribute Conduct qualitative research, collect
statements secondary data, identify theory
3. Assess and select reduced set Use qualitative judgment and item analysis
of items/statements
4. Design scales and pretest Collect data from pretest
5. Complete statistical analysis Evaluate reliability and validity
6. Refine and purify scales Eliminate poorly designed statements
7. Complete final scale evaluation Most often qualitative judgment, but may
involve further reliability and validity tests
Exhibit 7.9 Example of a Likert Scale
For each listed statement below, please check the one response that best expresses the extent to which you
agree or disagree with that statement.
Definitely Somewhat Slightly Slightly Somewhat Definitely
Statements Disagree Disagree Disagree Agree Agree Agree
I buy many things with a credit card.
I wish we had a lot more money.
My friends often come to me for advice.
I am never influenced by advertisements.
www.MyEbookNiche.eCrater.com

Chapter 7 Measurement and Scaling 175
will be one object and a related set of attributes, each with its own set of bipolar adjectives.
In most cases, semantic differential scales use either 5 or 7 scale points.
Means for each attribute can be calculated and mapped on a diagram with the various
attributes listed, creating a “perceptual image profile” of the object. Semantic differential
scales can be used to develop and compare profiles of different companies, brands, or
products. Respondents can also be asked to indicate how an ideal product would rate, and
then researchers can compare ideal and actual products.
To illustrate semantic differential scales, assume the researcher wants to assess the
credibility of Tiger Woods as a spokesperson in advertisements for the Nike brand of per-
sonal grooming products. A credibility construct consisting of three dimensions is used:
(1) expertise; (2) trustworthiness; and (3) attractiveness. Each dimension is measured using
five bipolar scales (see measures of two dimensions in Exhibit 7.10).
Non-bipolar Descriptors A problem encountered in designing semantic differential
scales is the inappropriate narrative expressions of the scale descriptors. In a well-designed
semantic differential scale, the individual scales should be truly bipolar. Sometimes re-
searchers use a negative pole descriptor that is not truly an opposite of the positive descrip-
tor. This creates a scale that is difficult for the respondent to interpret correctly. Consider,
for example, the “expert/not an expert” scale in the “expertise” dimension. While the scale
is dichotomous, the words not an expert do not allow the respondent to interpret any of the
other scale points as being relative magnitudes of that phrase. Other than that one endpoint
which is described as “not an expert,” all the other scale points would have to represent
some intensity of “expertise,” thus creating a skewed scale toward the positive pole.
Researchers must be careful when selecting bipolar descriptors to make sure the words
or phrases are truly extreme bipolar in nature and allow for creating symmetrical scales.
Exhibit 7.10 Example of a Semantic Differential Scale Format for Tiger Woods
as a Credibility Spokesperson3
We would like to know your opinions about the expertise, trustworthiness, and attractiveness you believe Tiger
Woods brings to Nike advertisements. Each dimension below has five factors that may or may not represent your
opinions. For each listed item, please check the space that best expresses your opinion about that item.
Expertise:
Knowledgeable Unknowledgeable
Expert Not an expert
Skilled Unskilled
Qualified Unqualified
Experienced Inexperienced
Trustworthiness:
Reliable Unreliable
Sincere Insincere
Trustworthy Untrustworthy
Dependable Undependable
Honest Dishonest
www.MyEbookNiche.eCrater.com

176 Part 3 Gathering and Collecting Accurate Data
For example, the researcher could use descriptors such as “complete expert” and “complete
novice” to correct the scale descriptor problem described in the previous paragraph.
Exhibit 7.11 shows a semantic differential scale used by Midas Auto Systems to col-
lect attitudinal data on performance. The same scale can be used to collect data on several
competing automobile service providers, and each of the semantic differential profiles can
be displayed together.
Behavioral Intention ScaleOne of the most widely used scale formats in marketing research is the behavioral intention
scale. The objective of this type of scale is to assess the likelihood that people will behave
in some way regarding a product or service. For example, market researchers may measure
purchase intent, attendance intent, shopping intent, or usage intent. In general, behavioral
intention scales have been found to be reasonably good predictors of consumers’ choices of
frequently purchased and durable consumer products.4
Behavioral intention scales are easy to construct. Consumers are asked to make a sub-
jective judgment of their likelihood of buying a product or service, or taking a specified
action. An example of scale descriptors used with a behavioral intention scale is “defi-
nitely will,” “probably will,” “not sure,” “probably will not,” and “definitely will not.”
When designing a behavioral intention scale, a specific time frame should be included in
the instructions to the respondent. Without an expressed time frame, it is likely respondents
will bias their response toward the “definitely would” or “probably would” scale categories.
Behavioral intentions are often a key variable of interest in marketing research stud-
ies. To make scale points more specific, researchers can use descriptors that indicate the
Behavioral intention scale
A special type of rating
scale designed to capture
the likelihood that people
will demonstrate some type
of predictable behavior
intent toward purchasing an
object or service in a future
time frame.
Exhibit 7.11 Example of a Semantic Differential Scale for Midas Auto Systems
From your personal experiences with Midas Auto Systems’ service representatives, please rate the
performance of Midas on the basis of the following listed features. Each feature has its own scale ranging from
“one” (1) to “six” (6). Please circle the response number that best describes how Midas has performed on that
feature. For any feature(s) that you feel is (are) not relevant to your evaluation, please circle the (NA)—Not
applicable—response code.
Cost of repair/maintenance work (NA) Extremely high 6 5 4 3 2 1 Very low, almost free
Appearance of facilities (NA) Very professional 6 5 4 3 2 1 Very unprofessional
Customer satisfaction (NA) Totally dissatisfied 6 5 4 3 2 1 Truly satisfied
Promptness in delivering service (NA) Unacceptably slow 6 5 4 3 2 1 Impressively quick
Quality of service offerings (NA) Truly terrible 6 5 4 3 2 1 Truly exceptional
Understands customer’s needs (NA) Really understands 6 5 4 3 2 1 Doesn’t have a clue
Credibility of Midas (NA) Extremely credible 6 5 4 3 2 1 Extremely unreliable
Midas’s keeping of promises (NA) Very trustworthy 6 5 4 3 2 1 Very deceitful
Midas services assortment (NA) Truly full service 6 5 4 3 2 1 Only basic services
Prices/rates/charges of services (NA) Much too high 6 5 4 3 2 1 Great rates
Service personnel’s competence (NA) Very competent 6 5 4 3 2 1 Totally incompetent
Employee’s personal social skills (NA) Very rude 6 5 4 3 2 1 Very friendly
Midas’s operating hours (NA) Extremely flexible 6 5 4 3 2 1 Extremely limited
Convenience of Midas’s locations (NA) Very easy to get to 6 5 4 3 2 1 Too difficult to get to
www.MyEbookNiche.eCrater.com

Chapter 7 Measurement and Scaling 177
percentage chance they will buy a product, or engage in a behavior of interest. The following
set of scale points could be used: “definitely will (90–100 percent chance)”; “probably will (50–
89 percent chance)”; “probably will not (10–49 percent chance)”; and “definitely will not (less
than 10 percent chance).” Exhibit 7.12 shows what a shopping intention scale might look like.
No matter what kind of scale is used to capture people’s attitudes and behaviors, there
often is no one best or guaranteed approach. While there are established scale measures for
obtaining the components that make up respondents’ attitudes and behavioral intentions,
the data provided from these scale measurements should not be interpreted as being com-
pletely predictive of behavior. Unfortunately, knowledge of an individual’s attitudes may
not predict actual behavior. Intentions are better than attitudes at predicting behavior, but
the strongest predictor of future behavior is past behavior.
Comparative and Noncomparative Rating Scales
A noncomparative rating scale is used when the objective is to have a respondent express
his or her attitudes, behavior, or intentions about a specific object (e.g., person or phe-
nomenon) or its attributes without making reference to another object or its attributes. In
contrast, a comparative rating scale is used when the objective is to have a respondent
express his or her attitudes, feelings, or behaviors about an object or its attributes on the
basis of some other object or its attributes. Exhibit 7.13 gives several examples of graphic
rating scale formats, which are among the most widely used noncomparative scales.
Graphic rating scales use a scaling descriptor format that presents a respondent with a
continuous line as the set of possible responses to a question. For example, the first graphic
rating scale displayed in Exhibit 7.13 is used in situations where the researcher wants to
collect “usage behavior” data about an object. Let’s say Yahoo! wants to determine how
Noncomparative rating
scale A scale format that
requires a judgment without
reference to another object,
person, or concept.
Comparative rating scales
A scale format that requires
a judgment comparing one
object, person, or concept
against another on the
scale.
Exhibit 7.12 Retail Store: Shopping Intention Scale for Casual Clothes
When shopping for casual wear for yourself or someone else, how likely are you to shop at each of the following
types of retail stores? (Please check one response for each store type.)
Definitely Probably Probably Would Definitely Would
Type of Would Shop At Would Shop At Not Shop At Not Shop At
Retail Store (90–100% chance) (50–89% chance) (10–49% chance) (less than 10% chance)
Department stores
(e.g., Macy’s, Dillard’s)
Discount department stores
(e.g., Walmart, Costco, Target)
Clothing specialty shops
(e.g., Wolf Brothers,
Surrey’s George Ltd.)
Casual wear specialty stores
(e.g., The Gap, Banana
Republic, Aca Joe’s)
www.MyEbookNiche.eCrater.com

178 Part 3 Gathering and Collecting Accurate Data
satisfied Internet users are with its search engine without making reference to any other
available search engine alternative such as Google. In using this type of scale, the respon-
dents would simply place an “X” along the graphic line, which is labeled with extreme
narrative descriptors, in this case “Not at all Satisfied” and “Very Satisfied,” together with
numeric descriptors, 0 and 100. The remainder of the line is sectioned into equal-appearing
numeric intervals.
Another popular type of graphic rating scale descriptor design utilizes smiling faces.
The smiling faces are arranged in order and depict a continuous range from “very happy”
to “very sad” without providing narrative descriptors of the two extreme positions. This
visual graphic rating design can be used to collect a variety of attitudinal and emotional
data. It is most popular in collecting data from children. Graphic rating scales can be con-
structed easily and are simple to use.
Turning now to comparative rating scales, Exhibit 7.14 illustrates rank-order and
constant-sums scale formats. A common characteristic of comparative scales is that they
can be used to identify and directly compare similarities and differences between products
or services, brands, or product attributes.
Rank-order scales use a format that enables respondents to compare objects by indi-
cating their order of preference or choice from first to last. Rank-order scales are easy to
use as long as respondents are not asked to rank too many items. Use of rank-order scales
in traditional or computer-assisted telephone interviews may be difficult, but it is possible
as long as the number of items being compared is kept to four or five. When respondents
are asked to rank objects or attributes of objects, problems can occur if the respondent’s
preferred objects or attributes are not listed. Another limitation is that only ordinal data can
be obtained using rank-order scales.
Constant-sum scales ask respondents to allocate a given number of points. The
points are often allocated based on the importance of product features to respondents.
Respondents are asked to determine the value of each separate feature relative to all the
other listed features. The resulting values indicate the relative magnitude of importance
each feature has to the respondent. This scaling format usually requires that the individual
Constant-sum scales
Require the respondent to
allocate a given number of
points, usually 100, among
each separate attribute or
feature relative to all the
other listed ones.
Graphic rating scales A
scale measure that uses
a scale point format that
presents the respondent
with some type of graphic
continuum as the set of
possible raw responses to
a given question.
Exhibit 7.13 Examples of Graphic Rating Scales
Use All the Time
1009080706050403020100
Graphic Rating Scales
1. Usage (Quantity) Descriptors:
Never Use
2. Smiling Face Descriptors:
1 2 3 4 5 6 7
Rank-order scales These
allow respondents to
compare their own responses
by indicating their first,
second, third, and fourth
preferences, and so forth.
www.MyEbookNiche.eCrater.com

Chapter 7 Measurement and Scaling 179
values must add up to 100. Consider, for example, the constant-sum scale displayed in
Exhibit 7.14. Bank of America could use this type of scale to identify which banking
attributes are more important to customers in influencing their decision of where to bank.
More than five to seven attributes should not be used to allocate points because of the dif-
ficulty in adding to reach 100 points.
Exhibit 7.14 Examples of Comparative Rating Scales
Rank-Order Scale
Thinking about the different types of music, please rank your top three preferences of types of music you enjoy
listening to by writing in your first choice, second choice, and third choice on the lines provided below.
First Preference:
Second Preference:
Third Preference:
Constant-Sum Scale
Below is a list of seven banking features Allocate 100 points among the features. Your allocation should represent
the importance each feature has to you in selecting your bank. The more points you assign to a feature, the more
importance that feature has in your selection process. If the feature is “not at all important” in your process, you
should not assign it any points. When you have finished, double-check to make sure your total adds to 100.
Banking Features Number of Points
Convenience/location
Banking hours
Good service charges
The interest rates on loans
The bank’s reputation
The interest rates on savings
Bank’s promotional advertising
100 points
Paired-Comparison Scales
Below are several pairs of traits associated with salespeople’s on-the-job activities. For each pair, please circle
either the “a” or “b” next to the trait you believe is more important for a salesperson to be successful in their job.
a. trust b. competence
a. communication skills b. trust
a. trust b. personal social skills
a. communication skills b. competence
a. competence b. personal social skills
a. personal social skills b. communication skills
Note: Researchers randomly list the order of these paired comparisons to avoid possible order bias.
www.MyEbookNiche.eCrater.com

180 Part 3 Gathering and Collecting Accurate Data
Other Scale Measurement Issues
Attention to scale measurement issues will increase the usefulness of research
results. Several additional design issues related to scale measurement are reviewed
below.
Single-Item and Multiple-Item ScalesA single-item scale involves collecting data about only one attribute of the object or
construct being investigated. One example of a single-item scale would be age. The
respondent is asked a single question about his or her age and supplies only one possible
response to the question. In contrast, many marketing research projects that involve col-
lecting attitudinal, emotional, and behavioral data use some type of multiple-item scale. A
multiple-item scale is one that includes several statements relating to the object or con-
struct being examined. Each statement has a rating scale attached to it, and the researcher
often will sum the ratings on the individual statements to obtain a summated or overall
rating for the object or construct.
The decision to use a single-item versus a multiple-item scale is made when
the construct is being developed. Two factors play a significant role in the process:
(1) the number of dimensions of the construct and (2) the reliability and validity. First,
the researcher must assess the various factors or dimensions that make up the construct
under investigation. For example, studies of service quality often measure five dimen-
sions: (1) empathy; (2) reliability; (3) responsiveness; (4) assurance; and (5) tangibles. If
a construct has several different, unique dimensions, the researcher must measure each of
those subcomponents. Second, researchers must consider reliability and validity. In gen-
eral, multiple-item scales are more reliable and more valid. Thus, multiple-item scales
generally are preferred over single item scales. Researchers are reminded that internal
consistency reliability values for single-item or two-item scales cannot be accurately
determined and should not be reported as representing the scale’s internal consistency.
Furthermore, when determining the internal consistency reliability of a multi-item scale,
any negatively worded items (questions) must be reverse coded prior to calculating the
reliability of the construct.
Clear WordingWhen phrasing the question setup element of the scale, use clear wording and avoid
ambiguity. Also avoid using “leading” words or phrases in any scale measurement’s
question. Regardless of the data collection method (personal, telephone, computer-
assisted interviews, or online surveys), all necessary instructions for both respondent
and interviewer are part of the scale measurement’s setup. All instructions should be
kept simple and clear. When determining the appropriate set of scale point descrip-
tors, make sure the descriptors are relevant to the type of data being sought. Scale
descriptors should have adequate discriminatory power, be mutually exclusive, and
make sense to the respondent. Use only scale descriptors and formats that have been
pretested and evaluated for scale reliability and validity. Exhibit 7.15 provides a sum-
mary checklist for evaluating the appropriateness of scale designs. The guidelines are
also useful in developing and evaluating questions to be used on questionnaires, which
are covered in Chapter 8.
Single-item scale A scale
format that collects data
about only one attribute of
an object or construct.
Multiple-item scale A scale
format that simultaneously
collects data on several
attributes of an object or
construct.
www.MyEbookNiche.eCrater.com

Chapter 7 Measurement and Scaling 181
Exhibit 7.15 Guidelines for Evaluating the Adequacy of Scale and Question Designs
1. Scale questions/setups should be simple and straightforward.
2. Scale questions/setups should be expressed clearly.
3. Scale questions/setups should avoid qualifying phrases or extraneous references, unless they are
being used to screen out specific types of respondents.
4. The scale's question/setup, attribute statements, and data response categories should use singular (or
one-dimensional) phrasing, except when there is a need for a multiple-response scale question/setup.
5. Response categories (scale points) should be mutually exclusive.
6. Scale questions/setups and response categories should be meaningful to the respondent.
7. Scale questions/scale measurement formats should avoid arrangement of response categories that
might bias the respondent's answer.
8. Scale questions/setups should avoid undue stress on particular words.
9. Scale questions/setups should avoid double negatives.
10. Scale questions/scale measurements should avoid technical or sophisticated language.
11. Scale questions/setup should be phrased in a realistic setting.
12. Scale questions/setups and scale measurements should be logical.
13. Scale questions/setups and scale measurements should not have double-barreled items.
Misleading Scaling Formats
A double-barreled question includes two or more different attributes or issues in the
same question, but responses allow respondent to comment on only a single issue. The fol-
lowing examples illustrate some of the pitfalls to avoid when designing questions and scale
measurements. Possible corrective solutions are also included.
Example:
How happy or unhappy are you with your current phone company’s rates and customer
service? (Please check only one response)
Very
Unhappy Unhappy
Somewhat
Unhappy
Somewhat
Happy Happy
Very
Happy
Not
Sure
[ ] [ ] [ ] [ ] [ ] [ ] [ ]
Possible Solution:
In your questionnaire, include more than a single question—one for each attribute, or topic.
How happy or unhappy are you with your current phone company’s rates? (Please check
only one response)
Very
Unhappy Unhappy
Somewhat
Unhappy
Somewhat
Happy Happy
Very
Happy
Not
Sure
[ ] [ ] [ ] [ ] [ ] [ ] [ ]
www.MyEbookNiche.eCrater.com

182 Part 3 Gathering and Collecting Accurate Data
How happy or unhappy are you with your current phone company’s customer service?
(Please check only one response)
Very
Unhappy Unhappy
Somewhat
Unhappy
Somewhat
Happy Happy
Very
Happy
Not
Sure
[ ] [ ] [ ] [ ] [ ] [ ] [ ]
A leading question introduces bias and often influences the way a respondent answers
a question. The question below likely influences some respondents to check the Agree
option because it indicates what “Experts” think.
Example:
Retail experts believe that all consumers should comparison shop. Do you agree?
[ ] Agree [ ] Neutral [ ] Disagree
Possible Solution:
To what extent do you agree or disagree that all consumers should comparison shop.
Definitely
Disagree
Disagree
Somewhat
Disagree
Neither/Nor
Somewhat
Agree
Agree
Definitely
Agree
[ ] [ ] [ ] [ ] [ ] [ ] [ ]
A loaded question is a situation where the question/setup suggests a socially desirable
answer or involves an emotionally charged issue.
Example:
Should Americans buy imported automobiles that take away American jobs?
[ ] Definitely Should Not [ ] Should Not [ ] Should [ ] Definitely Should [ ] Not Sure
Possible Solution:
Please circle the number that best expresses your feelings of what Americans should do
when shopping for a car.
Avoid Imports 1 2 3 4 5 6 7 Buy Imports
Ambiguous questions involve a situation in which possible responses can be inter-
preted a number of different ways. When this is present, it typically creates confusion
among respondents about how to respond. The below example is confusing because the
terms, such as occasionally or sometimes, are not defined, and could easily differ for dif-
ferent respondents.
Example:
In the past month, how often did you shop in department stores? (Please check only one
response category.)
[ ] Never [ ] Occasionally [ ] Sometimes [ ] Often [ ] Regularly [ ] Do Not Know
Possible Solution:
In the past month, how often did you shop in department stores? (Please check only one
response category.)
[ ] Never [ ] 1–2 Times [ ] 3–5 Times [ ] 6–10 Times [ ] More Than 10 Times
www.MyEbookNiche.eCrater.com

Chapter 7 Measurement and Scaling 183
Complex questions are situations in which the question is worded in a way the respon-
dent is not sure how they are supposed to respond. In the example below, it is unclear what
is meant by the word “adequate.”
Example:
Do you think that soft drink distribution is adequate? (Please check one response.)
Definitely
Disagree
Disagree
Somewhat
Disagree
Neither/Nor
Somewhat
Agree
Agree
Definitely
Agree
[ ] [ ] [ ] [ ] [ ] [ ] [ ]
Possible Solution:
To what extent do you agree or disagree that soft drinks are easy to find whenever you
want to buy one?
Definitely
Disagree
Disagree
Somewhat
Disagree
Neither/Nor
Somewhat
Agree
Agree
Definitely
Agree
[ ] [ ] [ ] [ ] [ ] [ ] [ ]
A double negative question involves a situation where the question/setup contains
two negative thoughts in the same question. Double negative expressions in a question
create cognitive confusion and respondents find it difficult to understand the question and
therefore respond correctly.
Example:
To what extent do you agree that you are not incompetent when part of a multidisciplinary team?
Definitely
Disagree
Disagree
Somewhat
Disagree
Neutral
Somewhat
Agree
Agree
Definitely
Agree
[ ] [ ] [ ] [ ] [ ] [ ] [ ]
Possible Solution:
To what extent do you agree or disagree that you are competent when part of a multidisci-
plinary team?
Definitely
Disagree
Disagree
Somewhat
Disagree
Neutral
Somewhat
Agree
Agree
Definitely
Agree
[ ] [ ] [ ] [ ] [ ] [ ] [ ]
Scale responses should be mutually exclusive and not overlap. Using response
choices that overlap with other response choices creates confusion in the respondent’s
choice. In the below example, the same numbers (ages) are shown in more than a single
category.
Example:
Please check the one category that best represents your current age.
[ ] 0–10 years [ ] 10–20 years [ ] 20–30 years [ ] 30–40 years [ ] 40–50 years [ ] 50 or more years
Possible Solution:
Please check the category that best represents your current age.
[ ] under 10 years [ ] 10–20 years [ ] 21–30 years [ ] 31–40 years [ ] 41–50 years [ ] over 50 years
www.MyEbookNiche.eCrater.com

184 Part 3 Gathering and Collecting Accurate Data
MARKETING RESEARCH IN ACTIONWhat Can You Learn from a Customer Loyalty Index?
The idea that loyal customers are especially valuable is not new. Loyal customers repeat-
edly purchase products or services. They recommend a company to others. And they stick
with a business over time. Loyal customers are worth the special effort it may take to keep
them. But how can you provide that special treatment if you don’t know your customers
and how their loyalty is won and lost?
To better understand the concept of customer loyalty, we can first define what cus-
tomer loyalty is not. Customer loyalty is not customer satisfaction. Satisfaction is a neces-
sary component of loyal or secure customers. However, just because customers are satisfied
with your company does not mean they will continue to do business with you in the future.
Customer loyalty is not a response to trial offers or incentives. Customers who
respond to a special offer or incentive may be just as quick to respond to your competitors’
incentives.
Customer loyalty is not high market share. Many businesses mistakenly look at their
sales numbers and market share and think, “We wouldn’t be enjoying high levels of market
share if our customers didn’t love us.” However, this may not be true. Many other factors
can drive up market share, including poor performance by competitors or pricing issues.
Customer loyalty is not repeat buying or habitual buying. Many repeat customers may
be choosing your products or services because of convenience or habit. However, if they
learn about a competitive product that they think may be less expensive or of better quality,
they may quickly switch to that product.
So what does customer loyalty mean? Customer loyalty is a composite of a number
of qualities. It is driven by customer satisfaction, yet it also involves a commitment on
the part of the customer to make a sustained investment in an ongoing relationship with a
brand or company. Finally, customer loyalty is reflected by a combination of attitudes and
behaviors. These attitudes include,
∙ The intention to buy again and/or buy additional products or services from the same
company.
∙ A willingness to recommend the company to others.
∙ A commitment to the company demonstrated by a resistance to switching to a
competitor.
Customer behaviors that reflect loyalty include,
∙ Repeat purchasing of products or services.
∙ Purchasing more and different products or services from the same company.
∙ Recommending the company to others.
Burke, Inc. (burke.com) developed a Secure Customer Index® (SCI®) using the
combined scores on three components of customer loyalty (Exhibit 7.16).5 They ask, for
example, “Overall, how satisfied were you with your visit to this restaurant?” To examine
their likelihood to recommend, “How likely would you be to recommend this restaurant
to a friend or associate?” And finally, to examine likelihood of repeat purchases, they ask,
“How likely are you to choose to visit this restaurant again?”
www.MyEbookNiche.eCrater.com

Chapter 7 Measurement and Scaling 185
With these three components and the appropriate scales for each, “secure customers”
are defined as those giving the most positive responses across all three components. All
other customers would be considered vulnerable or at risk of defecting to a competitor.
Companies are increasingly able to link customer satisfaction and customer loyalty
to bottom-line benefits. By examining customer behaviors over time and comparing them
to SCI® scores, a strong connection can be shown between secure customers and repeat
purchasing of products or services. In comparing cases across customer and industry types,
Burke, Inc. has found other illustrations that show a connection between the index scores
and financial or market performance.
Using a customer loyalty index helps companies better understand their customers. By
listening to customers, implementing change, and continuously monitoring the results, com-
panies can focus their improvement efforts with the goal of winning and keeping customers.
Hands-On ExerciseUsing the material from the chapter and the preceding information, answer each of the fol-
lowing questions:
1. In your judgment, what level of scale design would be the most appropriate in creat-
ing the necessary scale measurements for collecting primary data on each construct?
2. For each construct, design an example of the actual scale measurement that could be
used by Burke, Inc. to collect the data.
% Very
Satisfied
% Definitely
Would
Recommend
Secure Customers
% Definitely
Would
Continue
Source: From Burke, Inc. and Amanda Prus and D. Randall Brandt, “Understanding Your Customers – What You Can
Learn from a Customer Loyalty Index,” Marketing Tools (July/August 1995), pp. 10–14.
Exhibit 7.16 The Secure Customer Index® (i.e., Customer Loyalty Index)
www.MyEbookNiche.eCrater.com

186 Part 3 Gathering and Collecting Accurate Data
3. What are several weaknesses associated with how Burke, Inc. measured its Secure
Customer Index® (SCI®)? Make sure you clearly identify each weakness and explain
why you feel it is a weakness.
4. If you were the lead researcher, what types of scale measurement would you have used
to collect the needed data for calculating SCI®? Why? Write some scale measurements
you would use.
5. Do you agree or disagree with the Burke, Inc. interpretation of the value they provide
their clients using the Customer Loyalty Index? Support your response.
Source: www.burke.com. Reprinted by permission
Summary
Understand the role of measurement in marketing
research.
Measurement is the process of developing methods to
systematically characterize or quantify information about
persons, events, ideas, or objects of interest. As part of
the measurement process, researchers assign either num-
bers or labels to phenomena they measure. The measure-
ment process consists of two tasks: construct selection/
development and scale measurement. A construct is an
unobservable concept that is measured indirectly by a
group of related variables. Thus, constructs are made up
of a combination of several related indicator variables
that together define the concept being measured. Con-
struct development is the process in which researchers
identify characteristics that define the concept being
studied by the researcher.
When developing constructs, researchers must con-
sider the abstractness of the construct and its dimen-
sionality, as well as reliability and validity. Once the
characteristics are identified, the researcher must then
develop a method of indirectly measuring the concept.
Scale measurement is the process of assigning a set of
descriptors to represent the range of possible responses a
person may give in answering a question about a particu-
lar object or construct.
Explain the four basic levels of scales.
The four basic levels of scales are nominal, ordi-
nal, interval, and ratio. Nominal scales are the most
basic and provide the least amount of data. They
assign labels to objects and respondents but do not
show relative magnitudes between them. Nominal
scales ask respondents about their religious affilia-
tion, gender, type of dwelling, occupation, last brand
of cereal purchased, and so on. To analyze nominal
data researchers use modes and frequency distribu-
tions. Ordinal scales require respondents to express
relative magnitude about a topic. Ordinal scales
enable researchers to create a hierarchical pattern
among the responses (or scale points) that indicate
“greater than/less than” relationships. Data derived
from ordinal scale measurements include medians and
ranges as well as modes and frequency distributions.
An example of an ordinal scale would be “complete
knowledge,” “good knowledge,” “basic knowledge,”
“little knowledge,” and “no knowledge.” Ordinal scales
determine relative position, but they cannot determine
how much more or how much less since they do not
measure absolute differences. Interval scales enable
researchers to show absolute differences between scale
points. With interval data, means and standard devia-
tions can be calculated, as well as the mode, median,
frequency distribution and range. Ratio scales enable
researchers to identify absolute differences between
each scale point and to make absolute comparisons
between the respondents’ responses. Ratio questions
are designed to allow “true natural zero” or “true state
of nothing” responses. Ratio scales also can develop
means, standard deviations and other measures of cen-
tral tendency and variation.
Describe scale development and its importance in
gathering primary data.
There are three important components to scale mea-
surement: (1) question/setup; (2) dimensions of the
object, construct, or behavior; and (3) the scale point
descriptors. Some of the criteria for scale devel-
opment are the intelligibility of the questions, the
www.MyEbookNiche.eCrater.com

Chapter 7 Measurement and Scaling 187
appropriateness of the primary descriptors, and the
discriminatory power of the scale descriptors. Likert
scales use agree/disagree scale descriptors to obtain
a person’s attitude toward a given object or behavior.
Semantic differential scale formats are used to obtain
perceptual image profiles of an object or behavior.
This scale format is unique in that it uses a set of bipo-
lar scales to measure several different attributes of a
given object or behavior. Behavioral intention scales
measure the likelihood that people will purchase an
object or service, or visit a store. Scale point descrip-
tors such as “definitely would,” “probably would,”
“probably would not,” and “definitely would not” are
often used with intentions scales.
Discuss comparative and noncomparative scales.
Comparative scales require the respondent to make a
direct comparison between two products or services,
whereas noncomparative scales rate products or services
independently. Data from comparative scales is inter-
preted in relative terms. Both types of scales are generally
considered interval or ratio and more advanced statistical
procedures can be used with them. One benefit of com-
parative scales is they enable researchers to identify small
differences between attributes, constructs, or objects. In
addition, comparative scales require fewer theoretical
assumptions and are easier for respondents to understand
and respond to than are many noncomparative scales.
Key Terms and Concepts
Behavioral intention scale 176
Comparative rating scale 177
Constant-sum scales 178
Construct 161
Construct development 162
Discriminatory power 170
Graphic rating scales 178
Interval scale 165
Likert scale 173
Measurement 160
Multiple-item scale 180
Nominal scale 164
Noncomparative rating scale 177
Ordinal scale 164
Rank-order scales 178
Ratio scale 166
Scale measurement 163
Scale points 163
Semantic differential scale 174
Single-item scale 180
Review Questions
1. What is measurement?
2. Among the four basic levels of scales, which one pro-
vides the researcher with the most information?
3. Explain the main differences between interval and ra-
tio scale measurements.
4. What are the major differences between ordinal and
interval scales? In your response include an example
of each type of scale.
5. Explain the major differences between “rating” and
“ranking” scales. Which is a better scale measurement
technique for collecting attitudinal data on sales force
performance of people who sell commercial laser
printers? Why?
6. What are the benefits and limitations of comparative
scale measurements? Design a ranking order scale
that will enable you to determine brand preference
between Bud Light, Miller Lite, Coors Light, and Old
Milwaukee Light beers.
www.MyEbookNiche.eCrater.com

188 Part 3 Gathering and Collecting Accurate Data
Discussion Questions
1. Develop a semantic differential scale that can identify
the perceptual profile differences between Outback
Steakhouse and Longhorn Steakhouse restaurants.
2. Design a behavioral intention scale that can answer
the following research question: To what extent are
college students likely to purchase a new automo-
bile within six months after graduating? Discuss the
potential shortcomings of your scale design.
3. For each of the scales shown below (A, B, and C),
answer the following questions:
a. What type of data is being collected?
b. What level of scale measurement is being used?
c. What is the most appropriate measure of central
tendency?
d. What is the most appropriate measure of
dispersion?
e. What weakness, if any, exists with the scale?
A. How do you pay for your travel expenses?
Cash Company charge
Check Personal charge
Credit card Other
B. How often do you travel for business or pleasure
purposes?
For Business For Pleasure
0–1 times per month 0–1 times per year
2–3 times per month 2–3 times per year
4–5 times per month 4–5 times per year
6 or more times 6 or more times
per year per month
C. Check the one category that best approximates your
total family annual income, before taxes. (Check only
one category.)
4. For each of the listed concepts or objects, design a
scale measurement that would enable you to collect
data on that concept or object.
a. An excellent long-distance runner
b. A person’s favorite Mexican restaurant
c. Size of the listening audience for a popular coun-
try and western radio station
d. Consumers’ attitudes toward the Colorado Rock-
ies professional baseball team
e. The satisfaction a person has toward his or her
automobile
f. Purchase intentions for a new tennis racket
5. Identify and discuss the key issues a researcher
should consider when choosing a scale for capturing
consumers’ expressions of satisfaction.
6. AT&T is interested in capturing the judgments
people make of its new wireless cell phone ser-
vices. Determine and justify what service attri-
butes should be used to capture the performance
of its wireless cell phone service. Design two scale
measurements that would allow AT&T to accu-
rately collect the data.
7. The local Ford dealership is interested in collect-
ing data to answer the following research question:
How likely are young adults to purchase a new au-
tomobile within a year after graduating from col-
lege? Design a nominal, ordinal, interval, and ratio
scale measurement that will enable the dealership
to collect the required data. In your opinion, which
one of your designs would be most useful to the
dealership and why?
Under $10,000 $30,001–$40,000 $60,001–$70,000
$10,000–$20,000 $40,001–$50,000 $70,001–$100,000
$20,001–$30,000 $50,001–$60,000 Over $100,000
www.MyEbookNiche.eCrater.com

This page intentionally left blank
www.MyEbookNiche.eCrater.com

Designing the Questionnaire
C h a p t e r 8
www.MyEbookNiche.eCrater.com

Learning Objectives After reading this chapter, you will be able to:
1. Describe the steps in questionnaire design.
2. Discuss the questionnaire development process.
3. Summarize the characteristics of good questionnaires.
4. Understand the role of cover letters.
5. Explain the importance of other documents used with questionnaires.
Can Surveys Be Used to Develop University Residence Life Plans?
University administrators implemented a “Residence Life” program to identify
factors likely to enrich the academic and social experiences of on-campus stu-
dents. The main goals were to ensure the university offered high-quality on-cam-
pus living experiences with facilities and programs for attracting new students to
the university, increasing on-campus housing occupancy rates, and improving re-
tention levels of students, thus increasing the likelihood that students would renew
their on-campus housing contracts for multiple years. MPC Consulting Group,
Inc., a national firm specializing in on-campus housing programs, was retained to
oversee the project. The firm had an excellent reputation but seldom conducted
primary marketing research.
After clarifying the objectives of the project, MPC determined that a self-
administered survey instrument would be used to obtain students’ information,
attitudes, and feelings regarding on-campus living experiences. The survey
would be administered using the university’s newly acquired “Blackboard” elec-
tronic learning management system. The rationale for using this method was that
all 43,000 students had access and it would save time and costs. MPC’s con-
sulting team brainstormed a list of 59 questions to be asked of both on-campus
and off-campus students currently enrolled at the university. The questionnaire
began by asking about personal demographic characteristics followed by some
questions concerning students’ current housing situations and an evaluation of
those conditions. Next, questions were asked about the importance of a list of
preselected housing characteristics, then questions about students’ intentions of
living on-campus versus off-campus and reasons for those intentions. After ask-
ing about marital status and children, questions were asked on the desirability
of types of housing structures and amenities. The survey ended with personal
thoughts about the need for child care services.
When placed on “Blackboard” for access, the questionnaire took 24 screens
with six different “screener” questions requiring respondents to skip back and
forth between computer screens depending on how they responded to the
www.MyEbookNiche.eCrater.com

screening questions. After being in the field three weeks, only 17 students had
responded, and eight of those surveys were incomplete. University officials were dis-
appointed in the response rate and asked MPC three simple but critical questions:
(1) “Why such a low response rate?” (2) “Was the survey a good or bad instrument
for capturing the needed information?” and (3) “What was the value of the data for
addressing the given goals?”
Based on your knowledge and understanding of research practices to this point, answer
the three questions. What are the potential problems (weaknesses) created by MPC’s pro-
cess described earlier?
192 Part 3 Gathering and Collecting Accurate Data
Value of Questionnaires in Marketing Research
This chapter focuses on the importance of questionnaire design and the process that should
be undertaken in the development of data collection instruments. Understanding question-
naire design will require integration of many of the concepts discussed in earlier chapters.
Most surveys are designed to be descriptive or predictive. Descriptive research designs
use questionnaires to collect data that can be turned into knowledge about a person, object,
or issue. For example, the U.S. Census Bureau uses descriptive survey questionnaires to
collect attributes and behavioral data that can be translated into facts about the U.S. popu-
lation (e.g., income levels, marital status, age, occupation, family size, usage rates, con-
sumption quantities). In contrast, predictive survey questionnaires require the researcher
to collect a wider range of data that can be used in predicting changes in attitudes and
behaviors as well as in testing hypotheses.
You may never actually design a questionnaire. But you likely will be in the position
of determining whether a survey is good or bad. Thus, you should know the activities
and principles involved in designing survey questionnaires. A questionnaire is a docu-
ment consisting of a set of questions and scales designed to gather primary data. Good
questionnaires enable researchers to collect reliable and valid information. Advances
in communication systems, the Internet, and software have influenced how questions
are asked and recorded. Yet the principles followed in designing questionnaires remain
essentially unchanged. Whether developing a survey to use online or offline, the steps
researchers follow in designing questionnaires are similar.
Pilot Studies and Pretests
Prior to discussing the development and execution of questionnaires (or surveys) used in
marketing research practices, it is useful to understand the distinctions and similarities of a
pilot study (also referred to as pilot test) and a pretest. Depending on the reference source,
some scholars, books, journal articles, and conference proceedings use these two terms “pilot
study” and “pretest” interchangeably referring to the same meaning, that is, a smaller scale
study before the actual study. Several characteristics make a pilot study different beginning
with its focus. A pilot study is a small-scale version of the intended main research study,
including all the subcomponents that make up the main study, including the data collection
and analysis from about 50 to 100 respondents that have representation of the main study’s
defined target population. A pilot study normally serves a guide for conducting a larger main
study. In some situations, a pilot study is employed for examining specific subcomponents of
Questionnaire A formal
framework consisting of a
set of questions and scales
designed to generate pri-
mary raw data.
www.MyEbookNiche.eCrater.com

Chapter 8 Designing the Questionnaire 193
the overall research plan to see if the selected procedures work as expected or if refinements
are needed prior to conducting the main study. For example, a pilot study among 50 to 100
representative respondents is used to obtain data for refining scale measurements and gain
preliminary insights about construct reliability and validity assessments, finetuning research
objectives and questions as well as data collection procedures, reducing the risk that the
main study will be fatally flawed. While pilot studies can be included in any form of research
(i.e., exploratory, descriptive, or causal research designs), they are most often associated with
empirical descriptive or predictive quantitative research studies. In contrast, a pretest is a
descriptive research activity representing a small-scale investigation of 5 to 30 subjects that
are representative of the main study’s defined target population but focus on a specific sub-
component of the main study. The results of a pretest are only preliminary and intended only
to assist researchers in designing or executing a particular subcomponent of a larger study (or
experiment). While researchers do conduct pretests in the development of a pilot study, pre-
tests are more associated with exploratory and causal experimental research designs. As we
begin discussions of the development and execution of questionnaires in marketing research,
more insights concerning how and when researchers use pretests will be acknowledged.
Questionnaire Design
Researchers follow a systematic approach to designing questionnaires. Exhibit 8.1 lists the
steps followed in developing survey questionnaires. Discussion of the steps is based on a
study conducted for American Bank in Baton Rouge, the capital city of Louisiana. The
bank would like to expand regionally. To improve decision making, information is needed
on banking habits and patterns, satisfaction and commitment, as well as demographic and
lifestyle characteristics of current and potential customers.
Step 1: Confirm Research ObjectivesIn the initial phase of the development process, the research objectives are agreed upon by
the researcher and bank management. The research objectives are listed below:
1. To collect data on selected demographic characteristics that can be used to create a
profile of current American Bank customers as well as potential future customers.
2. To collect data on selected lifestyle dimensions that can be used to better understand cur-
rent American Bank customers and their banking habits and those of potential customers.
Exhibit 8.1 Steps in Questionnaire Design
Step 1: Confirm research objectives
Step 2: Select appropriate data collection method
Step 3: Develop questions and scaling
Step 4: Determine layout and evaluate questionnaire
Step 5: Obtain initial client approval
Step 6: Pretest, revise, and finalize questionnaire
Step 7: Implement the survey
www.MyEbookNiche.eCrater.com

194 Part 3 Gathering and Collecting Accurate Data
3. To identify preferred banking services, as well as attitudes and feelings toward those
services.
4. To identify demographic and lifestyle characteristics of market segments as well as
satisfaction with and commitment to current primary banking relationships.
Step 2: Select Appropriate Data Collection MethodTo select the data collection method, the researcher first must determine the data require-
ments to achieve each of the objectives as well as the type of respondent demographic
information desired. In doing so, the researcher should follow a general-to-specific order.
The data requirements and flow for the American Bank study are described below:
Section I: Banking Services
1. The bank most often patronized by customers; that is, the primary banking relationship.
2. Bank characteristics perceived as important in selecting a bank (convenience and location,
banking hours, good service charges, interest rates on savings accounts, knowing an
employee of the bank, bank’s reputation, bank’s promotional advertisements, interest
rates on loans, and Internet banking services).
3. Personal savings accounts held by household members at various types of financial
institutions.
4. Preferences for and usage of selected banking methods (inside the bank, drive-up
window, 24-hour ATM, electronic banking, bank by mail, bank by phone).
Section II: Lifestyle Dimensions This section includes belief statements to classify bank
customer’s lifestyles in terms of segments such as financial optimist, financially dissatisfied,
information exchanger, credit or debit card user, family oriented, price conscious, and so forth.
Section III: Banking Relationships This section includes questions to examine satisfac-
tion and commitment to current primary banking relationship.
Section IV: Demographic Characteristics This section includes characteristics such as
gender, length of time in area and at current residence, employment status, marital status,
spouse or partner’s current employment status, number of dependent children, education,
age, occupation, income, and zip code.
The researcher considered several approaches to data collection, including random
telephone calls and online surveys. On the basis of the research objectives, information
requirements, and the desire for a random sample of current bank customers, bank man-
agement and the researcher decided that an initial phone contact followed by a direct mail
survey would be the best method of collecting data for current customers along with a
telephone survey for potential customers.
Step 3: Develop Questions and ScalingQuestionnaire design is systematic and includes a series of logical activities. Research-
ers select the appropriate scales and design the questionnaire format to meet the data
requirements. The researcher decides on question format (unstructured or structured),
wording of questions, scales, and instructions for responding to questions and scales, and
type of data required (nominal, ordinal, interval, or ratio). In making these decisions,
researchers must consider how the data are to be collected. For example, appropriate
www.MyEbookNiche.eCrater.com

Chapter 8 Designing the Questionnaire 195
questions and scaling often differ between online, mail, and telephone surveys. Con-
structs and scaling were discussed in a previous chapter. We discuss the other topics in
the following sections:
Question Format Unstructured questions are open-ended questions that enable respon-
dents to reply in their own words. There is no predetermined list of responses available to
aid or limit respondents’ answers. Open-ended questions are more difficult to code for
analysis. Perhaps more importantly, these questions require more thinking and effort on the
part of respondents. As a result, with quantitative surveys there are generally only a few
open-ended questions. Unless the question is likely to be interesting to respondents, open-
ended questions are often skipped.
Structured questions are closed-ended questions that require the respondent to
choose from a predetermined set of responses or scale points. Structured formats reduce
the amount of thinking and effort required by respondents, and the response process is
faster. In quantitative surveys, structured questions are used much more often than unstruc-
tured ones. They are easier for respondents to fill out and easier for researchers to code.
Examples of structured questions are shown in Exhibit 8.2.
Wording Researchers must carefully consider the words used in creating questions and
scales. Ambiguous words and phrases as well as vocabulary that is difficult to under-
stand must be avoided. For example, asking a question such as “How frequently do you
eat Domino’s Pizza?” and using a 7-point “Very Frequently” to “Very Infrequently”
scale would likely result in inaccurate answers. What is very frequent for one person is
likely to be different for another person. Similarly, words easily understood by the re-
searcher may not be familiar to respondents. For example, questionnaires often ask for
the respondent’s ethnic origin and list one alternative as Caucasian. But many individu-
als do not know that Caucasian means white. Researchers must select words carefully to
make sure respondents are familiar with them, and when unsure, questionable words
should be examined in a pretest.
Words and phrases can influence a respondent’s answer to a given question. For exam-
ple, small changes in wording can produce quite different answers to questions. The fol-
lowing illustrates this point:
1. Do you think anything could be done to make it more convenient for students to regis-
ter for classes at your university or college?
2. Do you think anything should be done to make it more convenient for students to reg-
ister for classes at your university or college?
3. Do you think anything will be done to make it more convenient for students to register
for classes at your university or college?
Some question topics are considered sensitive and must be structured carefully to
increase response rates. Examples of sensitive questions include income, sexual beliefs
or behaviors, medical conditions, financial difficulties, alcohol consumption, and so forth.
These types of behaviors are often engaged in but may be considered socially unaccept-
able. As an example, consider the question below:
Have you ever consumed five or more drinks in one sitting? For the purposes of
this study, a drink is defined as a bottle of beer, a glass of wine, a wine cooler, a
shot glass of liquor, a mixed drink, or a similar drink containing alcohol.
_____ Yes _____ No
Unstructured questions
Open-ended questions
formatted to allow
respondents to reply in
their own words.
Structured questions
Closed-ended questions
that require the respondent
to choose from a predeter-
mined set of responses or
scale points.
Sensitive questions
Include income, sexual
beliefs or behaviors,
medical conditions,
financial difficulties, alcohol
consumption, and so forth
that respondents are likely
to respond to incorrectly.
www.MyEbookNiche.eCrater.com

196 Part 3 Gathering and Collecting Accurate Data
Researchers are likely to get a high response rate to this question. But how accurate
will the answers be? How is “one sitting” defined? Moreover, the size of a drink in ounces
is unclear. An even worse approach to asking this question, however, would be to frame it
as shown below.
“Binge drinking” has been defined as consuming five or more drinks in one
sitting. Have you ever consumed alcohol in a manner that meets this definition?
_____ Yes _____ No
Exhibit 8.2 Examples of Structured Questions
Personal Interview
HAND RESPONDENTS THE CARD. Please look at this card and tell me the letters that
indicate what toppings, if any, you typically add to a pizza other than cheese when
ordering a pizza for yourself from Pizza Hut. Interviewer: Record all mentioned toppings
by circling the letters below, and make sure you probe for any other toppings.
[a] anchovies [b] bacon [c] barbecue beef
[d] black olives [e] extra cheese [f] green olives
[g] green peppers [h] ground beef [i] ham
[ j] hot peppers [k] mushrooms [l] onions
[m] pepperoni [n] sausage [o] some other topping:
Telephone Interview (Traditional or Computer-Assisted)
I’m going to read you a list of pizza toppings. As I read each one, please tell me
whether or not that topping is one that you usually add to a pizza when ordering a
pizza for yourself from Pizza Hut. Interviewer: Read each topping category slowly and
record all mentioned toppings by circling their corresponding letter below, and make
sure you probe for any other toppings.
[a] anchovies [b] bacon [c] barbecue beef
[d] black olives [e] extra cheese [f] green olives
[g] green peppers [h] ground beef [i] ham
[ j] hot peppers [k] mushrooms [l] onions
[m] pepperoni [n] sausage [o] some other topping:
Self-Administered Survey (Online or Offline)
Among the pizza toppings listed below, what toppings, if any, do you usually add to a
pizza other than cheese when ordering a pizza for yourself from Pizza Hut? Check as
many boxes as apply.
anchovies bacon barbecue beef
black olives extra cheese green olives
green peppers ground beef ham
hot peppers mushrooms onions
pepperoni sausage some other topping:
www.MyEbookNiche.eCrater.com

Chapter 8 Designing the Questionnaire 197
The earlier definition of binge drinking was developed by the Harvard School of
Public Health, but leading this question with the definition will result in very few people
answering yes—in spite of the fact that many individuals who watch sports programs or
other activities have actually consumed five drinks.
Guidelines for asking sensitive questions start with not asking them unless they are
required to achieve your research objectives. If they are necessary, assure respondents that
their answers will be kept completely confidential. Another guideline is to indicate the behav-
ior is not unusual. For example, if asking about financial problems, before asking your ques-
tions say something like “Many individuals have financial problems” so respondents do not
feel as though they are the only ones with such problems. Another approach is to phrase ques-
tions so they are referring to other people to obtain general as opposed to specific answers. For
example, “Do you think most college students take drugs? Explain your answer.” Responses
about the behavior of others are often a reflection of the respondent’s behavior.
Questions and Scaling Questions and scale format directly impact survey designs. To
collect accurate data, researchers must devise good questions and select the correct type of
scale. Several types of scales were discussed in the previous chapter. Whenever possible,
metric scales should be used. Also, researchers must be careful to maintain consistency in
scales and coding to minimize confusion among respondents in answering questions.
Once a particular question or scale is selected, the researcher must ensure it is intro-
duced properly and easy to respond to accurately. Bad questions prevent or distort com-
munications between the researcher and the respondent. If the respondent cannot answer
a question in a meaningful way, it is a bad question. Some examples of bad questions are
those that are the following:
1. Unanswerable either because the respondent does not have access to the informa-
tion needed or because none of the answer choices apply to the respondent. Examples
would be: “What was your parents’ yearly after-tax income last year?” or “How much
did you spend on food last month?” In general, respondents do not know the answer
to this type of question but will still attempt to answer it. They give an “informed
guess” based on what they think about is right. Some researchers believe that providing
response alternatives is a solution, but that introduces bias, too. When ranges are given,
respondents tend to select an average amount based on the range given, and if the range
is $200 to $500 then the amount selected will be lower than if the range is $400 to
$600. An open-ended question to these types of situations often is the best alternative.
2. Leading (or loaded) in that the respondent is directed to a response that would not
ordinarily be given if all possible response categories or concepts were provided, or
if all the facts were provided for the situation, An example of this would be: “We care
about the customer service you receive from our business. How would you rate the
quality of service you received?” Another example would be asking a question by first
saying, “Most Americans are against raising taxes. Are you in favor of raising taxes?”
3. Double-barreled in that they ask the respondent to address more than one issue at a
time. An example would be: “Do you drink Pepsi with breakfast, lunch, and dinner?”
or “Do you agree or disagree that Home Depot employees are friendly and helpful?”
When designing specific questions and scales, researchers should act as if they are two
different people: one thinking like a technical, systematic researcher and the other like a
respondent. The questions and scales must be presented in a logical order. After selecting a
title for the questionnaire, the researcher includes a brief introductory section and any gen-
eral instructions prior to asking the first question. Questions should be asked in a natural
Bad questions Any
questions that prevent or
distort the fundamental
communication between
the researcher and the
respondents.
www.MyEbookNiche.eCrater.com

198 Part 3 Gathering and Collecting Accurate Data
general-to-specific order to reduce the potential for sequence bias. Also, any sensitive or
more difficult questions should be placed later in the questionnaire after the respondent
becomes engaged in the process of answering questions.
Some questionnaires have skip or branching questions. Skip questions can appear
anywhere within the questionnaire and are used if the next question (or set of questions)
should be responded to only by respondents who meet a previous condition. A simple
expression of a skip command might be: “If you answered ‘yes’ to question 5, skip to
question 9.” Skip questions help ensure that only specifically qualified respondents answer
certain items. When skip questions are used, the instructions must be clearly communi-
cated to respondents or interviewers. If the survey is online, then skip questions are easy to
use and handled automatically.
Respondents should be made aware of the time it will take to complete the question-
naire and of their progress in completing it. This begins in the introductory section when
the respondent is told how long it will take to complete the questionnaire, but it continues
throughout the questionnaire. For online surveys this is easy and most surveys have an icon
or some other indicator of the number of questions remaining or progress toward completion.
Another approach is at the beginning of the demographic section to use a statement similar to
the following: “The survey is almost completed. There are only a few more questions.” This is
a “transition phrase” that serves two purposes. First, it communicates to the respondents that
a change in their thinking process is about to take place. They can clear their minds before
thinking about their personal data. Second, it indicates that the task of completing the survey
is almost over. The questionnaire used in the banking survey is shown in Exhibit 8.3.
Prior to developing the layout for the survey questionnaire, the researcher should
assess the reliability and validity of the scales, such as the statements in Section II: General
Opinions shown in Exhibit 8.3. To ensure high quality data, including reliable and valid
measures, researchers need to use both qualitative and quantitative procedures to assess
validity. In the development stage of understanding what particular aspects make up a
construct, such as “brand image”, a researcher can use a number of qualitative data collec-
tion procedures. For example, a small group of industry brand experts might be asked to
review the researcher’s list of topics and constructs using a non-structured expert interview
procedure, or focus group interviews could be used to obtain the opinions of representative
customers about the questions, topics and scaling. The main objective of using qualita-
tive procedures at this point is to establish that the constructs have face validity. Once the
Skip questions Used if
the next question (or set
of questions) should be
responded to only by
respondents who meet a
previous condition.
On a Saturday morning one spring day, one of the authors
was out working in the yard. A group of young folks got out of
a van and began knocking on doors to solicit participation in
a survey on exercise-related topics. They were students
from a local college doing a class project for a local health
club. The students were pleasant and polite in soliciting par-
ticipation, and upon agreement from participants they began
asking the questions on the survey. About halfway through
the survey, one of the interviewers asked the following:
“When people were asked this question in the past, 90
percent said ‘Yes.’ Do you think belonging to a health club
motivates people to exercise? Yes or no?”
The author refused to answer the question and
proceeded to inform the student interviewers that
the question had not asked if he believed belong-
ing to a health club motivates people to exercise.
In essence they had asked: “How willing are you to
give a response that differs from 90 percent of oth-
ers who have responded to this question in the past?”
The students were shocked, but courteous. The
author then informed them if they would like to learn
how to design valid questionnaires, they should take
his research methods course at the local state
university.
MARKETING RESEARCH DASHBOARD “FRAMING” YOUR QUESTIONS CAN INTRODUCE BIAS!
www.MyEbookNiche.eCrater.com

Chapter 8 Designing the Questionnaire 199
Exhibit 8.3 Consumer Banking Opinion Survey
(continued)
Thank you for participating in this study. Your participation will help us determine what people think about the
products and services offered by banks. The results will provide insights on how to better serve the banking
customers. Your attitudes and opinions are important to this study. All of your answers will be kept strictly confidential.
DIRECTIONS: PLEASE READ EACH QUESTION CAREFULLY. ANSWER THE QUESTION BY FILLING IN THE
APPROPRIATE BOX(ES) THAT REPRESENT YOUR RESPONSES.
SECTION I: GENERAL BANKING HABITS
1. Which one of the following banks is the one you use most often in conducting banking or financial
transactions? Please check only one box.
American Bank Capital Bank Hibernia National Bank
Baton Rouge Bank City National Bank Louisiana National Bank
Some other bank; please specify:
2. How important were each of the following factors to you in selecting the bank mentioned in Q.1 above?
Please check only one response for each factor.
Extremely Somewhat Not at All
Factor Important Important Important Important
Convenient locations
Banking hours
Reasonable service charges
Interest rates on savings
Personally knew someone at the bank
Bank’s reputation
Bank’s promotional advertising
Interest rate on loans
Internet banking services
If there was some other reason (factor) you considered important in selecting your bank mentioned in Q.1, please
specify :
3. At which of the following financial institutions do you or some member of your immediate household have a
personal savings account? Please check as many or as few as necessary.
Both You and Some Other
Financial Institution Some Other Member Member Yourself
A credit union
American Bank
Baton Rouge Bank
City National Bank
Hibernia National Bank
Louisiana National Bank
Another institution (Please specify):
www.MyEbookNiche.eCrater.com

200 Part 3 Gathering and Collecting Accurate Data
Exhibit 8.3 Consumer Banking Opinion Survey, continued
4. We would like to know your feelings about each of the following banking methods. For each banking
method listed, please check the response that best describes your preference for using that method. Please
check only one response for each banking method.
Definitely Somewhat Somewhat Definitely
Banking Methods Like Using Like Using Dislike Using Dislike Using
Inside the bank
Drive-in (Drive-up)
24-hour machine
Bank by phone
Bank by mail
Online banking
5. Now we would like to know to what extent you actually use each of the following banking methods. Please
check only one response for each banking method.
Banking Methods Usually Occasionally Rarely Never
Inside the bank
Drive-in (Drive-up)
24-hour machine
Bank by phone
Bank by mail
Online banking
SECTION II: GENERAL OPINIONS
A list of general statements is included in this section. There are no right or wrong answers to the statements.
We are just interested in your opinions.
6. Next to each statement, please fill in the one response that best expresses the extent to which you agree or
disagree with the statement. Remember, there are no right or wrong answers—we just want your opinions.
Definitely Somewhat Neither Agree Somewhat Definitely
Statements Agree Agree or Disagree Disagree Disagree
I often seek out the advice
of my friends regarding a
lot of different things.
I buy many things with
credit cards.
I wish we had a lot
more money.
Security is most important
to me.
I am definitely influenced
by advertising.
I like to pay cash for
everything I buy.
www.MyEbookNiche.eCrater.com

Chapter 8 Designing the Questionnaire 201
Exhibit 8.3 continued
(continued)
Definitely Somewhat Neither Agree Somewhat Definitely
Statements Agree Agree or Disagree Disagree Disagree
My neighbors or friends often
come to me for advice on
many different matters.
It is good to have charge
accounts.
I will probably have more
money to spend next year
than I have now.
A person can save a lot
of money by shopping
around for bargains.
For most products or
services, I try the ones
that are most popular.
Unexpected situations often
catch me without enough
money in my pocket.
Five years from now,
my income will probably
be much higher than it is now.
SECTION III: BANKING RELATIONSHIPS
Please indicate your view on each of the following questions. Check the box that most closely represents your feelings.
Not Very Highly
Satisfied Satisfied
7. How satisfied are you with the bank you
do most of your business with?
(i.e., your primary banking relationship)
Not Very Highly
Likely Likely
8. How likely are you to continue doing
business with your current primary bank?
9. How likely are you to recommend your
primary bank to a friend?
SECTION IV: CLASSIFICATION DATA
The next few questions ask for your demographic information. We ask these questions so we can properly
generalize survey results to the greater population. Your answers help us to ensure that we have sufficient
diversity among our respondents.
10. What is your sex? Female Male
www.MyEbookNiche.eCrater.com

202 Part 3 Gathering and Collecting Accurate Data
Exhibit 8.3 Consumer Banking Opinion Survey, continued
11. Approximately how long have you lived at your current address?
Less than 1 year 4–6 years 11–20 years
1–3 years 7–10 years Over 20 years
12. What is your current employment status?
Employed full-time Employed part-time Not currently employed
Retired
13. What is your current marital status?
Married Single (never married)
Single (widowed, divorced, or separated)
14. IF MARRIED, please indicate your spouse’s current employment status.
Employed full-time Employed part-time Not currently employed Retired
15. IF YOU HAVE CHILDREN, please indicate the number of children under 18 years of age in your household.
0 1 2 3 4 5 6 7 8 More than 8; please specify:
16. Which one of the following categories best represents your last completed year in school?
Postgraduate studies or advanced degree Completed high school
Graduate studies or degree Some high school
Completed college (4-year degree) Completed grammar school
Some college or technical school Some grammar school
17. What is your current age?
Under 18 26–35 46–55 66–70
18–25 36–45 56–65 Over 70
18. Which one of the following categories best describes the type of work you do?
Government (Federal, State, City) Legal Financial Insurance
Petrochemical Manufacturing Transportation Consulting
Educational Medical Retailing Wholesaling
Some other area, please specify:
19. In which of the following categories does your total annual family income, before taxes, fall?
Under $10,000 $30,001–$50,000
$10,000–$15,000 $50,001–$75,000
$15,001–$20,000 $75,001–$100,000
$20,001–$30,000 Over $100,000
20. What is the five-digit zip code of your residence address?
THANK YOU VERY MUCH FOR PARTICIPATION IN THIS STUDY!
YOUR TIME AND OPINIONS ARE APPRECIATED.
www.MyEbookNiche.eCrater.com

Chapter 8 Designing the Questionnaire 203
researcher develops the measures for the constructs, quantitative data collection procedures
in the form of a pretest or pilot study are needed to quantitatively assess the construct’s reli-
ability and validity. Once this is completed, the focus is on preparing instructions and making
required revisions. Methods for assessing reliability and validity were discussed in Chapter 7.
Step 4: Determine Layout and Evaluate QuestionnaireIn good questionnaire design, questions flow from general to more specific information,
and end with demographic data. Questionnaires begin with an introductory section
that gives the respondent an overview of the research. The section begins with a state-
ment to establish the legitimacy of the questionnaire. For example, the research com-
pany would be identified and the respondent would be assured their responses will be
anonymous. Next, there typically are screening questions. Screening questions (also
referred to as screeners or filter questions) are used on most questionnaires. Their pur-
pose is to identify qualified prospective respondents and prevent unqualified respon-
dents from being included in the study. It is difficult to use screening questions in many
self-administered questionnaires, except for computer-assisted surveys. Screening ques-
tions are completed before the beginning of the main portion of the questionnaire that
includes the research questions. The introductory section also includes general instruc-
tions for filling out the survey.
The second section of the questionnaire focuses on the research questions. This is
called the research questions section, and based on the research objectives the sequence
is arranged from general questions to more specific questions. If the study has multiple
research objectives then questions designed to obtain information on each of the objectives
also should be sequenced from general to specific. One exception to this would be when
two sections of a questionnaire have related questions. In such a situation the researcher
would typically separate the two sections (by inserting a nonrelated set of questions) to
minimize the likelihood that answers to one set of questions might influence the answers
given in a second set of questions. Finally, any difficult or sensitive questions should be
placed toward the end of each section.
The last section includes demographic questions for the respondents. Demographic
questions are placed at the end of a questionnaire because they often ask personal information
and many people are reluctant to provide this information to strangers. Until the “comfort zone”
is established between the interviewer and respondent, asking personal questions could easily
bring the interviewing process to a halt. The questionnaire ends with a thank-you statement.
Questionnaires should be designed to eliminate or at least minimize response order
bias. Response order bias occurs when the order of the questions, or of the closed-end
responses to a particular question, influences the answer given. Answers that appear at the
beginning or the end of a list tend to be selected most often. With numeric alternatives
(prices or quantities) respondents tend to select central values. With online surveys this
is not a problem because the order of presentation can be randomized. It also is less of
a problem with mail surveys because the respondent can see all the possible responses.
Another way to reduce order bias with mail or self-administered surveys is to prepare sev-
eral different forms of the questionnaire using a different order and average the responses.
Phone surveys often present the most opportunities for response order bias to emerge.
Some researchers have recently expressed concerns that questionnaire design might
result in common methods variance (CMV) being embedded in respondent data collected
from surveys. Common methods variance is biased variance that results from the mea-
surement method used in a questionnaire instead of the scales used to obtain the data. CMV
is present in survey responses when the answers given by respondents to the independent
Introductory section Gives
the respondent an
overview of the research.
Screening questions (also
referred to as screeners or
filter questions) Used in most
questionnaires, their purpose
is to identify qualified
prospective respondents
and prevent unqualified
respondents from being
included in the study.
Research questions section
The second section of the
questionnaire that focuses
on the research questions.
Response order bias
Occurs when the order of the
questions, or of the closed-
end responses to a particular
question, influences the
answer given.
Common methods variance
(CMV) A biased variance
that results from the
measurement method used
in a questionnaire.
www.MyEbookNiche.eCrater.com

204 Part 3 Gathering and Collecting Accurate Data
and dependent variable questions are falsely correlated. The bias introduced by CMV is
most likely to occur when the same respondent answers at the same time both independent
and dependent variable questions that are perceptual in nature, and the respondent recog-
nizes a relationship between the two types of variables. An example of a situation in which
CMV might occur is when a respondent is asked to evaluate “How they liked the food” or
“How they liked the restaurant atmosphere” (independent variables and perceptions ques-
tions) in the initial section of a restaurant questionnaire. Then, in a later section of the same
questionnaire, the same respondent is asked “How satisfied were you with your dining
experience at the Santa Fe Grill?” (dependent variable and a perceptions question).
Many researchers believe the prevalence of CMV in surveys is exaggerated. More
recently, research investigating the extent to which CMV bias is caused by using only one
type of scale measure in capturing a respondent’s responses found no empirical evidence of
problematic bias due to CMV. The research indicates that CMV resulting from these types
of variables (e.g., attitudes, emotions, and behaviors) investigated in most marketing stud-
ies would not exist until over half of the variance in data is common across all variables.
Thus, a sufficient level of CMV to cause concern exceeds even high estimates of how
much CMV may exist across studies.1
If a researcher is concerned about the possible presence of CMV, one approach to
reduce the likelihood of CMV being present in data is to collect independent and depen-
dent variable data at different points in time, or from different sources (e.g., investigate the
relationship between the workplace environment and performance by obtaining perceptions
of the work environment from employees and performance evaluations from supervisors).
Unfortunately, this is often not possible in marketing studies. Other approaches to reduce
the possible presence of CMV include using more than one type of scale in the question-
naire (e.g., use both semantic differential and graphic-ratings formats) or using scales with
a different number of scale points. For example, a questionnaire could be designed so that
10-point scales are used to answer the independent variable questions and 100-point scales
are used to answer the dependent variable questions.
An easy to use test for determining the influence of CMV bias is the so-called Harmon
One Factor test.2 This procedure applies exploratory factor analysis as a diagnostic tool for
“Smart” questionnaires are the state-of-the-art in marketing
research surveys. The questionnaires are structured using
mathematical logic that enables the computer to custom-
ize them for each respondent as the interview progresses.
Through the use of interactive software, the computer con-
stantly evaluates new information and personalizes survey
questions. Based on responses, more specific questions
are posed to probe and clarify an individual respondent’s
reasons behind his or her initial responses. Thus, with
smart questionnaire surveys, different respondents taking
the same questionnaire answer different sets of questions,
each custom-designed to provide the most relevant data.
For global corporations with diverse product lines,
computerized questionnaires can provide information
related to each product line. Before computerized ques-
tionnaires, corporations had to rely on survey data that
used scripted questions that often did not provide rele-
vant data. With smart questionnaires, however, the infor-
mation obtained is relevant to the specific needs of the
organization.
Important advantages of smart questionnaires over
traditional structured surveys include increased ease of
participation, decreased time requirements, and fewer
resources needed to conduct surveys, thereby reducing
the overall cost of survey administration. For many com-
panies, smart questionnaires increasingly are the logical
choice for data collection.
MARKETING RESEARCH DASHBOARD SMART QUESTIONNAIRES ARE REVOLUTIONIZING SURVEYS
www.MyEbookNiche.eCrater.com

Chapter 8 Designing the Questionnaire 205
investigating CMV effects. If the first factor from the analysis accounts for less than 40%
of all variance, there would be no concern about CMV bias, and a factor that accounts for
as much as 50% is not likely to indicate a CMV problem.
Questionnaire formatting and layout should make it easy for respondents to read and
follow instructions. If the researcher fails to consider questionnaire layout, the quality of
the data can be substantially reduced. The value of a well-constructed questionnaire is dif-
ficult to estimate. The main function of a questionnaire is to obtain people’s true thoughts
and feelings about issues or objects. Data collected using questionnaires should improve
understanding of the problem or opportunity that motivated the research. In contrast,
bad questionnaires can be costly in terms of time, effort, and money without yielding
good results.
After preparing the questionnaire but before submitting it to the client for approval,
the researcher should review the document carefully. The focus is on determining whether
each question is necessary and if the overall length is acceptable. Also, the researcher
checks to make sure that the survey meets the research objectives, that the scale format and
instructions work well, and that the questions move from general to specific. If the survey
is online, it should be viewed on the screen as the respondent will see it. If the survey is
mail or drop-off, it should be physically inspected. All forms of self-administered ques-
tionnaires should look professional and be visually appealing. A summary of the major
considerations in questionnaire design is given in Exhibit 8.4.
Online Survey Considerations The design of online surveys requires additional plan-
ning. A primary metric for traditional data collection methods is response rate. To deter-
mine response rates, the researcher must know the number of attempts to contact
respondents and complete a questionnaire. With mail or phone surveys, this task is rela-
tively easy. With online surveys, researchers must work with the online data collection
field service to plan how respondents will be solicited. If the data collection service sends
out a “blanket” invitation to complete a survey, there is no way to measure response rates.
Even if the invitation to complete a survey is sent to an organized panel of respondents,
Exhibit 8.4 Considerations in Questionnaire Design
1. Confirm the research objectives before starting to design the questionnaire.
2. Determine data requirements to complete each research objective.
3. The introduction section should include a general description of the study.
4. Instructions should be clearly expressed.
5. Questions and scale measurements should follow a logical order, that is, one that appears logical to the
respondent rather than to the researcher or practitioner.
6. Begin an interview or questionnaire with simple questions that are easy to answer, and then gradually lead
up to the more difficult questions. Use a general-to-specific questions and topic sequence.
7. Ask personal questions at the end of the interview or survey.
8. Place questions that involve personal opinions, attitudes, and beliefs toward the end of the interview or
survey, but before demographics.
9. Avoid asking questions using a different measurement format in the same section of the questionnaire.
10. End the interview or survey with a thank-you statement.
www.MyEbookNiche.eCrater.com

206 Part 3 Gathering and Collecting Accurate Data
calculating response rates can be a problem. This is because panels may involve millions of
individuals with broad criteria describing them. As a result, a survey targeted to males be-
tween the ages of 18 and 35 may be sent to a group with much broader demographic char-
acteristics. Another issue is recruiting of participants. If individuals are invited to
participate and they decline, should they be included in the response rate metric? Or should
the response rate metric be based on just those individuals who say they qualify and agree
to respond, whether or not they actually respond? To overcome these problems, researchers
must work closely with data collection vendors to identify, target, and request participation
from specific groups so accurate response rates can be calculated. Moreover, a clear under-
standing of how individuals are recruited for online surveys is necessary before data
collection begins.
A related problem in calculating the response rate metric online is the possibility of
recruitment of participants outside the official online data collection vendor. For example,
it is not uncommon for an individual included in the official invitation to participate to
recruit online friends and suggest that they participate. Recruited friends then go to the
data collection website and respond because they are interested in the survey topic. Effec-
tive control mechanisms, such as a unique identifier that must be entered before taking the
survey, must be put in place ahead of time to prevent this type of unsolicited response.
Another problem with online surveys is the length of time it takes some respondents to
complete the survey. It is not uncommon for some respondents to zip through in less than
five minutes a survey that should take 15 minutes to complete. On the other hand, it also
is not uncommon for individuals to take an hour or two to complete the same 15-minute
survey. To deal with this issue with online data collection vendors, first make sure “time
for completion” is a metric that is measured. If you do not collect this information, there is
no way to deal with this problem. When data collection is complete and you are reviewing
this metric, we suggest researchers follow the approach often used to deal with outliers in
calculating the mean. That is, apply the “trimmed mean” approach in which the 5 percent
tails on either end (very short and very long response times) are removed from the sample.
This will remove the extreme outlying observations and reduce the likelihood of biased
responses being included in the data analysis.
Research firms are just beginning to analyze online questionnaire design issues.
Three specific issues that have been addressed to date are (1) the effect of response box
size on length of answer in open-ended questions, (2) use of radio buttons versus pull-
down menus for responses, and (3) appropriate use of visuals. With regard to response
box size, respondents will write more when boxes are bigger. Some research firms cope
with this by offering respondents the choice between small, medium, and large boxes
so that the box size does not affect their response. In regard to the second issue, use of
pull-down menus, if a response is immediately visible at the top of the pull-down menu,
it will be selected more often than if it is simply one of the responses on the list. Thus, if
a pull-down menu is used, the top option should be “select one.” Generally, radio buttons
should be used as much as possible. Third, the use of visuals can affect respondents. For
example, two versions of a question about attending a baseball game featured either a
full baseball stadium or a small stadium with little attendance. Respondents were more
likely to say they attended more sporting events in the previous year when the question
was accompanied by a visual of a full baseball stadium as compared to a small, sparsely
attended stadium.3
Online formats facilitate the use of improved rating and ranking scales, as well as
extensive graphics and animation. For example, Qualtrics enables researchers to obtain
responses using their slider scale—a graphic ratings scale that improves response accuracy.
For example, the slider scale is a true metric measure of responses and facilitates the use of
www.MyEbookNiche.eCrater.com

Chapter 8 Designing the Questionnaire 207
10-point and 100-point scales. Programming surveys in the online environment offers the
opportunity to use graphics and scales in new ways, some of which are helpful and some
of which are not. As with traditional data collection methods and questionnaire design, the
best guideline is the KISS test—Keep It Simple and Short! Complex formats or designs
can produce biased findings and should be avoided.
Step 5: Obtain Initial Client ApprovalCopies of the questionnaire should be given to all parties involved in the project. This is
the client’s opportunity to provide suggestions of topics overlooked or to ask any questions.
Researchers must obtain final approval of the questionnaire prior to pretesting. If changes
are necessary, this is where they should occur. Changes at a later point will be more expen-
sive and may not be possible.
Step 6: Pretest, Revise, and Finalize the QuestionnaireThe final version of the questionnaire is evaluated using a pretest. In the pretest, the survey
questionnaire is given to a small, representative group of respondents that are asked to fill
out the survey and provide feedback to researchers. The number of respondents is most
often between 10 and 20 individuals. In a pretest, respondents are asked to pay attention to
words, phrases, instructions, and question sequence. They are asked to point out anything
that is difficult to follow or understand. Returned questionnaires are checked for signs of
boredom or tiring on the part of the respondent. These signs include skipped questions or
circling the same answer for all questions within a group. The pretest helps the researcher
determine how much time respondents will need to complete the survey, whether to add or
revise instructions, and what to say in the cover letter.
Complex questionnaires involving scale development or revision often execute a
pilot study. The terms “pilot study” and “pretest” are sometimes used interchangeably
but actually are different. A pilot study is a small-scale version of the intended main
research study, including the data collection and analysis and typically involving 100
to 200 respondents that are similar to the study’s defined target population. In some
situations, a pilot study is conducted to examine specific subcomponents of the overall
research plan, such as the experimental design manipulations, to see if the proposed pro-
cedures work as expected or if refinements are needed. For example, a pilot study with
100 representative respondents could be used to collect data to assess the reliability and
validity of scaled questions. While pilot studies can be included in any form of research
(i.e., exploratory, descriptive, or causal research designs), they are most often associated
with quantitative descriptive or predictive research studies. If problems or concerns arise
in the pretest or pilot study, modifications must be made and approved by the client prior
to moving to the next step.
Step 7: Implement the SurveyThe focus here is on the process followed to collect the data using the agreed-upon ques-
tionnaire. The process varies depending on whether the survey is self-administered or
interviewer-completed. For example, self-completed questionnaires must be distributed to
respondents and methods used to increase response rates. Similarly, with Internet surveys,
the format, sequence, skip patterns, and instructions after the questionnaire is uploaded to
the web must be thoroughly checked. Thus, implementation involves following up to ensure
all previous decisions are properly implemented.
www.MyEbookNiche.eCrater.com

208 Part 3 Gathering and Collecting Accurate Data
The Role of a Cover Letter
A cover letter is used with a self-administered questionnaire. The primary role of the
cover letter is to obtain the respondent’s cooperation and willingness to participate in
the research project. With personal or telephone interviews, interviewers use a verbal
statement that includes many of the points covered by a mailed or drop-off cover letter.
Similarly, for online surveys, there is a written introduction designed to motivate respon-
dents to participate and to explain the nature of the survey. Self-administered surveys
often have low response rates (25 percent or less). Good cover letters increase response
rates. Exhibit 8.5 provides guidelines for developing cover letters. While the exact word-
ing of a cover letter will vary from researcher to researcher and from situation to situa-
tion, a good cover letter should incorporate as many of these guidelines as possible. To
illustrate how a researcher might incorporate these guidelines, see the MARKETING
RESEARCH DASHBOARD: Cover Letter used with the American Bank Survey shown
in Exhibit 8.3. The bold number inserts in the cover letter refer to the guidelines listed
in Exhibit 8.5.
Cover letter A separate
written communication to
a prospective respondent
designed to enhance that
person’s willingness to
complete and return the
survey in a timely manner.
Exhibit 8.5 Guidelines for Developing Cover Letters
Factors Description
1. Personalization Cover letters should be addressed to the prospective respondent. The
research firm’s professional letterhead stationery should be used.
2. Identification of the organization Clear identification of the name of the research firm conducting the survey
or interview. A disguised approach is most often used but an undisguised
approach that reveals the actual client (or sponsor) of the study may be used.
3. Clear statement of the study’s Describe the general topic of the research and emphasize its importance to
purpose and importance the prospective respondent.
4. Anonymity and confidentiality Give assurances that the prospective respondent’s name will not be
revealed. Explain how the respondent was chosen, and stress that his or her
input is important to the study’s success.
5. General time frame of doing Communicate the overall time frame of the survey or study.
the study
6. Reinforce the importance of Communicate the importance of the prospective respondent’s participation.
respondent’s participation
7. Acknowledge reasons for Point out “lack of leisure time,” “surveys classified as junk mail,” and
nonparticipation in survey “forgetting about survey” reasons for not participating, and defuse them.
or interview
8. Time requirements and Communicate the approximate time required to complete the survey.
incentive Discuss incentive, if any.
9. Completion date and where and Communicate to the prospective respondent all instructions for returning
how to return the survey the completed questionnaire.
10. Advance thank-you statement for Thank the prospective respondent for his or her cooperation.
willingness to participate
www.MyEbookNiche.eCrater.com

Chapter 8 Designing the Questionnaire 209
MARKETING RESOURCES GROUP
2305 Windsor Oaks Drive, Suite 1105
Baton Rouge, Louisiana 70814
March 10, 2018
Ms. Caroline V. Livingstone [1]
873 Patterson Drive
Baton Rouge LA 70801
Dear Ms. Livingstone:
[2] The Marketing Resources Group in Baton Rouge is
conducting an interesting study on people’s banking hab-
its and services [5] this month and would like to include
your opinions.
[3] Consumer-banking practices are rapidly changing.
With many new electronic bank services, online tech-
nologies, the growth of credit unions and savings and
loans, and the increased complexity of people’s financial
needs and wants, financial institutions are indeed chang-
ing. These changes are having important effects on you
and your family. We would like to gain insights into these
changes and their impact from the consumer’s perspec-
tive by better understanding your opinions about different
banking services, habits, and patterns.
[4] Your name was one of only 600 names randomly
selected from a representative list of people currently liv-
ing in Baton Rouge. [6] Because the success of the survey
depends upon the cooperation of all the selected people,
we would especially appreciate your willingness to help
us in this study.
[4] The information obtained from the survey will in no
way reflect the identities of the people participating. Your
cooperation, attitudes, and opinions are very important to
the success of the study and will be kept strictly confiden-
tial, and only used when grouped with those of the other
people taking part in the study.
[7] We realize that people in the community receive many
things through the mail that we classify as “junk mail” and
often are not important to respond to, but please do not
consider the attached survey as being “junk mail.” [6] Your
opinions, attitudes, and viewpoints toward each question
are very important to us.
[7] To most of us in the community, our leisure time is
scarce and important, and we do not like to spend it
filling out a questionnaire for some unknown organiza-
tion’s survey. Please remember that you are among a
few people asked to participate in this study and [6]
your opinions are very important to the success of
the study. [8] We have designed the questionnaire to
include all the directions and instructions necessary to
complete the survey without the assistance of an inter-
viewer. The survey will take only about 15 minutes of
your time. Please take your time in responding to each
question. [6] Your honest responses are what we are
looking for in the study.
[8] To show our appreciation for your taking the time to
participate in this important study, you will be entered
into a drawing to receive one of ten Apple iPads for
those who donate some of your leisure time to com-
plete this survey. The drawing procedure is designed so
that everyone who completes and returns the question-
naire will have an equal opportunity to receive one of
the iPads.
[7] Past research suggests that many questionnaires
received through the mail, if not completed and returned
within the first 36 hours, are misplaced or forgotten about.
Upon receiving this survey, please take the time to com-
plete it. [6] Your opinions are very important to us.
[9] Please use the enclosed stamped and addressed enve-
lope to return your completed survey and enter you into the
drawing for a new iPad. To help us complete the study in a
timely fashion, we need your cooperation in returning the
survey by no later than Friday, March 24, 2018.
Again, we are not trying to sell you something. If you have
any doubts, concerns, or questions about this survey,
please give me a call at (504) 974-6236.
[10] Thank you in advance. We deeply appreciate your
cooperation in taking part in our study.
Sincerely,
Thomas L. Kirk
MRG Project Director
MARKETING RESEARCH DASHBOARD COVER LETTER USED WITH THE AMERICAN BANK SURVEY
www.MyEbookNiche.eCrater.com

210 Part 3 Gathering and Collecting Accurate Data
Other Considerations in Collecting Data
When data are collected, supervisor and interviewer instructions often must be developed as
well as screening questions and call records. These mechanisms ensure the data collection
process is successful. Some of these are needed for interviews and others for self-adminis-
tered questionnaires. In this section, we summarize each of these mechanisms.
Supervisor InstructionsMany researchers collect data using interviews conducted by field interviewing companies.
A supervisor instruction form serves as a blueprint for training people to complete the
interviewing process in a consistent fashion. The instructions outline the process for con-
ducting the study and are important to any research project that uses personal or telephone
interviews. They include detailed information on the nature of the study, start and comple-
tion dates, sampling instructions, number of interviewers required, equipment and facility
requirements, reporting forms, quotas, and validation procedures. Exhibit 8.6 displays a
sample page from a set of supervisor instructions for a restaurant study.
Supervisor instruction
form A form that serves
as a blueprint for training
people on how to execute
the interviewing process
in a standardized fashion;
it outlines the process by
which to conduct a study
that uses personal and tele-
phone interviewers.
Exhibit 8.6 Supervisor Instructions for a Restaurant Study Using Personal Interviews
Purpose To determine students’ dining-out patterns and attitudes toward selected restaurants located
within 1 mile of campus.
Number of A total of 90 trained student interviewers (30 interviewers per class, three different classes).
interviewers
Location of Interviews will be conducted over a two-week period beginning March 10 and ending March 24, 2013.
Interviews They will be conducted between the hours of 8:00 a.m and 9:00 p.m., Monday through Friday.
The locations of the interviews will be outside the campus buildings housing the four colleges
one making up the university plus the library and student union. There will be three shifts of
interviewers, 30 interviewers per shift, working the time frames of 8:00 a.m. to 12:00 noon or
12:01 p.m. to 5:00 p.m. or 5:01 p.m. to 9:00 p.m.
Quota Each interviewer will conduct and complete 30 interviews, with a maximum of five completed
interviews for each of the following named restaurants: Mellow Mushroom, Pizza Hut, Domino’s
Pizza, Chili’s, Outback Steakhouse, and any five “local restaurants.” All completed interviews
should come from their assigned location and time period.
For each shift of 30 interviewers, there will be a minimum of 150 completed interviews for each
of the five named restaurants in the study and maximum of 150 completed interviews representing
the set of “local restaurants.”
Project materials For this study, you are supplied with the following materials: 2,701 personal questionnaires,
91 interviewer instruction-screening-quota forms, 91 sets of “rating cards,” with each set consisting
of six different rating cards, 91 “verification of interview” forms, and 1 interviewer scheduling form.
Preparation Using your set of materials, review all material for complete understanding. Set a two-hour time frame
for training your 90 student interviewers on how they should select a prospective respondent, screen
for eligibility, and conduct the interviews. Make sure each interviewer understands the embedded
“interviewer’s instructions” in the actual questions making up the survey. In addition, assign each
interviewer to a specified location and time frame for conducting the interviews. Make sure all locations
and time frames are properly covered. Prepare a backup plan for anticipated problems.
www.MyEbookNiche.eCrater.com

Chapter 8 Designing the Questionnaire 211
Interviewer InstructionsInterviewer instructions are used for training interviewers to correctly select a prospec-
tive respondent for inclusion in the study, screen prospective respondents for eligibility,
and to properly conduct the actual interview. The instructions include detailed informa-
tion about the nature of the study, start and completion dates, sampling instructions,
screening procedures, quotas, number of interviews required, guidelines for asking ques-
tions, use of rating cards, recording responses, reporting forms, and verification form
procedures.
Screening QuestionsScreening questions ensure the respondents included in a study are representative of the
defined target population. Screening questions are used to confirm the eligibility of a pro-
spective respondent for inclusion in the survey and to ensure that certain types of respon-
dents are not included in the study. This occurs most frequently when a person’s direct
occupation or a family member’s occupation in a particular industry eliminates the person
from inclusion in the study. For example, a study of the perceived quality of automobiles
manufactured by Ford Motor Company would exclude people who work for Ford Motor
Company or an automobile dealership that sells Ford vehicles. Individuals who work for
marketing research firms or advertising agencies also are routinely excluded from partici-
pation in studies.
QuotasQuotas are used to ensure that data are collected from the correct respondents. When a
particular quota for a subgroup of respondents is filled, questionnaires for that subgroup
are no longer completed. If interviewers are used, they record quota information and
tabulate it to know when interviews for targeted groups have been completed. If the
survey is online, then the computer keeps track of questionnaires completed to ensure
quotas for targeted groups are met. In the retail banking example, each interviewer
completed 30 interviews, with five each from customers of six different banks: Bank of
America, SunTrust Bank, Citicorp, Chase, First Union, and “Other Banks.” Once the
quota was reached for a particular bank, such as Chase, any prospective respondent who
indicated that Chase was his or her primary bank would be excluded from participating
in the survey.
Call or Contact RecordsCall records, also referred to as either reporting or tracking approaches, are used to esti-
mate the efficiency of interviewing. These records typically collect information on the
number of attempts to contact potential respondents made by each interviewer and the
results of those attempts. Call and contact records are often used in data collection methods
that require the use of an interviewer, but also can be used with online surveys. Informa-
tion gathered from contact records includes number of calls or contacts made per hour,
number of contacts per completed interview, length of time of the interview, completions
by quota categories, number of terminated interviews, reasons for termination, and number
of contact attempts.
Your understanding of the activities needed to develop a survey instrument completes
the third phase of the research process, gathering and collecting accurate data, and prepares
you to move into the last phase: data preparation and analysis. Chapter 9 covers coding,
editing, and preparing data for analysis.
Interviewer instructions
Used to train interviewers
how to select prospective
respondents, screen them
for eligibility, and conduct
the actual interview.
Quotas A tracking system
that collects data from
respondents and helps
ensure that subgroups are
represented in the sample
as specified.
Call records A recording
document that gathers
basic summary informa-
tion about an interviewer’s
performance efficiency
(e.g., number of contact
attempts, number of com-
pleted interviews, length of
time of interview).
www.MyEbookNiche.eCrater.com

212 Part 3 Gathering and Collecting Accurate Data
MARKETING RESEARCH IN ACTIONDesigning a Questionnaire to Survey Santa Fe Grill Customers
This illustration extends the chapter discussion on questionnaire design. Read through
this example and, using the actual Screening Questions (Exhibit 8.7) and Questionnaire
(Exhibit 8.8), answer the questions at the end.
In early 2013, two recent college business graduates (one majored in Finance and the
other in Management) came together with a new restaurant concept for a southwestern
casual dining experience that focused on a Mexican theme with a variety of fresh food
items and a friendly family-oriented atmosphere. After several months of planning and
creating detailed business and marketing plans, the two entrepreneurs were able to get the
necessary capital to build and open their restaurant, calling it the Santa Fe Grill Mexican
Restaurant.
After the initial six months of success, they noticed that revenues, traffic flow, and
sales were declining and realized that they knew only the basics about their customers.
Neither of the owners had taken any marketing courses beyond basic marketing in college,
so they turned to a friend who advised them to hire a marketing research firm to collect
some primary data about people’s dining-out habits and patterns. A marketing research
firm was located in their mall so they contracted with them to design a self-administered
survey to collect the needed data. The following six research objectives were used to guide
the design of their survey instrument shown in Exhibit 8.8.
1. To identify the factors people consider important in making casual dining restaurant
choice decisions.
2. To determine the characteristics customers use to describe the Santa Fe Grill and its
competitor, Jose’s Southwestern Café.
3. To develop a psychographic/demographic profile of the restaurant customers.
4. To determine the patronage and positive word-of-mouth advertising patterns of the
restaurant customers.
5. To assess the customer’s willingness to return to the restaurant in the future.
6. To assess the degree to which customers are satisfied with their Mexican restaurant
experiences.
www.MyEbookNiche.eCrater.com

Chapter 8 Designing the Questionnaire 213
Exhibit 8.8 The Mexican Restaurant Dining-Out Survey
Please read all questions carefully. If you do not understand a question, ask the
interviewer to help you. In the first section, a number of statements are given about
interests and opinions. Using a scale from 1 to 7, with 7 being “Strongly Agree” and 1 being
“Strongly Disagree,” please indicate the extent to which you agree or disagree a particular
statement describes you. Circle only one number for each statement.
Section 1: Lifestyle Questions
1. I often try new and different things. Strongly Strongly
Disagree Agree
1 2 3 4 5 6 7
2. I like parties with music and lots of talk. Strongly Strongly
Disagree Agree
1 2 3 4 5 6 7
3. People come to me more often than I go to Strongly Strongly
them for information about products. Disagree Agree
1 2 3 4 5 6 7
4. I try to avoid fried foods. Strongly Strongly
Disagree Agree
1 2 3 4 5 6 7
5. I like to go out and socialize with people. Strongly Strongly
Disagree Agree
1 2 3 4 5 6 7
6. Friends and neighbors often come to me Strongly Strongly
for advice about products and brands. Disagree Agree
1 2 3 4 5 6 7
(continued)
Exhibit 8.7 Screening and Rapport Questions for the Mexican Restaurant Study
Hello. My name is ____ and I work for DSS Research. We are talking with individuals today
(tonight) about dining-out habits.
1. “Do you regularly eat out at casual dining restaurants?” __ Yes __ No
2. “Have you eaten at more than one Mexican restaurant in the last six months?” __ Yes __ No
3. “Is your gross annual household income $20,000 or more?” __ Yes __ No
4. At which of the following Mexican restaurants have you eaten most recently?
a. First response is Santa Fe Grill—Yes, continue.
b. First response is Jose’s Southwestern Café—Yes, continue.
c. First response is Other Restaurant—thank them and terminate interview.
If respondent answers “yes” to first three questions, and also indicates either the Santa Fe
Grill or Jose’s Southwestern Café, then say:
We would like you to answer a few questions about yourself and your experiences eating
at the ___ __ __ restaurant. The questions will take only a few minutes and it will be very
helpful in better serving our customers.
???
www.MyEbookNiche.eCrater.com

214 Part 3 Gathering and Collecting Accurate Data
7. I am self-confident about myself and Strongly Strongly
my future. Disagree Agree
1 2 3 4 5 6 7
8. I usually eat balanced, nutritious meals. Strongly Strongly
Disagree Agree
1 2 3 4 5 6 7
9. When I see a new product in stores, Strongly Strongly
I often buy it. Disagree Agree
1 2 3 4 5 6 7
10. I am careful about what I eat. Strongly Strongly
Disagree Agree
1 2 3 4 5 6 7
11. I often try new brands before my friends Strongly Strongly
and neighbors do. Disagree Agree
1 2 3 4 5 6 7
Section 2: Perceptions Measures
Listed below is a set of characteristics that could be used to describe the Mexican
restaurant at which you ate most recently. Using a scale from 1 to 7, with 7 being “Strongly
Agree” and 1 being “Strongly Disagree,” to what extent do you agree or disagree the
_____________ restaurant:
12. has friendly employees. Strongly Strongly
Disagree Agree
1 2 3 4 5 6 7
13. is a fun place to eat. Strongly Strongly
Disagree Agree
1 2 3 4 5 6 7
14. has large size portions. Strongly Strongly
Disagree Agree
1 2 3 4 5 6 7
15. has fresh food. Strongly Strongly
Disagree Agree
1 2 3 4 5 6 7
16. has reasonable prices. Strongly Strongly
Disagree Agree
1 2 3 4 5 6 7
17. has an attractive interior. Strongly Strongly
Disagree Agree
1 2 3 4 5 6 7
Exhibit 8.8 The Mexican Restaurant Dining-Out Survey, continued
www.MyEbookNiche.eCrater.com

Chapter 8 Designing the Questionnaire 215
18. has excellent food taste. Strongly Strongly
Disagree Agree
1 2 3 4 5 6 7
19. has knowledgeable employees. Strongly Strongly
Disagree Agree
1 2 3 4 5 6 7
20. serves food at the proper temperature. Strongly Strongly
Disagree Agree
1 2 3 4 5 6 7
21. has quick service. Strongly Strongly
Disagree Agree
1 2 3 4 5 6 7
Section 3: Relationship Measures
Please indicate your view on each of the following questions:
22. How satisfied are you with Not Satisfied Very
___________? At All Satisfied
1 2 3 4 5 6 7
23. How likely are you to return to Definitely Will Definitely Will
___________ in the future? Not Return Return
1 2 3 4 5 6 7
24. How likely are you to recommend Definitely Will Definitely Will
___________ to a friend? Not Recommend Recommend
1 2 3 4 5 6 7
25. How often do you eat at 1 = Very Infrequently
___________? 2 = Somewhat Infrequently
3 = Occasionally
4 = Somewhat Frequently
5 = Very Frequently
Section 4: Selection Factors
Listed below are some reasons many people use in selecting a restaurant where they
want to dine. Think about your visits to casual dining restaurants in the last three months
and please rank each attribute from 1 to 4, with 1 being the most important reason for
selecting the restaurant and 4 being the least important reason. There can be no ties so
make sure you rank each attribute with a different number.
Attribute Ranking
26. Prices
27. Food Quality
28. Atmosphere
29. Service
Exhibit 8.8 continued
(continued)
www.MyEbookNiche.eCrater.com
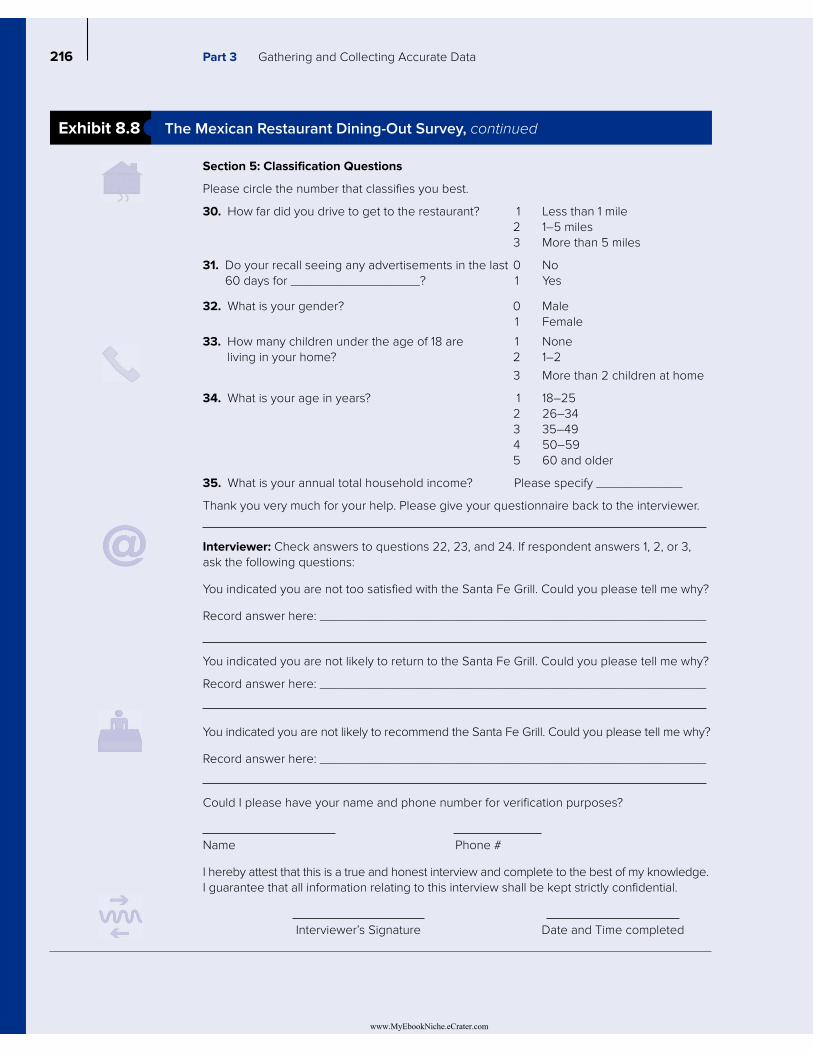
216 Part 3 Gathering and Collecting Accurate Data
Section 5: Classification Questions
Please circle the number that classifies you best.
30. How far did you drive to get to the restaurant? 1 Less than 1 mile
2 1–5 miles
3 More than 5 miles
31. Do your recall seeing any advertisements in the last 0 No
60 days for __________________? 1 Yes
32. What is your gender? 0 Male
1 Female
33. How many children under the age of 18 are 1 None
living in your home? 2 1–2
3 More than 2 children at home
34. What is your age in years? 1 18–25
2 26–34
3 35–49
4 50–59
5 60 and older
35. What is your annual total household income? Please specify ____________
Thank you very much for your help. Please give your questionnaire back to the interviewer.
Interviewer: Check answers to questions 22, 23, and 24. If respondent answers 1, 2, or 3,
ask the following questions:
You indicated you are not too satisfied with the Santa Fe Grill. Could you please tell me why?
Record answer here: ______________________________________________________
You indicated you are not likely to return to the Santa Fe Grill. Could you please tell me why?
Record answer here: ______________________________________________________
You indicated you are not likely to recommend the Santa Fe Grill. Could you please tell me why?
Record answer here: ______________________________________________________
Could I please have your name and phone number for verification purposes?
Name Phone #
I hereby attest that this is a true and honest interview and complete to the best of my knowledge.
I guarantee that all information relating to this interview shall be kept strictly confidential.
Interviewer’s Signature Date and Time completed
Exhibit 8.8 The Mexican Restaurant Dining-Out Survey, continued
www.MyEbookNiche.eCrater.com

Chapter 8 Designing the Questionnaire 217
Hands-On Exercise1. Based on the research objectives, does the self-administered questionnaire, in its cur-
rent form, correctly illustrate sound questionnaire design principles? Please explain
why or why not.
2. Overall, is the current survey design able to capture the required data needed to ad-
dress all the stated research objectives? Why or why not? If changes are needed, how
would you change the survey’s design?
3. Evaluate the “screener” used to qualify the respondents. Are there any changes
needed? Why or why not?
4. Redesign questions #26 to 29 on the survey using a rating scale that will enable you
to obtain the “degree of importance” a customer might attach to each of the four listed
attributes in selecting a restaurant to dine at.
Summary
Describe the steps in questionnaire design.
Researchers follow a systematic approach to design-
ing questionnaires. The steps include: confirm research
objectives, select appropriate data collection method,
develop questions and scaling, determine layout and
evaluate questionnaire, obtain initial client approval,
pretest, revise and finalize questionnaire, and implement
the survey.
Discuss the questionnaire development process.
A number of design considerations and rules of logic
apply to the questionnaire development process. The
process requires knowledge of sampling plans, con-
struct development, scale measurement, and types
of data. A questionnaire is a set of questions/scales
designed to collect data and generate information to
help decision makers solve business problems. Good
questionnaires enable researchers to gain a true report
of the respondent’s attitudes, preferences, beliefs, feel-
ings, behavioral intentions, and actions. Through
carefully worded questions and clear instructions, a
researcher has the ability to focus a respondent’s
thoughts and ensure answers that faithfully represent
respondents’ attitudes, beliefs, intentions, and knowl-
edge. By understanding good communication principles,
researchers can avoid bad questions that might result
in unrealistic information requests, unanswerable ques-
tions, or leading questions that prohibit or distort the
respondent’s answers.
Summarize the characteristics of good questionnaires.
Survey information requirements play a critical role in
the development of questionnaires. For each objective,
the researcher must choose types of scale formats (nomi-
nal, ordinal, interval, or ratio); question formats (open-
ended and closed-ended); and the appropriate scaling.
Researchers must be aware of the impact that differ-
ent data collection methods (personal, telephone, self-
administered, computer-assisted) have on the wording of
both questions and response choices. With good ques-
tionnaires, the questions are simple, clear, logical, and
meaningful to the respondent, and move from general to
specific topics.
Understand the role of cover letters.
The primary role of a cover letter should be to obtain
the respondent’s cooperation and willingness to partici-
pate in the project. Ten factors should be examined in
developing cover letters. Observing these guidelines will
increase response rates.
Explain the importance of other documents used
with questionnaires.
When data are collected using interviews, supervisor
and interviewer instructions must be developed as well
as screening forms and call record sheets. These docu-
ments ensure the data collection process is successful.
Supervisor instructions serve as a blueprint for training
people to complete the interviewing process in a con-
sistent fashion. The instructions outline the process for
conducting the study and are important to any research
project that uses personal or telephone interviews. Inter-
viewer instructions are used to train interviewers to cor-
rectly select a prospective respondent for inclusion in the
study, screen prospective respondents for eligibility, and
how to properly conduct the actual interview. Screening
www.MyEbookNiche.eCrater.com

218 Part 3 Gathering and Collecting Accurate Data
forms are a set of preliminary questions used to confirm
the eligibility of a prospective respondent for inclu-
sion in the survey. Quota sheets are tracking forms that
enable the interviewer to collect data from the right type
of respondents. All of these documents help improve
data collection and accuracy.
Key Terms and Concepts
Bad questions 197
Call records 211
Common methods variance (CMV) 203
Cover letter 208
Interviewer instructions 211
Introductory section 203
Questionnaire 192
Quotas 211
Research questions section 203
Response order bias 203
Screening questions 203
Sensitive questions 195
Skip questions 198
Structured questions 195
Supervisor instruction form 210
Unstructured questions 195
Review Questions
1. Discuss the advantages and disadvantages of using
unstructured (open-ended) and structured (closed-
ended) questions in developing an online, self-
administered survey instrument.
2. Explain the role of a questionnaire in the research
process. What should be the role of the client during
the questionnaire development process?
3. What are the guidelines for deciding the format and
layout of a questionnaire?
4. What makes a question bad? Develop three examples
of bad questions. Rewrite your examples so they
could be judged as good questions.
5. Discuss the value of a good questionnaire design.
6. Discuss the main benefits of including a brief intro-
ductory section in questionnaires.
7. Unless needed for screening purposes, why shouldn’t
demographic questions be asked up front in
questionnaires?
Discussion Questions
1. Assume you are doing exploratory research to find out
students’ opinions about the purchase of a new digi-
tal music player. What information would you need
to collect? What types of questions would you use?
Suggest six to eight questions you would ask and in-
dicate in what sequence you would ask them. Pretest
the questions on a sample of students from your class.
2. Assume you are conducting a study to determine the
importance of brand names and features of mobile
phone handsets. What types of questions would you
use—open-ended, closed-ended, scaled?—and why?
Suggest six to eight questions you would ask and in
what sequence you would ask them. Pretest the ques-
tions on a sample of students from your class.
3. Discuss the guidelines for developing cover letters.
What are some of the advantages of developing good
cover letters? What are some of the costs of a bad
cover letter?
4. Using the questions asked in evaluating any ques-
tionnaire design (see Exhibit 8.4), evaluate the Santa
Fe Grill restaurant questionnaire. Write a one-page
assessment.
5. What are the critical issues involved in pretesting a
questionnaire?
www.MyEbookNiche.eCrater.com

Data Preparation,
Analysis, and
Reporting the
Results
P a r t 4
www.MyEbookNiche.eCrater.com

Qualitative Data Analysis
C h a p t e r 9
www.MyEbookNiche.eCrater.com

Learning Objectives After reading this chapter, you will be able to:
1. Contrast qualitative and quantitative data analyses.
2. Explain the steps in qualitative data analysis.
3. Describe the processes of categorizing and coding data and developing theory.
4. Clarify how credibility is established in qualitative data analysis.
5. Discuss the steps involved in writing a qualitative research report.
Why Women are “Claiming the Throttle”
Why are women increasingly choosing to ride motorcycles? Motorcycle riding
has been described as a hypermasculine “outlaw” subculture. Thus, women who
choose to ride motorcycles are resisting or expanding existing cultural ideas of
women’s roles. Currently, about 5 percent of motorcycle riders are women, with
estimates as high as 17 percent of riders from Generation X.
In an ethnographic research project, a team of researchers that included one
woman and two men studied female motorcycle riders. Data collection included
participant observation by the female member of the research team and observa-
tion of motorcycle-riding events. In-depth interviews of 18 women were also
conducted, including riders of different ages and experience levels. During the
in-depth interviews, researchers toured the homes and garages of participants.
In addition to videotaping the interviews, researchers wrote field notes detailing
what they saw and added these notes to the data set.
The researchers found that initiation and socialization into the “boys’ club” of
motorcycle riding occur in different ways. Some women had been “rebels” or “bad
girls” when they were teenagers, riding on the backs of motorcycles even though
their parents had forbidden them to do so. Other girls grew up with motorcycles of
their own, often dirt bikes. Competition on bikes had been their way into the “boy’s
club.” Within couples, women either started riding or encouraged their spouse to
ride so that they could ride together, side by side. A last route for socialization
into riding was seeing other women ride. These women riders experienced riding
among other women as a sisterhood and actively encouraged other women to ride.
Freedom and empowerment were the overarching themes emerging from anal-
ysis of the qualitative data. Like men, women ride for the sense of freedom—the
freedom to slow down and to enjoy, and the freedom to accept physical risk. Women
also experience freedom in a unique way as riding broadens their definitions and
experiences of femininity. Most women riders are attracted at least to some degree
to the hypermasculinity of biking cultures, which they associate with empowerment
and fulfillment. Perhaps most impressively, women riders reported carrying over
the sense of empowerment gained from riding to other areas of their lives.1
www.MyEbookNiche.eCrater.com

222 Part 4 Data Preparation, Analysis, and Reporting the Results
Nature of Qualitative Data Analysis
In this chapter, you will learn the processes used by researchers to interpret qualitative
data and form insights about their meaning. We often think of data analysis as involv-
ing numbers. But the data qualitative researchers analyze consists of text (and some-
times images) rather than numbers. Some researchers criticize qualitative research as
“soft,” lacking rigor, and being inferior. But measurement and statistical analysis do
not ensure that research is useful or accurate. What increases the likelihood of good
research is a deliberate, thoughtful, knowledgeable approach whether qualitative or
quantitative research methods are used. While the reliability and validity of quantita-
tive analysis can be evaluated numerically, the trustworthiness of qualitative analysis
depends fundamentally on the rigor of the process used for collecting and analyzing
the data.
As we explained in Chapter 4, when magnitude of response and statistical project-
ability are important, quantitative research should be used to verify and extend qualitative
findings. But when the purpose of a research project is to better understand psychoanalyti-
cal or cultural phenomena, quantitative research may not offer a great deal of insight or
depth. For these topics, qualitative research and analysis often is superior to quantitative
research in providing useful knowledge for decision makers.
This chapter details a process that can be followed to ensure qualitative data analy-
ses are careful and rigorous. In this chapter, we first compare qualitative and quantitative
analyses. Next we describe the steps involved in qualitative data analysis. We explain cat-
egorization, coding, and assessing trustworthiness or credibility. The chapter concludes by
providing guidelines on writing a qualitative research report.
Qualitative versus Quantitative Analyses
All marketing researchers construct stories that are based on the data they have col-
lected. The goal of these stories, whether they are based on qualitative or quantitative
data, is to provide actionable answers to research questions. Yet, there are many differ-
ences between the processes of analyzing and interpreting qualitative and quantitative
data. The most apparent difference stems from the nature of the data itself. Qualita-
tive data is textual (and occasionally visual), rather than numerical. While the goal of
quantitative analysis is quantifying the magnitude of variables and relationships, or
explaining causal relationships, understanding is the goal of qualitative analysis. A
second contrast between the two kinds of analysis is that qualitative analyses tend to
be ongoing and iterative. This means the data is analyzed as it is collected, which may
affect further data collection efforts in terms of who is sampled and what questions
are asked. Another difference between the methods is that quantitative analyses are
guided entirely by the researchers, while good qualitative researchers employ member
checking. Member checking involves asking key informants to read the researchers’
report to verify that the story they are telling about the focal problem or situation is
accurate.
Qualitative data analysis is largely inductive. The categories, themes, and pat-
terns analysts describe in their reports emerge from the data, rather than being defined
prior to data collection, as in quantitative analyses. Because an inductive process is
used, the theory that emerges is often called grounded theory.2 The categories and cor-
responding codes for categories are developed as researchers work through the texts
Member checking Asking
key informants to read
the researcher’s report to
verify that the analysis is
accurate.
www.MyEbookNiche.eCrater.com

Chapter 9 Qualitative Data Analysis 223
and images and find what is there. Of course, rarely is the development of categories
and theory completely inductive. Researchers bring with them knowledge, theory, and
training that suggests categories, themes, and theories that might exist in the data they
have collected.
There is no one process for analyzing qualitative data, although the three-step pro-
cess described in this chapter has been useful to the thinking of many qualitative research-
ers. Some researchers prefer a more impressionistic approach to qualitative analysis and
do not go through transcripts and other documents with the degree of care that we suggest
here. Nevertheless, “careful and deliberate analysis remains crucial to sound qualitative
research.”3
Qualitative researchers differ in their beliefs about the use of quantifying their data.
Some feel that quantification is completely useless and likely misleading. But others find
that quantification can be useful in both counting responses and in model development. We
discuss tabulation (counting) later in this chapter.
Qualitative researchers use different techniques for data collection. These differences
affect the kinds of analyses that can be performed with the data. Analysts use the collected
and transcribed textual data to develop themes, categories, and relationships between vari-
ables. Categories are usually developed as the transcripts (and images) are reviewed by
researchers. Codes are attached to the categories, which are then used to mark the portions
of text (or images) where the category is mentioned.
In this chapter, we review the process of analyzing qualitative data. We explain the
process of data reduction, data display, and conclusion making/verification. We also
explain how qualitative researchers develop analyses that are credible, which means
the analyses are authentic and believable. Finally, we explain how to write a qualitative
research report.
The Process of Analyzing Qualitative Data
After data is collected, researchers engage in a three-step process of analysis: data
reduction, data display, and conclusion drawing/verification.4 The three steps and
relationships between the steps and data collection efforts are pictured in Exhibit 9.1.
Managing the Data Collection EffortWhether the collection method is focus groups or in-depth interviews, the data will be
transcribed for further analysis. Data from online focus groups, private communities, and
social media sites is collected in one database to facilitate analysis. Occasionally, par-
ticipants are asked to write stories or respond to open-ended questions, and their written
responses become the data set. The project in the Marketing Research in Action at the end
of this chapter makes use of this technique.
Qualitative researchers often enter their interim thoughts in the database. Field notes,
which are observations written down during the data collection effort, also become part of
the data set. Finally, key participants may be asked to evaluate researchers’ initial research
draft. Their feedback becomes part of the official data set as well.
Step 1: Data ReductionThe amount of data collected in a qualitative study can be extensive. Researchers
must make decisions about how to categorize and represent the data. This results in
www.MyEbookNiche.eCrater.com

224 Part 4 Data Preparation, Analysis, and Reporting the Results
data reduction. The most systematic method of analysis is to read through transcripts
and develop categories to represent the data. When similar topics are encountered, they
are coded similarly. Researchers may simply write codes in the margins of their tran-
scripts. But increasingly, software such as QSR NVIVO and Atlas/ti is used to track the
passages that are coded. Computer coding enables researchers to view all similarly coded
passages at the same time, which facilitates comparison and deeper coding. Computer
coding also makes it easier to study relationships in the data. Data reduction consists of
several interrelated processes: categorization and coding; theory development; and itera-
tion and negative case analysis.
Data Reduction: Categorization and Coding The first step in data reduction is
categorization. Researchers categorize sections of the transcript and label the categories
with names and sometimes code numbers. There may be some categories that are deter-
mined before the study because of existing researcher knowledge and experience. How-
ever, most often the codes are developed inductively as researchers read through
transcripts and discover new themes of interest and code new instances of categories that
have already been discovered. The sections that are coded can be one word long or sev-
eral pages. The same sections of data can be categorized in multiple ways. If a passage
refers to several different themes that have been identified by researchers, the passage
will be coded for all the different relevant themes. Some portions of the transcripts will
not contain information that is relevant to the analysis and will not be coded at all.5 A
code sheet is a piece of paper with all the codes (see Exhibit 9.2 for an example from a
senior Internet adoption study). The coded data may be entered into a computer, but the
first round of coding usually occurs in the margins (Exhibit 9.3). The codes can be words
or numbers that refer to categories on the coding sheet. In the example in Exhibit 9.3,
Data reduction The
categorization and coding
of data that is part of
the theory development
process in qualitative data
analysis.
Categorization Placing
portions of transcripts into
similar groups based on
their content.
Code sheet A document
that lists the different
themes or categories for a
particular study.
Codes Labels or numbers
that are used to track cate-
gories in a qualitative study.
Exhibit 9.1 Components of Data Analysis: An Interactive Model
Data
collection
Data
reduction
Data
display
Conclusion
drawing/verifying
Source: Matthew B. Miles and A. Michael Huberman, Qualitative Data Analysis: An Expanded Sourcebook
(Thousand Oaks, CA: Sage Publications, 1994), p. 12.
www.MyEbookNiche.eCrater.com

Chapter 9 Qualitative Data Analysis 225
Exhibit 9.2 Senior Adoption of the Internet Study Initial Code Sheet
I. Antecedents
A. Observability
1. Seeing others use the Internet
2. Having an “a-ha” experience
3. Marketing influences
B. Trialability
1. Family
2. Community centers
3. Friends
4. Work
C. Complexity
1. Physical challenges
2. Learning challenges
3. Initial fear
D. Relative advantage
1. Cultural currency
2. Ability to engage in hobbies
3. Finding information
4. Communication
5. Creativity
E. Compatibility
1. Openness to experience/life
involvement
2. Technology optimism
3. Self-efficacy/proactive coping
4. Financial resources
5. Time in retirement
6. Previous experience w/computing
II. Processes
A. Attend formal classes
B. Consult published sources
C. Mentors
D. Bricolage (learning by doing)
E. Ancillary systems (e.g., handwritten notes)
F. Flow
G. Multitasking
III. Uses
A. Communication (e-mail, jokes,
support groups)
B. Gather info
1. health
2. hobbies
3. places
4. news
5. financial
6. product
7. travel
C. Banking
D. Shop selectively
E. Later life uses (Keeper of the
meaning, generativity, integrity)
F. Intended uses
G. Acting as an intermediary/proxy
H. Entertainment
I. Word processing, etc.
J. Creativity
IV. Outcomes
1. Connectedness
a. Companionship
b. Social support
c. Linkages to places visited, lived
2. Self-efficacy/independence
3. Cultural currency
a. Computer skills
b. Increased knowledge
4. Excitement
5. Evangelism
6. Fun
7. Self-extension
V. Coping Strategies
A. Security–personal info
B. Protecting privacy
C. Flow/limiting flow
D. Ease
E. Satisficing
Codes for Senior Characteristics
B = Broadband
M = Modem
OO = Old old 75+
Y = Young old 65–74
S = Self-adopted
O = Other adopted
SA = Self-assisted
www.MyEbookNiche.eCrater.com

226 Part 4 Data Preparation, Analysis, and Reporting the Results
numbers are used as codes to help organize themes and subthemes in the study. The
numbers written in the margin correspond to themes and categories in the coding sheet
developed by the researchers.
An example of the process of data coding comes from an online shopping study based
on data collected from both online and offline focus groups. One theme that emerged from
the data was the importance of freedom and control as desirable outcomes when shopping
online.6 The following are some examples of passages that were coded as representing the
freedom and control theme:
∙ “You’re not as committed [online]. You haven’t driven over there and
parked and walked around so you have a little more flexibility and can get around a lot faster.”
∙ “. . . when I go to a store and a salesperson’s helping me for a long time and it’s not
really what I wanted . . . I’ll oblige them, they spent all this time with me . . . but . . .
online, I know I will get to the point and be ready to order, but I know I don’t have to,
I can come back anytime I want to.”
∙ “You can sit on your arse and eat while you shop. You kin even shop nekked!”
∙ “For me, online browsing is similar [to offline browsing], but I have more of a sense
of freedom. I’ll browse stores I might not go into offline . . . Victoria’s Secret comes
to mind . . . also I’ll go into swank stores that I might feel intimidated in going into
offline . . . when you’re a 51-year-old chubby gramma, online Victoria’s Secret just
feels a bit more comfortable.”
Exhibit 9.3 Coding Transcripts in the Margins
Moderator: What’s a typical session like? You sit down at the computer and . . .
III 1
Nisreen: I sit down at the computer and then I go into my e-mails. I check my emails and I make the
replies. Then I want to find out about certain things, then I find out about those things and then I go to
World News. Then I go to the different countries I’m interested in, then I go to the newspapers. I get the
news about Pakistan right now. I go into Asia and then I go into Pakistan and then I get the news right
there before I think my relatives know in Pakistan. I know the news before that. So isn’t it wonderful?
Moderator: Yes. It really is. It’s amazing.
Nisreen: My cousin in Australia . . . before he thought he was leaving Australia from Sydney and I knew
all about it, it’s faster than telegram. It’s so wonderful. I almost feel like I’m sitting on a magic carpet and I press
a button and boom, I’m there.
Moderator: That’s interesting. Just reading the paper makes you feel like you are there.
Nisreen: And then I want to read the viewpoint of different newspapers, so I go into different
countries like India, Bangladesh or Pakistan, or the Middle East. In the Middle East, I used to be a voluntary
assistant of the, Perspective, which is the only women’s magazine in the Middle East. At that time, Jordan
was a very peaceful place. The rest of the world was up in arms and that kind of thing. So you see, I feel like
I’m in touch with the whole world. It’s such a wonderful feeling at my age to be in touch with the world. I
wish more and more . . . because I think in the near future, that would be the order of the day.
III 2 D
III 2 C
IV D
IV F
III 2C
IV A
IV C2
IV C
III 2D
IV A 1
IV D
www.MyEbookNiche.eCrater.com

Chapter 9 Qualitative Data Analysis 227
Categories may be modified and combined as data analysis continues. The researcher’s
understanding evolves during the data analysis phase and often results in revisiting,
recoding, and recategorizing data.
Data Reduction: Comparison Comparison of differences and similarities is a funda-
mental process in qualitative data analysis. There is an analogy to experimental design, in
which various conditions or manipulations (for instance, price levels, advertising appeals)
are compared to each other or to a control group. Comparison first occurs as researchers
identify categories. Each potential new instance of a category or theme is compared to al-
ready coded instances to determine if the new instance belongs in the existing category.
When all transcripts have been coded and important categories and themes identified, in-
stances within a category will be scrutinized so that the theme can be defined and ex-
plained in more detail. For example, in a study of employee reactions to their own
employers’ advertising, the category “effectiveness of advertising with consumers” was a
recurring theme. Because of the importance of advertising effectiveness in determining
employees’ reactions to the ad, employees’ views of what made ads effective were com-
pared and contrasted. Employees most often associated the following qualities with effec-
tive organizational ads to consumers: (1) likely to result in short-term sales; (2) appealing
to the target audience; (3) attention grabbing; (4) easily understandable; and (5) authenti-
cally portraying the organization and its products.7
Comparison processes are also used to better understand the differences and similari-
ties between two constructs of interest. In the study of online shopping, two types of shop-
ping motivations emerged from analyses of transcripts: goal-oriented behavior (shopping
to buy or find information about specific products) and experiential behavior (shopping to
shop). Comparison of shopper motivations, descriptions, and desired outcomes from each
type of behavior reveals that consumers’ online shopping behavior is different depending
on whether or not the shopping trip is goal-oriented or experiential.8
Comparisons can also be made between different kinds of informants. In a study of
high-risk leisure behavior, skydivers with different levels of experience were interviewed.
As a result of comparing more and less experienced skydivers, the researchers were able to
show that motivations changed and evolved, for example, from thrill, to pleasure, to flow,
as skydivers continued their participation in the sport.9 Similarly, in a study of postsocialist
Eastern European women who were newly exposed to cosmetics and cosmetics brands,
researchers compared women who embraced cosmetics to those who were either ambiva-
lent about cosmetics or who rejected them entirely.10
Data Reduction: Theory Building Integration is the process through which researchers
build theory that is grounded, or based on the data collected. The idea is to move from the
identification of themes and categories to the development of theory.
In qualitative research, relationships may or may not be conceptualized and pictured
in a way that looks like the traditional causal model employed by quantitative researchers.
For instance, relationships may be portrayed as circular or recursive. In recursive relation-
ships, variables may both cause and be caused by the same variable. A good example is
the relationship between job satisfaction and financial compensation. Job satisfaction tends
to increase performance and thus compensation earned on the job, which in turn increases
job satisfaction.
Qualitative researchers may look for one core category or theme to build their story-
line around, a process referred to as selective coding. All other categories will be related to
or subsumed to this central category or theme. Selective coding is evident in the following
studies that all have an overarching viewpoint or frame:
Comparison The process
of developing and refining
theory and constructs by
analyzing the differences
and similarities in passages,
themes, or types of
participants.
Integration The process
of moving from the
identification of themes
and categories to the
development of theory.
Recursive A relationship in
which a variable can both
cause and be caused by
the same variable.
Selective coding Building
a storyline around one
core category or theme;
the other categories will
be related to or subsumed
to this central overarching
category.
www.MyEbookNiche.eCrater.com

228 Part 4 Data Preparation, Analysis, and Reporting the Results
∙ A study of personal websites finds that posting a website is an imaginary digital exten-
sion of self.
∙ A study of an online Newton (a discontinued Apple PDA) user group finds several
elements of religious devotion in the community.
∙ A study of Hispanic consumer behavior in the United States uses the metaphor of
boundary crossing to explore Hispanic purchase and consumption.11
Given its role as an integrating concept, it is not surprising that selective coding gener-
ally occurs in the later stages of data analysis. Once the overarching theme is developed,
researchers review all their codes and cases to better understand how they relate to the
larger category, or central storyline, that has emerged from their data.
Data Reduction: Iteration and Negative Case Analysis Iteration means working
through the data in a way that permits early ideas and analyses to be modified by choos-
ing cases and issues in the data that will permit deeper analyses. The iterative process
may uncover issues that the already collected data do not address. In this case, the re-
searcher will collect data from more informants, or may choose specific types of infor-
mants that he or she believes will answer questions that have arisen during the iterative
process. The iterative procedure may also take place after an original attempt at integra-
tion. Each of the interviews (or texts or images) may be reviewed to see whether it sup-
ports the larger theory that has been developed. This iterative process can result in
revising and deepening constructs as well as the larger theory based on relationships
between constructs.
An important element of iterative analysis is note taking or memoing. Researchers
should write down their thoughts and reactions as soon after each interview, focus group,
or site visit that time will allow. Researchers may want to write down not only what partici-
pants say they feel, but also whether or not what they say is credible.
Perhaps most important, during the iterative process researchers use
negative case analysis, which means that they deliberately look for cases and instances
that contradict the ideas and theories that they have been developing. Negative case analy-
sis helps to establish boundaries and conditions for the theory that is being developed by
the qualitative researcher. The general stance of qualitative researchers should be skepti-
cism toward the ideas and theory they have created based on the data they have collected.12
Otherwise they are likely to look for evidence that confirms their preexisting biases and
early analysis. Doing so may result in important alternative conceptualizations that are
legitimately present in the data being completely overlooked.
Iterative and negative case analyses begin in the data reduction stage. But they con-
tinue through the data display and conclusion drawing/verification stages. As analysis
continues in the project, data displays are altered. Late in the life of the project, iterative
analysis and negative case analysis provide verification for and qualification of the themes
and theories developed during the data reduction phase of research.
Data Reduction: The Role of Tabulation The use of tabulation in qualitative analyses is
controversial. Some analysts feel that any kind of tabulation will be misleading. After all,
the data collected are not like survey data where all questions are asked of all respondents
in exactly the same way. Each focus group or in-depth interview asks somewhat different
questions in somewhat different ways. Moreover, frequency of mention is not always a
good measure of research importance. A unique answer from a lone wolf in an interview
Iteration Working through
the data several times in
order to modify early ideas.
Memoing Writing down
thoughts as soon as possible
after each interview, focus
group, or site visit.
Negative case analysis
Deliberately looking for
cases and instances that
contradict the ideas and
theories that researchers
have been developing.
www.MyEbookNiche.eCrater.com

Chapter 9 Qualitative Data Analysis 229
may be worthy of attention because it is consistent with other interpretation and analysis,
or because it suggests a boundary condition for the theory and findings.13
Exhibit 9.4 shows a tabulation from the study of senior adoption of the Internet. The
most frequently coded response was “communication,” followed by “self-directed values/
behavior.” While this result may seem meaningful, a better measure of the importance of
communications to seniors over the Internet is likely to be found using surveys. But the
result does provide some guidance. All 27 participants in the study mentioned the use of
the Internet for communication, so researchers are likely to investigate this theme in their
analysis even if the tabulations are not included in the final report. Note that qualitative
researchers virtually never report percentages. For example, they seldom would report
four out of ten that are positive about a product concept as 40 percent. Using percentages
would inaccurately imply that the results are statistically projectable to a larger population
of consumers.
Tabulation can also keep researchers honest. For example, researchers involved in
the senior Internet adoption study were initially impressed by informants who made the
decision to adopt the Internet quickly and dramatically when someone showed them an
Internet function that supported a preexisting interest or hobby (coded as “a-ha”). But the
code only appeared three times across the 27 participants in the study. While researchers
Exhibit 9.4 Tabulation of Most Frequently Appearing Categories in the Senior Adoption
of the Internet Study
Themes Passages
Documents
(Participants)
Communication—uses 149 27
Self-directed values and behavior 107 23
Shopping/conducting biz—uses 66 24
Gather information—uses 65 25
Classes to learn the Internet 64 22
Future intended uses 63 20
Mentors/teachers helping to learn 55 20
Difficulty in learning 50 20
Self-efficacy/proactive coping—outcome 46 16
Later life cycle uses (e.g., genealogy) 45 19
Entertainment—uses 43 24
Excitement about the Internet 40 14
Adopting to facilitate hobbies 40 15
Technology optimism 40 18
Proactive coping 38 19
Health information on Internet—uses 34 19
Bricolage (Tinkering to learn the Internet) 34 20
www.MyEbookNiche.eCrater.com

230 Part 4 Data Preparation, Analysis, and Reporting the Results
may judge the theme worthy of mention in their report, they are unlikely to argue that
“a-ha” moments are central in the senior adoption decision process. Counting responses
can help keep researchers honest in the sense that it provides a counterweight to biases
they may bring to the analysis.14
Another way to use tabulation is to look at co-occurrences of themes in the study.
Exhibit 9.5 shows the number of times selected concepts were mentioned together in
the same coded passage. In the exhibit, the categories or themes most often mentioned
together with curiosity were technology optimism, proactive coping skills (“I can fig-
ure it out even if it makes me feel stupid sometimes”), and cultural currency (adopting
to keep up with the times). The co-mentions with curiosity suggest that qualitative
analysts would consider the idea that curious people are more likely to be technology
optimists, to be interested in keeping up with the times, and to have strong proac-
tive coping skills. But interpreting these numbers too literally is risky. Further itera-
tive analysis is required to develop these conceptual ideas and to support (or refute)
their credibility. Whenever the magnitude of a finding is important to decision makers,
well-designed quantitative studies are likely to provide better measures than are quali-
tative studies.
Some researchers suggest a middle ground for reporting tabulations of qualitative data.
They suggest using “fuzzy numerical qualifiers” such as “often,” “typically,” or “few” in
their reports.15 Marketing researchers usually include a section in their reports about limi-
tations of their research. A caution about the inappropriateness of estimating magnitudes
based on qualitative research typically is included in the limitations section of the report.
Therefore, when reading qualitative findings, readers would be cautioned that any numeri-
cal findings presented should not be read too literally.
Step 2: Data DisplayQualitative researchers typically use visual displays to summarize data. Data displays are
important because they help reduce and summarize the extensive textual data collected
in the study in a way that conveys major ideas in a compact fashion. There is no one way
to display and present data in qualitative analysis. Any perusal of qualitative reports will
Exhibit 9.5 Relationships between Categories: Co-Mentions of Selected Constructs
in the Senior Adoption of the Internet Study
Curiosity
Technology
Optimism
Proactive
Coping Skills Cultural Currency
Curiosity 107*
Technology
optimism 16 40
Proactive
coping skills 19 10 38
Cultural
currency 12 8 7 26
*Diagonal contains total number of mentions of each concept.
www.MyEbookNiche.eCrater.com

Chapter 9 Qualitative Data Analysis 231
find a wide variety of formats, each developed in response to the combination of research
problem, methodology (ethnography, case study, focus group, or in-depth interview, for
instance), and focus of analysis. Coming up with ideas for useful data displays is a creative
task that can be both fun and satisfying. Some data displays provide interim analysis and
thus may not be included in the final report. In any case, the displays will probably change
over the course of analysis as researchers interpret and re-read their data and modify and
qualify their initial impressions. The displays also evolve as researchers seek to better dis-
play their findings.
Displays may be tables or figures. Tables have rows or row by column formats that
cross themes and/or informants. Figures may include flow diagrams, traditional box and
arrow causal diagrams (often associated with quantitative research), diagrams that display
circular or recursive relationships, trees that display consumers’ taxonomies of products,
brands, or other concepts, consensus maps, which picture the collective connections that
informants make between concepts or ideas, and checklists that show all informants and
then indicate whether or not each informant possesses a particular attitude, value, behav-
ior, ideology, or role, for instance. While displays of qualitative findings are quite diverse,
some common types of displays include the following:
∙ A table that explains central themes in the study. For example, a study of technology
products uncovered eight themes that represent the paradoxes or issues in technology
adoption and use (see Exhibit 9.6).
∙ A diagram that suggests relationships between variables. An example of a diagram
that pictures relationships between themes comes from the earlier mentioned study
of skydiving (see Exhibit 9.7). The diagram pictures how three sets of motivations
evolve over time as skydivers become more experienced. The arrows are double-sided
because movement to a higher level is not complete, since skydivers revisit and experi-
ence the lower level motivations.
∙ A matrix including quotes for various themes from representative informants. An ex-
ample of this is a table from the previously mentioned study of involvement with cos-
metics and brand attitudes in post-socialist Europe, which shows attitudes of women
who are ambivalent about cosmetics (see Exhibit 9.8). Other tables included in the
study contain parallel verbatims for women who have embraced cosmetics and women
who have rejected cosmetics.
Step 3: Conclusion Drawing/VerificationThe iterative process and negative case analysis continues through the verification
phase of the project. The process includes checking for common biases that may
affect researcher conclusions. A list of the most common biases to watch out for is
shown in Exhibit 9.9. In addition to actively considering the possibility of bias in
the analysis, researchers also must establish credibility for their findings. We explain
credibility next.
Verification/Conclusion Drawing: Credibility in Qualitative Research Quantita-
tive researchers establish credibility in data analysis by demonstrating that their results
are reliable (measurement and findings are stable, repeatable, and generalizable) and
valid (the research measures what it was intended to measure). In contrast, the credibil-
ity of qualitative data analysis is based on the rigor of “the actual strategies used for
collecting, coding, analyzing, and presenting data when generating theory.”16 The es-
sential question in developing credibility in qualitative research is “How can (a
www.MyEbookNiche.eCrater.com

232 Part 4 Data Preparation, Analysis, and Reporting the Results
Exhibit 9.6 Eight Central Paradoxes of Technological Products
Paradox Description
Control/chaos Technology can facilitate regulation or order, and
technology can lead to upheaval or disorder
Freedom/enslavement Technology can facilitate independence or fewer
restrictions, and technology can lead to dependence or
more restrictions
New/obsolete New technologies provide the user with the most recently
developed benefits of scientific knowledge, and new
technologies are already or soon to be outmoded as they
reach the marketplace
Competence/incompetence Technology can facilitate feelings of intelligence or efficacy,
and technology can lead to feelings of ignorance
or ineptitude
Efficiency/inefficiency Technology can facilitate less effort or time spent in certain
activities, and technology can lead to more effort or time in
certain activities
Fulfills/creates needs Technology can facilitate the fulfillment of needs or desires,
and technology can lead to the development or awareness
of needs or desires previously unrealized
Assimilation/isolation Technology can facilitate human togetherness, and
technology can lead to human separation
Engaging/disengaging Technology can facilitate involvement, flow, or activity, and
technology can lead to disconnection, disruption,
or passivity
Source: David Glen Mick and Susan Fournier, “Paradoxes of Technology: Consumer Cognizance, Emotions and
Coping Strategies,” Journal of Consumer Research 25 (September 1998), p. 126. © 1998 by JOURNAL OF
CONSUMER RESEARCH, Inc.
researcher) persuade his or her audiences that the research findings of an inquiry are
worth paying attention to?”17
The terms validity and reliability have to be redefined in qualitative research. For
example, in qualitative research the term emic validity means that the analysis presented
in the report resonates with people inside the studied culture or subculture, a form of
validity established by member checking. Similarly, cross-researcher reliability means
the text and images are coded similarly among multiple researchers. However, many
qualitative researchers prefer terms such as quality, rigor, dependability, transferabil-
ity, and trustworthiness to the traditionally quantitative terms validity and reliability.
Moreover, some qualitative researchers completely reject any notions of validity and
reliability, believing there is no single “correct” interpretation of qualitative data.18 In this
Emic validity An attribute
of qualitative research that
affirms that key members
within a culture or subculture
agree with the findings of a
research report.
Cross-researcher reliability
The degree of similar-
ity in the coding of the
same data by different
researchers.
www.MyEbookNiche.eCrater.com

Chapter 9 Qualitative Data Analysis 233
Exhibit 9.7 Evolution of Motives for High-Risk Consumption in Relation to Risk
Acculturation and Experience
Source: Richard L. Celsi, Randy L. Rose, and Tom W. Leigh, “An Exploration of High Risk Leisure Consumption
through Skydiving,” Journal of Consumer Research 20 (June 1993), p. 14. Copyright 1993 by the University of
Chicago Press.
HIGH RISK
ACTIVITIES
SURVIVAL
THRILL
RISK ACCULTURATION
EX
PE
RIE
NC
E
HIGH
HIGH
NORMATIVE
INFLUENCE
ACHIEVEMENT
PLEASURE GROUP
IDENTITY
PERSONAL IDENTITY
FLOW COMMUNITAS/
PHATIC COMMUNION
chapter, we use the term credibility to describe the rigor and believability established in
qualitative analysis.
Triangulation is the technique most often associated with credibility in qualita-
tive research.19 Triangulation requires that research inquiry be addressed from multiple
perspectives. Several kinds of triangulation are possible:
∙ Multiple methods of data collection and analysis.
∙ Multiple data sets.
∙ Multiple researchers analyzing the data, especially if they come from different
backgrounds or research perspectives.
∙ Data collection in multiple time periods.
∙ Providing selective breadth in informants so that different kinds of relevant groups
that may have different and relevant perspectives are included in the research.
Credibility is also increased when key informants and other practicing qualitative
researchers are asked to review the analyses. As mentioned, soliciting feedback from key
Credibility The degree of
rigor, believability, and trust-
worthiness established by
qualitative research.
Triangulation Addressing
the analysis from multiple
perspectives, including
using multiple methods of
data collection and analysis,
multiple data sets, multiple
researchers, multiple time
periods, and different kinds of
relevant research informants.
www.MyEbookNiche.eCrater.com

234 Part 4 Data Preparation, Analysis, and Reporting the Results
Exhibit 9.8 Postsocialist Eastern European Women’s Product Involvement and Brand
Commitment: Informants Who Were Ambivalent about Cosmetics
3.1: Normally I wash my hair twice a week.
But . . . I knew we would meet, so I washed it
yesterday. It depends on my mood. I use
corrector and cream powder in winter when
I am not so brown, but in the summer. . . .
It is disgusting. If I go to a movie I don’t.
So, I always say, “Okay, you have to have
a nice look, but you don’t have to prepare for
the next beauty contest every morning.”
3.2: When I’ll be the grandparent then it will be
okay for the parent, because I’ve changed my
way of thinking. I will give it to my children.
3.3: I mean during the socialist communist
regime there wasn’t a choice. People
weren’t conscious about cosmetics. The
only thing that was important was to have a
workplace and to meet the requirement of
the socialist men and women.
3.4: There is Cosmopolitan in Hungarian, but it
is not as good as in English. It is thinner, and
there are only advertisements in it and about
sex and that is all. I am lucky because we have
an English teacher at the university, and they
subscribe to this magazine, and I can read it.
And there are fashion models, as well and
cooking advice and so on. So, it is much nicer.
3.5: We have to forget about communism,
and we have to change our way of thinking,
but it is very, very hard to change the
thinking of the whole country.
3.6: If I have money I get cosmetics at a
pharmacy, If I don’t have much money I go
to a drugstore. Usually (pharmacists) have
creams that they do themselves. They are
good ones because they know what to put
in them, but they don’t have names. And
they are cheaper. . . . The name isn’t
Cosmetics use and
involvement
Consumer as
interpreter
Cultural ideologies
and intermediaries
Local context and
social networks
Ideological
positions
Involvement with
branded
products
3.8: Only if something bad happened, a
disaster, and then I wouldn’t think about
appearance. Mascara, this is something
that I always use, and powder everyday for
my face. I like it. . . . Mascara, I can put that
on myself. But I can’t put on makeup. I can
give advice, but I don’t know how to do it for
myself. Maybe I am too stressed, I won’t get the
effect that I want. I feel better without makeup.
3.9: I buy things that I don’t really need. I
know that I don’t need it, but it, and then I
am sorry. . . . Those things can wait.
3.10: Romanian women are more attractive
than five years ago because they have the
chance to find out new things from TV and
magazines—how to put on makeup and how
to dress. For instance, my mother doesn’t
take care of herself. . . . You know we didn’t
learn how to use cosmetics from her. We
watched TV, read books. My mother didn’t
tell me anything.
3.11: They judge you according to appearance.
Even in the job, women discuss . . . and then
you also have to buy it, because you want
to be at the same level. I saw this, and after
they buy the products, they show off. Look
what I have. Those who cannot buy suffer,
even if they don’t admit it. It is painful. . . .
After the Revolution, I guess this is when it
started—with jeans.
3.12: If you look good, you get a good guy, a
good job, even though you are not very
smart. But many have problems because of
this . . . it is risky to look good. Everyone
wants to look better than the other. They
think that if you are dressed according to the
latest fashion, everyone will think that you
have money and have a good life.
3.13: I saw many women that want to use
branded products, not because they know it
is good, but because they saw a commercial,
or they want to show off. They don’t think it is
possible that the products don’t fit you.
Branded products might not fit you. At some
point, we had Pantene shampoos. All the
Alexandra Laura
(continued)
www.MyEbookNiche.eCrater.com

Chapter 9 Qualitative Data Analysis 235
Alexandra Laura
commercial breaks had ads with Pantene. I
didn’t want to buy. I got it as a gift and used
it, and I wasn’t happy with it. I didn’t like. It
might be a good brand, but it didn’t fit me,
so brand is not enough.
3.14: I prefer L’Oreal, and Avon and Oriflame
have good body lotion. I still like to try other
things. I like to try only things that I have
heard of.
important to me, what is important is quality. If I
find an unknown product, but it is good for me,
I buy it. . . . And I don’t trust these (products) . . .
it would be cheaper to buy them, but I haven’t
heard about them. I don’t trust them.
3.7: This is my favorite. I just found it. . . . It is
brand new. I tried Wash & Go. It was
advertised very frequently, and everybody
ran to the shops and bought it. But I said,
“OK, it’s very popular, but it is not good for
me (it tangled my hair).”
Brand commitment
and brand
experimentation
Source: Robin A. Coulter, Linda L. Price, and Lawrence Feick, “Rethinking the Origins of Involvement and Brand Commitment: Insights from
Postsocialist Europe,” Journal of Consumer Research 30 (September 2003), p. 159. © 2003 by JOURNAL OF CONSUMER RESEARCH, Inc.
Exhibit 9.8 Postsocialist Eastern European Women’s Product Involvement and Brand
Commitment: Informants Who Were Ambivalent about Cosmetics, continued
Exhibit 9.9 Threats to Drawing Credible Conclusions in Qualitative Analysis
Salience of first impressions or of observations of highly concrete or dramatic incidents.
Selectivity which leads to overconfidence in some data, especially when trying to confirm
a key finding.
Co-occurrences taken as correlations or even as causal relationships.
Extrapolating the rate of instances in the population from those observed.
Not taking account of the fact that information from some sources may be unreliable.
Source: Adapted from Matthew B. Miles and A. Michael Huberman, Handbook of Qualitative Research,
An Expanded Sourcebook (Thousand Oaks, CA: Sage Publications, 1994), p. 438.
informants or member checking strengthens the credibility of qualitative analysis. Seeking
feedback from external expert reviewers, called peer review, also strengthens credibility.
Key informants and external qualitative methodology and topic area experts often question
the analyses, push researchers to better clarify their thinking, and occasionally change key
interpretations in the research. When member checking and peer review are utilized in a
qualitative design, it is reported in the methodological section of the report.
Writing the Report
Researchers should keep in mind that research reports are likely to be read by people in
the company who are not familiar with the study. Moreover, the study may be reviewed
years later by individuals who were not working at the company at the time the research
was conducted. Therefore, the research objectives and procedures should be well explained
Peer review A process in
which external qualitative
methodology or topic area
specialists are asked to
review the research
analysis.
www.MyEbookNiche.eCrater.com

236 Part 4 Data Preparation, Analysis, and Reporting the Results
both to current and future decision makers. Qualitative research reports typically contain
three sections:20
1. Introduction
a. Research objectives
b. Research questions
c. Description of research methods
2. Analysis of the data/findings
a. Literature review and relevant secondary data
b. Data displays
c. Interpretation and summary of the findings
3. Conclusions and recommendations
The introductory portion of the report should present the research problem, objec-
tives of the research, and the methodology used. As do quantitative researchers, qualitative
researchers report the procedures they used to collect and analyze data. The methodology
section of a qualitative report usually contains:
∙ Topics covered in questioning and other materials used in questioning informants.
∙ If observational methods are used, the locations, dates, times, and context of observation.
∙ Number of researchers involved and their level of involvement in the study. Any di-
versity in background or training of researchers may be highlighted as positive for the
study because multiple viewpoints have been brought to the analysis.
∙ Procedure for choosing informants.
∙ Number of informants and informant characteristics, such as age, gender, location, and level
of experience with the product or service. This information is often summarized in a table.
∙ The number of focus groups, interviews, or transcripts.
∙ The total number of pages of the transcripts, number of pictures, videos, number, and
page length of researcher memos.
∙ Any procedures used to ensure that the data collection and analysis were systematic.
For example, coding, iterative analysis of transcripts, member checking, peer reviews,
and so forth.
∙ Procedures used for negative case analyses and how the interpretation was modified.
∙ Limitations of qualitative methodology in general, and any limitations that are specific
to the particular qualitative method used.
Two examples of explaining the general limitations of qualitative methodology in a
report are:
“The reader is cautioned that the findings reported here are qualitative, not
quantitative in nature. The study was designed to explore how respondents feel
and behave rather than to determine how many think or act in specific ways.”
“Respondents constitute a small nonrandom sample of relevant consumers and
are therefore not statistically representative of the universe from which they
have been drawn.”21
Analysis of the Data/FindingsThe sequence of reported findings should be written in a way that is logical and persuasive.
Secondary data may be brought into the analysis to help contextualize the findings. For
instance, in the senior adoption of the Internet study, the demographics of senior adopters
www.MyEbookNiche.eCrater.com

Chapter 9 Qualitative Data Analysis 237
were included in the report to contextualize the qualitative findings. Also, general topics
precede more specific topics. For example, a discussion of findings related to seniors’
general attitudes toward and adoption of technology will precede the discussion of senior
Internet adoption.
Data displays that summarize, clarify, or provide evidence for assertions should
be included with the report. Verbatims, or quotes from research participants, are often
used in the textual report as well as in data displays. When they are well chosen, ver-
batims are a particularly powerful way to underscore important points because they
express consumer viewpoints in their own voice. Video verbatims can be used in live
presentations. Of course, the power of verbatims is a double-edged sword. Colorfully
stated, interesting verbatims do not always make points that are well-grounded in the
body of data collected. Researchers need to take care that they do not select, ana-
lyze, and present verbatims that are memorable rather than revealing of patterns in
their data.
Conclusions and RecommendationsResearchers should provide information that is relevant to the research problem articu-
lated by the client. As two qualitative researchers stated, “A psychoanalytically rich inter-
pretation of personal hygiene and deodorant products is ultimately of little value to the
client if it cannot be linked to a set of actionable marketing implications—for example,
a positioning which directly reflects consumer motivations or a new product directed at
needs not currently addressed.”22 As with quantitative research, knowledge of both the
market and the client’s business is useful in translating research findings into managerial
implications.
When the magnitude of consumer response is important to the client, researchers are
likely to report what they have found, and suggest follow-up research. Even so, qualitative
research should be reported in a way that reflects an appropriate level of confidence in the
findings. Exhibit 9.10 lists three examples of forceful, but realistic recommendations based
on qualitative research.
A sample qualitative report appears in Appendix 9A. The sample is a summary of
a longer report. A longer report should explain each theme in more detail and include
participant verbatims.
Verbatims Quotes from
research participants
that are used in research
reports.
Exhibit 9.10 Making Recommendations Based on Qualitative Research When Magnitude Matters
“The qualitative findings give reason for optimism about market interest in the new
product concept . . . We therefore recommend that the concept be further developed
and formal executions be tested.”
“While actual market demand may not necessarily meet the test of profitability, the data
reported here suggest that there is widespread interest in the new device.”
“The results of this study suggest that ad version #3 is most promising because it elicited
more enthusiastic responses and because it appears to describe situations under which
consumers actually expect to use the product.”
Source: Alfred E. Goldman and Susan Schwartz McDonald, The Group Depth Interview (Englewood Cliffs, N J:
Prentice Hall, 1987), p. 176.
www.MyEbookNiche.eCrater.com

238 Part 4 Data Preparation, Analysis, and Reporting the Results
The business consultant hired by the owners of the Santa Fe
Grill has recommended a quantitative survey of lunch and
dinner customers. He has not recommended any qualitative
research. The owners are not experts in research methods,
but they do know the difference between qualitative and
quantitative research. They are wondering if some kind of
qualitative research approach would be better to understand
the challenges facing them. Or perhaps both qualitative and
quantitative research should be undertaken?
1. Could observation be used to collect qualitative
information?
2. If yes, when and how could observation be used?
3. Are there topics that could be explored better using
focus groups?
4. If yes, suggest topics to be used in the focus group
studies.
CONTINUING CASE SANTA FE GRILL: USING QUALITATIVE RESEARCH
www.MyEbookNiche.eCrater.com

Chapter 9 Qualitative Data Analysis 239
MARKETING RESEARCH IN ACTION
A Qualitative Approach to Understanding Product Dissatisfaction
Product dissatisfaction has important negative consequences for businesses. In this assign-
ment, you will be investigating the nature of product dissatisfaction qualitatively. Your instruc-
tor will form groups of three or four. In your group, you will be conducting a small-scale
qualitative project about the nature of product dissatisfaction. There are seven project-related
assignments that will help step you through the process of qualitative analysis. As you work
your way through the assignments, you will be analyzing textual data. Your instructor may
ask you to present your findings after each step, or when you have completed all seven steps.
Project Assignment 1 Write a two-page summary about an unsatisfactory purchase expe-
rience you have made recently. In your narrative essay, you should include (1) the product
or service, (2) your expectations when you bought the product or service, (3) any interac-
tions with salespeople or customer service people before, during, or after the purchase, (4)
the feelings and emotions that accompanied your dissatisfaction, and (5) the outcomes of
your dissatisfaction. You should include any other details you remember as well.
The narrative should be posted to the class discussion group, or alternately, each stu-
dent should bring five copies to class. In class, your instructor will help your group to
solicit 10 different product or service dissatisfaction summaries from students outside their
group to form the textual data set you will be analyzing in subsequent steps.
Project Assignment 2 With your group members, collectively go through three of the prod-
uct dissatisfaction narratives, writing codes in the margins of the narratives to represent cate-
gories or themes. As you go, write codes directly on the narratives and create a separate code
sheet. You will likely need to create new codes as you go through the narrative, but the num-
ber of new codes needed will be smaller the more narratives that are coded. Look at the sam-
ple code sheet in Exhibit 9.2 and a coded section of a transcript in Exhibit 9.3. The exhibit
uses numbers, but it is probably easier for you to simply label your data with the name of the
category. For example, you may write “emotion: disappointment” in the margin any time you
encounter an instance of disappointment. Hint: In coding, relevant categories for this project
may include (1) factors that lead to dissatisfaction (e.g., poor product quality), (2) emotions
and thoughts related to dissatisfaction (e.g., disappointment and frustration), and (3) outcomes
of dissatisfaction (e.g., returning the product, telling others). Your categories may need to be
broken down into subcategories. For example, there may be several outcomes of dissatisfac-
tion, each one of which is a subcategory of the more general category “outcomes.”
You are likely to uncover categories and codes other than those suggested here as you
go through the transcripts. Please work from the data as much as possible to develop your
categories. We have suggested categories only to get you started.
When your group has coded three narratives together, the remaining seven can be
divided among individuals in the group to be coded. Some codes may still have to be added
to the code sheet as individual group members code. Any new codes should be added to the
master code sheet that group members are utilizing. The result should be ten coded narra-
tives and one master code sheet.
www.MyEbookNiche.eCrater.com

240 Part 4 Data Preparation, Analysis, and Reporting the Results
Project Assignment 3 Your group has now read and coded all ten narratives, so you are
familiar with your data set. With your group members, make a list of how the cases are
similar. Then make a list of how the cases are dissimilar. Do your lists suggest any issues
for further qualitative research to investigate? If yes, please make a list of the issues. What
have you learned from the process of comparison that helps you better understand product
dissatisfaction? Is the product dissatisfaction experience similar across the narratives, or
are there differences?
Project Assignment 4 Create a data display or two that usefully summarizes your find-
ings. Exhibits 9.6 through 9.8 show sample displays. Hint: It is likely easiest in this case to
create a list of your themes along with representative verbatims and/or a conceptual dia-
gram showing variables leading to product dissatisfaction and the outcomes (thoughts,
emotions, and behaviors) that result from dissatisfaction. The result will be data display(s)
that will be used as part of your presentation of the results.
Project Assignment 5 Perhaps the most difficult task for new researchers is to come up
with an overarching concept that integrates your categories. Re-read the section on integra-
tion on pp. 227 and 228 in your text. As a group, come up with one idea or concept that
integrates all your themes into one overarching theme.
Project Assignment 6 If your group were to further refine your analysis, which of the
techniques that help ensure credibility would you use? Write down your choices and briefly
explain why they would improve the credibility of the analysis.
Project Assignment 7 Based on your group’s analysis in project assignments #1 to #6,
make a presentation to the class that includes slides that address methodology, findings
(including some relevant verbatims and your data display(s)), research limitations, and
conclusions and recommendations. Your findings should develop a theory of product dis-
satisfaction based on your data set and should be informed by the analyses you have done
across steps #1 to #6. Your group’s recommendations should flow from your analyses and
be useful to businesses in both reducing product dissatisfaction and managing product dis-
satisfaction after it occurs.
Turn in a copy of your presentation along with the coded narratives, and your master
code sheet.
Summary
Contrast qualitative and quantitative data analyses.
There are many differences between qualitative and quan-
titative data analyses. The data that are analyzed in qualita-
tive research include text and images, rather than numbers.
In quantitative research, the goal is to quantify the mag-
nitude of variables and relationships, or explain causal
relationships. In qualitative analysis, the goal of research is
deeper understanding. A second difference is that qualitative
analysis is iterative, with researchers revisiting data and
clarifying their thinking during each iteration. Third, quan-
titative analysis is driven entirely by researchers, while
good qualitative research employs member checking, or
www.MyEbookNiche.eCrater.com

Chapter 9 Qualitative Data Analysis 241
asking key informants to verify the accuracy of research
reports. Last, qualitative data analysis is inductive, which
means that the theory grows out of the research process
rather than preceding it, as it does in quantitative analysis.
Explain the steps in qualitative data analysis.
After data collection, there are three steps in analyz-
ing qualitative data. Researchers move back and forth
between these steps iteratively rather than going through
them one step at a time. The steps are data reduction,
constructing data displays, and drawing/verifying con-
clusions. Data reduction consists of several interrelated
processes: categorization and coding, theory develop-
ment and iteration, and negative case analysis. Catego-
rization is the process of coding and labeling sections
of the transcripts or images into themes. Then the cat-
egories can be integrated into a theory through iterative
analysis of the data. Data displays are the second step.
Data displays picture findings in tables or figures so
that the data can be more easily digested and communi-
cated. After a rigorous iterative process, researchers can
draw conclusions and verify their findings. During the
verification/conclusion drawing stage, researchers work
to establish the credibility of their data analysis.
Describe the processes of categorizing and coding
data and developing theory.
During the categorization phase, researchers develop cat-
egories based both on preexisting theory and the categories
that emerge from the data. They code the data in margins
and develop a code sheet that shows the various labels that
they are developing. The codes are revised and revisited as
the theory develops. Comparison of differences and simi-
larities between instances of a category, between related
categories, and between different participants is particularly
useful in better defining constructs and refining theory.
Integration is the process of moving from identifi-
cation of themes and categories to the investigation of
relationships between categories. In selective coding,
researchers develop an overarching theme or category
around which to build their storyline.
Clarify how credibility is established in qualitative
data analysis.
Credibility in data analysis is established through
(1) careful, iterative analysis in categorization and
theory development, (2) the use of negative case anal-
ysis, and (3) triangulation. In negative case analysis,
researchers systematically search the data for informa-
tion that does not conform to their theory. This helps
to establish the credibility of their analysis and to
identify boundary conditions for their theory. Triangu-
lation is especially important in developing credibility
for qualitative data analyses. There are several forms
of triangulation, including using multiple methods of
data collection and analysis; multiple data sets; mul-
tiple researchers; data collection in multiple time peri-
ods; and informants with different perspectives and
experiences. Credibility is also enhanced with mem-
ber checking, which is soliciting feedback about the
accuracy of the analysis from key informants. In peer
review, qualitative methodology experts are asked to
critique the qualitative report.
Discuss the steps involved in writing a qualitative
research report.
A qualitative report has three sections: (1) introduc-
tion; (2) analysis of the data/findings; and (3) conclu-
sions and recommendations. In the introductory portion
of the report, the objectives of the research and meth-
odology are explained. In the data analysis section,
the reported findings are written in a way that is logi-
cal and persuasive. Data displays and verbatims may be
used to enhance the communication of the findings. The
Conclusion includes the marketing implications section.
In this part of the report, researchers provide information
that is relevant to the research problem articulated by the
client.
Key Terms and Concepts
Categorization 224
Codes 224
Code sheet 224
Comparison 227
Credibility 233
Cross-researcher reliability 232
Data reduction 224
Emic validity 232
Integration 227
Iteration 228
www.MyEbookNiche.eCrater.com

242 Part 4 Data Preparation, Analysis, and Reporting the Results
Member checking 222
Memoing 228
Negative case analysis 228
Peer review 235
Recursive 227
Selective coding 227
Triangulation 233
Verbatims 237
Review Questions
1. How are quantitative and qualitative data analyses
different?
2. Describe the three steps in qualitative data analysis
and explain how and why these steps are iterative.
3. What are the interrelated steps in data reduction?
4. How do you build theory in qualitative analysis?
5. What is negative case analysis and why is it impor-
tant to the credibility of qualitative analysis?
6. Give some specific examples data displays and ex-
plain of how they may be used in qualitative data
analysis.
7. What are some of threats to drawing credible conclu-
sions in qualitative data analysis?
8. What is triangulation and what is its role in qualita-
tive analysis?
9. What are the various ways that credibility can be
established in qualitative analysis?
Discussion Questions
1. Compare and contrast reliability and validity in quan-
titative analysis with the concept of credibility used
in qualitative analysis. Do you believe the concepts
are really similar? Why or why not?
2. Let’s say your college has as a goal increasing partici-
pation in student activities on campus. To help this
effort, you are doing an ethnographic study to better
understand why students do or do not participate in
student activities. How would you plan for triangula-
tion in this study?
3. EXPERIENCE MARKETING RESEARCH. Ask
permission from three people to analyze the content of
their Facebook or similar site (of course, you should
promise them anonymity). If the sites are extensive,
you may need a plan to sample a portion of the web-
site (at least five to ten representative pages). As you
go through the sites, develop a coding sheet. What did
you learn about social networking sites from your cod-
ing? What content categories are the most frequently
occurring? What do you conclude based on the fact
that these categories are the most frequently occurring
at these three websites? Are there any implications
of your findings for advertisers that are considering
advertising on social networking sites?
4. An anthropology professor over the age of 50 took
a year of leave, and spent the year undercover as a
student at her college. She did not take classes in
her own department, but instead signed up, attended
classes, took exams, and wrote papers just like any
other freshmen. She lived in the dorm for part of the
year. At the end of a year, she wrote a book entitled
My Freshman Year,23 which details her findings. In
reporting the research methodology of her study,
what methodological strengths and weaknesses
should the anthropology professor address?
5. Conduct three or four in-depth interviews with
college students who are not business majors. You
will be conducting an investigation of the asso-
ciations that college students make with the word
marketing. You can ask students to bring five to
ten images of any type (pictures, cutouts from maga-
zines) that most essentially picture what they think
marketing is all about. You may also conduct a word
association exercise with the students. During the
interview, you may want to tell informants that you
are an alien from another planet and have never heard
of marketing. Based on your interviews, develop
a diagram that shows the concepts that students
relate to marketing. Draw a circle around the most
frequently occurring connections in your diagram.
What did you learn about how college students view
marketing?
www.MyEbookNiche.eCrater.com

243
SAMPLE QUALITATIVE RESEARCH REPORT
Advertising’s Second Audience: Employee Reactions to Organizational Communications
Advertising consists of specialized statements that are, first and foremost, attempts by the organization to cre-
ate situations in which consumers and others will be motivated to engage in actions that are favorable to the
organization. Nevertheless, employees are a potentially important “second audience.” Advertising can be a
tool for communicating with, motivating, and educating employees.
In this study, we examine the effects, both positive and negative, of advertising on organizational employees.
We also suggest ways in which advertising managers can include this internal audience in their decision making.
Methodology
A qualitative research design was used because research to date is not sufficiently rich to model the possible
effects. Thus, the study was designed not to test specific hypotheses, but instead to uncover all the possible
effects of outcomes of organizational advertising on employees. Four companies were recruited from the Mar-
keting Science Institute (MSI) roster of member companies to participate in the research.
We conducted interviews and focus groups with employees, marketing and advertising managers, and
human relations managers at four different companies. Two data collection methods were used at each participat-
ing company. First, in-depth interviews were conducted with advertising decision makers and advertising agency
contacts (n = 19). All individual interviews were audiotaped and transcribed for analysis. The second source of
data was focus groups with employees. Four to five focus groups were recruited from a variety of employee cat-
egories within the organization. A total of 151 individuals participated in the focus group data collection.
How Do Employees Evaluate Advertising?
We found that employees evaluate not only the accuracy of organizational advertising; they judge its effec-
tiveness and appropriateness as well. Employees want their organization to do well, and they see effective
advertising as an important component in this success. Employees view themselves, and are viewed by
friends and family, as organizational representatives. As such, they are frequently called upon to “explain”
their company’s actions, including advertising. Thus, they also want ads to appropriately reflect their values
and their image of the company.
Several factors were found to affect the intensity of employee reactions to organizational advertising.
The foremost is whether a given employee is in a customer contact position, and thus is more likely to
feel the effects of customer comments and requests. But regardless of whether employees are in contact
with customers, organizational communication with regard to an advertising campaign—its strategy, goals,
purposes—can strongly affect employee reception of that campaign. Importantly, employees who more
strongly identified with, and expressed more loyalty to, their organization were more psychically invested
in their organization’s advertising.
Append ix A
www.MyEbookNiche.eCrater.com

244 Part 4 Data Preparation, Analysis, and Reporting the Results
Gaps between Decision Makers and Employees
The study also identified four potential gaps between decision maker and employee percep-
tions of organizational advertising:
1. Knowledge gap: Decision makers have a greater degree of knowledge about the field
of advertising in general and about company strategy in particular; employees have
greater knowledge of concrete functions and performances of employees.
2. Employee role gap: Decision makers lack knowledge about how employees view
their own roles and their roles as organizational representatives in their personal
networks.
3. Priority gap: Decision makers’ priorities are to make persuasive, effective ads; em-
ployees believe that ads should reflect their vision of the company and their values.
4. Evaluation criteria gap: Decision makers evaluate advertising based on particular
goals and objectives; employees evaluate ads by comparing them to past organiza-
tional ads and to competitors’ ads.
Exhibit 9.11 Advertising Perceptions of Decision Makers and Employees
Gap Source Solution
Knowledge gap Employees don’t understand strategy. Explain company strategy in internal
communications.
Decision makers don’t know about
the portrayed employee function.
Pretest any ads featuring employees
or their function with employees.
Employees lack knowledge of
advertising as a body of knowledge. Communicate with employees
concerning the benefits of the
particular approach taken in current
advertising.
Employee role gap Decision makers don’t understand
employees’ self-role.
If employees are featured, match with
employee group self-role should be
attempted. Don’t overlook support
personnel.
Decision makers don’t understand
that others view employees as
company representatives.
“Sell” advertising and new products to
employees.
Priority gap Decision makers need to make
effective, creative ads.
Explain how minor inaccuracies were
tolerated for impact; employees
understand need for impact.
Employees want ads to reflect their
vision of the company and their
values.
Research employees’ vision and
values; communicate that they have
been heard.
Evaluation criteria
gap
Decision makers evaluate ads
relative to achievement of objectives. Communicate to employees how ads are
helping the company meet objectives.
Employees evaluate ads by
comparing them to past ads and
competitors’ ads.
Knowing how employees “frame” their
judgments, position organization’s ads
within the frame.
Source: From Mary C. Gilly and Mary Wolfinbarger (1996), “Advertising’s Second Audience: Employee Reactions to
Organizational Communications,” Working Paper Series, Report Summary #96-116, Marketing Science Institute.
www.MyEbookNiche.eCrater.com

Chapter 9 Qualitative Data Analysis 245
Strategies for closing these gaps include the following:
∙ Explaining advertising strategies and outcomes to employees in internal communica-
tions and premieres (at a minimum, advertising should be premiered with customer
contact personnel).
∙ Pretesting advertisements featuring employees or their functions with the employees
themselves.
∙ Understanding employees’ vision and values regarding the organization.
∙ In communicating with employees, positioning advertising with respect to employees’
frame of reference.
The gaps and strategies for closing them are summarized in Exhibit 9.11.
Conclusion
This study strongly indicates that advertising decision makers may underestimate the
importance of the employee audience for ads. Given that employees will be influenced
by ads, it is important for companies to make every effort to ensure that this influence is
positive or, at least, to avoid the possible negative influence of ads. Decision makers must
recognize that employees enjoy an “insider” role and want to be informed in advance of
marketing communications.
If messages and themes can be identified to have positive effects on employees as well
as on customers, such messages may be incorporated into advertising campaigns that con-
tribute to employee commitment to the organization. Employee commitment in turn will
increase the quality of the organization’s products and services.
Source: Report adapted from Mary C. Gilly and Mary Wolfinbarger, “Advertising’s
Second Audience: Employee Reactions to Organizational Communications,” Working
Paper Series, Report Summary #96-116, Marketing Science Institute, 1996.
www.MyEbookNiche.eCrater.com

Preparing Data for Quantitative Analysis
C h a p t e r 1 0
www.MyEbookNiche.eCrater.com

Learning Objectives After reading this chapter, you will be able to:
1. Describe the process for data preparation and analysis.
2. Discuss validation, editing, and coding of survey data.
3. Explain data entry procedures and how to detect errors.
4. Describe data tabulation and analysis approaches.
Scanner Data Improves Understanding of Purchase Behavior
When you purchase something in a drugstore, supermarket, or almost any retail
store, the item you purchase is scanned into a computer. The bar code enables
each store to know exactly what products are selling, when, and at what price.
Store managers also can keep accurate control of inventory so they can easily
order more products when they run low. Walmart is among the leaders in the
use of scanner data. Walmart does not own most of the products on its shelves.
Instead, the product manufacturers arrange to put them on Walmart shelves but
still own the products. With its scanning system, Walmart always knows what
is on their shelves, where in the store it is placed, what products are selling, and
which ones need to be reordered. Scanner data has enabled Walmart and other
retailers to build and manage larger inventories than would have been possible a
few years ago.
Scanner equipment can also be used with bar-coded customer cards so cus-
tomers can be associated with their purchases and the data stored in a central
database. The process takes a second or two per transaction, and requires only
that the customers produce the card at purchase time. Scanner technology is
widely used in the marketing research industry. Questionnaires can be prepared
using word processing software and printed on a laser printer. Respondents can
complete the questionnaire with any type of writing instrument. With the appro-
priate software and scanning device, the researcher can scan the completed ques-
tionnaires and the data are checked for errors, categorized, and stored in a matter
of seconds. Retailers often collect 400 to 500 completed surveys in a week or
so. Thus, scanner technology offers many benefits for data collection at a very
reasonable cost.1
www.MyEbookNiche.eCrater.com

248 Part 4 Data Preparation, Analysis, and Reporting the Results
Value of Preparing Data for Analysis
Data collected using traditional methods (i.e., personal interviews, telephone interviews,
CATI, direct mail, and drop-off) must be converted to an electronic format for data analy-
sis. Data from Internet or web-based surveys, handheld PCs, scanner databases, and com-
pany data warehouses are already in electronic format, but also require preparation. For
example, data may be obtained in Excel format and must be converted to SPSS format. Or
data collected using open-ended questions will have to be coded for analysis. Converting
information from surveys or other data sources so it can be used in statistical analysis is
referred to as data preparation.
The data preparation process typically follows a four-step approach, beginning with data
validation, then editing and coding, followed by data entry and data tabulation. Data prepa-
ration is essential in converting raw data into usable coded data for data analysis. But data
preparation also plays an important role in assessing and controlling data integrity and ensur-
ing data quality by detecting potential response and nonresponse biases created by interviewer
errors and/or respondent errors, as well as possible coding and data entry errors. Data prepara-
tion also is important in dealing with inconsistent data from different sources or in converting
data in multiple formats to a single format that can be analyzed with statistical software.
Interpretation
Descriptive
Analysis
Multivariate
Analysis
Error
Detection
Univariate and
Bivariate Analysis
Validation
Editing and Coding
Data Entry
Data Analysis
Data Tabulation
Exhibit 10.1 Overview of Data Preparation and Analysis
www.MyEbookNiche.eCrater.com

Chapter 10 Preparing Data for Quantitative Analysis 249
With traditional data collection methods, the data preparation process starts after the
interviews, questionnaires, or observation forms have been completed and returned to the
field supervisor or researcher. But new technology associated with online surveys and data
collection methods involving handheld terminals or scanners enables researchers to com-
plete some data preparation tasks in real time and also eliminate data collection errors. In
fact, technology advances are reducing and sometimes eliminating the need to manually
code, verify, and enter data when creating electronic files.
The stages of data preparation and analysis are shown in Exhibit 10.1. Some data col-
lection methods require activities in all stages while other methods involve only limited data
preparation. For example, online surveys are already in electronic format and do not require
data entry, unless some questions are open-ended. This chapter discusses the data preparation
process and Chapters 11 and 12 provide an overview of data analysis for quantitative research.
Validation
The purpose of validation is to determine if surveys, interviews, and observations were
conducted correctly and free of bias, and if data from other sources is accurate and consis-
tent. Data collection often is not easy to monitor closely. To facilitate accurate data collec-
tion in surveys, each respondent’s name, address, zip code, phone number, e-mail address,
or similar information may be recorded. Similarly, to validate data from other sources, for
example, an internal company data warehouse, information must be recorded on when and
where the data were obtained, any manipulations that were conducted, and so forth. While
information on respondents or sources and nature of internal data may not be used for
analysis, it does enable the validation process to be completed.
The initial concern of researchers with surveys is to determine whether question-
naires or observation methods are completed and valid. The purpose of data validation
is to determine if surveys, interviews, and observations were conducted correctly and free
of errors. When data collection involves trained interviewers obtaining data from respon-
dents, the emphasis in validation most often is on interviewer errors, or failure to follow
instructions. If data collection involves online surveys, validation often involves checking to
see if instructions were correctly followed. For example, if quotas such as 70 percent male
respondents, or 80 percent in a specific age range, or only U.S. citizens were specified, then
these guidelines must be checked to ensure they were met. Similarly, if observation involves
online studies, researchers must verify that specified websites or Internet locations were
visited, or whether other execution criteria were followed consistently. Online surveys also
should incorporate approaches to verify that the recruited individuals actually completed the
survey. As with traditional survey methods, this typically involves requesting specific types
of information or including similar questions to assess consistency in responding. Thus, the
main goal of validation is to detect, control, and eliminate fraud, misrepresentation, failure
to follow predetermined instructions, inconsistent or inaccurate data, and so forth.
In marketing research, interviewers submitting false data for surveys are referred to as
curbstoning. As the name implies, curbstoning is when interviewers find an out-of-the-
way location, such as a curbstone, and fill out the survey themselves rather than follow
procedures with an actual respondent. Because of the potential for such falsification, data
validation is an important step when the data acquisition process involves interviewers.
To minimize fraudulent responses, marketing researchers target between 10 percent and
30 percent of completed interviews for “callbacks.” Specifically for telephone, mail, and
personal interviews, a certain percentage of respondents from the completed interviews are
Data validation The
process of determining, to
the extent possible, whether
a survey’s interviews
or observations were
conducted correctly and are
free of fraud or bias.
Curbstoning Cheating
or falsification in the data
collection process.
www.MyEbookNiche.eCrater.com

250 Part 4 Data Preparation, Analysis, and Reporting the Results
recontacted by the research firm to make sure the interview was conducted correctly. Often
through telephone recontact, respondents will be asked several short questions as a way of
validating the returned interview. Generally, the process of validation covers five areas:
1. Fraud. Was the person actually interviewed, or was the interview falsified? Did the
interviewer contact the respondent simply to get a name and address, and then pro-
ceed to fabricate responses? Did the interviewer use a friend to obtain the necessary
information?
2. Screening. Data collection often must be conducted only with qualified respondents.
To ensure accuracy of the data collected, respondents are screened according to some
preselected criteria, such as household income level, recent purchase of a specific
product or brand, brand or service awareness, gender, or age. For example, the data
collection instructions may specify that only female heads of households with an an-
nual household income of $25,000 or more, who are familiar with and have recently
visited a Mexican-themed restaurant, be interviewed. In this case, a validation call-
back could verify each of these factors if an interviewer was involved.
When online data collection is used, screening control methods must be included
in the design, and this is often difficult to do. For example, online surveys may specify
screening criteria but it is up to the respondent to provide accurate information. How
can you prevent a child from completing a survey targeted for their parents if all they
have to do is provide information that meets the requested profile? Follow-up e-mails
are possible but not as effective as follow-up phone calls. One approach is to include
multiple similar questions so the consistency of responses can be assessed.
3. Procedure. In many marketing research projects, data must be collected according to
a specific procedure. For example, customer exit interviews typically must occur in a
designated place as the respondent leaves a certain retail establishment. In this particu-
lar example, a validation callback may be necessary to ensure that the interview took
place at the proper setting, not some social gathering area like a party or a park. For
online surveys, procedure checking involves verifying that screening instructions, skip
patterns, recruitment, quotas, and so forth were adhered to in data collection.
4. Completeness. In order to speed through the data collection process, an interviewer
may ask the respondent only a few of the questions. In such cases, the interviewer
asks the respondent a few questions from the beginning of the questionnaire and then
skips to the end, omitting questions from other sections. The interviewer may then
make up answers to the remaining questions. To determine if the interview is valid,
the researcher could recontact a sample of respondents and ask about questions from
different parts of the questionnaire. This is not a problem with online surveys that
have controls to prevent respondents from skipping questions. But these controls likely
cause some respondents to stop completing the survey before finishing, particularly if
the questions are unclear, difficult, or uninteresting.
Another problem could arise if the data collection process incorporates “skip”
questions to direct interviewers (or respondents) to different parts of the question-
naire. If the interviewer (or respondent on a self-administered survey) fails to follow
instructions for those skip questions, the respondent is asked the wrong questions.
With some data collection approaches the research supervisor can recontact respon-
dents and verify their response to skip questions. Skip questions are not a problem
with online surveys since the computer controls the sequence of answering ques-
tions. But researchers should go online before a survey begins and complete the
questionnaire themselves to ensure skip patterns are executed like they are supposed
to be.
www.MyEbookNiche.eCrater.com

Chapter 10 Preparing Data for Quantitative Analysis 251
5. Courtesy. Respondents should be treated with courtesy and respect during the
interviewing process. Situations can occur, however, where the interviewer may
inject a tone of negativity into the interviewing process. To ensure a positive image,
respondent callbacks are common to determine whether the interviewer was courteous.
Other aspects of the interviewer that are checked during callbacks include appearance,
communication and interpersonal skills.
Editing and Coding
Following validation, the data must be edited for mistakes. Editing is the process of check-
ing the data for mistakes made by the interviewer, the respondent, or in the process of
transferring information from scanner databases or other sources to the company data ware-
house. By reviewing completed interviews from primary research, the researcher can check
several areas of concern: (1) asking the proper questions, (2) accurate recording of answers,
(3) correct screening of respondents, and (4) complete and accurate recording of open-
ended questions. All of the above steps are necessary for traditional data collection meth-
ods. Online surveys must verify respondent screening (at minimum to ensure that specified
instructions were adhered to in programming the survey) and open-ended questions must
be checked and coded if they are used. When information is obtained from internal data
warehouses, it must be checked for availability, consistency, correct format, and so on.
Asking the Proper QuestionsOne aspect of the editing process especially important to interviewing methods is to make
certain the proper questions were asked of the respondent. As part of the editing process,
the researcher will check to make sure all respondents were asked the proper questions.
In cases where they were not, respondents are recontacted to obtain a response to omitted
questions. This task is not necessary with online surveys if they were designed and set up
correctly.
Accurate Recording of AnswersCompleted questionnaires sometimes have missing information. The interviewer may
have accidentally skipped a question or not recorded it in the proper location. With a
careful check of all questionnaires, these problems can be identified. In such cases, if it
is possible, respondents are recontacted and the omitted responses recorded. This task
is not necessary with online surveys if they were designed to prevent respondents from
skipping questions.
Sometimes a respondent will accidentally not complete one or more questions for
various reasons (carelessness, in a hurry to complete the survey, not understanding how
to answer the question, etc.), resulting an incomplete response. For example, the question-
naire has a two-part question where answering the second part is based on the respondent’s
answer to the first part, and the respondent may answer only one part of the question. In
this example, the following two-part question creates the need for the in-house editing
supervisor to adjust or correct the respondent’s answer for completeness.
Does your family use more than one brand of toothpaste?
[ ] Yes [ ] No
If yes, how many brands? 3
Editing The process where
the raw data are checked
for mistakes made by
either the interviewer or the
respondent.
www.MyEbookNiche.eCrater.com

252 Part 4 Data Preparation, Analysis, and Reporting the Results
If the respondent initially did not check either “yes” nor “no,” but indicated “3” brands,
the supervisor should check “yes” to the first part of the question, unless there is other
information to indicate that would be wrong to assume. This situation should not arise with
online questionnaires because the software is designed to prevent it.
Correct Screening QuestionsRecall from the continuing case description in Chapter 1 that a survey of Santa Fe Grill
employees also was completed. The first two questions on the Santa Fe Grill employee ques-
tionnaire shown in Exhibit 10.2 are actually screening questions that determine whether the
respondent is eligible to complete the survey. During the editing phase, the researcher makes
certain only qualified respondents were included in a survey. It is also critical in the edit-
ing process to establish that the questions were asked and (for self-administered surveys)
answered in the proper sequence. If the proper sequence is not followed in self-completion
surveys, the respondent must be recontacted to verify the accuracy of the recorded data.
Exhibit 10.2 The Santa Fe Grill Employee Questionnaire
This is a survey to be completed by employees of the Santa Fe Grill.
Are you currently an employee of the Santa Fe Grill? Yes _____ (continue) No _____
(terminate)
How long have you been an employee 0 = Three months or less (terminate)
of the Santa Fe Grill? 1 = More than three months but less than one year
2 = One year to three years
3 = More than three years
If respondents answer “yes” to the first question, and indicate that they have worked at the
Santa Fe Grill for more than three months then they are permitted to continue answering the
questions on the survey.
The Santa Fe Grill would like to better understand how its employees feel about the work
environment so improvements can be made as needed. Please log on to this URL
http://santafe.qualtrics.com?SE/?SID=SV_10QkhmnGMiTCJ5C to complete the survey.
The survey will take only about 10 minutes to complete, and it will be very helpful to
management in ensuring the work environment meets both employee and company needs.
There are no right or wrong answers. We are simply interested in your opinions, whatever
they may be. All of your answers will be kept strictly confidential.
WORK ENVIRONMENT SURVEY
Section 1: How You Feel About Your Work Environment
The statements lead in below may or may not describe your work environment at the Santa Fe
Grill. Using a scale from 1 to 7, with 7 being “Strongly Agree” and 1 being “Strongly Disagree,” to
what extent do you agree or disagree that each statement describes your work environment at
the Santa Fe Grill:
1. My job teaches me valuable new skills. Strongly Strongly
Disagree Agree
1 2 3 4 5 6 7
2. I enjoy my work at the Santa Fe Grill. Strongly Strongly
Disagree Agree
1 2 3 4 5 6 7
www.MyEbookNiche.eCrater.com
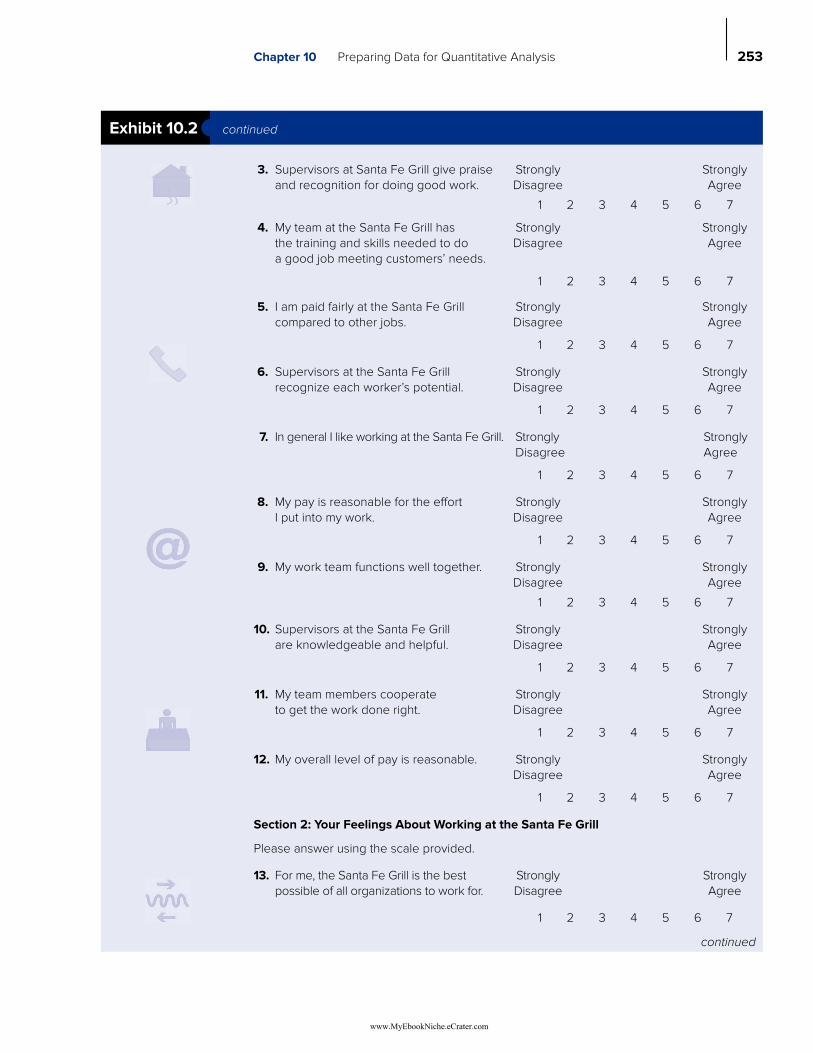
Chapter 10 Preparing Data for Quantitative Analysis 253
Exhibit 10.2 continued
3. Supervisors at Santa Fe Grill give praise Strongly Strongly
and recognition for doing good work. Disagree Agree
1 2 3 4 5 6 7
4. My team at the Santa Fe Grill has Strongly Strongly
the training and skills needed to do Disagree Agree
a good job meeting customers’ needs.
1 2 3 4 5 6 7
5. I am paid fairly at the Santa Fe Grill Strongly Strongly
compared to other jobs. Disagree Agree
1 2 3 4 5 6 7
6. Supervisors at the Santa Fe Grill Strongly Strongly
recognize each worker’s potential. Disagree Agree
1 2 3 4 5 6 7
7. In general I like working at the Santa Fe Grill. Strongly Strongly
Disagree Agree
1 2 3 4 5 6 7
8. My pay is reasonable for the effort Strongly Strongly
I put into my work. Disagree Agree
1 2 3 4 5 6 7
9. My work team functions well together. Strongly Strongly
Disagree Agree
1 2 3 4 5 6 7
10. Supervisors at the Santa Fe Grill Strongly Strongly
are knowledgeable and helpful. Disagree Agree
1 2 3 4 5 6 7
11. My team members cooperate Strongly Strongly
to get the work done right. Disagree Agree
1 2 3 4 5 6 7
12. My overall level of pay is reasonable. Strongly Strongly
Disagree Agree
1 2 3 4 5 6 7
Section 2: Your Feelings About Working at the Santa Fe Grill
Please answer using the scale provided.
13. For me, the Santa Fe Grill is the best Strongly Strongly
possible of all organizations to work for. Disagree Agree
1 2 3 4 5 6 7
continued
www.MyEbookNiche.eCrater.com

254 Part 4 Data Preparation, Analysis, and Reporting the Results
Exhibit 10.2 The Santa Fe Grill Questionnaire, continued
14. I feel a strong sense of “belonging” Strongly Strongly
to the Santa Fe Grill. Disagree Agree
1 2 3 4 5 6 7
15. I tell my friends the Santa Fe Grill Strongly Strongly
is a great place to work. Disagree Agree
1 2 3 4 5 6 7
16. I feel like “part of the family” at the Strongly Strongly
Santa Fe Grill. Disagree Agree
- 1 2 3 4 5 6 7
17. Select a number between 0 and 100 0 = Not At All Likely 100 = Very Likely
that represents how likely you
are to look for another job in the
next year.
18. Select a number between 0 and 100 0 = Not Very Often 100 = All the Time
that represents how often you think
about quitting your job at the
Santa Fe Grill.
Section 3: Classification Questions
Please indicate the number that classifies you best.
19. Are you a part-time or full-time worker? 0 = Full Time
1 = Part Time
20. What is your gender? 0 = Male
1 = Female
21. What is your age in years? _____
22. How long have you been an employee of the Santa Fe Grill?
Note: Data from the screening question for employees working at the restaurant more than
three months was recorded here. 1 = More than three months but less than one year
2 = One year to three years
3 = More than three years
Thank you very much for your help.
__________
Note: Santa Fe Grill management evaluated the performance of all employees. These scores
were added to the employee survey data file.
23. Performance: Employees were rated on a 100-point scale with 0 = very low performer and
100 = very high performer.
www.MyEbookNiche.eCrater.com

Chapter 10 Preparing Data for Quantitative Analysis 255
Increasingly surveys are completed online. When online surveys are used, respondents
are automatically asked the screening questions and are not allowed to continue if the ques-
tions are not correctly answered.
Responses to Open-Ended QuestionsResponses to open-ended questions often provide very meaningful data. Open-ended ques-
tions may provide greater insight into the research questions than forced-choice questions.
A major part of editing the answers to open-ended questions is interpretation. Exhibit 10.3
shows some typical responses to an open-ended question and thus points to problems asso-
ciated with interpreting these questions. For example, one response to the question “Why
are you coming to the Santa Fe Grill more often?” is simply “They have good service.”
This answer by itself is not sufficient to determine what the respondent means by “good
service.” The interviewer needed to probe for a more specific response. For example, are
the employees friendly, helpful, courteous? Do they appear neat and clean? Do they smile
when taking an order? Probes such as these would enable the researcher to better interpret
the “good service” answer. In cases such as these, the individual doing the editing must use
judgment in classifying responses. At some point the responses must be placed in standard
categories. Answers that are incomplete are considered useless.
Coding is necessary in online surveys if they have open-ended questions. As with
traditional data collection methods, the responses must be reviewed, themes and common
words and patterns must be identified, and then codes must be assigned to facilitate quanti-
tative data analysis. See the next section and Chapter 9 for additional comments on coding
qualitative data.
Exhibit 10.3 Responses to Open-Ended Questions
Why are you eating at the Santa Fe Grill more often?
They have good service.
Found out how good the food is.
I enjoy the food.
We just moved here and where we lived there were no good Mexican restaurants.
That part of town is building up so fast.
They have a couple of offers in the newspaper.
It is right beside where my husband works.
Tastes better—grilled.
They started giving better value packages.
We really like their chicken sandwiches, so we go more often now.
The good food.
Only because they only put one in within the last year.
Just opened lately.
It is located right by Walmart.
Just moved into this area and they have good food.
www.MyEbookNiche.eCrater.com

256 Part 4 Data Preparation, Analysis, and Reporting the Results
The Coding ProcessCoding involves grouping and assigning values to responses to the survey questions. It
is the assignment of numerical values to each individual response for each question on
the survey. Typically, the codes are numerical—a number from 0 to 9—because numbers
are quick and easy to input, and computers work better with numbers than alphanumeri-
cal values. Like editing, coding can be tedious if certain issues are not addressed prior to
collecting the data. A well-planned and constructed questionnaire can reduce the amount
of time spent on coding and increase the accuracy of the process if it is incorporated into
the design of the questionnaire. The restaurant questionnaire shown in Exhibit 10.2 has
built-in coded responses for all questions except the open-ended ones asked by the inter-
viewer at the end of the survey. In the “Lifestyle Questions,” for example, a respondent has
the option of responding from 1 to 7, based on his or her level of agreement or disagree-
ment with a particular statement. Thus, if the respondent circled “5” as his or her choice,
then the value of 5 would become the coded value for a particular question.
In contrast, open-ended questions pose unique problems to the coding process. An exact
list of potential responses cannot be prepared ahead of time for open-ended questions. Thus,
a coding process must be prepared after data is collected. But the value of the information
obtained from open-ended questions often outweighs the problems of coding the responses.
In conducting quantitative research, the format for a question/scale sometimes needs
to allow the respondent to provide more than one response using a structured closed-end
question. The uniqueness of a multiple response question is that the researcher uses a spe-
cific type of instruction (e.g., check as many topics as apply) to communicate clearly to
the respondent the appropriateness of selecting more than one listed response. To illustrate
coding for this type of structured question format, refer back to the Pizza Hut example for a
self-administered survey in Exhibit 8.2. With an online survey, the researcher asks respon-
dents the question “Among the pizza toppings listed below, what toppings, if any, do you
usually add to a pizza other than cheese when ordering a pizza for yourself from Pizza Hut?
(Check as many boxes as apply),” followed by a list of 14 different topping choices, such as
vegetables and types of meats, as well as a write-in option for “some other topping ______.”
From a coding perspective, a researcher can use either a multiple-dichotomy or a multiple-
response coding method. With the multiple dichotomy method, each prelisted topping is
treated as a separate variable to which respondents provide a YES answer by checking the
corresponding box (or an implied NO answer by leaving the corresponding box unchecked).
The researcher would then assign a specific numerical code (e.g., 1) for each topping’s
checked box and another specific numerical code (e.g., 0) for each topping left blank.
When the questionnaire involves a structured open-ended question as part of a survey,
the coding task for multiple responses becomes more time consuming. In these situations,
a multiple-response method similar to coding the responses for a content analysis is used.
The objective of the coding process is to reduce the large number of individual responses to
a smaller set of general, yet mutually exclusive categories of answers that can be assigned
numerical codes. Therefore, instead of creating a separate variable for each answer, a smaller
set of more general categorical type variables is created so that it includes all of the responses
in some combination. A multistep process is followed in which the first step is to identify a
portion of the initial written answers that have something in common. The questions with a
common theme are then combined to form mutually exclusive general categorical variables.
This process can be carried out by the researcher, other experts, or trained coders. Finally,
specific numerical codes are assigned to each of the new general categorical variables.
Although a categorization coding scheme should be tailored to meet the specific needs
of the study, there is a general rule of thumb to keep in mind: if the categorical data is coded
Coding Grouping and
assigning values to various
responses from the survey
instrument.
www.MyEbookNiche.eCrater.com
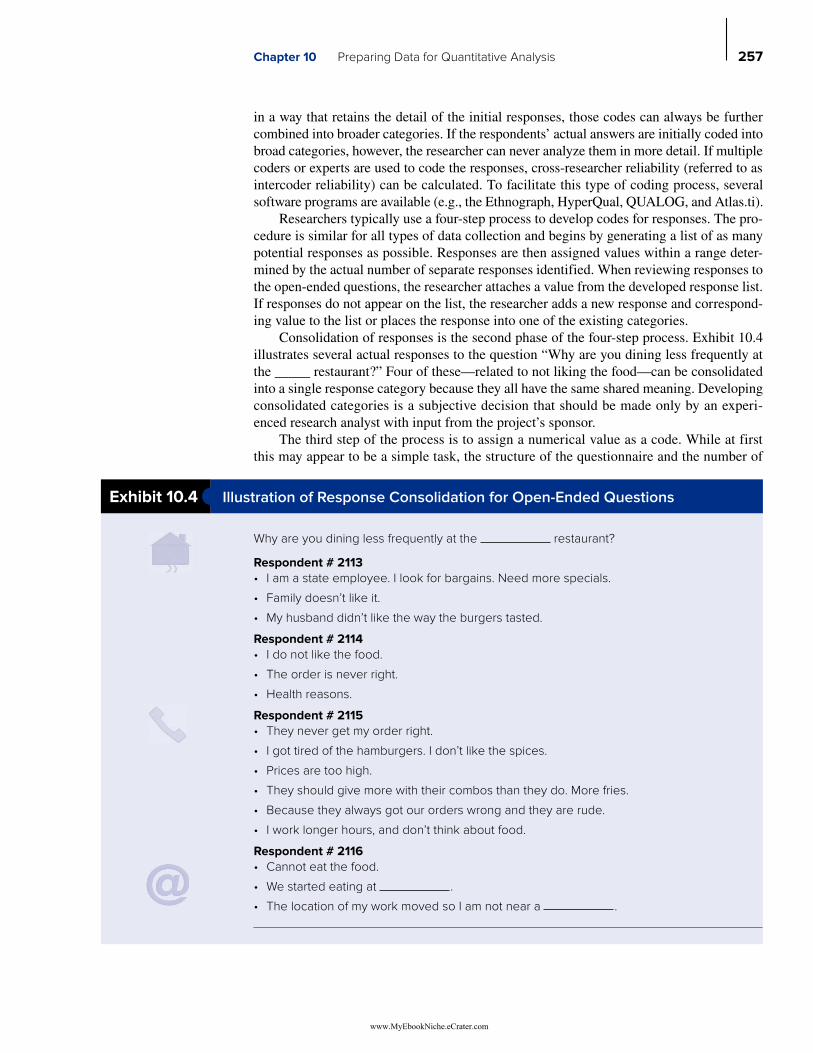
Chapter 10 Preparing Data for Quantitative Analysis 257
in a way that retains the detail of the initial responses, those codes can always be further
combined into broader categories. If the respondents’ actual answers are initially coded into
broad categories, however, the researcher can never analyze them in more detail. If multiple
coders or experts are used to code the responses, cross-researcher reliability (referred to as
intercoder reliability) can be calculated. To facilitate this type of coding process, several
software programs are available (e.g., the Ethnograph, HyperQual, QUALOG, and Atlas.ti).
Researchers typically use a four-step process to develop codes for responses. The pro-
cedure is similar for all types of data collection and begins by generating a list of as many
potential responses as possible. Responses are then assigned values within a range deter-
mined by the actual number of separate responses identified. When reviewing responses to
the open-ended questions, the researcher attaches a value from the developed response list.
If responses do not appear on the list, the researcher adds a new response and correspond-
ing value to the list or places the response into one of the existing categories.
Consolidation of responses is the second phase of the four-step process. Exhibit 10.4
illustrates several actual responses to the question “Why are you dining less frequently at
the _____ restaurant?” Four of these—related to not liking the food—can be consolidated
into a single response category because they all have the same shared meaning. Developing
consolidated categories is a subjective decision that should be made only by an experi-
enced research analyst with input from the project’s sponsor.
The third step of the process is to assign a numerical value as a code. While at first
this may appear to be a simple task, the structure of the questionnaire and the number of
Exhibit 10.4 Illustration of Response Consolidation for Open-Ended Questions
Why are you dining less frequently at the restaurant?
Respondent # 2113
I am a state employee. I look for bargains. Need more specials.
Family doesn’t like it.
My husband didn’t like the way the burgers tasted.
Respondent # 2114
I do not like the food.
The order is never right.
Health reasons.
Respondent # 2115
They never get my order right.
I got tired of the hamburgers. I don’t like the spices.
Prices are too high.
They should give more with their combos than they do. More fries.
Because they always got our orders wrong and they are rude.
I work longer hours, and don’t think about food.
Respondent # 2116
Cannot eat the food.
We started eating at .
The location of my work moved so I am not near a .
www.MyEbookNiche.eCrater.com

258 Part 4 Data Preparation, Analysis, and Reporting the Results
responses per question need to be considered. For example, if a question has more than ten
responses, then double-digit codes need to be used, such as 01, 02, . . . 11. Another good
practice is to assign higher value codes to positive responses than to negative responses.
For instance, “no” responses are coded 0 and “yes” responses coded 1; “dislike” responses
are coded as 1 and “like” responses coded as 5. Coding makes subsequent analysis easier.
For example, the researcher will find it easier to interpret means or averages if higher val-
ues occur as the average moves from “dislike” to “like.”
If correlation or regression is used in data analysis, then for categorical data there
is another consideration. The researcher may wish to create “dummy” variables in which
the coding is “0” and “1.” To learn more about dummy coding, go to our website at
connect.mheducation.com.
Assigning a coded value to missing data is very important. For example, if a respon-
dent completes a questionnaire except for the very last question and a recontact is not pos-
sible, how do you code the response to the unanswered question? A good practice in this
situation is to first consider how the response is going to be used in the analysis phase. In
certain types of analysis, if the response is left blank and has no numerical value, the entire
questionnaire (not just the individual question) will be deleted. The best way to handle
the coding of omitted responses is first to check on how your data analysis software treats
missing data. This should be the guide for determining whether omissions are coded or left
blank. We discuss missing data more in a later section.
The fourth step in the coding process is to assign a coded value to each response.
This is probably the most tedious process because it is done manually. Unless an optical
scanning approach is used to enter the data, this task is almost always necessary to avoid
problems in the data entry phase.
Researchers increasingly must analyze and make recom-
mendations on data from data warehouses. This trend has
both advantages and disadvantages. The advantages are
related mostly to the fact that data from data warehouses
are secondary data and therefore are quicker and easier
to obtain, as well as less expensive. But there are numer-
ous disadvantages that must be dealt with before the data
can be analyzed and used. Below is a list of typical prob-
lems managers face in using data from data warehouses.
Outdated data, for example, too old to be relevant.
Incomplete data, for example, data available from
one time period but not another.
Data that supposedly are available but cannot be
found. In large companies this is often due to having
several data warehouses in different locations main-
tained by different divisions of the company.
Supposedly same data from various internal sources
are different, for example, information on sales by ter-
ritory is different from two different sources such as
internal sales records versus scanner data, which
generally does not represent all distribution outlets.
Managers must decide which source to rely on in a
particular situation, or how to combine the data from
two sources.
Data that are in an unusable or incompatible format,
or cannot be understood.
Disorganized data not in a central location.
Software to access data is not working at all, or not
working as it should.
Too much data.
How are the above problems resolved? Sometimes they
cannot be resolved, at least in a timely manner, that is, in
time to be used to make decisions. The best approach
to avoid or minimize these problems is to establish a
good working relationship between the marketing and
information technology departments. This means mar-
keting managers must start early to communicate their
expectations of what data are needed, how often, in
what format, and so on. Then on an ongoing basis they
must continue to work closely together to anticipate
and deal with data management and utilization issues
as they arise.
MARKETING RESEARCH DASHBOARD DEALING WITH DATA FROM DATA WAREHOUSES
www.MyEbookNiche.eCrater.com

Chapter 10 Preparing Data for Quantitative Analysis 259
Each questionnaire is assigned a numerical value. The numerical value typically is a
three-digit code if there are fewer than 1,000 questionnaires to code, and a four-digit code
if there are 1,000 or more. For example, if 452 completed questionnaires were returned, the
first would be coded 001, the second 002, and so on, finishing with 452.
Data Entry
Data entry follows validation, editing, and coding. Data entry is the procedure used to enter
the data into a computer file for subsequent data analysis. Data entry is the direct input of
the coded data into a file that enables the research analyst to manipulate and transform the
data into useful information. This step is not necessary when online data collection is used.
There are several ways of entering coded data into an electronic file. With CATI and
Internet surveys, the data are entered simultaneously with data collection and a separate
step is not required. However, other types of data collection require the data to be entered
manually, which typically is done using a personal computer.
Scanning technology also can be used to enter data. This approach enables the com-
puter to read alphabetic, numeric, and special character codes through a scanning device.
Respondents use a number two pencil to fill in responses, which are then scanned directly
into a computer file.
Online surveys are becoming increasingly popular for completing marketing research
studies. Indeed, online surveys now represent almost 60 percent of all data collection
approaches. They not only are often faster to complete but also eliminate entirely the data
entry process.
Error DetectionError detection identifies errors from data entry or other sources. The first step in error detec-
tion is to determine whether the software used for data entry and tabulation performs “error
edit routines” that identify the wrong type of data. For example, say that for a particular field
on a given data record, only the codes of 1 or 2 should appear. An error edit routine can dis-
play an error message on the data output if any number other than 1 or 2 has been entered.
Such routines can be quite thorough. A coded value can be rejected if it is too large or too
small for a particular scaled item on the questionnaire. In some instances, a separate error edit
routine can be established for every item on the questionnaire. With online surveys, controls
are built in ahead of time to prevent respondents from keying in incorrect responses.
Another approach to error detection is for the researcher to review a printed representa-
tion of the entered data. Exhibit 10.5, for example, shows the coded values for observations
377 to 405 in the restaurant database. In this example, the top row indicates the variable names
assigned to each data field (i.e., “id” is the label for the questionnaire number, “X_s1” repre-
sents the first screening question, X1 is the first question on the survey after the four screening
questions, etc.). The numbers in the columns are the coded values that were entered. While the
process is somewhat tedious, the analyst can view the actual entered data for accuracy and can
tell where any errors occurred. Another approach is to run a tabulation (frequency count) of all
survey questions so responses can be examined for completeness and accuracy.
Missing DataMissing data are often a problem in data analysis. Missing data are defined as a situation
in which respondents do not provide an answer to a question. Sometimes respondents
Data entry Those tasks
involved with the direct
input of the coded data into
some specified software
package that ultimately
allows the research
analyst to manipulate and
transform the raw data into
useful information.
www.MyEbookNiche.eCrater.com

260 Part 4 Data Preparation, Analysis, and Reporting the Results
purposely do not answer a question creating a missing data situation. This most often
arises when questions of a sensitive nature are asked, such as asking for a respondent’s age
or income. It also may occur because a respondent simply does not see a question, or is in
a hurry to complete the survey and simply skips a question. Missing data are most often
a problem with self-completion surveys. With online surveys respondents can be required
to answer all questions, but this may cause some respondents to simply stop answering
questions and terminate the survey. In general, with online surveys it is recommended to
require answers on all questions since the problem of respondents quitting a survey is not
as substantial as is the problem of missing data.
If missing data are encountered, there are several ways to deal with it. One approach
is to replace the missing value with a value from a similar respondent. For example, if
the demographics of the respondent are male, aged 35 to 49, with some college educa-
tion, then the appropriate approach is to find one or more other respondents with simi-
lar characteristics and use their responses as a guide to determine a replacement value
for the missing data. Another approach, if there are other similar questions to the one
with missing data, is to use the answers to the other similar questions as a guide in
Exhibit 10.5 SPSS Data View of Coded Values for Santa Fe Grill Customer Observations
www.MyEbookNiche.eCrater.com

Chapter 10 Preparing Data for Quantitative Analysis 261
determining the replacement value. A third approach is to use the mean of a subsample
of the respondents with similar characteristics that answered the question to determine
a replacement value. A final alternative is to use the mean of the entire sample that
answered the question as a replacement value, but this is not recommended because it
reduces the overall variance in the question.
Organizing DataSeveral useful data organizing functions are available in SPSS. One function under the
Data pull-down menu is Sort Cases. This can be used to sort your data cases (observa-
tions) in either ascending or descending order. Another is the Split File function, which can
be used, for example, to split the Santa Fe Grill and Jose’s Southwestern Café customer
respondents into two groups so they can be compared. A third useful function is the Select
Cases option, which can be used to select only males, or only customers over age 35, and
so on. This option can also be used to select a random subsample of your total sample. The
specific steps to execute these and other functions are explained in the SPSS instructions
available from the book’s website.
Data Tabulation
Tabulation, sometimes referred to as a frequency count, is counting the number of
responses in categories. Two common forms of tabulation are used in marketing research
projects: one-way tabulation and cross-tabulations. A one-way tabulation shows responses
for a single variable. In most cases, a one-way tabulation shows the number of respondents
(frequency count) who gave each possible answer to each question on the questionnaire.
The number of one-way tabulations is determined by the number of variables measured in
the study.
Cross-tabulation simultaneously compares two or more variables in the study. Cross-
tabulations categorize the number of responses to two or more questions, thus showing the
relationship between those two variables. For example, a cross-tabulation could show the
number of male and female respondents who spent more than $7.00 eating at McDonald’s
versus those who spent less. Cross-tabulation is most often used with nominal or ordinal
scaled data.
One-way and cross-tabulation are considered descriptive statistics. The overview
of these two types of tabulations in this chapter provides a foundation for other types of
descriptive statistics discussed in the next chapter. We show you how to use software to
develop all types of descriptive statistics in the next chapter.
One-Way TabulationOne-way tabulations serve several purposes. First, they can be used to determine the
amount of nonresponse to individual questions. Based on the coding scheme used for
missing data, one-way tabulations identify the number of respondents who did not answer
various questions on the questionnaire. Second, one-way tabulations can be used to locate
mistakes in data entry.
If a specific range of codes has been established for a given response to a question, say
1 through 5, a one-way tabulation can illustrate if an inaccurate code was entered, say, a
7 or 8. It does this by providing a list of all responses to the particular question. In addition,
means, standard deviations, and related descriptive statistics often are determined from a
Tabulation The simple
process of counting the
number of observations
(cases) that are classified
into certain categories.
One-way tabulation
Categorization of single
variables existing in a study.
Cross-tabulation
Simultaneously treating two
or more variables in the
study; categorizing the
number of respondents
who have answered
two or more questions
consecutively.
www.MyEbookNiche.eCrater.com

262 Part 4 Data Preparation, Analysis, and Reporting the Results
one-way tabulation. Finally, one-way tabulations are also used to communicate the results
of the research project. One-way tabulations can profile sample respondents, identify char-
acteristics that distinguish between groups (e.g., heavy users vs. light users), and show the
percentage of respondents who respond differently to different situations. For instance,
a one-way tabulation might show the percentage of people who purchase fast food from
drive-through windows versus those who use dine-in facilities.
The most basic way to illustrate a one-way tabulation is to construct a one-way fre-
quency table. A one-way frequency table shows the number of respondents who answered
each possible response to a question given the available alternatives. An example of a
one-way frequency table is shown in Exhibit 10.6, which shows which Mexican restaurants
the respondents dined at in the last 30 days. The information indicates that 99 individuals
(20.1 percent) ate at Superior Grill in the last 30 days, 74 (15.0 percent) ate at Mamacita’s,
110 (22.3 percent) ate at Ninfa’s, and so on. Typically, a computer printout will be prepared
with one-way frequency tables for each question on the survey. In addition to listing the
number of responses, one-way frequency tables also identify missing data and show valid
percentages and summary statistics. In reviewing the output, look for the following:
1. Indications of missing data. One-way frequency tables show the number of missing
responses for each question. As shown in Exhibit 10.7, a total of 13 respondents,
Exhibit 10.6 Example of One-Way Frequency Distribution
www.MyEbookNiche.eCrater.com

Chapter 10 Preparing Data for Quantitative Analysis 263
or 3 percent of the sample, did not respond to how frequently they patronized
the two restaurants. It is important to recognize the actual number of missing
responses when estimating percentages from a one-way frequency table. In or-
der to establish valid percentages, missing responses must be removed from the
calculation.
2. Determining valid percentages. To determine valid percentages one must remove in-
complete surveys or particular questions. For example, the one-way frequency table in
Exhibit 10.7 actually constructs valid percentages (the third column). While the total
number of responses for this particular question was 427, only 414 are used to develop
the valid percentage of response across categories because the 13 missing responses
were removed from the calculations.
3. Summary statistics. Finally, one-way frequency tables illustrate a variety of sum-
mary statistics. In Exhibit 10.7 the summary statistics for question X25
are the
Exhibit 10.7 One-Way Frequency Table Illustrating Missing Data
www.MyEbookNiche.eCrater.com

264 Part 4 Data Preparation, Analysis, and Reporting the Results
mean, median, mode, and standard deviation. These statistics help the researcher
better understand the average responses. For example, the mean of 3.26 indicates
that many respondents are occasional patrons of the two restaurants. Note that
variable X25
ranges from one to five, with larger numbers indicating higher dining
frequency.
Descriptive StatisticsDescriptive statistics are used to summarize and describe the data obtained from a
sample of respondents. Two types of measures are often used to describe data. One of
those is measures of central tendency and the other is measures of dispersion. Both are
described in detail in the next chapter. Understanding the six basic descriptive statistics
(e.g., mean, median, mode, frequency distribution, range, and standard deviation) is
essential to properly applying data editing and coding, error detection (data cleaning),
handling missing data, and tabulation. For now we refer you to Exhibit 10.8, which
provides an overview of the major types of descriptive statistics used by marketing
researchers.
Graphical Illustration of DataThe next logical step following development of frequency tables is to translate them into
graphical illustrations. Graphical illustrations can be very powerful for communicating key
research results generated from preliminary data analysis. We discuss graphical illustration
of data using bar charts, pie charts, and similar techniques in Chapter 13.
Exhibit 10.8 Overview of Descriptive Statistics
To clarify descriptive statistics, we use a simple data set to illustrate each of the major ones.
Assume that data have been collected from ten students about satisfaction with their Apple
iPOD. Satisfaction is measured on a 7-point scale with the end points labeled “Highly
Satisfied = 7” and “Not Satisfied at All = 1”. The results of this survey are shown below by
respondent.
Respondent Satisfaction Rating
1 7
2 5
3 6
4 4
5 6
6 5
7 7
8 5
9 4
10 5
www.MyEbookNiche.eCrater.com

Chapter 10 Preparing Data for Quantitative Analysis 265
Exhibit 10.8 continued
Descriptive Statistics
Frequency = the number of times a number (response) is in the data set.
To compute it, count how many times the number is in the data set. For example, the number
7 is in the data set twice.
Frequency distribution = a summary of how many times each possible response to a
question appears in the data set.
To develop a frequency distribution, count how many times each number appears in the data set
and make a table that shows the results. For example, create a chart like the one shown below:
Satisfaction Rating Count
7 2
6 2
5 4
4 2
3 0
2 0
1 0
Total 10
Percentage distribution = the result of converting a frequency distribution into percentages.
To develop a percentage distribution, divide each frequency count for each rating by the
total count.
Satisfaction Rating Count Percentage
7 2 20
6 2 20
5 4 40
4 2 20
3 0 0
2 0 0
1 0 0
Total 10 100%
Cumulative percentage distribution = each individual percentage added to the previous
to get a total.
To develop a cumulative percentage distribution, arrange the percentages in descending
order and sum the percentages one at a time and show the result.
Satisfaction Rating Count Percentage Cumulative Percentage
7 2 20 20
6 2 20 40
5 4 40 80 ← median
4 2 20 100%
3 0 0
2 0 0
1 0 0
Total 10 100%
continued
www.MyEbookNiche.eCrater.com

266 Part 4 Data Preparation, Analysis, and Reporting the Results
Exhibit 10.8 Overview of Descriptive Statistics, continued
Mean = the arithmetic average of all the raw responses.
To calculate the mean, add up all the values of a distribution of responses and divide
the total by the number of valid responses.
The mean is: (7 + 5 + 6 + 4 + 6 + 5 + 7 + 5 + 4 + 5) = 54/10 = 5.4
Median = the descriptive statistic that splits the data into a hierarchical pattern where half the
data are above the median value and half are below.
To determine the median, look at the cumulative percentage distribution and find either
where the cumulative percentage is equal to 50 percent or where it includes 50 percent.
The median is marked in the table above.
Mode = the most frequently occurring response to a given set of questions.
To determine the mode, find the number which has the largest frequency (count). In the
responses above, the number 5 has the largest count and is the mode.
Range = a statistic that represents the spread of the data and is the distance between the
largest and the smallest values of a frequency distribution.
To calculate the range, subtract the lowest rating point from the highest rating point and
the difference is the range. For the above data, the maximum number is 7 and the
minimum number is 4 so the range is 7 − 4 = 3.
Standard deviation = the measure of the average dispersion of the values in a set of
responses about their mean. It provides an indication of how similar or
dissimilar the numbers are in the set of responses.
To calculate the standard deviation, subtract the mean from the square of each number
and sum them. Then divide that sum by the total number of responses minus one, and
then take the square root of the result.
www.MyEbookNiche.eCrater.com

Chapter 10 Preparing Data for Quantitative Analysis 267
MARKETING RESEARCH IN ACTIONDeli Depot
In this chapter, we have shown you simple approaches to examine data. In later chap-
ters, we show you more advanced statistical techniques to analyze data. The most impor-
tant consideration in deciding how to analyze data is to enable businesses to use data to
make better decisions. To help students more easily understand the best ways to examine
data, we have prepared several databases that can be applied to various research problems.
This case is about Deli Depot, a sandwich restaurant. The database is available at connect
.mheducation.com.
Deli Depot sells cold and hot sandwiches, soup and chili, yogurt, and pies and cookies.
The restaurant is positioned in the fast-food market to compete directly with Subway and
similar sandwich restaurants. Its competitive advantages include special sauces on sand-
wiches, supplementary menu items like soup and pies, and quick delivery within specified
zones. As part of their marketing research class, students conducted a survey for the owner
of a local restaurant near their campus.
The students obtained permission to conduct interviews with customers inside the
restaurant. Information was collected for 17 questions. Customers were first asked their
perceptions of the restaurant on six factors (variables X1–X
6) and then asked to rank the
same six factors in terms of their importance in selecting a restaurant where they wanted
to eat (variables X12
–X17
). Finally, respondents were asked how satisfied they were with
the restaurant, how likely they were to recommend it to a friend, how often they eat
there, and how far they drove to eat a meal at Deli Depot. Interviewers recorded the sex
of the respondents without asking it. The variables, sample questions, and their coding
are shown below.
Performance Perceptions VariablesThe performance perceptions were measured as follows.
Listed below is a set of characteristics that could be used to describe Deli Depot.
Using a scale from 1 to 10, with 10 being “Strongly Agree” and 1 being “Strongly
Disagree,” to what extent do you agree or disagree that Deli Depot has:
X1–Friendly Employees
X2–Competitive Prices
X3–Competent Employees
X4–Excellent Food Quality
X5–Wide Variety of Food
X6–Fast Service
If a respondent chose a 10 on the Friendly Employees category, this would indicate
strong agreement that Deli Depot has friendly employees. On the other hand, if a respon-
dent chose a 1 for Fast Service, this would indicate strong disagreement and the perception
that Deli Depot offers relatively slower service.
www.MyEbookNiche.eCrater.com

268 Part 4 Data Preparation, Analysis, and Reporting the Results
Classification VariablesData for the classification variables were asked at the end of the survey, but in the database
they are recorded as variables X7–X
11. Responses were coded as follows:
X7–Gender (1 = Male; 0 = Female)
X8–Recommend to Friend (7 = Definitely Recommend; 1 = Definitely Not
Recommend)
X9–Satisfaction Level (7 = Highly Satisfied; 1 = Not Very Satisfied)
X10
–Usage Level (1 = Heavy User—eats at Deli Depot two or more times each week;
0 = Light User—eats at Deli Depot fewer than two times a week)
X11
–Market Area (1 = Came from within 1 mile; 2 = Came from 1–3 miles; 3 = Came
from more than 3 miles)
Selection Factor RankingsData for the selection factors were collected as follows:
Listed below is a set of attributes (reasons) many people use when selecting a fast-
food restaurant. Regarding your visits to fast-food restaurants in the last 30 days,
please rank each attribute from 1 to 6, with 6 being the most important reason for
selecting the fast-food restaurant and 1 being the least important reason. There can be
no ties, so make sure you rank each attribute with a different number.
X12
–Friendly Employees
X13
–Competitive Prices
X14
–Competent Employees
X15
–Excellent Food Quality
X16
–Wide Variety of Food
X17
–Fast Service
The questionnaire for the Deli Depot survey is shown in Exhibit 10.9.
Hands-On Exercise1. Should the Deli Depot questionnaire have screening questions?
2. Run a frequency count on variable X3–Competent Employees. Do the customers per-
ceive employees to be competent?
3. Consider the guidelines on questionnaire design you learned in Chapter 8. How would
you improve the Deli Depot questionnaire?
www.MyEbookNiche.eCrater.com

Chapter 10 Preparing Data for Quantitative Analysis 269
Exhibit 10.9 Deli Depot Questionnaire
Screening and Rapport Questions
Hello. My name is ____ and I work for Decision Analyst, a market research firm in Dallas,
Texas. We are talking to people today/tonight about eating out habits.
1. “How often do you eat out?” __ Often __ Occasionally __ Seldom
2. “Did you just eat at Deli Depot?” __ Yes __ No
3. “Have you completed a restaurant
questionnaire on Deli Depot before?” __ Yes __ No
If respondent answers “Often or Occasionally” to the 1st question, “Yes” to the 2nd question,
and “No” to the 3rd question, then say:
We would like you to answer a few questions about your experience today/tonight at Deli
Depot, and we hope you will be willing to give us your opinions. The survey will only take a
few minutes and it will be very helpful to management in better serving its customers. We will
pay you $5.00 for completing the questionnaire.
If the person says yes, give them a clipboard with the questionnaire on it, briefly explain the
questionnaire, and show them where to complete the survey.
DINING OUT SURVEY
Please read all questions carefully. If you do not understand a question, ask the interviewer to
help you.
Section 1: Perceptions Measures
Listed below is a set of characteristics that could be used to describe Deli Depot. Using a
scale from 1 to 10, with 10 being “Strongly Agree” and 1 being “Strongly Disagree,” to what
extent do you agree or disagree that Deli Depot has: Circle the correct response.
1. Friendly Employees Strongly Strongly
Disagree Agree
1 2 3 4 5 6 7 8 9 10
2. Competitive Prices Strongly Strongly
Disagree Agree
1 2 3 4 5 6 7 8 9 10
3. Competent Employees Strongly Strongly
Disagree Agree
1 2 3 4 5 6 7 8 9 10
4. Excellent Food Quality Strongly Strongly
Disagree Agree
1 2 3 4 5 6 7 8 9 10
5. Wide Variety of Food Strongly Strongly
Disagree Agree
1 2 3 4 5 6 7 8 9 10
6. Fast Service Strongly Strongly
Disagree Agree
1 2 3 4 5 6 7 8 9 10
Section 2: Classification Variables
Circle the response that describes you.
7. Your Gender 1 Male
0 Femalecontinued
www.MyEbookNiche.eCrater.com

270 Part 4 Data Preparation, Analysis, and Reporting the Results
Exhibit 10.9 Deli Depot Questionnaire, continued
Attribute Ranking
12. Friendly Employees
13. Competitive Prices
14. Competent Employees
15. Excellent Food Quality
16. Wide Variety of Food
17. Fast Service
Thank you very much for your help. Please give your questionnaire to the interviewer and
you will be given your $5.00.
8. How likely are you to recommend Deli Depot Definitely Definitely
to a friend? Not Recommend Recommend
1 2 3 4 5 6 7
9. How satisfied are you with Deli Depot? Not Very Highly
Satisfied Satisfied
1 2 3 4 5 6 7
10. How often do you patronize Deli Depot? 1 = eat at Deli Depot 2 or more
times each week.
0 = eat at Deli Depot fewer than
2 times each week.
11. How far did you drive to get to Deli Depot? 1 = came from within one mile.
2 = 1−3 miles.
3 = came from more than 3 miles.
Section 3: Selection Factors
Listed below is a set of attributes (reasons) many people use when selecting a fast-food
restaurant. Regarding your visits to fast-food restaurants in the last 30 days, please rank each
attribute from 1 to 6, with 6 being the most important reason for selecting the restaurant and
1 being the least important reason. There can be no ties so make sure you rank each
attribute with a different number.
Summary
Describe the process for data preparation and
analysis.
The value of marketing research is its ability to provide
accurate decision-making information to the user. To
accomplish this, the data must be converted into usable
information or knowledge. After collecting data through
the appropriate method, the task becomes one of ensur-
ing the data provide meaning and value. Data prepara-
tion is the first part of the process of transforming data
into useful knowledge. This process involves several
steps: (1) data validation; (2) editing and coding; (3) data
entry; (4) error detection; and (5) data tabulation. Data
analysis follows data preparation and facilitates proper
interpretation of the findings.
Discuss validation, editing, and coding of survey data.
Data validation attempts to determine whether surveys,
interviews, or observations were conducted correctly and
are free from fraud. In recontacting selected respondents,
www.MyEbookNiche.eCrater.com

Chapter 10 Preparing Data for Quantitative Analysis 271
the researcher asks whether the interview (1) was falsi-
fied; (2) was conducted with a qualified respondent; (3)
took place in the proper procedural setting; (4) was com-
pleted correctly and accurately; and (5) was accomplished
in a courteous manner. The editing process involves scan-
ning of interviews or questionnaire responses to determine
whether the proper questions were asked, the answers
were recorded according to the instructions given, and
the screening questions were executed properly, as well as
whether open-ended questions were recorded accurately.
Once edited, the questionnaires are coded by assigning
numerical values to all responses. Coding is the process
of providing numeric labels to the data so they can be
entered into a computer for subsequent statistical analysis.
Explain data entry procedures and how to detect
errors.
There are several methods for entering coded data
into a computer. First is the PC keyboard. Data also
can be entered through terminals having touch-screen
capabilities, or through the use of a handheld elec-
tronic pointer or light pen. Finally, data can be entered
through a scanner using optical character recognition.
Data entry errors can be detected through the use of
error edit routines in the data entry software. Another
approach is to visually scan the actual data after it has
been entered.
Describe data tabulation and analysis approaches.
Two common forms of data tabulation are used in mar-
keting research. A one-way tabulation indicates the num-
ber of respondents who gave each possible answer to
each question on a questionnaire. Cross-tabulation pro-
vides categorization of respondents by treating two or
more variables simultaneously. Categorization is based
on the number of respondents who have responded to
two or more consecutive questions.
Key Terms and Concepts
Coding 256
Cross-tabulation 261
Curbstoning 249
Data entry 259
Data validation 249
Editing 251
One-way tabulation 261
Tabulation 261
Review Questions
1. Briefly describe the process of data validation. Spe-
cifically discuss the issues of fraud, screening, proce-
dure, completeness, and courtesy.
2. What are the differences between data validation,
data editing, and data coding?
3. Explain the differences between developing codes for
open-ended questions and for closed-ended questions.
4. Briefly describe the process of data entry. What
changes in technology have simplified this
procedure?
5. What is the purpose of a simple one-way tabulation?
How does this relate to a one-way frequency table?
Discussion Questions
1. Explain the importance of following the sequence for
data preparation and analysis described in Exhibit 10.1.
2. Identify four problems a researcher might find while
screening questionnaires and preparing data for analysis.
3. How can data tabulation help researchers better
understand and report findings?
4. SPSS Exercise. Using SPSS and the Santa Fe Grill
employee database, develop frequencies, means,
modes, and medians for all the relevant variables on
the questionnaire.
www.MyEbookNiche.eCrater.com

Basic Data Analysis for Quantitative Research
C h a p t e r 1 1
www.MyEbookNiche.eCrater.com

Learning Objectives After reading this chapter, you will be able to:
1. Explain measures of central tendency and dispersion.
2. Describe how to test hypotheses using univariate and bivariate statistics.
3. Apply and interpret analysis of variance (ANOVA).
4. Utilize perceptual mapping to present research findings.
Data Analysis Facilitates Smarter Decisions
In his book Thriving on Chaos, Tom Peters says, “We are drowning in information
and starved for knowledge.” Indeed, the amount of information available for business
decision making has grown tremendously over the last decade. But until recently,
much of that information just disappeared. It was either not used or discarded because
collecting, storing, extracting, and interpreting it were too expensive. Now, decreases
in the cost of data collection and storage, development of faster data processors and
user-friendly client–server interfaces, and improvements in data analysis and inter-
pretation made possible through data mining enable businesses to convert what had
been a “waste by-product” into a new resource to improve business and marketing
decisions. The data may come from secondary sources or surveys of customers, or
be internally generated by enterprise or CRM software, such as SAP. To convert this
information into knowledge so it can be useful for decision making, the data must be
organized, categorized, analyzed, and shared among company employees.
Data analysis facilitates the discovery of interesting patterns in databases
that are difficult to identify and have potential for improving decision making
and creating knowledge. Data analysis methods are widely used today for com-
mercial purposes. Fair Isaac & Co. (www.fairisaac.com) is an $800 million
business built around the commercial use of multivariate statistical techniques.
The firm developed a complex analytical model that can accurately predict
who will pay bills on time, who will pay late, who will not pay at all, who will
file for bankruptcy, and so on. Its models are useful for both the consumer and
business-to-business markets. Similarly, the IRS uses data analysis to identify
which returns to audit. State Farm uses multivariate statistics to decide who to
sell insurance to, and Progressive Insurance combines multivariate methods with
global positioning technology to identify where and how fast you drive so that
they can raise your auto insurance premiums if you drive in a hazardous manner.
To make accurate business decisions in today’s increasingly complex
environment, intricate relationships with many intervening variables must be
examined. Sophisticated statistical methods, such as data mining, are powerful
analytical techniques used by marketing researchers to examine and better under-
stand these relationships.
www.MyEbookNiche.eCrater.com

274 Part 4 Data Preparation, Analysis, and Reporting the Results
Value of Statistical Analysis
Once data have been collected and prepared for analysis, several statistical procedures can
help to better understand the responses. It can be difficult to understand the entire set of
responses because there are too many numbers to look at. For example, Nokia analyzed
6 billion pieces of data in designing its N-Series wireless phone. This amount of data
could only be analyzed and understood with multivariate analysis. Consequently, almost all
data needs summary statistics to describe the information it contains. Basic statistics and
descriptive analysis achieve this purpose.
We describe some of the statistics common to almost all research projects in this
chapter. First we explain measures of central tendency and dispersion. Next, we discuss the
Chi-square statistic to examine cross tabulations, and then the t statistic for testing differ-
ences in means. Finally, the chapter closes with an introduction to analysis of variance, a
powerful technique for detecting differences between three or more sample means.
Measures of Central TendencyFrequency distributions can be useful for examining the different values for a variable.
Frequency distribution tables are easy to read and provide a great deal of basic informa-
tion. There are times, however, when the amount of detail is too great. In such situations,
the researcher needs a way to summarize and condense all the information in order to get
at the underlying meaning. Researchers use descriptive statistics to accomplish this task.
The mean, median, and mode are measures of central tendency. These measures locate the
center of the distribution. For this reason, the mean, median, and mode are sometimes also
called measures of location.
We use variable X25
–Frequency of Eating from the restaurant database to illustrate the
measures of central tendency (Exhibit 11.1). Note that for this example we look first at the
frequency distribution, which is the lower table. It is based on the 427 respondents who
participated in the survey, including 13 responses that included some missing data on this
question. Respondents used a 5-point scale, with 1 = Very Infrequently, 2 = Somewhat
Infrequently, 3 = Occasionally, 4 = Somewhat Frequently, and 5 = Very Frequently. The
numbers in the Percent column are calculated using the total sample size of 427, while the
numbers in the Valid % and Cumulative % columns are calculated using the total sample
size minus the number of missing responses to this question (427 − 13 = 414).
Mean The mean is the average value within the distribution and is the most commonly
used measure of central tendency. The mean tells us, for example, the average number of
cups of coffee the typical student drinks during finals to stay awake. The mean can be cal-
culated when the data scale is either interval or ratio. Generally, the data will show some
degree of central tendency, with most of the responses distributed close to the mean.
The mean is a very robust measure of central tendency. It is fairly insensitive to
data values being added or deleted. The mean can be subject to distortion, however,
if extreme values are included in the distribution. For example, suppose you ask four
students how many cups of coffee they drink in a single day. Respondent answers are
as follows: Respondent A = 1 cup; Respondent B = 10 cups; Respondent C = 5 cups;
and Respondent D = 6 cups. Let’s also assume that we know that respondents A and B
are males and respondents B and C are females and we want to compare consumption of
coffee between males and females. Looking at the males first (Respondents A and B), we
calculate the mean number of cups to be 5.5 (1 + 10 = 11/2 = 5.5). Similarly, looking
Mean The arithmetic
average of the sample; all
values of a distribution of
responses are summed
and divided by the number
of valid responses.
www.MyEbookNiche.eCrater.com

Chapter 11 Basic Data Analysis for Quantitative Research 275
at the females next (Respondents C and D), we calculate the mean number of cups to be
5.5 (5 + 6 = 11/2 = 5.5). If we look only at the mean number of cups of coffee consumed
by males and females, we would conclude there are no differences in the two groups. If
we consider the underlying distribution, however, we must conclude there are some dif-
ferences and the mean in fact distorts our understanding of coffee consumption patterns
of males and females.
Median The median is the middle value of the distribution when the distribution is or-
dered in either an ascending or a descending sequence. For example, if you interviewed a
sample of students to determine their coffee-drinking patterns during finals, you might find
that the median number of cups of coffee consumed is 4. The number of cups of coffee
consumed above and below this number would be the same (the median number is the ex-
act middle of the distribution). If the number of data observations is even, the median is
generally considered to be the average of the two middle values. If there is an odd number
of observations, the median is the middle value. The median is especially useful as a mea-
sure of central tendency for ordinal data and for data that are skewed to either the right or
left. For example, income data are skewed to the right because there is no upper limit
on income.
Mode The mode is the value that appears in the distribution most often. For example, the
average number of cups of coffee students drink per day during finals may be 5 (the mean),
while the number of cups of coffee that most students drink is only 3 (the mode). The
mode is the value that represents the highest peak in the distribution’s graph. The mode is
especially useful as a measure for data that have been somehow grouped into categories.
Median The middle
value of a rank-ordered
distribution; exactly half of
the responses are above
and half are below the
median value.
Mode The most common
value in the set of
responses to a question;
that is, the response most
often given to a question.
Exhibit 11.1 Measures of Central Tendency
www.MyEbookNiche.eCrater.com

276 Part 4 Data Preparation, Analysis, and Reporting the Results
The mode for the Jose’s Southwestern Café data distribution in Exhibit 11.1 is “Occasion-
ally” because when you look in the Frequency column you will see the largest number of
responses is 62 for the “Occasionally” label, which was coded as a 3.
Each measure of central tendency describes a distribution in its own manner, and each
measure has its own strengths and weaknesses. For nominal data, the mode is the best mea-
sure. For ordinal data, the median is generally best. For interval or ratio data, the mean is
appropriate, except when there are extreme values within the interval or ratio data, which
are referred to as outliers. In this case, the median and the mode are likely to provide more
information about the central tendency of the distribution.
SPSS Applications—Measures of Central TendencyYou can use the Santa Fe Grill database with the SPSS software to calculate measures of
central tendency. After splitting the file into the two restaurant samples, the SPSS click-
through sequence is ANALYZE → DESCRIPTIVE STATISTICS → FREQUENCIES.
Let’s use X25
–Frequency of Eating as a variable to examine. Click on X25
to highlight it
and then on the arrow box for the Variables window to use in your analysis. Next, open
the Statistics box and click on Mean, Median, and Mode, and then Continue and OK. The
dialog boxes for this sequence are shown in Exhibit 11.2.
Let’s look at the output for the measures of central tendency shown in Exhibit 11.1.
In the Statistics table we see the mean for Jose’s Southwestern Café is 3.77, the median
is 4.00, the mode is 3, and there are eight observations with missing data. Recall that this
variable is measured on a 5-point scale, with lower numbers indicating lower frequency
of eating and larger numbers indicating higher frequency. The three measures of central
tendency can all be different within the same distribution, as described previously in the
coffee-drinking example. But it also is possible that all three measures can be the same. In
our example, the mean, median, and mode are all different.
Interpretation of Results The mean frequency of dining at Jose’s is 3.77 and at the Santa
Fe Grill the mean frequency is 2.96. Similarly, the median for Jose’s is 4.0 and the mode is
3 while the median for the Santa Fe Grill is 3.0 and the mode 2. All three measures of
central tendency indicate, therefore, that the customers of Jose’s dine there more frequently.
This identifies an area of improvement for the Santa Fe Grill. The owners need to determine
why their customers eat there less often (or why Jose’s customers eat in that restaurant
more frequently) and develop a plan to overcome this weakness.
To split the sample into the Santa Fe Grill responses and
those from Jose’s Southwestern Café, the click-through
sequence is DATA → SPLIT FILE. First click on the Data
pull-down menu and scroll down and highlight and click
on Split File. You now see the Split File dialog box where
the default is Analyze all cases. Click on the Compare
groups option, highlight the variable you want to split
the groups with (e.g., screening variable X_s4) and click
on the arrow box to move it into the Groups Based on:
window. Next click on OK and you will be analyzing the
Santa Fe Grill customers and Jose’s customers sepa-
rately. Thus, your output will have the results for the two
competitors separately. Remember too that all data anal-
ysis following this change will split the file. To analyze
the total sample you must follow the same sequence and
click again on Analyze all cases.
MARKETING RESEARCH DASHBOARD SPLITTING THE DATABASE INTO SANTA FE’S AND JOSE’S CUSTOMERS
www.MyEbookNiche.eCrater.com

Chapter 11 Basic Data Analysis for Quantitative Research 277
Measures of DispersionMeasures of central tendency often do not tell the whole story about a distribution of
responses. For example, if data have been collected about consumers’ attitudes toward
a new brand of a product, you could calculate the mean, median, and mode of the dis-
tribution of answers. However, you might also want to know if most of the respondents
had similar opinions. One way to answer this question is to examine the measures of
dispersion associated with the distribution of responses to your questions. Mea-
sures of dispersion describe how close to the mean or other measure of central ten-
dency the rest of the values in the distribution fall. Two measures of dispersion that
describe the variability in a distribution of numbers are the range and the standard
deviation.
Range The range defines the spread of the data. It is the distance between the smallest
and largest values of the variable. Another way to think about it is that the range identifies
the endpoints of the distribution of values. For variable X25
–Frequency of Eating, the range
is the difference between the response category Very Frequently (largest value coded 5)
and response category Very Infrequently (smallest value coded 1). Thus, the range is 4. In
this example, there were only five response categories. But some questions have a much
wider range. For example, if we asked how often in a month respondents record TV shows
on their DVR, or how much they would pay for a new Smartphone, the range likely would
be much larger. In these examples, the respondents, not the researchers, are defining the
Range The distance
between the smallest and
largest values in a set of
responses.
Exhibit 11.2 Dialog Boxes for Calculating the Mean, Median, and Mode
www.MyEbookNiche.eCrater.com

278 Part 4 Data Preparation, Analysis, and Reporting the Results
range by their answers. For this reason, the range is more often used to describe the vari-
ability of open-ended questions such as our examples. Recall that for variable X25
–
Frequency of Eating, the range is calculated as the distance between the largest and
smallest values in the set of responses and equals 4 (5 – 1 = 4).
Standard Deviation The standard deviation describes the average distance of the distri-
bution values from the mean. The difference between a particular response and the distri-
bution mean is called a deviation. Since the mean of a distribution is a measure of central
tendency, there should be about as many values above the mean as there are below it (par-
ticularly if the distribution is symmetrical). Consequently, if we subtracted each value in a
distribution from the mean and added them up, the result would be close to zero (the posi-
tive and negative results would cancel each other out).
The solution to this difficulty is to square the individual deviations before we add
them up (squaring a negative number produces a positive result). To calculate the esti-
mated standard deviation, we use the formula below.
n − 1i–1
n
∑(Xi − X)
2
Standard deviation (s) =
Once the sum of the squared deviations is determined, it is divided by the number of
respondents minus 1. The number 1 is subtracted from the number of respondents to help
produce an unbiased estimate of the standard deviation. The result of dividing the sum of
the squared deviations is the average squared deviation. To convert the result to the same
units of measure as the mean, we take the square root of the answer. This produces the
estimated standard deviation of the distribution. Sometimes the average squared deviation
is also used as a measure of dispersion for a distribution. The average squared deviation,
called the variance, is used in a number of statistical processes.
Since the estimated standard deviation is the square root of the average squared devia-
tions, it represents the average distance of the values in a distribution from the mean. If the
estimated standard deviation is large, the responses in a distribution of numbers do not fall
very close to the mean of the distribution. If the estimated standard deviation is small, you
know that the distribution values are close to the mean.
Another way to think about the estimated standard deviation is that its size tells you
something about the level of agreement among the respondents when they answered a
particular question. For example, in the restaurant database, respondents were asked to
rate their satisfaction (X22
) with the two restaurants. We will use the SPSS program later to
examine the standard deviations for this question.
Together with the measures of central tendency, these descriptive statistics can reveal
a lot about the distribution of a set of numbers representing the answers to an item on a
questionnaire. Often, however, marketing researchers are interested in more detailed ques-
tions that involve more than one variable at a time. The next section, on hypothesis testing,
provides some ways to analyze those types of questions.
SPSS Applications—Measures of DispersionWe will use the restaurant database with the SPSS software to calculate measures of
dispersion, just as we did with the measures of central tendency. Note that to calculate
the measures of dispersion we will be using the database with a sample size of 405, so
Standard deviation The
average distance of the
distribution values from
the mean.
Variance The average
squared deviation about
the mean of a distribution
of values.
www.MyEbookNiche.eCrater.com

Chapter 11 Basic Data Analysis for Quantitative Research 279
we have eliminated all respondents with missing data. Also, before running this analy-
sis make sure your database is split between the two restaurants. The SPSS click-through
sequence is ANALYZE → DESCRIPTIVE STATISTICS → FREQUENCIES. Let’s use
X22
–Satisfaction as a variable to examine. Click on X22
to highlight it and then on the arrow
box to move X22
to the Variables window. Next open the Statistics box, go to the Dispersion
box in the lowerleft-hand corner, and click on Standard deviation, Range, Minimum and
Maximum, and then Continue.
Interpretation of Results Exhibit 11.3 shows the output for the measures of dispersion
for variable X22
–Satisfaction. First, the highest response on the 7-point scale is 7 (maximum)
for both restaurants, and the lowest response for the two restaurants is 3 (minimum). The
range for both restaurants is 4 (7 – 3 = 4), while the standard deviation for Jose’s is 1.141
and for Santa Fe 1.002. The mean for Jose’s is 5.31 and for Santa Fe Grill 4.54. A standard
deviation of 1.002 on a 7-point scale for the Santa Fe Grill indicates the responses to this
question are dispersed relatively closely around the mean of 4.54. The results again suggest
an area of improvement since the reported satisfaction of Santa Fe Grill customers is lower
(4.54) than for Jose’s Southwestern Café (5.31). At this point we have not examined
whether the mean satisfaction levels of the two restaurants are statistically different,
however, so that is a question that needs to be examined.
Exhibit 11.3 Measures of Dispersion
www.MyEbookNiche.eCrater.com

280 Part 4 Data Preparation, Analysis, and Reporting the Results
Exhibit 11.5 Bar Chart for Frequency of Eating at Santa Fe Grill
60
40
20
0
Very Infrequently Very FrequentlySomewhat
Infrequently
Somewhat
Frequently
X25 — Frequency of Eating at . . . ??
X25 — Frequency of Eating at . . . ??
Occasionally
Fre
qu
en
cy
Exhibit 11.4 Frequency Count of X25
–Frequency of Eating at Santa Fe Grill
www.MyEbookNiche.eCrater.com

Chapter 11 Basic Data Analysis for Quantitative Research 281
Preparation of ChartsMany types of charts and graphics can be prepared easily using the SPSS software. Charts
and other visual communication approaches should be used whenever practical. They help
information users to quickly grasp the essence of the results developed in data analysis, and
also can be an effective visual aid to enhance the communication process and add clarity
and impact to research reports and presentations.
In this section, we show how to prepare bar charts. We use variable X25
–Frequency of
Eating from the restaurant database to develop the frequency tabulation in Exhibit 11.4.
Note that we have 253 responses so this is the data only for the customers of the Santa
Fe Grill.The table shows how frequently the customers eat at the Santa Fe Grill using a
5-point scale, with 1 = Very Infrequently, 2 = Somewhat Infrequently, 3 = Occasionally,
4 = Somewhat Frequently, and 5 = Very Frequently. The most frequent response is
2 (Somewhat Infrequently) with 62 of the 253 respondents indicating that alternative.
A bar chart shows tabulated data in the form of bars that may be horizontally or
vertically oriented. Bar charts are excellent tools to depict both absolute and relative
magnitudes, differences, and change. Exhibit 11.5 is an example of a vertical bar chart
based on the data from Exhibit 11.4. For example, the frequency for the value label of
Very Infrequently = 1 (N = 49) is the first vertical bar on the left side of the chart, and
the next bar is Somewhat Infrequently = 2 (N = 62). The remaining bars are developed
in the same way.
Marketing researchers need to exercise caution when using charts and figures
to explain data. It is possible to misinterpret information in a chart and lead marketing
research information users to inappropriate conclusions. In Chapter 13, on marketing
research reports, we explain charts and graphics in much more detail.
How to Develop Hypotheses
Measures of central tendency and dispersion are useful tools for marketing researchers.
But researchers often have preliminary ideas regarding data relationships based on the
research objectives. These ideas are derived from previous research, theory, and/or the
current business situation, and typically are called hypotheses. Recall that a hypothesis
is an unproven supposition or proposition that tentatively explains certain facts or phe-
nomena. A hypothesis also may be thought of as an assumption about the nature of a
particular situation. Statistical techniques enable us to determine whether the proposed
hypotheses can be confirmed by the empirical evidence. An example of a hypothesis
would be “The average number of Cokes consumed by an individual on a hot day will be
greater than on a cooler day.”
Hypotheses are developed prior to data collection, generally as a part of the research plan.
One example of testing a hypothesis is to examine a theory that men eat more hamburgers
than women at a McDonald’s restaurant in a typical week. To test this hypothesis, the num-
ber of hamburgers eaten by men and women could be calculated by observing purchasing
behavior in a typical week. To do so, we would compare the number of hamburgers
eaten by the male and female customers and determine if there are differences. For
example, let’s say the average number of McDonald’s hamburgers eaten by women per
week is 1.2, and the average number of McDonald’s hamburgers eaten by men is 2.7. We
could conclude that there is a difference in the number of hamburgers eaten by men and
www.MyEbookNiche.eCrater.com

282 Part 4 Data Preparation, Analysis, and Reporting the Results
women and that our theory is confirmed. This finding could be very useful to a marketing
researcher working for McDonald’s, or perhaps a competitor.
When we test hypotheses that compare two or more groups, if the groups are different
subsets of the same sample then the two groups must be considered related samples for
conducting statistical tests. In contrast, if we assume the groups are from separate popula-
tions then the different groups are considered independent samples. In both situations, the
researcher is interested in determining if the two groups are different but different statisti-
cal tests are appropriate for each situation.We examine this in more detail in a later section.
Many theories could be used to develop hypotheses for the restaurant databases. For
example, the owners have a theory that the recession has resulted in customers eating at
the Santa Fe Grill less often. To test that hypothesis we first calculate that of the 253 Santa
Fe Grill customers surveyed, 10 percent said they visited the restaurant at least two times
per month. But in a similar survey conducted last year, 15 percent said they visited the
restaurant at least two times per month. In this example, the samples are independent. One
question is whether or not the difference in the percentages confirms the hypothesis that
frequency of eating at the Santa Fe Grill is down. If it is down, as the data suggest, this is
useful information in developing a marketing plan for the Santa Fe Grill. In other words,
“Has the percentage of persons eating at the Santa Fe Grill two times per month actually
decreased from 15 percent last year to 10 percent this year?” or is this finding a result of
sampling error?
There is a difference in the percentages that visit the Santa Fe Grill at least two times
per month. We noted, however, that sampling error could distort the results enough so
there may not be any statistical differences between this year’s and last year’s percentages.
If the difference between the percentages is quite large, the researcher would be more con-
fident that there is in fact a true difference between the groups. Some uncertainty would
still exist, however, as to whether the observed difference is meaningful. In this instance
we have intuitively considered the amount of difference between the means. But we have
not considered the size of the sample used to calculate the means or the sample standard
deviations.
The null hypothesis is no difference in the group means. It is based on the notion that
any change from the past is due entirely to random error. In this case, the null hypothesis
would be no difference between the 15 percent visiting the restaurant an average of two times
To be consistent with the scientific method, marketing
researchers need a systematic approach to develop
hypotheses. Below is a recommended set of steps.
1. Review the research objectives and background in-
formation obtained from the literature review.
2. Develop the null and alternative hypotheses based
on research objectives and other information.
3. Make an informed judgment about the sampling distri-
bution of the population and then select the appropri-
ate statistical test based on data distribution, number
of variables, and type of scale measurement.
4. Select the desired level of statistical significance
(p = .05, for example).
5. Collect the sample data, apply the statistical method
selected, and determine if the differences are statisti-
cally significant and meaningful.
6. Accept or reject the null hypothesis. That is, deter-
mine whether the deviation of the sample value from
the expected value occurred by chance alone or rep-
resents a true difference.
MARKETING RESEARCH DASHBOARD STEPS IN HYPOTHESIS DEVELOPMENT AND TESTING
www.MyEbookNiche.eCrater.com

Chapter 11 Basic Data Analysis for Quantitative Research 283
a month last year and the 10 percent found this year. Statisticians and marketing researchers
typically test the null hypothesis. Another hypothesis, called the alternative hypothesis, states
the opposite of the null hypothesis. The alternative hypothesis is that there is a difference
between the group means. If the null hypothesis is accepted, we do not have change in the
status quo. But if the null hypothesis is rejected and the alternative hypothesis accepted, the
conclusion is there has been a change in behavior, attitudes, or some similar measure.
Analyzing Relationships of Sample Data
Marketing researchers often wish to test hypotheses about proposed relationships in the
sample data. In this section, we discuss several methods used to test hypotheses. We first
introduce Chi-square analysis, a statistic used with nominal and ordinal data. We then
discuss the t distribution and describe its function for testing hypotheses using interval and
ordinal data. Before discussing these methods of testing hypotheses, we review some basic
statistical terminology and suggest ways to select the appropriate statistical technique.
Sample Statistics and Population ParametersThe purpose of inferential statistics is to make a determination about a population on
the basis of a sample from that population. As we explained in Chapter 6, a sample is
a subset of the population. For example, if we wanted to determine the average number
of cups of coffee consumed per day by students during finals at your university, we
would not interview all the students. This would be costly, take a long time, and could be
impossible since we might not be able to find them all or some would decline to partici-
pate. Instead, if there are 16,000 students at your university, we may decide that a sample
of 200 females and 200 males is sufficiently large to provide accurate information
about the coffee-drinking habits of all 16,000 students.
You may recall that sample statistics are measures obtained directly from the sample
or calculated from the data in the sample. A population parameter is a variable or some
sort of measured characteristic of the entire population. Sample statistics are useful in
making inferences regarding the population’s parameters. Generally, the actual population
parameters are unknown since the cost to perform a true census of almost any population
is prohibitive.
A frequency distribution displaying the data obtained from the sample is commonly
used to summarize the results of the data collection process. When a frequency distribution
displays a variable in terms of percentages, then this distribution represents proportions
within a population. For example, a frequency distribution showing that 40 percent of the
people patronize Burger King indicates the percentage of the population that meets the cri-
terion (eating at Burger King). The proportion may be expressed as a percentage, a decimal
value, or a fraction.
Choosing the Appropriate Statistical TechniqueAfter the researcher has developed the hypotheses and selected an acceptable level of risk
(statistical significance), the next step is to test the hypotheses. To do so, the researcher
must select the appropriate statistical technique to test the hypotheses. A number of sta-
tistical techniques can be used to test hypotheses. Several considerations influencing the
choice of a particular technique are (1) the number of variables, (2) the scale of measure-
ment, and (3) parametric versus nonparametric statistics.
www.MyEbookNiche.eCrater.com

284 Part 4 Data Preparation, Analysis, and Reporting the Results
Number of Variables The number of variables examined together is a major consider-
ation in the selection of the appropriate statistical technique. Univariate statistics uses only
one variable at a time to generalize about a population from a sample. For example, if the
researcher wants to examine the average number of cups of Starbucks coffee college
students drink during finals, only a single variable is used and univariate statistics is ap-
propriate. If the researcher is interested in the relationship between the average number of
cups of Starbucks coffee college students drink during finals and the number of hours
spent studying for finals, two variables are involved and a bivariate statistical technique is
required. Often researchers will need to examine many variables at the same time to repre-
sent the real world and fully explain relationships in the data. In such cases, multivariate
statistical techniques are required. We examine univariate and bivariate statistics in this
chapter and more advanced statistical techniques in later chapters.
Scale of Measurement We discussed measurement and scaling in Chapter 7. We use
that information here to show which statistical techniques are used with a particular type of
scale. Exhibit 11.6 provides an overview of the types of scales used in different situations.
Suppose the researcher has a nominal scale like Starbucks brand coffee drinkers versus
Maxwell House coffee drinkers. The mode would be the only appropriate measure of cen-
tral tendency. A Chi-square test could be used to test whether the observed number of
Starbucks brand coffee drinkers is what one would expect it to be. For example, if a sample
survey showed that 34 percent of college students at your university drink Starbucks coffee
and you expected it to be 40 percent based on a national survey, you could use Chi-square
to determine whether the differences were statistically significant.
With ordinal data you can use only the median, percentile, and Chi-square. For
example, if we have ranking data for two factors that are thought to be important in the
selection of a coffee brand, we would use the median, percentile, and Chi-square. If the
two ranking factors are coffee taste and brand name, we could use the Chi-square statistic
to determine whether Starbucks coffee drinkers and Maxwell House drinkers ranked these
factors differently. Finally, if we have the actual count of the number of cups of coffee the
typical Starbucks consumer drank during finals versus the Maxwell House consumer, we
have ratio data and could calculate the standard deviation and determine if there are differ-
ences in the mean number of cups consumed using the t-test or ANOVA.
Parametric Versus Nonparametric Statistics There are two major types of statistics. They
are referred to as parametric and nonparametric. The major difference between these two types
of statistics lies in the underlying assumptions about the data. When the data are measured using
Exhibit 11.6 Type of Scale and Appropriate Statistic
Measure of
Type of Scale Central Tendency Measure of Dispersion Statistic
Nominal Mode None Chi-square
(nonparametric)
Ordinal Median Percentile Chi-square
(nonparametric)
Interval or ratio Mean Standard deviation t-test, ANOVA
(parametric)
www.MyEbookNiche.eCrater.com

Chapter 11 Basic Data Analysis for Quantitative Research 285
an interval or ratio scale and the sample size is large, parametric statistics are appropriate. It is
also assumed the sample data are collected from populations with normal (bell-shaped) distribu-
tions. In contrast, when a normal distribution cannot be assumed, the researcher must use non-
parametric statistics. Moreover, when data are measured using an ordinal or nominal scale it is
generally not appropriate to assume that the distribution is normal and, therefore, nonparametric
or distribution-free statistics should be used. In this chapter, we discuss the nonparametric statis-
tic Chi-square and the parametric statistics t-test and ANOVA. Exhibit 11.6 shows a chart that
provides further guidelines on selecting the appropriate statistic.
After considering the measurement scales and data distributions, there are three
approaches for analyzing sample data that are based on the number of variables. We can
use univariate, bivariate, or multivariate statistics. Univariate means we statistically ana-
lyze only one variable at a time. Bivariate analyzes two variables. Multivariate examines
many variables simultaneously.
Exhibit 11.7 provides guidelines on selecting the appropriate statistical test to assess
univariate and bivariate relationships. The combination of data types presented by the IV
and DV (i.e., nominal, ordinal, interval, or ratio), and the nature of the relationship exam-
ined (hypothesis), determines the correct statistical test. For example, if the IV is gender
(nominal data) and the DV is age (ratio data), and your objective is examining differences
in the groups, then that combination calls for the t-test. But if the IV is gender (nominal
data) and the DV is age (ratio/metric data), and your objective is examining association
between the groups, that combination calls for the Spearman correlation. Thus, it is the
combination of the type of data and the objective of the analysis (differences or associa-
tion) that determines the correct statistical test.
Two or More VariablesRelationship
Examined
(hypothesis)
Statistical Test
Independent
Variable (IV)
Dependent
Variable (DV)
Nominal Nominal Differences X2 Crosstabs test (NP)
Ordinal Ordinal Association Spearman correlation (NP)
Metric Ordinal Association Spearman correlation (NP)
Ordinal Metric Association Spearman correlation (NP)
Metric Metric Association Pearson correlation (P)
Two groups Ordinal Differences Median test (NP)
Three or more
groups
Ordinal Differences Kruskal-Wallis one way analysis
of variance (NP)
Two groups Metric Differences t-test (independent samples) (P)
Three or more
groups
Metric Differences One way analysis of variance (P)
Single Variable
Nominal X2 Goodness-of-fit test (NP)
Note: (NP) = Nonparametric test and (P) = Parametric test
Exhibit 11.7 Univariate and Bivariate Relationships: Selecting the Appropriate Test
www.MyEbookNiche.eCrater.com

286 Part 4 Data Preparation, Analysis, and Reporting the Results
Univariate Statistical TestsTesting hypotheses using statistical tests involves much more than the tabulations included
in a frequency distribution or the calculation of measures of central tendency or dispersion.
Researchers not only describe data using means or percentages. They also provide tests of
the like lihood that the sample numbers are correct or incorrect estimates of the population
characteristics. The simplest types of tests are univariate tests of significance. Univari-
ate tests of significance are used to test hypotheses when the researcher wishes to test a
proposition about a sample characteristic against a known or given standard. The following
are some examples of propositions:
∙ The new product or service will be preferred by 80 percent of our current customers.
∙ The average monthly electric bill in Miami, Florida, exceeds $250.00.
∙ The market share for Community Coffee in south Louisiana is at least 70 percent.
∙ More than 50 percent of current Diet Coke customers will prefer the new Diet Coke
that includes a lime taste.
We can translate these propositions into a null hypotheses and test them. Remember,
hypotheses are developed based on theory, previous relevant experiences, and current mar-
ket conditions. In the following paragraphs, we provide an example from the Santa Fe Grill
database of a univariate hypothesis test.
The process of testing hypotheses regarding population characteristics based on
sample data often begins by calculating frequency distributions and averages, and then
moves on to further analysis that actually tests the hypotheses. When the hypothesis testing
involves examining one variable at a time, it is referred to as a univariate statistical test.
When the hypothesis testing involves two variables, it is called a bivariate statistical test.
We first discuss univariate statistical tests.
Suppose the Santa Fe Grill owners based on observation of competitors believe their
menu prices are reasonable and want to test the hypothesis of whether customers think
their menu prices are reasonable. Respondents have answered a pricing question using
a 7-point scale where 1 = “Strongly Disagree” and 7 = “Strongly Agree.” The scale is
assumed to be an interval scale, and previous research using this measure has shown the
responses to be approximately normally distributed.
Researchers must perform a couple of tasks before attempting to answer the question
posed above. First, the null and alternative hypotheses must be developed. Then the level
of significance for rejecting the null hypothesis and accepting the alternative hypothesis
must be selected. At that point, the researchers can conduct the statistical test and deter-
mine the answer to the research question.
In this example, the owners believe that customers will perceive the prices of food
at the Santa Fe Grill to be about average. If the owners are correct, the mean response to
this question will be around 4 (halfway between 1 and 7 on the response scale). The null
hypothesis is that the mean of the X16
–Reasonable Prices will not be significantly differ-
ent from 4. Recall the null hypothesis asserts the status quo: Any difference from what is
thought to be true is due to random sampling. The alternative hypothesis is that the mean
of the answers to X16
–Reasonable Prices will not be 4. If the alternative hypothesis is true,
then there is in fact a true difference between the sample mean we find and the mean the
owners are expected to find (4).
Assume also the owners want to be 95 percent certain the mean is not 4. Therefore, the
significance level will be set at .05. Using this significance level means that if the survey
of Santa Fe Grill customers is conducted many times, the probability of incorrectly reject-
ing the null hypothesis when it is true would happen less than five times out of 100 (.05).
www.MyEbookNiche.eCrater.com

Chapter 11 Basic Data Analysis for Quantitative Research 287
SPSS Application—Univariate Hypothesis TestUsing the SPSS software, you can test the responses in the Santa Fe Grill database to find the
answer to the research question posed earlier. First you must select only the Santa Fe Grill cus-
tomers that took the survey—see nearby Marketing Research Dashboard for instructions. The
click-through sequence is, ANALYZE → COMPARE MEANS → ONE-SAMPLE T-TEST.
When you get to the dialog box, click on X16
–Reasonable Prices to highlight it. Then click on
the arrow to move X16
into the Test Variables box. In the window labeled Test Value, enter the
number 4. This is the number you want to compare the respondents’ answers against. Click
on the Options box and enter 95 in the confidence interval box. This is the same as setting the
significance level at 0.05. Then, click on the Continue button and OK to execute the program.
The SPSS output is shown in Exhibit 11.8. The top table is labeled One-Sample Sta-
tistics and shows the mean, standard deviation, and standard error for X16
– Reasonable
Prices (a mean of 4.47 and standard deviation of 1.384). The One-Sample Test table below
shows the results of the t-test for the null hypothesis that the average response to X16
is 4
(Test Value = 4). The t-test statistic is 5.404, and the significance level is .000. This means
that the null hypothesis can be rejected and the alternative hypothesis accepted with a high
level of confidence from a statistical perspective.
Interpretation of Results From a practical standpoint, in terms of the Santa Fe Grill, the results
of the univariate hypothesis test indicate respondents perceived that menu prices are slightly
above the midpoint of the scale. The mean of 4.47 is somewhat higher than the midpoint of 4 on
the 7-point scale (7 = Strongly Agree prices are reasonable). Thus, the Santa Fe Grill owners can
conclude that their prices are not perceived as unreasonable. But on the other hand, there is a lot
of room to improve between the mean of 4.47 on the 7-point scale and the highest value of 7.
This is definitely an area the owners need to examine and develop a plan to improve.
Bivariate Statistical TestsIn many instances marketing researchers test hypotheses that compare the characteristics
of two groups or two variables. For example, the marketing researcher may be interested in
Exhibit 11.8 Univariate Hypothesis Test Using X16
–Reasonable Prices
www.MyEbookNiche.eCrater.com

288 Part 4 Data Preparation, Analysis, and Reporting the Results
determining whether there is a difference in the importance of a GPS (global positioning
system) between older and younger new car purchasers. In this situation, bivariate (two
variable) analysis is appropriate.
In the following section, we first explain the concept of cross tabulation, which examines
two variables. We then describe three types of bivariate hypothesis tests: Chi-square, which is
used with nominal data, and the t-test (to compare two means) and analysis of variance (com-
pares three or more means), both of which are used with either interval or ratio data.
Cross-TabulationIn Chapter 10, we introduced one-way frequency tables to report the findings for a single
variable. The next logical step in data analysis is to perform cross-tabulation using two
variables. Cross-tabulation is useful for examining relationships and reporting the find-
ings for two variables. The purpose of cross tabulation is to determine if differences exist
between subgroups of the total sample. In fact, cross tabulation is the primary form of data
analysis in some marketing research projects. To use cross tabulation you must understand
how to develop a cross tabulation table and how to interpret the outcome.
Cross-tabulation is one of the simplest methods for describing sets of relationships.
A cross-tabulation is a frequency distribution of responses on two or more sets of vari-
ables. To conduct cross tabulation, the responses for each of the groups are tabulated and
compared. Chi-square (X2) analysis enables us to test whether there are any statistical dif-
ferences between the responses for the groups. Below are examples of questions that could
be answered using cross-tabulations and testing with Chi-square analysis:
∙ Do restaurant selection factor rankings (most important, second most important, third
in importance, etc.) differ between customers and noncustomers?
∙ Does frequency of dining (very frequent, somewhat frequent, occasional) differ
between the Santa Fe Grill and Jose’s Southwestern Café?
∙ Is Internet usage (heavy, moderate, low) related to educational levels (elementary,
middle, high school, some college, college degree, post-graduate work)?
∙ Is brand awareness (unaware, aware) related to the geographic area in which individu-
als live (North America, Europe, Asia, Africa, etc.)?
Researchers can use the Chi-square test to determine whether responses observed in a
survey follow the expected pattern. For example, Exhibit 11.9 shows a cross-tabulation
between gender and respondents’ recall of restaurant ads. The cross-tabulation shows
To select the Santa Fe Grill responses (253) from the total
sample of 405 responses, the click-through sequence is
DATA → SELECT CASES. First click on the Data pull-down
menu and scroll down and highlight and click on Select
Cases. You now see the Select Cases dialog box where
the default is All cases. Click on the If condition is satisfied
option, and then on the If tab. Next highlight the screen-
ing variable X_s4 and click on the arrow box to move it
into the window. Then click on the equal sign (=) and 1
for the Santa Fe Grill customers. Now click Continue and
then OK and you will be analyzing only the Santa Fe Grill
customers. Thus, your output will have the results for only
one restaurant. Remember too that all data analysis fol-
lowing this change will analyze only the Santa Fe custom-
ers. To analyze the total sample you must follow the same
sequence and click again on All cases.
MARKETING RESEARCH DASHBOARD SELECTING THE SANTA FE GRILL CUSTOMERS FOR ANALYSIS
www.MyEbookNiche.eCrater.com

Chapter 11 Basic Data Analysis for Quantitative Research 289
frequencies and percentages, with percentages existing for both rows and columns. To
obtain these results, the SPSS sequence is Analyze–Descriptive Statistics–Crosstabs.
When you see the Crosstabs dialog box, move X31
into the Rows window and X32
into the
Columns window. Then click on the Statistics tab and check Chi-square and Continue.
Next click on the Cells tab and check Observed and Expected under the Counts box and
then Row, Column, and Total under the Percentages box, and Continue, and then OK.
Interpretation of Results One way to interpret the numbers in Exhibit 11.9, for example,
would be to look at those individuals who do not recall advertising. Overall only
33.3 percent of the sample recall any advertisements. But of all the males interviewed just 28.8
percent (76/264 = 28.8 percent) recall ads, while 41.8 percent of the females interviewed recall
ads. Thus, our preliminary interpretation suggests that males are less likely to recall restaurant
advertisements than females. But be careful not to be confused by the results for individuals
who recall ads. Those results show that of the 135 people who recall ads, 56.3 percent are males
and 43.7 percent are females, which you may think conflicts with the previous conclusion that
females recall ads at a higher rate than males. The higher percentage of males in the recall
ads group is due to the fact that more males than females were interviewed in this study.
The next step to better understand this situation would be to look at this same cross
tabulation but divide the analysis into Santa Fe Grill customers and Jose’s customers. This
would enable the Santa Fe Grill owners to compare the recall of their advertisements com-
pared to that for Jose’s.
Exhibit 11.9 Example of a Cross-Tabulation: Gender by Ad Recall
www.MyEbookNiche.eCrater.com

290 Part 4 Data Preparation, Analysis, and Reporting the Results
Several other issues must be considered in developing and interpreting cross tabula-
tion tables. Looking at Exhibit 11.9, note that percentages were calculated for each cell
of the cross tabulation table. The top number within each cell represents the absolute fre-
quency (count) of responses for each variable or question (e.g., 188 male respondents do
not recall ads). Below the absolute frequency is the Expected Count and then the row per-
centage per cell. For example, the 188 male respondents who do not recall ads repre-
sent 69.6 percent of the total in the “Do Not Recall” category (188/270 = 69.6 percent).
The cell also shows the total percentage of respondents within cells based on the total
sample. So, for example, with a total sample of 405, 46.4 percent of the sample are males
who do not recall ads, and 18.8 percent are males that do recall ads. This suggests that in gen-
eral males are not recalling advertisements as frequently as females, but neither has a high recall
of restaurant ads. This is definitely an area the Santa Fe Grill owners need to understand better.
When constructing a cross-tabulation table, the researcher selects the variables to use
when examining relationships. Selection of variables should be based on the objectives of
the research project and the hypotheses being tested. But in all cases remember that
Chi-square is the statistic to analyze nominal (count) or ordinal (ranking) scaled data.
Paired variable relationships (e.g., gender of respondent and ad recall) are selected on the
basis of whether the variables answer the research questions in the research project and are
either nominal or ordinal data.
Demographic variables or lifestyle/psychographic characteristics are typically the
starting point in developing cross tabulations. These variables are usually the columns
of the cross tabulation table, and the rows are variables like purchase intention, usage, or
actual sales data. Cross-tabulation tables show percentage calculations based on column
variable totals. Thus, the researcher can make comparisons of behaviors and intentions for
different categories of predictor variables such as income, sex, and marital status.
Cross-tabulation provides the research analyst with a powerful tool to summarize survey
data. It is easy to understand and interpret and can provide a description of both total and
subgroup data. Yet the simplicity of this technique can create problems. It is easy to produce
an endless variety of cross tabulation tables. In developing these tables, the analyst must
always keep in mind both the project objectives and specific research questions of the study.
Chi-Square AnalysisMarketing researchers often analyze survey data using one-way frequency counts and
cross-tabulations. One purpose of cross tabulations is to study relationships among vari-
ables. The research question is “Do the numbers of responses that fall into different cat-
egories differ from what is expected if there is no relationship between the variables?” The
null hypothesis is always that the two variables are not related. Thus, the null hypothesis in
our example would be that the percentage of men and women customers who recall Santa
Fe Grill ads is the same. The alternative hypothesis is that the two variables are related,
or that men and women differ in their recall of Santa Fe Grill ads. This hypothesis can be
answered using Chi-square analysis. Below are some other examples of research questions
that could be examined using Chi-square statistical tests:
∙ Is usage of the Internet (low, moderate, and high) related to the gender of the respondent?
∙ Does frequency of dining (infrequent, moderately frequent, and very frequent) differ
between males and females?
∙ Do part-time and full-time workers differ in terms of how often they are absent from
work (seldom, occasionally, frequently)?
∙ Do college students and high-school students differ in their preference for Coke versus Pepsi?
www.MyEbookNiche.eCrater.com

Chapter 11 Basic Data Analysis for Quantitative Research 291
Chi-square (X2) analysis enables researchers to test for statistical significance between
the frequency distributions of two (or more) nominally scaled variables in a cross-tabulation
table to determine if there is any association between the variables. Categorical data from
questions about sex, education, or other nominal variables can be tested with this statistic. Chi-
square analysis compares the observed frequencies (counts) of the responses with the expected
frequencies. The Chi-square statistic tests whether or not the observed data are distributed the
way we would expect them to be, given the assumption that the variables are not related. The
expected cell count is a theoretical value, while the observed cell count is the actual cell count
based on your study. For example, to test whether women recall Santa Fe Grill ads better than
men, we would compare the observed recall frequency for each sex with the frequency we
would expect to find if there is no difference between women’s and men’s ad recall. The
Chi-square statistic answers questions about relationships between nominally scaled data that
cannot be analyzed with other types of statistical analysis, such as ANOVA or t-tests.
Calculating the Chi-Square ValueTo help you better understand the Chi square statistic, we will show you how to calculate
it. The formula is shown below:
i−1
n
∑Chi-square formula x2 =
(Observedi — Expectedi)2
Expectedi
where
Observedi = observed frequency in cell i
Expectedi = expected frequency in cell i
n = number of cells
When you apply the above formula to the restaurant data shown in Exhibit 11.9, you get
the following calculation of Chi-square value:
= Chi-square value = 7.05 (P = 0.011; two-tailed)(188 – 176)
2(82 – 94)
2(76 – 88)
2(59 – 47)
2
176+ + +
94 88 47
As the above equation indicates, we subtract the expected frequency from the observed
frequency and then square it to eliminate any negative values before we use the results
in further calculations. After squaring, we divide the resulting value by the expected
frequency to take into consideration cell size differences. Then each of these calcula-
tions, which we performed for each cell of the table, is summed over all cells to arrive at
the final Chi-square value. The Chi-square value tells you how far the observed frequen-
cies are from the expected frequencies. Conceptually, the larger the Chi-square is, the
more likely it is that the two variables are related. This is because Chi-square is larger
whenever the number actually observed in a cell is more different than what we expected
to find, given the assumption that the two variables are not related. The computed Chi-
square statistic is compared to a table of Chi-square values to determine if the differences
are statistically significant. If the calculated Chi-square is larger than the Chi-square
reported in standard statistical tables, then the two variables are related for a given level
of significance, typically .05.
Chi-square (X2) analysis
Assesses how closely the
observed frequencies fit
the pattern of the expected
frequencies and is referred
to as a “goodness-of-fit”
test.
www.MyEbookNiche.eCrater.com

292 Part 4 Data Preparation, Analysis, and Reporting the Results
Some marketing researchers call Chi-square a “goodness of fit” test. That is, the test
evaluates how closely the actual frequencies “fit” the expected frequencies. When the dif-
ferences between observed and expected frequencies are large, you have a poor fit and you
reject your null hypothesis. When the differences are small, you have a good fit and you
would accept the null hypothesis that there is no relationship between the two variables.
One word of caution is necessary in using Chi-square. The Chi-square results will be
distorted if more than 20 percent of the cells have an expected count of less than 5, or if
any cell has an expected count of less than 1. In such cases, you should not use this test.
SPSS will tell you if these conditions have been violated. One solution to small counts in
individual cells is to collapse them into fewer cells to get larger counts.
SPSS Application—Chi-SquareBased on their conversations with customers, the owners of the Santa Fe Grill believe that
female customers drive to the restaurant from farther away than do male customers. The
Chi-square statistic can be used to determine if this is true. The null hypothesis is that the
same proportion of male and female customers make up each of the response categories for
X30
–Distance Driven. The alternative hypothesis is that these proportions differ by gender.
To conduct this analysis, first use the Data pull-down menu and go to Select Cases, as
shown in the accompanying Marketing Research Dashboard. Select only the Santa Fe Grill
customers to analyze. Next, the click-through sequence is ANALYZE → DESCRIPTIVE
STATISTICS → CROSSTABS. Click on X30
–Distance Driven for the Row variable and on
X32
–Gender for the Column variable. Click on the Statistics button and the Chi-square box,
and then Continue. Next click on the Cells button and on Expected frequencies (Observed
frequencies is usually already checked), and then on Row, Column, and Total Percentages.
Now click Continue and OK to execute the program.
The SPSS results are shown in Exhibit 11.10. The top table shows the actual num-
ber of responses (count) for males and females for each of the categories of X30
–Distance
Driven. Also in this table you will see the expected frequencies, or the number that we
expect to find in the cell if the null hypothesis of no difference is true. For example, 74
males drove a distance of less than 1 mile (59.8 were “expected” in this cell) while 12
females drove from this same distance (we expected to find 26.2).
The expected frequencies (count) are calculated on the basis of the proportion of the
sample represented by a particular group. For example, the total sample of Santa Fe Grill
customers is 253 and 176 are males and 77 are females. This means 69.6 percent of the
sample is male and 30.4 percent is female. When we look in the Total column for the dis-
tance driven category labeled “Less than 1 mile” we see that there are a total of 86 male
and female respondents. To calculate the expected frequencies, you multiply the proportion
a particular group represents times the total number in that group. For example, with males
you calculate 69.6 percent of 86 and the expected frequency is 59.8. Similarly, females
are 30.4 percent of the sample so the expected number of females = 26.2 (30.4 × 86). The
other expected frequencies are calculated in the same way.
Look again at the observed frequencies, but this time at those who drove More than
5 Miles. Note that a lower number of male customers of Santa Fe Grill than expected drive
farther to get to the restaurant. That is, we would expect 63.3 males to drive to the Santa Fe
Grill from more than 5 miles, but actually only 57 men drove from this far away. In con-
trast, there are more female customers than expected who drive from more than five miles
away (expected = 27.7 and actual 34).
Interpretation of Results Information in the Chi-Square tests table shows the results for
this test. The Pearson Chi-Square value is 16.945 and it is significant at the .000 level.
www.MyEbookNiche.eCrater.com

Chapter 11 Basic Data Analysis for Quantitative Research 293
Since this level of significance is much lower than our standard criterion of .05, we can
reject the null hypothesis of no difference with a high degree of confidence. The interpreta-
tion of this finding suggests that there is a high probability that female customers drive
from farther away to get to the Santa Fe Grill. There also is a tendency for males to drive
shorter distances to get to the restaurant.
Comparing Means: Independent Versus Related SamplesIn addition to examining frequencies, marketing researchers often want to compare the
means of two groups. In fact, one of the most frequently examined questions in marketing
Exhibit 11.10 Crosstab Chi-Square Example of Santa Fe Grill Customers
www.MyEbookNiche.eCrater.com

294 Part 4 Data Preparation, Analysis, and Reporting the Results
research is whether the means of two groups of respondents on some attitude or behavior
are significantly different. For example, in a sample survey we might examine any of the
following questions:
∙ Do the coffee consumption patterns (measured using the mean number of cups con-
sumed daily) of males and females differ?
∙ Does the number of hours an individual spends on the Internet each week differ by
income level? By gender? By education?
∙ Do younger workers exhibit higher job satisfaction than do older workers?
∙ Do Fortune 500 firms have a more favorable image than do smaller, family-owned firms?
The above research questions typically are based upon theory or practical experience
suggesting one or more hypotheses to be tested. Thus, when we examine questions like the
above, we first consider the theory and then develop the null and alternative hypotheses.
Then we select the significance level for testing the null hypothesis. Finally, we select the
appropriate statistical test and apply it to our sample data.
There are two types of situations when researchers compare means. The first is when
the means are from independent samples, and the second is when the samples are related.
An example of an independent samples comparison would be the results of interviews
with male and female coffee drinkers. The researcher may want to compare the average
number of cups of coffee consumed per day by male students with the average number
of cups of coffee consumed by female students. An example of the second situation,
related samples, is when the researcher compares the average number of cups of coffee
consumed per day by male students with the average number of soft drinks consumed per
day by the same sample of male students.
In a related sample situation, the marketing researcher must take special care in analyzing the information. Although the questions are independent, the respondents
are the same. This is called a paired sample. When testing for differences in related
samples, the researcher must use what is called a paired samples t-test. The formula
to compute the t value for paired samples is not presented here. Students are referred
to more advanced texts for the actual calculation of the t value for related samples.
The SPSS package contains options for both the related-samples and the independent
samples situations.
Using the t-Test to Compare Two MeansJust as with the univariate t-test, the bivariate t-test requires interval or ratio data. Also, the
t-test is especially useful when the sample size is small (n < 30) and when the population
standard deviation is unknown. Unlike the univariate test, however, we assume that the
samples are drawn from populations with normal distributions and that the variances of the
populations are equal.
The t-test for differences between group means can be conceptualized as the differ-
ence between the means divided by the variability of the means. The t value is a ratio of
the difference between the two sample means and the standard error. The t-test provides a
mathematical way of determining if the difference between the two sample means occurred
by chance. The formula for calculating the t value is
Z =X1 – X2
Sx1 – x2
Independent samples
Two or more groups of
responses that are tested
as though they may come
from different populations.
Related samples Two or
more groups of responses
that originated from the
sample population.
t-Test A hypothesis test
that utilizes the t distribution;
used when the sample
size is smaller than 30 and
the standard deviation is
unknown.
www.MyEbookNiche.eCrater.com

Chapter 11 Basic Data Analysis for Quantitative Research 295
where
x1 = mean of sample 1
x2 = mean of sample 2
Sx1 – x2 = standard error of the difference between the two means
SPSS Application—Independent Samples t-TestTo illustrate the use of a t-test for the difference between two group means, we turn to the res-
taurant database. Based on their experiences observing customers in the restaurant, the Santa
Fe Grill owners believe there are differences in the levels of satisfaction between male and
female customers. To test this hypothesis we can use the SPSS “Compare Means” program.
To execute this analysis, first use the Data pull-down menu and go to Select Cases, as shown
in the Marketing Research Dashboard. Select only the Santa Fe Grill customers to analyze.
The SPSS click-through sequence is Analyze → Compare Means → Independent-
Samples T-Test. When you get to this dialog box click variable X22
–Satisfaction into the
Test Variables box and variable X32
–Gender into the Grouping Variable Box. For variable
X32
you must define the range in the Define Groups box. Enter a 0 for Group 1 and a 1 for
Group 2 (males were coded 0 in the database and females were coded 1) and then click
Continue. For the Options we will use the defaults, so just click OK to execute the program.
Interpretation of Results In Exhibit 11.11 the top table shows the Group Statistics. Note
that 176 male customers and 77 female customers are in the Santa Fe restaurant data set.
Also, the mean satisfaction level for males is a bit higher at 4.70, compared with 4.18 for
the female customers. The standard deviation for females is somewhat smaller (0.823) than
for the males (1.034).
To find out if the two means are significantly different, we look at the information in the
Independent Samples Test table. The statistical significance of the difference in two means
is calculated differently if the variances of the two means are equal versus unequal. The Lev-
ene’s test for equality of variances is reported on the left side of the table. In this case the test
shows the two variances are not equal (Sig. value of .000 indicated the variances are signifi-
cantly different). When this value is < .05 you would use the “Equal variances not assumed”
test. In the column labeled “Sig. (2-tailed),” you will note that the two means are significantly
Exhibit 11.11 Comparing Two Means with the Independent Samples t-Test
www.MyEbookNiche.eCrater.com

296 Part 4 Data Preparation, Analysis, and Reporting the Results
different (< .000), whether we assume equal or unequal variances. Thus, there is no support
for the null hypothesis that the two means are equal, and we conclude that male customers
are significantly more satisfied than female customers with the Santa Fe Grill. There is other
information in this table, but we do not need to concern ourselves with it at this time.
SPSS Application—Paired Samples t-TestSometimes marketing researchers want to test for differences in two means for variables in
the same sample. For example, the owners of the Santa Fe Grill noticed that the taste of their
food is rated 4.78 while the food temperature is rated only 4.38. Since the two food variables
are likely to be related, they want to know if the ratings for taste really are significantly higher
(more favorable) than for temperature. To examine this, we use the paired samples test for the
difference in two means. This test examines whether two means from two different questions
using the same scaling and answered by the same respondents are significantly different. The
null hypothesis is that the mean ratings for the two food variables (X18
and X20
) are equal.
To test this hypothesis we use the SPSS paired-samples t-test and data only for the
Santa Fe Grill customers. The click-through sequence is Analyze → Compare Means →
Paired-Samples T-Test. When you get to this dialog box, highlight first X18
–Food Taste and
click the arrow button, and then highlight X20
–Food Temperature and click on the arrow
button to move them into the Paired Variables box. For the “Options” we will use the
defaults, so just click OK to execute the program.
Interpretation of Results In Exhibit 11.12 the top table shows the Paired Samples Statis-
tics. The mean for food taste is 4.78 and for food temperature is 4.38. The t value for this
comparison is 8.421 (see Paired Samples Test table) and it is significant at the 0.000 level.
Thus, we can reject the null hypothesis that the two means are equal. Moreover, we can
conclude that Santa Fe Grill customers have somewhat more favorable perceptions of food
taste than food temperature.
Exhibit 11.12 Paired Samples t-Test
www.MyEbookNiche.eCrater.com

Chapter 11 Basic Data Analysis for Quantitative Research 297
Analysis of Variance (ANOVA)Researchers use analysis of variance (ANOVA) to determine the statistical difference
between three or more means. For example, if a researcher finds that the average number of
cups of coffee consumed per day by freshmen during finals is 3.7, while the average number
of cups of coffee consumed per day by seniors and graduate students is 4.3 cups and
5.1 cups, respectively, are these observed differences statistically significant?
In this section, we show how one-way ANOVA is used to examine group means. The
term one-way is used because the comparison involves only one independent variable. In
a later section, we show how researchers also can use ANOVA to examine the effects of
several independent variables simultaneously. This enables analysts to estimate both the
individual and combined effects of several independent variables on the dependent variable.
An example of a one-way ANOVA problem may be to compare light, medium, and
heavy drinkers of Starbucks coffee on their attitude toward a particular Starbucks advertis-
ing campaign. In this instance, there is one independent variable—consumption of Star-
bucks coffee—but it is divided into three different levels. Our earlier t statistics won’t work
here because we are comparing the means of more than two groups.
ANOVA requires that the dependent variable, in this case the attitude toward the
Starbucks advertising campaign, be metric. That is, the dependent variable must be either
interval or ratio scaled. A second data requirement is that the independent variable, in this
case the coffee consumption variable, be categorical (nonmetric).
The null hypothesis for ANOVA always states that there is no difference between the
dependent variable groups—in this situation, the ad campaign attitudes of the groups of
Starbucks coffee drinkers. Thus, the null hypothesis would be
μ1 = μ2 = μ3
ANOVA examines the variance within a set of data. Recall from the earlier discussion
of measures of dispersion that the variance of a variable is equal to the average squared
deviation from the mean of the variable. The logic of ANOVA is that if we calculate the
variance between the groups and compare it to the variance within the groups, we can
make a determination as to whether the group means (attitudes toward the advertising
campaign) are significantly different.1 When within-group variance is high, it swamps any
between group differences we see unless those differences are large.
Determining Statistical Significance in ANOVA Researchers use the F-test with
ANOVA to evaluate the differences between group means for statistical significance. For
example, suppose the heavy users of Starbucks coffee rate the advertising campaign 4.4 on
a 5-point scale, with 5 = Very favorable. The medium users of Starbucks coffee rate the cam-
paign 3.9, and the light users of Starbucks coffee rate the campaign 2.5. The F-test in
ANOVA will tell us if these observed differences are statistically significant.
The total variance in a set of responses to a question is made up of between-group
and within-group variance. The between-group variance measures how much the sample
means of the groups differ from one another. In contrast, the within-group variance mea-
sures how much the responses within each group differ from one another. The F distribu-
tion is the ratio of these two components of total variance and can be calculated as follows:
F ratio =Variance between groups
Variance within groups
Analysis of variance
(ANOVA) A statistical
technique that determines
whether three or more
means are statistically
different from one another.
F-test The test used to
statistically evaluate the
differences between the
group means in ANOVA.
www.MyEbookNiche.eCrater.com

298 Part 4 Data Preparation, Analysis, and Reporting the Results
The larger the difference in the variance between groups, the larger the F ratio. Since the
total variance in a data set is divisible into between- and within-group components, if there
is more variance explained or accounted for by considering differences between groups than
there is within groups, then the independent variable probably has a significant impact on the
dependent variable. Larger F ratios imply significant differences between the groups. Thus,
the larger the F ratio, the more likely it is that the null hypothesis will be rejected.
SPSS Application—ANOVAThe owners of the Santa Fe Grill would like to know if there is a difference in the likeli-
hood of returning to the restaurant based on how far customers have driven to get to the
restaurant. They believe it is important to know the answer not only for their customers but
for customers of Jose’s as well. They therefore ask the researcher to test the hypothesis that
there are no differences in likelihood of returning (X23
) and distance driven to get to the
restaurants (X30
). To do so, the researcher analyzed all 405 responses for the survey.
To test this hypothesis we use the SPSS compare means test. The click-through
sequence is Analyze → Compare Means → One-Way ANOVA. When you get to the One-
Way ANOVA dialog box, highlight X23
–Likely to Return and move it into the Dependent
List window. Next highlight X30
–Distance Driven and then click on the arrow button to
move it into the Factor window. Now click on the Options tab and then on Descriptive.
Click Continue and OK to execute the program.
Interpretation of ANOVA Results The results are shown in Exhibit 11.13. First, the
numbers in the N column indicate that 116 individuals drive less than 1 mile, 129 drive 1 to
5 miles, and 160 drive more than 5 miles. Thus, a larger number of people are driving from
farther away to get to the restaurants. The question is, however, is distance driven related to
likelihood of returning? Looking at the numbers in the Mean column, we see that the like-
lihood of returning is lower as individuals drive farther. That is, the numbers in the Mean
Exhibit 11.13 Example of One-Way ANOVA
www.MyEbookNiche.eCrater.com

Chapter 11 Basic Data Analysis for Quantitative Research 299
column indicate that individuals driving less than 1 mile report a likelihood of returning of
4.91. Recall that this question uses a 7-point scale with 7 = Highly Likely and 1 = Highly
Unlikely. Individuals that drive 1 to 5 miles indicate their likelihood of returning is 4.63
and those who drive more than 5 miles are even less likely to return—mean of 4.01. Thus,
the likelihood of returning means become smaller as the distance driven increases.
The question remains, however, are these means significantly different? The ANOVA
table at the bottom of Exhibit 11.13 provides this answer. The Sig. column has the
number .000 in it. The correct interpretation of this number is if this survey were repeated
1,000 times, the result would always be statistically significant. Another way of saying this
is there are no chances in 1,000 that we could be wrong if we said that the hypothesis of no
differences is rejected and concluded that in fact there truly are differences in the means of
likelihood of returning based on distance driven.
Statistical Significance and Individual Group Differences A weakness of ANOVA,
however, is that the test enables the researcher to determine only that statistical differences
exist between at least one pair of the group means. The technique cannot identify which
pairs of means are significantly different from each other. In our example of Starbucks cof-
fee drinkers’ attitudes toward the advertising campaign, we can conclude that differences
in attitudes toward the advertising campaign exist among light, medium, and heavy coffee
drinkers, but we would not be able to determine if the differences are between light and
medium, or between light and heavy, or between medium and heavy, and so on. We are
able to say only that there are significant differences somewhere among the groups. Thus,
the marketing researcher still must determine where the mean differences lie.
The difficulty of the Starbucks example above is also true of the restaurant ANOVA results
for the restaurant survey. That is, we can conclude that there are differences between the three
groups based on distance driven. But we do not know if the differences are between the drive
less than 1 mile group and the 1 to 5 miles group, or the 1 to 5 miles group and the more than
5 miles group, and so on. To answer this question, we must apply follow-up “post-hoc” tests.
These tests will identify the pairs of groups that have significantly different mean responses.
Many follow-up tests are available in statistical software packages such as SPSS and
SAS. All of the methods involve multiple comparisons, or simultaneous assessment of
confidence interval estimates of differences between the means. That is, all means are
compared two at a time. The differences between the methods are based on their ability to
control the error rate. We shall briefly describe one follow-up test, the Scheffé procedure.
Relative to other follow-up tests, the Scheffé procedure is a more conservative method for
detection of significant differences between group means.
The Scheffé follow-up test establishes simultaneous confidence intervals around all
groups’ responses and imposes an error rate at a specified α level. The test identifies differ-
ences between all pairs of means at high and low confidence interval ranges. If the differ-
ence between each pair of means falls outside the range of the confidence interval, then the
null hypothesis is rejected and we conclude that the pairs of means are statistically different.
The Scheffé test will show whether one, two, or all three pairs of means in our restaurant
example are different. The Scheffé test is equivalent to simultaneous two-tailed hypothesis
tests. Because the technique holds the experimental error rate to α (typically .05), the con-
fidence intervals tend to be wider than in the other methods, but the researcher has more
assurance that true mean differences exist. Recall that the Scheffé test is conservative so you
may wish to look at one of the other tests available in your statistical software.
To run the Scheffé post-hoc test, we use the SPSS compare means test. The click-through
sequence is Analyze → Compare Means → One-Way ANOVA. When you get to the One-
Way ANOVA dialog box, highlight X23
–Likely to Return and move it into the Dependent
Follow-up tests A test that
flags the means that are
statistically different from
each other; follow-up tests
are performed after an
ANOVA determines there
are differences between
means.
www.MyEbookNiche.eCrater.com

300 Part 4 Data Preparation, Analysis, and Reporting the Results
List window. Next highlight X30
–Distance Driven and then click on the arrow button to
move it into the Factor window. Now click on the Options tab and then on Descriptive.
Next click on the Post Hoc tab and then on Scheffé. Then click Continue and OK to get the
post-hoc test results.
Interpretation of Results Results for the Scheffé test for the restaurant example are shown
in Exhibit 11.14. Recall from Exhibit 11.13 that the means for the three groups indicated less
likelihood to return to the restaurants as the customers drove from farther away. The research
question is, “Do statistically significant differences exist between all the distance driven cus-
tomer groups, or only some?” Looking at the information in the Sig. column we see that dif-
ferences between some of the group means are statistically significant (.000) while others are
not (.115). Specifically, the means of the less than 1 mile and 1–5 mile groups are not statisti-
cally different. In contrast, the means of the less than 1 mile and more than 5 miles groups are
statistically different and so also are the means of the 1 to 5 miles group and the more than
five miles group. As a general conclusion, we can state that distance from the restaurant does
influence likelihood of returning, but the influence is not significant until a customer drives
from farther than 5 miles away. Thus, marketing efforts based on distance from the restaurant
can be similar for individuals within a 5-mile radius of the restaurant, the typical primary
target area for a restaurant. But for individuals driving farther than 5 miles, some kind of in-
centive should be considered to increase their likelihood of returning.
n-Way ANOVA
Discussion of ANOVA to this point has been devoted to one-way ANOVA in which there
is only one independent variable. In the Starbucks example, the usage category (con-
sumption of Starbucks coffee) was the independent variable. Similarly, for the restaurant
example, distance driven (three separate groups) was the independent variable. Marketing
researchers may, however, be interested in analyzing several independent variables simul-
taneously. In such cases an n-way ANOVA would be used.
n-Way ANOVA This is a
type of ANOVA that can
analyze several independent
variables at the same time.
Exhibit 11.14 Results for Post-hoc ANOVA Tests
www.MyEbookNiche.eCrater.com
Chapter 11 Basic Data Analysis for Quantitative Research 301
Researchers often are interested in the region of the country where a product is sold as
well as consumption patterns. Using multiple independent factors creates the possibility of
an interaction effect. That is, the multiple independent variables can act together to affect
dependent variable group means. For example, heavy consumers of Starbucks coffee in the
Northeast may have different attitudes about advertising campaigns than heavy consumers
of Starbucks coffee in the West, and there may be still further differences between the vari-
ous coffee-consumption-level groups, as described earlier.
Another situation that may require n-way ANOVA is the use of experimental designs
(causal research), where the researcher uses different levels of a stimulus (e.g., different
prices or ads) and then measures responses to those stimuli. For example, a marketer may
be interested in finding out whether consumers prefer a humorous ad to a serious one and
whether that preference varies across gender. Each type of ad could be shown to different
groups of customers (both male and female). Then, questions about their preferences for
the ad and the product it advertises could be asked. The primary difference between the
groups would be the difference in ad execution (humorous or nonhumorous) and customer
gender. An n-way ANOVA could be used to find out whether the ad execution differences
helped cause differences in ad and product preferences, as well as what effects might be
attributable to customer gender.
From a conceptual standpoint, n-way ANOVA is similar to one-way ANOVA, but the
mathematics is more complex. However, statistical packages such as SPSS will conve-
niently perform n-way ANOVA.
SPSS Application—n-Way ANOVATo help you understand how ANOVA is used to answer research questions, we refer to the
restaurant database to answer a typical question. The owners want to know first whether
customers who come to the restaurant from greater distances differ from customers who
live nearby in their willingness to recommend the restaurant to a friend. Second, they also
want to know whether that difference in willingness to recommend, if any, is influenced by
the gender of the customers. The database variables are X24
–Likely to Recommend, mea-
sured on a 7-point scale, with 1 = “Definitely Will Not Recommend” and 7 = “Definitely
Recommend”; X30
–Distance Driven, where 1 = “Less than 1 mile,” 2 = “1–3 miles,” and
3 = “More than 3 miles”; and X32
–Gender, where 0 = male and 1 = female.
On the basis of informal comments from customers, the owners believe customers who
come from more than 5 miles will be more likely to recommend the restaurant. Moreover,
they hypothesize male customers will be more likely to recommend the restaurant than
females. The null hypotheses are that there will be no difference between the mean ratings
for X24
–Likely to Recommend for customers who traveled different distances to come to
the restaurant (X30
), and there also will be no difference between females and males (X32
).
The purpose of the ANOVA analysis is to see if the differences that do exist are statis-
tically significant and meaningful. To statistically assess the differences, ANOVA uses the
F-ratio. The bigger the F-ratio, the bigger the difference among the means of the various
groups with respect to their likelihood of recommending the restaurant.
SPSS can help you conduct the statistical analysis to test the null hypotheses. The best
way to analyze the restaurant survey data to answer the owner’s questions is to use a factorial
model. A factorial model is a type of ANOVA in which the individual effects of each inde-
pendent variable on the dependent variable are considered separately, and then the combined
effects (an interaction) of the independent variables on the dependent variable are analyzed.
To examine this hypothesis we will use only the Santa Fe Grill customer survey data.
To separate out the Santa Fe sample, first use the Data pull-down menu and go to Select
Interaction effect Multiple
independent variables in an
ANOVA can act together to
affect dependent variable
group means.
www.MyEbookNiche.eCrater.com

302 Part 4 Data Preparation, Analysis, and Reporting the Results
Cases, as shown in the Research Dashboard. Select only the Santa Fe Grill customers to
analyze. After selecting the Santa Fe sample, the click-through sequence is ANALYZE →
GENERAL LINEAR MODEL → UNIVARIATE. Highlight the dependent variable
X24
–Likely to Recommend by clicking on it and move it to the Dependent Variable box.
Next, highlight X30
–Distance Driven and X32
–Gender, and move them to the Fixed Factors
box. Now click on the Options box on the right side of the SPSS screen and look in the
Estimated Marginal Means box and highlight (OVERALL) as well as X30
, X32
, and X30
* X32
and move them all into the Display Means for box. Next place a check on “Compare main
effects” and Descriptive Statistics. Then click Continue and finally click OK.
Interpretation of Results The SPSS output for ANOVA is shown in Exhibit 11.15. The
Tests of Between-Subjects Effects table shows that the F-ratio for X30
–Distance Driven is
48.927, which is statistically significant at the .000 level. This means that customers who
come from different distances to eat at the restaurant vary in their likelihood of
recommending the restaurant. The F-ratio for X32
–Gender is 13.046, which also is
statistically significant at the .000 level. This means the gender of customers influences
their likelihood of recommending the restaurant.
Exhibit 11.15 n-Way ANOVA Results—Santa Fe Grill
www.MyEbookNiche.eCrater.com

Chapter 11 Basic Data Analysis for Quantitative Research 303
n-Way ANOVA Means We now know that both X30
–Distance Driven and X32
–Gender
influence likelihood of recommending the Santa Fe Grill. But we do not know how. To
answer this question we must look at the means for these two variables, which are shown
in Exhibit 11.16.
Interpretation of Results Look at the numbers in the Descriptive Statistics table of
Exhibit 11.16. The means (see Total rows) show that the average likelihood of recommend-
ing the Santa Fe Grill to a friend increases as the distance driven by the respondent
decreases. In short, customers who come from within 1 mile of the Santa Fe Grill show an
average likelihood to recommend of 4.29, compared with a 3.74 and 2.87 average likeli-
hood for customers who come from 1–5 and more than 5 miles away, respectively.
The Santa Fe Grill owners were also interested in whether there is a difference in the
likelihood of males versus females recommending the Santa Fe Grill. The F-ratio for gender
Exhibit 11.16 n-Way ANOVA Means Result
www.MyEbookNiche.eCrater.com

304 Part 4 Data Preparation, Analysis, and Reporting the Results
is again large (13.046; see Exhibit 11.15) and statistically significant (.000). Looking at
the means of the customer groups based on gender (see Exhibit 11.16), we see that indeed
males are more likely to recommend the Santa Fe Grill as compared to females. The null
hypothesis of no differences based on gender is rejected. Moreover, we conclude there is
a difference in the average likelihood of male and female customers to recommend the
Santa Fe Grill, with males being significantly more likely than females to recommend
the restaurant.
The interaction between distance traveled and gender has an F-ratio of .456, with a
probability level of .634, meaning that the difference in the likelihood of recommendation
when both independent variables are considered together is not statistically significant.
This means there is no interaction between distance driven, gender, and likelihood of rec-
ommending the Santa Fe Grill.
Perceptual MappingPerceptual mapping is a process that is used to develop maps that show the perceptions
of respondents. The maps are visual representations of respondents’ perceptions of a com-
pany, product, service, brand, or any other object in two dimensions. A perceptual map
typically has a vertical and a horizontal axis that are labeled with descriptive adjectives.
Possible adjectives for our restaurant example might be food temperature and/or freshness,
speed of service, good value for the money, and so on.
Several different approaches can be used to develop perceptual maps. These include
rankings, medians and mean ratings. To illustrate perceptual mapping, data from an exam-
ple involving ratings of fast-food restaurants are shown in Exhibit 11.17. Researchers gave
customers a set of six fast-food restaurants and asked them to express how they perceive
each restaurant. The perceptions of the respondents are then plotted on a two-dimensional
map using two of the adjectives, freshness of food and food temperature. Inspection of the
map, shown in Exhibit 11.18, illustrates that customers perceive Wendy’s and Back Yard
Burgers as quite similar to each other, as are McDonald’s and Burger King. Customers
perceive Arby’s and Hardee’s as somewhat similar, but do not view these restaurants as
favorably as the others. However, Back Yard Burgers and McDonald’s were perceived as
very dissimilar.To better understand how to develop perceptual maps, read the Marketing
Research in Action on Remington’s Steak House at the end of this chapter.
Perceptual mapping A
process that is used to
develop maps showing
the perceptions of
respondents. The maps are
visual representations of
respondents’ perceptions
of a company, product,
service, brand, or any other
object in two dimensions.
Exhibit 11.17 Ratings of Six Fast-Food Restaurants
Food Freshness Food Temperature
McDonald’s 1.8 3.7
Burger King 2.0 3.5
Wendy’s 4.0 4.5
Back Yard Burger 4.5 4.8
Arby’s 4.0 2.5
Hardee’s 3.5 1.8
Key: Food temperature, 1 = Warm, 5 = Hot, Food freshness, 1 = Low, 5 = High.
www.MyEbookNiche.eCrater.com
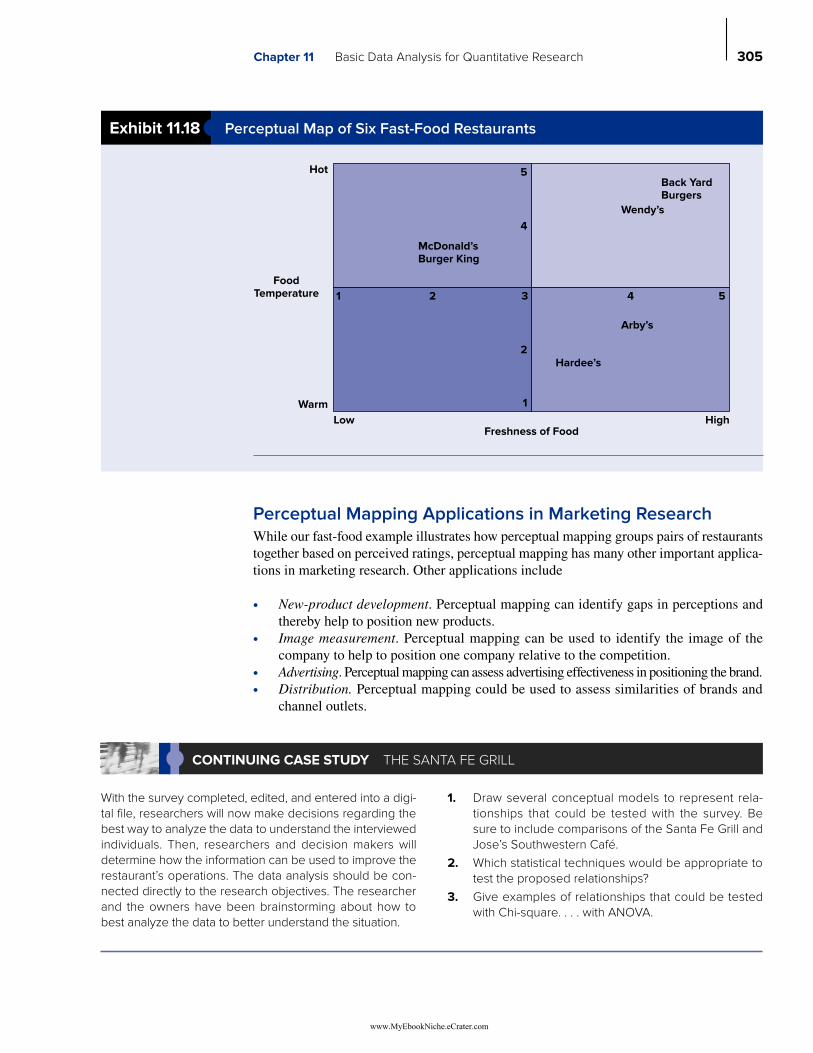
Chapter 11 Basic Data Analysis for Quantitative Research 305
Exhibit 11.18 Perceptual Map of Six Fast-Food Restaurants
Hot
Warm
Low HighFreshness of Food
FoodTemperature
Back YardBurgers
Wendy’s
McDonald’sBurger King
Arby’s
Hardee’s
1
1
2
4
5
32 54
With the survey completed, edited, and entered into a digi-
tal file, researchers will now make decisions regarding the
best way to analyze the data to understand the interviewed
individuals. Then, researchers and decision makers will
determine how the information can be used to improve the
restaurant’s operations. The data analysis should be con-
nected directly to the research objectives. The researcher
and the owners have been brainstorming about how to
best analyze the data to better understand the situation.
1. Draw several conceptual models to represent rela-
tionships that could be tested with the survey. Be
sure to include comparisons of the Santa Fe Grill and
Jose’s Southwestern Café.
2. Which statistical techniques would be appropriate to
test the proposed relationships?
3. Give examples of relationships that could be tested
with Chi-square. . . . with ANOVA.
CONTINUING CASE STUDY THE SANTA FE GRILL
Perceptual Mapping Applications in Marketing ResearchWhile our fast-food example illustrates how perceptual mapping groups pairs of restaurants
together based on perceived ratings, perceptual mapping has many other important applica-
tions in marketing research. Other applications include
∙ New-product development. Perceptual mapping can identify gaps in perceptions and
thereby help to position new products.
∙ Image measurement. Perceptual mapping can be used to identify the image of the
company to help to position one company relative to the competition.
∙ Advertising. Perceptual mapping can assess advertising effectiveness in positioning the brand.
∙ Distribution. Perceptual mapping could be used to assess similarities of brands and
channel outlets.
www.MyEbookNiche.eCrater.com

306 Part 4 Data Preparation, Analysis, and Reporting the Results
MARKETING RESEARCH IN ACTIONExamining Restaurant Image Positions—Remington’s Steak House
About three years ago, John Smith opened Remington’s Steak House, a retail theme res-
taurant located in a large midwestern city. Smith’s vision was to position his restaurant
as a unique, theme-oriented specialty restaurant. The plan was for the restaurant to have
an excellent reputation for offering a wide assortment of high-quality yet competitively
priced entrees, excellent service, and knowledgeable employees who understand custom-
ers’ needs. The overriding goal was to place heavy emphasis on satisfying customers.
Smith used this vision to guide the development and implementation of his restaurant’s
positioning and marketing strategies. Although Smith knew how to deliver dining experience,
he did not know much about developing, implementing, and assessing marketing strategies.
Recently, Smith began asking himself some fundamental questions about his restau-
rant’s operations and the future of his business. Smith expressed these questions to an
account representative at a local marketing research firm and, as a result, decided to do
some research to better understand his customers’ attitudes and feelings. More specifically,
he wanted to gain some information and insights into the following set of questions:
1. What are the major factors customers use when selecting a restaurant, and what is the
relative importance of each of these factors?
2. What image do customers have of Remington’s and its two major competitors?
3. Is Remington’s providing quality and satisfaction to its customers?
4. Do any of Remington’s current marketing strategies need to be changed, and if so in
what ways?
To address Smith’s questions, the account representative recommended completing
an image survey using an Internet panel approach. Initial contact was made with potential
respondents using a random digit dialing telephone survey to screen for individuals who
were patrons of Remington’s as well as customers of competitors’ restaurants (including
their main competitors, Outback Steak House and Longhorn Steak House) within the mar-
ket area. Respondents must also have a minimum annual household income of $20,000,
and be familiar enough with one of the three restaurant competitors to accurately rate them.
If an individual was qualified for the study based on the screening questions, they were
directed to a website where they completed the survey.
Because this was the first time Smith had conducted any marketing research,
the consultant suggested an exploratory approach and recommended a small sample
size of 200. She said that if the results of the initial 200 surveys were helpful,
the sample size could be increased so that the findings would be more precise. The
questionnaire included questions about the importance of various reasons in choosing
a restaurant, perceptions of the images of the three restaurant competitors on the same
factors, and selected classification information on the respondents. When the researcher
reached the quota of 200 usable completed questionnaires, the sample included 86 respon-
dents who were most familiar with Outback, 65 who were most familiar with Longhorn,
and 49 who were most familiar with Remington’s. This last criterion was used to deter-
mine which of Remington’s restaurant competitors a respondent evaluated. A database
for the questions in this case is available in SPSS format at connect.mheducation.com.
The name of the database is Remingtons MRIA_essn.sav. A copy of the questionnaire is
in Exhibit 11.19.
www.MyEbookNiche.eCrater.com

Chapter 11 Basic Data Analysis for Quantitative Research 307
Screening and Rapport Questions
Hello. My name is and I work for DSS Research. We are talking to individuals today/
tonight about dining out habits.
1. “Do you regularly dine at casual dining restaurants?” Yes No
2. “Have you eaten at other casual restaurants in the last six months?” Yes No
3. “Is your gross annual household income $20,000 or more?” Yes No
4. There are three casual steakhouse restaurants in you neighborhood—Outback, Longhorn,
and Remington’s. Which of these restaurants are you most familiar with?
a. Outback
b. Longhorn
c. Remington’s
d. None
If respondent answers “Yes” to the first three questions, and is familiar with one of the three
restaurants, then say:
We would like you to answer a few questions about your recent dining experiences at Outback/
Longhorn/Remington’s restaurant. The survey will only take a few minutes and it will be very
helpful in better serving restaurant customers in this area.
If the person says yes, give them instructions on how to access the website and complete the survey.
DINING OUT SURVEY
Please read all questions carefully. In the first section a number of reasons are listed that people
use in selecting a particular restaurant to dine at. Using a scale from 1 to 7, with 7 being “Very
Important” and 1 being “Not Important at All,” please indicate the extent to which a particular
selection reason is important or unimportant. Circle only one number for each selection reason.
Section 1: Importance Ratings
How important is/are in selecting a particular restaurant to dine at?
1. Large portions Not Important Very
At All Important
1 2 3 4 5 6 7
2. Competent employees Not Important Very
At All Important
1 2 3 4 5 6 7
3. Food quality Not Important Very
At All Important
1 2 3 4 5 6 7
4. Speed of service Not Important Very
At All Important
1 2 3 4 5 6 7
5. Atmosphere Not Important Very
At All Important
1 2 3 4 5 6 7
6. Reasonable prices Not Important Very
At All Important
1 2 3 4 5 6 7
Exhibit 11.19 The Remington’s Steak House Questionnaire
(continued)
www.MyEbookNiche.eCrater.com

308 Part 4 Data Preparation, Analysis, and Reporting the Results
Section 2: Perceptions Measures
Listed below is a set of characteristics that could be used to describe [Outback/Longhorn/
Remington’s]. Using a scale from 1 to 7, with 7 being “Strongly Agree” and 1 being “Strongly
Disagree,” to what extent do you agree or disagree that [Remington’s—Outback—
Longhorn’s]: (a particular restaurant’s name appeared on the screen based on the familiarity
question in the telephone screener)
7. has large portions Strongly Strongly
Disagree Agree
1 2 3 4 5 6 7
8. has competent employees Strongly Strongly
Disagree Agree
1 2 3 4 5 6 7
9. has excellent food quality Strongly Strongly
Disagree Agree
1 2 3 4 5 6 7
10. has quick service Strongly Strongly
Disagree Agree
1 2 3 4 5 6 7
11. has a good atmosphere Strongly Strongly
Disagree Agree
1 2 3 4 5 6 7
12. reasonable prices Strongly Strongly
Disagree Agree
1 2 3 4 5 6 7
Section 3: Relationship Measures
Please indicate your view on each of the following questions:
13. How satisfied are you with ? Not Satisfied Very
At All Satisfied
1 2 3 4 5 6 7
14. How likely are you to return to Definitely Will Definitely
in the future? Not Return Will Return
1 2 3 4 5 6 7
15. How likely are you to recommend Definitely Will Definitely Will
to a friend? Not Recommend Recommend
1 2 3 4 5 6 7
16. Frequency of Patronage 1 = Occasionally (Less than once a month)
How often do you eat at ? 2 = Frequently (1–3 times a month)
3 = Very Frequently (4 or more times a month)
Section 4: Classification Questions
Please circle the number that classifies you best.
17. Number of Children at Home 1 None
2 1–2
3 More than 2 children at home
Exhibit 11.19 continued
www.MyEbookNiche.eCrater.com

Chapter 11 Basic Data Analysis for Quantitative Research 309
Exhibit 11.19 continued
18. Do you recall seeing any 0 No
advertisements in the last 1 Yes
60 days for Outback/Longhorn/
Remington’s?
19. Your gender 0 Male
1 Female
20. Your age in years 1 18–25
2 26–34
3 35–49
4 50–59
5 60 and Older
21. Your annual gross household income 1 $20,000–$35,000
2 $35,001–$50,000
3 $50,001–$75,000
4 $75,001–$100,000
5 More than $100,000
22. Competitors: Most familiar with _______? 1 Outback
2 Longhorn
3 Remington’s
Thank you very much for your help. Click on the submit button to exit the survey.
Researchers focused their initial analysis of the data on the importance ratings for
the restaurant selection factors. The importance ratings are variables X1–X
6 in the Rem-
ington’s database. Exhibit 11.20 shows that food quality and speed of service are the two
most important factors. To create this exhibit, the click-through sequence is ANALYZE →
DESCRIPTIVE STATISTICS → FREQUENCIES. Highlight variables X1–X
6 and move
them to the Variable(s) box. Then go to the Statistics box and check “Mean,” and then click
Continue, and OK. The least important factor is competent employees (mean = 3.12). This
does not mean employees are not important. It simply means they are less important com-
pared to the other factors included in the survey. In sum, respondents wanted good food,
fast service, and reasonable prices.
Exhibit 11.20 Average Importance Ratings for Restaurant Selection Factors
www.MyEbookNiche.eCrater.com

310 Part 4 Data Preparation, Analysis, and Reporting the Results
The next task was to examine the perceptions of the three restaurant competitors.
Using the restaurant image factors, the consultant conducted an ANOVA to see if there
were any differences in the perceptions of the three restaurants (Exhibits 11.21 and 11.22).
To create these exhibits, the click-through sequence is ANALYZE → COMPARE MEANS →
ONE-WAY ANOVA. Highlight variables X7–X
12 and move them to the Dependent List
box, and then highlight variable X22
and move it to the Factor box. Next go to the Options
box, check “Descriptive,” and then click Continue, and OK.
We show the results in Exhibits 11.21 and 11.22. We provide an overview of the find-
ings from Exhibits 11.20 to 11.22 in Exhibit 11.23.
The findings of the survey were quite revealing. On the most important factor (food
quality), Remington’s rated the highest (mean = 6.86; see Exhibit 11.23), but Outback
Exhibit 11.21 One-Way ANOVA for Restaurant Competitors
Descriptives
N Mean
X7 -- Large Portions Outback 86 3.57
Longhorn 65 2.77
Remington’s 49 3.39
Total 200 3.27
X8 -- Competent Employees Outback 86 5.15
Longhorn 65 3.25
Remington’s 49 2.49
Total 200 3.88
X9 -- Food Quality Outback 86 6.42
Longhorn 65 5.12
Remington’s 49 6.86
Total 200 6.11
X10 -- Speed of Service Outback 86 4.35
Longhorn 65 3.02
Remington’s 49 2.27
Total 200 3.41
X11 -- Atmosphere Outback 86 6.09
Longhorn 65 4.35
Remington’s 49 6.59
Total 200 5.65
X12 -- Reasonable Prices Outback 86 5.50
Longhorn 65 5.00
Remington’s 49 5.49
Total 200 5.34
www.MyEbookNiche.eCrater.com

Chapter 11 Basic Data Analysis for Quantitative Research 311
Exhibit 11.22 One-Way ANOVA of Differences in Restaurant Perceptions
Competitor Means
Attributes Rankings* Outback Longhorn Remington’s Sig.
X7—Large Portions 4 3.57 2.77 3.39 .000
X8—Competent Employees 6 5.15 3.25 2.49 .000
X9—Food Quality 1 6.42 5.12 6.86 .000
X10—Speed of Service 2 4.35 3.02 2.27 .000
X11—Atmosphere 5 6.09 4.35 6.59 .000
X12—Reasonable Prices 3 5.50 5.00 5.49 .000
N = 200 total 86 65 49 .000
*Note: Rankings are based on mean importance ratings of attributes.
Exhibit 11.23 Summary of ANOVA Findings from Exhibits 11.20–11.22
was a close second (mean = 6.42). Remington’s was also rated the highest on atmosphere
(mean = 6.59), but that factor was fifth most important. For speed of service (second
most important) and competent employees (least important), Remington’s was rated the
lowest of the three competitors.
www.MyEbookNiche.eCrater.com

312 Part 4 Data Preparation, Analysis, and Reporting the Results
Exhibit 11.24 Importance-Performance Chart for Remington’s Steak House
71
7
3
Less Important
More Important
ExcellentPoor
X9—Food Quality
X10—Speed of
Service
X12—Reasonable Prices
X7—Large
Portions X11—Atmosphere
X8—Competent
Employees
Quadrant A Quadrant B
Quadrant C Quadrant D
An easy way to convey the results of an image analysis is to prepare an impor-
tance performance chart (IPC). To prepare this chart, calculate the mean values for
the importance and performance questions for each of the restaurants.Then use these
means to plot the position of each restaurant on a perceptual map. The IPC for Rem-
ington’s Steak House is shown in Exhibit 11.24. The chart shows that in terms of food
quality and prices, Remington’s is doing well. But there are several areas for improve-
ment, particularly in comparison to the competition. The competitive restaurants can
be plotted on a separate perceptual map. An IPC (perceptual map) has quadrants (A–D)
that are described as follows:
Quadrant A: Modifications are needed.
Quadrant B: Good job—no need to modify.
Quadrant C: Don’t worry—low priority.
Quadrant D: Rethink—a possible overkill.
Hands-On Exercise1. What are other areas of improvement for Remington’s?
2. Run post-hoc ANOVA tests between the competitor groups. What additional problems
or challenges did this reveal?
3. What new marketing strategies would you suggest?
www.MyEbookNiche.eCrater.com

Chapter 11 Basic Data Analysis for Quantitative Research 313
Summary
Explain measures of central tendency and dispersion.
The mean is the most commonly used measure of cen-
tral tendency and describes the arithmetic average
of the values in a sample of data. The median rep-
resents the middle value of an ordered set of values.
The mode is the most frequently occurring value in
a distribution of values. All these measures describe
the center of the distribution of a set of values. The
range defines the spread of the data. It is the distance
between the smallest and largest values of the distribu-
tion. The standard deviation describes the average dis-
tance of the distribution values from the mean. A large
standard deviation indicates a distribution in which the
individual values are spread out and are relatively far-
ther away from the mean.
Describe how to test hypotheses using univariate and
bivariate statistics.
Marketing researchers often form hypotheses regard-
ing population characteristics based on sample data.
The process typically begins by calculating frequency
distributions and averages, and then moves on to actu-
ally test the hypotheses. When the hypothesis testing
involves examining one variable at a time, researchers
use a univariate statistical test. When the hypothesis
testing involves two variables, researchers use a bivari-
ate statistical test. The Chi-square statistic permits us to
test for statistically significant differences between the
frequency distributions of two or more groups. Categori-
cal data from questions about sex, race, profession, and
so forth can be examined and tested for statistical dif-
ferences. In addition to examining frequencies, market-
ing researchers often want to compare the means of two
groups. There are two possible situations when means
are compared. In independent samples the respondents
come from different populations, so their answers to
the survey questions do not affect each other. In related
samples, the same respondent answers several questions,
so comparing answers to these questions requires the use
of a paired-samples t-test. Questions about mean differ-
ences in independent samples can be answered by using
a t-test statistic.
Apply and interpret analysis of variance (ANOVA).
Researchers use ANOVA to determine the statistical
significance of the difference between two or more
means. The ANOVA technique calculates the variance
of the values between groups of respondents and com-
pares it with the variance of the responses within the
groups. If the between-group variance is significantly
greater than the within-group variance as indicated by
the F-ratio, the means are significantly different. The
statistical significance between means in ANOVA
is detected through the use of a follow-up test. The
Scheffé test is one type of follow-up test. The test
examines the differences between all possible pairs of
sample means against a high and low confidence range.
If the difference between a pair of means falls outside
the confidence interval, then the means can be consid-
ered statistically different.
Utilize perceptual mapping to present research
findings.
Perceptual mapping is used to develop maps that show
perceptions of respondents visually. These maps are
graphic representations that can be produced from the
results of several multivariate techniques. The maps pro-
vide a visual representation of how companies, products,
brands, or other objects are perceived relative to each
other on key attributes such as quality of service, food
taste, and food preparation.
Key Terms and Concepts
Analysis of variance (ANOVA) 297
Chi-square (X2) analysis 291
Follow-up test 299
F-test 297
Independent samples 294
Interaction effect 301
Mean 274
Median 275
Mode 275
n-way ANOVA 300
Perceptual mapping 304
Range 277
www.MyEbookNiche.eCrater.com

314 Part 4 Data Preparation, Analysis, and Reporting the Results
Related samples 294
Standard deviation 278
t-test 294
Variance 278
Review Questions
1. Explain the difference between the mean, the median,
and the mode.
2. Why and how would you use Chi-square and t-tests
in hypothesis testing?
3. Why and when would you want to use ANOVA in
marketing research?
4. What will ANOVA tests not tell you, and how can
you overcome this problem?
Discussion Questions
1. The measures of central tendency discussed in this
chapter are designed to reveal information about the
center of a distribution of values. Measures of dis-
persion provide information about the spread of all
the values in a distribution around the center values.
Assume you were conducting an opinion poll on vot-
ers’ approval ratings of the job performance of the
mayor of the city where you live. Do you think the
mayor would be more interested in the central ten-
dency or the dispersion measures associated with the
responses to your poll? Why?
2. If you were interested in finding out whether or not
young adults (21–34 years old) are more likely to buy
products online than older adults (35 or more years
old), how would you phrase your null hypothesis?
What is the implicit alternative hypothesis accompa-
nying your null hypothesis?
3. The level of significance (alpha) associated with
testing a null hypothesis is also referred to as the
probability of a Type I error. Alpha is the probability
of rejecting the null hypothesis on the basis of your
sample data when it is, in fact, true for the popula-
tion of interest. Because alpha concerns the prob-
ability of making a mistake in your analysis, should
you always try to set this value as small as possible?
Why or why not?
4. Analysis of variance (ANOVA) allows you to test for
the statistical difference between two or more means.
Typically, there are more than two means tested. If
the ANOVA results for a set of data reveal that the
four means that were compared are significantly dif-
ferent from each other, how would you find out which
individual means were statistically different from
each other? What statistical techniques would you ap-
ply to answer this question?
5. EXPERIENCE MARKETING RESEARCH. Nike,
Reebok, and Converse are strong competitors in the
athletic shoe market. The three use different advertis-
ing and marketing strategies to appeal to their target
markets. Use one of the search engines on the Internet to
identify information on this market. Go to the websites
for these three companies (www.Nike.com; www
.Reebok.com; www.Converse.com). Gather back-
ground information on each, including its target mar-
ket and market share. Design a questionnaire based
on this information and survey a sample of students.
Prepare a report on the different perceptions of each
of these three companies, their shoes, and related
aspects. Present the report in class and defend your
findings.
6. SPSS EXERCISE. Form a team of three to four
students in your class. Select one or two local fran-
chises to conduct a survey on, such as Subway or
McDonald’s. Design a brief survey (10–12 questions)
including questions like ratings on quality of food,
speed of service, knowledge of employees, attitudes of
employees, and price, as well as several demographic
variables such as age, address, how often individuals
eat there, and day of week and time of day. Obtain per-
mission from the franchises to interview their custom-
ers at a convenient time, usually when they are leaving.
Assure the franchiser you will not bother customers
and that you will provide the franchise with a valuable
report on your findings. Develop frequency charts, pie
charts, and similar graphic displays of findings, where
appropriate. Use statistics to test hypotheses, such as
www.MyEbookNiche.eCrater.com

Chapter 11 Basic Data Analysis for Quantitative Research 315
“Perceptions of speed of service differ by time of day
or day of week.” Prepare a report and present it to your
class; particularly point out where statistically signifi-
cant differences exist and why.
7. SPSS EXERCISE. Using SPSS and the Santa Fe
Grill employee database, provide frequencies, means,
modes, and medians for the relevant variables on the
questionnaire. The questionnaire is shown in Chap-
ter 10. In addition, develop bar charts and pie charts
where appropriate for the data you analyzed. Run an
ANOVA using the work environment perceptions
variables to identify any differences that may exist
between male and female employees, and part-time
versus full-time employees. Be prepared to present a
report on your findings.
8. SPSS EXERCISE. Review the Marketing Research
in Action case for this chapter. There were three res-
taurant competitors—Remington’s, Outback, and
Longhorn. Results for a one-way ANOVA of the
restaurant image variables were provided. Now run
post-hoc ANOVA follow-up tests to see where the
group differences are. Make recommendations for
new marketing strategies for Remington’s compared
to the competition.
www.MyEbookNiche.eCrater.com

Examining Relationships in Quantitative Research
Chapter 12
www.MyEbookNiche.eCrater.com

Learning Objectives After reading this chapter, you will be able to:
1. Understand and evaluate the types of relationships between variables.
2. Explain the concepts of association and co-variation.
3. Discuss the differences between Pearson correlation and Spearman correlation.
4. Explain the concept of statistical significance versus practical significance.
5. Understand when and how to use regression analysis.
6. Understand the value and application of structural modeling.
Data Mining Helps Rebuild Procter & Gamble as a Global Powerhouse
Procter & Gamble (P&G) is a global player in consumer household products,
with 20 world-ranking brands such as Tide, Folgers, Febreze, Mr. Clean, and
Pringles. Three billion times a day, P&G products touch the lives of consum-
ers around the world. Yet, several years ago the company saw its status in
jeopardy. While many businesses, including P&G, pursue three overall market-
ing objectives—to get customers, keep customers, and grow customers—P&G
realized it had to change its traditional marketing strategies and tactics in order to
rebuild its global image and practices. The new approach was based on answer-
ing three key questions: (1) Who are the targeted consumers for each brand?
(2) What is the company’s desired brand equity or positioning? and (3) How
should it be achieved?
P&G, a leader in brand management, turned to information technology and
customer relationship management to design their new brand building strat-
egy. From internal employee surveys they recognized a need to recommit to a
customer-centric approach. Understanding employees’ attitudes concerning what
P&G was doing “right” and “wrong” helped reestablish five fundamental focal
points as operating objectives: (1) respecting the consumer as the “boss” and
delivering superior consumer value; (2) making clear strategic choices about
where to compete and how to win; (3) being a leader in innovation and branding;
(4) leveraging P&G’s unique, global operating structure; and (5) executing with
excellence as well as more rigorous financial and operating discipline.
P&G mines the information in its data warehouse to retool customer models
for its global brand and distributor markets. One objective of the brand models
is to acquire new customers worldwide for its brands as well as cross selling
the brands to current customers. Another objective is to use product innovation
and acquisition to expand the type of products sold worldwide. Statistical mod-
els with high predictive capability were modified and validated for each of the
brands’ market segments. The models considered factors such as household pur-
chasing power, length of residence, family size, age, gender, attitudes toward
www.MyEbookNiche.eCrater.com

318 Part 4 Data Preparation, Analysis, and Reporting the Results
a brand, media habits, purchase frequencies, and so on. The results suggest P&G has
made progress in its rebuilding efforts. Brand equity in 19 of 20 of their major brands is
growing—30 million times a day consumers choose P&G brand products. Internally,
employee confidence in P&G is growing—56 percent of all P&G employees believe P&G
is moving in the right direction compared to only 26 percent a year ago. To learn more
about P&G’s turnaround, go to www.pg.com.
Examining Relationships between Variables
Relationships between variables can be described in several ways, including presence,
direction, strength of association, and type. We will describe each of these concepts
in turn.
The first issue is whether two or more variables are related at all. If a systematic rela-
tionship exists between two or more variables, then a relationship is present. To measure
whether a relationship exists, we rely on the concept of statistical significance. If we test
for statistical significance and find that it exists, then we say that a relationship is present.
Stated another way, we say that knowledge about the behavior of one variable enables us to
make a useful prediction about the behavior of another. For example, if we find a statisti-
cally significant relationship between perceptions of the quality of Santa Fe Grill food and
overall satisfaction, we would say a relationship is present.
If a relationship is present between two variables, it is important to know the direction.
The direction of a relationship can be either positive or negative. Using the Santa Fe Grill
example, a positive relationship exists if respondents who rate the quality of the food high
are also highly satisfied. Alternatively, a negative relationship exists between two variables
if low levels of one variable are associated with high levels of another. For example, as
the number of service problems experienced when dining at the Santa Fe Grill increases,
satisfaction is likely to decrease. Thus, number of service problems is negatively related to
customer satisfaction.
An understanding of the strength of association also is important. Researchers gener-
ally categorize the strength of association as no relationship, weak relationship, moderate
relationship, or strong relationship. If a consistent and systematic relationship is not pres-
ent, then there is no relationship. A weak association means the variables may have some
variance in common, but not much. A moderate or strong association means there is a
consistent and systematic relationship, and the relationship is much more evident when it is
strong. The strength of association is determined by the size of the correlation coefficient,
with larger coefficients indicating a stronger association.
A fourth important concept is the type of relationship. If we say two variables are
related, then we pose this question: “What is the nature of the relationship?” How can the
link between Y and X best be described? There are a number of different ways in which two
variables can share a relationship. Variables Y and X can have a linear relationship, which
means the strength and nature of the relationship between them remain the same over the
range of both variables, and can be best described using a straight line. A second type of
relationship between Y and X is a curvilinear relationship, which means the strength and/or
direction of the relationship changes over the range of both variables. For example, the
relationship can be curvilinear if moderate levels of X are strongly related to high levels of Y,
whereas both low and high levels of X are only slightly related. For example, if moderate
Linear relationship An
association between two
variables whereby the
strength and nature of the
relationship remains the
same over the range of
both variables.
Curvilinear relationship
A relationship between
two variables whereby the
strength and/or direction of
their relationship changes
over the range of both
variables.
www.MyEbookNiche.eCrater.com

Chapter 12 Examining Relationships in Quantitative Research 319
levels of fear appeal in an advertisement are strongly related to positive attitudes toward the
ad, whereas both low and high levels of fear appeal are only slightly related, then the rela-
tionship between strength of fear appeal and attitude toward the ad would be curvilinear.
A linear relationship is much simpler to work with than a curvilinear relationship. If we
know the value of variable X, then we can apply the formula for a straight line (Y = a + bX)
to determine the value of Y. But when two variables have a curvilinear relationship, the for-
mula that best describes the linkage is more complex. Therefore, most marketing research-
ers work with relationships they believe are linear.
Marketers are often interested in describing the relationship between variables they
think influence purchases of their product(s). There are four questions to ask about a pos-
sible relationship between two variables. First, “Is there a relationship between the two
variables of interest?” If there is a relationship, “How strong is that relationship?” “What is
the direction of the relationship?” and “Is the relationship linear or nonlinear?” Once these
questions have been answered, the researcher can interpret results, make conclusions, and
recommend managerial actions.
Covariation and Variable Relationships
Since we are interested in finding out whether two variables describing our customers
are related, the concept of covariation is a very useful idea. Covariation is defined as the
amount of change in one variable that is consistently related to a change in another vari-
able. For example, if we know that DVD purchases are related to age, then we want to
know the extent to which younger persons purchase more DVDs. Another way of stating
the concept of covariation is that it is the degree of association between two variables. If
two variables are found to change together on a reliable or consistent basis, then we can use
that information to make predictions that will improve decision making about advertising
and marketing strategies.
One way of visually describing the covariation between two variables is with the use
of a scatter diagram. A scatter diagram plots the relative position of two variables using
horizontal and vertical axes to represent the variable values. Exhibits 12.1 through 12.4
show some examples of possible relationships between two variables that might show up
on a scatter diagram. In Exhibit 12.1, the best way to describe the visual impression left
by the dots representing the values of each variable is probably a circle. That is, there is no
particular pattern to the collection of dots. Thus, if you take two or three sample values of
variable Y from the scatter diagram and look at the values for X, there is no predictable pat-
tern to the values for X. Knowing the values of Y or X would not tell you very much (maybe
nothing at all) about the possible values of the other variable. Exhibit 12.1 suggests there
is no systematic relationship between Y and X and that there is very little or no covariation
shared by the two variables. If we measured the amount of covariation shared by these two
variables, which you will learn how to do in the next section, it would be very close to zero.
In Exhibit 12.2, the two variables present a very different picture from that of Exhibit 12.1.
There is a distinct pattern to the dots. As the values of Y increase, so do the values of
X. This pattern can be described as a straight line or an ellipse (a circle that has been
stretched out from both sides). We could also describe this relationship as positive because
increases in the value of Y are associated with increases in the value of X. That is, if we
know the relationship between Y and X is a linear, positive relationship, we would know
the values of Y and X change in the same direction. As the values of Y increase, so do the
values of X. Similarly, if the values of Y decrease, the values of X should decrease as well.
Covariation The amount of
change in one variable that
is consistently related to
the change in another vari-
able of interest.
Scatter diagram A graphic
plot of the relative position
of two variables using a
horizontal and a vertical
axis to represent the values
of the respective variables.
www.MyEbookNiche.eCrater.com

320 Part 4 Data Preparation, Analysis, and Reporting the Results
If we try to measure the amount of covariation shown by the values of Y and X, it would
be relatively high. Thus, changes in the value of Y are systematically related to changes in
the value of X.
Exhibit 12.3 shows the same type of pattern between the values of Y and X, but the
direction of the relationship is the opposite of Exhibit 12.2. There is a linear pattern, but
now increases in the value of Y are associated with decreases in the values of X. This
type of relationship is known as a negative relationship. The amount of covariation shared
between the two variables is still high because Y and X still change together, though in a
direction opposite from that shown in Exhibit 12.2. The concept of covariation refers to
Exhibit 12.1 No Relationship between X and Y
Y
X
Exhibit 12.2 Positive Relationship between X and Y
Y
X
www.MyEbookNiche.eCrater.com

Chapter 12 Examining Relationships in Quantitative Research 321
the strength of the relationship between two variables, not the direction of the relationship
between two variables.
Finally, Exhibit 12.4 shows a more complicated relationship between the values
of Y and X. This pattern of dots can be described as curvilinear. That is, the relation-
ship between the values of Y and the values of X is different for different values of the
variables. Part of the relationship is positive (increases in the small values of Y are
associated with increases in the small values of X), but then the relationship becomes
negative (increases in the larger values of Y are now associated with decreases in the
larger values of X).
Exhibit 12.3 Negative Relationship between X and Y
Y
X
Exhibit 12.4 Curvilinear Relationship between X and Y
Y
X
www.MyEbookNiche.eCrater.com

322 Part 4 Data Preparation, Analysis, and Reporting the Results
This pattern of dots cannot be described as a linear relationship. Many of the statistics
marketing researchers use to describe association assume the two variables have a linear
relationship. These statistics do not perform well when used to describe a curvilinear rela-
tionship. In Exhibit 12.4, we can still say the relationship is strong, or that the covaria-
tion exhibited by the two variables is strong. But now we cannot talk very easily about
the direction (positive or negative) of the relationship, because the direction changes. To
make matters more difficult, many statistical methods of describing relationships between
variables cannot be applied to situations where you suspect the relationship is curvilinear.
Correlation Analysis
Scatter diagrams are a visual way to describe the relationship between two variables
and the covariation they share. For example, a scatter diagram can tell us that as income
increases, the average consumption of Starbucks coffee increases too. But even though a
picture is worth a thousand words, it is often more convenient to use a quantitative measure
of the covariation between two items.
The Pearson correlation coefficient measures the degree of linear association
between two variables. It varies between −1.00 and 1.00, with 0 representing absolutely no
association between two variables, and −1.00 or 1.00 representing a perfect link between
two variables. The correlation coefficient can be either positive or negative, depending on
the direction of the relationship between two variables. But the larger the correlation coef-
ficient, the stronger the association between two variables.
The null hypothesis for the Pearson correlation coefficient states that there is no asso-
ciation between the two variables and the correlation coefficient is zero. For example,
we may hypothesize there is no relationship between Starbucks coffee consumption and
income levels. If a researcher collects measures of coffee consumption and income from
a sample of the population and estimates the correlation coefficient for that sample, the
basic question is “What is the probability of getting a correlation coefficient of this size
in my sample if the correlation coefficient in the population is actually zero?” That is, if
you calculate a large correlation coefficient between the two variables in your sample,
and your sample was properly selected from the population of interest, then the chances
the population correlation coefficient is really zero are relatively small. Therefore, if
the correlation coefficient is statistically significant, the null hypothesis is rejected, and
you can conclude with some confidence the two variables you are examining do share
some association in the population. In short, Starbucks coffee consumption is related
to income.
Earlier in the chapter, we stated that the first question of interest was “Does a relation-
ship between Y and X exist?” This question is equivalent to asking whether a correlation
coefficient is statistically significant. If this is the case, then you can move on to the second
and third questions: “If there is a relationship between Y and X, how strong is the relation-
ship?” and “What is the best way to describe that relationship?”
The size of the correlation coefficient can be used to quantitatively describe the
strength of the association between two variables. Some rules of thumb for characterizing
the strength of the association between two variables based on the size of the correlation
coefficient are suggested in Exhibit 12.5. Correlation coefficients between .81 and 1.00
are considered very strong. That is, covariance is strongly shared between the two vari-
ables under study. At the other extreme, if the correlation coefficient is between .00 and
.20, there is a good chance the null hypothesis will not be rejected (unless you are using
Pearson correlation
coefficient A statistical
measure of the strength
of a linear relationship be-
tween two metric variables.
www.MyEbookNiche.eCrater.com

Chapter 12 Examining Relationships in Quantitative Research 323
a large sample). These interpretations of the strength of correlations are suggestions
and other ranges and descriptions of relationship strength are possible depending on the
situation.
In addition to the size of the correlation coefficient, we also must consider its signifi-
cance level. How do we do this? Most statistical software, including SPSS, calculates the
significance level for a computed correlation coefficient. The SPSS software indicates sta-
tistical significance, which is the probability that the null hypothesis will be rejected when
in fact it is true. For example, if the calculated correlation coefficient between Starbucks
coffee consumption and income is .61 with a statistical significance of .05, this means we
would expect to get that result only five times out of 100 solely by chance—if there is not
a relationship between the two variables. Thus, we reject the null hypothesis of no associa-
tion, and conclude that Starbucks coffee consumption and income are related. In the SPSS
output, statistical significance is identified as the “Sig.” value.
Pearson Correlation CoefficientIn calculating the Pearson correlation coefficient, we are making several assumptions.
First, we assume the two variables have been measured using interval- or ratio-scaled mea-
sures. If this is not the case, there are other types of correlation coefficients that can be
computed which match the type of data on hand. A second assumption is that the relation-
ship we are trying to measure is linear. That is, a straight line describes the relationship
between the variables of interest.
Use of the Pearson correlation coefficient also assumes the variables you want to ana-
lyze have a normally distributed population. The assumption of normal distributions for
the variables under study is a common requirement for many statistical techniques. But
determining whether it holds for the sample data you are working with is sometimes dif-
ficult, and research analysts too often take the assumption of normality for granted.
SPSS Application—Pearson CorrelationWe use the restaurant database to examine the Pearson correlation. The Santa Fe Grill
owners anticipate that the relationship between satisfaction with the restaurant and like-
lihood to recommend the restaurant would be significant and positive. Looking at the
database variables you note that information was collected on “Likely to Recommend”
(variable X24
) and Satisfaction (variable X22
). To examine this research question, the own-
ers of the Santa Fe Grill want to look only at their customers. The null hypothesis is no
Exhibit 12.5 Rules of Thumb about the Strength of Correlation Coefficients
Range of Coefficient Description of Strength
±.81 to ±1.00 Very Strong
±.61 to ±.80 Strong
±.41 to ±.60 Moderate
±.21 to ±.40 Weak
±.00 to ±.20 Weak to no relationship
www.MyEbookNiche.eCrater.com

324 Part 4 Data Preparation, Analysis, and Reporting the Results
relationship exists between Santa Fe Grill customer satisfaction and likelihood of recom-
mending the restaurant.
To select the Santa Fe Grill survey responses (253) from the total sample of
405 responses, the click-through sequence is DATA → SELECT CASES. First click on
the Data pull-down menu and scroll down and highlight and click on Select Cases. You
now see the Select Cases dialog box where the default is All cases. Click on the If condi-
tion is satisfied option, and then on the If tab. Next highlight the screening variable X_s4
and click on the arrow box to move it into the window. Now click on the equals sign and
then 1 to select the Santa Fe customers (coded 1). Next click Continue and then OK and
you will be analyzing only the Santa Fe Grill customers. Thus, your output will have the
results for only one restaurant. Remember too that all data analysis following this change
will analyze only the Santa Fe customers. To analyze the total sample you must follow the
same sequence and click again on All cases.
With SPSS it is easy to compute a Pearson correlation between these two variables
and test this hypothesis. Once you have selected the Santa Fe customers, the SPSS click-
through sequence is ANALYZE → CORRELATE → BIVARIATE, which leads to a dialog
box where you select the variables. Transfer variables X22
and X24
into the Variables box.
Note that we will use all three default options: Pearson correlation, two-tailed test of sig-
nificance, and flag significant correlations. Next go to the Options box, and after it opens
click on Means and Standard Deviations and then Continue. Finally, click on OK at the top
right of the dialog box SPSS to calculate the Pearson correlation.
Exhibit 12.6 SPSS Pearson Correlation Example for Santa Fe Grill Customers
www.MyEbookNiche.eCrater.com

Chapter 12 Examining Relationships in Quantitative Research 325
Interpretation of Results The Pearson correlation results are shown in Exhibit 12.6.
As you can see in the Correlations table, the correlation between variable X24
–Likely to
Recommend and X22
–Satisfaction is .776, and the statistical significance of this correla-
tion is .000. Thus, we have confirmed our hypothesis that satisfaction is positively re-
lated to “likely to recommend.” When we examine the means of the two variables, we
see that satisfaction (4.54) is somewhat higher than likely to recommend (3.61) but we
know the pattern of the responses to these questions is similar. That is, there is covaria-
tion between the responses to the two variables: As one goes up, so does the other (and
as one goes down, so does the other). In short, more satisfied respondents are more
likely to recommend Santa Fe Grill.
It is important for the Santa Fe Grill owners to know the relationship between satis-
faction and recommendation likelihood. But equally important is finding out there is con-
siderable room for improvement in both satisfaction and intentions to recommend. These
variables are measured on a 7-point scale and both means are near the midpoint of the
scale. The owners need to find out why satisfaction is so low as is likelihood of recom-
mending the restaurant. Basically, they need to “drill down” into the other survey data and
identify ways to improve the situation. In examples later in this chapter, we show you how
to do that.
Substantive Significance of the Correlation CoefficientWhen the correlation coefficient is strong and significant, you can be confident that the
two variables are associated in a linear fashion. In our Santa Fe Grill example, we can be
reasonably confident that likelihood of recommending the restaurant is in fact related to
satisfaction. When the correlation coefficient is weak, two possibilities must be consid-
ered: (1) there is not a consistent, systematic relationship between the two variables; or
(2) the association exists, but it is not linear, and other types of relationships must be inves-
tigated further.
When you square the correlation coefficient, you arrive at the coefficient of
determination, or r2. This number ranges from .00 to 1.0 and shows the proportion of vari-
ation explained or accounted for in one variable by another. In our Santa Fe Grill example,
the correlation coefficient was .776. Thus, the r2 = .602, meaning that approximately
60.2 percent of the variation in likelihood to recommend is associated with satisfaction.
The larger the size of the coefficient of determination, the stronger the linear relation-
ship between the two variables being examined. In our example, we have accounted for
60 percent of the variation in likelihood of recommending Santa Fe Grill by assessing its
relationship to satisfaction.
There is a difference between statistical significance and substantive significance.
Thus, you need to understand substantive significance. In other words, do the num-
bers you calculate provide useful information for management? Since the statistical
significance calculation for correlation coefficients depends partly on sample size, it
is possible to find statistically significant correlation coefficients that are too small
to be of much practical use to management. This is because large samples result in
more confidence that a relationship exists, even if it is weak. For example, if we had
correlated satisfaction with the likelihood of recommending the Santa Fe Grill to others,
and the correlation coefficient was .20 (significant at the .05 level), the coefficient of
determination would be .04. Can we conclude that the results are meaningful? It is
highly unlikely the results are meaningful since the amount of shared variance is only
4 percent. Always look at both types of significance (statistical and substantive) before
you develop conclusions.
Coefficient of determina-
tion (r2) A number mea-
suring the proportion of
variation in one variable ac-
counted for by another. The
r2 measure can be thought
of as a percentage and var-
ies from 0.0 to 1.00.
www.MyEbookNiche.eCrater.com

326 Part 4 Data Preparation, Analysis, and Reporting the Results
Influence of Measurement Scales on Correlation AnalysisSometimes research questions can be measured only with ordinal or nomi-
nal scales. What options are available when ordinal scales are used to collect data,
or when the data simply cannot be measured with an interval scale or better? The
Spearman rank order correlation coefficient is the recommended statistic to use when two
variables have been measured using ordinal scales. If either one of the variables is represented
by rank order data, the best approach is to use the Spearman rank order correlation coeffi-
cient, rather than the Pearson correlation.
SPSS Application—Spearman Rank Order CorrelationThe Santa Fe Grill customer survey collected data that ranked four restaurant selection
factors. These data are represented by variables X26
to X29
. Management is interested in
knowing whether “Food Quality” is a more important selection factor than “Service.”
Since these variables are ordinal, the Pearson correlation is not appropriate. The Spear-
man correlation is the appropriate coefficient to calculate. Variables X27
–Food Quality and
X29
–Service are the variables we will use.
The owners want to know in general what factors influence the choice of a restaurant.
Therefore, in this analysis the total sample of 405 responses is analyzed. The SPSS click-
through sequence is ANALYZE → CORRELATE → BIVARIATE, which leads to a dialog
box where you select the variables. Transfer variables X27
and X29
into the “Variables”
box. You will note the Pearson correlation is the default along with the two-tailed test of
significance, and flag significant correlations. “Uncheck” the Pearson correlation and click
on “Spearman.” Then click on “OK” to execute the program.
Interpretation of Results The SPSS results for the Spearman correlation are shown in
Exhibit 12.7. As you can see in the Correlations table, the correlation between variable
X27
–Food Quality and X29
–Service is −.130, and the significance value is above .01
(see footnote to Correlations table). Thus, we have confirmed there is a statistically signifi-
cant relationship between the two restaurant selection factors, although it is very small.
The negative correlation indicates that a customer who ranks food quality high in impor-
tance tends to rank service significantly lower in importance.
Spearman rank order
correlation coefficient A
statistical measure of the
linear asso ciation between
two variables where both
have been measured using
ordinal (rank order) scales.
Exhibit 12.7 SPSS Spearman Rank Order Correlation
www.MyEbookNiche.eCrater.com

Chapter 12 Examining Relationships in Quantitative Research 327
SPSS Application—Calculating Median Rankings To better understand the Spearman
correlation findings, we need to calculate the median rankings of the four selection fac-
tors. To do this, the SPSS click-through sequence is ANALYZE → DESCRIPTIVE
STATISTICS → FREQUENCIES. Click on variables X26
–X29
to highlight them and then
on the arrow box for the Variables box to use them in your analysis. We use all four selec-
tion factors because this will enable us to examine the overall relative rankings of all the
restaurant selection factors. Next, open the Statistics box and click on median and then
Continue. For the Charts and Format options we will use the defaults, so click on OK to
execute the program.
Interpretation of Results The SPSS results for median rankings are shown in the Sta-
tistics table in Exhibit 12.8. Recall that medians are descriptive data and can only be
used to describe respondents. Based on the coding for this variable, the factor with the
lowest median is ranked the highest and is the most important, and the factor with the
highest median is the least important, since the four selection factors were ranked from
1 to 4, with 1 = most important, and 4 = least important. Food quality is ranked as the
most important factor (median = 1.0) while atmosphere and service are the least impor-
tant (median = 3.0). The Spearman rank correlation compared food quality (median = 1)
with service (median = 3.0), so food quality is significantly more important in restaurant
selection than service.
What Is Regression Analysis?
Correlation can determine if a relationship exists between two variables. The correlation
coefficient also tells you the overall strength of the association and the direction of the
relationship between the variables. However, managers sometimes still need to know how
to describe the relationship between variables in greater detail. For example, a marketing
manager may want to predict future sales or how a price increase will affect the profits
or market share of the company. There are a number of ways to make such predictions:
(1) extrapolation from past behavior of the variable; (2) simple guesses; or (3) use of
a regression equation that includes information about related variables to assist in the
prediction. Extrapolation and guesses (educated or otherwise) usually assume that past
Exhibit 12.8 Median Example for Restaurant Selection Factors
www.MyEbookNiche.eCrater.com

328 Part 4 Data Preparation, Analysis, and Reporting the Results
conditions and behaviors will continue into the future. They do not examine the influ-
ences behind the behavior of interest. Consequently, when sales levels, profits, or other
variables of interest to a manager differ from those in the past, extrapolation and guessing
do not explain why.
Bivariate regression analysis is a statistical technique that uses information about
the relationship between an independent or predictor variable and a dependent variable to
make predictions. Values of the independent variable are selected, and the behavior of the
dependent variable is observed using the formula for a straight line. For example, if you
wanted to find the current level of your company’s sales volume, you would apply the fol-
lowing straight-line formula:
Sales volume ( Y ) = $0 + (Price per unit = b) × (Number of units sold = X)
You would not expect any sales volume if no units are sold. Thus, the constant or
x-intercept is $0. Price per unit (b) determines the amount that sales volume (Y) increases
with each unit sold (X). In this example, the relationship between sales volume and number
of units sold is linear.
Once a regression equation has been developed to predict values of Y, we want to find
out how good that prediction is. A place to begin is to compare the values predicted by our
regression model with the actual values we collected in our sample. By comparing this
actual value (Yi) with our predicted value (Y), we can tell how well our model predicts the
actual value of our dependent variable.
A couple of points should be made about the assumptions behind regression analy-
sis. First, as with correlation, regression analysis assumes a linear relationship is a good
description of the relationship between two variables. If the scatter diagram showing the
positions of the values of both variables looks like the scatter plots in Exhibits 12.2 or 12.3,
this assumption is a good one. If the plot looks like Exhibits 12.1 or 12.4, however, then
regression analysis is not a good choice. Second, even though the terminology of regres-
sion analysis commonly uses the labels dependent and independent for the variables, these
labels do not mean we can say one variable causes the behavior of the other. Regression
analysis uses knowledge about the level and type of association between two variables to
make predictions. Statements about the ability of one variable to cause changes in another
must be based on conceptual logic or preexisting knowledge rather than on statistical cal-
culations alone.
Finally, the use of a simple regression model assumes (1) the variables of interest
are measured on interval or ratio scales (except in the case of dummy variables, which
are discussed on our website, www.mhhe.com/hairessentials3e), (2) the variables come
from a normal population, and (3) the error terms associated with making predictions are
normally and independently distributed.
Fundamentals of Regression AnalysisA fundamental basis of regression analysis is the assumption of a straight line relation-
ship between the independent and dependent variables. This relationship is illustrated in
Exhibit 12.9. The general formula for a straight line is
Y = a + bX + ei
Bivariate regression
analysis A statistical tech-
nique that analyzes the
linear relationship between
two variables by estimating
coefficients for an equa-
tion for a straight line. One
variable is designated as a
dependent variable and the
other is called an indepen-
dent or predictor variable.
www.MyEbookNiche.eCrater.com

Chapter 12 Examining Relationships in Quantitative Research 329
where
Y = the dependent variablea = the intercept (point where the straight line intersects the Y-axis when X = 0)b = the slope (the change in Y for every 1 unit change in X)X = the independent variable used to predict Ye
i = the error for the prediction
In regression analysis, we examine the relationship between the independent variable X
and the dependent variable Y. To do so, we use the actual values of X and Y in our
data set and the computed values of a and b. The calculations are based on the
least squares procedure. The least squares procedure determines the best-fitting line
by minimizing the vertical distances of all the data points from the line, as shown in
Exhibit 12.10. The best fitting line is the regression line. Any point that does not fall on
the line is the result of unexplained variance, or the variance in Y that is not explained
by X. This unexplained variance is called error and is represented by the vertical distance
between the estimated straight regression line and the actual data points. The distances of
all the points not on the line are squared and added together to determine the sum of the
squared errors, which is a measure of total error in the regression.
In the case of bivariate regression analysis, we are looking at one independent vari-
able and one dependent variable. However, managers frequently want to look at the
combined influence of several independent variables on one dependent variable. For
example, are digital recorder/player purchases related only to age, or are they also related
to income, ethnicity, gender, geographic location, and education level? Similarly, in the
Santa Fe Grill database, we might ask whether customer satisfaction is related only to
perceptions of the restaurant’s food taste (X18
), or is satisfaction also related to percep-
tions of friendly employees (X12
), reasonable prices (X16
), and speed of service (X21
)?
Least squares procedure
A regression approach
that determines the best-
fitting line by minimizing the
vertical distances of all the
points from the line.
Unexplained variance The
amount of variation in the
dependent variable that
cannot be accounted for
by the combination of inde-
pendent variables.
Exhibit 12.9 The Straight Line Relationship in Regression
X
Y
1
0
b = slope
a
Intercept
www.MyEbookNiche.eCrater.com

330 Part 4 Data Preparation, Analysis, and Reporting the Results
Multiple regression is the appropriate technique to measure these multivariate relation-
ships. We discuss bivariate or simple regression analysis before moving on to multiple
regression analysis.
Developing and Estimating the Regression CoefficientsRegression uses an estimation procedure called ordinary least squares (OLS) that guaran-
tees the line it estimates will be the best fitting line. We said earlier that the best prediction
would be one in which the difference between the actual value of Y and the predicted value
of Y was the smallest. Ordinary least squares is a statistical procedure that results in equa-
tion parameters (a and b) that produce predictions with the lowest sum of squared differ-
ences between actual and predicted values. The betas (b) are the regression coefficients. If
a b is large, the variable is a better predictor of Y.
Error in Regression The differences between actual and predicted values of Y are repre-
sented by ei (the error term of the regression equation). If we square these errors for each
observation (the difference between actual values of Y and predicted values of Y) and add
them up, the total would represent an aggregate or overall measure of the accuracy of the
regression equation.
SPSS Application—Bivariate RegressionLet’s illustrate bivariate regression analysis. Suppose the owners of the Santa Fe Grill
want to know if more favorable perceptions of their prices are associated with higher
customer satisfaction. The obvious answer would be “of course it would.” But how
much improvement would be expected in customer satisfaction if the owners improved
the perceptions of prices? Bivariate regression provides information to answer this
question.
Ordinary least squares
A statistical procedure
that estimates regression
equation coefficients that
produce the lowest sum
of squared differences
between the actual and
predicted values of the de-
pendent variable.
Regression coefficient An
indicator of the importance
of an independent variable
in predicting a dependent
variable. Large coefficients
are good predictors and
small coefficients are weak
predictors.
Exhibit 12.10 Fitting the Regression Line Using the “Least Squares” Procedure
ei = error
0X
Y
www.MyEbookNiche.eCrater.com

Chapter 12 Examining Relationships in Quantitative Research 331
In the Santa Fe Grill customer database X22
is a measure of customer satisfaction, with
1 = Not Satisfied At All and 7 = Highly Satisfied. Variable X16
is a measure of respon-
dents’ perceptions of the reasonableness of the restaurant’s prices (1 = Strongly Disagree,
7 = Strongly Agree). To examine this research question, the owners of the Santa Fe
Grill are most interested in their own customers. The null hypothesis is that there is
no relationship between X22
–Satisfaction and X16
–Reasonable Prices for the Santa Fe
Grill customers.
To select the Santa Fe Grill survey responses (253) from the total sample of 405
responses, the click-through sequence is DATA → SELECT CASES. First click on the
Data pull-down menu and scroll down and highlight and click on Select Cases. You now
see the Select Cases dialog box where the default is All cases. Click on the If condition
is satisfied option, and then on the If tab. Next highlight the screening variable X_s4 and
click on the arrow box to move it into the window. Now click on the equal sign and then 1
to select the Santa Fe customers (coded 1). Next click Continue and then OK and you will
be analyzing only the Santa Fe Grill customers. Thus, your output will have the results for
only one restaurant.
To run the bivariate regression, the SPSS click-through sequence is ANALYZE →
REGRESSION → LINEAR. Click on X22
–Satisfaction and move it to the Dependent
Variable window. Click on X16
–Reasonable Prices and move it to the Independent Vari-
ables window. We use the defaults for the other options so click OK to run the bivariate
regression.
Exhibit 12.11 contains the results of the bivariate regression analysis. The table
labeled “Model Summary” has three types of R in it. The R on the far left is the correlation
coefficient (.479). The R-square is .230—you get this value by squaring the correlation
coefficient (.479) for this regression. The R-square shows the percentage of variation in
one variable that is accounted for by another variable. In this case, customer perceptions
of the Santa Fe Grill’s prices accounts for 23.0 percent of the total variation in customer
satisfaction with the restaurant.
Interpretation of Results The ANOVA table shows the F-ratio that indicates the sta-
tistical significance of the regression model. The variance in X22
–Customer Satisfaction
that is associated with X16
–Reasonable Prices is referred to as explained variance. The
remainder of the total variance in X22
that is not associated with X16
is referred to as
unexplained variance. The F-ratio compares the amount of explained variance to the
unexplained variance. The larger the F-ratio, the more variance in the dependent vari-
able that is associated with the independent variable. In our example, the F-ratio is
74.939, and the statistical significance is .000—the Sig. value on the SPSS output—so
we can reject the null hypothesis that no relationship exists between the two variables.
Moreover, we can conclude that the perception of reasonable prices is positively related
to overall customer satisfaction.
The Coefficients table shows the regression coefficient for X16
(reasonable prices).
The column labeled “Unstandardized Coefficients” indicates the unstandardized regres-
sion coefficient (b) for X16
is .347. The column labeled “Sig.” shows the statistical signifi-
cance of the regression coefficient for X16
, as measured by the t-test. The t-test examines
the question of whether the regression coefficient is different enough from zero to be sta-
tistically significant. The t statistic is calculated by dividing the regression coefficient by
its standard error (labeled Std. Error in the Coefficients table). If you divide .347 by .040,
you will get a t value of 8.657, which is significant at the .000 level.
The Coefficients table also shows the result for the Constant component in the regres-
sion equation. This item is a term in the equation for a straight line we discussed earlier.
www.MyEbookNiche.eCrater.com

332 Part 4 Data Preparation, Analysis, and Reporting the Results
It is the X-intercept, or the value of Y when X is 0. If the independent variable takes on
a value of 0, the dependent measure (X22
) would have a value of 2.991. Combining the
results of the Coefficients table into a regression equation, we have
Predicted value of X22 = 2.991 + .347 × (value of X16) + .881 (avg. error in prediction)
The relationship between customer satisfaction and reasonable prices is positive. The
regression coefficient for X16
is interpreted as “For every unit that X16
(the rating of reason-
able prices) increases, X22
(satisfaction) will increase by .347 units.” Recall that the Santa
Fe Grill owners asked, “If the prices in our restaurant are perceived as being reasonable,
will this be associated with improved customer satisfaction?” The answer is “yes,” because
the model was significant at the .000 level, and the R-square was .230. Thus, 23 percent
of the dependent variable satisfaction was explained by the single independent variable
reasonable prices.
SignificanceOnce the statistical significance of the regression coefficients is determined, we have
answered the first question about our relationship: “Is there a relationship between our
dependent and independent variable?” In this case, the answer is “yes.” But recall our
Exhibit 12.11 SPSS Results for Bivariate Regression
www.MyEbookNiche.eCrater.com

Chapter 12 Examining Relationships in Quantitative Research 333
discussion of statistical versus substantive significance. The logic of that discussion also
applies when we evaluate whether regression coefficients are meaningful. A second
question to ask is “How strong is that relationship?” The output of regression analysis
includes the coefficient of determination, or r2—which describes the amount of variation
in the dependent variable associated with the variation in the independent variable. The
regression r2 also tells you what percentage of the total variation in your dependent vari-
able you can explain by using the independent variable. The r2 measure varies between
.00 and 1.00, and is calculated by dividing the amount of variation you have been able
to explain with your regression equation by the total variation in the dependent variable.
In the previous Santa Fe Grill example that examined the relationship between reason-
able prices and satisfaction, the r2 was .230. That means 23.0 percent of the variation in
customer satisfaction is associated with the variation in respondents’ perceptions of the
reasonableness of prices.
When examining the substantive significance of a regression equation, you should
look at the size of the r2 for the regression equation and the size of the regression coef-
ficient. The regression coefficient may be statistically significant, but still relatively
small, meaning that your dependent measure won’t change very much for a given unit
change in the independent measure. In our Santa Fe Grill example, the unstandard-
ized regression coefficient was .347, which is a relatively weak relationship. When
regression coefficients are significant but small, we say a relationship is present in
our population, but that it is weak. In this case, Santa Fe Grill owners need to consider
additional independent variables that will help them to better understand and predict
customer satisfaction.
Multiple Regression AnalysisIn most problems faced by managers, there are several independent variables that need to
be examined for their influence on a dependent variable. Multiple regression analysis
is the appropriate technique to use for these situations. The technique is an extension
of bivariate regression. Multiple independent variables are entered into the regres-
sion equation, and for each variable a separate regression coefficient is calculated that
describes its relationship with the dependent variable. The coefficients enable the mar-
keting researcher to examine the relative influence of each independent variable on
the dependent variable. For example, Santa Fe Grill owners want to examine not only
reasonable prices, but also customer perceptions of employees, atmosphere, and ser-
vice. This gives them a more accurate picture of what to consider when developing
marketing strategies.
The relationship between each independent variable and the dependent measure is still
linear. Now, however, with the addition of multiple independent variables, we have to think
of multiple independent variables instead of just a single one. The easiest way to analyze
the relationships is to examine the regression coefficient for each independent variable,
which represents the average amount of change expected in Y given a unit change in the
value of the independent variable you are examining.
With the addition of more than one independent variable, we have some new issues to
consider. One is the possibility that each independent variable is measured using a differ-
ent scale. To solve this problem, we calculate the standardized regression coefficient. It is
called a beta coefficient, and it shows the change in the dependent variable for each unit
change in the independent variable. Standardization removes the effects of using different
scales of measurement. For example, years of age and annual income are measured on dif-
ferent scales. Beta coefficients will range from .00 to 1.00, and can be either positive or
Multiple regression analy-
sis A statistical technique
which analyzes the linear
relationship between a
dependent variable and
multiple independent vari-
ables by estimating coef-
ficients for the equation for
a straight line.
Beta coefficient An
estimated regression co-
efficient that has been re-
calculated to have a mean
of 0 and a standard de-
viation of 1. Such a change
enables independent vari-
ables with different units of
measurement to be directly
compared on their asso-
ciation with the dependent
variable.
www.MyEbookNiche.eCrater.com

334 Part 4 Data Preparation, Analysis, and Reporting the Results
negative. A positive beta means as the size of an independent variable increases then the
size of the dependent variable increases. A negative beta means as the size of the indepen-
dent variable increases then the size of the dependent variable gets smaller.
Statistical SignificanceAfter the regression coefficients have been estimated, you must examine the statistical
significance of each coefficient. This is done in the same manner as with bivariate regres-
sion. Each regression coefficient is divided by its standard error to produce a t statistic,
which is compared against the critical value to determine whether the null hypothesis can
be rejected. The basic question is still the same: “What is the probability we would get a
coefficient of this size if the real regression coefficient in the population were zero?” You
should examine the t-test statistics for each regression coefficient. Many times not all the
independent variables in a regression equation will be statistically significant. If a regres-
sion coefficient is not statistically significant, that means the independent variable does not
have a relationship with the dependent variable and the slope describing that relationship
is relatively flat: the value of the dependent variable does not change at all as the value of
the statistically insignificant independent variable changes.
When using multiple regression analysis, it is important to examine the overall sta-
tistical significance of the regression model. The amount of variation in the dependent
variable you have been able to explain with the independent measures is compared with
the total variation in the dependent measure. This comparison results in a statistic called a
model F statistic which is compared against a critical value to determine whether or not to
reject the null hypothesis. If the F statistic is statistically significant, it means the chances
of the regression model for your sample producing a large r2 when the population r2 is
actually 0 are acceptably small.
Substantive SignificanceOnce we have estimated the regression equation, we need to assess the strength of the
association. The multiple r2 or multiple coefficient of determination describes the strength
of the relationship between all the independent variables in our equation and the dependent
variable. The larger the r2 measure, the more of the behavior of the dependent measure
is associated with the independent measures we are using to predict it. For example, if
the multiple r2 in our Canon copier example above were .78, that would mean we can
explain 78 percent of the variation in sales revenue by using the variables sales force size,
advertising budget, and customer attitudes toward our copier products. Higher values for r2
mean stronger relationships between the group of independent variables and the dependent
measure.
To summarize, the elements of a multiple regression model to examine in determin-
ing its significance include the r2, the model F statistic, the individual regression coef-
ficients for each independent variable, their associated t statistics, and the individual beta
coefficients. The appropriate procedure to follow in evaluating the results of a regression
analysis is (1) assess the statistical significance of the overall regression model using the
F statistic and its associated probability; (2) evaluate the obtained r2 to see how large it
is; (3) examine the individual regression coefficients and their t statistics to see which
are statistically significant; and (4) look at the beta coefficients to assess relative influ-
ence. Taken together, these elements give you a comprehensive picture of the answers
to our three basic questions about the relationships between dependent and independent
variables.
Model F statistic A statistic
that compares the amount
of variation in the depen-
dent measure “explained”
or associated with the
independent variables to
the “unexplained” or error
variance. A larger F statistic
indicates that the regression
model has more explained
variance than error variance.
www.MyEbookNiche.eCrater.com

Chapter 12 Examining Relationships in Quantitative Research 335
Multiple Regression AssumptionsThe ordinary least squares approach to estimating a regression model requires that sev-
eral assumptions be met. Among the more important assumptions are (1) linear rela-
tionship, (2) homoskedasticity, and (3) normal distribution. The linearity assumption
was explained earlier and illustrated in Exhibits 12.9 and 12.10. Exhibit 12.12 illustrates
heteroskedasticity. The pattern of covariation (dots representing the values of X and Y)
around the regression line is narrow on the left and very wide on the right (increases in
width). In such a situation, the predictive ability of the regression model would change as
the values range from small to large. For the regression model to predict accurately the dots
must be approximately equal distances from the regression line, whether the values are
small, medium, or large—a situation referred to as homoskedasticity. A normal curve is
shown in Exhibit 12.13. A regression model assumes both the independent and dependent
variable distributions are normally distributed. The SPSS regression software has options
to check these assumptions. All of these assumptions should be met. The general regres-
sion model predicts reasonably well, however, with moderate deviations from linearity,
homoskedasticity, and normality.
SPSS Application—Multiple RegressionRegression can be used to examine the relationship between a single metric dependent vari-
able and one or more metric independent variables. If you examine the Santa Fe Grill cus-
tomer database, you will note that the first 21 variables are metric independent variables. They
are lifestyle variables and perceptions of the restaurant, measured using a 7-point rating scale
with 7 representing the high end of the scale and 1 the low end. Variables X22
, X23
, and X24
are metric-dependent variables measured on a 7-point rating scale. Variable X25
–Frequency of
Homoskedasticity The
pattern of the covariation is
constant (the same) around
the regression line, whether
the values are small, me-
dium, or large.
Heteroskedasticity The
pattern of covariation
around the regression line
is not constant around the
regression line, and varies
in some way when the val-
ues change from small to
medium and large.
Normal curve A curve that
indicates the shape of the
distribution of a variable is
equal both above and be-
low the mean.
Exhibit 12.12 Example of Heteroskedasticity
Y
X0
www.MyEbookNiche.eCrater.com

336 Part 4 Data Preparation, Analysis, and Reporting the Results
Eating, X30
–Distance Driven, X31
–Ad Recall, and X32
–Gender are nonmetric. Variables X26
to
X29
also are nonmetric variables because they are ranking data, and thus cannot therefore be
used in regression.
An example of a problem to examine with multiple regression is the relationship
between perceptions of the food in the restaurant and overall customer satisfaction. In this
case, the single metric-dependent variable is X22
–Satisfaction, and the independent vari-
ables would be X15
–Fresh Food, X18
–Food Taste, and X20
–Food Temperature. The null
hypothesis would be that there is no relationship between the three food variables and X22
for the Santa Fe Grill customers. The alternative hypothesis would be that X15
, X18
, and X20
are significantly related to X22
–Satisfaction of Santa Fe Grill customers.
First, make sure you select only the Santa Fe Grill customers to analyze. The SPSS
click-through sequence to examine this relationship is ANALYZE → REGRESSION →
LINEAR. Highlight X22
and move it to the Dependent Variables window. Highlight X15
,
X18
, and X20
and move them to the Independent Variables window. We will use the defaults
for the other options so click OK to run the multiple regression.
Interpretation of Results The SPSS output for the multiple regression is shown in
Exhibit 12.14. The Model Summary table shows the R-square for this model is .417. This
means that 41.7 percent of the variation in satisfaction (dependent variable) can be explained
by the three independent variables. The regression model results in the ANOVA table indicate
that the R-square for the overall model is significantly different from zero (F-ratio = 59.288;
probability level (Sig.) < .000). This probability level means there are .000 chances the
regression model results come from a population where the R-square actually is zero. That is,
there are no chances out of 1,000 that the actual correlation coefficient is zero.
To determine if one or more of the food independent variables are significant pre-
dictors of satisfaction, we examine the information provided in the Coefficients table.
Looking at the Standardized Coefficients Beta column reveals that X15
–Fresh Food
has a beta coefficient of .767 that is significant (.000). Similarly, X18
–Food Taste and
Exhibit 12.13 Example of a Normal Curve
–4 –3 –2 –1 0 1 2 3 4
www.MyEbookNiche.eCrater.com
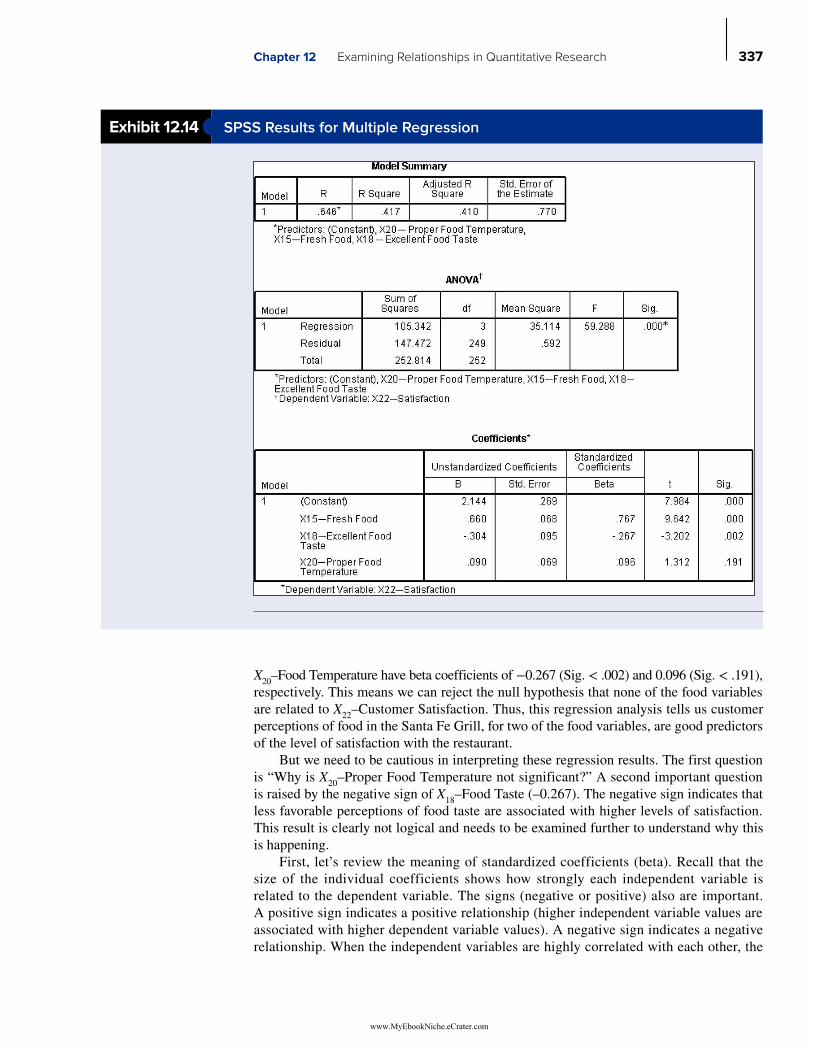
Chapter 12 Examining Relationships in Quantitative Research 337
X20
–Food Temperature have beta coefficients of −0.267 (Sig. < .002) and 0.096 (Sig. < .191),
respectively. This means we can reject the null hypothesis that none of the food variables
are related to X22
–Customer Satisfaction. Thus, this regression analysis tells us customer
perceptions of food in the Santa Fe Grill, for two of the food variables, are good predictors
of the level of satisfaction with the restaurant.
But we need to be cautious in interpreting these regression results. The first question
is “Why is X20
–Proper Food Temperature not significant?” A second important question
is raised by the negative sign of X18
–Food Taste (–0.267). The negative sign indicates that
less favorable perceptions of food taste are associated with higher levels of satisfaction.
This result is clearly not logical and needs to be examined further to understand why this
is happening.
First, let’s review the meaning of standardized coefficients (beta). Recall that the
size of the individual coefficients shows how strongly each independent variable is
related to the dependent variable. The signs (negative or positive) also are important.
A positive sign indicates a positive relationship (higher independent variable values are
associated with higher dependent variable values). A negative sign indicates a negative
relationship. When the independent variables are highly correlated with each other, the
Exhibit 12.14 SPSS Results for Multiple Regression
www.MyEbookNiche.eCrater.com

338 Part 4 Data Preparation, Analysis, and Reporting the Results
signs of the beta coefficients may be reversed in a regression model, and coefficients that
are significant may be insignificant. This is what happened in this example. The food
variables (independent variables) are highly correlated and therefore can be described as
exhibiting multicollinearity.
Because multicollinearity can create problems in using regression, analysts must
always examine the logic of the signs and significance levels of the regression betas when
independent variables are highly correlated. If a hypothesized relationship is the opposite
of what is anticipated, one must look at a simple bivariate correlation of the two variables.
This can be seen in Exhibit 12.15, which clearly shows the significant positive correlation
of .393 between X22
–Satisfaction and X18
–Food Taste. Note also that there is a significant
positive correlation of .430 between X22
–Satisfaction and X18
–Food Temperature. These
bivariate correlations show the problem of using multiple regression when the independent
variables are highly correlated.
When are the correlations between independent variables in multiple regression high
enough to cause a problem? In the authors’ experiences, problems typically arise when
the independent variables are correlated at a level of .50 or higher. Note in Exhibit 12.15
that all three independent variables are correlated at a level of .68 or higher. Thus, it is not
surprising that this problem arose. To deal with this problem researchers typically follow
one of two approaches. One approach is to create summated scales consisting of the inde-
pendent variables that are highly correlated. The other approach, computing factor scores,
is beyond the scope of this book.
Additional discussion of multicollinearity or nonmetric dummy variables in regres-
sion is beyond the scope of this book. To help you understand these topics, we have placed
material on our website at connnect.mheducation.com.
Examination of the SPSS tables reveals that there is a lot of information provided that
we did not discuss. Experts in statistics may use this information, but managers typically
do not. One of the challenges for you will be to learn which information is most important
to analyze and present in a report.
Multicollinearity A situ-
ation in which several in-
dependent variables are
highly correlated with each
other. This characteristic
can result in difficulty in
estimating separate or
independent regression co-
efficients for the correlated
variables.
Exhibit 12.15 Correlation Matrix of Regression Model Variables
www.MyEbookNiche.eCrater.com

Chapter 12 Examining Relationships in Quantitative Research 339
What Is Structural Modeling?
Our analysis of multivariate modeling has focused on multiple regression. The model
in Exhibit 12.16 shows how multiple regression could be used to understand what work
environment factors might influence commitment among employees of the Santa Fe Grill
restaurant. The model has a single dependent variable (Commitment) and four work envi-
ronment independent variables (pay, teamwork, management/supervision, and work). To
run a multiple regression model using the Samouel’s Employee data, you would have to
select a single question to represent each of the four independent variables in the model,
and one question for the dependent variable. For example, question 5 could be used to
measure pay, question 4 could measure team, question 3 could measure management, ques-
tion 1 could measure work, and question 14 could measure the single dependent variable
commitment (see Exhibit 10.2 for these specific questions). This regression model has two
stages—the four independent variables are one stage and the single dependent variable is
the second stage.
In today’s complex business environment, we often encounter situations that involve
more than two stages in a multivariate model, and in which concepts are more accurately
measured with more than a single variable. The model shown in Exhibit 12.17 has three
stages—the first stage is the four independent variables (constructs) representing the
work environment, each measured with three separate questions; the second stage is
the Commitment construct, measured with four separate questions; and the third stage
is the ultimate dependent variable Performance, measured with only a single question.
Note that the Commitment variable in this path model operates as both a dependent vari-
able of the four work environment variables and as an independent variable predicting
performance. The commitment variable in the model is also referred to as an interven-
ing or mediating variable. A three-stage path model like this cannot be analyzed with
multiple regression. You must use structural modeling, generally referred to as structural
equation modeling (SEM).
Exhibit 12.16 Multiple Regression—Santa Fe Restaurant Employees
Pay
Team
Mgmt.
Work
Commitment
www.MyEbookNiche.eCrater.com

340 Part 4 Data Preparation, Analysis, and Reporting the Results
The most appropriate type of SEM for this problem is called partial least squares, or
simply PLS-SEM. The calculation of a solution is very similar to ordinary least squares
regression, but is extended to obtain a solution for path models with more than two stages
and variables measured with more than a single question. The statistical objective of the
calculations is to maximize the variance explained in the dependent variables. There also is
user-friendly software available to students at no charge—SmartPLS (www.smartpls.de).
A Powerpoint file explaining how to use this software is available on the website for this
book (www.mhhe.com/hairessentials4).
The path model is developed based on theory. In Exhibit 12.17, the theory represented
by the path model is that the way employees feel about pay, team, management, and work
will influence commitment to their job, and that commitment in turn influences perfor-
mance. Specifically, employees that are more favorable about their pay, coworkers, manag-
ers, and work in general, are more committed, and therefore perform at a higher level.
PLS-SEM is becoming popular in business and marketing research because of the fol-
lowing advantages:
1. The measurement requirements are very flexible and it works well with all types of
data, including nominal, ordinal, interval, and ratio data.
2. The method is nonparametric so it can be applied to data that is not normally
distributed.
3. Solutions can be obtained with both small and large samples. Depending on the com-
plexity of the model, a sample size of 50 or so respondents is often acceptable.
Exhibit 12.17 Structural Equation Model—Santa Fe Restaurant Employees
Work
MGMT
Team
Pay
X12
X13
X23
Performance
Commitment
X14 X15 X16
X5
X8
X11
X4
X9
X10
X3
X6
X1
X2
X7
www.MyEbookNiche.eCrater.com

Chapter 12 Examining Relationships in Quantitative Research 341
4. Solutions are possible with very complex models based on 100+ questions and many
constructs.
5. Many types of analysis are possible, such as group comparisons, mediation, modera-
tion, and importance-performance analysis.
6. The SmartPLS software is very user friendly—just draw a picture of your path model,
import your data, and use point-and-click and drag-and-drop motions to run the soft-
ware. The output includes many assessment tools, including Cronbach’s Alpha reli-
ability, validity testing, and explained variance (R2).
The next section demonstrates the application of the SmartPLS software to help you under-
stand the factors that may be influencing the Santa Fe Grill employees to perform at a
higher level.
An Example of Structural ModelingManagement of the Santa Fe Grill wants their employees to be highly motivated to pro-
vide excellent service to their customers. As noted earlier, theory suggests that pay, team-
work, management, and work influence commitment to an employer, and ultimately lead
to higher performance. These proposed relationships are based not only on theory, but also
on practical knowledge, logic, and business experience.
There are five structural paths in the path model shown in Exhibit 12.18. The struc-
tural paths are represented by the four single-headed arrows from pay, team, management,
Exhibit 12.18 Results of PLS-SEM Path Model Analysis
X12
X5
X8
X11
X4
X9
X10
X1
X2
X7
X3
X6
X14 X15
Work
MGMT
Team
Pay
X13
X23
Performance
Commitment
X16
.54
.57
.18
.45
.26
.34
.89 .92 .85 .95
.76
1.00
.94
.98
.82
.86
.91
.81
.82
.95
.94
.91.52
.42
www.MyEbookNiche.eCrater.com

342 Part 4 Data Preparation, Analysis, and Reporting the Results
and work to commitment, and the one single-headed arrow from commitment to perfor-
mance. Each of these five structural paths is a hypothesis:
1. The more satisfied employees are with their pay, the more committed they are to the
restaurant.
2. The more favorable employees are about how their teams are functioning, the more
committed they are to the restaurant.
3. The more favorable employees are about management, the more committed they are
to the restaurant.
4. The more favorable employees are about their work at the restaurant, the more com-
mitted they are to the restaurant.
5. The more committed employees are to the restaurant, the higher their job
performance.
The results from testing the hypotheses using the SmartPLS software are shown on
the structural model in Exhibit 12.18. The relationships between the six constructs and
the variables (questions) that measure the constructs are referred to as the outer model.
For example, the pay construct is measured by three variables—X12, X5, and X8. The
outer model is thus the six constructs in the path model and the relationships between
these six constructs and the variables that measure the constructs. The five structural
relationships (single-headed arrows) between the six constructs in the model are referred
to as the inner model.
PLS-SEM results are examined in a two-step sequence. The first step assesses the
outer model, also referred to as the measurement model. The second step assesses the
inner model. The numbers on the outer model arrows connecting the constructs with
the measured variables are correlations. These correlations are evaluated based on their
size and statistical significance. The general guideline is the size of the correlations should
be .70 or larger, but smaller correlations are sometimes considered acceptable. Looking at
the correlations for the six constructs (see Exhibit 12.19), all are larger than the .70 guide-
line, except for X1 and X7 on the work construct. In addition, X1 is not statistically sig-
nificant at the .05 level but X7 is. Since the sample size is N = 77, some researchers would
consider the .09 for X1 acceptable, but the size of the correlation still does not meet rec-
ommended guidelines. Basically, researcher judgment is involved in deciding these issues.
Questions X1 and X7 are definitely weak, and many researchers would likely remove both
X1 and X7 from the model and rerun it with fewer measured variables.
The SmartPLS software also provides the Cronbach’s Alpha internal consistency reli-
ability measure for all constructs. The reliability is the following: pay = .93; team = .83;
MGMT = .87; work = .44; and commitment = .92 (internal consistency reliability is not
appropriate for single item constructs, such as performance). The reliability of all con-
structs is acceptable, except for the work construct.
The second step involves evaluating the results for the inner model. The num-
bers on the inner model arrows connecting the constructs are structural coefficients
(not correlations). These coefficients are similar to regression coefficients (standard-
ized betas), and are also evaluated based on their size and statistical significance.
The larger the size of the coefficients, the stronger the path relationship between
the two constructs. The sizes of the coefficients on all relationships are meaningful
(see Exhibit 12.20). All paths are statistically significant (< 0.05), except the Pay →
Commitment relationship. The lack of significance is likely due to the small sample
size (N = 77), and under these circumstances, many researchers would consider a .07 sig-
nificance level acceptable.
www.MyEbookNiche.eCrater.com
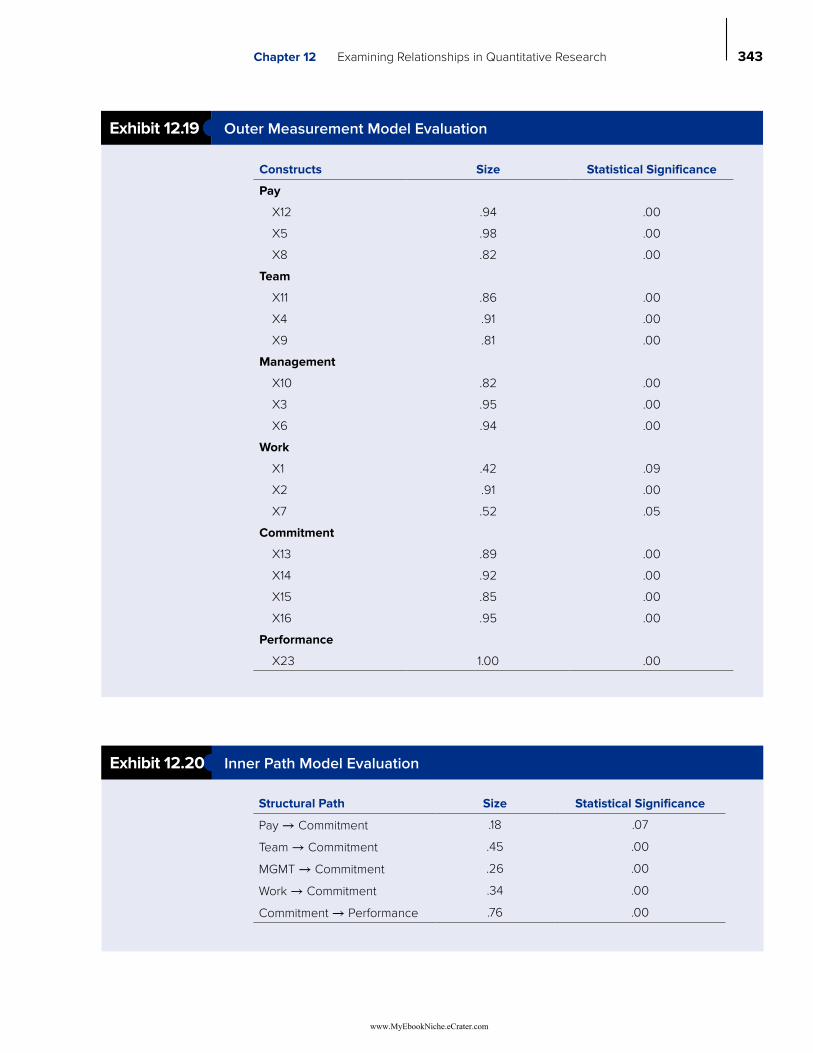
Chapter 12 Examining Relationships in Quantitative Research 343
Exhibit 12.19 Outer Measurement Model Evaluation
Constructs Size Statistical Significance
Pay
X12 .94 .00
X5 .98 .00
X8 .82 .00
Team
X11 .86 .00
X4 .91 .00
X9 .81 .00
Management
X10 .82 .00
X3 .95 .00
X6 .94 .00
Work
X1 .42 .09
X2 .91 .00
X7 .52 .05
Commitment
X13 .89 .00
X14 .92 .00
X15 .85 .00
X16 .95 .00
Performance
X23 1.00 .00
Exhibit 12.20 Inner Path Model Evaluation
Structural Path Size Statistical Significance
Pay → Commitment .18 .07
Team → Commitment .45 .00
MGMT → Commitment .26 .00
Work → Commitment .34 .00
Commitment → Performance .76 .00
www.MyEbookNiche.eCrater.com

344 Part 4 Data Preparation, Analysis, and Reporting the Results
The small size and lack of significance of the outer model correlations of the work
construct, in combination with the low reliability of the construct, dictate that corrective
measures must be taken to improve this construct. The entire construct could be removed
from the model. But before taking that action it is appropriate to delete the poorly per-
forming measured variables. Variables X1 and X7 were removed and the model was run
again. The results of the revised model are shown in Exhibit 12.21. Overall, these model
results are very similar to the previous one, except that the work construct measured with
a single variable (X2) now meets acceptable guidelines, as do all other constructs.
The final concept to evaluate is the predictive ability of the structural model. The
four independent variable work environment constructs predict 55 percent of the vari-
ance (R2) in the commitment construct, and the commitment construct predicts 57 percent
of the variance (R2) in the performance construct (see numbers inside constructs in
Exhibit 12.21). These are excellent results for this predictive model, and are very useful for
the owners of the Santa Fe Grill restaurant in better understanding how to supervise their
employees. It should be noted that our analysis has only focused on the basic assessment
tools for PLS-SEM analyses. A more comprehensive explanation of the PLS-SEM method
can be found in this book (Hair Jr, Joseph F., G. Tomas M. Hult, Christian M. Ringle,
and Marko Sarstedt, A primer on partial least squares structural equation modeling (PLS-
SEM), 2nd ed. (Thousand Oaks, CA: Sage Publications, in press)).
Exhibit 12.21 Results of Revised PLS-SEM Path Model
Work
MGMT
Team
Pay
X12
X13
X23
Performance
Commitment
X14 X15 X16
.55
.57
X5
X8
X11
X4
X9
X10
X3
X6
X2
.17
.46
.26
.35
.89 .92 .85 .94
.76
1.00
.94
.98
.82
.86
.91
.81
.82
.95
.94
1.00
www.MyEbookNiche.eCrater.com

Chapter 12 Examining Relationships in Quantitative Research 345
MARKETING RESEARCH IN ACTIONThe Role of Employees in Developing a Customer Satisfaction Program
The plant manager of QualKote Manufacturing is interested in the impact his year-long
effort to implement a quality improvement program is having on the satisfaction of his
customers. The plant foreman, assembly-line workers, and engineering staff have closely
examined their operations to determine which activities have the most impact on prod-
uct quality and reliability. Together, the managers and employees have worked to better
understand how each particular job affects the final delivered quality of the product as the
customer perceives it.
To answer his questions about customer satisfaction, the plant manager conducted
an internal survey of plant workers and managers using a 7-point scale (endpoints are
1 = Strongly Disagree and 7 = Strongly Agree). His plans are to get opinions from within
the company first and then do a customer survey on similar topics. He has collected com-
pleted surveys from 57 employees. The following are examples of the topics that were
covered in the questionnaire:
∙ Data from a variety of external sources such as customers, competitors, and suppliers
is used in the strategic planning process. Independent variable A10.
∙ Customers are involved in the product quality planning process. Independent
variable A12.
∙ Customer requirements and expectations of the company’s products are used in devel-
oping strategic plans and goals. Independent variable A17.
∙ There is a systematic process to translate customer requirements into new/improved
products. Independent variable A23.
∙ There is a systematic process to accurately determine customers’ requirements and
expectations. Independent variable A31.
∙ The company’s product quality program has improved the level of customer satisfac-
tion. Dependent variable A36.
∙ The company’s product quality program has improved the likelihood that customers
will recommend us. Dependent variable A37.
∙ Gender of the employee responding: Male = 1; Female = 0. Classification
variable A40.
A multiple regression was run using SPSS with responses of the 57 employees as
input to the model. The dependent variable was A36 and the independent variables were
A10, A12, A17, A23, and A31. The output is shown in Exhibits 12.22 and 12.23. There is
a database of QualKote employee responses to these questions available in SPSS format at
connect.mheducation.com. The database is labeled QualKote MRIA_Essn 3e.sav.
Results indicate a statistically significant relationship between the metric-dependent
variable (A36–Satisfaction) and at least some of the five metric independent variables.
The R2 for the relationship is 67.0 and it is statistically significant at the .000 level. This
suggests that when employees have more favorable perceptions about some aspects of the
implementation of the quality improvement program, they also believe the program has
improved customer satisfaction.
www.MyEbookNiche.eCrater.com
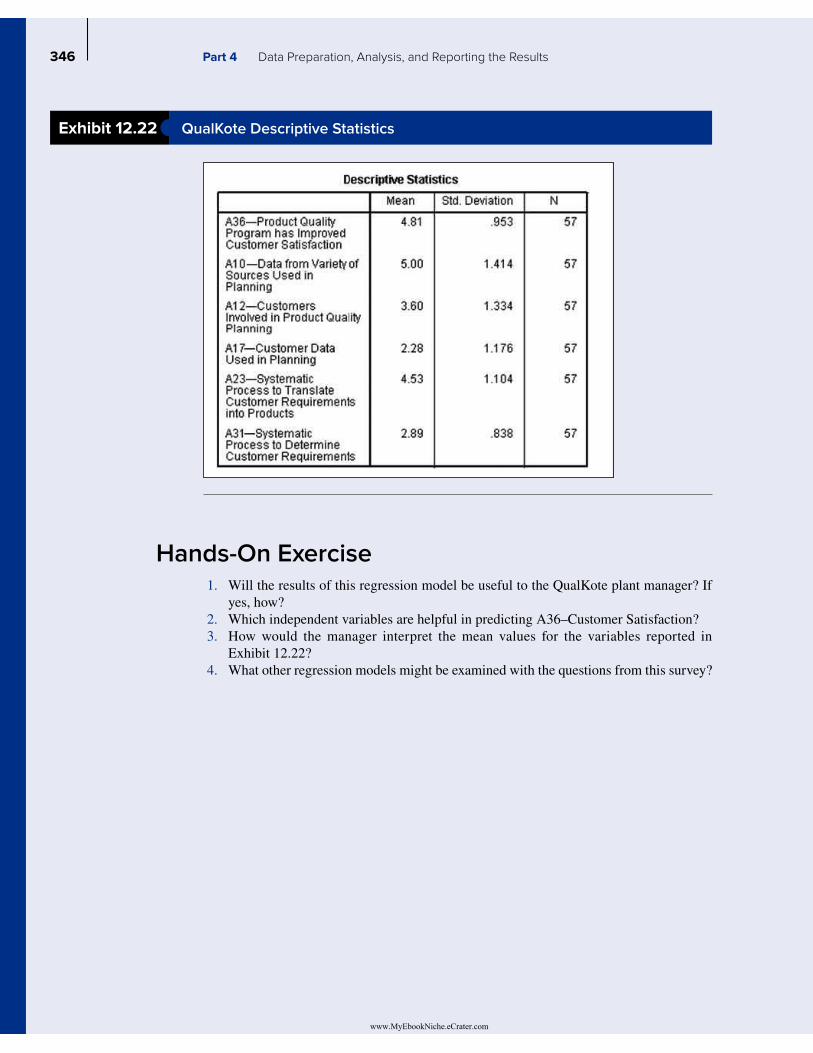
346 Part 4 Data Preparation, Analysis, and Reporting the Results
Hands-On Exercise1. Will the results of this regression model be useful to the QualKote plant manager? If
yes, how?
2. Which independent variables are helpful in predicting A36–Customer Satisfaction?
3. How would the manager interpret the mean values for the variables reported in
Exhibit 12.22?
4. What other regression models might be examined with the questions from this survey?
Exhibit 12.22 QualKote Descriptive Statistics
www.MyEbookNiche.eCrater.com

Chapter 12 Examining Relationships in Quantitative Research 347
Exhibit 12.23 Multiple Regression of QualKote Satisfaction Variables
www.MyEbookNiche.eCrater.com

348 Part 4 Data Preparation, Analysis, and Reporting the Results
Summary
Understand and evaluate the types of relationships
between variables.
Relationships between variables can be described in
several ways, including presence, direction, strength of
association, and type. Presence tells us whether a consis-
tent and systematic relationship exists. Direction tells us
whether the relationship is positive or negative. Strength
of association tells us whether we have a weak or strong
relationship, and the type of relationship is usually
described as either linear or nonlinear.
Two variables may share a linear relationship, in
which changes in one variable are accompanied by some
change (not necessarily the same amount of change) in
the other variable. As long as the amount of change stays
constant over the range of both variables, the relationship
is termed linear. Relationships between two variables
that change in strength and/or direction as the values of
the variables change are referred to as curvilinear.
Explain the concepts of association and covariation.
The terms covariation and association refer to the attempt
to quantify the strength of the relationship between two
variables. Covariation is the amount of change in one vari-
able of interest that is consistently related to change in
another variable under study. The degree of association
is a numerical measure of the strength of the relationship
between two variables. Both these terms refer to linear
relationships.
Discuss the differences between Pearson correlation
and Spearman correlation.
Pearson correlation coefficients are a measure of lin-
ear association between two variables of interest. The
Pearson correlation coefficient is used when both vari-
ables are measured on an interval or ratio scale. When
one or more variables of interest are measured on an
ordinal scale, the Spearman rank order correlation coef-
ficient should be used.
Explain the concept of statistical significance versus
practical significance.
Because some of the procedures involved in determin-
ing the statistical significance of a statistical test include
consideration of the sample size, it is possible to have
a very low degree of association between two variables
show up as statistically significant (i.e., the population
parameter is not equal to zero). However, by considering
the absolute strength of the relationship in addition to
its statistical significance, the researcher is better able to
draw the appropriate conclusion about the data and the
population from which they were selected.
Understand when and how to use regression analysis.
Regression analysis is useful in answering questions
about the strength of a linear relationship between a
dependent variable and one or more independent vari-
ables. The results of a regression analysis indicate the
amount of change in the dependent variable that is
associated with a one-unit change in the independent
variables. In addition, the accuracy of the regression
equation can be evaluated by comparing the predicted
values of the dependent variable to the actual values of
the dependent variable drawn from the sample. When
using regression the assumptions should be checked to
ensure the results are accurate and not distorted by devi-
ations from the assumptions.
Understand the value and application of structural
modeling.
Structural modeling enables researchers to analyze
complex multivariate models. The most appropriate
structural modeling method for marketing research appli-
cations is partial least squares structural equation model-
ing (PLS-SEM). The PLS-SEM method is an extension
of ordinary least squares multiple regression and the sta-
tistical objective is to maximize the variance explained
in the dependent variable(s). The primary advantages of
the method are the ability to examine complex structural
models with three or more stages, to include constructs/
variables measured with several questions, to analyze
data with non-normal distributions, and to obtain solu-
tions with smaller sample sizes.
www.MyEbookNiche.eCrater.com
Chapter 12 Examining Relationships in Quantitative Research 349
Key Terms and Concepts
Beta coefficient 333
Bivariate regression analysis 328
Coefficient of determination (r2) 325
Covariation 319
Curvilinear relationship 318
Homoskedasticity 335
Heteroskedasticity 335
Least squares procedure 329
Linear relationship 318
Model F statistic 334
Multicollinearity 338
Multiple regression analysis 333
Normal curve 335
Ordinary least squares 330
Partial least squares (PLS-SEM) 340
Pearson correlation coefficient 322
Regression coefficient 330
Scatter diagram 319
Spearman rank order correlation coefficient 326
Structural Modeling 339
Unexplained variance 329
Review Questions
1. Explain the difference between testing for significant
differences and testing for association.
2. Explain the difference between association and
causation.
3. What is covariation? How does it differ from
correlation?
4. What are the differences between univariate and bi-
variate statistical techniques?
5. What is regression analysis? When would you use it?
6. What is the difference between simple regression and
multiple regression?
Discussion Questions
1. Regression and correlation analysis both describe the
strength of linear relationships between variables.
Consider the concepts of education and income.
Many people would say these two variables are re-
lated in a linear fashion. As education increases, in-
come usually increases (although not necessarily
at the same rate). Can you think of two variables
that are related in such a way that their relationship
changes over their range of possible values (i.e., in
a curvilinear fashion)? How would you analyze the
relationship between two such variables?
2. Is it possible to conduct a regression analysis on two
variables and obtain a significant regression equation
(significant F-ratio), but still have a low r2? What
does the r2 statistic measure? How can you have a
low r2 yet still get a statistically significant F-ratio for
the overall regression equation?
3. The ordinary least squares (OLS) procedure com-
monly used in regression produces a line of “best fit”
for the data to which it is applied. How would you
define best fit in regression analysis? What is there
about the procedure that guarantees a best fit to the
data? What assumptions about the use of a regression
technique are necessary to produce this result?
4. When multiple independent variables are used to
predict a dependent variable in multiple regression,
multicollinearity among the independent variables is
often a concern. What is the main problem caused by
high multicollinearity among the independent vari-
ables in a multiple regression equation? Can you still
achieve a high r2 for your regression equation if mul-
ticollinearity is present in your data?
5. EXPERIENCE MARKETING RESEARCH.
Choose a retailer that students are likely to patronize
www.MyEbookNiche.eCrater.com

350 Part 4 Data Preparation, Analysis, and Reporting the Results
and that sells in both catalogs and on the Internet (e.g.,
Victoria’s Secret). Prepare a questionnaire that com-
pares the experience of shopping in the catalog with
shopping online. Then ask a sample of students to visit
the website, look at the catalogs you have brought to
class, and then complete the questionnaire. Enter the
data into a software package and assess your finding
statistically. Prepare a report that compares catalog and
online shopping. Be able to defend your conclusions.
6. SPSS EXERCISE. Choose one or two other stu-
dents from your class and form a team. Identify
the different retailers from your community where
wireless phones, digital recorders/players, TVs, and
other electronics products are sold. Team members
should divide up and visit all the different stores
and describe the products and brands that are sold
in each. Also observe the layout in the store, the
store personnel, and the type of advertising the store
uses. In other words, familiarize yourself with each
retailer’s marketing mix. Use your knowledge of the
marketing mix to design a questionnaire. Interview
approximately 100 people who are familiar with all
the retailers you selected and collect their responses.
Analyze the responses using a statistical software
package such as SPSS. Prepare a report of your find-
ings, including whether the perceptions of each of
the stores are similar or different, and particularly
whether the differences are statistically or substan-
tively different. Present your findings in class and be
prepared to defend your conclusions and your use of
statistical techniques.
7. SPSS EXERCISE. Santa Fe Grill owners believe
their employees are happy working for the restaurant
and unlikely to search for another job. Use the Santa
Fe Grill employee database and run a bivariate regres-
sion analysis between X11
–Team Cooperates and
X17
–Likelihood of Searching for another Job to
test this hypothesis. Could this hypothesis be better
examined with multiple regression? If yes, execute a
multiple regression and explain the results.
www.MyEbookNiche.eCrater.com

This page intentionally left blank
www.MyEbookNiche.eCrater.com

Communicating Marketing Research Findings
C h a p t e r 1 3
www.MyEbookNiche.eCrater.com

Learning Objectives After reading this chapter, you will be able to:
1. Understand the objectives of a research report.
2. Describe the format of a marketing research report.
3. Discuss several techniques for graphically displaying research results.
4. Clarify problems encountered in preparing reports.
5. Understand the importance of presentations in marketing research.
It Takes More than Numbers to Communicate
Visual display of data is not easy, and even research experts do not always do it
well. After all, the kinds of people who are good at statistics are not necessarily
the ones who are good at visual presentation. Nevertheless, the ability to present
data visually in a way that is illuminating is important in writing research reports.
The person most known for his expertise in presenting visual data is Profes-
sor Edward Tufte. The author of several books on the topic, including The Dis-
play of Quantitative Information, Professor Tufte hails from the field of political
science, but his advice applies to any field. Business graphics have the same
goals as any other graphics: to convey information, to summarize reasoning,
and to solve problems. Tufte explains the importance of visual displays of data:
“Good design is clear thinking made visible, and bad design is stupidity made
visible. . . . So when you see a display filled with chart junk, there’s a deeper
corruption: they don’t know what they’re talking about.”1
Tufte has implicated poor presentation of statistics and information in the
Challenger disaster. A NASA PowerPoint slide show buried statistics reveal-
ing that rubber O-ring seals in the boosters tended to leak at low temperatures.
The failure of an O-ring ultimately resulted in the death of seven astronauts. Of
course, poor graphic presentations rarely have such dramatic or tragic conse-
quences. However, business opportunities are missed, time is wasted, and audi-
ences are bored.
The New York Times calls Professor Tufte the Leonardo da Vinci of data
presentation. Tufte emphasizes that presenting statistics well is not about creat-
ing slick graphics. “The task is not to have ‘high-impact’ presentations, or ‘point,
click, wow,’ or ‘power pitches.’ The point is to explain something. . . . The right
metaphor for presentations is not power or PowerPoint. . . . It’s not television or
theater. It’s teaching.”2
www.MyEbookNiche.eCrater.com

354 Part 4 Data Preparation, Analysis, and Reporting the Results
Value of Communicating Research Findings
No matter how well research projects are designed and implemented, if the results cannot be
effectively communicated to the client, the project is not a success. While the chapter intro-
duction focuses on presentations, marketing research reports are communicated in writing
as well. An effective marketing research report is one way to ensure the time, effort, and
money that went into the research project will be completely realized. The purpose of this
chapter is to introduce the style and format of the marketing research report. We identify
how the marketing research report is designed and explain the objectives of each section.
We then discuss industry best practices regarding effective presentation of research reports.
Marketing Research Reports
A professional marketing research report has four objectives: (1) to effectively communicate the
findings of the marketing research project; (2) to provide interpretations of those findings in the
form of sound and logical recommendations; (3) to establish the credibility of the research
project; and (4) to serve as a future reference document for strategic or tactical decisions.
The first objective of the research report is to effectively communicate the findings of
the marketing research project. Since a major purpose of the research project is to obtain
information to answer questions about a specific business problem, the report must explain
both how the information was obtained and what relevance it has to the research questions.
A detailed description of the following topics should be communicated to the client:
1. The research objectives
2. The research questions
3. Literature review and relevant secondary data
4. A description of the research methods
5. Findings displayed in tables, graphs, or charts
6. Interpretation and summary of the findings
7. Conclusions and recommendations
In Chapter 9, we explained how to write a qualitative research report. Quantitative
reports include the same general information as do qualitative reports. But some of the
issues faced in developing a research report are different. The objectives and questions in
qualitative research tend to be broader, more general, and more open-ended than in quanti-
tative research. The literature review and relevant secondary data may be integrated in the
analysis of findings in qualitative data analysis, rather than being presented separately from
other findings. The description of research methods in both qualitative and quantitative
research helps to develop credibility for both kinds of research projects, but different kinds
of evidence are offered in developing credibility in quantitative and qualitative analyses.
Data display is important in both methods. Qualitative researchers rarely present statistics,
but they are the bread and butter of a quantitative presentation. Writing conclusions and
recommendations is the final step in both qualitative and quantitative reports.
Too often, quantitative researchers are so concerned about doing statistical analyses they
forget to provide a clear, logical interpretation of their results. Researchers must recognize that
clients are seldom knowledgeable about sampling methods and statistics. Thus, researchers
must present technical or complex information in a manner that is understandable to all par-
ties. Many words used to teach research to students are not necessary in a marketing research
www.MyEbookNiche.eCrater.com

Chapter 13 Communicating Marketing Research Findings 355
report. For example, the word hypothesis seldom appears in a marketing research report.
When Crosstabs, ANOVAs, t-tests, correlation, and regression are used, they are presented
with simplicity and clarity. The name of the analysis technique may not even be used in the
presentation and reporting of results. Most market researchers do not even include informa-
tion about statistical significance in their reports, although we recommend that you do so.
In writing a report, researchers must cross the gap from doing and understanding statis-
tics to communicating findings in a way that is completely understandable to nontechnical
readers. Most researchers are comfortable with statistics, computer outputs, questionnaires,
and other project-related material. In presenting results to the client, researchers should
keep the original research objectives in mind. The task is to focus on the objectives and
communicate how each part of the project is related to the completion of the objectives.
For example, Exhibit 13.1 is from a research presentation that illustrates a research
objective: identifying senior segments with respect to Internet adoption and use. While a
Exhibit 13.1 Findings from Senior Internet Adoption Study
Senior Internet Adoption Segments
Light Use Heavy Use
Demographics Demographics
High income and education, more male High income and education, younger, more male
Self-Directed Values Self-Directed Values
Low curiosity and proactive coping High curiosity and proactive coping
Technology Attitudes/Behavior Technology Attitudes/Behavior
Low technology discomfort Earliest adoption
Medium technology optimism, Low technology discomfort
innovativeness 12% High technology optimism, innovativeness 8%
Demographics Demographics
Medium education and income, more female Medium income and education, more female
Self-Directed Values Self-Directed Values
Medium curiosity and proactive coping High curiosity and proactive coping
Technology Attitudes/Behavior Technology Attitudes/Behavior
Latest adoption High technology discomfort
High technology discomfort High technology optimism, innovativeness 8%
Medium technology optimism,
innovativeness 13%
Demographics
Low income, and education, more female, older
Self-Directed Values
Low curiosity and high proactive coping
Technology Attitudes/Behavior
High technology discomfort, low technology optimism, and low innovativeness
Self
Adoption
20%
Helped
Adoption
21%
Non-
Adopters
59%
www.MyEbookNiche.eCrater.com

356 Part 4 Data Preparation, Analysis, and Reporting the Results
great deal of numerical data was used to prepare the chart, the data have been reduced to
a format that is compact and easy to understand. In this chapter, we show you how to use
graphics to summarize the statistical analyses covered in our text. These graphics can be
used in presentations and in written marketing research reports. Researchers are always
looking for ways to summarize information in a meaningful and compact way. They must
be careful, however, that results are still easy to interpret and they should provide text to
help readers focus on important points. In this chapter, we provide suggestions on how to
present various kinds of analysis graphically. Our exhibits show PowerPoint slides, but the
same graphics can be used as part of a narrative report. There are always multiple ways
to present the same data, and researchers must use their creativity and continually think
about if and how their presentation and/or report makes the points they want to make.
In addition to presenting results in an easy-to-understand fashion, the research report
or presentation must establish credibility for the research methods, findings, and conclu-
sions. This can be accomplished only if the report is accurate, believable, and profession-
ally organized. These three dimensions cannot be treated separately, for they collectively
operate to build credibility in the research document. For the report to be accurate, all of
the input must be accurate. No degree of carelessness in handling data, reporting of sta-
tistics, or incorrect interpretation can be tolerated. Errors in mathematical calculations,
grammatical errors, and incorrect terminology diminish the credibility of the entire report.
Clear and logical thinking, precise expression, and accurate presentation create
believability. When the underlying logic is fuzzy or the presentation imprecise, readers may
have difficulty understanding what they read. If readers do not understand what they read,
they may not believe what they read. It is important to note that whenever findings are sur-
prising, or are different from what the client expects, research analysts can expect to be ques-
tioned. The methodology will be scrutinized to find an explanation that explains away the
surprising findings. Sampling method, question wording, and nonresponse error are some of
the most common ways of explaining away surprising findings. Researchers must anticipate
these questions and have clear explanations for all findings. The accompanying Marketing
Research Dashboard covers the role of critical thinking in reporting marketing research.
Finally, the credibility of the research report is affected by the quality and organization of
the document itself. The report must be clearly developed and professionally organized. The
overall look of the report must not only clearly communicate results, but also convey the profes-
sionalism of the research effort. Also, the document must reflect the preferences and technical
sophistication of the reader. Reports are written to reflect three levels of readers: (1) readers
who will read only the executive summary; (2) readers who will read the executive summary
and look at the body of findings more closely; and (3) readers with some technical expertise,
who may read the entire report and look to the appendix for more detailed information.
It is helpful to prepare an outline of all major points, with supporting details in their
proper position and sequence. The report should have sections that address each of the
research objectives. Use short, concise sentences and paragraphs. Always select wording
consistent with the background and knowledge of readers. Rewrite the report several times.
This will force you to remove clutter and critically evaluate the document for improvements.
The fourth objective of the research report is to be a reference. Most marketing
research studies cover a variety of different objectives and seek to answer several research
questions. This is accomplished in the report using both statistical and narrative formats.
To retain all of this information is virtually impossible for the client. As a result, the
research report becomes a reference document that is reviewed over an extended period.
Many marketing research reports become a part of a larger project conducted in vari-
ous stages over time. It is not uncommon for one marketing research report to serve as
a baseline for additional studies. Also, many reports are used for comparison purposes.
Credibility The quality of a
report that is related to its
accuracy, believability, and
professional organization.
Believability The quality
of a report that is based on
clear and logical thinking,
precise expression, and
accurate presentation.
www.MyEbookNiche.eCrater.com

Chapter 13 Communicating Marketing Research Findings 357
For example, they are used to compare promotional changes, image building tactics, or
even strengths and weaknesses of the firm.
Format of the Marketing Research Report
Every marketing research report is unique in that it is based on the needs of the client, the
research purpose, and the study objectives. Yet all reports contain some common elements.
Although the terminology may differ among industries, the basic format discussed in this
section will help researchers plan and prepare reports for various clients. The parts com-
mon to all marketing research reports are the following:
1. Title page
2. Table of contents
3. Executive summary
a. Research objectives
b. Concise statement of method
c. Summary of key findings
d. Conclusion and recommendations
Critical thinking is the art of analyzing and evaluating think-
ing with a view to improving it. While critical thinking is
important to almost anything we do, it is especially impor-
tant in evaluating and reporting research results. Many
barriers to effective critical thinking have been identified,
and several of these are directly applicable to reporting
research.
Confirmation BiasConfirmation bias exists when researchers interpret the
evidence to fit pre-existing beliefs. Researchers must seek
to find evidence that disproves their preexisting beliefs
in order to avoid falling into this trap. Surprising findings
should be evaluated relative to methodological and sam-
pling choices that might have contributed to the findings.
However, surprising findings should not be rejected or
ignored outright.
Generalizing from SamplesWhen a sample is small or has not been randomly
chosen, researchers must be very careful in making
generalizations. Many samples in marketing research
are not ideal. Even when researchers seek to draw
random samples, they may face challenges in recruit-
ing the sample that result in the sample being biased
in subtle ways. Researchers must always seek to think
about how the sampling method might have affected
their results.
Claiming Causal Relationships between Variables
That Aren’t Really ThereSome facts may be correlated in your data, but the rela-
tionship may be merely a statistical coincidence or the
correlation may be caused by a third variable. To claim
causation, researchers must be sure the appropriate
research design was used.
Wrong ConstructIn evaluating survey results, you may find that a construct is mis-
labeled because the items don’t actually measure what they
claim to measure. Evaluating the reliability and validity of con-
structs is essential to accurate reporting of scientific research.
Methodological BiasesMethodological choices can bring biases with them. For
example, respondents are less forthcoming about some
issues on the telephone as compared to an online survey.
Long surveys may result in respondent fatigue and inaccu-
rate answers. Word choice, graphics usage, and order of
questions can affect responses. Researchers must actively
think about how methodological issues may have
affected their results.
In reporting results and making presentations, research-
ers must apply critical thinking skills to ensure their findings
are presented objectively and accurately. Being sensitive to
the above barriers so they can be overcome, or at least mini-
mized, will help researchers to prepare better presentations.
MARKETING RESEARCH DASHBOARD CRITICAL THINKING AND MARKETING RESEARCH
www.MyEbookNiche.eCrater.com

358 Part 4 Data Preparation, Analysis, and Reporting the Results
4. Introduction
5. Research method and procedures
6. Data analysis and findings
7. Conclusions and recommendations
8. Limitations
9. Appendixes
Title PageThe title page indicates the subject of the report and the name of the recipient, along with
his or her position and organization. Any numbers or phrases to designate a particular
department or division also should be included. Most important, the title page must contain
the name, position, employing organization, address, telephone number of the person or
persons submitting the report, and the date the report is submitted.
Table of ContentsThe table of contents lists the topics of the report in sequential order. Usually, the contents
page will highlight each topical area, the subdivisions within each area, and corresponding
page numbers. It is also common to include tables and figures and the pages where they
can be found.
Executive SummaryThe executive summary is the most important part of the report. Many consider it the
soul of the report, insofar as many executives read only the report summary. The executive
summary presents the major points of the report. It must be complete enough to provide
a true representation of the entire document but in summary form. Make sure your execu-
tive summary can stand alone. The rest of your report supports the key findings included
in the summary, but the overview provided by the executive summary must nevertheless
seem complete. While the executive summary comes near the front of the report, it should
actually be written last. Until all the analyses are done, researchers cannot determine which
findings are most important.
The executive summary has several purposes: (1) to convey how and why the research
was undertaken; (2) to summarize the key findings; and (3) to suggest future actions. In other
words, the executive summary must contain the research objectives, a concise statement of
method, a summary of the findings, and specific conclusions and recommendations.
Research objectives should be as precise as possible, but not longer than approximately
one page. The research purpose along with the questions or hypotheses that guided the project
should also be stated in this section. Exhibit 13.2 shows a PowerPoint slide from a presentation
that summarizes research objectives for a project in which employees’ reactions to their com-
pany’s consumer ads were measured. After explaining the research purpose and objectives, a
brief description of the sampling method, the research design, and any procedural aspects are
addressed in one or two paragraphs. Following this is a statement of key findings.
Exhibit 13.3 shows a slide that summarizes a few of the key findings from a research
project. The findings presented in the summary must agree with those found in the findings
section of the full report. Only key findings that relate to the research objectives should be
included.
Finally, the summary contains a brief statement of conclusions and recommendations.
The conclusion section of the report summarizes your findings. Conclusions concisely
Executive summary The
part of a marketing research
report that presents the
major points; it must be
complete enough to provide
a true representation of the
document but in summary
form.
www.MyEbookNiche.eCrater.com

Chapter 13 Communicating Marketing Research Findings 359
explain research findings and the meaning that can be attached to the findings. Recommen-
dations, in contrast, are for appropriate future actions. Recommendations focus on specific
marketing tactics or strategies the client can use to gain a competitive advantage. Conclu-
sions and recommendations typically are stated in one to two paragraphs.
IntroductionThe introduction contains background information necessary for a complete understanding
of the report. Definition of terms, relevant background information, and the study’s scope
and emphasis are communicated in the introduction. The introduction also lists specific
research objectives and questions the study was designed to answer, as well as hypoth-
eses, length of the study, and any research-related problems. Usually hypotheses are not
stated formally. They are stated in everyday language. For example, a research team can
Introduction Contains
background information
necessary for a complete
understanding of the
report.
Exhibit 13.2 Research Objectives
Research Objectives
Exhibit 13.3 Selected Key Findings from a Research Project
Key Findings
www.MyEbookNiche.eCrater.com

360 Part 4 Data Preparation, Analysis, and Reporting the Results
summarize their hypotheses about the variables they believe will affect senior Internet
adoption as follows: “We expected the following factors to be positively related to senior
adoption: income, education, curiosity, and technology optimism.” Upon reading the intro-
duction, the client should know exactly what the report is about, why the research was con-
ducted, and what relationships exist between the current study and past or future research
endeavors.
Research Methods and ProceduresThe objective of the methods-and-procedures section is to communicate how the research
was conducted. Issues addressed in this section include the following:
1. The research design used: exploratory, descriptive, and/or causal.
2. Types of secondary data included in the study, if any.
3. If primary data were collected, what procedure was used (observation, questionnaire)
and what administration procedures were employed (personal, mail, telephone, Internet)?
4. Sample and sampling processes used. The following issues are usually addressed:
a. How the sample population was defined and profiled.
b. Sampling units used (for example, businesses, households, individuals).
c. The sampling list (if any) used in the study.
d. How the sample size was determined.
e. Was a probability or nonprobability sampling plan employed?
Many times when writing the methods-and-procedures section, the writer gets bogged
down in presenting too much detail. If on completion of this section, the reader can say
what was done, how it was done, and why it was done, the objective of the writer has been
fulfilled. A presentation slide summarizing the methodology used in the senior adoption of
the Internet study appears in Exhibit 13.4.
Methods-and-procedures
section Communicates
how the research was
conducted.
Exhibit 13.4 Slide Summarizing Research Methodology
Research Methodology
O Consortium
CENTER FOR RESEARCH ON INFORMATION TECHNOLOGY AND ORGANIZATIONS
www.MyEbookNiche.eCrater.com
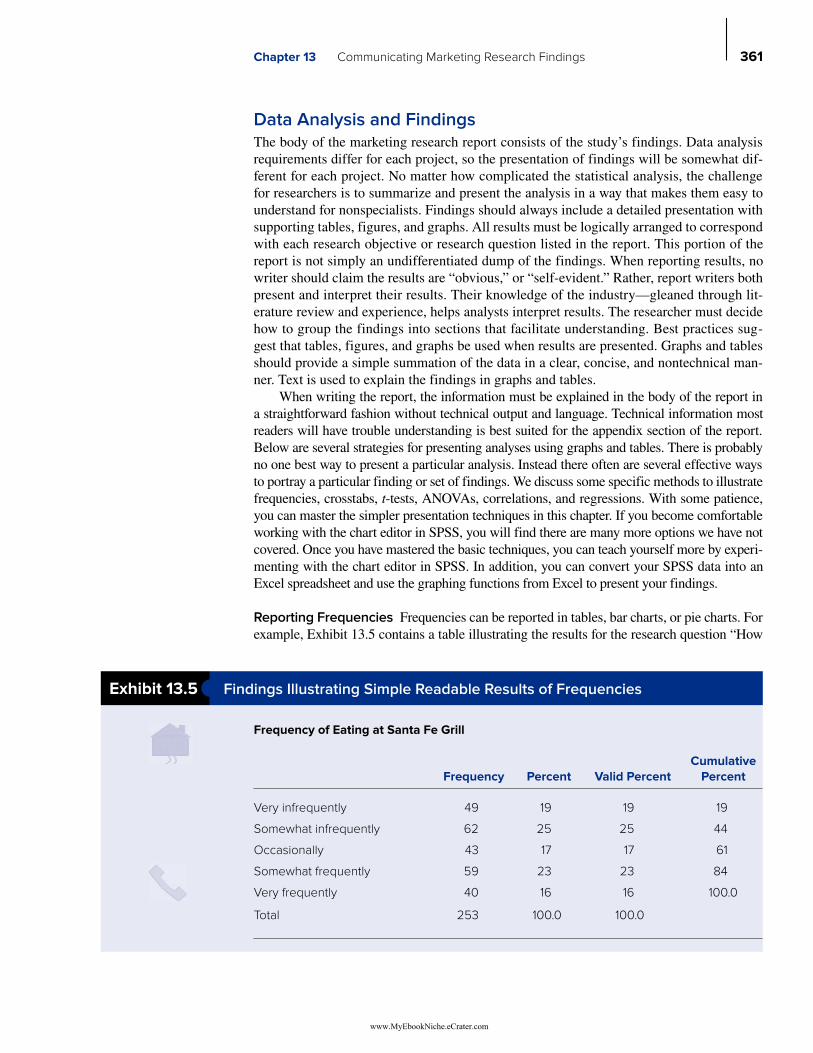
Chapter 13 Communicating Marketing Research Findings 361
Data Analysis and FindingsThe body of the marketing research report consists of the study’s findings. Data analysis
requirements differ for each project, so the presentation of findings will be somewhat dif-
ferent for each project. No matter how complicated the statistical analysis, the challenge
for researchers is to summarize and present the analysis in a way that makes them easy to
understand for nonspecialists. Findings should always include a detailed presentation with
supporting tables, figures, and graphs. All results must be logically arranged to correspond
with each research objective or research question listed in the report. This portion of the
report is not simply an undifferentiated dump of the findings. When reporting results, no
writer should claim the results are “obvious,” or “self-evident.” Rather, report writers both
present and interpret their results. Their knowledge of the industry—gleaned through lit-
erature review and experience, helps analysts interpret results. The researcher must decide
how to group the findings into sections that facilitate understanding. Best practices sug-
gest that tables, figures, and graphs be used when results are presented. Graphs and tables
should provide a simple summation of the data in a clear, concise, and nontechnical man-
ner. Text is used to explain the findings in graphs and tables.
When writing the report, the information must be explained in the body of the report in
a straightforward fashion without technical output and language. Technical information most
readers will have trouble understanding is best suited for the appendix section of the report.
Below are several strategies for presenting analyses using graphs and tables. There is probably
no one best way to present a particular analysis. Instead there often are several effective ways
to portray a particular finding or set of findings. We discuss some specific methods to illustrate
frequencies, crosstabs, t-tests, ANOVAs, correlations, and regressions. With some patience,
you can master the simpler presentation techniques in this chapter. If you become comfortable
working with the chart editor in SPSS, you will find there are many more options we have not
covered. Once you have mastered the basic techniques, you can teach yourself more by experi-
menting with the chart editor in SPSS. In addition, you can convert your SPSS data into an
Excel spreadsheet and use the graphing functions from Excel to present your findings.
Reporting Frequencies Frequencies can be reported in tables, bar charts, or pie charts. For
example, Exhibit 13.5 contains a table illustrating the results for the research question “How
Exhibit 13.5 Findings Illustrating Simple Readable Results of Frequencies
Frequency of Eating at Santa Fe Grill
Cumulative
Frequency Percent Valid Percent Percent
Very infrequently 49 19 19 19
Somewhat infrequently 62 25 25 44
Occasionally 43 17 17 61
Somewhat frequently 59 23 23 84
Very frequently 40 16 16 100.0
Total 253 100.0 100.0
www.MyEbookNiche.eCrater.com

362 Part 4 Data Preparation, Analysis, and Reporting the Results
frequently do you eat at the Santa Fe Grill?” This table illustrates the data output in a simple
and concise manner, enabling the reader to easily view how often respondents eat at the Santa
Fe Grill. Notice that all digits past the decimal point have been removed. This is common
practice in reporting percentages in marketing research. The extra digits create clutter with-
out providing very much information. Moreover, because most research involves sampling
error, carrying percentages out past the decimal point is misleading. Researchers usually
cannot estimate the results with the degree of precision the extra decimal points imply.
Using Bar Charts to Display Frequencies Exhibit 13.6 shows the simplest type of bar
chart that can be made in SPSS. If you are using SPSS version 20 or higher, you will have
to choose “LEGACY DIALOGUES” from the “GRAPH” menu before executing each
command in this chapter.
To make a bar chart, the SPSS click-through sequence is GRAPH → Legacy Dialogues →
BAR. Leave the default on “Simple” and under “Data in chart are,” you also use the default
of “Summaries for groups of cases.” Next click the Define tab to get the screen shown
in Exhibit 13.7. On this screen you will usually want to change the default choice from
“N of cases” to “% of cases.” On the left side of your screen, highlight the name of the vari-
able you want in your bar graph (in this case, the variable is “Major”) and move it across to
the window that says “Category Axis,” and click OK. SPSS will then generate your bar graph.
To make changes to the graph, you double-click the chart in the output, which will
take you to a chart editor. There you will find several options for the chart. Double-clicking
Exhibit 13.6 A Simple Bar Chart
0%
5%
Na
tura
l S
cie
nce
s
an
d M
ath
Ed
uca
tio
n
En
gin
ee
rin
g
Th
e A
rts
He
alt
h a
nd
Hu
ma
n S
erv
ice
s
Bu
sin
ess
Ad
min
istr
ati
on
Lib
era
l A
rts
10%
Pe
rce
nt
15%
Major
20%
25%
30%
www.MyEbookNiche.eCrater.com

Chapter 13 Communicating Marketing Research Findings 363
on any of the elements in your chart brings up the relevant menu for customizing that
particular element. For example, double-clicking on the bars in the chart will bring up a
Properties menu with several tabs. To produce the graph shown in Exhibit 13.6, we chose
the Categories tab on the Properties menu. On the Categories menu, we selected the “sort
by” option and then “statistic/ascending.” This option arranges the graph by lowest percent
to highest percent, which makes the graph easier for readers to understand.
By experimenting with various tabs on the Properties menu, students will find they can
change the color, font, and font size on the graph. It is often desirable to enlarge the font if
the graph will be exported to either Word or PowerPoint. The orientation of the bar labels
can be changed as well. If you click on the bar labels while in the chart editor, the Properties
menu will appear, and one of the tabs will be “Labels and Ticks.” Using this menu, the ori-
entation of labels can be chosen: vertical, horizontal, or staggered. You should experiment
with options until everything on your graph is clear and readable. Then, you can right-click
Exhibit 13.7 Making a Simple Bar Graph in SPSS
www.MyEbookNiche.eCrater.com

364 Part 4 Data Preparation, Analysis, and Reporting the Results
on your finished chart, choose the “copy chart” option, and cut and paste the result to a
Word or PowerPoint document. The finished result is shown in Exhibit 13.6.
Portraying Frequencies Using Pie Charts Pie charts are particularly good at portraying
the relative proportion of response to a question. The process for creating a pie chart is
similar to that used for creating the bar chart. From the SPSS menu, choose GRAPH →
Legacy Dialogues → PIE. A menu will appear with three radio buttons. The default choice
“Summaries for groups of cases” is the correct option for a simple pie chart. Click “De-
fine” and a new menu will appear. On this menu, although “N of cases” is the default op-
tion, in most cases you, will be more interested in reporting percentages, so click the button
next to “% of cases.” Move the variable name from the variable list (in this case V16,
which is labeled “How many ads per day do you pay attention to?”) into the blank next to
“Define Slices by.” Then click OK. SPSS will now create your chart in an output file.
As with the bar chart, when you double-click on the pie chart in the output file, you will
open the chart editor in SPSS. From the toolbar in the editor, you can choose “Elements →
Show Data Labels” and the percentages will be displayed on the pie chart for each slice.
However, remove any extra digits after the decimal place from the percentages displayed in
your chart. You can double-click on the percentages box, which will give you a Properties
menu. Choose the Number Format tab and next to decimal places, enter 0 (see Exhibit 13.8).
Note that if you don’t click in the right place, the Properties menu may not show the appro-
priate tab. If you don’t see the tab you want on the Properties menu, try double-clicking the
relevant part of the chart that you want to change again.
If you spend some time investigating the Options and Properties menus, you will see
that you can make fonts bigger, change the font style, and alter the color and appearance
Exhibit 13.8 Changing the Properties of a Pie Chart in the SPSS Chart Editor
www.MyEbookNiche.eCrater.com

Chapter 13 Communicating Marketing Research Findings 365
of the slices in the pie. When you are done, you can right-click on the chart and copy and
paste it into Word or PowerPoint.
Reporting Means of Thematically Related Variables Researchers may want to report
the means of several thematically related variables in the same chart or table. This can be
accomplished with either a bar chart or a table. A table may be preferred when a researcher
feels that the entire question needs to be portrayed in order to fully understand the findings.
Exhibit 13.9 shows a table that was constructed in PowerPoint using the table function.
The results of the table are based on SPSS output, using the command sequence
Analyze → Descriptive Statistics → Frequencies. A menu will appear, and then you click
the Statistics button near the bottom of that menu. Then choose “Mean” and “Standard
Deviation.” Click OK, and the results will be generated by SPSS.
Note that the items in the table have been ordered from the highest to the lowest aver-
age. Sorting responses in this manner often facilitates reader understanding. There are
two other important elements of the table to note: (1) the maximum value of 7 is clearly
indicated so that readers can easily compare the mean to the maximum possible score and
(2) the mean and standard deviations are shown with only one digit past the decimal.
While percentages should have no decimals past the decimal point, means should generally
display one digit past the decimal point.
It is also possible to portray thematically related means on a bar chart in SPSS. In
order to do so, you begin as you did when portraying one variable by choosing Graphs →
Bar from the toolbar and leaving the default bar chart type “Simple” selected. However,
Exhibit 13.9 A Table Summarizing Means of Thematically Related Items
College Students’ Attitudes towards Advertising
Number of Average 7 = Standard
Item Responses Strongly Agree Deviation
Ads can be a good way to learn about products. 312 5.2 1.5
The purpose of marketing is to attract customers by
learning what they want. 308 5.2 1.5
Advertising is an interesting business. 308 5.2 1.5
Advertising sometimes encourages me to seek out more
information about products I am interested in. 312 5.0 1.5
I think it would be fun to work for an advertising agency. 306 4.5 1.9
Overall, I am satisfied with advertising. 308 4.3 1.3
Advertising is usually designed to sell things that people
don’t really need. 310 4.3 1.8
Advertising appeals to the selfishness in human beings. 303 3.6 1.8
If there was less advertising, the world would be a
better place. 304 3.4 1.7
I try to avoid advertising whenever possible. 304 3.3 1.7
Advertising is bad for society. 310 2.6 1.5
www.MyEbookNiche.eCrater.com

366 Part 4 Data Preparation, Analysis, and Reporting the Results
you will change the default at the bottom of the menu from “Summaries of groups of
cases” to “Summaries of separate variables.” Then click “Define.” From there, move the
variables you want in the graph from the variable list on the left into the window labeled
“Bars Represent” (see Exhibit 13.10). The default is “Mean” so you will not have to change
any options. Once you click OK, the bar graph will be created. When you double-click on
the bar chart in the output, this will take you to the chart editor. As we explained previously
in the chapter, you can double-click elements within the chart and change the properties
and the appearance of the bar chart. Exhibit 13.11 shows a finished image that has been cut
and pasted to a PowerPoint slide. An interpretation has been added to the slide to facilitate
reader comprehension.
Reporting Crosstabs (Bar Charts) The bar chart function in SPSS can be used to dis-
play Crosstabs. Once again, you can start with Graphs → Bar → Summaries for groups of
cases. From there, choose “Cluster” rather than the default option “Simple” and click
“Define.” Under “Bars Represent,” choose “% of cases.” Your independent or predictor
Exhibit 13.10 Using the Bar Chart Function in SPSS to Summarize Thematically Related Means
www.MyEbookNiche.eCrater.com

Chapter 13 Communicating Marketing Research Findings 367
variable should be entered in the “Category Axis” blank. In this case, gender is the inde-
pendent variable. The variable you are explaining, in this case, liking of the Carl’s Jr. Paris
Hilton ad, is entered into the “Define Clusters” blank (see Exhibit 13.12). Then click OK,
and the Crosstab bar chart will be created. As with the other charts, you can double-click
on the graph to bring up the chart editor.
Because this particular Crosstab crosses only two categories by two categories, we
excluded the bars representing “don’t like” from the graph. This is because in a 2 × 2,
once you know the values for one category, the other category is completely defined (the
two categories must add to 100 percent). Removing a category is straightforward. You can
double-click on any of the bars in the graph. This will bring up the Properties menu. One
of the tabs will be “Categories.” You will see the categories displayed on the menu. If you
click on the category you want to exclude (in this case, “Don’t Like”), and then click the
red X button next to the box labeled “Order,” the label will be moved to the box below
under “Excluded.” Click “Apply” and your Crosstab will now display only one category of
the outcome variable, in this case the percentage of respondents within each sex who liked
the Carl’s Jr. Paris Hilton ad. The resulting graph is displayed in Exhibit 13.13.
Reporting t-Tests and ANOVAs (Bar Charts) Exhibit 13.14 shows a table created in
PowerPoint with information from SPSS output that pictures the results of five different
t-tests that are thematically related. Each t-test compares outcome measures for two groups:
men and women. The average for each gender for each variable appears in the cells. Again,
significant p-values are indicated.
Exhibit 13.11 A Bar Chart Displaying Multiple Thematically Related Means
1
2
Inte
rne
t a
ds
Dir
ect
ma
il
Mo
vie
ad
s
Ra
dio
ad
s
TV
ad
s
Ma
ga
zin
e a
ds
Ye
llow
pa
ge
s
Ne
wsp
ap
er
ad
s
3
Me
an
How Much Do You Trust Ads in these Media?
4
5
6
7
Ads in newspapers and yellow pages,
which tend to be the most informative
ads, are the most trusted.
2.93.3
3.7 3.9 4.0 4.04.4
4.7
www.MyEbookNiche.eCrater.com

368 Part 4 Data Preparation, Analysis, and Reporting the Results
Both t-tests and ANOVAs can be displayed on bar charts created in SPSS. Our example
will focus on using the bar charts for an ANOVA, but the command sequence within SPSS
is the same. Start with Graphs → Bar → Simple. Leave the box chosen next to “Summaries
are groups of cases,” and click “Define.” On the next screen (pictured in Exhibit 13.15),
under “Bars Represent,” choose “other” and enter the outcome variable (in this case,
“Liking for Touching/Emotional” ads) into the blank under “Variable.” For “Category
Axis,” enter the independent variable (in this case “Major”). Then click OK and the graph
will be produced. Using “Options” we added a title and a footnote to the graph. Click
on the y-axis, which shows the scale that we used in the survey, and you get the Proper-
ties menu along with a tab labeled “Scale.” In that menu, we changed the minimum to
1 and the maximum to 7 (the endpoints in the actual scale). SPSS will often change the
scale points represented to maximize the space in the chart, but the resulting default
chart may distort your findings. In many cases, you will want to change the axis to show
the actual endpoints of your scale. A footnote shows an ANOVA analysis performed
to examine the significance of categorical differences. The final graph is displayed in
Exhibit 13.16.
Exhibit 13.12 Using the SPSS Bar Chart Function to Portray Crosstabs
www.MyEbookNiche.eCrater.com

Chapter 13 Communicating Marketing Research Findings 369
Exhibit 13.13 Bar Chart Portraying a Crosstab
Percentage of Men and Women Who Like Paris Hilton’s Carl’s Junior Ad
0%
Male
Note: p < .05
Female
20%
Pe
rce
nt
40%
Sex
60%
80%Almost twice as many men as women
reported liking the Carl’s Junior ad
that featured Paris Hilton.
66%
34%
Ad Element Mean (max=7)
Informational Male 4.3*
Female 4.8
Humorous Male 5.8
Female 6.0
Touching/ Male 4.0*
Emotional Female 4.8
Sex appeal Male 5.5*
Female 4.7
Ads with attractive models Male 5.4*
Female 4.5
Colorful ads Male 4.3*
Female 5.0
Women are more likely than men to say that informational, emotional, and colorful ads are
effective. Men are more likely to say that sex appeals and attractive models are effective in
advertising. Men and women rate the effectiveness of humor similarly.
*p<.05
What Kind of Ads are Effective?
Exhibit 13.14 A Table Showing t-Tests
www.MyEbookNiche.eCrater.com

370 Part 4 Data Preparation, Analysis, and Reporting the Results
Reporting Correlation and Regression Correlations may be included in a report to il-
lustrate relationships between several variables that are later used in a regression or to
show the relationship of several variables to an outcome variable of interest. Exhibit 13.17
is a table showing the correlation of several variables with overall satisfaction for a retailer
named Primal Elements. To facilitate comparison of the sizes of the correlations, they are
arranged from strongest to mildest. Note that the negative correlation is sorted by its
strength because the negative value indicates the direction of the relationship only. The
Exhibit 13.15 Using SPSS to Create Bar Charts to Display ANOVA Results
www.MyEbookNiche.eCrater.com

Chapter 13 Communicating Marketing Research Findings 371
significance levels are once again indicated with a star. The sample size is included on the
graph in the footnote if the sample size used in the correlation analysis is different from the
overall sample size reported in the methodology section of the report. The interpretation of
the table is not included in the exhibit, but accompanying text would explain the strong role
Exhibit 13.16 Bar Chart Portraying ANOVA Results
1
2
Th
e A
rts
Bu
sin
ess
Ad
min
istr
ati
on
Ed
uca
tio
n
En
gin
ee
rin
g
He
alt
h a
nd
Hu
ma
n
Se
rvic
es
Lib
era
l A
rts
Na
tura
l S
cie
nce
s
an
d M
ath
em
ati
cs
3
Average Liking for Touching/Emotional Ads by Major*
4
5
6
7
4.34.7 4.9
3.6
4.5 4.5 4.3
*p < .05 for comparison between Engineering and all other majors.
Exhibit 13.17 Correlations of Item Ratings with Overall Satisfaction with Primal Elements
Item Correlation
Store atmosphere .59*
How intimidating the store is −.30*
Expense of products −.25*
Interior appearance of store 25*
Quantity of information workers provide about products .21*
Exterior appearance of store .16
*p<.05, N = 94. Correlations vary in strength from −1 to +1 with 0 meaning “no relationship.”
www.MyEbookNiche.eCrater.com

372 Part 4 Data Preparation, Analysis, and Reporting the Results
of perceptions of store atmosphere in satisfaction and may focus as well on the milder
effects of other variables.
Recall that regression is a multivariate technique that estimates the impact of
multiple explanatory or independent variables on one dependent variable. One of
the simplest ways to present regression findings is to create a diagram in Word or in
PowerPoint that pictures the predictor and the outcome variables with arrows show-
ing the relationships between the variables (see Exhibit 13.18). These diagrams were
referred to as conceptual models in Chapter 3. The title of the analysis clearly describes
the picture (“Predictors of Satisfaction with Marketing”). The standardized betas are
portrayed above the appropriate arrow because the beta shows the strength of the rela-
tionship between the independent and dependent variables. As in the other pictured
analyses, a star may be used to indicate statistical significance. The R2 (.27) appears in
the diagram; the three variables together explain 27 percent of the variance in attitudes
toward marketing. The text summarizes the information provided by the regression
analysis in the picture.
Conclusions and RecommendationsConclusions and recommendations are derived specifically from the findings. As illus-
trated in Exhibit 13.19, conclusions are descriptive statements generalizing the results, not
necessarily the numbers generated by statistical analysis. Each conclusion directly refer-
ences research objectives.
Recommendations are generated by critical thinking. The task is one where the
researcher must critically evaluate each conclusion and develop specific areas of applications
Exhibit 13.18 Displaying Regression Findings
Predictors of Satisfaction with
Marketing
Consumer
Innovativeness
Beliefs about
Advertising’s
Negative impacts
Interest in
Advertising as a
Business
Marketing
Satisfaction
.29*
–.20*
.30*
R2 = .27, *p < .01
Respondents who like to be the first to shop for and
buy new products and who think advertising is an
interesting business are more satisfied with marketing.
Respondents who believe that advertising can have
negative impacts on consumers and society are less
likely to be satisfied with marketing.
www.MyEbookNiche.eCrater.com

Chapter 13 Communicating Marketing Research Findings 373
for strategic or tactical actions. Recommendations must address how the client can solve the
problem at hand through the creation of a competitive advantage.
Exhibit 13.20 outlines the recommendations that correspond to the conclusions dis-
played in Exhibit 13.19. You will notice each recommendation, unlike the conclusion, is in
the form of a clear action statement.
Exhibit 13.19 Illustration of Conclusions in a Marketing Research Presentation
Conclusions
Four primary factors are related to satisfaction with and eating at the Santa Fe Grill—food
quality, service, value, and atmosphere.
Food quality is the most important factor influencing satisfaction with and eating at the Santa
Fe Grill.
Service at the Santa Fe Grill is the second-most important factor influencing satisfaction
with and eating at the restaurant.
Perceptions of the Santa Fe Grill food quality and service are favorable.
Perceptions of value and atmosphere are relatively less favorable.
Perceptions of the Santa Fe Grill on all four factors—food, service, value, and
atmosphere—are significantly less favorable for the less frequent patrons.
Perceptions of the Santa Fe Grill on two factors—food and service—are significantly less
favorable than they are for Jose’s Southwestern Café.
More frequent patrons of the Santa Fe Grill have lifestyles that characterize them as
Innovators and Influencers.
Employees of Santa Fe Grill do not evaluate their team coworkers very favorably.
Exhibit 13.20 Illustration of Recommendations in a Marketing Research Presentation
Recommendations
Advertising messages should emphasize food quality and service since these are the
most important factors influencing satisfaction.
If advertisements include people, they should be characterized as innovative in their
lifestyles.
Focus group research needs to be conducted to learn why perceptions of value and
atmosphere are less favorable than perceptions of food quality and service.
The focus group research also needs to examine why perceptions of less frequent patrons
of the Santa Fe Grill are significantly less favorable than those of more frequent patrons.
The current study collected data from customers of the Santa Fe Grill and Jose’s
Southwestern Café. In the future, data should be collected from noncustomers.
Focus group research needs to be conducted to learn why employees are not very
favorable about their coworkers.
www.MyEbookNiche.eCrater.com

374 Part 4 Data Preparation, Analysis, and Reporting the Results
LimitationsResearchers always strive to develop and implement a flawless study for the client. But all
research has limitations. Researchers must note the limitations of a project, and speculate
intelligently about if and how the limitations may have affected their conclusions. Com-
mon limitations associated with marketing research include sampling bias, financial con-
straints, time pressures, and measurement error.
Every study has limitations, and the researcher has to make the client aware of them.
Researchers should not be embarrassed by limitations but rather admit openly that they
exist. However, limitations should not be stated in a way that undermines the credibility of
the entire project. Researcher reports address limitations, but do so in a way that develops
reasonable confidence in the conclusions made in the report. Treatment of limitations in
the research report usually involves a discussion of results and accuracy. For example,
researchers should tell clients about the generalizability of the results beyond the sample
used in the study. Any weaknesses in specific scales should be addressed, along with other
potential sources of nonsampling error. If limitations are not stated and are later discovered
by the client, mistrust and skepticism toward the entire report may result. When properly
reported, limitations rarely diminish the credibility of the report but instead improve client
perceptions of the quality of the project.
AppendixesAn appendix, many times referred to as a “technical appendix,” contains complex, detailed,
or technical information not necessary for the formal report. Common items contained in
appendixes include the questionnaire or data collection instrument used for the research
project, interviewer forms, statistical calculations, and detailed sampling maps. Researchers
know the appendix is rarely read in the same context as the report itself. In fact, most appen-
dixes are treated as points of reference in the report. That is, information in the appendix is
cited in the report to guide the reader to further technical or statistical detail.
Common Problems in Preparing the Marketing Research Report
Industry’s best practices suggest five problem areas that may arise in writing a marketing
research report:
1. Lack of data interpretation. In some instances, researchers get so involved in con-
structing results tables that they fail to provide proper interpretation of the data in the
tables. The researcher always provides unbiased interpretation of any findings.
2. Unnecessary use of complex statistics. To impress clients, many researchers unneces-
sarily use sophisticated multivariate statistical techniques. In many research reports,
the most sophisticated statistical technique required will be a Chi-square test. Avoid
using statistical methods unless they are essential to derive meaning from the data.
3. Emphasis on packaging instead of quality. Many researchers go out of their way to
make reports look classy or flamboyant using sophisticated computer-generated graph-
ics. While professional graphic representation of the results is essential in the report,
never lose sight of the primary purpose—to provide valid and credible information to
the client.
Limitations Weaknesses in
research methodology that
might affect confidence in
research conclusions.
Appendix A section
following the main body of
the report; used to house
complex, detailed, or
technical information.
www.MyEbookNiche.eCrater.com

Chapter 13 Communicating Marketing Research Findings 375
4. Lack of relevance. Reporting data, statistics, and information that are not consistent with
the study’s objectives can be a major problem when writing the report. Always develop
the report with the research objectives clearly in focus. Avoid adding unnecessary infor-
mation just to make the report longer. Always remain in the realm of practicality. Sug-
gest ideas that are relevant, doable, and consistent with the results of the study.
5. Placing too much emphasis on a few statistics. Never base all conclusions or recom-
mendations on one or a few statistically significant questions or results, but on the
weight of evidence from your literature review, secondary data, and the pattern of
results in your entire report. Always attempt to find substantial supporting evidence
for any recommendation or conclusion.
The final research document is the end product of the researcher. Individual credibility
can be enhanced or damaged by the report, and credibility is what helps a researcher gain
repeat business and referrals from clients. The quality, dedication, and honesty one places into
the report have the potential to generate future business, career promotions, and salary raises.
The Critical Nature of Presentations
Presentation of marketing research results can be as important as, if not more important
than, the results of the research itself. This is true for several reasons. First, any research,
no matter how well done or how important, cannot be properly acted upon if the results are
not effectively communicated to those who will use the information in making decisions.
Managers need accurate information if they are going to make good decisions, and if they
do not understand the marketing research findings, they may well make poor decisions that
lead to difficulty not only for the organization but also for individuals in the organization
affected by those decisions. Second, the report or presentation is often the only part of the
marketing research project that will be seen by those commissioning the report. Senior
managers often do not have the time to review all aspects of a research project, so they rely
on the researcher to carry out the research properly and then present the findings clearly
and concisely. Third, the content and presentation form of the research are closely inter-
twined. Poorly organized presentations presented in an unclear, lengthy, difficult-to-access
format often lead audiences to discount the content.
Guidelines for Preparing Oral PresentationsIn almost all situations, the results of marketing research must be presented in a well-
documented written report, and summarized in an effective oral presentation to the client.
The primary goal of the oral presentation is to condense complex research-oriented informa-
tion (sampling concepts, statistics, graphs, figures, etc.) into an interesting, informative, and
conclusive discussion. Effectively communicating marketing research information is more
of an art than a science—an art associated with being a dynamic and credible communica-
tor. A few simple best practices can be very helpful in providing a professional presentation:
1. Don’t let the visual component of the presentation detract from the information being
communicated. Keep the visual presentation simple and avoid flamboyant graphics
and unnecessary audio.
2. Always be friendly, honest, warm, and open in your oral communication. Being too
formal, stuffy, or overbearing can lead to a lack of interest in your discussion.
www.MyEbookNiche.eCrater.com

376 Part 4 Data Preparation, Analysis, and Reporting the Results
3. Be knowledgeable and confident in your delivery. If necessary, have experts avail-
able (research analysts, statisticians, technicians) to complement or facilitate your
presentation.
4. Have a well-organized and inspiring dialogue prepared. Practice your presentation
with others in your research team, as well as mentally in front of a mirror (or recording
device) before you make the presentation to the client.
5. Be an effective active listener. Understand questions and comments arising from the
audience. If no questions or comments are being posed within the first five minutes of
the presentation, open up the discussion for questions.
Guidelines for Preparing the Visual PresentationThe visual presentation is a separate but equally important component of the marketing
research report. The visual presentation has one primary goal: to provide a visual summary
of the marketing research report, designed in a manner that will complement and enhance
oral communication of the written marketing research report.
In many cases, Microsoft PowerPoint is the preferred method of preparing the visual
marketing research presentation. Given the versatility of PowerPoint, the visual presen-
tation may employ graphics as simple as those in this chapter. But these presentations
may also employ a full multimedia array of techniques, including sound, animation, color
graphics, and video. Regardless of the complexity of the presentation, industry practices
suggest the following guidelines:
1. Begin with a slide showing the title of the presentation and the individual(s) doing the
presentation. In addition, the client and the marketing research firm should also be
identified.
2. A sequence of slides should be developed indicating the objectives of the research and
the specific research questions to be addressed, followed by the research methodology
employed and a description of the sample surveyed.
3. Additional slides should be developed that highlight the research findings or partic-
ular results of the study which the researcher deems important for communication
purposes.
4. Finally, the presentation should conclude with recommendations, conclusions, and re-
search implications as they pertain to the study at hand.
www.MyEbookNiche.eCrater.com

Chapter 13 Communicating Marketing Research Findings 377
MARKETING RESEARCH IN ACTIONWho Are the Early Adopters of Technology?
The latest digital recorder/players do a lot more than just record material. The latest
devices include hard drives and programming guides with lots of functionality. Stand-
alone digital devices use the same access and storage technology as PCs, but in addition
they provide a home theater platform. The devices have menus that let you easily jump to
a specific point within a recording and multiple shows over an extended period of time
can be recorded.
The recording and storage market is large and rapidly getting much larger. No lon-
ger limited to home entertainment playback boxes, it is being combined with increasing
numbers of consumer electronics products: computers, wireless phones and other portable
devices, appliances, and industrial systems.
DVDs hit the market in the late 1990s and enjoyed very fast growth. Indeed, the DVD
market experienced the most rapid rise of any consumer electronics technology ever intro-
duced. The total annual market for all types of digital recorder/player systems (players,
recorders, set-tops, PCs) is expected to exceed 700 million units in 2012. But shipments
of Blu-ray devices are starting to account for a significant portion of the disc player and
recorder market and are expected to outsell DVD players by 2015, when sales of Blu-ray
player unit shipments are expected to reach 105 million.
Digital player/recorders have caught the imagination and interest of consumers. Set-
top boxes boomed in sales due not only to their functionality, but also to their rapidly
falling prices. The average selling price fell from about $500 in 1998 to less than $100 in
major retail outlets in 2012, with some units selling for as low as $35.
Two of the biggest challenges of electronics marketers are (1) the successful introduc-
tion of new technology-based product innovations into consumer markets and (2) stimu-
lating the diffusion of those innovations to profitable penetration levels. To meet these
challenges, researchers must gain clearer insights into the key factors consumers use in
deciding whether to adopt technology innovations in consumer electronics.
Researchers recently completed a study to investigate opinions of potential purchasers
of digital recorder/player devices. The study compares the innovator and early adopter seg-
ments with regard to product usage, digital device purchase likelihood, demographics, and
related issues. The primary questions addressed were: “Are there attitudinal and behavioral
differences between consumers who are innovators versus those who are early adopters?”
and “Can these differences be systematically associated with purchase likelihood of digital
recorder/players?”
Using an Internet panel, data were collected from a sample of 200 individuals. The sample
frame was consumers with annual household incomes $20,000 or more and ages 18 to 35 years.
Data were collected over a two-week period. Participants had to be living in North America
because the market study was limited to this geographic area. The questionnaire included
questions about innovativeness, lifestyle, product, and brand image. Some of the questions
employed interval level measures while others were nominal and ordinal. There is a database
for the questions which is available in SPSS format at www.mhhe.com/hairessentials3e.
The database is labeled Digital Recorder Survey MRIA 3e.sav. A copy of the questionnaire
is provided in Exhibit 13.21.
www.MyEbookNiche.eCrater.com

378 Part 4 Data Preparation, Analysis, and Reporting the Results
Exhibit 13.21 Questionnaire for Electronics Products Opinion Survey
This is a project being conducted by a marketing research class at the University of Oklahoma.
The purpose of this project is to better understand the attitudes and opinions of consumers
toward electronics products. The questionnaire will take only a few minutes to complete, and all
responses will remain strictly confidential. Thank you for your help on this project.
I. Attitudes
The following questions relate to your attitudes about shopping for electronics products. On
a scale of 1 to 7, with 7 being Strongly Agree and 1 being Strongly Disagree, please circle the
number that best expresses your degree of agreement with each of the following statements.
Strongly Strongly
Disagree Agree
1. The Internet is a good place
to get lower prices. 1 2 3 4 5 6 7
2. I don’t shop for specials. 1 2 3 4 5 6 7
3. People come to me for advice. 1 2 3 4 5 6 7
4. I often try new brands before my
friends and neighbors. 1 2 3 4 5 6 7
5. I would like to take a trip around
the world. 1 2 3 4 5 6 7
6. My friends and neighbors come to me
for advice and consultation. 1 2 3 4 5 6 7
7. Coupons are a good way to save money. 1 2 3 4 5 6 7
8. I seldom look for the lowest price
when I shop. 1 2 3 4 5 6 7
9. I like to try new and different things. 1 2 3 4 5 6 7
10. To what extent do you believe you need a DVD player?
Please indicate on the scale provided below:
Product I Definitely Product I Definitely
Do Not Need Need
1 2 3 4 5 6 7
11. How likely are you to purchase a digital recorder/player in the next year? Please indicate
whether you are moderately likely or highly likely to purchase a digital recorder/player.
(Note: Respondents who were not likely to purchase a digital recorder/player were
screened out of the survey.)
6 = Moderately Likely
7 = Highly Likely
II. Classification Information
Please tell us a little about yourself. We use the data for classification purposes only.
12. What is the highest level of education you have attained? (Check only ONE.)
a. __ High school graduate
b. __ College graduate
www.MyEbookNiche.eCrater.com

Chapter 13 Communicating Marketing Research Findings 379
Exhibit 13.21 continued
13. Electronics Products Ownership. Please indicate the level of electronics products
ownership that best describes you.
a. __ Own few electronics products.
b. __ Own a moderate number of electronics products.
c. __ Own many electronics products.
14. Please check the category that best indicates your total annual household income
before taxes. (Check only ONE.)
a. __ $20,000–$35,000
b. __ $35,001–$50,000
c. __ $50,001–$75,000
d. __ $75,001–$100,000
e. __ More than $100,000
THANK YOU FOR SHARING YOUR OPINIONS WITH OUR MARKETING RESEARCH CLASS.
To begin the analysis, researchers classified respondents as innovators or early adopters.
The Innovativeness scale consisted of five variables: x3, x4, x5, x6, and x9. Cluster analysis
was utilized to identify respondents who rated themselves higher (more innovative) on these
five scales. The analysis produced 137 Innovators and 63 Early Adopters. This categorical
variable (x14) was then used to learn more about the respondents. The initial variables we
examine here are x10–Digital recorder/player Product Perceptions, x11– Purchase Likeli-
hood, and x16–Price Consciousness. The results are shown in Exhibit 13.22.
All of the comparisons are significantly different. Looking first at variable x10, the
mean value for innovators is larger than for early adopters (5.5 vs. 3.2). This indicates that
innovators believe they need a digital recorder/player much more than do early adopters.
A similar finding is true for variable x11–Purchase Likelihood (coded 1 = highly likely
and 0 = moderately likely). The higher mean value for innovators (.8 vs .1) indicates they
are much more likely to purchase a digital recorder/player. Finally, looking at x16–Price
Exhibit 13.22 Comparison of Innovators and Adopters
Group N Mean Sig.
x10—Digital recorder/Player 0 = Early Adopters 63 3.2
Perceptions 1 = Innovators 137 5.5
Total 200 4.7 .00
x11—Purchase Likelihood 0 = Early Adopters 63 .1
1 = Innovators 137 .8
Total 200 .6 .00
x16—Price Conscious 0 = Early Adopters 63 .6
1 = Innovators 137 .4
Total 200 .5 .01
www.MyEbookNiche.eCrater.com

380 Part 4 Data Preparation, Analysis, and Reporting the Results
Conscious we see that innovators are less price conscious than are early adopters (.4 vs .6;
coded 1 = more price conscious and 0 = less price conscious).
This study suggests that digital recorder/players have left the innovation stage of the
diffusion process and are making inroads into the early adopter phase, and beyond. But
digital recorder/player manufacturers and retail marketers alike must continue to develop
strategies that attract more potential early adopters as well as create awareness and desire
among the early majority.
Hands-On Exercise1. What other issues can be examined with this survey?
2. What problems do you see with the questionnaire?
3. What are the important topics to include in a presentation of the findings?
Summary
Understand the objectives of a research report.
The key objective of a marketing research report is to
provide the client with a clear, concise interpretation
of the research project. The research report is a culmi-
nation of the entire study and therefore must commu-
nicate the systematic manner in which the study was
designed and implemented. Secondary objectives of
the report are to provide accurate, credible, easy-to-
understand information to the client. The end result of
the report is its ability to act as a reference document
to guide future research and serve as an information
source.
Describe the format of a marketing research report.
The research report generally includes the following: a
title page, a table of contents, and an executive summary,
which includes a statement of the research objectives,
a detailed statement of the research method and proce-
dures, a brief statement of findings, and conclusions and
recommendations. Following the executive summary are
the introduction of the report, a description of the meth-
odology employed, and a discussion of data analysis
techniques and findings. The final elements are conclu-
sions and recommendations, and a description of limita-
tions. An appendix may include technical explanations
or documentation.
Discuss several techniques for graphically displaying
research results.
A vast array of graphic techniques is available to display
research results. A variety of bar charts can be used to dis-
play analyses from simple frequencies to Crosstabs, t-tests
and ANOVA. As well, pie charts can be used to display the
results of frequencies. Tables are especially helpful for por-
traying related results, including means, t-tests, and corre-
lations. Conceptual models showing relationships between
variables are often used to portray regression results.
Clarify problems encountered in preparing reports.
Problem areas that may arise in the preparation of
the research report are (1) lack of data interpretation,
(2) unnecessary use of multivariate statistics, (3) empha-
sis on packaging rather than quality, (4) lack of rel-
evance, and (5) placing too much emphasis on a few
statistical outcomes.
Understand the importance of presentations in mar-
keting research.
Presentations are important because research results
must be effectively communicated to those seeking to
use the information in decision making. The report or
presentation may be the only part of the research project
that will be seen by those commissioning the report. The
content of the research and the presentation form of the
research are closely intertwined.
www.MyEbookNiche.eCrater.com

Chapter 13 Communicating Marketing Research Findings 381
Key Terms and Concepts
Appendix 374
Believability 356
Credibility 356
Executive summary 358
Introduction 359
Limitations 374
Methods-and-procedures section 360
Review Questions
1. What are the seven components of the marketing re-
search report? Briefly discuss each component and
why it is important.
2. In the context of the marketing research report, what
is the primary goal of the executive summary?
3. What are the primary topics/issues that need to be ad-
dressed in the research methods-and-procedures sec-
tion of a marketing research report?
4. Why are conclusions and recommendations included
in a marketing research report?
5. What are the common problems associated with the
marketing research report?
6. Why is it important to explain limitations in your
marketing research report?
Discussion Questions
1. EXPERIENCE MARKETING RESEARCH. Go to
the following website: www.microsoft.com/Education
/Tutorials.aspx. Complete the Tutorials dialog box
by typing in “higher education” in the Grade Level
box, “technology” in the Learning Area box, and
“PowerPoint” in the Product box. After selecting and
completing the tutorial, provide written comments on
the benefits you received by taking this tutorial.
2. Select the Santa Fe Grill data or one of the other
data bases provided with this text (see Deli Depot;
Remington’s; QualKote; or Digital Recorder Survey
on the website), analyze the data using the appropri-
ate statistical techniques, prepare a PowerPoint pre-
sentation of your findings, and make the presentation
to your research class.
a. Select an appropriate variable from the data set
and prepare a simple bar chart of the findings
in SPSS.
b. Select an appropriate variable from the data set
and prepare a simple pie chart of the findings
in SPSS.
c. Select a group of thematically related items that
are on metric scales. Present the results in a table
and also in a bar chart using SPSS.
d. Find two categorical items that are appropriate for
a Crosstab and present your results in a bar chart
made with SPSS.
e. Find a categorical independent variable and inter-
val level dependent variable. Present the results in
a bar chart made with SPSS.
f. Choose an outcome variable that can be explained
by two or more independent variables. Run a
regression and then develop a diagram (using
PowerPoint or Word) that displays your findings.
3. There are several PowerPoint presentations for the
Santa Fe Grill Restaurant study on the book’s web-
site at http://connect.mheducation.com. The pres-
entations demonstrate how findings of a statistical
analysis of data from a survey can be reported. Re-
view the presentations and select the one you believe
most effectively communicates the findings. Justify
your choice.
www.MyEbookNiche.eCrater.com

382
Glossary
AAbility to Participate The ability
of both the interviewer and the
respondent to get together in a
question-and-answer interchange.
Alpha Factor The desired or
acceptable amount of difference
between the expected and the actual
population parameter values; also
referred to as the tolerance level of
error.
Alternative Hypothesis A state-
ment that is the opposite of the null
hypothesis, where the difference in
reality is not simply due to random
error.
Analysis of Variance (ANOVA) A
statistical technique that deter-
mines whether two or more means
are statistically different from each
other.
Appendix A section at the end of
the final research report used to
house complex, detailed, or tech-
nical information.
Archives Secondary sources of
recorded past behaviors and trends.
Area Sampling A form of cluster
sampling where clusters are formed
by geographic designations such as
cities, subdivisions, and blocks.
Any geographic unit with boundar-
ies can be used, with one-step or
two-step approaches.
Assignment Property The
employment of unique descriptors
to identify each object in a set.
Availability of Information The
degree to which the information
has already been collected and
assembled in some type of recog-
nizable format.
BBad Questions Any question or
directive that obscures, prevents,
or distorts the fundamental com-
munications between respondent
and researcher.
Bar Code A pattern of varied-
width electronic-sensitive bars and
spaces that represents a unique
code of numbers and letters.
Behavior Intention Scale A spe-
cial type of rating scale designed
to capture the likelihood that peo-
ple will demonstrate some type of
predictable behavior toward pur-
chasing an object or service.
Behavioral Targeting Displaying
ads at one website based on the
user’s previous surfing behavior.
Believabil i ty The qual i ty
achieved by building a final report
that is based on clear, logical
thinking, precise expression, and
accurate presentation.
Benefit and Lifestyle Studies
Studies conducted to examine sim-
ilarities and differences in needs;
used to identify two or more
segments within a market for the
purpose of identifying customers
for the product category of interest
to a particular company.
Beta Coefficient An estimated
regression coefficient that has been
recalculated to have a mean of 0
and a standard deviation of 1. This
statistic enables the independent
variables with different units of
measurement to be directly com-
pared on their association with the
dependent variable.
Bias A particular tendency or
inclination that skews results,
thereby preventing accurate con-
sideration of a research question.
Bivariate Regression Analysis A
statistical technique that analyzes
the linear relationship between
two variables by estimating coef-
ficients for an equation for a
straight line. One variable is desig-
nated as a dependent variable, and
the other as an independent (or
predictor) variable.
Brand Awareness The percent-
age of respondents having heard of
a designated brand; brand aware-
ness can be either unaided or
aided.
Branded Black-Box Methodolo-
gies Methodologies offered by
research firms that are branded and
do not provide information about
how the methodology works.
Bulletin Board An online research
format in which participants agree
to post regularly over a period of
4–5 days.
CCall Record Sheet A recording
document that gathers basic sum-
mary information about an inter-
viewer’s performance efficiency
(e.g., number of contact attempts,
number of completed interviews,
length of time of interview).
www.MyEbookNiche.eCrater.com

383Glossary
have a respondent express
an attitude, feeling, or behavior
about an object (or person, or
phenomenon) or its attributes on the
basis of some other object (or per-
son, or phenomenon).
Comparison The process of
developing and refining theory and
constructs by analyzing the differ-
ences and similarities in passages,
themes, or types of participants.
Competitive Intelligence Analysis
Specific procedures for collecting
daily operational information per-
taining to the competitive compa-
nies and markets they serve.
Completeness The depth and
breadth of the data.
Completion Deadline Date Part
of the information included in a
cover letter that directly communi-
cates to a prospective respondent
the date by which his or her com-
pleted questionnaire must be
returned to the researcher.
Complexity of the Information
One of the two fundamental
dimensions used to determine the
level of information being sup-
plied by the information research
process; it relates to the degree to
which the information is easily
understood and applied to the
problem or opportunity under
investigation.
Computer-Assisted Telephone
Interview (CATI) The computer
controls and expedites the inter-
viewing process.
Computer-Assisted Telephone
Survey A survey that uses a fully
automated system in which the
respondent listens to an electronic
voice and responds by pushing
keys on a touch-tone telephone
keypad.
Concept and Product Testing
Research information for decisions
on product improvements and new
product introductions.
frequencies and is referred to as a
“goodness-of-fit test.”
Cluster Sampling A method of
probability sampling where the
sampling units are selected in
groups (or clusters) rather than
individually. Once the cluster has
been identified, the elements to
be sampled are drawn by simple
random sampling or all of the
units may be included in the
sample.
Code of Ethics A set of guide-
lines that states the standards and
operating procedures for ethical
decisions and practices by
researchers.
Codes Labels or numbers that are
used to track categories in a quali-
tative study.
Code Sheet A sheet of paper that
lists the different themes or cate-
gories for a particular study.
Coding The activities of group-
ing and assigning values to various
responses.
Coefficient Alpha See Cron-
bach’s Alpha.
Coefficient of Determination (r2)
A statistical value (or number) that
measures the proportion of varia-
tion in one variable accounted for
by another variable; the r2 measure
can be thought of as a percentage
and varies from .00 to 1.00.
Commercial/Syndicated Data
Data that have been compiled and
displayed according to some stan-
dardized procedure.
Common Methods Variance (CMV)
A biased variance that results from the
measurement method used in
a questionnaire.
Comparative Rating Scale A scale
format that requires a judgment
comparing one object, person, or
concept against another on the
scale.
Comparative Scale Scale used
when the scaling objective is to
Case Studies An exploratory
research technique that intensively
investigates one or several existing
situations which are similar to the
current problem/opportunity
situation.
Categorization Placing portions
of transcripts into similar groups
based on their context.
Causal Hypotheses Theoretical
statements about relationships
between variables that indicate a
cause-and-effect relationship.
Causal Research Research that
focuses on collecting data struc-
tures and information that will
allow the decision maker or
researcher to model cause–effect
relationships between two or more
variables under investigation.
Census A study that includes data
about or from every member of a
target population.
Central Limit Theorem (CLT)
The theoretical backbone of sam-
pling theory. It states that the sam-
pling distribution of the sample
mean ( _ x ) or the sample proportion
( _ p ) value derived from a simple
random sample drawn from the tar-
get population will be approxi-
mately normally distributed
provided that the associated sample
size is sufficiently large (e.g., when
n is greater than or equal to 30). In
turn, the sample mean value ( _ x ) of
that random sample with an esti-
mated sampling error (Sg) (esti-
mated standard error) fluctuates
around the true population mean
value (m) with a standard error of
s/n and has a sampling distribution
that is approximately a standard-
ized normal distribution, regard-
less of the shape of the probability
frequency distribution curve of the
overall target population.
Chi-square ( 2) Analysis Assesses
how closely the observed frequen-
cies fit the pattern of the expected
www.MyEbookNiche.eCrater.com

384 Glossary
Conceptualization Development
of a model that shows variables
and hypothesized or proposed
relationships between variables.
Confidence The certainty that the
true value of what we are estimat-
ing falls within the precision range
we have selected.
Confidence Interval A statistical
range of values within which the
true value of the target population
parameter of interest is expected to
fall based on a specified confi-
dence level.
Confidence Levels Theoretical
levels of assurance of the probabil-
ity that a particular confidence
interval will accurately include or
measure the true population param-
eter value. In information research,
the three most widely used levels
are 90 percent, 95 percent, and
99 percent.
Confidentiality to Client The
agreement between a researcher
and the client that all activities
performed in the process of con-
ducting marketing research will
remain private and the property of
the client, unless otherwise speci-
fied by both parties.
Confidentiality to Respondent
The expressed assurance to the
prospective respondent that his or
her name, while known to the
researcher, will not be divulged to
a third party, especially the spon-
soring client.
Confirmation/Invitation Letter
A specific follow-up document sent
to prospective focus group partici-
pants to encourage and reinforce
their willingness and commitment
to participate in the group session.
Conformance to Standards The
researcher’s ability to be accurate,
timely, mistake free, and void of
unanticipated delays.
Conjoint Analysis A multivariate
technique that estimates the utility
of the levels of various attributes
or features of an object, as well as
the relative importance of the
attributes themselves.
Consent Forms Formal signed
statements of agreement by the
participants approving the taping
or recording of the information
provided in group discussions and
releasing that data to the modera-
tor, researcher, or sponsoring
client.
Constant Sums Rating Scale A
scale format that requires the
respondents to allocate a given
number of points, usually 100,
among several attributes or fea-
tures based on their importance to
the individual; this format requires
a person to value each separate
feature relative to all the other
listed features.
Construct A hypothetical vari-
able made up of a set of compo-
nent responses or behaviors that
are thought to be related.
Construct Development An
integrative process of activities
undertaken by researchers to
enhance understanding of what
specific data should be collected
for solving defined research
problems.
Construct Development Error
A type of nonsampling (system-
atic) error that is created when
the researcher is not careful in
fully identifying the concepts and
constructs to be included in the
study.
Constructs Hypothetical vari-
ables composed of a set of compo-
nent responses or behaviors that
are thought to be related.
Construct Validity The degree to
which researchers measure what
they intended to measure.
Consumer-Generated Media
Blogs, bulletin boards, and social
media platforms.
Consumer Panels Large samples
of households that provide certain
types of data for an extended
period of time.
Content Analysis The technique
used to study written or taped
materials by breaking the data into
meaningful aggregate units or
categories using a predetermined
set of rules.
Content Validity That property
of a test which indicates that the
entire domain of the subject or
construct of interest was properly
sampled. That is, the identified
factors are truly components of the
construct of interest.
Control Group That portion of
the sample which is not subjected
to the treatment.
Control Variables Extraneous
variables that the researcher is able
to account for according to their
systematic variation (or impact) on
the functional relationship between
the independent and dependent vari-
ables included in the experiment.
Convenience Sampling A
method of nonprobability sam-
pling where the samples are drawn
on the basis of the convenience of
the researcher or interviewer; also
referred to as accidental sampling.
Convenience sampling is often
used in the early stages of research
because it allows a large number
of respondents to be interviewed
in a short period of time.
Convergent Validity The degree
to which different measures of the
same construct are highly correlated.
Cost Analysis An analysis of
alternative logistic system designs
that a firm can use for achieving
its performance objective at the
lowest total cost.
Covariation The amount of
change in one variable that is con-
sistently related to the change in
another variable of interest.
www.MyEbookNiche.eCrater.com

385Glossary
This process categorizes the num-
ber of respondents who have
responded to two or more ques-
tions consecutively.
Curbstoning Cheating or falsifi-
cation of data during the collection
process that occurs when inter-
viewers fill in all or part of a sur-
vey themselves.
Curvilinear Relationship An
association between two variables
whereby the strength and/or
direction of their relationship
changes over the range of both
variables.
Customer-Volunteered Informa-
tion Data provided by the cus-
tomer without solicitation.
Customized Research Firms
Research firms that provide tai-
lored services for clients.
Cycle Time The time that elapses
between taking a product or ser-
vice from initial consumer contact
to final delivery.
DData Facts relating to any issue or
subject.
Data Analysis Error A “family”
of nonsampling errors that are
created when the researcher sub-
jects the data to inappropriate
analysis procedures.
Database A collection of second-
ary information indicating what
customers are purchasing, how
often they purchase, and how
much they purchase.
Data Coding Errors The incorrect
assignment of codes to responses.
Data Editing Errors Inaccuracies
due to careless verifying procedures
of data to computer data files.
Data Entry The direct inputting
of the coded data into some speci-
fied software package that will
ultimately allow the research ana-
lyst to manipulate and transform
the data into usable information.
Cover Letter A separate letter
that either accompanies a self–
administered questionnaire or is
mailed prior to an initial inter-
viewer contact call and whose
main purpose is to secure a
respondent’s willingness to
participate in the research project;
sometimes referred to as a letter of
introduction.
Cover Letter Guidelines A
specific set of factors that should
be included in a cover letter for the
purpose of increasing a prospec-
tive respondent’s willingness to
participate in the study.
Credibility The quality that
comes about by developing a final
report that is accurate, believable,
and professionally organized.
Critical Questions Questions
used by a moderator to direct the
group to the critical issues under-
lying the topics of interest.
Critical Tolerance Level of
Error The observed difference
between a sample statistic value and
the corresponding true or hypoth-
esized population parameter.
Critical z Value The book z value
and the amount of acceptable
variability between the observed
sample data results and the pre-
scribed hypothesized true popula-
tion values measured in
standardized degrees of standard
errors for given confidence
levels.
Cronbach’s Alpha A widely
used measurement of the internal
consistency of a multi-item scale
in which the average of all possi-
ble split-half coefficients is taken.
Cross-Researcher Reliabil-
ity The degree of similarity in the
coding of the same data by differ-
ent researchers.
Cross-Tabulation The process of
simultaneously treating (or counting)
two or more variables in the study.
Data Entry Errors The incorrect
assignment of computer codes to
their predesignated location on the
computer data file.
Data Mining The process of find-
ing hidden patterns and relationships
among variables/characteristics con-
tained in data stored in the data
warehouse.
Data Reduction The categoriza-
tion and coding of data that is part
of the theory development process
in qualitative data analysis.
Data Silo Collection of data by
one area of a business that is not
shared with other areas.
Data Validation A specific con-
trol process that the researcher
undertakes to ensure that his or
her representatives collected the
data as required. The process is
normally one of recontacting
about 20 percent of the selected
respondent group to determine
that they did participate in the
study.
Data Warehouse A central
repository for all significant pieces
of information that an organization
collects.
De-Anonymizing Data Combin-
ing different publicly available
information to determine consum-
ers’ identities, especially on the
Internet.
Debriefing Analysis The tech-
nique of comparing notes, thoughts,
and feelings about a focus group
discussion between the moderator,
researcher, and sponsoring client
immediately following the group
interview.
Decision Opportunity The pres-
ence of a situation in which market
performance can be significantly
improved by undertaking new
activities.
Defined Target Population A
specified group of people or
www.MyEbookNiche.eCrater.com

386 Glossary
of selected panels of consumers
who use a special identification
card in recording their product
purchasing data.
Element The name given to the
object about which information is
sought. Elements must be unique,
countable, and, when added
together, make up the whole of the
target population.
Emic Validity An attribute of
qualitative research that affirms
that key members within a culture
or subculture agree with the find-
ings of a research report.
Empirical Testing The collection
of data in the real world using
research instruments and then sub-
jecting that data to rigorous anal-
ysis to either support or refute a
hypothesis.
Ending Questions Questions
used by a focus group moderator
to bring closure to a particular topic
discussion; encourages summary-
type comments.
Error The difference between the
true score on a research instrument
and the observed score.
Estimated Sample Standard
Deviation A quantitative index of
the dispersion of the distribution of
drawn sampling units’ actual data
around the sample’s arithmetic aver-
age measure of central tendency;
this sample statistical value specifies
the degree of variation in the data
responses in a way that allows the
researcher to translate the variations
into normal curve interpretations.
Estimated Sample Variance The
square of the estimated sample
standard deviation.
Estimated Standard Error of the
Sample Statistic A statistical
measurement of the sampling
error that can be expected to exist
between the drawn sample’s statis-
tical values and the actual values
from respondents via the postal
service.
Directness of Observation The
degree to which the researcher or
trained observer actually observes
the behavior/event as it occurs;
also termed direct observation.
Discriminant Validity The degree
to which measures of different
constructs are uncorrelated.
Discriminatory Power The
scale’s ability to significantly dif-
ferentiate between the categorical
scale responses (or points).
Disguised Sponsorship When
the true identity of the person or
company for which the research is
being conducted is not divulged to
the prospective respondent.
Disproportionately Stratified
Sampling A stratified sampling
method in which the size of
each stratum is independent of its
relative size in the population.
Diversity of Respondents The
degree to which the respondents in
the study share some similarities.
Domain of Observables The set
of observable manifestations of a
variable that is not itself directly
observable. A domain represents
an identifiable set of components
that form the construct of interest.
Drop-off Survey A questionnaire
that is left with the respondent to
be completed at a later time. The
questionnaire may be picked up by
the researcher or returned via
some other mode.
EEditing The process in which the
interviews or survey instruments
are checked for mistakes that may
have occurred by either the inter-
viewer or the respondent during
data collection activities.
Electronic Test Markets Test
procedures that integrate the use
objects for which questions can be
asked or observations made to
develop the required information;
also referred to as the working pop-
ulation. A precise definition of the
target population is essential when
undertaking a research project.
Deliberate Falsification When
the respondent and/or interviewer
intentionally gives wrong answers
or deliberately cheats on a survey.
Demographic Characteristics
Physical and factual attributes of
people, organizations, or objects.
Dependence Techniques Multi-
variate procedures when one or
more of the variables can be iden-
tified as dependent variables and
the remaining as independent
variables.
Dependent Variable A singular
observable attribute that is the
measured outcome derived from
manipulating the independent
variable(s).
Depth The overall number of key
data fields or variables that will
make up the data records.
Description The process of dis-
covering patterns, associations,
and relationships among key cus-
tomer characteristics.
Descriptive Research Research
that uses a set of scientific meth-
ods and procedures to collect data
that are used to identify, deter-
mine, and describe the existing
characteristics of a target popula-
tion or market structure.
Direct (positive) Directional
Hypothesis A statement about
the perceived relationship between
two questions, dimensions, or sub-
groups of attributes that suggests
that as one factor moves in one
direction, the other factor moves in
the same direction.
Direct Mail Survey A question-
naire distributed to and returned
www.MyEbookNiche.eCrater.com

387Glossary
each room contains a large table
and comfortable chairs for up to
13 people, with a relaxed atmo-
sphere, built-in audio equipment,
and normally a one-way mirror for
disguised observing by the spon-
soring client or researcher.
Focus Group Incentives Speci-
fied investment programs to com-
pensate focus group participants
for their expenses associated with
demonstrating a willingness to be
a group member.
Focus Group Moderator A per-
son who is well trained in interper-
sonal communications; listening,
observation, and interpretive
skills; and professional manner-
isms and personality. His or her
role in a session is to draw from
the participants the best and most
innovative ideas about an assigned
topic or question.
Focus Group Research A for-
malized qualitative data collection
method for which data are collected
from a small group of people who
interactively and spontaneously dis-
cuss one particular topic or concept.
Follow-up Test A statistical test
that flags the means that are statis-
tically different from each other;
follow-up tests are performed after
an ANOVA determines there are
differences between means.
Forced-Choice Scale Measure-
ments Symmetrical scale mea-
surement designs that do not have
a logical “neutral” scale descriptor
to divide the positive and negative
domains of response descriptors.
Formal Rating Procedures The
use of structured survey instruments
or questionnaires to gather informa-
tion on environmental occurrences.
F-ratio The statistical ratio of
between-group mean squared vari-
ance to within-group mean
squared variance; the F value is
hypothesized relationships between
dependent variables and manipu-
lated independent variables.
Exploratory Research Research
designed to collect and interpret
either secondary or primary data
in an unstructured format.
External Secondary Data Data
collected by outside agencies such
as the federal, state, or local gov-
ernment; trade associations; or
periodicals.
External Validity The extent to
which the measured data results of
a study based on a sample can be
expected to hold in the entire
defined target population. In addi-
tion, it is the extent that a causal
relationship found in a study can
be expected to be true for the
entire defined target population.
Extraneous Variables All vari-
ables other than the independent
variables that affect the responses
of the test subjects. If left uncon-
trolled, these variables can have a
confounding impact on the depen-
dent variable measures that could
weaken or invalidate the results of
an experiment.
FField Experiments Causal research
designs that manipulate the inde-
pendent variables in order to mea-
sure the dependent variable in a
natural test setting.
Finite Correction Factor
(fcf) An adjustment factor to the
sample size that is made in those
situations where the drawn sample
is expected to equal 5 percent or
more of the defined target popula-
tion. The fcf is equal to the overall
square root of N – n/N – 1.
Focus Group Facility A profes-
sional facility that offers a set of
specially designed rooms for con-
ducting focus group interviews;
of all the sampling units’ distribu-
tions of those concerned statistics.
These indexes are referred to as
general precision.
Estimates Sample data facts that
are transformed through interpre-
tation procedures to represent
inferences about the larger target
population.
Ethnography A form of qualita-
tive data collection that records
behavior in natural settings to
understand how social and cultural
influences affect individuals’
behaviors and experiences.
Executive Dashboard An intranet
for a select group of managers who
are decision makers in the company.
Executive Interview A person-
administered interview of a busi-
ness executive. Frequently, these
interviews will take place in the
executive’s office.
Executive Summary The part of
the final research report that illus-
trates the major points of the
report in a manner complete
enough to provide a true represen-
tation of the entire document.
Expected Completion Rate
(ECR) The percentage of pro-
spective respondents who are
expected to participate and com-
plete the survey; also referred to as
the anticipated response rate.
Experiment An empirical inves-
tigation that tests for hypothe-
sized relationships between
dependent variables and one or
more manipulated independent
variables.
Experimental Design Reliabil-
ity The degree to which the
research design and its procedures
can be replicated and achieve sim-
ilar conclusions about hypothe-
sized relationships.
Experimental Research An
empirical investigation that tests for
www.MyEbookNiche.eCrater.com

388 Glossary
Independent Samples Two or
more groups of responses that are
tested as though they may come
from different populations.
Independent Variable An attri-
bute of an object whose measure-
ment values are directly manipulated
by the researcher, also referred to as
a predictor or treatment variable.
This type of variable is assumed to
be a causal factor in a functional
relationship with a dependent
variable.
In-Depth Interview A structured
process of a subject’s being asked
a set of semi-structured, probing
questions by a well-trained inter-
viewer usually in a face-to-face
setting.
Information Objectives The
clearly stated reasons why data
must be collected; they serve as
the guidelines for determining the
data requirements.
Information Requirements The
identified factors, dimensions, and
attributes within a stated informa-
tion objective for which data must
be collected.
Information Research Process
The 10 systematic task steps involved
in the four phases of gathering, ana-
lyzing, interpreting, and transform-
ing data and results into information
for use by decision makers.
Information Research Questions
Specific statements that address
the problem areas the research
study will attempt to investigate.
In-Home Interview A person-
administrated interview that takes
place in the respondent’s home.
Integration The process of mov-
ing from the identification of
themes and categories to the
development of theory.
Interaction Effect Multiple inde-
pendent variables in an ANOVA
can act together to affect depen-
dent variable group means.
graphic continuum as the set of pos-
sible responses to a given question.
Group Dynamics The degree of
spontaneous interaction among
group members during a discus-
sion of a topic.
Groupthink A phenomenon in
which one or two members of a
group state an opinion and other
members of the group are unduly
influenced.
HHeteroskedasticity The pattern
of covariation around the regres-
sion line is not constant around the
regression line, and varies in some
way when the values change from
small to medium and large.
Homoskedasticity The pattern of
the covariation is constant (the
same) around the regression line,
whether the values are small,
medium, or large.
Hypothesis A yet-unproven prop-
osition or possible solution to a
decision problem that can be
empirically tested using data that
are collected through the research
process; it is developed in order to
explain a relationship between two
or more constructs or variables.
IIceberg Principle The general
notion indicating that the dangerous
part of many marketing decision
problems is neither visible nor well
understood by marketing managers.
Importance-Performance Anal-
ysis A research and data analysis
procedure used to evaluate a firm’s
and its competitors’ strengths
and weaknesses, as well as future
actions that seek to identify key
attributes that drive purchase
behavior within a given industry.
Incidence Rate The percentage of
the general population that is the
subject of a market research study.
used as an indicator of the statisti-
cal difference between group
means in an ANOVA.
Frequency Distributions A sum-
mary of how many times each pos-
sible response to a scale question/
setup was recorded by the total
group of respondents.
F-test The test used to statisti-
cally evaluate the difference between
the group means in ANOVA.
Functional Relationship An
observable and measurable sys-
tematic change in one variable as
another variable changes.
GGarbage In, Garbage Out A
standard phrase used in marketing
research to represent situations
where the process of collecting,
analyzing, and interpreting data
into information contains errors or
biases, creating less than accurate
information.
Gatekeeper Technology Any
device used to help protect one’s
privacy against intrusive market-
ing practices such as telemarketing
solicitors, unwanted direct market-
ers, illegal scam artists, and “sug-
ging” (caller ID, voice messengers,
answering machines).
Generalizability The extent to
which the data are an accurate
portrait of the defined target pop-
ulation; the representativeness of
information obtained from a
small subgroup of members to
that of the entire target population
from which the subgroup was
selected.
General Precision The amount
of general sampling error associ-
ated with the given sample of data
that was generated through some
type of data collection.
Graphic Rating Scale Descriptors
A scale point format that presents
respondents with some type of
www.MyEbookNiche.eCrater.com

389Glossary
belief that the participants will
meet the requirements of the
research study.
KKnowledge Information becomes
knowledge when someone, either
the researcher or the decision
maker, interprets the data and
attaches meaning.
Knowledge Level Degree to
which the selected respondents feel
they have knowledge of or experi-
ence with the survey’s topics.
LLaboratory Experiments Exper-
iments conducted in an artificial
setting.
Leading Question A question
that tends to purposely elicit a par-
ticular answer.
Least Squares Procedure A
regression approach that deter-
mines the best-fitting line by mini-
mizing the vertical distances of all
the points from the line, also
referred to as OLS.
Likert Scale A special rating
scale format that asks respondents
to indicate the extent to which
they agree or disagree with a
statements.
Limitations A section of the final
research report in which all extra-
neous events that place certain
restrictions on the report are fully
communicated.
Linear Relationship An associa-
tion between two variables
whereby the strength and nature of
the relationship remains the same
over the range of both variables.
Literature Review A compre-
hensive examination of available
information that is related to your
research topic.
Lottery Approach A unique
incentive system that pools together
properties but also the distance
property; all scale responses have
a recognized absolute difference
between each of the other scale
points (responses).
Interviewer Error A type of
non-sampling error that is created
in situations where the interviewer
distorts information, in a system-
atic way, from respondents during
or after the interviewer/respondent
encounter.
Interviewer Instructions The
vehicle for training the interviewer
on how to select prospective
respondents, screen them for eligi-
bility, and conduct the actual
interview.
Introduction Contains back-
ground information necessary for
a complete understanding of the
report.
Introductory Questions Ques-
tions used by a focus group mod-
erator to introduce the general
topic of discussion and opportuni-
ties of reflecting their past
experiences.
Introductory Section Gives the
respondent an overview of the
research.
Inverse (negative or indirect)
Directional Hypothesis A state-
ment about the perceived relation-
ship between two questions,
dimensions, or subgroupings of
attributes which suggests that as
one factor moves in one direction,
the other factor moves in an oppo-
site fashion.
Iteration Working through the
data several times in order to mod-
ify early ideas and to be informed
by subsequent analyses.
JJudgment Sampling A nonprob-
ability sampling design that selects
participants for a sample based
on an experienced individual’s
Intention to Purchase A per-
son’s planned future action to buy
a product or service.
Interdependence Techniques
Multivariate statistical procedures
in which the whole set of interde-
pendent relationships is examined.
Internal Reliability The extent to
which the items of a scale represent
the same domain of content and are
highly correlated both with each
other and summated scale scores. It
represents the degree to which the
components are related to the same
overall construct domain.
Internal Secondary Data Facts
that have been collected by the
individual company for accounting
and marketing activity purposes.
Internal Validity The certainty
with which a researcher can state
that the observed effect was
caused by a specific treatment;
exists when the research design
accurately identifies causal
relationships.
Internet Survey The method of
using the Internet to ask survey
questions and record responses of
respondents.
Interpersonal Communication
Skills The interviewer’s abilities
to articulate the questions in a
direct and clear manner so that the
subject understands what she or he
is responding to.
Interpretive Bias Error that
occurs when the wrong inference
about the real world or defined
target population is made by the
researcher or decision maker due
to some type of extraneous
factor.
Interpretive Skills The inter-
viewer’s capabilities of accurately
understanding and recording the
subject’s responses to questions.
Interval Scales Any question/
scale format that activates not only
the assignment and order scaling
www.MyEbookNiche.eCrater.com

390 Glossary
Median The sample statistic that
splits the data into a hierarchical
pattern where half the data are
above the median statistic value
and half are below.
Media Panels Selected house-
holds that are primarily used in
measuring media viewing habits
as opposed to product/brand con-
sumption patterns.
Member Checking Asking key
informants to read the researcher’s
report to verify that the analysis is
accurate.
Memoing Writing down thoughts
as soon as possible after each inter-
view, focus group, or site visit.
Method Bias The error source
that results from selecting an inap-
propriate method to investigate the
research question.
Methods-and-Procedures Sec-
tion Communicates how the
research was conducted.
Mode The most frequently men-
tioned (or occurring) raw response
in the set of responses to a given
question/setup.
Model F Statistic A statistic that
compares the amount of variation in
the dependent measure “explained”
or associated with the independent
variables to the “unexplained” or
error variance. A larger F statistic
value indicates that the regression
model has more explained variance
than error variance.
Moderator’s Guide A detailed
document that outlines the topics,
questions, and subquestions that
serve as the basis for generating
the spontaneous interactive dia-
logue among the focus group
participants.
Modified Likert Scale Any ver-
sion of the agreement/disagree-
ment-based scale measurement
that is not the original five-point
“strongly agree” to “strongly dis-
agree” scale.
Market Intelligence The use of
real-time customer information
(customer knowledge) to achieve a
competitive advantage.
Market Performance Symptoms
Conditions that signal the pres-
ence of a decision problem and/or
opportunity.
Mean The arithmetic average of
all the responses; all values of a
distribution of responses are
summed and divided by the num-
ber of valid responses.
Measurement Rules for assign-
ing numbers to objects so that
these numbers represent quantities
of attributes.
Measurement/Design Error A
“family” of nonsampling errors
that result from inappropriate
designs in the constructs, scale
measurements, or survey measure-
ments used to execute the asking
and recording of people’s
responses to a study’s questions.
Measures of Central Tendency
The basic sample statistics that
could be generated through ana-
lyzing the collected data; they are
the mode, the median, and the
mean.
Measures of Dispersion The
sample statistics that describe how
all the data are actually dispersed
around a given measure of central
tendency; they are the frequency
distribution, the range, and the
estimated sample standard
deviation.
Mechanical Devices High-
technology instruments that can
artificially observe and record
either current behavioral actions
or physical phenomena as they
occur.
Mechanical/Electronic Observa-
tion Some type of mechanical or
electronic device is used to capture
human behavior, events, or mar-
keting phenomena.
either individual small cash incen-
tives into a significantly larger dollar
amount or a substantial nonmone-
tary gift and then holds a drawing to
determine the winner or small set of
winners. The drawing procedure is
designed so that all respondents who
complete and return their survey
have an equal chance of receiving
the larger reward.
MMail Panel Survey A representa-
tive sample of individual respon-
dents who have agreed in advance
to participate in a mail survey.
Mail Surveys Surveys sent to
respondents using the postal
service.
Mall-Intercept Interview An
interview technique in which mall
patrons are stopped and asked for
feedback. The interview may take
place in the mall’s common areas
or in the research firm’s offices at
the mall.
Marketing The process of plan-
ning and executing pricing, pro-
motion, product, and distribution
of products, services, and ideas in
order to create exchanges that sat-
isfy both the firm and its
customers.
Marketing Knowledge A charac-
teristic that complements a research-
er’s technical competency.
Marketing Research The func-
tion that links an organization to
its market through the gathering of
information. The information
allows for the identification and
definition of market-driven oppor-
tunities and problems. The infor-
mation allows for the generation,
refinement, and evaluation of mar-
keting actions.
Marketing Research Online
Communities (MROCs) Pur-
posed communities whose pri-
mary purpose is research.
www.MyEbookNiche.eCrater.com

391Glossary
the response pool is systematically
and significantly different from
those that did respond.
Nonsampling Error A type of
bias that occurs in a research study
regardless of whether a sample or
census is used.
Normal Curve A curve that indi-
cates the shape of the distribution
of a variable is equal both above
and below the mean.
North American Industry Clas-
sification System (NAICS) Codes
numerical industrial listings
designed to promote uniformity in
data reporting procedures for the
U.S. government.
Not at Home A specific type of
nonresponse bias that occurs when
a reasonable attempt to initially
reach a prospective respondent
fails to produce an interviewer/
respondent encounter.
Null Hypothesis A statement of
no relationship between two
variables.
n-way ANOVA This is a type of
ANOVA that can analyze several
independent variables at the same
time.
OObject Any tangible item in a
person’s environment that can be
clearly and easily identified
through the senses.
Objectivity The degree to which a
researcher uses scientific procedures
to collect, analyze, and create nonbi-
ased information.
Observation Research System-
atic observation and recording of
behavioral patterns of objects,
people, events and other
phenomena.
Observing Mechanism How the
behaviors or events will be observed;
human observation is when the
observer is either a person hired
and trained by the researcher or
Netnography A research tech-
nique that draws on ethnography
but uses “found data” on the Inter-
net that are produced by virtual
communities.
Nominal Scales Question/scale
structures that ask the respondent
to provide only a descriptor as the
response; the response does not
contain any level of intensity.
Nomological Validity The extent
to which one particular construct
theoretically networks with other
established constructs which are
related yet different.
Noncomparative Scale Scale
used when the scaling objective is
to have a respondent express an
attitude, emotion, action, or inten-
tion about one specific object (per-
son, phenomenon) or its attributes.
Nondirectional Hypothesis A
statement regarding the existing
relationship between two questions,
dimensions, or subgroupings of attri-
butes as being significantly different
but lacking an expression of direction.
Nonmonetary Compensation
Any type of individual incentive
excluding direct cash (e.g., a free
T-shirt) used by the researcher to
encourage a prospective respon-
dent’s participation.
Nonparticipant Observation An
ethnographic research technique
that involves extended contact
with a natural setting, but without
participation by the researcher.
Nonprobability Sampling Sam-
pling designs in which the probabil-
ity of selection of each sampling
unit is not known. The selection of
sampling units is based on the judg-
ment or knowledge of the researcher
and may or may not be representa-
tive of the target population.
Nonresponse Error An error that
occurs when the portion of the
defined target population not rep-
resented or underrepresented in
Monetary Compensation An
individual cash incentive used by
the researcher to increase the like-
lihood of a prospective respon-
dent’s willingness to participate in
the survey.
Multicollinearity A situation in
which several independent vari-
ables are highly correlated with
each other. This characteristic can
result in difficulty in estimating
separate or independent regression
coefficients for the correlated
variables.
Multiple-Item Scale Designs
Method used when the researcher
has to measure several items (or
attributes) simultaneously in order
to measure the complete object or
construct of interest.
Multiple Regression Analysis
A statistical technique that ana-
lyzes the linear relationships
between a dependent variable and
multiple independent variables by
estimating coefficients for the
equation for a straight line.
Multivariate Analysis (Techniques)
A group of statistical techniques
used when there are two or more
measurements on each element and
the variables are analyzed
simultaneously.
Mystery Shopper Studies Studies
in which trained, professional shop-
pers visit stores, financial institu-
tions, or companies and “shop” for
various products and assess service
quality factors or levels.
NNegative Case Analysis Deliber-
ately looking for cases and
instances that contradict the ideas
and theories that researchers have
been developing.
Negative Relationship An asso-
ciation between two variables in
which one increases while the
other decreases.
www.MyEbookNiche.eCrater.com

392 Glossary
some past event or recorded
behavior.
Population The identifiable total
set of elements of interest being
investigated by a researcher.
Population Mean Value The
actual calculated arithmetic average
parameter value based on interval or
ratio data of the defined target popu-
lation elements (or sampling units).
Population Proportion Value
The actual calculated percentage
parameter value of the characteris-
tic of concern held by the target
population elements (or sampling
units).
Population Size The determined
total number of elements that rep-
resent the target population.
Population Specification Error
An incorrect definition of the true
target population to the research
question.
Population Standard Devia-
tion A quantitative index of the
dispersion of the distribution of
population elements’ actual data
around the arithmetic average
measure of central tendency.
Population Variance The square
of the population standard
deviation.
Positioning The desired percep-
tion that a company wants to be
associated with its target markets
relative to its products or brand
offerings.
Positive Relationship An associa-
tion between two variables in which
they increase or decrease together.
PowerPoint A software package
used to develop slides for
electronic presentation of the
research results.
Precision The degree of exactness
of the data in relation to some other
possible response of the target pop-
ulation; the acceptable amount of
error in the sample estimate.
Overall Reputation The primary
dimension of perceived quality
outcomes. Quality of the end prod-
uct can be gauged in direct propor-
tion to the level of expertise, trust,
believability, and contribution the
research brings to the client.
PParameter The true value of a
variable.
Participant Observation An eth-
nographic research technique that
involves extended observation of
behavior in natural settings in
order to fully experience cultural
or subcultural contexts.
Pearson Correlation Coefficient
A statistical measure of the strength
and direction of a linear relation-
ship between two metric variables.
Peer Review A process in which
external qualitative methodology
or topic area specialists are asked
to review the research analysis.
Perceptual Map A graphic repre-
sentation of respondents’ beliefs
about the relationship between
objects with respect to two or
more dimensions (usually attri-
butes or features of the objects).
Performance Rating Scale
Descriptors A scale that uses an
evaluative scale point format that
allows the respondents to express
some type of postdecision evalua-
tive judgment about an object.
Person-Administered Survey A
survey in which an individual
interviewer asks questions and
records responses.
Phantom Respondents A type of
data falsification that occurs when
the researcher takes an actual
respondent’s data and duplicates
them to represent a second (nonex-
isting) set of responses.
Physical Audits (or Traces) Tan-
gible evidence (or artifacts) of
the researcher himself; mechanical
observation refers to the use of a
technology-based device to do the
observing rather than a human
observer.
One-Way Tabulation The cate-
gorization of single variables
existing in the study.
Online Surveys Survey data col-
lected using the Internet.
Opening Questions Questions
used by a focus group moderator
to break the ice among focus
group participants; identify com-
mon group member traits; and cre-
ate a comfort zone for establishing
group dynamics and interactive
discussions.
Opportunity Assessment The
collection of information on
product-markets for the purpose
of forecasting how they will
change in the future. This type
of assessment focuses on gather-
ing information relevant to
macroenvironments.
Optical Scanner An electronic
device that optically reads bar
codes; this scanner captures and
translates unique bar code num-
bers into product information.
Ordinal Scales A question/scale
format that activates both the
assignment and order scaling
properties; the respondent is
asked to express relative magni-
tudes between the responses to a
question.
Ordinary Least Squares A sta-
tistical procedure that estimates
regression equation coefficients
which produce the lowest sum of
squared differences between the
actual and predicted values of the
dependent variable.
Overall Incidence Rate (OIR)
The percentage of the defined target
population elements who actually
qualify for inclusion in the survey.
www.MyEbookNiche.eCrater.com

393Glossary
activities that are undertaken to
design a systematic survey
instrument for the purpose of
collecting primary data from
(respondents).
Questionnaire Format/Layout
The combination of sets of question/
scale measurements into a system-
atic structured instrument.
Question/Setup Element The
question and/or directive that ele-
ment of a questionnaire; it is one
of the three elements that make up
any scale measurement.
Quotas A tracking system that
collects data from respondents and
helps ensure that subgroups are
represented in the sample as
specified.
Quota Sampling The selection of
participants based on specific quo-
tas regarding characteristics such
as age, race, gender, income, or
specific behaviors. Quotas are
usually determined by research
objectives.
Quota Sheets A simple tracking
form that enhances the interview-
er’s ability to collect data from the
right type of respondents; the form
helps ensure that representation
standards are met.
RRandom-Digit Dialing A random
selection of area code, exchange,
and suffix numbers.
Random Error An error that
occurs as the result of chance
events affecting the observed score.
Randomization The procedure
whereby many subjects are
assigned to different experimental
treatment conditions, resulting in
each group’s averaging out any
systematic effect on the investi-
gated functional relationship
between the independent and
dependent variables.
Propensity Scoring Weighting
underrepresented respondents
more heavily in results.
Proportionately Stratified Sam-
pling A stratified sampling
method in which the size of each
stratum is proportional to its rela-
tive size in the population.
Purchase Intercept Interview An
interview similar to a mall inter-
cept except that the respondent is
stopped at the point of purchase
and asked a set of predetermined
questions.
Purposive Sampling Selecting
sample members to study because
they possess attributes important
to understanding the research
topic.
QQualitative Research Research
methods used in exploratory
research designs where the main
objective is to gain a variety of
preliminary insights to discover
and identify decision problems
and opportunities.
Quality of the Information One
of the two fundamental dimen-
sions that is used to determine the
level of information being pro-
vided by the research process; it
refers to the degree to which the
information can be depended on as
being accurate and reliable.
Quantitative Research Data col-
lection methods that emphasize
using structured questioning prac-
tices where the response options
have been predetermined by the
researcher and administered to sig-
nificantly large numbers of
respondents.
Questionnaire A set of questions
and scales designed to generate
data to address research objectives.
Questionnaire Development
Process A series of logical
Predictions Population estimates
that are carried into a future time
frame; they are derived from either
facts or sample data estimates.
Predictive Validity The extent to
which a scale can accurately pre-
dict some event external to the
scale itself.
Pretesting The conducting of a
simulated administering of a
designed survey (or questionnaire)
to a small, representative group of
respondents.
Primary Data Data structures of
variables that have been specifi-
cally collected and assembled for
the current research problem or
opportunity situation; they repre-
sent “firsthand” structures.
Primary Information Firsthand
facts or estimates that are derived
through a formalized research pro-
cess for a specific current problem
situation.
Probability Distribution of the
Population The relative frequen-
cies of a population’s parameter
characteristic emulating a normal
bell-shaped pattern.
Probability Sampling Sampling
designs in which each sampling
unit in the sampling frame (opera-
tional population) has a known,
nonzero probability of being
selected for the sample.
Problem Definition A statement
that seeks to determine precisely
what problem management wishes
to solve and the type of informa-
tion necessary to solve it.
Project Costs The price require-
ments of doing marketing research.
Projective Techniques A family
of qualitative data collection
methods where subjects are asked
to project themselves into speci-
fied buying situations and then
asked questions about those
situations.
www.MyEbookNiche.eCrater.com

394 Glossary
Research Proposal A specific
document that serves as a written
contract between the decision
maker and researcher.
Research Questions Section The
second section of the question-
naire that focuses on the research
questions.
Respondent Characteristics The
attributes that make up the respon-
dents being included in the survey;
three important characteristics
are diversity, incidence, and
participation.
Respondent Error The type of
nonsampling errors that can occur
when selected prospective respon-
dents cannot be initially reached to
participate in the survey process,
do not cooperate, or demonstrate
an unwillingness to participate in
the survey.
Respondent Participation The
overall degree to which the
selected people have the ability
and the willingness to participate
as well as the knowledge of the
topics being researched.
Response Error The tendency to
answer a question in a unique sys-
tematic way. Respondents may
consciously or unconsciously dis-
tort their answers and true
thoughts.
Response Order Bias Occurs
when the order of the questions, or
of the closed-end responses to a
particular question, influences the
answer given.
Response Rate The percentage of
usable responses out of the total
number of responses.
Retailing Research Research
investigations that focus on top-
ics such as trade area analysis,
store image/perception, in-store
traffic patterns, and location
analysis.
Recursive A relationship in which
a variable can both cause and be
caused by the same variable.
Regression Coefficient An indi-
cator of the importance of an
independent variable in predicting
a dependent variable. Large stan-
dardized coefficients are good pre-
dictors and small coefficients are
weak predictors.
Refusal A particular type of non-
response bias that is caused when
a prospective respondent declines
the role of a respondent.
Related Samples Two or more
groups of responses that originated
from the sample population.
Relationships Associations between
two or more variables.
Reliability The extent to which
the measurements taken with a par-
ticular instrument are repeatable.
Reliability of the Scale
The extent to which the designed
scale can reproduce the same
measurement results in repeated
trials.
Reliability of Service The
researcher’s ability to be consis-
tent and responsive to the needs
of the client.
Reputation of the Firm The
culmination of a research firm’s
ability to meet standards, reliabil-
ity of service, marketing knowl-
edge, and technical competency
for purposes of providing quality
outcomes.
Research Instr ument A
microscope, ruler, questionnaire,
scale, or other device designed for
a specific measurement purpose.
Research Objectives Statements
that the research project will
attempt to achieve. They provide
the guidelines for establishing
a research agenda of activities nec-
essary to implement the research
process.
Random Sampling Error The
statistically measured difference
between the actual sampled results
and the estimated true population
results.
Ranges Statistics that represent
the grouping of data responses
into mutually exclusive subgroups
with each having distinct identifi-
able lower and upper boundary
designation values in a set of
responses.
Rank-Order Rating Scale A
scale point format that allows
respondents to compare their
responses to each other by indicat-
ing their first preference, then their
second preference, then their third
preference, etc., until all the
desired responses are placed in
some type of rank order, either
highest to lowest or lowest to
highest.
Rating Cards Cards used in
personal interviews that repre-
sent a reproduction of the set of
actual scale points and descrip-
tions used to respond to a spe-
cific question/setup in the survey.
These cards serve as a tool to
help the interviewer and respon-
dent speed up the data collection
process.
Ratio Scales Question/scale for-
mats that simultaneously activate
all four scaling properties; they are
the most sophisticated scale in the
sense that absolute differences can
be identified not only between
each scale point but also between
individuals’ responses. Ratio
scales request that respondents
give a specific singular numerical
value as their response to the
question.
Reachable Rate (RR) The per-
centage of active addresses on a
mailing list or other defined popu-
lation frame.
www.MyEbookNiche.eCrater.com

395Glossary
Scanner-Based Panel A group of
participating households which
have an unique bar-coded card as
an identification characteristic for
inclusion in the research study.
Scatter Diagram A graphic plot
of the relative position of two vari-
ables using a horizontal and a ver-
tical axis to represent the values of
the respective variables.
Scientific Method The system-
atic and objective process used to
develop reliable and valid first-
hand information.
Screening Forms A set of pre-
liminary questions that are used to
determine the eligibility of a pro-
spective respondent for inclusion
in the survey.
Screening Questions Also
referred to as screeners or filter
questions; are used on most ques-
tionnaires. Their purpose is to
identify qualified prospective
respondents and prevent unquali-
fied respondents from being
included in the study.
Secondary Data Historical data
structures of variables that have
been previously collected and
assembled for some research prob-
lem or opportunity situation other
than the current situation.
Secondary Information Infor-
mation (facts or estimates) that has
already been collected, assembled,
and interpreted at least once for
some other specific situation.
Selection Bias Contamination of
internal validity measures created by
inappropriate selection and/or
assignment processes of test subjects
to experimental treatment groups.
Selective Coding Building a
story-line around one core cate-
gory or theme; the other catego-
ries will be related to or subsumed
to this central overarching
category.
prospective sampling units or
determining the size of a sample
required to ensure its representa-
tiveness of the larger defined tar-
get population.
Sampling Frame A list of all eli-
gible sampling units for a given
study.
Sampling Frame Error An error
that occurs when a sample is drawn
from an incomplete list of potential
or prospective respondents.
Sampling Gap The representa-
tion difference between the
population elements and sampling
units in the sample frame.
Sampling Plan The blueprint or
framework used to ensure that the
data collected are, in fact, repre-
sentative of a larger defined target
population structure.
Sampling Units Those elements
that are available for selection dur-
ing the sampling process.
Scale Dimensions and Attributes
Element The components of the
object, construct, or concept that is
being measured; it identifies what
should be measured and is one of
the three elements of a scale
measurement.
Scale Measurement The process
of assigning a set of descriptors to
represent the range of possible
responses that an individual gives
in answering a question about a
particular object, construct, or fac-
tor under investigation.
Scale Points The set of assigned
descriptors that designate the
degrees of intensity to the responses
concerning the investigated charac-
teristics of an object, construct, or
factor; it is one of the three elements
that make up scale measurements.
Scale Reliability The extent to
which a scale can produce the
same measurement results in
repeated trials.
SSample A randomly selected
group of people or objects from
the overall membership pool of a
target population.
Sample Design Error A family
of nonsampling errors that occur
when sampling plans are not
appropriately developed and/or the
sampling process is improperly
executed by the researcher.
Sample Mean Value The actual
calculated arithmetic average
value based on interval or ratio
data of the drawn sampling units.
Sample Percentage Value The
actual calculated percentage value
of the characteristic of concern
held by the drawn sampling units.
Sample Selection Error A type
of sample design bias that occurs
when an inappropriate sample is
drawn from the defined target pop-
ulation because of incomplete or
faulty sampling procedures.
Sample Size The determined total
number of sampling units needed
to be representative of the defined
target population.
Sample Statistic The value of a
variable that is estimated from a
sample.
Sampling The process of select-
ing a relatively small number of
elements from a larger defined
group of elements so that the
information gathered from the
smaller group allows one to make
judgments about that larger group
of elements.
Sampling Distribution The fre-
quency distribution of a specific
sample statistic value that would
be found by taking repeated ran-
dom samples of the same size.
Sampling Error Any type of
bias in a survey study that is
attributable to mistakes made in
either the selection process of
www.MyEbookNiche.eCrater.com
396 Glossary
Spearman Rank Order Corre-
lation Coefficient A statistical
measure of the linear association
between two variables where
both have been measured using
ordinal (rank-order) scale
instruments.
Split-Half Test A technique used
to evaluate the internal consis-
tency reliability of scale measure-
ments that have multiple attribute
components.
Standard Deviation The mea-
sure of the average dispersion of
the values in a set of responses
about their mean.
Standard Error of the Popula-
tion Parameter A statistical mea-
sure used in probability sampling
that gives an indication of how far
the sample result lies from the
actual population measure we are
trying to estimate.
Standard Industrial Classifica-
tion (SIC) Codes The numerical
scheme of industrial listings
designed to promote uniformity in
data reporting procedures for the
U.S. government.
Standardized Research Firms
Research firms that provide gen-
eral results following a standard
format so that results of a study
conducted for one client can be
compared to norms.
Staple Scales Considered a modi-
fied version of the semantic differ-
ential scale; they symmetrically
center the scale point domain within
a set of plus (+) and minus (−)
descriptors.
Statistical Conclusion Validity
The ability of the researcher to
make reasonable statements about
covariation between constructs of
interest and the strength of that
covariation.
Store Audits Formal examina-
tions and verifications of how
much of a particular product or
population with a prespecified
margin of error.
Single-Item Scale Descriptors A
scale used when the data require-
ments focus on collecting data
about only one attribute of the
object or construct being
investigated.
Situational Characteristics Fac-
tors of reality such as budgets,
time, and data quality that affect
the researcher’s ability to collect
accurate primary data in a timely
fashion.
Situation Analysis An informal
process of analyzing the past,
present, and future situations fac-
ing an organization in order to
identify decision problems and
opportunities.
Skip Interval A selection tool
used to identify the position of
the sampling units to be drawn
into a systematic random sample
design. The interval is deter-
mined by dividing the number of
potential sampling units in the
defined target population by the
number of units desired in the
sample.
Skip Questions Used if the next
question (or set of questions)
should be responded to only by
respondents who meet a previous
condition.
Snowball Sampling A nonproba-
bility sampling method that
involves the practice of identifying
a set of initial prospective respon-
dents who can, in turn, help in
identifying additional people to be
included in the study.
Social Desirability A type of
response bias that occurs when the
respondent assumes what answer
is socially acceptable or
respectable.
Social Media Monitoring Research
based on conversations in social
media.
Selective Perception Bias A
type of error that occurs in situa-
tions where the researcher or
decision maker uses only a
selected portion of the survey
results to paint a tainted picture of
reality.
Self-Administered Survey A
survey in which respondents read
the survey questions and record
their responses without the assis-
tance of an interviewer.
Semantic Differential Scale A
special type of symmetrical rating
scale that uses sets of bipolar
adjectives and/or adverbs to
describe some type of positive and
negative poles of an assumed con-
tinuum; it is used to capture
respondents’ cognitive and affec-
tive components of specified fac-
tors and create perceptual image
profiles relating to a given object
or behavior.
Semistructured Question A
question that directs the respon-
dent toward a specified topic area,
but the responses to the question
are unbounded; the interviewer is
not looking for any preconceived
right answer.
Sensitive Questions Questions
concerning income, sexual beliefs
or behaviors, medical conditions,
financial difficulties, alcohol con-
sumption, and so forth that respon-
dents are likely to respond to
incorrectly.
Sentence Completion Test A
projective technique where sub-
jects are given a set of incomplete
sentences and asked to complete
them in their own words.
Simple Random Sampling
(SRS) A method of probability
sampling in which every sampling
unit has an equal, nonzero chance
of being selected. Results gener-
ated by using simple random sam-
pling can be projected to the target
www.MyEbookNiche.eCrater.com

397Glossary
Systematic Random-Digit
Dialing The technique of ran-
domly dialing telephone numbers,
but only numbers that meet spe-
cific criteria.
Systematic Random Sampling
(SYMRS) A method of
probability sampling that is simi-
lar to simple random sampling but
requires that the defined target
population be naturally ordered in
some way.
TTable of Random Numbers A
table of numbers that has been
randomly generated.
Tabulation The simple proce-
dure of counting the number of
observations, or data items, that
are classified into certain
categories.
Target Market Analysis Infor-
mation for identifying those people
(or companies) that an organiza-
tion wishes to serve.
Target Population A specified
group of people or objects for
which questions can be asked or
observations made to develop
required data structures and
information.
Task Characteristics The
requirements placed on the respon-
dents in their process of providing
answers to questions asked.
Task Difficulty How hard the
respondent needs to work to
respond, and the level of prepara-
tion required to create an environ-
ment for the respondent.
Technical Competency The
degree to which the researcher
possesses the necessary functional
requirements to conduct the
research project.
Technology-Mediated Observa-
tion Data collection using some
type of mechanical device to
fashion; it outlines the process by
which to conduct a study that
uses personal and telephone
interviewers.
Survey Instrument Design
Error A “family” of design or for-
mat errors that produce a question-
naire that does not accurately collect
the appropriate data; these nonsam-
pling errors severely limit the gen-
eralizability, reliability, and validity
of the collected data.
Survey Instrument Error A
type of error that occurs when the
survey instrument induces some
type of systematic bias in the
response.
Survey Research Methods Research
design procedures for collecting
large amounts of data using
interviews or questionnaires.
Symptoms Conditions that signal
the presence of a decision problem
or opportunity; they tend to be
observable and measurable results
of problems or opportunities.
Syndicated (or Commercial)
Data Data and information that
have been compiled according to
some standardized procedure
which provides customized data
for companies such as market
share, ad effectiveness, and sales
tracking.
Syndicated Business Services Ser-
vices provided by standardized
research firms that include data
made or developed from a com-
mon data pool or database.
Systematic Error The type of
error that results from poor instru-
ment design and/or instrument
construction causing scores or
readings on an instrument to be
biased in a consistent manner; cre-
ates some form of systematic vari-
ation in the data that is not a
natural occurrence or fluctuation
on the part of the surveyed
respondents.
brand has been sold at the retail
level.
Strata The subgroupings that are
derived through stratified random
sampling procedures.
Stratified Purposive Sampling
Selecting sample members so that
groups can be compared.
Stratified Random Sampling
(STRS) A method of probability
sampling in which the population
is divided into different subgroups
(called strata) and samples are
selected from each stratum.
Structured Questions Questions
that require the respondent to
make a choice among a limited
number of prelisted responses or
scale points; they require less
thought and effort on the part of
the respondent; also referred to as
closed-ended questions.
Subject Debriefing Fully explain-
ing to respondents any deception
used during research.
Subjective Information Infor-
mation that is based on the deci-
sion maker’s or researcher’s past
experiences, assumptions, feel-
ings, or interpretations without
any systematic assembly of facts
or estimates.
Subject’s Awareness The
degree to which subjects con-
sciously know their behavior is
being observed; disguised obser-
vation is when the subject is
completely unaware that he or
she is being observed, and undis-
guised observation is when the
person is aware that he or she is
being observed.
Sugging/Frugging Claiming that
a survey is for research purposes
and then asking for a sale or
donation.
Supervisor Instructions A form
that serves as a blueprint for training
people on how to execute the inter-
viewing process in a standardized
www.MyEbookNiche.eCrater.com

398 Glossary
Unstructured Questions Question/
scale formats that require respon-
dents to reply in their own words;
this format requires more thinking
and effort on the part of respon-
dents in order to express their
answers; also called open-ended
questions.
VValidity The degree to which a
research instrument serves the pur-
pose for which it was constructed;
it also relates to the extent to which
the conclusions drawn from an
experiment are true.
Variability A measure of how
data are dispersed; the greater the
dissimilarity or “spread” in data,
the larger the variability.
Variable Any observable, mea-
surable element (or attribute).
Variance The average squared
deviations about a mean of a dis-
tribution of values.
Verbatims Quotes from research
participants that are used in
research reports.
WWillingness to Participate The
respondent’s inclination or dis-
position to share his or her
thoughts.
Wireless Phone Survey The
method of conducting a marketing
survey in which the data are col-
lected on standard wireless
phones.
Word Association Test A pro-
jective technique in which the
subject is presented with a list of
words or short phrases, one at a
time, and asked to respond with
the first thoughts that comes to
mind.
Transition Questions Questions
used by a moderator to direct a
focus group’s discussion toward
the main topic of interest.
Triangulation Addressing the
topic analysis from multiple
perspectives, including using mul-
tiple methods of data collection
and analysis, multiple data
sets, multiple researchers, multiple
time periods, and different kinds of
relevant research informants.
t-Test Also referred to as t statis-
tic, a hypothesis test procedure
that uses the t-distribution; t-tests
are used when the sample size of
subjects is small (generally less
than 30) and the standard devia-
tion is unknown.
Type I Error The error made by
rejecting the null hypothesis when
it is true; represents the probability
of alpha error.
Type II Error The error of fail-
ing to reject the null hypothesis
when the alternative hypothesis is
true; represents the probability of
beta error.
UUndisguised Sponsorship When
the true identity of the person
or company for which the
research is being conducted is
directly revealed to the prospec-
tive respondent.
Unexplained Variance In multi-
variate methods, it is the amount
of variation in the dependent con-
struct that cannot be accounted for
by the combination of independent
variables.
Unit of Analysis Specifies whether
data should be collected about
individuals, households, organiza-
tions, departments, geographical
areas, or some combination.
capture human behavior, events, or
marketing phenomena.
Telephone Interview A question-
and-answer exchange that is con-
ducted via telephone technology.
Test Marketing A controlled
field experiment conducted for
gaining information on specified
market performance indicators or
factors.
Theoretical Sampling Selecting
sample members based on earlier
interviews that suggest that
particular types of participants
will help researchers better under-
stand the research topic.
Theory A large body of intercon-
nected propositions about how
some portion of a certain phenom-
enon operates.
Thick Description An ethno-
graphic research report that con-
textualizes behavior within a
culture or subculture.
Topic Sensitivity The degree to
which a specific question or
investigated issue leads the respon-
dent to give a socially acceptable
response.
Traditional Test Markets Test
markets that use experimental
design procedures to test a product
and/or a product’s marketing mix
variables through existing distri-
bution channels; also referred to as
standard test markets.
Trained Interviewers Highly
trained people, with excellent
communication and listening
skills, who ask research partici-
pants specific questions and accu-
rately record their responses.
Trained Observers Highly
skilled people who use their vari-
ous sensory devices to observe
and record either a person’s cur-
rent behaviors or physical phe-
nomena as they take place.
www.MyEbookNiche.eCrater.com

399Glossary
share emotional and subcon-
scious reactions to a particular
topic.
z-test (also referred to as z statistic)
A hypothesis test procedure that
uses the z distribution; z-tests are
used when the sample size is
larger than 30 subjects and the
standard deviation is unknown.
either is no longer in service or is
incorrect on the sample list.
ZZaltman Metaphor Elicitation
Technique (ZMET) A visual
research technique used in in-
depth interviewing that encour-
ages research participants to
Wrong Mailing Address A type
of nonresponse bias that can occur
when the prospective respondent’s
mailing address is outdated or no
longer active.
Wrong Telephone Number A
type of nonresponse bias that can
occur when the prospective
respondent’s telephone number
www.MyEbookNiche.eCrater.com

400
Endnotes
CHAPTER 11. Allen Vartazarian, “Why Geo-
fencing is the Next Mobile
Research Must-Have,” Quirk’s
Marketing Research Review,
July 2013, p. 56.
2. Allen Vartazarian, “Advances in
Geofencing,” www. Quirks.com,
December 29, 2014, accessed
February 7, 2016.
3. Dan Seldin, Gina Pingitore,
Lauri Alexander, and Chris
Hilaire, “Capturing the Moment:
A Feasibility Test of Geofencing
and Mobile App Data Collection,”
www.casro.org, 2014, accessed
February 7, 2016.
4. Allen Vartazarian, “7 Ways
Geofencing is Transforming
Mobile Marketing Research,”
Instantly Blog, blog.instant.ly,
September 17, 2014, accessed
February 4, 2016.
5. American Marketing Associa-
tion, Official Definition of Mar-
keting Research, 2009, www
.marketingpower.com.
6. Dan Ariely, Predictably Irratio-
nal: The Hidden Forces That
Shape Our Decisions (New
York: HarperCollins, 2009).
7. “Shopper Insights for Consumer
Product Manufacturers and
Retailers,” www.msri.com
/industry-expertise/retail.aspx,
accessed March 23, 2012.
8. David Burrows, “How to Use
Ethnography for In-depth Con-
sumer Insights,” May 9, 2014,
Marketing Week, accessed
February 7, 2016.
9. Kurt Lewin, Field Theory in
Social Science: Select Theoretical
Papers by Kurt Lewin (London:
Tavistock, 1952).
10. Sheena S. Iyangar and Mark R.
Lepper, “When Choice Is Demoti-
vating: Can One Desire Too Much
of a Good Thing?,” Journal
of Personality & Social Psychol-
ogy 79, no. 6 (December 2000),
pp. 995–1006.
11. “Survey of Top Marketing
Research Firms,” Advertising
Age, June 27, 1997.
12. “Fostering Professionalism,”
Marketing Research, Spring 1997.
13. Ibid.
14. Bureau of Labor Statistics, www
.bls .gov/ooh/Business-and
-Financial/Market-research
-analysts.htm, Occupational Out-
look Handbook, “Market Research
Analysis,” March 29, 2012.
15. Steve Smith, “You’ve Been De-
Anonymized,” Behavioral
Insider, MediaPost.com, April 3,
2009, www.mediapost.com
/publications/?fa=Ar t i c l e s
.showArticle&art_aid=103467.
16. ICC/ESOMAR International
Code on Social and Market
Research, April 3, 2009, http://
www.esomar.org/index.php
/ c o d e s - g u i d e l i n e s . h t m l .
Reprinted by permission of
ESOMAR.
CHAPTER 21. Robert Kenneth Wade and
William David Perreault, “The
When/What Research Decision
Guide,” Marketing Research: A
Magazine and Application
5, no. 3 (Summer 1993),
pp. 24–27; and W. D. Perreault,
“The Shifting Paradigm in Mar-
keting Research,” Journal of the
Academy of Marketing Science
20, no. 4 (Fall 1992), p. 369.
CHAPTER 31. Mark Walsh, “Pew: 52% Use
Mobile While Shopping,” Media-
Post News, January 30, 2012;
Aaron Smith, “The Rise of In-Store
Mobile Commerce,”Pew Inter-
net & American Life, January 30,
2012, http://pewinternet.org
/Reports/2012/In-store-mobile-
commerce.aspx; Ned Potter,
“‘Showrooming’: People Shopping
in Stores, Then Researching by Cell
Phone, says Pew Survey,”
ABC World News, January 31,
2012, http://abcnews.go.com
/Technology/pew-in te r net
- showrooming-half-cell-phone-use
rs-research/story?id=15480115#
.Ty2tIlx5GSo.
2. Sally Barr Ebest, Gerald J. Alred,
Charles T. Brusaw, and Walter E.
Oliu, Writing from A to Z: An Easy-
to-Use Reference Handbook, 4th
ed. (Boston: McGraw-Hill, 2002).
3. Ibid., pp. 44–46 and 54–56.
4. Mintel.com, “About Mintel,
About Market Intelligence,”
www.Mintel.com/about-Mintel,
accessed April 8, 2016.
5. GfK Custom Research North
American, “GfK Roper Consulting,”
www.gfkamerica.com/practice
_areas/roper_consulting/index
.en.html, accessed April 14, 2009.
6. Youthbeat, www.crresearch
.com, accessed April 24, 2009.
7. Nielsen Media Research, “Any-
time, Anywhere Media Mea-
surement,” June 14, 2006, p. 1,
a2m2.nielsenmedia.com.
8. David C. Tice, “Accurate
Measurement & Media Hype:
Placing Consumer Media
Technologies in Context,”
www.MyEbookNiche.eCrater.com

401Endnotes
Exploration of High-Risk Leisure
Consumption through Skydiving,”
The Journal of Consumer Research
20, no. 1 (1993), pp. 1–23.
24. Jennifer McFarland, “Margaret
Mead Meets Consumer Fieldwork:
The Consumer Anthropologist,”
Harvard Management Update,
September 24, 2001, http://hbswk
.hbs.edu/archive/2514.html.
25. Arch G. Woodside and Elizabeth
J. Wilson, “Case Study Research
Methods for Theory Building,”
Journal of Business and Indus-
trial Marketing 18, no. 6/7
(2003), pp. 493–508.
26. Gerald Zaltman, “Rethinking Mar-
ket Research: Putting People Back
In,” Journal of Marketing Research
34, no. 4 (1997), pp. 424–37.
27. Emily Eakin, “Penetrating the
Mind by Metaphor,” The New
York Times, February 23, 2002,
p. B11; also see Zaltman, How
Consumers Think.
28. Eakin, “Penetrating the Mind by
Metaphor.”
29. Sam K. Hui, Eric T. Bradlow,
and Peter S. Fader, “Testing
Behavioral Hypotheses Using
an Integrated Model of Grocery
Store Shopping Path and Pur-
chase Behavior,” Journal of
Consumer Research 36 (October
2009), pp. 478–93.
30. Poynter, “Chatter Matters.”
31. Poynter, “Chatter Matters.”
32. David Murphy and Didier
Truchot, “Moving Research For-
ward,” RWConnect, December 22,
2011, Esomar.org.
33. Poynter, “Chatter Matters,”.
34. Angela Hausman, “Listening
Posts in Social Media: Discus-
sion from Ask a Marketing
Expert,” January 16, 2011,
www.hausmanmarketresearch
.org.
35. Surinder Siama, “Listening
Posts for Word-of-Mouth Mar-
keting,” RWConnect, January
16, 2011, Esomar.org.
36. Peter Turney, “Thumbs Up or
Thumbs Down? Semantic
Orientation Applied to Unsuper-
vised Classification of Reviews,”
Proceedings of the Association for
7. Mary Modahl, Now or Never:
How Companies Must Change
Today to Win the Battle for
Internet Consumers (New York:
HarperCollins, 2000).
8. Power Decisions Group, “Mar-
ket Research Tools: Qualitative
Depth Interviews,” 2006,
www. powerdec is ions .com
/ qualitative-depth-interviews.cfm.
9. Harris Interactive, “Online
Qualitative Research,” 2006,
www.harr isinteractive.com
/services/qualitative.asp.
10. Mary F. Wolfinbarger, Mary
C. Gilly and Hope Schau, “Lan-
guage Usage and Socioemo-
tional Content in Online vs.
Offline Focus Groups,” Winter
American Marketing Associa-
tion Conference, Austin, TX,
February 17, 2008.
11. Online Focus Groups, “Video-
Diary Qualitative Research Soft-
ware,” www.qualvu.com/video
diary, accessed April 17, 2009.
12. Zaltman, How Customers Think.
13. Ibid.
14. Robert M. Schindler, “The Real
Lesson of New Coke: The Value
of Focus Groups for Predicting
the Effects of Social Influence,”
Marketing Research: A Magazine
of Management & Applications,
December 1992, pp. 22–27.
15. Ray Poynter, “Chatter Matters,”
Marketing power.com, Fall
2011, pp. 23–28.
16. Al Urbanski, “‘Community’
Research,” Shopper Marketing,
November 2009, Communispace
.com, January 7, 2011.
17. Ibid.
18. Poynter, “Chatter Matters.”
19. Stephen Baker, “Following the
Luxury Chocolate Lover,”
Bloomberg Businessweek, March
25, 2009.
20. Julie Wi. Schlack, “Taking a Good
Look at Yourself,” November 7,
2011, Research-live.com.
21. Poynter, “Chatter Matters.”
22. Clifford Geertz, Interpretation
of Cultures (New York: Basic
Books, 2000).
23. Richard L. Celsi, Randall L. Rose,
and Thomas W. Leigh, “An
www.knowledgenetworks.com
/accuracy/spring2007/tice.html,
accessed April 29, 2009; Jacqui
Cheng, “Report: DVR Adoption to
Surge Past 50 Percent by 2010,”
w w w . a r s t e c h n i c a . c o m
/gadgets/news/2007/report-dvr
-adoption-to-surge-past-50
-percent-by-2010.ars-, accessed
April 29, 2009; Dinesh C. Sharma,
“Study: DVR Adoption on the Rise,”
CNET News, http://news.cnet.com
/Study-DVR-adoption-on-the
-rise/2100-1041_3-5182035.html.
CHAPTER 41. Merlyn A. Griffiths and Mary
C. Gilly, “Dibs! Customer Ter-
ritorial Behaviors,” Journal of
Services Research 15, no. 2
(2012), pp. 131–49; Bryant
Simon, Everything but the Cof-
fee (Berkeley: University of
California Press, 2009); Irwin
Altman, The Environment and
Social Behavior: Privacy, Per-
sonal Space, Territory,
Crowding (Monterey, CA:
Wadsworth, 1975).
2. Yvonne Lincoln and Egon G.
Guba, “Introduction: Entering
the Field of Qualitative
Research,” in Handbook of
Qualitative Research, eds. Nor-
man Denzin and Yvonne Lin-
coln (Thousand Oaks, CA:
Sage, 1994), pp. 1–17.
3. Gerald Zaltman, How Customers
Think: Essential Insights into the
Mind of the Market (Boston:
Harvard Business School, 2003).
4. Melanie Wallendorf and Eric J.
Arnould, “We Gather Together:
The Consumption Rituals of
Thanksgiving Day,” Journal of
Consumer Research 19, no. 1
(1991), pp. 13–31.
5. Dennis W. Rook, “The Ritual
Dimension of Consumer Behav-
ior,” Journal of Consumer
Research 12, no. 3 (1985),
pp. 251–64.
6. Alfred E. Goldman and Susan
Schwartz McDonald, The Group
Depth Interview: Principles and
Practice (Englewood Cliffs, NJ:
Prentice Hall, 1987), p. 161.
www.MyEbookNiche.eCrater.com

402 Endnotes
Computational Linguistics, 2002,
pp. 417–24; Bo Pang, Lillian Lee,
and Shivakumar Vaithyanathan,
“Thumbs Up? Sentiment Classifi-
cation Using Machine Learning
Techniques,” Proceedings of the
Conference on Empirical Methods
in Natural Language Processing,
2002, pp. 79–86; Bo Pang and Lil-
lian Lee, “Seeing Stars: Exploiting
Class Relationships for Sentiment
Categorization with Respect to
Rating Scales,” Proceedings of the
Association for Computational
Linguistics, 2005, pp. 115–24;
Benjamin Snyder and Regina Bar-
zilay, “Multiple Aspect Ranking
Using the Good Grief Algorithm,”
Proceedings of the Joint Human
Language Technology/North
American Chapter of the ACL
Conference, 2007, pp. 300–07.
37. Michelle de Haaff, “Sentiment
Analysis, Hard But Worth It!”
CustomerThink, March 11, 2010.
38. Tanzina Vega, “E*Trade’s Baby
Creates the Most Online Buzz,”
The New York Times, December
28, 2011.
39. “Social Media Monitoring
Overview,” www.g2crowd.com
/ c a t e g o r i e s / s o c i a l - m e d i a
-monitoring#before-you-buy,
accessed March 6, 2016.
40. Robert V. Kozinets, “The Field
behind the Screen: Using Netno-
graphy for Marketing Research
in Online Communities,” Jour-
nal of Marketing Research 39
(February 2002), p. 69.
41. Ibid., pp. 61–72.
CHAPTER 51. Terry L. Childers and Steven J.
Skinner, “Toward a Conceptualiza-
tion of Mail Survey Response
Behavior,” Psychology and
Marketing 13 (March 1996),
pp. 185–225.
2. Kathy E. Green, “Sociodemo-
graphic Factors and Mail Survey
Response Rates,” Psychology
and Marketing 13 (March
1996), pp. 171–84.
3. Michael G. Dalecki, Thomas W.
Ivento and Dan E. Moore, “The
Effect of Multi-Wave Mailings on
the External Validity of Mail
Surveys,” Journal of Community
Development Society 19 (1988),
pp. 51–70.
4. “Mobile Memoir: The Power
of the Thumb,” April 2004,
Mobile Memoir LLC 2004,
w w w. k i n e s i s s u r v e y. c o m
/phonesolutions.html.
5. Leslie Townsend, “The Status
of Wireless Survey Solutions:
The Emerging Power of the
Thumb,” Journal of Interactive
Advertising 6, no. 1 (2005),
p. 52. http://jiad.org/vol6/no1
/townsend/index.htm.
6. “Mobile Memoir: The Power of
the Thumb.”
7. Townsend, “The Status of Wire-
less Survey Solutions.”
8. “Consumers Ditching Landline
Phones,” USA Today, May 14,
2008, p. 1B.
9. Townsend, “The Status of Wire-
less Survey Solutions.”
10. Kevin B. Wright, “Research
Internet-Based Populations:
Advantages and Disadvantages
of Online Survey Research,
Online Questionnaire Authoring
Software Packages, and Web
Survey Services,” Journal of
Computer-Mediated Communi-
cation 10, no. 3 (April 2005),
http://jcmc.indiana.edu/vol10
/issue3/wright.html.
11. Maryann J. Thompson, “Market
Researchers Embrace the Web,”
The Industry Standard, January
26, 1999, www.thestandard
.com/article/0,1902,3274,00.html.
CHAPTER 61. Ian Paul, “Mobile Web Use
Explodes,” PC World, March
16, 2009.
2. Joseph F. Hair, Jr., Robert P. Bush,
and David J. Ortinau, Marketing
Research: A Practical Approach for
the new Millennium (Burr Ridge,
IL: Irwin/McGraw l-Hill 2000)
p. 330. Actual prices of lists will vary
according to the number and com-
plexity of characteristics needed to
define the target population.
3. Nielsen Online, www.nielsen
-online.com/resources.jsp?
section=pr_netv&nav=1, accessed
July 27, 2009.
4. J. Michel Dennis, Larry Osborn,
and Karen Semans, “Comparison
Study: Early Adopter Attitudes
and Online Behavior in Probability
and Non-Probability Web Panels,”
at http://www.knowledgnetworks
/accuarcy/spring2009; accessed on
April 29, 2009.
CHAPTER 71. Kaylene C. Williams and Rosann
L. Spiro, “Communication Style in
the Salesperson-Customer Dyad,”
Journal of Marketing Research
12 (November 1985), pp. 434–42.
2. Kenneth C. Schneider, “Uni-
formed response rates in survey
research: New evidence,” Jour-
nal of Business Research 13 (2)
(April 1985), pp. 153–62; also
Del I. Hawkins and Kenneth A.
Coney, “Uninformed Response
Error in Survey Research,” Jour-
nal of Marketing Research 18
(3) (August 1981), pp. 370–74;
also at DOI: 10.2307/3150978.
3. Roobina Ohanian, “Construc-
tion and Validation of a Scale to
Measure Celebrity Endorsers’
Perceived Expertise, Trustwor-
thiness, and Attractiveness,”
Journal of Advertising 19, no. 3
(1990), pp. 39–52; and Robert
T. W. Wu and Susan M.
Petroshius, “The Halo Effect in
Store Image Management,” Jour-
nal of Academy of Marketing Sci-
ence 15 (1987), pp. 44–51.
4. Rajendar K. Garg, “The Influence
of Positive and Negative Wording
and Issues Involvement on
Response to Likert Scales in Mar-
keting Research,” Journal of the
Marketing Research Society 38,
no. 3 (July 1996), pp. 235–46.
5. See www.burke.com and
Amanda Prus and D. Randall
Brandt, “Understanding Your
Customers—What You Can
Learn from a Customer Loyalty
Index,” Marketing Tools (July/
August 1995), pp. 10–14.
CHAPTER 81. Barry J. Babin, Mitch Griffin, and
Joseph F. Hair, Jr., “Heresies and
sacred cows in scholarly market-
ing publications,” Journal of
www.MyEbookNiche.eCrater.com

403Endnotes
Freedom, Control and Fun,”
California Management Review
43, no. 2 (Winter 2001), pp. 34–55.
7. Mary C. Gilly and Mary
Wolfinbarger, “Advertising’s
Internal Audience,” Journal of
Marketing 62 (January 1998),
pp. 69–88.
8. Wolfinbarger and Gilly, “Shop-
ping Online for Freedom,
Control and Fun.”
9. Richard L. Celsi, Randall L.
Rose, and Thomas W. Leigh,
“An Exploration of High-Risk
Leisure Consumption through
Skydiving,” Journal of Con-
sumer Research 20, no. 1
(1993), pp. 1–23.
10. Robin A. Coulter, Linda L.
Price, and Lawrence Feick,
“Rethinking the Origins of
Involvement and Brand Commit-
ment: Insights from Post-socialist
Central Europe,” Journal of
Consumer Research 31, no. 2
(2003), pp. 151–69.
11. Hope J. Schau and Mary C.
Gilly, “We Are What We Post?
Self-Presentation in Personal
Web Space,” Journal of Con-
sumer Research 30, no. 3 (2003),
pp. 385–404; Albert M. Muniz
and Hope J. Schau, “Religiosity
in the Abandoned Apple Newton
Brand Community,” Journal of
Consumer Research 31, no. 4
(2005), pp. 737–47; Mary
Wolfinbarger, Mary Gilly, and
Hope Schau, “A Portrait of Ven-
turesomeness in a Later Adopting
Segment,” working paper 2006;
Lisa Penaloza, “Atravesando
Fronteras/Border Crossings: A
Critical Ethnographic Explora-
tion of the Consumer Accultura-
tion of Mexican Immigrants,”
Journal of Consumer Research
21, no. 1 (1993), pp. 32–54.
12. Anselm Strauss and Juliet
Corbin, Basics of Qualitative
Research: Grounded Theory
Procedures and Techniques
(Beverly Hills, CA: Sage,
1990).
13. Goldman and McDonald, The
Group Depth Interview; also
see Miles and Huberman, Qual-
itative Data Analysis.
Business Research, 69 (8)
(August 2016), pp. 3133–3138;
also Christie M. Fuller, Marcia J.
Simmering, Guclu Atinc, Yase-
min Atinc, and Barry J. Babin,
“Common method variance detec-
tion in business research,” Journal
of Business Research 69 (8)
(August 2016), pp. 3192–3198.
2. Harman, H.H. (1976), Modern
Factor Analysis, 3rd ed. (Chicago,
IL: The University of Chicago
Press, 1976).
3. Mario Callegaro, “Web Ques-
tionnaires: Tested Approaches
from Knowledge Networks for
the Online World,” Spring 2008,
www.knowledge networks.
CHAPTER 91. Diane M. Martin, John W.
Schouten, and James
McAlexander, “Claiming the
THrottle: Multiple Femininities
in a Hyper-Masculine Subcul-
ture,” Consumption, Markets and
Culture 9, no. 3 (2006), pp. 171–
205; Sam Bendall, RidaApart.
com, December 23, 2015,
“Female Motorcycle Ownership
Rise,” accessed April 8, 2016.
2. Barney G. Glaser and Anselm
Strauss, The Discovery of
Grounded Theory: Strategies for
Qualitative Research (Chicago,
IL: Aldine, 1967); also see
Anselm Strauss and Juliet M.
Corbin, Basics of Qualitative
Research: Grounded Theory
Procedures and Techniques
(Newbury Park, CA: Sage, 1990).
3. Alfred E. Goldman and Susan
Schwartz McDonald, The Group
Depth Interview: Principles and
Practice (Englewood Cliffs, NJ:
Prentice Hall, 1987), p. 161.
4. Matthew B. Miles and A.
Michael Huberman, Qualitative
Data Analysis: An Expanded
Sourcebook (Thousand Oaks,
CA: Sage, 1994).
5. Susan Spiggle, “Analysis and
Interpretation of Qualitative
Data in Consumer Research,”
Journal of Consumer Research
21, no. 3 (1994), pp. 491–503.
6. Mary Wolfinbarger and Mary
Gilly, “Shopping Online for
14. Miles and Huberman, Qualita-
tive Data Analysis.
15. Alfred E. Goldman and Susan
S. McDonald, The Group Depth
Interview (Englewood Cliffs,
NJ: Prentice Hall, 1987), p. 176.
16. Glaser and Strauss, The Discov-
ery of Grounded Theory; also
see Strauss and Corbin, Basics
of Qualitative Research.
17. Yvonne S. Lincoln and Egon G.
Guba, Naturalistic Inquiry (Beverly
Hills, CA: Sage, 1985), p. 290.
18. Caroline Stenbecka, “Qualita-
tive Research Requires Quality
Concepts of Its Own,” Manage-
ment Decision 39, no. 7 (2001),
pp. 551–55.
19. Glaser and Strauss, The Discov-
ery of Grounded Theory; also
see Strauss and Corbin, Basics
of Qualitative Research.
20. Goldman and McDonald, The
Group Depth Interview.
21. Ibid., p. 147.
22. Ibid., p. 175.
23. Rebekah Nathan, My Freshman
Year: What a Professor Learned
by Becoming a Student (Ithaca,
NY: Cornell University Press,
Sage House, 2005).
CHAPTER 101. Barry Deville, “The Data Assembly
Challenge,” Marketing Research
Magazine, Fall/Winter 1995, p. 4.
CHAPTER 111. For a more detailed discussion
of analysis of variance
(ANOVA), see Gudmund R.
Iversen and Helmut Norpoth,
Analysis of Variance (Newbury
Park, CA: Sage, 1987); and
John A. Ingram and Joseph G.
Monks, Statistics for Business
and Economics (San Diego,
CA: Harcourt Brace Jovanovich,
1989).
CHAPTER 131. David Corcoran, “Talking Numbers
with Edward R. Tufte; Campaign-
ing for the Charts That Teach,”
The New York Times, February 6,
2000, www.NYTimes.com.
2. Ibid.
www.MyEbookNiche.eCrater.com

404
Name Index
AAlexander, Lauri, 400
Alred, Gerald J., 400
Altman, Irwin, 401
Ariely, Dan, 6
Arnould, Eric J., 401
Atinc, G., 403
Atinc, Y., 403
BBabin, B., 403
Babin, Barry J., 402
Baker, Stephen, 401
Barzilay, Regina, 402
Bradlow, Eric T., 401
Brandt, D. Randall, 402
Brusaw, Charles T., 400
Burrows, David, 400
CCallegaro, Mario, 403
Cardwell, Annette, 15
Carnahan, Ira, 15
Celsi, Richard L., 401, 403
Cheng, Jacqui, 401
Childers, Terry L., 402
Coney, K. A., 402
Corbin, Juliet M., 403
Corcoran, David, 403
Coulter, Robin A., 403
Craig, C. Samuel, 5
DDalecki, M. G., 402
de Haaff, Michelle, 402
Denzin, Norman, 401
Deville, Barry, 403
Dickerson, M., 403
Douglas, Susan P., 4, 5
EEakin, Emily, 401
Ebest, Sally Barr, 400
Enos, Lori, 10
FFader, Peter S., 401
Fastoso, Fernando, 5
Feick, Lawrence, 403
Fuller, C., 403
GGarg, Rajendar K., 402
Geertz, Clifford, 401
Gilly, Mary C., 240, 244, 245, 401, 403
Glaser, Barney G., 403
Goldman, Alfred E., 401, 403
Green, Kathy E., 402
Griffin, Mitch, 402
Griffiths, Merlyn A., 401
Guba, Egon G., 401, 403
HHair, Joseph F., Jr., 402
Harman, H.H., 403
Harzing, Anne Wil, 5
Hausman, Angela, 401
Hawkins, Del I., 402
Hilaire, Chris, 400
Hoffman, Scott, 37
Huberman, A. Michael, 403
Hui, Sam K., 401
IIlvento, T. W., 402
Iversen, Gudmund R., 403
Iyangar, Sheena S., 400
KKozinets, Robert V., 99, 402
LLee, Lillian, 402
Leigh, Thomas W., 401, 403
Lepper, Mark R., 400
Lewin, Kurt, 9, 400
Lincoln, Yvonne, 401
Lincoln, Yvonne S., 403
Lopez, Ricardo, 100
MMandese, Joe, 37
Martin, Diane M., 403
McAlexander, James, 403
McDonald, Susan Schwartz, 401, 403
McFarland, Jennifer, 401
Miles, Matthew B., 403
Modahl, Mary, 401
Moore, D. E., 402
Muniz, Albert M., 403
Murphy, David, 401
NNathan, Rebekah, 403
Norpoth, Helmut, 403
OOhanian, Roobina, 402
Oliu, Walter E., 400
PPang, Bo, 402
Paul, Ian, 402
Penaloza, Lisa, 403
Perreault, W. D., 400
Petroshius, Susan M., 402
Pingitore, Gina, 400
Potter, Ned, 400
Poynter, Ray, 401
Price, Linda L., 403
Prus, Amanda, 402
RRegan, Keith, 10
Reiche, B. Sebastian, 5
Romero, Donna, 91
Rook, Dennis W., 401
Rose, Randall L., 401, 403
SSchau, Hope J., 403
Schindler, Robert M., 401
Schlack, Julie Wi, 401
Schneider, K. C., 402
www.MyEbookNiche.eCrater.com

405Name Index
Schouten, John W., 403
Schwab, Charles, 29
Seldin, Dan, 400
Sharma, Dinesh C., 401
Shulby, Bill, 25
Siama, Surinder, 401
Simon, Bryant, 401
Skinner, Steven J., 402
Smith, Steve, 400
Snyder, Benjamin, 402
Spiggle, Susan, 403
Spiro, Rosann L., 402
Stenbecka, Caroline, 403
Strauss, Anselm, 403
TThompson, Maryann J., 402
Tice, David C., 400
Townsend, Leslie, 402
Truchot, Didier, 401
Tufte, Edward R., 403
Turney, Peter, 401
UUrbanski, Al, 401
VVaithyanathan, Shivakumar, 402
Vartazarian, Allen, 400
Vega, Tanzina, 402
WWade, R. K., 400
Wade, Will, 15
Wallendorf, Melanie, 401
Walsh, Mark, 400
Whitelock, Jeryl, 5
Williams, Kaylene C., 402
Wilson, Elizabeth J., 401
Wind, Yoram, 4, 5
Wolfinbarger, Mary, 240, 244, 245, 401, 403
Wolverton, Troy, 10
Woodside, Arch G., 401
Wright, Kevin B., 402
Wu, Robert T. W., 402
ZZaltman, Gerald, 93, 401
www.MyEbookNiche.eCrater.com

406
Subject Index
AABI/Inform, 54, 56
Ability to participate, 121
Abstract constructs, 162
Accuracy, of secondary data, 52
Acme Rent-A-Car, 15
AC Nielsen, 11, 95
Adoption and diffusion theory, 9
Advertising
online, 37
Advertising Age study, 10
Africa, emerging market in, 4
Agree-Disagree scales, 161
Alternative hypothesis, 283
defined, 68
Amazon.com, 8, 10
Ambiguous questions, 182
American Airlines, 136
American Bank, Baton Rouge study, 193
American Business Lists, Inc., 138
American Express, 77
American Marketing Association (AMA)
code of ethics, 16
marketing research, defined, 5
Analysis of variance (ANOVA),
297–300
n-Way. See n-Way ANOVA
one-way, 297, 298
post-hoc, 300
reporting, 367–370
statistical significance in, 297–298
Analytics (application of statistics), 8
ANOVA. See Analysis of variance
(ANOVA)
Appendix, research report, 374
Apple, 77, 135
Arbitron Ratings, 11
Area sampling, 145
Attitude scales, 173–177
behavioral intention scale, 176–177
Likert scale, 173–174
semantic differential scale, 174–176
BBad questions, 197–198
Balanced scale, 170
Bank of America, 26
Bar charts, 362–364
and ANOVA reporting, 367–370
reporting crosstabs, 366–367
and t-test reporting, 367–370
Behavior
purchase, scanner data and, 247
scales used to measure, 173–177
Behavioral intention scale, 176–177
Behavioral targeting, 8
Believability, 356
Benefit and lifestyle studies, 9
Benito Advertising, 42
Beta coefficient, 333–334
defined, 333
Between-group variance, 297
Bias
questions and, 198
response order, 203
and secondary data evaluation, 52–53
Big data, 4
Bing, 56
Bivariate regression analysis, 328
defined, 328
SPSS application, 330–332
Bivariate statistical tests, 287–288
“Black-box” methodologies, 12–13
Blogs, 56
Bookmarking tools, 57
BP (British Petroleum), 90
Brainstorming, 65
Branded “black-box” methodologies, 13
Branding, 7
Brand management, 317–318
Brick-and-mortar stores, 49–50
Budget, survey research method selection
and, 118
Bulletin board format, 84
Burke, Inc.
customer loyalty prediction, 159–160
Secure Customer Index, 184–185
Burke Market Research, 11
Buzz marketing, 56
CCall records, 211
Careers, in marketing research, 22–23
Carolina Consulting Company, 25
Carter, Dan, 25
Case studies
defined, 91
Deli Depot, 267–270
early adopters of technology, 377–380
Lee Apparel Company, test marketing,
128–129
Santa Fe Grill Mexican Restaurant. See
Santa Fe Grill Mexican Restaurant
case study
Catalog of Government Publications, 58
Causal hypotheses, 65
Causal research, 122–127. See also
Survey research methods
defined, 37, 122
descriptive research vs., 122–123
experimentation in, 123–124
objective of, 77
value of, 108
Cell phones. See Mobile phones
Census
data, 57–58
defined, 38, 136
Central limit theorem (CLT), 138–139
Charts, preparation of, 281
Children’s Wish Foundation, 147
Chi-square analysis, 290–293
defined, 291
SPSS application, 292–293
value calculation, 291–292
ClickZ.com, 56
Client/research buyer
ethical issues with, 12
unethical activities of, 15
Closed-ended questions, 195
Cluster sampling
advantages, 146
area sampling, 145
defined, 145
disadvantages, 146
Coca-Cola, 26, 77, 89, 160
Codes
defined, 224
Code sheet, 224, 225
Codes of ethics, 16. See also Ethics
Coding, 256–259
defined, 256
www.MyEbookNiche.eCrater.com

407Subject Index
example, 226
selective, 227–228
Coefficient alpha, 168
Coefficient of determination, 325
Commercial (syndicated) data. See
Syndicated data
Common methods variance (CMV),
203–205
Communispace, 100
Comparative rating scale
constant-sum scales, 178, 179
defined, 177
examples of, 179
rank-order scales, 178
Completion time frame, survey research
method selection and, 118
Complex questions, 183
Computer-aided telephone interviewing
(CATI), 5, 113–114
ComScore, 135
Concept testing, 7
Conceptualization, 66
Conceptual Model
development of, 63–67
hypotheses and. See Hypothesis
Conclusion drawing, in qualitative research,
231–235
Conclusions, research report, 372–373
Consistency, of secondary data, 52
Constant-sum scales, 178, 179
Construct development, 161–163
Constructs
abstract, 162
defined, 63, 161
development of, 161–163
in hypotheses, 66
list of, 34
marketing maven, 63, 64
Consumer culture/subculture, 4, 6
Consumer panels, 60–61
Consumer privacy, data collection tools and, 4
Consumer Report on Eating Share Trends
(CREST), 60
Contact records, 211
Content analysis, 89
Content validity, 169
Control variables, 124
Convenience sampling
advantages, 146
defined, 146
disadvantages, 146
Convergent validity, 169
Cookies, computer, 26
Correlation analysis, 322–327
influence of measurement scales on,
326–327
Pearson correlation coefficient, 322–325
Cosmetics, post-socialist European women’s
involvement with, 234–235
Covariation, 319–322
defined, 319
scatter diagram, 319
and variable relationships, 319–322
Cover letter
defined, 208
guidelines for developing, 208
usage, 209
Creative and Response Research
Services, 61
Credibility
cross-researcher reliability, 232
defined, 233, 356
emic validity, 232
in qualitative research, 231–235
of secondary data, 52
triangulation, 233, 235
Critical thinking, and marketing
research, 357
Cross-researcher reliability, 232
Cross-tabulation, 261, 288–290
Cultural differences, marketing research
and, 4
Curbstoning, 13, 249
Curvilinear relationship, 318, 321
Customer loyalty
Santa Fe Grill Mexican Restaurant,
159–160
Customer privacy, ethical issues with, 15
Customer satisfaction surveys, 36
Customized research firms, 11
DData
census, 57–58
completeness of, 118–119
from data warehouses, 258
deanonymizing, 15
“found,” 79
generalizability, 119
interpretation, and knowledge creation, 40
missing, 259–261
organizing, 261
precision, 119
preparation. See Data preparation
primary. See Primary data
scanner, and purchase behavior, 247
secondary. See Secondary data
syndicated, 59–60
transformation into knowledge, 30–31
visual display of, 353
Data analysis
bar charts. See Bar charts
components of, 224
data reduction. See Data reduction
pie charts, 364–365
qualitative. See Qualitative data analysis
quantitative. See Quantitative data analysis
reporting frequencies, 361–362
in research design phase, 39
Data coding. See Coding
Data collection
consumer panels, 60–61
interviewer instructions, 211
qualitative data. See Qualitative data
collection methods
questionnaire design, 194
in research design phase, 39
screening questions, 211
supervisor instructions, 210
tools. See Data collection tools
wireless phone survey, 114–115
Data collection tools
challenges with digital technology, 4
consumer privacy and, 4
Data display, 230–231
types of, 231
Data editing. See Editing, data
Data entry, 259–261
defined, 259
error detection, 259
missing data, 259–261
organizing data, 261
Data mining, 317–318
Data preparation, 248–249
coding, 256–259
data entry, 259–261
editing, 251–255
validation, 249–251
Data reduction, 223–230
categorization, 224, 226–227
comparison, 227
defined, 224
integration, 227
iteration, 228
negative case analysis, 228
tabulation, 228–230
Data tabulation. See Tabulation, in
qualitative data analysis; Tabulation, in
quantitative data analysis
Data validation, 249–251
completeness, 250
courtesy, 250
curbstoning, 249
defined, 249
fraud, 250
procedure, 250
process of, 250–251
screening, 250
Data warehouses, data from, 258
Deanonymizing data, 15
Debriefing analysis, 89
Defined target population, 137
Dell Computers, 26
Dependent variables
defined, 63, 122
Depth interviews. See In-depth interviews (IDI)
Descriptive hypotheses, 64
www.MyEbookNiche.eCrater.com

408 Subject Index
Descriptive research, 36–37. See also Survey
research methods
causal research vs., 122–123
defined, 36
objective of, 77
and surveys. See Surveys
value of, 108
Descriptive statistics, 264–266. See also
Cross-tabulation; One-way tabulation
Desk research, 50. See also Secondary data
Discriminant validity, 169
Discriminatory power, 170
Disproportionately stratified sampling, 143
Distribution
marketing research applied to, 7–8
Diversity, respondent, 120
Do-it-yourself (DIY) research, 6
Double-barreled questions, 181–182, 197
Doubleclick, 14
Double negative question, 183
Drop-off survey, 116
DVRs, 62
EEasyJet, 90
Editing, data
and data preparation, 251–255
defined, 251
Emic validity, 232
Equivalent form reliability technique, 168
Error detection, 259
Errors
nonsampling, 110
sampling, 109–110, 139
ESOMAR, 16
E-tailers/e-tailing, 8
E-tailing, 10
Ethics, 12–16
branded “black-box” methodologies, 13
client/research user, unethical activities
of, 15
codes of ethics, 16
curbstoning, 13
data privacy, 15
deanonymizing data, 15
in general business practices, 12–13
and professional standards, 13–14
respondent abuse, 14–15
sources of issues, 12
unethical activities by respondents, 16
Ethnography, 9
defined, 91
nonparticipant observation, 91
participant observation, 91
Executive summary, 358–359
defined, 358
purpose of, 358
Experimental research. See also Causal
research
test marketing. See Test marketing
types of, 126
validity concerns with, 124–126
variables, 123, 124
Experiments
defined, 122
field, 127
laboratory, 127
Exploratory research
defined, 36
focus group interviews, 82–89
in-depth interviews, 81–82
netnography, 99
objectives, 36
observation methods. See Observation
methods
qualitative research methods, 76–93
sentence completion tests, 93
word association tests, 92
Zaltman Metaphor Elicitation
Technique, 93
External research providers, 10–11
External secondary data, 54–62
defined, 50
government sources, 57–58
popular sources, 54, 56–57
scholarly sources, 57
syndicated data, 59–60
External validity, 125, 126
Extraneous variables, 124
FFacebook, 97
Facebook, impact on data collection, 4
Face validity, 169
Fair Isaac & Co., 273
Federal Express, marketing careers at,
22–23
Field experiments, 127
Final research report, 41
Focus group interviews, 82–89
advantages of, 89
analyzing results, 89
bulletin board format, 84
conducting discussions, 87–88
content analysis, 89
debriefing analysis, 89
groupthink, 89
locations, 86
number of participants, 84
participants, 85–86
phases for conducting, 84–89
planning phase, 85–86
purposive sampling, 86
size of, 86
stratified purposive sample, 86
theoretical sampling, 86
Focus group moderator
defined, 87
guide for, 87
in main session, 88
Focus group research, 5. See also Focus
group interviews
defined, 82
Follow-up tests, 299
Forced-choice scale, 171
Ford Motor Company, 211
Format, research report, 357–374
appendix, 374
conclusions and recommendations, 372–373
data analysis and findings, 361–372
executive summary, 358–359
introduction, 359–360
limitations, 374
methods-and-procedures section, 360
table of contents, 358
title page, 358
Frequency distribution, 172
Frugging, 14
F-test, 297
GGatekeeper technologies, 26
Generalizable data, 119
Geofencing, 3
Gfk Research, 4
GfK Roper Consulting, 61
Globalization, challenges to marketing
research, 26
Godiva Chocolates, 90
Google, 8, 56
Android-based G1, 135
Google Scholar, 57, 69
Government sources, external secondary
data, 57–58
GPS system, 15
Graphic rating scales, 177–178
Grounded theory, 222
Group depth interview. See Focus group
interviews
Groupthink, 89
HHarmon One Factor test, 204, 205
Harris Interactive, 5
Heteroskedasticity, 335
Hibernia National Bank, 163
Hispanics, and qualitative research, 100
The Home Depot, 90
Homoskedasticity, 335
Hypothesis
alternative. See Alternative hypothesis
causal, 65
constructs in, 66
defined, 67
descriptive, 64
development of, 281–283
formulating, 64
www.MyEbookNiche.eCrater.com
409Subject Index
null. See Null hypothesis
projective, 93
testing. See Hypothesis testing
Hypothesis testing, 67–68
parameter, 68
sample statistic, 68
IIBM, 10, 26
Iceberg principle, 32, 33
Image assessment surveys, 36
Image positioning, Remington’s Steak
House, 306–312
Incidence rate, 120–121
Independent samples
defined, 294
related samples vs., 293–294
t-test, 295–296
Independent variables
defined, 63, 122
In-depth interviews (IDI), 75, 76
advantages of, 82
characteristic of, 82
defined, 81
as qualitative data collection method,
81–82
skills required for conducting, 82
steps in conducting, 82, 83
Information overload theory, 9
Information research process
defined, 27
need for, 27–29
overview, 29–31
phases of. See Phases, of research process
primary data sources, 26
sampling as part of, 136–137
scientific method, 30
secondary data sources, 26
transforming data into knowledge, 30–31
value of measurement in, 160
In-home interview, 111
Inner model, 342
Integration, 227
Interaction effect, 301
Interactive Advertising Bureau (IAB), 51, 57
Internal consistency, scale reliability, 168
Internal research providers, 10
Internal secondary data, 54
defined, 50
list of, 55
Internal validity, 125
International marketing research, challenges
of, 4–5
Internet
deanonymizing data, 15
geofencing, 3
mobile searches, 135–136
netnography, 99
online surveys, 116–118
search engine marketing, 135
social media monitoring, 97–98
Internet marketing research, 12
Internet surveys. See Online surveys
Interpersonal communication skills, for in-
depth interview, 82
Interpretive skills, for in-depth
interview, 82
Interval scales
defined, 165
examples of, 166
overview, 165–166
Interviewer instructions, 211
Interviews
computer-assisted telephone, 5, 113–114
curbstoning, 13
in-depth. See In-depth interviews (IDI)
in-home, 111
mall-intercept, 112
subject debriefing, 14
sugging/frugging, 14
Introduction, research report, 359–360
Introductory section, questionnaires, 203
iPhone, 135
Iteration, 228
JJ. D. Power and Associates, 61, 77, 137
Johnson Properties, Inc., 42
Judgment sampling, 147
KKISS (Keep It Simple and Short) test, 207
Knowledge
creation, data interpretation and, 40
defined, 30
transforming data into, 30
Knowledge level, respondents, 121–122
Kodak, 10
Kraft Foods, 10, 90
LLaboratory (lab) experiments, 126–127
Latin America, emerging market in, 4
Leading/loaded questions, 197
Leading question, 182
Least squares procedure, 329
Lee Apparel Company, 128–129
Lexus/Nexus, 54, 56
Likert scale, 117, 173–174
Limitations, research report, 374
Linear relationship
defined, 318
Listening platform/post, 98
Listening skills, for in-depth interview, 82
Literature reviews, 34–35
conducting, 51–54
constructs and, 63–64
defined, 51
Santa Fe Grill Mexican Restaurant case
study, 69
secondary data sources, evaluation of,
51–53
secondary research for, 62–63
value of, 50–51
Loaded question, 182
Loitering time, 3
Lotame Solutions, Inc., 36, 37
Lowe’s Home Improvement, Inc., 35
MMagnum Hotel
loyalty program, 107–108
Preferred Guest Card Program, 42–44
Mail panel survey, 116
Mail surveys, 116
Mall-intercept interview, 112
Mapping, perceptual. See Perceptual
mapping
Marketing blogs, 56
Marketing maven construct, 63, 64
Marketing mix variables, marketing research
and, 6–9
Marketing research
critical thinking and, 357
defined, 5
distribution decisions, 7–8
ethics in. See Ethics
and four Ps, 6
growing complexity of, 4–5
industry. See Marketing research industry
international, 4–5
and marketing mix variables, 6–9
pricing decisions, 8
process. See Marketing research process
promotional decisions, 8
questionnaires in. See Questionnaires
role and value of, 6–10
role of secondary data in, 50–51
sampling in. See Sample/sampling
situations when not needed, 28
Marketing Research Association (MRA), 15
Marketing researchers, management
decision makers vs., 28
Marketing research ethics. See Ethics
Marketing research industry
careers in, 22–23
changing skills and, 11
types of, 10–11
Marketing research process, 5. See
Information research process
changing view of, 26–27
phases of. See Phases, of research process
secondary data and, 53–54
Marketing research report. See Research report
Marketing Research Society, 16
Marketing research tools, 6
Marketing Resource Group (MRG), 43, 107
www.MyEbookNiche.eCrater.com

410 Subject Index
Marketing Science Institute (MSI.org), 9
Marketing theory
examples of, 9
Market segmentation research, 9
Marriott Hotels, 26
Mazda Motor Corporation, 137
McDonald’s, 26, 281–282
Mean, 274–275
analysis of variance. See Analysis of
variance (ANOVA)
comparing means, 293–297
defined, 274
n-Way ANOVA, 303–304
Measurement. See also Constructs; Scale
measurement
defined, 160
process, overview of, 160–161
value in information research, 160
Measures of central tendency, 172, 274–277
mean. See Mean
median. See Median
mode. See Mode
SPSS applications, 276
Measures of dispersion, 172, 277–280
range, 277–278
SPSS applications to calculate, 278–279
standard deviation, 278–279
variance, 279
Median
defined, 275
Media panels, 61
Member checking, 222
Memoing, 228
Mercedes-Benz, 87
Methods-and-procedures section, 360
Middle East, emerging market in, 4
Mintel, 61
Missing data, 259–261
Mobile phones. See also Wireless phone
survey
used while shopping, 49–50
with web interactions, 135–136
Mode, 275–276
defined, 275
Model F statistic, 334
Moderators. See Focus group moderator
Moderator’s guide, 87
MPC Consulting Group, 191
Multicollinearity, 338
Multiple-item scale, 180
Multiple regression analysis, 333–338
assumptions, 335
beta coefficient, 333–334
defined, 333
SPSS application, 335–338
statistical significance, 334
substantive significance, 334
Multisource sampling, 143
Mystery shopping, 5
NNAICS (North American Industry
Classification System) codes, 59
Namestomers, 7, 11
Narrative inquiry, 75
National Eating Trends (NET), 60
National Hardwood Lumber Association, 53
Natural language processing (NLP), 98
Negative case analysis, 228
Negative relationship
covariation, 320, 321
defined, 65
Netnography, 99
Neuromarketing, 4
The New York Times, 56
NFO (National Family Opinion), 26
Nominal scales
defined, 164
examples of, 164
Noncomparative rating scales
defined, 177
graphic rating scales, 177–178
Nonforced-choice scale, 171
Nonparticipant observation, 91
Nonprobability sample size, 150
Nonprobability sampling
convenience sampling, 146
defined, 140
judgment sampling, 147
quota sampling, 147
in research design development, 38
snowball sampling, 147
Nonresponse error, 110
Nonsampling errors, 110, 139–140
defined, 139
nonresponse error, 110
respondent errors, 110
response error, 110
Normal curve, 335
North American Industry Classification
System (NAICS) codes, 59
Novartis, 90
NPD Group, 60
Null hypothesis, 283
for ANOVA, 297
defined, 68
for Pearson correlation coefficient, 322
n-Way ANOVA, 300–305
defined, 300
interaction effect, 301
means, 303–304
perceptual mapping, 304–305
SPSS application, 301–302
OObjectives, research. See Research objectives
Observation methods, 93–99
benefits of, 97
characteristics of, 94, 95
limitations of, 97
listening platform/post, 98
selection of, 96–97
social media monitoring, 97–98
types of, 94–96
Observation research
defined, 94
methods. See Observation methods
overview, 93–94
One-on-one interviews. See In-depth
interviews; In-depth interviews (IDI)
One-way ANOVA, 297, 298
One-way tabulation, 261–264
Online focus groups, 84
bulletin board format, 84
disadvantage of, 84
Online research
retailing research, 8
Online surveys, 116–118
considerations, 205–207
defined, 116
propensity scoring, 118
Open-ended questions
responses to, 255
unstructured questions as, 195
Opinion mining, 98
Optimal allocation sampling, 143
Oral presentation, guidelines for preparing,
375–376
Ordinal scales
defined, 164
examples of, 165
overview, 164–165
Ordinary least squares, 330
Outer model, 342
PPaired sample, 294
t-test, 296
Parameter, 68
Participant observation, 91
Participants, in focus group, 85–86
PathTracker, 96
Pearson correlation coefficient, 322–325
Peer review, 235
People for the Ethical Treatment of Animals
(PETA), 53
Perceptual mapping, 304–305
applications in marketing research, 305
defined, 7
Person-administered survey methods
advantages of, 112
defined, 111
disadvantages of, 112
in-home interview, 111
mall-intercept interview, 112
Petesting, questionnaires, 39
Pew American and Internet Life, 49
Phases, of research process, 29–41
www.MyEbookNiche.eCrater.com
411Subject Index
communicate results, 40–41
research design, selection of. See
Research design
research problem, determination of,
31–36. See also Research problem
determination
Phone surveys. See Telephone-administered
surveys
Pie charts, 364–365
Pilot studies, 192–193, 207
Place, marketing research applied to, 6, 7–8
PlayStation Underground, 27
Population
defined, 137
defined target. See Defined target population
in sampling theory, 137
Population parameter, 283
Population variance, 148
Positioning, 7
Positive relationships, 65
Precision
data, 119
defined, 148
Predictably Irrational (Ariely), 6
Presentation, research report, 375–376
oral, guidelines for preparing, 375–376
visual, guidelines for preparing, 376
Pretesting questionnaires, 193, 207
Price/pricing
e-tailing, 10
marketing research applied to, 6, 8
unethical, 13
Primary data
defined, 26
qualitative research, 76
research design selection, 37–38
Privacy issues
ethical challenges, 15
gatekeeper technologies and, 26
Private communities, 89–90
Probability sample size, 148–150
Probability sampling
cluster sampling, 145–146
defined, 140
in research design development, 38
simple random sampling, 140–141
stratified random sampling, 143–145
systematic random sampling, 141–142
Procter & Gamble (P&G), 10, 90, 317–318
Product, marketing research applied to, 6–7
Product dissatisfaction, 239–240
Product testing, 7
Projective hypothesis, 93
Projective techniques
defined, 92
disadvantage of, 92
sentence completion tests, 93
word association tests, 92
Zaltman Metaphor Elicitation Technique, 93
Project Planet, 5
Promotion, marketing research applied to, 6, 8
Propensity scoring, 118
Proportionately stratified sampling, 143
Purposed communities, 89
Purposive sampling, 86
QQuaker Oats, 120
Qualitative data analysis
categorization, 224, 226–227
code sheet, 224
conclusion drawing/verification,
231–235
data display, 230–231
grounded theory, 222
member checking, 222
nature of, 222
process of, 223–235
quantitative analysis vs., 222–223
research reports. See Research report, in
qualitative research
triangulation, 233, 235
Qualitative data collection methods
focus group interviews, 82–89
in-depth interviews, 81–82
Qualitative research, 4. See also Exploratory
research
advantages of, 80
case study. See Case studies
credibility in, 231–235
defined, 79
disadvantages of, 80
ethnography, 91
Hispanics and, 100
overview of, 78–80
private communities, 89–90
and product dissatisfaction, 239–240
projective techniques, 92–93
purposed communities, 89
quantitative research vs., 78
samples in, 38
value of, 76–77
QualKote Manufacturing, 345–347
Qualtrics, 117
QualVu, 84
Quantitative data analysis. See also
Statistical analysis
coding, 256–259
data entry, 259–261
data preparation, 248–249
data tabulation, 261–266
Deli Depot examples, 267–270
editing, 251–255
grounded theory, 222
qualitative data analysis vs., 222–223
validation, 249–251
Quantitative research, 4. See also
Quantitative data analysis
defined, 77
goals of, 78
listening platform/post, 98
opinion mining, 98
overview of, 77–78
qualitative research vs., 78
sentiment analysis, 98
social media monitoring, 97–98
Questionnaire design, 39, 193–207
American Bank example, 193–207
bad questions in, 197–198
call records, 211
common methods variance, 203–205
considerations in, 205
cover letter, 208, 209
data collection methods, 194
evaluating, 203–207
example of banking survey, 199–202
implementation of survey, 207
online survey considerations, 205–207
question/scale format, 197–198, 203
quotas, 211
research questions section, 203
response order bias, 203
screening questions, 203
sensitive questions in, 195
skip questions, 198
steps in, 193
Questionnaires
defined, 192
Deli Depot example, 269–270
design. See Questionnaire design
electronic products opinion survey,
378–379
introductory section, 203
petesting, 39
pilot study, 192–193
pretesting, 193
samples and, 136–137
“smart,” 204
wording of, 195, 196–197
Questions
ambiguous, 182
bad, 197–198
and bias, 198
closed-ended, 195
complex, 183
double-barreled, 181–182, 197
double negative, 183
leading, 182
leading/loaded, 197
loaded, 182
open-ended. See Open-ended questions
screening, 203, 211
sensitive, 195
skip, 198
structured, 195, 196
unanswerable, 197
unstructured, 195
www.MyEbookNiche.eCrater.com

412 Subject Index
Quotas, 211
Quota sampling, 147
RRange, 277–278
Rank-order scales, 179
Ratio scales
defined, 166
examples of, 167
overview, 166
Recommendations, research report, 372–373
Recursive relationship, 227
Referral sampling, 147
Regression analysis, 327–338
beta coefficient, 333–334
bivariate, 328
fundamentals of, 328–330
least squares procedure, 329
multiple. See Multiple regression analysis
ordinary least squares, 330
regression coefficients, 330
straight line relationship, 329
structural modeling, 339–344
unexplained variance, 329
Regression coefficients
beta coefficient, 333–334
defined, 330
statistical significance of, 332–333
Related samples
defined, 294
independent samples vs., 293–294
Relationships
and conceptualization, 66
correlation analysis, 322–327
curvilinear, 318, 321
defined, 63
linear, 318
negative. See Negative relationship
positive, 65
regression analysis, 327–338
strength of association, 318
between variables, 318–319
Reliability
cross-researcher, 232
scale measurement, 167–168
Remington’s Steak House, 306–312
Research design
causal, 37
data analysis, 39
data collection/preparation, 39
data sources, 37–38
descriptive, 36–37
execution of, 39–40
exploratory, 36
measurement issues and scales, 38–39
overview of, 77
sampling design/size, 38
selection of, 36–39
Research firms, ethical issues with, 13
Research objectives
causal research, 77
descriptive research, 77
questionnaire development, 193–194
Research problem determination, 31–36
iceberg principle, 32, 33
identify and separate out symptoms,
32–33
information needs, identification/
clarification, 32–34
information value, 36
relevant variables, determination of, 34
research objectives, specification, 36
research questions, 34–35
research request, purpose of, 32
situation analysis, 32
unit of analysis, determination of, 34
Research proposal, 10
defined, 41
development of, 41
example, 42–44
outline of, 40
Research questions, defining, 34–35
Research questions section, 203
Research report
conclusions, 237
data/findings, analysis of, 236–237
format of. See Format, research report
introductory portion of, 236
objectives, 354–357
presentation of. See Presentation,
research report
problems in preparing, 374–375
recommendations, 237
value of, 354
writing, 235–237
Respondent errors, 110
Respondents
ability to participate, 121
abuse of, 14–15
characteristics, 120–122
diversity of, 120
ethical issues with, 12
incidence rate, 120–121
knowledge level, 121–122
participation, 121–122
unethical activities by, 16
willingness to participate, 121
Response error, 110
Response order bias, 203
Retail Diagnostics Inc., 11
Retailing research, 8
Rocking-chair interviewing, 13
SSample/sampling, 4
defined, 38, 136
design, development of, 38
errors, 109–110
independent vs. related, 293–294
nonprobability sampling. See
Nonprobability sampling
paired, 294
as part of research process, 136–137
plans. See Sampling plans
probability. See Probability sampling
purposive, 86
quality assessment tools, 139–140
and questionnaires design, 136–137
size. See Sample size
SPSS to select, 151
stratified purposive, 86
theoretical, 86
theory. See Sampling theory
value of, 136–137
Sample size
determination, 148–151
nonprobability, 150
population variance, 148
probability, 148–150
sampling from small population, 150
Sample statistic
defined, 68
Sampling error, 109–110
defined, 139
Sampling frame
defined, 138
sources of, 138
Sampling plans
defined, 152
probability, 38
steps in developing, 152–153
Sampling theory, 137–140
central limit theorem, 138–139
factors underlying, 138–139
population, 137
sampling frame, 138
terminology, 137
Sampling units
defined, 137
Santa Fe Grill Mexican Restaurant case
study, 17, 18–19
customer loyalty, 159–160
customers surveys, 19, 139
database, splitting, 276
employee questionnaire, 252–254
literature review, 69
n-Way ANOVA results, 302
proposed variables, 92
qualitative research, usage of, 238
questionnaire design, 212–216
and research questions/hypotheses
development, 67
sampling plan development, 154
and secondary data usage, 58
systematic random sample for, 142
Scale descriptors
balanced scale, 170
www.MyEbookNiche.eCrater.com

413Subject Index
defined, 163
discriminatory power of, 170
forced-choice scale, 171
graphic rating scale, 177–178
nonforced-choice scale, 171
unbalanced scale, 170
Scale development, 169–173
adapting established scales, 172–173
balanced scale, 170
criteria for, 169–172
discriminatory power of scale descriptors,
170
forced-choice vs. nonforced scale
descriptors, 171–172
measures of central tendency and
dispersion, 172
negatively worded statements, 172
questions, understanding of, 169–170
unbalanced scale, 170
Scale measurement, 163–167
clear wording for scales, 180
defined, 163
development of. See Scale development
interval scales, 165–166
multiple-item scale, 180
nominal scale, 164
ordinal scale, 164–165
scale descriptors, 163
scale points, 163–164
single-item scale, 180
Scale points, 163–164
defined, 163
Scale reliability, 167–168
coefficient alpha, 168
defined, 167
equivalent form technique, 168
internal consistency, 168
split-half test, 168
test-retest technique, 167–168
Scale validity, 168–169
content validity, 169
convergent validity, 169
discriminant validity, 169
face validity, 169
Scanner-based panels, 95–96
Scanner data, and purchase behavior, 247
Scanner technology, 95–96
scanner-based panels, 95
Scatter diagram
defined, 319
negative relationship, 320, 321
Scheffé procedure, 299
Scholarly sources, 57
Scientific method, 30
Scientific Telephone Samples, 138
Screening questions, 203, 211
Search engine marketing (SEM), 135
Secondary data
additional sources of, 55
defined, 26, 50
external. See External secondary data
government reports used as sources, 58
internal. See Internal secondary data
and marketing research process, 53–54
research design selection, 37–38
role of, 50–51
search, variables sought in, 53
sources. See Secondary data sources
study using, 49–50
Secondary data sources. See also Literature
review
consumer panels, 60–61
evaluation of, 51–53
media panels, 61
store audits, 62
triangulating, 62
Secure Customer Index (SCI), 184–185
Segmentation studies, 9
Selective coding, 227–228
Self-administered survey, 115–118
advantages of, 115
defined, 115
disadvantages of, 115
drop-off survey, 116
mail panel survey, 116
mail surveys, 116
online survey, 116–118
Semantic differential scale, 174–176
Sensitive questions, 195
Sentence completion tests, 93
Sentiment analysis, 98
Services marketing research, 9
Shopper marketing, 8
Short-term private communities, 90
Simple random sampling
advantages of, 141
defined, 140
disadvantages of, 141
Single-item scale, 180
Situation analysis, 32
Skip questions, 198
“Smart” questionnaires, 204
Snowball sampling, 147
Social media monitoring, 97–98
Sony, 27
Spearman rank order correlation coefficient,
326–327
Split-half test, 168
SPSS (Statistical Product and Service
Solution)
ANOVA, 298–300
bivariate regression analysis, 330–332
to calculate measures of central tendency,
276
to calculate measures of dispersion,
278–279
Chi-square analysis, 292–293
independent samples t-test, 295–296
n-way ANOVA, 301–302
paired samples t-test, 296
Pearson correlation coefficient, 323–325
sample selection, 151
Standard deviation, 278–279
Standardized research firms, 11
Starbucks, 3, 75, 297
Statistical analysis
analysis of variance. See Analysis of
variance (ANOVA)
bivariate statistical tests, 287–288
charts, 281
chi-square analysis, 290–293
cross-tabulation, 288–290
facilitating smarter decisions, 273
hypotheses. See Hypothesis
independent vs. related samples, 293–294
measures of central tendency, 274–277
measures of dispersion, 277–280
n-Way ANOVA, 300–305
Remington’s Steak House example,
306–312
sample data, analyzing relationships of,
283–300
statistical technique, selection of,
283–285
univariate statistical tests, 286–287
value of, 274–281
Stealth marketing, 56
Store audits, 62
Stratified purposive sample, 86
Stratified random sampling, 143–145
advantages, 144–145
defined, 143
disadvantages, 144–145
disproportionately, 143
multisource, 143
optimal, 143
proportionately, 143
steps in drawing, 143, 144
Structural modeling, 339–344
example of, 341–344
Structured questions, 195, 196
Subject debriefing, 14
Sugging, 14
Supervisor instruction form, 210
Survey Gizmo, 117
surveygizmo.com, 117
Surveymonkey.com, 117
Survey research
central limit theorem, 138
and university residence life plans,
191–192
Survey research methods
advantages of, 109
defined, 109
disadvantages of, 109
errors in, 109–110
person-administered, 111–112
www.MyEbookNiche.eCrater.com

414 Subject Index
Survey research methods (Continued)
respondent characteristics, 120–122
selection of, 118–122
self-administered, 115–118
situational characteristics, 118–119
task characteristics, 119–120
telephone-administered, 112–115
types of, 110–118
Survey Sampling, Inc., 138
Survey Sampling Inc., 11
Survey Sampling International (SSI), 136
Syndicated business services, 11
Syndicated data, 59–60
companies, 61
consumer panels, 60–61
defined, 60
media panels, 61
Systematic random sampling
advantages of, 141
defined, 141
disadvantages of, 141
steps in drawing, 142
TTable of contents, research report, 358
Tabulation, in qualitative data analysis
role of, 228–230
Tabulation, in quantitative data analysis,
261–266
cross-tabulation, 261
defined, 261
descriptive statistics, 264–266
graphical illustration of data, 264
one-way, 261–264
Target population
defined, 38
Task characteristics, and survey research
methods selection, 119–120
Technology
and complexity of marketing research, 4
gatekeeper technologies, 26
marketing research on early adopters of,
377–380
Technology-mediated observation, 94–95
Telephone-administered surveys
computer-assisted telephone interviews,
113–114
defined, 112
wireless phone survey, 114–115
Territorial behavior, 75–76
Test marketing
defined, 127
Lee Apparel Company example, 128–129
Test-retest reliability technique, 167–168
Theoretical sampling, 86
“Third places,” 75–76
Threadless.com, 117
3Com, 5
Thriving on Chaos (Peters), 273
Time Spent methodology, 36, 37
Title page, of research report, 358
Topic sensitivity, 120
Total variance, 297
Triangulation, 233, 235
TSN Global, 60
t-test, 294–296
defined, 294
independent samples, 295–296
paired samples, 296
reporting, 367–370
Twitter, 4, 97
UUnanswerable questions, 197
Unbalanced scale, 170
Underground marketing, 56
Unexplained variance, 329
Unit of analysis, 34
Univariate statistical tests, 286–287
SPSS application, 287
Unstructured questions, 195
UpSNAP, 135
U.S. Census Bureau, 57, 192
U.S. Television Index (NTI) system, 95
VValidity, 124–126
defined, 125
emic, 232
external, 125, 126
internal, 125
scale, 168–169
Variables
causal research design, 123
and conceptualization, 66
control, 124
defined, 63, 123
dependent. See Dependent variables
extraneous, 124
independent. See Independent variables
indicator, 161
list of, 34
negative relationships, 65
positive relationship, 65
relationships between, 318–319
relevant, determination of, 34
in secondary data search, 53
Variance, 279
unexplained, 329
Verbatims, 237
Verification, qualitative research,
231–235
Verizon, 90
VideoDiary, 84
Visual presentation, guidelines for
preparing, 376
WThe Wall Street Journal, 56
Walmart, 26, 90, 247
Web-based bookmarking tools, 57
Willingness to participate, 121
Wireless phone survey, 114–115
Within-group variance, 297
Word association tests, 92
Wording, of questionnaires, 195, 196–197
Worldwide, Inc., 26
YYahoo!, 56
Youthbeat, 61
ZZaltman Metaphor Elicitation Technique
(ZMET), 93
Zoomerang.com, 117
www.MyEbookNiche.eCrater.com