
Marketing Research An Applied Approach Fifth Edition - NIBM ...
976
MARKETING RESEARCH FIFTH EDITION AN APPLIED APPROACH NARESH K. MALHOTRA DANIEL NUNAN • DAVID F. BIRKS
-
Upload
khangminh22 -
Category
Documents
-
view
0 -
download
0
Transcript of Marketing Research An Applied Approach Fifth Edition - NIBM ...

MARKETINGRESEARCHFIFTH EDITION
AN APPLIED APPROACH
NARESH K. MALHOTRA DANIEL NUNAN • DAVID F. BIRKS

Marketing researchan applied approach

At Pearson, we have a simple mission: to help peoplemake more of their lives through learning.
We combine innovative learning technology with trustedcontent and educational expertise to provide engagingand effective learning experiences that serve people
wherever and whenever they are learning.
From classroom to boardroom, our curriculum materials, digitallearning tools and testing programmes help to educate millionsof people worldwide – more than any other private enterprise.
Every day our work helps learning flourish, andwherever learning flourishes, so do people.
To learn more, please visit us at www.pearson.com/uk

Marketing researchan applied approachFiFth edition
Naresh K. MalhotraDaNiel NuNaNDaviD F. BirKs
Harlow, England • London • New York • Boston • San Francisco • Toronto • Sydney • Dubai • Singapore • Hong Kong Tokyo • Seoul • Taipei • New Delhi • Cape Town • São Paulo • Mexico City • Madrid • Amsterdam • Munich • Paris • Milan

Pearson Education LimitedEdinburgh GateHarlow CM20 2JEUnited KingdomTel: +44 (0)1279 623623Web: www.pearson.com/uk
Original 6th edition entitled Marketing Research: An Applied Orientation published by Prentice Hall Inc., a Pearson Education companyCopyright Prentice Hall Inc.
First edition published 2000 (print)Second edition published 2003 (print)Third edition published 2007 (print)Fourth edition published 2012 (print)Fifth edition published 2017 (print and electronic)
© Pearson Education Limited 2000, 2003, 2007, 2012 (print)© Pearson Education Limited 2017 (print and electronic)
The rights of Naresh K. Malhotra, Daniel Nunan, David F. Birks and Peter Wills to be identified as authors of this work has been asserted by them in accordance with the Copyright, Designs and Patents Act 1988.
The print publication is protected by copyright. Prior to any prohibited reproduction, storage in a retrieval system, distribution or transmission in any form or by any means, electronic, mechanical, recording or otherwise, permission should be obtained from the publisher or, where applicable, a licence permitting restricted copying in the United Kingdom should be obtained from the Copyright Licensing Agency Ltd, Barnard’s Inn, 86 Fetter Lane, London EC4A 1EN.
The ePublication is protected by copyright and must not be copied, reproduced, transferred, distributed, leased, licensed or publicly performed or used in any way except as specifically permitted in writing by the publishers, as allowed under the terms and conditions under which it was purchased, or as strictly permitted by applicable copyright law. Any unauthorised distribution or use of this text may be a direct infringement of the authors’ and the publisher’s rights and those responsible may be liable in law accordingly.
All trademarks used herein are the property of their respective owners. The use of any trademark in this text does not vest in the author or publisher any trademark ownership rights in such trademarks, nor does the use of such trademarks imply any affiliation with or endorsement of this book by such owners.
Pearson Education is not responsible for the content of third-party internet sites.
ISBN: 978-1-292-10312-9 (print) 978-1-292-10315-0 (PDF) 978-1-292-21132-9 (ePub)
British Library Cataloguing-in-Publication DataA catalogue record for the print edition is available from the British Library
Library of Congress Cataloging-in-Publication DataNames: Malhotra, Naresh K., author. | Nunan, Daniel, author. | Birks, David F., author.Title: Marketing research : an applied approach / Naresh K. Malhotra, Daniel Nunan, David F. Birks.Description: Fifth Edition. | New York : Pearson, [2017] | Revised edition of Marketing research, 2012. | Includes bibliographical references and index.Identifiers: LCCN 2017007654 | ISBN 9781292103129Subjects: LCSH: Marketing research. | Marketing research—MethodologyClassification: LCC HF5415.2 .M29 2017 | DDC 658.8/3—dc23LC record available at https://lccn.loc.gov/2017007654
10 9 8 7 6 5 4 3 2 119 18 17 16 15
Print edition typeset in 10/12 pt Times LT Pro by AptaraPrinted in Slovakia by Neografia
NOTE THAT ANY PAGE CROSS REFERENCES REFER TO THE PRINT EDITION

Preface xiii
Publisher’s acknowledgements xv
About the authors xvii
1. Introduction to marketing research 1
2. Defining the marketing research problem and developing a research approach 29
3. Research design 59
4. Secondary data collection and analysis 90
5. Internal secondary data and analytics 121
6. Qualitative research: its nature and approaches 147
7. Qualitative research: focus group discussions 179
8. Qualitative research: in-depth interviewing and projective techniques 207
9. Qualitative research: data analysis 233
10. Survey and quantitative observation techniques 267
11. Causal research design: experimentation 302
12. Measurement and scaling: fundamentals, comparative and non-comparative scaling 333
13. Questionnaire design 371
14. Sampling: design and procedures 409
15. Sampling: determining sample size 442
16. Survey fieldwork 471
17. Social media research 491
18. Mobile research 513
19. Data integrity 528
20. Frequency distribution, cross-tabulation and hypothesis testing 556
21. Analysis of variance and covariance 601
Brief contents

vi Marketing Research
22. Correlation and regression 632
23. Discriminant and logit analysis 673
24. Factor analysis 707
25. Cluster analysis 735
26. Multidimensional scaling and conjoint analysis 762
27. Structural equation modelling and path analysis 795
28. Communicating research findings 831
29. Business-to-business (b2b) marketing research 854
30. Research ethics 881
Glossary 908
Subject index 926
Name index 952
Company index 954

Contents
Preface xiiiPublisher’s acknowledgements xvAbout the authors xvii
1 Introduction to marketing research 1
Objectives 2Overview 2What does ‘marketing research’ mean? 3A brief history of marketing research 6Definition of marketing research 6The marketing research process 9A classification of marketing research 12The global marketing research industry 15Justifying the investment in marketing research 19The future – addressing the marketing research
skills gap 22Summary 25Questions 26Exercises 26Notes 27
2 Defining the marketing research problem and developing a research approach 29
Objectives 30Overview 30Importance of defining the problem 31The marketing research brief 32Components of the marketing research brief 33The marketing research proposal 36The process of defining the problem and
developing a research approach 39Environmental context of the problem 42Discussions with decision makers 42Interviews with industry experts 44Initial secondary data analyses 45Marketing decision problem and marketing
research problem 46Defining the marketing research problem 49Components of the research approach 50Objective/theoretical framework 51
Analytical model 52Research questions 53Hypothesis 54Summary 54Questions 55Exercises 56Notes 57
3 Research design 59
Objectives 60Overview 60Research design definition 61Research design from the decision makers’
perspective 62Research design from the participants’ perspective 63Research design classification 69Descriptive research 73Causal research 79Relationships between exploratory, descriptive
and causal research 80Potential sources of error in research designs 82Summary 85Questions 86Exercises 86Notes 87
4 Secondary data collection and analysis 90
Objectives 91Overview 91Defining primary data, secondary data
and marketing intelligence 92Advantages and uses of secondary data 94Disadvantages of secondary data 96Criteria for evaluating secondary data 96Classification of secondary data 99Published external secondary sources 100Databases 104Classification of online databases 104Syndicated sources of secondary data 106Syndicated data from households 109

viii Marketing Research
Syndicated data from institutions 115Summary 117Questions 118Exercises 119Notes 119
5 Internal secondary data and analytics 121
Objectives 122Overview 122Internal secondary data 125Geodemographic data analyses 128Customer relationship management 132Big data 134Web analytics 136Linking different types of data 139Summary 144Questions 144Exercises 145Notes 146
6 Qualitative research: its nature and approaches 147
Objectives 148Overview 148Primary data: qualitative versus
quantitative research 150Rationale for using qualitative research 152Philosophy and qualitative research 155Ethnographic research 162Grounded theory 168Action research 171Summary 174Questions 176Exercises 176Notes 177
7 Qualitative research: focus group discussions 179
Objectives 180Overview 180Classifying qualitative research techniques 182Focus group discussion 183Planning and conducting focus groups 188The moderator 193Other variations of focus groups 194Other types of qualitative group discussions 195Misconceptions about focus groups 196Online focus groups 198Advantages of online focus groups 200Disadvantages of online focus groups 201Summary 202
Questions 203Exercises 204Notes 205
8 Qualitative research: in-depth interviewing and projective techniques 207
Objectives 208Overview 208In-depth interviews 209Projective techniques 221Comparison between qualitative techniques 227Summary 228Questions 229Exercises 230Notes 230
9 Qualitative research: data analysis 233
Objectives 234Overview 234The qualitative researcher 235The process of qualitative data analysis 239Grounded theory 251Content analysis 254Semiotics 256Qualitative data analysis software 259Summary 262Questions 263Exercises 264Notes 264
10 Survey and quantitative observation techniques 267
Objectives 268Overview 268Survey methods 269Online surveys 271Telephone surveys 275Face-to-face surveys 276A comparative evaluation of survey methods 279Other survey methods 288Mixed-mode surveys 289Observation techniques 289Observation techniques classified by mode
of administration 292A comparative evaluation of the
observation techniques 295Advantages and disadvantages
of observation techniques 296Summary 297Questions 297Exercises 298Notes 299

ixContents
11 Causal research design: experimentation 302
Objectives 303Overview 303Concept of causality 304Conditions for causality 305Definitions and concepts 308Definition of symbols 310Validity in experimentation 310Extraneous variables 311Controlling extraneous variables 313A classification of experimental designs 315Pre-experimental designs 316True experimental designs 317Quasi-experimental designs 318Statistical designs 320Laboratory versus field experiments 323Experimental versus non-experimental designs 325Application: test marketing 326Summary 328Questions 329Exercises 330Notes 330
12 Measurement and scaling: fundamentals, comparative and non-comparative scaling 333
Objectives 334Overview 334Measurement and scaling 335Scale characteristics and levels of measurement 336Primary scales of measurement 337A comparison of scaling techniques 342Comparative scaling techniques 343Non-comparative scaling techniques 347Itemised rating scales 349Itemised rating scale decisions 352Multi-item scales 356Scale evaluation 358Choosing a scaling technique 363Mathematically derived scales 364Summary 364Questions 365Exercises 366Notes 367
13 Questionnaire design 371
Objectives 372Overview 372Questionnaire definition 374Questionnaire design process 375Specify the information needed 378Specify the type of interviewing method 379
Determine the content of individual questions 380Overcoming the participant’s inability and
unwillingness to answer 381Choose question structure 385Choose question wording 389Arrange the questions in proper order 394Identify the form and layout 396Reproduce the questionnaire 397Eliminate problems by pilot-testing 398Summarising the questionnaire design
process 400Designing surveys across cultures and countries 402Summary 403Questions 404Exercises 405Notes 405
14 Sampling: design and procedures 409
Objectives 410Overview 410Sample or census 412The sampling design process 414A classification of sampling techniques 419Non-probability sampling techniques 420Probability sampling techniques 425Choosing non-probability versus
probability sampling 433Summary of sampling techniques 434Issues in sampling across countries and cultures 436Summary 437Questions 438Exercises 439Notes 439
15 Sampling: determining sample size 442
Objectives 443Overview 443Definitions and symbols 445The sampling distribution 446Statistical approaches to determining
sample size 447The confidence interval approach 448Multiple characteristics and parameters 454Other probability sampling techniques 454Adjusting the statistically determined
sample size 455Calculation of response rates 456Non-response issues in sampling 457Summary 464Questions 464Exercises 465Appendix: The normal distribution 466Notes 468

x Marketing Research
16 Survey fieldwork 471
Objectives 472Overview 472The nature of survey fieldwork 474Survey fieldwork and the data-collection process 475Selecting survey fieldworkers 475Training survey fieldworkers 476Recording the answers 479Supervising survey fieldworkers 481Evaluating survey fieldworkers 482Fieldwork and online research 483Fieldwork across countries and cultures 485Summary 487Questions 487Exercises 488Notes 489
17 Social media research 491
Objectives 492Overview 492What do we mean by ‘social media’? 492The emergence of social media research 494Approaches to social media research 495Accessing social media data 497Social media research methods 499Research with image and video data 508Limitations of social media research 509Summary 510Questions 510Exercises 511Notes 511
18 Mobile research 513
Objectives 514Overview 514What is a mobile device? 514Approaches to mobile research 516Guidelines specific to mobile marketing research 518Key challenges in mobile research 522Summary 525Questions 526Exercises 526Notes 526
19 Data integrity 528
Objectives 529Overview 529The data integrity process 530Checking the questionnaire 531Editing 532Coding 533Transcribing 539
Cleaning the data 541Statistically adjusting the data 543Selecting a data analysis strategy 545Data integrity across countries and cultures 548Practise data analysis with SPSS 549Summary 552Questions 552Exercises 553Notes 554
20 Frequency distribution, cross-tabulation and hypothesis testing 556
Objectives 557Overview 557Frequency distribution 560Statistics associated with frequency distribution 562A general procedure for hypothesis testing 565Cross-tabulations 570Statistics associated with cross-tabulation 576Hypothesis testing related to differences 580Parametric tests 582Non-parametric tests 588Practise data analysis with SPSS 593Summary 596Questions 596Exercises 597Notes 598
21 Analysis of variance and covariance 601
Objectives 602Overview 602Relationship among techniques 604One-way ANOVA 605Statistics associated with one-way ANOVA 606Conducting one-way ANOVA 606Illustrative applications of one-way ANOVA 610n-way ANOVA 614Analysis of covariance (ANCOVA) 619Issues in interpretation 620Repeated measures ANOVA 622Non-metric ANOVA 624Multivariate ANOVA 624Practise data analysis with SPSS 625Summary 626Questions 627Exercises 627Notes 630
22 Correlation and regression 632
Objectives 633Overview 633Product moment correlation 634Partial correlation 638

xiContents
Non-metric correlation 640Regression analysis 641Bivariate regression 641Statistics associated with bivariate regression
analysis 642Conducting bivariate regression analysis 642Multiple regression 651Statistics associated with multiple regression 652Conducting multiple regression analysis 653Multicollinearity 661Relative importance of predictors 662Cross-validation 662Regression with dummy variables 663Analysis of variance and covariance
with regression 664Practise data analysis with SPSS 665Summary 666Questions 667Exercises 667Notes 670
23 Discriminant and logit analysis 673
Objectives 674Overview 674Basic concept of discriminant analysis 675Relationship of discriminant and logit analysis
to ANOVA and regression 676Discriminant analysis model 676Statistics associated with discriminant
analysis 677Conducting discriminant analysis 678Conducting multiple discriminant analysis 688Stepwise discriminant analysis 696The logit model 696Conducting binary logit analysis 696Practise data analysis with SPSS 702Summary 703Questions 704Exercises 705Notes 705
24 Factor analysis 707
Objectives 708Overview 708Basic concept 709Factor analysis model 710Statistics associated with factor analysis 711Conducting factor analysis 712Applications of common factor analysis 724Practise data analysis with SPSS 729Summary 730Questions 731Exercises 731Notes 733
25 Cluster analysis 735
Objectives 736Overview 736Basic concept 737Statistics associated with cluster analysis 739Conducting cluster analysis 739Applications of non-hierarchical clustering 750Applications of TwoStep clustering 752Clustering variables 754Practise data analysis with SPSS 757Summary 758Questions 759Exercises 759Notes 760
26 Multidimensional scaling and conjoint analysis 762
Objectives 763Overview 763Basic concepts in MDS 765Statistics and terms associated with MDS 765Conducting MDS 766Assumptions and limitations of MDS 773Scaling preference data 773Correspondence analysis 775Relationship among MDS, factor analysis
and discriminant analysis 776Basic concepts in conjoint analysis 776Statistics and terms associated with
conjoint analysis 777Conducting conjoint analysis 778Assumptions and limitations of conjoint analysis 786Hybrid conjoint analysis 786Practise data analysis with SPSS 788Summary 789Questions 790Exercises 790Notes 791
27 Structural equation modelling and path analysis 795
Objectives 796Overview 796Basic concepts in SEM 797Statistics and terms associated with SEM 798Foundations of SEM 800Conducting SEM 802Higher-order CFA 813Relationship of SEM to other multivariate
techniques 814Application of SEM: first-order factor model 814Application of SEM: second-order factor model 817Path analysis 823

xii Marketing Research
Software to support SEM 826Summary 826Questions 828Exercises 828Notes 829
28 Communicating research findings 831
Objectives 832Overview 832Why does communication of research
findings matter? 833Importance of the report and presentation 835Preparation and presentation process 836Report preparation 837Guidelines for graphs 842Report distribution 845Digital dashboards 845Infographics 847Oral presentation 847Research follow-up 849Summary 850Questions 851Exercises 852Notes 852
29 Business-to-business (b2b) marketing research 854
Objectives 855Overview 855What is b2b marketing and why is it important? 856The distinction between b2b and consumer
marketing 857Concepts underlying b2b marketing research 858
Implications of the differences between business and consumer purchases for researchers 860
The growth of competitive intelligence 873The future of b2b marketing research 876Summary 877Questions 877Exercises 878Notes 878
30 Research ethics 881
Objectives 882Overview 882Ethics in marketing research 884Professional ethics codes 884Ethics in the research process 888Ethics in data collection 890Data analysis 896Ethical communication of research findings 898Key issues in research ethics: informed consent 898Key issues in research ethics: maintaining
respondent trust 900Key issues in research ethics: anonymity
and privacy 901Key issues in research ethics: sugging
and frugging 905Summary 905Questions 906Exercises 906Notes 906
Glossary 908Subject index 926Name index 952Company index 954
Supporting resources
Visit www.pearsoned.co.uk/malhotra_euro to find valuable online resourcesFor more information please contact your local Pearson Education sales representative or visit www.pearsoned.co.uk/malhotra_euro

xiiiChapter 3 Research design
Preface
What’s new in this edition?
Working as a marketing researcher remains an intellec-tually stimulating, creative and rewarding career. Glob-ally, marketing research is an industry that turns over more than $40 billion a year and is at the forefront of innovation in many sectors of the economy. However, few industries can have been presented with as many challenges and opportunities as those faced by market-ing research due to the growing amounts of data gener-ated by modern technology.
Founded upon the enormously successful US edition, and building upon the previous four European editions, the fifth edition of this book seeks to maintain its position as the leading marketing research text, focused on the key challenges facing marketing research in a European con-text. As with previous editions, this aims to be compre-hensive, authoritative and applied. As a result, the book covers all the topics in previous editions while including a number of new chapters that reflect the changes and challenges that have impacted the marketing research sector since the fourth edition was published. This edition has been significantly updated, with new chapters, new content, updated cases studies and a major focus on the issues and methods generated by new technologies.
Key improvements and updates in this edition include:
1 New chapters on social media research and mobile research. These chapters provide an in-depth and very current view of these two key areas of technol-ogy. Both social media and mobile research provide researchers with a range of new opportunities to col-lect data. At the same time, they pose a threat to many of the existing ways in which research is carried out.
2 A dedicated chapter on research ethics. Research ethics has been an important part of this text in previ-ous editions but the growing range of data collection
enabled through social media or other ‘big data’ sources has created a new range of ethical challenges around maintaining respondent privacy. This chapter includes recently updated research industry ethics codes and the discussion around the threats to core ethical principles of research (such as anonymity) that are posed by new technologies.
3 Focus on communicating research findings. The last stage of the marketing research model that forms the core of this and previous editions of the book has been renamed from ‘Reporting preparation and pres-entation’ to ‘Communicating research findings’. This recognises the increasing range of channels through which research is communicated and the need to look beyond the old-style research report to what influences today’s busy managers. Chapter 28 on communicating research findings has been updated to reflect this.
4 New and updated examples and data. A wide range of new examples, including more than 35 new and updated ‘Real Research’ case studies, are presented. Material referring to industry data and research firms has been updated to include the most recent data available at time of publication.
5 Data analysis with SPSS. Reflecting the feedback from previous editions, this book has focused upon SPSS – where step-by-step instructions for conducting the data analysis in each chapter on quantitative analy-sis are included. These are available to download at the text website, and instructions are suitable for both Windows and Mac versions of SPSS. Recognising that there are a wide range of software programs avail-able for carrying out data analysis – including those suitable for qualitative analysis – we also include details of alternative and emerging software programs, where appropriate. These include lower-cost or open-source programs.

xiv Marketing Research
6 Updated references. The book contains many more recent references, including articles, conference papers and academic research, as well as retaining the classic references.
Integrated learning package
If you take advantage of the following special features, you should find this text engaging, thought provoking and even fun:
1 Balanced orientation. This book contains a blend of scholarship and a highly applied and managerial ori-entation, showing how researchers apply concepts and techniques and how managers use their findings to improve marketing practice. In each chapter, we discuss real marketing research challenges to support a great breadth of marketing decisions.
2 Real-life examples. Real-life examples (‘Real research’ boxes) describe the kind of marketing research that companies use to address specific man-agerial problems and how they implement research to great effect.
3 Hands-on approach. You will find more real-life sce-narios and exercises in every chapter. The end-of-chapter exercises challenge you to research online and role play as a researcher and a marketing man-ager. You can tackle real-life marketing situations in which you assume the role of a consultant and recom-mend research and marketing management decisions.
4 International focus. Reflecting the increasingly glo-balised nature of marketing research, the book contains
examples and cases from around the world and embeds key cross-cultural issues within the wider discussion of research techniques and methods.
5 Contemporary focus. We apply marketing research to current challenges, such as customer value, experi-ential marketing, satisfaction, loyalty, customer equity, brand equity and management, innovation, entrepreneurship, relationship marketing, creativity and design and socially responsible marketing.
6 Statistical software. We illustrate data analysis pro-cedures, with emphasis upon SPSS and SAS. SPSS sections in the relevant chapters discuss the programs and the steps you need to run them. On our website we also describe and illustrate NVivo qualitative data analysis software and provide details of other key software tools for statistical and other forms of data analysis.
7 Companion website. The companion website has been updated to reflect the changes in this edition. There are new European case studies with discussion points and questions to tackle. All the referenced websites within the text are described, with notes of key features to look for on a particular site.
8 Instructor’s manual. The instructor’s manual is very closely tied to the text, but is not prescriptive in how the material should be handled in the classroom. The manual offers teaching suggestions, answers to all end-of-chapter questions, ‘Professional Perspective’ discussion points and case study exercises. The man-ual includes PowerPoint slides, incorporating all the new figures and tables.

Publisher’s acknowledgements
We are grateful to the following for permission to reproduce copyright material:
Tables
Table 6.1 from ‘Divided by a common language: diversity and deception in the world of global marketing’, Journal of the Market Research Society, vol. 38(2), p. 105 (Goodyear, M., 1996); Table 7.2 adapted from ‘Online audio group discussions, a comparison with face to face methods’, International Journal of Market Research, vol. 51 (2), pp. 219–41 (Cheng, C.C., Krumwiede, D. and Sheu, C., 2009).
Text
Extract on p. 21 from ‘James Dyson: He sweeps as he cleans as he spins. What’s next from the ideas factory? A day in the life of the chairman and founder of Dyson’, The Independent, 27/05/2006, p. 55 (Mesure, S.), http://www.independent.co.uk/news/business/analysis-and-features/james-dyson-he-sweeps-as-he-cleans-as-he-spins-whats-next-from-the-ideas-factory-479931.html; Extract on p. 103 from Social and Welfare News Release, Social Trends, Crown Copyright material is reproduced with permission under the terms of the Click-Use Licence; Extract on p. 412 adapted from ‘Down with random sampling?’, Research World, November, p. 44–5 (Scheffler, H., Zelin, A. and Smith, P., 2007); Extract on pp. 411–12 adapted from ‘Down with random samples’, Research World, May, p. 31 (Kellner, P., 2007); Extract on pp. 480–1 from ‘How was it for you?’, Research, Fieldwork Sup-plement (July), pp. 8–9 (Park, C., 2000); Extract on pp. 886–7 from ESOMAR news ‘It’s here: What the new EU Data Protection law means for market research’, https://www.esomar.org/utilities/news-multimedia/news.php?idnews=195; Extract on pp. 901–2 from ‘Viewpoint - MR confidential: anonymity in market research’, International Journal of Market Research, vol. 50 (6), pp. 717–18 (Griffiths, J. 2008).
Photographs
The publisher would like to thank the following for their kind permission to reproduce their photographs:
(Key: b – bottom; c – centre; l – left; r – right; t – top)
123RF.com: 22, 64, 134, 243, 257, 525, 735, 869, bonninstudio 491, sirylok 673, siuwing 516, Tono Balaguer 271, vizafoto 556; Pearson Education Ltd: Ann Cromack. Ikat Design 222, Cheuk-king Lo 428, Debbie Rowe 585, Gareth Dewar 541, Jules Selmes 382, Naki Kouyioumtzis 116, 796, Sian Bradfield. Pearson Education Aus-tralia Pty Ltd 694, Studio 8 728; Shutterstock.com: 1279606 632, 3024425 799, aastock 573, Adam Gregor 207, alexskopje 443, alphaspirit 795, Amble Design 13, AMC Photography 169, Amy Johansson 290, Angela Waye 519 Apples Eyes Studio 954, arek_malang 431, ariadna de raadt 818, auremar 41, bikeriderlondon 886, Bike-worldtravel 726, Bloomua 361, 513, Bob Denelzen 233, Brocreative 97, CandyBox Images 685, Catalin Petolea

xvi Marketing Research
787, Catherine Murray 153, clivewa 147, Dean Drobot 179, Denis Pepin 601, Djomas 79, dotshock 486, Doug Stevens 752, Dusit 91, 267, ejwhite 255, Gergo Orban 533, Gunnar Pippel 755, gyn9037 314, Hellen Grig 215, iconspro 651, igor.stevanovic 764, Ioannis Pantzi 481, iofoto 617, Ivelin Radkov 506, ivosar 427, Jaimie Duplass 890, Jeff Banke 143, Jeff Dalton 3, Johan Swanepoel 736, JohnKwan 388, KKulikov 714, koh sze kiat 29, koh sze kiat 29, Kovalchuk Oleksandr 302, kRie 371, kubais 859, Kzenon 339, 609, LANBO 707, Lichtmeister 881, Login 1, Marcio Eugenio 192, Mark Herreid 809, Matej Kastelic 322, Meg Wallace Photography 444, 456, MJTH 459, Monkey Business Images 866, Nata-Lia 71, Nickolay Stanev 51, Olivier Le Queinec 544, ollyy 307, Pavel L Photo and Video 398, Pixsooz 471, Rawpixel 195, Richard Peterson 181, Rido 484, Robnroll 333, Roger Asbury 842, scyther5 500, Sinisa Botas 680, Stephen Coburn 131, Stephen Rees 220, StockLite 633, SvetlanaFedoseyeva 164, Tan Kian Khoon 836, Tim Scott 278, trendywest 762, Tyler Olson 496, 831, 848, 903, viki2win 35, vinzstu-dio 59, Vladimir Wrangel 602, Vlue 409, wellphoto 107, William Perugini 528, Yuttasak Jannarong 659, zim-mytws 349, 557
All other images © Pearson Education

xviiChapter 3 Research design
About the authors
Dr Naresh K. Malhotra is Senior Fellow, Georgia Tech CIBER and Regents’ Professor Emeritus, Scheller College of Business, Georgia Institute of Technology, USA. He has published more than 135 papers in major refereed jour-nals, including the Journal of Marketing Research, Journal of Consumer Research, Marketing Science, Manage-ment Science, Journal of Marketing, Journal of Academy of Marketing Science, Journal of Retailing, Journal of Health Care Marketing and leading journals in statistics, management science, information systems and psychol-ogy. He was Chairman, Academy of Marketing Science Foundation, 1996–1998, and was President, Academy of Marketing Science, 1994–1996 and Chairman, Board of Governors, 1990–1992. He is a Distinguished Fellow of the Academy and Fellow of the Decision Sciences Institute. He is the founding Editor of Review of Marketing Research and served as an Associate Editor of Decision Sciences for 18 years. His book entitled Marketing Research: An Applied Orientation has been translated into eight languages and is being used in over 100 countries. Dr Malhotra has consulted for business, non-profit and government organisations in the USA and abroad and has served as an expert witness in legal and regulatory proceedings. He is the winner of numerous awards and honours for research, teaching and service to the profession.
Dr Daniel Nunan is Lecturer in Marketing at Birkbeck, University of London, having previously been a member of faculty at Henley Business School, University of Reading. Dan has published in journals including the Journal of Business Ethics, New Technology, Work and Employment, International Journal of Market Research and Journal of Marketing Management. He is a member of the Editorial Board of the International Journal of Market Research and has been a reviewer for a number of leading journals. Dan was nominated for the Market Research Society Sil-ver Medal in 2012 and 2014, and won the MRS Award for Innovation in Research Methodology in 2012. Dr Nunan is a Fellow of the Higher Education Academy and the Royal Statistical Society. Prior to his academic career, Dan held senior marketing roles in the financial services and technology sectors.
Professor David F. Birks is Professor of Marketing at the University of Winchester. He is Dean of the Faculty of Busi-ness, Law and Sport and Director of Winchester Business School. Prior to working at Winchester, David worked at the Universities of Southampton, Bath and Strathclyde. David has over 30 years’ experience in universities, primarily working on postgraduate research, marketing, management and design programmes. David is a committee member of the Association for Survey Computing (ASC), the world’s leading society for the advancement of knowledge in soft-ware and technology for research surveys and statistics. He has continued to practise marketing research throughout his university career, managing projects in financial institutions, retailers, local authorities and charities.

This page intentionally left blank

Introduction to marketing research
Marketing research supports
decision making through
collecting, analysing and
interpreting information to
identify and solve marketing
problems.
Stage 1
Problem definition
Stage 2
Research approach developed
Stage 3
Research design
developed
Stage 4
Fieldwork or data
collection
Stage 5
Data integrity
and analysis
1
Stage 6
Communicating research findings

2 Marketing Research
Objectives
After reading this chapter, you should be able to:
1 understand the nature and scope of marketing research and its role in supporting marketing decisions;
2 describe a conceptual framework for conducting marketing research, as well as the steps in the marketing research process;
3 distinguish between problem-identification and problem-solving marketing research;
4 appreciate the impact that technology is having on the marketing research industry;
5 appreciate the role of marketing research in different regions and countries throughout the world;
6 understand the types and roles of research suppliers, including internal and external, full-service and limited-service suppliers;
7 understand why some marketers may be sceptical of the value of marketing research;
8 appreciate the skills that researchers will need to succeed in the future world of marketing research.
When you hear the term ‘marketing research’ what comes to mind? People with clipboards stopping you on the street to ask for your opinion? Reading the results of a political opinion poll in the media? A report on opportunities for new markets being presented to managers? All of these activities represent traditional types of marketing research activities, but they don’t even begin to capture the range and breadth of activities that encompass marketing research today. Marketing research is one of the most important, interesting and fast-moving aspects of marketing. In this chapter, we introduce the concept of marketing research, emphasising its key role in supporting marketing decision making, and provide several real-life examples to illustrate the basic concepts of marketing research. We discuss formal definitions of marketing research and show how these link to a six-stage description of the marketing research process. This description is extended to illustrate many of the interconnected activities in the marketing research process. We then subdivide marketing research into two areas: problem-identification and problem-solving research. Finally, an overview of the global marketing research sector is provided, including details of expenditure and key research firms.
The marketing research industry is going through a huge period of change. Much of this change derives from technological developments that are affecting nearly all aspects of how consumers interact with companies. The growth of the internet, the shift to mobile computing and the emergence of ‘big data’ have raised fundamental questions over the relevance of traditional notions of marketing research. However, technology is not the only source of change. Both academics and practitioners have noted that it is getting more difficult to persuade people to take part in research, partly because research tools such as surveys are so commonly used in nearly all aspects of our day-to-day lives. Another emerging issue is the increasing interest from governments in the ways that companies are collecting and using data about their customers. This creates the potential for new forms of data protection legislation that could place tighter legal restrictions on the kinds of research that can be undertaken. On the other hand, change brings opportunity. New technologies have brought with them an exciting range of new research techniques. Above all, with organisations being awash with data, the need for researchers skilled in being able to turn this data into insight has never been greater.
There are many successful marketing decisions that have been founded upon sound marketing research; however, marketing research does not replace decision making. We explore the need to justify investment in marketing research alongside the challenges facing marketing research as an industry. At the same time, these challenges create new ways for researchers to design and produce research that is actionable and relevant to marketing decision makers.
Overview

3Chapter 1 Introduction to marketing research
What does ‘marketing research’ mean?
The term ‘marketing research’ is broad in meaning and application. This breadth will be explored and illustrated throughout this chapter. What will become apparent is that it is related to supporting marketing decision making in many traditional and new ways. The following examples illustrate some of the different contexts in which marketing research can be applied.
Real research Customer service on London Buses
London’s bus network is one of the world’s largest, carrying more than 6.5 million passengers each day using a fleet of over 8,600 (mostly red) buses. The network is overseen by Transport for London (TfL) and keeping so many customers happy is not an easy job. TfL relies on research to make sure it under-stands the customer experience. In 2014 TfL realised that, despite major investment, thousands of cus-tomers were contacting it each month to complain about the service received. Working with agency research partners, TfL was able to bring together data from a wide range of sources including complaints data, social media analysis, customer satisfaction sur-veys, customer experience ethnographies, driver depth interviews and observations and bus staff surveys.
Analysis of this data, particularly that of social media data, found that customers viewed their interactions with employees as nearly as important as the functional reliability of the bus services, such as the range of routes or a bus being on time. A lot of customer complaints were due to bus drivers not always stopping when expected or poor communication when something went wrong, such as a delay or disrup-tion. On the other hand, analysis of employee data showed that bus drivers viewed their role as functional – simply driving the bus!
Research identified the disconnect, which was then addressed via a series of work-shops to help bus drivers understand the importance of customer experience. Follow-up research six months later indicated that the workshops had significantly increased employees’ engagement with customers.1
Real research Steve Jobs on market research
Steve Jobs, Apple CEO and founder, was one of the most influential business leaders of modern times and the wider impacts of his work are felt by hundreds of millions of peo-ple around the world each day. But what did he think of market research? At first glance not a great deal, as he was famously quoted as saying the following:
Some people say, ‘Give the customers what they want.’ But that’s not my approach. Our job is to figure out what they’re going to want before they do. I think Henry Ford once said, ‘If I’d asked customers what they wanted, they would have told me, “A faster horse!” People don’t know what they want until you show it to them. That’s why I never rely on market research. Our task is to read things that are not yet on the page.2’

4 Marketing Research
You will find this quote widely used online when referring to the weaknesses of mar-keting research. However, it doesn’t quite tell the whole story. Information that came to light after Steve Jobs’ death found that Apple carried out plenty of market research to better understand what customers thought about both its products and competitors.3 As it turns out, what Steve Jobs was talking about was the role of focus groups in developing completely new and innovative products, such as the iPhone, where a customer lacks knowledge of what the product can actually do.
Real research Moving on from ‘low-cost’ with easyJet
Measured by the number of passengers carried, easyJet is the largest UK airline and the second largest in Europe. It has a history of using innovative research techniques to gen-erate the highest returns from its marketing budget. For example, easyJet was an early adopter of online research communities to gain feedback from customers more quickly than was possible with traditional approaches.4 More recently, following a long period of success, easyJet has sought to improve its brand perception and move away from a mar-keting model purely based upon low prices. This involved moving to more of an affinity-building approach based around the ‘Europe by easyJet’ approach. One of the challenges it faced was finding a budget for brand advertising on television without damaging the results of expenditure on existing channels.5 By carrying out research on the effectiveness of search-engine advertising, it found that it could reduce expenditure on certain key-words, such as ‘easyJet’, without reducing the number of visitors to the website. This cre-ated savings of £8 million per year on search advertising alone, which could be reinvested in television advertising.6
These examples illustrate the variety of methods used to conduct marketing research, which may range from highly structured surveys with large samples to open-ended, in-depth inter-views with small samples; from the collection and analysis of readily available data to the generation of ‘new’ quantitative and qualitative data; from personal face-to-face interactions to remote observations and interactions with consumers via the internet; from small local stud-ies to large global studies. As is best highlighted by the case of Apple, marketing research techniques can’t be used to solve all business problems, but every company, even Apple, has a place for marketing research. This book will introduce you to the full complement of market-ing research techniques and challenges. These examples also illustrate the crucial role played by marketing research in designing and implementing successful marketing plans. This book will introduce you to a broad range of marketing applications supported by marketing research.
The role of marketing research can be better understood in light of a basic marketing paradigm depicted in Figure 1.1. The emphasis in marketing, as illustrated in the TfL exam-ple above, is on understanding customer experiences and the delivery of satisfaction. To understand customer experiences and to implement marketing strategies and plans aimed at delivering satisfying experiences, marketing managers need information about customers, competitors and other forces in the marketplace. In recent years, many factors have increased the need for more accurate and timely information. As firms have become national and inter-national in scope, the need for information on larger and more distant markets has increased. As consumers have become more affluent, discerning and sophisticated, marketing manag-ers need better information on how they will respond to new products and other new experi-ences. As competition has become more intense, managers need information on the effectiveness of their marketing tools. As the environment is changing more rapidly, market-ing managers need more timely information to cope with the impact of these changes.

5Chapter 1 Introduction to marketing research
Marketers make decisions about what they see as potential opportunities and problems, i.e. a process of identifying issues. They go on to devise the most effective ways to realise these opportunities and overcome problems they have identified. They do this based on a ‘vision’ of the distinct characteristics of the target markets and customer groups. From this ‘vision’ they develop, implement and control marketing programmes. This ‘vision’ of mar-kets and subsequent marketing decisions may be complicated by the interactive effects of an array of environmental forces that shape the nature and scope of target markets. These forces also affect the marketers’ ability to deliver experiences that will satisfy their chosen target markets. Within this framework of decision making, marketing research helps the marketing manager link the marketing variables with their environment and customer groups. It helps remove some of the uncertainty by providing relevant information about marketing varia-bles, environment and consumers.
The role of the researcher in supporting the marketing decision maker can therefore be summarised as helping to:
• describe the nature and scope of customer groups;
• understand the nature of forces that shape customer groups;
• understand the nature of forces that shape the marketer’s ability to satisfy targeted cus-tomer groups;
• test individual and interactive variables that shape consumer experiences;
• monitor and reflect upon past successes and failures in marketing decisions.
Traditionally, researchers were responsible for designing and crafting high-quality research and providing relevant information support, while marketing decisions were made by the managers. The clarity and distinction of these roles are blurring somewhat. Researchers are becoming more aware of decision making; conversely, marketing managers are becoming more aware of research and the use of an eclectic array of data sources that can support their decision making. This trend can be attributed to better training of marketing managers and advances in technology; the advances in technology are a theme that we will discuss in more detail throughout the text. There has also been a shift in the nature and scope of marketing research. Increasingly marketing research is being undertaken not only on an ongoing basis but on a ‘real-time’ basis, rather than a traditional notion of research being in response to
Figure 1.1
The role of marketing research within the marketing system
Marketingmanagers
• Market segmentation• Target market selection• Marketing programmes• Performance and control
• Consumers• Employees• Shareholders• Suppliers
Customer behaviour, satisfaction, loyalty
Exchange of values
Controllable marketing variables
• Product • Pricing • Promotion • Distribution
Time
Marketing research support:• The nature and scope of target markets• The forces that shape the marketing system• Evaluate marketing mix variables• Evaluate successes and failures of marketing decisions
Macroenvironmentalfactors• Economy• Technology• Competitors• Legal and political• Social and demographic
Microenvironmental• Family• Peer groups• Opinion leaders

6 Marketing Research
specific marketing problems or opportunities.7 Major shifts are occurring in the marketing research industry that are impacting upon the perceived nature and value of marketing research. The nature of these shifts and their impact upon new approaches to marketing research will be addressed later in this chapter. The current and developing role of marketing research is recognised in its definition.
A brief history of marketing research
Before defining marketing research, it is useful to consider some of the history of the field. This is not because marketing researchers need to be historians – far from it. Rather, history helps to give us context. In a time where the research sector is facing many changes and chal-lenges, being able to understand the forces that have shaped the development of marketing research in the past and present will better enable us to understand the future.
The first point to make is that while the term ‘marketing research’ is relatively recent, the concepts that underlie it are not new. As long as the opinions of the public have mattered, and traders have had a need to improve their level of trade, then some form of research has been undertaken. The bustling markets of ancient Rome have been characterised as a market economy, with traders seeking competitive advantage while dealing with suppliers, farmers and craftsmen in distant lands. As today, information such as the prices consumers were willing to pay for certain products was valuable to traders and much effort was spent on gathering and exchanging such information.8 Even many modern research techniques have origins far into the past. The Domesday Book, a research project completed in 1086 for the English King William the Conqueror, contained details of land holdings in England and Wales. Perhaps Europe’s oldest and most valuable statistical document, the original, and less ominous, name of the book was descriptio – the Latin word for ‘survey’.
However, elements of what would be immediately recognisable as marketing research can be traced back to more recent times. For example, opinion polls in the USA can can be traced back to the 1820s, and questionnaires were being used widely to gauge consumer opinion of advertising as early as the 1890s.9 The first evidence of market research use becoming mainstream happened in the period from 1910–20 and it is generally accepted that the marketing research industry was well embedded in commercial life by the 1930s.10 Thus, when professional associations such as ESOMAR or the UK’s market research society (MRS) were established in the late 1940s, it didn’t represent the beginning of marketing research but rather the capstone on a longer period of development. We will discuss some of the innovations since this time, for example in the development of research ethics guidelines, in later chapters.
The important point here is that marketing research has been a well-established part of com-mercial life for more than 100 years. It has successfully navigated the huge social, political and economic changes facing the world over this period and has continued to prosper. From televi-sion to the internet, marketing research has adapted to each new set of technologies, while the key focus on producing high-quality research, and doing so with integrity, has remained.
Definition of marketing research
You might ask why we need a definition of marketing research – isn’t it obvious? The chal-lenge is that when many managers think about marketing research, they focus on the data collection aspects of research. This ignores the importance of a wider research process and doesn’t tell us how marketing research might differ from other marketing activities. To understand these issues we can review two common definitions of marketing research. You might note that the first definition uses the term ‘market research’, while the second talks

7Chapter 1 Introduction to marketing research
about ‘marketing research’; we will discuss this point later in this section. The first is from ESOMAR (originally the European Society for Opinion and Market Research), a global membership organisation for research firms and practitioners:
Market research, which includes social and opinion research, is the systematic gathering and interpretation of information about individuals or organisations using the statistical and analytical methods and techniques of the applied sciences to gain insight or support decision making. The identity of respondents will not be revealed to the user of the information without explicit consent and no sales approach will be made to them as a direct result of their having provided information.11
Several aspects of this definition are noteworthy. It includes opinion and social research within its definition, meaning that it’s not only for-profit companies that undertake market research. Charities, governments and other third- or public-sector organisations are also important users of research. Secondly, it makes it clear that the principle of anonymity applies to market research and that the identity of those partaking in research will not be revealed. Finally, it highlights the importance of gaining consent from research participants and not selling directly to them as a result of partaking in research. Consent and anonymity are key concepts of market research and we will return to them throughout this text.
Our second definition comes from the American Marketing Association (AMA):
Marketing research is the function that links the consumer, customer, and public to the marketer through information – information used to identify and define marketing opportunities and problems; generate, refine, and evaluate marketing actions; monitor marketing performance; and improve understanding of marketing as a process. Marketing research specifies the information required to address these issues, designs the method for collecting information, manages and implements the data collection process, analyzes the results, and communicates the findings and their implications.12
This definition has several aspects that differentiate it from the previous ESOMAR defi-nition. Most importantly, it stresses the role of marketing research as a process of ‘linking’ the marketer to the consumer, customer and public to help improve the whole process of marketing decision making. It also sets out the challenges faced by marketing decision mak-ers and thus where research support can help them make better decisions, and/or decisions with lower risks. Notably, it also alludes to the ethical issues surrounding market research (which will be covered in depth in Chapter 30).
We should remember that definitions often reflect the interests of those who create them. Ultimately, ESOMAR exists to look after and promote the interests of its members, so it is not surprising that in defining marketing research it seeks to position it as something separate from marketing. On the other hand, the AMA takes a more integrative view of market-ing research as part of marketing activity. With this in mind, neither definition is ‘best’ – they simply take different perspectives and both give us a useful understanding as to the scope of marketing research.
One area of potential confusion is with distinctions between marketing research and market research. In terms of usage, these distinctions are largely geographic in nature, with research practitioners in Europe preferring ‘market research’ and those in the USA ‘market-ing research’. However, behind the semantics of the exact words used there lies slightly dif-ferent views on how the industry should be seen. ‘Market research’ is more closely associated with the research industry and good practice. On the other hand, the AMA definition’s use of ‘marketing research’ refers to the broader consumer context that drives the undertaking of research. While there were once a number of regional differences reflecting local research cultures in different markets, as commerce has become increasingly globalised so too has the use of language. This means that ‘marketing research’ has become increasing commonly used around the world while, even within Europe, ‘market research’ and ‘marketing research’ are often used interchangeably.
Marketing researchis the function that links the consumer, customer, and public to the marketer through information – information used to identify and define marketing opportunities and problems; generate, refine, and evaluate marketing actions; monitor marketing performance; and improve understanding of marketing as a process. Marketing research specifies the information required to address these issues, designs the method for collecting information, manages and implements the data collection process, analyzes the results, and communicates the findings and their implications.

8 Marketing Research
One final, final point of note on language is the use of the word ‘insight’. For many years, marketing and market research professionals and functions have been termed or associated with ‘consumer insight’, as illustrated by the following example from Diageo. There has been much debate about what consumer insight means and how this may give a ‘richer’ understand-ing of consumers compared with traditional notions of market research. At the heart of this debate is a clear recognition that the links to consumers and support given to marketing deci-sion makers are being delivered by a much broader and diverse array of techniques and sources.
At the core of the definitions of marketing and market research is an understanding of the consumer and what shapes consumers. Regardless of whether a research professional is defined as a ‘marketing researcher’, ‘market researcher’ or ‘consumer insight manager’, the focus upon consumers is paramount. However, the role and expectations of the marketing researcher can be argued to have the widest scope of practice. The expectations and demands of such a scope will be addressed later in this chapter, but for now we will use and adopt the broader definition of marketing research. Focusing upon ‘marketing research’ helps to encapsulate the profession of managing the process of measuring and understanding con-sumers in order to better support marketing decision making, a profession that strives for the highest levels of integrity in applying sound research methods in an ethical manner. It is recognised that marketing research can now include understanding the macro-business oper-ating environment, monitoring market trends, conducting competitive analyses, answering business questions, identifying business opportunities and assessing potential risks. More analytics, insights and future outlooks are demanded from business leaders to help them bet-ter understand their customers, the marketplace and the overall business environment. Researchers have to adapt and respond to these demands.
One of the major qualities of the American Marketing Association’s definition of market-ing research is its encapsulation of the marketing research process. The process is founded upon an understanding of the marketing decision(s) needing support. From this understand-ing, research aims and objectives are defined. To fulfil defined aims and objectives, an approach to conducting the research is established. Next, relevant information sources are identified and a range of data collection methods are evaluated for their appropriateness, forming a research design. The data are collected using the most appropriate method(s); they are analysed and interpreted, and inferences are drawn. Finally, the findings, implications and recommendations are provided in a format that allows the information to be used for marketing decision making and to be acted upon directly.
It is important that marketing research should aim to be objective. It should attempt to provide accurate information in an impartial manner. Although research is always influenced
Marketing research processA set of six steps that define the tasks to be accomplished in conducting a marketing research study. These include problem definition, developing a research approach, research design, fieldwork or data collection, data analysis and communicating research findings.
Real research What consumer insight means to Diageo13
Diageo’s (www.diageo.com) strong belief is that in order to be a world-class company, it all starts with the consumer: ‘knowing them, understanding them, understanding their motivations, understanding what drives them, and subsequently utilising this informa-tion to better serve consumers’. ‘Consumer insight’ is at the heart of what they see makes them a world-class company. Consumer insight, as defined by Diageo, is: ‘A penetrating discovery about consumer motivations, applied to unlock growth’:
• Penetrating – same data, but much deeper understanding.
• Discovery – ah-ha! eureka!
• Motivations – understand the why?
• Applied – leveraged for their brands.
• Growth – organic from brand strategies based on deep consumer understanding.

9Chapter 1 Introduction to marketing research
by the researcher’s research philosophy, it should be free from personal or political biases of the researcher or decision makers. Research motivated by personal or political gain involves a breach of professional standards. Such research is deliberately biased to result in predeter-mined findings. The motto of every researcher should be ‘Find it and tell it like it is’. Second, it is worth noting the term ‘total field of information’. This recognises that marketing deci-sions are not exclusively supported by marketing research. There are other means of infor-mation support for marketers, from management consultants, raw-data providers such as call centres, direct marketing, database marketing telebusinesses and social media. These alterna-tive forms of support are now competing with the ‘traditional’ view of marketing research. The methods of these competitors may not be administered with the same scientific rigour and/or ethical standards applied in the marketing research industry. Nonetheless, many mar-keting decision makers are increasingly using these other sources, which collectively are changing the nature of skills demanded in researchers.
The marketing research process
The marketing research process consists of six broad stages. Each of these stages is devel-oped in more detail in subsequent chapters; thus, the discussion here is brief. The process illustrated in Figure 1.2 is of the marketing research seen in simple stages. Figure 1.3 takes the process a stage further to show the many iterations and connections between stages. This section will explain the stages and illustrate the connections between the stages.
Step 1: Problem definition. The logical starting point in wishing to support the decision maker is trying to understand the nature of the marketing problem that requires research support. Marketing decision problems are not simple ‘givens’ (as will be discussed in Chap-ter 2). Many researchers are surprised to learn that clearly defining a research problem can be the most challenging stage in a research project. The symptoms and causes of a problem are not, in reality, as neatly presented as they may be in a case study, such as those found in marketing textbooks. In Figure 1.3, the first three stages show the iterations between the environmental context of the problem, the marketing decision problem and the marketing research problem. Understanding the environmental context of the problem has distinct stages (which will be discussed in Chapter 2). It involves discussion with decision makers, in-depth interviews with industry experts and the collection and analysis of readily availa-ble published information (from both inside and outside the firm). Once the problem has been precisely defined, the researcher can move on to designing and conducting the research process with confidence.
Step 2: Developing a research approach. The development of an approach to the research problem involves identifying factors that influence research design. A key ele-ment of this step involves the selection, adaptation and development of an appropriate theoret-ical framework to underpin a research design. Understanding the interrelated characteristics of the nature of target participants, the issues to be elicited from them and the context in which this will happen relies upon ‘sound’ theory. ‘Sound’ theory helps the researcher to decide ‘what should be measured or understood’ and ‘how best to encapsulate and com-municate the measurements or understandings’. In deciding what should be either meas-ured or encapsulated, the researcher also develops a broad appreciation of how the data collected will be analysed. (The issues involved in developing an approach are tackled in more detail in Chapter 2.)
Step 3: Research design. A research design is a framework or blueprint for conducting a marketing research project. It details the procedures necessary for obtaining the required information. Its purpose is to establish a study design that will either test the hypotheses of interest or determine possible answers to set research questions, and ultimately provide the information needed for decision making. Conducting any exploratory techniques, precisely

10 Marketing Research
defining variables to be measured and designing appropriate scales to measure variables can also be part of the research design. The issue of how the data should be obtained from the participants (e.g. by conducting a survey or an experiment) must be addressed. (These steps are discussed in detail in Chapters 3 to 13.)
Step 4: Fieldwork or data collection. In Figure 1.2, this stage could be simplified to ‘col-lecting the required data’. In Figure 1.3, a whole array of relationships between stages of data collection is shown, starting at secondary data collection and analysis through to quantitative research or qualitative research. The process starts with a more thorough collection and anal-ysis of secondary data sources. Secondary data are data collected for some other purpose than the problem at hand. They may be held within the organisation as databases that detail the nature and frequency of customer purchases, through to surveys that may have been com-pleted some time ago that may be accessed through libraries or through online sources. Going through this stage avoids replication of work and gives guidance in sampling plans and in deciding what to measure or encapsulate using quantitative or qualitative techniques. Secondary data collection and analysis may complete the research process, i.e. sufficient information may exist to interpret and report findings to a point whereby the information gaps that the decision maker has are filled. Secondary data form a vital foundation and essen-tial focus to primary data collection.
In Figure 1.3, the stage of ‘Identify and select individuals for primary research’ covers sampling issues for both quantitative and qualitative studies. This stage may include the selection of individuals for in-depth qualitative research. In qualitative research, issues of ‘representativeness’ are less important than the quality of individuals targeted for investiga-tion and the quality of response elicited. However, as can be seen from the line leading up from ‘Qualitative research’ to ‘Identify and select individuals for primary research’, the qualitative research process may help in the identification and classification of individuals who may be targeted using more formal sampling methods. (These sampling methods are covered in detail in Chapters 14 and 15.)
Figure 1.2
Simple description of the marketing research process
Stage 1:Problem de�nition
Stage 2:Research approach developed
Stage 3:Research design developed
Stage 4:Fieldwork or data collection
Stage 5:Data integrity and analysis
Stage 6:Communicating research �ndings

11Chapter 1 Introduction to marketing research
Beyond the issues of identifying and selecting individuals, the options available for pri-mary data collection vary considerably. A stage of qualitative research alone may be suffi-cient to support the decision maker, as indeed could a stage of quantitative research. In their own right, qualitative techniques do not necessarily have to be followed by a survey or quan-titative work to confirm the observations. (In-depth interviewing will be described and eval-uated in Chapter 8).
A research problem may require a stage of qualitative and quantitative research to run concurrently, perhaps measuring and encapsulating different characteristics of the problem under investigation. Alternatively, a stage of qualitative research could be used to precede a stage of quantitative research. For example, a sequence of focus groups may help to generate a series of statements or expectations that are subsequently tested out in a survey to a repre-sentative sample. Conversely, a survey may be conducted and, upon analysis, there may be clear, statistically significant differences between two distinct target markets. A series of qualitative in-depth interviews may follow to allow a more full exploration and understand-ing of the reasons for the differences between the two groups.
Step 5: Data analysis. Data preparation includes the editing, coding, transcription and ver-ification of data. This is perhaps the least glamorous aspect of market research but is critical in ensuring the integrity and accuracy of findings. In Figure 1.3, this stage is not drawn out
Figure 1.3
The marketing research process, detailing iterations between stages Marketing
decisionproblem
Marketingresearchproblem
Secondary datacollection and analysis
Identify and selectindividuals for
primary research
Marketer supported forset problem(s) but also acontribution made towards
organisational learningin terms of building upmarketing knowledge
Qualitativeresearch
Quantitativeresearch
Marketer’s informationgaps �lled
Interpret andpresent research �ndings
Qualitativeresearch
Quantitativeresearch
Research designdeveloped
Approach to theproblem developed
Environmental contextof the problem

12 Marketing Research
as a distinct stage in its own right, but is seen as integral to the stages of secondary data col-lection and analysis through to quantitative research or qualitative research. The process of data integrity and analysis is essentially the same for both quantitative and qualitative tech-niques, for data collected from both secondary and primary sources. Considerations of data analysis do not occur after data have been collected; such considerations are an integral part of the development of an approach, the development of a research design and the implemen-tation of individual quantitative or qualitative methods. If the data to be collected are qualita-tive, the analysis process can occur as the data are being collected, well before all observations or interviews have been completed. An integral part of qualitative data preparation and anal-ysis requires researchers to reflect upon their own learning and the ways they may interpret what they see and hear. (These issues will be developed in Chapters 6 to 9.)
If the data to be analysed are quantitative, each questionnaire or observation form is inspected or edited and, if necessary, corrected to ensure the integrity of data. The data from questionnaires are loaded, transcribed or keypunched into a chosen data analysis package. Verification ensures that the data from the original questionnaires have been accurately transcribed, whereas data analysis gives meaning to the data that have been collected. Uni-variate techniques are used for analysing data when there is a single measurement of each element or unit in the sample; if there are several measurements of each element, each vari-able is analysed in isolation. On the other hand, multivariate techniques are used for analys-ing data when there are two or more measurements of each element and the variables are analysed simultaneously.
Step 6: Communicating findings. Even if steps one to five are followed in the best pos-sible way, there is no use carrying out research unless it can be communicated effectively to stakeholders. The traditional route through which to carry out research would be to docu-ment the research with a written report that addresses the specific research questions identi-fied, describes the approach, research design, data collection and data analysis procedures adopted, and presents the results and major findings. However, due to increasing pressures on managers’ time, researchers realise that they need to go beyond reports – that may never be read – and use alternative means. Frequently these are visual, and can include videos, images or infographics to enhance clarity and impact (see Chapter 28 for more on effective communication of research findings).
A classification of marketing research
The ESOMAR definition provided earlier in this chapter encapsulates two key reasons for undertaking marketing research: (1) to identify opportunities and problems; and (2) to gener-ate and refine marketing actions. This distinction serves as a basis for classifying marketing research into problem-identification research and problem-solving research, as shown in Figure 1.4. Linking this classification to the basic marketing paradigm in Figure 1.1, problem-identification research can be linked to the description of the nature and scope of customer groups, understanding the nature of forces that shape customer groups and under-standing the nature of forces that shape the marketer’s ability to satisfy targeted customer groups. Problem-solving research can be linked to testing individual and interactive market-ing mix variables that create consumer experiences, and to monitoring and reflecting upon past successes and failures in marketing decisions.
Problem-identification research is undertaken to help identify problems that are, per-haps, not apparent on the surface and yet exist or are likely to arise in the future. Examples of problem-identification research include market potential, market share, brand or company image, market characteristics, sales analysis, short-range forecasting, long-range forecasting and business trends research. Research of this type provides information about the marketing environment and helps diagnose a problem. For example, a declining market potential indicates that the firm is likely to have a problem achieving its growth targets. Similarly, a problem exists if the market potential is increasing but the firm is losing market share. The
Problem identification researchResearch undertaken to help identify problems that are not necessarily apparent on the surface, yet exist or are likely to arise in the future.

13Chapter 1 Introduction to marketing research
recognition of economic, social or cultural trends, such as changes in consumer behaviour, may point to underlying problems or opportunities.
Once a problem or opportunity has been identified, problem-solving research may be undertaken to help develop a solution. The findings of problem-solving research are used to support decisions that tackle specific marketing problems. Problem-solving research linked to problem-identification research is illustrated by the following example of developing a new cereal at Kellogg’s.
Problem-solving researchResearch undertaken to help solve specific marketing problems.
Figure 1.4
A classification of marketing research
Marketing research
Problem-identi�cation
research
Problem-solving
research
Examples:• Market-potential research• Market-share research• Image research• Market-characteristics research• Sales-analysis research• Forecasting research• Business-trends research
Examples:• Segmentation research• Product research• Pricing research• Promotion research• Distribution research
Real research Crunchy Nut Red adds colour to Kellogg’s sales14
In the late 2000s Kellogg’s (www.kel-loggs.com) experienced a slump in the market for breakfast-cereal sales. Through problem-identification research, Kellogg’s was able to identify the problem and, through problem-solving research, develop several solu-tions to increase cereal sales. Kellogg’s performed several tasks to identify the problem. Researchers spoke to deci-sion makers within the company, inter-viewed industry experts, conducted analysis of available data, performed some qualitative research and sur-veyed consumers about their perceptions and preferences for cereals. Several important issues or problems were identified by this research. Current products were being tar-geted at children, alternatives to cereal, such as bagels, were becoming more favoured breakfast foods and high prices were turning consumers to generic brands. Other infor-mation also came to light during the research. Adults wanted quick foods that required very little or no preparation. Collectively, these issues helped Kellogg’s identify the prob-lem. The company was not being creative in introducing new products to meet the needs of the adult market. After defining the problem, Kellogg’s went to work on

14 Marketing Research
solutions. It developed and tested several new flavours of cereals based upon the results of survey interviews with adult consumers. Based on these results, Kellogg’s introduced new flavours that were more suited to the adult palate but were not the tasteless varie-ties of the past. Through creative problem-identification research, followed by problem-solving research, Kellogg’s not only saw an increase in sales, but also increased consumption of cereal at times other than breakfast.
This example illustrates how the careful crafting of problem-identification research can help to develop a clear focus to problem-solving research. The outcome was research that supported marketing decisions in many ways. A problem-solving perspective enabled the Kellogg’s decision makers to focus on issues of product development and an integrated com-munications campaign. Table 1.1 shows the different types of issues that can be addressed using problem-solving research.
Table 1.1
Segmentation research Determine basis of segmentation
Establish market potential and responsiveness for various segments
Select target markets and create lifestyle profiles: demography, media and product image characteristics
Experiential-design research Determine the process of consuming products and services
Online consumption experiences
Social media engagement
Sensory tests
Product research Determine optimal product design
Test concept
Package tests
Product modification
Brand positioning and repositioning
Test marketing
Pricing research Importance of price in brand selection
Pricing policies
Product-line pricing
Price elasticity of demand
Initiating and responding to price changes
Promotions research Optimal promotional budget
Optimal promotion mix
Copy decisions
Creative-advertising testing
Evaluation of advertising effectiveness
Distribution research Attitudes of channel members
Intensity of wholesale and retail coverage
Channel margins
Retail and wholesale locations
Examples of problem-solving research

15Chapter 1 Introduction to marketing research
Problem-identification research and problem-solving research can go hand in hand, as seen in the Kellogg’s case, and a given marketing-research project may combine both types of research.
The global marketing research industry
Huge changes in the marketing research industry have been developing for a number of years. In order to appreciate the nature and impact of these changes, we turn our attention to the relative rates of demand for marketing research and industry growth rates across the globe. To monitor rates of expenditure and growth, we evaluate the annual ESOMAR Global Market Research Industry Study (www.esomar.org)15, the latest available at time of writing being the 2015 report, including data up until the end of 2014.
The figures presented in forthcoming tables are estimates of all the work conducted within individual countries, by research agencies. Not included in the data is marketing research undertaken by non-profit research institutes, governments, universities or advertis-ing agencies using their own resources. The data also do not include the internal supply of marketing research, i.e. the costs of a marketing research function located within a firm. In addition, not included are costs incurred by the more sophisticated users of marketing research who integrate the data and analyses of their operational databases to understand customers and support marketing decision making. Though these estimates are static, and may therefore quickly go out of date, they are a vital means to illustrate developments in the marketing research industry.
Table 1.2
CountryResearch spend
(US$ million)Population (millions)
Research spend per capita (US$)
1. USA 18,565 319 58.19 2. United Kingdom 5,239 65 81.21 3. Germany 3,359 81 44.00 4. France 2,586 64 40.45 5. China 1,780 1,368 1.30 6. Japan 1,730 127 13.62 7. Brazil 754 203 3.72 8. Italy 742 60 12.37 9. Australia 646 24 27.4010. Spain 530 46 11.4111. Netherlands 499 17 29.5812. South Korea 466 50 9.2413. Canada 450 35 12.6714. Sweden 449 10 46.1115. Russia 385 144 2.6816. Mexico 353 120 2.9517. India 267 1260 0.2118. South Africa 222 54 4.1219. Switzerland 218 8 26.7920. Poland 214 38 5.63
Top 20 countries with the highest research spend (2014 data in US$ million)

16 Marketing Research
Table 1.3 lists the regional and total global shares of marketing research expenditure and the net growth rates (taking into account local inflation) in these regions between 2010 and 2014. Although turnover grew in absolute terms from $35.5 billion to $43.8 billion, when inflation was taken into account growth was only 0.1%. Although this is an improvement over the previous period when the industry contracted following the 2008 financial crisis, it does indicate the challenges facing the industry. However, the low nature of growth in real terms should not take away from the large size of the industry, turning over more than $43 billion a year.
While the overall global picture indicates static real-terms growth, there are also some important regional variations. In particular, strong growth remains in key emerging markets in Africa, Asia-Pacific and the Midde-East. This reflects an increased focus among global brands towards developing economies, and in Africa in particular. In terms of the major markets of Europe and the USA, continuing challenging economic circumstances can cer-tainly explain part of the decline in growth rates. More troubling for the marketing research industry could be a switch in spending patterns by companies that commission marketing research, from ‘traditional’ sources to just about any alternative source of information that could apply insight. The result of the decline in the industry and the shift to alternative sources of insight has generated a greater competitive intensity between marketing research suppliers, exacerbating the demand for a broader mix of managerial and technical skills from researchers. This is reflected in attempts by ESOMAR to draw a wider boundary around the marketing research sector by including expenditure on survey technology that is used internally within firms, such as Survey Monkey (www.surveymonkey.com) or Qual-trics (www.qualtrics.com).
How marketing research expenditure is spent on different research methods is illustrated in Table 1.4. Quantitative research methods account for 73% of global research spend, with qualitative accounting for 16%. The remaining 11% includes desk and secondary research. This table makes distinctions between different forms of online research – for instance, high-lighting online qualitative research, where there are many examples of companies specialis-ing in online focus groups, in-depth interviews and ethnography. (These examples will be discussed in Chapters 6 to 9.) One long-term trend that can be observed is that the use of qualitative techniques and secondary data sources (captured in ‘other’) has steadily increased over time while quantitative research has declined. Despite these trends in terms of expendi-ture, quantitative methods remain dominant. The leading research firms on a global basis are highlighted in Table 1.5. Some names you may be familiar with while others may operate through a sub-brand in your market. What is key to note here is the extent to which a rela-tively small group of firms count for a large share of the market.
Table 1.3
RegionTurnover 2010
($USmillion)Turnover 2015
($USmillion) Net growth %*
Europe 13,196 16,164 −0.8North America 13,897 15,512 0.1Asia – Pacific 5,168 6,096 1.6Latin America 1,688 1,856 −0.3Middle East 334 404 9.1Africa 261 273 2.6Total world 34,544 43,861 0.1
* Net growth takes into account local inflation rates.
Turnover, growth rates and market share per region 2010–2015 in $US million

17Chapter 1 Introduction to marketing research
The bases for the estimates in Tables 1.2 to 1.5 are derived from external marketing research suppliers or agencies. External suppliers are outside firms hired to supply research data. These external suppliers collectively comprise the ‘marketing research indus-try’. They range from small (one or a few persons) operations to very large global corpora-tions. We now examine the nature of services that may be supplied by external suppliers. As illustrated in Figure 1.5, external suppliers can be classified as full-service or limited-service suppliers.
Full-service suppliers offer the entire range of marketing research services: for example, defining a problem, developing a research design, conducting focus group interviews, designing questionnaires, sampling, collecting, analysing and interpreting data and present-ing reports. They may also address the marketing implications of the information they pre-sent, i.e. have the management skills to interpret and communicate the impact of their research findings at the highest levels. They may also manage customer database analyses, being able to integrate the management and analyses databases with the management and analyses of conventional marketing research techniques.
The services provided by these suppliers can be further broken down into syndicated ser-vices, standardised services and customised services (see Figure 1.5). Examples of these companies include Kantar (www.kantar.com) and Ipsos (www.ipsos.com).
External suppliersOutside marketing research companies hired to supply marketing research services.
Full-service suppliersCompanies that offer the entire range of marketing research services.
Table 1.4
Quantitative research
Online 23%Automated digital/electronic 21%Telephone 9%Face-to-face 8%Other quantitative (e.g. syndicated services) 5%Mobile/smartphone 3%Postal 2%Online traffic/audience 2%
Qualitative research
Group discussions 11%Online qualitative 3%In-depth interviews 2%Other qualitative 1% Other 11%
Spend by research method for 2014
Table 1.5
The Nielson Company 14%Kantar 8%IMS Health Inc. 6%Ipsos 5%Gartner 5%GfK 4%Rest of the market 58%
Market share of top six companies (2014)

18 Marketing Research
Syndicated services collect information of known commercial value that they provide to multiple clients on a subscription basis. Surveys, diary panels, scanners and audits are the main means by which these data are collected. Examples of these companies include Nielsen (www.nielsen.com) and GfK (www.gfk.com).
Customised services offer a variety of marketing research services specifically designed to suit a client’s particular needs. Each marketing research project is treated uniquely. An example of such companies is TNS (www.tnsglobal.com).
Online services offer a combination or variety of secondary data and intelligence gather-ing, survey or qualitative interviewing, social media engagement and the analysis and publi-cation of research findings, exclusively online. Examples of these companies include YouGov (www.yougov.com) and OnePoll (www.onepoll.com).
Market research reports and advisory services provide off-the-shelf reports as well as data and briefs on a range of markets, consumer types and issues; as such, they are thought of as part of the broader information market and not necessarily part of the tradi-tional marketing research industry. Examples include Euromonitor (www.euromonitor.com) and Mintel (www.mintel.com).
Limited-service suppliers specialise in one or a few phases of a marketing research pro-ject. Services offered by such suppliers are classified as field services, coding and data entry, analytical services, branded products, viewing facilities, panel providers, software provid-ers, web analytics, online community providers, online focus groups and streaming and reporting.
Syndicated servicesCompanies that collect information of known commercial value that they provide to multiple clients on a subscription basis.
Customised servicesCompanies that offer a variety of marketing-research services specifically designed to suit a client’s particular needs. Each marketing-research project is treated uniquely.
Online servicesCompanies that offer a combination or variety of secondary data and intelligence gathering, survey or qualitative interviewing, social media engagement and the analysis and publication of research findings, exclusively online.
Marketing research suppliersFigure 1.5
Research suppliers
ExternalInternal
Limited-serviceFull-service
Market researchreports and
advisory serviceOnline services
Fieldservices
Codingand data-
entry services
Analyticalservices
Branded-productsservices
Panelproviders
Softwareproviders
Onlinecommunityproviders
Onlinefocus
groups andstreaming
Reporting
Customisedservices
Syndicatedservices

19Chapter 1 Introduction to marketing research
Field services collect data through postal surveys, face-to-face interviews, telephone interviews and the internet. Firms that specialise in interviewing are called field-service organisations. These organisations may range from small proprietary companies that operate locally to large multinationals. Some organisations maintain extensive interviewing facilities across the country for interviewing shoppers. Many offer qualitative data collection services, such as focus group interviewing (discussed in detail in Chapter 7). Examples of these com-panies include LightspeedGMI (part of WPP) (www.lightspeedgmi.com) and Indiefield (www.indiefield.co.uk).
Coding and data-entry services include editing completed questionnaires, developing a coding scheme and transcribing the data for input into a computer.
Analytical services include designing and pre-testing questionnaires, determining the best means of collecting data and designing sampling plans, as well as other aspects of the research design. Some complex marketing research projects require knowledge of sophisti-cated procedures, including specialised experimental designs (discussed in Chapter 10) and analytical techniques such as conjoint analysis and multidimensional scaling (discussed in Chapter 26). This kind of expertise can be obtained from firms and consultants specialising in analytical services. Examples of these companies include Cobalt Sky Ltd (www.cobalt-sky.com) and Digitab (www.digitab.uk.com).
Branded marketing-research products and services are specialised data collection and analysis procedures developed to address specific types of marketing research problems. These procedures may be patented, given brand names and marketed like any other branded product. An example of such a company is Millward Brown’s Vermeer (mbvermeer.com).
Panel providers offer researchers the opportunity to access consumer, b2b and specialist panels of participants, alongside scripting and hosting surveys. Examples of these companies include e-Rewards (www.e-rewards.com) and Toluna (www.toluna.com).
Software providers offer software packages that create platforms to script, host and ana-lyse surveys, or software as a service (SaaS) options. Examples of these companies include Qualtrics (www.qualtrics.com) and Surveymonkey (www.surveymonkey.com).
Online community providers build online research communities where researchers can employ a wide variety of quantitative and qualitative techniques to connect to consumers. Examples of these companies include Cspace (www.cspace.com) and FreshMinds (www.freshminds.net).
Online focus groups and streaming provide platforms for running online focus groups and streaming the results. An example is FocusVision (www.focusvision.com).
Reporting offers research companies reporting solutions that seek to engage clients in oral and electronic presentations beyond conventional reporting methods such as hard-copy reports and PowerPoint. They utilise specialist art and graphic-design services to create static data presentation formats and data dashboards that can be interrogated.
Justifying the investment in marketing research
The 2015 ‘ESOMAR Global Market Research’ report highlights many of the pressures that the marketing research industry is facing. One of the key weaknesses the report highlights is the need to raise the perceived value of research among decision makers outside the research sector.16 This is not a recent phenomenon; it is a challenge that the marketing research industry has faced from its inception and that has become more prevalent in recent times:
the price of consumer data is trending downwards and parts of market research are becoming commoditised. This is in part driven by aggressive procurement processes, growing expectations for demonstrable return on investment and increasing macroeconomic pressure. ‘Consumer data’ is now more abundant and automated.17
Market research reports and advisory servicesCompanies that provide off-the-shelf reports as well as data and briefs on a range of markets, consumer types and issues.
Field servicesCompanies that collect data through postal surveys, face-to-face interviews, telephone interviews and the internet.
Analytical servicesCompanies that provide such services as designing and pre-testing questionnaires, determining the best means of collecting data and designing sampling plans.
Panel providersCompanies that offer researchers the opportunity to access consumer, b2b and specialist panels of participants, alongside scripting and hosting surveys.
Software providersCompanies that provide software packages that create platforms to script, host and analyse surveys, or software as a service (SaaS) options.
Limited-service suppliersCompanies that specialise in one or a few phases of a marketing-research project.
Coding and data-entry servicesCompanies that offer such services as editing completed questionnaires, developing a coding scheme and transcribing the data for input into a computer.
Branded marketing-research products and servicesCompanies that offer specialised data collection and analysis procedures developed to address specific types of marketing-research problems. These procedures can be patented, given brand names and marketed like any other branded product.

20 Marketing Research
Return on investment in marketing research spend will continue to be a factor that all practising researchers will need to address.
It must be recognised that if decision makers make use of marketing researchers, even if the best theories and practice of the marketing research process are followed ‘to the letter’, there is no guarantee that a marketing decision supported by research will be successful. The act of decision making and conducting marketing research are distinctive activities and there are examples where the vital link between these activities has resulted in failure. If decision makers have gaps in their knowledge, if they perceive risk and uncertainty in their decision making and cannot find support at hand within their organisation, they can gain support from marketing research. However, many decision makers can recount cases where the use of marketing research has resulted in failure or where decisions based upon gut feeling or intui-tion have proved to be successful. Such cases present a challenge to researchers, especially in light of the competition faced by the industry from alternative data sources.18 Reflecting upon such cases should remind researchers to maintain a focus of offering real and valuable support to decision makers. Understanding what real and valuable support means should underpin the whole array of creative data collection and analysis procedures available to the researcher.
Another view to reflect upon is the damning comment from the late Anita Roddick, founder of The Body Shop, who said that ‘market research is like looking in the rear view mirror of a speeding car’.19 This may be a valid point if one sees the relationship of market-ing and marketing research from the perspective illustrated by the respected research practi-tioner, Wendy Gordon:
Traditional marketers delegate responsibility to the processes of marketing research. They believe that you can ask people what they want and need in the future and then deliver it to them. It is a fallacy. Marketing research removes people from experiencing reality, where the signs of change bubble up in unexpected places. Sitting in comfort behind a oneway mirror, listening to a debrief from researchers describing the world ‘out there’ or reading statistical reports on markets and the ‘aggregate consumer’ is not real, it is sanitised and secondhand.20
Given the above criticisms, it is a fair point to acknowledge that there are cases where the use of marketing research has resulted in poor decision making, or even failure. Ultimately, this examination should lead to a stronger justification of what ensures strong and valuable marketing research support. It may be a painful path to tread, but this journey has to be made!
There are two areas of misconception of the role of marketing research that are still rele-vant today:21
Marketing research does not make decisions. The role of marketing research is not to make decisions. Rather, research replaces hunches, impressions or a total lack of knowledge with information that can be trusted.
Marketing research does not guarantee success. Research, at best, can improve the odds of making a correct decision. Anyone who expects to eliminate the possibility of failure by doing research is both unrealistic and likely to be disappointed. The real value of research can be seen over a long period where increasing the percentage of good decisions should be manifested in improved bottomline performance and in the occasional revelation that arises from research.
The last point shows the long-term benefits of conducting marketing research, i.e. that the results of a study may help decision makers with an immediate problem, but by building their knowledge they can also have long-term benefits.
The following example illustrates how marketing research could be used in new-product development. In an echo of some of the sentiments shared by Steve Jobs earlier in this chap-ter, the designer and entrepreneur chose to ignore the findings, and ultimately achieved immense levels of success. This is not always the case, as many different designers embrace marketing-research techniques to support their design thinking and practice to great effect.
Online focus groups and streamingCompanies that provide platforms for running online focus groups and streaming the results.
ReportingCompanies that offer research companies reporting solutions that seek to engage clients in oral and electronic presentations beyond conventional reporting methods such as hard-copy reports and PowerPoint.
Online community providersCompanies that build online research communities where researchers can employ a wide variety of quantitative and qualitative techniques to connect to consumers.

21Chapter 1 Introduction to marketing research
Out of the array of research and information-support approaches, there is no one, guaran-teed approach, research design or technique that can create the perfect means to support deci-sion makers. If decision makers complain that research is misleading or is only telling them what they already know, the researcher may argue that the fault lies with managers who pose the wrong questions or problem in the first place. If one takes the narrow view that the deci-sion maker poses the questions and the researcher finds the answers, there may be some validity in such an argument. It does not hold if one considers that the decision maker and the researcher have a joint commitment to solve problems. In this joint commitment they have quite distinct but complementary creative skills that they can bring together to understand what problem they should be researching, how they conduct the research and how they inter-pret their findings.
Can researchers survive in an age of increasing competition from other information pro-viders? Can they cope with the threats of growth of in-house research and new entrants to the industry that adopt new technologies and techniques, especially in the use of social media? Can the industry fend off the challenge from the armies of consultants, and avoid research being seen as a commodity?23 To achieve this, the industry has to offer marketers’ insights that have integrity and can be trusted, rather than just ‘robust’ data collection and analysis. Such insights should lead to fresh perspectives to business problems and/or a competitively advantaged solution.24 The researcher’s input must be seen to benefit the bottom line. Initia-tives that bring marketers and researchers closer together are needed, initiatives that educate buyers that marketing research has as much, if not more, to offer than far more expensive consultancy firms.25
Real research Doing a Dyson22
Just 23 months after its launch in the UK, the Dyson bagless vacuum cleaner became the country’s best seller, overtaking sales of Hoover, Electrolux, Panasonic, Miele and all other vacuum cleaners. The Dyson’s clear bin was given a resounding thumbs-down in marketing research. People said they did not like the dirt being visible in the bin in case their neighbours saw how much dirt had been picked up in their homes. Some retailers said they would not want to have dust on display in demonstration machines. Yet, the dust was there because they began using Dyson display machines to clean their shops. Dyson felt compelled to launch its vacuum cleaner with a clear bin, believing that it was important to see when it was full. Moreover, what better way was there to show stock-ists, sales staff and customers proof of its increased efficiency than to see the dirt being collected? How would consumers react to a new vacuum cleaner with totally radical styling, revolutionary internal engineering and a price tag almost twice that of the cur-rent brand leader? The response proved immediately that innovative products do sell, even at a premium price. However, marketing research did not point to this product having the potential to be a success. James Dyson argued that ‘marketing research will only tell you what has happened. No research can tell you what is going to happen’. This is a theme that James Dyson has reiterated over the years. In an interview in 2006, giving tips to would-be inventors and entrepreneurs, he said:
You can’t go out and do marketing research to try and solve these problems about what to do next because usually, or very often, you’re doing the opposite of what mar-keting research would tell you. You can’t base a new project two years ahead on cur-rent market trends and what users are thinking at the moment. That sounds very arrogant. But it isn’t arrogance. You can’t go and ask your customers to be your inven-tors. That’s your job.

22 Marketing Research
The future – addressing the marketing research skills gap
A key theme of this book relates to the emergence of new technologies and their impact upon marketing research. Billions of people now engage regularly in online discussions, giving their opinions, meeting new people, showing their activities, preferences, uses and attitudes, talking about brands, services, music and films. An idea of the scale of the potential impact of this does not come from Facebook’s announcement that it passed 1 billion regular users26, but from its internal target of having 5 billion users by 2030.27 Despite these numbers, the marketing research industry has been criticised for being slow to recognise that engagement with these new technologies is having a significant impact upon the nature, value and integ-rity of the work they undertake.
That is not to say that marketing research has not responded to the growth in technology, and in later chapters we will look at the importance of mobile and social media research, together with the increasing use of online data collection tools. In marketing research, the early period of the internet – from the late 1990s onwards – was used as a digital extension of activities that could be done offline, taking the survey from face to face, then to telephone (with computer-assisted telephone interviewing, CATI) and then online with web surveys. It has been argued that ‘the survey’ has not really embraced the breadth and richness of digital developments, with many surveys conducted online being essentially online versions of sur-veys that were previously administered by interviewers face to face.28 Although there are some opportunities to include multimedia, such as video, audio or pictures, in essence it is still a survey. These attempts to engage participants are in response to evidence that shows completion rates of surveys are dropping as participants grow tired of overly long surveys.29 However, the continuing use of surveys may ignore a revolution in online behaviour where people are now expressing their opinions and feelings in far more sophisticated and complex ways. The following example of audio company Bose highlights how such online channels can be used in research.
Real research Bose’s online community30
Bose (www.bose.com) is a high-end audio manufacturer, famous for its speakers and headphones. As a privately held company, wor-ried about competitors finding out new prod-uct plans, it could only draw upon existing employees for insights. The company realised that gathering feedback from employees – most of whom got the product for free – was not giving it an understanding of how its actual customers fel. Working with C Space, a spe-cialist in building online communities, Bose built an online community of around 400 people, including a mix of people who were existing customers and fans of the Bose brand and those who weren’t. Members of the community completed a number of activities each week, ranging from surveys to mobile ethnographies. The membership of the online community was frequently refreshed to ensure that it was representative of the most important customer segments.
After running for 18 months, Bose identified a number of benefits that were created by the use of online communities. These included new product opportunities, improv-ing its marketing messaging and a deeper understanding of how its customers view competitors.

23Chapter 1 Introduction to marketing research
Within the marketing research community there has been some attempt to align the broader changes resulting from the growth of the internet. For example, in 2004 the term ‘Web 2.0’ entered common use to describe the growth in user-generated content being uploaded to websites and the increasingly participative nature of the Web. For example, the growth in social networks has happened through interaction between individuals rather than top-down control of content by the companies running websites. As the term Web 2.0 became increasingly established, people began to apply the 2.0 label to a wider range of activities, including law, architecture and even government. In the world of marketing research, the term ‘Research 2.0’ came into being in 2006, to reflect a shift away from the old ‘command and control’ paradigm of marketing research towards a more collaborative approach. The core of Research 2.0 was to move away from an assumption that the brand decision makers and the researcher knew everything, towards a three-way discussion between the brand, the researcher and the customer.
Although early techniques tended to be passive techniques based around blogs, more active techniques are now the most significant area of interest in the area of online research communities, such as that used in the example of Bose.31 Traditional research techniques, such as focus groups and one-to-one interviews, while they still relate to younger audiences do not apply as readily as collaborative techniques, which are aligned more to conversation and empowering participants than to seeking specific responses. In isolation, face-to-face research with young people can deliver patchy results.32 The combination of Web and elec-tronic media use and proficiency by youth audiences has forced marketing research to evolve and embrace mixed methodologies. By engaging with younger audiences in ‘youth-friendly’ media, the quality and range of insight returned has risen. In contexts that are familiar, inter-active, but not physically engaging, younger audiences come alive.
Over time, the usage of the term Web 2.0 has declined sharply, and with it the term Research 2.0 has faded.33 This is not because the underlying concepts were unimportant, but it reflects that the development of internet technology is an ongoing process with impacts that differ depending on the time, place and context. The Web 2.0/Research 2.0 model implied an alternative world where everything had changed. Yet, in the case of research, new technology has often been used alongside existing techniques. Additionally, as the use and impact of technology has grown to near ubiquitous levels, the need to distinguish between ‘new’ and ‘old’ research has dissipated.
That is not to say that there aren’t important issues raised by the growth in technology. Some key issues are:34
1 Trust. Ensuring that research buyers understand the basis of the advice they are given. Decision makers have been assured for over 70 years that the research is ‘true’ because it is based on a scientific approach to knowledge development, thus it will take a while for the new messages to be widely understood.
2 Theoretical base. At the moment, many new techniques are being used in a theoretical vacuum; thus researchers need to address this and rebuild a body of knowledge and theory that supports the techniques being used.
3 Ethical base. There are new privacy, security and safety issues. Social media has changed the rules on how ‘findable’ somebody is. This has enormous implications for privacy and safety. For example, including a literal quote from an online forum in a report is essentially the same thing as naming the individual, since a search on the quote will usually return information about the person making it. The discussion about ‘what is in the public domain’ and what can be used when, where and how has barely started, and will develop rapidly over the next few years.
A newer issue that has emerged recently is the question of whether the marketing research industry is facing a skills gap.35 It has been suggested that one of the reasons that marketing research has found it difficult to adapt to change brought about by technology

24 Marketing Research
is the lack of appropriate technical skills among researchers. A worrying trend for market-ing research is the identification that marketing researchers lack sufficient analytical skills to draw insights from the increasing volumes of data being generated through ‘big data’ technologies.36
These issues will be described, illustrated and debated throughout this text. While mar-keting research faces uncertainty and challenges, these challenges can be found across many industries. The corollary of these events can also be seen, in that the future of the marketing research industry is laden with great opportunities, and it is in this spirit that we also wish to portray the subject. There are many commercial and scholarly opportunities, but these will demand a different set of skills, thinking and outlook compared with the researcher of the past.
The marketing research industry has great opportunities to add value to research. Researchers can move up the value chain to offer more advice and insight, thus improving their stature and ultimately their profitability. They can help decision makers to make sense of a variety of data sources rather than walking away from a project when the research is complete.37 Moving towards a business model that is driven by researchers offering action-able consumer insight means that researchers and the marketing research industry of the future will be required to:38
• Think conceptually – by developing ‘conceptual’ thinkers, i.e. researchers who feel com-fortable working with higher-order business concepts and talking the language of senior decision makers. These individuals must understand the relationship between information and key business concepts. They must go beyond their technical and skill-based knowl-edge and offer strategic and tactical advice for business advantage based on detailed con-sumer and market knowledge.
• Communicate in the way that those who commission research think – by knowing how to communicate in the way senior people think, i.e. researchers presenting findings as a compelling narrative, not as disparate blocks of information.
• Interpret findings in terms of the whole picture – by thinking holistically about ‘evidence’, i.e. researchers with the skills to work in a ‘holistic’ way with all available customer evi-dence, recognising the need to interpret often imperfect marketing information. They must draw knowledge from a host of different sources including qualitative and quantita-tive techniques, a variety of forms of observation, customer relationship management systems and financial and customer-profile information. These individuals will have to draw heavily upon the use of analytical models that represent the way customers think and behave.
• Integrate findings with others that support marketing decision makers – by working in a multidisciplinary way with related marketing-services companies, with researchers work-ing alongside branding and design and other marketing specialisms to gain a wider market understanding. This makes sure that everything is tailored to business solutions and is not just the result of rigid prescriptive research designs. This bottom-up, multidisciplinary approach provides flexibility and differentiates ‘strategic marketing intelligence’ from the ‘top-down’ approach of full-blown management consultants. This will also mean the cul-tivating of a more creative environment, with a more ‘hands-off’ management style rather than a prescriptive techniques-driven approach.
Finally, in a note of optimism, it is worth reflecting upon the views of three new graduates arguing what makes marketing research a great career choice. They worked for the research company Ipsos (www.ipsos.com) and were presenting their views to professional research-ers at the Annual Conference of the Market Research Society:39
1 Variety. This can apply to the kind of work and the projects one experiences, the sectors one can specialise in, the people and the teams one will work with depending on the pro-ject. Then, the actual day-to-day work is varied (be it data analysis one day, fieldwork the

25Chapter 1 Introduction to marketing research
Summary Marketing research provides support to marketing decision makers by helping to describe the nature and scope of customer groups, understand the nature of forces that shape the needs of customer groups and the marketer’s ability to satisfy those groups, test individual and interactive controllable marketing variables and monitor and reflect upon past successes and failures in marketing decisions. The overall purpose of market-ing research is to assess information needs and provide the relevant information in a systematic and objective manner to improve marketing decision making. The marketing research process consists of six broad steps that must be followed creatively and system-atically. The process involves problem definition, research approach development, research design formulation, fieldwork or data collection, data integrity and analysis and report preparation and presentation. Within these six broad steps are many iterations and routes that can be taken, reflecting the reality of marketing research in practice. Market-ing research may be classified into problem-identification research and problem-solving research. In general terms, problem identification uncovers the potential that may be exploited in markets, problem solving uncovers the means to realise that potential.
The major developed economies, especially in Europe and the USA, are the biggest users of marketing research on a per capita and total expenditure basis. However, in recent years growth of the sector has slowed – and in some years fallen. Commentators have debated whether this fall can be attributed solely to the global economic factors or trends within market research itself. Alternative explanations have focused upon the development in technology, such as social media usage and the growth of big data. New ways of engaging and collaborating with consumers are being generated that challenge many of the principles upon which ‘traditional marketing research’ has been built.
Marketing research may be conducted internally (by internal suppliers) or may be purchased from external suppliers. Full-service suppliers provide the entire range of marketing research services, from problem definition to report preparation and pres-entation. They may also manage customer database analyses and social media research, being able to integrate the management and analyses databases with the
next, charting, etc.). Ad hoc research also has the benefit of offering a variety of projects that can last from a few weeks up to a year or more.
2 Career progression. Marketing research has many clearly defined roles across the indus-try. Not only is there clear career progression within a company, but there is also the option to move client side (or vice versa), do international research, relocate to another country (a key selling point for a global business), specialise in a particular sector or even move to other roles such as brand consulting.
3 Responsibility. Compared with other industries, marketing research can offer a large amount of responsibility from an early stage of a person’s career. Where graduates in some industries may still be doing photocopying and other mundane administrative tasks, those working in marketing research may be at a stage where they are managing large international projects.
4 Intellectual eclecticism. Marketing research is open to graduates from all disciplines; all subject disciplines are applicable as there are a variety of roles and the nature of work can demand skills from all subject areas.
5 Working environment. Marketing research has some of the most intelligent, interesting, fun and inspiring people, and that makes it a great place in which to work and develop. The culture (particularly agency side) is relaxed and friendly with a mix of personalities and characters. It is not until you actually work in marketing research that you realise this.

26 Marketing Research
management and analyses of conventional marketing-research techniques. Limited-service suppliers specialise in one or a few phases of the marketing-research project.
Marketing research is not a panacea for all marketing problems. There are examples where marketing research has not adequately supported decision makers. The Steve Jobs quote used at the beginning of this chapter has become popular because many managers have experienced disappointment at the performance of marketing research. However, many of the problems that arise from poor marketing research derive from poor communications between decision makers and researchers. In order to resolve these problems, there are growing demands upon the marketing research industry to produce research findings that are more actionable and relevant to marketing decision makers. As well as having the technical skills to conduct research in a professional and ethical manner, researchers are increasingly expected to have the ability to inter-pret their findings in a manner that is relevant to decision makers.
Questions 1 Describe the purpose of marketing research.
2 What kinds of decisions are made by marketing managers? How does marketing research help in supporting these decisions?
3 What do you see as the major challenges for researchers that emerge from the ESOMAR definition of marketing research?
4 How may the effective problem-identification research enhance the practice of problem-solving research?
5 What challenges exist in trying to quantify the size and growth of the marketing research industry on a global basis?
6 Explain one way to classify marketing research suppliers and services.
7 Describe the steps in the marketing-research process.
8 Explain why there may be the need for iterations between stages of the marketing-research process.
9 What arguments can be used by sceptics of marketing research?
10 What kinds of new skills are increasingly being demanded from researchers?
11 What arguments would you use to make the case for greater investment in marketing research?
12 Summarise the nature of threats and opportunities that social media offer the researcher.
Exercises 1 Visit the website of TNS (www.tnsglobal.com). Examine the nature of the research services the firm offers and consider how you see them fitting together.
2 Visit the website of the Market Research Society (www.mrs.org.uk). Work through the range of publications and support it gives to its members. Specifically visit the published code of conduct. Compare the MRS code of conduct with that available on the ESOMAR website (www.esomar.org). Are there any differences in their respective approaches to maintaining professional standards in the marketing research industry?

27Chapter 1 Introduction to marketing research
Notes
1. ‘TfL – Next stop, cultural change’, MRS Awards: Winner, December 2015
2. Isaacson, W., Steve Jobs (London: Little Brown 2011), 72.
3. ‘Turns out Apple conducts market research after all’, http://blogs.wsj.com/digits/2012/07/26/turns-out-apple-conducts-market-research-after-all/, accessed 4 May 2016.
4. Dekkers, S. and Lawrence, G., ‘easyJet community – using online communities to co-create the future’, ESOMAR Panel Research, Dublin (October 2008).
5. ‘Europe by easyJet’, Marketing Society UK: Excellence Awards, Grand Prix, 2014.
6. ‘How easyJet used data to cut spend and boost its brand: A view from Thinkbox’s Blind Data event’, Event Reports: Thinkbox: Blind Data, November 2013.
7. Macer, T., ‘Technology futures: perspectives on how technology will transform the market research of tomorrow’, Market Research Society Conference (2009).
8. Bank, P.F., The Roman Bazaar. A Comparative Study of Trade and Markets in a Tributary Empire’ (Cambridge: Cambridge University Press, 2008).
9. Lockley, L., ‘Notes on the history of marketing research’, Journal of Marketing, 14 (1950) (5), 733–6.
10. Blankenship, A., ‘Needed: A broader concept of marketing research’ Journal of Marketing, 13 (1949) (3) 305.
11. ESOMAR, ‘Market Research Explained’, https://www.esomar.org/knowledge-and-standards/market-research-explained.php, accessed 4 May 2016.
12. ‘AMA Definition of Marketing’, https://www.ama.org/AboutAMA/Pages/Definition-of-Marketing.aspx, accessed 4 May 2016.
13. Renkema, R. and Zwikker, C., ‘Development of a new brand concept’, ESOMAR Consumer Insights Conference (March 2003).
14. Boal, K., ‘Kellogg rolls out new cereal and snacking options’, Bakery & Snacks (12 February, 2007); Anon., ‘Kellogg’s Crunchy Nuts gets ready for adult breakfast’, The Grocer 224 (7524) (6 October, 2001), 53 and www.kelloggs.com.
15. ESOMAR, ‘Global Market Research’, ESOMAR Industry Report (2015).
16. ESOMAR, ‘Global Market Research’, ESOMAR Industry Report (2010), 44.
17. Woodnutt, T. and Owen, R., ‘The research industry needs to embrace radical change in order to thrive and survive in the digital era’, Market Research Society, Annual Conference (2010).
18. ESOMAR, ‘Global Market Research’, ESOMAR Industry Report (2015), 3.
19. Lury, G., ‘Market research cannot cover for the “vision thing”’, Marketing (9 November 2000), 34.
20. Gordon, W., ‘Be creative to innovate’, Research (January 2000), 23.
21. Lehmann, D.R., Market Research and Analysis, 3rd edn (Homewood, IL: Irwin, 1994), 14.
22. Muranka, T. and Rootes, N., Doing a Dyson (Dyson Appliances, 1996), 22; Mesure, S., ‘A day in the life of James Dyson’, Independent (27 May 2006), 55.
23. ESOMAR, ‘Global Market Research’, ESOMAR Industry Report (2015), 48.
24. Srivatsa, A., Puri, A. and Raj, S., ‘The case of the elusive insight: lessons from the greatest researcher of them all’, Consumer Insights Conference, Milan (May 2005).
25. Chelliah, J. and Davis, D., ‘But do you like your (expensive management) consultant?’, Journal of Business Strategy 31 (2) (2010), 34–42.
26. BBC News, ‘Facebook has a billion users in a single day, says Mark Zuckerberg’, http://www.bbc.co.uk/news/world-us-canada-34082393, accessed 28 August 2015.
27. USA Today, ‘Facebook in 2030? 5 billion users, says Zuck’, http://www.usatoday.com/story/tech/news/2016/02/04/facebook-2030-5-billion-users-says-zuck/79786688/, accessed 4 February 2016.
28. ESOMAR, ‘Global Market Research’, ESOMAR Industry Report (2015).
29. ESOMAR, ‘Global Market Research’, ESOMAR Industry Report (2015).
30. Whiteside, S., ‘Bose learns to listen to customers’, Event Reports: The Market Research Event (November 2015).
31. Poynter, R., Cierpicki, S., Cape, P., Lewis, A. and Vieira, S., ‘What does research 2.0 mean to consumers in Asia Pacific?’, ESOMAR, Asia Pacific, Beijing (April 2009).
32. Antilli, L. and Vishney, A., ‘Digital media and technology in youth audience research’, Admap Magazine, Issue 498 (October 2008).
3 From national or international newspapers, track down stories of successful entrepreneurial ventures. Evaluate the extent to which marketing research is attributed to their success and/or an awareness of their market(s).
4 In a small group discuss the following issue: ‘What is the ideal educational background for someone seeking a career in marketing research?’.
5 Re-read the quote from Steve Jobs earlier in this chapter. Using the internet, identify other business leaders who have made comments around the effectiveness of market research, positive or negative. Examine their statements and consider the extent to which you agree with them.

28 Marketing Research
33. Discover, ‘The Decline of Web 2.0’ (March 2011), http://blogs.discovermagazine.com/gnxp/2011/03/the-decline-of-web-2-0/, accessed 4 May 2016.
34. Poynter, R., ‘A taxonomy of new MR’, Market Research Society, Annual Conference (2010).
35. Nunan, D., ‘Addressing the market research skills gap’, International Journal of Market Research 57 (2) (2015) 177–8.
36. Lund, S., Manyika, J., Nyquist, S., Mendonca, S. and Ramaswamy, S., ‘Game changers: Five opportunities for US growth and renewal’, McKinsey Global Institute Report (2013).
37. Chelliah, J. and Davis, D., ‘But do you like your (expensive management) consultant?’, Journal of Business Strategy 31 (2) (2010), 34–42; Keegan, S.,
‘“Emergent inquiry”: a practitioner’s reflections on the development of qualitative research’, Qualitative Market Research: An International Journal 12 (2) (2009), 234–48; Florin, D., Callen, B., Pratzel, M. and Kropp, J., ‘Harnessing the power of consumer insight’, Journal of Product & Brand Management 16 (2) (2007), 76–81.
38. Gordon, W., Ratcliff, M., Wynberg, R., Edwards, P., Helyar, R., Simmons, S., Fryer, S., Taylor, R. and O’Brien, Y., ‘The future of research’, Admap, July/August (2010), 18–23; Van Hamersveld, M. and Smith, D., ‘From data collection to decision support (3)’, Research World (December 2003), 20.
39. Radbourne, V., Boneham, D. and Muttiallu, J., ‘“When I grow up I want to be…”: attracting, developing and retaining graduate talent’, Market Research Society, Annual Conference (2008).

Defining the marketing research problem and developing a research approach
Stage 1
Problem definition
Stage 2
Research approach developed
Stage 3
Research design
developed
Stage 4
Fieldwork or data
collection
Stage 5
Data integrity
and analysis
2
Stage 6
Communicating research findings
The accurate identification of
research problems cannot be
compromised. Regardless of how
well subsequent stages are
conducted, the whole process
may be worthless if problem
identification is incorrect.

30 Marketing Research
Objectives
After reading this chapter, you should be able to:
1 understand the importance of, and the process used in, defining marketing research problems;
2 describe the tasks involved in problem definition;
3 discuss in detail the nature and various components of a research brief and a research proposal;
4 discuss the environmental factors affecting the definition of the research problem;
5 clarify the distinction between the marketing decision problem and the marketing research problem;
6 explain the structure of a well-defined marketing research problem, including the broad statement and the specific components;
7 understand the role of theory in the development and execution of applied marketing research;
8 acquire an appreciation of the complexity involved in defining the problem and developing a research approach in international marketing research.
This chapter covers the first two of the six steps of the marketing research process (described in Chapter 1): defining the marketing research problem and developing a research approach to tackle the problem. Defining the problem is the most important step, since only when a problem has been clearly and accurately identified can a research project be properly conducted. Regardless of how well a research plan is designed and subsequent stages are carried out, if the problem is not correctly diagnosed, research findings could be misleading or even dangerous. In this chapter, we allow the reader to appreciate the complexities involved in defining a problem, by identifying the factors to be considered and the tasks involved.
In practical terms, the means to communicate and facilitate the diagnosis of research problems is achieved through the preparation of a research brief and research proposal. The rationale and components of the research brief and research proposal are presented. We provide guidelines for appropriately defining the marketing research problem and avoiding common types of errors. The client–researcher relationship is described with seven Cs (communication, cooperation, confidence, candour, closeness, continuity and creativity), presented to nurture a trusting and effective relationship. We also discuss in detail the characteristics or factors influencing the research design and components of an approach to the problem: objective/theoretical framework, analytical models, research questions and hypotheses.
We introduce our discussion with an example of how Walmart’s UK subsidiary, Asda, structured a market research project to successfully address the problem of ensuring that research insights made their way across the organisation.
Overview
Real research Breaking down silos at Asda1
Asda is the UK brand of American retail giant Walmart, known for its large-format stores. It operates in one of the world’s most competitive grocery markets. Additionally, it faces the challenges of consumers shifting to online purchasing, the growth in ‘click and col-lect’ services and the growth of smaller-format stores. Working with full-service market research agency Trinity McQueen (www.trinitymcqueen.com), Asda sought to address the following marketing research problem:

31Chapter 2 Defining the marketing research problem and developing a research approach
How can organisation silos be broken down to ensure that research insights reach across the organisation?This is important because the behaviour of individual categories, on their own, can cause wider problems if they are not joined up with the corporate views of ‘head office’. For example, a reduction in prices in one category might damage a message of quality in an adjacent category.
This research problem was addressed via a range of approaches, including both pri-mary and secondary research in a process labelled ‘Category Deep Dive’.
Primary research included shopper interviewers (in-home, accompanied during the shopping process and when exiting store), observational in-store research, surveys and eye-tracking interviews during shopping.
Secondary data included both internal data (e.g. sales data) and data from external marketing research providers.
The findings were effective not because of the range of methods used, but by the focus on ensuring that insights were actionable within the realities of organisational life. For example, this research approach ensured that:
1 Actionable insights are simple and clear. For example, they are often presented in a visual format.
2 Research is matched to the planning cycle and done at a point where research insights can be effectively actioned.
3 To break through silos a cross-functional group is involved from different departments, and the project can not get underway without sponsorship from senior management.
Importance of defining the problem
Although each step in a marketing research project is important, problem definition is the most important step. For the purpose of marketing research, problems and opportunities are treated interchangeably (as mentioned in Chapter 1). Problem definition involves stating the general problem and identifying the specific components of the marketing research prob-lem. Only when the marketing research problem has been clearly defined can research be designed and conducted properly:
Of all the tasks in a marketing research project, none is more vital to the ultimate fulfilment of a client’s needs than an accurate and adequate definition of the research problem. All the effort, time, and money spent from this point on will be wasted if the problem is misunderstood and ill-defined.2
An analogy to this is the medical doctor prescribing treatment after a cursory examination of a patient – the medicine may be even more dangerous than the condition it is supposed to cure! The truly serious mistakes are made not as a result of wrong answers but because of asking the wrong questions. This point is worth remembering, because inadequate problem definition is a leading cause of failure of marketing research projects. Further, better com-munication and more involvement in problem definition are the most frequently mentioned ways of improving the usefulness of research.
The importance of clearly identifying and defining the research problem cannot be over-stated. The foundation of defining a research problem is the communication that develops between marketing decision makers and researchers. In some form or another, marketing decision makers must communicate what they see as being the problems they face and what
Problem definitionA broad statement of the general problem and identification of the specific components of the marketing research problem.

32 Marketing Research
research support they need. This communication usually comes in the form of a research brief. The researcher responds to the research brief with a research proposal, which encapsu-lates the researcher’s vision of a practical solution to the set research problem. The following example illustrates that a research brief may not always be particularly well thought out. The researcher is expected to develop the brief into a research proposal and, in doing so, has a vital role to play in the diagnosis of research problems.
Real research How to bait the interview hook for those top 1,000 big fish3
The groans from researchers when another brief arrives asking for 100 or 200 interviews with chief executive officers (CEOs) or equivalents within large companies typifies the attitude generated by business-to-business marketers’ constant demand to reach this audience. When the research brief arrives, it is certainly worth examining whether, prac-tically, what is requested can actually be done. The research proposal developed must reflect the practicalities of questioning managers who are constantly bombarded with requests to respond to research questions. The number of interviews, the timescale, the nature of questions and the structure of the sample all need to be taken into account. For example, is it really worth undertaking just 200 interviews within any single European country? If we were limited to one per organisation, we would be interviewing to strike rates of between 1 in 2.5 and 1 in 5. If the research targets companies throughout Europe, individual countries such as the UK and France may have few large companies compared with the USA, while Italy has a small number of very large companies and a great many smaller ones. In actually reaching the target audience, a number of issues need to be taken into account. International business-to-business research with senior business audiences brings with it not only the particular difficulties of reaching them, but also the need to understand both country and cultural issues that impact on the research. Telephone interviews (even if possible) are considered inappropriate in many Far East and Middle East markets, especially South Korea and Japan. In Singapore and Hong Kong, the telephone is fine, provided the interviews are not too long (over 15 minutes).
The marketing research brief
The marketing research brief is a document produced by the users of research findings or the buyers of a piece of marketing research. The brief may be used to communicate the perceived requirements of a marketing research project to external agencies or internally within an organ-isation to marketing research professionals. It should act as the first step for decision makers to express the nature of a marketing and research problem, as they see it. This first step is vital in developing an agreement of an appropriate research approach. As a first step of problem diag-nosis and negotiation, the marketing research brief should not be carved in tablets of stone!
It has been argued that the greatest source of potential error in marketing research lies in the initial relationship between marketing decision makers and researchers.4 In developing a sound initial relationship, the research brief plays a vital role. Without some formal method of communicating the nature of a marketing problem, there is great potential for ambiguities, illogical actions (by both parties), misunderstandings and even forgetfulness.
The purpose of a written marketing research brief may be summarised as follows:
• It makes the initiator of the brief more certain of how the information to be collected will support decision making.
• It ensures an amount of agreement or cohesion among all parties who may benefit from the research findings.
Research briefA document produced by the users of research findings or the buyers of a piece of marketing research. The brief is used to communicate the perceived requirements of a marketing research project.

33Chapter 2 Defining the marketing research problem and developing a research approach
• It helps both the marketer and the researcher to plan and implement the research design.
• It helps to reduce disputes that can occur when the gaps in decision makers’ knowledge are not ‘filled’ as intended.
• It can form the basis for negotiation with a variety of research organisations.
In all, the research brief saves resources in time and money by helping to ensure that the nature of the problem or opportunity under investigation has been thought through.
Components of the marketing research brief
The rationale for a marketing research brief may seem logical, but actually generating a brief from marketing decision makers can be extremely difficult. These difficulties will be tackled later in this chapter. If a decision maker has a very clear idea of the nature of decision support needed and can define the research objectives that will create such support and define the research design that will fulfil the research objectives, then the decision maker can write a research brief that is highly structured. A structured brief created in these conditions would basically be a tender document, allowing a number of research suppliers to pitch for business on a like-for-like basis. Not all marketing decision makers have such clarity of the marketing research support they need. Even if they do, by sticking to highly structured and prescriptive marketing research briefs, they can underutilise the experience and creativity of researchers. This is illustrated by the following quote, based upon the experiences of a researcher who has seen many research problems misdiagnosed:
When a client calls for a meeting on a research brief, quite often the tendency is for a methodology meeting: ‘I’d like to have a product test done on three new flavours that we have developed’. Off goes the researcher, conducts the test, identifies the winning flavour, the client launches it and finds to their dismay that it fails dis-mally. Why? It turns out the flavours were developed to try and revitalise an ageing product category and brand. In the product test, the familiar flavours orange and lemon won over the more exotic flavour to boost the category image. Had the researcher been allowed to look beyond the brief and ask one simple question on why the flavours were being made it may have led to a clearer brief, which in turn would have led to a research design which was more appropriately designed to cull out the real insight, which was that the consumers were bored and something rather more than flavour extensions were needed to revitalise the category.5
The following format for a research brief helps to make the most of the experience and creativ-ity of both the marketing decision maker and the researcher, and has clear advantages for both parties. First, it does not demand that decision makers have a great deal of technical knowledge about research. Their focus can remain upon the gaps in their knowledge, the nature of support they need, not the technicalities of how data are to be collected and analysed. Second, it allows the researchers the opportunity to demonstrate their creative abilities and awareness of the lat-est research and analysis techniques. Using their experiences from problems faced by other decision makers, perhaps from a great variety of contexts and industries, researchers have the possibility of examining the marketing and research problem from many different perspectives. They can create, develop and adapt a research design to the research problem that supports the marketing decision maker within clear time and cost parameters (See Figure 2.1):
1 Background information. The background serves to put research objectives into context, helping the researcher to understand why certain research objectives are being pursued. Decision makers would detail what they see as being the main events that have caused or contributed to the problem under study. Such a background gives a framework for the researcher to investigate other potential events, contributory factors or causes.

34 Marketing Research
2 Objectives. The first part of this section would detail which marketing decisions are to be completed once the research has been undertaken. This requires decision makers to explain what they see as the focus of the decisions they plan to make. They then go on to explain what gap(s) they see in their knowledge. Those gaps create the focus for planned research activities and set the research objectives. The formulation of the market-ing objectives can encompass two areas: organisational objectives and personal objec-tives of the decision maker. For a research project to be successful, it must serve the objectives of the organisation and of the decision maker. For the researcher, this may not be explicit or obvious to discern. It may take some time working with a decision maker or a particular organisation to see potential conflicts in organisational and personal objec-tives. The problem faced by researchers is that decision makers may not formulate mar-keting objectives clearly. Rather, it is likely that objectives tend to be stated in terms that have no operational significance, such as ‘to improve corporate image’. Ultimately this does not matter, as this ‘first-step’ brief offers the opportunity for the researcher to draw out and develop a much clearer vision of marketing and research objectives. Drawing out and developing decision makers’ perspectives of objectives, even if they have no opera-tional significance, helps the process of developing a common understanding of what the decision maker is trying to achieve.
3 Target to research. Any marketing research project will measure, understand or observe a target group of individuals. These may be distinct groups of consumers, channel members such as retailers or competitors, or company employees. In this section, details of the characteristics of the target group(s) can help in many research design decisions. These cover areas of identification, gaining access to conduct research, understanding which techniques are appropriate to measure or understand these individuals and the best envi-ronment or context in which to conduct research.
4 Who is to use the findings? This section would outline brief details of the decision makers who will use the research findings. For example, certain decision makers may be entre-preneurial and introspective, looking for short-term tactical advantages. Presenting research findings that make tactical advantages apparent would be the best way to com-municate to such managers. Managers with a background and training in statistics may expect results to be analysed and presented in a particular manner to have any credibility.
Figure 2.1
Components of the marketing research brief
Background information
Objectives (a) marketing(b) research
Target to research
Who is to use �ndings(a) analysis(b) format
Constraints
Administration

35Chapter 2 Defining the marketing research problem and developing a research approach
Other managers, e.g. those responsible for many product and/or communications design decisions, may not have such training or may even be distrustful of statistical analyses and seek a more qualitative interpretation. These issues have an impact upon the nature and extent of analysis conducted, upon the data collected and the style and format in which research findings will be presented.
5 Constraints. The main limitation to researchers carrying out what they may perceive as being the correct way to research a problem is the time and money that decision makers can afford. Proposing a large-scale project that would cost €200,000 when only €50,000 has been budgeted obviously will not meet management approval. In many instances, the scope of the marketing research problem may have to be reduced to accommodate budget constraints. With knowledge of time and cost constraints, the researcher can develop a research design to suit these needs. The researcher may also demonstrate other courses of action that could demand greater amounts of money or time, but could have clear benefits that the marketer may be unaware of. Other constraints, such as those imposed by the cli-ent firm’s personnel, organisational structure and culture or decision-making styles, should be identified to determine the scope of the research project. Yet, constraints should not be allowed to diminish the value of the research to the decision maker or to compro-mise the integrity of the research process. In instances where the resources are too limited to allow a project of sufficient quality, the firm should be advised not to undertake formal marketing research. In the following example, research undertaken by Nestlé in Poland shows how a research brief was developed that facilitated creative input from researchers, marketers and their communications agency.
6 Administrative considerations. These would lay out administrative details in complet-ing the research project. Examples could be the expected delivery of interim reports, contacts in an organisation that may be able to help supply further information, or refer-ence to sources of materials and individuals that are needed to complete the research successfully.
Real research Can marketing research support effective communication ideas for children?6
The marketing team of the Ice Cream Divi-sion of Nestlé in Poland wished to brief its creative agency. It turned to the marketing research team to see what support it could give to develop strong communications with the target market of children. The research-ers seized the opportunity to be part of the process of advertising development, rather than simply delivering data or consumer test results. They decided to try a new way of cross-functional team cooperation to the chal-lenge, which started with the preparation of a research brief. Their short brief described:
1 Clear and straightforward project objectives, including details of the target group they would be addressing. In this particular case, the research objective was to reconstruct consumer insights, which help to build the most relevant and effective communication for children in the ice cream category in Poland. The core target group was children aged 6 to 11 years old.
2 Details of participant characteristics.

36 Marketing Research
3 A detailed plan of the project:
What? Who is responsible?
a Short brief with the objective Marketing teamb Prepare and conduct the training from Consumer
Insight Process at Nestlé and how to talk with consumers
Marketing research team
c Prepare and conduct of the training for ‘consumer connection’ – what this is, how to talk to your consumer and how to obtain knowledge in the connection process
Marketing research team and agency
d Meeting with consumers at their homes Marketing research agency and everyonee Preparation of guide (how to talk to the
consumers)Marketing research team and marketing research agency
f Affinity groups – just before their workshop – to put everyone in the ‘mood of consumers’
Everyone
g Final workshop Marketing research team and agencyh Analyses: information about the product and
consumer habitsMarketing team
i Analyses: communications for children Creative teamj Knowledge from the meetings with the consumers
(pictures, toys, verbatims)Everyone
k Reports; required at distinct stages throughout the whole project
Marketing research team
Three of the best ideas were tested in the research study; one was chosen, filmed and aired. The outcome was a success for the new business in Poland (Nestlé was a relatively new brand that did not really exist in consumers’ minds as it had taken over the Scholler brand). The marketing team increased awareness of the Nestlé brand and the BluMis brand (hero of the Nestlé children’s ice creams in Poland); the team sold much more than the operational plan and began building the image of the brands. This is an exam-ple of an action research approach (which will be discussed in more detail in Chapter 6).
With a formal marketing research brief and perhaps preliminary discussion with the organisation that is to commission the research, the researcher has the necessary material to develop a research proposal. In many instances, however, the researcher does not enjoy the luxury of a written research brief.7 The marketing decision maker may outline ideas in an oral manner, perhaps on an informal basis. This can happen if the decision maker is not aware of the personal benefits of producing a written research brief as detailed above. Deci-sion makers may see the brief as a time-consuming process that really is the job of the researcher. If researchers are faced with an oral brief, they can use the proposed brief outline above as a guideline to the issues they should elicit in informal discussions in order to develop an effective proposal.
The marketing research proposal
In response to a research brief, the researcher will develop a research plan (covered in detail in Chapter 3) and will develop a research proposal to communicate this plan. The market-ing research proposal contains the essence of the project and, in its final format, can serve as a contract between the researcher and decision makers.8 The research proposal covers all phases of the marketing research process. It allows the researcher to present an interpretation of the problems faced by management and to be creative in developing a research solution
Research proposalThe official layout of the planned marketing research activity.

37Chapter 2 Defining the marketing research problem and developing a research approach
that will effectively support decision makers. Although the format of a research proposal may vary considerably, most proposals address all the steps of the marketing research pro-cess and contain the elements shown in Figure 2.2:
1 Executive summary. The proposal should begin with a summary of the major points from each of the other sections, presenting an overview of the entire proposal.
2 Background. The researcher would be expected to have researched and developed ideas beyond those presented in the brief ‘background’. Other potential causes of the problems faced, or alternative interpretations of the factors that shape the background in an envi-ronmental context, should be presented. The extent of developmental work on the back-ground to a research project will depend mostly upon how much past work researchers have done for the decision makers. In projects where researchers and decision makers are working together for the first time, much exploratory work may be undertaken by the researcher to understand an industry, organisation, decision makers, planned campaigns, etc. After a number of projects, much of this may be understood and not need restating.
3 Problem definition. Again, if necessary, the researcher may go beyond the problem defi-nition presented in the brief. If the researcher sees potential to add value for the marketer through alternative diagnoses of the problem presented in the brief, then these should be shown. If the researcher sees a problem in the brief that is ambiguous or unattainable, other alternative diagnoses should be presented. From this section, the marketer’s gaps in knowledge should be apparent.
4 Research objectives. These may be presented in the form of clear hypotheses that may be tested. They may also cover broader areas in terms of ‘research questions’ that are to be explored rather than formally measured in a conclusive manner.
Figure 2.2
Components of the marketing research proposal
Executive summary
Background
Problem de�nition
Research objectives
Research design
Fieldwork/data collection
Data analysis
Reporting
Cost and timetable
Research organisation and researchers
Appendices
Agreement

38 Marketing Research
5 Research design. The research design to be adopted, classified in broad terms as explora-tory, descriptive or causal, should be specified. Beyond such a broad classification should be details of the individual techniques that will be adopted and how they will unfold and connect to each other. This means that the reader will clearly see methods of collecting the desired data, justification for these methods and a sampling plan to include details of sample size(s). This applies to both quantitative and qualitative approaches.
6 Fieldwork/data collection. The proposal should discuss how the data will be collected and who will collect them. If the fieldwork is to be subcontracted to another supplier, this should be stated. Control mechanisms to ensure the quality of data collected should be described.
7 Data analysis. This should describe the kind of data analysis that will be conducted, e.g. content analysis, simple cross-tabulations, univariate analysis or multivariate analysis. If software packages are to be used in these analyses, they should be specified, as they will be indicative of the potential analyses that can be conducted. There should be further description of the extent to which the results will be interpreted in light of the set market-ing objectives, beyond the specified analysis techniques.
8 Reporting. The proposal should specify the nature of any intermediate reports to be pre-sented, what will be the form of the final report and whether an oral presentation of the results will be made.
9 Cost and timetable. The cost of the project and a time schedule, broken down by phases, should be presented. A critical-path method chart might be included. In large projects, a payment schedule is also worked out in advance.
10 Research organisation and key researchers working on the project. When an organisa-tion is working with researchers for the first time, some idea of past research projects and clients should be displayed. This can help the marketer to trust the researchers in problem diagnosis, research design and implementation (e.g. how credible the researchers may be seen to be by the individuals they are to research and how this may affect participant openness and honesty) and interpretation of the findings.
11 Appendices. Any statistical or other information of interest to only a few people should be contained in appendices.
12 Agreement. All parties concerned with fulfilling the research plan should sign and date their agreement to the proposal.
Preparing a research proposal has several advantages. It ensures that the researcher and manage-ment agree about the nature of the project, and it helps sell the project to a wider array of deci-sion makers, who may contribute to and benefit from the research findings. As preparation of the proposal entails planning, it helps the researcher conceptualise and execute the marketing research project. The following example illustrates a Coca-Cola European brand tracking study that required a major overhaul. This situation resulted in 400 research proposals being generated by marketing research agencies in 32 countries. Imagine the research, quality and creativity that went into the proposal that won the contract, not offering the cheapest option to Coca-Cola.
Real research Coca-Cola’s Beverage Brand Barometer9
Coca-Cola’s Knowledge & Insights (K&I) marketing research team established a multi-country task force to consolidate its disparate brand trackers into a common framework to better understand consumers across the globe. The K&I task force launched the Bev-erage Brand Barometer (B3), feeling that having a consistent format would quickly pay its way. Coca-Cola’s K&I team reduced its global yearly research spend by 10%, while

39Chapter 2 Defining the marketing research problem and developing a research approach
improving the quality of its insights. Two years after the launch, in the midst of a global economic and financial crisis, another Coca-Cola research task force was established, this time in Europe. Its aim was to review the brand tracker’s performance, and to vali-date consumer feedback on the experience of completing the B3 study in different European markets. The results of the review were conclusive: the B3 survey was too complex, extremely long and repetitive. This generated serious concerns over the qual-ity of the data. In addition, structural changes within Coca-Cola Europe resulted in an increased need to benchmark, consolidate and cluster data across markets. With budget pressures and a tracking tool not delivering on business needs because of quality issues, the need for a shakeup was clear. In order to allow Coca-Cola Europe to improve its study, the B3 Global Council revisited the B3 core structure and significantly reduced all global mandatory sections, giving the Europe team the flexibility it needed. Because the study stretched across 32 European markets, consolidating all European B3 services with one marketing research supplier was identified as the best strategic and most feasible option. Working with a single partner on the revamped B3 across Europe would provide a new perspective, while allowing for productivity gains. The new study would improve quality by shortening the questionnaire, but it had also to generate savings for each indi-vidual market, while increasing the research supplier’s share of business. Five global agencies were briefed to put forward proposals for each individual market, as well as a potential pan-European package. However, the Coca-Cola project team also reviewed the local agency route to ensure fair local pricing, thus resulting in more than 400 pro-posals to be reviewed (i.e. five to seven agencies per market providing up to two propos-als across 32 markets). Finally, Kantar (www.kantar.com) was chosen as the single strategic partner for Europe. Within Kantar, Millward Brown (www.millwardbrown.com) took the lead, with TNS (www.tnsglobal.com) playing a supporting role. Kantar was already well integrated into the Coca-Cola Company business via advertising testing and other tracking initiatives, and it presented a viable business case not only for the European central team but also for each individual market.
The process of defining the problem and developing a research approach
By formally developing and exchanging a marketing research brief and research proposal, the marketing decision maker and the researcher utilise their distinctive skills. They ensure that the marketing problem and research problems have been correctly defined and an appropriate research approach is developed. The research brief and the research proposal are the formal documents that ensure each party is clear about the nature and scope of the research task. These documents allow decision makers and researchers formally to present their perspective of the task in hand. The nature of negotiations between decision makers and researchers may occur between a sponsoring client organisation, e.g. Coca-Cola, and a research agency, e.g. Kantar. It could also happen within an organisation, i.e. there may be an in-house marketing research team. In successfully diagnosing a marketing decision and marketing research prob-lem, the access to, and the understanding of, decision makers by researchers can make a major difference. There are many positive reasons for using marketing research agencies, but it is worth noting that there has been a growth in the use of in-house marketing research, some-times described in a derogatory manner as DIY (Do-It-Yourself) research.10 Where marketing research is practised without a full appreciation of the skills and creativity needed, or the limitations of particular techniques, much damage can be done. The growth in relatively cheap proprietary software to support DIY research has exacerbated concerns about the quality of some in-house marketing research. However, much in-house research is conducted by

40 Marketing Research
well-qualified researchers, many of whom have worked at the best marketing research agen-cies. Such researchers can help diagnose research problems well and then outsource specific elements of data gathering and analysis to the many different types of research organisation that were detailed in Chapter 1. The following two examples illustrate how two major organi-sations have adopted ‘DIY research’.
Real research Do-it-yourself research in Finland11
Like the country’s high-tech industries, research in Finland is expected to be increasingly driven by internet and software developments. One consequence, warns Research International’s (www.research-int.fi) managing director, Jukka Tolvanen, is that ‘many customers gather information themselves’. Juha Aalto, managing director of Taloustutki-mus (www.taloustutkimus.fi/in_english/), goes further: ‘the increase in do-it-yourself research has been fast and furious’. At MTV, Research Manager, Taina Mecklin, has chang-ing needs in an increasingly diffuse media industry. Although generally satisfied with services, she warns: ‘We already have the tools to conduct many projects ourselves. Agencies should think about how they can help us instead of wanting to keep the whole process to themselves.’ Public broadcaster YLE (www.yle.fi/fbc) also boasts its own research expertise. However, Head of Audience Research, Erja Ruohomaa, explains that she buys fieldwork to gain a ‘better understanding of the significance of our program-ming for all Finns’.
Real research DIY research at Readers Digest12
Spurred on by technological, mostly web-based IT advancements, ‘do-it-yourself’ or DIY market research is growing. Not only does the online marketing of global brands cross international borders, but, most of all, web-based marketing research can be cost effective and fast. Additionally, as part of the growing importance of business intelli-gence departments and improved data management, it offers companies the bonus of keeping their information as close to the source as possible. One company where the DIY approach has played an integral role for a number of years is Readers Digest (www.readersdigest.co.uk). Apart from being a worldwide publisher of books, music and the magazine of the same name, Readers Digest also offers financial services. It supports all these products with a substantial amount of in-house research. This covers all the inter-national markets in which Reader’s Digest operates. Additionally, the company executes an annual ‘European Trusted Brands’ survey in 14 European countries for its advertisers. Gavin Murray, strategy director, explains:
Rather than being approached by a third party, our readership appreciates direct con-tact. We are in the unique position of being able to communicate directly with our cus-tomers and most of these customers are happy to participate in surveys sent out by us.
Whether marketing research is conducted by research agencies, in-house or a combina-tion of these, the diagnosis and articulation of what should be researched is vital. The follow-ing section details the process that needs to be undertaken in order to produce research proposal documents. The detail of defining the nature of problems and developing an appro-priate research approach to the point of creating a research design is shown in Figure 2.3.

41Chapter 2 Defining the marketing research problem and developing a research approach
Bear in mind, at this point, the challenges of gain-ing access to and understanding the demands of decision makers in this process.
The tasks involved in problem definition con-sist of discussions with decision makers, qualita-tive interviews with industry experts and other knowledgeable individuals and analysis of readily available secondary data. These tasks help the researcher to understand the background of the problem by analysing the environmental context. Certain essential environmental factors bearing on the problem should be evaluated. An understand-ing of the environmental context facilitates the identification of the marketing decision problem. Then, the marketing decision problem is translated into a marketing research problem. Based on the definition of the marketing research problem, an approach to the problem is established and an appropriate research design is developed. The components of the approach may consist of an objective/theoretical framework, analytical models, research questions and hypotheses. Fur-ther explanation of the problem-definition process begins with a discussion of the tasks involved.
Figure 2.3
The process of defining the problem and developing an approach
Analyticalmodel
Objectivetheoreticalframework
Researchquestions
Hypotheses
Environmental context of the problem – the tasks involved
Interviews withexperts
Marketing-decision problem to marketing-research problem
Marketing-decisionproblem
Marketing-researchproblem
Approach to the problem
Research design
Characteristics/factorsin�uencing
research design (Chapter 3)
Discussions withdecision makers
Secondary dataevaluation

42 Marketing Research
Environmental context of the problem
The tasks involved in understanding the environmental context of the marketing and research problem can include discussions with decision makers, qualitative interviews with industry experts, and secondary data collection and analysis. The purposes of these tasks are to develop an understanding of forces that may affect the nature of decision makers’ problems and related research problems.
Discussions with decision makers
Discussions with the decision makers beyond the formal presentation of a research brief and research proposal are usually vital. The decision maker needs to understand the capa-bilities and limitations of research.13 Research provides information relevant to manage-ment decisions, but it cannot provide solutions, because solutions require managerial creativity and judgement. Conversely, the researcher needs to understand the nature of the decision that managers face – the marketing problem and what they hope to learn from the research.
To identify the marketing problem, the researcher must possess considerable skill in inter-acting with the decision maker. Several factors may complicate this interaction. Access to decision makers may be difficult, and some organisations have complicated protocols for access to top executives. The organisational status of the researcher or the research depart-ment may make it difficult to reach the key decision maker in the early stages of the project. Finally, there may be more than one key decision maker, and meeting collectively or indi-vidually may be difficult. All of these problems make it difficult to develop a research brief. Despite these problems, though, it is necessary that the researcher attempts to interact directly with the key decision makers.14
A problem audit provides a useful framework to develop ideas from a brief, allowing the researcher to interact with the decision maker and identify the underlying causes of the prob-lem. Like any other type of audit, it is a comprehensive examination of a marketing problem with the purpose of understanding its origin and nature.15 A problem audit involves discus-sions with the decision maker on the following issues:
1 The events that led to the decision that action is needed, or a brief history of the problem.
2 The corporate culture as it relates to decision making.16 For example, in some firms, the decision-making process is dominant; in others, the personality of the decision maker is more important.
3 The alternative courses of action available to the decision maker. The set of alternatives may be incomplete at this stage, and exploratory research may be needed to identify more innovative courses of action.
4 The criteria that will be used to evaluate the alternative courses of action. For example, new product offerings might be evaluated based on sales, market share, profitability, or return on investment.
5 What the decision maker perceives to be gaps in their knowledge.
6 The manner in which the decision maker will use each item of information in making the decision.
It may be necessary to perform a problem audit, because the decision maker may have only a vague idea of what the problem is. For example, the decision maker may know that the firm is
Problem auditA comprehensive examination of a marketing problem to understand its origin and nature.

43Chapter 2 Defining the marketing research problem and developing a research approach
losing market share but may not know why; decision makers may tend to focus on symptoms rather than on causes. An inability to meet sales forecasts, a loss of market share and a decline in profits are all symptoms. The researcher should treat the underlying causes, not merely address the symptoms. For example, loss of market share may be caused by much better advertising campaigns by the competition, inadequate distribution of the company’s products, or any number of other factors. Only when the underlying causes are identified can the prob-lem be successfully addressed.
A problem audit, which involves extensive interaction between the decision maker and the researcher, can greatly facilitate problem definition by determining the underlying causes. The interaction between the researcher and the decision maker is facilitated when one or more people in the client organisation serve to liaise and form a team with the researcher. To be fruitful, the interaction between the decision maker and the researcher can be characterised by the following:
1 Communication. A free exchange of ideas between the decision maker and the researcher is essential.
2 Cooperation. Marketing research is a team project in which both parties (decision maker and researcher) must cooperate, from problem diagnosis through to the interpretation and presentation of findings.
3 Confidence. Mutual trust of each other’s distinct skills and contribution should underlie the interaction between the decision maker and the researcher.
4 Candour. There should not be any hidden agendas, and an attitude of openness should prevail.
5 Closeness. An understanding of each other’s problems should result in a closeness that should characterise the relationship between the decision maker and the researcher.
6 Continuity. The decision maker and the researcher must interact continually rather than sporadically.
7 Creativity. The interaction between the decision maker and the researcher should be crea-tive rather than formulaic. Though the research process may be laid out in ‘easy-to- follow’ steps, in reality great amounts of creativity are needed at every stage.
Real research Surf Superconcentrate faces a super washout in Japan
Unilever attempted to break into the Japanese detergent market with Surf Supercon-centrate. It initially achieved a 14.5% market share during test marketing but fell to a shocking 2.8% when the product was introduced nationally. Where did Unilever go wrong? Surf was designed to have a distinctive pre-measured packet, resembling teabag-like sachets, joined in pairs because convenience was an important attribute to Japanese consumers. It also had a ‘fresh smell’ appeal. Japanese consumers, however, noticed that the detergent did not dissolve in the wash, partly because of weather conditions and because of the popularity of low-agitation washing machines. Surf was not designed to work in the new washing machines. Unilever also found that the ‘fresh smell’ positioning of new Surf had little relevance since many consumers hang their washing out in the fresh air. The research approach was certainly not without flaw, as Unilever failed to identify critical attributes that are relevant in the Japanese detergent market. Furthermore, it identified factors such as ‘fresh smell’ that had no relevance in the Japanese context. Appropriate secondary data and business intelligence gathering

44 Marketing Research
and analysis, and even some exploratory qualitative research from the target market, could have revealed the correct characteristics or factors leading to a suitable research design. Despite having to withdraw from the Japanese market, Surf continued to per-form well in several markets including India. By 2009 it was the third-biggest-selling product in the Indian washing detergent market behind Unilever’s Persil and Procter & Gamble’s Ariel.
Interviews with industry experts
In addition to discussions with decision makers, qualitative interviews with industry experts who are individuals knowledgeable about the firm and the industry can help in diagnosing the nature of the marketing and research problem.17 These experts may be found both inside and outside an organisation commissioning the research. Typically, expert information is obtained by unstructured interviews. It is helpful, however, to pre-pare a list of topics to be covered during the interview. The order in which these topics are covered and the questions to ask should not be predetermined. Instead, they should be decided as the interview progresses, which allows greater flexibility in capturing the insights of the experts (see Chapter 8 for full details of in-depth interviewing techniques). The list of topics to cover and the type of expert sought should evolve as the researcher becomes more attuned to the nature of the marketing problem. The purpose of interview-ing experts is to explore ideas make new connections between ideas and create new per-spectives in defining the marketing research problem. If the technique works well by identifying an appropriate individual with the qualities to give insight into a particular topic, and an amount of trust and rapport is developed, the potential to generate and test ideas can be immense. Experts may have other contacts that the researcher may not be aware of or may not be able to get access to. They may also have secondary data, which, again, the researcher may not be aware of or have access to. Unfortunately, two potential difficulties may arise when seeking advice from experts:
1 Some individuals who claim to be knowledgeable and are eager to participate may not really possess expertise.
2 It may be difficult to locate and obtain help from experts who are outside the commission-ing organisation, i.e. access to these individuals may be problematic.
For these reasons, interviews with experts are more useful in conducting marketing research for industrial firms and for products of a technical nature, where it is relatively easy to identify and approach the experts. This method is also helpful in situations where little information is available from other sources, as in the case of radically new products and markets. For example, in a marketing research study of Indian high-net-worth con-sumers, much work went into the environmental context of the problem. Understanding the characteristics of such a complex and fragmented group of wealthy consumers demanded an understanding of significant cultural changes in India. As well a critical evaluation of relevant theories and secondary data, interviews with experts helped enor-mously with the challenge of developing a research approach and research design. Identi-fying credible experts on India came from an immersion in good theories and secondary data. Identifying them was just the first challenge, gaining access to them and/or their network of contacts was the major test.

45Chapter 2 Defining the marketing research problem and developing a research approach
Real research The changing Indian consumer18
Modernisation theories propose that the central challenge for developing economies is to manage the transition from traditional to modern societies. Since liberalisation of the Indian economy started in 1991, urban Indian society has become consumerist in its orientation. As a result of the political, social and economic changes of the past six dec-ades, urban India today can be described as a modern society with strong traditional roots. The modern values and ideas that have made inroads into Indian society and culture include money, power, equality, democracy, individuality, pleasure and indul-gence, celebrity and glamour, enterprise, experimentation and technology. Many of these represent ‘rational’ and ‘self-expressive’ values, as defined in modernisation theo-ries. At the same time, there are several core values that retain their imprint on Indian society. These include hierarchy, primacy of family, importance of religion, belief in the supernatural, importance of relationships, mutual duty, alignment to the group, male superiority and scarcity consciousness. These core values have founded the Indian cul-tural unconscious for thousands of years. Today, it results in a constant churn and inter-section of traditional and modern to create new blends, amalgams and trends that are uniquely Indian. Culture experts have commented about this fundamental aspect of Indian society in different ways. Professor Rapaille, a French–American culture guru, author of the recent bestseller, The Culture Code,19 has studied the cultures of India, China and America. He says:
India has a different cultural code to China. The collective unconscious of India has a way to integrate the outside world without losing their soul. A culture which was able to get rid of the British, the Moguls, the Persians, the Arabs, and so on, could survive any-thing. We will not have, in India, a phase of self-destruction like the Chinese Cultural Revolution, but more of a slow practical way of using the incredible commerce ability of the Indians to their advantage without destroying their culture.
Professor Sudhir Kakar, India’s foremost psychoanalyst and social commentator, writing in The Inner World,20 says:
‘its aim dramatizes a cultural ideal of the whole society, namely, a receptive absorption rather than an active alteration and opposition’.
He also talks of the Elastic Indian – the eclectic Hindu who absorbs all manner of new religious practices such as reiki, pranic healing, Buddhist meditation, alongside tradi-tional Hindu practices. These expert views point to the ‘and-ness’ of the Indian world-view, where the aim of the cultural unconscious is to find the ‘and’ answer to potentially conflicting values and ideas. Indians employ a variety of strategies to achieve ‘ and-ness’: blend, balance, manipulate, conceal or negotiate and, when all other options fail, co-exist.
Initial secondary data analyses
Secondary data collection and analysis will be addressed in detail in Chapters 4 and 5. Here it can be seen in a broad context to include data generated within organisations, externally gen-erated data and business intelligence. A brief introduction here will demonstrate the worth of secondary data at the stage of problem diagnosis. Secondary data are data collected for some
Secondary dataData collected for some purpose other than the problem at hand.

46 Marketing Research
purpose other than the problem at hand. Primary data, on the other hand, are originated by the researcher for the specific purpose of addressing the research problem. Secondary data include data generated within an organisation, including customer databases, information made available by business and government sources, commercial marketing research firms and the vast resources available online. Secondary data are an economical and quick source of background information. Analysis of available secondary data is an essential step in the problem-definition process: primary data should not be collected until the available secondary data have been fully analysed. Past information, forecasts and commentary on trends with respect to sales, market share, profitability, technology, population, demographics and life-style can help the researcher to understand the underlying marketing research problem. Where appropriate, this kind of analysis should be carried out at the industry and organisation levels. For example, if an organisation’s sales have decreased but industry sales have increased, the problems will be very different than if the industry sales have also decreased. In the former case, the problems are likely to be specific to the firm. Past information and forecasts can be vital in uncovering potential opportunities and problems.
Primary dataData originated by the researcher specifically to address the research problem.
Marketing decision problem and marketing research problem
The marketing decision problem asks what the decision maker needs to do, whereas the marketing research problem asks what information is needed and how it can best be obtained.21 The marketing decision problem is action oriented. It is concerned with the pos-sible actions the decision maker can take. How should the loss of market share be arrested? Should the market be segmented differently? Should a new product be introduced? Should the promotional budget be increased?
In contrast, the marketing research problem is information oriented. It involves determin-ing what information is needed and how that information can be obtained effectively and efficiently. Consider, for example, the loss of market share for a particular product line. The decision maker’s problem is how to recover this loss. Alternative courses of action can include modifying existing products, introducing new products, changing other elements in the marketing mix and segmenting the market. Suppose that the decision maker and the researcher believe that the problem is caused by inappropriate segmentation of the market and want research to provide information on this issue; the research problem would then become the identification and evaluation of an alternative basis for segmenting the market. Note that this process requires much interaction, in the sense that both parties critically eval-uate, develop and defend each other’s ideas to clarify the nature of decision and research problems, and to ensure there is a clear and logical connection between them. The following example further illustrates the distinction between the marketing decision problem and the marketing research problem. It also illustrates the interactive nature of identifying the mar-keting decision problem and the research problem, each one unfolding and informing the understanding of the other.
The following example, and Table 2.1, further distinguish between the marketing deci-sion problem and the marketing research problem.
Marketing decision problemThe problem confronting the marketing decision maker, which asks what the decision maker needs to do.
Marketing research problemA problem that entails determining what information is needed and how it can be obtained in the most feasible way.
Real research Defining the problem
Bank X: We are experiencing a loss of market share in France in corporate banking.
Researcher: Is it just France?
Bank X: No, but as we conduct the majority of our business there, the loss is causing us the greatest amount of concern.

47Chapter 2 Defining the marketing research problem and developing a research approach
While distinct, the marketing decision problem has to be closely linked to the marketing research problem. A good way to link the broad statement of the marketing decision problem with the marketing research problem is through the use of a conceptual map (Figures 2.4 and 2.5). A conceptual map involves the following three components:
Conceptual mapA way to link the broad statement of the marketing decision problem to the marketing research problem.
Researcher: Why do you think you are losing market share?
Bank X: We wish we knew!
Researcher: How are your competitors coping?
Bank X: We suspect that other French banks are also suffering, and the multinational banks are capturing market share.
Researcher: How do your customers feel about the quality of services you deliver?
Bank X: We recently attained our ISO 9000 for service quality, which we are proud of!
Researcher: But how does your service delivery compare with your competitors?
After a series of discussions with key decision makers, analysis of secondary data and business intelligence sources within the bank and from other sources, the problem was identified as follows:
• Marketing decision problem. To improve the the relationship experience with clients both in face-to-face and online relationships, in order to arrest the decline in market share of Bank X.
• Marketing research problem. To determine the relative strengths and weaknesses in terms of relationship experiences of Bank X, vis-à-vis other major domestic and inter-national competitors in France. This would be done with respect to factors that influ-ence a company in its choice of a bank to handle its transactions.
Marketing decision problem Marketing research problem
Evaluates what the decision maker needs to do Evaluates what information is needed to support the identified marketing decision
Action oriented Information oriented
Focuses upon symptoms Focuses on the underlying causes
The following examples further distinguish between the marketing decision problem and the marketing research problem:
Which product line extension should we invest in? To determine consumer perceptions of the qualities and fit to existing products of a selection of product line extensions
Should we invest in celebrity X to endorse our brand in Europe?
To determine consumer perceptions of the qualities and fit to a brand of a selection of celebrities
Should we reposition our brand with an emphasis upon raising prices?
To determine the price elasticity of demand and impact on sales and profits of various levels of price changes
Table 2.1 Marketing decision problems versus the marketing research problem

48 Marketing Research
Marketing decision maker wants to (take an action)Therefore we should study (topic)So that we can explain (question).
The first line states the rationale for the question and the project; this is the marketing decision problem. The second line of the conceptual map sets out the nature of the broader topic being investigated. The third line implies the question being investigated – the who/how/why that needs to be explained. Thus, the second and third lines define the broad mar-keting research problem. An example follows of the conceptual map for the study of high-net-worth individuals, assuming that the French luxury brand Hermès was developing marketing strategies to develop its brand in India:
Marketing decision maker wants to (develop differentiated in-store customer experiences for particular types of high-net-worth individuals)
Therefore we should study (ways to segment different types of high-net-worth individuals in India)
So that we can explain (the essential demographic, geographic, psychographic, behav-ioural and psychological factors that could shape differentiated in-store consumer experi-ences for luxury goods and services).
As can be seen, the preceding example provides valuable definitions of the marketing decision problem and the broad marketing research problems that are closely linked. The problem is now focused upon a research approach and research design that will generate understanding and measurements of different types of high-net-worth individuals in India.
A conceptual map for problem definition (DM = decision maker)
Problem identi�cation
Marketing decision problem
consists ofconsists of
consists of
guides
Action oriented
is
Speci�c components
Component 2
such as
Component n
such as
Component 1
such as
Underlyingcauses
focuses on
What informationis needed?
asks
Marketing research problem
is
Symptoms
focuses on
Broad statement
Management want to(take an action)
consists ofis broken down to
We should study (topic)
therefore
We can explain (question)
so that
What does theDM need to do?
asks
Informationoriented
Figure 2.4

49Chapter 2 Defining the marketing research problem and developing a research approach
A conceptual map for approach to the problem
Research questionsand hypotheses
Approach to theproblem
Speci�c componentsof the marketingresearch problem
Speci�cation ofinformation needed
Theoretical frameworkand models
consists of
consists of
guide
consists of
Research questions
broken down to
guideguide
guide
guide
re�nedstatements
Hypotheses
possible answers
Graphicalmodels
modelscould be
Mathematicalmodels
modelscould be
Information needed for component 1Information needed for component 2Information needed for component n
for eachcomponent
Verbalmodels
modelscould be
guide
Figure 2.5
The distinction and linkage between the marketing decision problem and the marketing research problem helps us in understanding how the marketing research problem should be defined.
Defining the marketing research problem
The general rule to be followed in defining the research problem is that the definition should:
• allow the researcher to obtain all the information needed to address the marketing deci-sion problem;
• guide the researcher in maintaining focus and proceeding with the project in a consistent manner.
Researchers make two common errors in problem definition. The first arises when the research problem is defined too broadly. A broad definition does not provide clear guidelines for the subsequent steps involved in the project. Some examples of excessively broad mar-keting research problem definitions are: developing a marketing strategy for a brand, improv-ing the competitive position of the firm, or improving the company’s image. These are not specific enough to suggest an approach to the problem or a research design.
The second type of error is just the opposite: the marketing research problem is defined too narrowly. A narrow focus may preclude consideration of some courses of action, particu-larly those that are innovative and not obvious. It may also prevent the researcher from

50 Marketing Research
addressing important components of the marketing decision problem. For example, in a project conducted for a consumer products firm, the marketing problem was how to respond to a price cut initiated by a competitor. The alternative courses of action initially identified by the firm’s research staff were to:
• decrease the price of the firm’s brand to match the competitor’s price cut;
• maintain price but increase advertising heavily; or
• decrease the price somewhat, without matching the competitor’s price, and moderately increase advertising.
None of these alternatives seemed promising. When outside marketing research experts were brought in, the problem was redefined as improving the market share and profitability of the product line. Qualitative research indicated that in blind tests consumers could not differenti-ate products offered under different brand names. Furthermore, consumers relied on price as an indicator of product quality. These findings led to a creative alternative: increase the price of the existing brand and introduce two new brands – one priced to match the competitor and the other priced to undercut it. This strategy was implemented, leading to an increase in market share and profitability.
The likelihood of committing either error of problem definition can be reduced by stating the marketing research problem in broad, general terms and identifying its specific components (see Figure 2.6). The broad statement of the problem provides perspective and acts as a safe-guard against committing the second type of error. The specific components of the problem focus on the key aspects and provide clear guidelines on how to proceed further, and act as a safeguard against committing the first type of error. Decisions requiring research support linked to fitting marketing research problem definitions are provided in the following example.
Broad statement of the problemThe initial statement of the marketing research problem that provides an appropriate perspective on the problem.
Specific components of the problemThe second part of the marketing research problem definition that focuses on the key aspect of the problem and provides clear guidelines on how to proceed further.
Figure 2.6
Proper definition of the marketing research problem
Broad statement
Speci�c components
Marketing research problem
Components of the research approach
Once the marketing decision maker and researcher have clarified the decision problem and established the research problem they face, it has to be decided how to approach the research problem. The research problem may be very clear in the sense that there are strong estab-lished theories of what should be measured and how to conduct the measurements. Con-versely, the research problem may lack theoretical foundation, with the researcher trying to cope with a broad set of issues that have not been sufficiently researched beforehand and unable to trust existing theories. How the researcher perceives the research problem affects the paradigm they will adopt in either an implicit or explicit manner. The researcher’s adopted paradigm is built upon a set of assumptions. These assumptions consist of ‘agreed-upon’ knowledge, criteria of judgement, problem fields and ways to consider them22 (these factors will be developed further in Chapter 6). What is ‘agreed-upon’ refers to how strong the theories are in defining and encapsulating the issues that make up a research problem.23 Bringing together the ‘agreed-upon’ knowledge, criteria of judgement, problem fields and
ParadigmA set of assumptions consisting of agreed-upon knowledge, criteria of judgement, problem fields and ways to consider them.

51Chapter 2 Defining the marketing research problem and developing a research approach
ways to consider them can be undertaken by considering the objective/theoretical frame-work, analytical models, research questions and hypotheses. Each of these components is discussed in the following sections. Collectively they may be considered to be the ‘approach’ that a researcher will take.
Objective/theoretical framework
In general, researchers should aim to base their investigations upon objective evidence, sup-ported by theory. A theory is a conceptual scheme based on foundational statements called axioms that are assumed to be true. Objective evidence is gathered by compiling relevant findings from secondary sources. Likewise, an appropriate theory to guide the research might be identified by reviewing academic literature contained in books, journals and monographs. The researchers should rely on theory to help them to measure or understand the variables they are investigating. Academic sources of new developments to measure, understand and analyse consumers should be constantly evaluated; the following example illustrates why.
TheoryA conceptual scheme based on foundational statements, or axioms, that are assumed to be true.
Objective evidencePerceived to be unbiased evidence, supported by empirical findings.
Real research Using faces: measuring emotional engagement: FaceTrace™24
The research company BrainJuicer (www.brainjuicer.com) tested a number of adverts that had won awards from the Institute of Practitioners in Advertising, and had there-fore been shown to deliver against their busi-ness objectives. Alongside these, BrainJuicer tested a set of adverts from each of the same categories, with what might commonly be termed as having the same kind of advertis-ing objective (i.e. direct message, relaunch, brand building). An experiment was con-ducted online, and each advert was tested with 150 participants. The emotional scale BrainJuicer developed stated how many viewers felt each emotion, having viewed the adverts, and also the intensity with which they felt any emotion. A review of methods used to measure emotion led the company to the conclusion that it needed to develop a self-report technique (it needed to be easy to administer and user-friendly) that over-came some of the criticisms of self-report, one that identified the emotion felt without the need for a great deal of cognitive processing on the part of the participant.
The company turned to the work of Paul Ekman,25 a respected psychologist, who puts a case for a set of seven basic emotions, happiness, surprise, sadness, fear, anger, contempt and disgust, all of which are universally conveyed by and recognisable in the face. Ekman’s research on reading emotion in people’s faces had two important implica-tions:
1 It gave BrainJuicer a framework for understanding which emotions they should be looking to capture.
2 It provided a means of accessing what participants feel, with minimal cognitive pro-cessing on their part.
3 Ekman’s research findings served as BrainJuicer’s theoretical framework for measuring emotional response. They were fundamental in helping to set out important new findings for the measurement of emotion in advertising.

52 Marketing Research
Researchers should also rely on theory to determine which variables should be investi-gated. Past research on theory development and testing can provide important guidelines on determining dependent variables (variables that depend on the values of other variables) and independent variables (variables whose values affect the values of other variables). Further-more, theoretical considerations provide information on how the variables should be opera-tionalised and measured, as well as how the research design and sample should be selected. A theory also serves as a foundation on which the researcher can organise and interpret the findings: ‘nothing is so practical as a good theory’.26 Conversely, by neglecting theory researchers increase the likelihood that they will fail to understand the data obtained or be unable to interpret and integrate the findings of the project with findings obtained by others. The role of theory in the various phases of an applied marketing research project is summa-rised in Table 2.2.
Applying a theory to a marketing research problem requires creativity on the part of the researcher. A theory may not specify adequately how its abstract constructs (variables) can be embodied in a real-world phenomenon. Researchers must therefore take the best of what they believe to be the most novel theories to represent and encapsulate consumer thinking and behaviour. It is also vital for researchers to recognise that theories are incomplete; they deal with only a subset of variables that exist in the real world. Hence, the researcher must also identify and examine other variables that have yet to be published as theories. This may involve the researcher developing ‘grounded theory’,27 (which will be explained and devel-oped in Chapter 6).
Table 2.2 The role of theory in applied marketing research
Research task Role of theory
Conceptualising and identifying key variables
Provides a conceptual foundation and understanding of the basic processes underlying the problem situation; these processes will suggest key dependent and independent variables
Operationalising key variables Provides guidance for the practical means to measure or encapsulate the concepts or key variables identified
Selecting a research design Causal or associative relationships suggested by the theory may indicate whether a causal, descriptive or exploratory research design should be adopted (see Chapter 3)
Selecting a sample Helps in defining the nature of a population, characteristics that may be used to stratify populations or to validate samples (see Chapter 14)
Analysing and interpreting data The theoretical framework and the models, research questions and hypotheses based on it guide the selection of a data analysis strategy and the interpretation of results (see Chapter 19)
Integrating findings The findings obtained in the research project can be interpreted in the light of previous research and integrated with the existing body of knowledge
Analytical model
An analytical model is a set of variables and their interrelationships, designed to represent, in whole or in part, some real system or process. Models can have many different forms. The most common are verbal, graphical and mathematical structures. In verbal models, the vari-ables and their relationships are stated in prose form. Such models may be mere restatements of the main tenets of a theory. Graphical models are visual. They are used to isolate variables
Analytical modelAn explicit specification of a set of variables and their interrelationships designed to represent some real system or process in whole or in part.

53Chapter 2 Defining the marketing research problem and developing a research approach
and to suggest directions of relationships but are not designed to provide numerical results. They are logical, preliminary steps to developing mathematical models.28 Mathematical models explicitly specify the relationships among variables, usually in equation form.29 These models can be used as guides for formulating the research design and have the advantage of being amenable to manipulation.30
As can be seen from this example, the verbal, graphical and mathematical models depict the same phenomenon or theoretical framework in different ways. The phenomenon of ‘sponsorship impact’, stated verbally, is represented for clarity through a figure (graphical model) and is put in equation form (mathematical model) for ease of statistical estimation and testing. Graphical models are particularly helpful in clarifying the concept or approach to the problem.
The verbal, graphical and mathematical models complement each other and help the researcher identify relevant research questions and hypotheses.
Verbal modelsAnalytical models that provide a written representation of the relationships between variables.
Graphical modelsAnalytical models that provide a visual picture of the relationships between variables.
Mathematical modelsAnalytical models that explicitly describe the relationships between variables, usually in equation form.
Real research Model building with ESP Properties
The three approaches to model building can be understood through an example. ESP Properties (www.espglobal.com), part of WPP, is a leading sports and entertainment rights management company. Firms working with ESP Properties are seeking to use sponsorship as a marketing tool. However, for sponsorship to be effective it is vital to ensure that the most appropriate sponsorship is selected. This requires a high level of planning before any sponsorship is agreed, as outlined in the following.
Verbal modelThe marketing department wish to include an investment in sponsorship as part of an integrated marketing communications strategy. They need to understand the potential impact of their sponsorship investment. They start by deciding what key objectives should be fulfilled through a sponsorship relationship. They then select a sector (sports, arts, culture, environment, broadcast) and the type of property (event, team, perfor-mance, individual, programme). Once the sector and property have been selected, they set specific objectives that can be developed to help to set realistic targets and a set of metrics as a means to measure success.
Mathematical model
+n
i = 1∑y = a0 ai xi
where y = sponsorship impact a0, ai = model parameters to be estimated statistically xi = sponsorship requirement factors.
Research questions
Research questions are refined statements of the components of the problem. Although the components of the problem define the problem in specific terms, further detail may be needed to develop an approach. Each component of the problem may have to be broken down into subcomponents or research questions. Research questions ask what specific infor-mation is required with respect to the problem components. If the research questions are answered by the research, then the information obtained should aid the decision maker. The
Research questionsRefined statements of the specific components of the problem.

54 Marketing Research
formulation of the research questions should be guided not only by the problem definition, but also by the theoretical framework and the analytical model adopted. For a given problem component, there are likely to be several research questions.
Hypothesis
A hypothesis is an unproven statement or proposition about a factor or phenomenon that is of interest to the researcher. For example, it may be a tentative statement about relationships between two or more variables, as stipulated by the theoretical framework or the analytical model. Often, a hypothesis is a possible answer to the research question.31 Hypotheses go beyond research questions because they are statements of relationships or propositions rather than merely questions to which answers are sought. Research questions are interrogative; hypotheses are declarative and can be tested empirically (see Chapter 20). An important role of a hypothesis is to suggest variables to be included in the research design.32 The relation-ship between the marketing research problem, research questions and hypotheses, along with the influence of the objective/theoretical framework and analytical models, are described in Figure 2.7.33
Hypotheses are an important part of the approach to a research problem. When stated in operational terms, such as H1 and H2, they provide guidelines on what, and how, data are to be collected and analysed. When operational hypotheses are stated using symbolic notation, they are commonly referred to as statistical hypotheses.
It is important to note that not all research questions can be developed into hypotheses that can be tested. Certain research questions may be exploratory in nature, with the researcher having no preconceived notions of possible answers to the research questions, nor the ability to produce statements of relationships or propositions. If the researcher is faced with such a situation, it does not mean that the investigation will not be as valid as one where hypotheses are clearly established. It means that the researcher may have to adopt a different approach or paradigm to establish its validity.
HypothesisAn unproven statement or proposition about a factor or phenomenon that is of interest to a researcher.
Figure 2.7
Development of research questions and hypotheses
Components of themarketing research
problem
Researchquestions
Hypotheses
Objective/theoreticalframework
Analyticalmodel
Summary Defining the marketing research problem is the most important step in a research pro-ject. Problem definition is a difficult step, because, frequently, decision makers have not determined the actual problem or only have a vague notion about it. The researcher’s role is to help decision makers identify and define their marketing research problem.

55Chapter 2 Defining the marketing research problem and developing a research approach
The formal ways in which decision makers and researchers communicate their per-spectives on a research problem and how to solve it are through the development of a research brief and a research proposal. To develop these documents fully, research-ers should be proactive in arranging discussions with key decision makers, which should include a problem audit whenever possible. They should also conduct, where necessary, interviews with relevant experts, and secondary data collection and analy-ses. These tasks should lead to an understanding of the environmental context of the problem.
Analysis of the environmental context should assist in the identification of the mar-keting decision problem, which should then be translated into a marketing research problem. The marketing decision asks what the decision maker needs to do, whereas the marketing research problem asks what information is needed and how it can be obtained effectively and efficiently. The researcher should avoid defining the market-ing research problem either too broadly or too narrowly. An appropriate way of defin-ing the marketing research problem is to make a broad statement of the problem and then identify its specific components.
Developing an approach to the problem is the second step in the marketing research process. The components of an approach may consist of an objective/theoretical framework, analytical models, research questions and hypotheses. It is necessary that the approach developed be based upon objective evidence or empirical evidence and be grounded in theory as far as it is appropriate. The relevant variables and their inter-relationships may be neatly summarised in an analytical model. The most common kinds of model structures are verbal, graphical and mathematical. The research ques-tions are refined statements of the specific components of the problem that ask what specific information is required with respect to the problem components. Research questions may be further refined into hypotheses. Finally, given the problem defini-tion, research questions and hypotheses should be used to create a method either to measure or elicit an understanding of target participants.
Questions 1 What is the nature of the first step in conducting a marketing research project?
2 Why is it vital to define the marketing research problem correctly?
3 What is the role of the researcher in the problem definition process?
4 What are the components of a marketing research brief?
5 What are the components of a marketing research proposal?
6 How may a researcher be creative in interpreting a research brief and developing a research proposal?
7 What is the significance of the ‘background’ section of a research brief and research proposal?
8 Describe some of the reasons why management are often not clear about the ‘real’ research problem that needs to be addressed.
9 What interrelated events occur in the environmental context of a research problem?
10 What are some differences between a marketing decision problem and a marketing research problem?
11 Describe the factors that may affect the approach to a research problem.

56 Marketing Research
12 What is the role of theory in the development of a research approach?
13 What are the most common forms of analytical models?
14 What are the differences between research questions and hypotheses?
15 Is it necessary for every research project to have a set of hypotheses? Why or why not?
Exercises 1 Imagine that you are the Marketing Director of Lufthansa.
a Make a list of potential marketing objectives whose fulfilment could improve the performance of Lufthansa.
b Select what you feel would be the most important marketing objective. Develop a set of marketing research objectives that you consider would support the decisions needed to fulfil that marketing objective.
2 You are a consultant to Audi AG, working on a project for their Lamborghini subsidiary.
a Use online databases to compile a list of articles related to the Lamborghini and the global high-performance luxury car market in the past year.
b Visit the Lamborghini and Ferrari websites and evaluate the extent of competitive information available at each.
c Based upon the information collected from 2a and 2b, write a report on the environmental context surrounding Lamborghini.
3 In a small group discuss the following issues: ‘Is it feasible that marketing decision makers may not conceive of or be able to express the nature of decision support they need? What are the implications of such a possibility in the development of research proposals?’ And ‘From where may theory emerge to ground applied marketing research and what may be the relative worth of the source of theories used by researchers?’
4 Visit www.innocentdrinks.co.uk and other relevant sources of business news and gather relevant information about the marketing challenges of Innocent Smoothies. As a brand manager for Innocent Smoothies you are concerned about improving the performance of your brand. Identify possible factors that you feel may shape the future performance of the brand. Write a brief report of 1,000 words that sets out Innocent’s marketing challenges and concludes with your views of factors that could shape its future performance.
5 Visit www.fabindia.com. In particular, look at the sections that describe the vision and philosophy behind this business. Gather online secondary data and business intelligence from online sources, especially your library’s online databases. If Fabindia were to develop its brand further in selected European countries, what would the key challenges be? Write a brief report of 1,000 words that sets out Fabindia’s challenges, identify five experts who may have a view of capitalising upon these challenges, and give brief details of why these individuals may be seen as experts.

57Chapter 2 Defining the marketing research problem and developing a research approach
Notes
1. Cliffe, A., McCauley, B. and Briscoe, R. ‘Asda: Diving deeper, thinking broader, working closer’, MRS Awards (December 2013).
2. ‘Marketing profs knowledge exchange: money spent, marketing research, decision-making’, www.marketingprofs.com/ea/qst_question.asp?qstID=11527, accessed 4 November 2010; Sheth, J.N. and Sisodia, R.S., ‘Marketing productivity: issues and analysis’, Journal of Business Research 55 (5) (May 2002), A9; Butler, P., ‘Marketing problem: from analysis to decision’, Marketing Intelligence & Planning 12 (2) (1994), 4–12.
3. Ingledew, S., ‘How to bait the interview hook for those Top 1000 big fish’, ResearchPlus (October 1996), 4.
4. John, C.F., ‘From Iliad to Odyssey: the Odyssey of our profession’, ESOMAR Congress Odyssey, Athens (September 2010); Greenhalgh, C., ‘How should we initiate effective research?’, The Market Research Society Conference (1983).
5. Srivatsa, A., Puri, A. and Raj, S., ‘The case of the elusive insight: lessons from the greatest researcher of them all’, ESOMAR Consumer Insights Conference, Milan (May 2007).
6. Blachowska, M., ‘From consumer connection to consumer insight: a Nestlé case study’, ESOMAR Consumer Insights Conference, Milan (May 2007).
7. Methner, T. and Frank, D., ‘Welcome to the house of research: achieving new insights and better brand knowledge through courageous ways of collaboration in what is usually a competitive environment’, ESOMAR Congress Odyssey, Athens (September 2010).
8. Pagani, P., Raubik, P. and May, J., ‘Coca-Cola Europe and the philosopher’s stone: crafting a rare win-win-win situation’, ESOMAR Congress Odyssey, Athens (September 2010).
9. Pagani, P., Raubik, P. and May, J., ‘Coca-Cola Europe and the philosopher’s stone: crafting a rare win-win-win situation’, ESOMAR Congress Odyssey, Athens (September 2010).
10. ESOMAR, ‘Global Market Research’, ESOMAR Industry Report (2010), 48.
11. Heeg, R., ‘Do-it-yourself’, Research World (December 2005), 25.
12. Heeg, R., ‘DIY’, Research World (February 2006), 15.
13. Cooke, M. and Buckley, N., ‘Web 2.0, social networks and the future of market research’, International Journal of Market Research 50 (2) (2008), 267–92; Marshall, G.W., ‘Selection decision making by sales managers and human resource managers: decision impact, decision frame and time of valuation’, Journal of Personal Selling and Sales Management (Winter 2001), 19–28.
14. Anon., ‘How to decide who should get what data’, HR Focus (May 2001), 7; Cronin, M.J., ‘Using the web to push key data to decision makers’, Fortune 36 (6) (29 September 1997), 254.
15. Copernicus Marketing Consulting, ‘Auditing a marketing program’, www.copernicusmarketing.com/univers/audit.shtml, accessed 10 November 2010; Reid, M., ‘IMC-performance relationship’, International Journal of
Advertising 22 (2) (2003), 227–48; Morgan, N.A., ‘Marketing productivity, marketing audits, and systems for marketing performance assessment: integrating multiple perspectives’, Journal of Business Research 55 (5) (May 2002), 363; Merrilyn, A.T., ‘Quick marketing audit’, Law Practice Management 23 (6) (September 1997), 18, 63; Berry, L.L., Conant, J.S. and Parasuraman, A., ‘A framework for conducting a services marketing audit’, Journal of the Academy of Marketing Science 19 (Summer 1991), 255–8; Ackoff, R.L., Scientific Method (New York: Wiley, 1961), 71; Ackoff, R.L., The Art of Problem Solving (New York: Wiley, 1978).
16. Balmer, J.M.T., ‘Corporate marketing: apocalypse, advent and epiphany’, Management Decision 47 (4), (2009), 544–72; Charan, R., ‘Conquering a culture of indecision’, Harvard Business Review (April 2001), 74; Nwachukwu, S.L.S. and Vitell, S.J. Jr, ‘The influence of corporate culture on managerial ethical judgments’, Journal of Business Ethics 16 (8) (June 1997), 757–76.
17. Grisham, T., ‘The Delphi technique: a method for testing complex and multifaceted topics’, International Journal of Managing Projects in Business 2 (1) (2009), 112–30; Malo, K., ‘Corporate strategy requires market research’, Marketing News 36 (2) (21 January 2001), 14; Winett, R., ‘Guerilla marketing research outsmarts the competition’, Marketing News 29 (1) (January 1995), 33.
18. Shivakumar , H., ‘“And-ness”: the key to the changing Indian consumer’, Admap 479 (January 2007), 38–40.
19. Rapaille, C., The Culture Code: An Ingenious Way to Understand Why People Around the World Buy and Live as They Do (Portland, OR: Broadway Books, 2007).
20. Kakar, S., The Inner World: A Psycho-analytical Study of Hindu Childhood and Society (Oxford: Oxford University Press, 2008).
21. Ganeshasundaram, R. and Henley, N., ‘The prevalence and usefulness of market research: an empirical investigation into “background” versus “decision” research’, International Journal of Market Research 48 (5) (2006), 525–50; Roe, M. and Vervoot, J., ‘A market research training simulation – bringing market research closer to decision-makers’, ESOMAR Innovate! Conference, Paris (February 2005); Gordon, A., ‘Linking marketing decisions with consumer decision making: closing the gap between feelings and behaviour’, ESOMAR Annual Congress, Lisbon (September 2004).
22. Potter, G., The Philosophy of Social Science: New Perspectives (Harlow: Pearson, 2000), 242.
23. Saren, M. and Pels, J., ‘A comment on paradox and middle-range theory: universality, synthesis and supplement’, Journal of Business & Industrial Marketing 23 (2) (2008), 105–7.
24. Wood, O., ‘Using faces: measuring emotional engagement for early stage creative’, ESOMAR Annual Congress, Berlin (September 2007).
25. Ekman, P., Emotions Revealed, Understanding Faces and Feelings (London: Phoenix, 2003).
26. Nyilasy, G. and Reid, L.N., ‘The academician-practitioner gap in advertising’, International Journal of Advertising 26 (4) (2007), 425–45; Lilien, G.L., ‘Bridging the marketing theory’, Journal of Business

58 Marketing Research
Research 55 (2) (February 2002), 111; Hunt, S.D., ‘For reason and realism in marketing’, Journal of Marketing 56 (April 1992), 89–102.
27. Goulding, C. and Saren, M., ‘Immersion, emergence and reflexivity: grounded theory and aesthetic consumption’, International Journal of Culture, Tourism and Hospitality Research 4 (1) (2010), 70–82.
28. For an illustration of a graphical model, see Nauckhoff, F., Asberg, P. and Hemmingsson, C., ‘Managing media planning and brand positioning across media platforms’, ESOMAR Worldwide Media Measurement, Stockholm (May 2009).
29. For an illustration of a mathematical model based on it, see Suher, J. and Sorenson, H., ‘The power of Atlas: why in-store shopping behavior matters’, Journal of Advertising Research 50 (1) (2010), 21–9.
30. Patwardhan, P. and Ramaprasad, J., ‘Rational integrative model of online consumer decision-making’, Journal of Interactive Advertising 6 (1) (Fall 2005), 2–13; Malhotra, N.K. and Wu, L., ‘Decision models and descriptive
models: complementary roles’, Marketing Research 13 (4) (December 2001), 43–4.
31. For an example of hypothesis formulation, see Bian, X. and Moutinho, L., ‘The role of brand image, product involvement, and knowledge in explaining consumer purchase behaviour of counterfeits: direct and indirect effects’, European Journal of Marketing 45 (1/2) (2010), 191–216.
32. For an example of model development and hypothesis formulation, see Heath, R.G., Nairn, A.C. and Bottomley, P.A., ‘How effective is creativity? Emotive content in TV advertising does not increase attention’, Journal of Advertising Research 49 (4) (December 2009), 450–63.
33. The integrated role of theory, models, research questions and hypotheses in marketing research can be seen in Nygaard, A. and Dahlstrom, R., ‘Role stress and effectiveness in horizontal alliances’, Journal of Marketing 66 (April 2002), 61–82; Nunes, J.C., ‘A cognitive model of people’s usage estimations’, Journal of Marketing Research 37 (4) (November 2000), 397–409.

Research design
There is a wide choice of
alternative research designs that
can meet research objectives.
The key is to create a design that
enhances the value of the
information obtained, while
reducing the cost of obtaining it.
Stage 1
Problem definition
Stage 2
Research approach developed
Stage 3
Research design
developed
Stage 4
Fieldwork or data
collection
Stage 5
Data integrity
and analysis
3
Stage 6
Communicating research findings

60 Marketing Research
Objectives
After reading this chapter, you should be able to:
1 define research design, classify various research designs and explain the differences between exploratory and conclusive research designs;
2 compare the basic research designs: exploratory, descriptive and causal;
3 understand how participants or the subjects of research design affect research design choices;
4 understand the strengths and weaknesses of key research designs;
5 describe the major sources of errors in a research design, including random sampling error and the various sources of non-sampling error.
Chapter 2 discussed how to define a marketing research problem and develop a suitable approach. These first two steps are critical to the success of the whole marketing research project. Once they have been completed, attention should be devoted to designing the formal research project by formulating a detailed research design (as a reminder, see Figure 2.3).
This chapter defines and classifies research designs. We examine the nature of research design from the perspectives of decision makers and participants. Two major types of research design are then discussed: exploratory and conclusive. We further classify conclusive research designs as descriptive or causal and discuss both types in detail. The differences between the two types of descriptive designs are then considered (cross-sectional and longitudinal) and sources of errors are identified. The special considerations involved in formulating research designs in international marketing research are discussed. A better appreciation of the concepts presented in this chapter can be gained by first considering the following example, which illustrates the use of a number of interrelated techniques to build a research design.
Overview
Real research Getting to know you1
Building a relationship with consumers is a challenge facing all organisations, but par-ticularly so in the case of ‘emergent drinkers’, those of legal drinking age up to 25. Allied Domecq Spirits and Wines (www.allieddomecq.com) recognised the danger of being distanced from this crucial group, particularly across geographical markets. Allied Domecq worked with Pegram Walters International (www.aegisplc.com) on a project that went far beyond an exploration of the current usage and attitudes towards spirits. The objectives of the project encompassed an exploration of the target groups’ personal values, their feelings about their lives, their universe, their hopes and dreams. There were three stages to the research design. In the first stage the researchers conducted one-hour in-depth interviews. There were three clear objectives for this stage: to under-stand personal viewpoints on marketing and lifestyle issues; to clarify and/or narrow down topics for subsequent exploration; and to recruit appropriate ‘information gather-ers’. From this stage, hypotheses were formulated on issues such as how participants saw themselves and their future, their relationships, self-discovery and opting in or out of the

61Chapter 3 Research design
system. In the second stage, from 20 in-depth interviews, 10 participants were retained as ‘information gatherers’. ‘Leading-edge’ bars were rented out and 50 adult emergent drinkers were invited to participate in workshops. Given a task guideline, the information gatherers led discussions. As an additional record, the workshops were video recorded. The participants felt comfortable within their peer group and, in the more natural bar environment, fed back real, relevant and honest information. The third stage occurred on the night following the workshops. Focus groups were used, made up of the ‘infor-mation gatherers’. They discussed what happened in the workshops and their interpre-tation of what it actually meant. In order to ensure that the information remained topical, useful and easily accessible, it was felt important to create a vehicle for an on going communication and dialogue with the target market. To achieve this, a high-impact ‘magazine’ was created to bring the research to life after the presentation of findings. This was referred to as a magazine and not a research report to reflect the lifestyle of the consumer group in question: it contained images, layouts and fonts typically associated with the generation.
The above example illustrates a very creative and useful exploratory research design. As a research design it worked well in that it achieved a balance of the needs and expecta-tions of marketing decision makers and participants. Decision makers helped to set clear research objectives based upon the gaps in their knowledge of the target market. Partici-pants related well to the questions and issues posed to them, in a context and environ-ment in which they felt comfortable. An understanding of the fundamentals of research design, its components and the trade-offs between the parties involved in crafting an effective research design enabled the researchers to formulate the most appropriate design for the problem at hand.
Research design definition
A research design is a framework or plan for conducting a marketing research project. It details the procedures necessary for obtaining the information needed to structure or solve marketing research problems. Although a broad approach to the problem has already been developed, the research design specifies the details, the practical aspects of implementing that approach. A research design lays the foundation for conducting the project. A good research design will ensure that the marketing research project is conducted effectively and efficiently. Typically, a research design involves the following components or tasks, is discussed in detail in various chapters:
1 Define the information needed (Chapter 2).
2 Decide whether the overall design is to be exploratory, descriptive or causal (Chapter 3).
3 Design the sequence of techniques of understanding and/or measurement (Chapters 4 to 12).
4 Construct and pre-test an appropriate form for data collection or questionnaire (Chapters 7, 8 and 13).
5 Specify the qualitative and/or quantitative sampling process and sample size (Chapters 6, 14 and 15).
6 Develop a plan of qualitative and/or quantitative data analysis (Chapters 9 and 19).
Research designA framework or plan for conducting the marketing research project. It specifies the details of the procedures necessary for obtaining the information needed to structure or solve marketing research problems.

62 Marketing Research
In formulating a research design, the researcher has to balance the perspectives of market-ing decision makers and target participants. From their education and experience, marketing decision makers may have certain techniques that they believe to be the most effective and in which they subsequently have more confidence. There is no problem with this, providing the technique is the best means to measure or understand the issue under investigation, from the perspective of participants. In the example at the start of this chapter, decision makers had confidence in the qualitative techniques and the data generated. The techniques worked well with the participants, drawing out a rich picture of participant behaviour, lifestyle and aspira-tions. However, should the decision makers feel that survey techniques were the most effec-tive, giving them the most confidence to support their decisions, the researchers may face a dilemma. If they use survey techniques they might find that participants may have a different relationship with interviewers, do not reflect in the same manner and ultimately do not reveal so much. Thus, research design involves the researchers developing an understanding of the type of data decision makers have confidence in, plus an understanding of how participants may respond to different techniques. The first part of this balancing act involves understand-ing research design from the decision makers’ perspective; the second part involves under-standing the participants’ perspective.
Research design from the decision makers’ perspective
Marketing decision makers seek support from researchers that is of practical relevance to the decisions they face. To give practical support, decision makers expect information that is:
• Accurate, i.e. the most valid representation of the phenomena under investigation, that has come from the most reliable or consistent form of measurement or understanding, that is sufficiently sensitive to the important differences in individuals being measured or understood. Combining these three criteria refers to the degree to which information may be deemed as ‘accurate’.
• Current, i.e. as up to date as possible. This is particularly important where consumer attitudes, lifestyle or behaviour change quickly, perhaps due to rapid technological changes or new product offerings in a highly competitive market.
• Sufficient, i.e. the completeness or clarity of a ‘picture’ that reflects the characteristics of the marketing problem the decision makers face.
• Available, i.e. that access to the relevant information can be made when a decision is imminent. This is particularly important where competitive activity forces the decision makers into making a rapid response.
• Relevant, i.e. that the support given ‘makes sense’ to decision makers. In a very general sense, decision makers may criticise qualitative research approaches and techniques for being biased and unrepresentative and, conversely, quantitative approaches and tech-niques for lacking depth and a contextual perspective. Whichever approach or techniques are adopted, decision makers should be aware of their benefits, limitations and even alter-natives. With this awareness they can use the findings with confidence to build upon their existing experiences and knowledge.
Generating information that fulfils all the above characteristics is extremely difficult, if not impossible, to achieve in marketing research. The evaluation of sources of error, pre-sented later in this chapter, and the restrictions of budget and timescales mean that this list represents ‘ideals’. Realistically, trade-offs must be made among the above characteristics. Within the first characteristic of accuracy there are further trade-offs, which are primarily caused by what the researcher is attempting to measure or understand:2

63Chapter 3 Research design
1 The subject of investigation is usually human.
2 The process of measuring or observing humans may cause them to change.
3 It is difficult to assess the effect of extraneous variables in marketing experiments and thus their applications are limited.
Given the complexity of the subjects under study, the context or environment in which measurements are taken and the skills required to perform and interpret measurements, it is difficult (if not impossible) to gain completely objective and accurate measurements.3 Of all the potential trade-offs, if one were to remove relevance, then the whole rationale of support-ing the marketing decision maker would be removed. Therefore this characteristic can never be compromised.
Relevance embraces, among other things, the ability to plan and forecast from research findings, to be able to distinguish real differences in consumer traits and to know that char-acteristics are representative of groups of individuals. With relevant information such as this, the decision maker can build up a stronger understanding or awareness of markets and the forces that shape them. In building up this understanding, the decision maker cannot turn to a single technique or even body of techniques that may be deemed ‘ideal’ in ensuring that information is relevant.4 In different types of decision-making scenarios, different tech-niques will offer the best support for that decision maker. Establishing the best form of sup-port is the essence of research design.
A fundamental starting point in deciding an appropriate design is viewing the process from the point of view of the potential subject or participant of a marketing research study.
Research design from the participants’ perspective
The potential participants in any marketing research investigation play a vital role in decid-ing which research design will actually work in practice. A subject of study may be complex and need time for participants to reflect upon and put words to the questions posed. Certain methods are more likely to build up a rapport and trust – in these circumstances putting the participants in the right frame of mind and getting them to respond in a full and honest man-ner. Figure 3.1 is a framework that serves to remind how participants may be accessed, and what kinds of response may be generated.5
In Figure 3.1 the box under the heading ‘Layers of response from participants’ represents how participants may react to questions posed to them. In the first layer of ‘Spontaneous, Reasoned, Conventional’ are questions that participants can express a view about quickly, and that are simple for them to reflect upon, relating to common, everyday occurrences that are at the forefront of their minds. In such circumstances, simple structured questioning (or self-reporting) in a standardised manner is possible. Further, the same procedure can be con-ducted in a consistent manner to a whole array of ‘types’ of participant, such as age groups, social class and intellectual levels. For example, if questions were posed on which news-papers someone reads, it is a reasonable assumption that participants would be aware of the newspaper title(s), these title(s) can be communicated and the topic of newspaper readership is not a sensitive issue. In these circumstances, where answers to questions on reading habits are relatively easy to access and respond to, highly structured questionnaires are appropriate. Clearly, in such situations, quantitative techniques are applicable that allow very detailed descriptions or experiments to be conducted. The following example illustrates the use of a structured online survey that allowed detailed descriptions and attitudinal measurements of visitors to an exclusive event.

64 Marketing Research
Figure 3.1
Responses to interviewing
• Spontaneous• Reasoned• Conventional
Layers of responsefrom participants
Highlystructuredquestionnaires
e.g. telephone surveys
• Concealed• Personal
Questionnaires witha proportion of open-ended questions toallow probing
e.g. face-to-face surveys
• Intuitive• Imaginative
• Unconscious• Repressed
Semi-structured tounstructuredinterviews on anindividual or groupbasis
e.g. focus group discussions
Unstructuredinterviews andobservations
e.g. naturalistic approaches on a one-to-one basis
Examples oftechniques
Tends to beconclusive
Tends to beexploratory
Una
war
eA
war
e
Non
-com
mun
icab
leC
omm
unic
able
Priv
ate
Publ
ic
Access toparticipant
Real research The Moving Motor Show at Goodwood
Held within the spectacular grounds of Goodwood Park, the exclusive Moving Motor Show (https://www.goodwood.com/grrc/event-coverage/festival-of-speed/) was an important addition to the Festival of Speed. The show enabled a limited number of motoring enthusiasts and new-car buyers to see the very latest models up close for the first time in the UK, and, in some cases, also to climb aboard and experience the vehicles firsthand, strictly at the invitation of the attending vehicle manufacturers. Following the show, IFM Sports Marketing

65Chapter 3 Research design
Surveys (now part of Repucom: http://repucom.net) contacted visitors using its ticketing database as a sampling frame. Event attendees were invited to complete an online questionnaire. The nature of questions posed in this survey addressed attitudinal, behavioural and demographic questions. These questions did not demand in-depth reflection on the part of participants; their responses could be articulated with ease in a concise survey that took five minutes to complete. As most attendees to the event were passionate about Goodwood and cars, their engagement with the subject was high, resulting in 777 completed questionnaires. The show succeeded in attracting new visitors to Goodwood: 26% of visitors had never been to any event prior to this visit. Encouragingly, 37% of visitors had noth-ing negative to say about their visit to Goodwood; however, 27% disliked the walk from the car park to the event.
Progressing down Figure 3.1, at the second level are questions that are more personal and more sensitive. There are two characteristics that can turn otherwise mundane topics into sensitive ones.6 The first involves any private, sacred or stressful aspect of a participant’s life. The second is the real or perceived stigma associated with specific thoughts or actions. A great amount of business-to-business research can be added to these in terms of commercially sensitive information. Again, structured questionnaires can measure the relevant issues, but an amount of rapport may be needed to induce participants to trust the interviewer and reveal their ‘more personal’ attitudes and behaviour. Where the presence of the interviewer causes discomfort or bias, the method of audio/computer-assisted self-interviewing may be used7 or, far more frequently, the anonymity of online research methods can facilitate more honest and open responses.8 Such techniques combine the higher response rates of personal interviews with the privacy of self-administered questionnaires. The following example illustrates how the condom manufacturer Durex managed to research a sensitive topic.
Real research Minimising unease, embarrassment or reluctance in disclosing intimate personal information9
Durex (www.durex.com) wishes to support each individual’s right to enjoy a healthy and rewarding sex life. The challenge for Durex, in this vision, is to develop a brand platform that encompasses sexual well-being (and, through this, the promise of an enhanced and better sex experience), without eroding its safe sex and barrier protection. To fulfil its overall business objective of providing insights to support the commercial vision for the brand, marketing research was needed to address a number of discrete research objec-tives. These ranged from understanding sexual well-being and how it fits into people’s lives, through exploring the sexual activities they take part in, to future trends. It was also critical to ensure that within the overarching aim, the needs of individual stakeholder audiences were met through a robust and reliable research design. The stakeholder audiences included internal business teams and divisions, sexual well-being and health experts, clinicians, politicians, opinion formers and teachers. Openness to talking about sex can vary greatly, not only from individual to individual, but from one culture to another. So a key challenge for the research was to ensure that unease, embarrassment or reluctance in disclosing intimate personal information was minimised. For those who would choose to participate in the survey, their concerns were in participant willingness

66 Marketing Research
to answer more specific, detailed and sensitive questions (e.g. on sexual activities or dys-functions). In designing the survey, these issues needed to be front of mind, and every effort made to minimise their potential impact on response rates, data quality and, ulti-mately, on costs and feasibility. The duty of care to participants in the survey was at the centre of the thinking throughout questionnaire design, and the respective codes of conduct in each of the 26 countries covered in the research were rigorously followed. The focus of the approach was the idea of ‘treating others as we expect to be treated’. So, it was extremely important to be open and honest about the nature of the survey from the very beginning. The introduction advised participants of the sensitive nature of the questions and it also stressed that researchers were not in any way intending to cause any offence. Participants were consequently able to make an informed choice as to their participation. A funnel approach to questionnaire design was adopted, with the less sensitive questions placed at the beginning of the questionnaire to build trust, so that participants felt comfortable being asked the more sensitive questions later on. Throughout the survey, participants were given the option to decline to answer, or sus-pend, to ensure they did not feel pressured into answering questions they did not feel comfortable with. After careful consideration of the strengths and limitations associated with each mode of data collection available in a researcher’s toolkit, an online approach was singled out as the best one for this survey. This approach presented a number of key advantages over other methods for the following reasons:
• The sensitive topic area required an approach that allowed for honesty and openness.
• Removing any interviewer influence or bias was also considered key to data quality.
• The need for global coverage.
• Reach/cost ratio: an online approach was the most cost-effective way of obtaining global reach.
However, an online approach was not feasible in Nigeria, principally due to low pene-tration levels of the telephone and internet. Instead, a face-to-face self-completion approach was adopted in this country.
At the third level are questions that require participants to be creative. For example, if participants were to be asked about their attitudes and behaviour towards eating yogurt, this could be done in a very structured manner. Questions could be set to determine when it was eaten, favourite flavours and brands, where it was bought, how much was spent, etc. The same can be said of alcohol consumption, though this could well be a sensitive issue for many participants. Now imagine a new product idea that mixes yogurt and alcohol. What combinations of alcohol and yogurt would work, and what types of consumer would be attracted to them? Would it be a dessert liqueur such as Baileys Irish Cream, or frozen yogurt to compete with the Häagen-Dazs luxury ice creams? Would champagne, advocaat, whisky or beer be the best alcoholic ingredient? Should any fruits be added? Individually? Forest fruits? Tropical fruits? How would the product be packaged? What name would best suit it? What price level would it sell at? On what occasions would it be consumed?
Answering these questions demands a great amount of creativity and imagination. It demands that participants reflect upon ideas, play with ideas and words and dig deep to draw out ideas in a relaxed manner. Structured questionnaires cannot do this; such a sce-nario would work best with the use of focus groups. One of the major participant-access challenges faced at this level relates to how participants articulate their views and feelings,

67Chapter 3 Research design
At the fourth level may be questions that participants may not be able to conceptualise, never mind be able and willing to express what they feel about particular views and feelings. Consumers may absorb masses of marketing-related stimuli, react to them and ‘intend’ to behave without really knowing why or even being aware of the true drivers of their inten-tions or behaviour.11 An example may be trying to understand the childhood influences of family and friends on an individual’s perception and loyalty to brands that the individual may purchase, perhaps on a habitual basis – an example being washing-up liquid. Another example may be understanding the image consumers have of themselves and an image they wish to portray by spending €20,000 on a Rolex wristwatch. Participants do not normally have to think through such issues or articulate reasons for buying expensive luxury or fash-ion brands, until a researcher comes along!
There is an implicit assumption in research that people carry attitudes around in their head that determine their buying behaviour. Most of the time, we don’t give much thought to the burger we’ve eaten or even the flight we’ve made. Our natural inclination is to be polite and cooperative. If a researcher asks us to give an opin-ion we will do our best to formulate one on the spot.12
In circumstances where the researcher is digging deep into topics that participants do not normally think about or articulate, polite responses to questions may be very misleading. The characteristics of the individual participant may determine what is the best way to probe and elicit appropriate responses. Nothing is standardised or consistent in these circumstances, the researchers having to shape the questions, probes and observations as they see fit in each interview or observation situation. The following example illustrates the challenges faced by researchers and research participants in thinking and articulating their emotional relation-ships to brands.
Real research What the nose knows10
Thomas Inglesant works in the Global Consumer Insights team of the fragrances and flavours company Givaudan (www.givaudan.com). The task of his team is to help brands match household products, such as floor cleaners, with scents that appeal to consumers. One of the main activities of his team is the broad pursuit of an understanding of con-sumers, covering their attitudes and usage habits as they relate to different products. This work is growing, with group discussions, one-to-one interviews and in-home eth-nography as commonly used tools. Inglesant notes: ‘the negative side is there are no numbers so you cannot do statistics with the results, but the positive is that it is more to do with the “why”, rather than the “what” and the “how much”’. One of the problems with asking consumers about different scents is that they tend not to have many words to be able to describe either a smell or why they do or don’t like it. Words such as ‘clean’ and ‘fresh’ are used almost universally by people describing a whole range of scents they like. In case words fail them, consumers can be shown pictures to help them associate scents with certain moods, colours or scenes. Researchers draw on a bank of about 100 pictures – everything from food and flowers to mountain views and people pulling dif-ferent facial expressions – to help discussions along. In some instances, consumers are given a bank of descriptive words and asked to choose which best describe the fra-grance they are given.
especially their emotional states related to brands. The following example illustrates how research participants can be helped to articulate what they may feel about sensations and brands.

68 Marketing Research
As well as understanding how participants may react to particular issues, researchers should also understand how the context or environment may affect participants. The follow-ing examples illustrate why ‘context’ is so important when thinking about where participants are questioned and/or observed. The first example sets out ideas of how to experiment with different contexts in which to conduct qualitative interviews. The second example questions the context in which focus groups are conducted and the possible impact of context upon participant engagement, reflection and honesty.
Real research Winning people’s hearts13
There are plenty of brands that give consumers satisfaction, and then there are brands such as Apple (www.apple.com) and Netflix (www.netflix.com) that have something extra. This intangible something is what Marc Gobé, CEO of Desgrippes Gobé Group (www.dga.com), calls ‘emotional branding’, and he says it is what makes consumers fall in love with a brand:
This magnetism can be manufactured and there's a big role for research in coming up with the right chemistry to create it. Nike is a good example of an emotional brand. It made sportswear accessible to non-sports people with a brand story that inspired not just success but energy and determination.
Marc says that it is important to evaluate visual codes and emotional stimuli associ-ated with brands and their competitors, to determine how consumers experience brands on a sensory level. What he does not do is ask consumers to describe their own feelings about brands and visual stimuli, recalling famous brands like Absolut and Red Bull that have flopped in focus groups:
It is very difficult to ask consumers, particularly in that kind of environment that is not conducive to imagination, about what they feel. I think consumers are not honest all the time and we are limited by the words that we use to express the emotions we have. It is very difficult to truly understand what it is that consumers really will accept in their lives, particularly when it comes to innovation.
Real research Taxis, vans and subways: capturing insights while commuting14
The Mexican research company Insitum (www.insitum.com) has been experimenting with new ways to conduct qualitative research by reaching consumers in their own con-text instead of making them move to a local facility and participate in a study.
The company tried three approaches:
1 Designing and implementing a research taxi in which participants are taken to their destination while they participate in an interview conducted by the researcher–driver.
2 Moderating focus group sessions inside a private van in which passengers participate while they travel from a suburb to the city centre.
3 Conducting shadowings (observations and interviews) with subway passengers dur-ing their home–work commute.
The three approaches had mixed results and opportunities for improvement, with clear logistical challenges. However, they all successfully developed new insights of consum-ers who were happy to discuss issues and be observed in contexts that they felt ‘ comfortable’ in.

69Chapter 3 Research design
As a further example, return to the first level of Figure 3.1, where participants may be more relaxed and feel in control if they can answer the set questions about their newspaper-reading habits online rather than on the street. In the example at the start of this chapter, which explored the hopes and dreams of ‘emergent drinkers’, techniques were used at the third and fourth levels of Figure 3.1. The context of the interviews was in ‘leading-edge bars’. This context could have helped the target participants to relax, to develop a better rap-port with interviewers and other participants and to think more about the issues and express their feelings more clearly. If the interviews were conducted online, the same levels of relax-ation and rapport might not work so well. If the interviews were targeted at older participants, they would have felt very self-conscious in ‘leading-edge bars’, which might restrict their responses. Researchers therefore must understand the characteristics of participants, how they react to particular issues and how they react in different contexts or environments. These factors are illustrated in Figure 3.2, which acts as a reminder of the understanding of partici-pants that researchers must develop in order to choose and apply the best research technique.
Figure 3.2
Understanding participants – to help choose optimum research techniques
Context orenvironment where
participant isquestioned
Nature of issueunder investigation,
as perceived byparticipant
Nature ofparticipant
Research design classification
Research designs may be broadly classified as exploratory or conclusive (see Figure 3.3). The dif-ferences between exploratory research and conclusive research are summarised in Table 3.1.
The primary objective of exploratory research is to provide insights into and an understand-ing of marketing phenomena.15 It is used in instances where the subject of the study cannot be measured in a quantitative manner, or where the process of measurement cannot realistically represent particular qualities. For example, if a researcher was trying to understand what ‘atmos-phere’ meant in a restaurant, exploratory research may help to establish all the appropriate vari-ables and how they connect together. What role did music play? What type of music? How loud? What types of furniture? What colours and textures? What types of lighting? What archi-tectural features? This list could go on to consider what ‘atmosphere’ may mean in the context of a restaurant experience for particular types of consumer. ‘Atmosphere’ may not be measura-ble from the participant’s perspective. From the perspective of the creative director in an adver-tising agency, quantitative measurements of the individual components of ‘atmosphere’ may not create the holistic feel of a restaurant in a manner the creative director can relate to.
Exploratory research may also be used in cases where the problem must be defined more precisely, relevant courses of action identified, or additional insights gained before going on to confirm findings using a conclusive design. The following example of researching the psychology of voting illustrates how the different approaches to research can be combined within a single study.
Exploratory researchA research design characterised by a flexible and evolving approach to understanding marketing phenomena that are inherently difficult to measure.
Conclusive researchA research design characterised by the measurement of clearly defined marketing phenomena.

70 Marketing Research
Table 3.1
Exploratory Conclusive
Objectives To provide insights and understanding of the nature of marketing phenomena
To understand
To test specific hypotheses and examine relationships
To measure
Characteristics Information needed may be loosely defined
Research process is flexible, unstructured and may evolve
Samples are small
Data analysis can be qualitative or quantitative
Information needed is clearly defined
Research process is formal and structured
Sample is large and aims to be representative
Data analysis is quantitative
Findings/results Can be used in their own right
May feed into conclusive research
May illuminate specific conclusive findings
Can be used in their own right
May feed into exploratory research
May set a context to exploratory findings
Methods Expert surveys
Pilot surveys
Secondary data
Qualitative interviews
Unstructured observations
Quantitative exploratory multivariate methods
Surveys
Secondary data
Databases
Panels
Structured observations
Experiments
Differences between exploratory and conclusive research
Figure 3.3
A classification of marketing research designs
Multiplecross-sectional
Singlecross-sectional
Longitudinaldesign
Cross-sectionaldesign
Causalresearch
Descriptiveresearch
Quantitativeexploration
Qualitativeexploration
Conclusive design
Research design
Exploratory design

71Chapter 3 Research design
In an example of a flexible, loosely structured and evolutionary approach, consider con-ducting personal interviews with industry experts. The sample, selected to generate maxi-mum insight, is small and non-representative. However, the emphasis in the sampling procedure is focused upon ‘quality’ individuals who are willing to open up, use their imagi-nation, be creative and reveal perhaps sensitive thoughts and behaviour. ‘Quality’ also may emerge from their level of expertise; for example, there may only be a small population of chief executives of airline companies in Europe. If a small sample of, say, six chief execu-tives from the largest and fastest-developing airlines allowed access to a researcher and revealed their attitudes and behaviour, insights might be gained that no conclusive study could achieve. By being flexible in the issues to discuss, loosely structured in how probes and additional issues emerge and evolutionary in the nature of who to talk to and the best context in which to gain their confidence and get them to express what they really feel, an exploratory design can be very beneficial.
Real research Getting inside the minds of European voters16
Around the world, countries face a challenge with falling participation in elections and a sense of alienation felt by citizens in response to the actions of their governments. Research-ers at Opinium Research (www.opinium.co.uk) and The London School of Economics (www.lse.ac.uk) have been undertaking a multi-year study to get inside the mind of voters across 12 European countries. The goal of this research, ‘entitled’ Inside the mind of the vote’, is to build a better understanding of the psychology of the voting process itself.
In order to address this challenging research problem project, a very broad range of data collection techniques were built into the research design. The research design involved both qualitative and quantitative data collection approaches, including:
• Multi-wave quantitative surveys
• In-depth interviews
• Experiments
• Diary techniques
• Observational techniques in polling stations.
The complexity of the research design generated a number of challenges in analysing the research, which had to be overcome. One approach to dealing with combining qualitative and quantitative data sources is to ensure that there is a ‘bridge’ between the different methods. For example, including open-ended questions in surveys that link to the themes used in interviews, or using questionnaire items in diary entries. This helped to triangulate the data and identify potential sources of bias.
The study generated a number of insights about the voting process itself. For exam-ple, the high levels of voters who change their mind in the week before an election and the role of emotions in the voting process. This unique research design has resulted in a number of important impacts upon public policy, both within the European Commis-sion and in individual European governments.

72 Marketing Research
There is an exception to exploratory designs being built around qualitative techniques. There are examples of quantitative findings being used for exploratory purposes. For example, within a survey that examines specific research questions and hypotheses lies the opportunity to examine additional connections between questions that had not been initially considered. Simple correlations through to multivariate techniques that explore potential connections between questions may be conducted; this process is known as data mining. In essence, data mining searches for significant connections or patterns in a dataset that a researcher or decision maker may be unaware of.
To summarise, exploratory research is meaningful in any situation where the researcher does not have enough understanding to proceed with the research project. Exploratory research is characterised by flexibility and versatility with respect to the methods, because formal research protocols and procedures are not employed. It rarely involves structured questionnaires, large samples and probability sampling plans. Rather, researchers are alert to new ideas and insights as they proceed. Once a new idea or insight is discovered, they may redirect their exploration in that direction. That new direction is pursued until its possibilities are exhausted or another direction is found. For this reason, the focus of the investigation may shift constantly as new insights are discovered. Thus, the creativity and ingenuity of the researcher play a major role in exploratory research. Exploratory research can be used for any of the purposes listed in Table 3.2.
Table 3.2
1 To obtain some background information where absolutely nothing is known about the problem area
2 To define problem areas fully and to formulate hypotheses for further investigation and/or quantification
3 To identify and explore concepts in the development of new products or forms of marketing communications
4 During a preliminary screening process, such as in new-product development, in order to reduce a large number of possible projects to a smaller number of probable ones
5 To identify relevant or salient behaviour patterns, beliefs, opinions, attitudes, motivations, etc., and to develop structures of these constructs
6 To develop an understanding of the structure of beliefs and attitudes in order to aid the interpretation of data structures in multivariate data analyses
7 To explore the reasons that lie behind the statistical differences between groups that may emerge from secondary data or surveys
8 To explore sensitive or personally embarrassing issues from the participants’ and/or the interviewer’s perspective
9 To explore issues that participants may feel deeply about, that are difficult for them to rationalise and that they may find difficult to articulate
10 To ‘data-mine’ or explore quantitative data to reveal hitherto unknown connections between different measured variables
A summary of the uses of exploratory research designsa
The objective of conclusive research is to describe specific phenomena, to test specific hypotheses and to examine specific relationships. This requires that the information needed is clearly specified.17 Conclusive research is typically more formal and structured than exploratory research. It is based on large, representative samples, and the data obtained are subjected to quantitative analysis. Conclusive research can be used for any of the purposes listed in Table 3.3.
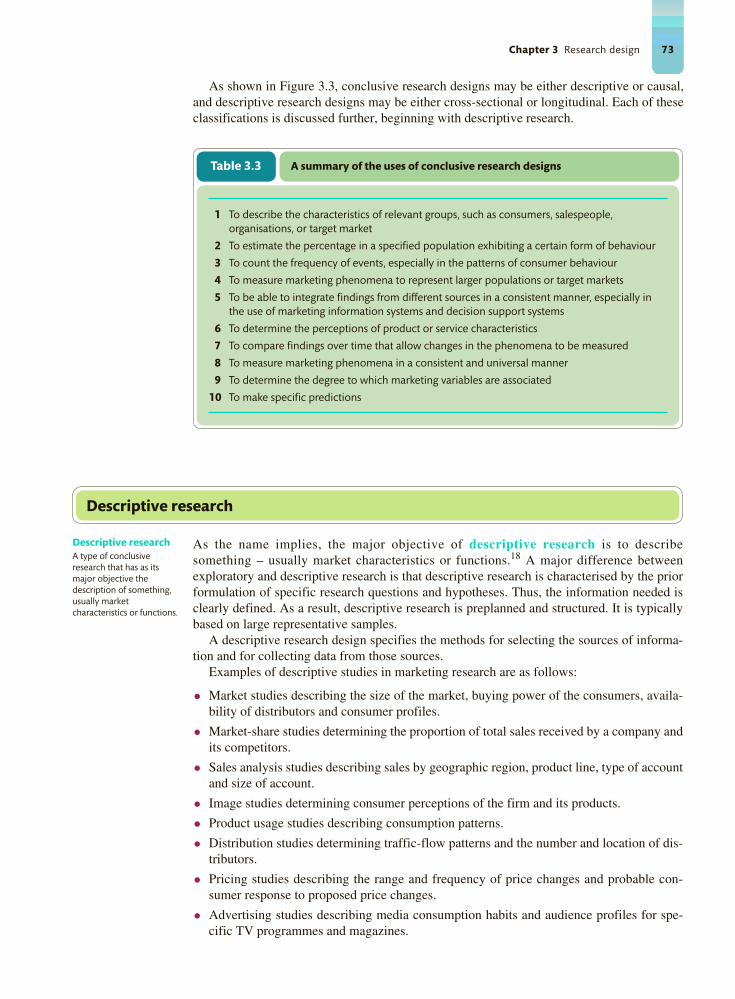
73Chapter 3 Research design
Table 3.3
1 To describe the characteristics of relevant groups, such as consumers, salespeople, organisations, or target market
2 To estimate the percentage in a specified population exhibiting a certain form of behaviour
3 To count the frequency of events, especially in the patterns of consumer behaviour
4 To measure marketing phenomena to represent larger populations or target markets
5 To be able to integrate findings from different sources in a consistent manner, especially in the use of marketing information systems and decision support systems
6 To determine the perceptions of product or service characteristics
7 To compare findings over time that allow changes in the phenomena to be measured
8 To measure marketing phenomena in a consistent and universal manner
9 To determine the degree to which marketing variables are associated
10 To make specific predictions
A summary of the uses of conclusive research designs
Descriptive research
As the name implies, the major objective of descriptive research is to describe something – usually market characteristics or functions.18 A major difference between exploratory and descriptive research is that descriptive research is characterised by the prior formulation of specific research questions and hypotheses. Thus, the information needed is clearly defined. As a result, descriptive research is preplanned and structured. It is typically based on large representative samples.
A descriptive research design specifies the methods for selecting the sources of informa-tion and for collecting data from those sources.
Examples of descriptive studies in marketing research are as follows:
• Market studies describing the size of the market, buying power of the consumers, availa-bility of distributors and consumer profiles.
• Market-share studies determining the proportion of total sales received by a company and its competitors.
• Sales analysis studies describing sales by geographic region, product line, type of account and size of account.
• Image studies determining consumer perceptions of the firm and its products.
• Product usage studies describing consumption patterns.
• Distribution studies determining traffic-flow patterns and the number and location of dis-tributors.
• Pricing studies describing the range and frequency of price changes and probable con-sumer response to proposed price changes.
• Advertising studies describing media consumption habits and audience profiles for spe-cific TV programmes and magazines.
Descriptive researchA type of conclusive research that has as its major objective the description of something, usually market characteristics or functions.
As shown in Figure 3.3, conclusive research designs may be either descriptive or causal, and descriptive research designs may be either cross-sectional or longitudinal. Each of these classifications is discussed further, beginning with descriptive research.

74 Marketing Research
These examples demonstrate the range and diversity of descriptive research studies. Descriptive research can be further classified into cross-sectional and longitudinal research (Figure 3.3).
Cross-sectional designs
The cross-sectional study is the most frequently used descriptive design in marketing research. Cross-sectional designs involve the collection of information only once from any given sample of population elements. They may be either single cross-sectional or multiple cross-sectional (Figure 3.3). In single cross-sectional designs, only one sample of partici-pants is drawn from the target population, and information is obtained from this sample only once. These designs are also called sample survey research designs. In multiple cross- sectional designs, there are two or more samples of participants, and information from each sample is obtained only once. Often, information from different samples is obtained at dif-ferent times. The following examples illustrate single and multiple cross-sectional designs respectively.
Real research Television motivations19
Much marketing research is directed at understanding the ‘drivers’ of consumer behav-iour. Corning is a leading specialist manufacturer of glass products, perhaps best known for its role in providing screens for the iPhone, iPad and other mobile devices. In a study commissioned by Corning Display Technologies (www.corning.com), the motivations for choosing a new TV were measured. An online survey of 2,500 respondents in China, France, Germany, Japan, the UK and USA was administered. Qualitative research grounded in motivational theory underpinned the survey. The qualitative research sug-gested a number of consumer concerns and interests that might have an impact on TV preferences, especially across the countries being studied. This knowledge was used to develop a list of concerns and interests that could encompass selection and use of a TV set. The survey included a discrete choice exercise to measure preferences for different types of TV sets. The survey also contained a list of TV viewing occasions and activities, and participants were asked to indicate the frequency of each occasion for their house-holds. Participants selected three viewing activities or occasions that would be most important to their choice of a TV set. To be part of the survey, participants had to indi-cate a likelihood of purchasing an LCD TV in the next four years.
Cross-sectional designA type of research design involving the collection of information only once from any given sample of population elements.
Single cross-sectional designA cross-sectional design in which one sample of participants is drawn from the target population and information is obtained from this sample only once.
Multiple cross-sectional designA cross-sectional design in which there are two or more samples of participants, and information from each sample is obtained only once.
Real research Life cycle, objective and subjective living standards and life satisfaction – multiple cross-sectional design20
Centrum Badania Opinii Spotecznej (CBOS) (www.cbos.pl) is a major Polish polling cen-tre, a non-governmental foundation, whose main goal is to conduct a monthly survey of public opinion on all important current problems and events. The centre wished to build a composite measure of living conditions, based upon household material wealth and life satisfaction. In order to do this it conducted seven surveys in Poland between 1992 and 2004. Through 2003 the surveys were conducted on stratified probability random samples of Polish addresses. The data from all surveys were weighted to assure their representativeness in respect of the main socio-demographic characteristics of the

75Chapter 3 Research design
The survey devoted to measuring motivations of TV purchases, a single cross-sectional design, involved only one group of participants who provided information only once. On the other hand, the Polish study involved eight different samples, each measured only once, with the measures generally obtained two years apart. Hence, the latter study illustrates a multiple cross-sectional design. A type of multiple cross-sectional design of special interest is cohort analysis.
Cohort analysis consists of a series of surveys conducted at appropriate time intervals, where the cohort serves as the basic unit of analysis. A cohort is a group of participants who experience the same event within the same time interval.21 For example, a birth (or age) cohort is a group of people who were born during the same time interval, such as 1951–1960. The term ‘cohort analysis’ refers to any study in which there are measures of some character-istics of one or more cohorts at two or more points in time.
It is unlikely that any of the individuals studied at time 1 will also be in the sample at time 2. For example, the age cohort of people between 8 and 19 years was selected, and their soft-drink consumption was examined every 10 years for 30 years. In other words, every 10 years a different sample of participants was drawn from the population of those who were then between 8 and 19 years old. This sample was drawn independently of any previous sample drawn in this study from the population of people aged 8 to 19 years. Obviously, people who were selected once were unlikely to be included again in the same age cohort (8 to 19 years), as these people would be much older at the time of subsequent sampling. This study showed that this cohort had increased consumption of soft drinks over time. Similar findings were obtained for other age cohorts (20–29, 30–39, 40–49 and 50+). Further, the consumption of each cohort did not decrease as the cohort aged. These results are presented in Table 3.4, in which the consumption of the various age cohorts over time can be determined by reading down the diagonal. These findings contradict the common belief that the consumption of soft drinks will decline with the greying of Western economies. This common but erroneous belief has been based on single cross-sectional studies. Note that if any column of Table 3.4 is viewed in isolation (as a single cross-sectional study) the consumption of soft drinks declines with age, thus fostering the erroneous belief.22
Cohort analysisA multiple cross-sectional design consisting of surveys conducted at appropriate time intervals. The cohort refers to the group of participants who experience the same event within the same time interval.
population. Satisfaction with various aspects of life was also investigated many times during the 1992–2004 period. However, only once, in September 1999, was it included in the same survey together with the questions on household possessions. Effective sam-ple sizes were 1,788 in 1992, 1,222 in 1994, 1,177 in 1996, 1,167 in 1998, 1,092 in 1999, 1,060 in 2002, 1,057 in 2003 and 1,022 in 2004.
Table 3.4
Age 1950 1960 1970 1980
8–19 53 63 73 81R20–29 45 61 76 76R C8
30–39 34 47 68 71R C7
40–49 23 41 59 68R C6
50+ 18 29 50 52R C5
C1 C2 C3 C4
C1: cohort born prior to 1900 C4: cohort born 1921–1930 C7: cohort born 1951–1960C2: cohort born 1901–1910 C5: cohort born 1931–1940 C8: cohort born 1961–1970C3: cohort born 1911–1920 C6: cohort born 1941–1950
Consumption of soft drinks by various age cohorts (percentage consuming on a typical day)

76 Marketing Research
Cohort analysis can also be used to predict changes in voter opinions during a political campaign. Well-known researchers such as YouGov (www.yougov.com) or Ipsos MORI (www.ipsos-mori.com), who specialise in political opinion research, periodically question cohorts of voters (people with similar voting patterns during a given interval) about their vot-ing preferences in order to predict election results. Thus, cohort analysis is an important cross-sectional design, as illustrated in the following example, which builds on the previous example of the Polish polling centre CBOS.
Real research Life cycle, objective and subjective living standards and life satisfaction – cohort analysis23
Cohort analysis of the household material wealth and life satisfaction in Poland allowed joint examination of the impacts of age, time and period of being born. It can be said that, though age-related differences were similar in each survey, between-survey differ-ences suggested that material wealth was rapidly growing in time. This growth was evi-dently faster in young groups than in older ones, so the youth benefited the most from the changes. In addition, accumulated wealth was evidently much smaller in older age groups. That may bring an inexperienced researcher to a completely false conclusion that after a short period of acquiring wealth, people get rid of it rather than accumulate it in time. Thus, cohort analysis can be indispensable in properly examining the changes in wealth during the span of life.
Longitudinal designs
The other type of descriptive design is longitudinal design. In a longitudinal design, a fixed sample (or samples) of population elements is measured repeatedly, as in the following example at Philips.
Longitudinal designA type of research design involving a fixed sample of population elements measured repeatedly. The sample remains the same over time, thus providing a series of pictures that, when viewed together, vividly illustrate the situation and the changes that are taking place.
Real research True Loyalty24
True Loyalty is a large-scale joint research project developed by Philips (www.philips.com) and Interview NSS (www.interview-nss.com). The project aims to measure the actual sales effect of consumers’ experiences with Philips Consumer Lifestyle. The pro-ject was influenced by the work of Frederick Reichheld,25 who developed the concept of ‘Net Promotor Score’ (NPS), which has become a widely used loyalty metric in many leading companies. Unlike most studies using the NPS, True Loyalty decided to set up a single-source longitudinal survey. Customers from whom it had obtained satisfaction and recommendation scores via ongoing research projects were recontacted 9 to 18 months later and both their purchases and those of friends and colleagues were assessed. The database consisted of over 25,000 recontacted customers.
A longitudinal design differs from a cross-sectional design in that the sample or samples remain the same over time. In other words, the same people are studied over time. In contrast to the typical cross-sectional design, which gives a snapshot of the variables of interest at a single point in time, a longitudinal study provides a series of ‘pictures’. These ‘pictures’ give an in-depth view of the situation and the changes that take place over time. For example, the

77Chapter 3 Research design
question ‘How did the German people rate the performance of German Chancellor Angela Merkel in 2016?’ would be addressed using a cross-sectional design. A longitudinal design, however, would be used to address the question ‘How did the German people change their view of Merkel’s performance during her term of office?’.
Often, the term ‘panel’ is used in conjunction with the term ‘longitudinal design’. A panel consists of a sample of participants, generally households, who have agreed to provide gen-eral or specific information at set intervals over an extended period. The emphasis of the panel is on measuring facts, e.g. who in the household bought what, where they bought it, when, and other aspects of their behaviour. Panels are really only established when observa-tions or measurements over an extended period are meaningful. The observations are usually gathered through questionnaires, such as purchase diaries, or increasingly through social media methods. Panels are maintained by syndicated firms, such as TNS (www.tnsglobal.com) and panel members are compensated for their participation with gifts, coupons, infor-mation or cash.26
Access panels are made up of a ‘pool’ of individuals or households who have agreed to be available for surveys of widely varying types and topics.27 They are used to provide infor-mation for ad hoc decisions rather than for longitudinal studies – a typical use being for new-product testing. A pre-recruited panel that is willing to participate makes it easier to set up the test and conduct interviews after the test. Access panels are also used to test concepts, advertising and pricing decisions.
Online consumer access panels are becoming increasingly prevalent in marketing research.28 The growth in use of access panels has partly been in response to the challenges of rising rates of non-response or refusal to take part in surveys. The growth of online sur-veys and the need for electronic addresses of willing participants have also favoured the use of access panels. (Given this growth and prevalence, we will further address access panels in Chapters 4, 10 and 14.)
The industry moves forward at such a fast pace that samples can easily be left behind. Frequency of internet usage is a classic example; what people were doing 12 or even 6 months ago will be different to what they are doing now. In a fast-moving research sector it is important to keep up to date with the latest gadgets, technologies and service offerings, and to keep the panel updated with these.
Relative advantages and disadvantages of longitudinal and cross-sectional designs
The relative advantages and disadvantages of longitudinal versus cross-sectional designs are summarised in Table 3.5. A major advantage of longitudinal design over cross-sectional design is the ability to detect change as a result of repeated measurement of the same varia-bles on the same sample.
Tables 3.6 and 3.7 demonstrate how cross-sectional data can mislead researchers about changes over time. The cross-sectional data reported in Table 3.6 reveal that the purchases of Brands A, B and C remained the same in periods 1 and 2. In each survey, 20% of the partici-pants purchased Brand A, 30% Brand B and 50% Brand C. The longitudinal data presented in Table 3.7 show that substantial change, in the form of brand switching, occurred in the study period. For example, only 50% (100/200) of the participants who purchased Brand A in period 1 also purchased it in period 2. The corresponding repeat-purchase figures for Brands B and C are, respectively, 33.3% (100/300) and 55% (275/500). Hence, during this interval Brand C experienced the greatest loyalty and Brand B the least. Table 3.7 provides valuable information on brand loyalty and brand switching (such a table is called a turnover table or a brand-switching matrix).29
Longitudinal data enable researchers to examine changes in the behaviour of individual units and to link behavioural changes to marketing variables, such as changes in advertising, packaging, pricing and distribution. Since the same units are measured repeatedly, variations caused by changes in the sample are eliminated, and even small variations become apparent.
PanelA sample of participants who have agreed to provide information at specified intervals over an extended period.
Access panelA general ‘pool’ of individuals or households who have agreed to be available for surveys of widely varying types and topics.

78 Marketing Research
Another advantage of panels is that relatively large amounts of data can be collected. Because panel members are usually compensated for their participation, they are willing to participate in lengthy and demanding interviews. Yet another advantage is that panel data can be more accurate than cross-sectional data. A typical cross-sectional survey requires the participant to recall past purchases and behaviour; these data can be inaccurate because of memory lapses. Panel data, which might involve continuous recording of purchases in a diary, place less reli-ance on the participant’s memory. A comparison of panel and cross-sectional survey esti-mates of retail sales indicates that panel data give more accurate estimates.30
Table 3.5 Relative advantages and disadvantages of longitudinal and cross-sectional designs
Evaluation criteria Cross-sectional design Longitudinal design
Detecting change − +Large amount of data collection − +Accuracy − +Representative sampling + −Response bias + −
Note: + indicates a relative advantage over the other design, whereas – indicates a relative disadvantage.
Table 3.6
Time period
Brand purchased Period 1 survey Period 2 survey
Total surveyed 1,000 1,000Brand A 200 200Brand B 300 300Brand C 500 500
Cross-sectional data may not show change
Table 3.7
Brand purchased in period 2
Brand purchased in period 1 Brand A Brand B Brand C Total
Total surveyed 200 300 500 1,000Brand A 100 50 50 200Brand B 25 100 175 300Brand C 75 150 275 500
Longitudinal data may show substantial change

79Chapter 3 Research design
The main disadvantage of panels is that they may not be representative. Non-representa-tiveness may arise because of the following:
1 Refusal to cooperate. Many individuals or households do not wish to be bothered with the panel operation and refuse to participate. Consumer panels requiring members to keep a record of purchases have a cooperation rate of 60% or less.
2 Dropout. Panel members who agree to participate may subsequently drop out because they move away or lose interest. Dropout rates can be as high as 20% per year.31
3 Payment. Payment may cause certain types of people to be attracted, making the group unrepresentative of the population.
4 Professional participants. Most concerns about representativeness arise from the claim that research panels generate ‘professional’ participants. ‘Panel conditioning’ is the term used to describe the effect of participants who engage with a number of surveys over time and on a regular basis. Their self-reported attitudes and behaviours can be shaped by what they feel is the type of response expected of them.32
Another disadvantage of panels is response bias. New panel members are often biased in their initial responses. They tend to increase the behaviour being measured, such as food pur-chasing. This bias decreases as the participant overcomes the novelty of being on the panel, so it can be reduced by initially excluding the data of new members. Bias also results from bore-dom, fatigue and incomplete diary entries.33 The following example from the marketing research agency Taylor Nelson Sofres (TNS) illustrates how it copes with potential panel bias.
Causal research
Causal research is used to obtain evidence of cause-and-effect (causal) relationships. Mar-keting managers continually make decisions based on assumed causal relationships. These assumptions may not be justifiable, and the validity of the causal relationships should be examined via formal research.35 For example, the common assumption that a decrease in price will lead to increased sales and market share does not hold in certain competitive envi-ronments. Causal research is appropriate for the following purposes:
Causal researchA type of conclusive research where the major objective is to obtain evidence regarding cause-and-effect (causal) relationships.
Real research Rubbish in, rubbish out34
Research firms such as TNS (www.tnsglobal.com) spend a lot of money on recruiting par-ticipants to online panels – if the quality of participants is rubbish so will be the research! As part of the ESOMAR Project Team on online panels, TNS has been looking at how to define a well-recruited panel. For TNS, a panel is recruited from multiple sources with the pan-ellist’s details verified. Care must be taken to account for the differences between the type of people who take part in online panels and those who do not, to ensure that the panel is truly representative. TNS deals with this issue by running parallel studies to make sure that online panellists are responding in the same way online as they would offline. If a bias is found, the results are calibrated to account for it. In this respect, online is no different from any other form of research.

80 Marketing Research
1 To understand which variables are the cause (independent variables) and which variables are the effect (dependent variables) of marketing phenomena.
2 To determine the nature of the relationship between the causal variables and the effect to be predicted.
3 To test hypotheses.
Like descriptive research, causal research requires a planned and structured design. Although descriptive research can determine the degree of association between variables, it is not appropriate for examining causal relationships. Such an examination requires a causal design, in which the causal or independent variables are manipulated in a relatively con-trolled environment. Such an environment is one in which the other variables that may affect the dependent variable are controlled or checked as much as possible. The effect of this manipulation on one or more dependent variables is then measured to infer causality. The main method of causal research is experimentation.36
(Due to the complexity and importance of this subject, Chapter 11 has been devoted to causal research designs.)
Relationships between exploratory, descriptive and causal research
We have described exploratory, descriptive and causal research as major classifications of research designs, but the distinctions among these classifications are not absolute. A given marketing research project may involve more than one type of research design and thus serve several purposes as illustrated in the following example.
Real research Italians and Americans face each other at dinner37
The ways in which we select, prepare and consume foods are tied to the habits and cus-toms that define a people in their place and time. The foods that are valued and enjoyed are linked to circumstances of availability, tradition, self-image and cultural transference. In research commissioned by Barilla Alimentare (www.barillagroup.com), Hy Mariam-polski and Sharon Wolf (www.qualidataresearch.com) studied ideas about the ‘Italian-ness’ influence on foods eaten in the USA, alongside a contrasting study of attitudes toward American foods eaten in Italy conducted by Luigi Toiati (www.focusresearch.it). Italian food in the USA, while being seen as an essential part of American cuisine, has been losing its previous cachet. Competing against other cuisines, particularly Asian and Mexican meals, Italian foods have been riddled with unhelpful ideas emanating from popular cultural steroetypes: that Italian meals consist of enormous quantities of pasta heavily sauced with cheese and meaty red tomato purée. These myths tend to reduce Italian foods as downscale and inappropriate for low-carbohydrate diets. Italy, too, has its own complex mythology regarding the USA and its cuisine: that it consists of heaping portions of food that are mediocre at best, over processed, lacking tradition, fattening and eaten too hastily. The general conclusion is that ‘America is a country worth visiting, but where it’s not worth eating’. In the Italian mind, overweight Americans stuff them-selves with anonymous, monotonous food, simply eating for eating’s sake with no regard for taste! The researchers wanted to help reverse these disparaging stereotypes. Digging deeply into the meaning of ‘authenticity’ and seeking positive and constructive aspects of the national mythologies helped to secure consumer insights that promoted

81Chapter 3 Research design
Which combination of research designs to employ depends on the nature of the problem. We offer the following general guidelines for choosing research designs:
1 When little is known about the problem situation, it is desirable to begin with exploratory research. Exploratory research is appropriate for the following:
a When the nature of the topic under study cannot be measured in a structured, quan-tifiable manner.
b When the problem needs to be defined more precisely.
c When alternative courses of action need to be identified.
d When research questions or hypotheses need to be developed.
e When key variables need to be isolated and classified as dependent or independent.
2 Exploratory research may be an initial step in a research design. It may be followed by descriptive or causal research. For example, hypotheses developed via exploratory research can be statistically tested using descriptive or causal research.
3 It is not necessary to begin every research design with exploratory research. It depends on the precision with which the problem has been defined and the researcher’s degree of certainty about the approach to the problem. A research design could well begin with descriptive or causal research. To illustrate, a consumer satisfaction survey that is con-ducted annually need not begin with or include an exploratory phase.
4 Although exploratory research is generally the initial step, it need not be. Exploratory research may follow descriptive or causal research. For example, descriptive or causal research can result in findings that are hard for managers to interpret. Exploratory research may provide more insights to help understand these findings.
The relationships between exploratory, descriptive and causal research are further illustrated by the following example.
consumption of Italian brands in the USA and American foods in Italy. The methods used in this study of food culture were: semiotic analysis of media images to gain insights into the ideas communicated about Italy and the USA in popular culture; in-depth inter-views with experts and influential consumers; ethnographic home visits to see how ideas about the foods of each culture were expressed in meal preparation; focus group discus-sions to explore emerging ideas; and descriptive, face-to-face street interviews.
Real research Using insight to improve telephone banking customer satisfaction at Natwest
Financial services firms face increasing challenges to retain their customers. With many customers shifting their banking to digital channels, and pressure to manage costs, it is not surprising that telephone banking services could be seen as a declining channel. As a result, leading UK bank Natwest, like many other banks, developed processes to try and stop customers calling their online phone service and ensure any calls there were made kept short. For example, Natwest had a target that 90% of calls should be completed within 60 seconds.

82 Marketing Research
Examples of multi-method research designs can be criticised for taking too long to under-take, being too expensive and perhaps applying too many techniques that do not offer sufficient additional understanding. Such criticism cannot really be addressed without knowing the value that decision makers may get from this decision support (not just at the end, but at the many stages of research as it unfolds), compared with how much they would have to pay for it. Deci-sion makers can receive interim reports and feed back their ideas to give more focus to the issues and types of participant in subsequent stages. The example also illustrates that research-ers can be very creative in their choice of techniques that combine to make up a research design.
Working with leading research firm KPMG Nunwood38, Natwest ran a continuous tracking programme that interviewed 4,000 customers, alongside 2,000 customers of Natwest’s competitors each month. Researchers made use of a research method known as ‘critical incident technique’ (CIT), which involves research participants telling stories about specific experiences (‘incidents’) related to use of a product or service.
This research generated insights in two important areas. Firstly, Natwest found it had some of the lowest customer satisfaction ratings for any bank telephone service. Sec-ondly, far from being unimportant, telephone banking was often the point of contact where customers were most in need of help.
To address these issues qualitative research was augmented with quantitative analysis of customer verbatim comments using textual analysis software. The output resulted in a new call model for delivering a high-quality customer experience over the telephone, and a dramatic increase in customer satisfaction.
Potential sources of error in research designs
Several potential sources of error can affect a research design. A good research design attempts to control the various sources of error. Although these errors are discussed in detail in subsequent chapters, it is pertinent at this stage to give brief descriptions.
Where the focus of a study is a quantitative measurement, the total error is the variation between the true mean value in the population of the variable of interest and the observed mean value obtained in the marketing research project. For example, the annual average income of a target population may be 85,650, as determined from census information via tax returns, but a marketing research project estimates it at 62,580 based upon a sample survey. As shown in Figure 3.4, the total error (in the above case 23,070) is composed of random sampling error and non-sampling error.
Random sampling error
Random sampling error occurs because the particular sample selected is an imperfect rep-resentation of the population of interest. Random sampling error is the variation between the true mean value for the population and the true mean value for the original sample. (Random sampling error is discussed further in Chapters 14 and 15.)
Non-sampling error
Non-sampling errors can be attributed to sources other than sampling, and may be random or non-random. They result from a variety of reasons, including errors in problem definition, approach, scales, questionnaire design, interviewing methods and data preparation and anal-ysis. Non-sampling errors consist of non-response errors and response errors.
Total errorThe variation between the true mean value in the population of the variable of interest and the observed mean value obtained in the marketing research project.
Random sampling errorThe error arising because the particular sample selected is an imperfect representation of the population of interest. It may be defined as the variation between the true mean value for the sample and the true mean value of the population.
Non-sampling errorAn error that can be attributed to sources other than sampling and that can be random or non-random.

83Chapter 3 Research design
A non-response error arises when some of the participants included in the sample simply do not respond. The primary causes of non-response are refusals and not-at-homes (see Chap-ter 15). Non-response will cause the net or resulting sample to be different in size or composi-tion from the original sample. Non-response error is defined as the variation between the true mean value of the variable in the original sample and the true mean value in the net sample.
Response error arises when participants give inaccurate answers, or their answers are mis-recorded or mis-analysed. Response error is defined as the variation between the true mean value of the variable in the net sample and the observed mean value obtained in the marketing research project. Response error is determined not only by the non-response percentage, but also by the difference between participants and those who failed to cooperate, for whatever reason, as response errors can be made by researchers, interviewers or participants.39 A central question in evaluating response error is whether those who participated in a survey differ from those who did not take part, in characteristics relevant to the content of the survey.40
Response errors made by the researcher include surrogate information, measurement, population definition, sampling frame and data analysis errors:
• Surrogate information error may be defined as the variation between the information needed for the marketing research problem and the information sought by the researcher. For example, instead of obtaining information on consumer choice of a new brand (needed for the marketing research problem), the researcher obtains information on consumer preferences because the choice process cannot be easily observed.
• Measurement error may be defined as the variation between the information sought and information generated by the measurement process employed by the researcher. While seeking to measure consumer preferences, the researcher employs a scale that measures perceptions rather than preferences.
Non-response errorA type of non-sampling error that occurs when some of the participants included in the sample do not respond. This error may be defined as the variation between the true mean value of the variable in the original sample and the true mean value in the net sample.
Response errorA type of non-sampling error arising from participants who do respond but who give inaccurate answers or whose answers are mis-recorded or mis-analysed. It may be defined as a variation between the true mean value of the variable in the net sample and the observed mean value obtained in the market research project.
Figure 3.4
Potential sources of error in research designs
Interviewererrors
• Participant selection• Questioning• Recording• Cheating
Researchererrors
• Surrogate information• Measurement• Population de�nition• Sampling frame• Data analysis
Participanterrors
• Inability• Unwillingness
Responseerrors
Non-responseerrors
Random samplingerrors
Non-samplingerrors
Total error

84 Marketing Research
• Population definition error may be defined as the variation between the actual population relevant to the problem at hand and the population as defined by the researcher. The prob-lem of appropriately defining the population may be far from trivial, as illustrated by the following example of affluent households. Their number and characteristics varied depending on the definition, underscoring the need to avoid population definition error. Depending upon the way the population of affluent households was defined, the results of this study would have varied markedly.
Real research How affluent is affluent?
The population of the affluent households was defined in four different ways in a study:
1 Households with an income of €80,000 or more.
2 The top 20% of households, as measured by income.
3 Households with net worth over €450,000.
4 Households with discretionary income to spend being 30% higher than that of com-parable households.
• Sampling frame error may be defined as the variation between the population defined by the researcher and the population as implied by the sampling frame (list) used. For exam-ple, the telephone directory used to generate a list of telephone numbers does not accu-rately represent the population of potential landline consumers due to unlisted, disconnected and new numbers in service. It also misses out the great number of consum-ers who choose not to have landlines, exclusively using mobile phones.
• Data analysis error encompasses errors that occur while raw data from questionnaires are transformed into research findings. For example, an inappropriate statistical procedure is used, resulting in incorrect interpretation and findings.
Response errors made by the interviewer include participant selection, questioning, record-ing and cheating errors:
• Participant selection error occurs when interviewers select participants other than those specified by the sampling design, or in a manner inconsistent with the sampling design.
• Questioning errors denotes errors made when asking questions of the participants, or in not probing when more information is needed. For example, while asking questions an interviewer does not use the exact wording or prompts as set out in the questionnaire.
• Recording error arises due to errors in hearing, interpreting and recording the answers given by the participants. For example, a participant indicates a neutral response (unde-cided) but the interviewer misinterprets that to mean a positive response (would buy the new brand).
• Cheating error arises when the interviewer fabricates answers to a part or the whole of the interview. For example, an interviewer does not ask the sensitive questions related to a participant’s debt but later fills in the answers based on personal assessment.
Response errors made by the participant comprise errors of inability and unwillingness:
• Inability error results from the participant’s inability to provide accurate answers. Par-ticipants may provide inaccurate answers because of unfamiliarity, fatigue, boredom, question format, question content or because the topic is buried deep in the participant’s mind. An example of inability error is where a participant cannot recall the brand of toothpaste he or she purchased four weeks ago.

85Chapter 3 Research design
• Unwillingness error arises from the participant’s unwillingness to provide accurate infor-mation. Participants may intentionally misreport their answers because of a desire to pro-vide socially acceptable answers, because they cannot see the relevance of the survey and/or a question posed, to avoid embarrassment or to please the interviewer.41 For example, to impress the interviewer a participant intentionally says that he or she reads The Economist magazine.
These sources of error are discussed in more detail in subsequent chapters; what is important here is that there are many sources of error. In formulating a research design, the researcher should attempt to minimise the total error, not just a particular source. This admonition is warranted by the general tendency among naïve researchers to control sampling error by using large samples. Increasing the sample size does decrease sampling error, but it may also increase non-sampling error, e.g. by increasing interviewer errors. Non-sampling error is likely to be more problematic than sampling error. Sampling error can be calculated, whereas many forms of non-sampling error defy estimation. Moreover, non-sampling error has been found to be the major contributor to total error, whereas random sampling error is relatively small in magnitude. The point is that researchers must not lose sight of the impact of total error upon the integrity of their research design and the findings they present. A particular type of error is important only in that it contributes to total error.
Sometimes, researchers deliberately increase a particular type of error to decrease the total error by reducing other errors. For example, suppose that a mail survey is being conducted to determine consumer preferences in purchasing shoes from a chain of specialist shoe shops. A large sample size has been selected to reduce sampling error. A response rate of 30% may be expected. Given the limited budget for the project, the selection of a large sample size does not allow for follow-up mailings. Past experience, however, indicates that the response rate could be increased to 45% with one follow-up mailing and to 55% with two follow-up mailings. Given the subject of the survey, non-participants are likely to differ from participants in many features. Therefore it may be wise to reduce the sample size to make money available for fol-low-up mailings. While decreasing the sample size will increase random sampling error, the two follow-up mailings will more than offset this loss by decreasing non-response error.42
Summary A research design is a framework or plan for conducting a marketing research project. It specifies the details of how a project should be conducted in order to fulfil set research objectives. The challenge faced by researchers in developing a research design is that they need to balance an understanding of research design from the decision makers’ perspec-tive with an understanding of potential participants’ reactions to issues researched using different techniques, applied in differing contexts. Research designs may be broadly clas-sified as exploratory or conclusive. The primary purpose of exploratory research is to develop understanding and provide insights. Conclusive research is conducted to measure and describe phenomena, test specific hypotheses and examine specific relationships. Conclusive research may be either descriptive or causal. The findings from both explora-tory and conclusive research can be used as input into marketing decision making.
The major objective of descriptive research is to describe market characteristics or functions. Descriptive research can be classified into cross-sectional and longitudinal research. Cross-sectional designs involve the collection of information from a sample of population elements at a single point in time. These designs can be further classified as single cross-sectional or multiple cross-sectional designs. In contrast, in longitudinal designs repeated measurements are taken on a fixed sample. Causal research is designed for the primary purpose of obtaining evidence about cause-and-effect (causal) relation-ships. Many research designs combine techniques that can be classified as exploratory,

86 Marketing Research
descriptive and causal. In cases where there is an array of interrelating techniques, the researcher should examine the ultimate aim of an investigation, and decide what encap-sulates the overall research design – i.e. a desire to explore, describe or experiment.
A research design consists of six components, and errors can be associated with any of these components. The total error is composed of random sampling error and non-sampling error. Non-sampling error consists of non-response and response errors. Response error encompasses errors made by researchers, interviewers and partici-pants. In formulating a research design when conducting international marketing research, considerable effort is required to ensure the equivalence and comparability of secondary and primary data obtained from different countries
Questions 1 Define research design in your own words.
2 What expectations do marketing decision makers have of research designs?
3 How does the subject of a study, as seen by potential research participants, affect research design?
4 How does formulating a research design differ from developing an approach to a problem?
5 Differentiate between exploratory and conclusive research.
6 What are the major purposes for which exploratory research is conducted?
7 Describe how quantitative techniques may be used in exploratory research.
8 What are the major purposes for which descriptive research is conducted?
9 Discuss the advantages and disadvantages of access panels.
10 Compare and contrast cross-sectional and longitudinal designs.
11 Describe cohort analysis. Why is it of special interest?
12 What is a causal research design? What is its purpose?
13 What is the relationship between exploratory, descriptive and causal research?
14 What potential sources of error can affect a research design?
15 Why is it important to minimise total error rather than any particular source of error?
Exercises 1 Imagine that you are the researcher appointed by BMW and that you have been hired to conduct a study of its corporate image.
a Discuss the potential issues that may affect your choice of context in which to interview female executives who buy the 7-series cars.
b Discuss the potential issues that may affect your choice of context in which to interview teenagers whose parent(s) own a BMW.
2 Visit the website of the MRS. Browse through its Research Buyer’s Guide (www.theresearchbuyersguide.com) to get a feel for the nature of industries and marketing issues that may be supported by exploratory studies. Find the agency Brainjuicer and examine the work of this research company (www.brainjuicer.com). In what manner(s) does this agency link exploratory designs to conclusive designs?

87Chapter 3 Research design
3 Visit www.netflix.com (look for the site in your home country) and search online using your library’s online databases to gather information of consumers’ attitudes towards TV and movie streaming services. Netflix would like to determine consumers’ attitudes towards entertainment streaming services and hope to repeat this project annually. What type of research design would you recommend and why? As the marketing director of Netflix in your country, how would you use information about consumers’ attitudes towards streaming services to increase consumer sign-ups and retention?
4 Visit the website of the research organisation JD Power and Associates (www.jdpower.com). Work through its corporate site and choose a study that it has conducted. What research design was used for this study and what potential error issues could emerge given the nature of what it was investigating?
5 In a small group, discuss the following issues: ‘There are many potential sources of error in a research project. It is impossible to control all of them. Hence, all marketing research contains errors and we cannot be confident of the findings.’ And ‘If a research budget is limited, small sample sizes through exploratory studies are the best solution.’
Notes
1. Perkins, H. and Carney, P., ‘In touch with the spirit world’, ESOMAR, Consumer Insights Conference, Madrid (April 2003); Acreman, S. and Pegram, B., ‘Getting to know you’, Research (November 1999), 36–41.
2. Branthwaite, A. and Patterson, S., ‘The vitality of qualitative research in the era of blogs and tweeting: an anatomy of contemporary research methods’, ESOMAR, Qualitative, Barcelona (November 2010); Tait, B., ‘How “marketing science” undermines brands’, Admap (October, 2004), 46–8.
3. Hunt, S., ‘Objectivity in marketing theory and research’, Journal of Marketing 57 (April 1993), 71–91.
4. Roberts, D. and Adams, R., ‘Agenda development for marketing research: the user’s voice’, International Journal of Market Research 52 (3) (2010), 329–52.
5. Cooper, P., ‘In search of excellence: the evolution and future of qualitative research’, ESOMAR, Annual Congress, Berlin (September 2007); figure adapted from Cooper, P. and Branthwaite, A., ‘Qualitative technology – new perspectives on measurement and meaning through qualitative research’, Market Research Society Conference, 2nd Pre-conference Workshop, 1979.
6. Examples of research conducted on sensitive topics include: Kouznetsov, A. and Dass, M., ‘Does size matter? A qualitative study into areas of corruption where a firm’s size influences prospects for distributors of foreign-made goods in Russia’, Baltic Journal of Management 5 (1) (2010), 51–67; Vasconcelos, A.F., ‘Intuition, prayer, and managerial decision-making processes: a religion-based framework’, Management Decision 47 (6), (2009), 930–49; Yap, M.H.T. and Ineson, E.M., ‘HIV-infected employees in the Asian hospitality industry’, Journal of Service Management 20 (5) (2009), 503–20.
7. Chambers, K., ‘Lies, damn lies and sensitive topics’, Imprints (July 2004), 6.
8. Brüggen, E. and Willems, P., ‘A critical comparison of offline focus groups, online focus groups and e-Delphi’, International Journal of Market Research 51 (3) (2009), 363–81.
9. Murray, D. and Manuel, L., ‘Coming together…’, Market Research Society, Annual Conference (2008).
10. Bowman, J. ‘What the nose knows’, Research News (May 2007), 32–3.
11. Heath, R. and Feldwick, P., ‘Fifty years using the wrong model of advertising’, International Journal of Market Research 50 (1) (2008), 29–59; Gordon, W., ‘Consumer decision making’, Admap (October 2004), 74.
12. Clegg, A. ‘What do you really think?’, Marketing Week (25 November 2004), 39.
13. Bowman, J., ‘Winning people’s hearts’, Research World (January 2008) 13–14.
14. Arnal, L. and Holquin, R., ‘Taxis, vans and subways: capturing insights while commuting’, ESOMAR Qualitative Research, Paris (November 2007).
15. Yaman, H.R. and Shaw, R.N., ‘Marketing research and small travel agents: an exploratory study’, Journal of Vacation Marketing 8 (2) (2002), 127–40; Halman, I.M., ‘Evaluating effectiveness of project start-ups: An exploratory study’, International Journal of Project Management 20 (January 2002), 81.
16. Opinium Research and The London School of Economics, ‘Inside the mind of the voter’, MRS Awards (December 2013).
17. Kover, A.J., Carlson, L. and Ford, J., ‘Comments – the quant-qual debate: Where are we in advertising?’,

88 Marketing Research
International Journal of Advertising 27 (4) (2008), 659–69; Creswell, J.W., Research Design: Qualitative, Quantitative, and Mixed Method Approaches, 2nd edn (Thousand Oaks, CA: Sage, 2002); Lee, H., Lindquist, J.D. and Acito, F., ‘Managers’ evaluation of research design and its impact on the use of research: An experimental approach’, Journal of Business Research 39 (3) (July 1997), 231–40; Wilson, R.D., ‘Research design: Qualitative and quantitative approaches’, Journal of Marketing Research 33 (2) (May 1996), 252–5.
18. For examples of descriptive research, see Lindstrand, A. and Lindbergh, J., ‘SMEs’ dependency on banks during international expansion’, International Journal of Bank Marketing 29 (1) (2010), 65–83; Robinson, W.Y., ‘Is the first to market the first to fail?’, Journal of Marketing Research 39 (1) (February 2002), 120–28; Song, S.M. and Perry, M.E., ‘The determinants of Japanese new product success’, Journal of Marketing Research 34 (February 1997), 64–76.
19. Bakken, D., ‘Renewing the original bonds – let’s put psychology back into market research (and marketing!)’, ESOMAR Annual Congress, London (September 2006).
20. Zagórski, K., ‘Life cycle, objective and subjective living standards and life satisfaction: New indexes building and applications, Poland, 1992–2004’, ESOMAR, Public Sector Research, Berlin (May 2004).
21. Yang, K. and Jolly, L.D., ‘Age cohort analysis in adoption of mobile data services: Gen Xers versus baby boomers’, Journal of Consumer Marketing 25 (5) (2008), 272–80; Creswell, J., Research Design: Qualitative, Quantitative, and Mixed Method Approaches, 2nd edn (Thousand Oaks, CA: Sage, 2002); Misra, R. and Panigrahi, B., ‘Changes in attitudes toward women: a cohort analysis’, International Journal of Sociology & Social Policy 15 (6) (1995), 1–20; Glenn, N.D., Cohort Analysis (Beverly Hills, CA: Sage, 1981).
22. Gayen, K., McQuaid, R. and Raeside, R., ‘Social networks, age cohorts and employment’, International Journal of Sociology and Social Policy 30 (5/6) (2010), 219–38; Rentz, J.O., Reynolds, F.D. and Stout, R.G., ‘Analyzing changing consumption patterns with cohort analysis’, Journal of Marketing Research 20 (February 1983), 12–20; see also Rentz, J.O. and Reynolds, F.D., ‘Forecasting the effects of an aging population on product consumption: An age-period-cohort framework’, Journal of Marketing Research (August 1991), 355–60.
23. Zagórski, K., ‘Life cycle, objective and subjective living standards and life satisfaction: New indexes building and applications, Poland, 1992–2004’, ESOMAR, Public Sector Research, Berlin (May 2004).
24. Otker, T. and van Leeuwen, H., ‘WOM’, Research World (September 2006), 36.
25. Reichheld, F.F., The Loyalty Effect: The Hidden Force Behind Growth, Profits, and Lasting Value (Boston, MA: Harvard Business School Press, 2001).
26. For example, see Tinson, J., Nancarrow, C. and Brace, I., ‘Purchase decision making and the increasing significance of family types’, Journal of Consumer Marketing 25 (1) (2008), 45–56; Elrod, T. and Keane, M.P., ‘A factor-analytic probit model for representing the market structure in panel data’, Journal of Marketing Research 32 (February 1995), 1–16.
27. De Wulf, K., Friedman, M. and Borggreve, B., ‘Pavlov revisited – comparing panel conditioning and quality between panel methods’, ESOMAR Panel Research, Dublin (October 2008); Michaelsen, F., ‘A quick ABC of panels’, Research World (February 2005), 27.
28. de Jong, K., ‘CSI Berlin: The strange case of the death of panels’, ESOMAR Online Research, Berlin (October 2010).
29. Table 3.7 can also be viewed as a transition matrix. It depicts the brand-buying changes from period to period. Knowing the proportion of consumers who switch allows for early prediction of the ultimate success of a new product or change in market strategy.
30. Rindfleisch, A., Malter, A.J., Ganesan, S. and Moorman, C., ‘Cross-sectional versus longitudinal survey research: concepts, findings and guidelines’, Journal of Marketing Research 45 (3) (June 2008), 261–79; de Vaus, D., Research Design, 4 vols (Thousand Oaks, CA: Sage, 2005); Brannas, K., ‘A new approach to modelling and forecasting monthly guest nights in hotels’, International Journal of Forecasting 18 (1) (January–March 2002), 19; Coupe, R.T. and Onudu, N.M., ‘Evaluating the impact of CASE: An empirical comparison of retrospective and cross-sectional survey approaches’, European Journal of Information Systems 6 (1) (March 1997), 15–24.
31. Brewer, J., Foundations of MultiMethod Research (Thousand Oaks, CA: Sage, 2005); Taris, T.W., A Primer in Longitudinal Data Analysis (Thousand Oaks, CA: Sage, 2001); Van Den Berg, D.G., Lindeboom, M. and Ridder, G., ‘Attribution in longitudinal panel data and the empirical analysis of dynamic labour market behaviour’, Journal of Applied Econometrics 9 (4) (October–December 1994), 421–35; Winer, R.S., ‘Attrition bias in econometric models estimated with panel data’, Journal of Marketing Research 20 (May 1983), 177–86.
32. De Wulf, K. and Berteloot, S., ‘Challenging conventional wisdom’, Research World (January 2008), 44.
33. Pearson, C. and Kateley, V., ‘Why are we trying to create new communities for market research purposes? A case study comparing learnings from an existing community vs. a research panel’, ESOMAR Online Research, Berlin (October 2010); Lee, J.K.H., Sudir, K. and Steckel, J.H., ‘A multiple ideal point model: Capturing multiple preference effects from within an ideal point framework’, Journal of Marketing Research 39 (1) (February 2002), 73–86; Maytas, L. and Sevestre, P. (eds), The Econometrics of Panel Data: A Handbook of the Theory with Applications (Norwell, MA: Kluwer Academic, 1996).
34. Murphy, D., ‘More efficiency and integration of data’, Research World (February 2005), 29.
35. Huertas-Garcia, R. and Consolación-Segura, C., ‘Using statistical design experiment methodologies to identify customers’ needs’, International Journal of Market Research 51 (1) (2009), 115–36; Hulland, J., Ho, Y. and Lam, S., ‘Use of causal models in marketing research: A review’, International Journal of Research in Marketing 13 (2) (April 1996), 181–97; see also Cox, K.K. and Enis, B.M., Experimentation for Marketing Decisions (Scranton, PA: International Textbook, 1969), 5.
36. Ryals, L. and Wilson, H., ‘Experimental methods in market research: from information to insight’,

89Chapter 3 Research design
International Journal of Market Research 47 (4) (2005), 345–64; Winer, R.S., ‘Experimentation in the 21st century: the importance of external validity’, Journal of the Academy of Marketing Science (Summer 1999), 349–58.
37. Mariampolski, H., Wolf, S. and Luigi, T., ‘Americans and Italians face each other at dinner’, Research World (January 2006), 32–3.
38. KPMG Nunwood, ‘NatWest: A great call for financial services’, MRS Awards Finalist (December 2015).
39. Poynter, R., ‘A taxonomy of new MR’, Market Research Society, Annual Conference (2010); Lee, E., ‘Are consumer survey results distorted? Systematic impact of behavioural frequency and duration on survey response errors’, Journal of Marketing Research (February 2000), 125–33; Dutka, S. and Frankel, L.R., ‘Measuring response error’, Journal of Advertising Research 37 (1) (January/February 1997), 33–9.
40. van Meurs, L., van Ossenbruggen, R. and Nekkers, L., ‘Do rotten apples spoil the whole barrel? Exploring quality issues in panel data’, ESOMAR Panel Research,
Orlando (October 2007); Loosveldt, G., Carton, A. and Billiet, J., ‘Assessment of survey data quality: A pragmatic approach focused on interviewer tasks’, International Journal of Market Research 46 (1) (2004), 68.
41. Blyth, B., ‘Mixed mode: The only “fitness” regime?’, International Journal of Market Research 50 (2) (2008), 241–66; Brooks, D.V., ‘A hands on approach to response rates’, Imprints (October 2003), 24.
42. Manfreda, K.L., Bosnjak, M., Berzelak, J., Haas, I. and Vehovar, V., ‘Web surveys versus other survey modes: A meta-analysis comparing response rates’, International Journal of Market Research 50 (1) (2008), 79–104; Sinha, P., ‘Determination of reliability of estimations obtained with survey research: A method of simulation’, International Journal of Market Research 42 (3) (Summer 2000), 311–18; Rollere, M.R., ‘Control is elusive in research design’, Marketing News 31 (19) (15 September 1997), 17; Corlett, T., ‘Sampling errors in practice’, Journal of the Market Research Society 38 (4) (April 1997), 307–18.

Secondary data collection and analysis
The act of sourcing, evaluating
and analysing secondary data
can realise great insights for
decision makers. It is also vital
to successful problem
diagnosis, sample planning and
collection of primary data.
Stage 1
Problem definition
Stage 2
Research approach developed
Stage 3
Research design
developed
Stage 4
Fieldwork or data
collection
Stage 5
Data integrity
and analysis
4
Stage 6
Communicating research findings

91Chapter 4 Secondary data collection and analysis
Objectives
After reading this chapter, you should be able to:
1 define the nature and scope of secondary data and distinguish secondary data from marketing intelligence and primary data;
2 analyse the advantages and disadvantages of secondary data and their uses in the various steps of the marketing research process;
3 evaluate secondary data using the criteria of specifications, error, currency, objectives, nature and dependability;
4 describe in detail the different sources of secondary data, focusing upon external sources in the form of published materials and syndicated services;
5 discuss in detail the syndicated sources of secondary data, including household and consumer data obtained via surveys, purchase and media panels and scanner services, as well as institutional data related to retailers and industrial or service firms;
6 explain the need to use multiple sources of secondary data and describe single-source data;
7 understand the researchers’ challenges in coping with the burgeoning amount of externally generated secondary data;
8 appreciate how social media research techniques are integrating with traditional forms of research, and the impact upon what may be defined as secondary data.
The collection and analysis of secondary data helps to define the marketing research problem and develop an approach. In addition, before collecting primary data, the researcher should locate and analyse relevant secondary data. Thus, secondary data should be an essential component of a successful research design. Secondary data can help in sample designs and in the details of primary research methods. In some projects, research may be largely confined to the analysis of secondary data because some marketing problems may be resolved using only secondary data.
This chapter discusses the distinction between primary data, secondary data and marketing intelligence. The advantages and disadvantages of secondary data are considered, and criteria for evaluating secondary data are presented, along with a classification of secondary data. Internal secondary data are described and major sources of external secondary data, such as published materials, online and offline databases and syndicated services, are also discussed. Using secondary data in international marketing research is covered. Several ethical issues that arise in the use of secondary data are identified. The impact of the growth and development of secondary data sources on the web will also be evaluated.
To begin with, we present an example that illustrates how secondary data were used in a research design for the Virgin brand.
Overview
Real research A 21st-century approach to brand development1
As a leading global brand, Virgin has created more than 200 companies in 29 different countries. Virgin brands are independent businesses, empowered to run themselves but united by Virgin’s brand values of being fun, innovative, challenging and offering great service and value for the customer. The lack of management layers and bureaucracy cre-ates an optimum ‘start-up’ atmosphere, backed up by the support of a wider ‘family’ of

92 Marketing Research
Defining primary data, secondary data and marketing intelligence
Primary data are data originated by a researcher for the specific purpose of addressing the problem at hand. They are individually tailored for the decision makers of organisations that pay for well-focused and exclusive support. Compared with readily available data from a variety of sources, this exclusivity can mean higher costs and a longer time frame in collect-ing and analysing the data.
Secondary data are data that have already been collected for purposes other than the problem at hand. At face value, this definition seems straightforward, especially when con-trasted to the definition of primary data. However, many researchers confuse the term, or quite rightly see some overlap, with marketing intelligence.
Marketing intelligence can be defined as ‘qualified observations of events and develop-ments in the marketing environment’. The use of the word ‘observations’ is presented in a wide sense to include a variety of types of data, broadly concerned with ‘environmental scanning’.2 In essence, though, marketing intelligence is based upon data that in many instances have been collected for purposes other than the problem at hand. To clarify this overlap in definitions, Table 4.1 compares secondary data with marketing intelligence through a variety of characteristics.
Primary dataData originated by the researcher specifically to address the research problem.
Secondary dataData previously collected for some purpose other than the problem at hand.
Marketing intelligenceQualified observations of events and developments in the marketing environment.
brands operating as a community to support and challenge each other. As such, the Virgin brand can mean many things to many different people. Virgin had an intuitive feel for what this was but lacked any firm evidence of the Virgin brands supporting each other. Measuring the equity of the Virgin brand required a customised approach to assess the impact of the brand at both industry and Virgin-group level. Virgin needed a research solution that would move beyond a ‘recap’ of the brand health and provide a roadmap to increase consumer engagement, support new category entry and, ulti-mately, generate a tangible return for the business. With the opportunity of a new phase of research, Virgin wanted to throw away the rule book, creating a programme of brand evaluation that would help Virgin ‘join the dots’ across its family of brands and harness the voice of the consumer in a more intuitive way. The research had to balance the need for ongoing tracking and global benchmarking research, while delivering an increased understanding of the consumer. A new phase of research always generates debate, and in an organisation such as Virgin there was no shortage of ideas for moving things for-ward, shaking things up and challenging the status quo. A balance was required to ensure the great ideas and insights from previous work were not ignored. It was extremely important to move this phase of research forward without throwing away the ideas and insights that the brand team and wider research users had been using effec-tively. There were three key phases: (1) reviewing historical research (both in terms of past reports and in an engagement in the ‘stories’ that surround past research); (2) evalu-ating internal and external secondary data sources; and (3) in-depth interviews with Virgin executives and executives from supporting agencies. Searching for past research and secondary data beyond the Virgin brand team to agency partners presented further resources to explore. They worked through Mullen’s (a full-service integrated advertising agency, www.mullen.com) internal resources, which in turn provided access to Simmons’ (www.simmonssurvey.com) psychographic profiling and media databases. Utilising sec-ondary data was a critical step in creating not simply a brand research review, but a dynamic brand research ‘resource’ that could provide more versatile elements of brand research, which could be used directly to target Virgin customers.

93Chapter 4 Secondary data collection and analysis
Table 4.1 A comparison of secondary data and marketing intelligence3
Characteristic Secondary data Marketing intelligence
Structure Specifications and research design tend to be apparent
Can be poorly structured; no universal conventions of reporting
Availability Tend to have regular updates Irregular availability
Sources Generated in-house and from organisations with research prowess
Generated in-house and from unofficial sources, especially through social media
Data type Tend to be quantitative; many issues need qualitative interpretation
Tends to be qualitative; many issues difficult to validate and quantify
Source credibility Tend to be from reputable and trustworthy research sources
Questionable credibility; can be generated from a broad spectrum of researchers and authors
Terms of reference Tend to have clear definitions of what is being measured
Ambiguous definitions; difficult to compare over different studies
Analysis Mostly conventional quantitative techniques Opinion based, interpretative
Ethics In-company data gathering may be covered by Data Protection Acts; externally generated data may be covered by research codes of conduct, e.g. ESOMAR
Some techniques may be seen as industrial espionage – though there is an ethical code produced by the Society of Competitive Intelligence Professionals
Note in these comparisons the repeated use of the word ‘tend’. The boundaries between the two are not absolutely rigid. As will become apparent in this chapter, there are clear cri-teria for evaluating the accuracy of secondary data, which tend to be of a quantitative nature. Marketing intelligence is more difficult to evaluate but this does not mean that it has less value to decision makers or researchers. Certain marketing phenomena cannot be formally measured: researchers may not be able to gain access to conduct research, or the rapid unfolding of events means that it is impracticable to conduct timely research.
Real research Gathering marketing intelligence in China4
The very nature of marketing intelligence gathering means that much of what research-ers discover is often new and surprising. This is particularly true of intelligence gathering in China, where the rapid changes in the commercial landscape mean changes to com-mercial structures and processes, and projections, happen very quickly; an industry report can be out of date within six months. Some of the challenges that are faced in gathering marketing intelligence in China include the following:
• Access to Western internet services within China, including Facebook and Google, is restricted or blocked by China’s Golden Shield Project (often referred to by the media as the ‘Great Firewall’), which controls access to internet traffic in and out of China. Because of the scale and size of the Chinese marketplaces, China has now developed its own social media ecosystem and marketing researchers should be careful to understand the effective local sources of data (see Chapter 17 for more details).
• Protecting information is part of the culture, as is a reluctance to be the one blamed for losing information. There is little incentive for a typical purchasing or operations manager or government employee to provide information to an

94 Marketing Research
Many major organisations invest huge amounts in the hardware and software needed for a systematic approach to gathering intelligence, some even engaging in the use of ‘shadow teams’. A shadow team is a small, cross-functional, boundary-spanning group that learns everything about a competitive unit. A competitive unit can be a competitor, product line, supply chain or prospective partner in a strategic alliance. The objective of a shadow team is to learn everything possible about its target through published data, personnel and network connection and organisation knowledge or hearsay. It brings together knowledge from across an organisation, so that it can think, reason and react like the competitive unit.5 (Com-petitive intelligence will be discussed in more detail in the context of business-to-business marketing research in Chapter 29.)
Such widespread use of intelligence in major organisations means it has a role to play in supporting decision makers, but it has many limitations, which are apparent in Table 4.1. In the development of better-founded information support, credible support can come from the creative collection and evaluation of secondary data. This requires researchers to connect and validate different data sources, ultimately leading to decision-maker support in its own right, and support of more focused primary data collection. As this chapter and Chapter 5 unfold, examples of different types of secondary data will emerge and the applications of secondary data will become apparent.
Shadow teamA small, cross-functional, boundary-spanning group that learns everything about a competitive unit.
external party. There is potential risk associated in passing on information, and since marketing research is relatively new in China, interviewers have to be more reassuring about how ‘normal’ the process is in order to facilitate meetings, inter-views and informative responses.
• Research participants can be from a wide variety of social and educational backgrounds, but all can be working in the same district. This phenomenon is particularly apparent in the ‘1st-tier cities’, as Beijing, Shanghai, Shenzhen and Guangzhou are collectively known. There is a complex convergence of those with money and international experi-ence, those with money but no international experience and those with very little money and no experience outside one small area of the country. When this diverse combination occurs within one family, it causes specific challenges to researchers. In marketing intelligence gathering, the progression from very low knowledge and aware-ness of international influences on an industry to full awareness happens very fast.
• Fragmented industries and a vast country means hundreds of local marketplaces abound. Extracting comment on the nature of one industry across the country is unre-alistic, and so it is for the researcher to merge the jigsaw pieces from across the country to build a national picture. A senior manager in a company in Zhejiang will often assume automatically that we are speaking only about the Zhejiang province when posed questions about the development of the industry in the coming five years.
Advantages and uses of secondary data
Secondary data offer several advantages over primary data. Secondary data are easily acces-sible, relatively inexpensive and quickly obtained. Some secondary data sources can be accessed free of charge, but many sources do charge fees to reflect the investment made to gather, analyse and present accurate information. Nonetheless, with the availability of freely available data (of variable quality and integrity), there are suggestions that government-sourced secondary data should be freely available, as argued in the following example.

95Chapter 4 Secondary data collection and analysis
Real research Free our data6
Marketers make extensive use of information that is collected by governments. In recent years the pressure has mounted for public data to be more freely available in order to stimulate innovation. Many businesses rely on accurate secondary data to make better business decisions, especially in targeting new markets. In doing this, they can draw on an array of government datasets and surveys. These data have the particular advantage of having a consistent national coverage, being relatively unbiased and created to high research standards. Examples of a number of UK-based government suppliers include:
• Office for National Statistics – especially for the Census and large-sample surveys
• Post Office – the Postcode Address File
• Ordnance Survey – grid references, map background and boundaries
• Land Registry – house prices
• Companies House – details of businesses.
Other countries have also developed an interest in the wide use of open data including France (www.data.gouv.fr), Germany (www.govdata.de) and many more, which are available via the EU Open Data portal (www.publicdata.eu). It has been argued that as public information is often collected at taxpayers’ expense, the barriers to its widespread use should be removed wherever possible. Users will have better information – a step towards the ‘perfect knowledge’ assumed in economists’ views of perfect markets.
Some secondary data, such as those provided by the National Censuses, are available on topics where it would not be feasible for a firm to collect primary data. Although it is rare for secondary data to provide all the answers to a non-routine research problem, such data can be useful in a variety of ways.7 Secondary data can help to:
1 Diagnose the research problem.
2 Develop an approach to the problem.
3 Develop a sampling plan.
4 Formulate an appropriate research design (e.g. by identifying the key variables to meas-ure or understand).
5 Answer certain research questions and test some hypotheses.
6 Interpret primary data with more insight.
7 Validate qualitative research findings.
Given these advantages and uses of secondary data, we state the following general rule:
Examination of available secondary data is a prerequisite to the collection of pri-mary data. Start with secondary data. Proceed to primary data only when the sec-ondary data sources have been exhausted or yield marginal returns.
The rich dividends obtained by following this rule are illustrated in the example at the start of this chapter. It shows that the collection and analysis of even one relevant secondary data source can provide valuable insights. The decision maker and researcher can use the ideas generated in secondary data as a very strong foundation to primary data design and collec-tion. However, the researcher should be cautious in using secondary data, because they have some limitations and disadvantages.

96 Marketing Research
Disadvantages of secondary data
Because secondary data have been collected for purposes other than the problem at hand, their usefulness to the current problem may be limited in several important ways, including relevance and accuracy. The objectives, nature and methods used to collect the secondary data may not be appropriate to the present situation. Also, secondary data may be lacking in accuracy or may not be completely current or dependable. Before using secondary data, it is important to evaluate them according to a series of factors. These factors are discussed in more detail in the following section.
Criteria for evaluating secondary data
The quality of secondary data should be routinely evaluated, using the criteria presented in Table 4.2 and the discussion in the following sections.
Table 4.2
Criteria Issues Remarks
Specifications and research design • Data collection method
• Response rate
• Population definition
• Sampling method
• Sample size
• Questionnaire design
• Fieldwork
• Data analysis
Data should be reliable, valid and generalisable to the problem at hand
Error and accuracy Examine errors in:
• Approach
• Research design
• Sampling
• Data collection
• Data analysis
• Reporting
Assess accuracy by comparing data from different sources
Currency Time lag between collection and publication; frequency of updates
Census data are periodically updated by syndicated firms
Objective Why the data were collected The objective will determine the relevance of data
Nature • Definition of key variables• Units of measurement• Categories used• Relationships examined
Reconfigure the data to increase their usefulness, if possible
Dependability Source:• Expertise• Credibility• Reputation• Trustworthiness
Preference should be afforded to an original rather than an acquired source
Criteria for evaluating secondary data

97Chapter 4 Secondary data collection and analysis
Specifications: research design and how the data were collected
The specifications of the research design used to collect the data should be critically exam-ined to identify possible sources of bias. Such design considerations include size and nature of the sample, response rate and quality, questionnaire design and administration, procedures used for fieldwork and data analysis and reporting procedures. These checks provide infor-mation on the reliability and validity (concepts developed in Chapter 13) of the data and help determine whether they can be generalised to the problem at hand. The reliability and valid-ity can be further ascertained by an examination of the error, currency, objectives, nature and dependability associated with the secondary data.
Error: accuracy of the data
The researcher must determine whether the data are accurate enough for the purposes of the present study. Secondary data can have a number of sources of error or inaccuracy, including errors in the approach, research design, sampling, data collection, analysis and reporting stages of the project. Moreover, it is difficult to evaluate the accuracy of secondary data because the researcher did not participate in the research. One approach is to find multiple sources of data, if possible, and compare them using standard statistical procedures.
Real research Measuring media on the internet8
Gone are the days of the internet being a col-lection of static web pages. Now it extends across almost every platform and is inter-twined with nearly every medium. TV, radio and mobile are now directly connected with the internet. Such is the change that the terms ‘TV’ and ‘radio’ are fast becoming redundant, in exchange for the terms ‘video’ and ‘audio’, as the English language evolves to keep up. The fragmentation of media has created more niche audiences than ever before; they are constantly dividing, subdividing and regroup-ing in many different forms at different levels on a national, even global scale. Publishers and broadcasters are now media companies with a mixed-content offering. The effects of the fragmentation of media have made it increasingly challenging for sample-based research to measure these fragmented audiences accurately. For instance, there might be 1,000 people a month who are regularly visiting a blog on gardening. These people have distinct interests and needs, and may well be a very valuable audience; however, in countries with populations of millions, these people are simply not being picked up. Publishers report their online traffic through ABCe (www.abc.org.uk; ABC is owned by the media industry and ABCe independently verifies and reports on media performance, providing trusted traffic and related data across a broad range of digital platforms). These industry-agreed standards are a step forward, as greater transparency will better inform advertisers and media agencies in their decisions when allocating advertising budgets. However, the development of the internet has brought a host of new opportu-nities and challenges for measuring the internet in the shape of blogs, video, audio, RSS feeds, podcasts, and so the list goes on. The TV, radio and mobile industry sectors are making positive steps to establish industry-backed measurement standards to help quantify online audiences. Broadcasters have been swift to make moves to measure video delivered over the internet. Major broadcasters have come together to form the

98 Marketing Research
As the above example indicates, the accuracy of secondary data can vary. What is being meas-ured? What rules apply to those measurements? What happens if there are rapid changes in what is being measured? With different researchers potentially measuring the ‘same’ phenomena, data obtained from different sources may not agree. In these cases, the researcher should verify the accuracy of secondary data by conducting pilot studies, or by other exploratory work that verifies the analytical framework used to arrive at certain figures. Often, by judicious questioning of those involved in compiling the figures, this can be done without much expense or effort.
Currency: when the data were collected
Secondary data may not be current, and the time lag between data collection and publication may be long, as is the case with many census data, which may take up to two years from col-lection to publication. Moreover, the data may not be updated frequently enough for the purpose of the problem at hand. Decision makers require current data; therefore, the value of secondary data is diminished as they become older. For instance, although the Census of Population data are comprehensive, they may not be applicable to major cities in which the population has changed rapidly during the last two years.
Objective: the purpose for which the data were collected
Data are invariably collected with some objective in mind, and a fundamental question to ask is why the data were collected in the first place. The objective for collecting data will ultimately determine the purpose for which that information is relevant and useful. Data collected with a specific objective in mind may not be appropriate in another situation. Working with our open-ing example, suppose that the magazine Inside Flyer (www.insideflyer.com) conducted a sur-vey where the sample was made up of ‘frequent flyers’. The objective of the study could be ‘to uncover the airline characteristics consumers consider most important’. Virgin, however, may wish to target ‘business-class’ flyers and ‘to uncover perceptions related to trade-offs made in customer service–price–safety’. Even though there may be identical questions used in both surveys, the target participants may be different, the rationale for the study presented to partici-pants will be different and, ultimately, the ‘state of mind’ that participants may be in when they come to comparable questions will be different. The Inside Flyer survey would be conducted for entirely different objectives from those Virgin has for its study. The findings from the Inside Flyer survey may not directly support decision making at Virgin, though they may help to define who Virgin should talk to and what questions it should put to them.
Nature: the content of the data
The nature, or content, of the data should be examined with special attention to the definition of key variables, the units of measurement, the categories used and the relationships
BMWG (Broadband Measurement Working Group) to develop a common approach for measuring online video content to deliver accountability to rights holders. Broadcasters clearly feel that video over the internet has reached a point where a reliable measure-ment tool is needed. This is particularly important for commercial broadcasters, who are investing a great deal in developing a variety of video-on-demand services and will need to generate revenue from video advertising to sustain their businesses. The internet is a global medium, and so the international implications cannot be ignored. In fact, global measurement structures are helpful. The International Federation of Audit Bureaux of Circulation (IFABC) (www.ifabc.org) draws together ABCe’s sister organisations across the globe to implement constructive international measurement initiatives.

99Chapter 4 Secondary data collection and analysis
examined. If the key variables have not been defined, or are defined in a manner inconsistent with the researcher’s definition, then the usefulness of the data is limited. Consider, for example, secondary data on consumer preferences for TV programmes. To use this informa-tion, it is important to know how preference for programmes was defined. Was it defined in terms of the programme watched most often, the one considered most needed, most enjoya-ble, most informative, or the programme of greatest service to the community?
Likewise, secondary data may be measured in units that may not be appropriate for the current problem. For example, income may be measured by individual, family, household or spending unit and could be gross or net after taxes and deductions. Income may be classified into categories that are different from research needs. If the researcher is interested in high-income consumers with gross annual household incomes of over €120,000, secondary data about those with income categories of less than € 20,000, € 20,001−50,000, € 50,001−75,000 and more than € 75,000 will not be of much use. Determining the measurement of variables such as income may be a complex task, requiring the wording of the definition of ‘income’ to be precise. Finally, the relationships examined should be taken into account in evaluating the nature of data. If, for example, actual behaviour is of interest, then data inferring behaviour from self-reported attitudinal information may have limited usefulness. Sometimes it is pos-sible to reconfigure the available data – for example, to convert the units of measurement – so that the resulting data are more useful to the problem at hand.
Dependability: how dependable are the data?
An overall indication of the dependability of data may be obtained by examining the exper-tise, credibility, reputation and trustworthiness of the source. This information can be obtained by checking with others who have used the information provided by the source. Data pub-lished to promote sales, to advance specific interests, or to carry on propaganda should be viewed with suspicion. The same may be said of data published anonymously or in a form that attempts to hide the details of the data collection research design and process. It is also pertinent to examine whether the secondary data came from an original source (one that gen-erated the data), or an acquired source (one that procured the data from an original source and published them in a different context). Generally, secondary data should be secured from an original rather than an acquired source. There are at least two reasons for this rule: first, an original source is the one that specifies the details of the data collection research design; and, second, an original source is likely to be more accurate and complete than a surrogate source.
Classification of secondary data
Figure 4.1 presents a classification of secondary data. Secondary data may be classified as either internal or external. Internal data are those generated within the organisation for which the research is being conducted. An example of this source of data for any marketing decision maker and researcher is the corporate revenue ledger at individual transaction level. Analyses of who is buying and the different ways that these customers may be classified or segmented, what they bought, how frequently and the monetary value of their purchases, can give a basic level of understanding customer buying behaviour. With a number of years of transaction data, the life-stages of customer segments can be better understood and how cus-tomers have reacted to an array of marketing activities. One of the main problems that researchers face with accessing and analysing transaction data is ‘corporate territorialism’, i.e. the attitude that each department should only be concerned with the operational data it needs for the business to run on a day-to-day basis.9 (Given the growth and significance of this element of marketing decision support, secondary data generated from internal sources will be examined in more detail in Chapter 5.)
Internal dataData available within the organisation for which the research is being conducted.

100 Marketing Research
External data, on the other hand, are those generated by sources outside the organisation. These data may exist in the form of published material, online databases, or information made available by syndicated services. Externally generated secondary data may be more difficult to access, more expensive and more difficult to evaluate for accuracy, in compari-son with internal secondary data. These factors mean that, before collecting external second-ary data, it is vital to gather, analyse and interpret any readily available internal secondary data and intelligence.
External dataData that originate outside the organisation.
Figure 4.1
A classification of secondary data
Computeriseddatabases
Publishedmaterials
Syndicatedservices
Internal
Readyto use
Requiresfurther
processing
Secondarydata
External
Published external secondary sources
Sources of published external secondary data include local authorities, regional and national governments, the EU, non-profit organisations (e.g. Chambers of Commerce), trade associa-tions and professional organisations, commercial publishers, investment brokerage firms and professional marketing research firms.10 In fact, such a quantity of data is available that the researcher can be overwhelmed. Therefore, it is important to classify published sources (see Figure 4.2). Published external sources may be broadly classified as general business data or government data. General business sources comprise guides, directories, indexes and statisti-cal data. Government sources may be broadly categorised as census data and other publica-tions. These data types are discussed further, with specific sources used as examples.
General business sources
Businesses publish a lot of information in the form of books, periodicals, journals, news-papers, magazines, reports and trade literature. Although some information may be in hard copy, an increasingly large volume of information is now available through databases that can be easily accessed online. Sources are also available to identify statistical data.
1 Guides. Guides are an excellent source of standard or recurring information. A guide may help identify other important sources of directories, trade associations and trade publications,

101Chapter 4 Secondary data collection and analysis
so guides are one of the first sources a researcher should consult when commencing research. Libraries, whether these be public, at universities or within businesses, will have a guide to classify the resources they hold. Within library holdings will be databases such as WARC (www.warc.com), which compiles industry-based data and commentary to support market-ers, communications and research professionals. Commercial guides can be used to assist decision makers or researchers to uncover current issues and sources regarding individual industries or countries. An example of one of these would be the Datamonitor guides (search for ‘guides’ on www.datamonitor.com). Another example is the @BRINT guide to business technology management and knowledge management sites with editorial comments (www.brint.com).
2 Directories. Directories are helpful for identifying individuals or organisations that col-lect specific data. Examples of directories used by researchers are the Hollis directories that support the industries of sponsorship and public relations (www.hollis-sponsorship.com; www.hollis-pr.com).
Figure 4.2
A classification of published secondary sources
Directories Indexes Statistical dataGuides
Published secondary data
Generalbusinesssources
Governmentsources
Othergovernment data
Census data
Real research Hollis-PR.com
For more than 40 years Hollis has been the public relations world’s major information provider, publishing the market-leading directories, such as Hollis UK PR Annual, Hollis Europe and Hollis-PR.
Hollis-PR.com is a gateway to PR information requirements. It has a search engine that enables researchers to:
• Find a PR consultancy – to find the ideal agency partner.
• Source an in-house PR contact – through subscription – with access to 7,788 in-house PR contacts.
• Locate a specialist service – a free supplier search to locate specialist support.
• Search for a UK media contact – through subscription – with access to a UK media database for newspapers, magazines and broadcast media.

102 Marketing Research
Another example is Europages, a reference business directory in Europe, which classi-fies 23 million companies in 35 European countries, in 26 languages (www.europages.com). Other directories worth exploring include www.bizeurope.com and ESOMAR’s Directory of Research Organisations (http://directory.esomar.org).
3 Non-governmental statistical data. Business research often involves compiling statistical data reflecting market or industry factors. A historic perspective of industry participation and growth rates can provide a context for market-share analysis. Market statistics related to popu-lation demographics, purchasing levels, TV viewership and product usage are some of the types of non-governmental statistics available from secondary sources. As well as any pub-lished commentary presented in these resources, further statistical analyses and graphical manipulations can be performed on these data to draw important insights. Examples of non-governmental statistical data include trade associations such as the Swedish Tourism Trade Association (www.sverigeturism.se). The Swedish Information ‘Smorgasbord’ is a large sin-gle source of information in English on Sweden, Swedish provinces, nature, culture, lifestyle, society and industry. Other examples include Euromonitor (www.euromonitor.com), which publishes monthly market research journals covering a great breadth of industries and coun-tries across the world. Keynote (www.keynote.co.uk) produces reports focusing on European markets, built upon a combination of primary data collection and other secondary data sources.
The United Nations provides an example of an organisation with a Statistics Division that provides a wide range of statistical outputs on a global basis (http://unstats.un.org). The Sta-tistics Division produces printed publications of statistics and statistical methods in the fields of international merchandise trade, national accounts, demography and population, social indicators, gender, industry, energy, environment, human settlements and disability. The Statistics Division also produces general statistical compendiums, including the Statistical Yearbook and World Statistics Pocketbook.
Government sources
European governments and the EU also produce large amounts of secondary data. Each Euro-pean country has its own statistical office, which produces lists of the publications available (and the costs involved). Examples of national statistical offices include the Centraal Bureau voor de Statistiek Nederlands (www.cbs.nl), Danmarks Statistik (www.dst.dk), the Federal Statistical Office of Germany (www.destatis.de), the French Institut National de la Statistique et des Études Economiques (www.insee.fr) and the British Office for National Statistics (www.statistics.gov.uk). All of these links allow you to examine quickly the array of publications that they produce. Their publications may be divided into census data and other publications.
1 Census data. Most European countries produce either catalogues or newsletters that describe the array of census publications available and the plans for any forthcoming census. In the UK, for example, www.ons.gov.uk/ons/guide-method/census/2011/index.html contains the latest information about the 2011 Census in England and Wales. Census Marketing in Britain can supply unpublished data from the 1961, 1971, 1981, 1991 and 2001 Censuses in the form of Small Area Statistics (SAS). SAS are available for standard census areas within England and Wales, such as counties, local government districts, London boroughs, wards, civil par-ishes and enumeration districts. Maps can also be purchased to complement the data.
Census data can be kept in electronic format, allowing them to be analysed and pre-sented in a variety of formats at a detailed geographical level. Given the long periods between the national censuses and the amount of change that can occur in these periods, other data sources are used to maintain an up-to-date picture of specific regions.
2 Other government publications. In addition to the censuses, national statistical offices collect and publish a great deal of statistical data. As well as general population censuses, national statistical offices produce an array of nationally relevant statistics. The value of

103Chapter 4 Secondary data collection and analysis
these may lie in evaluating and describing markets and operating environments and the challenges and opportunities these hold. The British Office for National Statistics covers areas that include: agriculture and environment; children, education and skills; crime and justice; the economy; government; health and social care; the labour market; people and places; the population; and travel and transport. Business and energy statistics may be viewed at www.statistics.gov.uk/hub/business-energy/.
Examples of reports from the British Office for National Statistics include Social Trends, drawing together social and economic data from a wide range of government departments and other organisations. This report provides a comprehensive guide to British society today, and how it has been changing.
Real research UK citizens rate health care relatively highly compared with the rest of the EU
An established reference source, Social Trends, draws together social and economic data from a wide range of government departments and other organisations; it paints a broad picture of British society today, and how it has been changing. There are 13 chapters, each focusing on a different social policy area, described in tables, figures and text: pop-ulation; households and families; education and training; labour market; income and wealth; expenditure; health; social protection; crime and justice; housing; environment; transport; and lifestyles and social participation. The zip file provides links to Excel spreadsheets that contain the data for each table, figure and map. An example of the output is encapsulated in the following extract from Social Trends News Release:
Date: 11 November 2010 Coverage: United Kingdom Theme: Social and Welfare
UK men born in 2007 could expect to live 1.6 years longer than the ‘average man’ in the EU-27, according to a report published today by the Office for National Statistics. How-ever, women could expect to live 0.3 years less than the EU-27 average for females. The International comparisons chapter of Social Trends also shows that in 2007 life expec-tancy for UK women stood at 81.9 years at birth (82.2 for EU-27) compared with 77.7 years for men (76.1 for EU-27).
In the EU, statistics and opinion polls are published by the Statistical Office of the European Community in a series called Eurostat (http://europa.eu; http://europa.eu/documentation/ statistics-polls). Tables normally contain figures for individual member states of the EU, plus totals for all countries. Eurostat divides its publications into themes, which are:
• General and regional statistics
• Economy and finance
• Population and social conditions
• Industry trade and services
• Agriculture and fisheries
• External trade
• Transport
• Environment and energy
• Science and technology.
It also produces general titles, which include the Eurostat Regional Yearbook, The EU in the World – A Statistical Portrait, Europe in Figures – Eurostat Yearbook and Key Figures on European Business.

104 Marketing Research
Figure 4.3
A classification of online databases
Full-textdatabases
Numericdatabases
Bibliographicdatabases
Directorydatabases
Special-purpose
databases
Computeriseddatabases
Online O�ine
Databases
A major category of secondary data is available in the form of browsable online databases.11 From the 1980s to date, the number of databases, as well as the vendors providing these ser-vices, has grown enormously. Browsable online databases offer a number of advantages over printed data, including:12
1 The data can be current, up to date and even ‘live’.
2 The search process is more comprehensive, quicker and simpler. Online vendors can pro-vide ready access to hundreds of databases. Moreover, this information can be accessed instantaneously, and the search process is simplified as the vendors provide uniform search protocols and commands for accessing the database.
3 The cost of accessing these is relatively low, because of the accuracy of searching for the right data, and the speed of location and transfer of data.
4 It is convenient to access these data using many forms of working online, including mobile devices.
Although online database information can be helpful, it is not necessarily free. It is vital to consider what costs are incurred in generating, presenting and updating quality and depend-able information databases. The number of database vendors and the breadth of subjects covered can be vast and confusing, especially at the commencement of a project. Thus a classification of online databases is helpful.
To examine any of the national statistics offices in Europe and Global Regions, visit the United Nations Economic Commission for Europe website (www.unece.org/stats/links.html) and follow the country links. There are also links to many other important organisa-tions with relevant statistics, such as the European Central Bank (www.ecb.int) and the Inter-national Monetary Fund (www.imf.org).
Classification of online databases
Online databases may be classified as bibliographic, numeric, full text, directory or special-purpose databases, as shown in Figure 4.3.
Online databasesDatabases that can be accessed, searched and analysed via the internet.

105Chapter 4 Secondary data collection and analysis
Bibliographic databases are composed of citations to articles in journals, magazines, newspapers, marketing research studies, technical reports, government documents and the like.13 They often provide summaries or abstracts of the material cited. The IMRI database is a good example of this. It includes over 50,000 abstracts of market research reports and sources (including journals, databases, audits, published surveys, etc.). This is a comprehensive direc-tory of marketing research agencies, publishers and associations in over 100 countries. Besides country listings, agencies appear in regions (e.g. Asia), specialist fields (e.g. quantitative) and market sectors (e.g. healthcare and pharmaceutical). The IMRI database is hosted on Datastar, Thompson/Dialog’s collection of information databases (www.dialog.com).
Numeric databases contain numerical and statistical information. For example, some numeric databases provide time-series data about the economy and specific industries. The earlier examples of census-based numeric databases using data over a series of censuses provide an example of a numeric database. The Experian MOSAIC database is a good exam-ple of a numeric database (www.experian.co.uk/marketing-services/). Experian data include business and consumer demographics and classifications, mapping, economic forecasts and statistics, local area data and retail and business information. This numeric database is deliv-ered in a range of formats, including databases, reports and products, such as Experian’s Mosaic consumer classification.
Full-text databases contain the complete text of the source documents held in the database. They usually have the ability to conduct advanced searches for topics, authors, phrases, words and interconnections between these. Examples include Emerald Insight (www.emeraldinsight.com) and the Gale Newspaper Database (www.gale.cengage.com). Emerald is an independent publisher of global research with an impact in business, society, public policy and education. Its database provides access to more than 68,000 articles, some dating back as far as 1898. It has backfiles of over 120 business and management titles in one unified platform and access to 217 business and management e-journals. The Gale Newspaper Database indexes and pro-vides full-text articles – for example, in the UK from the Financial Times, The Guardian, the Independent, the Independent on Sunday, The Observer, The Times and The Sunday Times. The Gale database is a global resource so is worth accessing for any specific country or region. The Gale Directory of Databases is published every six months. Volume 1 covers online data-bases and Volume 2 covers CD-ROMs and other offline databases.
Directory databases provide information on individuals, organisations and services. European Directories (www.europeandirectories.com) is an example of a directory database. European Directories is a pan-European local search-and-lead generation company. It pro-vides local search services to help customers find, evaluate and connect with local businesses across multiple media, including print, online and mobile. It can help advertisers ensure they have a strong presence wherever consumers might be searching for local businesses. Another example is the Directory of Open Access Journals (www.doaj.org). This online directory covers free, full-text, quality-controlled scientific and scholarly journals.
Finally, there are special-purpose databases. A good example of a special-purpose data-base is the fashion-trend forecasting service WGSN (www.wgsn.com). WGSN is a leading online trend-analysis and research service, providing creative and marketing intelligence for the apparel, style, design and retail industries. Its data support all business functions, includ-ing design, production, manufacturing, purchasing, merchandising, marketing, product development and general management. WGSN has a 12-year archive, with more than 5 mil-lion images and 650,000 pages of information.
In addition, virtually all libraries of major universities maintain special-purpose databases of research activities that reflect the distinct specialisms of that university. Beyond the inter-nally generated, special-purpose databases, university libraries and reference libraries main-tain online databases with instructions relating to what may be accessed and how it may be accessed. Another library source worth examining for online sources is the European Com-mission’s ‘Libraries’ site (http://europa.eu). The site, which is multilingual, is distributed by the EUROPA server, the portal site of the EU. It provides up-to-date coverage of European affairs and essential information on European integration. Users can access the websites of each of the EU institutions.
Bibliographic databasesDatabases composed of citations to articles in journals, magazines, newspapers, marketing research studies, technical reports, government documents and the like. They often provide summaries or abstracts of the material cited.
Numeric databasesDatabases containing numerical and statistical information that may be important sources of secondary data.
Full-text databasesDatabases that contain the complete text of secondary source documents comprising the database.
Directory databasesDatabases that provide information on individuals, organisations and services.
Special-purpose databasesDatabases that contain information of a specific nature, e.g. data on a specialised industry.

106 Marketing Research
Syndicated sources (services)Information services offered by marketing research organisations that provide information from a common database to different firms that subscribe to their services.
Syndicated sources of secondary data
In addition to published data, or data available in the form of online databases, syndicated sources constitute the other major source of external secondary data. Syndicated sources, also referred to as syndicated services, are companies that collect and sell common pools of data designed to serve information needs shared by a number of clients. These data are not collected with a focus on a specific marketing problem, but the data and reports supplied to client companies can be personalised to fit specific needs. For example, reports could be organised based on the clients’ sales territories or product lines. Using syndicated services is frequently less expensive than commissioning tailored primary data collection. Figure 4.4 presents a classification of syndicated sources. Syndicated sources can be classified based on the unit of measurement (households and consumers or institutions). Household and con-sumer data may be obtained from surveys, purchase and media panels, or electronic scanner services. Information obtained through surveys consists of values and lifestyles, advertising evaluation, or general information related to preferences, purchase, consumption and other aspects of behaviour. Diary panels can focus upon information on purchases or media con-sumption, as illustrated in the following example.
Electronic scanner services might provide scanner data only, scanner data linked to pan-els, or scanner data linked to panels and (cable) TV. When institutions are the unit of meas-urement, the data may be obtained from retailers, wholesalers or industrial firms. An overview of the various syndicated sources is given in Table 4.3. Each of these sources will be discussed.
Figure 4.4
A classification of syndicated services
Households/consumers
Panels
Surveys Electronicscannerservices
GeneralPsychographics
andlifestyles
Advertisingevaluation
Scannerpanels
Volumingtracking
data
Scannerpanel withcable TV
Wholesalers
Clippingservices
Corporatereports
Directenquiries
Retailers
Audits
Unit ofmeasurement
Institutions
Purchase Media Industrial �rms

107Chapter 4 Secondary data collection and analysis
Real research Making the news14
In a technology-enabled world, where online news aggregation is common, mobile internet is a reality and social networking is mainstream, how do people consume news? A Taylor Nelson Sofres (TNS) (www.tnsglobal.com) syndicated study researched news consumption by addressing the inter-sections between the platforms (conven-tional platforms, from newspapers and TV to radio and news websites, as well as word-of-mouth channels), news brands, content and news consumers that constitute the news world. The study delivered to multiple clients a detailed understanding of the role and place of news in the lives of con-sumers. It provided evidence of the complex nature of news gathering, revealing how a news story first sparks interest, to where further information is sourced, both online and offline, to flesh out a story, through to the impact each platform and brand has on conveying facts, forming opinion and encouraging the sharing of opin-ion with others – thus extending the life cycle of the story and starting the news cycle afresh. The study relied on an innovative qualitative methodology, inspired by ethnography and made possible by technology, which allowed the observation and probing of research participants in any product category. Over the course of 10 days, participants recorded all their contact with news, noting what they con-sumed, what stories attracted them and why, the platforms and brands they used and how they followed up and passed on the news. They were able to post links, photos, videos and comments throughout the day. TNS monitored their journeys, observing the participants’ routines and their thoughts and feelings as the news unfolded. This intensive process produced a rich record of news consumption and a valuable multimedia repository of information to review. In a follow-up stage, TNS met the participants in person in small groups, to talk through their diaries and explore themes thrown up by the online journeys; what caught their attention and why; the role of news in their lives, patterns of consumption and the relationship between platforms. Using mapping exercises, personification and other projective techniques, participants were asked about their perceptions of media brands and their relative positions, as well as about their expectation for the future of news con-sumption. Most participants were extremely engaged and committed, were compli-ant, doing all that was asked of them, and were unconstrained by the method. Some posted very personal contributions and had to be reminded that their contributions would be seen by others. As expected, there were also some poor contributors; some missed their daily updates, failed to upload photos and videos, were short on detail in their diary entries and provided little explanation. Participants could choose to say what they wanted about themselves as no one could check. However, TNS’s research did have a mechanism for accountability, because the participants knew they would meet TNS face to face at the end of the diary period.

108 Marketing Research
Table 4.3
Type Characteristics Advantages Disadvantages Uses
Surveys Surveys conducted at regular intervals
Most flexible way of obtaining data; information on underlying motives
Interviewer errors; participant errors; response-rate challenges
Market segmentation, advertising-theme selection and advertising effectiveness
Purchase panels
Households provide specific information regularly over an extended period of time; participants asked to record specific behaviour as it occurs
Recorded purchase behaviour can be linked to the demographic/ psychographic characteristics
Lack of representativeness; response bias; maturation
Forecasting sales, market share and trends; establishing consumer profiles, brand loyalty and switching; evaluating test markets, advertising and distribution
Media panels Electronic devices automatically recording behaviour, supplemented by a diary
Same as purchase panels
Same as purchase panels Establishing advertising; selecting media programme or air time; establishing viewer profiles
Scanner volume– tracking data
Household purchases recorded through electronic scanners in supermarkets
Data reflect actual purchases; timely data, less expensive
Data may not be representative; errors in recording purchases; difficult to link purchases to elements of marketing mix other than price
Price tracking, modelling effectiveness of in-store promotions
Scanner panels with cable TV
Scanner panels of households that subscribe to cable TV
Data reflect actual purchases; sample control; ability to link panel data to household characteristics
Data may not be representative; quality of data limited
Promotional mix analyses, copy testing, new-product testing, positioning
Audit services Verification of product movement by examining physical records or performing inventory |analysis
Relatively precise information at retail and wholesale levels
Coverage may be incomplete; matching of data on competitive activity may be difficult
Measurement of consumer sales and market share; competitive activity; analysing distribution patterns; tracking of new products
Industrial product syndicated services
Data banks on industrial establishments created through direct enquiries of companies, clipping services and corporate reports
Important source of information in industrial firms; particularly useful in initial phases of research projects
Data can be lacking in terms of content, quantity and quality, i.e. this equates more with business and competitor intelligence services
Determining market potential by geographical area; defining sales territories; allocating advertising budget
Overview of syndicated services

109Chapter 4 Secondary data collection and analysis
Syndicated data from households
Surveys
Many marketing research companies offer syndicated services by conducting surveys and omnibus surveys. As with any survey, the process involves interviews with a large number of participants using a pre-designed questionnaire. (Survey design and the relative advan-tages and disadvantages of different survey types will be discussed in detail in Chapter 10.) The distinction made here is that rather than designing a survey for the specific needs of a client company, the syndicated survey is designed for a number of client companies. The needs of sometimes quite a disparate array of client companies can be met by a syndicated survey. The key benefits of the syndicated survey lie in combining the resources of a number of clients to craft a survey of high quality and the economies of scale this may bring to indi-vidual clients. The downside may be that not all the information needs of an individual client may be met, and additional primary data may need to be collected. One of the most prolific forms of syndicated survey is the omnibus survey. The distinction of the omnibus survey compared with ad hoc surveys is that they target particular types of participants, such as those in certain geographical locations – e.g. Luxembourg residents, or consumers of par-ticular types of products – e.g. business air travellers. The following example illustrates just one of many omnibus surveys conducted by Ipsos MORI (www.ipsos-mori.com).
SurveysInterviews with a large number of participants using a questionnaire.
Omnibus surveyA distinctive form of survey that serves the needs of a syndicate group. The omnibus survey targets particular types of participants such as those in specific locations, e.g. Luxembourg residents, or customers of particular types of product, e.g. business air travellers. With that target group of participants, a core set of questions can be asked, with other questions added as syndicate members wish.
Real research Clients speak their minds about UK advertising agencies15
Marketers rarely miss an opportunity to tell advertising agencies what they think of them. So there were few refusals to participate in a study of clients’ views on the UK communications industry. Conducted on behalf of the Institute of Practitioners in Adver-tising (www.ipa.co.uk), a section of Ipsos MORI’s (www.ipsos-mori.com) ongoing omni-bus survey, Captains of Industry, asked a key question: ‘Were advertising and communications agencies good at supplying advice on intangible asset creation?’ The sam-ple comprised 99 boardroom executives selected from a universe that included (1) the UK’s top 500 companies by market capitalisation; (2) the top 500 by turnover; and (3) the top 100 by capital employed. In answer to that key question, 64% replied ‘Yes – they did consider advertising and communications agencies as good at supplying advice on intangible asset creation.’ Other perceptions of advertising and communications agen-cies included: ‘26% indicated that advertising and communications agencies were good at supplying advice on organic growth creation whilst 37% indicated that they were poor at this’. Among those participants that make use of advertising and communications agencies (84), 55% rated the quality of management at the main marketing and com-munications agency they used as above average. In response to the survey, IPA Presi-dent Moray Maclennan commented:
The IPA and its members lead the way in championing effectiveness, which made it doubly appropriate to measure progress in our boardroom agenda. The data threw down a challenge to the industry regarding its reputation for generating organic growth.
With a defined target group of participants, a core set of questions can be asked, with other questions added as syndicate members wish. Other syndicate members can ‘jump on the omnibus’ and buy the answers to all the questionnaire responses, or to specific questions

110 Marketing Research
of their choice. Surveys and omnibus surveys may be broadly classified, based on their con-tent, as psychographics and lifestyles, advertising evaluation, or general surveys.
1 Psychographics and lifestyles. Psychographics refers to the psychological profiles of individuals and to psychologically based measures of lifestyle. Lifestyles refers to the distinctive modes of living of a society or some of its segments. Together, these measures are generally referred to as activities, interests and opinions.16 Companies may wish to buy syndicated data that describe the lifestyles of consumers, as this can help them to understand further the characteristics of their existing and, especially, potential custom-ers. A good example of a marketing research agency that works upon the measurement and marketing applications of lifestyles can be found at the Natural Marketing Institute (www.nmisolutions.com).
2 Advertising evaluation. The purpose of using surveys to evaluate advertising is to assess the effectiveness of advertising that may be delivered through print, broadcast, online, out-doors and social media.17 A good example of a marketing research agency specialising in advertising evaluation is Harvey Research (http://harveyresearch.co.uk). Evaluation of effectiveness is critical to all forms of advertising. Companies that communicate to target consumers wish to understand the impact of their advertisements and thus the return on their advertising investment. Companies that sell advertising space and services wish to demon-strate that their medium will have the best impact on particular consumers.18 The sums involved in planning, creating and delivering effective advertising mean that research has long played a part in supporting advertising decisions, and surveys continue to play a major role in that evaluation process. The subject of advertising research has a long history and very large literature base, with strong academic and practitioner viewpoints.19 A few exam-ples may illustrate the complexity and value of advertising research. TV advertisements can be evaluated using either the recruited audience method or the in-home viewing method. In the former method, participants are recruited and brought to a central viewing facility, such as a theatre or mobile viewing laboratory. The participants view the advertisements and provide data regarding their knowledge, attitudes and preferences related to the product being advertised and the advertisement itself. In the in-home viewing method, participants evaluate advertisements at home in their normal viewing environment. New advertisements can be pre-tested at the network level or in local markets distributed via DVDs. A survey of viewers is then conducted to assess the effectiveness of the advertisements.
One of the main contemporary challenges in measuring the impact of advertising is in isolating a specific medium, as illustrated in the following example. This example shows that creative research designs can be used to isolate and measure the impact of a single communications medium.
PsychographicsQuantified profiles of individuals based upon lifestyle characteristics.
LifestylesDistinctive patterns of living described by the activities people engage in, the interests they have and the opinions they hold of themselves and the world around them.
Real research It can be measured20
Radio Ad Effectiveness Lab (RAEL, www.radioadlab.org) was founded in 2001 and is dedicated to providing research about how radio advertising works. One of its first stud-ies was dedicated to the return on investment (ROI) on radio advertising. With the help of Millward Brown (www.millwardbrown.com) and Information Resources Symphony (IRI www.symphonyiri.com) and four adventurous advertisers, RAEL created a ‘real-world’ test. RAEL used IRI’s BehaviorScan Targetable TV test market capabilities to con-trol the delivery of TV advertisements household by household, while simultaneously using test and control markets to deliver or not deliver radio advertising. This involved a six-month test of actual advertising campaigns for multiple advertisers. RAEL created four matching test cells: one with no local radio or national TV advertising; one with only the national TV ads; one with only an equivalent weight of local radio advertising;

111Chapter 4 Secondary data collection and analysis
3 General surveys. Syndicated surveys are also conducted for a variety of other purposes, including examination of purchase and consumption behaviour. Because a variety of data can be obtained, survey data have numerous uses. They can be used for market segmenta-tion, as with psychographic and lifestyle data, and for establishing consumer profiles. Surveys are also useful for determining product image, measurement and positioning, and conducting price perception analysis.
Purchase and media panels
About a fifth of all research budgets is spent on panels in their various formats, among the largest investors in this format in Europe being Switzerland at 38%, Germany at 34% and the Netherlands at 31%.21 Panels were discussed in Chapter 3 in the context of longitudinal research designs. Panels are samples of participants who provide specified information at regular intervals over an extended period of time. These participants may be organisations, households or individuals, although household panels are most common. The distinguishing feature of panels is that the participants record specific behaviours as they occur. Previously, behaviour was recorded in a handwritten diary, and the diary returned to the research organi-sation every one to four weeks. Panel diaries have been gradually replaced by electronic diaries and blog diaries.22 Now, most panels are online, and consumption and media behav-iour is recorded electronically, either entered online by the participants or recorded auto-matically by electronic devices.
In media panels, electronic devices automatically record viewing behaviour, thus supple-menting a diary. Media panels yield information helpful for establishing advertising rates by radio and TV networks, selecting appropriate programming and profiling viewer or lis-tener subgroups. Advertisers, media planners and buyers find panel information particularly useful. Another media vehicle that competes heavily for advertising budgets is the internet. The following example illustrates how TNS use media panels to understand the likelihood of viewers responding to advertisements.
Media panelsA data-gathering technique composed of samples of participants whose TV viewing behaviour is automatically recorded by electronic devices, supplementing the purchase information recorded in a diary or blog.
and one with equivalent weights of both national TV and local radio advertising. Along-side the survey data collected, RAEL also had corresponding scanner shopping data from IRI for four national advertisers. At the end of the six-month period, RAEL looked at the cell-by-cell details for each advertiser. On a sales-lift basis, the radio campaigns for the four advertisers acquitted themselves very well. The radio campaigns were linked to a statistically significant sales lift of 4.1%. Meanwhile, TV, with a much higher spend level, accounted for 7.5% in additional sales. When advertising costs were considered, radio delivered 49% better ROI than the corresponding (and similar weights of) national TV advertising.
Real research Targeting ad responders23
The Skyview panel, conceived and developed by BSkyB (www.sky.com) and TNS (www.tnsglobal.com), comprises 33,000 Sky households, from which detailed second-by- second TV viewing data covering all TV channels is collected via a set-top box. Of these homes, 6,000 are also members of Worldpanel, the service operated by TNS, which pro-vides details on each household’s purchasing of grocery products on a continuous basis. Sky Media (www.skymedia.co.uk) is the media sales arm of BSkyB and it wanted to use

112 Marketing Research
Purchase panels provide information useful for forecasting sales, estimating market shares, assessing brand loyalty and brand-switching behaviour, establishing profiles of spe-cific user groups, measuring promotional effectiveness and conducting controlled store tests.
Compared with sample surveys (see Chapter 10), panels offer certain distinct advan-tages.24 Panels can provide longitudinal data (data can be obtained from the same partici-pants repeatedly). They enable specific types of consumer to be targeted for study, relatively quicker than generating a bespoke sample. People who are willing to serve on panels may be more motivated to engage in a particular study and thus provide more and higher-quality data than one-off sample participants. In purchase panels, information is recorded at the time of purchase, eliminating recall errors.25 If information is recorded by electronic devices, it is generally more accurate as it eliminates recall errors.
The disadvantages of panels include lack of representativeness, maturation and response biases.26 This problem is further compounded by refusal to respond and attrition of panel mem-bers. Over time, maturation sets in, and the panel members should be replaced. Response biases may occur, since simply being on the panel may alter behaviour. There has been much debate on the challenges of creating representative and/or probability-based samples, with some research-ers claiming that panels are an unsustainable research method.27 (Due to the seriousness of this latter claim, the ‘scientific rigour’ of panels is further explored in Chapters 14 and 15.) In spite of these disadvantages, purchase panels are extensively used in marketing research, and the fol-lowing example illustrates how they can effectively support decision makers.
Purchase panelsA data-gathering technique in which participants record their purchases, either online or in a diary or blog.
data from Worldpanel to identify which households are the most responsive to advertis-ing. Having identified these ‘high responders’, Sky Media could then go on to examine their viewing patterns and thus find ways in which advertising could be more effectively targeted at the most responsive buyers through the better use of timing advertisements throughout the day, on certain channels and specific programmes. Worldpanel data reveal when each household made a purchase of a product category and whether the advertised brand or another brand was bought. It was possible to count the number of times the advertised brand was bought when the household was exposed to the brand’s advertising. Sky Media built upon this relationship to help predict the likelihood of someone responding to an advertisement. To investigate this Sky Media studied 33 brands across three categories: breakfast cereals, shampoo and yogurts. In each case it identified the ‘ad responders’. For each panellist it added a description of their demo-graphics, together with their scores on 137 attitudinal statements and their propensity to view TV. On average, 13% of panellists were classified as ‘ad responders’. Those with the highest propensity to be ad responders were people who liked advertising, were heavy consumers of commercial TV and had two or more people in the household. By con-trast, the least responsive were those who claimed not to like advertising, were living on their own and working full time.
Real research SCI INTAGE – A Japanese nationwide retail panel survey28
In 1960, a time when Japan was fast developing into a consumer market, Marketing Intelligence Corporation (MiC), the forerunner of INTAGE Inc., was established as Japan’s first true comprehensive marketing research organisation. The fledgling firm’s first businesses were SDI (nationwide drug-store panel research) and custom research. In 1964 the company launched SCI, a nationwide household consumer panel research

113Chapter 4 Secondary data collection and analysis
Electronic scanner services
The following example illustrates the nature and value of electronic scanner services, as undertaken by A.C. Nielsen, Worldwide Consumer Panel Services (http://uk.nielsen.com). A.C. Nielsen’s Panel Services operates in 27 countries, based on consumer purchase infor-mation from over 210,000 households. Another major global research company worth exam-ining with expertise in panel services and electronic scanning is Kantar (www.kantarworldpanel.com).
(www.intage.co.jp/english). SCI was based upon a sample of 12,008 two- or more mem-ber households. Data from this study were extensively used by Japanese retailers and the following example shows how SCI supported decision makers. One-day-only sales and short-term discount promotions were often run by Japanese retailers. Such price changes entailed costly operational and stock control complexities. Why did they change prices at short intervals despite the drawbacks? The situation had its basis in the unique characteristics of the purchasing behaviour of Japan’s consumers. According to SCI data on housewife purchasing behaviour, even when shopping for perishable foods is excluded, housewives shopped at supermarkets 2.5 times per week. Japanese house-wives on average shopped at 4.7 supermarkets and 13.3 stores across all SCI channels during the course of a year. What these data revealed was that Japan’s consumers shopped every few days and at different stores rather than always shopping at the same stores. For this reason, retailers wanted to offer novel experiences to attract customers to their stores on as many shopping occasions as possible. They did not wish to con-tinue discounting of a single product for a full week, but rather to rotate products fre-quently to be discounted for short periods of time.
Real research A.C. Nielsen Worldwide Consumer Panel Services
A.C. Nielsen Homescan was launched in 1989, the first continuous consumer panel in Europe to use in-home bar code scanners to collect data. The panel is regionally and demographically balanced to represent the household population and captures con-sumer package goods purchases brought back into the home, including variable weight and non-bar-coded fresh products. Each household provides daily information on its purchases of consumer goods for in-home use. Collected on a continuous basis, it is possible to measure the ongoing changes and interactions of households’ purchasing behaviour across all grocery and fresh-food products. Homescan incorporates both descriptive and diagnostic information. Consumer panel data provide information on purchaser attributes, purchase behaviour, market penetration, share of category require-ments, brand loyalty, brand switching and parallel consumption, plus a wide range of other powerful analytics. The database provides insights into why consumers behave the way they do. Subscribers can get answers to questions specific to their brand, such as: How many households purchased a product on a trial basis? Did they return later to purchase again? What did buyers purchase before a marketing campaign; what did they purchase subsequently? Where did buyers of a brand come from? What else do buyers purchase? Where else do buyers shop? How store-loyal are shoppers? What is the demographic composition of buyers? How do lifestyles and attitudes impact upon pur-chasing behaviour?

114 Marketing Research
Although information provided by surveys and purchase and media panels is useful, elec-tronic scanner services have continued to deliver great value to decision makers. (The role of scanned data as a foundation to developing sophisticated consumer databases is developed further in Chapter 5.) In this chapter we examine scanned data as a distinct source of syndi-cated data. Scanner data relates to retail data collected by bar codes at electronic checkouts. This code is then linked to the current price held on the computer and used to prepare a sales slip. Information printed on the sales slip includes descriptions as well as prices of all items purchased. Checkout scanners have revolutionised packaged goods marketing research.
Three types of scanner data are available: volume-tracking data, scanner panels and scanner panels with cable TV. Volume-tracking data provide information on purchases by brand, size, price and flavour or formulation, based on sales data collected from the checkout scanner. This information is collected nationally from a sample of supermarkets (rather than individual supermarkets tracking their customers’ purchases using loyalty cards) with elec-tronic scanners. In scanner panels, each household member is given an ID card. Panel mem-bers present their ID card at the checkout counter each time they shop. The checker scans their ID and each item of that customer’s order. The information is stored by day of week and time of day.
Scanner panels with cable TV combine panels with new technologies growing out of the cable TV industry. Households on these panels subscribe to one of the cable or TV systems in their market. By means of a cable TV ‘split’, the researcher targets different advertisements into the homes of the panel members. For example, half the households may see test adver-tisement A during the 6 pm newscast while the other half see test advertisement B. These panels allow researchers to conduct fairly controlled experiments in a relatively natural envi-ronment. It is possible to combine store-level scanner data with scanner panel data to do integrated analyses of consumer behaviour. This was illustrated with the earlier Real Research example of the Skyview panel developed by BSkyB and TNS. The following example illus-trates how panel and scanning organisations such as Nielsen are striving to make this work.
Scanner dataData obtained by passing merchandise over a laser scanner that reads the UPC from the packages.
Volume-tracking dataScanner data that provide information on purchases by brand, size, price and flavour or formulation.
Scanner panels with cable TVThe combination of a scanner panel with manipulations of the advertising that is being broadcast by cable TV companies.
Scanner panelsScanner data where panel members are identified by an ID card, allowing information about each panel member’s purchases to be stored with respect to the individual shopper.
Real research From fragmentation to integration29
Paul Donato is Executive Vice President and Chief Research Officer for The Nielsen Company (www.nielsen.com). His responsibilities include integrating all research func-tions within The Nielsen Company, overseeing the development and evaluation of all research and serving as Nielsen’s research liaison to clients and industry associations. In describing Nielsen’s drive to integrate more of its data he illustrated this through NielsenConnect:
The concept of Connect is based on the fact that there are limits to how much you can ask any one person within a survey. That makes a strong case for integrating various databases with our people-meter panel (http://www.agbnielsen.net). We do this via a hub, where we take homes from the people-meter panel and for two years collect other media usage data from these homes. To start with, we put a Niesen/NetRatings meter in these panel households, but in the long term we may also measure other media. One of our visions is to measure internet usage in as many TV people-meter homes as we can. We have done some tests and we know that people react to internet measurement dif-ferently and we estimate that realistically only 30–40% of people-meter households will sign up for internet measurement as well. Our plan is to grow the number of TV panel households to around 37,000, which should yield approximately 12–13,000 TV plus online panel homes onto which the balance of the 130,000-strong Nielsen/NetRatings panel. Importantly, for internet measurement advertisers they will benefit from the large 130,000 sample, which enables them to evaluate smaller, more specialist sites.

115Chapter 4 Secondary data collection and analysis
Scanner data are useful for a variety of purposes.30 National volume-tracking data can be used for tracking sales, prices and distribution, for modelling and for analysing early warn-ing signals. Scanner panels with cable TV can be used for testing new products, reposition-ing products, analysing promotional mixes and making advertising decisions, including budget, copy and media and pricing. These panels provide researchers with a unique con-trolled environment for the manipulation of marketing variables.
Real research GfK BEHAVIORSCAN
GfK BEHAVIORSCAN tests advertising spots in a random sample of the test households. Because of the capability to split these into test and control groups, a range of different budgets or campaigns can be tested and compared. The comparability of test and con-trol groups is achieved by ‘matching’, a mathematical optimisation program. Compara-bility is based on socio-demographic factors, purchasing behaviour in the category and, as far as the product is established, on the test product. GfK BEHAVIORSCAN can test the entire marketing mix of a product in a real environment controlled by members of the GfK team to produce results at the level of a complete household panel. It can help answer important questions such as: How many trial buyers do I gain? How satisfied are the customers? Which product variants and which packet size sell best? How do TV advertisements work? How profitable is the invested advertisement budget? How profit-able are campaigns, mail shots, vouchers and in-home samples? What market share will I achieve with my new product? Which competitor does it attack and who will lose out?
Scanner data have an obvious advantage over surveys and panels: they reflect purchasing behaviour that is not subject to interviewing, recording, memory or expert biases. The record of purchases obtained by scanners is complete and unbiased by price sensitivity, because the panellist is not required to be particularly conscious of price levels and changes. Another advantage is that in-store variables such as pricing, promotions and displays are part of the dataset. The data are also likely to be current and can be obtained quickly. Finally, scanner panels with cable TV provide a highly controlled testing environment.
A major weakness of scanner data can be a lack of representativeness. National volume-tracking data may not be projectable onto the total population. Not all purchases are scanned in the manner of large supermarkets. Many types of retail and wholesale outlets, which con-sumers may physically or virtually shop at, may well be excluded. Scanner data provide product and media behavioural and sales information, but they do not provide information on underlying attitudes and preferences and the reasons for specific choices.
Syndicated data from institutions
Retail audits
As Figure 4.4 shows, syndicated data are available from retailers as well as industrial firms. A retail audit is a regular survey that monitors sales of products via a sample of retail outlets. Retail audit data allow decision makers to analyse their product structure, pricing and distri-bution policy, and their position in relation to their competition.
The most popular means of obtaining data from retailers is an audit. This is a formal exami-nation and verification of product movement carried out by examining physical records or ana-lysing inventory. Retailers who participate in the audit receive basic reports and cash payments from the audit service, but the main beneficiary is the brand owner who wishes to monitor the
AuditA data-collection process derived from physical records or performing inventory analysis. Data are collected personally by the researcher, or by representatives of the researcher, and are based on counts usually of physical objects rather than people.

116 Marketing Research
sales of the brand through many retail outlets. Audit data focus on the products or services sold through the outlets or the characteristics of the outlets themselves.
The uses of retail audit data include: (1) determining the size of the total market and the distribution of sales by type of outlet, region or city; (2) assessing brand shares and competi-tive activity; (3) identifying shelf-space allocation and inventory problems; (4) analysing distribution problems; (5) developing sales potentials and forecasts; and (6) developing and monitoring promotional allocations based on sales volume. Thus, audit data can be particu-larly helpful in understanding and developing the environmental context, should further stages of research need to be administered.
Audits provide relatively accurate information on the movement of many different products. Furthermore, this information can be broken down by a number of important variables, such as brand, type of outlet and size of market. Audits may have limited coverage; not all categories of particular products or brands are necessarily included. In addition, audit information may not be timely or current, particularly compared with scanner data. At one time, there could be a two-month gap between the completion of the audit cycle and the publication of reports. Another disadvantage is that, unlike scanner data, audit data cannot be linked to consumer characteris-tics. In fact, there may even be a problem in relating audit data to advertising expenditures and other marketing efforts. Some of these limitations are overcome in online audit panels. GfK (www.gfk.com/solutions/point-of-sales-tracking/point-of-sales-tracking/) performs online tracking in over 80 countries and covers markets such as tourism, optics and fashion. The fol-lowing example illustrates the nature and value of its work for fashion brands.
Real research GfK FashionLife
GfK FashionLife offers market figures and the fast, fact-based delivery of detailed informa-tion to allow companies to steer their perfor-mance accordingly. The power to benchmark products and markets allows fashion compa-nies to maintain a firm grip on insights by channel. Reporting includes information on sales volume, sales value and average prices, and forms the basis for a continuous service for both retailers and suppliers within the fashion industry. Reports are available from top-level aggregation down to single-product level, and are customisable according to indi-vidual client needs. Delivery is on a monthly or weekly basis. Fashion products tracked by GfK FashionLife include: watches, luggage, jewellery, clothing and shoes, leisure and home textiles. GfK pitches the benefits of its online retail audit for fashion businesses as: fast weekly data directly from retailers; high levels of granularity in reporting; a basis for decisions on product assortments and ranges; a platform for understanding performance against competitors and the impact price has on market share; additional information to help target advertising and promotional activities; and help in maximising stock efficiency.
Industry services
These provide syndicated data about industrial firms, businesses and other institutions. Examples of these services include Datamonitor, Bureau Van Dijk and Dun and Brad-street. Datamonitor (www.datamonitor.com) is a provider of global business information delivering data, analysis and opinion across the automotive, consumer packaged-goods,

117Chapter 4 Secondary data collection and analysis
energy and sustainability, financial services, logistics, pharmaceutical and health care, retail, sourcing, technology and telecoms industries. It supports over 6,000 of the world’s leading companies in strategic and operational decision making. Its market intelligence products and services are delivered online. Bureau Van Dijk (www.bvdinfo.com) pro-vides a range of company information products that are co-published with many renowned information providers. Its product range includes databases of company information and marketing intelligence for individual countries, regions and worldwide. Its global data-base, Orbis, combines information from around 100 sources and covers nearly 65 million companies. It also provides e-publishing solutions, based on open and flexible platforms, and offers features such as search, secure delivery, e-commerce, rendering systems and hosting. Clients include publishers of books, scientific, technical and medical journals, news, directories and reference guides. Dun and Bradstreet (www.dnb.com, but also look for specific countries, e.g. Netherlands, http://dbnetherlands.dnb.com) has a global com-mercial database that contains more than 151 million business records. Through the D&B Worldwide Network clients gain access to perhaps the world’s largest global commercial business information database. D&B has global data coverage on business records in over 190 countries. To help ensure the accuracy and completeness of its information, D&B uses sophisticated data-collection tools and updates the database over 1.5 million times a day.
Information provided by industrial services is useful for sales management decisions, including identifying potential target markets, defining territories and measuring market potential by geographical areas. It can also support communications decisions such as targeting prospects, allocating communications budgets, selecting media and measuring communications effectiveness. Given the rich competitive intelligence available, these sources of information are also useful for segmentation and positioning decisions. Indus-try services represent an important contextual source of support in defining the environ-mental context for management decisions and any subsequent bespoke marketing research. They are particularly valuable for researchers who aim to measure and under-stand the networks and relationships of industrial firms (to be addressed in more detail in Chapter 28).
Summary In contrast to primary data, which originate with the researcher for the specific purpose of the problem at hand, secondary data and marketing intelligence are data originally collected for other purposes. Secondary data can be obtained quickly and are relatively inexpensive, though not free, especially for accurate, high-quality data. Secondary data have limitations, and should be carefully evaluated to determine their appropriateness for the problem at hand. The evaluation criteria consist of specifications, error, currency, objectivity, nature and dependability.
A wealth of information exists in the organisation for which the research is being conducted. This information constitutes internal secondary data. External data are generated by sources outside the organisation. These data exist in the form of pub-lished (printed) material, online and offline databases, or information made available by syndicated services. Published external sources may be broadly classified as gen-eral business data or government data. General business sources comprise guides, directories, indexes and statistical data. Government sources may be broadly catego-rised as census data and other data. Online databases may be online or offline. Both online and offline databases may be further classified as bibliographic, numeric, full-text, directory or specialised databases.

118 Marketing Research
Syndicated sources are companies that collect and sell common pools of data designed to serve a number of clients. Syndicated sources can be classified based on the unit of measurement (households and consumers or institutions). Household and consumer data may be obtained via surveys, purchase or media panels, or electronic scanner services. When institutions are the unit of measurement, the data may be obtained from retailers or industrial units. It is desirable to combine information obtained from different secondary sources.
Several specialised sources of secondary data are useful for conducting international marketing research. The evaluation of secondary data becomes even more critical, however, because the usefulness and accuracy of these data can vary widely. Ethical dilemmas that can arise include the unnecessary collection of primary data, the use of only secondary data when primary data are needed, the use of secondary data that are not applicable and the use of secondary data that have been gathered through morally questionable means. The growth of online sources of externally generated secondary data has exerted demands upon researchers to be able to access, integrate and inter-pret these data. The emergence of social media research techniques has generated not only new research techniques, but also new forms of data that could raise questions about what constitutes ‘secondary data’ and ‘marketing intelligence’.
Questions 1 What are the differences between primary data, secondary data and marketing intelligence?
2 What are the relative advantages and disadvantages of secondary data?
3 At what stages of the marketing research process can secondary data be used?
4 Why is it important to locate and analyse secondary data before progressing to primary data?
5 How may secondary data be used to validate qualitative research findings?
6 What is the difference between internal and external secondary data?
7 How can intranets help in the location and dissemination of secondary data?
8 By what criteria may secondary data be evaluated?
9 What criteria would you look for when examining the design and specifications of secondary data? Why is it important to examine these criteria?
10 To what extent should you use a secondary data source if you cannot see any explicit objectives attached to that research?
11 If you had two sources of secondary data for a project, the first being dependable but out of date, the second not dependable but up to date, which would you prefer?
12 Evaluate the desirability of using multiple sources of secondary data and intelligence.
13 List and describe the main types of syndicated sources of secondary data.
14 Explain what an online panel is, giving examples of different types of panel. What are the advantages and disadvantages of online panels?
15 What is an audit? Describe the uses, advantages and disadvantages of audits.

119Chapter 4 Secondary data collection and analysis
Exercises 1 Select an industry of your choice. Using secondary sources, obtain industry sales figures and the sales of the major firms in that industry for the past year. Estimate the market shares of each major firm. From another source where this work may have already been completed, e.g. Mintel, compare and contrast the estimates:
a To what extent do they agree?
b If there are differences in the estimates, what may account for these differences?
2 Select an industry of your choice. Write a report on the potential growth in that industry and the factors that are driving that growth. Use both secondary data and intelligence sources to build your case.
3 Using your library’s online databases, search through secondary data sources to gather data on the use of celebrities in the promotion of fashion brands. You are conducting a marketing research project to determine the effectiveness of celebrity endorsements in Louis Vuitton Moet Hennessy (www.lvmh.com). What secondary data sources have you found to be the most useful? As a marketing director at LVMH, how would you use secondary data that describe celebrity endorsement investments to determine whether you should continue to use celebrities in LVMH advertising campaigns?
4 Visit the Eurostat website (ec.europa.eu/eurostat/web/links/) and follow a link to the national statistics office in a country of your choice. Write a report about the secondary data available from this office that would be useful to a national housing developer for the purpose of formulating its marketing strategy
5 In a small group, discuss the following issues: ‘What are the significance and limitations of government census data for researchers?’ and ‘Given the growing array of alternative data sources that describe characteristics of individuals and households in a country, would it be a disaster for researchers if formal government censuses were scrapped?’
Notes
1. Peters, J., Appleby, M. and LaRue, S., ‘Virgin USA – a 21st century approach to brand development’, ESOMAR Annual Congress, Montreal (September 2008).
2. Fleisher, C.S., ‘Using open source data in developing competitive and marketing intelligence’, European Journal of Marketing 42 (7/8) (2008), 852–66; Rothberg, H.N. and Erickson, G.S., From Knowledge to Intelligence: Creating Competitive Advantage in the Next Economy (Burlington, MA: Butterworth–Heinemann, 2005); Aguilar, F.J., Scanning the Business Environment (London: Macmillan, 1967).
3. Adapted from Brownlie, D., ‘Environmental scanning’, in Baker, M.J., The Marketing Book, 3rd edn (Oxford: Butterworth–Heinemann, 1998), 158.
4. Mitchelson, L., ‘Gathering business intelligence in China – the ups and downs’, Admap Magazine, China supplement (February 2008).
5. Neves, M.A., ‘Strategic marketing plans and collaborative networks’, Marketing Intelligence & Planning 25 (2) (2007), 175–92; Rothberg, H.N. and Erickson, G.S., From Knowledge to Intelligence: Creating Competitive Advantage in the Next Economy (Burlington, MA: Butterworth–Heinemann, 2005), 21.
6. Dugmore, K., ‘Viewpoint: Public information – now it’s time to make it freely available’, International Journal of Market Research 49 (2) (2007), 153–4.
7. For applications of secondary data, see Allen, L. and Spencer, N., ‘Managing knowledge, maximising returns – revolutions in business information management’, ESOMAR Congress, Montreux (September 2009); Houston, M.B., ‘Assessing the validity of secondary data proxies for marketing constructs’, Journal of Business Research 57 (2) (2004), 154–61; Kotabe, M., ‘Using Euromonitor database in international marketing

120 Marketing Research
research’, Journal of the Academy of Marketing Science 30 (2) (Spring 2002), 172.
8. Foan, R., ‘Measuring media internet’, Admap Issue 496 (2008), 28–31.
9. Piercy, N.F., ‘Evolution of strategic sales organizations in business-to-business marketing’, Journal of Business & Industrial Marketing 25 (5) (2010), 349–59; Lawson, J., ‘Buying behaviour’, Database Marketing (October 2004), 35–8.
10. Allen, L. and Green, C., ‘Connecting insight with the organisation: knowledge management online’, Market Research Society, Annual Conference (2006); Fries, J.R., ‘Library support for industrial marketing research’, Industrial Marketing Management 11 (February 1982), 47–51.
11. Tasgal, A., ‘Inspiring insight through trends’, Market Research Society, Annual Conference (2009).
12. Jackson, M., Gider, A., Feather, C., Smith, K., Fry, A., Brooks-Kieffer, J., Vidas, C.D. and Nelson, R., ‘Electronic Resources & Libraries, 2nd Annual Conference 2007’, Library Hi Tech News 24 (4) (2007), 4–17.
13. Saw, G., Lui, W.W. and Yu, F., ‘2010: A library odyssey’, Library Management 29 (1/2) (2008), 51–66; Tenopir, C., ‘Links and bibliographic databases’, Library Journal 126 (4) (1 March 2001), 34–5.
14. Vir, J., Simpson, I. and Brown, K., ‘Making the news’, Market Research Society, Annual Conference (2009).
15. Anon., ‘Clients speak their minds about UK ad agencies’, WARC News (1 February 2008).
16. Lekakos, G., ‘It’s personal: Extracting lifestyle indicators in digital television advertising’, Journal of Advertising Research 49 (4) (December 2009), 404–18.
17. Bennett, G., Ross, M., Uyenco, B. and Willerer, T., ‘Lifestyles of the ad averse: A proposal for an advertising evaluation framework’, ESOMAR, Worldwide Multi Media Measurement (WM3), Dublin (June 2007).
18. Hu, Y., Lodish, L.M., Krieger, A.M. and Hayati, B., ‘An update of real-world TV advertising tests’, Journal of Advertising Research 49 (2) (June 2009), 201–6.
19. Nyilasy, G. and Reid, L.N., ‘The academician-practitioner gap in advertising’, International Journal of Advertising 26 (4) (2007), 425–45.
20. Peacock, J. and Bennett, M., ‘It can be measured’, Research World (September 2005), 70–1.
21. ESOMAR, ‘Global Market Research’, ESOMAR Industry Report (2010), 104.
22. Bryant, J.A. and Christensen, L., ‘I want MySpace! Helping an industry innovator (re)innovate’, ESOMAR Online Research, Berlin (October 2010).
23. Roberts, A. and Bristowe, L., ‘Targeting ad responders’, Admap Magazine Issue 486 (September 2007).
24. Comley, P., ‘Panel management and panel quality issues – understanding the online panellist’, ESOMAR Conference on Panel Research, Budapest (April 2005); Eunkyu, L., Hu, M.Y. and Toh, R.S., ‘Are consumer survey results distorted? Systematic impact of behavioural frequency and duration on survey response errors’, Journal of Marketing Research 37 (1) (February 2000), 125–33.
25. Clancy, K.J., ‘Brand confusion’, Harvard Business Review 80 (3) (March 2002), 22; Sudman, S., On the Accuracy of Recording of Consumer Panels II, Learning Manual (New York: Neal-Schumen, 1981).
26. Sassinot-Uny, L. and Gadeib, A., ‘Panel satisfaction index. Quality target for online access panels owners?’ ESOMAR Panel Research, Orlando (October 2007).
27. de Jong, K., ‘CSI Berlin: The strange case of the death of panels’, ESOMAR Online Research, Berlin (October 2010).
28. Kondo, T., ‘Creating a win-win relationship by maximizing both manufacturer sales and retailer profits’, ESOMAR Asia Pacific Conference, Tokyo (March 2005).
29. Mareck, M., ‘From fragmentation to integration’, Research World (September 2007), 48–50.
30. Examples of scanner data applications include González-Benito, O., Martínez-Ruiz, M.P. and Mollá-Descals, A., ‘Latent segmentation using store-level scanner data’, Journal of Product & Brand Management 17 (1) (2008), 37–47; Lemon, K.W. and Nowlis, S.M., ‘Developing synergies between promotions and brands in different price-quality tiers’, Journal of Marketing Research 39 (2) (May 2002), 171–85; Chintagunta, P.K., ‘Investigating category pricing behaviour at a retail chain’, Journal of Marketing Research 39 (2) (May 2002), 141–54.

Internal secondary data and analytics
The research industry needs to
evolve in order to weather the
digital storm of change that
threatens to engulf it.1
Stage 1
Problem definition
Stage 2
Research approach developed
Stage 3
Research design
developed
Stage 4
Fieldwork or data
collection
Stage 5
Data integrity
and analysis
5
Stage 6
Communicating research findings

122 Marketing Research
Objectives
After reading this chapter, you should be able to:
1 describe the nature and purpose of researchers utilising internal sources of secondary data;
2 appreciate how different types of company databases have developed into powerful means to understand customer behaviour;
3 understand how geodemographic information systems can help in integrating and displaying customer data;
4 understand how customer relationship systems can capture and model customer data and thus support marketing research;
5 understand how web analytics can capture and model customer data and thus support marketing research;
6 appreciate how different sources of customer data and marketing research can build up behavioural and attitudinal profiles of target markets;
7 appreciate the challenges of international data capture issues;
8 understand the ethical problems of having individual consumer data held on databases;
9 appreciate how different technological developments have increased the breadth of internally generated secondary data.
This chapter covers a topic that would have only merited a few paragraphs as recently as 20 years ago, when internal secondary data searches would have been part of primary data collection. The cost and difficulty of collecting internal secondary data, compared to primary data, would have mitigated the potential advantages of these data sources. What has changed? In one word – technology. The growth in the use of internet-enabled services in managing customers, together with the widespread adoption of mobile internet-enabled devices such as smartphones and tablets, has led to an exponential increase in the volume of data available. This increase, combined with the corresponding reduction in the cost of data analysis, has been labelled ‘big data’. These changes have shaped the expectations of decision makers in terms of the information they can rely on to help them make timely and effective decisions. Due to the perceived cost-effectiveness of these new internal data-collection techniques, the pressure has been increased for primary data-collection techniques to justify a return on investment. The growth in secondary data is not without problems. Management expectations are often misplaced, as the growth in data collection far exceeds the ability to successfully analyse the data. There are also issues over access, as internal data, particularly in the case of analytics, may still end up being controlled by a third party.
This chapter describes how use of internal secondary data, including analytics and databases, has grown to make major impacts upon how decision makers are supported. We start the chapter with examples of the use of databases, how they can directly support decision making, but also support the implementation of marketing research. We then move onto internal data-collection techniques that make use of unstructured data, particularly those based around the collection of analytics, and discuss the growing popularity of the concept of ‘big data’.
Databases generated within companies or bought in from specialist sources are often viewed as a tool to generate direct sales and target promotion activities. However, internally generated customer databases are also a secondary data source of immense value to researchers. The first example illustrates how a customer database in the form of a customer relationship system (CRM) was used to support the development of online surveys. The second example illustrates how a customer database was interrogated and enhanced with the use of geodemographic data in order to develop more refined descriptions of customer segments and to model behaviour.
Overview

123Chapter 5 Internal secondary data and analytics
Real research Creation of a pan-European online customer panel for Nintendo2
Nintendo wished to develop a platform to integrate online customer surveys with data stored in its CRM system. Globalpark (www.globalpark.com) worked in close cooperation with Nintendo to develop a workflow that networked its existing CRM system with Globalpark survey software. As a result, almost 1 million registered Nintendo customers could be managed and surveyed with its EFS (Enterprise Feedback System) Panel. An interface in the EFS Panel made it possible to extract samples from the customer database according to specific criteria, such as socio-demographic features. The master data could be used to identify suitable participants for a specific survey. Collected data from the survey were then fed back into the integrated system. The entire survey process, from the development of the survey, the recruitment of participants from the Nintendo CRM system and the invitation via email, to field control and the delivery of rewards at the end of the survey, could be coordinated using the EFS Panel. This process allowed Nintendo to conduct online product tests, customer satisfaction analyses, communic-ations campaigns and ad hoc marketing research projects.
Real research Geodemographics at Boden3
Boden (www.boden.co.uk) is renowned for catalogue-based retailing of high-quality women’s, men’s and children’s clothing. Starting in 1991, Johnnie Boden delivered his first catalogue with only eight menswear pieces. Boden now sends out over 20 million catalogues per annum, and 500 employees jointly share responsibility for shipping more than 4,000 orders per day. Boden identified a requirement to gain better insight into its growing customer base and purchased smartFOCUS (www.smartfocus.com) Intelligent Marketing Analysis solutions. This enabled better customer segmentation, with an increase in specific customer cells for targeting from 20 to 80 individual segments. Boden used the smartFOCUS analysis and visualisation, data mining and campaign-planning solutions to enhance its understanding of the 2.2 million people on its database. ‘Propensity to buy’ information, discovered through smartFOCUS, indicated that the womenswear range was delivering faster growth than other ranges; specifically, menswear buyers had a higher lapse rate and were more likely to buy every other year. This type of customer knowledge helped Boden plan more accurately and to forecast more effectively. Its purchase of MOSAIC geodemographic data (www.experian.co.uk/business-strategies) to enhance the Boden customer view enabled even more sophisticated segmentation analyses. Boden improved response rates by profiling profitable customers and identifying groups of prospects with similar profiles for specifically targeted marketing promotions. In addition, improved product transaction history enabled models to be built, ensuring that customer retention was maximised. The awareness and usage of this technology within Boden was also developing, with even the clothing designers requesting profile information on customers to create a better picture of their target audience. Designers wanted to ensure that more of their products met customer expectations.
There is no doubt that the database analyses in these opening examples acted (or could act) as an excellent foundation for marketing research design in deciding who to research and what issues to focus upon. The growth and impact of these sources mean that an examination of the opportunities and challenges inherent in internally generated secondary data is vital; the

124 Marketing Research
practice of marketing research cannot be independent or ‘siloed’.4 There are arguments that the perceived value of ‘traditional research’ and methods based upon reported attitudes and behaviour are eroding. A key factor in this erosion is that consumer data are now more abun-dant and automated. For example, web analytics provides masses of behavioural data on what consumers are looking for, what they do on a website, how they got there and, critically, whether they did what was wanted of them (e.g. buying a product). This behavioural data can carry more weight with decision makers, since what someone actually does could be consid-ered more reliable than what they say, think, feel or plan to do. Similarly, online feedback and internally managed customer relationship management surveys are providing customer insight without necessarily involving marketing research in order to gather it.5 Some of the challenges and opportunities generated by the growth of internally generated data are encap-sulated in the views of three leading research practitioners in the following example.
Real research The enlightened researcher6
Colin Shearer, of SPSS (www.ibm.com/software/analytics/spss):
I think in the future we will see a reassessment of where marketing research and related disciplines sit within an organisation. Historically, marketing research has been kept separate from things like CRM and marketing. There is a move to use the same techniques used to conduct surveys to collect feedback information from customers and act on it. The term that has been coined for this is ‘Enterprise Feedback Management’. It uses the same tools and techniques as marketing research, but in a different way, so it needs to be reconciled with traditional marketing research as supplied by agencies.
Jim Spaeth, of the New York agency Sequent Partners (www.sequentpartners.com):
I think marketing research will continue to evolve. The ‘digitalisation’ of almost everything, and the creation of continuous data streams, not for research but to run the business, will continue to change the nature of data collection from ad hoc to continuous. Analytic techniques will be validated through their empirical relationship with important business outcomes, all measured through the same enterprise data stream. Our emphasis will continue to move from data collection to data analysis and onto business decision support.
Clare Bruce, CEO of the Consumer Insight Agency Nunwood (www.nunwood.com):
There has been a stampede to use web technologies to collect data more quickly. We are using it to analyse data and devolve insight into our clients’ organisations. We also col-lect data online, but all our research and development from the technology point of view has been focused on enabling clients to disseminate insight more quickly and effectively. Our market analytics division takes the data and provides clients with a more in-depth, more strategic view on how the data can help, and more and more they are being asked to undertake implementation programmes so clients don’t just want answers to the questions, and insight, which is another layer on the raw data: they actually want us to tell them how to use it and guide their implementation.
The views in the above example illustrate not only the impact of new technologies and systems upon marketing research, but also the expectations of decision makers as to what marketing research should do to support them. The phenomenal growth in internally gener-ated secondary data and the means to analyse, interpret and action these data have brought about much reflection and consternation within the marketing research industry (as discussed

125Chapter 5 Internal secondary data and analytics
in Chapter 1). The nature, value and challenges of internally generated secondary data have been hotly debated over recent years but this is not a new phenomenon. To reflect upon the roots of such debates it is worth examining what internal secondary data are.
Internal secondary data
Chapter 4 described the nature, purpose and value of secondary data to researchers. A vital source of secondary data comes from within organisations that commission marketing research, namely internal secondary data. These data are generally seen as being drawn from opera-tional data, i.e. data that represent the daily activities, transactions and enquiries of a business.
Daily transactions may be held in different departments, such as sales, accounts or human resources, and stored in different manners. The use of operational data has presented opportu-nities to researchers for as long as businesses have been recording their daily transactions. Even in the days of transactions being recorded manually, it has been invaluable for research-ers to track down different sources of data and analyse them. The value of such data at all stages of the marketing research process means that locating and analysing internal sources of secondary data should be the starting point in any research project. The main reasons are that they are invaluable in defining the nature of a marketing decision problem and in defining who should be questioned or observed, and the nature of questions and observations to be directed at these individuals. These reasons are fundamental to the quality, action orientation and per-ceived value of marketing research. In addition, as these data have already been collected, there are no additional data-collection costs, there should be fewer access problems (though individual managers may make access difficult for personal or political reasons) and the qual-ity of the data should be easier to establish (in comparison with externally generated data).
Most organisations have a wealth of in-house information, even if they are not marketing or customer focused, so some data may be readily available. For example, imagine a shoe manufacturer that has traditionally sold shoes to retailers, such as Grenson (www.grenson.com/uk/). It creates invoices for all its sales to these business accounts. Its accounts depart-ment handles this process and maintains the data that it generates. Yet, there exists much consumer behaviour data in these invoices. Examples of analysis include:
• What products do customers buy?
• Which customers buy the most products?
• Which customers repeat purchases?
• Which customers are more active when there are special offers?
• Where are these customers located?
• Which customers are the most loyal?
• Which customers are the most profitable?
• Seasonal patterns of purchasing behaviour by product types and customer types.
Grenson has also developed e-business capabilities, with a website that enables it to sell its shoes directly to consumers. In such an instance Grenson would have the ability (perhaps for the first time if it has not previously invested in marketing research) to understand the above characteristics of the final consumers of its products, rather than characteristics of the retailer intermediaries. Beyond transactional data, there may also be data that relate to promotional activities such as spending on advertising, trade fairs, sponsorship deals or personal selling. It is not unusual for large organisations to have a multiplicity of different data sources, e.g. sales orders, customer relationship management, assets, stock, distribution, advertising, marketing and accounting. Each of these operational data systems may have its own databases but there is no guarantee that these systems and databases are linked.7 Thus the researcher may be faced with many discrete and/or integrated internal data sources from which characteristics of
Internal secondary dataData held within an organisation for some purpose other than a research problem at hand.
Operational dataData generated about an organisation’s customers, through day-to-day transactions.

126 Marketing Research
customers, their past behaviour and potential behaviour may be discerned. The norm for many companies is to integrate formally the data about their customers and invest in develop-ing and maintaining a customer database.
The customer database can be used to design and deliver marketing activities and strat-egies, and the response from these activities is fed back to improve and update it. Data-bases support techniques such as segmentation analysis, which at one time was developed from data gathered from relatively small samples collected at considerable expense. With a customer database, insights can be developed from larger samples obtained at almost no marginal cost as the data usually were gathered in the course of normal business opera-tions.8 The increasing use of store or loyalty cards has seen a major growth in the genera-tion of these kinds of data. Such an example of a customer database is illustrated in the following example.
Customer databaseA database that details characteristics of customers and prospects, which can include names and addresses, geographic, demographic and buying-behaviour data.
Real research Consumer Zoom: the French experience on loyalty card data9
More than 90% of French households hold at least one loyalty card from a hypermarket or supermarket brand name, and more than one in two participate in at least two programmes. Major retailers have information on several million clients, with a detail by product (European Article Number – EAN-13 bar codes are product identification numbers) and this for each till receipt. The development of store loyalty programmes has enabled researchers to follow and analyse consumer behaviour at the point of sale. After several years dedicated to client recruitment and optimisation of their programmes, FMCG retailers are now reviewing the use of the huge databases generated by loyalty programmes. This information is first used to analyse purchases of store loyalty card holders, then to describe behavioural characteristics of these customers. An additional method of analysis now exists, thanks to the size of the fast-moving consumer goods stores’ (FMCG) customer databases: the analysis of consumer behaviour on product categories and consumer reaction before marketing stimuli displayed by manufacturers and retailers. Marketing-Scan (www.marketingscan.fr) developed a Consumer Zoom approach through a partnership built with two French retailers, including the Auchan store (www.auchan.fr). One level of analysis performed by Consumer Zoom was the study of purchase habits by product category. Retailers as well as manufacturers are interested in this approach, as it is possible to find brand growth opportunities by analysing customers’ purchase habits. The Auchan Consumer Zoom tool is built from a representative sample of 600,000 store loyalty card holders.
The essence of the Auchan Consumer Zoom example is that the scanned data of products sold in Auchan stores are linked to known customers: the system links customer identifi-cation to product usage. Any promotional offers, competitive activity, new-product offer-ings, discounts or where to locate a new store, to name but a few marketing activities, can be analysed and related to classifications of customer. This example also illustrates one of the most prolific devices designed to capture customer behaviour data, i.e. the store-card or loyalty card.
The loyalty card is the device that supermarkets, pharmacists, department stores, petrol stations and even whole shopping centres and towns have developed in order to link cus-tomer characteristics to actual product purchases.
The loyalty card may be offered to customers as they make a purchase in a store. Basic customer data can be gathered as customers normally complete an application form, which may include their name and address, demographic details, household details, media usage
Loyalty cardAt face value, a sales promotion device used by supermarkets, pharmacists, department stores, petrol stations and even whole shopping centres and towns to encourage repeat purchases. For the researcher, the loyalty card is a device that can link customer characteristics to actual product purchases.

127Chapter 5 Internal secondary data and analytics
and even some lifestyle characteristics. Once customers use their loyalty cards, the products they have purchased are scanned and a link can be made through the ‘swiped’ card to their characteristics, which can then be related to the scanned data of their product purchases. In return, the customers earn ‘points’ for their total spend and may earn additional points for buying particular products.
From the researchers’ perspective, many benefits also accrue from the internally gener-ated secondary data from a loyalty card and product scanning system. The following list summarises the benefits to the researcher:
1 Profiles of customers can be built up. The types of individual who are being attracted to a store, particular types of products and responses to different types of promotion can be monitored. The returns and contributions made by particular types of customer can be measured. Profiles of the ‘ideal’ customer type can be built up, and plans developed to attract potential customers based upon these profiles.
2 One big laboratory. Experimental methods will be described in Chapter 11, but, in essence, the monitoring of customers, markets and interrelated marketing mix activities allows for many causal inferences to be established. For example, what is the effect, and upon whom, of raising the price of Häagen-Dazs ice cream by 10%? What is the effect of placing a coupon code to give a discount on after-sun lotion, placed via a Face-book brand page?
3 Refining the marketing process. With a series of responses to planned marketing activi-ties, statistical models of consumer response can be built with associated probabilities of a particular outcome. Likewise, models of the consumers over their lifetimes can be built. Again, statistical models can be built with associated probabilities of particular types of product being bought at different stages of a consumer’s life.
4 Developing a clear understanding of ‘gaps’ in the knowledge of consumers. The scanner and loyalty card electronically observe behaviour but do not encapsulate attitudinal data. The nature and levels of satisfaction, what is perceived as good-quality service, or what image is associated with a particular brand, are examples of attitudinal data. The use of the database helps to identify target populations to measure and the attitudinal data that need to be collected. In all, there can be a much greater clarity in the nature of primary marketing research that tackles attitudinal issues.
5 Linking behavioural and attitudinal data. If attitudinal data are elicited from consumers, the data gathered can be analysed in their own right. It is possible, however, to link the gathered data back to the behavioural data in the database. The term ‘fusing’ the data from different sources is used. The key to fusing lies in identifying individual participants so that one large dataset is built up. The notion of fusing together databases and survey data from different sources is at the heart of building a strong understanding of both the behav-iour and motivation of consumers.
The iterative knowledge gained from consumer interactions means that new targeted offerings can be formulated, and the nature of the customers’ response can be recorded. Researchers and decision makers can model and learn much about customers’ behaviour from transaction data. They should also be able to see the gaps in their knowledge of the cur-rent and potential customers. The awareness of these gaps in knowledge can be the founda-tion of well-designed and actionable marketing research. In the development of good research designs, the customer database can be seen as a vital resource to the researcher when conducting internal secondary data searches. The idea of accessing a customer data-base represents a clear opportunity for researchers, but such a resource may not be singular and can be integrated with many other databases and systems. There are a whole array of different means to capture electronically customer transaction behaviour and even potential customers through their search for information to buy services and products.

128 Marketing Research
It is beyond the scope of this chapter to describe and evaluate fully the array of technolo-gies, e-business methodologies and touchpoints with consumers that are impacting contem-porary business. Many of these systems and technologies can be integrated, and so pulling apart all these touchpoints with consumers represents a major task. We will, therefore, con-centrate on four major subject areas where internally generated data can be integrated with marketing research to produce greater consumer and marketing insights. A summary of how these can be integrated with marketing research will then be presented to illustrate the power of measuring and understanding consumers in different and integrated manners. The main areas are geodemographic data analyses, customer relationship management (CRM) sys-tems, big data and web analytics.
Geodemographic data analyses
Insight gleaned from databases, as illustrated in the preceding section, can emerge from the linking of different data sources from operational data that relate to customers. The ability to create those links and to display analyses graphically has long been achieved with the use of a geodemographic information system (GIS). At a base level, a GIS is a business tool that matches geographic information with demographic information, allowing analyses to be pre-sented on thematic maps. This base can be built upon with data from customer databases, databases from other sources and survey data. The combined data again can be presented on maps and in conventional statistical tables. Though the creation of geodemographic informa-tion systems comes from a variety of externally generated data sources, they have been instrumental in empowering decision makers to make sense of their internally generated secondary data – namely, customer databases. The earliest forms of GISs were developed in the early 1980s and were immediately a great success – not only in their ability to integrate a disparate array of data sources, but also their ability to display analyses in a very clear and engaging manner.
The geographic dimension of where consumers live is vital as a base to the system. Grow-ing up and living in different geographical locations can have an effect upon what consumers buy and the nature of their lifestyles. Look at the huge diversity of consumers around Europe! It is easy to see differences in consumers and their spending habits, between countries and regions within countries, between cities and towns and areas within a town, and even between different sides of a street. Differences can be seen between geographical locations that affect the lifestyle of residents, the array of products and services they buy, their ability to buy dif-ferent types of products and services and their hopes, fears and aspirations. The founding premise of a GIS is that the type of property a consumer lives in says much about the con-sumer’s lifestyle and consumption patterns. For example, consumers living in small, one-bedroom flats over shops in a city centre will tend to have very different lifestyles and consumption patterns from those living in large, detached, rural properties. Consumers in different property types have different propensities or probabilities of buying particular goods and services and of undertaking activities that make up their lifestyle. They also have different propensities to use and be exposed to different types of media.
From a marketing decision-making perspective, geography can be pivotal in strategic thinking. Knowing where one’s consumers are located affects the means and costs of distribu-tion. For example, should a new retail outlet be built and, if so, in which city and then in which part of that city? Which customers will have to pass our competitors in order to get to us? What features and facilities should the outlet have? The location of consumers also affects the means to communicate with them. Are consumers dispersed over a wide area or tightly clustered together? Do they read the same type of newspaper or magazine? Do they watch the same TV programmes or films at the cinema? Do they prefer to spend more time on Facebook or YouTube? The following example of the charity Sense Scotland shows how the organisa-tion used geodemographic analyses to generate a greater depth of understanding their donors.
Geodemographic information system (GIS)At a base level, a GIS is a business tool that matches geographic information with demographic information. This match allows subsequent data analyses to be presented on thematic maps.
Thematic mapsMaps that solve marketing problems. They combine geography with demographic information and a company’s sales data or other proprietary information.

129Chapter 5 Internal secondary data and analytics
One of the major factors that have seen decision makers engage with geodemographics are the maps and other graphical devices used to present data analyses. Such data analyses can be used to portray a huge variety of consumer characteristics and essential differences between target consumers. A map can identify all properties in a country (or even countries), all roads, shopping centres and major facilities in towns and cities. Data related to where consumers live and shop can be easily portrayed on these maps. The data typically originate from a number of internal and external sources and have the common feature of being able to relate to a specific postcode or zip code. Examples of such a system are those produced by CACI (www.caci.co.uk) and Experian Mosaic (www.experian.co.uk/business-strategies). The CACI system has been well established in the UK for many years, giving detailed analy-ses of specific locations and specific industry types, such as telecommunications, retailing and finance. Experian Mosaic is also well established in the UK but has also developed sys-tems specifically tailored for a number of countries throughout the world. The sources and details of data available in each of the above countries differ, as does the legislation that determines what can be stored and analysed on databases. Typically for each country, statis-tics can be gathered and used to develop individual GISs based upon census data, postal address files, electoral registers, consumer credit data, directories of company directors, mail-order purchase records, car registrations and data on access to retail outlets.
From the data collected, the purpose is to classify consumers on a geodemographic basis. Experian defines a geodemographic classification as follows:
Geodemographic classification groups consumers together based on the types of neighbourhood in which they live. If a set of neighbourhoods are similar across a wide range of demographic measures, they will also offer similar potential across most products, brands, services and media.
With the variables chosen for a particular country, i.e. the types of data that are available to build a GIS, cluster analyses are performed (Chapter 25 details the nature and purpose of cluster analysis). These analyses help to create consumer classifications, based upon the types of property the consumers live in and the propensity of consumers to have certain lifestyles
Geodemographic classificationThis groups consumers together based on the types of neighbourhood in which they live. If sets of neighbourhoods are similar across a wide range of demographic measures, they may also offer similar potential across most products, brands, services and media.
Real research Connecting to the ‘Captains of Industry’ – Sense Scotland
Sense Scotland (www.sensescotland.org.uk) is a significant service-providing organisa-tion that is engaged in policy development for children and adults with complex support needs because of deafblindness or sensory impairment, learning disability or physical disability. As part of an ongoing process of profiling and analysing its donor database, Sense Scotland commissioned CCR Data (www.ccr.co.uk) to find out about the types of donors who had previously been asked to convert from a home money box to a direct debit payment for donations. CCR analysed Sense Scotland’s donor database using Experian’s Mosaic Scotland consumer classification. This allowed CCR to assess Sense Scotland’s previous performance with individual donor segments and its performance related to Mosaic Scotland groups. For example, Mosaic Scotland Type A01 ‘Captains of Industry’ made up 6.67% of the donors who had been asked to convert. This type of consumer, the wealthiest in Scotland, made up only 1.92% of the population, which revealed that the original method of targeting donors had worked well. Further analysis showed that each person who had converted from the ‘Captains of Industry’ group had given 22% more than the average donor in regular gifts. Using Sense Scotland’s donor database and Mosaic data, CCR was able to refine further the process of analysing donor profiles and behaviour prediction. Following this analysis, Sense Scotland made the decision to develop a completely new form of profiling the donors on its database.

130 Marketing Research
and behave in particular manners. The analyses ensure that each of the descriptions used is reasonably homogeneous in terms of demographic measurements and consumer behaviour. As well as being able to discriminate and describe distinctive groups of consumers, the analyses produce ‘pictures’ of consumers that are meaningful to marketing decision makers.
Experian has also produced ‘Mosaic Global’ (www.experian.co.uk/business-strategies/mosaic-global) as a consistent segmentation system that covers over 380 million of the world’s households. It is based on the proposition that the world’s cities share common pat-terns of residential segregation. Each country has its ghettos of ‘Metropolitan Strugglers’, suburbs of ‘Career and Family’, and communities of ‘Sophisticated Singles’. In terms of their values and lifestyles, each type of neighbourhood can display strong similarities in whichever country it is found. Using local data from 25 countries and clustering methods, Experian has identified 10 types of residential neighbourhood, each with a distinctive set of values, motivations and consumer preferences, which can be found in each of the countries. Mosaic Global uses the data from the national Mosaic classification systems for the follow-ing countries: Australia, Austria, Belgium, Canada, Czech Republic, Denmark, Finland, France, Germany, Greece, Hong Kong, Israel, Ireland, Italy, Japan, The Netherlands, New Zealand, Norway, Romania, Singapore, Spain, Sweden, Switzerland, the UK and the USA.
The resulting analyses have produced a classification of 10 main consumer types. The example below describes characteristics of the Mosaic Global group labelled as ‘Sophisticated Singles’.
With a GIS, it is possible to pinpoint where the ‘Sophisticated Singles’ are in any of the countries analysed, whether they are clustered in particular regions or cities, or whether they are dispersed. If one were to dig deeper within each country, there would be clear differences in the proportions of these groups between cities and regions. From these classifications and the data that can be added from other internal databases, models of behaviour can be devel-oped for consumers in markets across the world. The profile of customers that a company has can be compared with national, regional or city profiles. Data that are captured on customer databases can be mapped out. For example, ING Bank NV can map out which customers have responded to an offer to take out a personal loan at a discounted rate, as well as building up a profile of those who respond. In addition to customer behaviour from an organisation’s customer database being added to the GIS, survey data can also be added. The key that would link the survey to the customer database may be either a named customer or a postcode. The following cases illustrate how geodemographic data from both Experian Mosaic and CACI have been integrated with marketing research techniques. In the first case study, Experian’s Mosaic was used to create more valid and reliable sampling frames for international surveys and more detailed analyses of target markets. In the second study, CACI’s GIS was used after stages of qualitative interviewing and telephone interviewing were conducted.
Real research ‘Sophisticated Singles’
‘Sophisticated Singles’ contains young people, mostly single and well educated, who posi-tively enjoy the variety and stimulation afforded by life in large cities. Typically interna-tional in their outlook and with a rich network of personal contacts, they are quick to explore and adopt new social and political attitudes and are important agents of innova-tion, in terms of both lifestyles and the adoption of consumer products. Most are at the stage of their lives when the development of ‘human’ capital, i.e. skills, contacts and knowl-edge, continues to take precedence over the maximisation of their incomes or indeed the accumulation of financial assets. Much of their income is spent on ‘experiences’, such as entertainment, eating out, travel, books and magazines, rather than on equipment. They exhibit a variety of household arrangements and typically marry and have children later in their lives. Such people gravitate towards the smarter downtown areas of major cities, where they spend short periods of time living in small, rented apartments.

131Chapter 5 Internal secondary data and analytics
Real research Research Now and Mosaic
Research Now (www.researchnow.com) specialise in managing access panels across the globe and international online fieldwork for both business-to-consumer and business-to-business relationships. It has combined the details of its 2 million panel mem-bers with Experian’s multi-country analysis (www.experian.co.uk/business-strategies). Mosaic classi-fies 1 billion consumers across 25 countries, cover-ing Europe, the Americas and Asia-Pacific. The partnership enables international researchers to improve the design of their surveys through detailed sample definitions and selection, being able to monitor and manage sample quotas during field-work. With more detailed profiles of consumers available through this link, individual clients can have specific market-segment specifications applied to their study, which can be applied to survey find-ings in data analyses and tables.
Real research Segmentation of the baby milk market10
The formula milk market has an unusual feature in that the vast majority of women will have given negligible thought to the product prior to becoming pregnant, and, because of the intent and encouragement to breastfeed, relatively little even during their preg-nancy. When the time comes to buy the product, mothers are confronted with a bewil-dering choice of brands, milk types, pack and product formats and sizes. Somehow, they have to make a decision on what is best for their baby and for themselves. SMA (www.smanutrition.co.uk) wanted to ensure that they were providing products, formats and communications that were in tune with mothers’ complex needs. SMA established that a segmentation study was needed and thus established a cross-functional team of market-ing, marketing research and sales personnel from SMA, researchers from Leapfrog (www.leapfrogresearch.co.uk) and management consultants. The first phase was to conduct qualitative research to deepen the understanding of mothers and their attitudes and behaviour, particularly in respect of feeding patterns and choices. Leapfrog ran 38 paired in-depth interviews across the UK and Ireland that included first-time and subsequent mothers. The qualitative research produced a wealth of data on mothers, their influ-ences and decision processes and also theories on market segmentation, which needed quantitative validation and refinement. The second phase was to conduct telephone interviews of first-time pregnant women, first-time mothers and subsequent mothers. A key factor in the choice of telephone interviewing was the need for a very wide geo-graphical dispersion so as to enable subsequent geodemographic modelling. The sam-pling frame used to contact participants was built from four sources: a commercial mailing list, the customer base of a leading retailer, callers to the SMA careline and the SMA Mums’ Network. The telephone interviews covered full details of feeding behav-iour and the influences on every decision made (e.g. the switch from a first milk to a milk

132 Marketing Research
In this example, the organisation did not previously have a clear means to measure and understand its existing or potential customers. There was a distinct role and integration of qualitative and quantitative research that helped it to characterise its target markets. Geodemo-graphic analyses helped the organisation to refine its profiles of target markets and get a sense of the potential markets and, with its research data, to understand what would be needed to turn prospective customers into actual customers. Having used geodemographics in this study, SMA could subsequently map out and form graphical representations of customers’ behaviour, their attitudes and their levels of satisfaction; there is much that could be achieved in represent-ing characteristics of how SMA customers relate to its brand. Of note also in this example is how the data and analyses of customers were used as a foundation for the CRM programme. We continue by examining the nature and impact of (CRM) tools that have emerged from the database marketing and geodemographics industries. Remember that the customer data gener-ated in the following evaluation of CRM systems can be mapped out using GISs.
for a hungrier bottle-fed baby). In addition there was extensive attitudinal information, which formed the basis of developing segmentation. The development of a national set of segments was the first step towards realising the individual needs of the customer base at a level of detail never previously achieved. The starting point was to identify each segment down to postcode-sector level. CACI (www.caci.co.uk) was commissioned to undertake this exercise, using its geodemographic tool ACORN. The task was achieved by matching key attributes in CACI lifestyle segments to those identified in the SMA cus-tomer segmentation exercise, resulting in SMA being able to identify the type of mother residing at each postcode-sector level. The next step was to share the segmentation analyses and descriptions with the entire SMA division at a specially organised confer-ence. A video was specifically created in order to bring each of the defined segments to life. The process helped to validate the accuracy of the segments, based upon the sales-person’s knowledge of different localities. The customer segmentation work provided SMA with strong evidence to help design its customer relationship (CRM) programme. The whole project also helped management consultants design a model for SMA, allow-ing the business to understand the core dynamics of the feeding experience by key stages in babies’ development. This was the first time that SMA’s market share data was based upon the number of customers (penetration figures) using infant formula, rather than volume and value sales. SMA experienced record levels of women joining their CRM programme and has seen more first-time bottle-feeding mothers than ever using the SMA brand, as measured by TNS (www.tnsglobal.com).
Customer relationship management
The foundation of customer relationship management (CRM) is to analyse and target the ‘right people’ with the ‘right offers’, aiming to understand profitability trends at the individ-ual customer level, to know who to target, why and with what.11 Marketing decision makers continue to realise the benefits of analysing customer data held within operational databases within their organisations. This realisation and the technological developments in collecting, analysing and presenting insight in customer-generated data have developed into the concept and practice of CRM. CRM definitions can vary, but in essence the concept can be seen as:
The processes involved in the identification of profitable customers and/or cus-tomer groups and the cultivation of relationships with these customers. The aim of such processes is to build customer loyalty, raise retention rates and therefore increase profitability.12
Customer relationship management (CRM)The processes involved in the identification of profitable customers and/or customer groups and the cultivation of relationships with these customers. The aim of such processes is to build customer loyalty, raise retention rates and therefore increase profitability.

133Chapter 5 Internal secondary data and analytics
The growth of CRM has emerged from the use and subsequent integration of various direct marketing channels (direct mail, telemarketing) and the rise of e-business, e-commu-nication and the increasing use of the internet as a conduit for customer care and sales.13 In the same manner that consumer insights generated from social media sources have impacted upon the practice of traditional marketing research, CRM practitioners are integrating social media data with internally generated customer data.14 The main challenge of implementing CRM is to integrate customer data from the post, telephone, personal visits, e-business and social media into a central database, so that it holds all transactions and contacts with each customer (and indeed browsing, potential customers) allied with the ability to update the data constantly and to access them immediately, whenever necessary.15 The principles of CRM are straightforward: organisations gather accurate data about their customers and prospects from all the sources that contact or engage with them. They analyse and sometimes model these data to generate insight into the behaviour of different customers. They can then for-mulate marketing strategies and offerings that differentiate between customer segments, sometimes differentiating down to the individual customer level. Greater resources can be focused on higher-value or higher-prospect customers. Every opportunity is used to amass additional data about each customer to personalise offerings and build a closer relationship16, and indeed to build stronger models of customer behaviour. The following example illus-trates how the fashion retailer Debenhams has used customer data, generated through its storecard and CRM system, to help model and predict customer behaviour.
Real research Customer analytics are in style at Debenhams17
As a key player in the UK fashion retail market, Debenhams (www.debenhams.com) has to create the best possible customer experience and needs to understand what its cus-tomers want from its 139 stores. Understanding customer shopping habits can be seen as crucial for any retailer, and identifying trends early can be critical to success. Deben-ham’s team of analysts was responsible for researching and evaluating all aspects of the customer relationships, including analysing customer buying habits as well as marketing campaigns and activity around new store openings. Debenhams used SPSS’s Predictive Analytics (www-01.ibm.com/software/analytics/spss) to support three areas of the ana-lytics team’s work: (1) supporting planning and decision making within buying and mer-chandising; (2) supporting marketing and CRM activity; and (3) analysing potential new stores. Using the software, the analytics team could look at which special offers were generating the most sales, as well as identify ‘cross-sell’ opportunities; for example, if a customer bought a new shirt, which tie was the customer most likely to buy to go with it? The team also applied analytics to understand why some lines were selling better than others. The SPSS tool has also played a crucial role in the life cycle of new store openings, from strategy to actual openings. This included preparing the initial business case and evaluating the optimum mix of product lines to carry, through to evaluating marketing campaigns for the new store.
The use of the term ‘CRM’ has grown rapidly over past years and now encompasses many functions associated with superior customer service and management, relationship building and electronic shopping. CRM often includes sales force and front office applica-tions that assist in customer interaction, the addition of customer and product information, and sometimes have the ability to integrate with other operational systems, including finance, inventory and ERP (Enterprise Resource Planning) to develop a full e-business or Web-based system.18 There is no doubting the value and impact of CRM systems in generating

134 Marketing Research
customer insight, but for researchers the means by which data are generated on individual customers can generate conflicts with the fundamentals of their code of practice. The ESO-MAR International Code on Market and Social Research states in its ‘Basic Principles’:19
Market research shall be clearly distinguished and separated from non-research activities including any commercial activity directed at individual participants (e.g. advertising, sales promotion, direct marketing, direct selling etc.).
Participant anonymity has been a hallmark of bone fide marketing research for as long as it has been professionally practised. However, ESOMAR has recognised that one of the big-gest threats to the industry lies in the alternative data sources that decision makers use, which includes customer insight generated from CRM data:
As CRM databases improve, a growing amount of data collection needs to be non-anonymous and linked to customer databases – at the moment marketing research is not well placed to contribute to that process.20
These concerns over the use of research data for wider purposes, together with the ethical issues around the use of anonymisation, are covered in more detail in Chapter 29. However, both the opportunities and the challenges generated by the collection and use of CRM data can be seen as a microcosm of those presented by the emergence of big data, which is dis-cussed next.
Big data
Big data is a term that has reached widespread use within business as well as among the media, academics and politicians. As might be expected from such a broad range of groups, the meaning of the term ‘big data’ varies depending on the needs of the group who are dis-cussing it. In general terms, big data describes a range of technological and commercial trends enabling the storage and analysis of huge amounts of customer data.21 Much of the commercial promise of big data is in the ability to generate valuable insights from collecting new types and volumes of data in ways that were not previously economically viable.
Real research What is ‘big data’ anyway?
Although the term big data has been widely discussed, many of the definitions can be vague and driven by hype rather than reality. One of the firms closely associated with the push behind big data is IBM, which has attempted to provide some clarity with the following definition:22
Every day, we create 2.5 quintillion bytes of data – so much that 90% of the data in the world today has been created in the last two years alone. This data comes from every-where: sensors used to gather climate infor-mation, posts to social media sites, digital pictures and videos, purchase transaction records, and cell phone GPS signals to name a few. This data is big data.

135Chapter 5 Internal secondary data and analytics
One of the more confusing aspects of big data is that it is not solely, or even mainly, about the ‘bigness’ or volume of data. Data volume is one of four dimensions of big data that have been identified by IBM:23
1 Volume. This relates to the ‘bigness’ in big data – in other words, the amount of data that are being collected. As the definition of big data given by IBM illustrates, the increase in data being collected is nearly exponential. However, the volume is not simply about data being created but also the amount of data that are being stored.
2 Velocity. Beyond volume of data, velocity is a lesser aspect of the technological side of big data that is less obvious. Data are collected in real time when they come from sensors on cars, on mobile devices or from websites. They can also be accessed and analysed in real time. One practical example of this can be seen when searching for a name on Facebook: despite more than a billion users of the service, data can be returned almost instantly for a a search.
3 Variety. Until as recently as the mid-2000s, most of the data collected through the internet were in text form. This had a number of advantages in that they were relatively easy to store and access. However, data now exist in a wide variety of formats and the majority of data that are stored are now in text or video formats.
4 Veracity. While originally there were only three dimensions, a fourth dimensions was added by IBM – veracity. This refers to the non-technical issues that surround big data. Although these factors have often frustrated technologists, they will be familiar to mar-keting researchers as they reflect many of the existing challenges with carrying out research. These include the extent to which business leaders trust the information they use to make decisions, as well as issues around data quality when working with big data.
On top of these technical dimensions lies a number of economic factors, in that technol-ogy has not only enabled the expansion of data collection but dramatically reduced the costs of doing so. As the marginal cost of data collection reduces, often close to zero, organisa-tions collect almost any amount of data without necessarily regarding the cost. This creates a number of opportunities in terms of marketing research but also a number of ethical issues (which are discussed in detail in Chapter 29).
Problems with big data
• Data quality. As the saying goes: rubbish in rubbish out. Just because large volumes of data are being collected doesn’t mean that the data will be useful. For example, if geo-location data from a mobile device are collected every 30 seconds as opposed to once a day, nearly 3,000 times more data are being collected. However, there are likely to be rela-tively few commercial uses where it is necessary to know a location every 30 seconds (not to mention a number of ethical issues from collecting such data). Just because more data are being collected it doesn’t mean that more types of data are being collected. As with traditional market research techniques, the most sought after customer insights can remain the most difficult to source.
• Skills in analysing data. While collecting data might be the (comparatively) easy part, successful analysis of very large secondary data sets requires a different skillset from those typically possessed by marketing researchers. The required skills are technical and are built around the techniques needed to deal with large volumes of unstructured data. The shortage of individuals with such ‘data science’ skills has been identified as a major barrier to achieving the potential of big data.24
• Organisations and culture. Just because there are new technologies and increasing sources of data does not mean that the age-old issues around data sharing within firms have been solved. Much of the value around big data is centered on the combination and

136 Marketing Research
analysis of multiple data sets. However, to achieve this requires a high level of cooperation within organisations. One of the criticisms of big data is that the perception that collecting data has value led to the hoarding of data within existing organisational silos, without rec-ognising that value can only be found through sharing the data across organisations.
Web analytics
The process of measuring and understanding the interaction with, and impact of, a website can be broadly termed as web analytics. This refers to the collection, measurement and analysis of user activity on a website to better understand and help achieve the intended objectives of that website. As well as focusing upon their own customers, organisations may include activities such as competitor web analysis, which is the practice of assessing and analysing the strengths and weaknesses of competing websites. With internally generated secondary data, web analytics can enable researchers and decision makers to build upon existing customer data. Handled correctly, researchers can undertake behavioural analyses of customers that can enhance known demographic, geographic and other behavioural charac-teristics. As well as developing profiles of customers, analyses can be performed to gauge how existing and potential customers respond to different stimuli (advertising, marketing and customer service).
Web analytics can make it possible to track every page viewed, every element ‘moused over’, every menu dropped down, every key pressed, every video watched. Tracking tech-niques can collect the most complete picture of what a visitor does on a site, even capturing data entered into a form that the visitor chooses not to submit.25 In the tracking and analysis of web interactions, knowledge of customers can be created. Figure 5.1 summarises this pro-cess, starting from individual website clicks being captured, through to an understanding of how visitors (which includes potential customers who turn into customers – or not) are browsing a website. Once actual shopping takes place via the website, further customer details and their behaviour can be recorded and modelled. This figure highlights the impor-tant distinction between ‘browsing’ and ‘shopping’ behaviour and what insight can be devel-oped as a potential customer moves to become an actual customer.
Web analyticsThe process of collection, measurement and analysis of user activity on a website to understand and help achieve the intended objective of that website.
Figure 5.1
Building consumer profiles from website events
Knowledge
Data
Person identi�ed
Person pro�led
Repeat visit
Website visit
Website event
Customer
High-value customer
Visitor
Visit
Click
Shopping
Browsing
The value of measuring and understanding browsing and actual purchasing behaviour is illustrated in the following example. Holiday and travel industries have seen major competi-tive changes and pressures through consumers being able to organise and buy products and services directly from websites. This example shows how Thomson Holidays has realised the benefits of these changes through capturing customer behaviour from its website.

137Chapter 5 Internal secondary data and analytics
A large range of different web analytics products exist, although the dominant player in the market is Google Analytics (www.google.com/analytics), which provides both paid and free versions of its software. In addition to its pricepoint – free is an attractive proposition for any business – Google Analytics also integrates demographic information gathered from Google’s own databases including, for example, data gathered from users of Android smart-phones. This provides data on age profile, gender, interests and current purchase intentions for website visitors, among other thing. This information is highly valuable and provides access to data that would not normally be available through secondary data analysis. It also provides a reminder of why provision of secondary data by Google is seen as a threat to the business of many established reseach firms.
As might be expected, free software comes with a catch. If Google Analytics is used as an analytics service, then the data on visitors are held by Google and only anonymised data will be made available to website owners, and researchers. In other words, individual visitors cannot be tracked. This is often less of a practical issue than might be thought in terms of addressing research questions, and can help to ensure compliance with the need to maintain anonymised data. However, if websites have a need to track individual visitors (for example, if they are collecting purchase data via an ecommerce site), then paid services may be more appropriate. Lower-cost examples include Crazy Egg (www.crazyegg.com) or Kissmetrics (www.kissmetrics.com).
Beyond this are full enterprise-level implementation services, such as Adobe Analytics (www.adobe.com/marketing-cloud/web-analytics.html), which allow customisation of ana-lytics options while maintaining control of the underlying data – at a cost. In a full-enterprise system, the integration of web-user data is included with other customer data sources. This is illustrated in Figure 5.2, where potential sources of customer touchpoints with an organisa-tion are brought together to create enhanced customer profiles and models of their behaviour. This figure illustrates how a ‘visitor’ can connect with an organisation in a range of ways.
Real research Thomson Holidays: behavioural conversion programme26
The holiday industry is hugely competitive, with tough challenges facing major oper-ators in an industry where customer loyalty is hard won. Using enquirer tracking, email and web analytics, Thomson Holidays (www.tuitravelplc.com) developed its Engagement Warehouse, which captured the on- and offline pre-purchase behaviour of millions of customers and prospects. It combined historical transactions, live web and email click, search and select behaviour, retail store visits and enquirer touch-points to help it understand how customers and prospects acted before making a purchase. This was a strategic investment in a technical capability that allowed Thom-son to know when its prospects were actively thinking about and planning holidays, what products they were considering and when they wanted to go. Thomson could identify individuals who were currently in the market, seek out those who want to go away at different times, to different places, with or without children, to 5-star hotels or budget products. It was a sophisticated data structure, with proprietary software, triggered web services, email and web content integration, delivering strategic and competitive advantage through eCRM services in a highly commoditised and price-sensitive market. The Engagement Warehouse extended Thomsons’s understanding of customers’ pre-purchase journey and was at the heart of a well-defined data strat-egy engaging all Thomson contacts, historical transactions, email engagement and web analytics. It revealed previously untapped analytical trends and tactical and stra-tegic opportunities.

138 Marketing Research
Certain customers may choose to connect to and shop with an organisation in one way; oth-ers may use a range of methods to browse, plan, experience and finally make a purchase. Each of these connections may be deemed a visit. The use of a visitor profile database is illustrated in the following example of Europe’s largest retailer, Tesco. The example shows how Tesco has used data from the loyalty card, plus web analytics data, to build customer profiles and targeted offerings. It also shows how Tesco builds and integrates marketing research.
Figure 5.2
Visitor profile database
Visitorpro�le
database
Demographicdata
Call centre activity
Transaction dataO�ine shopping
(loyalty card data)
Online behaviour(browsing and shopping)
Mail order
Geographicdata
Campaign data(email, search engine, etc.)
Real research Tesco: integrating research and analytics27
The UK supermarket giant Tesco (www.tesco.com) first introduced its Clubcard in 1995, and now has an estimated 16 million members equating to around three-quarters of the total number of people who shop at Tesco in the UK each week. Every purchase made in its stores delivers 45 separate pieces of information to the company, based around fac-tors ranging from price to whether a customer has opted for an own-label or branded product, and a ‘basic’ or more unusual item. Tesco customers are sorted into a variety of different demographic profiles, such as whether they have children or pets, or whether they appear to make complex or simple meals. Dunnhumby (www.dunnhumby.com), the marketing firm that pioneered the Clubcard platform, and which is now owned by Tesco, assesses 100 transactions a second, or around 6 million shopping trips a day. Tesco also has a major online shopping facility, allowing it to identify and profile con-sumers who shop online and/or in-store. The information that is generated through its databases helps Tesco decide which goods to stock, where promotional activity could boost sales and even when it could expand its store-brand range. Tesco has integrated its market research and analytics capability. In order to understand ‘why’ consumers are behaving in the way it has identified, Tesco can target specific customers, pre-populate the survey with known customer data, tailor questions that are specific to the behaviour of that customer and offer a reward that is meaningful to the customer. Tesco estimates that 16% of its margin is attributable to the knowledge it gets from its customer data-base. That makes the database a $3.2 billion asset. Alongside offering Tesco an insight into the behaviour of its customers, major FMCG firms, such as Coca-Cola, Nestlé and Unilever, pay to access these data.

139Chapter 5 Internal secondary data and analytics
Web analytics can reveal what consumers do online and how they respond to different pieces of digital communications. What consumers do online and what it physically means to be ‘online’ are changing dramatically. The growth of social media interactions is adding richness and complexity to web analytics, providing decision makers with not only masses of behavioural data on consumers, but also some attitudinal and emotional data. The wealth of data can carry more weight with decision makers, as the capturing of what consumers actu-ally do could be considered more reliable than what consumers say they think, feel or will do in response to survey questions. In a world where customer touchpoints and brand engage-ment are being constantly captured, the marketing research industry must take full advantage of these digital tools rather than seeing them as a distinct and alien form of encapsulating consumer behaviour. If seen as a source of internal secondary data upon which much richer consumer insights can be built, web analytics provides additional and immense opportunities for the researcher. As in the Tesco example above, neither web analytics nor loyalty card data can totally reveal the underlying reasons for consumer behaviour. A richness of psycho-logical reasoning and emotive connections to products, brands and experiences may be miss-ing. With the established skills to provide valid measurements of populations, researchers can provide data sets that bridge others and put them in context, both in place and in time.28 The key to gaining rich insights into consumers, the drivers of their behaviour and thus the distinctive role and power of the researcher, comes from examining how different types of data may be linked and integrated. Examples of data integration have been used throughout the chapter; the following section presents a simple framework to describe and evaluate the distinctive means to encapsulate consumers.
Linking different types of data
The examples in the sections above illustrate how different types of data can be linked to form richer and more powerful analyses of existing and potential customer characteristics. The following study takes these examples further by illustrating how Nestlé has made organ-isational changes that have delivered a stronger understanding of the nature, dynamics and influences upon its customers.
Real research Boosting consumer excellence at Nestlé29
When Denyse Drummond-Dunn joined Nestlé in 2004, the company’s sources of con-sumer information were fragmented. She set out to bring together three departments where consumer information was available: consumer services, consumer insights and consumer relationship management. This integration of the three departments came after a major change in the way Nestlé developed consumer insights. The company built consumer insights on four different sources of information. A first source was market data, such as sales or media data. Second, it used information derived from consumer ‘Safaris’, e.g. during consumer events organised by Nestlé or during ‘consumer experience ses-sions’. A third source was information developed through marketing research, both quan-titative and qualitative. The fourth source consisted of data about the wider environment the company operates in, such as socio-economic trends or competitive activity data. ‘Integrating information from different sources is not new’, Denyse pointed out:
What is unique at Nestlé is that we not only integrate information from different sources, but also ensure that the ensuing consumer insights are actually applied when we take decisions. This is done in all business units and countries we operate in.

140 Marketing Research
These examples illustrate what may be seen as one of the primary functions of supporting marketing decision makers, i.e. helping them to build a clear vision of the nature and dynam-ics of their target markets. Traditionally this would be seen as performing segmentation anal-yses and using these analyses to define and select target markets. It is not intended to work through the theory, practice or implementation of segmentation or target marketing. How-ever, it is worth examining how different data sources can be linked and integrated to make segmentation and targeting work more effectively. Figure 5.3 sets out five basic methods of segmenting markets. Individually, each of these methods delivers different levels of insight to decision makers. They also demand that different types of data be captured, with differing challenges in that capturing process. The figure is somewhat deceiving in that it may imply that the process of building stronger profiles of consumers is a linear process and that once one level is complete, one moves on to the next. The reality is that consumers may be con-stantly changing, and the building up of profiles of consumers is an iterative process and may never be complete. The examples in this chapter reveal that consumer data can be constantly updated to represent who the consumers are, where they are located, what they ‘do’ and why they behave in that manner (and indeed could behave).
Figure 5.3
Methods of segmenting markets
GeographicDemographic Psychographic Psychological
e.g. webanalytics andloyalty cards
e.g. Post O�cedata
e.g. censusdata
e.g. loyaltycards andsurveys
e.g. surveys
Increases in di�culty in measuring
Clarity of ‘picture’ of consumers
Segmentation methods
Behavioural
Figure 5.3 gives examples of where data may be obtained from, to help build up profiles of customers and markets. In the example of ‘psychographics’ or lifestyle measurements, data may be generated from CRM databases, web analytics or surveys. In the case of CRM data and web analytics, the purchasing or even browsing of particular types of products can indicate characteristics of a lifestyle. In a more direct manner, questions in a survey or quali-tative study can help to build a profile of lifestyle behaviour. In its own right, ‘lifestyle’ can be a valid means of segmenting a market, perhaps positioning products and services to con-sumers who aspire to a particular lifestyle. However, being able to combine demographic measurements, broader behavioural characteristics and a knowledge of where these consum-ers live helps to build a ‘picture’ of consumers that facilitates strong marketing decision-making support. Figure 5.3 indicates that as one moves from the demographic through to psychological characteristics, the measurement and capturing process can become more dif-ficult. Putting aside the differences in techniques to capture ‘demography’, ‘behaviour’ or ‘psychology’, what is being captured becomes more difficult as one moves towards psycho-logical variables. If one considers psychological variables that are vital to marketing that could be captured, examples such as satisfaction, loyalty, trust and quality are not as easy to capture as questions such as gender, age or where one lives. Chapter 12 will explore the con-cept of measurement in more depth, but at this stage consider what ‘satisfaction’ actually means, and then the problems of measuring that concept in a valid and consistent manner.

141Chapter 5 Internal secondary data and analytics
Conversely, as the measurements become more difficult to conduct, they add more to the ‘picture’ of consumer and market profiles. To say that a market is primarily female, aged between 25 and 40 and lives in a detached property with a mortgage, starts to build a very basic ‘picture’ of target consumers. To add details of their media behaviour, the array of products and services they buy, characteristics of their lifestyle and even something of their dreams and aspirations in life can help to build up a rich and, for decision makers, a much more powerful ‘picture’ of target consumers. Examining the variety of data sources that can be used in an interrelated manner to build market profiles, it is easy to see distinct contribu-tions from externally generated secondary data founded in GISs, transactional scanned data, loyalty card data, customer data in CRM systems, web analytics data, the use of traditional survey work and, indeed, other forms of quantitative and qualitative marketing research. The challenges in integrating these sources together can be summarised as:
1 Data challenges. To source, gather, validate, store, integrate, feed, model, analyse and interpret internally and externally generated quantitative and qualitative data.
2 Information systems challenges. To manage this array of data and develop and support emergent marketing knowledge in an organisation.
3 Marketing challenges. To keep abreast of the nature and dynamism of what should be an organisation’s target markets and performance in those markets.
There is a clear interdependence among the different data sources and, as in the Nestlé example, with the will and means to integrate these sources, much more powerful consumer insights can be generated. The main approaches to generating consumer insight can be sum-marised, as in Figure 5.4. Though each of the four segments is presented as a distinct approach, and there are organisations that deliver these distinct specialisations, there is much overlap in how they work.
Figure 5.4
Approaches to gaining consumer insight
• Primary data collection through exploratory and conclusive means• Secondary data collection – internal and externally generated
• CRM systems• Web analytics• Geodemographic information systems• Transactional and browsing behaviour
• Can impact exclusively on the practice and aims of the other quadrants• Passive – observation• Active – directed engagement
• Internal �nancial and operational analyses• Competitior intelligence
Marketingresearch
Customeranalytics
Socialmedia
research
Businessintelligence
This overlap is especially prevalent in the development and use of social media research (as discussed in detail in Chapter 17). Experts in CRM, web analytics and business intelli-gence, as well as marketing research, see the development of their discipline tightly interwo-ven with developments in social media research. This social media research has the potential to add many psychological characteristics of consumers, and as such has much to add to the other three approaches laid out in Figure 5.4. The explosion of data generated through social

142 Marketing Research
This view of the impact of continuing digitisation of everyday life means that ever more individual-level data about consumer behaviour will be available for marketers to respond to.31 Marketing research, like any of the other approaches in Figure 5.4, has to recognise that it contributes part of a wider understanding required to formulate effective and successful business and marketing strategies. Relying on marketing research as a sole data source, or arguing that it is the most valid data source, could lead to a very one-dimensional view of consumers and the worlds they live in. Researchers need to recognise that marketing research has a distinctive role to play in a single-enterprise view of a business, adding value and dis-tinction through being able to:
1 Focus upon existing and potential customers.
2 Use quantitative and qualitative approaches to tap into a rich array of consumer attitudes, emotions and aspirations.
3 Tap into a rich array of sensory and experiential characteristics of consumers.
4 Draw on a well-established and robust theoretical base in measuring and understanding consumers.
5 Draw on a well-established and robust theoretical base in being ‘representative’ and gen-eralising populations.
6 Demonstrate social responsibility through a long-established, proactive and open code of conduct.
‘Old-style’ researchers, who may conduct studies to meet specific objectives and just deliver the results of the research, are becoming rare. Even if researchers were to see the nature and scope of their work in this narrow sense, they would be designing and delivering relatively weak research by not tapping into the array of internally generated secondary data
media and internet developments could well lead to far more integration between these approaches. This explosion and its impact are described in the following example, from ‘Using math marketing to increase your return on investment’ by Dimitri Maex (President of OgilvyOne New York, www.ogilvy.com).
Real research Moving beyond the traditional single customer view30
Research data is the raw material for marketing, and the volumes gathered every day are staggering. Imagine for a moment that you had a database that held every word ever spoken by a human being, every utterance from the dawn of language on to the babble you hear around you right now. That’s a damn big database, right? You would need twenty databases of that size to hold the data that will exist by the end of next year. And the amount of data we spool out skyrockets every year! Not all of this data can be used by companies to improve their marketing efforts. After all, much of it is junk, but quite a bit of it can be helpful. Companies that adapt to the new scales of available data will thrive. Adapting organisations will adopt a single enterprise view of their business, not to replace the traditional single customer view but to augment it. This will allow them to access huge volumes of data, producing intricate analytics and targeted messaging that has both mass economies of scale and single-customer precision. Companies that adapt to the new scales of available data will thrive. Those that do not, well, no one said that evolution was kind.

143Chapter 5 Internal secondary data and analytics
that are at their disposal. In order to utilise internal secondary data, researchers need to equip themselves with more information-gathering skills and techniques than they have been tradi-tionally trained to do.32 In order to thrive, researchers need to become ‘data curators’ by embracing and integrating new information sources. We must ensure that we are the ‘aggre-gators’ not just the aggregated.33
Real research Diageo uses Google Analytics to empower its global brand managers
Diageo is a leading global producer of alco-holic beverages, including some of the world’s best-known brands such as Guinness, Johnnie Walker, Smirnoff and Baileys and with annual revenues of €14,500 million. For a company of Diageo’s size, the logistics of delivering accurate analytics across hundreds of websites in over 20 countries was a daunt-ing task. Marketing and brand managers required instant access to their website’s analytics reports in their native language. Though Google hosts and manages the server and hardware infrastructure for the entire Google Analytics platform, Diageo worked with a specialist agency to deploy Google Analytics across its global brands and to train its marketing teams. ConversionWorks (www.conversionworks.co.uk), a Google Analytics certified partner, worked with each brand’s web design agency. ConversionWorks quickly found that Diageo’s needs were very different from those of smaller organisations that have marketing teams centralised in one location. With potentially thousands of marketing executives spread around the globe, their challenge was to bring the data to the brand managers and not have them chasing after them. Using the Google Application Programming Interface, Diageo was able to show the latest reports and data directly on their intranet dashboards. Data were automatically extracted from each Google Analytics account and shown each time exec-utives logged into the intranet.
Real research Mobile surveys at TOMORROW FOCUS Media34
TOMORROW FOCUS Media (www.tomorrow-focus.de) is one of Germany’s leading internet marketing providers. Its portfolio includes FOCUS online and HOLIDAYCHECK, as well as partner portals CHIP Online, FAZ.net and FREUNDIN.de. It knew that 350,000 people had downloaded its iPhone app and were keeping abreast of the news (350,000 downloads). However, it did not have any hard facts about the users of its app, e.g. how many were male or female or how old they were. It was already conducting ‘traditional’ online surveys, but in order to measure and understand customer characteristics of its apps, it decided to conduct surveys on iPhones and iPads. Working with GlobalPark (www.globalpark.com), it selected 1,930 users of the iPhone app and included a small advertisement within the news content, asking them to participate in a survey. Of these, 152 completed the whole questionnaire. TOMORROW FOCUS was able to start building up a profile of its app users and to update this periodically by running additional surveys.

144 Marketing Research
The project highlighted that it was possible to survey hard-to-reach consumers via iPhones. TOMORROW FOCUS discovered that a very high percentage of its app users had a high salary and tended to be younger than the users of its website; most were also male. In its newer iPad app survey, it discovered that the app was used mainly in the evenings and at weekends for leisure purposes. The users of the iPad were also pre-dominantly male and with a very high income.
Summary The overall focus of this chapter has been to demonstrate that internally generated sec-ondary data offer significant opportunities, not only for decision makers but also for researchers. As with all good secondary data sources, they have a major impact upon the design, focus and value of primary data collection, analyses and interpretation. For the researcher, databases help to build profiles of consumers, linked to the products, com-munications and distribution methods those consumers favour. Databases present oppor-tunities to experiment in ‘one big laboratory’, build models of consumer behaviour, develop an understanding of the gaps in knowledge of consumers and make links between behavioural and attitudinal data. Much of the data that offer these benefits cap-ture customer buying and even browsing behaviour. The use of the ‘loyalty card’ is one example. Different types of data, including scanner, loyalty card, CRM, web analytics and survey data, may be combined and displayed using geodemographic information systems (GISs). Using base geographic and demographic data, characteristics of exist-ing and potential customers can be analysed and mapped out.
Disparate database and analytics-based research sources can be integrated to create powerful consumer insights. As well as what may be seen as traditional forms of mar-keting research, methods of customer transaction analysis and business intelligence can be mutually supportive and integrated. Social media research methods can add further insights to these forms of gaining consumer insight. There are distinctive forms of expertise and organisations that support these individual approaches. Researchers may see the growth in big data and the skills required to make the most of these techniques as a competitive threat. Alternatively, marketing research can embrace these approaches as an opportunity and be proactive in seeking the means to deliver superior consumer insight. The challenges in integrating these approaches lie in the characteristics of the data they generate – information systems that portray emergent knowledge in an organisation and marketing challenges of what should be an organisation’s target markets and its performance in those markets. The emergence of ‘big data’ and the growing opportunities presented by analytics will shape many of the challenges and opportunities that researchers face going forward.
Questions 1 How may ‘operational data’ held in organisations help to build up an understanding of customer behaviour?
2 What kinds of data can be gathered through electronic scanner devices?
3 What other sources, beyond electronic scanner devices, electronically observe customer behaviour?
4 Describe the benefits to the marketing decision maker of being able to capture data that identify characteristics of consumers and their shopping behaviour in a store.

145Chapter 5 Internal secondary data and analytics
5 Describe the benefits to the researcher of being able to capture data that identify characteristics of consumers and their shopping behaviour in a store.
6 Why may the characteristics of consumers differ, based upon where they live?
7 What is a geodemographic classification of consumers?
8 How may data from customer relationship management systems support the practice of marketing research?
9 How may the data from web analytics support the practice of marketing research?
10 How does the compilation of different types of data help to build a strong ‘picture’ of consumer characteristics?
11 What is big data? What are the core dimensions of big data (the four Vs)?
12 What might be the limitations of using Google Analytics as a source of data for marketing research projects?
Exercises 1 Visit the websites of Acorn (www.caci.co.uk) and Mosaic (www.experian.co.uk/business-strategies). Imagine that you have been commissioned to select a geodemographic system to help a newspaper publisher in a major European city.
a For such a business, how may a geodemographic system be used for marketing decision making?
b For such a business, how may a geodemographic system aid marketing research design?
c Present the case of which of the above systems would best suit such a business.
2 Call in at a supermarket or store that operates a reward or loyalty card scheme that requires you to apply for membership. Pick up an application form and examine the nature of questions you are expected to answer.
a What marketing research use can be made of the data collected from this application form?
b Evaluate the design of this form and make recommendations on how the nature of questions could be improved.
3 You are a marketing manager for Nescafé coffee. One of your major customers is a supermarket that uses a loyalty card scheme to observe its customers electronically.
a What would this supermarket know about coffee-buying behaviour through its scheme?
b If it would not share this with you, evaluate any marketing research, web analytics and social media research techniques that you think could generate the same knowledge.
4 Visit the SPSS website (www.ibm.com/software/analytics/spss) and evaluate its ‘predictive analytics’ products. Write a report on how marketing research may feed into and/or feed from predictive analytics for key decisions that may be planned by either a bank or major retailer.
5 Visit the Google website (www.google.co.uk/analytics/) and evaluate its Google Analytics 360 Suite, designed for enterprise users. Write a report on the potential limitations of using Google Analytics as an enterprise tool.

146 Marketing Research
Notes
1. Woodnutt, T. and Owen, R., ‘The research industry needs to embrace radical change in order to thrive and survive in the digital era’, Market Research Society, Annual Conference (2010).
2. Havermans, J., ‘Knowing everything a customer wants’, Research World (January 2006), 18–19.
3. www.smartfocus.com, accessed 14 January 2011.
4. Berelowitz, M., ‘Ready for Enterprise 2.0?’, Market Leader 3 (June 2009), 48–51.
5. Woodnutt, T. and Owen, R., ‘The research industry needs to embrace radical change in order to thrive and survive in the digital era’, Market Research Society, Annual Conference (2010).
6. Murphy, D., ‘The enlightened researcher’, Research World (December 2006), 18–20.
7. Macer, T., ‘Conference notes – making technology decisions in combining attitudinal and behavioural data’, International Journal of Market Research 51 4 (2009), 543–6.
8. Bakken, D.G., ‘Riding the value shift in market research: only the paranoid survive’, ESOMAR Best Paper Overall, Congress Odyssey, Athens (September 2010).
9. Jolly, M. and Battais, L., ‘Loyalty card databases, revolutionary analysis in shopping behaviour’, ESOMAR Retail Conference, Valencia (February 2007).
10. Hindmarch, J., Wells, C. and Price, F., ‘“It’s as vital as the air that they breathe”. The development of a segmentation of the baby milk market by SMA Nutrician and Leapfrog Research & Planning’, Market Research Society, Annual Conference (2005).
11. Noble, Y., ‘Personalisation, relevance and consistency in database marketing’, Admap 497 (September 2008).
12. Oktar, S., ‘Integrating decision making and marketing intelligence’, ESOMAR Technovate Conference, Cannes (January 2003).
13. Greenberg, P., ‘The impact of CRM 2.0 on customer insight’, Journal of Business & Industrial Marketing 25 (6) (2010), 410–19; Evans, M., Nancarrow, C., Tapp, A. and Stone, M., ‘Future marketers: future curriculum; future shock?’, Journal of Marketing Management 18 (5–6) (2002), 579–96.
14. Greenberg, P., ‘The impact of CRM 2.0 on customer insight’, Journal of Business & Industrial Marketing 25 (6) (2010), 410–19.
15. Dawe, A., ‘Integration is the thing’, The Times – Special Edition e-CRM (11 April 2001), 2–3.
16. Sumner-Smith, D., ‘Getting to know clients lifts profits’, The Sunday Times (26 September 1999), 17.
17. Havermans, J., ‘Knowing everything a customer wants’, Research World (January 2006), 18–19.
18. Fletcher, K., ‘Consumer power and privacy’, International Journal of Advertising 22 (2) (2003), 249–71.
19. ICC/ESOMAR International Code on Market and Social Research (December 2007), 4.
20. ESOMAR, ‘Global Market Research’, ESOMAR Industry Report (2010), 48–9.
21. Nunan, D. and Di Domenico, M., ‘Market research and the ethics of big data’, International Journal of Market Research 55 (4) (2013).
22. IBM, ‘What is big data?’ Available at: http://www-01.ibm.com/software/data/bigdata/what-is-big-data.html, accessed 1 April 2016.
23. IBM, ‘What is big data?’ Available at: http://www-01.ibm.com/software/data/bigdata/what-is-big-data.html, accessed 1 April 2016.
24. Manyika, J., Chui, M., Brown, B., Bughin, J., Dobbs, R. and Hung Byers, A., ‘Big data: The next frontier for innovation, competition and productivity’, McKinsey Global Institute Report (2011). Available online at: http://www.mckinsey.com/Insights/MGI/Research/Technology_and_Innovation/Big_data_The_next_frontier_for_innovation, accessed 31 March 2016.
25. Sterne, J., ‘Web analytics and the march toward better measurement’, Marketing NPV 4 (3) (2007), 18–19.
26. Anon., ‘TUI UK: Engagement warehouse & behavioural conversion programme’, Direct Marketing Association – UK: Gold Award (2010).
27. Maex, D., ‘Learning to read the river: Using math marketing to increase your return on investment’, WPP Atticus Awards: Highly Commended (2009); Anon., ‘Tesco uses loyalty scheme to drive growth’, WARC News (7 October 2009); Rawlinson, R., ‘Beyond brand management – the anatomy of the 21st century marketing professional’, Market Leader 34 (Autumn 2006).
28. Passingham, J. and Blyth, B., ‘A small rock holds back a great wave: Unleashing our potential’, ESOMAR Congress Odyssey, Athens (September 2010).
29. Havermans, J., ‘Boosting consumer excellence’, Research World (April 2006) 2829.
30. Maex, D., ‘Learning to read the river: Using math marketing to increase your return on investment’, WPP Atticus Awards: Highly Commended (2009).
31. Hayward, M., ‘Conference notes – connecting the dots: Joined-up insight finally becomes possible’, International Journal of Market Research 51 (2) (2009).
32. Page, A. and Lai, S., ‘Understanding your competitors: Completing the marketing intelligence jigsaw’, ESOMAR Asia Pacific Conference, Tokyo (March 2005).
33. Woodnutt, T. and Owen, R., ‘The research industry needs to embrace radical change in order to thrive and survive in the digital era’, Market Research Society, Annual Conference (2010).
34. Wilke, A., ‘Mobile surveys win new business for TOMORROW FOCUS Media’, GlobalPark Case Study (2011).

Qualitative research: its nature and approaches
Qualitative research helps the
marketer to understand the
richness, depth and complexity
of consumers.
Stage 1
Problem definition
Stage 2
Research approach developed
Stage 3
Research design
developed
Stage 4
Fieldwork or data
collection
Stage 5
Data integrity
and analysis
6
Stage 6
Report preparation
and presentation

148 Marketing Research
Objectives
After reading this chapter, you should be able to:
1 explain the difference between qualitative and quantitative research in terms of the objectives, sampling, data collection and analysis and outcomes;
2 describe why qualitative research is used in marketing research;
3 understand the basic philosophical stances that underpin qualitative research;
4 understand the nature and application of ethnographic approaches;
5 understand how qualitative researchers develop knowledge through a grounded theory approach;
6 explain the potential of action research to qualitative researchers;
7 discuss the considerations involved in collecting and analysing qualitative data collected from international markets;
8 understand the ethical issues involved in collecting and analysing qualitative data;
9 describe how developments in social media research have changed established qualitative research techniques and added new techniques.
Qualitative research forms a major role in supporting marketing decision making, primarily as an exploratory design but also as a descriptive design. Researchers may undertake qualitative research to help define a research problem, to support quantitative, descriptive or causal research designs, or as a design in its own right. Qualitative research is often used to generate hypotheses and identify variables that should be included in quantitative approaches. It may also be used after or in conjunction with quantitative approaches, where illumination of statistical findings is needed. Qualitative research designs can also be used in isolation, after secondary data sources have been thoroughly evaluated or even in an iterative process alongside secondary data sources.
In this chapter, we discuss the differences between qualitative and quantitative research and the role of each in marketing research. We present reasons for adopting a qualitative approach to marketing research (Stage 2 of the marketing research process). These reasons are developed by examining the basic philosophical stances that underpin qualitative research. The concept of ethnographic techniques is presented, with illustrations of how such techniques support marketing decision makers. The concept of grounded theory is presented, illustrating its roots, the steps involved and the dilemmas for researchers in attempting to be objective and sensitive to the expressions of participants. Action research is an approach to conducting research that has been adopted in a wide variety of social and management research settings. Action research is developing in marketing research, especially in areas such as product, communications and brand design. The concept of co-creation in design through action research offers great potential for consumers, decision makers and researchers alike. The roots of action research are presented, together with the iterative stages involved and the concept of action research teams. Technological developments are changing the manner in which traditional qualitative research techniques are conducted, creating new opportunities for the generation of insight. Examples of these changes and new techniques will be presented, along with the challenges and opportunities these present.
Overview
We begin by evaluating the nature of qualitative research with the use of two examples. Given the nature of its products and competitive environment, the first example illustrates how Weihenstephan has used qualitative research in the development of an online research

149Chapter 6 Qualitative research: its nature and approaches
Real research The Weihenstephan online research community1
Weihenstephan is a German dairy company belonging to the international Mueller Dairy Group (www.muellergroup.com). As a premium brand it faced major challenges in the German dairy market, which was characterised by very strong private-label brands. It faced numerous strong national brands with intense promotional activities in high-volume categories such as fruit yogurts, flavoured milk drinks and desserts. These categories were affected by very important and influential topics for consum-ers – e.g. sustainability, fair treatment of farmers and GMO-free products (genetically modified organisms). Weihenstephan recognised that social media were profoundly changing the basics of interpersonal communication, but it also saw several new challenges for researchers arising from this ‘web evolution’: discussion groups devel-oped without being previously sampled; answers were given to questions that had not yet been asked; well-constructed interviews were replaced by dynamic social interaction in virtual communities. In planning its response to the challenges and opportunities to social media research, Weihenstephan felt it could establish two types of research community: (1) by expanding an already existing open consumer-oriented website (www.weihenstephan-erleben.de) into a branded open-source community; and (2) setting up a dedicated, closed, online research community. It saw the development of co-creation processes in these communities providing the advantages of combining the classical focus group concept with the benefits of Web 2.0. Both types of community could have the same functionalities and features (e.g. creating user profiles, establishing different forums and including quantitative research elements such as voting). Weihenstephan chose the second option, the closed online research community, establishing one place for conducting all qualita-tive and quantitative marketing research. Qualitative–exploratory questions were investigated within the community. The company targeted around 100–150 partici-pants representing various regions in Germany (equally spilt in urban areas of Munich, Stuttgart, Cologne, Berlin and Hamburg). Its community is working and several key projects have been discussed, including new concept and product ideas in existing subcategories, possible line extensions and general attitudes and habits in possible new sub-categories for the brand.
community. The second example illustrates how LG Electronics uses qualitative techniques to support design decisions. Note in this example how LG uses different techniques to cap-ture characteristics of consumers that it may be totally unaware of. These examples illustrate the rich insights into the underlying behaviour of consumers that can be obtained by using qualitative techniques.
Real research Living with your customers2
When designing domestic appliances, the German branch of Korean-based LG Elec-tronics needed a way to find out what people need from its kitchen equipment, wash-ers and vacuum cleaners. The answer was to use ethnographic research with a combination of video diaries and long in-depth interviews so that it could understand

150 Marketing Research
In qualitative research, research agencies and companies are continually looking to find better ways to understand consumers’ thought processes and motivations. This has led to a wealth of research approaches, including techniques borrowed from anthropology, ethnogra-phy, sociology and psychology. For example, Philips has a specialist team of researchers, including ethnographers, anthropologists and psychologists.
As Marco Bevolo, Design Director at Philips Design, says:3
At Philips Design, we have created research tools to enable ethnographic insights to be delivered into the creative process in a truly actionable way. We aim to push the agenda of research from the side of future studies, people research and their lively embodiment into advanced design.
Primary data: qualitative versus quantitative research
Primary data are originated by the researcher for the specific purpose of addressing the prob-lem at hand (as explained in Chapter 4). Primary data may be qualitative or quantitative in nature, as shown in Figure 6.1.
Dogmatic positions are often taken in favour of either qualitative research or quantitative research by researchers and decision makers alike. Indeed, many researchers will define themselves as either ‘qual’ or ‘quant’. The positions are founded upon which approach is perceived to give the most accurate measurements and understanding of consumers. The extreme stances on this issue mirror each other. Many quantitative researchers are apt to dismiss qualitative studies completely as giving no valid findings, indeed as being little bet-ter than journalistic accounts. They assert that qualitative researchers ignore representative
Qualitative researchAn unstructured, primarily exploratory design based on small samples, intended to provide depth, insight and understanding.
Quantitative researchResearch techniques that seek to quantify data and, typically, apply some form of measurement and statistical analysis.
its customers through sharing their experiences. The company combined the two methods, because one drawback of filming participants was that they might behave atypically, being aware that they were in a test situation. There can also be verbal or subconscious non-verbal communication with the camera operator. The com-pany therefore used the two methods to apply what it saw as ‘non- presence while being present’ in different households and countries. The projects were directed to find out how European consumers used electrical appliances, their workflow in the kitchen, how they go about doing their laundry and their habits in wet and dry floor cleaning. The company believed that habitual non-conscious behaviour should be researched in an authentic environment with a minimum of external factors, so it worked at participants’ homes, usually for a period of five to eight days. It carried out research focusing on the kitchen (10 households each in Hamburg, London and Paris), laundry (10 households each in Hamburg, Budapest, Stockholm, Madrid and London) and vacuum cleaning (15 households in Paris, Budapest, Madrid and Lon-don). To observe kitchen behaviour, it installed cameras focused on major appli-ances for a week for the video diaries. For the laundry study, it installed fixed cameras with a motion detector to observe behaviour with the washing machine and dryer. If these appliances were in the bathroom or toilet, where no one wanted to be filmed, participants themselves could switch the camera on whenever they used the appliances. The company adjusted the technical equipment and location of video cameras according to different individuals and households so it could observe how people sorted clothes, dealt with stains, dried their laundry and did the ironing.

151Chapter 6 Qualitative research: its nature and approaches
sampling, with their findings based on a single case or only a few cases. Equally adamant are some qualitative researchers, who firmly reject statistical and other quantitative methods as yielding shallow or completely misleading information. They believe that to understand cul-tural values and consumer behaviour, especially in its full contextual richness, requires interviewing or intensive field observation. Qualitative techniques they see as being the only methods of data collection sensitive enough to capture the nuances of consumer attitudes, motives and behaviour.4
There are great differences between the quantitative and qualitative approaches to studying and understanding consumers. The arguments between qualitative and quantita-tive researchers about their relative strengths and weaknesses are of real practical value. The nature of marketing decision making encompasses a vast array of problems and types of decision maker. This means that seeking a singular and uniform approach to supporting decision makers by focusing on one approach is futile. This should have become apparent when evaluating the huge array of data sources that can generate con-sumer insight (as discussed in Chapter 5). Defending qualitative approaches for a par-ticular marketing research problem through the positive benefits it bestows and explaining the negative alternatives of a quantitative approach is healthy, and vice versa. Business and marketing decision makers have always used both approaches, and will continue to need both.5
The distinction between qualitative and quantitative research can be in the context of research designs (as discussed in Chapter 3). There is a close parallel in the distinctions between ‘exploratory and conclusive research’ and ‘qualitative and quantitative research’. There is a parallel, but the terms are not identical. There are circumstances where qualitative research can be used to present detailed descriptions that cannot be measured in a quantifia-ble manner: for example, in describing characteristics and styles of music that may be used in an advertising campaign, or in describing the interplay of how families go through the process of choosing, planning and buying a holiday.6
Conversely, there may be circumstances where quantitative measurements are used con-clusively to answer specific hypotheses or research questions using descriptive or experi-mental techniques. Beyond answering specific hypotheses or research questions, there may be sufficient data to allow data mining or an exploration of relationships between individual measurements to take place.
The nature of qualitative research
Qualitative research encompasses a variety of methods that can be applied in a flexible manner, to enable participants to reflect upon and express their views or to observe their behaviour. It seeks to encapsulate the behaviour, experiences and feelings of participants
Figure 6.1
A classification of marketing research data
Secondarydata
Primaryquantitative
data
Primaryqualitative
data
DescriptionExploration Experiment

152 Marketing Research
in their own terms and context; for example, when conducting research on children, an informal and child-friendly atmosphere is vital, considering features such as the decora-tion of the room with appropriately themed posters.7 Qualitative research is based on at least two intellectual traditions.8 The first, and perhaps most important, is the set of ideas and associated methods from the broad area of in-depth psychology and motivational research.9 This movement was concerned with the less conscious aspects of the human psyche. It led to a development of methods to gain access to individuals’ subconscious and/or unconscious levels. So, while individuals may present a superficial explanation of events to themselves or to others, these methods sought to dig deeper and penetrate the superficial. The second tradition is the set of ideas and associated methods from sociology, social psychology and social anthropology, and the disciplines of ethnography, linguistics and semiology. The emphases here are upon holistic understanding of the world-view of people. The researcher is expected to ‘enter’ the hearts and minds of those they are researching, to develop an empathy with their experiences and feelings. Both traditions have a concern with developing means of communication between the researcher and those being researched. There can be much interaction between the two broad traditions, which in pragmatic terms allows a wide and rich array of techniques and interpretations of collected data.
Qualitative research is a significant contributor to the marketing research industry, accounting for substantial expenditure (around 13% of all spending on marketing research methods).10 If one considers the growth and development of social media research, much of which is qualitative in nature, it is clear to see that this form of research is growing and of major impact upon decision making. In commercial terms, it is a global industry that gener-ates revenues over 1 billion annually. However, it is not just a matter of business value. Qualitative thinking has had a profound effect upon marketing, strategic and design thinking and the marketing research industry as a whole.
Rationale for using qualitative research
It is not always possible, or desirable, to use structured quantitative techniques to obtain information from participants or to observe them. Thus, there are several reasons to use qualitative techniques. These reasons, either individually or in any combination, explain why certain researchers adopt a particular approach (Stage 2 of the marketing research process) to how they conduct research, analyse data and interpret their findings:
1 Preferences and/or experience of the researcher. Some researchers are more oriented and temperamentally suited to do this type of work. Just as some researchers enjoy the challenge of using statistical techniques, there are researchers who enjoy the chal-lenges of qualitative techniques and the interpretation of diverse types of data. Such researchers have been trained in particular disciplines (e.g. anthropology) and philoso-phies (e.g. hermeneutics) that traditionally make use of qualitative research designs and techniques.
2 Preferences and/or experience of the research user. Some decision makers are more oriented to receiving support in a qualitative manner. This orientation could come from their training, but it could also be due to the type of marketing decisions they have to take. Decision makers working in a creative environment of product design, advertising copy or the development of brand ‘personalities’, for example, may have a greater preference for data that will feed such design and visually based decisions. In the following example, consider how decision makers would get to understand and cope with the frustrations felt by consumers. Consider also the implications for a brand

153Chapter 6 Qualitative research: its nature and approaches
if designers and marketers do not fully understand the consumer behaviour that was presented in a visual manner.
Real research I once sat with a women who was ironing for five hours11
Microsoft’s chief design anthropologist, Anne Kirah, set out what she believed was one of her most successful research projects. She watched 40 ordinary, randomly chosen Amer-ican families try to set up and use an early ver-sion of Windows XP. Not one of them managed to do it. After many hours of frustra-tion most ended up furious with Microsoft, and the video she took of these families made a big impact at Microsoft. The first assumption from management was that something was wrong with the people she had chosen, among them a couple in their seventies. What management realised was that, on the contrary, there was something wrong with the way they had been testing software until then: volunteers who had completed the task in laboratory conditions were all tech enthusiasts and therefore not at all representative of the population. Anne says:
I am an observer; that is what an ethnographer is. It is not taking a list of questions you would otherwise ask online and, sitting in someone’s kitchen, asking the same thing. I go to people’s homes when they wake up and leave when they go to bed; I go with them. If they are changing a baby’s nappy, I watch them do it. I once sat with a women who was ironing for five hours. I do not go into homes to study computers. I do not give a damn whether they have a computer or not. If you really want to know what makes people tick, and their motivations and aspirations, that is where innovation comes from. Do not ask them questions, listen to them.
3 Sensitive information. Participants may be unwilling to answer or to give truthful answers to certain questions that invade their privacy, embarrass them, or have a negative impact on their ego or status. Questions that relate to sanitary products and contraception are examples of personally sensitive issues. In business-to-business marketing research, questions that relate to corporate performance and plans are examples of commercially sensitive issues. Techniques that build up an amount of rapport and trust, that allow gentle probing in a manner that suits individual participants, can help researchers get close to participants, and may allow sensitive data to be elicited.
4 Subconscious feelings. Participants may be unable to provide accurate answers to ques-tions that tap their subconscious. The values, emotional drives and motivations residing at the subconscious level are disguised from the outer world by rationalisation and other ego defences. For example, a person may have purchased an expensive sports car to overcome feelings of inferiority. But if asked ‘Why did you purchase this sports car?’ that person may say ‘I got a great deal’, ‘My old car was falling apart’, or ‘I need to impress my customers and clients’. The participants do not have to put words to their deeper emotional drives until researchers approach them! In tapping into those deeper emotional drives, qualitative research can take a path that evolves and is right for the participant.

154 Marketing Research
5 Complex phenomena. The nature of what participants are expected to describe may be difficult to capture with structured questions. For example, participants may know what brands of wine they enjoy, what types of music they prefer or what images they regard as being prestigious. They may not be able to clearly explain why they have these feelings or where these feelings are coming from. The following example illustrates a qualitative research challenge that tapped into and revealed characteristics of sensitive information, subconscious feelings and complex phenomena. The use of visual ethnography for MTV proved to be highly engaging and relevant for the participants.
Real research Visual ethnography at MTV12
MTV Networks (www.mtvne.com) wanted to understand identity construction among young people. Instead of using a traditional ethnographical approach, it used an alter-native approach that combined principles from visual ethnography and netnography. Using pictures for observing individuals in their environment is at the core of visual ethnography. In the early days of visual ethnography, pictures were mainly taken by the observer. A new approach has shifted control towards participants, who take their own (self-relevant) pictures. In line with this new approach, MTV gave full control to the participants. The user-generated ethnography took place in two phases. First, partici-pants got the general instruction to take pictures of all aspects of their lives that they believed that MTV should know about in order to get a better understanding of who they were and to get a sense of their daily lives. Next, at several times they received ‘special tasks’. These tasks were created to make sure that they collected enough ‘rele-vant observations’ in order to help answer the research questions. When creating the special tasks, it was important not to mention the topic of the study directly. Instead, each participant was asked to photograph the context where their identity manifests itself. A special role was assigned to clothes and peers. Clothes are one of the main product categories that teenagers use to express their identity. Participants were there-fore asked to take pictures of clothes that they wear on several different types of occa-sions: clothes that they wear at home as a reflection of their personal identity; clothes that represent their social identity; clothes that give insights into their aspirational iden-tity; clothes that they do not want to wear. A similar reasoning was applied for peers, asking participants to take pictures of the friends and people they find important (social identity), others with whom they are not friends but would like to be friends (aspira-tional identity), adolescents whom they would not like to be friends with (non-group) and others who are different than themselves but still socially acceptable. This last group was included to get a more detailed view on all social groups. To get a better understanding of personal identity, participants were also invited to take pictures of objects that were typical of themselves. Finally, participants were asked to take pictures of the place where they could really be themselves.
6 The holistic dimension. The object of taking a holistic outlook in qualitative research is to gain a comprehensive and complete picture of the whole context in which the phenomena of interest occur. It is an attempt to describe and understand as much as possible about the whole situation of interest. Each scene exists within a multi-layered and interrelated con-text, and it may require multiple methods to ensure the researcher covers all angles. This orientation helps the researcher discover the interrelationships among the various compo-nents of the phenomenon under study. In evaluating different forms of consumer behaviour,

155Chapter 6 Qualitative research: its nature and approaches
the researcher seeks to understand the relationship of different contextual environments upon that behaviour. Setting behaviour into context involves placing observations, experi-ences and interpretations into a larger perspective.13 An example of this may be measuring satisfaction with a meal in a restaurant. A questionnaire can break down components of the experience in the restaurant and quantify the extent of satisfaction with these. But what effect did the ‘atmosphere’ have upon the experience? What role did the type of music, the colour and style of furniture, aromas coming from the kitchen, other people in the restau-rant, the mood when entering the restaurant, feelings of relaxation or tension as the meal went on, contribute to the feeling of atmosphere? Building up an understanding of the interrelationship of the context of consumption allows the qualitative researcher to build up this holistic view. This can be done through qualitative observation and interviewing.
7 Developing new theory. This is perhaps the most contentious reason for conducting quali-tative research. (Chapter 11 details how causal research design through experiments helps to generate theory.) Qualitative researchers may argue that there are severe limitations in conducting experiments on consumers and that quantitative approaches are limited to elaborating or extending existing theory. The development of ‘new’ theory through a qualitative approach is called ‘grounded theory’, which will be addressed later.
8 Interpretation. Qualitative techniques often constitute an important final step in research designs. Large-scale surveys and audits often fail to clarify the underlying reasons for a set of findings. Using qualitative techniques can help to elaborate and explain underlying reasons in quantitative findings.14
Philosophy and qualitative research15
Positivist perspectives
In Chapter 2 we discussed the vital role that theory plays in marketing research. Researchers rely on theory to determine which variables should be investigated, how variables should be operationalised and measured, and how the research design and sample should be selected. Theory also serves as a foundation on which the researcher can organise and interpret find-ings. Good marketing research is founded upon theory and contributes to the development of theory to improve the powers of explanation, prediction and understanding in marketing decision makers.16
The dominant perspective of developing new theory in marketing research has been one of empiricism and, more specifically, positivism. The central belief of a positivist position is a view that the study of consumers and marketing phenomena should be ‘scientific’ in the manner of the natural sciences. Researchers of this persuasion adopt a framework for inves-tigation akin to the natural scientist. For many, this is considered to be both desirable and possible. A fundamental belief shared by positivists is the view that the social and natural worlds ‘conform to certain fixed and unalterable laws in an endless chain of causation’.17 The main purpose of a scientific approach to marketing research is to establish causal laws that enable the prediction and explanation of marketing phenomena. To establish these laws, a scientific approach must have, as a minimum, reliable information or ‘facts’. The emphasis on facts leads to a focus upon objectivity, rigour and measurement.
As an overall research approach (using the description of a paradigm or research approach, as developed in Chapter 2) qualitative research does not rely upon measurement or the establishment of ‘facts’ and so does not fit with a positivist perspective. However, if qualitative research is just seen as a series of techniques, they can be used to develop an understanding of the nature of a research problem and to develop and pilot questionnaires. In other words, the positivist perspective of qualitative research is to see it as a set of tech-niques, applied as preliminary stages to more ‘rigorous’ techniques that measure, i.e. surveys and questionnaires. This use of qualitative techniques is fine but can have many limitations.
TheoryA conceptual scheme based on foundational statements, or axioms, that are assumed to be true.
OperationalisedThe derivation of measurable characteristics to encapsulate marketing phenomena; e.g. the concept of ‘customer loyalty’ can be operationalised through measurements such as the frequency of repeat purchases or the number of years that a business relationship has existed.
EmpiricismA theory of knowledge. A broad category of the philosophy of science that locates the source of all knowledge in experience.
PositivismA philosophy of language and logic consistent with an empiricist philosophy of science.
ParadigmA set of assumptions consisting of agreed-upon knowledge, criteria of judgement, problem fields and ways to consider them.

156 Marketing Research
Conducting in-depth interviews, focus groups or ethnographic techniques can help enor-mously in understanding the language and logic of consumers. In turn, this understanding of a language and logic can strengthen and focus the design of surveys and questionnaires. However, using qualitative techniques just to develop quantitative techniques represents a narrow perspective of their rich, creative and exploratory powers. As an illustration, we will examine how different perspectives of the nature and value of qualitative research can impact upon how a technique may be conducted – in this case, focus group discussions.
The term ‘focus group discussion’ is commonly used across all continents, yet it sub-sumes different ways of applying the technique. There are two main schools of thought that underpin the technique, which may be termed ‘cognitive’ and ‘conative’. The American, Japanese and European illustrations used simplify much of the variations that occur and develop within these two schools. The examples serve to illustrate the origins, thinking and focus that can be adopted in running focus groups:
1 Cognitive. American and Japanese researchers generally follow this tradition, which largely follows a format and interviewing style as used in quantitative studies. ‘American-style groups’ is shorthand in Europe for large groups (10 participants on average), a struc-tured procedure and a strong element of external validation. Within the cognitive approach, the analysis or articulation has been worked on before, and so the interviews are largely meant to confirm or expand on known issues. The following example presents a caricature of the Japanese style of focus group to illustrate a cognitive underpinning.
2 Conative. European researchers generally follow this tradition. This style assumes a different starting point – one that emphasises exploration, with analysis taking place during and after the group. There is less structure to the questions, with group mem-bers being encouraged to take their own paths of discussion, make their own connec-tions and let the whole process evolve.
Real research Japanese focus groups18
The aspiration in using the focus group in Japan is to replicate the often-stimulating, rich and thought-provoking experience (for clients) that one finds in the West. Yet, many of the practices and reflexes in use in the West are at odds with the need at the heart of Japanese research orthodoxy to reduce the bias in the focus group. For instance, the moderator has been discouraged from explaining too much about the concept of the focus group, what marketing research does and what the study at hand is trying to achieve. Sharing such information has been considered contamination of the partici-pants and introducing a bias. For the moderator to show human warmth beyond the strictly polite has likewise been considered a biasing approach. Free expression of opin-ion and having an opinion is a value in Western culture, whereas in Japan it is not. Non-Japanese clients are inevitably frustrated with the failure to achieve a group that engages in an open discussion with the sharing of deep thoughts and opposing statements: peo-ple there do not usually and openly express an opinion on things and people. As part of the quantitative heritage of qualitative research in Japan, and the consequent obsession with avoiding bias, the focus group room has been synthetic, grey and devoid of emo-tion and ‘homeyness’ in an attempt to reach a neutral, bias-free setting. Japanese research has introduced boardrooms and office chairs into rooms with no windows and artificial light on grey walls. Is it a surprise that it is hard for participants to talk about their daily lives and personal matters? The successful application of home-visit and eth-nography research in Japan demonstrates that, in relaxed and humanised conditions, consumers can talk more openly about their inner needs and private thoughts. We

157Chapter 6 Qualitative research: its nature and approaches
Table 6.1 summarises the differences between the American (cognitive) and European (cona-tive) approaches to conducting focus groups. Note the longer duration of the European approach to allow the exploration to develop. To maintain the interest and motivation of participants for this time period, the interview experience must be engaging, stimulating and enjoyable. Interna-tional marketers have always been aware that qualitative research, as it developed in the USA and Europe, involves quite different practices, stemming from different premises and yielding different results. American-style qualitative research started from the same evaluative premise as quantitative research but on a smaller scale. This made it cheaper, quicker and useful for check-ing out the less-critical decisions. European-style qualitative research started from the opposite premise to quantitative research: it was developmental, exploratory and creative rather than eval-uative. It was used as a tool of understanding, to get underneath consumer motivation.19
The American style uses a detailed discussion guide, which follows a logical sequence and is usually strictly adhered to. The interviewing technique involves closed questions and straight answers. This type of research is used primarily to inform about behaviour and to confirm hypotheses already derived from other sources. For this reason, clients who have attended groups often feel they do not need any further analysis; the group interaction supplies the answers. Tran-scripts are rarely necessary and reports are often summarised, or even done away with altogether.
believe that a room with a relaxing décor, music in the background, dimmed lights and even alcohol can help the participant engage in the group situation and offer deeper insight. What this means is that it is important to create a more at-home atmosphere.
Table 6.1
Characteristics Cognitive Conative
Purpose Demonstration Exploration
Sample size 10–12 6–8
Duration 1.5 hours 1.5 to 6 hours
Interviewing Logical sequence Opportunistic
Questions Closed Open
Techniques Straight questions, questionnaires, hand shows, counting
Probing, facilitation, projectives, describing
Response required Give answers Debate issues
Interviewer Moderator Researcher
Observer’s role To get proof To understand
Transcripts Rarely necessary Usually full
Analysis On the spot Time-consuming
Focus of time Preplanning Post-fieldwork
Accusations against other style ‘Formless’ ‘Over-controlling’
Suited for Testing or proving ideas Meaning or understanding
Output To be confirmed in quantitative studies Can be used in its own right to support decision makers
The two schools of thought about ‘focus group discussions’20

158 Marketing Research
The European style is used primarily to gain new insight; it also works as a discussion guide, but in a less structured way. The interviewing technique is opportunistic and probing. Projective techniques are introduced to help researchers understand underlying motivations and attitudes. Because the purpose is ‘understanding’, which requires a creative synthesis of (sometimes unconscious) consumer needs and brand benefits, analysis is time-consuming and usually involves full transcripts.
In the above descriptions of American and European traditions of applying qualitative techniques, it is clear that the American perspective is positivist, i.e. aims to deliver a ‘fac-tual’ impression of consumers. The facts may be established, but they may not be enough; they may not provide the richness or depth of understanding that certain marketing deci-sion makers demand. So, although a positivist perspective has a role to play in developing explanations, predictions and understanding of consumers and marketing phenomena, it has its limitations and critics. In a seminal paper that reviews the evolution and future of qualitative research, the eminent qualitative practitioner Peter Cooper encapsulated the power of focus groups, viewed in a non-positivist manner. He argued that they have deliv-ered and continue to deliver understanding and anticipation of consumers, opening up fac-tors driving choice, adapting to and predicting the changing power and influence of consumers:21
Forming groups has given us primates our evolutionary competitive edge. They enable us to learn, solve problems, communicate, share experiences, and under-stand others. Around the flickering campfire we swapped stories, developed rela-tionships, built up togetherness, groomed one another, resolved conflicts, played games, adopted roles, deceived, told falsehoods, and invented spirits and gods. There is a compulsion about groups that we all share. One explanation is that in the contemporary world where campfires no longer exist and there is reduced opportunity for real social interaction, joining in groups is yearned for. But focus groups are not kinship groups. True, participants are paid to come, but most are made up of people who do not know one another, and are largely drawn from wider circles that happen to have some behaviour in common. We know them as types not as people. This is where their everlasting fascination lies. Participants are often deliberately strangers, ‘virtual’ people, who then disappear. We know that people posture, exaggerate, deceive, but we can step into their shoes for a fleeting few hours.
The dominance of positivist philosophy in marketing research has been and is being chal-lenged by other philosophical perspectives, taken and adapted from disciplines such as anthropology and sociology. These perspectives have helped researchers to develop richer explanations and predictions and especially an understanding and a meaning, as seen through the eyes of consumers.
Interpretivist perspectives
In general, there are considered to be two main research paradigms that are used by market-ing researchers.22 These are the positivist paradigm and the interpretivist paradigm (though these are by no means the only research paradigms that may be adopted by researchers).23 Table 6.2 presents alternative names that may be used to describe these paradigms.
While it may be easier to think of these as quite clear, distinct and mutually exclusive perspectives of developing valid and useful marketing knowledge, the reality is somewhat different. There is a huge array of versions of these paradigms, presented by philosophers, researchers and users of research findings. These versions change depending upon the assumptions of researchers and the context and subjects of their study, i.e. the ultimate nature of the research problem. It has long been argued that both positivist and interpretivist para-digms are valid in conducting marketing research and help to shape the nature of techniques that researchers apply.24

159Chapter 6 Qualitative research: its nature and approaches
In order to develop an understanding of what an interpretivist paradigm means, Figure 6.2 presents characteristic features of the two paradigms.
Comparison of positivist and interpretivist perspectives
The paradigms can be compared through a series of issues. The descriptions of these issues do not imply that any particular paradigm is stronger than the other. In each issue there are relative advantages and disadvantages specific to any research question under investigation. The issues are dealt with in the following subsections.
1 Reality. The positivist supposes that reality is ‘out there’ to be captured. It thus becomes a matter of finding the most effective and objective means possible to draw together infor-mation about this reality. The interpretivist stresses the dynamic, participant-constructed and evolving nature of reality, recognising that there may be a wide array of interpreta-tions of realities or social acts.
Figure 6.2
Paradigm featuresReality
POSITIVISTObjective
ITERPRETIVISTSubjective
ITERPRETIVISTInteracting
ITERPRETIVISTBiased
ITERPRETIVISTPersonal
POSITIVISTIndependent
POSITIVISTUnbiased
POSITIVISTImpersonal
Researcherparticipant
ValuesResearcherlanguage
Theory andresearch design
POSITIVIST
INTERPRETIVIST
• Deduction• Determinist• Cause/e�ect• static• Context free• Laboratory• Prediction/control• Reliability/validity• Representative• Experimentation
• Induction• Freedom of will• Multiple in�uences• Organic/evolving• Context bound• Ethnographic• Understanding• Preceptive decision making• Theoretical sample• Case studies
Table 6.2 Alternative paradigm names
Positivist Interpretivist
1. Quantitative 1. Qualitative
2. Objectivist 2. Subjectivist
3. Scientific 3. Humanistic
4. Experimentalist 4. Phenomenological
5. Traditionalist 5. Revolutionist

160 Marketing Research
2 Researcher–participant. The positivist sees the participant as an ‘object’ to be measured in a reliable or consistent manner. The interpretivist may see participants as ‘peers’, or even ‘companions’, seeking the right context and means of observing and questioning to suit individual participants. Such a view of participants requires the development of rap-port an amount of interaction and evolution of method as the researcher learns of the best means to gain access and elicit information.
3 Values. The positivist seeks to set aside his or her own personal values. The positivist’s measurements of participants are being guided by established theoretical propositions. The task for the positivist is to remove any potential bias. The interpretivist recognises that their own values affect how they observe, question, probe and interpret. The task for interpretivists is to reflect upon and realise the nature of their values and how these impact upon how they observe, question and interpret.
4 Researcher language. In seeking a consistent and unbiased means to measure, the posi-tivist uses a language in questioning that is uniformly recognised. This uniformity may emerge from existing theory (to allow comparability of findings) and/or from the positiv-ist’s vision of what may be relevant to the target group of participants. Ultimately, the positivist imposes a language and logic upon target participants in a reliable or consistent manner. The interpretivist seeks to draw out the language and logic of target participants. The language used may differ between participants and develop in different ways as the interpretivist learns more about a topic and the nature of participants.
5 Theory and research design. In the development of theory, the positivist seeks to establish causality (to be discussed in detail in Chapter 11) through experimental methods. Seeking causality helps the positivist to explain phenomena and hopefully predict the recurrence of what has been observed in other contexts. There are many extraneous variables that may confound the outcome of experiments, hence the positivist will seek to control these vari-ables and the environment in which an experiment takes place. The ultimate control in an experiment takes place in a laboratory situation. In establishing causality through experi-ments, questions of causality usually go hand in hand with questions of determinism; i.e. if everything that happens has a cause, then we live in a determinist universe.
The positivist will go to great pains to diagnose the nature of a research problem and establish an explicit and set research design to investigate the problem. A fundamental element of the positivist’s research design is the desire to generalise findings to a target population. Most targeted populations are so large that measurements of them can only be managed through representative sample surveys. The positivists use theory to develop the consistent and unbiased measurements they seek. They have established rules and tests of the reliability and validity of their measurements, and continually seek to develop more reli-able and valid measurements.
In the development of theory, the interpretivist seeks to understand the nature of multiple influences of marketing phenomena through case studies. The search for multiple influences means focusing upon the intrinsic details of individual cases and the differences between dif-ferent classes of case. This helps the interpretivist to describe phenomena and hopefully gain new and creative insights to understand ultimately the nature of consumer behaviour in its fullest sense. The consumers that interpretivists focus upon, live, consume and relate to prod-ucts and services in a huge array of contexts, hence the interpretivist will seek to understand the nature and effect of these contexts on the chosen cases. The contexts in which consumers live and consume constitute the field in which interpretivists immerse themselves to conduct their investigations. In understanding the nature and effect of context upon consumers, the interpretivist does not consider that everything that happens has a cause and that we live in a determinist universe. There is a recognition and respect for the notion of free will.
The interpretivist will go to great pains to learn from each step of the research process and adapt the research design as their learning develops. The interpretivist seeks to diagnose the
CausalityCausality applies when the occurrence of X increases the probability of the occurrence of Y.
Extraneous variablesVariables other than dependent and independent variables, which may influence the results of an experiment.
DeterminismA doctrine espousing that everything that happens is determined by a necessary chain of causation.
Target populationThe collection of elements or objects that possess the information sought by the researcher and about which inferences are made.
ReliabilityThe extent to which a scale produces consistent results if repeated measurements are made on the characteristic.
ValidityThe extent to which a measurement represents characteristics that exist in the phenomenon under investigation.
Case studyA detailed study based upon the observation of the intrinsic details of individuals, groups of individuals and organisations.

161Chapter 6 Qualitative research: its nature and approaches
nature of a research problem but recognises that a set research design may be restrictive and so usually adopts an evolving research design. A fundamental element of the interpretiv-ist’s research design is the desire to generalise findings to different contexts, such as other types of consumer. However, rather than seeking to study large samples to generalise to tar-get populations, the interpretivist uses theoretical sampling. This means that the data-gath-ering process for interpretivists is driven by concepts derived from evolving theory, based on the notion of seeking out different situations and learning from the comparisons that can be made. The purpose is to go to places, people or events that will maximise opportunities to discover variations among concepts.
Interpretivists use theory initially to help guide which cases they should focus upon, the issues they should observe and the context of their investigation. As their research design evolves they seek to develop new theory and do not wish to be ‘blinkered’ or too focused on existing ideas. They seek multiple explanations of the phenomena they observe and cre-ate what they see as the most valid relationship of concepts and, ultimately, theory. Inter-pretivists seek to evaluate the strength of the theory they develop. The strongest means of evaluating the strength of interpretivist theory lies in the results of decision making that is based on the theory. Interpretivists continually seek to evaluate the worth of the theories they develop. A principal output of research generated by an interpretivist perspective should therefore be findings that are accessible and intended for use. If they are found to be meaningful by decision makers and employed successfully by them, this may constitute further evidence of the theory’s validity. If employed and found lacking, questions will have to be asked of the theory, about its comprehensibility and comprehensiveness and about its interpretation. If it is not used, the theory may be loaded with validity but have little value.
Summarising the broad perspectives of positivism and interpretivism
The positivist seeks to establish the legitimacy of his or her approach through deduction. In a deductive approach, the following process unfolds:
• An area of enquiry is identified, set in the context of well-developed theory, which is seen as vital to guide researchers, ensuring that they are not naïve in their approach and do not ‘reinvent the wheel’.
• The issues upon which to focus an enquiry emerge from the established theoretical frame-work.
• Specific variables are identified that the researchers deem should be measured, i.e. hypotheses are set.
• An ‘instrument’ to measure specific variables is developed.
• ‘Participants’ give answers to set and specific questions with a consistent language and logic.
• The responses to the set questions are analysed in terms of a prior established theoretical framework.
• The researchers test theory according to whether their hypotheses are accepted or rejected. From testing theory in a new context, they seek to develop existing theory incrementally.
Such a process means that positivists reach conclusions based upon agreed and measurable ‘facts’. The building and establishment of ‘facts’ forms the premises of deductive argu-ments. Deductive reasoning starts from general principles from which the deduction is to be made, and proceeds to a conclusion by way of some statement linking the particular case in question.
A deductive approach has a well-established role for existing theory: it informs the devel-opment of hypotheses, the choice of variables and the resultant measures.25 Whereas the deductive approach starts with theory expressed in the form of hypotheses, which are then
Theoretical samplingData-gathering driven by concepts derived from evolving theory and based on the concept of ‘making comparisons’.
DeductionA form of reasoning in which a conclusion is validly inferred from some premises, and must be true if those premises are true.
Evolving research designA research design where particular research techniques are chosen as the researcher develops an understanding of the issues and participants.

162 Marketing Research
tested, an inductive approach avoids this, arguing that it may prematurely close off possible areas of enquiry.26
The interpretivist seeks to establish the legitimacy of their approach through induction. In an inductive approach, the following process unfolds:
• An area of enquiry is identified, but with limited or no theoretical framework. Theoretical frameworks are seen as restrictive, narrowing the researcher’s perspective and an inhibi-tor to creativity.
• The issues upon which to focus an enquiry are either observed or elicited from partici-pants in particular contexts.
• Participants are aided to explain the nature of issues in a particular context.
• Broad themes are identified for discussion, with observation, probing and in-depth ques-tioning to elaborate the nature of these themes.
• The researchers develop their theory by searching for the occurrence and interconnection of phenomena. They seek to develop a model based upon their observed combination of events. Such a process means that interpretivists reach conclusions without ‘complete evidence’.
With the intense scrutiny of individuals in specific contexts that typify an interpretivist approach, tackling large ‘representative’ samples is generally impossible. Thus, the validity of the interpretivist approach is based upon ‘fair samples’. Interpretivists should not seek only to reinforce their own prejudice or bias, seizing upon issues that are agreeable to them and ignoring those that are inconvenient. If they are to argue reasonably, they should coun-teract this tendency by searching for conflicting evidence.27 Their resultant theory should be subject to constant review and revision.
InductionA form of reasoning that usually involves the inference that an instance or repeated combination of events may be universally generalised.
Ethnographic research
It is clear that an interpretive approach does not set out to test hypotheses but to explore the nature and interrelationships of marketing phenomena. The focus of investigation is a detailed examination of a small number of cases rather than a large sample. The data col-lected are analysed through an explicit interpretation of the meanings and functions of con-sumer actions. The product of these analyses takes the form of verbal descriptions and explanations (sometimes supported by visuals or other forms of art), with quantification and statistical analysis playing a subordinate role. These characteristics are the hallmark of a research approach that has developed and been applied to marketing problems over many years in Europe, and increasingly so across the globe. This research approach is one of eth-nographic research.
Ethnography as a general term includes observation and interviewing and is sometimes referred to as participant observation. It is, however, used in the more specific case of a method that requires a researcher to spend a large amount of time observing a particular group of people, by sharing their way of life.28 Ethnography is the art and science of describ-ing a group or culture. The description may be of a small tribal group in an exotic land or a toy factory in Poland. The task is much like the one taken on by the investigative reporter, who interviews relevant people, reviews records, takes photographs, weighs the credibility of one person’s opinions against another’s, looks for ties to special interests and organisa-tions and writes the story for a concerned public and for professional colleagues. A key dif-ference between the investigative reporter and the ethnographer, however, is that whereas the journalist seeks out the unusual, the murder, the plane crash, or the bank robbery, the ethnographer writes about the routine daily lives of people. The more predictable patterns of human thought and behaviour are the focus of enquiry.29
The origins of ethnography are in the work of nineteenth-century anthropologists who travelled to observe different pre-industrial cultures. An example in a more contemporary
EthnographyA research approach based upon the observation of the customs, habits and differences between people in everyday situations.

163Chapter 6 Qualitative research: its nature and approaches
Ethnography cannot reasonably be classified as just another single method or technique.33 In essence, it is a research discipline based upon culture as an organising concept and a mix of both observational and interviewing tactics to record behavioural dynamics. Above all, ethnography relies upon entering participants’ natural-life worlds, at home, while shopping, at leisure and in the workplace. The researcher essentially becomes a naïve visitor in that world by engaging participants during realistic product-usage situations in the course of daily life. Whether called on-site, observational, naturalistic or contextual research, ethno-graphic methods allow marketers to delve into actual situations in which products are used, services are received and benefits are conferred. Ethnography takes place not in laboratories but in the real world. Consequently, clients and practitioners benefit from a more holistic and better nuanced view of consumer satisfactions, frustrations and limitations than in any other research method.34
Researchers apply ethnographic methods in natural retail or other commercial environ-ments in order to fully appreciate the nature of consumer experiences. There are several objectives that lie behind these studies, one of which is oriented towards a detailed ecologi-cal analysis of sales behaviour. In other words, consumer interactions with all of the ele-ments that comprise retail store environments: lighting, smells, signage, display of goods, the location, size and orientation of shelving. Observing how these may impact upon the consumers’ experience and their ultimate buying behaviour can be of great value to design-ers and marketers. The ethnographer’s role is to decode the meaning and impact of these ecological elements. Often, these studies utilise time-lapse photography as a tool for behav-ioural observation and data collection over extensive periods of time, and can avoid actual interaction with consumers.
Ethnographic research achieves this immersion with consumers through the following aims:
• Seeing through the eyes of others. Viewing events, actions, norms and values from the perspective of the people being studied.
context could be the study of death rituals in Borneo, conducted over a period of two years by the anthropologist Peter Metcalf.30 Today, ‘ethnography’ encompasses a much broader range of work, from studies of groups in one’s own culture, through experimental writing, to political interventions. Moreover, ethnographers today do not always ‘observe’, at least not directly. They may work with cultural artefacts, such as written texts, or study recordings of interactions they did not observe at first hand,31 or even, as in the following example, the observations of teenagers as viewed through photographs taken on their mobile phones.
Real research Chocolate or mobile? 32
Ayobamidele Gnädig and Oliver Schieleit are project directors at the German qualitative research agency H.T.P. Concept (www.htp-concept.de). They asked teenagers to photo-blog their snacking habits with their mobile phones and saw that many of these were ‘boredom-relief’ moments where they were waiting for trains, buses or friends who were late for an appointment. When they spent time with them, a whole day or just an after-noon, they saw this moment crop up time and again. They also believe they witnessed a change, in that these moments were increasingly being filled differently than maybe five or ten years ago. Instead of quickly buying a Mars bar at the nearby kiosk, a young teen was just as likely to spend time waiting for a bus in writing text messages to friends. This meant that, in some contexts, the text message had become ‘top of the mind’ over the chocolate bar. Through understanding by observing and not by probing the dynamics, H.T.P. Concept offered a first step for chocolate brands to develop new ideas, communi-cations and distribution concepts to address this opportunity.

164 Marketing Research
• Description. Built up in many written and visual forms to provide clues and pointers to the layers of ‘reality’ experienced by consumers.
• Contextualism. Attending to mundane detail to help understand what is going on in a par-ticular context. Whatever the sphere in which the data are being collected, events can be best understood when they are situated in the wider social and historical context.
• Process. Viewing social life as involving an interlocking series of events.
• Avoiding early use of theories and concepts. Rejecting premature attempts to impose theor-ies and concepts that may exhibit a poor fit with participants’ perspectives. This will be developed further in this chapter when we examine grounded theory.
• Flexible research designs. Ethnographers’ adherence to viewing social phenomena through the eyes of their participants or subjects has led to a wariness regarding the impo-sition of prior and possibly inappropriate frames of reference on the people they study. This leads to a preference for an open and unstructured research design, which increases the possibility of coming across unexpected issues.
The following example displays characteristics of all the above aims and introduces new developments in ethnography as applied in marketing research.
Real research Netnography at Nivea35
Nivea is the best-known brand of the multi-national corporation Beiersdorf, based in Hamburg, Germany. In order to integrate the voice of consumers beyond traditional mar-keting research techniques, such as concept tests or focus groups, the Nivea Body Care Division instituted a holistic co-creation pro-cess that included the application of netnog-raphy. They used this approach to start new-product development, helping R&D to immerse and orientate itself in the consumers’ world. The goal was to draw a landscape of needs, wishes, concerns, consumer language and potential product solutions by users, which were explicitly and implicitly expressed in online communities and social media. They started with a broad search of more than 200 online communities, forums and blogs in three languages, screening all kinds of ‘consumer tribes’ that have emerged online. The most relevant and insightful communities and forums on cosmetics, health, lifestyle, fashion, sports and do-it-yourself were observed and analysed, examples being beauty24.de, bubhub.com.au, badgerandblade.com, glamour.de or undershirtguy.com. To follow this search, threads of consumer conversations were analysed using qualitative data software. In the field of deodorants, the consumer dialogue revealed that users speak about a number of issues revolving around the buying, application and effective-ness of deodorants in their own language and with a distinct classification. In order to overcome issues consumers also resorted to self-made remedies or diverted substances from their intended use. Certain needs, concerns or suggestions for product improve-ments repeatedly occurred in consumers’ online conversations. Those ‘gold nuggets’ , i.e. fresh, relevant, inspiring and enduring findings, were then aggregated to consumer insights. For example, one consumer insight introduced Nivea to do-it-yourself solu-tions that were exchanged between users online. Those self-made remedies were sys-tematically structured, depicted and supported by a coding report of consumer

165Chapter 6 Qualitative research: its nature and approaches
This example introduces the method of netnography, an adaptation of ethnography that analyses the free behaviour of individuals in online environments.36 Observing online communities can be much faster, simpler and less expensive than traditional ethnography. It is also unelicited, so more natural and unobtrusive than surveys and interviews. Net-nography can refer to the passive process of following conversations and interactions on the internet at the individual level; this was the approach taken by Nivea. It can also involve a more active engagement with consumers on the net directing questions, or becoming a participant observer in a community.37 Passive or active netnography approaches create privacy, security and safety challenges for researchers. Social media have changed the rules on how ‘findable’ somebody is. This has enormous implications for privacy and safety. Debates about what is ‘in the public domain’, and what can be used when, where and how, will impact enormously upon the development of codes of conduct for researchers. The use of social media data and mobile devices are both increas-ingly important as part of ethnographic research respectively (and are covered in more detail in Chapters 17 and 18 respectively).
Irrespective of ethical challenges they may bring, the use of ethnographic approaches has rapidly developed in marketing research. The Nivea example illustrates a very creative and engaging use of netnography as part of a co-creation process. Co-creation is the practice of developing new designs, including products or marketing communications, through collabo-ration with consumers. In the early 2000s, large advertisers including Nike established suc-cessful co-creation projects. The Danish toy company Lego was another advocate of co-creation, with a project beginning in 2004 signing up ‘master-builders’ to help design products. Initially, only four people were invited to join; the following year 10 collaborators joined, followed by 100 from 10,000 consumers who applied.38 Enthusiasm for what Lego was doing spread to the blogosphere and to social networks, with a host of unofficial web-sites set up by fans suggesting further innovations to the firm.39
One of the key features of all the descriptions and illustrations of forms of ethnogra-phy is the context in which the consumer is behaving. The researcher observes people experiencing, taking in and reacting to communications, product and services and retail experience all behaving naturally in the set context. For example, in the context of shop-pers this does not just mean the retail outlet they visit. The processes of choosing and buying products, of using products or giving them as gifts, of reflecting upon and plan-ning subsequent purchases, are all affected by contextual factors. Context operates on several levels, including the immediate physical and situational surroundings of con-sumers, as well as language, character, culture and history. Each of these levels can provide a basis for the meaning and significance attached to the roles and behaviour of consumption:40
Can we divorce the ways we buy, use and talk about products from the cultural and linguistic context within which economic transitions occur? The answer is an emphatic NO.
The ethnographer may observe the consumer acting and reacting in the context of con-sumption. The ethnographer may see a shopper spending time reading the labels on cat food, showing different brands to their partner, engaged in deep conversation, pondering, getting
NetnographyAn adaptation of ethnography that analyses the free behaviour of individuals in online environments.
Co-creationThe practice of developing new designs, including products or marketing communications, through collaboration with consumers.
statements. The consumer insights helped Beiersdorf to develop a deep understanding of consumers, the language they use and what truly bothers them. Applying the netnog-raphy method, Beiersdorf was able to identify trends in the field of body care and obtain innovative product and marketing ideas. In the final step of the netnography, product designers joined the research team and helped to interpret and translate the consumer insights into initial products.

166 Marketing Research
frustrated and putting tins back on the shelf. The ethnographer may see the same shopper more purposefully putting an expensive bottle of cognac into a shopping trolley without any discussion and seemingly with no emotional attachment to the product. The ethnographer may want to know what is going on. How may the consumer explain their attitudes and moti-vations behind this behaviour? This is where the interplay of observation and interviewing helps to build such a rich picture of consumers. In questioning the shopper in the above exam-ple, responses of ‘we think that Rémy Martin is the best’ or ‘we always argue about which are the prettiest cat food labels’ would not be enough. The stories and contexts of how these assertions came to be would be explored. The ethnographer does not tend to take simple explanations for activities that, in many circumstances, may be habitual to consumers. Ethno-graphic practice takes a highly critical attitude towards expressed language. It challenges our accepted words at face value, searching instead for the meanings and values that lie beneath the surface. In interviewing situations, typically this involves looking for gaps between expressed and non-verbal communication elements. For example, if actual practices and facial and physical gestures are inconsistent with a participant’s expressed attitudes towards the expensive cognac, we are challenged to discover both the reality behind the given answer and the reasons for the ‘deception’.
Ethnographic research is also effective as a tool for learning situationally and culturally grounded language – the appropriate words for everyday things, as spoken by various age or ethnic groups. Copywriters and strategic thinkers are always pressed to talk about products and brands in evocative and original ways. Ethnography helps act as both a discovery and an evaluation tool.41 To summarise, ethnographic approaches are useful when the marketing research objectives call for:42
1 High-intensity situations. To study high-intensity situations, such as a sales encounter, meal preparation and service or communication between persons holding different levels of authority.
2 Behavioural processes. To conduct precise analyses of behavioural processes, e.g. radio listening behaviour, home-computer-purchasing decisions or home-cleaning behaviour.
3 Memory inadequate. To address situations where the participant’s memory or reflection would not be adequate. Observational methods can stand alone or can complement inter-viewing as a memory jog.
4 Shame or reluctance. To work with participants who are likely to be ashamed or reluc-tant to reveal actual practices to a group of peers. If they were diabetic, for example, participants may be reluctant to reveal that they have a refrigerator full of sweet snacks something that an ethnographic observer would be able to see without confronting the subject.
In these applications, the ethnographer is expected to analyse critically the situations observed. The critique or analysis can be guided by theory but, in essence, the researcher develops a curiosity, thinks in an abstract manner and at times steps back to reflect and see how emerging ideas connect. By reacting to the events and participants as they face them, to draw out what they see as important, ethnographers have the ability to create new explana-tions and understandings of consumers. This ability to develop a new vision, to a large extent unrestricted by existing theory, is the essence of a grounded theory approach, which is explained and illustrated in the next section. Before we evaluate the nature and application of grounded theory, it is worth examining one final example of an ethnographic study that embraces the idea of ‘listening’.
Listening involves the evaluation of naturally occurring conversations, behaviours and signals. The information that is elicited may or may not be guided, but it brings the voice of consumers’ lives to brand. Every day, millions of consumers talk about all aspects of their
ListeningListening involves the evaluation of naturally occurring conversations, behaviours and signals. The information that is elicited may or may not be guided, but it brings the voice of consumers’ lives to brand.

167Chapter 6 Qualitative research: its nature and approaches
lives online. This wealth of naturally occurring consumer expression offers the opportunity to understand consumers on their terms, using their language and logic. Due to the internet, high-speed access and the ‘conversational webs’ of blogs, forums, social networks, Twitter, communities and wikis, people are talking with one another about their problems, experi-ences, likes and dislikes, life in general, and their feelings and experiences of brands. By tuning in to relevant conversations (i.e. by listening), it is argued that more can be learned about consumer attitudes and needs than through traditional ‘questioning’ methods alone. Advocates of listening approaches would argue that researchers have interacted with ‘par-ticipants’ on their terms: they ask the questions they want to ask, the way they want to ask them, when they want to ask them. This can be seen as intrusive and out of step with the lives of consumers and is not conducive to developing a thorough, context-laden under-standing of consumer opinions and needs.43 By listening, researchers may be able to learn more about consumers and prospects by understanding the natural, rich, unfiltered word of mouth around products and service experiences. This approach is illustrated in the follow-ing example.
Real research The essentials of listening at Hennessy Cognac44
Hennessy (www.hennessy.com), the leading cognac brand, discovered a rising trend in links made between its company website and BlackPlanet.com, the largest social net-work for African-Americans. Digging deeper, Hennessy learned that numbers of Black-Planet members linked their personal pages to Hennessy’s site. Some went further, decorating their pages with borrowed images of Hennessy brands. By listening to signals embedded in linking behaviour, Hennessy had stumbled upon a passionate market it was not aware of. Interested to learn more about these consumers, Hennessy then stud-ied a random sample of BlackPlanet member web pages to understand their themes and use of brand imagery. Hennessy also commissioned an online survey with research part-ner CRM Metrix (www.crmmetrix.com) to profile audience attitudes, usage and influ-ence. Hennessy discovered that visions of the Hennessy brand expressed in the member pages ‘were not necessarily ours, but this does not make them any less valid’. Research showed that ‘the brand belongs as much to its consumers as to its managers . . . We must listen without prejudice.’ Stated another way, this was a shining illustration of customer ‘co-creation’ and extraordinary brand engagement. The survey data described 8 of 10 of these individuals as ‘high-value’ consumers, with a strong influence on the alcohol choices of people around them. About half the participants were opinion leaders, a higher-than-usual percentage. Recognising the inherent and potential long-term value in BlackPlanet members, Hennessy then sought to learn what would improve its site and make it more interesting and enjoyable. Hennessy went further than just tweaking the site; it asked for and listened to suggestions about ‘what would make your experience of drinking Hennessy cognacs more enjoyable?’. Realising that BlackPlanet members enjoyed drinking socially and mixing Hennessy into drinks, it added recipes highlighting cognac as an ingredient and offered Hennessy-branded e-invitations for parties. Five years after the initial round of responses, the Hennessy site showed the brand’s ongoing commitment to listening and evolving the relationship and experience. In 2009, Hennessy’s ‘Artistry’ initiative sponsored musicians and music tours, streamed music and showcased artists. Hennessy also added a social networking component by creating a presence on Facebook and YouTube.

168 Marketing Research
Grounded theory
The tradition of grounded theory was developed by Glaser and Strauss in the late 1950s and published in their seminal work The Discovery of Grounded Theory in 1967.45 At that time, qualitative research was viewed more as impressionistic or anecdotal, little more than ‘soft science’ or journalism.46 It was generally believed that the objective of sociology should be to produce scientific theory, and to test this meant using quantitative methods.47 Qualitative research was seen to have a place, but only to the extent to which it developed questions that could then be verified using quantitative techniques. Glaser and Strauss accepted that the study of people should be scientific, in the way understood by quantitative researchers. This meant that it should seek to produce theoretical propositions that were test-able and verifiable, produced by a clear set of replicable procedures. Glaser and Strauss defined theory as follows:48
theory in sociology is a strategy for handling data in research, providing modes of conceptualization for describing and explaining. The theory should provide clear enough categories and hypotheses so that crucial ones can be verified in present and future research; they must be clear enough to be readily operationalized in quantitative studies when these are appropriate.
The focus upon developing theory was made explicit in response to criticisms of ethno-graphic studies that present lengthy extracts from interviews or field observations. Strauss sought to reinforce his view of the importance of theory, illustrated by the following quote:49
much that passes for analysis is relatively low-level description. Many quite esteemed and excellent monographs use a great deal of data, quotes or field note selections. The procedure is very useful when the behavior being studied is rela-tively foreign to the experiences of most readers or when the factual assertions being made would be under considerable contest by skeptical and otherwise rela-tively well-informed readers. Most of these monographs are descriptively dense, but alas theoretically thin. If you look at their indexes, there are almost no new concepts listed, ones that have emerged in the course of research.
In contrast to the perhaps casual manner in which some ethnographers may be criticised for attempts at developing theory, the grounded theorist follows a set of systematic procedures for collecting and analysing data. This systematic procedure is used to encourage researchers to use their intellectual imagination and creativity to develop new theories, to suggest meth-ods for doing so, to offer criteria to evaluate the worth of discovered theory and to propose an alternative rhetoric of justification.50 The most distinctive feature of grounded theory is its commitment to ‘discovery’ through direct contact with the social phenomena under study, coupled with a rejection of a priori theorising. This feature does not mean that researchers should embark on their studies without any general guidance provided by some sort of theo-retical understanding. It would be nigh on impossible for a researcher to shut out the ideas in the literature surrounding a particular subject. However, Glaser and Strauss argued that pre-conceived theories should be rejected, as they obstruct the development of new theories by coming between researchers and the subjects of their study. In other words, the strict adher-ence to developing new theory built upon an analytical framework of existing theory can result in ‘narrow-minded’ researchers who do not explore a much wider range of explana-tions and possibilities. With the rejection of a priori theorising and a commitment to imagi-native and creative discovery comes a conception of knowledge as emergent. This knowledge is created by researchers in the context of investigative practices that afford them intimate contact with the subjects and phenomena under study.51
The following example illustrates the use of grounded theory in the development of theory related to how advertising works. The study was conducted by a senior marketing research professional and a professor of advertising. The example is then followed by a description of the process involved in developing theory through a grounded theory process.52
Grounded theoryA qualitative approach to generating theory through the systematic and simultaneous process of data collection and analysis.

169Chapter 6 Qualitative research: its nature and approaches
Real research Agency practitioners’ meta-theories of advertising53
What do advertising agency practitioners think about how advertising works? This study’s basic aim was to understand practi-tioners’ thinking about the work of advertis-ing in their own terms. As there was little substantive research of this perspective, a grounded theory approach to qualitative research was used. Semi-structured, in-depth interviews were used as the key field method; these allowed the discovery of participant- determined points of view. Preliminary prep-arations for data collection started well before actual interviewing. Informal inter-views were conducted with qualitative–eth-nographic experts. Email and phone conversations were exchanged about the fea-sibility of the project, opinions about method and tips for effective interviewing were exchanged. Based on the insights gained in these preparations and from the relevant lit-erature, an initial interview guide was developed. This was built around three questions: (1) what the content of practitioners’ knowledge is; (2) how practitioners know what they know; and (3) how they use this knowledge in everyday practice. The interview guide used both opening ‘grand tour’ questions as well as more specific probes. Twenty-eight participants were interviewed until theoretical saturation was achieved (i.e. concepts were identified and linked to other concepts until no new information was obtained). Three occupational groups were interviewed: account managers, account planners and creative directors. Interviews lasted from 45 to 90 minutes. Most took place in the par-ticipants’ offices. Practitioners were encouraged to talk freely but were also probed using academic theories in the early stages of the interviews for comparative purposes. Exten-sive field notes were composed immediately following the interviews. These reflections helped refine ways of asking questions and with the development of emerging concepts. The field notes were entered into the NVivo (www.qsrinternational.com) qualitative data analysis software. The findings, presented in a manuscript format, were checked with participants. They agreed that the content accurately reflected their thoughts. This study was the first attempt to get at agency practitioners’ fundamental presuppositions about advertising knowledge in a thoroughly holistic and theoretically informed way.
Attempting to gain an objective viewpoint
Much of the thinking and application of qualitative data analysis is inextricably linked to the collection of data (as will be discussed in detail in Chapter 9). For the grounded theorist, data collection and analysis occur in alternating sequences. Analysis begins with the first inter-view and observation, which leads to the next interview or observation, followed by more analysis, more interviews or fieldwork and so on. It is the analysis that drives the data collec-tion. Therefore there is a constant interplay between the researcher and the research act. Because this interplay requires immersion in the data, by the end of the enquiry the researcher is shaped by the data, just as the data are shaped by the researcher. The problem that arises

170 Marketing Research
during this mutual shaping process is how one can become immersed in the data and main-tain a balance between objectivity and sensitivity. It could be argued that objectivity is nec-essary to arrive at an impartial and accurate interpretation of events. Sensitivity is required to perceive the subtle nuances and meanings of data and to recognise the connections between concepts. Both objectivity and sensitivity are necessary in making sense of data and creating insight. Objectivity enables the researcher to have confidence that the findings are a reason-able, impartial representation of a problem under investigation, whereas sensitivity enables creativity and the discovery of new theory from data.54
During the analytic process, grounded researchers attempt to set aside their knowledge and experience to form new interpretations about phenomena. Yet, in their everyday lives, they rely on knowledge and experience to provide the means for helping them to understand the world in which they live and to find solutions to problems encountered. Most researchers have learned that a state of objectivity is impossible and that in every piece of research, quan-titative or qualitative, there is an element of subjectivity. What is important is to recognise that subjectivity is an issue and that researchers should take appropriate measures to mini-mise its intrusion into their investigations and analyses. Being objective means a constant drive for transparency in the actions, decisions and conclusions taken in relation to data.
Qualitative researchers should have an openness, a willingness to listen and to ‘give voice’ to participants, in whatever manner they wish to express themselves. This is particu-larly important given the array of forms of expression that are possible through social media. Good qualitative research means hearing what others have to say, seeing what others do and representing these as accurately as possible. It means developing an understanding of those they are researching, while recognising that their understanding is often based on the values, culture, training and experiences that they bring from all aspects of their lives; these can be quite different from those of their participants.55 As well as being open to participants, qual-itative researchers should reflect upon what makes them, as observers, ‘see’ and ‘listen’ in particular ways. This usually means that, while working on a particular project, the researcher keeps a diary or journal. This diary is used to make notes about the conditions of interviews and observations, of what worked well and what did not, of what questions the researcher would have liked to ask but did not think of at the time. As the researcher reads through the diary in the analysis process, the entries become part of the narrative explored, and reveal to the researcher and to others the way the researcher has developed their ‘seeing’ and ‘listen-ing’. (Again, research diaries will be covered in more detail in examining qualitative data analysis in Chapter 9.)
Developing a sensitivity to the meanings in data
Having sensitivity means having insight into, and being able to give meaning to, the events and happenings in data. It means being able to see beneath the obvious to discover the new. This quality of the researcher occurs as they work with data, making comparisons, asking questions and going out and collecting more data. Through these alternating processes of data collection and analysis, meanings that are often elusive at first later become clearer. Immersion in the data leads to those sudden insights.56 Insights do not just occur haphaz-ardly; rather, they happen to prepared minds during interplay with the data. Whether we want to admit it or not, we cannot completely divorce ourselves from who we are and what we know. The theories that we carry around in our heads inform our research in multiple ways, even if we use them quite unselfconsciously.57
Ultimately, a grounded theory approach is expected to generate findings that are mean-ingful to decision makers and appropriate to the tasks they face. Ethnographic techniques are well suited to being driven by a grounded research approach. As with other interpretivist forms of research, if it is found meaningful by decision makers and employed successfully by them, there is further evidence of the theory’s validity. Another qualitative approach that is absolutely meaningful to decision makers in that its primary focus is to deliver actionable results is called action research.

171Chapter 6 Qualitative research: its nature and approaches
Action research
Background
The social psychologist Kurt Lewin had an interest in social change, and specifically in questions of how to conceptualise and promote social change. Lewin is generally thought to be the person who coined the term ‘action research’ and gave it meanings that are appli-cable today.58 In action research, Lewin envisaged a process whereby one could construct a social experiment with the aim of achieving a certain goal.59 The classic case of the ori-gins of action research comes from the early days of the Second World War. The case revolved around a problem that essentially was a traditional marketing research challenge. Lewin was commissioned by the US authorities in their quest to use tripe as part of the regular daily diet of American families.60 The research question was: ‘To what extent could American housewives be encouraged to use tripe rather than beef for family din-ners?’ Choice cuts of beef were scarce at this time and were destined primarily for the fighting troops.
Lewin’s approach to this research question was to conduct a study in which he trained a limited number of housewives in the art of cooking tripe for dinner. He then surveyed how this training had an effect on their daily cooking habits in their own families. In this case, action research was synonymous with a ‘natural experiment’, meaning that the researchers in a real-life context invited participants into an experimental activity. This research approach was very much within the bounds of conventional applied social science, with its patterns of authoritarian control, but it was aimed at producing a specific, desired social outcome.
The above example can be clearly seen from a marketing perspective. It is easy to see a sample survey measuring attitudes to beef, to tripe, to feeding the family and to feelings of patriotism. From a survey, one can imagine advertisements extolling the virtues of tripe, how tasty and versatile it is. But would the campaign work? Lewin’s approach was not just to understand the housewives’ attitudes but to engage them in the investigation and the solu-tion: to change attitudes and behaviour.
Lewin is credited with coining a couple of important slogans within action research that hold resonance with the many action researchers that practise today. The first is ‘nothing is as practical as a good theory’ and the second is ‘the best way to try to understand something is to change it’. In action research it is believed that the way to ‘prove’ a theory is to show how it provides an in-depth and thorough understanding of social structures – understanding gained through planned attempts to invoke change in particular directions. The appropriate changes are in the proof. Lewin’s work was a fundamental building block of what today is called action research. He set the stage for knowledge production based on solving real-life problems. From the outset, he created a new role for researchers and redefined criteria for judging the quality of the enquiry process. Lewin shifted the researcher’s role from being a distant observer to involvement in concrete problem solving. The quality criteria he devel-oped for judging a theory to be good focused on its ability to support practical problem solv-ing in real-life situations.61
From Lewin’s work has developed a rich and thriving group of researchers who have developed and applied his ideas throughout the world. In management research, the study of organisational change with the understanding and empowerment of different managers and workers has utilised action research to great effect. There has been comparatively little appli-cation of action research in marketing research, though that is changing. Researchers and marketing decision makers alike are learning of the nature of action research, the means of implementing it and the benefits it can bestow. In an era where marketers, designers (of brands, products, communications and a whole array of consumer experiences) and consum-ers in co-creation projects are working more closely together, action research holds many rich possibilities.
Action researchA team research process, facilitated by a professional researcher(s), linking with decision makers and other stakeholders who together wish to improve particular situations.

172 Marketing Research
Approach
The term ‘action research’ includes a whole range of approaches and practices, each grounded in different traditions, in different philosophical and psychological assumptions, sometimes pursu-ing different political commitments. Sometimes it is used to describe a positivist approach in a ‘field’ context, or where there is a trade-off between the theoretical interests of researchers and the practical interests of organisation members. Sometimes it is used to describe relatively uncrit-ical consultancy based on information gathering and feedback.62 It is beyond the scope of this text to develop these different traditions, so the following describes an approach that is grounded in the Lewin foundations of the approach, and, like his work, is applicable to marketing.
Action research is a team research process, facilitated by one or more professional researchers linking with decision makers and other stakeholders, such as customers, who together wish to change or improve particular situations. Together, the researcher and deci-sion makers or stakeholders define the problems to be examined, generate relevant knowl-edge about the problems, learn and execute research techniques, take actions and interpret the results of actions based on what they have learned.63 There are many iterations of prob-lem definition, generating knowledge, taking action and learning from those actions. The whole process of iteration evolves in a direction that is agreed by the team.
Action researchers accept no a priori limits on the kinds of research techniques they use. Surveys, secondary data analyses, interviews, focus groups, ethnographies and life histories are all acceptable, if the reason for deploying them has been agreed by the action research collaborators and if they are used in a way that does not oppress participants.
Action research is composed of a balance of three elements. If any one of the three is absent, then the process is not action research:
1 Research. Research based on any quantitative or qualitative techniques, or combination of them, generates data, and in the analyses and interpretation of the data there is shared knowledge.
2 Participation. Action research involves trained researchers who serve as facilitators and ‘teachers’ to team members. As these individuals set their action research agenda, they gen-erate the knowledge necessary to transform the situation and put the results to work. Action research is a participatory process in which everyone involved takes some responsibility.
3 Action. Action research aims to alter the initial situation of the organisation in the direc-tion of a more self-managed and more rewarding state for all parties.
An example of an action research team in marketing terms could include:
• Researchers. Trained in a variety of qualitative and quantitative research techniques, and with experience of diagnosing marketing and research problems.
• Strategic marketing managers. Decision makers who work at a strategic level in the organisation and have worked with researchers, as well as those who have no experience of negotiating with researchers.
• Operational marketing managers. Decision makers who have to implement marketing activities. These may be the individuals who meet customers on a day-to-day basis and who really feel the impact and success of marketing ideas.
• Advertising agency representatives. Agents who have worked with strategic decision makers. They may have been involved in the development of communication campaigns to generate responses from target groups of consumers.
• Customers. Existing customers who may be loyal and have had many years of experience of the company (initiating and funding the action research), its products and perhaps even its personnel.
• Target customers. Potential customers who may be brand switchers or even loyal custom-ers to competitive companies.

173Chapter 6 Qualitative research: its nature and approaches
Figure 6.364 illustrates how action research may be applied. This model of action research is taken from the subject area of the management of change, which is relevant to many of the problems faced by marketing decision makers. The process aims to create a learning com-munity in a team such as that above. The team develops an understanding of issues to the extent that it makes sound judgements and takes effective action to implement the changes it wishes to make.
Figure 6.3
The action research approach Diagnosis
Evaluation
Action Feedback
Analysis
Learningprocess
The process in Figure 6.3 can be described as follows:
• Diagnosis. The present state of affairs would be set out, including the perceived barriers to change and an initial broad statement of desired direction for the organisation. Diagno-sis would include documenting the change process and all data-gathering activities, such as secondary data gathering, surveys, interviews or observations.
• Analysis. An initial interpretation of data gathered would be made. From this the issues to be tackled would be identified. Summary findings and the development of a framework, with set tasks for team members in subsequent data gathering, would be drawn up.
• Feedback. Data analyses would be fed back for examination and discussion in the team. ‘Ownership’ of the diagnosis would be developed to formulate a commitment to action.
• Action. Individual courses of action and the development of broader strategies would be formulated.
• Evaluation. There would be an ongoing review of methods and outcomes. The effective-ness of any action would be evaluated against agreed criteria and critical success factors.
All of these stages are interrelated, so there is no definitive path that the team would take. In subsequent iterations of activities, the team could move around the stages in any order that suits its needs.
The process is illustrated in the following example, where action research was used in the development process of a new product. The detail of the case is limited, but there is sufficient to see action research being successfully practised in a manner that brings together a team with diverse forms of thinking and expertise.

174 Marketing Research
Real research The dissolution of the demarcation lines between clients, researchers and consumers65
To obtain an optimum number of results usable for the development process of a new product, a joint research approach was chosen by Deutsche Telekom Laboratories (www.laboratories.telekom.com). The idea was to combine ‘the best of three worlds’ by forming one team of researchers experienced in the field of consumer segmentation and qualitative research methods (members of Sinus Sociovision, www.sinus-institut.de) and one team of experts in the field of consumer behaviour and needs (members of Deutsche Telekom Laboratories and Berlin University of Technology). In addition, five experts from the field of innovation development with a background in psychology, speech recognition and engineering were invited to join the research preparations and to provide a broader view on the technology landscape. The task of the researchers was to formulate an approach by which the everyday life of information and communica-tions technology (ICT) users could be explored. For Deutsche Telekom Laboratories the most important issue was to find out about ICT rituals and the situations in which ICT was used. Issues such as ‘fears’ and ‘barriers’ were also of interest, especially for the development of appropriate applications and services in the future. In order to attain these results, the researchers had to dive deep into the world of the Deutsche Telekom Laboratories and to learn about their ideas, problems attitudes, and cognitive structures, decision-making processes and organisational structures. Via meetings and workshops prior to the project/study, research experts were enabled to think like the developers and Deutsche Telekom Laboratories specialists. A first round of interviewing was applied, and additional rounds of expert interviews were conducted to understand the client. They installed feedback loops in order to discuss changes in the team during the research process and to include possible new issues in the interviews or observations. Among the researchers, a continuous learning process was observable since many participants developed their own ideas about how they integrate ICT into their everyday lives. The findings from this research were summarised in an additional feedback loop in order to coach the ICT specialists working for the client.
Summary Qualitative and quantitative research should be viewed as complementary. Unfortu-nately, many researchers and decision makers do not see this, taking dogmatic positions in favour of one or the other. The defence of qualitative approaches for a particular mar-keting research problem, through the positive benefits it bestows and through explaining the negative alternatives of a quantitative approach, should be seen as healthy, as should the defence of quantitative approaches. Decision makers use both approaches and will continue to need both.
Qualitative and quantitative approaches to marketing research are underpinned by two broad philosophical schools, namely positivism and interpretivism. The central belief of a positivist position is a view that the study of consumers and marketing phenomena should be ‘scientific’ in the manner of the natural sciences. Researchers of this persuasion adopt a framework for investigation akin to that of the natural sci-entist. The interpretivist researcher does not set out to test hypotheses in the manner

175Chapter 6 Qualitative research: its nature and approaches
of the positivist researcher. Their aim is primarily to explore and understand the nature and interrelationships of marketing phenomena. The focus of investigation is a detailed examination of a small number of cases rather than a large sample. The data collected are analysed through an explicit interpretation of the meanings and functions of consumer actions. The product of these analyses takes the form of ver-bal descriptions and explanations, with quantification and statistical analysis playing a subordinate role.
In examining qualitative approaches, ethnography as a general term includes observation and interviewing and is growing in use through the use of social media observations and interactions. Ethnography is used to describe a range of methods that require researchers to spend a large amount of time observing a par-ticular group of people, by sharing or immersing themselves in their way of life. The ethnographer is expected to analyse critically the situations observed. The critique and the analysis can be guided by theory but, in essence, the researcher develops a curiosity, thinks in an abstract manner and at times steps back to reflect and see how emerging ideas connect. By reacting to the events, narrative, images and other forms of participants and by drawing out what they see as important, ethnographers have the ability to create new explanations and understandings of consumers.
Some ethnographers may be criticised in their attempts at developing theory. In response, the grounded theorist follows a set of systematic procedures for collecting and analysing data. A distinctive feature of a grounded theory approach is that the col-lection of data and their analysis take place simultaneously, with the aim of develop-ing general concepts, to organise data and integrate these into a more general, formal set of categories.
Ethnographic techniques and a grounded theory approach can be applied in an action research framework. Action research is a team research process, facilitated by one or more professional researchers, linking with decision makers and other stakeholders who together wish to improve particular situations. Together, the researcher and deci-sion makers or stakeholders define the problems to be examined, generate relevant knowledge about the problems, learn and execute research techniques, take actions and interpret the results of actions based on what they have learned. There are many iterations of problem definition, generating knowledge, taking action and learning from those actions. The whole process of iteration evolves in a direction that is agreed by the team.
When conducting qualitative research, the researcher and the client must respect participants. This should include protecting the anonymity of participants, honour-ing all statements and promises used to ensure participation and conducting research in such a way as not to embarrass or harm the participants. With the emergence of techniques that use social media, such as ethnography using electronic communi-ties, maintaining an ethical relationship with participants is becoming far more challenging.
The internet and the growth in social media and the use of mobile devices present huge opportunities for the qualitative researcher. Online versions of traditional forms of qualitative research, such as focus groups, semi-structured or in-depth interviews and ethnographic techniques, have been developed to great effect. New qualitative techniques have been developed that add further consumer insights. These develop-ments have the potential to present research to participants as meaningful and enjoy-able engagements.

176 Marketing Research
Questions 1 What criticisms do qualitative researchers make of the approaches adopted by quantitative researchers, and vice versa?
2 Why is it not always possible or desirable to use quantitative marketing research techniques?
3 Evaluate the differences between a European and an American approach to qualitative research.
4 Describe the characteristics of positivist and interpretivist researchers.
5 In what ways may the positivist and the interpretivist view potential research participants?
6 What role does theory play in the approaches adopted by positivist and interpretivist researchers?
7 What does ethnographic research aim to achieve in the study of consumers?
8 What is netnography? What additional consumer insights can netnography deliver?
9 Why may marketing decision makers wish to understand the context of consumption?
10 Describe and illustrate two research techniques that may be utilised in ethnographic research.
11 What stages are involved in the application of a grounded theory approach?
12 Is it possible for researchers to be objective?
13 What does ‘listening’ mean for the qualitative researcher? How may researchers ‘listen’ to consumers?
14 Describe the key elements to be balanced in the application of action research.
15 What do you see as the key advantages and challenges of conducting qualitative research online?
Exercises 1 An advertising agency has selected three pieces of music that it could use in a new advertising campaign. It has come to you as a researcher to help in making the case for selecting the right piece of music for the campaign. What would be the case for using qualitative techniques for this task?
2 Would a 12-year-old schoolchild who has not been exposed to any academic theories about ‘service delivery quality’ be more creative and open-minded, and thus better suited to conduct a grounded theory approach, compared with a 22-year-old business studies graduate? Would your view change in any way if the study were about a game or toy that was specifically targeted at 12 year olds?
3 You are a brand manager for Microsoft’s Xbox division. You wish to invest in an ethnographic study (that could include netnography techniques) of young gamers who regularly play multi-player online games. Ask another student to play the role of marketing director. What case would you make to the marketing director about the value of investing in an ethnographic study?
4 In the above case of an ethnographic study of young gamers for Microsoft, what would you feel to be appropriate contexts or circumstances to conduct this work?
5 In a small group, discuss the following issues: ‘Quantitative research is more important than qualitative research because it generates conclusive findings’ and ‘Qualitative research should always be followed by quantitative research to confirm the qualitative findings’.

177Chapter 6 Qualitative research: its nature and approaches
Notes
1. Methner, T. and Frank, D., ‘Welcome to the house of research: Achieving new insights and better brand knowledge through courageous ways of collaboration in what is usually a competitive environment’, ESOMAR Congress Odyssey, Athens (September 2010).
2. You, J.S. and Kaltenback, E., ‘Living with your customers’, Research World (November 2005), 40.
3. Murphy, D., ‘Feeding inspiration’, Research World (April 2006), 14–15.
4. Ford, J., Carlson, L. and Kover, A.J., ‘Comments – the quant-qual debate: Where are we in advertising?’, International Journal of Advertising 27 (4) (2008), 659–69; Alioto, M.F. and Gillespie, D., ‘The complex customer: Applying qualitative methods in automotive NPD’, ESOMAR Qualitative Research, Athens (October 2006).
5. Cooper, P., ‘We’ve come a long way’, Research World (November 2007), 8–11; Cooper, P., ‘Consumer understanding, change and qualitative research’, Journal of the Market Research Society 41 (1) (January 1999), 3.
6. Bowman, J., ‘Sounding off’, Research World (July/August 2006), 36–7.
7. Kenway, J., ‘Keep on moving’, Research (November 2005), 36.
8. Cooper, P., ‘In search of excellence: The evolution and future of qualitative research’, ESOMAR Annual Congress, Berlin (September 2007).
9. Sykes, W., ‘Validity and reliability in qualitative market research: A review of the literature’, Journal of the Market Research Society 32 (3) (1990), 289; De Groot, G., ‘Qualitative research: Deeply dangerous or just plain dotty?’, European Research 14 (3) (1986), 136–41.
10. ESOMAR, ‘Global Market Research’, ESOMAR Industry Report (2010), 16.
11. Bowman, J., ‘Real people for real data’, Research World (January 2007), 40.
12. Truong, Y., ‘Personal aspirations and the consumption of luxury goods’, International Journal of Market Research 52 (5) (2010), 655–73.
13. Verhaeghe, A., den Bergh, J.V. and Colin, V., ‘Me, myself and I: Studying youngsters’ identity by combining visual ethnography & netnography’, ESOMAR Qualitative Research, Istanbul (November 2008).
14. Branthwaite, A. and Patterson S., ‘The vitality of qualitative research in the era of blogs and tweeting: An anatomy of contemporary research methods’, ESOMAR, Qualitative, Barcelona (November 2010).
15. It is recognised that this topic is treated in a superficial manner and is really a basic introduction to the key ideas. Students who are interested in developing these ideas further should see Harrison, R.L. and Reilly, T.M., ‘Mixed methods designs in marketing research’, Qualitative Market Research: An International Journal 14 (1) (2011), 7–26; Rod, M., ‘Marketing: Philosophy of science and “epistobabble warfare”’, Qualitative Market Research: An International Journal 12 (2) (2009), 120–9; Heath, R. and Feldwick, P., ‘Fifty years using the wrong model of advertising’, International Journal of Market Research 50 (1) (2008), 29–59; Silverman, D.,
Interpreting Qualitative Data: Methods for Analysing Talk, Text and Interaction (London: Sage, 2006), 9.
16. Hunt, S.D., Modern Marketing Theory (Cincinnati, OH: South Western Publishing, 1991); Hunt, S., Marketing Theory: The Philosophy of Marketing Science (Homewood, IL: Irwin, 1983), 2.
17. Tasgal, A., ‘“All because …”: From command and control to cascades and contexts’, Market Research Society, Annual Conference (2005).
18. Djourvo, D., ‘A global method, a local approach: How the Japanese group can gain focus’, ESOMAR Asia Pacific Conference, Singapore (April 2008).
19. Cooper, P., ‘The evolution of qualitative research: From imperialism to synthesis’, ESOMAR, Qualitative Research Singapore (1997); Broadbent, K., ‘When East meets West, quite what does “qualitative” mean?’, ResearchPlus (March 1997), 14.
20. Goodyear, M., ‘Divided by a common language: Diversity and deception in the world of global marketing’, Journal of the Market Research Society 38 (2) (April 1996), 105.
21. Cooper, P., ‘In search of excellence: The evolution and future of qualitative research’, ESOMAR Annual Congress, Berlin (September 2007).
22. Hussey, J. and Hussey, R., Business Research (Basingstoke: Macmillan Business, 1997).
23. For a comprehensive review of the philosophy of social sciences, see Jarvie, I.C. and Zamora-Bonilla, J. (eds), The SAGE Handbook of the Philosophy of Social Sciences (London: Sage, 2011); in addition see Nicolai, A. and Seidl, D., ‘That’s relevant! Different forms of practical relevance in management science’, Organization Studies 31 (9–10) (2010), 1257–85; Healy, M. and Perry, C., ‘Comprehensive criteria to judge validity and reliability of qualitative research within the realism paradigm’, Qualitative Market Research: An International Journal 3 (3) (2000), 118–26.
24. Channon, C., ‘What do we know about how research works?’, Journal of the Market Research Society 24 (4) (1982), 305–15.
25. Hamlin, R.P., ‘Forum – small business market research: Examining the human factor’, International Journal of Market Research 49 (5) (2007), 551–71; Ali, H. and Birley, S., ‘Integrating deductive and inductive approaches in a study of new ventures and customer perceived risk’, Qualitative Market Research: An International Journal 2 (2) (1999), 103–10.
26. Bryman, A., Quantity and Quality in Social Research (London: Unwin Hyman, 1988).
27. Magee, B., Fontana Modern Masters – Popper (London: Fontana, 2010); St Aubyn, G., The Art of Argument (London: Christophers, 1956), 61–75.
28. Angrosino, M., Doing Ethnographic and Observational Research (London: Sage, 2007); Travers, M., Qualitative Research through Case Studies (London: Sage, 2001), 4.
29. Schensul, J.J., Designing and Conducting Ethnographic Research: An Introduction, 2nd edn (Lanham, MD: AltaMira Press, 2010); Fetterman, D.M., Ethnography: Step by Step (Thousand Oaks, CA: Sage, 1998), 1.

178 Marketing Research
30. Metcalf, P., A Borneo Journey into Death: Berawan Eschatology From its Rituals (Kuala Lumpur: Abdul Majeed, 1991).
31. Silverman, D., Interpreting Qualitative Data: Methods for Analysing Talk, Text and Interaction, 2nd edn (London: Sage, 2001), 45.
32. Gnädig, A. and Schieleit, O., ‘The death of depth: Skimming the surface’, Research World (January 2006), 44–5.
33. Stewart, A., The Ethnographer’s Method (Thousand Oaks, CA: Sage, 1998), 5.
34. Mariampolski, H., ‘The power of ethnography’, Journal of the Market Research Society 41 (1) (January 1999), 79.
35. Bilgram, V., Bartl, M. and Biel, S., ‘Successful consumer co-creation: The case of Nivea Body Care’, Market Research Society, Annual Conference (2010).
36. Kozinets, R.V., ‘Click to connect: Netnography and tribal advertising’, Journal of Advertising Research 46 (3) (2006) 279–88.
37. Poynter, R., ‘A taxonomy of new MR’, Market Research Society, Annual Conference (2010).
38. http://johnbell.typepad.com/weblog/2006/09/3_ways_lego_lea.html, accessed 8 February 2011.
39. Anon., ‘Co-creation’, WARC Exclusive (November 2010).
40. Mariampolski, H., ‘The power of ethnography’, Journal of the Market Research Society 41 (1) (January 1999), 82.
41. Ibid., p. 81.
42. Mariampolski, H., Qualitative Marketing Research: A Comprehensive Guide (Thousand Oaks, CA: Sage, 2001), 52.
43. Wiesenfeld, D., Bush, K. and Sikdar, R., ‘The value of listening: Heeding the call of the snuggie’, Journal of Advertising Research 50 (1) (2010), 16–20.
44. Rappaport, S.D., ‘Putting listening to work: The essentials of listening’, Journal of Advertising Research 50 (1) (2010), 30–41.
45. Glaser, B. and Strauss, A., The Discovery of Grounded Theory (Chicago: Aldine, 1967).
46. Blumer, H., ‘Sociological analysis and the variable’, in Blumer, H., Symbolic Interactionism: Perspective and Method (Berkeley, CA: University of California Press, 1969), 127–39.
47. Travers, M., Qualitative Research Through Case Studies (London: Sage, 2001).
48. Glaser, B. and Strauss, A., The Discovery of Grounded Theory (Chicago: Aldine, 1967), 3.
49. Strauss, A., Fagerhaugh, S., Suczek, B. and Wiener, C., The Social Organisation of Medical Work (Chicago: University of Chicago Press, 1985).
50. Locke, K., Grounded Theory in Management Research (London: Sage, 2001), 33.
51. Ibid., p. 34.
52. This outline summarises a quite detailed procedure. For a definitive practical guideline to performing grounded theory see Corbin, J. and Strauss, A., Basics of Qualitative Research: Techniques and Procedures for Developing Grounded Theory (Thousand Oaks, CA: Sage, 2008); Goulding, C., Grounded Theory: A Practical Guide for Management, Business and Market Researchers (London: Sage, 2002); Strauss, A. and Corbin, J.M., Basics of Qualitative Research: Techniques and Procedures for Developing Grounded Theory, 2nd edn (London: Sage, 1998).
53. Nyilasy, G. and Reid, L.N., ‘Agency practitioners’ meta-theories of advertising’, International Journal of Advertising 28 (4) (2009), 639–68.
54. Strauss, A. and Corbin, J.M., Basics of Qualitative Research: Techniques and Procedures for Developing Grounded Theory, 2nd edn (London: Sage, 1998), 53.
55. Bresler, L., ‘Ethical issues in qualitative research methodology’, Bulletin of the Council for Research in Music Education 126 (1995), 29–41; Cheek, J., ‘Taking a view: Qualitative research as representation’, Qualitative Health Research 6 (1996), 492–505.
56. Strauss, A. and Corbin, J.M., Basics of Qualitative Research: Techniques and Procedures for Developing Grounded Theory, 2nd edn (London: Sage, 1998), 46–7.
57. Sandelowski, M., ‘Theory unmasked: The uses and guises of theory in qualitative research’, Research in Nursing and Health 16 (1993), 213–18.
58. Greenwood, D.J. and Levin, M., Introduction to Action Research: Social Research for Social Change (Thousand Oaks, CA: Sage, 1998), 17.
59. Lewin, K., ‘Forces behind food habits and methods of change’, Bulletin of the National Research Council 108 (1943), 35–65.
60. Tripe – the first and second divisions of cow stomachs, but could also be sheep or goat.
61. Greenwood, D.J. and Levin, M., Introduction to Action Research: Social Research for Social Change (Thousand Oaks, CA: Sage, 1998), 19.
62. Reason, P. and Bradbury, H., Handbook of Action Research (London: Sage, 2002), xxiv.
63. Greenwood, D.J. and Levin, M., Introduction to Action Research: Social Research for Social Change (Thousand Oaks, CA: Sage, 1998), 4.
64. Bate, S.P., ‘Changing the culture of a hospital: From hierarchy to network’, Public Administration 78 (3) (2000), 487.
65. Dörflinger, T., Gutknecht, S., Klär, K. and Tabino, O., ‘Digital divorce or digital love affair – understanding consumer needs by breaking down frontiers’, ESOMAR Annual Congress, Montreal (September 2008).

Qualitative research: focus group discussions
The best moderators of focus
groups are those that create
a spirit of spontaneity and a
passion for the issues under
discussion.
Stage 1
Problem definition
Stage 2
Research approach developed
Stage 3
Research design
developed
Stage 4
Fieldwork or data
collection
Stage 5
Data integrity
and analysis
7
Stage 6
Communicating research findings

180 Marketing Research
Objectives
After reading this chapter, you should be able to:
1 understand why the focus group is defined as a direct qualitative research technique;
2 describe focus groups in detail, with an emphasis on planning and conducting focus groups;
3 evaluate the advantages and disadvantages of focus groups;
4 understand the myths that are associated with the application of focus groups;
5 describe alternative ways of conducting qualitative research in group settings;
6 understand the differences between online and traditional focus groups.
In this chapter, we start by presenting a means of classifying qualitative research techniques and we examine the implications of such classification. The characteristics of the focus group are presented, along with their advantages and disadvantages. The manner in which focus groups should be planned and conducted is then presented. Running successful focus groups depends upon the skills of a moderator, i.e. the person who manages the group, and the ensuing discussion. We present the qualities needed in moderators to get the most out of focus group discussions. There are variations on the main theme of running a focus group; these are described, as well as other qualitative group activities. Some of the misconceptions of focus groups are examined, with a reminder of the qualities that make group techniques work well. In Chapter 6 we contrasted the purpose and different ways of running focus groups in the USA and in Europe; this contrast is developed and illustrated further in examining international marketing research issues. The relative advantages and disadvantages of running online focus groups is compared with ‘offline’ or face-to-face groups. We also evaluate many new group-based techniques that are emerging through social media research.
The following examples illustrate how using focus groups helps researchers and decision makers to understand the issues faced by consumers. The three examples represent major variations of the focus group in terms of a traditional focus group, an online focus group and an online bulletin board. In all the examples, the issues being researched are expressed in consumers’ own words and sometimes in ways that words cannot convey. The examples also illustrate that researchers and decision makers may think that they know of all the issues they should be questioning, but once an exploration starts, participants can reveal new issues that they perceive to be of more importance, and these issues can drive very innovative marketing decisions.
Overview
Real research Chinese views of chicken tastes1
How is it possible to encapsulate flavour experiences and enable improved flavour inno-vations for Chinese consumers? The producer of flavours and fragrances, Givaudan (www.givaudan.com), sponsored a study that was executed by Labbrand (www. labbrand.com). Out of the five senses, taste may be considered the most abstract, and therefore the most difficult to describe. In China there was a huge amount of information that could be con-sidered in flavour creation for roast chicken. There were more than 30 variations of cook-ing methods for chicken, the most famous being ‘roast’ and ‘fry’, and with very specific flavour characteristics such as the ‘Gong Bao Ji Ding’ or the ‘Beggar’s Chicken’. Before dis-cussing flavours with consumers, preliminary research was conducted on the variety of dishes, flavours and brands in order to understand cultural references. This research

181Chapter 7 Qualitative research: focus group discussions
helped in the planning of focus groups directed at Chinese consumers to understand their fla-vour experiences. From the discussions of over 12 groups held in different Chinese cities, three categorical distinctions were apparent when a food experience was described: emotions and sensations – ‘generous’ or ‘smoky’ (general and conceptual, not linked to a specific context); practical experience – ‘at McDonald’s’, ‘with friends’ or ‘at a picnic’ (when, where, with whom, how); and rules, etiquette and common beliefs – ‘eating the bones clean makes me feel I am full’ or ‘white meat with friends can be embarrassing because it can get stuck between the teeth’. One issue faced when conducting research on taste experience, expectations and needs was that participants mixed these three dimensions of discourse. An additional complexity was that flavour experience is multidimensional. To describe a certain flavour, the participant may give a description in terms of taste (sweet, sour, bitter, salty and savoury – the basic tastes) and in terms of smell (fresh, burned, smoked, fruity) and/or texture. Because describing flavours was so complex, the role and expertise of the focus group moderator was crucial. The group setting was also crucial, so that participants could build on each other’s responses to arrive at more complete descriptions.
Real research How does Philips execute its online bulletin boards?2
Online bulletin boards at Philips have used several studies at critical time points in the corporate strategic planning process. Initial studies differed in their particular aims, and in the sub-audiences targeted, but they generally took the following form. For a reason-able fee, senior influencers including executives, journalists, senior physicians, senior hospital administrators, urban planners and lighting designers agreed to join an online discussion. They logged on at their own convenience for a minimum specified number of minutes per day, over a period of two or three days. Three separate influencer panels were recruited to participate in a series of six one- or two-day online bulletin board ses-sions. Individuals were not always able to participate in all six sessions, but on average at least 75% participated each time. (Rare) panel dropouts were replaced with new mem-bers. Logging in and out whenever convenient to them, panel members interacted across multiple time zones and/or countries that shared a common language. Since Philips is a global company with worldwide reach, influencers were recognised across a wide range of geographies. Allowing senior individuals to interact with their transatlantic peers was engaging for participants, as well as valuable in yielding cross-cultural insight. The issue of audience heterogeneity was addressed by running several online bulletin boards concurrently, with the different sub-audiences each interacting at peer group level while discussing a mixture of topics – some that were common across all audiences and others that were specific to the sub-audience concerned. The flexible format ena-bled ongoing discussion guide development throughout a given fielding period, and incorporated a wide variety of visual aids and modes of enquiry. The studies for Philips included pre-seeded discussion, questionnaire rating scales and evaluation of print ads, multimedia clips and websites in development.

182 Marketing Research
These techniques are classified as either direct or indirect, based on whether the true purpose of the project is known to the participants. A direct approach is not disguised. The purpose of the project is disclosed to the participants or is otherwise obvious to them from the questions asked. Focus groups and in-depth interviews are the major direct techniques. Even though the purpose of the project is disclosed, the extent to which the purpose of the research is revealed at the start of a focus group or in-depth group may vary. Suppose that the researcher wanted to understand how participants felt about the Prada brand, what their views were of Prada advertising campaigns, the style and quality of Prada clothes, how ‘cool’ the brand was, the importance of its being an Italian company – to name but a few issues that could be tackled. Rather than stating these objectives, or even that the study was for Prada right at the start, the researcher may initially hide these issues. If revealed at the start, participants might focus straight onto these issues and not the surrounding contextual issues that may reveal the ‘relative’ impact of the Prada brand. Thus the researcher may initially reveal that the discussion is going to be about ‘what clothes mean to you’. The researcher may explore what participants feel to be good and poor examples of clothing advertisements and why – what types of clothing and accessories do participants see as styl-ish, how important is it to wear stylish clothes, how important is it to wear ‘cool’ clothes – drawing out examples of brands to illustrate these views. Italy as a country could be explored in terms of characteristics of Italians, or Italian design and style. If participants bring up Prada in the discussion, the researcher can then focus upon specific questions about the brand, contrast it with other brands and clearly see which subjects generated positive or negative views of Prada. Participants may deduce that the study is being conducted for Prada as the discussion proceeds, which may be apparent by the end of the discussion, or the researcher may clarify this point and explain why it was not revealed at the beginning.3
In using focus groups or in-depth interviews, the researcher employs a direct approach but has control over how much ‘directness’ to reveal at the start of the discussion. The researcher must consider what ‘frame of mind’ participants should be in at the start of the discussion, as too narrow or set a focus at the start can impede the thought processes and creativity of the participants and the success of the discussion.
In contrast, research that takes an indirect approach totally disguises the purpose of the project. In an indirect approach, the researcher wants participants to behave as naturally as pos-sible without any impediment of research purposes. In observation or ethnographic techniques,
Direct approachA type of qualitative research in which the purposes of the project are disclosed to the participant, or are obvious given the nature of the interview.
Indirect approachA type of qualitative research in which the purposes of the project are disguised from the participants.
Classifying qualitative research techniques
A classification of qualitative research techniques is presented in Figure 7.1.
Figure 7.1
A classification of qualitative research techniques
Direct(non-disguised)
Observationtechniques
Projectivetechniques
Groupinterviews
In-depthinterviews
Qualitative research procedures
Indirect(disguised)

183Chapter 7 Qualitative research: focus group discussions
consumers may be seen shopping, choosing products, using products and interacting with other people and objects, hopefully in a natural environment and a natural manner. The ‘participants’ may not know that they are being observed or, if they do and have agreed to be observed, may not really know why. The purpose of using projective techniques (presented in Chapter 8) is to discover underlying motivations, beliefs, attitudes or feelings regarding consumer behaviour. The techniques allow indirect questioning to enable participants to discover novel ways to think about and express their feelings, where direct questioning would fail.
Figure 7.1 presents a useful way to remember which qualitative techniques tend towards directness and indirectness. Another way of thinking about these issues would be to visualise a continuum, with ‘totally direct’ at one extreme and ‘totally indirect’ at the other. Qualita-tive techniques may then be positioned on this continuum and the implications of that posi-tion addressed. The implications for the researcher are as follows:
• Ethical. What are the ethical issues concerning revealing what a study is about? Would participants get involved in the study if they knew what it was really about? Would partici-pants feel cheated or abused by not being told the purpose or finding it out as they go along?
• Data richness. If participants know what a study is about, to what extent does this ‘close’ their minds or destroy their creativity? Qualitative techniques aim to draw out deeply held views, issues that may be difficult to conceive or express. Researchers need to be able to get participants in the right frame of mind to be able to elicit these rich data. To what extent does revealing the purpose of a study impede this process?
Researchers cannot resolve this issue by stating, for example, that ‘they will only use direct techniques’ to resolve the ethical issues. Successful focus groups and in-depth inter-views can utilise certain observation techniques. As an example, consider recording a simple answer of ‘no’ to a question. This ‘no’ may be interpreted in different ways, depending upon facial expressions (‘was the participant smiling?’), the tone of the participant’s voice (‘was it sharp and direct?’), the participants’ posture and body language (‘were they hunched and hiding their faces?’), or their positioning and reactions to others around them (‘were they seeking support from others of the same view, by gestures directed towards those partici-pants?’). The researcher can use and manipulate scenarios to observe participants as a means of interpreting the answers they give to questions. The same can be said of projective tech-niques, all of which can be used to great effect in focus groups and in-depth interviews.4
The researcher ultimately has to work out the extent of directness or indirectness of the chosen qualitative techniques and address the ethical and data richness issues before setting out the detail of how to administer the qualitative techniques. These issues may be unique in each investigation, depending upon the nature of participants being studied and the questions they face. In practice, the qualitative researcher may resolve the best means to administer a technique by experimenting and adapting; these issues are tackled later in this chapter.
Focus group discussion
A focus group is a discussion conducted by a trained moderator in a non-structured and natural manner with a small group of participants. A moderator leads and develops the dis-cussion. The main purpose of focus groups is to gain insights by creating a forum where participants feel sufficiently comfortable and relaxed. In such a forum, it is hoped that par-ticipants can reflect and portray their feelings and behaviour, at their pace and using their language, means of expression and logic. It has been argued that the single most compelling purpose of the focus group is to bridge social and cultural differences between researchers and their target participants.5 The value of the technique and its role in bridging social and cultural differences lie in discovering unexpected findings, often obtained from a free- flowing discussion that is respectful and not condescending to participants.6 Focus groups are the most frequently used qualitative marketing research procedure, accounting for 9% of
Focus groupA discussion conducted by a trained moderator among a small group of participants in an unstructured and natural manner.
ModeratorAn individual who conducts a focus group interview, by setting the purpose of the interview, questioning, probing and handling the process of discussion.

184 Marketing Research
all global marketing research expenditure in 2010.7 They are used extensively in new prod-uct development, advertising development and image studies. They are so popular that many marketing research practitioners consider this technique synonymous with qualitative research.8 Given their importance and popularity, we describe the salient characteristics of focus groups in detail.9
Characteristics
The major characteristics of a focus group are summarised in Table 7.1.One of the main characteristics and key benefits lies in the amount of creative discussion
and other activities that may be generated. Group members have the time to reflect upon the discussion and range of stimuli that may be presented to them. The stimuli may come from other group members and/or from the moderator. Using their intuition and imagination, group members can explain how they feel or behave, in words or other forms of expression that they are comfortable with and using logic that is meaningful to them. The key drawback lies in how intimidating the group scenario may be to certain individuals. Many individuals may be self-conscious in expressing their ideas, feeling they may be ridiculed by others, or they may be shy and unable to express themselves freely in a group. A focus group is gener-ally made up of 6 to 10 members. Groups of fewer than six are unlikely to generate the momentum and group dynamics necessary for a successful session. Likewise, groups of more than 10 may be too crowded and may not be conducive to a cohesive and natural dis-cussion.10 Large groups have a tendency to splinter into subgroups as group members compete to get their views across.
Table 7.1
Key benefit Group members ‘feed’ off each other and creatively reveal ideas that the researcher may not have thought of or dared to tackle
Key drawback Group members may feel intimidated or shy and may not reveal anything of significance
Group size 6–10
Group composition Homogeneous, participants pre-screened by questionnaire or through known characteristics
Physical setting Relaxed, informal atmosphere, ‘comfortable’ from the perspective of the participants
Stimulating discussion Use of storyboards, mood boards, products, advertisements, films, music, websites, brochures
Time duration 1.5 to 6 hours
Recording Use of audiocassettes, videotapes and notes from observations
Moderator Observational, interpersonal and communication skills
Characteristics of focus groups
A focus group generally should be homogeneous in terms of demographic and socio-economic characteristics. Commonality among group members avoids interactions and conflicts among group members on side issues.11 An amount of conflict may draw out issues or get participants to rationalise and defend their views in a number of ways; it can also mean that the discussion does not get stale with everybody agreeing with each other and setting a scenario where genuine disagreement gets stifled. However, major conflicts should and can be avoided by the careful selection of participants. Thus, for many topics, a

185Chapter 7 Qualitative research: focus group discussions
women’s group should not combine married homemakers with small children, young unmarried working women and elderly divorced or widowed women, because their life-styles may be substantially different. Participants should be carefully screened to meet stated criteria. These criteria are set by the researcher to ensure that participants have had adequate experience with the object or issue being discussed. The most fundamental basis screening of participants is through demographic classification. Common demographic characteristics for determining group composition are: gender, race or ethnicity, age, house-hold location, education level, occupation, income and marital status or family composi-tion. Selecting participants using these characteristics can help increase compatibility but does not guarantee it; their backgrounds should be carefully balanced with their experi-ences.12 Participants who have already taken part in numerous focus groups should not be included. These so-called ‘professional’ participants are atypical, and their participation leads to serious validity problems.13
The physical setting for the focus group is also important. A relaxed, informal atmos-phere helps group members to forget they are being questioned and observed. What is meant by a relaxed, informal atmosphere may change depending upon the type of partici-pant and the subject being tackled. Examples of what ‘relaxed and informal’ means can include the home of a friend within a particular community, a works canteen, a village hall, a room in a leisure centre, a meeting room in a hotel or a purpose-built discussion group room. The poor acoustics and hard seats of a works canteen may not seem relaxed and informal. To group participants, however, it may be the place where they are happy to talk and willing to open up to a moderator. An example of this could be using part of a furniture store to discuss issues around house decoration, furnishings and cleaning or maintaining the home. Such a setting may set a very strong frame of reference to start the focus group and provide lots of stimuli. This example does not mean that all research needs to be conducted in situ, but that the technique can be designed to allow the findings from the real and the research environments to inform the overall recommendations.14 Light refreshments should be served before the session and made available throughout; these become part of the con-text of relaxation. The nature of these refreshments largely depends upon how long the discussion lasts, the nature of tasks faced by the participants and the ethical viewpoint of the researcher.
Although a focus group may last from one to six hours, a duration of one and a half to two hours is typical. When a focus group lasts up to six hours, participants may be performing a series of projective techniques such as building ‘mood boards’ or ‘role playing’.
Participants can also be given additional stimuli to discuss, such as advertising story-boards and products (existing, new, competitors’) to handle and examine. A focus group that lasts for up to six hours will invariably require a break for a meal, but in all circumstances a flow of drinks and snacks should be made available – noting special dietary requirements such as vegan food and drinks.
The lengthy period of discussion in a focus group is needed to establish rapport with the participants, to get them to relax and be in the right frame of mind and to explore in depth their beliefs, feelings, ideas, attitudes and insights regarding the topics of concern. Focus group discussions are invariably recorded, mostly using audiotape but often on video, for subsequent replay, transcription and analysis. Video recording has the advantage of capturing facial expressions and body movements, but it can increase the costs significantly. Fre-quently, where focus groups are conducted in purpose-built studios, decision makers as ‘cli-ents’ observe the session from an adjacent room using a two-way mirror or through video transmission. However, the existence of the mirror can impact upon everyone’s perceptions of what is happening in the discussion. The idea of invisible and unknown people sitting on the other side of the glass can be daunting and inhibiting to participants. Who are they? Why are they there? What are they doing? What are they going to think of me? Participants may not divulge private thoughts, confess to indulgent practices or generally open up if they feel intimidated by the interview process.15 The ‘City Hunter and ‘Philips’ examples at the start of this chapter illustrated how clients or decision makers are able to observe and even

186 Marketing Research
influence the development of group discussions. This issue will be developed in this chapter when we compare the relative advantages and disadvantages of face-to-face discussions and online focus groups.
In the physical setting of the focus group, care must be taken with both audio and video recording of participants. A judgement must be made of how comfortable participants are with being recorded and what effects recorders have on how much they relax and honestly portray how they feel. Many moderators can give rich examples of how the most interesting points to emerge from a focus group occur when recorders are switched off at the end of the discussion. This happens when a group of participants have really become involved in the subject of discussion and have enjoyed talking to their fellow participants. Even when the moderator has finished the discussion, some participants carry on discussing the issues between themselves as they put their coats on, leave the room and even perhaps as they walk to their cars. Moderators can hear issues discussed in this informal manner that they wish had been tackled with the full group.
The moderator plays a vital role in the success of a focus group. The moderator must establish rapport with the participants and keep the discussion flowing, including the probing of participants to elicit insights. Typically, probing differs from questioning in that the probes and the nature of probing are more spontaneous, and involve comments such as:16
• Would you explain further?
• Can you give me an example of what you mean?
• Would you say more?
• Is there anything else?
• Please describe what you mean.
• I don’t understand.
• Tell me more about that.
• How does that work?
Sometimes the moderator may put a probe question to the whole group, such as:
• Who else has something?
• What about the rest of you?
• I see people nodding their heads; tell me about it.
• We want to hear all the different points of view. Who else has something that might be a bit different?
It is seen as good practice to probe early in the discussion in order to communicate the importance of precision or a developed explanation, and to use probes sparingly in later discussion.
In addition, the moderator may have a central role in the analysis and interpretation of the data. Therefore, the moderator should possess skill, experience, knowledge of the discussion topic and an understanding of the nature of group dynamics.
Advantages and disadvantages of focus groups
Focus groups offer several advantages over other data-collection techniques. These may be summarised by the 10 Ss:17
1 Synergy. Putting a group of people together will produce a wider range of information, insight and ideas than will individual responses secured privately.
2 Snowballing. A bandwagon effect often operates in a group discussion in that one person’s comment triggers a chain reaction from the other participants. This process facilitates a very creative process where new ideas can be developed, justified and critically examined.
ProbingA motivational technique used when asking questions to induce the participants to enlarge on, clarify or explain their answers.

187Chapter 7 Qualitative research: focus group discussions
3 Stimulation. Usually after a brief introductory period, the participants want to express their ideas and expose their feelings as the general level of excitement over the topic increases in the group.
4 Security. Because the participants’ feelings may be similar to those of other group mem-bers, they feel comfortable and are therefore willing to ‘open up’ and reveal thoughts where they may have been reluctant if they were on their own.
5 Spontaneity. Because participants are not required to answer specific questions, their responses can be spontaneous and unconventional and should therefore provide an accu-rate idea of their views.
6 Serendipity. Ideas are more likely to arise unexpectedly in a group than in an individual interview. There may be issues that the moderator had not thought of. The dynamics of the group can allow these issues to develop and be discussed. Group members, to great effect, may clearly and forcibly ask questions that the moderator may be reluctant to ask.
7 Specialisation. Because a number of participants are involved simultaneously, the use of a highly trained, but expensive, interviewer is justified.
8 Scientific scrutiny. The group discussion allows close scrutiny of the data-collection pro-cess in that observers can witness the session and it can be recorded for later analysis. Many individuals can be involved in the validation and interpretation of the collected data, and the whole process can be very transparent.
9 Structure. The group discussion allows for flexibility in the topics covered and the depth with which they are treated. The structure can match the logical structure of issues from the participants’ perspective as well as the language and expressions they are comforta-ble with.
10 Speed. Since a number of individuals are being interviewed at the same time, data collec-tion and analysis can proceed relatively quickly. This advantage has become even more pronounced with the development of online focus groups.
Disadvantages of focus groups may be summarised by the five Ms:
1 Misjudgement. Focus group results can be more easily misjudged than the results of other data-collection techniques. As a qualitative technique focus groups can evolve through a line of questioning and probing (as discussed in Chapter 6). The specific direction of questioning and the ultimate interpretation of findings can be susceptible to the bias of the moderator and other researchers working on a project.
2 Moderation. As well as being great fun to moderate, focus groups can be difficult to moderate. Much depends upon the ‘chemistry’ of the group in terms of how group mem-bers get on with each other and draw ideas and explanations from each other. Even mod-erators with many years of experience may not connect with particular groups of participants or topics and can get into difficulty with group members who disrupt the discussion. The quality of the results depends upon how well the discussion is managed and, ultimately, on the skills of the moderator.
3 Messiness. The unstructured nature of the responses makes coding, analysis and interpre-tation difficult in comparison with the far more structured approach of quantitative tech-niques. Focus group data tend to be messy and need either strong theoretical support or the discipline of a grounded theory approach to ensure that decision makers can rely upon the analyses and interpretations.
4 Misrepresentation. Focus group results concentrate on evaluating distinct target groups, describing them and contrasting them to other groups or types of participant. Trying to generalise to much wider groups, in the same manner as with a quantitative survey based on a representative sample, can be very misleading.

188 Marketing Research
5 Meeting. There are many problems in getting potential participants to agree to take part in a focus group discussion. Even when they have agreed to participate, there are prob-lems in getting focus group participants together at the same time. Running online focus groups has helped to resolve these problems to a great extent and is one of the main factors in the growth of this approach. For some participants a ‘virtual meeting’ is still not a solution. An example is in conducting business research with managers as participants. Given the amount of travel and tight schedules that many managers have, getting them together at the same time is very difficult. With many managers reluctant to reveal their company’s behaviour and plans in front of other managers, one can see that the focus group may be very difficult to administer in getting managers to meet up and discuss issues.
Planning and conducting focus groups
The procedure for planning and conducting focus groups is described in Figure 7.2.Planning begins with an examination of the marketing research problem(s) and objec-
tives. In most instances, the problem has been defined by this stage, but it is vital to ensure that the whole process is founded upon a clear awareness of the gaps in the knowledge of marketing decision makers. Given the problem definition, the objectives of using focus groups should be clarified. There should be a clear understanding of what information can be elicited and what the limitations of the technique are.
The next step is to develop a list of issues, or topic guide, that are to be tackled in the focus groups. This list may be a series of specific questions but is more likely to be a set
Topic guideA list of topics, questions and probes that are used by a moderator to help manage a focus group discussion.
Figure 7.2
Planning and conducting focus groups
Clarify marketing research problem(s) and objectives
Clarify the role of focus groups in ful�lling those objectives
Specify the issues to be developed in the focus groups
Specify the types of target respondents to make up groups
Specify the location(s) in which to conduct the focus groups
Recruit group members
Run an experimental group
Conduct the focus groups
Analyse data and present �ndings

189Chapter 7 Qualitative research: focus group discussions
of broad issues that can be developed into questions or probes as the focus group actually takes place. Specific questions may be of help to the moderator who feels that a consist-ent set of points needs to be presented to different groups in order to allow clear com-parisons to be made. Specific questions also act as a ‘prop’ when the discussion is failing; indeed, some group participants may initially feel that their role is to react to specific questions. However, treating the whole discussion as a means to present set questions may stifle the creativity and spontaneity that are the hallmarks of successful focus groups. The moderator should open the discussion with a general introductory question to make participants comfortable with the subject and the purpose of the research. This question should encourage conversation and interaction among the participants. It should not be threatening and it may even question in the third person – i.e. not asking partici-pants what they do or think, and as such it may not be critical to the analysis, though there can be much revealed at this point. The discussion moves on to one or two transi-tion questions, which move the discussion towards the key questions and issues. Transi-tion questions help participants to envision the topic in a broader scope. Through these questions, participants become more aware of their fellow participants. Transition ques-tions can ask participants to go into more depth about their experiences and uses of a product, making the connection between the participant and the topic under investiga-tion.18 The moderator can then move on to the key questions, developing specific ques-tions, issues and probes that can advance as the moderator tunes into the dynamics of the group. There may be additional, new issues that develop and, indeed, issues that group members do not see as being appropriate, and these can be discussed. The emphasis should be upon an evolution and learning process rather than administering a consistent set of questions.
The types of group members to take part in the discussions are then specified. From this specification, a questionnaire to screen potential participants is prepared. Typical informa-tion obtained from the questionnaire includes product familiarity and knowledge, usage behaviour, attitudes towards and participation in focus groups and standard demographic characteristics. With the types of participants specified, consideration must be taken of what would make them relaxed and comfortable, balanced in both a physical and psycho-logical sense.
Having decided on the location of the focus groups, the actual recruitment of group mem-bers progresses. This is one of the most difficult tasks, as potential group members may be sceptical of what may happen at the group, sometimes fearing that they are exposing them-selves to a hard-sell campaign of time-share holidays or home improvements! If individuals have attended a focus group beforehand, the process of recruitment is easier, but getting the right types of participant together at the right place and time can prove difficult. With the screening questionnaire, recruitment may take place on a face-to-face basis through street interviews or through database details by phone or email. One traditional approach is to give the specification of group members to an individual in whose home the discussions are to take place. That individual then recruits participants who fit that specification from the local community. The advantage of this approach is the individual’s ability to persuade partici-pants that the process is a bona fide research process and is going to be rewarding in many ways; ultimately the individual makes sure that potential participants actually attend. The big disadvantage is ensuring that those recruited match the screening questionnaire require-ments. Whichever method of recruiting participants is used, even when individuals have said that they will participate in the group, a follow-up is necessary to remind and motivate group members.
Group participants have to be rewarded for their attendance. Usually they enjoy the expe-rience immensely once they are there, but that does not ensure that they attend in the first place. Attendance can be rewarded with cash, a donation to charity or a gift. The following example illustrates the difficulties involved in recruitment and a researcher’s creative solu-tion to the problem.

190 Marketing Research
The first focus group to be run should be seen as an experimental group. All aspects of running the group should be evaluated. Were the group members relaxed and comfortable in the chosen location, i.e. did the context work as intended? How did they react to the audio recorder, video or two-way mirror, i.e. at what point did they seem to relax and forget that they were being recorded? What types of member interacted well or not, and what issues helped or hindered interaction? How did the introductory and transition questions work in opening up and developing the discussion? How did the topic guide work; were there issues missing or issues that individuals would not tackle? How comfortable was the moderator in handling the topics; did they have to interject to liven the discussion? How much did the moderator have to know about the subject to have credibility with the participants? With reflection on these issues, any necessary alterations can be made to the way that the remain-ing focus groups are administered. There may be very useful information that emerges from the experimental group that can be included in the main analysis. However, if the group does not work well, the information gleaned may be of little use, but the lessons learned are inval-uable in running the remaining groups.
Finally, the focus groups can be run. The question arises here of how many groups should be run. Beyond the first experimental group, the number of groups needed can vary. The extent to which comparisons are sought in analyses can determine how many groups are needed. Seeking comparisons means recruiting participants with different backgrounds or experiences. If there are a great variety of types of individual that make up a target market, then many homogeneous groups may be needed to reflect the variety of types, e.g. a group of 18–25-year-old single-male car owners compared with groups of women or groups of older males, married men or non-car owners. The definition of these distinct target groups to ques-tion is entirely bound by the nature of the research problem.
A confounding factor in the definition of these groups is the extent to which different types of participant will mix together in a single group. In an experimental focus group that explored attitudes and behaviour related to sports activities in the English city of Bath, distinct target groups of participants did not work well together. Older participants who participated in more ‘gentle’ sports activities did not particularly appreciate, listen to or respect the views of younger participants. In addition, there was a gender split in that male participants showed very little respect for the views of female participants. The older male
Experimental groupAn initial focus group, run to test the setting of the interview, the opening question, the topic guide and the mix of participants that make up the group.
Real research So how do you upstage a Ferrari owner?19
Researching a high-net worth, socially active audience is difficult at the best of times. The target can be opinionated, demanding, often resistant to research and almost impossible to reach. So, when we got the brief to conduct focus groups among Ferrari, Porsche, top Mercedes and other exotic sports-car owners, we were tempted to panic. We knew we could find them, but how could we persuade them to participate? We realised the one thing that would link our target, who were also defined as keen drivers, not just poseurs, was their love of cars and desire to know the latest news about new models (and to try them out if possible). That’s why we decided to offer the carrot of a drive around a race and proving track and the opportunity to meet the design and management team at our famous sports car maker. If anything might motivate people who clearly already had sufficient money to indulge a very expensive taste, it should be this package. It worked like a dream, and we had great success getting the right people to come and, more importantly, to participate.

191Chapter 7 Qualitative research: focus group discussions
participants were particularly patronising to younger females. As a result it was decided to run groups that separated younger and older participants and males and females. This meant an increase in the total number of focus groups conducted, but also meant that the remaining focus groups worked well and that the views of distinct target groups were clearly presented.
If target participants are geographically widespread, then many groups may be needed to represent this diversity. Focus groups may be needed to represent each country. Further anal-yses of two distinct target groups were also needed. Thus, a minimum of two groups per country, i.e. eight groups plus an experimental group, would be needed, which would be doubled if it were subsequently felt to be important to run exclusively male and female groups.
Another factor to be considered in determining the number of focus groups to conduct relates to whether the researcher is using focus groups as part of a grounded theory approach. With such an approach (as described in Chapter 6, and further developed in Chapter 9), theoretical sampling is adopted whereby further examples or instances are sought that may contradict the nature of the emerging grounded theory. The complexity of the developing grounded theory and the extent to which the qualitative researcher makes sense of the issues being explored will ultimately determine the number of dis-cussions needed. This can be contrasted to focus groups conducted from a positivist perspective, focusing upon generating an understanding of issues to be confirmed in a subsequent survey. In the latter scenario, the researcher may not need to continue to search for more contradictory perspectives. Whichever paradigm underpins the applica-tion of focus groups, resources permitting, one should conduct additional discussion groups until the moderator can anticipate what will be said. The last sentence is a reminder of the final factor determining the number of discussions – the time and money afforded by the client.
In summary, the number of focus groups that should be conducted on a single subject depends on the following factors:
• The extent to which comparisons between different types of participants are sought.
• The types of participant to be targeted and how well they interact in a discussion.
• The geographic spread of participants.
• The paradigm that underpins the planning, administration and analysis of the focus group.
• The time and budget available.
Another dimension of running the groups, beyond the actual number of groups, is the nature of stimuli that the moderator chooses to input. At certain times, examples of particular products or brands may be introduced for participants to examine, to taste, touch, smell or sample if the nature of the product permits. Advertising material such as brochures, posters or even video recordings of TV or cinema adverts can be shown and a response generated. One of the most frequently used forms of stimuli is the mood board.
The ‘mood board’ is really the creation of a collage, though in some discussions, pre-prepared collages are given to participants.20 Focus group participants are given a pile of magazines and asked to snip words and pictures from them. The direction they are given is to select images and words that they think represent characteristics of a brand, a consumer type or lifestyle, or whatever issue the researcher wishes to be illustrated in this manner. The resultant collage can then be used to stimulate discussion and to help draw together ideas and connect them. Creative marketing decision makers in copywriting or advertisement develop-ment may develop many ideas directly from the collages or mood boards, as illustrated in the following examples.
Mood boardA collage created in a focus group setting. Focus group participants are asked to snip words and pictures from magazines that they see as representing the values a particular brand is perceived to have. In some circumstances, collages can also be made up from audio and videotapes.

192 Marketing Research
Real research Y bother with insurance21
Suncorp (www.suncorp.com.au) wished to launch a new under-25 ‘Family Discount’ insurance offer. In order to make this work, Suncorp wanted to engage with parents and their children simultaneously. A team of young researchers was recruited to have frank discussions with the youth market. Suncorp wanted to know what their rela-tionship with their parents was like. Suncorp wanted to see if there was any common ground between them and their parents it could use, and what issues it should avoid. Focus groups using mood board exercises produced surprising results: Generation Y were not ‘trapped’ at home, they ‘share’ with their parents, the more liberal of whom have no objection to boy/girlfriends staying over. Parties within reason. No curfews. It could be seen in their fashions: the boho chic of Gen Y girls was not too different from their baby boomer mothers’ youthful fashions. They talked of wardrobe sharing and recycling. The fundamental values of the two generations were far more aligned than the angry Generation X and their parents, or the baby boomers and their depression-era parents. While this understanding may seem fairly obvious to anyone actually living this situation, very little of this was obvious in marketers’ approaches to Generation Y.
Real research Becoming a brand22
The Turkish white-goods company Arçelik (www.arcelik.com.tr) commissioned focus group research to ask consumers how they perceived Arçelik at present and how they would like to see the brand in the future. The findings were revealing. Some of the clip-art visuals used by the consumers in their collages to depict Arçelik included: traditional family; a bit aged; military; Hamamizade Ishak Efendi (an historical music composer); old TV sets; managers in black and white photos; black and white photos of past Miss Turkey winners; the British Royal Family; an old lady with back pain; a wooden bridge; a classical painting; old shots from Turkish TV authority broadcasts and Turkish carpets. The same groups said they would like to see Arçelik in the future as: ‘smiling; smiling youngsters; young women; motor sports; cute babies; luxury cars; happy families; family values; portable shelves; astronauts and computers.’
The mood board has two main functions:
1 Reference point. The moderator can use the mood board to reflect upon the discussion, in which case issues can emerge that were not so apparent in the heat of a discussion.
2 Enabling device. The mood board gets participants to loosen up and talk more freely. The focus group is not to get participants to talk rationally but to display what ‘feels right’ to

193Chapter 7 Qualitative research: focus group discussions
them. The collage can help to express feelings they may not be able to put into words, or enable those words to have more clarity. This can happen by questioning what is included in a mood board, as well as what is omitted.23
The mood board and the creation of collages can develop beyond two-dimensional images. Given the growth of social media, individuals have become far more adept at expressing their personalities, their likes and dislikes through music and videos. The growth and engagement with sources such as Facebook, YouTube and SecondLife demonstrates an array of ways that consumers wish to express themselves and the skills they have developed to form expressions.24 As a result, there are many examples of participants producing video and audio collages in both group and individual settings.
The final stage in planning and conducting focus groups involves the analysis of data. (Chapter 9 discusses qualitative data analysis in more detail.) There are two essential points to note:
1 Evolving analysis. Focus groups can change and develop in terms of the issues discussed and the stimuli used to draw out views from participants. The changes are made as the mod-erator generates and develops new ideas as each focus group progresses. The moderator makes observations and notes to help as the discussion progresses, and also for when it is over. The moderator may also interact with the client as the discussion progresses and/or when individual groups are completed. These observations and notes are part of the total analysis in that they decide which issues to probe, which issues to drop and the form of sum-marising issues that may be presented to groups at certain stages of the discussion.
2 Not just the narrative. If the discussion is recorded then transcripts can be produced, which can be analysed with proprietary software. These transcripts form a major part of the analysis procedure but the accumulation and reflection upon observations and notes forms a key part of the analysis.
The moderator
Throughout this chapter we have referred to the moderator as an individual who conducts a focus group discussion, by setting the purpose of the discussion, questioning, probing and handling the process of discussion. This individual may also be the researcher handling the project. More likely it will be someone who specialises in the technique, or, given the num-ber of groups to run and the time allowed to complete them, a number of specialist modera-tors will be employed. Whoever is to undertake the task of ‘moderating’ will require the following qualities:25
• Kindness with firmness. The moderator must quickly develop an empathy with group members. From this the moderator should show kindness to make participants feel wel-come, combined with a firmness to stop particular individuals taking over the discussion.
• Permissiveness. The moderator must be permissive, allowing the flow of discussion to develop as the group sees fit. However, the moderator must be alert to signs that the group’s cordiality or purpose is disintegrating.
• Involvement. The moderator must encourage and stimulate intense personal involvement. In certain circumstances, this may mean becoming involved in the actual discussion itself. This can happen if a tendency for ‘group speak’ emerges. ‘Group speak’ happens when little debate or creativity in ideas develops, as particular individuals may not wish to be seen as going against a perceived group norm.
• Incomplete understanding. The moderator must encourage participants to be more specific about generalised comments by exhibiting a feigned naïvety or incomplete understanding.

194 Marketing Research
• Encouragement. The moderator must encourage unresponsive members to participate.
• Flexibility. The moderator must be able to improvise and alter the planned outline amid the distractions of the group process.
• Sensitivity. The moderator must be sensitive enough to guide the group discussion at an intellectual as well as emotional level. The moderator must also be attuned to mood changes and issues that fire up enthusiastic responses or, conversely, cause the discussion to dry up. Sensitivity can also encompass the subtle nuances in the manner that they are viewed by participants, e.g. their dress, speech and manner, language and forms of expres-sion used by participants and cultural references and context of these references as expressed in the discussion.
• Observation. As the group progresses, notes must be made of ideas or questions to come back to, interpretations of particular silences or bouts of laughter, and how group mem-bers are interacting with each other. These observations help the group discussion to pro-gress well and the interpretation of the discussion to have greater meaning.
Other variations of focus groups
Many developments have occurred in the format of group discussions. An illustration of one development was set out in the Philips example at the start of the chapter in the use of online bulletin boards for group discussions. As with the Philips example, most developments have been facilitated by the growth of online technologies and will be discussed later in the context of social media (Chapter 17) and mobile research (Chapter 18). However, in examining how mod-erators may adapt and change their role in order to engage and elicit more from participants, it is worth examining several variations of the standard focus group procedure. These include:
• Two-way focus group. This allows one target group to listen to and learn from a related group. In one application, physicians viewed a focus group of arthritis patients discussing the treatment they desired. A focus group of these physicians was then held to determine their reactions.
• Dual-moderator group. This is a focus group discussion conducted by two moderators. One moderator is responsible for the smooth flow of the session, and the other ensures that specific issues are discussed.
• Duelling-moderator group. Here also there are two moderators, but they deliberately take opposite positions on the issues to be discussed. This allows the researcher to explore both sides of controversial issues. It also encourages participants who may support a particular per-spective to express their views without fear that they will be ‘attacked’ by the rest of the group.
• Participant–moderator group. In this type of focus group, the moderator asks selected participants to play the role of moderator temporarily to improve group dynamics.
• Client–participant group. Client personnel are identified and made part of the discussion group. Their primary role is to offer clarifications that will make the group process more effective.
• Mini group. These groups consist of a moderator and only four or five participants. They are used when the issues of interest require more extensive probing than is possible in the standard group of 6–10.
• Telephone focus groups. These are conducted using a telephone conferencing system with the same number of participants as conventional focus groups, but typically within a nar-rower time frame, no more than an hour. These can work well in gaining access to widely dispersed experts in a range of professions or specialists. They would not be cost effective with ‘average’ consumers, except perhaps in cases where follow-up from survey partici-pants is desired.26

195Chapter 7 Qualitative research: focus group discussions
Other types of qualitative group discussions
Brainstorming
Traditional brainstorming has been used for several decades, especially in the context of management or marketing issues.27 Whether formal or informal, the process is the same: think of as many ideas as you can and say them out loud; leave the evaluation until later; build on and combine others’ ideas; be as imaginative as possible, the wilder the ideas the better. The group moderator seeks to nurture an atmosphere of creativity, tapping into the intuition of participants, generating novel ideas and connections between ideas. When it works well, ideas flow freely from an interplay that may never have occurred if the group had not brainstormed together.
Two problems plague traditional brainstorming: production blocking and evaluation apprehension:
• Production blocking. Occurs when a group member has an idea, but someone else is talk-ing. When it is finally his or her turn they have forgotten the idea, or think it is redundant or not that good. If the group is large or dominated by talkative people, such members lose interest and do not say what they think.
• Evaluation apprehension. Occurs when participants become anxious about what others think of their thoughts. Ideas may be censored, as there is a fear of being labelled as odd. When participants feel this apprehension they do not produce as many new and poten-tially useful ideas but keep themselves to themselves, and therefore defeat the purpose of brainstorming.
As with traditional focus groups, online developments have generated a large variety of new approaches to brainstorming and generating ideas. These can include the use of research communities, Twitter and games.28 The following example illustrates a comparison of tradi-tional versus online approaches to brainstorming.
Real research BrainJuicer online brainstorming29
The research agency BrainJuicer (www.brain-juicer.com) has created a four-stage approach to online brainstorming: (1) identify ‘creative consumers’ via an online creativity test; (2) brief 50 creative consumers online to create 500 new ideas for a certain product/category and collect the new ideas digitally; (3) catego-rise the output, select the most promising 50 ideas from the total; (4) after this the client team focuses on what it is good at: harvesting, articulating sound and appealing con-cepts. Harvesting can be done in a joint workshop to create commitment to the ideas. Using this process BrainJuicer was asked to generate new-product ideas for Unilever Deodorants, both for men (e.g. Axe) and for women (e.g. Rexona). Halfway through the process it was decided to feed the ideas from the creative consumers into a brainstorm-ing workshop and then invite some of them to participate in the workshop. After the workshop, a total of 40 ideas, 21 originally from Unilever resources (generated using traditional brainstorming techniques) and 19 originally from the BrainJuicer process, were selected by Unilever to be evaluated head to head in BrainJuicer’s screening tool, the Predictive Market™. The Predictive Market uses a large diverse crowd to decide on

196 Marketing Research
ideas with the most potential in the marketplace. Participants get virtual shares in all ideas tested. They need to maximise their own wealth by selecting one idea that they think will be a big failure in the market and one idea that they feel will be most successful in the market. For each idea, they assessed how often it had been selected ‘to sell’ and how often it had been selected ‘to double shares in’. Among the deodorant ideas for men, the two winning ideas were inspired by the BrainJuicer process. Five out of six ‘question marks’ (often polarising ideas with niche potential) were inspired by the pro-cess. From the Unilever Deodorant results it was clear that the traditional brainstorming approach was less successful in generating fresh potent ideas than the group of creative consumers working individually online.
Misconceptions about focus groups
There has been much debate about the use and value of focus group discussions. Much of the debate has been misinformed through the development of myths and misconceptions built around the technique. Misconceptions about focus groups have emerged from assumptions made by researchers or the users of focus group findings, or even journalists. Their assump-tions may have been useful at one time, in a particular context, or when tackling a certain subject. The assumptions may well apply to specific contexts but may not be applicable to focus groups in general. Working through the misconceptions can help researchers make decisions about when and how to use focus groups, and even whether they should be using them at all.30 The misconceptions about focus groups can be summarised by the five Es:
1 Economical – they are low cost and quick. The idea that focus groups are low cost and quick has emerged through comparison with other research methods. In comparison with survey research, focus groups (and especially online focus groups) may be conducted with a smaller budget and more quickly. This is not a fair comparison given the sample sizes that the techniques work with and the type of data they generate. In comparison with other qualitative methods, focus groups are often more expensive than observation and individual interviewing, primarily due to more expensive recruiting methods. The biggest resource involved in the technique, however, is that of the researcher in the careful plan-ning, execution and analysis of focus groups. The analysis of the data generated can be ‘cheap and quick’ if it is a case of decision makers taking away their own conclusions from focus groups they have observed. Analysis can be far more expensive and time con-suming if the careful planning and execution is followed up by the assembly of data, reflective diaries and memos and the full immersion into those data of the researcher (as detailed in Chapter 9).
2 Experts – they require professional moderators. The qualities of a good moderator were detailed above. A professional moderator, with experience of tackling different subjects, questioning and probing different types of participant and working in a variety of con-texts, undoubtedly has much to offer any project. However, in many instances it is not the amount of experience that matters most in moderating. Sometimes a less-experienced moderator, who has more contact with the issues under question, more contact with the participants and is perhaps more comfortable in the interview location, can elicit better data. This is especially true when working with distinctive ethnic, linguistic or cultural groups. For example, an undergraduate student working on a project for a leading deodor-ant brand was about to enter the room to conduct a focus group. Looking at the 18–20 year olds before he entered the room, he realised that he was wearing the ‘wrong’ logo. With a quick change of his shirt, he continued with the discussion to great effect. Upon

197Chapter 7 Qualitative research: focus group discussions
reflection, he revealed that the logo he was wearing, and indeed the colour of his sweat-shirt, would have said things about him to the group that would have affected his credibil-ity with the assembled participants. He felt that he would not have been able to engage with the group and get it to reveal so much had he been in his original clothing. His acute sensitivity to this cultural nuance made this focus group particularly effective; an older and more experienced moderator may not have picked this up. The best moderators are not necessarily those with the most experience. Rather it is the individual that can best engage with, listen to and draw out the best of target participants.
3 Easily upset – they do not work for sensitive topics. Focus groups are regularly used in projects related to sexual behaviour, substance abuse and stressful life events, which have marketing or other social implications. This misconception is based upon what may be deemed as socially acceptable in conversations, perhaps around the dinner table. How-ever, focus groups present an atypical setting for discussion. The moderator is encourag-ing everyone in the group to share values and experiences that they all have an interest in. There may be little consequence to what they say, especially if they are meeting with strangers whom they may never meet again. Handled with caution, the moderator can encourage participants to reveal things they would normally keep to themselves. Research-ers and moderators working with sensitive issues must make plans to encourage appropri-ate self-disclosures, and to cope with disclosures that go beyond the boundaries of the project. These plans go beyond the wording of the questions and probes into the atmos-phere the researchers wish to create at the discussion, the nature of the location being particularly important here.
4 Endorsement – they must be validated by other research methods. This is part of the gen-eral misconception that all qualitative techniques play a preliminary role that prepares the way for a conclusive technique. Focus groups can serve a useful role as the first stage of developing questionnaires or experiments, but that is not their sole purpose. Focus groups can illuminate and indeed help to validate many of the statistical findings that emerge from surveys, e.g. helping to understand and describe findings from factor and cluster analyses. They can be used in isolation to produce the kind of in-depth understanding of an issue that no other technique can provide: for example, the use of a particular celebrity in an advertisement can generate a series of emotional responses that could impact upon the brand values – and those values are compounded by the particular use of music and who is playing that music. To uncover what is happening to the viewers and how their values may have changed, the focus group may well be the most efficient and effective technique, of all qualitative or quantitative options.
5 Exposure – they reveal how consumers will behave. Focus groups, in-depth interviews and surveys all depend upon verbal reporting. They depend upon a belief in what partici-pants say about how they intend to behave. In many circumstances, even when it comes down to it, the most sincere participants can change their minds. In focus groups, partici-pants may talk about their likely behaviour in many hypothetical scenarios, moderators can watch other participants nod their heads in agreement and the evidence is compelling. It must be recognised that the data generated are attitudinal, and trying to predict behav-iour from attitudes is most problematic. The rise in customer databases and ethnographic methods has helped researchers to predict consumer behaviour and validate the findings of focus groups and surveys.
The focus group, like every research technique, is never foolproof or perfect. To get the most from focus groups, the following thinking should be encouraged.31 First, the quality of moderating is crucial to the success of the discussion. The quality of the findings is directly related to the talents, preparation and attentiveness of the moderator. Second, teamwork is vital. As well as star moderators, there must be quality recruiters, note-takers, analysts and reporters. Third, this team has always something to learn from the participants. For a short period of time, the participants open their lives and share their experiences, preferences and

198 Marketing Research
beliefs. The most destructive thing a researcher can do in a focus group is to display arrogance, condescension or superiority. It is much better to sit back and let participants tell you every-thing you wanted to know, and more! Finally, there are many ways to conduct successful focus groups. Given the nature of the topic under investigation and the nature of the target partici-pants, there are many options to choose for the best context and approach to draw out the best from participants. Focus groups vary enormously in how they are planned, administered and analysed, from the very structured interview in a studio bristling with technology, through to a passionate dialogue conducted globally online, to a riotous exchange on a tropical beach. Experimentation with new ways of conducting focus groups should be positively encouraged rather than being bound by the thought that there is one ideal way to conduct them.
Real research Becoming a brand32
Young focus group participants are different creatures from adults, and this calls for some adaptations to the way researchers approach their work. Young people can be deeply self-conscious and lack confidence in revealing and articulating their views in front of others. A forum that seeks to source this information from them can therefore be an uncomfortable one. If they are involved in focus groups, it is like asking them to attend an event that can look like a school scenario. If it is not differentiated, this can result in an uncooperative or unmanageable group, as giggles take over and the mod-erator loses control. Generating comfort, and thus confidence, is crucial. It is worth add-ing a question to the recruitment screening about their possible ‘subcultural’ or ‘tribal’ leanings. With little else to use in self-definition, these visual distinctions can be all-important. Sworn enemies on the local high street, emo/indie/goth kids and ‘townie’ or ‘hoodie’ youths do not make easy group partners. In a group setting, girls tend to open up and share together fairly quickly. Boys need more time because their group dynamics are based on clear-cut roles. It can be worth asking them to arrive 30 minutes early and leave them to play games together or complete a task before the group kicks off. This will give them time to form some sense of group structure. Alternatively, start the group with some smaller team tasks before bringing them back together to talk as a whole. Where possible, it is worth trying to work with young people’s existing friendship groups. As well as providing a young person with security and familiarity, it offers a much more authentic understanding of brand adoption behaviours. By working with a set of friends, it can be possible to see how deliberations and decisions are played out and negotiated. What brought them to group consensus? What, or who, was the all-important lever in that consideration process?
Online focus groups
Throughout the chapter we have referred to and illustrated the use and value of online focus groups. The fundamental principles of why focus groups are conducted, their management and the data analysis challenges are similar between traditional offline focus groups and online focus groups, sometimes known as e-groups. Before examining their relative strengths and weaknesses it is worth considering a general description of online focus groups.
As in the case of traditional focus groups, online focus group participation is by invitation only. The participants are pre-recruited and generally come from lists of individuals who have expressed an interest in particular products, services or issues. An example of such a list could be the use of access panels (detailed in Chapter 4), such as (www.researchnow.com).

199Chapter 7 Qualitative research: focus group discussions
A screening questionnaire can be administered online to qualify participants, even if access panel members have already been profiled. Those who qualify are invited to participate in the online focus group and given clear benefits and a reward for their participation. They receive a time, a URL, a room name and a password via email. Before the focus group begins, participants receive information about the discussion that covers such things as how to express emotions when typing. Electronic emotion indicators are produced using key-board characters and are standard in their use on the internet. Obvious examples include :-) and :-( for happy and sad faces. The emotions are usually inserted in the text at the point at which the emotion is felt. Emotions can also be expressed using a different font or colour. There are a wide range of emotions to choose from, expressed such as: I’m frowning, I’m laughing to myself, I’m embarrassed, I’m mad now, I’m responding passionately now. These are then followed by responses. Participants can also preview information about the discus-sion topic by visiting a given website and reading information, or downloading and viewing visuals such as TV advertisements. Then, just before the focus group begins, participants visit a website where they log on and get some last-minute instructions.
When it is time for the discussion, participants move into a web-based chat room. In the chat room, the moderator and participants type to each other in real time. The general prac-tice is for moderators always to pose their questions in capital letters and participants use upper and lower case. Participants are asked always to start their response with the question or issue number, so the moderator can quickly tie the response to the proper question. This makes it fast and easy to transcribe a discussion. A raw transcript is available as soon as the discussion is completed and a formatted transcript can be available within 48 hours (the form of data used depends upon whether the transcript is to be input into qualitative analysis soft-ware and is to be built up as the groups progress, and/or is to be read by the client). The whole process of conducting the discussions and uploading transcripts for analysis is much faster than in traditional focus groups.
New forms of online focus groups continue to emerge. For example, online bulletin boards, such as the Philips example outlined at the start, involve the moderator and partici-pants over an extended period of time, from a few days to a few weeks. Questions and chal-lenges can be slowly fed out over time, allowing the researcher to reflect upon responses that have been received and adapt subsequent questions. Participants can reflect in more depth and respond at their own convenience. Participants may also be given tasks such as collect-ing and posting visuals and music or offering web links to illustrate ideas and issues. Such an approach can enable an in-depth discussion among 25 or more participants. The extended time period allows participants to react to and build upon each other’s ideas in a way that is often not possible during a traditional focus group that lasts even up to six hours. The follow-ing example illustrates a demonstration of how online focus groups could work for a design challenge faced by a bank. Of particular note is the value of input and observations made by the client – a topic discussed earlier in the chapter.
Real research Online focus group vs. traditional focus group experiment33
A leading high-street bank set iCD Research (www.icd-research.com), nqual (www.nqual.com) and The ID Factor (www.theidfactor.com) a challenge: to demonstrate that an online focus group would match the findings from traditional qualitative research. The objectives of the project were centred on a new credit card proposition. To demon-strate the capabilities, a two-stage online focus group was proposed to be conducted at 8 p.m. on a Tuesday and Wednesday night. Utilising existing data within The iD Factor financial panel, participants were selected on their consideration to switch credit-card providers within the next 12 months. A recruitment email validated this consideration, with the invitation to attend the night sessions. This information, as well as a demographic

200 Marketing Research
and attitudinal profile of each participant, was sent to the client prior to the session. A main moderator was based in London and a secondary moderator, based in Australia, was also present. At 7.55 p.m., a total of nine participants were active within the session, with an additional 18 observers across five companies/subsidiaries and three continents watching. The approach adopted within ‘online focus group 1’ was consistent with an offline topic guide, but adopted techniques that could be integrated into focus groups without risking participant focus or the trust in the moderation. The structure of the ses-sion followed what might be considered a ‘traditional’ qualitative format, including eval-uation of a proposition as well as the incorporation of participant-suggested improvements. The use of client observers and a second moderator allowed the client proposition to be adapted ‘live’ based on initial and user-generated comments and ‘built’ by the second moderator, uploaded into the session and evaluated. Client partici-pation was crucial as it allowed participant-generated queries to be addressed and answered correctly, as well as assisting the moderator in steering the conversation in a way that could deliver against the set objectives. At 10 p.m. nqual delivered the discus-sion transcript to iCD Australia moderators. The Melbourne office was then able to take their observations, transcript and start the analysis process at 9 a.m. Australian EST. By 8 a.m. UK time the following morning, a summary report with proposition and stimulus-recommended changes was delivered to the UK team, who by 9 a.m. had delivered a report to the client and worked with the client to make changes for ‘online focus group 2’. A fresh, but matched demographic and behavioural sample of participants was recruited for the second focus group. This followed a similar structure to ‘online focus group’ 1, with the revised stimulus and proposition. With the Australian office co-moderating and observing again, summary and analysis was again conducted over-night, which included quantitative recommendations. In response to this an online survey was launched on the Friday, completed by the Sunday and fed back on the Monday. The combined qualitative and quantitative project was commissioned, recruited and delivered within a seven-day period. When comparing the trial of focus groups with the previously commissioned research, the key themes, initial feedback and suggested user improvements were completely consistent for both approaches. Never-theless, the client viewed the online approach more positively because it was faster, and was able to refine the proposition in real time and actively contribute to the session.
Advantages of online focus groups
Participants from all over the country or even the world can take part, and with mobile tech-nology advances they can physically be anywhere that they are comfortable. Likewise, the client or decision maker can observe and comment on the discussion from anywhere. Geo-graphical constraints are removed and time constraints can be lessened. Unlike traditional groups, there is the opportunity to contact participants again at a later date, to revisit issues, or introduce them to modifications in material presented in the original focus group. The internet and the use of profiled consumers via access panels enable the researcher to reach segments that are usually hard to interview: doctors, lawyers, professionals, working mothers and oth-ers who are leading busy lives and not interested in taking part in traditional focus groups.
Moderators may also be able to carry on side conversations with individual participants, probing deeper into interesting areas. Participants may be less inhibited in their responses and can be more likely to express their thoughts fully, especially if they have the facility to reflect and upload images, music or other forms of expression. Many online focus groups go well past their allotted time as so many responses are expressed as participants become

201Chapter 7 Qualitative research: focus group discussions
engaged in the discussion. Finally, as there is no travel, video-recording or facilities to arrange, the cost is much lower than traditional groups. Firms are able to keep costs between one-fifth and one-half the cost of traditional groups.34
Disadvantages of online focus groups
Only individuals who have access to and know how to use a computer (desktop or mobile) can participate in online groups. The global growth and access to computers means that internet access may seem ubiquitous, but there remain significant numbers that cannot, par-ticularly among older age groups. Since the name of a participant is often private, actually verifying who the participant is and thus whether they fit a target profile is difficult. To over-come this limitation, other traditional methods such as telephone calls are used for the recruitment and verification of participants. This is an area where the use of a well-managed access panel can help in ensuring the profile of a participant is correct for a particular study. Body language, facial expressions, silences and the tone of voice cannot be observed and electronic emotions cannot capture as full a breadth of emotion as video-recording. Another factor that must be considered is the general lack of control over the participant’s environ-ment and potential exposure to distracting external stimuli. Since online focus groups could potentially have participants scattered all over the world, researchers and moderators have no idea what else participants may be doing during the discussion. This has to be balanced against the comfort that may be felt by the participants in being able to conduct the discus-sion in a context where they feel comfortable. Only audio and visual stimuli can be tested. Products cannot be touched (e.g. clothing) or smelled (e.g. perfumes). It may be more diffi-cult to get clients or decision makers involved in online groups than in observing traditional groups. It is hard to replicate the compelling views of consumers, expressing themselves in an uninhibited manner, on what they feel about a product or service. Table 7.2 presents a summary comparison of online and traditional focus groups.35
Table 7.2
Characteristic Online focus groups Traditional focus groups
Group size 4 to 8 participants 6 to 10 participants
Group composition Anywhere in the world Drawn from a targeted location
Time duration 1 to 1.5 hours – though can last over a week as participants are given tasks and come back to the discussion
1.5 to 6 hours
Physical setting Researcher has little control – but the participants can be in a place that is comfortable to them, especially with the use of mobile technology
Under the control of the researcher
Participant identity In some circumstances can be difficult to verify Can be easily verified
Participant attentiveness
Participants can engage in other tasks – not seen by the moderator
Attentiveness can be monitored
Online versus traditional focus groups

202 Marketing Research
Summary In direct qualitative methods participants are able to discern the true purpose of the research, whereas indirect methods disguise the purpose of the research to some extent. Focus groups can be a completely direct qualitative method, though by the use of observational and projective techniques elements of indirectness can be intro-duced. In deciding how ‘direct’ a focus group should be, researchers have to face ethical issues and questions related to the richness of data that they can draw from participants. Focus group discussions are the most widely used qualitative research method.
Focus groups are conducted by a moderator in a relaxed and informal manner with a small group of participants. The moderator leads and develops the discussion. In a focus group, participants can portray their feelings and behaviour, using their own
Table 7.2
Characteristic Online focus groups Traditional focus groups
Participant recruitment
Easier can be recruited online, by email, by access panel, or by traditional means
Recruited by traditional means (telephone, mail, mail panel)
Group dynamics Limited Synergistic, snowballing (bandwagon effect)
Openness of participants
Participants can be candid – may be more open with identities hidden to some extent
Participants can be candid as they build up trust of each other
Difficult with sensitive topics
Non-verbal communication
Body language and facial expressions cannot be observed
Some emotions can be expressed
Easy to observe body language and facial expressions
Expression of emotions easier to monitor
Use of physical stimuli
Limited to those that can be displayed online – unless specific engagement tasks given to participants
A variety of stimuli (products, advertising, demonstrations) can be used
Transcripts Available immediately Time-consuming and expensive to obtain
Observers’ communication with moderator
Observers can communicate with the moderator on a split screen
Observers can send messages to the moderator from behind two-way mirrors
Unique moderator skills
Software familiarity, awareness of chat-room slang
Observational
Turnaround time Can be set up and completed in a few days Takes many days to organise, administer and analyse
Client travel costs None Can be expensive
Client involvement Limited High
Basic focus group cost
Much less expensive More expensive due to facility rental, refreshments, video/audio taping and transcript preparation
Continued

203Chapter 7 Qualitative research: focus group discussions
language and logic. The value of the technique lies in the unexpected findings that emerge when participants are allowed to express what they really feel, especially as different sensory experiences are explored. An experimental focus group should always be run at the start of any series of discussions. The researcher needs to understand how comfortable target participants feel in the chosen location for dis-cussion, how the opening question works, the topic guide, the probes, the mix of participants and the refreshments, including any alcoholic drinks. In a nutshell, one could argue that one should continue running focus groups until nothing new is learned from target participants. This perspective oversimplifies how diverse and spread out different participants may be and how well they mix together in a group situation. The time and budget available will also mean that a cut-off point has to be drawn and the strongest analysis and interpretation has to be made at that point. Online technical and technique developments have seen online focus emerge as a means to engage with geographically dispersed participants. Such engagement can be conducted in a speedier and cheaper manner than traditional focus groups. Tradi-tional focus groups allow for richer observations of participants and more creative sensory experiences to be evaluated. There is no one absolute correct method to administer a focus group; the researchers should understand the factors that will make the technique work for their particular research problem and the type of par-ticipants they have to work with.
Researchers face challenges in planning, administrating and analysing focus groups when set in international contexts. It is vital that researchers do not impose their norms of running focus groups in different cultures but learn from indigenous researchers. This learning is vital in making cross-cultural comparisons. A key ele-ment of ensuring that the focus group works well lies in the ethical issues of how much is revealed to participants before they get involved, and during the discus-sion. Getting participants to relax and be open may involve the use of alcoholic drinks, which for many researchers creates no problems but for some creates ethical and practical issues. With the growth of online focus groups, the ethical challenge of understanding who is actually engaged in a discussion is paramount. This is particularly relevant in researching children, where ESOMAR guidelines have to keep up with emerging technologies and practices. Social media developments have resulted in the emergence and growth of Marketing Research Online Com-munities (MROCs). These communities are being adopted by many brands to engage with their existing and potential customers. Online focus groups can be conducted in the context of MROCs, but the development of communities as a potentially richer and cheaper data source will impact upon decision makers’ views of the use and value of focus groups.
Questions 1 Why may researchers not wish to fully reveal the purpose of a focus group discussion with participants before it starts?
2 What are the key benefits and drawbacks of conducting focus group discussions?
3 What are the difficulties in conducting focus groups with managers or professionals?
4 What determines the questions, issues and probes used in a focus group?

204 Marketing Research
Exercises 1 Following the methods outlined in this chapter, develop a plan for conducting a focus group study to determine consumers’ attitudes towards organic foods. Specify the objectives for the groups, write a screening questionnaire, list potential props or physical stimuli that you could use in the discussion and develop a moderator’s outline.
2 Your campus sports centre is trying to recruit more members from the local non-student community. In achieving this aim, evaluate the marketing decisions that could be supported by focus groups, either as a technique in its own right or as validated with other techniques.
3 You are a brand manager for Red Bull energy drinks. You wish to invest in an online focus group study of energy-drink buyers. Explain how you would identify and recruit such participants from across the globe. What incentive(s) would you offer potential participants?
4 Visit the website of the Association of Qualitative Research Practitioners (www.aqr.org.uk). Examine the reports and views of contributing practitioners (look in the news and inspiration section) and write a report on what you feel are the latest developments and/or opportunities in the use of focus groups.
5 In a small group discuss the following issues: ‘The dress, appearance and speech of the moderator create biases in group discussions that cannot be evaluated’ and ‘Mood boards created in focus groups are more useful to marketing decision makers compared with a formal written analysis of the discussions’.
5 Evaluate the purpose of running an experimental focus group discussion.
6 What does a ‘comfortable setting’ mean in the context of running a focus group?
7 To what extent can a moderator achieve an ‘objective detachment’ from a focus group discussion?
8 Why is the focus group moderator so important to the success of a focus group discussion?
9 What are the relative advantages and disadvantages of being able to observe covertly a focus group discussion?
10 What can the researcher do to make potential participants want to take part in a focus group?
11 What determines the number of focus groups that should be undertaken in any research project?
12 Describe the purpose and benefits of using stimulus material in a focus group.
13 What is an online focus group? What are the distinct advantages and disadvantages of running online compared with traditional focus groups?
14 Describe the opportunities and difficulties that may occur if alcoholic drinks are served during focus group discussions.
15 What is a Marketing Research Online Community (MROC)? How can an MROC be viewed as a group-based qualitative research technique?

205Chapter 7 Qualitative research: focus group discussions
Notes
1. Djurovic, V. and Depeux, V., ‘Semiotics of taste: Application in China for international (and local) food and flavor industries’, ESOMAR Qualitative, Barcelona (November 2010).
2. Mesure, P., McGouran, O. and Feehan, M., ‘Using online bulletin boards to develop high value corporate strategy’, ESOMAR Congress Odyssey, Athens (September 2010).
3. To understand more of how a luxury brand may be researched using qualitative techniques, see Healy, M.J., Beverland, H.O. and Sands, S., ‘Understanding retail experiences – the case for ethnography’, International Journal of Market Research 49 (6) (2007), 751–78.
4. For an excellent discussion on the problems of interpreting ‘silence’ in interviews, see Prasad, S., ‘Listening to the sounds of silence’, ESOMAR Asia Pacific, Kuala Lumpur (April 2010).
5. Ewing, T., ‘Confessions of a moderator: How web communities fail and how marketers can stop that happening’, Market Research Society: Annual Conference (2008); Morgan, D.L., ‘Focus group interviewing’, in Gubrium, J.F. and Holstein, J.A. (eds), Handbook of Interview Research: Context and Method (Thousand Oaks, CA: Sage, 2002), 141–59.
6. Morrison, D.E., ‘Focus group research: A misunderstood history’, ESOMAR Qualitative Research, Venice (November 2003); Morgan, D.L. and Krueger, R.A., ‘When to use focus groups and why’, in Morgan, D.L. (ed.), Successful Focus Groups: Advancing the State of the Art (Newbury Park, CA: Sage, 1993), 3–19.
7. ESOMAR, ‘Global Market Research’, ESOMAR Industry Report (2010), 16.
8. Bloor, M., Frankland, J., Thomas, M. and Robson, K., Focus Groups in Social Research (Thousand Oaks, CA: Sage, 2001).
9. Kreuger, R.A. and Casey, M.A., Focus Groups: A Practical Guide for Applied Research, 3rd edn (Thousand Oaks, CA: Sage, 2000); Drayton, J. and Tynan, C., ‘Conducting focus groups – a guide for first-time users’, Marketing Intelligence and Planning 6 (1) (1988), 5–9.
10. For more discussion, see Dexter, A. and Ngoc Hieu An, B., ‘From Bricolage to Pho – Vietnam as a model for global influences and assimilations at meal times’, ESOMAR Asia Pacific, Beijing (April 2009); Andrews, M. and Langmaid, R., ‘Theory and practice in the large group’, Market Research Society, Annual Conference (2003); Morgan, D.L., Planning Focus Groups (Thousand Oaks, CA: Sage, 1998), 71–6.
11. Forrest, C., ‘Research with a laugh track’, Marketing News 36 (5) (4 March 2002), 48; Mazella, G.F., ‘Show-and-tell focus groups reveal core bloomer values’, Marketing News 31 (12) (9 June 1997), H8.
12. Morgan, D.L., Planning Focus Groups (Thousand Oaks, CA: Sage, 1998), 71–6.
13. MacDougall, C., ‘Planning and recruiting the sample for focus groups and in-depth interviews’, Qualitative Health Research 11 (1) (January 2001), 117–26; Kahn, H., ‘A professional opinion’, American Demographics (Tools Supplement) (October 1996), 14–19.
14. Gordon, W., ‘New life for group discussions’, ResearchPlus (July 1993), 1.
15. Baskin, M., ‘Observing groups’, WARC Best Practice (November 2010).
16. McPhee, N., ‘Is there a future for “real” qualitative market research interviewing in the digital age?’, ESOMAR Congress Odyssey, Athens (September 2010); Krueger, R.A., Moderating Focus Groups (Thousand Oaks, CA: Sage, 1998), 30.
17. Stokes, D. and Bergin, R., ‘Methodology or “methodolatry”? An evaluation of focus groups and depth interviews’, Qualitative Market Research: An International Journal 9 (1) (2006), 26–37; Goldsmith, R.E., ‘The focus group research handbook’, The Services Industries Journal 20 (3) (July 2000), 214–15; Greenbaum, T.L., The Handbook for Focus Group Research (Newbury Park, CA: Sage, 1997).
18. Krueger, R.A., Developing Questions for Focus Groups (Thousand Oaks, CA: Sage, 1998), 25.
19. Ellis, R., ‘So how do you upstage a Ferrari owner?’, ResearchPlus (November 1994), 10.
20. Toiati, L., ‘How do you call collages in Asia?’, ESOMAR Asia Pacific Conference, Singapore (December 2002), 1–20.
21. Jowell, C. and Barber, A., ‘Suncorp – “Family Discount” campaign: Y bother with insurance?’, Account Planning Group (Australia), Finalist, Creative Planning Awards (2006).
22. Vardar, N., ‘Arçelik: From “a passion for manufacturing” towards “becoming a brand”’, Turkish Foundation of Advertising: ‘Turk Markalari-2’, Turkish Foundation of Advertising Publications (2008).
23. Croft, M., ‘Art of the matter’, Marketing Week (9 October 1997), 71.
24. Jalboukh, T. and Chaudhry, A., ‘Reality YOUTH research – the Arabian YOU (TH) Tube!’, ESOMAR Consumer Insights, Dubai (February 2009).
25. Sharma, A. and Pugh, G., ‘Serpents with tails in their mouths: a reflexive look at qualitative research’, ESOMAR Qualitative Research, Paris (November 2007); Katcher, B.L., ‘Getting answers from the focus group’, Folio: The Magazine for Magazine Management (Special Sourcebook Issue for 1997 Supplement) 25 (18) (1997), 222; and an adaptation from Chase, D.A., ‘The intensive group interviewing in marketing’, MRA Viewpoints (1973).
26. Mariampolski, H., Qualitative Marketing Research: A Comprehensive Guide (Thousand Oaks, CA: Sage, 2001), 47.
27. Gallupe, R.B. and Cooper, W.H., ‘Brainstorming electronically’, Sloan Management Review 35 (1) (Fall 1993), 27.
28. Cierpicki, S., Davis, C., Eddy, C., Lorch, J., Phillips, K., Poynter, R., York, S. and Zuo, B., ‘From clipboards to online research communities: A cross-cultural review of respondents’ perceptions’, ESOMAR Congress Odyssey, Athens (September 2010); Poynter, R., Vieira, S., Alexander-Head, D., Coulter, A., Zuo, B. and Gao, A., ‘Will Twitter change the way that market researchers communicate?’, ESOMAR Asia Pacific, Kuala Lumpur (April 2010); Verbrugge, J., Geels, A., Verbiest, S. and Fletcher, A., ‘Gaming 0.0 – a research game as an innovative “offline” research tool’, ESOMAR Congress, Montreux (September 2009).

206 Marketing Research
29. Johnston, C., ‘Getting over the courtesy bias’, Research World (July 2007), 29.
30. McCracken, G. and Morgan, D.L., The Long Interview + Focus Groups as Qualitative Research (Thousand Oaks, CA: Sage, 2009).
31. Morgan, D.L., The Focus Group Guidebook (Thousand Oaks, CA: Sage, 1998), 52–4.
32. Macdonald, N., ‘Unlocking response from young people’, Admap 504 (April 2009), 12–13.
33. Hamilton, J. and Dixon, P., ‘Real-time global research – a qual revolution’, Market Research Society: Annual Conference (2009).
34. Reid, D.J. and Reid, F.J., ‘Online focus groups’, International Journal of Market Research 47 (2) (2005),
131–62; O’Connor, H. and Madge, C., ‘Focus groups in cyberspace: Using the internet for qualitative research’, Qualitative Market Research 6 (2) (2003), 133–43; Kozinets, R.V., ‘The field behind the screen: Using netnography for marketing research online communities’, Journal of Marketing Research 39 (1) (February 2002), 61–72.
35. Cheng, C.C., Krumwiede, D. and Sheu, C., ‘Online audio group discussions: A comparison with face-to-face methods’, International Journal of Market Research 51 (2) (2009), 219–41; Brüggen, E. and Willems, P., ‘A critical comparison of offline focus groups, online focus groups and e-Delphi’, International Journal of Market Research 51 (3) (2009), 363–81.

Qualitative research: in-depth interviewing and projective techniques
With no social pressure to
conform to group responses,
participants can be questioned
in depth in a context that allows
them to really express how they
feel.
Stage 1
Problem definition
Stage 2
Research approach developed
Stage 3
Research design
developed
Stage 4
Fieldwork or data
collection
Stage 5
Data integrity
and analysis
8
Stage 6
Communicating research findings
208 Marketing Research
Objectives
After reading this chapter, you should be able to:
1 understand why the in-depth interview is defined as a direct qualitative research technique and observation and projective techniques are defined as indirect techniques;
2 describe in-depth interview techniques in detail, citing their advantages, disadvantages and applications;
3 explain how theory may be used to create structure to questioning and analysis in in-depth interviewing by reference to the laddering technique and the repertory grid technique;
4 describe projective techniques in detail and compare association, completion, construction and expressive techniques;
5 understand the context of interviewing and language problems that should be considered by qualitative researchers operating across different countries and cultures;
6 appreciate how technology is shaping the manner in which in-depth interviews and projective techniques are managed.
Having discussed qualitative research in terms of its nature and approach and evaluated focus groups, we now move on to describe and evaluate other qualitative techniques.
We start by describing and evaluating what is meant by an in-depth interview and the procedure of in-depth interviewing. The role of the in-depth interviewer is described and the advantages and disadvantages of the technique are summarised. In the process of conducting in-depth interviews, the techniques of ‘laddering’ and ‘repertory grid’ can be applied to help to structure the elicitation and analysis process. Laddering and repertory grid techniques will be described and illustrated. The indirect qualitative association, completion, construction and expressive projective techniques are described and illustrated. The applications of these techniques are detailed, followed by an evaluation of their advantages and disadvantages. This is developed into an overall summary of the relative strengths and weaknesses of qualitative techniques under the headings of ‘focus groups’, ‘in-depth interviews’, ‘projective techniques’ and ‘ethnographic techniques’.
The following example illustrates a subject that for many individuals would be difficult to articulate: how fragrances appeal to them and their fragrance experiences. The subject requires a qualitative technique to generate data of a kind that will support creative product design, packaging and advertising decisions. The subject matter, however, is ideal for the application of in-depth interviews and projective techniques, where time can be spent building trust and rapport between the interviewer and participant. In-depth interviews allow participants talking about fragrances the time and space to express ideas about everyday events that normally they just get on with and do not have to explain or rationalise to anyone!
Overview
Real research In-depth interviews and fragrances1
Christian Dior and the research agency Repères (www.reperes.eu) developed a research approach that tested consumer reactions to new fragrances and the context in which they are used. This work was particularly aimed at supporting decisions made in the launch of new fragrances. The researchers’ exploration was built upon the use of

209Chapter 8 Qualitative research: in-depth interviewing and projective techniques
In-depth interviews
The meaning of ‘in-depth’
An in-depth interview is an unstructured, direct, personal interview in which a single par-ticipant is probed by an experienced interviewer to uncover underlying motivations, beliefs, attitudes and feelings on a topic.2 It is a qualitative interview and, as such, is based upon conversation, with the emphasis on researchers asking questions and listening, and partici-pants answering.3 The purpose of most qualitative interviews is to derive meaning through interpretations, not necessarily ‘facts’ from participant talk. The emphasis should be upon a full interaction to understand the meaning of the participant’s experiences and life worlds.4 In order to tap into these experiences and life worlds, in-depth interviewing involves a cer-tain style of social and interpersonal interaction. In order to be effective and useful, in-depth interviews develop and build upon intimacy; in this respect, they resemble the forms of talk-ing one finds among close friends. They can resemble friendship, and may even lead to long-term friendship. They are also very different from the nature of talking one finds between friends, mainly because the interviewer seeks to use the information obtained in the interac-tion for some other purpose.5 As the name implies, in-depth interviewing seeks ‘deep’ infor-mation and understanding. The word ‘deep’ has four meanings in this context.6 These meanings will be illustrated with the scenario of a researcher trying to understand the eBay (www.eBay.com) shopping experience:
1 Everyday events. Deep understandings are held by the participants in some everyday activity, event or place. The interviewer seeks to achieve the same deep level of knowl-edge or understanding as the participants. For example, if the interviewer has never used
In-depth interviewAn unstructured, direct, personal interview in which a single participant is probed by an experienced interviewer to uncover underlying motivations, beliefs, attitudes and feelings on a topic.
metaphors and an individual qualitative approach through in-depth interviews. They felt there were limitations in how consumers could talk about fragrances and so chose met-aphors as a way of describing an object, using words other than those that consumers may usually employ. A library of images was built that encompassed the broadest array possible of meanings and feelings. Why in-depth interviews? The researchers felt that individual interviews enabled them to go beyond initial reactions and explore the emo-tional unconscious. This enabled them to explore the whole emotional and imaginary chain underlying the perception of a fragrance. They felt that group discussions would never go as far into perceptions because participants could be restricted in their emo-tional reactions by the perceptions of other participants. One-to-one in-depth inter-views allowed them to analyse the perceptions of different participants, identifying issues common to all (or to a particular target) vs. those specific to the characteristics of each participant. Participants were recruited with a specifically designed recruitment questionnaire that ensured that all had a minimum level of creativity and were able to articulate their thoughts. The room and the moderator were prepared to be as neutral as possible and ensure that a certain level of sensory deprivation was in place, so that the fragrance under study was the ‘star’ of the experience. The moderator avoided wearing perfume so as not to ‘pollute’ the air. The participants, however, were not asked to attend unscented. This was because this would not be true to life. If the participants wore a specific scent on a daily basis they may not feel comfortable being deprived of this olfactory enhancement. They were asked to place the tested fragrance on their skin as they were needed to ‘claim ownership’ of the fragrance. It was key to let the fragrance ‘live’ and develop on the participant.

210 Marketing Research
eBay to buy or sell goods and this experience is what is being investigated, in-depth inter-viewing can be used as a way to learn the meanings of participants’ actions. In this respect, the participant acts as a kind of teacher and the interviewer a student, one interested in learning the ropes.
2 Context. Deep understandings go beyond common-sense explanations of some cultural form, activity, event, place or artefact. In-depth interviewing aims to explore contextual boundaries to uncover what is usually hidden from ordinary view and to penetrate the more reflexive understandings about the nature of that experience. In an eBay investiga-tion, the interviewer can explore the meanings of different shopping experiences, the thrill of ‘winning’ a deal and the ‘joy’ of owning a particular artefact, and the ‘disappoint-ment’ felt when a beautiful pair of shoes that look perfect on the screen are slightly shoddy when they arrive, to name but a few contextual boundaries.
3 Multi-faceted. Deep understandings allow multiple views and perspectives on the meanings of some activity, event, place or cultural object. The researcher may wish to explore the many perspectives of eBay buyers and sellers, family members who ‘enjoy’ or ‘suffer’ eBay transactions in their household, executives who manage eBay, eBay competitors and high-street retailers, again to name but a few facets of the total experience.
4 Interviewer reflection. Deep understandings can help to reveal the interviewer’s common-sense assumptions, practices, ways of talking and self-interests. (This issue will be devel-oped in Chapter 9.) In this example, however, if the interviewer traditionally buys goods from the high street, wanting to examine the goods before buying, or has not conducted an internet transaction, what will the interviewer ‘see’ or ‘hear’ in a particular in-depth inter-view? This situation mirrors children–parent relationships. Children do not learn what their parents tell them, but what they are prepared and ready to hear. The same holds for in-depth interviewers: researchers do not necessarily ‘hear’ what their informants tell them, but only what their own intellectual, social, cultural and ethical development has prepared them to hear.
Going deep into the minds of consumers is a learning process. Researchers make mis-takes; they sometimes say the wrong things or upset participants in some way. They learn that their race, age, gender, social class, appearance or voice makes one kind of difference with some participants and another kind of difference with other informants.7 The lesson from this is that there is no ‘ideal’ means to conduct the in-depth interview. Researchers learn from their experiences, discovering strengths and playing to them, realising weak-nesses and understanding how to compensate for them. In this spirit of experimentation and learning we present a procedure that encapsulates how a researcher may approach the in-depth interview.
Procedure
To illustrate the technique, a scenario is set whereby the researcher is interviewing the mar-keting director of a soap brand that has successfully sponsored a major athletics event. The sponsorship has resulted in many industry awards, increased sales and better employee–employer relations. The researcher wishes to understand why the soap manufacturer became involved in the sponsorship and how it achieved such success.
The in-depth interview with this busy executive may take from 30 minutes to well over an hour. It may occur on a one-off basis or it may unfold over a number of meetings as more understanding is developed. Once the interviewer has gained access to the mar-keting director (which can be very problematic; why should they give up valuable time and share commercial knowledge?), the interviewer should begin by explaining the pur-pose of the interview, showing what both will get out of taking part in the interview and

211Chapter 8 Qualitative research: in-depth interviewing and projective techniques
explaining what the process will be like. Beyond the introduction, the interviewer may ask the marketing director a general introductory question such as ‘what impacts have the industry awards had upon your business?’. The interviewer would be expected to have done their homework to know what the awards were, what they were awarded for and who the brand was competing against. This is a very positive feature of the sponsor-ship experience, and it would be hoped to boost the ego of the marketing director and encourage them to talk freely about the different impacts of the awards. The impact of sponsorship could be upon existing and potential new customers, employees and suppli-ers. The discussion could then flow into any of these areas. After asking the initial ques-tion, the interviewer uses an unstructured format, guided by a topic guide as a reminder of important subject areas to cover. The subsequent direction of the interview is deter-mined by the participant’s initial reply, the interviewer’s probes for elaboration and the participant’s answers.
As with the focus group topic guide and the moderator managing that guide, spontaneity ensures that the process is creative and meaningful to the participant. Suppose that the par-ticipant replies to the initial question by saying:
The award for the ‘best use of sponsorship’ in the launch of a new product gave us the most satisfaction. It has made us review how we execute all of our new-product launches and integrate our different marketing agencies, our employees and supply chains.
The interviewer might then pose a question such as ‘was it the award that initiated the review or would you have done that anyway?’. If the answer is not very revealing, e.g. ‘we may have’, the interviewer may ask a probing question, such as ‘what did the award tell you about how you worked as a team?’. This question could open up a whole series of issues such as ‘trust’, ‘relationship development’ or ‘technical support’, to name a few. Such an exchange of questions and answers could emerge from a heading of ‘Integrating sponsor-ship with other marketing communications’ on the topic guide. The interviewer will keep an eye on the topic guide to ensure that all the important issues are tackled, but the specific wording of the questions and the order in which they are asked is influenced by the partici-pant’s replies.
Probing is of critical importance in obtaining meaningful responses and uncovering hid-den issues. Probing can be done by asking general questions such as ‘why do you say that?’, ‘that’s interesting, can you tell me more?’ or ‘would you like to add anything else?’.8 Probing can search for general issues but also be more specific, an example in the above scenario being ‘what does good teamwork mean to you?’. One of the main success factors of specific probing is that the researcher understands something about the nature of the subject being researched. This means the researcher appreciates the significance of particu-lar revelations, understands the language (even technical language and jargon in certain areas, like the soap industry) and has credibility with the participant, which encourages them to open up to the interviewer.
The interviewer must be alert to the issues to go through, but also the issues that the par-ticipant is willing to talk about, and must listen carefully to and observe which issues fire enthusiasm in the participant. The questions and probes the interviewer puts to participants should follow the interest and logic of the participants, making them feel motivated to respond in a manner that suits them. As with a focus group discussion, the participants should feel comfortable and relaxed, which could mean holding the interview in their office, their home, a bar or a sports club. There have even been experiments using a ‘research taxi’, in which participants are taken to their destination while they participate in an interview conducted by the researcher–driver, and shadowings (observations and interviews) with subway passengers during their home–work commute.9 In these examples any context in which participants feel at ease can result in a willingness to be more reflective, honest and open. Answering in a manner that suits the participant helps to make the interview more

212 Marketing Research
comfortable and relaxed. For a great amount of business research, the in-depth interview is the best way to gain access and to talk to managers. Much of the interviewing takes place in their office at a time that is convenient to them. Researchers can also observe characteristics of the manager in their office environment that can be of help in their analyses. Examples of this could be levels of formality in the workplace, reports and books that the manager has for reference, the manager’s use of technology, or the tidiness of the workplace. In the example above, where a manager has received a sponsorship award, it could be how that and other awards are displayed, photographs from advertisements or displays of new products. These observations would be entirely based upon the purpose of the study, but the context of the office can be of help to the manager and the researcher. In order to make the above process work, the interviewer should:
1 Do their utmost to develop an empathy with the participant.
2 Make sure the participant is relaxed and comfortable.
3 Be personable, to encourage and motivate participants.
4 Note issues that interest the participant and develop questions around these issues.
5 Not be happy to accept brief ‘yes’ or ‘no’ answers.
6 Note where participants have not explained clearly enough issues that need probing.
In marketing research that focuses upon managers or professionals, as illustrated above, the context of the in-depth interview helps to set the frame of mind of the participant. The context should also help the participant and interviewer to relax, engendering an atmosphere to explore and develop issues that they feel to be relevant. The following arguments help to focus on the issues faced by the interviewer coping with managers and professionals, trying to find the right context to allow these participants to express how they really feel.10 The in-depth interview helps to overcome:
1 Hectic schedules. The best participants tend also to be the busiest and most successful people. They can make time for an interview, but are rarely able to spare the much greater time needed for them to come to a group discussion at some location away from their office. So groups exclude the best participants.
2 Heterogeneity. Whereas mothers evaluating nappy advertisements, or beer drinkers the latest lager, have only their personal preferences to consider, it is very different for exec-utives evaluating copiers, airline advertisements or computer software. This is because their reactions are complicated by the type of job they do and who they work for. The group discussion is dependent on the group’s composition being fairly homogeneous; the job backgrounds of business people make them too varied to be entirely comfortable in a group.
3 Live context. A lot of information comes from seeing the participant at their desk, which is missed in a group discussion. Work schedules pinned to the wall, the working atmos-phere, artefacts placed on the desk, family photographs, the way coffee is served – all help to fill out the picture.
4 Interviewer reflection. Groups do not allow the researcher enough thinking time. Two groups, each taking an hour and a half over successive evenings, do not even begin to compare with two or three full days of non-stop interviewing. Individual interviews give much more scope for experimentation. If one way does not work it is only one participant, not a whole group, that is affected.
The following example illustrates the types of professionals or experts that may be targeted to participate in individual in-depth interviews.

213Chapter 8 Qualitative research: in-depth interviewing and projective techniques
Another major application of in-depth interviews, where the context of the interview plays a major part, is in the interviewing of children.12 Researchers into children and teenag-ers spend considerable time working out the best research approach. Debates proliferate on the most appropriate research designs and interviewing techniques: in-depth interviews ver-sus group, mini groups versus standard groups, friendship pairs versus stranger groups, asso-ciation projective techniques versus expressive ones, and of digital media-based techniques.13 These debates make researchers focus on the implications of how research is conducted and which technique provides the best results. One vital element is often overlooked, and that is the issue of context: in other words, the need to ensure that the situation in which children are interviewed is relevant to the research needs.
Like adults, children have multi-faceted personalities. The same teenager can be sullen at home, obstructive in the classroom, but the life and soul of the peer group. The essential dif-ference between children and adults, however, is the extent to which different aspects of the persona can be accessed on one occasion and in one situation, the research setting. Adults have insight into the different roles and behaviour, which they adopt in different contexts, and can project other aspects of themselves, which they bring into the research situation. Children and young teenagers, on the other hand, react to the moment and thus project only one aspect of themselves. They lack the maturity, experience and self-knowledge to draw on other parts of themselves and therefore find it almost impossible to know, let alone admit or explore, how they might behave in another circumstance.14
The above evaluation of the importance of context also shows that question formulation, the very heart of marketing research, can be more important in interviewing children than when dealing with adults. A straightforward ‘what do you think about X?’ may throw chil-dren into confusion. A formulation such as ‘if you were to call your friends about this, what would you tell them?’ would be more likely to produce illuminating responses. An innova-tive approach to interviewing children is illustrated in the following example.
Real research Connecting with experts11
Unilever’s Axe men’s range of toiletries was inspired by an unconventional approach to consumer research. The research approach started with in-depth interviews with a group of individuals identified as experts in ‘understanding men’ and what drives them. The experts included a professor of evolutionary psychology, sex psychologists, adult film directors, a ‘burlesque’ dancer, a game developer and a senior writer on Loaded magazine. They were all interviewed in their own working environments, either by Uni-lever’s Consumer Insight Manager or using researchers from the international qualita-tive and youth research company Firefish (www.firefish.ltd.uk).
Real research Quantifying the emotional aspects of advertising15
In order to understand how to ‘talk’ to children we need to find ways to connect to them, and hence explore what it is like to be a 10 year old. The way Optimisa (www.optimisa-research.com) goes about researching children taps into the very areas where they are not adults. It is about how we as adults adapt to who they are, finding a way to engage with every child and building a bridge to help us reach their world. A good starting point is often an awareness of the skills they have developed in school, using these as the building blocks for the technique. So, rather than asking a child a direct question, which more often than not will result in a long blank look, we can ask children to draw a picture, or select a photograph, or even write a story that simply relates to the question we are

214 Marketing Research
An effective technique when working with children is the use of friendship pairs – interviewing two friends or classmates together. This helps to cut out lying because children are not alone with strangers and because, if one tells a lie, the other ‘tells’ on that one. The ingrained honesty of children arguably makes them easier to research than adults, who of course are far more accomplished exponents of deception.
Advantages and challenges of in-depth interviews
In-depth interviews have the following advantages. They can:
• Uncover a greater depth of insights than focus groups. This can happen through concen-trating and developing an issue with the individual. In the group scenario, interesting and knowledgeable individuals cannot be solely concentrated upon.
• Attribute the responses directly to the participant, unlike focus groups where it is often difficult to determine which participant made a particular response.
• Result in a free exchange of information that may not be possible in focus groups because, alone, there is no social pressure to conform to group response. This makes in-depth inter-views ideally suited to sensitive issues, especially commercially sensitive issues.
• Be easier to arrange than the focus group as there are not so many individuals to coordi-nate and the interviewer can travel to the participant.
The following are not necessarily disadvantages, but rather the challenges that researchers face when using this valuable technique:
• The lack of structure makes the results susceptible to the interviewer’s influence, and the quality and completeness of the results depend heavily on the interviewer’s skills. As with all qualitative techniques, the interviewer needs to develop an awareness of the factors that make them ‘see’ in a particular way.
• The length of the interview, combined with high costs, means that the number of in-depth interviews in a project tends to be few. If few in-depth interviews can be managed, the researcher should focus upon the quality of the whole research experience. ‘Quality’ in this context means the qualities that the participant possesses in terms of richness of expe-rience and how relevant the experiences are to the study; the quality of drawing out and getting participants to express themselves clearly and honestly; and the quality of analysis in terms of interpretation of individual participants and individual issues evaluated across all the interviews conducted.
• The data obtained can be difficult to analyse and interpret. Many responses may not be taken at face value; there can be many hidden messages and interpretations in how par-ticipants express themselves. The researcher needs a strong theoretical awareness to make sense of the data, or the technical means to develop theory if using a grounded theory approach. As well as the transcripts of the interview, additional observations add to the richness and multi-faceted analyses and potential interpretations.
The use of the laddering technique in the next example illustrates how a theoretical aware-ness can help to develop structure, elicit or draw more out of participants and help to make
Friendship pairA technique used to interview children as two friends or classmates together.
trying to ask. Children react well to this approach and find the prop easy to talk around, often giving the researchers more than they hoped for.
On a project for Cartoon Network, a child depicted in a picture one of the pressures of the fierce consumer society we live in. The picture was about exclusion and showed a group of boys; outside the group, another boy was crying. On closer inspection it was not the fact that boy was crying that told the story, but why he was doing so. A Nike tick was distinctly missing from his trainers.

215Chapter 8 Qualitative research: in-depth interviewing and projective techniques
sense of the data they generate. It is an illustration of how the three challenges outlined above can be overcome. Balance what may be seen as the advantages and disadvantages of in-depth interviews in evaluating this example. Implementing the following discussion guide would be challenging, but would also generate many unique consumer insights. It illustrates that the in-depth interview is not a fixed and formulaic approach. This builds upon the Christian Dior example at the start of this chapter. The use of ‘laddering techniques’ will be further explained and illustrated in the next section.
Real research Christian Dior in-depth interview discussion guide16
The in-depth interview approach developed by Christian Dior and the research company Repères broadly followed these stages, allied to a laddering technique:
1 Gather initial sensations and emotions that come up instantly after a first sniff:a Evocations and imagery were explored:
(i) Association, imaginary place/scene, Chinese portrait, a photofit of the fragrance.
2 Gather new sensations a few minutes after the first sniff, once the fragrance had developed, and then re-evaluate the different sensations mentioned to obtain:a A detailed description of each sensation (e.g. if sensation of warmth, is it warmth
from a chimney fire, from the noon sun, from a duvet, human warmth) and where it operates (on the body, on the mood, on the nerves, on the mind/state of mind).
b The source of this sensation: what note, what scent (if concrete description pos-sible) or what ‘sort’ of odour (if analogous description) produced this sensation.
3 Analyse the olfactory journey or construction of the fragrance, its mechanism (it goes from what sensation/effect to what sensation?).
4 Identify the resulting personality of the fragrance: descriptors, values, objectives/ mission/role of the juice, image, distinctive specificity.a The projected target: what is the likely female (male) profile for the fragrance?
5 Image assessment using visual stimuli (varied photos from the picture library: differ-ent colours, shapes, materials, places, characters, scenes from life) to expose hidden or unconscious perceptions:a First, ask for a justified choice of six photos, each one representative of a perceived
aspect or dimension of the fragrance.b Then force associations as the moderator selects six photos at random and not
chosen at the beginning by the participant, asking what matches/does not match the fragrance under scrutiny.
6 Then close up with a critical assessment of the potential and risks/limitations of the fragrance.
The laddering technique
The in-depth interview can be driven by a topic guide, made up of just a few topics covering a very broad range of issues. From these few topics, the nature of questions, the order of questions and the nature of probes can be driven by the interviewer’s perception of what will

216 Marketing Research
draw the best out of participants. Alternatively, an in-depth interview can be semi-structured, where parts of the interview use consistent and highly structured questions, with set response categories, interspersed with open-ended questions involving probes that again suit the nature of the participant. There are other variations on the technique that can help the inter-viewer and participant to apply useful structure to issues that can be very ‘messy’ and unstructured. One of the most popular techniques to apply structure is called laddering. Lad-dering requires interviewers to be trained in specific probing techniques in order to develop a meaningful ‘mental map’ of the consumer’s view towards a particular product. The ulti-mate goal is to combine mental maps of consumers who are similar, which lead to the rea-sons why consumers purchase particular products.
The laddering technique is made up of a linking, or ladder, of elements that represent the link between products and the consumer’s perception process. It enables an understand-ing of how consumers translate product attributes, through personal meanings associated with them.17 Theories of consumer behaviour act as a foundation to this approach, based on the contention that consumption acts produce consequences for the consumer. Consum-ers learn to associate these consequences with specific product attributes. These associa-tions are reinforced through consumers’ buying behaviour and, as a result, they learn to choose products that have certain attributes in order to obtain the consequences they desire. There are two features of this theory that the researcher using the laddering technique will focus upon:
1 Motivation. The laddering technique focuses upon generating insight into the motives behind the consumption of certain products. It represents a more contemporary approach to classical motivation research.18 The technique aims to stimulate participants to reflect upon their buying behaviour in a way unconnected from their usual behaviour.
2 Cognitive structure. This feature is also a development of theory, in this case means–end–chain (MEC), developed by Gutman.19 MEC starts from a point of consumer motivation. It contends that motivation leading towards a form of behaviour is derived from the con-nection between tangible product attributes and more abstract cognitive structures that involve the physical and emotional consequences derived from these attributes. At a more abstract level, the consequences lead to values held by the consumer.
The laddering technique is therefore designed to identify and follow the chain of
attributes S consequences S values (A−C−V)
The in-depth interview using the laddering technique is based on comparisons of the con-sumer’s choice alternatives. These can include, for example, different products used for the same purpose, such as an electric toothbrush and a conventional toothbrush, and/or varieties in a product line such as full-fat and skimmed milk, and/or product brands such as Heineken and Amstel beer, and/or kinds of packaging such as wine in bottles and in cartons. Other ele-ments that can affect consumer choices can be added to the above list. In making the com-parisons, the interviewer poses a question that hopes to encourage the participants to put aside their established rationale and reflect upon their consumption behaviour, in ways that they would not normally do. In other words, questions are posed that make participants think about consumption from other points of view to try to release participants from fixed atti-tudes, perceptions and values. The interviewer’s role is to build up a rapport with partici-pants and get them to relax and feel comfortable to respond with whatever comes to mind. The interview revolves around three basic questions based on the A–C–V chain. The ques-tions posed would be:
1 Attributes. What is different about these alternatives? (e.g. low calories)
2 Consequences. What does this difference mean? (e.g. not fattening)
3 Values. How important is this for you? (e.g. health)
LadderingA technique for conducting in-depth interviews in which a line of questioning proceeds from product characteristics to user characteristics.

217Chapter 8 Qualitative research: in-depth interviewing and projective techniques
From the attribute of ‘low calories’ in comparing different product varieties in a product line such as full-fat and skimmed milk, a further and negative consequence of ‘watery taste’ could be elicited, followed by the values of ‘unnatural’. The interviewer aims to build spon-taneously a great repertoire of chains through these levels, choosing the right comparisons to draw out the next link in the chain. The resulting responses are analysed to establish possible categories of attributes, consequences and values. The categories are then organised accord-ing to the qualitative comments made between the relationship of an attribute, its conse-quence and value. The result is an association matrix that graphically displays the categories and the connections that have emerged.
Laddering requires an interviewer with experience of in-depth interviewing, with a reali-sation of what will relax participants and get them in a frame of mind to ‘play’ with the associations sought. The interviewer needs to appreciate the theoretical foundations of the technique,20 not only to help determine what should be elicited from participants, but also to help generate sound and meaningful analyses. Laddering sets out to unravel ‘how consumers translate product attributes, through personal meanings associated with them’ to provide a motivational and cognitive structure to purchase decisions in a given market. In essence, the technique looks at a brand in terms of the attributes that make it different from other brands, the consequences of this for the individual (what does the difference mean?) and the value the difference has (how important is it?).21 The following example illustrates the consumer insights and marketing implications that emerged through the use of laddering.
Real research AUTO BILD – understanding the connected barometer22
The AUTO BILD market barometer is an annual study carried out by Europe’s biggest car magazine. A recent study explored the concept of connectivity.
A mixed-methods approach was used involving a quantitative survey with 1,403 driv-ers, two separate online communities involving 60 participants and face-to-face inter-views with selected members of the online community. A laddering technique was applied to further analyse the research participant views that were expressed in the community.
The key laddering insights among younger consumer groups included:
• Smartphones are replacing cars as an object of identification.
• Consumers are developing a new unemotional relationship to cars; they are becom-ing more similar to consumables.
• Digital lifestyles are an emotional driving force. The physical presence of ‘being there’ that a car enables has become less important.
The insights generated helped to identify and build a better understanding of the ways in which consumers understand cars.
The repertory grid technique
Another widely used technique that applies structure to qualitative in-depth interviewing is the repertory grid technique (RGT). This technique was originally developed by George Kelly in 195523 to explore the meanings that people attach to the world around them, which they find particularly hard to articulate. As with the laddering technique, there is a theoretical underpinning – a personal construct psychology.24 The repertory grid technique is rooted in a grounded theory perspective. The categories used in the findings emerge from the data rather than being introduced by the researchers. It is a technique that grounds the data in the

218 Marketing Research
culture of the participants, if they choose both the elements and the constructs, and it is clearly useful where there is a need to explore the personal worlds of participants. The reper-tory grid has gained status in management research because of its distinctive strengths. It helps researchers to explore the unarticulated concepts and constructs that underlie people’s responses to the world. Moreover, it is a technique that may reduce the problem of inter-viewer bias in in-depth interviews. A particular strength of the repertory grid technique is that it can help to access the underlying realities in situations where the cultural or people issues are particularly strong, and where participants might otherwise feel constrained to try to answer in the way they think they should, as opposed to how they really think.25 There are a number of variations of the technique, and arguments about whether it should be imple-mented and analysed in a positivist or interpretivist manner,26 but in essence the stages involved in the repertory grid technique are:27
1 Element selection
2 Construct elicitation
3 Element comparisons
4 Data analysis.
1 Element selection. The elements selected will depend upon the nature of consumer behaviour that the interviewer wishes to examine. In a study that wished to understand broad-based patterns of consumer behaviour28 the elements chosen included 30 generic products and services such as newspapers, holidays, chocolate bars, eggs, alcoholic drinks, shoes, toothpaste, savings accounts, restaurant meals and shampoo. In another study that wished to understand the process of effective new product development29 the elements chosen included 30 successful new products and services, such as Slim Fast, Pull Ups, Loed Tea, Ultraglide, Baby Jogger, Gourmet Coffee, Zantac, Paragliders, MTV and Carmen Soft. These elements should be chosen by the participants, not just chosen and presented by the interviewer. There should be some homogeneity in the elements in the sense that the participant sees the elements relating to and being representative of the behaviour being studied.
2 Construct elicitation. Having selected elements that the participant believes to encapsu-late the behaviour being studied, the interviewer now seeks to understand what connects them together. The first stage of this involves the interviewer selecting three of the chosen elements at random and then presenting to the participant small cards with a summary of these elements. The participant is then asked to describe how they see two of the three to be alike and how the third may be different. The researcher selects different ‘triads’, to the point where all the elements have been contrasted or the participant cannot describe fur-ther ‘similarities’ or ‘differences’. Construct elicitation therefore draws out the partici-pant’s perspective of the important features that encapsulate a particular form of consumer behaviour.
3 Element comparisons. The constructs elicited from participants are now turned into bipo-lar descriptions in a manner similar to the semantic differential scale described and illus-trated in Chapter 12. For example, suppose that in a study of the process of effective new product development, three elements were compared: MTV, Gourmet Coffee and Para-gliders. The participant may say that MTV and Gourmet Coffee are alike in that there are many similar competitive products that they can be compared with, whereas Paragliders is different in that there are few competitive ‘personal’ means to fly long distances. Whether this is factually correct or whether the interviewer agrees with this is immaterial; it is how the participant sees it that is important. Such a belief could be turned into a bipo-lar scale, as illustrated below:

219Chapter 8 Qualitative research: in-depth interviewing and projective techniques
Lots of competitive products
No other products likethis in the market
4321 5 6 7
Other scales would be constructed to cover the ways that participants compared the cho-sen elements, i.e. the constructs elicited would be turned into a series of bipolar scales. Participants would then be expected to evaluate all the original elements using these scales. If they felt that Gourmet Coffee has many competitors, they could tick a line at the (6) or (7) point. So, if there were 30 elements that encapsulate the behaviour under study and 20 constructs elicited to evaluate these elements, a total of 30 * 20, or 600, ratings would need to be performed.
4 Data analysis. A grid can be assembled for each participant to represent, in the above example, the 30 * 20 ratings. Again, an illustration of this comes from a small extract of the process of effective new product development study. The following represents an extract of the total response from one participant:
Construct MTV Gourmet Coffee Paragliders
Market newness 6 6 2Company newness 3 7 1Technology newness 2 4 6
With a number of these completed grids, factor analysis (Chapter 24) can be performed to discover the important underlying factors or dimensions that encapsulate a particular form of behaviour.30 The analysis can continue by performing cluster analysis (Chapter 25) to explore patterns of similarity or dissimilarity in different types of participant, i.e. to dis-cover and describe groups of participants who may view particular forms of behaviour in similar ways.
The above process can take a great deal of time to select the elements, to elicit the means to compare the elements and to evaluate them. It requires an amount of rapport between the interviewer and the participant and patience in working through the stages. All of the stages may not be completed in one interview. It may require the interviewer to return to the par-ticipant to develop the next stage, especially in transferring the elicited elements to bipolar descriptions to allow all the elements to be evaluated.
The Zaltman metaphor elicitation technique
Another technique that creates a ‘mental map’ of the consumer’s view towards a particular product is the Zaltman metaphor elicitation technique (ZMET). It is a qualitative in-depth technique that is used by companies such as Procter & Gamble, AT&T, Kodak, Ford and General Motors. It was developed at the Harvard Business School by Professor Jerry Zaltman and is patented in the USA. In a ZMET study, before coming in for an in-depth interview, participants are asked to gather pictures that reflect their thoughts and feelings about an advertisement and brand.31 The technique uses images and metaphors to reveal how con-sumers think and feel about brands, issues or other research topics. It does not ask consumers ‘what they think about the things researchers think about’. Instead, it lets participants’ own frames of reference shape the in-depth interview, without losing sight of the research aims. The technique, its application and the power of visual metaphors are illustrated in the follow-ing examples.

220 Marketing Research
Real research Diving for pearls32
ZMET allows the participant to define the frame of reference for an interview. The use of metaphor is extremely effective in reveal-ing submerged thoughts and feelings, and specifically in allowing access to the emo-tional domain. Participants are given a ques-tion a few days before their actual interview, and asked to source (non-literal) images reflecting their feelings. For example, in a study of looking at how people choose which financial products to buy and which sup-pliers to use, one participant brought in a picture of two dogs, a fully grown Saint Bernard towering over a tiny Chihuahua, to express his feeling of being intimidated by large companies. This period of reflection brings tacit knowledge to the surface. At an in-depth interview, participants explain the significance of each image and how it relates to the question. Probing for clarification, cause and consequence reveals the meaning behind each idea and the connections between ideas. The results reveal the consumers’ mindset: the issues most salient to them and the thoughts and feelings they attach to each issue. The result is a consensus map of ‘the mind of the market’. Although product performance remains central to this map, the process also allows highly emotional out-comes, such as confidence, joy, fear and alienation, to emerge.
Real research Using metaphor33
Metaphors seem to express emotions more vividly than literal language because they evoke an emotional response directly. Memories that have emotional significance seem to have the greatest resonance; metaphors that link directly to emotions are the most powerful. The scales we use to measure consumer views of brands and brand communi-cations are language based and literal, not visual or metaphorical. Participants need to consider their response before answering, but by consideration they get further away from emotions. The emotion may still be present but it becomes blended with thinking and is more prone to post-rationalisation. The Conquest Metaphorix (www. metaphorixuk.com) approach incorporates visual metaphorical scales based on primary metaphors linked with emotional states, such as love, affection and intimacy, which have particular relevance to brand engagement. These online scales use a range of engaging visual devices to represent metaphors associated with different emotional states, using visual depictions of (for example) proximity/closeness and warmth.
ZMET aims to understand the images and associations that underpin both spoken and tacit thoughts and feelings through the elicitation of both rational and emotional thinking. The process especially allows the emotional aspects of products and their use to become apparent. The resultant analysis creates a graphical visualisation of the ‘mind of the market’. This visualisation creates a link between consumer perceptions and those involved in crea-tive activities of product design and marketing communications. Such an approach accelerates

221Chapter 8 Qualitative research: in-depth interviewing and projective techniques
the creative process and helps design and advertising agencies to add more emotional value to their work.
Applications of in-depth interviews
Applying in-depth interviews, with high or low levels of structure, with a strong theoretical foundation such as laddering, the repertory grid technique or ZMET, or with the desire to gen-erate grounded theory, presents challenges but also many rewards. There are many marketing decisions that can be made with support from researchers using the broad array of techniques under the heading of ‘in-depth interviews’. The following summarises the applications:34
1 Interviews with professional people (e.g. finance directors using banking services).
2 Interviews with children (e.g. attitudes towards a theme park).
3 Interviews with elite individuals (e.g. wealthy individuals involved in large philan-thropic ventures).
4 Detailed probing of the participant (e.g. new-product development for cars).
5 Discussion of confidential, sensitive or embarrassing topics (e.g. personal hygiene issues).
6 Situations where strong social norms exist and where the participant may be easily swayed by group response (e.g. attitudes of university students towards sports).
7 Detailed understanding of habitual or tacit behaviour (e.g. the ‘rituals’ an individual may go through when preparing to get ready for an evening out).
8 Detailed understanding of complicated behaviour (e.g. the purchase of fashion or ‘high-status’ goods).
9 Interviews with competitors who are unlikely to reveal the information in a group setting (e.g. travel agents’ perceptions of airline travel packages).
10 Situations where the product consumption experience is sensory in nature, affecting mood states and emotions (e.g. perfumes, bath soap).
In the application of in-depth interviews, the researcher can use other techniques to help maintain the interest of participants, to make the experience more enjoyable for the partici-pants and the researcher alike and ultimately to draw out the true feelings of participants. A set of techniques that help to achieve all this, and that have been applied with great success over many years, is the body of indirect techniques called ‘projective techniques’.
Projective techniques
Projective techniques are a category of exercises designed to provoke imagination and creativity that can be used in in-depth interviews. Projective techniques are subject-ori-ented, non-verbal and indirect self-reporting techniques that have the ability to capture responses from participants in a less structured and more imaginative way than direct ques-tioning. They get beyond the rational replies participants often make in interview situations, encouraging them to project their underlying motivations, beliefs, attitudes or feelings regarding the issues of concern.35 They are useful techniques for drawing out emotional values, exploring issues in a non-linear manner or for bypassing participants’ rational con-trols. They also help participants to verbalise unframed, subconscious, low-salience or low-involvement attitudes.36 Viewed as ‘face-saving’ techniques, projection provides
Projective techniqueAn unstructured and indirect form of questioning that encourages participants to project their underlying motivations, beliefs, attitudes or feelings regarding the issues of concern.

222 Marketing Research
participants with the facility to project their thoughts and feelings onto another person or object (e.g. via completion tests). Fundamentally, projective techniques can enable research participants to express feelings and thoughts they would otherwise find difficult to articu-late.37 In projective techniques, participants are asked to interpret the behaviour of others rather than to describe their own behaviour. In interpreting the behaviour of others, it is contended that participants indirectly project their own motivations, beliefs, attitudes or feelings onto the situation. Thus, the participants’ attitudes are uncovered by analysing their responses to scenarios that are deliberately unstructured, vague and ambiguous. The more ambiguous the situation, the more participants project their emotions, needs, motives, atti-tudes and values, as demonstrated by work in clinical psychology (on which projective techniques are based).38
The following example illustrates a use of projective techniques as part of the process of pre-testing advertisements.
Real research Pre-testing mould-breaking advertisements39
In an environment where consumers value originality, communications that really ‘break the mould’ offer advertisers rewards in terms of increased relevance. In a study for Sony, TNS (www.tnsglobal.com) felt that qualitative projective questioning techniques could be used alongside quantitative pre-testing tech-niques on mould-breaking advertisements. TNS felt that projective techniques could help participants reveal how mould-breaking advertisements work at a deeper, emotional level. Its NeedScope™ technique used photo-sets representing different personality types. The Sony Bravia Television (www.sony.co.uk/electronics/bravia) ‘Paint’ commercial was chosen to apply the technique. The exploding ‘paint-fest’, set on a Glasgow council estate, was an unexpected way to advertise a new TV. There were no lists of features, no voice-over describing the benefits, no happy family sitting around their new TV and not even a glamorous tropical location. Sony’s website stated:
When you’re introducing the next generation of television, you want to make an impact – but that doesn’t mean you have to be predictable. To announce the arrival of the new Bravia LCD and SXRD range, we want to get across a simple message – that the colour you will see on these screens will be like no other.
For a clear majority of participants, the brand represented a carefree, lively, bold per-sonality. In terms of brand image, the strongest attributes were ‘vibrant colour’, ‘lively’, ‘outgoing’, ‘dynamic’ and ‘cool/trendy’ – very much where the Sony Bravia communica-tion strategy wanted to be. The results from projective questioning were examined holistically with the results from other questions on likeability, recall and branding. Given the recognised importance of emotions in brand communications and engage-ment, projective techniques have a lot to offer in pre-testing advertisements.

223Chapter 8 Qualitative research: in-depth interviewing and projective techniques
As in psychology, these projective techniques are classified as association, completion, construction and expressive. Each of these classifications is discussed below.40
Association techniques
In association techniques, an individual is presented with a stimulus and asked to respond with the first thing that comes to mind. Word association is the best known of these techniques. In word association, participants are presented with a list of words, one at a time, and encouraged to respond without deliberation to each with the first word that comes to mind. The words of interest, called test words, are interspersed throughout the list, which also contains some neutral, or filler, words to disguise the purpose of the study. The participant’s response to each word is recorded verbatim and responses are timed so that participants who hesitate or reason out (defined as taking longer than three seconds to reply) can be identified. The interviewer, not the participant, records the responses.
The underlying assumption of this technique is that association allows participants to reveal their inner feelings about the topic of interest. Responses are analysed by calculating:
1 The frequency with which any word is given as a response.
2 The amount of time that elapses before a response is given.
3 The number of participants who do not respond at all to a test word within a reasonable period.
Those who do not respond at all are judged to have an emotional involvement so high that it blocks a response. It is often possible to classify the associations as favourable, unfavourable or neutral. An individual’s pattern of responses and the details of the response are used to determine the person’s underlying attitudes or feelings on the topic of interest, as shown in the following example.
Association techniqueA type of projective technique in which participants are presented with a stimulus and are asked to respond with the first thing that comes to mind.
Word associationA projective technique in which participants are presented with a list of words, one at a time. After each word, they are asked to give the first word that comes to mind.
Real research Dealing with dirt41
Word association was used to study womens’ attitudes towards detergents. Below is a list of stimulus words used and the responses of two women of similar age and house-hold status. The sets of responses are quite different, suggesting that the women differ in personality and in their attitudes towards housekeeping. Ms M’s associations suggest that she is resigned to dirt. She sees dirt as inevitable and does not do much about it. She does not do hard cleaning, nor does she get much pleasure from her family. Ms C sees dirt too, but is energetic, factual-minded and less emotional. She is actively ready to combat dirt, and she uses soap and water as her weapons.
Stimulus Ms M Ms C
Washday Everyday IroningFresh And sweet CleanPure Air SoiledScrub Does not; husband does CleanFilth This neighbourhood DirtBubbles Bath Soap and waterFamily Squabbles ChildrenTowels Dirty Wash

224 Marketing Research
There are several variations to the standard word association procedure illustrated here. Participants may be asked to give the first two, three or four words that come to mind rather than only the first word. This technique can also be used in controlled tests, as con-trasted with free association. In controlled tests, participants might be asked ‘what Formula One teams come to mind first when I mention “boring”?. More detailed information can be obtained from completion techniques, which are a natural extension association techniques.
Completion techniques
In completion techniques, participants are asked to complete an incomplete stimulus situa-tion. Common completion techniques in marketing research are sentence completion and story completion.42
Sentence completion is similar to word association. Participants are given incomplete sentences and are asked to complete them. Generally, they are asked to use the first word or phrase that comes to mind, as illustrated in the Formula 1 example below.
This example illustrates one advantage of sentence completion over word association: participants can be provided with a more directed stimulus. Sentence completion may pro-vide more information about the subjects’ feelings than word association. Sentence comple-tion is not as disguised as word association, however, and many participants may be able to guess the purpose of the study. A variation of sentence completion is paragraph completion, in which the participant completes a paragraph beginning with the stimulus phrase. A further expanded version of sentence completion and paragraph completion is story completion.
In story completion, participants are given part of a story – enough to direct attention to a particular topic but not to hint at the ending. They are required to give the conclusion in their own words; for example, a sentence-completion example in the case of Formula 1 mot-orsport might look like the following:
Completion techniqueA projective technique that requires participants to complete an incomplete stimulus situation.
Sentence completionA projective technique in which participants are presented with a number of incomplete sentences and are asked to complete them.
Story completionA projective technique in which participants are provided with part of a story and are required to give the conclusion in their own words.
These findings suggest that the market for detergents could be segmented based on attitudes. Firms (such as Procter & Gamble) that market several different brands of wash-ing powders and detergents could benefit from positioning different brands for different attitudinal segments.
Sentence completion
A Formula One fan that supports a team rather than a driver is ________________
__________________________________________________________________
A sponsor who selects drivers based on how competitive they are is ____________
__________________________________________________________________
The Ferrari team is most preferred by ____________________________________
__________________________________________________________________
When I think of watching Formula One on television, I ______________________
Construction techniques
Construction techniques are closely related to completion techniques. Construction tech-niques require the participants to construct a response in the form of a story, dialogue or description. In a construction technique, the researcher provides less initial structure for the
Construction techniqueA projective technique in which participants are required to construct a response in the form of a story, dialogue or description.

225Chapter 8 Qualitative research: in-depth interviewing and projective techniques
participants than in a completion technique. The two main construction techniques are pic-ture response techniques and cartoon tests.
The roots of picture response techniques can be traced to the thematic apperception test (TAT), which consists of a series of pictures of ordinary as well as unusual events. In some of these pictures the persons or objects are clearly depicted, while in others they are rela-tively vague. The participant is asked to tell stories about these pictures. The participant’s interpretation of the pictures gives indications of that individual’s personality. For example, an individual may be characterised as impulsive, creative, unimaginative and so on. The term ‘thematic apperception test’ is used because themes are elicited based on the subject’s per-ceptual interpretation (apperception) of pictures.
In cartoon tests, cartoon characters are shown in a specific situation related to the prob-lem. Participants are asked to indicate what one cartoon character might say in response to the comments of another character. The responses indicate the participants’ feelings, beliefs and attitudes towards the situation. Cartoon tests are simpler to administer and analyse than picture response techniques.
Expressive techniques
In expressive techniques, participants are presented with a verbal or visual situation and asked to relate the feelings and attitudes of other people to the situation. The participants express not their own feelings or attitudes, but those of others. The main expressive tech-niques are role playing, the third-person technique and personification.
In role playing, participants are asked to play the role or to assume the behaviour of someone else. Participants are asked to speak as though they were someone else, such as another household member with whom they would share a decision or an authority figure. For example, ‘Bernard, you are a 15-year-old boy; Eva, you play Bernard’s mother; George, you play Bernard’s father. Imagine you are at home deciding which summer holiday you would like this year as a family.’ The discussion that emerges is likely to reveal unspoken objections as well as those of overcoming resistance to features of the holiday, locations and ways of travelling there that may be favoured by Bernard but not his parents, or even his mother and not by the two males. The researcher assumes that the participants will project their own feelings into the role.43
In the third-person technique, participants are presented with a verbal or visual situation and are asked to relate the beliefs and attitudes of a third person, rather than directly express-ing personal beliefs and attitudes. This third person may be a friend, a neighbour, a col-league, or any person that the researcher chooses. Again, the researcher assumes that the participants will reveal personal beliefs and attitudes while describing the reactions of a third party. Asking an individual to respond in the third person reduces the social pressure to give an acceptable answer.
In the personification technique, participants imagine that the brand is a person and then describe characteristics of that person, e.g. their lifestyle, status, demographics, home(s). They can build up layers of this description using words and images from a variety of sources. These descriptions help to uncover and develop the perceived nature of a brand’s personality. The following example shows why the brand personality is of importance to the marketer and how an understanding of personality may be used in advertising.
Picture response techniqueA projective technique in which participants are shown a picture and are asked to tell a story describing it.
Cartoon testsCartoon characters are shown in a specific situation related to the problem. Participants are asked to indicate the dialogue that one cartoon character might make in response to the comment(s) of another character.
Expressive techniqueA projective technique in which participants are presented with a verbal or visual situation and are asked to relate the feelings and attitudes of other people to the situation.
Role playingParticipants are asked to assume the behaviour of someone else or a specific object.
Third-person techniqueA projective technique in which participants are presented with a verbal or visual situation and are asked to relate the beliefs and attitudes of a third person in that situation.
Personification techniqueParticipants are asked to imagine that the brand is a person and then describe characteristics of that person.
Real research Coors – Coors Light44
Brand personalityThe most common definition states that brand personality is ‘the set of human charac-teristics associated with a brand’. Consumers find it natural to imbue brands with

226 Marketing Research
Brand personality can also be uncovered using role play.46 In a group discussion scenario, participants may be asked to play out the personality of a brand. In the Coors example, the setting could be a sports bar after work on a Friday evening, with individuals acting out what they see as the personas of the brands Coors, Guinness, Becks, Stella Artois and Heineken. What the individuals as a brand do, what they say, how they interact with each other in the bar, all allow an expression of personality that straight questioning may not reveal. Video recording of the event, played back to the group, acts as a means to discuss and elicit further meaning of a brand’s personality, highlighting any positive and negative associations of the brand.
Advantages and disadvantages of projective techniques
The major advantage of projective techniques is that they may elicit responses that partici-pants would be unwilling or unable to give if they knew the purpose of the study. At times, in direct questioning, the participant may intentionally or unintentionally misunderstand, misinterpret or mislead the researcher. Personal accounts can be more self-conscious and self-justifying than the actions themselves, because they represent the way an individual would like to be judged.47 This is one of the values of projective techniques, which frame the actions as those of ‘someone else’. Projective techniques can increase the validity of responses by disguising the purpose. This is particularly true when the issues to be addressed are personal, sensitive or subject to strong social norms. Projective techniques are also helpful when underlying motivations, beliefs and attitudes are operating at a sub-conscious level.48
Projective techniques suffer from many of the disadvantages of unstructured direct tech-niques, but to a greater extent. These techniques generally require personal interviews with
personality characteristics, such as ‘honest’, ‘cheerful’, ‘charming’ or ‘tough’. Moreover, the personality traits associated with a brand, as with those associated with an individ-ual, tend to be relatively enduring and distinct.45 Coors Light was a brand at a cross-roads. Since its launch in 1984 it had become the best-selling light beer in Canada. In 2002 a superficial analysis of Coors Light would reveal a strong brand. It was growing in share and volume and had carved out a strong position. This came from the brand’s his-tory. It had capitalised on lifestyle trends such as health, fitness and lower calorific intake. Creatively, it had leveraged its Rocky Mountain heritage to communicate a healthy, active, fun lifestyle. However, Coors Light loyal drinkers were getting older and they were lighter drinkers. At one time a young man in a focus group said that he had tried the beer ‘once with an uncle at a funeral’ – ouch! Coors Light was not relevant to their lifestyle. Coors wished to develop a new brand personality that would drive all elements of marketing and business strategy. For a brand to become a leader, Coors did not believe it should mimic the attitude and personality of its target drinkers. It needed to develop a brand personality and a voice that ‘earned a right to be a part of the party’. Coors’ qualitative research projected ‘young adult-oriented brands’ generally falling into two camps. There were ‘skateboarding monkey’ brands, which inserted themselves into a scenario and tried to earn consumer affinity through proximity; these brands usually ended up looking as if they were wearing their younger brother’s clothes, and young adults were able to see through this approach. Then there were brands that became a part of the culture they were looking to infiltrate. They weren’t just using the words. They understood their meaning and believed in the core values of the target group. These brands earned a lasting and enduring affinity.

227Chapter 8 Qualitative research: in-depth interviewing and projective techniques
individuals who are experienced interviewers and interpreters; hence they tend to be expensive. Furthermore, as in all qualitative techniques, there can be a risk of interpretation bias. With the exception of word association, all are open-ended techniques, making the analysis and interpretation more problematic.
Some projective techniques, such as role playing, require participants to engage in what may seem to be unusual behaviour. Certain participants may not have the self-confidence or the ability to express themselves fully with these techniques. In role playing, for exam-ple, the skills of acting may make some participants more articulate at expressing their feelings compared with others. The same may be said of techniques where pictures and cartoons are put together and interpreted, in that distinctive skills may make certain par-ticipants more adept and comfortable in expressing themselves. To counter this, one could argue that there is a great amount of skill required in articulating ideas and feelings in an open-ended in-depth interview. One could point to fiction writers or poets who are able to encapsulate particular feelings most clearly and succinctly, which, again, is enormously skilful.
With such skill requirements, the disadvantage of the technique lies in the nature of the participants who agree to participate, and how characteristic they may be of distinct target markets.
Applications of projective techniques
Projective techniques are used less frequently than unstructured direct methods (focus groups and in-depth interviews). A possible exception may be word association, which is commonly used to test brand names and occasionally to measure attitudes about particular products, brands, packages or advertisements. As the examples have shown, projective techniques can be used in a variety of situations.49 The usefulness of these techniques is enhanced when the following guidelines are observed. Projective techniques should be used:
1 Because the required information cannot be accurately obtained by direct questioning.
2 In an exploratory manner to elicit issues that participants find difficult to conceive and express.
3 To engage participants in the subject, by having fun in expressing themselves in interest-ing and novel ways.
Comparison between qualitative techniques
To summarise comparisons between qualitative techniques, Table 8.1 gives a relative com-parison of focus groups, in-depth interviews, projective techniques and ethnographic approaches (qualitative observation).
The nature of qualitative research is such that, within the broad categories above, there are numerous variations of the techniques with distinct strengths and weaknesses in elicit-ing and representing consumer feelings. Really, it is not possible to say that one technique is better or worse than the other. Faced with a given problem, it would seem to be the case of deciding which technique is the most appropriate to represent or understand consum-ers.50 What may affect this choice is the confidence that marketing decision makers may have in particular techniques. Thus, for example, any number of arguments may be made for the use of a projective technique as being the best way to tackle a sensitive issue indi-rectly. However, if the marketer who has to use the research findings does not believe it to be a trustworthy technique, then other, perhaps less appropriate, techniques may have to be used.

228 Marketing Research
Table 8.1
Criteria Focus groups In-depth interviews
Projective techniques
Ethnographic techniques
Degree of structure Can vary from highly to loosely structured
Can vary from highly to loosely structured
Tends to be loosely structured
Loosely structured though can have a framework to guide observation
Probing of individual participants
Low High Medium None when used in isolation and in a covert manner
Moderator bias Medium Relatively high Low to high None when used in isolation and in a covert manner
Uncovering subcon-scious information
Low Medium to high High High
Discovering innovative information
High Medium Low Medium
Obtaining sensitive information
Low Medium High High
Involving unusual behaviour or questioning
No To a limited extent Yes Perhaps on the part of the observer
A comparison of focus groups, in-depth interviews, projective techniques and ethnographic techniques
Summary The qualitative techniques of in-depth interviewing allow researchers to focus upon indi-viduals with the qualities they deem to be important to their research objectives. With a ‘quality individual’ the researcher can question and probe to great depth and elicit a quality understanding of that individual’s behaviour or feelings. The technique is well suited to tackling commercially and personally sensitive issues. It is also well suited to interviewing children. There are many types of interview that can be applied under the term ‘in-depth interview’. They can range from the very open and unstructured to semi-structured exchanges. The application of structure in an in-depth interview can be founded on a theoretical underpinning of how individuals should be questioned and probed. Three relevant and widely used examples of interviews using a theoretical underpinning are laddering, repertory grid techniques and the Zaltman metaphor elicita-tion technique (ZMET). Laddering seeks to reveal chains of attributes, consequences and values that participants associate with products. The repertory grid seeks to elicit the underlying elements and the connection of those elements, related to a particular form of consumer behaviour. ZMET seeks to understand the images and associations that under-pin both spoken and tacit thoughts and feelings through the elicitation of both rational and emotional thinking.
Indirect projective techniques aim to project the participant’s motivations, beliefs, attitudes and feelings onto ambiguous situations. Projective techniques may be classi-fied as association (word association), completion (sentence completion, story com-pletion), construction (picture response, cartoon tests) and expressive (role playing,

229Chapter 8 Qualitative research: in-depth interviewing and projective techniques
third-person personification) techniques. Projective techniques are particularly useful when participants are unwilling or unable to provide the required information by direct methods.
The qualitative researcher needs to develop an understanding of the interplay between characteristics of the target participants, the issues they will be questioned about and the context in which they will be questioned. The context can be broken down into the physical location of the interview and the protocol of starting, running and terminat-ing the interview. Building up this understanding is vital to the success of conducting in-depth interviews and projective techniques in international markets.
The marketing research industry is concerned about how qualitative research partici-pants are handled in interviews and observations. More consumers are being ques-tioned in both domestic and business scenarios. If they are to ‘open up’ and reveal deeply held feelings, perhaps in front of a group of strangers, or if they are to take part in projective techniques that they may see as being unorthodox, they have to be reas-sured of how the data captured will be used.
Technology has opened up many possibilities to conduct in-depth interviews and use projective techniques on a global basis. A rich dialogue and engagement between an interviewer and a participant can be developed and recorded with much lower cost and time demands when compared with meeting face to face. The loss of subtle eye contact and body language may be a price to pay for the savings afforded by online research.
Questions 1 What is an in-depth interview? Summarise the process of administering an in-depth interview.
2 What are the major advantages of in-depth interviews?
3 What are the requirements of the researcher undertaking in-depth interviews? Why are these requirements particularly important when conducting interviews with managers?
4 Why may a structure be applied to the in-depth interview in the form of laddering or the repertory grid technique?
5 Describe the process of administering the repertory grid technique.
6 Evaluate the context and timing requirements that you think would be needed to make the repertory grid technique work.
7 Choose any particular application of an in-depth interview and present a case for why you think the technique may work much better than a focus group.
8 What are projective techniques? In what circumstances should projective techniques be used?
9 Describe the ‘word association’ technique. Give an example of a situation in which this technique is especially useful.
10 Describe the ‘story completion’ technique. Give an example of the type of participant and the context in which such a technique would work.
11 Describe the criteria by which researchers may evaluate the relative worth of qualitative techniques.
12 Why is the context of questioning particularly important when conducting in-depth interviews in international marketing research?

230 Marketing Research
13 Why may in-depth interviews or projective techniques upset or disturb participants?
14 Describe a projective technique that you feel would work particularly well online – without the use of webcams.
15 What limitations are there to conducting in-depth interviews online, compared with meeting participants face to face?
Exercises 1 Could an in-depth interview about the phenomenon of online casinos be conducted online? Present a case for how you would conduct such interviews and set out what you see as the advantages and disadvantages of this approach.
2 Baileys Irish Cream wishes to better understand customer experiences of serving and enjoying its drink. Develop a cartoon test for this purpose.
3 A cosmetics firm would like to increase its penetration of the student market through a new range of organic and ‘ethical’ products. Conduct two experimental in-depth interviews with a male and female student. Write a report setting out plans for any subsequent form of in-depth interviews and associated techniques, showing how the experimental interviews have impacted upon these plans.
4 Jeffery West shoes (www.jeffery-west.co.uk) wishes to develop an understanding of its brand personality. Design a role-playing scenario that will help to achieve this aim. Who would you invite to the sessions? Where would you run the sessions? What roles would you ask the participants to play?
5 In a small group discuss the following issues: ‘Are there any dangers (for researchers and participants) in conducting in-depth studies on issues that participants hardly reflect upon on a day-to-day basis?’ and ‘Projective techniques cannot work well with shy and introverted participants.’
Video case exercise: Acme Whistles
Acme wishes to conduct in-depth interviews with b2b buyers who purchase (or could purchase) its whistles for sports-related applications. How would you recommend Acme conducts such interviews with participants spread across the globe? Create a topic guide that would help you to question participants about their purchasing behaviour. How could you use these interviews to support the development of new products?
Notes
1. Rédier, E. and McClure, S., ‘Let the product talk’, ESOMAR Fragrance Conference, Paris (November 2007).
2. Supphellen, M., ‘Understanding core brand equity: Guidelines for in-depth elicitation of brand associations’, International Journal of Market Research 42 (3) (2000), 319–42; Harris, L.M., ‘Expanding horizons’, Marketing
Research: A Magazine of Management and Application 8 (2) (Summer 1996), 12.
3. Kvale, S., Interviews: An Introduction to Qualitative Research Interviewing (Thousand Oaks, CA: Sage, 1996); Rubin, H.J. and Rubin, I.S., Qualitative Interviewing: The Art of Hearing Data (Thousand Oaks, CA: Sage, 1995).

231Chapter 8 Qualitative research: in-depth interviewing and projective techniques
4. Warren, C.A.B., ‘Qualitative interviewing’, in Gubrium, J.F. and Holstein, J.A. (eds), Handbook of Interview Research: Context and Method (Thousand Oaks, CA: Sage, 2002), 83–101.
5. Johnson, J.M., ‘In-depth Interviewing’, in Gubrium, J.F. and Holstein, J.A. (eds), Handbook of Interview Research: Context and Method (Thousand Oaks, CA: Sage, 2002), 104.
6. Ibid., pp. 106–7.
7. Schwalbe, M.L. and Wolkomir, M., ‘Interviewing men’, in Gubrium, J.F. and Holstein, J.A. (eds), Handbook of Interview Research: Context and Method (Thousand Oaks, CA: Sage, 2002), 203–20.
8. Schnee, R.K., ‘Uncovering consumers’ deepest feelings using psychologically probing qualitative research techniques’, Advertising Research Foundation Workshops, ‘Consumer Insights Workshop’ (October 2000); ‘Looking for a deeper meaning’, Marketing (Market Research Top 75 Supplement) (17 July 1997), 16–17.
9. Arnal, L. and Holguin, R., ‘Taxis, vans and subways: Capturing insights while commuting’, ESOMAR Qualitative Research, Paris (November 2007).
10. Bloom, N., ‘In-depth research? A bit controversial!’, ResearchPlus (June 1993), 12.
11. Bowman, J., ‘When everything Clicks into place’, Research World (December 2006), 31.
12. Baxter, S., ‘It’s not kids’ play! Reflecting on the child-orientated research experience’, International Journal of Market Research 53 (1) (2011), 63–74.
13. Clarke, B., Goodchild, M. and Harrison, A., ‘The digital world of children and young adolescents: Children’s emotional engagement with digital media’, ESOMAR Congress Odyssey, Athens (September 2010).
14. Parke, A., ‘When not to rely on the young imagination’, ResearchPlus (March 1997), 14.
15. Milling, A., ‘Don’t supersize me’, Research (November 2005), 38–9.
16. Rédier, E. and McClure, S., ‘Let the product talk’, ESOMAR Fragrance Conference, Paris (November 2007).
17. Bakken, D.G. and Breglio, V.J., ‘Cultural differences in consumer decision-making – Asian consumers, western research methods: What we’ve learned’, ESOMAR Asia Pacific Conference, Tokyo (March 2005); De Andrade Marseilles Reis, A.H.M., ‘Laddering: An efficient tool for the formation of product positioning strategies and ways of communication’, The Dynamics of Change in Latin America, ESOMAR Conference, Rio de Janeiro (1997).
18. Dichter, E., The Strategy of Desire (New York: Doubleday, 1960).
19. Reynolds, T., Gutman, J. and Craddock, A., ‘The MECCAS framework to advertising strategy’, Brand Management Models (2006), 230–1; Gutman, J., ‘Laddering: Extending the repertory grid methodology to construct attribute-consequence-value hierarchies’, in Heath, D.C. (ed.), Personal Values and Consumer Psychology (Lanham, MD: Lexington Books, 1984).
20. For example, Grunert, G.K. and Grunert, S.C., ‘Measuring subjective meaning structures by the laddering method: Theoretical considerations and methodological problems’, International Journal of Research in Marketing 12 (1995) 209–25.
21. Best Practice, ‘Understanding motivation’, Admap 446 (January 2004), 13.
22. Schindlbeck, T., Loose, N. and Moughrabi, C., ‘AUTO BILD market barometer connectivity: The connected automobile is gaining momentum’, ESOMAR Automotive Research Forum, Wolfsburg (May 2013).
23. Kelly, G.A., The Psychology of Personal Constructs (New York: Norton, 1955).
24. Kelly, G.A., A Theory of Personality: The Psychology of Personality (New York: Norton, 1969).
25. Rogers, B. and Ryals, L., ‘Using the repertory grid to access the underlying realities in key account relationships’, International Journal of Market Research 49 (5) (2007), 595–612.
26. Marsden, D. and Littler, D., ‘Exploring consumer product construct systems with the repertory grid technique’, Qualitative Market Research: An International Journal 3 (3) (2000), 127–44.
27. Slater, A., ‘Understanding individual membership at heritage sites’, International Journal of Culture, Tourism and Hospitality Research 4 (1) (2010), 44–56.
28. Van Raaij, W.F. and Verhallen, T.M.M., ‘Domain specific market segmentation’, European Journal of Marketing 28 (10) (1994), 49–66.
29. Jin, Z.Q., Birks, D.F. and Targett, D., ‘The context and process of effective NPD: a typology’, International Journal of Innovation Management 1 (3) (September 1997), 275–98.
30. McDonald, H., ‘Understanding the antecedents to public interest and engagement with heritage’, European Journal of Marketing 45 (5) (2011), 780–804; Fransella, F. and Bannister, D., Manual for Repertory Grid Technique (London: Academic Press, 1977).
31. Micu, A.C. and Plummer, J.T., ‘Measurable emotions: How television ads really work – patterns of reactions to commercials can demonstrate advertising effectiveness’, Journal of Advertising Research 50 (2) (2010), 137–53.
32. Wornell, T., ‘Diving for pearls’, Research (April 2005), 39.
33. Penn, D., ‘In search of the buy button’, Research World (January 2008), 10.
34. Sharma, A. and Pugh, G., ‘Serpents with tails in their mouths: A reflexive look at qualitative research’, ESOMAR Qualitative Research, Paris (November 2007); Sokolow, H., ‘In-depth interviews increasing in importance’, Marketing News (13 September 1985), 26.
35. Branthwaite, A., ‘Investigating the power of imagery in marketing communication: Evidence-based techniques’, Qualitative Market Research: An International Journal 5 (3) (2002), 164–71; Chandler, J. and Owen, M., Developing brands with qualitative market research (Thousand Oaks, CA: Sage, 2002) 86–100; Best, K., ‘Something old is something new in qualitative research’, Marketing News 29 (18) (28 August 1995), 14.
36. Mariampolski, H., Qualitative Marketing Research: A Comprehensive Guide (Thousand Oaks, CA: Sage, 2001), 206.
37. Boddy, C., ‘Projective techniques in market research – valueless subjectivity or insightful reality?’, International Journal of Market Research 47 (3) (2005), 239–54.

232 Marketing Research
38. Zaichowsky, J.L., ‘The why of consumption: Contemporary perspectives and consumer motives, goals, and desires’, Academy of Marketing Science 30 (2) (Spring 2002), 179; Levy, S.J., ‘Interpreting consumer mythology: Structural approach to consumer behaviour focuses on story telling’, Marketing Management 2 (4) (1994), 4–9.
39. Burden, S., ‘Case study: Pre-testing mould breaking ads’, Admap Magazine, 485 (July/August 2007), 48–9.
40. Catterall, M., ‘Using projective techniques in education research’, British Educational Research Journal 26 (2) (April 2000), 245–56; Kennedy, M.M., ‘So how’m I doing?’, Across the Board 34 (6) (June 1997), 53–4; Lindzey, G., ‘On the classification of projective techniques’, Psychological Bulletin (1959), 158–68.
41. Byron, E., ‘How P&G led also ran to sweet smell of success’, Wall Street Journal (4 September, 2007), B2; Walsh, K., ‘Soaps and detergents’, Chemical Week 164 (3) (23 January 2002), 24–6; ‘Interpretation is the essence of projective research techniques’, Marketing News (28 September 1984), 20.
42. Grimes, A. and Kitchen, P., ‘Researching mere exposure effects to advertising – theoretical foundations and methodological implications’, International Journal of Market Research 49 (2) (2007), 191–219.
43. Clarke, B., ‘If this child were a car, what sort of car would it be? The global child: Using appropriate projective techniques to view the world through their eyes’, ESOMAR Qualitative Research, Cannes (November 2004); Suprenant, C., Churchill, G.A. and Kinnear, T.C. (eds), ‘Can role playing be substituted for actual consumption?’, Advances in Consumer Research (Provo, UT: Association for Consumer Research, 1984), 122–6.
44. Anon., ‘Coors – Coors Light’, Institute of Communication Agencies, Silver, Canadian Advertising Success Stories (2007).
45. Maehle, N. and Supphellen, M., ‘In search of the sources of brand personality’, International Journal of Market Research 53 (1) (2011), 95–114.
46. Strachan, J. and Pavie-Latour, V., ‘Forum – food for thought: Shouldn’t we actually target food advertising more towards kids and not less?’, International Journal of Market Research 50 (1) (2008), 13–27.
47. Branthwaite, A. and Patterson, S., ‘The vitality of qualitative research in the era of blogs and tweeting: An anatomy of contemporary research methods’, ESOMAR Qualitative, Barcelona (November 2010).
48. McPhee, N. and Chrystal, G., ‘Who’s eaten my porridge? Discovering brand image differences’, ESOMAR Healthcare Conference, Rome (February 2008); Gill, J., and Johnson, P., Research Methods for Managers, 3rd edn (Thousand Oaks, CA: Sage, 2002); Varki, S., Cooil, B. and Rust, R.T., ‘Modeling fuzzy data in qualitative marketing research’, Journal of Marketing Research 37 (4) (November 2000), 480–9.
49. For more on projective techniques, see Burden, S., ‘Emotional…but does it sell?’, Admap 496 (July/August 2008), 41–2; Clarke, B., ‘If this child were a car, what sort of car would it be? The global child: Using appropriate projective techniques to view the world through their eyes’, ESOMAR Qualitative Research, Cannes (November 2004); Valentine, V. and Evans, M., ‘The dark side of the onion: Rethinking the meaning of “rational” and “emotional” responses’, Journal of the Market Research Society 35 (April 1993), 125–44.
50. Branthwaite, A. and Cooper, P., ‘A new role for projective techniques’, ESOMAR Qualitative Research, Budapest (October 2001), 236–63.

Qualitative research: data analysis
Qualitative analysis involves the
process of making sense of data
that are not expressed in
numbers.
Stage 1
Problem definition
Stage 2
Research approach developed
Stage 3
Research design
developed
Stage 4
Fieldwork or data
collection
Stage 5
Data integrity
and analysis
9
Stage 6
Communicating research findings

234 Marketing Research
Objectives
After reading this chapter, you should be able to:
1 understand the importance of qualitative researchers being able to reflect upon and understand the social and cultural values that shape the way they gather and interpret qualitative data;
2 describe the stages involved in analysing qualitative data;
3 describe the array of data types that qualify as qualitative data;
4 explain the nature and role of coding in the stage of reducing qualitative data;
5 appreciate the benefits of being able to display the meaning and structure that qualitative researchers see in their data;
6 understand why qualitative data analysis pervades the whole process of data gathering and why the stages of analysis are iterative;
7 appreciate the nature and roles of grounded theory, content analysis and semiotics in qualitative data analysis;
8 understand the ethical implications of the ways that qualitative researchers interpret data;
9 appreciate the strengths and weaknesses of analysing data using qualitative analysis software.
The application of qualitative techniques is not necessarily a predefined and structured process. In the majority of instances, qualitative researchers modify their direction as they learn what and who they should focus their attention upon. Data-gathering techniques, the nature of participants and the issues explored can change and evolve as a project develops. This chapter starts by examining how researchers reflect upon what happens to the way they perceive and observe as these changes unfold. It discusses how these reflections form a key source of qualitative data to complement the narrative generated from interviews and observations.
The stages involved in a generic process of analysing qualitative data are outlined and described. The first stage of the process involves assembling qualitative data in their rich and varying formats. The second stage progresses to reducing the data, i.e. selecting, classifying and connecting data that researchers believe to be of the greatest significance. A key element of this stage is the concept of coding. The third stage involves the display of data, i.e. using graphical means to display the meaning and structure that researchers see in the data they have collected. Manual and electronic means of displaying data are discussed. The final stage involves verifying the data. Researchers aim to generate the most valid interpretation of the data they collect, which may be supported by existing theories or through the concept of theoretical sampling. Though these stages seem quite distinct, the reality is that they are iterative and totally interdependent upon each other; the stages unfold in ‘waves’ to produce an ultimate interpretation that should be of great value to decision makers. Three alternative perspectives on analysing qualitative data are presented. First, the purpose and concept of grounded theory are discussed, with the stages involved in building theory. Second, content analysis is presented, a much simpler approach to analysing qualitative data, which is sometimes viewed as a quantitative technique. Third, the purpose and concept of semiotics are presented. This approach adopts the view that consumers should be viewed as products of culture, constructed and largely determined by the popular culture within which they live. It allows for the integrated analysis of cues that emerge from text, pictures and sounds.
The social and cultural values of qualitative researchers affect how they gather and analyse data. Understanding the social and cultural norms of participants in international environments is discussed. The social and cultural values of researchers affect their interpretation of qualitative data, and the ethical implications of not reflecting upon these values are addressed.
Overview

235Chapter 9 Qualitative research: data analysis
The digital applications in the stages of qualitative data collection and analyses are described. There are many distinct advantages to the use of qualitative data analysis software, but many researchers contend that it should be a ‘hands-on’ process that cannot be mechanised. The arguments from both of these perspectives are presented. To be able to cope with the great amount of data generated from qualitative techniques, a great variety of software packages are available. Examples of analysis software are briefly described, followed by website addresses that allow demonstration versions of the software to be downloaded and explored. NVivo, a qualitative data analysis package specifically designed for researchers, is also presented.
The qualitative researcher
Self-reflection of social and cultural values
In Chapter 2, when discussing the diagnosis of research problems, we stated:
A major problem for researchers is that their perception of problems may be reflected through their own social and cultural development. Before defining the problem, researchers should reflect upon their unconscious reference to cultural values . . . The unconscious reference to cultural values can be seen to account for these differences.
This implies that researchers need to reflect upon their own values and attitudes – the factors that may bias the way they perceive and what they observe. This reflection is just as important in the analysis of qualitative data as it is in the diagnosis of research problems. To illustrate why researchers need to reflect upon what may bias the way they perceive and what they observe, we start this chapter with an example from the world of literature and the treatment of narrative. The example is a précis of an English translation of a Japanese novel; the exam-ple could be taken from any novel.
Real research South of the Border, West of the Sun1
This novel tells the story of an only child, Hajime, growing up in the suburbs of postwar Japan. His childhood sweetheart and sole companion in childhood was Shimamoto, also an only child. As children they spent long afternoons listening to her father’s record col-lection. When Hajime’s family moved away, the childhood sweethearts lost touch. The story moves to Hajime in his thirties. After a decade of drifting he has found happiness with his loving wife and two daughters, and success in running a jazz bar. Then Shima-moto reappears. She is beautiful, intense, enveloped in mystery. Hajime is catapulted into the past, putting at risk all he has at the present.
Imagine that you had been asked to read this novel, but before you read it you were expected to prepare by reading a description of conditions in postwar Japan. From that you might appreciate the significance of a record collection of 15 albums, and how privileged a family may be to own a record player and to have this collection. Imagine someone else being asked to prepare by reading a biography of the author. From that you might appreciate the social and economic conditions of his upbringing, the literature, music and education that he enjoyed. Preparing to read the novel in these two ways may mean that a reader sees very different things in the story. The reader may interpret passages differently, have a different

236 Marketing Research
emotional attachment with the conditions and behaviour of the characters, and appreciate the effect of quite subtle events upon the characters.
Put aside any prior reading and imagine a female reader enjoying the book. She may empathise with the main female character, Shimamoto, and understand her attitudes, values and behaviour in the way that male readers may not be able to comprehend. In the story, Shimamoto suffered from polio as a child, which made her drag her left leg. Imagine a reader who has had to cope with a disability and who may appreciate how, as a child, one copes with the teasing of other young children. The two main characters were ‘only children’; imagine a reader who was an only child and who can recall how he or she would view large families and appreciate the joys, disappointments and array of emotions of being an only child. The list could go on of the different perspectives of the story that may be seen. The reader, with their inherent values and attitudes, may perceive many different things happen-ing in the story. The reader does not normally reflect upon their unconscious values and attitudes, but just enjoys the story. In talking to others about the story, the reader might be surprised about how others see it. In watching the film version of the book, the reader might be shocked at the different images the film director presents, images that are very different from the one that resides in the reader’s head. Now consider whether there is one ultimate interpretation of the novel, one ultimate ‘truth’. It is very difficult to conceive that there is one ultimate interpretation. One may question why anyone would want to achieve such a thing; surely the enjoyment of literature is the ability to have multiple interpretations and ‘truths’ of a novel?2
Narrative for the qualitative researcher
What is the link from the interpretation of a novel to qualitative data analysis in marketing research? Quite simply, the qualitative researcher builds up a narrative and creates a story of the consumers whom decision makers wish to understand. Imagine yourself as a qualitative researcher, supporting decision makers who wish to develop advertisements for an expen-sive ride-on lawnmower. The key target market they wish to understand is ‘wealthy men, over the age of 60, who own a home(s) with at least 1 hectare of garden’. The decisions they face may include the understanding of:
1 What gardening and cutting grass mean to target consumers.
2 How they feel about the experience of buying and using a lawnmower.
3 What relative values (tangible and intangible) are inherent in different brands of lawnmower.
4 What satisfaction they get from the completed job of mowing a large lawn.
5 The nature and qualities of celebrities they admire (who may be used to endorse and use the product in an advertisement).
These questions may be tackled through the use of focus groups. Imagine yourself run-ning these groups. What could you bring to the groups if you have personally gone through the experience of buying an expensive ride-on lawnmower and have gardening and lawn-mowing experiences? You may have an empathy with the participants in the same manner as the ‘only child’ reading of the experiences and emotions of an only child in a story. From this empathy, you may be able to question, probe and interpret the participants’ answers really well, drawing an enormous amount from them. Without those experiences you may have to devise ways to ‘step into the shoes’ of the participants. You may look to the atti-tudes, values and behaviour of your parents, grandparents or friends for a start, looking for reference points that you are comfortable with, that make sense to you. As you go through a pilot or experimental focus group, you may be surprised by certain participants talking about their lawnmowers as ‘friends’, giving them pet names and devoting lavish care and

237Chapter 9 Qualitative research: data analysis
attention upon them. Getting an insight into this may mean looking at cases from past research projects or literature from analogous situations, such as descriptions of men form-ing a ‘bond’ with their cars.
The direction that qualitative researchers take in building up their understanding and ulti-mately their narrative is shaped by two factors. The first factor is the theoretical understand-ing of the researchers as they collect and analyse the data. This theoretical understanding can be viewed from two perspectives. The first is the use of theory published in secondary data, intelligence and literature. The use of theory from these sources may help the researchers to understand what they should focus their attention upon, in their questioning, probing, obser-vations and interpretations. The second is the use of theory from a grounded theory perspec-tive. The researchers may see limitations in existing theory that do not match the observations they are making. These limitations help the researchers to form the focus of their question-ing, probing, observations and interpretations.
The second factor that shapes the direction that the researchers take is a marketing under-standing. In the case of understanding the wealthy male lawnmower owner, the researchers need to understand what marketing decision makers are going to do with the story they cre-ate. The researchers need to appreciate the decisions faced in creating an advertisement, building a communications campaign or perhaps changing features of the product. Reference to theoretical and marketing understanding in researchers helps them to present the most valid interpretation of their story to decision makers. Unlike writing a novel, where the author is happy for the readers to take their own ‘truth’, researchers are seeking an ultimate interpretation and validity in their story. Achieving a valid interpretation enables the researchers to convey to decision makers a vision or picture of a target market that they can quickly ‘step into’. Marketing decision makers, for example, may wish to include a passage of music in an advertisement that the target market has an emotional attachment to, which they find positive and uplifting. With a rich picture or vision of this target market they may be able to choose the right piece of music. The decision makers’ cultural and social develop-ment may mean that the piece of music is meaningless to them, but you as a researcher have given them the confidence and enabled them to step into the world of the target market. The following example illustrates how qualitative research, based upon blogging via mobile devices, helped the Knorr brand to understand the characteristics, behaviour and views of a very distinctive target market.
Real research Tokyo Girls Collection metrics3
In Japan, Knorr wished to develop a new Soup Pasta to target the primary gourmets of noodle cuisine: younger, female consumers. The hardest question Knorr faced was how to develop a Soup Pasta that fitted the target segment’s taste preferences. To generate and commercialise the product successfully, the company needed frank and honest opin-ions from young, female consumers during the idea generation, idea screening, concept development, product design and detailed engineering phases. In order to do this, Knorr decided to tie its new-product development project to the Tokyo Girls Collection (TGC). The TGC was a twice-annual celebration of ‘all things cute’, organised by Girlswalker.com magazine to showcase the season’s fashionable streetwear. The fashion event included such attractions as live performances by renowned artists, a charity auction and the final stage selection and presentation of the TGC Contest. The fashion show used only amateur models, known as ‘Dokusha moderu’ (in English, ‘reader models’), chosen from trendset-ting girls’ magazines, such as Vivi or Ray. The TGC exemplified a grassroots movement that has become so huge in Japan that it has rendered the traditional fashion houses anachro-nistic. Many previous TGC tie-up campaigns have proven very successful, because young

238 Marketing Research
The researcher’s learning as qualitative data
Qualitative researchers have to reflect upon their own social and cultural development, their own attitudes and values, to see how these have shaped the narrative and how they shape their interpretation of the narrative. The researchers should recognise their own limitations and the need to develop and learn; in the cases above, this means learning about wealthy men and their relationship with lawnmowers or Japanese girls and their relationships with soup and fashion. Ultimately they wish to present the most valid story that they see, to have exam-ined the story from many perspectives, to have immersed themselves in the world of their target markets. The following example illustrates the research impact of not recognising one’s own biases and social/cultural conditioning.
female consumers tended to spread the word about their favourite brands. Knorr’s new-product development project was announced at the TGC venue, with star TGC models assigned as official new Soup Pasta development project members. Knorr launched the mobile Girlswalker.com site, where TGC project members described the product devel-opment process in their blogs. Knorr’s blogging project to support its new Soup Pasta development was an ideal way for it to generate such openness. The TGC served as a critical mental and symbolic venue for the virtual discussions.
Real research We see our own beliefs reflected in research4
Different advertising agencies cherish different beliefs about what will work and what will not work in an advertisement. Take, for instance, ‘influencing lifestyle’ (such as: drive less, drink less, stop smoking, don’t drink and drive). In this field, there are at least two different schools. One school promotes the ‘confrontation’ strategy; show the negative effects of behaviour as extremely as possible; show cancerous lungs in an anti-smoking campaign; show the remorseful victims of smoking-related diseases. Another school feels that such an approach does not really work, because the consumers will actively shut their system off from this kind of information, countering it with arguments such as ‘I have to die anyway’ or ‘I never have a problem drinking and driving’. This school claims that you can better focus on a more positive approach, or an approach that avoids show-ing negative consequences. Both schools will be able to find proof for their ideas, and both will tend to open up to reality supporting their ideas, avoiding evidence that goes against their views. In conducting research, both schools will find their views supported by consumers, one asking for ‘extreme examples’, the other claiming to be immune to such an approach and asking for a more positive approach. From the observations of Dutch researchers Jochum Stienstra (www.ferro-mco.nl) and Wim van der Noort (http://english.minaz.nl) in viewing focus group discussions, the participant that gives ‘the right answer’ is embraced: ‘You see, I knew it, scaring them off doesn’t work.’ Two participants later, another communication manager or researcher will hear proof of the opposite opinion: ‘This is exactly what I mean. They are asking for extreme emotions, otherwise they won’t listen.’ They contend that research that tries to find the right communication approach involves a danger: you might end up finding what you already thought was right, or – even worse – you might find an internal quarrel aggravated since both schools will find their standpoint proved. This means that research as we know it cannot help us out, cannot transfer the problem from the realms of belief to the realms of ‘proof’.

239Chapter 9 Qualitative research: data analysis
If you are reading a novel, you may not be inclined to make notes as your reading pro-gresses. You may not make notes of other books to read that may help you to understand the condition of particular characters, or to understand the environment in which they behave. You may not wish to write down the way that you change and learn as you read through the story. A reflection of your unconscious social and cultural values as revealed through your interpretation of the novel may be the last thing you want to do.
As a qualitative researcher you need to do all the above as you build and interpret your story of target consumers. A notebook or diary should be on hand to note new question areas or probes you wish to tackle, and to reflect upon how they have worked. As interviews unfold and you feel your own development and understanding progress, a note of these feel-ings should be made. As you seek out specific secondary data, intelligence or theory to develop your understanding, you should note why. If you see limitations in existing theories or ideas, you should note why. As an understanding of how decision makers can use the observations that are being made, these should be recorded. Included in these notes should be feelings of failure to ask the right question or probe, emotional states should be noted, of feeling up or down, sad or angry, or nervous.5 Ultimately, the story that emerges in your own notebook should be a revelation of your own social and cultural values. There should be an explicit desire to develop this self-awareness and understand how it has shaped the direction of an investigation and the ultimate story that emerges.
The creation and development of the researcher’s notebook is a major part of the narrative that is vital to the successful interpretation of questions and observations of consumers. The key lesson that emerges from the creation and development of the researcher’s notebook is that qualitative data analysis is an ongoing process through all stages of data collection, not just when the data have been collected:6
Analysis is a pervasive activity throughout the life of a research project. Analysis is not simply one of the later stages of research, to be followed by an equally separate phase of ‘writing up results’.
The evolution of questions and probes, deciding who should be targeted for questions and observations and even deciding the context for questioning or observing, means that analysis takes place as data are being gathered.
The process of qualitative data analysis
We examine four perspectives of analysing qualitative data, starting with a generic process. Many of the terms used here differ from those linked to specific types of software or to researchers who follow a particular theoretical approach derived from a specific discipline. The generic process outlined is designed to give an understanding of what is involved in qualitative data analysis and how the stages link and interact. The four stages of the generic process are outlined in Figure 9.1. The concept of coding is introduced in this section – a vital concept to understand in all approaches to analysing qualitative data. The second per-spective presented is the concept of grounded theory. The third perspective is the process of content analysis. The fourth is the discipline of semiotics.
Data assembly
Data assembly means the gathering of data from a variety of sources. These would include:
1 Notes taken during or after interviewing or observations.
2 Reflections of researchers, moderators or observers involved in the data-collection process.
3 Theoretical support – from secondary data, intelligence or literature sources.
Data assemblyThe gathering of data from a variety of disparate sources.

240 Marketing Research
4 Documents produced by or sourced from participants.
5 Photographs, drawings, diagrams, i.e. still visual images.
6 Audiotape recordings and transcripts of those recordings.
7 Video recordings.
8 Records made by participants, such as mood boards or collages.
As discussed in the previous section, the researcher should get into the habit of maintain-ing a notebook, diary or field notes. As a qualitative investigation evolves in terms of the issues to explore and the participants to target, the researcher goes through a learning pro-cess. This learning process means that the researcher may see things differently as inter-views or observations progress. Keeping field notes aids the researcher’s memory when it comes to the formal process of data analysis and helps enormously in categorising and inter-preting collected data. It ultimately helps to generate a ‘deeper and more general sense of what is happening’.
In order to create a ‘deeper and more general sense of what is happening’, it is suggested7 that researchers keep four separate sets of notes in order to systematise the process and thus improve their reliability:
1 Short notes made at the time of observation or interview.
2 Expanded notes made as soon as possible after each session of interviews or observations.
3 A fieldwork journal to record problems and ideas that arise during each stage of fieldwork.
4 A provisional running record of analysis and interpretation.
Data assembly also includes deciding lines of enquiry that should be developed and those that should be dropped. Given that qualitative research is primarily exploratory in nature, questions and probes are not fixed. As an interview or observation takes place, the researcher learns more about an issue and can develop a new question or probe and decide that a ques-tion, initially thought to be vital, is no longer relevant. There may be issues that can be com-pared over a series of interviews or observations, but the whole data collection and data assembly can evolve. Keeping notes is vital, as memory alone is fallible, unreliable and potentially biased. Being able to recall, for example, the hesitation in replying to a question displayed by a focus-group participant may, upon reflection, be seen as someone evading the issue. After all the group discussions have been completed and the same question has been
Field notesA log or diary of observations, events and reflections made by a researcher as a study is planned, implemented and analysed.
Figure 9.1
Stages of qualitative data analysis Data reduction
Data display
Data veri�cation
Data assembly

241Chapter 9 Qualitative research: data analysis
posed to others, the interpretation may change to the individual being embarrassed about an issue, primarily through becoming aware of their own ignorance. The researchers’ notes help them to recall how they were feeling at the point of setting the question, and recall the situa-tion in other groups that gives meaning to a pause that shows up as a quiet spot in an audio or video recording. The notes may also help the researcher appreciate what is happening when laughter occurs by participants in qualitative techniques. Interpreting the meaning of laugh-ter presents one challenge for researchers. When humour is present, group dynamics, the pitch and intensity of laughter, or even the sly smile that masks a feeling that something is incredibly funny would need to be recorded in the researcher’s notes, to set a context to the narrative of any discussion. The same challenges are faced in the example below, which deals with the nature of silence in an interview; what does a particular silence mean? The researcher’s notes at the time of the silence may hold vital clues to what is being felt by par-ticipants but not expressed.
Real research Listening to the sounds of silence8
My in-depth interview went really badly! It was full of long silences . . . my participants just would not open up!!
This is a cry from researchers who believe that discussions that are not full of verbal give and take have not ‘got going’. Many fail to understand that the silence received in response to the question asked may have told the researchers what they needed to know. The way people communicate is deeply linked with the culture, values and norms of a society. If one understands the reason for the silence, one can end up with a far stronger set of findings and interpretations. The following is based on the reflections of over 200 focus group discussions and 100 in-depth interviews conducted in different parts of India by Shobha Prasad (www.drshti.com). Silence in India could be based on the social structure between castes. For example, a study conducted in rural Rajasthan among young men ran into severe issues arising from mingling of castes within the focus group. There were demarcated places where castes were allowed to mingle and com-municate; they would talk to each other outdoors but not indoors. It was only when some of the participants were taken out of the group that others opened up to voice their opinions. Language block was occasionally encountered where sessions were con-ducted in Hindi and participants had differing levels of comfort with the language. In some sessions, more educated participants would express themselves in English, creat-ing a sense of inequality in the group. Those who were less educated would then become quiet unless the researcher directly addressed them and tried to draw them back into the discussion. Indians rarely contained strong emotions in silence; they tended to let these feelings out through words. Therefore silences resulting from the two extremes – extreme positive and extreme negative emotion – were rare and if they occurred were short-lived. ‘Extreme delight’ was very rarely silent. Extreme negativity tended to result in a short silence, which very often just ‘broke itself’. The body language accompanying strong negative emotions was very obvious: a closed expression, folded arms, rigid body and refusal to make eye contact. In some cases participants would whisper among themselves. The slightest direct probe was usually adequate to get a verbalisation of these thoughts. The more common causes for silence among both women and men was incomprehension, confusion and feelings of inadequacy, and a lack of confidence. These reasons generally came to light as the session went on, when at some point, in response to a probe, participants would admit to have been confused or bewildered.

242 Marketing Research
Unfortunately, the recording and use of field notes or a diary is limited in many qualita-tive marketing research projects. This may be due to the contents of such notes, which could include photographs and other non-verbal data sources. These are unavoidably ‘subjective’, being what the researcher has chosen to notice. They are developmental, representing the learning and self-reflection that the researcher goes through. The subjective choices are rea-soned choices, where issues are deliberately included or excluded. Understanding the rea-sons for those choices, recognising the learning and self-development that can emerge from these notes, can add so much more depth and greater insight into qualitative data. By devel-oping self-awareness, qualitative researchers can take a more balanced view of the data they collect as they realise many of their own biases and hidden agendas.
Beyond taking notes or keeping a diary, many qualitative techniques make extensive use of material of a semi- or non-verbal nature, generated through participant tasks such as the use of projective techniques (as described in Chapter 8). These materials can include draw-ings, lists, stories, clay models or structures and collages of photographs, video footage and music. The commonly held view is that it is not these materials that should be analysed but the meanings attached to them by the participants who produced them.9 These meanings as narrative will have been captured as part of the recorded discussion, or are in the notes of the researcher.10 The materials themselves would normally be available during analysis, ena-bling the possibility to notice useful features such as consistencies and differences between participants. They can also be useful in communicating and illustrating findings. Other quali-tative researchers go further, taking the view that it is legitimate to ‘read’ these materials in the absence of the participants who produced them. They would argue that significant and valid meaning can be extracted from them provided they have a strong theoretical basis to drawing their conclusions and meanings.
This relationship between participants’ discourse and non-verbal materials mirrors the debate in using photography in ethnographic studies (a common occurrence in qualitative marketing research, where participants are given disposable or digital cameras to capture stills or moving images of their experiences). Many significant anthropological ethnogra-phies dating from the mid-1920s onwards include photographs relating to the fieldwork. The question that faces anthropologists relates to why photographs may be used in analysis and the relationship, if any, between the photograph and the written text. It is difficult to general-ise, but it seems to be the case that photographs have been included in ethnographic reports more for evidential than analytic purposes. The photographs serve essentially presentational and illustrative purposes rather than providing a focus for a more sustained analysis of the visual dimensions of culture.11 Such perspectives are radically changing as more visual eth-nographic techniques gain prominence in qualitative marketing research, as illustrated in the following example.12
Real research Participant photography in visual ethnography13
Visual ethnography is an anthropological approach that incorporates visuality throughout the research process. In a project designed to investigate the consump-tion of households, an exploratory, initial investigation was designed to expose the various ways that household shoppers engaged with the consumption spaces that they visited. A key aim was to have the householders focus on their shopping in as natural a way as possible and record this so that it could be discussed during an in-depth interview. A researcher following participants on shopping trips was deemed to be quite intrusive, in that having a stranger along could affect the usual flow of the experience, no matter how much rapport was developed. It was important, however, to try to capture everyday practice as accurately as possible in order to bring to the

243Chapter 9 Qualitative research: data analysis
The key feature of the use of photography and visuals is the subtlety of characteristics or events that can be captured and portrayed where words alone may be deficient. This feature has an impact for qualitative researchers for two reasons. The first can be seen from the perspective of qualitative technique participants. Certain participants may not be able to express what they feel about a product, service, advertisement, brand or any design element of their experiences solely using words. They may, however, be able to use vis-ual cues from sources such as photographs to represent their feelings. The second can be seen from the perspective of decision makers who use qualitative research findings. Cer-tain marketing decision makers working in visually creative fields, such as advertising, product and package design and branding, work better with visual data compared with words or statistics. They may understand the impact of how consumers feel and will react to their designs through very subtle interpretations of visual data. Given the importance of visual data to this type of decision maker, we explore the concept of semiotics later in this chapter.
Data reduction
Data reduction involves handling the data. This process involves organising and struc-turing the data. It means having to throw some data away! Imagine a series of 10 focus group discussions and the amount of data that could be collected. There are the memories and notes of the moderator and any other observers who took part, there are the tran-scripts of what was actually said in interviews and there may be contributions from par-ticipants in the form of mood boards. The transcripts are a vital, and for most studies the, primary data source in qualitative data analysis, and much care should be taken in tran-scribing them. Transferring the dialogue from tape or digital devices can be tortuous as recordings are notoriously ‘unclear’. Imagine a focus group in full swing: not every par-ticipant takes their turn to speak without talking over other participants, and then they may not speak clearly and loudly enough. As a result it can take a great deal of time to work out what participants actually said and how the questions, responses and ideas con-nect together. In producing transcripts, it is much better for the researchers to work
Data reductionThe organising and structuring of qualitative data.
Transcripts‘Hard copies’ of the questions and probes and the corresponding answers and responses in focus groups or in-depth interviews.
investigation the real ways in which shop-pers engaged with the process of consump-tion. The research process asked participants to keep a shopping log of all household expenditure over a period of two weeks. This was a straightforward procedure of putting all their receipts into a plastic wallet provided and noting any expenses without a receipt on a notepad. After the fortnight had elapsed they were interviewed using the receipts as prompts and following several themes derived from the literature. Another important element was the addition of a disposable camera. Researchers met with the shoppers and explained their part in the data-gathering process. This initial contact established a rapport before the interview proper, but it continued by explaining the research process and covering ethical issues. In addition, participants were issued with a disposable flash camera and asked to take photographs of any-thing interesting connected to their shopping. Prior to the in-depth interviews, the photographs were collected and added to the receipts and notes to facilitate probing and the development of issues.

244 Marketing Research
through the recordings and piece together the components using their notes and memory of events. This is very time-consuming, so many researchers use typists to transcribe their recordings of interviews – arguing that their time is better spent reading through and edit-ing transcripts produced in this manner. The use of online software for in-depth inter-views and focus groups means that this time-consuming task is eliminated, as the transcript is built up as the interview progresses.
The researchers with their transcripts, notes and other supporting material have to decide what is relevant in all these data. Reducing the data involves a process of coding data, which means breaking down the data into discrete chunks and attaching a reference to those chunks of data. Coding is a vital part of coping with qualitative data analysis and, given this impor-tance, the process is discussed in some detail.
Researchers need to be able to organise, manage and retrieve the most meaningful bits of qualitative data that they collect. This is normally done by assigning ‘labels’ or codes to the data, based upon what the researcher sees as a meaningful categorisation. What happens is that the researcher condenses the great mass of data from a study into analysable units by creating categories from the data.14 This process is termed the coding of data. Coding is the process of bringing together participants’ responses and other data sources into categories that form similar ideas, concepts, themes, or steps or stages in process. Coding can also enable the categorisation of names, evidence or time sequences. Any hesitations, emotional states or levels of humour can be coded. Indeed, anything that is felt to be revealing in the data can be coded. Data such as a simple response to a question can be coded in many differ-ent ways, or placed into many different categories; there is no expectation of mutual exclu-sivity, and data can be re-coded as often as is thought necessary.15
An illustration of coding is presented using the data presented in Table 9.1. This table presents the verbatim responses from an open-ended question in a self-completion survey targeted at 12 to 14 year olds. The question asked participants what facilities they would like in a planned new community centre. Though the technique used was quantitative, the survey generated qualitative data and, in its much shortened format, demonstrates the process that qualitative researchers must go through.
In categorising the responses, the researcher could create codes of ‘swimming pool’ or ‘disco’ and count the times that these were literally expressed. Alternatively, the researcher could code on the basis of ‘sports activities’ or ‘recreational activities’ and group together activities such as ‘swimming, basketball and snooker’ for sports and ‘computers,
Coding dataBreaking down qualitative data into discrete chunks and attaching a reference to those chunks of data.
Table 9.1
Requested feature of new community centre Gender
Skate park, death slide, basketball courts, swimming pool MaleComputer room MaleStuff for all ages MaleSwimming pool MaleComputers, snooker room MaleA space for computers, tuck shop MaleMusic, television, up-to-date magazines, pool tables FemaleMusic, discos FemaleSwimming pool FemaleMusic, pool/snooker, discos FemaleWhat people will enjoy FemaleAll the things people enjoy Female
Teenager requests for facilities at a planned community centre

245Chapter 9 Qualitative research: data analysis
television, discos and tuck shop’ for recreational activities. The researcher could code ‘indoor activities’ and ‘outdoor activities’, or activities that would need supervision and those that would need no supervision. There are many ways that the researcher can catego-rise the data, it is their choice. Consider how the researcher may cope with the requests for a ‘computer room’ and ‘computers’. Could these be combined under one heading of ‘ computing’ or would this lose the meaning of having a devoted space, away from other activities that could be noisy and distracting? Consider also how the researcher would cope with the requests for ‘stuff for all ages’, ‘what people will enjoy’ and ‘all the things people enjoy’. It may seem obvious that a new leisure centre needs to develop facilities that people enjoy and that these may be discarded, but there may be a hint in the first state-ment of ‘stuff for all ages’ that may link to the word ‘people’ used in the two other state-ments. If the researcher interprets the statements in this way, a category of ‘activities to draw in all ages’ could be created; these responses may be seen as tapping into a notion of a leisure centre that is welcoming and not exclusive.
Table 9.2 presents a small selection of the verbatim responses from the same open-ended question in a self-completion survey, this time targeted at adults.
Table 9.2
Requested feature of new community centre Gender
Regard for residents living nearby, special car parking area to avoid streets nearby being jammed MaleNew centre would soon bring the wrong sort of people; it could form a centre for thugs and crime MaleStrict rules so as to inconvenience local people living close by as little as possible, e.g. noise MaleRun and organised well to run functions at affordable prices with dress rules for the lounge and bar MaleMembership should be given on signature of applicants to a strict set of rules MaleEmphasis on youth on the estate and run in a way to encourage rather than regiment them MaleSupervised youth activities, daytime crèche, dance floor, serve coffee/soft drinks for youths FemaleShould be very welcoming and developed for all kinds of people FemaleActive participation by those using the facilities, which should give opportunities for the young FemaleTo make a safe place for all people of all ages to enjoy FemaleExterior should be modern; inside decorated tastefully with nice seats and tables, plenty of hall space FemaleYouth club with a youth leader, luncheon club for older groups and gentle keep-fit for the elderly Female
Adult requests for facilities at a planned community centre
The interesting feature in comparing the statements from the adults with those from the teenagers is how they express themselves in more detail and how they thought beyond spe-cific facilities that make up the leisure centre. These statements were unprompted, so one can imagine how much richer the explanations and justifications would be with an in-depth inter-view or a focus group. Again, there are many ways that the researcher can categorise the data, perhaps even more than with the teenagers. Categorising these adult statements is not as straightforward as for the teenagers’. The researcher could draw out the words ‘youth’ or ‘rules’ and set these as categories. The researcher could pull out named ‘facilities’ such as ‘dance floor’ and ‘nice seats and tables’, or ‘activities’ such as ‘youth club’ and ‘luncheon club’. What becomes apparent in reading through the statements (especially with the full set of responses) are the implied problems related to issues of parking, the types of people that are attracted or could be attracted, and how ‘regimented’ or not the centre should be. These are categories or patterns that may be apparent to a researcher, though not explicitly expressed. There may be words expressed that make up the categories, but the words broken down and taken in isolation may lose their impact, if they are just counted.

246 Marketing Research
Table 9.2 illustrates that categorisation into the component words may mean that the con-textual material that gives these words meaning can be lost. From the above example, coding can be thought of as a means to:
1 Retrieve data, i.e. from the whole mass of data, particular words or statements can be searched for and retrieved to examine the ‘fit’ with other words or statements.
2 Organise the data, i.e. words or statements can be reordered, put alongside each other and similarities and differences evaluated.
3 Interpret data, i.e. as words or statements are retrieved and organised in different ways, interpretations of the similarities and differences can be made.
Coding is a process that enables the researchers to identify what they see as meaningful and to set the stage to draw conclusions and interpret meaning. Codes are essentially labels to assign meaning to the data compiled during a study.
In broad terms, the coding process involves the following stages:
1 Set up a broad group of coding categories. These would emerge from an initial reading of the gathered data and the intended purpose of the study. For example, these may be the themes that structured a number of focus group interviews or in-depth interviews.
2 Work through the data to uncover ‘chunks’ of data that may be put into brackets or under-lined or highlighted. Codes are usually attached to ‘chunks’ of varying size, i.e. words, phrases, sentences, paragraphs, an extended story, an image, indeed any component of the collected data, connected or unconnected to a specific context.16 Sometimes a single sen-tence or paragraph might be coded into several categories. For example, one paragraph where participants are overtly discussing parking problems at a community centre may also be discussing issues of ‘mobility’ or ‘independence’. Once the start and end of a chunk to be coded is established, a name or number is assigned to it.
3 Review the descriptions given to the codes. Working through the data, it may be clear that important themes emerging from the data do not fit into the pre-set categories, or that one theme blurs into two or more separate concepts. At this point new categories have to be set to fit the data. With new categories, the data must then be reviewed and recoded where appropriate. This stage therefore is one of immersion in the data and refining the nature of categories as more meaning is uncovered in the data.
4 Examine differences between types of participant. This could be simple demographic comparisons, e.g. to see if there are differences between men and women in how they view independence. The comparisons could be between types of participant that emerge from other codes, e.g. lifestyle aspirations may emerge from the data, with groups emerg-ing that may be labelled ‘sophisticated minimalists’ and ‘spiritual warriors’. Comparisons of the behaviour between these emerging groups can be made. Through these compari-sons, new insights may emerge about the assigned codes and the descriptors applied to them. New insights may also emerge about the way that participants are described and categorised, combining knowledge of their demographic, geographic, behavioural, psych-ographic and psychological characteristics.
5 Develop models of interconnectivity among the coded categories. This involves basic graphical modelling to explain a sequence of events or a process that the data describe. It could show how categories relate to each other, how participants may be alike or differ and how different contexts impact upon the categories and participants. Again, new insights may emerge about the meaning seen in the data, and the coding process may be further refined.
6 Iterate between the code descriptions and the developing model. This stage is again one of immersion in the data, with continual refining of the nature of categories and

247Chapter 9 Qualitative research: data analysis
the structural relationship of those categories. These iterations continue until the researchers have what they believe to be the most valid meaning that they see in the data.
The relative advantages and disadvantages of manual or electronic approaches to analys-ing qualitative data, and especially the iterative process of coding and modelling, are pre-sented later in the chapter. The point to consider at this stage is that the immersion in the data to draw out meaning is not formulaic, especially as one considers the different types of quali-tative data that can be included in analyses. Reducing qualitative data to the essence of meaning as seen by the researchers is a highly creative and subjective process. Given the time that may be allocated to this process, coding can be observed from two perspectives. First, if there is relatively little time for the researchers to immerse themselves in the data, it can be thought of as a means to simplify or reduce the mass of data. If an initial broad group of coding categories is kept and their number is relatively small, then the data can be ‘stripped down’ to a simple general form. This coding approach can be compared directly with simple forms of content analysis.17 Second, if more time can be afforded, it can be thought of as a means to expand, transform and reconceptualise data, opening up more diverse ideas and analytical possibilities. The general analytical approach is to open up the categories in order to interrogate them further, to try to identify and speculate about further features. Coding here is about going beyond the data, thinking creatively with the data, asking the data ques-tions and generating theories and frameworks.18
Coding is a major process involved in data reduction. The process forces the researchers to focus upon what they believe to be the most valid meaning held in the data. In order to develop that meaning further, the researchers need to communicate their vision to others, to evaluate their interpretations of the data and to reflect upon their own vision. The stage of data display is the means by which researchers communicate their vision of meaning in the data.
Data display
Data display is an organised, compressed assembly of information that permits conclusion-drawing and action.19 The most frequent form of display for qualitative data in the past has been extended text. Such an approach is cumbersome, dispersed and sequential, poorly struc-tured and extremely bulky. The qualitative researcher can resolve these problems with the use of matrices, graphs, charts, networks or ‘word clouds’. All are designed to assemble information into an immediately accessible, compact form so that the analyst can see what is happening and either draw justified conclusions or move on to the next step of analysis the displays suggests may be useful. The creation and use of displays is not an end output of analysis, it is an integral part of the analytic process. For example, designing a matrix as a display involves decisions on what should be displayed in the rows and columns, and decid-ing what qualitative data, in which form, should be entered in the cells.
Data display also allows a ‘public’ view of how the researcher has made connections between the different ‘data chunks’. Even if others may not have made the same connections or interpreted the data in exactly the same manner, the logic of connections should be clear. The display may be in a graphical format, with boxes summarising issues that have emerged and connecting arrows showing the interconnection between issues. Verbatim quotes can be used to illustrate the issues or the interconnections. Pictures, drawings, music or advertise-ments can also be used to illustrate issues or interconnections. The overall structure allows the decision maker who is to use the analysis to see the general meaning in the collected data. The illustration of issues or interconnections brings that meaning to life.
One of the simplest means to display data is through the use of a spreadsheet. This can be built up and displayed in a manual or electronic format. Table 9.3 presents an example of how a spreadsheet may be set out. This spreadsheet is a sample of all the interviews that may be conducted and the number of issues that may be tackled. The example relates to a bus and tram operator that wishes to understand the attitudes and behaviour of 18 to 25 year olds
Data displayInvolves summarising and presenting the structure that is seen in collected qualitative data.

248 Marketing Research
related to using public transport. In the columns, details of each interview are presented and, in the final column, notes are made of observations between interviews, with a focus on each issue. In the rows, the issues that were discussed in the interviews are presented. These issues may be generated from the topic guide used and/or from the notes of the researchers related to what they see as the emerging issues. The final row details notes of the dynamics of the group, explaining why particular exchanges may be interpreted in a particular way. The ana-lyst cuts and pastes extracts from the transcripts into the relevant cells. With the spreadsheet built up of the reordered transcripts (each focus group may tackle the issues in a different order and with different emphases), comparisons can be made across the columns on particu-lar issues, looking for similarities and differences. Connections between issues can be mapped out with the use of arrows to show the flow of dialogue. The responses from types of participants, such as ‘city-dwellers’ or ‘suburb-dwellers’, can be colour coded in order to compare similarities or differences. Different notes, images or any other supplementary material can be pasted onto the spreadsheet to help in the interpretation; all the assembled data can be displayed, or more probably a reduced and coded set of data can be displayed.
Such a spreadsheet can be built up manually using large sheets of paper from, for exam-ple, flip charts, divided into a grid, and the evidence (such as chunks of the transcript) physi-cally pasted in. This could even be tacked to a large wall, allowing the researcher to stand back, reflect, move things about and add data. The big advantage of this approach is being able to visualise the whole body of data and to move around the data to ‘play’ with ideas and connections. This works particularly well when there is more than one person working on the analysis and they are drawing ideas and questions out of each other as they relate to the data. The disadvantage is that editing, moving data around and recategorising data can become very cumbersome and messy. This is where electronic means of displaying the data work well. With electronic means, images and notes can be scanned in and added to the tran-scripts. Changes can be made very easily and quickly in moving data around, recategorising and incorporating new material. Different versions can be easily stored to allow an evalua-tion of how the thought processes of the researcher have developed. The disadvantage of the approach is that, when attempting to view the data in their entirety, the entire data set is there but, in effect, is viewed through a ‘window’ with a limited field of vision. The ‘window’ can be readily moved about, but the overall perspective is limited.
Table 9.3
Interviews? Group 1: 18–25-year-old male car drivers
Group 2: 18–25-year-old
female car drivers
Group 3: 18–25-year-old
male bus and tram users
Group 4: 18–25-year-old
tram users
Notes on the similarities and
differences between groups
on issues?
Evening travel Verbatim discourse taken from the interview that relates to this issue
Commuting
Freedom
Friends
Notes on the dynamics of individual groups?
Spreadsheet data display of focus group discourse

249Chapter 9 Qualitative research: data analysis
Another simple means to display data is through the use of a qualitative cross-tabulation. Table 9.4 presents an example of how a cross-tabulation may be set out. Again, the example relates to a bus and tram operator that wishes to understand the attitudes and behaviour of 18 to 25 year olds related to using public transport. The table shows a sample of categories that have been built around the issue of ‘evening travel’. As the analyst works through the transcripts and codes distinct chunks of data, and with knowledge of who expressed a particular view that is embodied in that chunk, that relationship can be displayed. The table shows that the analyst has established codes to represent views of ‘expense’, ‘personal attacks’, ‘spontaneity’ and ‘style’. With a simple classification of participants, in this case by gender, the analyst can display dif-ferences in the number of incidences that a specific code emerges. The large differences between males and females in how they brought up the issues ‘expense’ and ‘personal attacks’ can help the analyst to explore the data further, or indeed collect more data to understand what is creating such divergent attitudes and behaviour. Again, different notes, images or any other supplementary material can be pasted onto the cross-tabulation to help in the interpretation.
The other major means of displaying data is to use flow charts. Figure 9.2 displays a very basic structure of the issues or major categories and subcategories related to how 18–25 year olds view the use of public transport after an evening out.
Visualising the data in this matter can allow the researchers to dip back into the transcripts and their notes to seek alternative ways of connecting evidence and justifying connections.
Table 9.4
Gender
Evening trave Male Female
Expense 16 2Personal attacks 8 24Spontaneity 5 5Style 3 5
Cross-tabulation of emerging categories related to evening travel by gender
Figure 9.2
Flow chart depicting how 18–25 year olds view public transport
M/FM
M/F
M/F
M/F
M
F
The car as afashion item
Self-imageLooking after yourself
– independence
Getting home at night
Safety
Cool
Opportunitiesto ‘show o�’
Sense ofstyle
Brand of car
Otherroad users
Trusting thosearound you
Being attacked
Costs
Continuing thefun of the night

250 Marketing Research
This means that this form of graphic can play a vital role in data reduction and coding, i.e. in making sense of the data, as well as in portraying a final interpretation of the data. Most pro-prietary qualitative analysis software packages allow data structures to be displayed as in Figure 9.2, but with far more sophisticated features to display structure, differences and sup-porting evidence. A simple illustration of this in Figure 9.2 is the ‘M/F’ label attached to categories, used to display behavioural tendencies of male or female participants. With a proprietary qualitative analysis package, quite distinctive structures for participant types may be mapped, with the ability to tap into supporting evidence in actual categories or in the links between categories.20 Once researchers have displayed what they see as the meaning in the data, they need to demonstrate the credibility of their vision. This involves data verification.
Data verification
Data verification involves seeking alternative explanations through other data sources and theories. From the start of data collection, qualitative researchers are beginning to decide the meaning of their observations, and noticing regularities, patterns, explanations, possible con-figurations, causal flows and propositions. The researcher should form these meanings ‘lightly’, maintaining openness and scepticism, developing conclusions that are embryonic and vague at first, then increasingly explicit and grounded. Final conclusions may not appear until data collection is over, depending upon the volume of data collected in all their forms, the cod-ing, storage and retrieval methods used and the resource constraints placed upon researchers. When final conclusions have been drawn, researchers need to demonstrate that they have pre-sented a valid meaning of the data that they have collected. They need to show that the struc-ture or meaning they see is not just a reflection of their own views. This is where the concept of theoretical understanding, as discussed at the start of this chapter, can help. It is also where the use of the researchers’ field notes proves to be invaluable. The use of theory from second-ary data, intelligence and the literature can help to guide what may be reasonably expected as a meaning. Other means to verify the data can be through seeking ‘similar’ research findings and explanations taken from different contexts, different time frames and different researchers.21 Though the findings from these different scenarios will not be the same, there can be categories that give qualitative researchers the confidence that they are representing a valid view of their participants. This process is illustrated in the following example.
Data verificationInvolves seeking alternative explanations of the interpretations of qualitative data, through other data sources.
Real research Ethnographic interpretations22
Ethnography generally emphasises deep understanding through a focus on small numbers of participants and getting to know their lifestyles intimately. Interpretations become more robust when researchers openly draw upon information from other sources. As well as using more traditional marketing research sources, such as focus groups or surveys, other methods can be integrated. To understand what kind of products and services might reso-nate effectively with Generation Y consumers, researchers from IDEO (www.ideo.com) went as deep as they could with individuals, interviewing and observing them in different contexts. They talked to experts: parents, teachers, youth programme leaders and thera-pists. They held classes at universities made up of students from this generation and col-laborated with them to study their own cohort. They engaged individuals who were willing to make mini-documentary videos of their own lives. Combining insight from these various sources and experiences, they were able to reach a deeper understanding around complex areas such as identity. They could see how identity played out through their behaviours in co-opting brands, sampling from pop culture and borrowing from other continents, cul-tures and time periods. By triangulating methods, their understanding became more nuanced and ultimately more useful as a foundation for relevant innovation.

251Chapter 9 Qualitative research: data analysis
Two forms of validation have been suggested as particularly appropriate to the logic of qualitative research.23 The first is termed ‘triangulation’, a term derived from navigation, where different bearings give the correct position of an object. Triangulation is a process that facilitates the validation of data through cross-verification from more than two sources. In research terms, comparing different kinds of data (e.g. dialogue and photographs, quanti-tative and qualitative) and different methods (e.g. observations and interviews) allows reflec-tion upon the extent of corroboration, and what may be the causes of any differences.24 The second is termed ‘participant validation’. This involves taking one’s findings back to the participants under study. Where the feedback from participants on emergent conclusions is verified by them, there can be more confidence in the validity of the findings.
(The concept of validity will be examined in more detail in Chapter 12.25) It is worth not-ing that the qualitative researchers should not just present an interpretation and then seek validation or verification of that perspective. The search for verification is a quest that per-meates the whole research process. At face value, data assembly, reduction, display and veri-fication appear to be quite distinct and consecutive stages of data analysis. The reality is that they are iterative and totally interdependent upon each other. As researchers assemble new data, they should be thinking of means to validate their views, asking questions of different individuals in different ways and recording these thoughts in their field notes. As data are being reduced and coded, the researchers seek different possible explanations and evidence to support categorising, naming and connecting views in a particular manner. Researchers should question their interpretations of words and gestures and their own ways of seeing. This questioning process adds to the verification. The use of data display is a means to com-municate to others the meaning and structure that researchers ‘see’ in qualitative data. The display allows others to understand that vision, to question and evaluate it. The exposure and critique of the vision by other researchers and decision makers further verify the data. Ulti-mately, such critique can direct the researchers to further data assembly, reduction and dis-play; the stages may unfold in ‘waves’ to produce an ultimate interpretation of great value to decision makers.
TriangulationA process that facilitates the validation of data through cross-verification from more than two sources.
Grounded theory
In 1967 Glaser and Strauss published the seminal work The Discovery of Grounded Theory.26 It was their formal description of the approach to handling and interpreting qualitative data that they had developed in the 1960s in a participant observation study of hospital staff’s care and management of dying patients.27 The method they developed was labelled grounded theory to reflect the source of the developed theory, which is ultimately grounded in the behaviour, words and action of those under study.28 The essence of their beliefs was:29
• The need to conduct field research if one wants to understand what is going on.
• The importance of theory grounded in ‘reality’.
• The nature of field experiences for participants and researcher as something that continu-ally evolves.
• The active role of persons in shaping the worlds they live in through the process of sym-bolic interaction.
• An emphasis on change and process and the variability and complexity of life.
• The interrelationship between meaning in the perception of participants and their action.
The application of grounded theory means that the researcher develops conclusions that are grounded in the ‘data’. Grounded theory is meant to be transparent; in other words, for any given conclusion or theory that comes out of the analysis, anyone should be able to refer-ence the theory back to the text, see the steps the researchers have taken to arrive at their conclusions, and follow the development of the theory in a step-by-step way, leaving little or
Grounded theoryA qualitative approach to generating theory through the systematic and simultaneous process of data collection and analysis.

252 Marketing Research
no room for subjectivity, preconception and prejudice.30 Grounded theory researchers col-lect data and analyse them simultaneously, right from the initial phases of research. They would argue that in the initial stages of research it is not possible to know exactly what the most significant social and psychological processes are in particular settings. Research could be guided by existing theories, which may help to predict processes, but they would argue that such guidance may constrain their observations, forcing them to observe a particular set-ting from a narrow perspective. So they start with broad areas of interest and form prelimi-nary interviewing questions to open up many areas that could hold relevance. They explore and examine participants’ views and then further develop questions around those views, seeking out participants whose experiences address the emerging issues. This sequence is repeated several times during a research project, which means that researchers are kept ‘close’ to their data. Grounded theory gives researchers tools to analyse data that are concur-rent with obtaining additional focused data that inform, extend and refine emerging analyti-cal themes. This means that interviews become more focused, with a tight fit between the collected data and the data analysis. With grounded theory, the researcher works in the actual environments in which the actions take place, in order to relate participants’ perspectives to the environments through which they emerge (such as ethnographers sharing the homes of families to observe how they use and listen to the radio).31 The style of grounded theory adapts well to capturing the contextual complexities in which action unfolds, enabling researchers to understand better the interrelationships of context and action. It is especially useful where existing theories fail to explain observed phenomena, enabling researchers to challenge existing accepted views and think beyond conventional paradigms.32
Essentially, the approach is most commonly used to:
1 Generate new theory where little is already known.
2 Provide a fresh perspective on existing knowledge, i.e. to supplement existing theories.
3 Challenge existing theories. Researchers may challenge or disagree with existing theo-ries for two reasons. The first is based upon the substantive representation of what the theory explains, e.g. of how children respond to certain forms of advertising. The second may be based upon how the theory was created, i.e. the research approach, techniques or forms of analysis.
The grounded theory approach to analysing data
Grounded theory provides researchers with guidelines for analysing data at several points in the research process, not simply at an end point or ‘analysis stage’. It involves the following four stages:33
1. Coding data. Grounded theory data coding is at least a two-step process. It starts with an initial or open coding process, which forces the researchers to begin making broad analyti-cal decisions about the data they are collecting. It moves on to more selective or focused coding, in which the researchers use the most frequently appearing initial codes to synthe-sise and conceptualise large amounts of data. In essence, coding is a form of shorthand that distils events and meanings without losing their essential properties. During the coding pro-cess, researchers work through their collected data on a line-by-line basis, use ‘active’ terms or descriptors to define what is happening in the data, and ultimately follow leads in the initial coding through further data gathering. Throughout the process of coding in grounded theory, the researchers should regularly address the data, as they are built up and in their entirety, with the following list of questions. Attempting to answer these facilitates the questioning of how codes are defined, connected and subsumed into broader categories:34
a What? What is it about here? Which phenomenon is mentioned?
b Who? Which persons are involved? What roles do they play? How do they interact?
Grounded theory data codingA form of shorthand that distils events and meanings without losing their essential properties.

253Chapter 9 Qualitative research: data analysis
c How? Which aspects of the phenomenon are mentioned (or not mentioned)?
d When? How long? Where? Time, course, location?
e How much? How strong? Aspects of intensity.
f Why? Which reasons are given or can be reconstructed?
g What for? With what intention, to what purpose?
h By which? Means, tactics and strategies for reaching that goal.
2. Memo writing. Memo writing links coding to the writing of a first draft of the analysis. This stage helps researchers to: define the properties of the categories that they have cre-ated; specify conditions under which each category has developed; and note the impact of each category and the interrelationships with other categories. Memos can be anything from loosely written notes to fully formed analytical arguments, which are added to the original data and interpretations. The process of memo writing helps the researcher to achieve the following:35
a Stop and think about what is emerging from the data.
b Generate ideas to explore through other means of collecting data.
c Reflect upon gaps and missed opportunities in earlier interviews and observations.
d Reflect upon the meanings and impact of personal field notes.
e Treat coded data as distinct categories to analyse.
f Clarify categories, through their definitions, properties, distinctive elements, conse-quences and interconnectivity with other categories.
g Make explicit and constant comparisons of data with data, category with category, concept with concept.
3. Theoretical sampling. This concept was introduced in Chapter 6 in our discussion of the differences between a positivist and interpretivist approach to research. This type of sam-pling is not designed to represent a chosen population, but to develop theory by seeking out new data. The process of gathering more data is driven by the challenges in building categories and concepts that are derived from evolving theory. It is based on the notion of seeking out different situations and learning from the comparisons that can be made. Theoretical sampling helps researchers to construct and discard hypotheses and theoreti-cal explanations of the data they are immersed in. Its purpose is to encourage researchers to go to places, people or events that will maximise their opportunities to discover varia-tions among concepts. By generating more focused data to fill in any gaps in emerging categories and concepts, the whole process of theory building becomes more precise, explanatory and predictive. The process of theoretical sampling helps the researcher to achieve the following:36
a Define gaps within and between emerging categories that their coding suggests.
b Discover variation within these categories.
c Develop the validity of categories and their interconnections.
d Seek out and gather more focused and rich data.
e Seek out and gather other theoretical frameworks that may help to explain what is emerging in the data.
4. Integrating analysis. Producing more focused and well-developed memos as the analysis proceeds should enable researchers to produce theory that is clear and well validated.
Memo writingAnything from loosely written notes through to fully formed analytical arguments, which are added to the original data and interpretations.
Theoretical samplingData gathering driven by concepts derived from evolving theory and based on the concept of ‘making comparisons’.

254 Marketing Research
Researchers should aim to integrate the memos they have crafted in order to reflect the theoretical direction of their analysis or stages of a process. They have to create the order (how do the ideas fit together?) and the connectivity (what order makes the most sense?) that they see emerging from their memos. The process of integrating analysis helps the researchers to achieve the following:
a Sort the memos, usually done by the titles of categories.
b Map out a number of ways to order the memos.
c Choose an order that works for the analysis and whoever is going to use and benefit from the emergent theory.
d Create clear links between categories.
When ordering memos, researchers should consider whether a particular order reflects or challenges the logic of the experiences of participants and their target audiences of decision makers. A balance needs to be made between both parties, which may mean collapsing cat-egories for clarity and ease of reading.
Limitations of grounded theory
Grounded theory has been criticised for its failure to acknowledge implicit theories that guide researchers in the early stages of their work. Grounded theory researchers argue that such guidance may constrain their observations, forcing them to question and observe a par-ticular setting from a narrow perspective. The downside of claiming to have such an approach is that it may be extremely difficult to ignore theories that may be embedded into research-ers’ ways of thinking. It may also be counterproductive to ignore relevant theories (used with a healthy dose of scepticism) that could be useful in creating focus in gathering and interpret-ing data. Another major criticism of grounded theory is that the process can degenerate into a fairly empty building of categories, with a great abundance of description, especially when aided by data analysis software.37
Integrating analysisCreating an order and connectivity that is seen to be emerging from memos.
Content analysis
In qualitative research, content analysis is one of the classical procedures for analysing textual material, forms of communication and images rather than behaviour or physical objects. The focus of the analysis may range from the narrative or images held in bro-chures or advertising copy, to dialogues held in interview data. Primarily, the objective of content analysis is to ‘reduce’ the data, to simplify by summarising and structuring the data according to rules derived from existing theory. In effect, even though a researcher may be working with qualitative data, content analysis should be classified as a quantita-tive technique based upon classifying and ‘counting’. Content analysis is seen by many as an ‘objective’, systematic and quantitative description of the manifest content of a com-munication.38 The term ‘content analysis’ is set to include observation as well as analytic activity. The unit of analysis may be words (different words or types of words in the mes-sage), characters (individuals or objects), themes (propositions), space and time measures (length or duration of the message) or topics (subject of the message). Analytical catego-ries for classifying the units are developed, and the communication is broken down accord-ing to prescribed rules. Marketing research applications involve observing and analysing the content or message of advertisements, newspaper articles, TV and radio programmes and the like. The following example illustrates an application and process of content anal-ysis that was visually based.
Content analysisThe objective, systematic and quantitative description of the manifest content of a communication.

255Chapter 9 Qualitative research: data analysis
Content analysis has several virtues.40 First of all, it is a standardised technique that per-mits the processing of large amounts of data covering long time spans. It is an unobtrusive research method, avoiding the problems of researcher effects on the data that are inherent in interpretative research methods such as in-depth interviewing.
Limitations of content analysis
Content analysis has its shortcomings; the most serious involve the issues of manifest con-tent, data fragmentation and quantification. For qualitative researchers, these set limits on the usefulness of the method for the analysis of visual representations:41
1 Manifest content. A crucial requirement to the success of content analysis is that the established categories of analysis are sufficiently precise to enable different coders to arrive at the same results when the same body of material (e.g. advertising copy) is
Real research Food advertising to children39
Content analysis was used to provide descriptive statistics of incidence and a the-matic analysis of messages contained in a sample of food advertisements in Australia during children’s TV programming. Three weeks’ data were collected (Monday to Fri-day on Channel 10 from 7 to 8.30 a.m. and Saturday on Channel 7 from 7 to 9 a.m.) from the two Perth commercial TV chan-nels with morning children’s programming. The data were then independently coded by two researchers using a highly detailed coding instrument that provided an exhaustive list of predetermined options to increase inter-coder reliability. Pilot testing was carried out on a selection of adver-tisements that were not included in the final sample. Each advertisement was viewed first in its entirety without undertaking any coding, then all spoken and written text was transcribed onto the coding form and a summary of the story and events gener-ated. The advertisement was then viewed several times to capture the information required on the coding instrument. Next, the results were compared across the two coders’ output. There was almost complete agreement, with just a few discrepancies related to the food groups to which certain packaged foods belonged. These discrep-ancies were resolved after investigation of the products’ ingredients, resulting in complete coder agreement. After the frequencies were tabulated for each code, the ad descriptions and summaries were analysed qualitatively to develop themes relat-ing to the advertisement content. This involved constant iterations between the data and emerging themes to ensure soundness of fit. The 28.5 hours of children’s TV pro-gramming sampled contained 950 advertisements. This equated to more than 33 advertisements per hour of TV viewed. These included 212 advertisements for food products and represented 30 discrete advertising campaigns. Several of the 30 cam-paigns were repeated many times, often appearing twice in the same break. When categorised into the National Health and Medical Research Council’s food groups, the foods advertised to children were diametrically opposed to the foods recom-mended for children.

256 Marketing Research
examined. Thus, manifest content refers to what may be seen to be manifestly appar-ent in the established categories of any communication. This means that, in coding the meanings in any communication, a clearly defined category system must plainly state the characteristics of content – there can be no implicit or hidden meanings from the coding operation. For some analysts,42 the insistence upon coding only manifest content is too restrictive. The essence of their argument is that excessive emphasis on a standardised approach can result in reliability being attained at the expense of valid-ity. The significance of the message may lie more in its context than in its manifest content.
2 Data fragmentation. By virtue of the constraint of focusing upon manifest content, the tendency is to break up communications into their elements, and it is solely the presence, absence or frequency of these elements that is deemed relevant to the investigation. This categorisation isolates those elements of the communication determined by the research-er’s analytical framework or theory. This process de-contextualises the message in a com-munication – a process described as ‘losing the phenomenon’, or failing to respect the original right of the data.43
3 Quantification. It has been argued that content analysis is essentially a quantitative research technique and that applying qualitative considerations in the technique risks its objectivity and its systematic nature. The strength of the technique lies in allowing the selection and rational organisation of categories to condense the substantive meanings of a communication, with an aim to testing assumptions or hypotheses. If the aim of a study were to count frequencies in order to test hypotheses about com-munications, then the technique has much to offer. In this case it could be argued that the requirements of objectivity and a systematic approach should be the prime aim of the content analyst, and that the issue of manifest content be treated on a case-by-case basis. When examining individual cases and contexts, the presence or absence of a ‘theme’ may be measured, but not the frequency with which it occurs in the commu-nication. What the essence is of that ‘theme’ takes the method into the realms of qualitative research.44
Semiotics
We have described a range of different qualitative techniques and approaches that pri-marily focus on the participants or the consumers, questioning and observing them in a direct or indirect manner. Semiotics takes a different approach, in that consumers are not viewed as independent, self-determining agents, making their own choices. Rather, consumers are viewed as products of culture – constructed and largely determined by the popular culture within which they live. Consumer needs and aspirations are seen as not being the result of freely made choices of the individual, but a reflection of the surround-ing cultural discourses. Semiotics therefore moves the researcher’s focus towards the cultural context of the consumer, including both popular culture and the marketing con-text.45 Semiotics combines knowledge and research techniques from across a spectrum of disciplines, including linguistics, psychology, anthropology, cultural studies and the visual arts. It analyses data such as paintings and photography that some other qualita-tive research methods do not tackle so well.46 It is based on a detailed analysis of lan-guage and images, which untangle how meaning is conveyed as well as what that meaning is. A semiotic approach can be integrated with qualitative techniques that may generate much visual data, such as ethnography. This link is illustrated in the fol-lowing example.
SemioticsThe study of signs in the context of consumer experience.

257Chapter 9 Qualitative research: data analysis
Semiotic researchers aim to develop a richer and more holistic understanding of consum-ers by unearthing the cultural frameworks that underpin their behaviour. This can work across diverse global markets, supporting the design of brands and all the creative output that shapes brands in different cultures.48 In approaching a research problem, a conventional qualitative researcher might ask, ‘Why does Frank buy Pot Noodle?’. The semiotic researcher would be more likely to ask, ‘How does consumer culture give meaning to Pot Noodle, and what are these meanings?’. The semiotic researcher might argue that if we can answer these questions, we will be able to make a good guess not just at why Frank buys it, but also why anyone buys it. This is because behavioural meanings are constructed within popular culture, and consumers are influenced and constrained by this cultural context. An understanding of the broader cultural context is something that semiotic analysis is uniquely well placed to provide, because it focuses on the culture and not just on the consumer.49
Examples of how semiotics can help marketing decision makers are:50
• Mapping out a new market or a whole field of cultural activity.
• Seeing opportunities to position new brands.
• Analysing how different aspects of marketing communications work together, and the means to create synergies across different media.
• Evaluating in-store developments and harmonising the different aspects of marketing communications.
Real research Pushing the glamour button47
Unilever wished to grow the Rexona deodor-ant brand (www.rexona.com) in Russia. To generate consumer insight for its brand devel-opment, Unilever undertook a qualitative research approach, using ethnography and semiotics within a creative workshop environ-ment. The semiotics input gave it useful ways of thinking around issues and an inspiration for future communications. Uncovering some of the essential codes that underpinned Russian attitudes to identity, femininity and social sta-tus, semiotic methods led to a deeper under-standing of deodorant consumers. The most influential aspect of Russian culture identified by semiotics was around the issue of femininity. Unilever noted that ‘Prada was the new Pravda’; that glamour was the new one-party ideology of modern Russian culture. Qualita-tive research had already identified Russian women’s ambivalent attitudes towards the affluent glamour of the Moscow elite. In Unilever’s semiotic work they expanded on this contradictory state of admiration, jealousy, aspiration and loathing. It seemed that the ‘glamour button’ was the right one to push. While most Russian women, as elsewhere in the world, cannot afford to buy into the high-fashion world of Gucci and Prada, it was felt that the use of deodorant could provide a valuable displacement activity around glamour. On the one hand, ‘regular’ women could appreciate the notion that the richest, most glamour-ous Muscovites could be let down by their body odour. On a more positive note, the repre-sentation of glamour with a degree of accessibilty offered women a chance to ‘buy into’ the fame and beauty without having to spend three months’ wages on a handbag.

258 Marketing Research
• Diagnosing problems with brand or marketing communications.
• Providing models and guidelines for successful brand communications, indicating the key signifiers within the relevant context.
• Understanding the process of encoding and decoding more precisely, to minimise the potential for misunderstanding between the marketer and the consumer.
As can be seen from the above list, semiotics can play a major role in the development of a wide array of marketing communications. In terms of conducting a qualitative analysis of marketing communications, the approach goes into far more depth in comparison with con-tent analysis. Semioticians investigate the subtext of communication. They begin with the brand, combing through the cultural connotations of advertising imagery and language, the colour, shape and forms of corporate identity, where the brand is distributed and how it is displayed. Then they look outwards to the consumer’s world, hunting for shifts in cultural meaning – how concepts such as masculinity, heroism or indulgence have changed over time and how they might be reinterpreted.51 To illustrate this point, the following questions may be set by a researcher examining the advertising of a particular brand, looking at the past, the potential and the competition. The questions would be directed at the text, sounds and images of the advertisements, the wide breadth of qualitative data:52
• What are the major signifiers (i.e. the material signs – what it is)?
• What signifieds (i.e. the conceptual sign – what it means) might they be creating and to whom?
• How do the advertisements work on a symbolic/metaphorical and on a product/meto-nymical (literal) level?
• How do the form and content of the advertisements work together?
• What codes (i.e. bundles of signs) do the advertisements use?
• How do the advertisements measure up to the brand’s historical codes and those of its competitors?
• How do the advertisements work in relation to the brand’s history and its futures?
• Are is the advertisements using a dominant (everyday, mainstream), emergent (leading-edge, culturally dynamic) or residual (old-fashioned, lacking in energy) set of codes, or are residual codes being applied in an emergent way?
• What kinds of discourse or discourses are apparent, e.g. postmodernism, feminism, spirituality?
This set of questions and processes will illuminate the advertising material under develop-ment. They will help the researcher to understand more completely the material that viewers will be evaluating. However, this may not be readily achievable using a single researcher. To max-imise the potential of semiotics, an action research approach (described in Chapter 6) may offer the best results. This would involve taking a more facilitative and involving approach – sharing the actual techniques and questions of semiotic analysis with researchers and decision makers working together towards the co-creation of knowledge. This would be more open and interac-tive. Semiotics specialists would be vital to the process, but as facilitators and mentors in a workshop-style of joint working, helping clients identify and understand the way forward them-selves. A more involving approach also provides the tools to recode, enabling the client to move from insight to the successful implementation of new strategy in any of the applications above.53
Limitations of semiotics
Although semiotics is able to analyse a great breadth of interrelated qualitative data, there are four core criticisms:54
1 Reliability. The main criticism of semiotics lies in how reliable or replicable it is.55 Although an individual analyst’s interpretation may be very insightful and could be a valid

259Chapter 9 Qualitative research: data analysis
representation of cultural influences upon the consumer, there is little guarantee that another analyst would come to the same conclusion about the relevant codes or structures.
2 Qualitative data set. In practice it can be hard to assemble the relevant data to analyse, given that there is usually no discourse or discussion as might be assembled with a series of focus groups or in-depth interviews.
3 Logic of interpretation. It is not usually clear how the analyst has arrived at an interpreta-tion. It must be accepted that there is no unique way to interpret text or other types of qualitative data. On this score, Derrida56 makes the point that no single interpretation can ever claim to be the final one.57 In the case of semiotics, in many instances an interpreta-tion seems to rely upon a shared knowledge of a cultural background and intuition, which may be valid but extremely difficult to validate. This is where an action research approach can help, where the team of researchers and marketing decision makers share and ‘own’ the interpretation.
4 Consumer theory. The position of the consumer can be unclear in semiotic analysis. In principle, the consumer is seen as passive, determined by culture and unable to break out of their contextual frame.58 Many consumer theorists would disagree with this view, giv-ing the consumer a more active role in interpreting, accepting or resisting the brand’s semiotically encoded meanings.
Qualitative data analysis software
As with quantitative data analyses, it is possible to complete qualitative analyses without the aid of a computer. With quantitative analysis, it would be a rare occurrence to analyse data without a computer. With qualitative analysis it is not so rare; many researchers still believe in a ‘hands-on’ immersion in the rich data they have collected. Using the computer should provide speed, memory, ease of data access and the ability to transform and manipu-late data in many ways. Overall, it should allow a far more efficient and ultimately effective process, as the researcher’s effort can then be focused upon generating the most effective support for decision makers as quickly as possible, rather than upon laborious administra-tive tasks. The following list summarises qualitative research activities that may be sup-ported by the use of computers:
1 Field notes. Making notes before, during and after interviews and observations. Writing and editing these notes if needed as part of a data display to justify a particular interpretation.
2 Transcripts. Building up transcripts to represent the discourse in interviews.
3 Coding. Attaching keywords to chunks of data or text.
4 Storage, search and retrieval. Keeping data in an organised manner, so that relevant segments of data or text can be located, pulled out and evaluated.
5 Connection. Linking relevant data segments with each other.
6 Memos. Writing up reflective comments that can be ‘pasted’ onto relevant codes and connections.
7 Data display. Placing selected or reduced data in a condensed and organised format using a spreadsheet matrix or network. The display can be part of the development of the analysis or in the final vision produced by the researcher.
8 Drawing conclusions and verification. Aiding the researcher to interpret the data display and to test or confirm findings.

260 Marketing Research
9 Theory building. Developing systematic and conceptually coherent explanations of find-ings that are meaningful to marketing decision makers.
10 Reporting. Presenting interim and final reports of the findings in a written and oral manner.
Many of these tasks can be performed with readily available word-processing, spread-sheet and presentation packages. Many researchers may be very comfortable using such packages to gather and record data and to present findings. What may be new to many researchers is the use of proprietary software to help with the technical integration of data assembly, reduction, display and verification. Improvements in the functions and power of software that copes with this technical integration occur at a rapid pace. To see examples of different qualitative data analysis packages, download demos and cases and evaluate how applicable they may be to a particular qualitative technique, visit the following websites:
Qualitative data analysis software Website
NVivo www.qsrinternational.comAtlas.ti www.atlasti.comMAXQDA www.maxqda.com
The following example illustrates why Progressive Sports Technologies (www.progres-sivesports.co.uk) use NVivo and the qualitative techniques that are supported by this soft-ware. We recommend that you visit the QSR website to evaluate descriptions of applications and cases of NVivo applications. If you do not already have access to NVivo through your university or employer, you can access a demo from the NVivo website at the above address.
Qualitative data analysis packages do not automate the analysis process, nor is that their purpose. The process of coding, as described in the data verification section, depends upon the interpretations made by the researcher. The overall description, model or theory that emerges from the analysis also depends upon interpretations made by the researcher. No analysis package can perform such interpretations. Qualitative data analysis is not formulaic; it requires an approach that gives quick feedback to the researcher on the results of emergent questions. This involves an iterative cycle of reflection and innovation, which means total interaction between the researcher and the computer. So, rather than seeing analysis as an automated process, the purpose of software is to aid the researcher to analyse data in a sys-tematic and thorough manner. The researcher seeks patterns, meanings and interconnections in the qualitative data. This can be conducted manually, but by using software the researcher can manipulate the data far more efficiently to help see patterns, meanings and interconnec-tions and, ultimately, to develop theory.
Advantages of computer-assisted qualitative data analysis
1 Speed. The speed at which programs can carry out sorting procedures on large volumes of data is fast. This gives the researcher more time to think about the meaning of data, ena-bling rapid feedback of the results of particular analytic ideas so that new ones can be formulated. Analysis becomes more devoted to creative and intellectual tasks, less immersed in routine.
2 Rigour. Rigour adds to the trust placed in research findings. In this context it means counting the number of times things occur, as well as demonstrating that negative inci-dences have been located rather than selecting anecdotes that support a particular interpretation.
3 Team. In collaborative research projects, where researchers need to agree on the meaning of codes, a check can easily be made of whether team members are interpreting segments in the same way. This is particularly useful as coding moves from the more descriptive

261Chapter 9 Qualitative research: data analysis
and mundane codes to ones that reflect broader theoretical concerns. Researchers can pass coded interviews between them, and compare the results.
4 Sampling. It is easy to keep track of who has been interviewed, compared with the inten-tions of who should be interviewed. Beyond the sampling of individuals is the concept of theoretical sampling, i.e. the inclusion of events that corroborate or contradict developing theory. As researchers have more time to spend on creative and intellectual tasks, they can develop stronger descriptions and theories and strengthen the validity of their views by ensuring they have sampled sufficient incidences.59
It must be reinforced that software packages cannot interpret and find meaning in qualitative data. The programs do facilitate, and in some cases automate, the identification and coding of text. But there is sometimes a false assumption that identification and coding are simple and unproblematic, and critical evaluation and scrutiny of coded segments and code counts are not needed. By facilitating quick analyses, which focus on quantitative category relation-ships, the software may discourage more time-consuming, in-depth interpretations. Thus, while the programs are intended as a means of allowing the researcher to stay close to the data, their misuse can have the unintended result of distancing the researcher from the data. As discussed earlier, many decision makers who use qualitative marketing research do not question how analysis is completed, or indeed why it should be completed. The following arguments illustrate the nature of their concerns.60
Disadvantages of computer-assisted qualitative data analysis
1 Mechanistic data analysis. The computer cannot replace the creative process expected of the qualitative researcher. The researcher can evaluate the interrelated play on particular words, the tone of voice or the gestures of a particular participant. The sensitivity towards these relationships and connections can be lost in a mechanistic search for statements.
2 Loss of the overview. The researcher may be seduced into concentrating on the detail of individual chunks of data and assigning codes to the data. This focus may detract from the overall context that is so vital to identify and name chunks of data. Making sense of codes can be greatly facilitated by an ability to visualise the data in their entirety.
3 Obsession with volume. Given the ability to manipulate large amounts of data, there may be a push to increase the number of interviews. This may be counterproductive in that the emphasis should be on the interrelated qualities of:
a individual participants
b the data-capture process.
4 Exclusion of non-text data. As noted earlier, qualitative ‘text’ can include notes, observa-tions, pictures and music that make up the total ‘picture’ or holistic representation of indi-viduals. Many programs can only cope with the narrative of questions and answers recorded in transcripts (though rapid developments have been made to overcome this shortcoming).
Qualitative analysis software developers have recognised the above limitations and have gone to great pains to overcome them. One of the trade-offs faced by software developers in overcoming these limitations is the user-friendliness of their programs compared with the sophistication of being able to manipulate and represent the structure that may lie in multi-farious data. As qualitative researchers use and learn how to generate the most from the software, user-friendliness may take a lesser, though not ignored, role. Experienced qualita-tive researchers can demand more sophistication to match the realities of coping with quali-tative data. For the novice qualitative researcher the packages may seem daunting, but this problem is analogous to an initial exposure to statistical packages such as SPSS. In all cases, researchers need to appreciate how the software may serve them and work through the exam-ples and cases, to experiment and to build up their knowledge and confidence.

262 Marketing Research
Real research Taking sporting equipment to a new standard61
Progressive Sports Technologies Ltd is a UK-based sports innovation consultancy that specialises in the research and design of cutting-edge fitness equipment for major global sports brands such as Nike, Reebok and Speedo. In a research project on elite sporting products it used NVivo to conduct qualitative data analysis. The sport and fitness sector is a highly competitive industry where athletes and participants search for the latest training advancements in order to gain improved results. Whether training at an elite level or working out for general health and fitness, sporting participants demand goods and services that will better help them achieve their goals. The biggest challenge for sporting manufacturers is working out exactly what elite athletes want from their equip-ment. Understanding what this elite group wants is more difficult than it sounds. Athletes who are at the top of their game and striving for the smallest improvement in results may not necessarily be able to articulate where they want changes made. Traditionally, sporting-equipment designers have first created prototypes of new products and then asked athletes for their feedback, in order to fine tune the equipment. At Progressive, this process has been turned on its head by opening up direct communication channels between its designers and the elite athletes via a new perception study. In Progressive’s perception study, detailed interviews were conducted with 25 elite athletes across two countries. By providing the athletes with four distinct products within the same category, such as four very different pairs of running shoes, each participant was asked to describe their perceptions towards the different products in great detail. All interviews were recorded, transcribed and entered into NVivo. The software was used to group all key-words and themes that the athletes were describing. Numerous athletes were tested on multiple days, in different venues and countries. The software was used as an archive of all the testing carried out. The data files had in the order of 50,000 words relating to the athletes’ product perceptions. The software was seen as a huge time saver and allowed Progressive to organise the work in a clear and logical manner. The time saved was huge, the process definitely halved the sorting and evaluation time. In addition, the audiovis-ual capabilities available in NVivo allowed Progressive to import all files under one umbrella, including sound and movie files for future studies.
Summary Qualitative researchers should reflect upon how their social and cultural values affect the way they perceive and observe target participants. These reflections should be built up as field notes as the whole process of data gathering develops and evolves. These notes form a key source of qualitative data to complement the broad array of qualitative data generated from interviews and observations. To successfully draw together a valid interpretation, qualitative data analysis must be set in the context of a theoretical under-standing of the issue being researched and an understanding of the marketing decision makers’ use of the findings.
The first stage of the process of analysing qualitative data involves assembling data in their rich and varying formats. The second stage involves reducing the data, i.e. select-ing, classifying and connecting data that are believed to be of the greatest signifi-cance. A key element of this stage is the concept of coding. The third stage involves displaying data, i.e. using graphical means to display the meaning and structure that a researcher sees in the data collected. The final stage involves verifying the data. The researcher aims to generate the most valid interpretation of these data, which may be

263Chapter 9 Qualitative research: data analysis
supported by existing theories or through the concept of theoretical sampling. The stages of analysis seem quite distinct but in reality they are totally dependent upon each other.
Three of the most commonly used approaches to analysing qualitative marketing research lie in grounded theory, content analysis and semiotics. Grounded theory is an approach that develops theory that is ultimately grounded in the behaviour, words and action of those under study. Content analysis is used to ‘reduce’ qualitative data, to simplify them by summarising and structuring the data according to rules derived from existing theory. Semiotics combines research techniques from across a spectrum of disciplines, including linguistics, psychology, anthropology, cultural studies and the visual arts. It helps to analyse visual data that some other qualitative research methods do not tackle so well.
The qualitative researcher needs to develop an understanding of the social and cul-tural frames of target participants in international markets. At the same time, qualita-tive researchers must have a strong awareness of their own social and cultural frames. Only when they have examined both perspectives can they effectively interpret con-sumer responses. To be able to cope with the large amount of data generated from qualitative techniques, a great variety of software packages are available. Used cor-rectly, they can facilitate a speedy and rigorous exploration of qualitative data, allow-ing teams of researchers to perform creative and incisive analyses and interpretations. The main concern with the use of qualitative data analysis packages lies in the poten-tial for them to be mechanistic and to encourage yet more interviews to be completed, sacrificing the quality of data capture.
Questions 1 How may the social and cultural background of researchers affect the way they:
a gather qualitative data?
b interpret the whole array of qualitative data they have gathered?
2 What is the significance of a qualitative researcher having a theoretical and marketing understanding of the subject they are researching?
3 Why should a qualitative researcher maintain a field notebook?
4 What should be recorded in a field notebook?
5 What may be classified as ‘data’ when assembling data as part of the data analysis process?
6 What does the word ‘coding’ mean in the context of qualitative data analysis? What problems do you see associated with the process of coding?
7 What are the advantages and disadvantages of handing over recordings of qualitative interviews to a typist who has taken no part in the interviews?
8 Evaluate the purpose of displaying qualitative data.
9 What advantages and disadvantages do you see in displaying qualitative data in a spreadsheet format?
10 Evaluate ‘when’ the stage of data verification should occur.
11 How may theoretical sampling aid the process of verification?

264 Marketing Research
12 How may different types of software help in the whole process of qualitative data gathering and analysis?
13 Evaluate the main concerns that exist with the use of software in qualitative data analysis.
14 Why is the researcher’s understanding of their social and cultural values particularly important in international marketing research?
15 Why does the interpretation of qualitative findings have ethical implications?
Exercises 1 You have been given the task of conducting a series of in-depth interviews about luxury cruises targeted at women of 50 years of age and over. What preparatory work could you do to understand the characteristics of this subject, the target group and how the target group relates to the subject?
2 You have just started to work for a major qualitative marketing research agency. The CEO notes that her researchers use a great variety of methods to keep field notes, ranging from scrappy notes taken at interviews to detailed diaries. You have been given the task of designing a format of field notes that will incorporate ‘short notes made at the time of observation or interview’, ‘expanded notes made as soon as possible after each session of interviews or observations’, ‘a fieldwork journal to record problems and ideas that arise during each stage of fieldwork’ and ‘a provisional running record of analysis and interpretation’. Present the design and the case you would make to other researchers to use your format.
3 You have conducted a series of focus groups with 18 to 21 year olds about travelling home from evening events. As you complete each group, you ask participants to photograph significant events during their journeys home for the forthcoming weekend using their mobile phones. What would you do with the images that they send to you?
4 An ethnographic study is planned of young men using Lynx deodorant. Compare the relative merits of the qualitative data analysis packages ATLAS.ti (www.atlasti.com) and NVivo (www.qsrinternational.com) in terms of coping with the types of data that will be generated and the interpretations that will be performed.
5 In a small group, discuss the following issues: ‘Quantitative techniques of analysis and data display have no role to play in qualitative data analysis’ and ‘Theoretical sampling could never work in commercial marketing research given that it creates an open-ended agenda of issues to explore and participants to pursue.’
Notes
1. Murakami, H., South of the Border, West of the Sun (London: Harvill, 1999).
2. Interpreting narrative, i.e. the nature and scope of analysing literature, is a major subject area in its own right. For a simple introduction to the field, see Barry, P.,
An Introduction to Literary and Cultural Theory 3rd edn (Manchester: Manchester University Press, 2009).
3. Okazaki , S., ‘Mobile finds girls’ taste: Knorr’s new product development’, Journal of Interactive Advertising 9 (2) (Spring 2009), 32–9.

265Chapter 9 Qualitative research: data analysis
4. Stienstra, J. and van der Noort, W., ‘Loser, hero or human being – are you ready for emergent truth?’, ESOMAR Best Methodology, Annual Congress, Montreal (September 2008).
5. For an example of the use of field notes in a qualitative study, see Drenten, J., Okleshen Peters, C. and Boyd Thomas, J., ‘An exploratory investigation of the dramatic play of preschool children within a grocery store shopping context’, International Journal of Retail & Distribution Management 36 (10) (2009), 831–55; Rubin, H.J. and Rubin, I.S., Qualitative Interviewing: The Art of Hearing Data (Thousand Oaks, CA: Sage, 1995), 120.
6. Coffey, A. and Atkinson, P., Making Sense of Qualitative Data: Complementary Research Strategies (Thousand Oaks, CA: Sage, 1996), 10–11.
7. Spradley, J.P., The Ethnographic Interview (New York: Holt, Rinehart & Winston, 1979).
8. Prasad, S., ‘Listening to the sounds of silence’, ESOMAR Asia Pacific, Kuala Lumpur (April 2010).
9. Snowden, D. and Stienstra, J., ‘Stop asking questions: Understanding how consumers make sense of it all’, ESOMAR Annual Congress, Berlin (September 2007); Ereaut, G., Analysis and Interpretation in Qualitative Market Research (London: Sage, 2002), 63.
10. Gordon, W. and Langmaid, R., Qualitative Market Research: A Practitioner’s and Buyer’s Guide (Aldershot: Gower, 1988).
11. Ball, M.S. and Smith, G.W.H., Analyzing Visual Data (Newbury Park, CA: Sage, 1992), 9.
12. Verhaeghe, A., Van den Bergh, J. and Colin, V., ‘Me myself and I: Studying youngsters’ identity by combining visual ethnography and netnography’, ESOMAR Qualitative Research, Istanbul (November 2008).
13. Brace-Govan, J., ‘Participant photography in visual ethnography’, International Journal of Market Research 49 (6) (2007), 735–50.
14. Coffey, A. and Atkinson, P., Making Sense of Qualitative Data (Thousand Oaks, CA: Sage, 1996), 26.
15. Rubin, H.J. and Rubin, I.S., Qualitative Interviewing: The Art of Hearing Data (Thousand Oaks, CA: Sage, 1995), 238.
16. Hubermann, A.M. and Miles, M.B., ‘Data management and analysis methods’, in Denzin, N.K. and Lincoln, Y.S. (eds), Handbook of Qualitative Research (Thousand Oaks, CA: Sage, 1994), 428–44.
17. Weltzer-Ward, L., ‘Content analysis coding schemes for online asynchronous discussion’, Campus-Wide Information Systems 28 (1) (2011), 56–74; Roberts, M. and Pettigrew, S., ‘A thematic content analysis of children’s food advertising’, International Journal of Advertising 26 (3) (2007), 357–67; Krippendorf, K., Content Analysis: An Introduction to its Methodology (Beverly Hills, CA: Sage, 1980).
18. Coffey, A. and Atkinson, P., Making Sense of Qualitative Data: Complementary Research Strategies (Thousand Oaks, CA: Sage, 1996), 29–30.
19. Miles, M.B. and Huberman, A.M., Qualitative Data Analysis: An Expanded Sourcebook, 2nd edn (Thousand Oaks, CA: Sage, 1994), 11.
20. This is a very basic overview of the different means to display qualitative data. For a fuller discussion, the
following is recommended: Huberman, M. and Miles, M.B., The Qualitative Researcher’s Companion: Classic and Contemporary Readings (Thousand Oaks, CA: Sage, 2002); and especially the five chapters devoted to data display in Miles, M.B. and Huberman, A.M., Qualitative Data Analysis: An Expanded Sourcebook, 2nd edn (Thousand Oaks, CA: Sage, 1994), 90–244.
21. This process is known as triangulation. For a fuller description of this topic, set in the context of researcher bias, see Schillewaert, N., De Ruyck, T. and Verhaeghe, A., ‘Connected research – how market research can get the most out of semantic web waves’, International Journal of Market Research 51 (1) (2009), 11–27; Griseri, P., Management Knowledge: A Critical View (Basingstoke: Palgrave, 2002), 60–78.
22. Fulton Suri, J. and Gibbs Howard, S., ‘Going deeper, seeing further: Enhancing ethnographic interpretations to reveal more meaningful opportunities for design’, Journal of Advertising Research 46 (3) (September 2006), 246–50.
23. Silverman, D., Doing Qualitative Research 3rd edn (London: Sage, 2009), 292–310.
24. Patton, M.Q., Qualitative Research and Evaluation Methods 3rd edn (Newbury Park, CA: Sage), 2002.
25. For a fuller explanation of validity in qualitative research, see Barnham, C., ‘Qualis? The qualitative understanding of essence’, International Journal of Market Research 52 (6) (2010), 757–73; Kirk, J. and Miller, M.L., Reliability and Validity in Qualitative Research (Newbury Park, CA: Sage, 1986).
26. Glaser, B.G. and Strauss, A.L., The Discovery of Grounded Theory (Chicago: Aldine, 1967).
27. Locke, K., Grounded Theory in Management Research (London: Sage, 2001), 1.
28. Goulding, C., Grounded Theory: A Practical Guide for Management, Business and Market Researchers (London: Sage, 2002), 40.
29. Glaser, B.G., Basics of Grounded Theory Analysis: Emergence v Forcing (Mill Valley, CA: Sociology Press, 1992), 16.
30. Tottman, P., ‘The Rashoman effect: Exploring the meaning of qualitative research analysis’, Market Research Society, Annual Conference (2010).
31. Baszanger, I., ‘The work sites of an American interactionist: Anselm L. Strauss, 1917–1996’, Symbolic Interaction 21 (4) (1998), 353–78.
32. Bryant, A. and Charmaz, K., ‘Grounded theory in historical perspective: An epistemological account’, in Bryant, A. and Charmaz, K. (eds), Handbook of Qualitative Research (Thousand Oaks, CA: Sage, 2007), 32–57.
33. Charmaz, K., ‘Qualitative interviewing and grounded theory analysis’, in Gubrium, J.F. and Holstein, J.A., Handbook of Interview Research (Thousand Oaks, CA: Sage, 2002), 683–90.
34. Böhm, A., Legewie, H. and Muhr, T., Kursus Textinterpretation: Grounded Theory (Berlin: Technische Universität, Bericht aus dem IfP Atlas, 1992), 92–3, MS.
35. Adapted from Charmaz, K., ‘Qualitative interviewing and grounded theory analysis’, in Gubrium, J.F. and Holstein, J.A., Handbook of Interview Research (Thousand Oaks, CA: Sage, 2002), 687.

266 Marketing Research
36. Ibid., p. 689.
37. Silverman, D., Interpreting Qualitative Data: Methods for Analysing Text, Talk and Interaction 2nd edn (London: Sage, 2001), 71.
38. Allan, D., ‘A content analysis of music placement in prime-time television advertising’, Journal of Advertising Research 48 (3) (September 2008), 404–17; Neundorf, A.N., The Content Analysis Guidebook (Thousand Oaks, CA: Sage, 2002); Wang, C.L., ‘A content analysis of connectedness vs separateness themes used in US and PRC print advertisements’, International Marketing Review 18 (2) (2001), 145.
39. Roberts, M. and Pettigrew, S., ‘A thematic content analysis of children’s food advertising’, International Journal of Advertising 26 (3) (2007), 357–67.
40. Voorveld, H., Neijens, P. and Smit, E., ‘The interactive authority of brand web sites: A new tool provides new insights’, Journal of Advertising Research 50 (3) (2010), 292–304; Ball, M.S. and Smith, G.W.H., Analyzing Visual Data (Thousand Oaks, CA: Sage, 1992), 15.
41. Bang, H.-K., Raymond, M.A., Taylor, C.R. and Moon, Y.S., ‘A comparison of service quality dimensions conveyed in advertisements for service providers in the USA and Korea: A content analysis’, International Marketing Review 22 (3) (2005), 309–26.
42. Glassner, B. and Corzine, J., ‘Library research as fieldwork: A strategy for qualitative content analysis’, Sociology and Social Research 66 (1982), 305–19.
43. Waksler, F., ‘Studying children: Phenomenological insights’, Human Studies 9 (1986), 71–82.
44. Berelson, B., Content Analysis in Communication Research (New York: Free Press, 1952).
45. Desai, P., Methods Beyond Interviewing in Qualitative Market Research (London: Sage, 2002), 84.
46. Lawes, R., ‘The research gallery’, Research (October 2003), 23.
47. Rowland, G. and Jaroslav, C., ‘Pushing the glamour button’, Research World (February 2008), 46–7.
48. Valentine, V., ‘Unlocking cultural codes’, ResearchWorld (October 2006), 15.
49. Gadsby, N., ‘Enchantment: Using semiotics to understand the magic of branding’, Market Research Society Annual Conference (2010); Desai, P., Methods Beyond Interviewing in Qualitative Market Research (London: Sage, 2002), 85.
50. Adapted from the Semiotics Solutions website (www.semioticsolutions.com), in Desai, P., Methods Beyond
Interviewing in Qualitative Market Research (London: Sage, 2002), 85.
51. Maggio-Muller, K. and Evans, M., ‘Culture, communications and business: The power of advanced semiotics’, Market Research Society Annual Conference (2006); Clegg, A., ‘Just a sign of the times?’, Marketing Week (19 August 2004), 36.
52. Wardle, J., Developing Advertising With Qualitative Research (London: Sage, 2002), 53.
53. Valentine, V., ‘Semiotics, what now, my love?’, Market Research Society Annual Conference (2007); Clatworthy, T. and Flanagan, C., ‘White light white heat’, Research (December 2003), 41.
54. Arning, C., ‘Viewpoint – semiotics: A winning formula?’, International Journal of Market Research 51 (3) (2009), 289–91.
55. Slater, D., ‘Analysing cultural objects: Content analysis and semiotics’, in Seale, C. (ed.), Researching Society and Culture (London: Sage, 2002), 233–44.
56. Derrida, J., Positions, A. Bass (trans.) (Chicago: Chicago University Press, 1981).
57. Lawes, R., ‘Futurology through semiotics’, Market Research Society Annual Conference (2009); O’Shaughnessy, J. and Holbrook, M.B., ‘The linguistic turn in marketing research’, Journal of the Market Research Society 30 (3) (April 1988), 210.
58. Desai, P., Methods Beyond Interviewing in Qualitative Market Research (London: Sage, 2002), 97.
59. Ishmael, G. and Thomas, J.W., ‘Worth a thousand words’, Journal of Advertising Research 46 (3) (September 2006), 274–8; Packenham, L., ‘Can qual research benefit from data-analysis software?’, Admap 462 (June 2005), 48–9; Dembrowski, S. and Hanmer-Lloyd, S., ‘Computer applications – a new road to qualitative data analysis?’, European Journal of Marketing 29 (11) (November 1995), 50; Wolfe, R.A., Gephart, R.P. and Johnson, T.E., ‘Computer-facilitated qualitative data analysis: Potential contributions to management research’, Journal of Management 19 (3) (Fall 1993), 637.
60. www.qsrinternational.com/solutions_case-studies-detail.aspx?view-153, accessed 14 February 2012.
61. Schmidt, M., ‘Quantification of transcripts from depth interviews, open-ended responses and focus groups: Challenges, accomplishments, new applications and perspectives for market research’, International Journal of Market Research 52 (4) (2010), 483–509.

Survey and quantitative observation techniques
Know exactly what you want to
measure – and then select a
survey or observation technique
that creates cooperative
participants, willing to think and
be honest.
Stage 1
Problem definition
Stage 2
Research approach developed
Stage 3
Research design
developed
Stage 4
Fieldwork or data
collection
Stage 5
Data integrity
and analysis
10
Stage 6
Communicating research findings

268 Marketing Research
Objectives
After reading this chapter, you should be able to:
1 discuss and classify survey techniques available to researchers, and describe various survey techniques;
2 identify the criteria for evaluating survey techniques, compare the different techniques and evaluate which is the best for a particular research project;
3 explain and classify the different quantitative observation techniques;
4 identify the criteria for evaluating observation techniques, compare the different techniques and evaluate which are suited for a particular research project;
5 describe the relative advantages and disadvantages of observation techniques and compare them with survey techniques;
6 discuss the considerations involved in implementing surveys and observation techniques in an international setting;
7 appreciate how digital developments are shaping the manner in which surveys and quantitative observation techniques are managed and applied.
Real research Location-specific mobile research1
Adidas Japan wanted to gauge the performance of an advertising campaign targeted at football fans. The company’s particular need was to assess whether the Tokyo-based campaign had succeeded in generating awareness outside the capital, via television cov-erage. In order to do this, the company decided to conduct a mobile survey at an inter-national football match played in the city of Sendai. Fans were invited to participate via flyers handed to them as they entered the stadium. The flyers explained how to enter the survey with details of a prize draw and the chance of winning shirts signed by star players. The flyers generated a 29% hit rate on the survey home page and a 33%
In this chapter, we focus on the major techniques employed in descriptive research designs: surveys and quantitative observation. Descriptive research (as explained in Chapter 3) has as its prime objective the description of something, usually consumer or market characteristics. Survey and quantitative observation techniques are vital techniques in descriptive research designs. Survey techniques may be classified by mode of administration as online, telephone surveys, face-to-face and postal surveys. We describe each of these techniques and present a comparative evaluation of all survey techniques. Then we consider the major observational techniques: personal observation including mystery shopping research, electronic observation and trace analysis. The use of the internet has reshaped how surveys are designed and delivered in manners that are more engaging for participants.
To begin our discussion, we present two examples of how these digital developments are shaping the practice of survey and observation design. The first example illustrates how researchers designed and implemented an internet survey via mobile phone. The second example illustrates advances in outdoor communications and a means to measure the impact of individuals observing billboards and posters.
Overview

269Chapter 10 Survey and quantitative observation techniques
completion rate among fans visiting the site. For Adidas Japan this meant 333 completed questionnaires based upon the distribution of 3,500 flyers at the game. The survey took, on average, eight minutes to complete. This was a reflection that, at 18 questions, the questionnaire was rather long for a mobile survey. One of the strengths of this method was that participants were able to complete the survey at a time of their own choosing, but while the event was still fresh in their minds. Very few fans completed the survey during the game itself; the majority completed it after the game while travelling home.
Real research The great outdoors goes digital2
Many outdoor poster and billboard locations have been converted to digital screens by JCDecaux (www.jcdecaux.co.uk) and Clear Channel (www.clearchannel.com). Advertis-ers are able to utilise the flexibility of the screens to show different copy at different times of the day and make live changes throughout a campaign. This flexibility allows smaller advertisers to rent space for a limited time, in effect hiring screen time. This also means that the medium competes with TV advertisements. Added to this ability to digit-ise outdoor advertisements is the increased ability to measure their impact. In Canada, scientists have developed Eyebox2 (www.xuuk.com/eyebox2), whereby infrared tech-nology assesses how many passers-by turn to look at a display (and for how long). The data from these observations can be linked to point-of-sale data in stores to give even more powerful insights into the impact of a billboard.
Survey methods
The survey method of obtaining information is based upon the use of structured question-naires administered to a sample of a target population. Participants may be asked a variety of questions regarding their behaviour, intentions, attitudes, awareness, motivations and demo-graphic and lifestyle characteristics. These questions may be asked verbally, in writing or via a computer (including mobile devices), and the responses may be obtained in any of these forms. ‘Structured’ here refers to the degree of standardisation imposed on the data-collection process. In structured data collection, a formal questionnaire is prepared and the questions are asked in a prearranged order; thus, the process is also direct. Whether research is classified as direct or indirect is based on whether the true purpose is known to the participants. A direct approach is undisguised in that the purpose of the project is disclosed to the participants or is otherwise obvious to them from the questions asked (as explained in Chapter 7).
The structured direct survey, the most popular data-collection method, involves adminis-tering a questionnaire. In a typical questionnaire, most questions are fixed-response alternative questions that require the participant to select from a predetermined set of responses. Consider, for example, the following question, designed to measure a dimension of students’ attitudes towards the way they are assessed in marketing research classes:
Strongly Agree Neutral Disagree Strongly agree disagreeI prefer written examinations n n n n ncompared with continual assessment
The survey method has several advantages. First, the questionnaire is simple to administer. Second, the data obtained are consistent because the responses are limited to the alternatives
Survey methodA structured questionnaire administered to a sample of a target population, designed to elicit specific information from participants.
Structured data collectionUse of a formal questionnaire that presents questions in a prearranged order.
Fixed-response alternative questionsQuestions that require participants to choose from a set of predetermined answers.

270 Marketing Research
stated. The use of fixed-response questions reduces the variability in the results that may be caused by differences in interviewers. Finally, coding, analysis and interpretation of the data are relatively simple.3
The disadvantages are that participants may be unable or unwilling to provide the desired information. For example, consider questions about motivational factors. Participants may not be consciously aware of their motives for choosing specific brands or shopping at par-ticular stores. Therefore, they may be unable to provide accurate answers to questions about their motives. Participants may be unwilling to respond if the information requested is sensi-tive or personal. In addition, structured questions and fixed-response alternative questions may result in loss of validity for certain types of data, such as beliefs and feelings. Finally, wording questions in a consistent manner to all potential survey participants is not easy (see Chapter 13 on questionnaire design). In other words, the survey imposes the language and logic of the researcher on the questionnaire participants. Given this core characteristic of survey techniques, great care must be taken to ensure that the language and logic used in questionnaires are meaningful and valid to potential participants. Despite the above disad-vantages, the survey approach is by far the most common method of primary data collection in marketing research, representing around 72% of all marketing research spending.4
Access to survey participants may be conducted through two routes (see Figure 10.1). The first is via traditional approaches to building sampling frames, i.e. through personal contact, directories and databases. (These will be discussed in more detail in Chapters 14 and 15.) The second is via the access panel (described in Chapter 3). In short, specialist companies (such as ResearchNow, www.researchnow.com) manage large panels of individuals who have agreed to take part in surveys that are relevant to their backgrounds, location and/or interests. Access panels primarily work for online surveys and have been instrumental in the
Figure 10.1
A classification of survey methods
Traditional
Onlinesurvey
Telephonesurvey
Face-to-facesurvey
Postalsurvey
EmailHome orworkplace
Mobiledevice
Home orworkplace
StreetCATI
(computer-assisted
telephoneinterview)
Surveymethods
Traditionalsamplingmethods
Accesspanel
CATI(computer-
assistedtelephoneinterview)

271Chapter 10 Survey and quantitative observation techniques
rapid growth of online surveys. However, it is possible to use the details of panel members to allow other methods of survey to be conducted.
Survey questionnaires may be administered in four major modes: (1) online surveys; (2) telephone surveys; (3) face-to-face surveys; and (4) postal surveys. Online surveys can be conducted via the internet on devices in home and offices. The use of mobile devices in administering surveys could be classified as a telephone survey. While many mobile devices are indeed telephones, the majority of mobile device use is now for accessing services through the internet. Mobile devices enable consumers to access audio and video, while communicating via text, email, social media and web browsing. Globally there are more smartphones in circulation that have great power and functionality and are able to cope with an array of research engagements.5 We thus classify mobile devices as a form of online sur-vey. Telephone surveys may be further classified as traditional telephone survey and com-puter-assisted telephone interviews (CATIs). Face-to-face surveys may be conducted in the home or workplace, as street surveys, or as computer-assisted personal interviews (CAPIs). The final major method, postal surveys, takes the form of the traditional hard-copy, self-completion survey administered through the post. We now describe each method.
Online surveys
Online surveys can be conducted on devices in homes or the workplace, or administered on mobile devices. Unsurprisingly, given the broader trends in technology adoption, online sur-veys have now become the dominant means of delivering surveys. Some of the issues in terms of declining response rates are covered later in this book, but the following example illustrates why the online survey is so popular. The survey experience can be designed in a personalised manner, and it can be much cheaper and faster to administer compared with traditional phone or face-to-face survey methods.
Real research Happy campers
Hugh Inwood, Director at The Research Box (www.researchbox.co.uk), was approached by the British Holiday & Home Parks Association (BH&HPA) to develop an automated means of collecting customer satisfaction data. BH&HPA is an organisation representing the interests of the British holiday parks industry. Membership is made up of the owners and managers of park home estates, touring and tenting parks, cara-van holiday home parks, chalet parks and self-catering accommodation. BH&HPA wanted to develop a single-visitor satisfaction survey that could be used by all its holiday park members. The aim of the survey was to provide all the parks with customer feedback, ena-bling them to benchmark their performance against other parks and to improve their own levels of customer service. The Research Box used Snap survey software (www.snapsurveys.com) to set up a system to host and collect responses from a single survey, but one that was personalised to the individual circumstances at over 2,000 parks. Questions asked were dependent on the accommodation type and facilities available. Each park had its own unique web link to its version of the survey questionnaire. Customers were invited to fill out the survey online, or to complete a paper version that the park then manually entered onto the system. The system was capable of collecting more than 100,000 survey responses a year. If any unfavourable comments were received, they were emailed directly to the

272 Marketing Research
Email surveys
Email surveys can be seen as the forerunner to the development of online surveys. Although the main use of email in surveys is to send invitations to complete online surveys, text-based email surveys can be also convenient for participants because they require no facilities or expertise beyond those that they use in their day-to-day email communications. They can be particularly effective on mobile devices. To conduct an email survey, a list of email addresses is first obtained. The survey is written within the body of the email message, which is then sent out over the internet. Participants type the answers to either closed-ended or open-ended questions at designated places, and click ‘reply’. Responses are then data entered and tabu-lated in the manner of a postal survey, or imported with software that interprets the emailed responses and reads the answers directly into a format compatible with the requirements of an analysis package. Email surveys have several limitations, primarily being that they can appear dry and uninteresting.6 Given the advantages of other online survey methods, the popularity of the email survey is waning. The problems of the email survey for certain types of participant are illustrated in the following example.
relevant park the minute they were recorded, to enable it to take appropriate action. Each month, personalised survey reports were automatically produced and emailed direct to each park and stored online for future viewing. The reports contained park-specific analyses in the form of narrative, supported by summary tables, charts and lists of comments. They included benchmark comparisons between that park’s performance and other similar parks, and that park’s performance for the current month versus the equivalent period last year. The accumulated response data from all parks and for all periods are also available for analysis by The Research Box on behalf of BH&HPA. These analyses are used to identify industry trends and to act as supporting material for business or political case building.
Real research Send an email? Err . . . sorry, you seem to have mistaken me for a sad old geezer7
Email is in steady decline as younger people switch to social networking, texting and instant messaging. According to the marketing research company comScore (www.comscore.com), the under 25s are abandoning email. Younger users say that email still has its uses, for receiving their favourite newsletters or when writing formal messages to strangers. As a result, many have taken to more personal forms of communication. The likes of Facebook, Instagram and messaging platforms ensure that people only ever get contacted by people whom they have already accepted as friends. A similar trend is developing worldwide and is likely to continue. ‘It’s an evolution’, said Ian Angell, a Professor of Information Systems at the London School of Economics. ‘This is how faxes have more or less disappeared.’
Given the technical limitations of most email systems, questionnaires cannot utilise pro-grammed skip patterns, logic checks or randomisation. The limited intelligence of ASCII text cannot keep a participant from, say, choosing both ‘yes’ and ‘no’ to a question where only one response is meaningful. Skipping instructions (e.g. ‘If the answer to Question 5 is yes, go to Question 9’) must appear explicitly, just as on paper, as there is no automated rout-ing. These factors can reduce the quality of data from an email survey and can require much post-survey data cleaning.8 There are also problems in locating accurate and current email address lists and, even if these can be located, given spam protection software, there is no guarantee that an email will reach intended participants.

273Chapter 10 Survey and quantitative observation techniques
Online surveys using fixed and mobile devices
Early versions of internet surveys were labelled as CAWI (computer-assisted web inter-views) to follow previous acronyms within the research industry of CATIs (computer-assisted telephone interviews) and CAPIs (computer-assisted personal interviews). The far simpler term ‘online’ is used for all internet surveys hosted on a website. Participants may be recruited online from potential participant databases maintained by either a research agency or a panel management company, or they can be recruited by conventional techniques (tele-phone, face to face or postal). Frequently, participants are not recruited, but those who hap-pen to be visiting a website on which the survey is posted (or other popular websites) are invited to participate in the survey. Either all or every nth web visitor is allowed to partici-pate. Web surveys offer several advantages over email surveys. It is usual to construct but-tons, checkboxes and data entry fields that prevent participants from selecting more than one response where only one is intended, or from otherwise typing where no response is required. Skip patterns can be programmed and performed automatically, as in CATI or CAPI. It is possible to validate responses as they are entered. Additional survey stimuli, such as graphi-cal images and links to other web pages, may be integrated into or around the survey. The visual layout and care taken in designing additional stimuli can do much for participant engagement. This can contribute to a higher-quality experience for participants, encouraging a more committed response.
Researchers are also increasingly conducting online surveys using mobile devices. The smartphone and tablet offer many possibilities as tools that are in nearly every pocket or purse, providing both portability and immediacy for anytime, anywhere data collection. (The use of mobile devices for survey research is discussed in more detail in Chapter 18.)
The following lists summarise the advantages and disadvantages of online surveys.9
Advantages
• Speed. Compared with other survey methods, especially when conducting international research, the time taken to conduct a survey can be reduced to a matter of days rather than weeks. Even if one includes the time taken to contact participants, to establish their will-ingness to take part in a survey, for them to reply, for the survey to be sent, for it to be completed and then emailed back (the procedure adopted to reduce the perception of ‘junk’ email), such a survey can be completed relatively quickly. The only other method that could match its speed would be the telephone survey.
• Cost. Once the electronic questionnaire is designed, it is almost as easy to mail it to 10,000 people as to 10, since there are no printing, stationery and postage costs. Preparing data for analyses needs less manual intervention and can be also much cheaper.
• Quality of response. A range of design features can be used to make the survey more appealing and interesting. Graphics can be used to create visual and moving forms of scal-ing to maintain the interest of participants, but also to put them in a frame of mind that elicits more from them. The following example illustrates how Sony views this advantage.
Real research ‘Surveytainment’10
Many of the methods Sony implemented in its online surveys included what it referred to as ‘surveytainment’. This encapsulated a way of making surveys more emotional, engaging and fun for participants. Surveytainment used eye-catching question types and technology, including audio and video clips, drag-and-drop rankings and collaborative tools. For example, by using a ‘whiteboard’ application participants could show Sony what made an attractive cover by rearranging and altering the images provided.

274 Marketing Research
• Interviewer bias removed. The method maintains the key advantage of postal surveys in being able to present a consistent form of measurement.
• Data quality. Logic and validity checks can be built in, thus allowing the development of more personalised questionnaire designs. In areas where open-ended or ‘other – please state’ responses are required, the participant types in answers ready for analysis.
• Contacting certain target groups. Many participants may be reluctant to complete sur-veys by traditional methods such as postal and face-to-face surveys. Much of this reluc-tance can be attributed to the context of where the survey is administered and how comfortable participants are in these contexts. With the online survey, the participants are largely in control of the context and can respond in circumstances that they feel comfort-able with. In addition, with the growth of access panels where participants sign up to take part in research projects, very precise definitions of participant types can be devised.
Disadvantages
• Sampling frames. There are a growing number of access panels that provide means to access particular types of participant. However, there are still major questions surround-ing their representativeness and the motivations of panel members.11 Email directories exist beyond access panels, but there can be questions about their currency, accuracy and means of classifying different types of target participant. Another sampling issue is that participants who are recruited through browsing or clicking through banner ads or sources such as Facebook are self-selecting and the researcher does not know whether those who choose to take part are really representative of a target population. Being able to general-ise findings to a particular population becomes difficult with a self-selecting sample.
• Access to the web. Though access to the internet has grown enormously, and continues to grow in even remote and poor communities across the globe, the penetration of house-holds and businesses can still vary within countries and across countries. For example, use amongst the over 65s is still limited in many countries. Much depends upon the char-acteristics of the types of participant that are being targeted for a survey. Even if they do have access to the internet, do they have access to the means to engage with the survey in the manner intended by the questionnaire designer?
• Technical problems. Depending upon the hardware and software that participants use, the questionnaire may not work as intended by the designer; this is particularly true with sur-veys that are completed on mobile devices where there are a very wide selection of screen sizes that may require more restraint in the graphic design of such surveys.12
Although more complex, it was also possible for participants to upload their own images or text. The key to making ‘surveytainment’ effective was in ensuring that the techniques increased participant understanding. For example, the more imagery on a screen, the less likely a participant may read any long question text, relying on inference versus the written word. Sony believed that the ideas behind ‘surveytainment’ had a unique impor-tance in the music/entertainment industry as it introduced sound and imagery into questions that would otherwise be static or require participants to rely on recall. Before the aid of the web and digital recordings, song and video testing with large samples was limited and financially impractical. But no longer are tests based upon focus group responses to a CD on a stereo system; there can be thousands of active music enthusi-asts, experiencing and responding to a song or video in their natural music listening habitat – online, and in their home, offices or anywhere!

275Chapter 10 Survey and quantitative observation techniques
Telephone surveys
As stated earlier, telephone surveys may be categorised as traditional or computer-assisted. As the use of internet surveys increases, telephone surveys have declined.
Traditional telephone surveys
Traditional telephone surveys involve phoning a sample of participants and asking them a series of questions, using a paper questionnaire to record the responses. From a central loca-tion, a wide geographical area can be covered, including international markets. Given that telephone interviewers cannot give participants any visual prompts, they have to write down answers to any open-ended questions and may have to flick through the questionnaire to find appropriate questions for a particular participant (filtering). These surveys tend to be short in duration and have questions with few options as possible answers. Today, this approach is rarely used in commercial marketing research, the more common approach being CATI.
Computer-assisted telephone interviews (CATIs)
CATI uses a computerised questionnaire administered to participants over the telephone with a questionnaire on a networked computer or a PC. The interviewer sits in front of a terminal and wears a small headset. The terminal replaces a paper questionnaire, and the headset substitutes for a telephone. Upon command, the computer dials the telephone num-ber to be called. When contact is made, the interviewer reads questions posed on the screen and records the participant’s answers directly to the computer, ready for immediate analysis. The main benefit of CATI is the speed of collecting data and analyses. Speed is of the essence in subjects where participant attitudes and behaviour can change quickly, an example being the ‘latest’ toys that parents may wish to buy for their children. One of the most widespread uses of CATI is for political opinion polls.
With CATI, the computer systematically guides the interviewer. Only one question at a time appears on the screen. The computer checks the responses for appropriateness and con-sistency. It uses the responses as they are obtained to personalise the questionnaire. Data collection flows naturally and smoothly. Interviewing time is reduced, data quality is enhanced and the laborious steps in the data-collection process, coding questionnaires and entering data into the computer, are eliminated. Because the responses are entered directly into the computer, interim and update reports on data collection or results can be provided almost instantaneously.
The biggest drawback of CATI lies in participants’ willingness to be interviewed by tel-ephone. In many countries the percentage of people who only have a mobile device is now greater than those who have a landline. In some countries the segment of the population that used only a mobile phone was dominant as far back as 2007, and in developing markets this trend is likely to only be more pronounced.13
There are many factors that make it very difficult to conduct telephone surveys. At times, the technique may be confused in the minds of participants with cold-call selling techniques. To overcome this problem requires interviewers who are trained to reassure participants and to make the interviewing experience worthwhile. In most businesses, phone calls are screened; how else could managers avoid calls from companies and individuals they do not want to talk to? Many businesses have set up formal procedures to minimise unnecessary calls to management. This is a hurdle that well-trained inter-viewers are taught to circumvent. Experienced interviewers can ‘run the gauntlet’ of three or four screenings and still secure an interview without in any way upsetting the interviewee.14

276 Marketing Research
Home or workplace surveys
In face-to-face home or workplace surveys, participants are interviewed face to face in their ‘personal space’. The interviewer’s task is to contact the participants, ask the questions and record the responses. In recent years, the use of face-to-face home and workplace surveys has declined due to their high cost. However, there are many situations where they are used because of the reassurances of quality of the interview process, the comfort of the context felt by certain participants and the nature of the questions that are being administered. The follow-ing example illustrates such a case where it was paramount to use a face-to-face home survey.
Face-to-face surveys
Face-to-face surveying methods may be categorised as home, workplace, street or computer-assisted. As a proportion of global spend on marketing research techniques, face-to-face surveys are in decline, one of the main reasons being the costs involved, as illustrated in the following example.
Real research European Social Survey15
The European Social Survey (ESS) (www.europeansocialsurvey.org) is an attitude survey time series carried out in over 30 countries across Europe. The survey began in 2001 and fieldwork is carried out from September to December every two years. The question-naire consists of two parts: a core section that is repeated every round, and two rotating modules that are repeated less frequently. The core modules include subjects such as media consumption, political and social trust, religious identification and socio-demographic background data, while the rotating modules each cover a substantive topic in more detail. Rotating modules so far have covered topics such as well-being, work–life balance, ageing, welfare attitudes, immigration and citizenship. To help ensure equivalence of outputs, the hour-long survey interview is conducted face to face in all countries. This mode was initially chosen not only because it tends to get the highest response rates and is the only mode that offers complete coverage in all countries, but also because the ESS questionnaire is particularly well suited to face-to-face interviews. In particular, it involves a long interview, many showcards and some complex routing. It is, however, becoming clear that using face-to-face interviewing as the sole mode of data collection might now need to be reconsidered in view of its rising cost and dimin-ishing response rates. In addition, different countries have different experiences and expertise as well as different penetration of data-collection modes, which means they may be better equipped to use a different mode.
Real research PARC: 360-degree view of the consumer16
The Pan Arab Research Centre (PARC) (http://arabresearch.iniquus.com/) conducts an ongoing, comprehensive study of the Arab Republic of Egypt. The scope of the survey covers product and brand usage, media exposure, lifestyle and attitudes, daily activities, shopping behaviour and leisure activities. Fieldwork is conducted across different sea-sons of the year and consists of approximately 5,000 interviews. Two different methods are used to question participants: first, a home interview is used to collect demographics

277Chapter 10 Survey and quantitative observation techniques
As well as using face-to-face surveys for ad hoc studies, they are also widely used by syndicated firms for omnibus surveys, as illustrated in the following example.
and data related to media exposure (including magazines, newspapers, radio, TV and internet). Second, at the end of the interview, fieldworkers leave behind a self-completion questionnaire covering personal and household usage of more than 400 product categories and services and 5,000 brands, as well as attitude and lifestyle state-ments. A wide range of techniques have been used to elicit the full cooperation of par-ticipants. Listed households were informed by mail that they would be contacted by an interviewer. Up to six separate attempts were made to contact difficult-to-reach partici-pants. Households presenting language barriers were reassigned to specifically qualified interviewers, as were refusals and other unusual cases.
Real research Millward Brown Ulster omnibus survey17
The omnibus survey is a cost-effective means of measuring and tracking consumer awareness, behaviour and attitudes. Each omnibus survey incorporates a range of top-ics. The costs for each survey are directly shared between clients in proportion to the number of questions each decides to include. However, the questions included and the ensuing results are exclusive to each client, with each section treated completely confi-dentially. The Ulster omnibus survey is based upon a nationally and regionally repre-sentative sample of 1,000 adults aged 16 or over, in Northern Ireland. It is conducted twice monthly by personal surveys conducted in-home. The omnibus survey delivers extensive background information on the participants and their household. This covers standard demographics of gender, age, socio-economic group, ethnicity, working sta-tus, marital status, household size, presence and age of children in the household, reli-gion, mobility and tenure, through to issues such as internet access. All of this information is available, either for targeting questions or for cross-analysis, to deter-mine any significant differences in responses by segments. Applications of the Ulster omnibus survey include:
• Advertising. The majority of Northern Ireland’s high-profile advertising campaigns have used this omnibus to benchmark attitudes pre-campaign and track them post-campaign to measure advertising effectiveness.
• Charities. The methodology has been used by many charities to measure awareness, behaviour and attitudes towards specific organisations, their messages and donation giving.
• Health. Changing attitudes and behaviour in the area of personal health and activity have been routinely assessed using the omnibus survey. Some aspects of behaviours that have been monitored include issues such as smoking, drinking, healthy eating, recreational drug use and physical activity.
Face-to-face surveys are used extensively in business-to-business research for participant subjects who cannot be effectively interviewed by telephone or post. Managers being inter-viewed have the comfort and security of their office and can control the timing and pace of the interview. For the researcher, the big benefit of meeting managers in their office is the ability to build up a rapport, probe and gain the full attention of the manager.

278 Marketing Research
Street surveys
For street surveys, participants are intercepted while they are shopping in city centres or shopping centres. They may be questioned there and then in the street, or taken to a specific test facility. In the testing of new product formulations, test facilities are ideal to allow par-ticipants the time and context to sample and evaluate products. The technique can also be used to test merchandising ideas, advertisements and other forms of marketing communica-tions. The big advantage of the street survey is that it is more efficient for the participant to come to the interviewer than for the interviewer to go to the participant.18
Computer-assisted personal interviews (CAPIs)
In CAPI, a computer partially replaces the interviewer. There are several user-friendly soft-ware packages that design easy-to-use surveys with help screens and understandable instruc-tions. The use of colour, graphical images and on- and off-screen stimuli can all contribute to making the interview process both interesting and stimulating. This method has been classi-fied as a face-to-face survey technique because an interviewer is usually present to guide the participant as needed. CAPI has been used to collect data at test facilities from street surveys, product clinics, conferences and trade shows. It can be used in a kiosk format at locations such as museums or heritage sites to conduct visitor surveys. It may also be used for home or workplace surveys. The following example illustrates an application of CAPI where many visual aspects of football sponsorship could be displayed for questioning.
Real research Brands fall short of their goal19
Major consumer brands use a plethora of sports sponsorship platforms, from players to stadiums, to communicate with a global con-sumer market and gain international exposure and recognition. Sporting events are an effec-tive vehicle to gain access to a swathe of potential customers yet, according to the CAPI study conducted by TNS Sport, young people and children have a greater awareness than adults of those brands that sponsor leading football clubs. Its research among people who watch football on TV revealed that spontaneous recall of brands by adults (aged over 16) across a range of sponsors was generally less than that of children (aged 10–19).
A major development for marketers, especially in financial services, has been the use of customer satisfaction surveys to guide strategic and operational decisions. With traditional survey techniques, the interviewer may have to carry a huge questionnaire to cope with ques-tions that measure attitudes to a range of banks and a range of services taken from those banks. With CAPI, when a particular bank is chosen, particular questions may be filtered out, and choosing a particular service from that bank can filter out further questions. Questions specific to the participant may then be asked, making the interview process far more efficient.
Postal surveys
In the postal survey, questionnaires are mailed to preselected potential participants. As with other forms of ‘offline’ market research, postal surveys have sharply declined in use. A typi-cal mailed package consists of the outgoing envelope, cover letter, questionnaire, return

279Chapter 10 Survey and quantitative observation techniques
envelope and possibly an incentive. The participants complete and return the questionnaires. There is no verbal interaction between the researcher and the participant in the survey pro-cess.20 There may be an initial contact with potential participants, to establish the correct person to send the questionnaire to, and to motivate them before they receive the survey. Before data collection can begin, a sampling frame needs to be compiled so that potential participants can be identified. Therefore, an initial task is to obtain a valid mailing list. Mail-ing lists can be compiled from telephone directories, customer databases or association membership databases, or can be purchased from publication subscription lists or commer-cial mailing list companies.21 Regardless of its source, a mailing list should be current and closely related to the population of interest. (Chapters 13 and 14 will detail the full question-naire design and sampling implications of this approach.) With an understanding of charac-teristics of target participants and what will motivate them to respond honestly, as fully and as quickly as possible, the researcher must also make decisions about the various elements of the postal survey package (see Table 10.1).
Table 10.1
Outgoing envelope
Method of addressing; envelope size; colour; postage
Covering letter Personalisation; sponsorship; type of appeal; signature
Questionnaire Size, length and content; colour and layout; format and reproduction; participant anonymity
Instructions As part of covering letter; a separate sheet; alongside individual questions
Return envelope Whether to include one; type of envelope; postage
Incentives Feedback of findings; monetary v. non-monetary; prepaid v. promised amount
Some decisions related to the postal survey package
A comparative evaluation of survey methods
Not all survey techniques are appropriate in a given situation. Therefore, the researcher should conduct a comparative evaluation to determine which techniques are appropriate. Table 10.2 compares the different survey techniques through a range of criteria. For any particular research project, the relative importance attached to these criteria will vary. These factors may be broadly classified as task, situational and participant factors. Task factors relate to tasks that have to be performed to collect the data and to the topic of the survey. These factors consist of flexibility of data collection, diversity of questions, use of physical stimuli, sample control, quantity of data and response rate. The situational factors comprise control of the data-collection environment, control of field force, potential for interviewer bias, potential to probe participants, potential to build rapport, speed and cost. The partici-pant factors relate to perceived participant anonymity, social desirability, obtaining sensitive information, low incidence rate and participant control. We discuss in detail an evaluation of the different survey methods on each of these factors.
Task factors
The demand that the survey task places upon participants and the data-collection process influences the survey method that should be used.

280 Marketing Research
Flexibility of data collection
The flexibility of data collection is determined primarily by the extent to which the partici-pant can interact with the interviewer and the survey questionnaire. The face-to-face survey, whether conducted as a home, workplace or street survey, affords a very high flexibility of the form of data collection. Because the participant and the interviewer meet face to face, the interviewer can administer complex questionnaires, explain and clarify difficult questions and even use unstructured techniques.
By contrast, the traditional telephone survey allows only moderate flexibility because it is more difficult to use unstructured techniques, ask complex questions, or obtain in-depth answers to open-ended questions over the telephone. CATI and CAPI and online surveys allow somewhat greater flexibility because the researcher can use various question formats, can personalise the questionnaire and can handle complex skip or filter patterns (directions for skipping questions in the questionnaire based on the subject’s responses). One benefit of the online survey is the ease with which a survey may be modified. For example, early data returns may suggest additional questions that should be asked. Changing or adding questions as the need becomes apparent would be almost impossible with a postal survey, possible but difficult with face-to-face or telephone surveys, but achievable in a matter of minutes with some online surveys.
Diversity of questions
The diversity of questions that can be asked in a survey depends on the degree of interaction that the participant has with the interviewer and the questionnaire, as well as the participant’s ability actually to see the questions. A variety of questions can be asked in a face-to-face survey because the participant can see the questionnaire and the interviewer is present to clarify ambiguities. Thus, home and office surveys, street interviews and CAPI allow for diversity. In online surveys, multimedia capabilities can be utilised and so the ability to ask a diverse set of questions is moderate to high, despite the absence of an interviewer. In postal surveys and email surveys, less diversity is possible. In traditional telephone surveys and CATI, the participant cannot see the questions while answering, and this limits the diversity of questions. For example, in a telephone survey or CATI, it would be very difficult to ask participants to rank 15 TV programmes in terms of preference.
Use of physical stimuli
Often it is helpful or necessary to use physical stimuli such as products, product prototypes, commercials or promotional displays during an interview. For the most basic example, a taste test involves tasting a product and answering questions that evaluate the taste. In other cases, photographs, maps or other audio/visual cues are helpful. In these cases, face-to-face surveys conducted at central locations (guided through street surveys and CAPI) are prefer-able to home surveys. In the central location, many intricate visual stimuli can be set up prior to the actual interview. Postal surveys are moderate on this dimension, because sometimes it is possible to mail the facilitating aids or even product samples. Online surveys are also mod-erately suitable, because the questionnaires can include multimedia elements such as proto-type web pages and advertisements. The use of physical stimuli is limited in traditional telephone surveys and CATIs, as well as in email surveys (depending upon the participant’s ability to open attachments).
Sample control
Sample control is the ability of the survey mode to reach participants specified in the sample effectively and efficiently.22 At least in principle, home and workplace face-to-face surveys offer the best sample control. It is possible to control which sampling units or participants are interviewed, who is interviewed, the degree of participation of other members of the
Sample controlThe ability of the survey mode to reach the units specified in the sample effectively and efficiently.

281Chapter 10 Survey and quantitative observation techniques
household and many other aspects of data collection. In practice, to achieve a high degree of control, the researcher has to overcome several problems. It is difficult to find participants at home during the day because many people work outside the home. Also, for safety reasons, interviewers are reluctant to venture into certain neighbourhoods and people have become cautious of responding to strangers at their door. Street surveys allow only a moderate degree of sample control. Although the interviewer has control over which participants to intercept, the choice is limited to individuals who are walking down a street or through a shopping centre, and frequent shoppers have a greater probability of being included. Also, potential participants can intentionally avoid or initiate contact with the interviewer. Compared with street surveys, CAPI offers slightly better control, as sampling quotas can be set and partici-pants randomised automatically.
Moderate to high sampling control can be achieved with traditional telephone surveys and CATIs. Telephones offer access to geographically dispersed participants and hard-to-reach areas. These procedures depend upon a sampling frame – a list of population units with
Sampling frameA representation of the elements of the target population that consists of a list or set of directions for identifying the target population.
Table 10.2
Email Online Telephone CATI
Home and workplace
Street surveys
CAPI Postal
Flexibility of data collection * **** **** ***** ***** **** *
Diversity of questions *** **** * ***** ***** ***** ***
Use of physical stimuli * *** * **** ***** ***** ***
Sample control * ** **** **** **** *** *
Quantity of data *** **** ** *** *** *** **
Response rate * ** *** ***** **** ***** *
Control of data-collection environment
* * *** **** ***** ***** *
Control of field force ***** ***** *** * *** *** *****
Potential for interviewer bias None None *** ***** ***** * None
Potential to probe participants * * * ***** *** *** *
Potential to build rapport * * *** ***** **** **** *
Speed ***** ***** ***** **** *** **** *
Low cost ***** ***** *** * ** ** ****
Perceived participant anonymity *** ***** *** * * * *****
Social desirability ***** ***** *** ** * **** *****
Obtaining sensitive information *** *** * ***** * *** ***
Low incidence rate *** ***** ***** * * * ***
Participant control ***** **** ** * * * *****
(key: low = *, moderate to low = **, moderate = ***, moderate to high = ****, high = *****)
A comparative evaluation of survey techniques

282 Marketing Research
their telephone numbers.23 The sampling frames normally used are telephone directories, but telephone directories are limited in that:
(1) not everyone has a phone or even a ‘conventional’ phone, while some individu-als have several phone numbers partly due to the growing use of mobile phones with rapidly changing numbers;24 (2) the growth in number portability, which allows people to transfer their landline telephone number to a mobile phone and to move to any geographical area of the country;25 (3) some individuals have unlisted phones or are ex-directory and directories do not reflect new phones in service or recently disconnected phones; and (4) some individuals no longer use landlines, relying solely or using their mobile phone.
Online and postal surveys require a list of addresses of individuals or households eligible for inclusion in the sample. This requirement has underpinned the growth of access panels across the globe. These surveys can reach geographically dispersed participants and hard-to-reach areas. Without the use of access panels, mailing lists are sometimes unavailable, out-dated or incomplete, especially for electronic addresses. Another factor outside the researcher’s control is whether the questionnaire is answered and who answers it. Some subjects refuse to respond because of lack of interest or motivation; others cannot respond because they are illiterate.26 Given these reasons, the degree of sample control in online and postal surveys without the use of access panels tends to be low.27
The use of access panels provides moderate to high control over the sample. They can provide samples matched to national census statistics on key demographic variables. It is also possible to identify specific user groups within a panel and to direct the survey to house-holds with specific characteristics. Specific members of households in the panel can be ques-tioned. Finally, low-incidence groups, groups that occur infrequently in the population, can be reached with panels, but there is a question of the extent to which a panel can be consid-ered representative of an entire population.
Not all populations are candidates for online survey research. Although participants can be screened to meet qualifying criteria and quotas imposed, the ability to meet quotas is lim-ited by the number and characteristics of participants who may visit a website. However, there are some exceptions to this broad statement. For example, computer-product purchas-ers and users of internet services are ideal populations. Business and professional users of internet services are also an excellent population to reach with online surveys. Sample con-trol is low to moderate for online surveys, while email surveys suffer from many of the limi-tations of postal surveys and thus offer low sample control.
Quantity of data
Home and workplace face-to-face surveys allow the researcher to collect relatively large amounts of data. The social relationship between the interviewer and the participant, as well as the home or office environment, can motivate the participant to spend more time in the interview. Less effort is required of the participant in a face-to-face survey than in a tele-phone or postal survey. The interviewer records answers to open-ended questions and pro-vides visual aids to help with lengthy and complex scales. Some face-to-face surveys last for as long as 75 minutes. In contrast to home and workplace surveys, street surveys and CAPIs provide only moderate amounts of data. Because these surveys are conducted in shopping centres and other central locations, a participant’s time is more limited. Typically, the inter-view time is 20 minutes or less.
Postal surveys also yield moderate amounts of data. Fairly long questionnaires can be used because short questionnaires do not necessarily generate higher response rates than long ones. The same is true for email and online surveys, although online is a better medium in this respect.
Traditional telephone surveys, CATIs and surveys conducted using mobile devices result in limited quantities of data. They tend to be shorter than other surveys because participants

283Chapter 10 Survey and quantitative observation techniques
can easily terminate the telephone conversation or engagement at their own discretion. These interviews commonly last about 15 minutes and could be shorter in the case of mobile devices. Longer interviews may be conducted when the subject matter and the questioning tasks set are of interest to the participants.28
Response rate
Survey response rate is broadly defined as the percentage of the total attempted interviews that are completed. Concerns over declining response rates have been a characteristic of market research over the last two decades. Paradoxically, one of the reasons why traditional face-to-face techniques remain in use is that they can achieve response rates that are not pos-sible with online surveys. Face-to-face, home and workplace, street and CAPI surveys yield the highest response rates (typically between 40 and 80%), though the actual response rate for any survey will vary hugely depending on the context of the survey, the country and demographics and any incentives (monetary or psychological) for taking part in the survey.
Telephone surveys, traditional and CATI, can yield response rates between 40 and 50%. These modes also suffer from not-at-homes or no-answers. In a study involving qualitative interviews and a census of all Australian telephone market research providers, it was reported that about half of all placed telephone calls go unanswered; refusals can outnumber inter-views by up to six to one. Three call-backs per survey were built into the research design in most companies but, surprisingly, in some cases there were none, despite research that shows that call-backs can increase response rates by up to 76%.29
Response rateThe percentage of the total attempted interviews that are completed.
Real research Where participants are particularly reluctant to give their opinions30
Non-response is a common problem in most countries, but Germany had a particularly bad reputation when it came to ‘closed doors’. A manager, responsible for supplier man-agement at a domestic products company, worked with most global agencies in Germany for quantitative research. For products in baby care, for example, it proved very cumbersome to find out German opinion: ‘Door to door was virtually impossible, due also to the fact that there are a lot of apartment blocks. Telephone research was very difficult too, Germans were very careful before answering.’ John Attfield of RMM Mar-keting Research International worked in England before his 11-year stint in Germany. The differences in response he observed were dramatic. He took extra care in designing questionnaires, for instance:
One cannot approach Germans with the same introductory texts as in, for instance, the US. In the US the assumption is made that the participant was going to enjoy the survey. But in Germany people thought it was a pain.
Postal surveys have the poorest response rate. In a postal survey of randomly selected participants, without any pre- or post-mailing contact, response rates can be less than 15% – sometimes much less. Such low response rates can lead to serious bias (non-response bias). This is because whether a person responds to a postal survey is related to how well the ben-efits of taking part in the survey are meaningful to the person and are clearly communicated to them. The magnitude of non-response bias increases as the response rate decreases.
Online surveys can have very poor response rates – very frequently under 10% – though much will depend upon how comprehensive and current the sampling frame is. With a well-constructed sampling frame that is relevant to the survey topic, online survey response
Non-response biasBias caused when actual participants differ from those who refuse to participate.

284 Marketing Research
rates can be relatively high. This challenge is where the access panel has helped to improve online response rates. With a good relationship between panel participants and the panel owner, and well-chosen incentives to take part in online surveys, response rates can be greatly improved.
A comprehensive though dated review of the literature covering 497 response rates in 93 journal articles found weighted average response rates of 81.7%, 72.3% and 47.3% for, respectively, face-to-face, telephone and postal surveys.31 However, response rates have decreased in recent times and many current researchers would be delighted with such high response rates.32 The same review also found that response rates increase with the following:
• Either prepaid or promised monetary incentives.
• An increase in the amount of monetary incentive.
• Non-monetary premiums and rewards (pens, pencils, books).
• Preliminary notification.
• Foot-in-the-door techniques. These are multiple-request strategies. The first request is relatively small, and all or most people agree to comply. The small request is followed by a larger request, called the critical request, which is actually the target behaviour being researched.
• Personalisation.
• Follow-up letters.
(A further discussion of improving response rates is given in Chapter 15.)
Situational factors
In any practical situation, the researcher has to balance the need to collect accurate and high-quality data with the budget and time constraints. The situational factors that are important include control of the data-collection environment, control of field force, potential for inter-viewer bias, potential to probe participants, potential to build rapport, speed and cost.
Control of the data-collection environment
The context in which a questionnaire is completed can affect the way that a participant answers questions. An example of this would be the amount of distraction from other people around, noise and temperature. The degree of control a researcher has over the context or environment in which the participant answers the questionnaire differentiates the various survey modes. Face-to-face surveys conducted at central locations (from street surveys and CAPIs) offer the greatest degree of environmental control. For example, the researcher can set up a special facility for demonstrating a product upon which a survey is based. Home and workplace face-to-face surveys offer moderate to high control because the interviewer is present. Traditional telephone surveys and CATIs offer moderate control. The interviewer cannot see the environment in which the interview is being conducted, but can sense the background conditions and encourage the participant to be attentive and involved. In postal surveys, email and online surveys, the researcher has little or no control over the environ-ment. In the case of mobile online surveys, the questionnaire can be completed anywhere with the result that there is little or no consistency in the context in which the survey is com-pleted. However, this ability for the participant to have control over the context may be instrumental in their fully engaging in the survey.
Control of field force
The field force consists of interviewers and supervisors involved in data collection. Because they require no such personnel, postal surveys, email and online surveys eliminate field force problems. Traditional telephone surveys, CATIs, street surveys and CAPIs all offer
Critical requestThe target behaviour being researched.
Field forceBoth the actual interviewers and the supervisors involved in data collection.

285Chapter 10 Survey and quantitative observation techniques
moderate degrees of control because the interviews are conducted at a central location, mak-ing supervision relatively simple. Home and workplace face-to-face surveys are problematic in this respect. Because many interviewers work in many different locations, continual supervision is impractical.33
Potential for interviewer bias
An interviewer can bias the results of a survey by the manner in which the interviewer:
• Selects participants (e.g. interviewing a male aged 34 when required to interview a male aged between 36 and 45).
• Asks research questions (omitting questions).
• Poses questions in another way when participants do not understand the question as pre-sented on the questionnaire.
• Probes (e.g. by offering examples to encourage participants).
• Records answers (recording an answer incorrectly or incompletely).
The extent of the interviewer’s role determines the potential for bias.34 Home, workplace and street face-to-face surveys are highly susceptible to interviewer bias. Traditional tele-phone surveys and CATIs are less susceptible, although the potential is still there: for exam-ple, with inflection and tone of voice, interviewers can convey their own attitudes and thereby suggest answers. CAPIs have a low potential for bias. Postal surveys, email and online surveys are free of it.
Potential to probe participants
Although the interviewer has the potential to create bias in the responses elicited from par-ticipants, it is balanced somewhat by the amount of probing that can be done. For example, a survey may ask participants which brands of beer they have seen advertised on TV over the past month. A list of brands could be presented to participants and they could simply look at the list and call out the names. What may be important in the survey is what brands they could remember. There may be a first response, of a brand that could be remembered unaided. A simple probe such as ‘any others?’ or ‘any involving sports personalities?’ could be recorded as a second response.
Much deeper prompts and probes can be conducted, within limits. The intention is not to turn the structured interview into a qualitative interview but, for example, some of the reasons why a participant has chosen a brand may be revealed. Home, workplace and street face-to-face surveys have great potential for probing participants. Traditional telephone surveys and CATIs can also probe but not to the same extent as being face to face. CAPIs have limited potential to probe, though particular routines can be built into a survey to ask for further details. Postal surveys, email and online surveys have very limited means to probe participants.
Potential to build rapport
Another counter to the bias in the responses elicited from participants by face-to-face sur-veys is the amount of rapport that can be built up with participants. Rapport may be vital to communicate why the survey is being conducted, with a corresponding rationale for the participant to spend time answering the questions. Beyond motivating participants to take part in a survey is the need for the participant to answer truthfully, to reflect upon the ques-tions properly and not to rush through the questionnaire. Building up a good rapport with participants can be vital to gain a full and honest response to a survey.
Home, workplace and street face-to-face surveys have great potential to build up rapport with participants. Traditional telephone surveys and CATIs can also develop rapport but not to the same extent as being face to face. CAPI has limited potential to build up rapport

286 Marketing Research
through particular graphics and messages that can be built into a survey. Postal surveys, email and online surveys have very limited means to build up a rapport with participants. This challenge is where the access panel has helped to improve the online experience. With a good relationship between panel participants and the panel owner, and well-chosen incen-tives to take part in online surveys, rapport can be developed.
Speed
First, there is the speed with which a questionnaire can be created, distributed to participants and the data returned. Because printing, mailing and data-keying delays are eliminated, data can be in hand within hours of writing an online or telephone questionnaire. Data are obtained in electronic form, so statistical analysis software can be programmed to process standard questionnaires and return statistical summaries and charts automatically. Thus, online sur-veys can be an extremely fast method of obtaining data from a large number of participants. The email survey is also fast, although slower than the online survey, since more time is needed to compile an email list and data entry is also required.
Traditional telephone surveys and CATIs are also fast means of obtaining information. When a central telephone facility is used, several hundred telephone interviews can be done per day. Data for even large national surveys can be collected in a matter of days, or even within a day. Next in speed are street and CAPI surveys that reach potential participants in central locations. Home face-to-face surveys are slower because there is dead time between interviews while the interviewer travels to the next participant. To expedite data collection, interviews can be conducted in different markets or regions simultaneously. Postal surveys are typically the slowest. It usually takes several weeks to receive completed questionnaires; follow-up mailings to boost response rates take even longer.
Low cost
For large samples, the cost of online surveys is the lowest. Printing, mailing, keying and interviewer costs are eliminated, and the incremental costs per participant are typically low, so studies with large numbers of participants can be done at substantial savings compared with postal, telephone or face-to-face surveys. Face-to-face surveys tend to be the most expensive mode of data collection per completed response, whereas postal surveys tend to be the least expensive. In general, the cost increases from online to email, postal, traditional telephone, CATI, CAPI, street and, finally, face-to-face home and workplace surveys. This is a reflection of the progressively larger field staff and greater supervision and control. Relative costs, however, depend on the subject of enquiry and the procedures adopted.35
Participant factors
Since surveys are generally targeted at specific participant groups, participant characteristics have to be considered when selecting a survey method. The participant factors that are important include perceived participant anonymity, social desirability, obtaining sensitive information, low incidence rate and participant control.
Perceived participant anonymity
Perceived participant anonymity refers to the participants’ perceptions that their identities will not be discerned by the interviewer or the researcher. Perceived anonymity of the par-ticipant is high in postal surveys and online surveys because there is no contact with an interviewer while responding. It is low in face-to-face surveys (home, street and CAPI) due to face-to-face contact with the interviewer. Traditional telephone surveys and CATIs fall in the middle. It is also moderate with email; while there is no contact with the interviewer, participants know that their names can be located on the return email.
Perceived participant anonymityThe participants’ perceptions that their identities will not be discerned by the interviewer or researcher.

287Chapter 10 Survey and quantitative observation techniques
Social desirability
Social desirability is the tendency of participants to give answers that they feel to be accept-able in front of others, including interviewers. When participants are questioned face to face by an interviewer, they may give an answer that they feel to be ‘acceptable’ rather than how they really feel or behave. Because postal and online surveys do not involve any social inter-action between the interviewer and participant, they are least susceptible to social desirabil-ity. Traditional telephone surveys and CATIs are moderately good at handling socially desirable responses, as there is an amount of anonymity afforded by not meeting face to face. The weakest techniques are face-to-face surveys, though in the case of home and workplace surveys the chance to build up a rapport with participants may nurture them to reveal how they really feel.36 The best techniques to avoid participants distorting their views are those where face-to-face contact is avoided; this is the case in postal surveys.
Obtaining sensitive information
Sensitive information may mean an issue that is personally sensitive, such as the way in which a participant may be classified or the use of hygiene products. What may be deemed ‘sensitive’ varies enormously between different types of participant. For some participants, asking questions about the type and amount of household cleaning products may be seen as revealing characteris-tics of their personal cleanliness; they see it as a sensitive issue and would need a lot of reassur-ance before revealing the truth. Many classification questions in a survey, such as the participant’s age, gender, educational or income level, can also be seen as highly sensitive. In business research, characteristics of an organisation’s activities may be seen as commercially sensitive.
In some situations, the interviewer plays a very important role in explaining to participants why they are being asked such a question and that their views will be handled in a confiden-tial and proper manner. Home and workplace surveys allow the time and context to build up such explanations and reassure participants. Interviews conducted in this way may be seen as the best means to handle certain sensitive topics. For some issues, participants may not wish to face any interviewer and would like to complete the survey alone. CAPI can be set up so that the interviewer introduces the participant to a terminal and then leaves the participant to get on with the on-screen interview.37 Postal and online surveys can be seen as moderately successful in handling sensitive questions. Their success depends upon how well the purpose of sensitive questions is introduced. Handled correctly, participants can take their time to answer questions without any embarrassing contact. For telephone and street surveys, the interviewer can reassure the participant about the questions being asked, but may not have the time and context really to relax participants and overcome any embarrassment.
Perceived anonymity, social desirability and obtaining sensitive information are interre-lated criteria. With some exceptions, social desirability is the mirror image of perceived anonymity. When perceived anonymity is high, social desirability is low and vice versa. With some exceptions, obtaining sensitive information is directly related to perceptions of anonymity. Participants are more willing to give sensitive information when they perceive that their responses will be anonymous.
Low incidence rate
Incidence rate refers to the rate of occurrence or the percentage of persons eligible to par-ticipate in the study. Incidence rate determines how many contacts need to be screened for a given sample-size requirement (as will be discussed in more detail in Chapter 15). There are times when the researcher is faced with a situation where the incidence rate of survey partici-pants is low. This is generally the case when the ‘population’ represents a niche or a highly targeted market. Suppose a study was focused upon buyers of new sports cars, specifically to measure and understand the characteristics of consumers who aspire to own and could afford a new Audi R8.38 The incidence of such potential consumers in the wider population would be very low. A lot of wasted effort would be exerted if the ‘general population’ were to be
Social desirabilityThe tendency of participants to give answers that may not be accurate but may be desirable from a social standpoint.
Incidence rateIncidence rate refers to the rate of occurrence or the percentage of persons eligible to participate in a study.

288 Marketing Research
sampled for a survey. In such cases, a survey method should be selected that can locate qualified participants efficiently and minimise waste. The access panel, which can profile potential participants in some detail, offers great benefits in understanding incidence. The telephone survey can be very effective as a method of screening potential participants to determine eligibility; all it takes is a phone call. Face-to-face methods are all inefficient because the interviewer has to make personal contact with potential participants. Postal sur-veys and email are moderate in terms of efficiency as they are relatively low cost and can be used to contact a large number of potential participants, so the desired sample size of quali-fied participants is obtained. Online, however, is very good in this respect, as screening ques-tions can be used to weed out ineligible participants quickly and efficiently.
Participant control
Methods that allow participant control over the interviewing process can solicit greater co operation and engagement. Two aspects of control are particularly important to participants. The first is control over when to answer the survey, and the flexibility to answer it in parts at different times, and even via different modes. The second aspect of control pertains to the ability of the participants to regulate the rate or pace at which they answer the survey. Postal surveys and email are the best in giving this control to participants. Some control is lost in online surveys because in random pop-up surveys participants do not have the flexibility of answering at a later time. However, online surveys can be designed to allow participants to come back and complete them. The pace of telephone surveys is regulated by the interviewer and although the telephone call can be rescheduled, the participant must commit to a specific time. With face-to-face methods, the pace is regulated by the interviewer and generally the interview cannot be rescheduled. The main exception in face-to-face methods may lie with workplace surveys, as accessing business participants may be driven by their timetables.
Table 10.3
Method Advantages/disadvantages Comment
Completely automated telephone survey (CATS)
Same as CATI Useful for short, in-bound surveys initiated by participant
Central-location interview Same as street survey Examples include new product tests, advertising tests, trade shows, conferences
Kiosk-based computer interview
Same as CAPI Useful in museum, heritage and exhibition sites
Drop-off survey Same as postal survey, except higher cost and higher response rate
Useful for local market surveys
Additional survey methods
Other survey methods
We have covered the basic survey methods. Other survey methods are also used, which are variations of these basic methods. The more popular of these other methods are described in Table 10.3.

289Chapter 10 Survey and quantitative observation techniques
Mixed-mode surveys
As is evident from Table 10.2 and the preceding discussion, no survey method is supe-rior in all situations. Depending on such factors as information requirements, budgetary constraints (time and money) and participant characteristics, none, one, two or even all techniques may be appropriate.39 Remember that the various data collection modes are not mutually exclusive, but can be employed in a complementary fashion to build on each other’s strengths and compensate for each other’s weaknesses. The researcher can employ these techniques in combination and develop creative twists within each tech-nique. With the growth in the use of email and the internet as a means of communica-tion, online methods have become the most feasible and popular means of conducting surveys. Where online methods are not appropriate for particular types of participant, a choice can be made by individual participants to select the survey method that they pre-fer. Most survey analysis packages that include the function of questionnaire design have the ability to formulate the questionnaire into all survey method formats. Mixed-mode designs are increasingly being used for multi-country studies. Depending on the mix of countries being surveyed, face-to-face, CATI or online methods may be employed, with online being the preferred choice for the majority of countries with relatively high internet penetration. Single-mode within-country and mixed-mode between-country methods may be the most common mixed-mode designs in marketing research.40 Mixed-mode research offers one of the most serious ways to tackle falling response rates. The key features of making mixed-mode research work are:41
• Common questions across all modes.
• Different templates applied to different modes to ensure that each looks appropriate.
• Mode-specific text alternatives in addition to support for foreign-language translations.
• A single database for all survey data, updated in real time.
• The ability to determine the mode of initial contact from the sample.
• Easy switching of any interview from one mode to another.
• Automatic concealment of any interviewer-recorded data when switching a self-completion mode.
• Management tools that allow progress to be viewed across all modes and identify separate modes.
• Support for mode-specific questions or question types.
Care should be exercised when using different methods in the same domestic marketing research project. The method used may affect the response obtained, and hence the responses obtained by different methods may not be comparable.
Observation techniques
Quantitative observation techniques are extensively used in descriptive research. Obser-vation involves recording the behavioural patterns of people, objects and events in a sys-tematic manner to obtain information about the phenomenon of interest. The observer does not question or communicate with the people being observed unless he or she takes the role of a mystery shopper. Information may be recorded as the events occur, or from records of past events. Observational techniques may be structured or unstructured, dis-guised or undisguised. Furthermore, observation may be conducted in a natural or a con-trived environment.42
Quantitative observationThe recording and counting of behavioural patterns of people, objects and events in a systematic manner to obtain information about the phenomenon of interest.

290 Marketing Research
Structured versus unstructured observation
For structured observation, the researcher specifies in detail what is to be observed and how the measurements are to be recorded, such as when an auditor performs a stock or inventory analysis in a store. This reduces the potential for observer bias and enhances the reliability of the data. Structured observation is appropriate when the phenomena under study can be clearly defined and counted. For example, suppose that the researcher wished to measure the ratio of visitors to buyers in a store. The reason for such observations could be to understand the amount of browsing that occurs in a store. The researcher could observe and count the number of individuals who enter the store and the number who make a pur-chase. Counting people who enter a shop could be a manual observation, and could have a rule that the store visitors are counted ‘if they actually look at any of the products on dis-play’. Counting the number of transactions through the till may be a simpler electronic observation. With these two counts the researcher could simply calculate the required ratio. Structured observation is suitable for use in conclusive research.
In unstructured observation the observer monitors all aspects of the phenomenon that seem relevant to the problem at hand, such as observing children playing with new toys and trying to understand what activities they enjoy the most. This form of observation can be used when a research problem has yet to be formulated precisely and when flexibility is needed in observation to identify essential components of the problem and to develop hypotheses. Unstructured observation is most appropriate for exploratory research (and as such was discussed in detail in Chapter 6 under the heading of ‘ethnography’). Ethnographic techniques require a researcher to spend a large amount of time observing a particular group of people, by sharing their way of life.43
Disguised versus undisguised observation
In disguised observation, the participants are unaware that they are being observed. Disguise enables participants to behave naturally because people tend to behave differently when they know they are being observed. Disguise may be accomplished by using two-way mirrors, hidden cameras or inconspicuous electronic devices. Observers may be disguised as shop-pers, sales assistants or other appropriate roles. One of the most widespread techniques of observation is through the use of mystery shoppers, as illustrated in the following example.
Mystery shopperAn observer visiting providers of goods and services as if they were really a customer, and recording characteristics of the service delivery.
Structured observationObservation where the researcher clearly defines the behaviours to be observed and the techniques by which they will be measured.
Unstructured observationObservation that involves a researcher monitoring all relevant phenomena, without specifying the details in advance.
Real research Mystery shopping uncovers age discrimination44
Age UK is a major UK-based charity that fights for the rights of all older people in society. The charity funded research to investigate evi-dence of discrimination in the markets for motor and travel insurance, as experienced by older people. A solid evidence base was required that demonstrated in depth the behaviour, successes, challenges and frustra-tions that older customers faced. Evidence was provided by creating a comprehensive study based upon in-depth interviews, group discussions and an innovative mystery shopping exercise. The latter involved recruiting a sample of those aged 65 to 85 and a control sam-ple aged 30 to 49. Participants made real-life insurance quote requests through different channels, and gave interviews before and after the event. The study delivered substantial evidence of age discrimination, both in terms of offering services at all and in the pricing

291Chapter 10 Survey and quantitative observation techniques
Typically, a mystery shopper would go into a bank, for example, note practical things such as the number of counter positions open, the number of people queuing, or the availabil-ity of specific leaflets, and then ask a number of specific questions. The mystery shopper takes the role of the ordinary ‘man or woman in the street’, behaves just as a normal cus-tomer would, asks the same sorts of questions a customer would, leaves and fills in a ques-tionnaire detailing the various components observed in the visit. Mystery shopping differs from conventional survey research in that it aims to collect facts rather than perceptions. Conventional customer-service research is all about customer perceptions. Mystery shop-ping, on the other hand, aims to be as objective as possible and to record as accurately as possible what actually happened in encounters such as the following.45
1 Personal visits:
• How long were you in the queue?
• How many tills were open?
• Did the counter clerk apologise if you were kept waiting?
• What form of greeting or farewell was given?
2 Telephone calls:
• How many rings were there before the phone was answered?
• Did the person who answered the phone go on to answer all your questions?
• Were you asked a password?
• How many times during the conversation was your name used?
A major development in disguised and undisguised observation lies in social media research techniques. The terms used to represent disguised and undisguised may be replaced with the terms ‘passive’ and ‘active’ respectively.46 Passive observation through social media incor-porates a variety of sentiment and buzz mining techniques. These include searching the inter-net for conversations from blogs to Twitter, from social networks to comments on news stories, gathering information about brands and social issues. Active observation through social media can include participant blogs and communities. (These techniques are covered in more detail in Chapter 17.)
In undisguised or passive observation, participants are aware that they are under observa-tion either by being told that an observer is in their presence or by its being obvious that someone is recording their behaviour. Researchers disagree on how much effect the presence of an observer has on behaviour. One viewpoint is that the observer effect is minor and short-lived. The other position is that the observer can seriously bias the behaviour patterns.47 There are ethical considerations to disguised versus undisguised observations that will be tackled at the end of this chapter.
Natural versus contrived observation
Natural observation involves observing behaviour as it takes place in the environment. For example, one could observe the behaviour of participants eating a new menu option in a pizza restaurant. In contrived observation, participants’ behaviour is observed in an artifi-cial environment, such as a test kitchen.
Contrived observationObserving behaviour in an artificial environment.
of insurance. Quotations from the shopping team provided powerful illustrations. They also uncovered age-related concerns about internet-only access to some products, and in the way suppliers talk to customers. Wide-ranging recommendations were published, aimed at the insurance industry and the UK Government.
Natural observationObserving behaviour as it takes place in the environment.

292 Marketing Research
The advantage of natural observation is that the observed phenomenon will more accu-rately reflect the true phenomenon, as the behaviour occurs in a context that feels natural to the participant. The disadvantages are the cost of waiting for the phenomenon to occur and the difficulty of measuring the phenomenon in a natural setting.
Observation techniques classified by mode of administration
As shown in Figure 10.2, observation techniques may be classified by mode of administration – personal observation, electronic observation and trace analysis.
Personal observation
In personal observation, a researcher observes actual behaviour as it occurs. The observer does not attempt to control or manipulate the phenomenon being observed but merely records what takes place. For example, a researcher might record the time, day and number of shop-pers who enter a shop and observe where those shoppers ‘flow’ once they are in the shop. This information could aid in designing a store’s layout and determining the location of individual departments, shelf locations and merchandise displays.
Electronic observation
In electronic observation, electronic devices rather than human observers record the phe-nomenon being observed. The devices may or may not require the participants’ direct par-ticipation. They are used for continuously recording ongoing behaviour for later analysis.
Of the electronic devices that do not require participants’ direct participation, the A.C. Nielsen audimeter is best known. The audimeter is attached to a TV set to record continually the channel to which a set is tuned. Another way to monitor viewers is through the people meter. People meters attempt to measure not only the channels to which a set is tuned, but also who is watching.48 In recent years, there has been much interest in collecting and ana-lysing television set-top box (STB) data. As TV moves from analogue to digital signals, digital STBs are increasingly common in homes. Where these are attached to some sort of return path (as is the case in many homes subscribing to cable or satellite TV services), these data can be aggregated and licensed to companies wishing to measure TV viewership. Advances in distributed computing make it feasible to analyse these data on a huge scale. Whereas previous TV measurement relied on panels consisting of thousands of households, data can now be collected and analysed for millions of households. This holds the promise of providing accurate measurement for much (and perhaps all) of the niche TV content that eludes current panel-based methods in many countries.49
Chapter 5 detailed and evaluated an array of electronic observation techniques, including purchasing and browsing behaviour through web analytics. The chapter also detailed the observation of in-store purchasing behaviour through the use of the bar codes on products.
Personal observationAn observational research strategy in which human observers record the phenomenon being observed as it occurs.
Electronic observationAn observational research strategy in which electronic devices, rather than human observers, record the phenomenon being observed.
Figure 10.2
A classification of observation methods
Observationmethods
Personalobservation
Electronicobservation
Traceanalysis

293Chapter 10 Survey and quantitative observation techniques
The use of optical scanners can determine which products have been sold. With a link to a ‘loyalty card’, electronic observation links the whole array of purchases made by a consumer to the actual identity of that consumer. In this example, electronic observation does not require the direct involvement of the participants.
In contrast to the internet, there are many electronic observation devices that do require participant involvement. These electronic devices may be classified into five groups: (1) eye-tracking monitors; (2) pupilometers; (3) psycho-galvanometers; (4) voice-pitch analysers; and (5) devices measuring response latency. Eye-tracking equipment – such as oculometers, eye cameras or eye-view minuters – records the gaze movements of the eye. These devices can be used to determine how a participant reads an advertisement or views a TV commercial and for how long the participant looks at various parts of the stimulus, as illustrated in the fol-lowing example. Such information is directly relevant to assessing advertising effectiveness.
Eye-tracking equipmentInstruments that record the gaze movements of the eye.
Real research Through the shoppers’ eyes50
Mobile eye tracking allows the researcher to see exactly what the shoppers see as they go about their shopping. ‘Magic glasses’ contain two video cameras, one pointing out-wards to record the field of vision and one pointing at each shoppers’ eye to measure exactly where it focuses. The eye positions are overlaid onto the field of vision so the researcher can pinpoint exactly what each shopper looks at and for how long. Jigsaw Research (www.jigsawresearch.com.au), in partnership with Access Testing (www.accesstesting.com.au), completed a study using mobile eye tracking for Colgate Palmolive. Shoppers were recruited to meet up with researchers in a store. Following questions on their attitudes to shopping, participants were set up with the ‘magic glasses’ and their shopping trolley. After being sent off alone for a warm-up task, each partici-pant was sent off to complete the research task: making a purchase based on his or her current or most recent purchase needs. Once the task was complete, the video footage was immediately replayed to the shoppers so they could talk through the process. The researchers could see the real-life purchase process through the shoppers’ eyes and fol-low it up with discussion around why they had behaved as they did. The researchers saw shoppers get lost, pick up the wrong products and spend minutes agonising over which special offer to buy. They even saw them talking and singing to themselves (the glasses also have a microphone) and eyeing up fellow shoppers. Researchers could see what participants actually did, compared with what they said they would do.
Neuromarketing is concerned with the direct measurement of the brain’s conscious and unconscious responses to marketing stimuli. Typically this involves the measurement of a participant’s brain activity through quantitative electroencephalography (qEEG). This meas-urement is of electrical activity at specific sites across the surface of the brain through sen-sors affixed to the participant’s scalp. Through knowledge of brain function, insight into the mental activity associated with a particular stimulus or study condition can be determined.51
The psycho-galvanometer measures galvanic skin response (GSR), or changes in the electrical resistance of the skin.52 The participant is fitted with small electrodes that monitor electrical resistance and is shown stimuli such as advertisements, packages and slogans. The theory behind this device is that physiological changes, such as increased perspiration, accompany emotional reactions. Excitement leads to increased perspiration, which increases the electrical resistance of the skin. From the strength of the response, the researcher infers the participant’s interest level and attitudes towards the stimuli.
Voice-pitch analysis measures emotional reactions through changes in the participant’s voice. Changes in the relative vibration frequency of the human voice that accompany emo-tional reaction are measured with audio-adapted computer equipment.53
NeuromarketingThe application of neuroscience in marketing, primarily to measure emotions through brain imaging.
Psycho-galvanometerAn instrument that measures a participant’s galvanic skin response.
Galvanic skin responseChanges in the electrical resistance of the skin that relate to a participant’s affective state.
Voice-pitch analysisMeasurement of emotional reactions through changes in a participant’s voice.

294 Marketing Research
Response latency is the time a participant takes before answering a question. It is used as a measure of the relative preference for various alternatives.54 Response time is thought to be directly related to uncertainty. Therefore, the longer a participant takes to choose between two alternatives, the closer the alternatives are in terms of preference. On the other hand, if the participant makes a quick decision, one alternative is clearly preferred. With the increased popularity of computer-assisted data collection, response latency can be recorded accurately and without the participant’s awareness. Use of eye-tracking monitors, neuromarketing, psycho-galvanometers and voice-pitch analysers assumes that physiological reactions are associated with specific cognitive and affective responses. This has yet to be clearly demon-strated. Furthermore, calibration of these devices to measure physiological arousal is diffi-cult, and they are expensive to use. Another limitation is that participants are placed in an artificial environment and know that they are being observed.
Trace analysis
An observation method that can be inexpensive if used creatively is trace analysis. In trace analysis, data collection is based on physical traces, or evidence, of past behaviour. These traces may be left by the participants intentionally or unintentionally. Several innovative applications of trace analysis have been made in marketing research:
• The selective erosion of tiles in a museum indexed by the replacement rate was used to determine the relative popularity of exhibits.
• The number of different fingerprints on a page was used to gauge the readership of vari-ous advertisements in a magazine.
• The position of the radio dials in cars brought in for service was used to estimate share of listening audience of various radio stations. Advertisers used the estimates to decide on which stations to advertise.
• The age and condition of cars in a car park were used to assess the affluence of customers.
• The magazines people donated to charity were used to determine people’s favourite magazines.
• Internet visitors leave traces that can be analysed to examine browsing and usage behav-iour through web cookies.
The following example briefly outlines the use of cookies (which basically underpin much of the web analytics that were described in Chapter 5).
Response latencyThe amount of time it takes to respond to a question.
Trace analysisAn approach in which data collection is based on physical traces, or evidence, of past behaviour.
CookieAn identification code stored in the web surfer’s browser that identifies a particular user.
Real research Have a cookie55
The cookie is an identification code stored in the web surfer’s browser that identifies a particular user. Companies and individuals that host websites use cookies to observe behavioural characteristics of visitors. Cookies follow the traveller through the website and record the pages accessed by the visitor and the number of minutes spent on each page. The name, address, phone number and access site can be collected by the cookie and saved into a database if the visitor enters any information. During a follow-up visit, the cookie accesses this information and has the ability to repeat it to the visitor. In essence, the cookie collects data on the user during every visit to the site. For example, Expedia (www.expedia.com) uses cookies to collect information about site traffic. The information helps marketing personnel at the travel site to collect demographics on the reader. Also, the company can monitor ‘hits’ on particular topics and gain valuable feedback on user interest. Data collection is based upon visitor behaviour. This disguised technique enables Expedia to monitor use patterns and to eliminate socially acceptable response bias. Information collected in this manner has been used to modify editorial content and format to make the website more appealing and useful to visitors.

295Chapter 10 Survey and quantitative observation techniques
A comparative evaluation of the observation techniques
A comparative evaluation of the observation techniques is given in Table 10.4. The different observation techniques are evaluated in terms of the degree of structure, degree of disguise, ability to observe in a natural setting, observation bias, measurement and analysis bias and additional general factors.
Structure relates to the specification of what is to be observed and how the measurements are to be recorded. As can be seen from Table 10.4, personal observation is low and trace analysis is medium on the degree of structure. Electronic observation can vary widely from low to high, depending on the techniques used. Techniques such as optical scanners are very structured, in that the characteristics to be measured – for example, characteristics of items purchased and scanned in supermarket checkouts – are precisely defined. In contrast, electronic techniques, such as the use of hidden cameras to observe children at play with toys, tend to be unstructured.
Table 10.4
Criteria Personal observation Electronic observation Trace analysis
Degree of structure * * to ***** ***
Degree of disguise *** **** *****
Natural setting ***** **** *
Observation bias ***** * ***
Analysis bias ***** ** ***
General remarks Most flexible Can be intrusive Limited traces available
(key: low = *, moderate to low = **, moderate = ***, moderate to high = ****, high = *****)
A comparative evaluation of observation techniques
Personal observation offers a medium degree of disguise because there are limitations on the extent to which the observer can be disguised as a shopper, sales assistant or employee. Trace analysis offers a high degree of disguise because the data are collected ‘after the fact’ – that is, after the phenomenon to be observed has taken place. Some electronic observations, such as hidden cameras, offer excellent disguise, whereas others, such as the use of eye-tracking equipment, are very difficult to disguise.
The ability to observe in a natural setting is low in trace analysis because the observation takes place after the behaviour has occurred. Personal observation and audits are excellent on this score because human observers can observe people or objects in a variety of natural set-tings. Electronic observation techniques vary from low (e.g. use of eye-tracking equipment) to high (e.g. use of turnstiles).
Observation bias is low in the case of electronic observation because a human observer is not involved. Observation bias is medium for trace analysis. In this technique, human observ-ers are involved and the characteristics to be observed are not very well defined. The observ-ers typically do not interact with human participants during the observation process, thus lessening the degree of bias. It is high for personal observation due to the use of human observers, who interact with the phenomenon being observed.
Trace analysis has a medium degree of data analysis bias as the definition of variables is not very precise. Electronic observation techniques can have a low (e.g. scanner data) to

296 Marketing Research
medium (e.g. hidden camera) degree of analysis bias. Unlike personal observation, the bias in electronic observation is limited to the medium level due to improved measurement and classification, because the phenomenon to be observed can be recorded continuously using electronic devices.
In addition, personal observation is the most flexible, because human observers can observe a wide variety of phenomena in a wide variety of settings. Some electronic obser-vation techniques, such as the use of eye-tracking equipment, can be very intrusive, lead-ing to artificiality and bias. Audits using human auditors tend to be expensive. As mentioned earlier, trace analysis is a method that is limited to where consumers actually leave ‘traces’. This occurs infrequently, and very creative approaches are needed to cap-ture these traces.
Evaluating the criteria presented in Table 10.4 helps to identify the most appropriate observation technique, given the phenomena to be observed, the nature of participants being observed and the context in which the observation occurs. To strengthen the choice of a par-ticular observation technique, it is also helpful to compare the relative advantages and disad-vantages of observation versus survey techniques.
Advantages and disadvantages of observation techniques
Other than the use of scanner data, few marketing research projects rely solely on obser-vational techniques to obtain primary data.56 This implies that observational techniques have some major disadvantages compared with survey techniques. Yet these techniques offer some advantages that make their use, in conjunction with survey techniques, quite fruitful.
Relative advantages of observation techniques
The greatest advantage of observational techniques is that they permit measurement of actual behaviour rather than reports of intended or preferred behaviour. There is no reporting bias, and potential bias caused by the interviewer and the interviewing process is eliminated or reduced. Certain types of data can be collected only by observation. These include behaviour patterns that the participant is unaware of or unable to communicate. For example, informa-tion on babies’ and toddlers’ toy preferences is best obtained by observing babies at play, because they are unable to express themselves adequately. Moreover, if the observed phe-nomenon occurs frequently or is of short duration, observational techniques may cost less and be faster than survey techniques.
Relative disadvantages of observation techniques
The biggest disadvantage of observation is that the reasons for the observed behaviour may be difficult to determine because little is known about the underlying motives, beliefs, atti-tudes and preferences. For example, people observed buying a brand of cereal may or may not like it themselves; they may be purchasing that brand for someone else in the household. Another limitation of observation is the extent to which researchers are prepared to evaluate the level of their own bias, and how this can affect what they observe (this was discussed in Chapter 9). In addition, observational data can be time-consuming and expensive to collect. It is also difficult to observe certain forms of behaviour, such as personal activities that occur in the privacy of the consumer’s home. Finally, in some cases, such as in the use of hidden cameras, the use of observational techniques may border on being, or may actually be, uneth-ical. It can be argued that individuals being observed should be made aware of the situation, but this may cause them to behave in a contrived manner.

297Chapter 10 Survey and quantitative observation techniques
Summary The two basic means of obtaining primary quantitative data in descriptive research are through survey and observation techniques. Survey involves the direct questioning of participants, while observation entails recording participant behaviour or the behaviour of service deliverers.
Surveys involve the administration of a questionnaire and may be classified, based on the method or mode of administration, as: (1) online surveys; (2) email surveys; (3) tradi-tional telephone surveys; (4) computer-assisted telephone interviews (CATIs); (5) home or workplace face-to-face surveys; (6) street surveys; (7) computer-assisted personal interviews (CAPIs); and (8) traditional postal surveys. Of these techniques, online sur-veys have grown to be the dominant mechanism of delivering surveys in countries with good levels of internet access. However, online surveys suffer from particular problems with response rates and bias. Although these data collection techniques are usually thought of as distinct and ‘competitive’, they should not be considered to be mutually exclusive, in much the same manner as using quantitative and qualitative techniques should not be considered to be mutually exclusive. It is possible to employ them produc-tively in mixed-mode approaches, especially in conducting surveys across cultures.
Quantitative observational techniques may be classified as structured or unstructured, disguised or undisguised and natural or contrived. The major techniques are personal observation (including mystery shopping), electronic observation (including some active and passive social media research techniques) and trace analysis. Compared with surveys, the relative advantages of observational techniques are that they permit measurement of actual behaviour, there is no reporting bias and there is less potential for interviewer bias. Also, certain types of data can best, or only, be obtained by observation. The relative disadvantages of observation are that very little can be inferred about motives, beliefs, attitudes and preferences, there is a potential for observer bias, most techniques are time-consuming and expensive, it is difficult to observe some forms of behaviour and questions of ethical techniques of observation are far more contentious. Observation is rarely used as the sole method of obtaining primary data, but it can be usefully employed in conjunction with other marketing research techniques to corroborate, validate and enrich analyses and interpretations.
Each individual survey method has its own distinct advantages and disadvantages that the researcher must evaluate. But if the researcher is designing a survey that is to work in different geographical locations, the additional challenges and opportunities inher-ent to their selected locations must also be evaluated. Participants’ anonymity should be protected, and their names should not be turned over to clients. People should not be observed without consent for research in situations where they would not expect to be observed by the public. Digital developments in marketing research have fundamen-tally changed the way that researchers engage with participants, design questionnaires, collect survey data and analyse them. These developments continue with the use of mobile devices to conduct surveys and quantitative observations.
Questions 1 Given that survey researchers may impose their language and logic upon potential participants, what do you see as being the advantages and disadvantages of conducting surveys?
2 Discuss the dilemma faced by the survey designer who wishes to develop a survey that is not prone to interviewer bias but also sees that interviewer rapport with participants is vital to the success of the survey.

298 Marketing Research
Exercises 1 A manager from your college/university has been asked to review which survey method would be the most effective for a study of undergraduate experiences and attitudes at the end of each academic year. She has come to you to help her make the case. Explain which method would be best and why you have made that decision.
2 Visit the YouGov organisation’s website at www.yougov.com. Which survey methods have been used by YouGov in some of the recent surveys posted on this site? Given YouGov’s specialist studies and target participants, describe any limitations that you see in the survey methods it uses.
3 Locate an online survey, print off the pages and examine the content carefully. What would be the relative advantages of administering the same survey via a street survey? What would a street interviewer need to change to make this survey effective in a street situation?
4 You have been hired by a campus bookstore to observe covertly students making purchasing decisions while shopping. Spend 30 minutes making these observations and write a report that covers:
a How you feel students make their purchasing decisions for books and any other goods available in the shop.
b What you feel to be the benefits, limitations and challenges of this approach.
5 In a small group, discuss the following issue: ‘Given the decline in response and cooperation rates to surveys, it would be much better for marketers to invest in quantitative observation techniques and forget conducting surveys.’
3 Evaluate the reasons why response rates to surveys are declining.
4 Why do interviewers need to probe participants in surveys? What distinguishes survey probing from probing conducted in qualitative interviews?
5 What are the relevant factors for evaluating which survey method is best suited to a particular research project?
6 What are the distinct advantages of conducting a survey using CAPI technology compared with a traditional postal survey?
7 What are the key advantages of conducting online surveys? Why are response rates to online surveys so low?
8 How would you classify mystery shopping as an observation technique? Why would you classify it in this way?
9 How may electronic observation techniques be used in supermarkets?
10 Explain, using examples, where trace analysis may be used.
11 Describe the criteria by which you would evaluate the relative benefits of different observation techniques.
12 What is the difference between qualitative and quantitative observation?
13 Describe the relative advantages and disadvantages of observation.
14 Describe a marketing research problem in which both survey and observation techniques could be used for obtaining the information needed.

299Chapter 10 Survey and quantitative observation techniques
Notes
1. Till, A., ‘Right here. . .Right now. . .’, Research World (December 2006), 44–5.
2. Heeg, R., ‘The great outdoors goes digital’, Research World (March 2008), 19.
3. Surveys are commonly used in marketing research. See, for example, Rindfleisch, A., Malter, A.J., Ganesan, S. and Moorman, C., ‘Cross-sectional versus longitudinal survey research: Concepts, findings and guidelines’, Journal of Marketing Research 45 (3) (June 2008), 261–79; Malhotra, N. and McCort, D., ‘A cross-cultural comparison of behavioural intention models: Theoretical consideration and an empirical investigation’, International Marketing Review 18 (3) (2001), 235–69.
4. ESOMAR, ‘Global Market Research’, ESOMAR Industry Report (2010), 16.
5. Cohen, E. and Jacobs, P., ‘How mobile is changing the sociology, psychology and the entertainment/work environment’, ESOMAR WM3, Berlin (October 2010).
6. St-Laurent, N., Mathieu, A. and Coderre, F., ‘Comparison of the quality of qualitative data obtained through telephone, postal and email surveys’, International Journal of Market Research 46 (3) (2004), 349–57; Mann, C. and Stewart, F., Internet Communication and Qualitative Research: A Handbook for Researching Online (London: Sage, 2000), 67.
7. Ahmed, M., ‘Send an e-mail? Err . . . sorry, you seem to have mistaken me for a sad old geezer’, The Times (24 December 2010), 19.
8. Schwartz, M., ‘Postal and email “Combos” gain favor with marketers’, B to B 87 (2) (11 February 2002), 25; Stevens, J. and Chisholm, J., ‘An integrated approach: Technology firm conducts worldwide satisfaction research survey via email, Internet’, Quirk’s Marketing Research Review 11 (8) (October 1997), 12–13, 64–5.
9. Gorman, J.W., ‘An opposing view of online surveying’, Marketing News (24 April 2000); Johnston, A., ‘Welcome to the wired world’, Research (November 1999), 22–5; Comley, P., ‘Will working the web provide a net gain?’, Research (December 1996), 16.
10. Goon, E., ‘Friends or foes? The Internet versus the music industry’, GlobalPark Case Study (2010), www.globalpark.co.uk, accessed 23 March 2011.
11. Poynter, R., ‘Online research: Stop asking questions and start listening’, Admap (July/August 2010), 32–4.
12. Hellwig, J.O. and Wirth, T., ‘Panel-based mobile online research – why mobile online questionnaires contribute to improve data quality’ ESOMAR Panel Research, Dublin (October 2008).
13. Geoghegan, T. ‘The slow death of landline phones’ (November 2009), http://news.bbc.co.uk/1/hi/8355504.stm, accessed 15 April 2016.
14. Heeg, R., ‘MR will be a fundamental tool in our country’, Research World (May 2004), 6–7.
15. Eva, G. and Jowell, R., ‘Conference notes – prospects for mixed-mode data collection in cross-national surveys’, International Journal of Market Research 51 (2) (2009), 267–9.
16. Smith, A., Brown, L. and Garner, S., ‘Charities and the not-for-profit sector’, Admap 495 (June 2008), 38–40.
17. www.millwardbrownulster.com/omnibus.html, accessed 25 March 2011.
18. Folkman Curasi, C., ‘A critical exploration of face-to-face interviewing vs. computer mediated interviewing’, International Journal of Market Research 43 (3) (2001), 361–75; Bush, A.J. and Hair, J.E. Jr, ‘An assessment of the mall-intercept as a data collection method’, Journal of Marketing Research (May 1985), 158–67.
19. Rines, S., ‘Brands fall short of their goal’, Marketing Week (16 June 2005), 32–3.
20. Manfreda, K.L., Bosnjak, M., Berzelak, J., Haas, I. and Vehovar, V., ‘Web surveys versus other survey modes: A meta analysis comparing response rates’, International Journal of Market Research 50 (1) (2008), 79–104; Bourque, L., How to Conduct Self-Administered and Mail Surveys, 2nd edn (Thousand Oaks, CA: Sage, 2002); Brossard, H.L., ‘Information sources used by an organisation during a complex decision process: An exploratory study’, Industrial Marketing Management 27 (1) (January 1998), 41–50.
21. Schmid, J., ‘Assigning value to your customer list’, Catalog Age 18 (5) (April 2001), 69; Alan, C.B. and Tse, A.C.B., ‘Comparing response rate, response speed and response quality of two methods of sending questionnaires: E-mail vs. mail’, International Journal of Market Research 40 (4) (1998), 353–61; Yoegei, R., ‘List marketers head to cyberspace’, Target Marketing 20 (8) (August 1997), 54–5.
22. Anolli, L., Villani, D. and Riva, G., ‘Personality of people using chat: An on-line research’, CyberPsychology & Behavior 8 (1) (February 2005), 89–95; Thompson, S.K., Sampling (New York: Wiley, 2002); Childers, T.L. and Skinner, S.J., ‘Theoretical and empirical issues in the identification of survey participants’, Journal of the Market Research Society 27 (January 1985), 39–53.
23. Rao, J.N.K. and Lohr, S., ‘Estimation in multiple-frame surveys’, Journal of the American Statistical Association 101 (475) (September 2006), 1019–30; Murphy, G.B., ‘The effects of organizational sampling frame selection’, Journal of Business Venturing 17 (3) (May 2002), 237; Smith, W., Mitchell, P., Attebo, K. and Leeder, S., ‘Selection bias from sampling frames: Telephone directory and electoral rolls compared to door-to-door population census: Results from the Blue Mountain eye study’, Australian & New Zealand Journal of Public Health 21 (2) (April 1997), 127–33.
24. Heeg, R., ‘Every study in Belgium is an international study’, Research World (February 2004), 8–9.
25. Tarran, B., ‘Worldwide USA’, Research (July 2005), 26–7.
26. Printz, J. and Maltby, D., ‘Beyond personalisation: When handwriting makes a difference’, Fund Raising Management 28 (3) (May 1997), 16–19; Conant, J.S., Smart, D.T. and Walker, B.J., ‘Mail survey facilitation techniques: An assessment and proposal regarding reporting practices’, Journal of the Market Research Society 32 (October 1990), 569–80.

300 Marketing Research
27. Erdogan, B.Z., ‘Increasing mail survey response rates from an industrial population: A cost effectiveness analysis of four follow-up techniques’, Industrial Marketing Management 31 (1) (January 2002), 65; Edmonston, J., ‘Why response rates are declining’, Advertising Age’s Business Marketing 82 (8) (September 1997), 12; Hubbard, R. and Little, E.L., ‘Promised contributions to charity and mail survey responses: Replications with extension’, Public Opinion Quarterly 52 (Summer 1988), 223–30; Erdos, P.L. and Ferber, R. (eds), ‘Data collection methods: Mail surveys’, Handbook of Marketing Research (New York: McGraw-Hill, 1974), 102.
28. Fletcher, K., ‘Jump on the omnibus’, Marketing (15 June 1995), 25–8.
29. Bednall, D., ‘CATI: What researchers, interviewers and clients can do to improve response rates’, Research News (December 2004), 10.
30. Heeg, R., ‘Rigid data-protection and closed doors’, Research World (April 2004), 6–7.
31. Groves, R.M., ‘Nonresponse rates and nonresponse bias in household surveys’, Public Opinion Quarterly 70 (5) (2006), 646–75; Roy, A. and Berger, P., ‘E-mail and mixed mode database surveys revisited: Exploratory analyses of factors affecting response rates’, Journal of Database Marketing & Customer Strategy Management 12 (21) (January 2005), 153–71; Smith, J., ‘How to boost DM response rates quickly’, Marketing News 35 (9) (23 April 2001), 5; Columbo, R., ‘A model for diagnosing and reducing non-response bias’, Journal of Advertising Research (January/April 2000), 85–93.
32. ESOMAR, ‘Global Market Research’, ESOMAR Industry Report (2010), 48.
33. Fowler, F.J. Jr., Survey Research Methods, 3rd edn (Thousand Oaks, CA: Sage, 2001); Guengel, P.C., Berchman, T.R. and Cannell, C.E., General Interviewing Techniques: A Self-Instructional Workbook for Telephone and Personal Interviewer Training (Ann Arbor, MI: Survey Research Center, University of Michigan, 1983).
34. Graeff, T.R., ‘Uninformed response bias in telephone surveys’, Journal of Business Research 55 (3) (March 2002), 251; Singer, E., ‘Experiments with incentives in telephone surveys’, Public Opinion Quarterly 64 (2) (Summer 2000), 171–88; Cannell, C.E., Miller, P.U., Oksenberg, L. and Leinhardt, S. (eds), ‘Research on interviewing techniques’, Sociological Methodology (San Francisco, CA: Jossey-Bass, 1981); Miller, P.U. and Cannell, C.E., ‘A study of experimental techniques for telephone interviewing’, Public Opinion Quarterly 46 (Summer 1982), 250–69.
35. Fink, A., How to Conduct Surveys: A Step-by-Step Guide, 3rd edn (Thousand Oaks, CA: Sage, 2005); McMaster, M., ‘E-Marketing poll vault’, Sales and Marketing Management 153 (8) (August 2001), 25; Fink, A., A Survey Handbook (Thousand Oaks, CA: Sage, 1995).
36. Lee, Z. and Sargeant, A., ‘Dealing with social desirability bias: An application to charitable giving’, European Journal of Marketing 45 (5) (2011), 703–19.
37. Anon., ‘Random sampling: Homework – yeah right’, Marketing News 36 (6) (18 March 2002), 4; Vinten, G., ‘The threat in the question’, Credit Control 18 (1) (1997), 25–31; Raghubir, P. and Menon, G., ‘Asking sensitive questions: The effects of type of referent and frequency
wording in counterbiasing method’, Psychology & Marketing 13 (7) (October 1996), 633–52.
38. ‘Audi – born of powerful ideas’, European Association of Communications Agencies Bronze winner (2008).
39. Vicente, P., Reis, E. and Santos, M., ‘Using mobile phones for survey research: A comparison with fixed phones’, International Journal of Market Research 51 (5) (2009), 613–34; Eva, G. and Jowell, R., ‘Conference notes – prospects for mixed-mode data collection in cross-national surveys’, International Journal of Market Research 51 (2) (2009), 267–9.
40. Blyth, B., ‘Mixed mode: The only “fitness” regime?’, International Journal of Market Research 50 (2) (2008), 241–66.
41. Macer, T., ‘Different strokes’, Research in Business (March 2004), 20.
42. Pettit, R., ‘Digital anthropology: How ethnography can improve online research’, Journal of Advertising Research, 50 (3) (2010), 240–2; Milat, A.J., ‘Measuring physical activity in public open space – an electronic device versus direct observation’, Australian & New Zealand Journal of Public Health 26 (1) (February 2002), 1; Wilcox, S.B., ‘Trust, but verify’, Appliance Manufacturer 46 (1) (January 1998), 8, 87.
43. Healy, M.J., Beverland, M.B., Oppewal, H. and Sands, S., ‘Understanding retail experiences – the case for ethnography’, International Journal of Market Research 49 (6) (2007), 751–78; Travers, M., Qualitative Research Through Case Studies (London: Sage, 2001), 4.
44. Smith, A., Brown, L. and Garner, S., ‘Charities and the not-for-profit sector’, Admap 495 (June 2008), 38–40.
45. McNeil, R., ‘The mystery squad’s tougher challenge’, ResearchPlus (April 1994), 13.
46. Smit, E.G. and Neijens, P.C., ‘The march to reliable metrics: A half century of coming closer to the truth’, Journal of Advertising Research 51 (1) 50th Anniversary Supplement (2011), 124–35.
47. Baverstock, A., Bywater, H., Halliwell, P. and Boyle, B., ‘Stripping the wallpaper – using technology to reach the “out of reach” answers’, ESOMAR Qualitative, Marrakech (November 2009); Kurcina, B., ‘Use videos to obtain crucial POP info’, Marketing News 34 (24) (20 November 2000), 16; Seaton, A.V., ‘Unobtrusive observational measures as a qualitative extension of visitor surveys at festivals and events: Mass observation revisited’, Journal of Travel Research 35 (4) (Spring 1997), 25–30.
48. Kasari, H.J., ‘People-meter systems in the changing TV climate’, Admap 476 (October 2006) 55–6; Ephron, E., ‘Nielsen’s secret passive meter’, Mediaweek 10 (36) (18 September 2000).
49. Zigmond, D., Dorai-Raj, S., Interian, Y. and Naverniouk, I., ‘Measuring advertising quality on television: Deriving meaningful metrics from audience retention data’, Journal of Advertising Research 49 (4) (December 2009), 419–28.
50. Blackadder, J., ‘Through the shoppers’ eyes’, Research News (November 2006), 26.
51. Addie, I. and Lewis-Hodgson, D., ‘Bioshopping: Revolutionising shopper insight’, Market Research Society Annual Conference (2010).

301Chapter 10 Survey and quantitative observation techniques
52. For examples of an application of GSR, see Ohme, R.K., Reykowska, D., Wiener, D. and Choromanska, A., ‘Analysis of neurophysiological reactions to advertising stimuli by means of EEG and Galvanic Skin Responses measures’, Journal of Neuroscience, Psychology, and Economics 2 (1) (2009), 21–31; Anthes, G.H., ‘Smile, you’re on Candid Computer’, Computerworld 35 (49) (3 December 2001), 50.
53. Pullen, J.P., ‘Truth down to a science’, ANA Magazine (October 2006), 78–82; Croal, N’G., ‘Moviefone learns to listen,’ Newsweek 135 (19) (8 May 2000), 84.
54. Romaniuk, J. and Wight, S., ‘The influences of brand usage on response to advertising awareness measures’, International Journal of Market Research 51 (2) (2009),
203–18; Haaijer, R., ‘Response latencies in the analysis of conjoint choice experiments’, Journal of Marketing Research (August 2000), 376–82; Vasilopoulos, N. ‘The influence of job familiarity and impression management on self-report measure scale scores and response latencies’, Journal of Applied Psychology 85 (1) (February 2000), 50.
55. Verton, D., ‘SafeWeb users vulnerable’, Computerworld 36 (8) (18 February 2002), 6; Bayan, R., ‘Privacy means knowing your cookies,’ Link-Up 18 (1) (January/February 2001), 22–3.
56. McPhee, N., ‘Is there a future for “real” qualitative market research interviewing in the digital age?’, ESOMAR Congress Odyssey, Athens (September 2010).

Causal research design: experimentation
Causality can never be proved;
in other words, it can never
be demonstrated decisively.
Inferences of cause-and-effect
relationships are the best that
can be achieved.
Stage 1
Problem definition
Stage 2
Research approach developed
Stage 3
Research design
developed
Stage 4
Fieldwork or data
collection
Stage 5
Data integrity
and analysis
Stage 6
Communicating research findings
11

303Chapter 11 Causal research design: experimentation
Objectives
After reading this chapter, you should be able to:
1 explain the concept of causality as defined in marketing research and distinguish between the ordinary meaning and the scientific meaning of causality;
2 define and differentiate two types of validity: internal validity and external validity;
3 discuss the various extraneous variables that can affect the validity of results obtained through experimentation and explain how the researcher can control extraneous variables;
4 describe and evaluate experimental designs and the differences among pre-experimental, true experimental, quasi-experimental and statistical designs;
5 compare and contrast the use of laboratory versus field experimentation and experimental versus non-experimental designs in marketing research;
6 describe test marketing and its various forms: standard test market, controlled test market, simulated test market, electronic and other forms of test marketing;
7 understand the problems of internal and external validity of field experiments when conducted in international markets.
We introduced causal designs in Chapter 3, where we discussed their relationship to exploratory and descriptive designs and defined experimentation as the primary method employed in causal designs. This chapter explores the concept of causality further. We identify the necessary conditions for causality, examine the role of validity in experimentation and consider the extraneous variables and procedures for controlling them. We present a classification of experimental designs and consider specific designs, along with the relative merits of laboratory and field experiments. An application in the area of test marketing is discussed in detail. The considerations involved in conducting experimental research when researching international markets are discussed. Several ethical issues, which arise in experimentation, are identified. The chapter also discusses how digital developments in marketing research are enabling researchers to conduct improved and/or new forms of experimentation. We begin with an example that encapsulates the opportunities inherent in the application and process of experimentation.
Overview
Real research How the tone and wording of advertisements interact1
There are many examples of positive and negative advertisements. For instance, in a positive advert, Sony showed a young woman sitting in a café chatting on the phone. It would seem she was enjoying her leisure time by using her mobile phone. In contrast, the Red Cross showed an advert with one of its volunteers holding a young boy while the characters look at a war-torn landscape. The caption read, ‘Whatever the future holds, we’ll be there.’ By focusing on negative aspects, and how the Red Cross can over-come such a situation, the advert was taking a sad affective tone. Affective tone is defined here as the overall feeling of the advertisement. In a study to draw together the two constructs of message affect and framing, an experiment was conducted to discover whether and how they interact. The experiment was undertaken in the context of televi-sion advertisements for mobile phones. The researchers set two hypotheses for this

304 Marketing Research
study. H1: For advertisements with a happy or sad affective tone, positive message frames are more persuasive than negative message frames. H2: Advertisements with the incongruous positive (negative) frame and sad (happy) tone are more persuasive than the congruous negative (positive) frame and sad (happy) tone. The method designed to test these competing hypotheses was a 2 (affective tone: happy, sad) × 2 (message fram-ing: positive, negative) between-subjects factorial design. A total of 187 participants were randomly assigned to treatment conditions. Mobile telephones were chosen as the context for the advert as they were known to be important but not crucial items to the participant sample. Message framing was manipulated by inserting three attributes of information on a black screen background (i.e. convenience, business productivity and personal security). For the positive framing conditions this meant the following words being displayed on screen (negative framing in parentheses).
A mobile offers you: (No mobile means):
Convenience (Inconvenience)Greater productivity (Being unproductive)Personal security in emergencies (Isolation in emergencies)
Participants were told that the purpose of the study was to find out how people evaluate TV programmes and adverts. An episode of The Simpsons was then played, followed by the advert, after which participants completed a questionnaire. The choice of TV pro-gramme was based on showing the participants a programme that would keep the attention-levels high, distract participants away from the purpose of the experiment and minimise the biases associated with lab experimentation. The entire procedure took less than 37 minutes to complete. The results showed that for adverts with a positive affec-tive tone, it was negative frames rather than positive frames that produced the most favourable attitudes. This result was in accordance with H2. By contrast, for adverts with a negative affective tone, using positive framing appeared to be the most persuasive, which supported the negative state avoidance rationale for H1 and the incongruity rationale for H2. The experiment revealed two alternative yet complementary perspec-tives of the relationship between message affect and framing.
Concept of causality
Experimentation is commonly used to infer causal relationships. The concept of causality requires some explanation. The scientific concept of causality is complex. ‘Causality’ means something very different to the average person on the street than to a scientist.2 A statement such as ‘X causes Y’ will have the following meanings to an ordinary person and to a scientist:
Ordinary meaning Scientific meaning
X is the only cause of Y X is only one of a number of possible causes of Y
X must always lead to Y The occurrence of X makes the occurrence of Y more probable (X is a probabilistic cause of Y)
It is possible to prove that X is a cause of Y
We can never prove that X is a cause of Y. At best, we can infer that X is a cause of Y
The scientific meaning of causality is more appropriate to marketing research than is the ordinary meaning. Marketing effects are caused by multiple variables and the relationship
CausalityCausality applies when the occurrence of X increases the probability of the occurrence of Y.

305Chapter 11 Causal research design: experimentation
between cause and effect tends to be probabilistic. Moreover, we can never prove causality (i.e. demonstrate it conclusively); we can only infer a cause-and-effect relationship. In other words, it is possible that the true causal relation, if one exists, will not have been identified. We further clarify the concept of causality by discussing the conditions for causality.
Conditions for causality
Before making causal inferences, or assuming causality, three conditions must be satisfied: (1) concomitant variation; (2) time order of occurrence of variables; and (3) elimination of other possible causal factors. These conditions are necessary but not sufficient to demon-strate causality. No one of these three conditions, or all three conditions combined, can dem-onstrate decisively that a causal relationship exists.3 These conditions are explained in more detail in the following sections.
Concomitant variation
Concomitant variation is the extent to which a cause, X, and an effect, Y, occur together or vary together in the way predicted by the hypothesis under consideration. Evidence pertain-ing to concomitant variation can be obtained in a qualitative or quantitative manner.
For example, in the qualitative case, the management of a travel company may believe that the retention of customers is highly dependent on the quality of its service. This hypoth-esis could be examined by assessing concomitant variation. Here, the causal factor X is ser-vice level and the effect factor Y is retention level. A concomitant variation supporting the hypothesis would imply that travel companies with satisfactory levels of service would also have a satisfactory retention of customers. Likewise, travel companies with unsatisfactory service would exhibit unsatisfactory retention of customers. If, on the other hand, the oppo-site pattern was found, we would conclude that the hypothesis was untenable.
For a quantitative example, consider a random survey of 1,000 participants questioned about the purchasing of a skiing holiday. This survey yields the data in Table 11.1. The par-ticipants have been classified into high- and low-education groups based on a median or even split. This table suggests that the purchase of a skiing holiday is influenced by educa-tion level. Participants with high education are more likely to purchase a skiing holiday: 73% of the participants with high education have a high purchase level, whereas only 64% of those with low education have a high purchase level. Furthermore, this is based on a rela-tively large sample of 1,000 participants.
Based on this evidence, can we conclude that high education causes a high purchasing level of skiing holidays? Certainly not! All that can be said is that association makes the hypothesis more tenable; it does not prove it. What about the effect of other possible causal factors, such as income? Skiing holidays can be expensive, so people with higher incomes may be more able to afford them. Table 11.2 shows the relationship between the purchase of
Concomitant variationA condition for inferring causality that requires that the extent to which a cause, X, and an effect, Y, occur together or vary together is predicted by the hypothesis under consideration.
Table 11.1
Purchase of a skiing holiday from a travel company, Y
High Low Total
Education, X High 363 (73%) 137 (27%) 500 (100%)Low 322 (64%) 178 (36%) 500 (100%)
Evidence of concomitant variation between purchase of a skiing holiday and education

306 Marketing Research
a skiing holiday and education for different income segments. This is equivalent to holding the effect of income constant. Here, again, the sample has been split at the median to produce high- and low-income groups of equal size. Table 11.2 shows that the difference in purchas-ing levels of a skiing holiday between high- and low-education participants has been reduced considerably. This suggests that the association indicated by Table 11.1 may be spurious.
We could give similar examples to show why the absence of initial evidence of concomi-tant variation does not imply that there is no causation. It is possible that considering a third variable will crystallise an association that was originally obscure. The time order of the occurrence of variables provides additional insights into causality.
Time order of occurrence of variables
The time order of occurrence condition states that the causing event must occur either before or simultaneously with the effect; it cannot occur afterwards. By definition, an effect cannot be produced by an event that occurs after the effect has taken place. It is possible, however, for each event in a relationship to be both a cause and an effect of the other event. In other words, a variable can be both a cause and an effect in the same causal relationship. To illus-trate, customers who shop frequently in a particular supermarket are more likely to have a loyalty card for that supermarket. In addition, customers who have a loyalty card for a super-market are likely to shop there frequently.
Consider travel companies and the challenge of retaining their customers. If the quality of their service offering is the cause of retention, then improvements in service must be made before, or at least simultaneously with, an increase in retention. These improvements might consist of training or hiring more staff in their branches. Then, in subsequent months, the retention of customers should increase. Alternatively, retention may increase simultaneously with the training or hiring of additional branch staff. On the other hand, suppose that a travel company experienced an appreciable increase in the level of retaining customers and then decided to use some of that money generated to retrain its branch staff, leading to an improve-ment in service. In this case, the improved service quality cannot be a cause of increased retention; rather, just the opposite hypothesis might be plausible.
Absence of other possible causal factors
The absence of other possible causal factors means that the factor or variable being investi-gated should be the only possible causal explanation. Travel company service quality may be a
Table 11.2
Low-income
Purchase
High Low Total
Education High 122 (61%) 78 (39%) 200 (100%)
Low 171 (57%) 129 (43%) 300 (100%)
High-income
Purchase
High Low Total
Education High 241 (80%) 59 (20%) 300 (100%)
Low 151 (76%) 49 (24%) 200 (100%)
Purchase of skiing holiday by income and education

307Chapter 11 Causal research design: experimentation
cause of retention if we can be sure that changes in all other factors affecting retention – pricing, advertising, promotional offers, product characteristics, competition and so forth – were held constant or were otherwise controlled.
In an after-the-fact examination of a situation, we can never confidently rule out all other causal factors. In contrast, with experimental designs it is possible to control some of the other causal factors. It is also possible to balance the effects of some of the uncontrolled variables so that only random variations resulting from these uncontrolled variables will be measured. These aspects are discussed in more detail later in this chapter.
The difficulty of establishing a causal relationship is illustrated by the following example. If you were to design this experiment, imagine trying to pinpoint what ‘creativity’ means in the context of designing an advertisement.
Real research Advertising creativity matters4
A common view is that creativity is a mission of the entire advertising industry, its raison d’être. In a frequently cited study,5 wasteful advertising creativity in advertising agencies in the form of an abundance of creative ideas yielded more effective advertisements in the long term. An experiment was undertaken to test the notion of wasteful advertising. The aim was to see whether an abundance of cre-ativity in a single advertisement yielded posi-tive effects. To test their hypotheses, the researchers wished to compare responses between consumers who had been exposed to a more creative versus a less creative advertisement for the same brand with the same message. To do this they chose a 2 (more creative/less creative advertisement) × 2 (perceived creativity before/after) experi-mental design, where participants were randomly assigned to one of the four cells. To avoid stimulus-specific effects, four different brands and accompanying messages were used for a total of 16 experiment cells. All four brands were established and well known in their respective product categories (pain relief, coffee, vodka and condoms). Four pairs of print advertisements were developed, one pair for each brand. Print advertise-ments usually have three main elements: the brand, text and visuals. In creating test material, the brand and the visuals were kept constant, while the text was varied to com-municate the same message in a more (employing rhetorical figures) or less (without rhetorical figures) creative way. The number of words was kept constant. The partici-pants were recruited from an access panel to represent the adult working population. In total, 1,284 consumers participated in the study, making a cell size of approximately 80 participants. Participants were randomly exposed to one of the stimulus print adverti sements online and then directly completed a questionnaire. The results showed that waste in advertising creativity mattered. Rather than improving the functionality of an advertisement and pushing the message into consumers’ minds (which conventional wisdom held to be the major benefit of creativity), an extra degree of creativity may send signals about the advertiser that rub off on consumer perceptions of the brand. More versus less creative advertising signalled greater effort on the advertiser’s behalf and was taken as proof of the brand’s smartness, and ability to solve problems and develop valuable products. As a result, consumers became more interested in the brand and perceived it to be of higher quality.

308 Marketing Research
The visual characteristics of ‘creativity’ were not tested in this example, which could have had a major impact upon how participants view the creativity of an advert. This does not mean that the experiment has no value, far from it, but it does illustrate the challenges inherent in establishing cause-and-effect relationships. If, as this example indicates, it is dif-ficult to establish cause-and-effect relationships, what is the role of evidence obtained in experimentation?
Evidence of concomitant variation, time order of occurrence of variables and elimination of other possible causal factors, even if combined, still does not demonstrate conclusively that a causal relationship exists. If all the evidence is strong and consistent, however, it may be reasonable to conclude that there is a causal relationship. Accumulated evidence from several investigations increases our confidence that a causal relationship exists. Confidence is further enhanced if the evidence is interpreted in light of intimate conceptual knowledge of the problem situation. Controlled experiments can provide strong evidence on all three conditions.
Definitions and concepts
In this section, we define some basic concepts and illustrate them using the Real Research ‘Advertising creativity matters’ experiment detailed above:
• Independent variables. Independent variables are variables or alternatives that are manipulated (i.e. the levels of these variables are changed by the researcher) and whose effects are measured and compared. These variables, also known as treatments, may include price levels, package designs and advertising themes. In the advertising creativity example, the independent variable was the text used to communicate a message (i.e. ‘more’ or ‘less’ creative).
• Test units. Test units are individuals, organisations or other entities whose response to the independent variables or treatments is being examined. Test units may include con-sumers, stores or geographical areas. In the advertising creativity example, the test units were consumers.
• Dependent variables. Dependent variables are the variables that measure the effect of the independent variables on the test units. These variables may include sales, profits and market shares. In the advertising creativity example, the dependent variable was a meas-ure of favourable attitudes towards the brand being advertised.
• Extraneous variables. Extraneous variables are all variables other than the independent variables that affect the response of the test units. These variables can confound the dependent variable measures in a way that weakens or invalidates the results of the exper-iment. In the advertising creativity example, product categories, brands, visuals and num-ber of words were extraneous variables that had to be controlled.
• Experiment. An experiment is formed when the researcher manipulates one or more independent variables and measures their effect on one or more dependent variables, while controlling for the effect of extraneous variables.6 The advertising creativity research project qualifies as an experiment based on this definition.
• Experimental design. An experimental design is a set of procedures specifying: (1) the test units and how these units are to be divided into homogeneous subsamples; (2) what independent variables or treatments are to be manipulated; (3) what depend-ent variables are to be measured; and (4) how the extraneous variables are to be controlled.7
As a further illustration of these definitions, consider the following example.
Independent variablesVariables that are manipulated by the researcher and whose effects are measured and compared.
Test unitsIndividuals, organisations or other entities whose responses to independent variables or treatments are being studied.
Dependent variablesVariables that measure the effect of the independent variables on the test units.
Extraneous variablesVariables, other than dependent and independent variables, which may influence the results of the experiment.
ExperimentThe process of manipulating one or more independent variables and measuring their effect on one or more dependent variables, while controlling for the extraneous variables.
Experimental designThe set of experimental procedures specifying: (1) the test units and sampling procedures; (2) the independent variables; (3) the dependent variables; and (4) how to control the extraneous variables.

309Chapter 11 Causal research design: experimentation
Real research Engaging consumers through ‘advergames’8
Advertisers are engaging consumers in a game of ‘hide-and-seek’ by embedding brand messages. This strategy, known as branded entertainment, involves integrating elements of brand communication into content that consumers seek out for entertainment. One form of branded entertainment is the advergame, a videogame designed around a brand. Researchers felt that a high degree of thematic connection between an advergame and a brand should strengthen the bond between the game and the brand. This could result in a stronger connection between conditioned brand attitudes and attitude towards the game. This pattern of attitude conditioning should become manifest in a stronger observed rela-tionship between attitude towards the game and attitude towards the brand (dependent variable) as a result of playing advergames with a high degree of thematic connection to the brand, compared with playing advergames with low thematic connection to the brand. The primary hypothesis of an experiment to test this connection was:
H1: There is a stronger positive relationship between attitude towards the game and attitude towards the brand for advergames with a high thematic connection between the game and the brand than for advergames with low thematic connection.
To test this hypothesis, an experiment was created by the travel company Orbitz (www.orbitz.com) in which adult participants (test units) played two advergames. The manipu-lation of the thematic connection involved randomly assigning participants to one of two groups, such that they play either games with a travel-related theme or games that have little to do with travel (experimental design). Attitude towards Orbitz was measured both before the experiment and after participants finished playing the games, at which point they also indicated how much they enjoyed the gaming experience. Participants played two randomly assigned advergames, both with either high or low thematic con-nection (independent variables). Participants in the high-thematic connection advergame condition played ‘Find Your Hotel’ and ‘Gondoliero’, both of which had a travel-related theme that reinforced the association between Orbitz and travel. The object of ‘Find Your Hotel’ was to negotiate a series of obstacles and find a hotel; the object of ‘Gondo-liero’ was to win a series of gondola races set in the canals of Venice. Participants in the low-thematic connection advergame condition played ‘Paper Football’ and ‘Sink The Putt’. ‘Paper Football’ was based on a table game in which one person tries to flick a folded paper triangle between a set of goalposts that another person has made with their fingers. ‘Sink The Putt’ was a computerised version of miniature golf, in which par-ticipants tried to putt a ball into a hole in the fewest possible shots. After entering the laboratory, participants sat at computers (extraneous variable) and provided their informed consent. The study instructions told participants that the researchers were interested in their attitudes towards different online travel companies and indicated how to complete a brand attitude pre-test. When participants had finished playing and evaluating both games, they filled out a post-test measure of brand attitude. The entire experiment lasted approximately one hour. The results suggested that the most effective advergame executions involved the design of product-relevant games. This could be done by building games that engaged players in activities related to a behaviour they would do if they purchased the sponsoring brand’s product. Such efforts may be easier in some product categories than in others. Travel, the category used in this experiment, should be a fairly easy context around which to build product-relevant games.

310 Marketing Research
In the preceding experiment, the independent variable that was manipulated was the level of thematic connection between the brand and game. The dependent variable was the strength of the observed relationship between attitude towards the game and attitude towards the brand. An extraneous variable that was controlled was the device that the advergame was played on – the computer. Games players may engage in different manners dependent upon the gaming device they use. The test units were adult participants. The experimental design required the random assignment of participants to treatment groups (travel related or little to do with travel).
Definition of symbols
To facilitate our discussion of extraneous variables and specific experimental designs, we define a set of symbols now commonly used in marketing research:
X = the exposure of a group to an independent variable, treatment or event, the effects of which are to be determined
O = the process of observation or measurement of the dependent variable on the test units or group of units
R = the random assignment of participants or groups to separate treatments
In addition, the following conventions are adopted:
• Movement from left to right indicates movement through time.
• Horizontal alignment of symbols implies that all those symbols refer to a specific treatment group.
• Vertical alignment of symbols implies that those symbols refer to activities or events that occur simultaneously.
For example, the symbolic arrangement
X O1 O
2
means that a given group of participants was exposed to the treatment variable (X) and the response was measured at two different points in time–O1 and O2.
Likewise, the symbolic arrangement
R X1 O
1
R X2 O
2
means that two groups of participants were randomly assigned to two different treatment groups at the same time, and the dependent variable was measured in the two groups simul-taneously.
Validity in experimentation
When conducting an experiment, a researcher has two goals: (1) to draw valid conclusions about the effects of independent variables on the study group; and (2) to make valid generalisations to a larger population of interest. The first goal concerns internal validity, the second external validity.9
Internal validity
Internal validity refers to whether the manipulation of the independent variables or treat-ments actually caused the observed effects on the dependent variables. Thus, internal validity
Internal validityA measure of accuracy of an experiment. It measures whether the manipulation of the independent variables, or treatments, actually caused the effects on the dependent variable(s).

311Chapter 11 Causal research design: experimentation
refers to whether the observed effects on the test units could have been caused by variables other than the treatment. If the observed effects are influenced or confounded by extraneous variables, it is difficult to draw valid inferences about the causal relationship between the independent and dependent variables. Internal validity is the basic minimum that must be present in an experiment before any conclusion about treatment effects can be made. Without internal validity, the experimental results are confounded. Control of extraneous variables is a necessary condition for establishing internal validity.
External validity
External validity refers to whether the cause-and-effect relationships found in the experi-ment can be generalised. In other words, can the results be generalised beyond the experi-mental situation and, if so, to what populations, settings, times, independent variables and dependent variables can the results be projected?10 Threats to external validity arise when the specific set of experimental conditions does not realistically take into account the interac-tions of other relevant variables in the real world.
It is desirable to have an experimental design that has both internal and external validity, but in applied marketing research we often have to trade one type of validity for another.11 To control for extraneous variables, a researcher may conduct an experiment in an artificial environment. This enhances internal validity, but it may limit the generalisability of the results, thereby reducing external validity. For example, pizza restaurants test customers’ preferences for new formulations of menu items in test kitchens. Can the effects measured in this environment be generalised to pizza restaurants that may operate in a variety of other environments? (Further discussion on the influence of artificiality on external validity may be found in the section of this chapter on laboratory versus field experimentation.) Regard-less of the deterrents to external validity, if an experiment lacks internal validity, it may not be meaningful to generalise the results. Factors that threaten internal validity may also threaten external validity, the most serious of these being extraneous variables.
External validityA determination of whether the cause-and-effect relationships found in the experiment can be generalised.
Extraneous variables
In this section, we classify extraneous variables in the following categories: history, matura-tion, testing effects, instrumentation, statistical regression, selection bias and mortality.
History
Contrary to what the name implies, history (H) does not refer to the occurrence of events before the experiment. Rather, history refers to specific events that are external to the exper-iment but that occur at the same time as the experiment. These events may affect the depend-ent variable. Consider the following experiment:
O1 X
1 O
2
where O1 and O2 are measures of ticket sales to a weekend break built around visiting the Christmas market in Nuremberg, Germany, and X1 represents a new promotional campaign. The difference (O2–O1) is the treatment effect. Suppose that the experiment revealed that there was no difference between O2 and O1. Can we then conclude that the promotional campaign was ineffective? Certainly not! The promotional campaign, X1, is not the only possible explanation of the difference between O2 and O1. The campaign might well have been effective. What if general economic conditions declined during the experiment and the local area was particularly hard hit by redundancies through several employers closing down their operations (history)? Conversely, even if there was some difference between O2 and O1, it may be incorrect to con-clude that the campaign was effective if history was not controlled, because the experimental
HistorySpecific events that are external to the experiment but that occur at the same time as the experiment.

312 Marketing Research
effects might have been confounded by history. The longer the time interval between observa-tions, the greater the possibility that history will confound an experiment of this type.12
Maturation
Maturation (MA) is similar to history except that it refers to changes in participants them-selves. These changes are not caused by the impact of independent variables or treatments but occur with the passage of time. In an experiment involving people, maturation takes place as people become older, more experienced, tired, bored or uninterested. Tracking and market studies that span several months are vulnerable to maturation, since it is difficult to know how participants are changing over time.
Maturation effects also extend to test units other than people. For example, consider the case in which the participants or test units are travel companies. Travel companies change over time in terms of personnel, physical layout, decoration and the range of holidays and services they have to offer.
Testing effects
Testing effects are caused by the process of experimentation. Typically, these are the effects on the experiment of taking a measure on the dependent variable before and after the presen-tation of the treatment. There are two kinds of testing effects: (1) main testing effect (MT), and (2) interactive testing effect (IT).
The main testing effect (MT) occurs when a prior observation affects a later observation. Consider an experiment to measure the effect of advertising on attitudes towards taking a holiday in Egypt. Imagine that participants are given a pre-treatment questionnaire measuring background information and attitude towards holidaying in Egypt. They are then exposed to the test advertise-ment embedded in a TV programme. After viewing the advertisement, the participants again answer a questionnaire measuring, among other things, attitude towards holidaying in Egypt.
Suppose that there was no difference between the pre- and post-treatment attitudes. Can we conclude that the advertisement was ineffective? An alternative explanation might be that the participants tried to maintain consistency between their pre- and post-treatment attitudes. As a result of the main testing effect, post-treatment attitudes were influenced more by pre-treatment attitudes than by the treatment itself. The main testing effect may also be reactive, causing the participants to change their attitudes simply because these attitudes have been measured. The main testing effect compromises the internal validity of the experiment.
In the interactive testing effect (IT), a prior measurement affects the participants’ response to the independent variable. Continuing with our advertising experiment, when people are asked to indicate their attitudes towards taking a holiday in Egypt, they become more aware of Egyptian holidays: they are sensitised to Egyptian holidays and become more likely to pay attention to the test advertisement than are people who were not included in the experiment. The measured effects are then not generalisable to the population; therefore, the interactive testing effects influence the experiment’s external validity.13
Instrumentation
Instrumentation (I) refers to changes in the measuring instrument, in the observers or in the scores themselves. Sometimes measuring instruments are modified during the course of an experiment. In the Egyptian holiday experiment, using a newly designed questionnaire to meas-ure the post-treatment attitudes could lead to variations in the responses obtained. Consider an experiment in which sales at a shoe shop are measured before and after exposure to a promo-tional offer of a discounted music festival ticket (treatment). If there is a non-experimental price change between O1 and O2, this could result in a change in instrumentation, because European sales may be measured using different unit prices. In this case, the treatment effect (O2−O1) could be attributed to a change in instrumentation.
MaturationAn extraneous variable attributable to changes in the test units themselves that occur with the passage of time.
Testing effectsEffects caused by the process of experimentation.
Main testing effectAn effect of testing occurring when a prior observation affects a later observation.
Interactive testing effectAn effect in which a prior measurement affects the test unit response to the independent variable.
InstrumentationAn extraneous variable involving changes in the measuring instrument, in the observers or in the scores themselves.

313Chapter 11 Causal research design: experimentation
Instrumentation effects are likely when interviewers make pre- and post-treatment meas-urements. The effectiveness of interviewers can be different at different times.
Statistical regression
Statistical regression (SR) effects occur when participants with extreme scores move closer to the average score during the course of the experiment. In the Egyptian holiday advertising experiment, suppose that in a pre-test measurement some participants had either very favour-able or very unfavourable attitudes towards the country of Egypt. On post-treatment meas-urement, their attitudes might have moved towards the average. Consumer attitudes change continuously for a wide variety of reasons. Consumers with extreme attitudes have more room for change, so variation may be more likely. This has a confounding effect on the experimental results, because the observed effect (change in attitude) may be attributable to statistical regression rather than to the treatment (test advertisement).
Selection bias
Selection bias (SB) refers to the improper assignment of participants to treatment condi-tions. This bias occurs when selection or assignment of participants results in treatment groups that differ on the dependent variable before the exposure to the treatment condition. If participants self-select their own groups, or are assigned to groups on the basis of the researchers’ judgement, selection bias is possible. For example, consider an experiment in which two different merchandising displays (old static display and new audio-visual dis-play) are assigned to different branches of a travel company. The branches in the two groups may not be equivalent to begin with. They may vary with respect to a key characteristic, such as branch size. Branch size is likely to affect the sales of holidays, regardless of which mer-chandising display was assigned to a branch.
Mortality
Mortality (MO) refers to the loss of participants while the experiment is in progress. This hap-pens for many reasons, such as participants refusing to continue in the experiment. Mortality confounds results because it is difficult to determine whether the lost participants would respond in the same manner to the treatments as those that remain. Consider again the merchandising display experiment. Suppose that during the course of the experiment, three branches in the new audio-visual display drop out because they feel the noise is not conducive to negotiations with certain types of client (e.g. the type of customer that would spend 10,000 on a luxury cruise). The researcher could not determine whether the average sales of holidays for the new display would have been higher or lower if these three branches had continued in the experiment.
The various categories of extraneous variables are not mutually exclusive; they can occur jointly and also interact with each other. To illustrate, testing–maturation–mortality refers to a situation in which, because of pre-treatment measurement, the participants’ beliefs and attitudes change over time and there is a differential loss of participants from the various treatment groups.
Statistical regressionAn extraneous variable that occurs when participants with extreme scores move closer to the average score during the course of the experiment.
Selection biasAn extraneous variable attributable to the improper assignment of participants to treatment conditions.
MortalityAn extraneous variable attributable to the loss of participants while the experiment is in progress.
Controlling extraneous variables
Extraneous variables represent alternative explanations of experimental results. They pose a serious threat to the internal and external validity of an experiment. Unless they are con-trolled, they affect the dependent variable and thus confound the results. For this reason, they are also called confounding variables. There are four ways of controlling extraneous vari-ables: randomisation, matching, statistical control and design control.
Confounding variablesSynonymous with extraneous variables, confounding variables are used to illustrate that extraneous variables can confound the results by influencing the dependent variable.

314 Marketing Research
Randomisation
Randomisation refers to the random assignment of participants to experimental groups by using random numbers. Treatment conditions are also randomly assigned to experimental groups. In the three Real Research examples presented above, participants were randomly assigned. To illustrate further in an experiment of a test advertisement, participants may be ran-domly assigned to one of three experimental groups. One of the three versions of the test adver-tisement, selected at random, is administered to each group. As a result of random assignment, extraneous factors can be represented equally in each treatment condition. Randomisation is the preferred procedure for ensuring the prior equality of experimental groups,14 but it may not be effective when the sample size is small because it merely produces groups that are equal on aver-age. It is possible, though, to check whether randomisation has been effective by measuring the possible extraneous variables and comparing them across the experimental groups.
Matching
Matching involves comparing participants on a set of key background variables before assigning them to the treatment conditions. In the merchandising display (old static display and new audio-visual display) experiment, travel company branches could be matched on the basis of turnover, size, proportion of retail to corporate clients, or location. Then one branch from each matched pair would be assigned to each experimental group.
Matching has two drawbacks. First, participants can be matched on only a few character-istics, so the participants may be similar on the variables selected but unequal on others. Second, if the matched characteristics are irrelevant to the dependent variable, then the matching effort has been futile.15
Statistical control
Statistical control involves measuring the extraneous variables and adjusting for their effects through statistical analysis. This was illustrated in Table 11.2, which examined the relationship (association) between purchase of skiing holidays and education, controlling for the effect of income. More advanced statistical procedures, such as analysis of covariance (ANCOVA), are also available. In ANCOVA, the effects of the extraneous variable on the dependent variable are removed by an adjustment of the dependent variable’s mean value within each treatment condition. (ANCOVA is discussed in more detail in Chapter 17.)
Design control
Design control involves the use of experiments designed to control specific extraneous vari-ables. The types of controls made possible by suitably designing the experiment are illus-trated with the following example.
RandomisationA method of controlling extraneous variables that involves randomly assigning participants to experimental groups by using random numbers. Treatment conditions are also randomly assigned to experimental groups.
MatchingA method of controlling extraneous variables that involves matching participants on a set of key background variables before assigning them to the treatment conditions.
Statistical controlA method of controlling extraneous variables by measuring the extraneous variables and adjusting for their effects through statistical methods.
Design controlA method of controlling extraneous variables that involves using specific experimental designs.
Real research Experimenting with new products16
Controlled-distribution electronic test markets are used increasingly to conduct experimental research on new products. This method makes it possible to create a design that controls for several extraneous factors. The control can allow for the manipulation of variables that can affect the success of new products. In manipu-lating variables, it is possible to ensure that a new product:

315Chapter 11 Causal research design: experimentation
This example shows that controlled-distribution electronic test markets can be effective in controlling for specific extraneous variables. Extraneous variables can also be controlled by adopting specific experimental designs, as described in the next section.
• obtains the right level of supermarket acceptance and all commodity volume distribution;
• is positioned in the correct aisle in each supermarket;
• receives the right number of facings on the shelf;
• has the correct everyday price;
• never has out-of-stock problems;
• obtains the planned level of trade promotion, display and price features on the desired time schedule.
By being able to control these variables, a high degree of internal validity can be obtained.
A classification of experimental designs
Experimental designs may be classified as pre-experimental, true experimental, quasi-experimental and statistical designs; see Figure 11.1.
Pre-experimental designs do not employ randomisation procedures to control for extrane-ous factors. Examples of these designs include the one-shot case study, the one-group pre-test–post-test design and the static group. In true experimental designs, the researcher can randomly assign participants to experimental groups and treatments to experimental groups. Included in this category are the pre-test–post-test control group design, the post-test-only control group design and the Solomon four-group design. Quasi-experimental designs result when the researcher is unable to achieve full manipulation of scheduling or allocation of treatments to participants but can still apply part of the apparatus of the experimentation. Two such designs are time series and multiple time series designs. A statistical design is a
Pre-experimental designsDesigns that do not control for extraneous factors by randomisation.
True experimental designsExperimental designs distinguished by the fact that the researcher can randomly assign participants to experimental groups and also randomly assign treatments to experimental groups.
Trueexperimental
Pre-test–post-test controlgroup
Post-test-onlycontrol group
Solomon four-group
Pre-experimental
One-shot casestudy
One-group pre-test–post-test
Static group
Time series
Multiple timeseries
Statistical
Randomisedblocks
Latin square
Factorialdesign
Experimental designs
Quasi-experimental
Figure 11.1
A classification of experimental designs

316 Marketing Research
series of basic experiments that allows for statistical control and analysis of external varia-bles. Statistical designs are classified based on their characteristics and use. The important statistical designs include randomised block, Latin square and factorial.17
We begin our discussion with the first type of experimental design: pre-experimental.
Quasi-experimental designsDesigns that apply part of the procedures of true experimentation but lack full experimental control.
Statistical designsDesigns that allow for the statistical control and analysis of external variables.
One-shot case studyA pre-experimental design in which a single group of participants is exposed to a treatment X, and then a single measurement of the dependent variable is taken.
Pre-experimental designs
These designs are characterised by an absence of randomisation. Three specific designs are described: the one-shot case study, the one-group pre-test–post-test design and the static group design.
One-shot case study
Also known as the after-only design, the one-shot case study may be symbolically repre-sented as:
X1 O
1
A single group of participants is exposed to a treatment X, and then a single measurement on the dependent variable is taken (O1). There is no random assignment of participants. Note that the symbol R is not used, because the participants are self-selected or selected arbitrarily by the researcher.
The danger of drawing valid conclusions from experiments of this type can be easily seen. They do not provide a basis of comparing the level of O1 with what would happen if X were absent. In addition, the level of O1 might be affected by many extraneous variables, includ-ing history, maturation, selection and mortality. Lack of control for these extraneous varia-bles undermines the internal validity. For these reasons, the one-shot case study is more appropriate for exploratory than for conclusive research.
One-group pre-test–post-test design
The one-group pre-test–post-test design may be symbolised as:
O1 X O
2
In this design, a group of participants is measured twice. There is no control group. First a pre-treatment measure is taken (O1), then the group is exposed to the treatment (X). Finally, a post-treatment measure is taken (O2). The treatment effect is computed as (O2–O1) but the validity of this conclusion is questionable since extraneous variables are largely uncon-trolled. History, maturation, testing (both main and interactive testing effects), instrumenta-tion, selection, mortality and regression could possibly be present.
Static group design
The static group is a two-group experimental design. One group, called the experimental group (EG), is exposed to the treatment, and the other, called the control group (CG), is not. Measurements on both groups are made only after the treatment, and participants are not assigned at random. This design may symbolically be described as:
EG: X O1
CG: O2
The treatment effect would be measured as (O1–O2). Notice that this difference could also be attributed to at least two extraneous variables (selection and mortality). Because participants
One-group pre-test–post-test designA pre-experimental design in which a group of participants is measured twice.
Static groupA pre-experimental design in which there are two groups: the experimental group (EG), which is exposed to the treatment, and the control group (CG). Measurements on both groups are made only after the treatment, and participants are not assigned at random.

317Chapter 11 Causal research design: experimentation
are not randomly assigned, the two groups (EG and CG) may differ before the treatment, and selection bias may be present. There may also be mortality effects, as more participants may withdraw from the experimental group than from the control group. This would be particu-larly likely to happen if the treatment were unpleasant.
In practice, a control group is sometimes defined as the group that receives the current level of marketing activity, rather than a group that receives no treatment at all. The control group is defined in this way because it is difficult to reduce current marketing activities, such as advertising and personal selling, to zero.
True experimental designs
The distinguishing feature of true experimental designs, compared with pre-experimental designs, is randomisation. In true experimental designs, the researcher randomly assigns participants to experimental groups and treatments to experimental groups. True experimen-tal designs include the pre-test–post-test control group design, the post-test-only control group design and the Solomon four-group design.
Pre-test–post-test control group design
In the pre-test–post-test control group design, participants are randomly assigned to either the experimental or the control group and a pre-treatment measure is taken on each group. Then the treatment is applied to the experimental group, and a post-treatment measure is taken from both groups. This design is symbolised as:
EG: R O1 X O
2
CG: R O3 O
4
The treatment effect (TE) is measured as:
(O2–O
1) – (O
4–O
3)
This design controls for most extraneous variables. Selection bias is eliminated by randomi-sation. The other extraneous effects are controlled as follows:
O2– O
1 = TE + H + MA + MT + IT + I + SR + MO
O4– O
3 = H + MA + MT + I + SR + MO
= EV (extraneous variables)
where the symbols for the extraneous variables are as defined previously. The experimental result is obtained by:
(O2–O
1) – (O
4–O
3) = TE + IT
The interactive testing effect is not controlled, because of the effect of the pre-test measure-ment on the reaction of participants in the experimental group to the treatment.
The pre-test–post-test control group design involves two groups and two measurements on each group. A simpler design is the post-test-only control group design.
Post-test-only control group design
The post-test-only control group design does not involve any pre-measurement. It may be symbolised as:
EG: R X O1
CG: R O2
Pre-test–post-test control group designAn experimental design in which the experimental group is exposed to the treatment but the control group is not. Pre-test and post-test measures are taken on both groups.
Post-test-only control group designExperimental design in which the experimental group is exposed to the treatment but the control group is not and no pre-test measure is taken.

318 Marketing Research
The treatment effect is obtained by:
TE = O1–O
2
This design is fairly simple to implement. Because there is no pre-measurement, the testing effects are eliminated, but this design is sensitive to selection bias and mortality. It is assumed that the two groups are similar in terms of pre-treatment measures on the depend-ent variable because of the random assignment of participants to groups. Because there is no pre-treatment measurement, this assumption cannot be checked. This design is also sen-sitive to mortality. It is difficult to determine whether those in the experimental group who discontinue the experiment are similar to their counterparts in the control group. Yet another limitation is that this design does not allow the researcher to examine changes in individual participants.
It is possible to control for selection bias and mortality through carefully designed experimental procedures. Examination of individual cases is often not of interest. On the other hand, this design possesses significant advantages in terms of time, cost and sample size requirements. It involves only two groups and only one measurement per group. Because of its simplicity, the post-test-only control group design is probably the most popular design in marketing research. Note that, except for pre-measurement, the imple-mentation of this design is very similar to that of the pre-test–post-test control group design.
Solomon four-group design
When information about the changes in the attitudes of individual participants is desired, the Solomon four-group design should be considered. The Solomon four-group design overcomes the limitations of the pre-test–post-test control group and post-test-only control group designs in that it explicitly controls for the interactive testing effect, in addition to controlling for all the other extraneous variables. However, this design has practical limita-tions: it is expensive and time-consuming to implement. Hence, it is not considered further.18
In all true experimental designs, the researcher exercises a high degree of control. In particular, the researcher can control when the measurements are taken, on whom they are taken and the scheduling of the treatments. Moreover, the researcher can randomly select the test units and randomly expose test units to the treatments. In some instances, the researcher cannot exercise this kind of control; then quasi-experimental designs should be considered.
Solomon four-group designAn experimental design that explicitly controls for interactive testing effects, in addition to controlling for all the other extraneous variables.
Quasi-experimental designs
A quasi-experimental design results under the following conditions. First, the researcher cannot control when measurements are taken and on whom they are taken. Second, the researcher lacks control over the scheduling of the treatments and also is unable to expose participants to the treatments randomly.19 Quasi-experimental designs are useful because they can be used in cases when true experimentation cannot be used, and because they are quicker and less expensive.
Because full experimental control is lacking, the researcher must consider the specific variables that are not controlled. Popular forms of quasi-experimental designs are time series and multiple time series designs.

319Chapter 11 Causal research design: experimentation
Time series design
The time series design involves a series of periodic measurements on the dependent variable for a group of participants. The treatment is then administered by the researcher or occurs naturally. After the treatment, periodic measurements are continued to determine the treat-ment effect. A time series experiment may be symbolised as:
O1 O
2 O
3 O
4 O
5 O
6 O
7 O
8 O
9 O
10
This is a quasi-experiment, because there is no randomisation of participants to treatments, and the timing of treatment presentation, as well as which participants are exposed to the treatment, may not be within the researcher’s control (hence no specific X symbolised above).
Taking a series of measurements before and after the treatment provides at least partial control for several extraneous variables. Maturation is at least partially controlled, because it would not affect O5 and O6 alone but would also influence other observations. By similar reasoning, the main testing effect and statistical regression are controlled as well. If the par-ticipants are selected randomly or by matching, selection bias can be reduced. Mortality may pose a problem, but it can be largely controlled by paying a premium or offering other incen-tives to participants.
The major weakness of the time series design is the failure to control history. Another limitation is that the experiment may be affected by the interactive testing effect because multiple measurements are being made on the participants. Nevertheless, time series designs are useful. The effectiveness of a test advertisement (X) may be examined by broadcasting the advertisement a predetermined number of times and examining the data from a pre-existing test panel. Although the marketer can control the scheduling of the test advertisement, it is uncertain when or whether the panel members are exposed to it. The panel members’ purchases before, during and after the campaign are examined to determine whether the test advertisement has a short-term effect, a long-term effect or no effect.
Multiple time series design
The multiple time series design is similar to the time series design except that another group of participants is added to serve as a control group. Symbolically, this design may be described as:
EG: O1 O
2 O
3 O
4 O
5 X O
6 O
7 O
8 O
9 O
10
CG: O11
O12
O13
O14
O15
O16
O17
O18
O19
O20
If the control group is carefully selected, this design can be an improvement over the simple time series experiment. The improvement lies in the ability to test the treatment effect twice: against the pre-treatment measurements in the experimental group and against the control group. To use the multiple time series design to assess the effectiveness of an advertisement, the test panel example would be modified as follows. The test advertisement would be shown in only a few of the test cities. Panel members in these cities would make up the experimen-tal group. Panel members in cities where the advertisement was not shown would constitute the control group.
In concluding our discussion of pre-experimental, true experimental and quasi-experi-mental designs, we summarise in Table 11.3 the potential sources of invalidity that may affect each of these designs. In this table, a minus sign indicates a definite weakness, a plus sign indicates that the factor is controlled, a question mark denotes a possible source of con-cern and a blank means that the factor is not relevant. It should be remembered that potential sources of invalidity are not the same as actual errors.
Time series designA quasi-experimental design that involves periodic measurements of the dependent variable for a group of participants. Then the treatment is administered by the researcher or occurs naturally. After the treatment, periodic measurements are continued to determine the treatment effect.
Multiple time series designA time series design that includes another group of participants to serve as a control group.

320 Marketing Research
Table 11.3
Source of invalidity
Internal variablesExternal variables
Design
Hist
ory
Mat
urat
ion
Test
ing
Inst
rum
enta
tion
Regr
essio
n
Sele
ctio
n
Mor
talit
y
Inte
ract
ion
of
test
ing
and
X
Pre-experimental designs
One-shot case study − − − −
X O
One-group pretest–post-test design − − − − ? −
O X O
Static group comparison X O O
+ ? + + + − −
True experimental designs
Pre-test–post-test control group
R O X O + + + + + + + −
R O O
Post-test-only control group design + + + + + + +
R X O
R O
Quasi-experimental designs
Time series
O O O X O O O − + + ? + + + −
Multiple time series + + + + + + +
O O O X O O O
O O O O O O
Note: A minus sign indicates a definite weakness, a plus sign indicates that the factor is controlled, a question mark denotes a possible source of concern and a blank means that the factor is not relevant.
Potential sources of invalidity of experimental designs
Statistical designs
Statistical designs consist of a series of basic experiments that allow for statistical control and analysis of external variables. In other words, several basic experiments are conducted simultaneously. Thus, statistical designs are influenced by the same sources of invalidity that affect the basic designs being used. Statistical designs offer the following advantages:
1 The effects of more than one independent variable can be measured.
2 Specific extraneous variables can be statistically controlled.
3 Economical designs can be formulated when each participant is measured more than once.

321Chapter 11 Causal research design: experimentation
The most common statistical designs are the randomised block design, the Latin square design and the factorial design.
Randomised block design
A randomised block design is useful when there is only one major external variable – such as sales, store size or income of the participant – that might influence the dependent variable. The participants are blocked or grouped on the basis of the external variable. The researcher must be able to identify and measure the blocking variable. By blocking, the researcher ensures that the various experimental and control groups are matched closely on the external variable.
In most marketing research situations, external variables such as sales, store size, store type, location, income, occupation and social class of the participant can influence the dependent variable. Therefore, generally speaking, randomised block designs are more use-ful than completely random designs (see Table 11.4). Their main limitation is that the researcher can control for only one external variable. When more than one variable must be controlled, the researcher must use Latin square or factorial designs.
Randomised block designA statistical design in which the participants are blocked on the basis of an external variable to ensure that the various experimental and control groups are matched closely on that variable.
Table 11.4
Treatment groups
Block number Mercedes usage Advertisement A Advertisement B Advertisement C
1 High A B C
2 Medium A B C
3 Light A B C
4 None A B C
An example of a randomised block design
Table 11.5
Interest in watching Formula One races
Mercedes usage High Medium Low
High B A C
Medium C B A
Light and none A C B
Note: A, B and C denote three test advertisements, which have, respectively, no humour, some humour and high humour.
An example of a Latin square design
Latin square design
A Latin square design allows the researcher to control statistically two non-interacting external variables as well as to manipulate the independent variable. Each external or block-ing variable is divided into an equal number of blocks or levels. The independent variable is also divided into the same number of levels. A Latin square is conceptualised as a table (see Table 11.5), with the rows and columns representing the blocks in the two external variables. The levels of the independent variable are then assigned to the cells in the table. The assign-ment rule is that each level of the independent variable should appear only once in each row and each column, as shown in Table 11.5.
Latin square designA statistical design that allows for the statistical control of two non-interacting external variables in addition to the manipulation of the independent variable.

322 Marketing Research
Although Latin square designs are popular in marketing research, they are not without limitations. They require an equal number of rows, columns and treatment levels, which is sometimes problematic. Note that, in the above example, the low users and non-patrons had to be combined to satisfy this requirement. In addition, only two external variables can be controlled simultaneously. Latin squares do not allow the researcher to examine interactions of the external variables with each other or with the independent variable. To examine inter-actions, factorial designs should be used.
Factorial design
A factorial design is used to measure the effects of two or more independent variables at various levels. Unlike the randomised block design and the Latin square, factorial designs allow for interactions between variables.20 An interaction is said to take place when the simultaneous effect of two or more variables is different from the sum of their separate effects. For example, an individual’s favourite drink might be coffee and favourite tempera-ture level might be cold, but this individual might not prefer cold coffee, leading to an inter-action. The following example presents a situation where variables interacted and a factorial design was used.
Factorial designA statistical experimental design used to measure the effects of two or more independent variables at various levels and to allow for interactions between variables.
Real research Choosing a tour route in South America21
A study was conducted by Spanish research-ers on students in their last year of university who wished to make an end-of-year trip for 15 days during their Easter holiday. An exper-iment was conducted to determine how a holiday package should be designed. More specifically, the researchers wished to deter-mine the tour route and services in South America that would best satisfy the needs of their target market. Four relevant and very specific attributes were chosen for the study: the meal plan (four to eight days on half-board and the rest on bed and breakfast), accommodation at an Amazon lodge, an excursion to Colca Canyon and a sightseeing flight over the Nazca Lines. If all four rele-vant attributes were chosen, the cost of delivering this would exceed what could be afforded by this target market. Thus, the researchers had to find the exact combination of attributes that gave the best deal as seen by their target market. To ascertain exactly which of these four attributes determined the process of choosing a route, and what effect their interaction generated, they proposed an experiment using a two-level facto-rial design. The advantages of such a design were that it required very few elemental experiments for each factor, providing them with trends for determining the direction for future experiments and allowing the sequential investigation required by causal analysis.
A factorial design may also be conceptualised as a table. In a two-factor design, each level of one variable represents a row and each level of another variable represents a column. Multi-dimensional tables can be used for three or more factors. Factorial designs involve a cell for every possible combination of treatment variables. Suppose that in the example of a Mercedes advert, in addition to examining the effect of humour, the researcher is also inter-ested in simultaneously examining the effect of the amount of information about the perfor-mance of the Mercedes E-Class that came over in the advertisement. Further, the amount of

323Chapter 11 Causal research design: experimentation
information is also varied at three levels (high, medium and low). As shown in Table 11.6, this would require 3 × 3 = 9 cells. The participants would be randomly selected and ran-domly assigned to the nine cells. Participants in each cell would receive a specific treatment combination. For example, participants in the upper-left corner cell would view an advertise-ment that had no-humour and low information about the performance of the Mercedes E-Class. The results reveal a significant interaction between the two factors or variables. Participants with a low amount of Mercedes information preferred the high-humour adver-tisement (C). Those with a high amount of Mercedes information, however, preferred the no-humour film clip (G). Notice that, although Table 11.6 may appear somewhat similar to Table 11.4, the random assignment of participants and data analysis are very different for the randomised block design and the factorial design.22
Table 11.6
Amount of Mercedes E-Class
information
Amount of humour
No humour Some humour High humour
Low A B C
Medium D E F
High G H I
An example of a factorial design
The main disadvantage of a factorial design is that the number of treatment combinations increases multiplicatively with an increase in the number of variables or levels. In our exam-ple of Table 11.6, if the amount of humour and Mercedes information had five levels each instead of three, the number of cells would jump from 9 to 25. All the treatment combina-tions are required if all the main effects and interactions are to be measured. If the researcher is interested in only a few of the interactions or main effects, fractional factorial designs may be used. As their name implies, these designs consist of only a fraction, or portion, of the corresponding full factorial design.
Laboratory versus field experiments
Experiments may be conducted in a laboratory or field environment. A laboratory environment is an artificial one that the researcher constructs with the desired conditions specific to the experiment. A field environment is synonymous with actual market condi-tions. The earlier example of the advergame experiment of designing a videogame around a brand was conducted in a laboratory environment, where participants sat at computers in a given room to play the tested games. The same experiment could also be conducted in a field environment by allowing the participants to play the games on devices wherever they felt comfortable. The differences between the two environments are summarised in Table 11.7.
Laboratory experiments have the following advantages over field experiments:
• The laboratory environment offers a high degree of control because it isolates the experiment in a carefully monitored environment. Therefore, the effects of history can be minimised.
• A laboratory experiment also tends to produce the same results if repeated with similar participants, leading to high internal validity.
• Laboratory experiments tend to use a small number of participants, last for a shorter time, be more restricted geographically and are easier to conduct than field experiments. Hence, they are generally less expensive as well.
Laboratory environmentAn artificial setting for experimentation in which the researcher constructs the desired conditions.
Field environmentAn experimental location set in actual market conditions.

324 Marketing Research
Compared with field experiments, laboratory experiments suffer from some main disad-vantages:
• The artificiality of the environment may cause reactive error, in that participants react to the situation itself rather than to the independent variable.23
• The environment may cause demand artefacts – a phenomenon in which participants attempt to guess the purpose of the experiment and respond accordingly. For example, while viewing a film clip, participants may recall pre-treatment questions about the brand and guess that the advertisement is trying to change their attitudes towards the brand.24
• Finally, laboratory experiments are likely to have lower external validity than field exper-iments. Because a laboratory experiment is conducted in an artificial environment, the ability to generalise the results to the real world may be diminished.
Demand artefactsResponses given because participants attempt to guess the purpose of the experiment and respond accordingly.
Table 11.7
Factor Laboratory Field
Environment Artificial Realistic
Control High Low
Reactive error High Low
Demand artefacts High Low
Internal validity High Low
External validity Low High
Time Short Long
Number of participants Small Large
Ease of implementation High Low
Cost Low High
Laboratory versus field experiments
It has been argued that artificiality or lack of realism in a laboratory experiment need not lead to lower external validity. One must be aware of the aspects of the laboratory experiment that differ from the situation to which generalisations are to be made. External validity will be reduced only if these aspects interface with the independent variables explicitly manipulated in the experiment, as is often the case in applied marketing research. Another consideration, however, is that laboratory experiments allow for more complex designs than field experi-ments. Hence, the researcher can control for more factors or variables in the laboratory setting, which increases external validity.25
The researcher must consider all these factors when deciding whether to conduct labora-tory or field experiments. Field experiments are less common in marketing research than labo-ratory experiments, although laboratory and field experiments play complementary roles.26
Field experiments in international markets
If field experiments are difficult to conduct in developed economies, the challenge they pose is greatly increased in less developed markets. In many countries, the marketing, economic, structural, information and technological environment is not developed to the extent that it is in areas such as Western Europe and North America. In some countries in Asia, Africa and South America, much of the population lives in small towns and villages. Yet basic infra-structure such as roads, transportation and warehouse facilities are lacking, making it diffi-cult to achieve desired levels of distribution. Even when experiments are designed in such countries, it is difficult to control for the time order of occurrence of variables and the absence

325Chapter 11 Causal research design: experimentation
Experimental versus non-experimental designs
In Chapter 3, we discussed three types of research designs: exploratory, descriptive and causal. Of these, it may be argued that causal designs are the most appropriate for inferring and measuring cause-and-effect relationships (though not the only way, as may be argued by the adherents to grounded research approaches, introduced in Chapter 6). Although descriptive survey data are often used to provide evidence of ‘causal’ relationships, these studies do not meet all the conditions required for causality. For example, it is difficult in descriptive studies to establish the prior equivalence of the participant groups with respect to both the independent and dependent variables. On the other hand, an experiment can establish this equivalence by random assignment of participants to groups. In descriptive research, it is also difficult to establish the time order of occurrence of variables. In an experiment, however, the researcher controls the timing of the measurements and the intro-duction of the treatment. Finally, descriptive research offers little control over other possi-ble causal factors.
We do not wish to undermine the importance of descriptive research designs in marketing research. Descriptive research constitutes the most popular research design in marketing research, and we do not want to imply that it should never be used to examine causal rela-tionships. Indeed, some authors have suggested procedures for drawing causal inferences from descriptive (non-experimental) data.27 Rather, our intent is to alert the reader to the limitations of descriptive research for examining causal relationships. Likewise, we also want to make the reader aware of the limitations of experimentation.28
Experimentation is an important research design that gives the ability to infer causal rela-tionships. In marketing research terms, it has been used primarily in the field of communica-tions and advertising.29 However, it has limitations of time, cost and administration of an experiment, with these limitations meaning that experimental techniques have a relatively low penetration into marketing research practice.30
Time
Experiments can be time-consuming, particularly if the researcher is interested in measuring the long-term effects of the treatment, such as the effectiveness of an advertising campaign. Experiments should last long enough so that the post-treatment measurements include most or all of the effects of the independent variables.
Cost
Experiments are often expensive. The requirements of experimental group, control group and multiple measurements significantly add to the cost of research.
Administration
Experiments can be difficult to administer. It may be impossible, in measuring human activity, to control for the effects of the extraneous variables, particularly in a field envi-ronment. Field experiments often interfere with a company’s ongoing operations, and
of other possible causal factors – two of the necessary conditions for causality. Because the researcher has little control over the environment, control of extraneous variables is particu-larly problematic. Furthermore, it may not be possible to address this problem by adopting the most appropriate experimental design, as environmental constraints may make that design infeasible. Thus, the internal and external validity of field experiments conducted in developing markets is generally lower than in those that are more economically developed.

326 Marketing Research
Real research Developing the Boots brand for a European launch31
Boots (www.boots.com) was a virtually unknown consumer brand in mainland Europe. Where it existed, any brand awareness associated it with ‘drugstore’ health and beauty retailing, a far cry from the traditional, specialist, advice-led European pharmacy. A key challenge faced by Boots was how to leverage its expertise in product development, manufacturing, sourcing and distribution to build brand equity for the Boots brand across Europe. Boots planned a major international brand creation involving four key markets (France, Spain, Italy and Portugal), with a key business objective of launching a master brand and supporting product portfolio. This would involve concept and positioning development, naming approaches and an identity that could be communicated through product, range, packaging and collateral design. Initial research among some 1,500 Euro-pean pharmacy and consumer targets indicated that pharmacy consumers had a very specific set of needs and looked for particular attributes in their choice of brands. While virtually unknown as a consumer brand in Europe, Boots Healthcare had developed equity and heritage for Boots as a ‘laboratory’ with pharmacists in key markets. Based upon this awareness, the master brand positioning was developed under the name of ‘Boots Laboratories’, building on the brand’s heritage and awareness among health care professionals. The Boots Laboratories’ visual identity was created to reflect the ‘scientific’ heritage and health care credentials. France was selected as the lead and test market for the brand. France had a strong and established range of skincare brands and was notori-ously difficult to ‘crack’. All agreed that it would provide a challenging test market for the new brand. The research and launch programme covered the following stages: (1) quan-titative strategic research; (2) qualitative concept research; (3) quantitative concept/design test; (4) trade launch; and (5) consumer launch in France and Portugal. The test reactions to the brand were very positive, with a strong appeal and very good levels of unpriced purchase intent. The Boots range was seen as a good fit with the pharmacy envi-ronment, with 94% describing it as being appropriate to be sold in French pharmacies.
Test marketing involves a replication of a planned national or, as in the Boots example, international marketing programme in selected test markets. Often, the marketing mix vari-ables (independent variables) are varied in test marketing and the sales (dependent variable) are monitored so that an appropriate national marketing strategy can be identified. The two major objectives of test marketing are (1) to determine market acceptance of the product
Application: test marketing
Test marketing, also called market testing, is an application of a controlled experiment con-ducted in limited but carefully selected parts of the marketplace called test markets. The following example illustrates what decisions may be supported through a test market, and some of the challenges faced.
Test marketA carefully selected part of the marketplace particularly suitable for test marketing.
obtaining cooperation from the retailers, wholesalers and others involved may be difficult. Finally, competitors may deliberately contaminate the results of a field experiment. These limitations have given rise to the use of grounded theory approaches, especially in devel-oping an understanding of consumer behaviour that may be impossible to encapsulate through experiments.
Test marketingAn application of a controlled experiment done in limited, but carefully selected, test markets. It involves a replication of the planned national marketing programme for a product in test markets.

327Chapter 11 Causal research design: experimentation
and (2) to test alternative levels of marketing mix variables. Test-marketing procedures may be classified as standard test markets, controlled and mini-market tests and simulated test marketing.
Standard test market
In a standard test market, test markets are selected and the product is sold through regular distribution channels, which could include online outlets. Typically, the company’s own sales force is responsible for distributing the product. Sales personnel manage the stocking, restocking and monitoring inventory at regular intervals. One or more combinations of mar-keting mix variables (product, price, distribution and promotional levels) are employed.
Designing a standard test market involves deciding what criteria are to be used for select-ing test markets, how many test markets to use and the duration of the test. Care must be taken in establishing the rationale for the choice of a test market. In general, the more test markets that can be used, the better. If resources are limited, at least two test markets should be used for each programme variation to be tested. Where external validity is important, however, at least four test markets should be used. The criteria for the ideal selection of test markets may be summarised as:32
1 Large enough to produce meaningful projections; they should contain at least 2% of the potential target population.
2 Representative demographically.
3 Representative with respect to product consumption behaviour.
4 Representative with respect to media usage.
5 Representative with respect to competition.
6 Relatively isolated in terms of media and physical distribution.
7 Having normal historical development in the product class.
8 Having marketing research and auditing services available.
9 Not overtested.
The duration of the test depends on the repurchase cycle for the product, the probability of competitive response, cost considerations, the initial consumer response and company phi-losophy. The test should last long enough for repurchase activity to be observed. This indi-cates the long-term impact of the product. If competitive reaction to the test is anticipated, the duration should be short. The cost of the test is also an important factor. The longer a test is, the more it costs, and at some point the value of additional information is outweighed by its costs. Recent evidence suggests that tests of new brands whose product life cycle is pro-jected in ‘years’ should run for at least 10 months. An empirical analysis found that the final test-market share was reached in 10 months 85% of the time, and in 12 months 95% of the time.33 Test marketing is not without risks, but it can be very beneficial to a product’s suc-cessful introduction,
A standard test market constitutes a one-shot case study. In addition to the problems asso-ciated with this design, test marketing faces two unique problems. First, competitors often take actions such as increasing their promotional efforts to contaminate the test-marketing programme. When Procter & Gamble test marketed Wondra, a hand-and-body lotion, the market leader, Cheeseborough Ponds, started a competitive buy-one-get-one-free promotion for its flagship brand, Vaseline Intensive Care lotion. This encouraged consumers to stock up on Vaseline Intensive Care lotion and, as a result, Wondra did poorly in the test market. In spite of this, Procter & Gamble still launched the line nationally. Ponds again countered with the same promotional strategy. Vaseline Intensive Care settled with a market share of 22%
Standard test marketA test market in which the product is sold through regular distribution channels. For example, no special considerations are given to products simply because they are being test marketed.

328 Marketing Research
while Procter & Gamble achieved just 4%.34 Another problem is that, while a firm’s test marketing is in progress, competitors have an opportunity to beat it to the national market. Sometimes it is not feasible to implement a standard test market using the company’s per-sonnel. Instead, the company must seek help from an outside supplier, in which case the controlled test market may be an attractive option.
Controlled test market
In a controlled test market, the entire test-marketing programme is conducted by an outside research company. The research company guarantees distribution of the product in retail outlets that represent a predetermined percentage of the market. It handles warehousing and field sales operations, such as stocking shelves, selling and stock control. The controlled test market includes both mini-market (or forced distribution) tests and the smaller controlled store panels. An excellent example of this is provided by the German research firm, GfK (www.gfk.com).
Simulated test market
Also called a laboratory test or test-market simulation, a simulated test market yields math-ematical estimates of market share based on the initial reaction of consumers to a new prod-uct. The procedure works as follows. Typically, participants are intercepted in busy locations, such as shopping centres, and pre-screened for product usage. The selected individuals are exposed to the proposed new product concept and given an opportunity to buy the new prod-uct in a real-life or laboratory environment. Those who purchase the new product are inter-viewed about their evaluation of the product and repeat-purchase intentions. The trial and repeat-purchase estimates so generated are combined with data on proposed promotion and distribution levels to project a share of the market. Simulated test markets can be conducted in 16 weeks or less. The information they generate is confidential and the competition cannot obtain it. They are also relatively inexpensive.
Simulated test markets became widely adopted by major manufacturers around the world as an alternative to test marketing, which was slower, more expensive and less secure.35 However, the role of simulated test markets has changed. In the past the focus was helping to decide on the go/no decision and providing diagnostics to improve the product performance (communication, package, price and product) before launch. More recently, the go/no deci-sions are typically made in advance of a simulated test market and it serves primarily as a disaster check. Also, improvements in product performance need to be made earlier in the process and are based on other research (concept, copy, product, price, or package studies). By the time a simulated test market is performed, it may be too late, and it changes its role to become more focused on marketing plan optimisation.36
Controlled test marketA test-marketing programme conducted by an outside research company in field experimentation. The research company guarantees distribution of the product in retail outlets that represent a predetermined percentage of the market.
Simulated test marketA quasi-test market in which participants are preselected; they are then interviewed and observed on their purchases and attitudes towards the product.
Summary The scientific notion of causality implies that we can never prove that X causes Y. At best, we can only infer that X is one of the causes of Y, in that it makes the occurrence of Y prob-able. Three conditions must be satisfied before causal inferences can be made: (1) concomi-tant variation, which implies that X and Y must vary together in a hypothesised way; (2) the time order of occurrence of variables, which implies that X must precede Y; and (3) elimina-tion of other possible causal factors, which implies that competing explanations must be ruled out. Experiments provide the most convincing evidence of all three conditions. An experiment is formed when one or more independent variables are manipulated or con-trolled by the researcher and their effect on one or more dependent variables is measured.

329Chapter 11 Causal research design: experimentation
In designing an experiment, it is important to consider internal and external validity. Internal validity refers to whether the manipulation of the independent variables actu-ally caused the effects on the dependent variables. External validity refers to the gen-eralisability of experimental results. For the experiment to be valid, the researcher must control the threats imposed by extraneous variables, such as history, maturation, testing (main and interactive testing effects), instrumentation, statistical regression, selection bias and mortality. There are four ways of controlling extraneous variables: randomisation, matching, statistical control and design control.
Experimental designs may be classified as pre-experimental, true experimental, quasi-experimental and statistical designs. An experiment may be conducted in a laboratory environment or under actual market conditions in a real-life setting. Only causal designs encompassing experimentation are appropriate for inferring cause-and-effect relationships.
Although experiments have limitations in terms of time, cost and administration, they continue to be popular in marketing, especially in the testing of communications and advertising. Test marketing is an important example of research monies spent on the application of experimental design. The internal and external validity of field experi-ments conducted in developing nations is generally lower than in more developed economies. The level of development in many countries can be lower where the researcher lacks control over many of the marketing variables. Care has to be taken with this generalisation, as the application of experimentation and test markets grows in online environments.
Questions 1 What are the requirements for inferring a causal relationship between two variables?
2 Differentiate between internal and external validity.
3 List any five extraneous variables and give an example to show how each can reduce internal validity.
4 Describe the various methods for controlling extraneous sources of variation.
5 What is the key characteristic that distinguishes true experimental designs from pre-experimental designs?
6 List the steps involved in implementing the post-test-only control group design. Describe the design symbolically.
7 What is a time series experiment? When is it used?
8 How is a multiple time series design different from a basic time series design?
9 What advantages do statistical designs have over basic designs?
10 Compare the characteristics of laboratory and field experimentation.
11 Should descriptive research be used for investigating causal relationships? Why or why not?
12 What is test marketing? What are the major types of test marketing?
13 What is the main difference between a standard test market and a controlled test market?

330 Marketing Research
Exercises 1 You are a research and insight manager for Louis Vuitton (www.louisvuitton.com). The company would like to determine whether it should increase, decrease or maintain the current spend level of advertising. Design a field experiment to address this issue.
2 What potential difficulties do you see in conducting the experiment above? To what extent could the Louis Vuitton management help you overcome these difficulties?
3 Select two different perfume advertisements for any brand of perfume. Design and conduct an experiment to determine which advertisement is the most effective. Use a student sample, with 10 students being exposed to each advertisement (treatment condition). Develop your own measures of advertising effectiveness in this context.
4 Red Bull (www.redbull.com) has developed three alternative package designs to replace its current can design. Design an online-based experiment to determine which, if any, of these new package designs is superior to the current one.
5 In a small group, discuss the following issue: ‘The potential to observe consumer buying behaviour online has created potential for a much wider application of experimental techniques.’
Notes
1. Veer, E. and Pervan, S., ‘How the tone and wording of advertisements interact’, International Journal of Advertising 27 (2) (2008), 191–207.
2. Moreno, R. and Martinez, R., ‘Causality as validity: Some implications for the social sciences’, Quality & Quantity 42 (5) (October 2008), 597–604: Viswanathan, M., Measurement Error and Research Design (Thousand Oaks, CA: Sage, 2005); Sobel, M., ‘Causal inference in the social sciences’, Journal of the American Statistical Association 95 (450) (June 2000), 647–51.
3. Heckman, J.J., ‘The scientific model of causality’, Sociological Methodology 35 (1) (2007), 1–98; Boruch, R.F., Randomized Experiments for Planning and Evaluation (Thousand Oaks, CA: Sage, 1994).
4. Dahlen, M., Törn, F. and Rosengren, S., ‘Advertising creativity matters’, Journal of Advertising Research 48 (3) (September 2008), 392–403.
5. Gross, I., ‘The creative aspects of advertising’, Sloan Management Review 14 (1) (1972), 83–109.
6. Viswanathan, M., Measurement Error and Research Design (Thousand Oaks, CA: Sage, 2005); Leichty, J., Ramaswamy, V. and Cohen, S.H., ‘Choice menus for mass customization: An experimental approach for analyzing customer demand with an application to a web-based information service’, Journal of Marketing Research 38 (2) (May 2001), 183–96; Wyner, G.A., ‘Experimental design’, Marketing Research: A Magazine of Management and Applications 9 (3) (Fall 1997), 39–41; Brown, S.R. and Melamed, L.E., Experimental Design and Analysis (Newbury Park, CA: Sage, 1990).
7. Farris, P.W., ‘Overcontrol in advertising experiments’, Journal of Advertising Research (November/December 2000), 73–8.
8. Wise, K., Bolls, P.D., Kim, H., Venkataraman, A. and Meyer, R., ‘Enjoyment of advergames and brand attitudes: The impact of thematic relevance’, Journal of Interactive Advertising 9 (1) (Fall 2008), 27–36.
9. In addition to internal and external validity, there also exist construct and statistical conclusion validity. Construct validity addresses the question of what construct, or characteristic, is in fact being measured (and is discussed in Chapter 12 on measurement and scaling). Statistical conclusion validity addresses the extent and statistical significance of the covariation that exists in the data and is discussed in the chapters on data analysis. See Treadwell, K.R.H., ‘Demonstrating experimenter “Ineptitude” as a means of teaching internal and external validity’, Teaching of Psychology 35 (3) (August 2008), 184–8; Klink, R.R. and Smith, D.C., ‘Threats to the external validity of brand extension research’, Journal of Marketing Research 38 (3) (August 2001), 326–35; Campbell, D.T. and Stanley, J.C., Experimental and Quasi-Experimental Designs for Research (Chicago: Rand McNally, 1966).
10. Blanton, H. and Jaccard, J., ‘Representing versus generalizing: Two approaches to external validity and their implications for the study of prejudice’, Psychological Inquiry 19 (2) (2008), 99–105; Laurent, G., ‘Improving the external validity of marketing models: A plea for more qualitative input’, International Journal of Research in Marketing 17 (2) (September 2000), 177; Bordia, P., ‘Face-to-face computer-mediated communication: A synthesis of the experimental

331Chapter 11 Causal research design: experimentation
literature’, Journal of Business Communication 34 (1) (January 1997), 99–120; Bowen, D.M., ‘Work group research: Past strategies and future opportunities’, IEEE Transactions on Engineering Management 42 (1) (February 1995), 30–8; Lynch, J.G. Jr, ‘On the external validity of experiments in consumer research’, Journal of Consumer Research 9 (December 1982), 225–44.
11. Winer, R., ‘Experimentation in the 21st century: The importance of external validity’, Academy of Marketing Science 27 (3) (Summer 1999), 349–58; Argyris, C., ‘Actionable knowledge: Design causality in the service of consequential theory’, Journal of Applied Behavioural Science 32 (4) (December 1966), 390–406; Lynch, J.G. Jr, ‘The role of external validity in theoretical research’, Calder, B.J., Phillips, L.W. and Tybout, A., ‘Beyond external validity’, and McGrath, J.E and Brinberg, D., ‘External validity and the research process’, Journal of Consumer Research 10 (1) (June 1983), 109–11, 112–14 and 115–24 respectively.
12. Berger, P. and Maurer, R., Experimental Design with Applications in Management, Engineering and the Sciences (Boston, MA: Boston University Press, 2002).
13. Berger, P. and Maurer, R., Experimental Design with Applications in Management, Engineering and the Sciences (Boston, MA: Boston University Press, 2002); Dholakia, U.M. and Morwitz, V.G., ‘The scope and persistence of mere-measurement effects: Evidence from a field study of consumer satisfaction measurement’, Journal of Consumer Research 29 (2) (2002), 159–67.
14. Small, D.S., Have, T.R.T., and Rosenbaum, P.R., ‘Randomization inference in a group-randomized trial of treatments for depression: Covariate adjustment, noncompliance and quantile effects’, Journal of the American Statistical Association 103 (481) (March 2008), 271–9; Rosenbaum, P.R., ‘Attributing effects to treatment in matched observational studies’, Journal of the American Statistical Association 97 (457) (March 2002), 183–92; Durier, C., Monod, H. and Bruetschy, A., ‘Design and analysis of factorial sensory experiments with carry-over effects’, Food Quality and Preference 8 (2) (March 1997), 141–9; Nelson, L.S., ‘Notes on the use of randomization in experimentation’, Journal of Quality Technology 28 (1) (January 1996), 123–6.
15. Glick, R., Guo, X. and Hutchison, M., ‘Currency crises, capital-account liberalization and selection bias’, Review of Economics and Statistics 88 (4) (November 2006), 698–714; Rosenbaum, P.R., ‘Attributing effects to treatment in matched observational studies’, Journal of the American Statistical Association 97 (457) (March 2002), 183–92; Selart, M., ‘Structure compatibility and restructuring in judgement and choice’, Organisation Behaviour and Human Decision Processes 65 (2) (February 1996), 106–16; Barker Bausell, R., Conducting Meaningful Experiments (Thousand Oaks, CA: Sage, 1994).
16. Kim, B., ‘Virtual field experiments for a digital economy: A new research methodology for exploring an information economy’, Decision Support Systems 32 (3) (January 2002), 215; Chamis, E., ‘Auto dealers test online sales in 90 day experiment’, Washington Business Journal 19 (11 May 2001), 15; Spethmann, B., ‘Choosing a test market’, Brandweek 36 (19) (8 May 1995), 42–3; Tarshis, A.M., ‘Natural sell-in avoids pitfalls of controlled tests’, Marketing News (24 October 1986), 14.
17. Other experimental designs are also available. See Borror, C.M., ‘Evaluation of statistical designs for experiments involving noise variables’, Journal of Quality Technology 34 (1) (January 2002), 54–70; Campbell, D.T. and Russo, M.J., Social Experimentation (Thousand Oaks, CA: Sage, 1999); Gunter, B., ‘Fundamental issues in experimental design’, Quality Progress 29 (6) (June 1996), 105–13.
18. For an application of the Solomon four-group design, see Ayres, J., ‘Are reductions in CA an experimental artifact? A Solomon four-group answer’, Communications Quarterly 48 (1) (Winter 2000), 19–26.
19. Simester, D., ‘Implementing quality improvement programs designed to enhance customer satisfaction: Quasi experiments in the United States and Spain’, Journal of Marketing Research 37 (1) (February 2000), 102–12; Moorman, C., ‘A quasi-experiment to assess the consumer and informational determinants of nutrition information-processing activities – the case of the Nutrition Labeling and Education Act’, Journal of Public Policy and Marketing 15 (1) (Spring 1996), 28–44.
20. For applications of factorial designs, see Chung-Chau, C. and Yu-Jen, C., ‘Goal orientation and comparative valence in persuasion’, Journal of Advertising 37 (1) (Spring 2008), 73–87; Sengupta, J. and Gorn, G.J., ‘Absence makes the mind grow sharper: Effects of element omission on subsequent recall’, Journal of Marketing Research 39 (2) (May 2002), 186–201.
21. Huertas-Garcia, R. and Consolación-Segura, C., ‘Using statistical design experiment methodologies to identify customers’ needs’, International Journal of Market Research 51 (1) (2009), 115–36.
22. Roehm, M.L., Pullins, E.B. and Roehm, H.A. Jr, ‘Designing loyalty building programs for packaged goods brands’, Journal of Marketing Research 39 (2) (May 2002), 202–13; Jones, G.E. and Kavanagh, M.J., ‘An experimental examination of the effects of individual and situational factors on unethical behavioural intentions in the workplace’, Journal of Business Ethics 15 (5) (May 1996), 511–23.
23. Krishna, A. and Unver, M.U., ‘Improving the efficiency of course bidding at business schools: Field and laboratory studies’, Marketing Science 27 (2) (March/April 2008), 262–82: Dawar, N., ‘Impact of product harm crises on brand equity: The moderating role of consumer expectations’, Journal of Marketing Research 37 (2) (May 2000), 215–26.
24. Allen, C.T., ‘A theory-based approach for improving demand artifact assessment in advertising experiments’, Journal of Advertising 33 (2) (Summer 2004), 63–73; Lane, V.R., ‘The impact of ad repetition and ad content on consumer perceptions of incongruent extensions’, Journal of Marketing (April 2000), 80–91; Perrien, J., ‘Repositioning demand artifacts in consumer research’, Advances in Consumer Research 24 (1997), 267–71.
25. Ofir, C. and Simonson, I., ‘In search of negative customer feedback: The effect of expecting to evaluate on satisfaction evaluations’, Journal of Marketing Research 38 (2) (May 2001), 170–82; Laurent, G., ‘Improving the external validity of marketing models: A plea for more qualitative input’, International Journal of Research in Marketing 17 (2–3) (September 2000), 177–82.
26. Blumenschein, K., ‘Hypothetical versus real willingness to pay in the health care sector: Results from a field

332 Marketing Research
experiment’, Journal of Health Economics 20 (3) (May 2001), 441; Alston, R.M. and Nowell, C., ‘Implementing the voluntary contribution game: A field experiment’, Journal of Economic Behaviour and Organisation 31 (3) (December 1996), 357–68.
27. Spanos, A., ‘On theory testing in econometrics: Modeling with nonexperimental data’, Journal of Econometrics 67 (1) (May 1995), 189–226; Blalock, H.M. Jr, Causal Inferences in Non-Experimental Research (Chapel Hill, NC: University of North Carolina Press, 1964).
28. In some situations, surveys and experiments can complement each other and may both be used. For example, the results obtained in laboratory experiments may be further examined in a field survey. See Johnston, W.J. and Kim, K., ‘Performance, attribution, and expectancy linkages in personal selling’, Journal of Marketing 58 (October 1994), 68–81.
29. Farris, P.W. and Reibstein, D.J., ‘Overcontrol in advertising experiments’, Journal of Advertising Research 40 (6) (November/December 2000), 73–8.
30. Ryals, L. and Wilson, H., ‘Experimental methods in market research: From information to insight’, International Journal of Market Research 47 (4) (2005), 347–66.
31. Boots Laboratories Serum 7 – Alliance Boots, Design Business Association, Gold, Design Effectiveness Awards (2009).
32. Vinarsky, C., ‘Test market for smokeless tobacco’, Knight Ridder Tribune Business News (11 March 2002), 1; Romeo, P., ‘Testing, testing’, Restaurant Business 97 (2) (15 January 1998), 12.
33. Hitsch, G.J., ‘An empirical model of optimal dynamic product launch and exit under demand uncertainty’, Marketing Science 25 (1) (January/February 2006), 25–50; Lawrence, K., ‘Owensboro, Kentucky could be next test market for new McDonald’s eatery concept’, Knight Ridder Tribune Business News (7 February 2002), 1.
34. Anon., ‘Vaseline to back Dermacare with Llm Ads activity’, Marketing (10 January 2002), 4; Mehegan, S., ‘Vaseline ups ante via anti-bacterial’, Brandweek 38 (21) (26 May 1997), 1, 6.
35. Willke, J.J., ‘The future of simulated test markets’, ESOMAR Consumer Insight Congress, Barcelona, (September 2002); Hayes, D.J., Shogren, J.F., Fox, J.A. and Kliebenstein, B., ‘Test marketing new food products using a multitrial nonhypothetical experimental auction’, Psychology and Marketing 13 (4) (July 1996), 365–79.
36. Markowitz, L., ‘The future of forecasting is here: Did simulated test markets evolve as anticipated… and what are the new expectations?’, ESOMAR Congress Odyssey, Athens (Sepember 2010).

Measurement and scaling: fundamentals, comparative and non-comparative scaling
When you can measure what you
are speaking about and express
it in numbers, you know
something about it.
Lord Kelvin
Stage 1
Problem definition
Stage 2
Research approach developed
Stage 3
Research design
developed
Stage 4
Fieldwork or data
collection
Stage 5
Data integrity
and analysis
12
Stage 6
Communicating research findings

334 Marketing Research
Objectives
After reading this chapter, you should be able to:
1 introduce the concepts of measurement and scaling and show how scaling may be considered an extension of measurement;
2 explain the characteristics of description, order, distance and origin and how they define the level of measurement in a scale;
3 discuss the primary scales of measurement and differentiate nominal, ordinal, interval and ratio scales;
4 classify and discuss scaling techniques as comparative and non-comparative and describe the comparative techniques of paired comparison, rank order, constant sum and Q-sort scaling;
5 describe the non-comparative scaling techniques, distinguish between continuous and itemised rating scales and explain Likert, semantic differential and Stapel scales;
6 discuss the decisions involved in constructing itemised rating scales;
7 discuss the criteria used for scale evaluation and explain how to assess reliability, validity and generalisability.
Once researchers have a clear understanding of what they wish to ask their target participants, they should consider the concepts of scaling and measurement. These concepts are vital in developing questionnaires or ‘instruments of measurement’ that will fulfil their research objectives in the most accurate manner. In this chapter we describe the concepts of scaling and measurement and discuss four primary scales of measurement: nominal, ordinal, interval and ratio. We describe and illustrate both comparative and non-comparative scaling techniques in detail. The comparative techniques, consisting of paired comparison, rank order, constant sum and Q-sort scaling, are discussed and illustrated with examples. The non-comparative techniques are composed of continuous and itemised rating scales. We discuss and illustrate the popular itemised rating scales – the Likert, semantic differential and Stapel scales – as well as the construction of multi-item rating scales. We show how scaling techniques should be evaluated in terms of reliability and validity and consider how the researcher selects a particular scaling technique. Mathematically derived scales are also presented. The considerations involved in implementing scaling techniques when researching international markets are discussed. The chapter presents several ethical issues that arise in scale construction and concludes by examining how visual forms of scaling using flash technology can help create more engaging survey experiences for participants. We begin with an example of how the use of different types of scale can give quite different powers of analysis and interpretation.
Overview
Real research Numbers, rankings and ratings: Argentina is on top
According to the international football federation (FIFA) (www.fifa.com) 2016 national team rankings, Argentina reigned supreme at the top of the rankings with 1,523 points and the runners-up, Belgium, took second spot with 1,352 points. The top 10 countries were as follows:

335Chapter 12 Measurement and scaling: fundamentals, comparative and non-comparative scaling
Number Country May 2016 ranking Points
1 Argentina 1 1,523 2 Belgium 2 1,352 3 Brazil 7 1,251 4 Chile 3 1,348 5 Colombia 4 1,337 6 England 10 1,069 7 Germany 5 1,309 8 Portugal 8 1,184 9 Spain 6 1,27710 Uruguay 9 1,158
Note that the countries have been placed in alphabetical order and that at first glance this gives the impression that South American countries have performed better than European countries. An alphabetical order is used to illustrate the first column ‘Number’. The ‘number’ assigned to denote countries is not in any way related to their football-playing capabilities but simply serves the purpose of identification, e.g. drawing num-bered balls to decide which teams may play each other in a competition. This identification number constitutes a nominal scale, which says nothing about the respec-tive performances of the countries. So while England is numbered 6 and Germany is numbered 7, this does not reflect the superior performance of Germany.
A much clearer way to present the list would be to place the countries in the order of their ranking, with Argentina at the top and England at the bottom of the table. The ranking would represent an ordinal scale, where it would be clear to see that the lower the number, the better the performance. But what is still missing from the ranking is the magnitude of differences between the countries.
The only way really to understand how much one country is better than another is to examine the points awarded to each country. The points awarded represent an interval scale. Based on the points awarded, note that only 5 points separate the closely ranked Chile (1,348) and Columbia (1,337), but that the difference between Argentina (1,532) ranked at number 1 and Belgium (1,352) ranked at number 2 is 180 points.
Measurement and scaling
Measurement means assigning numbers or other symbols to characteristics of objects according to certain pre-specified rules.1 Note that what we measure is not the object but some characteristic of it. Thus, we do not measure consumers, only their perceptions, atti-tudes, preferences or other relevant characteristics. In marketing research, numbers are usu-ally assigned for one of two reasons. First, numbers permit statistical analysis of the resulting data. Second, numbers facilitate a universal and transparent communication of measurement rules and results.
The most important aspect of measurement is the specification of rules for assigning num-bers to the characteristics. The assignment process must be isomorphic, i.e. there must be one-to-one correspondence between the numbers and the characteristics being measured. For example, the same euro (€) figures can be assigned to households with identical annual incomes. Only then can the numbers be associated with specific characteristics of the meas-ured object, and vice versa. In addition, the rules for assigning numbers should be standard-ised and applied uniformly. They must not change over objects or time.
MeasurementThe assignment of numbers or other symbols to characteristics of objects according to certain pre-specified rules.

336 Marketing Research
Scaling may be considered an extension of measurement. Scaling involves creating a continuum upon which measured objects are located. To illustrate, consider a scale for locat-ing consumers according to the characteristic ‘attitude towards visiting a cinema’. Each par-ticipant is assigned a number indicating an unfavourable attitude (measured as 1), a neutral attitude (measured as 2) or a favourable attitude (measured as 3). Measurement is the actual assignment of 1, 2 or 3 to each participant. Scaling is the process of placing the participants on a continuum with respect to their attitude towards visiting a cinema. In our example, scal-ing is the process by which participants would be classified as having an unfavourable, neu-tral or positive attitude.
ScalingThe generation of a continuum upon which measured objects are located.
Scale characteristics and levels of measurement
All the scales used in marketing research can be described in terms of four basic characteris-tics. These characteristics are description, order, distance and origin, and together they define the level of measurement of a scale. The level of measurement denotes what properties of an object the scale is measuring or not measuring. An understanding of the scale characteristics is fundamental to understanding the primary type of scales.
Description
By description, we mean the unique labels or descriptors that are used to designate each value of the scale. Some examples of descriptors are as follows: 1. Female, 2. Male; 1 = Strongly disagree, 2 = Disagree, 3 = Neither agree nor disagree, 4 = Agree and 5 = Strongly agree; and the numbers of euros earned annually by a household. ‘Female’ and ‘male’ are unique descriptors used to describe values 1 and 2 of the gender scale. All scales possess this characteristic of description, i.e. all scales have unique labels or descriptors that are used to define the scale values or response options.
Order
By order, we mean the relative sizes or positions of the descriptors. There are no absolute values associated with order, only relative values. Order is denoted by descriptors such as ‘greater than’, ‘less than’ and ‘equal to’. For example, a participant’s preference for art forms that they visit can be expressed by the following order, with the most-preferred art form being listed first and the least-preferred last:
Cinema
Theatre
Pop concert
For this participant, the preference for the cinema is greater than the preference for the theatre. Likewise, the preference for a pop concert is less than the preference for the theatre. Participants who fall into the same age category, say 35 to 49, are considered to be equal to each other in terms of age, and greater than participants in the 20 to 34 age group. All scales do not possess the order characteristic. In the gender scale (1. Female, 2. Male) considered above, we have no way of determining whether a female is greater or less than a male. Thus the gender scale does not possess order.
Distance
The characteristic of distance means that absolute differences between the scale descriptors are known and may be expressed in units. A five-person household has one person more than
DescriptionThe unique labels or descriptors that are used to designate each value of the scale. All scales possess description.
OrderThe relative sizes or positions of the descriptors. Order is denoted by descriptors such as greater than, less than and equal to.
DistanceThe characteristic of distance means that absolute differences between the scale descriptors are known and may be expressed in units.

337Chapter 12 Measurement and scaling: fundamentals, comparative and non-comparative scaling
a four-person household, which in turn has one person more than a three-person household. Thus the following scale possesses the distance characteristic:
Number of persons living in your household ___
Notice that a scale that has distance also has order. We know that a five-person household is greater than the four-person household in terms of the number of persons living in the household. Likewise, a three-person household is less than a four-person household. Thus, distance implies order but the reverse may not be true.
Origin
The origin characteristic means that the scale has a unique or fixed beginning, or true zero point. Thus, an exact measurement of income by a scale such as
What is the annual income of your household before taxes? €____
has a fixed origin or a true zero point. An answer of zero would mean that the household has no income at all. A scale that has origin also has distance (and order and description). Many scales used in marketing research do not have a fixed notice or true zero point, as in the disagree–agree scale considered earlier under ‘description’. Notice that such a scale was defined as 1 = Strongly disagree, 2 = Disagree, 3 = Neither agree nor disagree, 4 = Agree and 5 = Strongly agree. However, 1 is an arbitrary origin or starting point. This scale could just as easily been defined as 0 = Strongly disagree, 1 = Disagree, 2 = Neither agree nor disagree, 3 = Agree and 4 = Strongly agree, with 0 as the origin. Alternatively, shifting the origin to –2 will result in an equivalent scale: –2 = Strongly disagree, –1 = Disagree, 0 = Neither agree nor disagree, 1 = Agree and 2 = Strongly agree. All these three forms of the agree–disagree scale, with the origin at 1, 0, or –2, are equivalent. Thus this scale does not have a fixed origin or a true zero point and consequently does not possess the characteristic of origin.
You may have observed that description, order, distance and origin represent successively higher-level characteristics, with origin being the highest scale characteristic. Description is the most basic characteristic that is present in all scales. If a scale has order, it also has descrip-tion. If a scale has distance, it also has order and description. Finally, a scale that has origin also has distance, order and description. Thus, if a scale has a higher-level characteristic, it also has all the lower-level characteristics. However, the reverse may not be true, i.e. if a scale has a lower-level characteristic, it may or may not have a higher-level characteristic. With an understanding of scale characteristics, we are ready to discuss the primary types of scale.
OriginThe origin characteristic means that the scale has a unique or fixed beginning, or true zero point.
Primary scales of measurement
There are four primary scales of measurement: nominal, ordinal, interval and ratio.2 These scales are illustrated in Figure 12.1, and their properties are summarised in Table 12.1 and discussed in the following sections.
Nominal scale
A nominal scale is a figurative labelling scheme in which the numbers serve only as labels or tags for identifying and classifying objects. For example, the numbers assigned to the partici-pants in a study constitute a nominal scale; thus, a female participant may be assigned a number 1 and a male participant 2. When a nominal scale is used for the purpose of identifi-cation, there is a strict one-to-one correspondence between the numbers and the objects. Each number is assigned to only one object, and each object has only one number assigned to it.
Common examples include student registration numbers at a college or university and num-bers assigned to football players or jockeys in a horse race. In marketing research, nominal scales are used for identifying participants, brands, attributes, websites and other objects.
When used for classification purposes, the nominally scaled numbers serve as labels for classes or categories. For example, you might classify the control group as group 1 and the
Nominal scaleA scale whose numbers serve only as labels or tags for identifying and classifying objects, with a strict one-to-one correspondence between the numbers and the objects.

338 Marketing Research
Figure 12.1
An illustration of primary scales of measurement
Performancerating on a 0to 10 scale
8.2 9.1 9.6Interval
Rank orderof winners
3rd place 2nd place 1st place
FinishOrdinal
Time to�nish inseconds
15.2 14.1 13.4Ratio
Numbersassignedto riders
7 11 3
FinishNominal
Scale
Table 12.1
Scale Basic characteristics Common examples Marketing example
Permissible statistics
Descriptive Inferential
Nominal Numbers identify and classify objects
Student registration numbers, numbers on football players’ shirts
Gender classification of retail outlet types
Percentages, mode Chi-square, binomial test
Ordinal Numbers indicate the relative positions of the objects but not the magnitude of differences between them
Rankings of the top four teams in the football World Cup
Ranking of service quality delivered by a number of shops; rank order of favourite TV programmes
Percentile, median Rank order correlation, Friedman, ANOVA
Interval Differences between objects can be compared; zero point is arbitrary
Temperature (Fahrenheit, Celsius)
Attitudes, opinions, index numbers
Range, mean, standard deviation
Product moment correlations, t tests, ANOVA, regression, factor analysis
Ratio Zero point is fixed; ratios of scale values can be computed
Length, weight Age, income, costs, sales, market shares
Geometric mean, harmonic mean
Coefficient of variation
Primary scales of measurement

339Chapter 12 Measurement and scaling: fundamentals, comparative and non-comparative scaling
experimental group as group 2. The classes are mutually exclusive and collectively exhaus-tive. The objects in each class are viewed as equivalent with respect to the characteristic represented by the nominal number. All objects in the same class have the same number, and no two classes have the same number. However, a nominal scale need not always involve the assignment of numbers; alphabets or symbols could be assigned as well.
The numbers in a nominal scale do not reflect the amount of the characteristic possessed by the objects. For example, a high number on a football player’s shirt does not imply that the foot-baller is a better player than one with a low number, or vice versa. The same applies to numbers assigned to classes. The only permissible operation on the numbers in a nominal scale is count-ing. Only a limited number of statistics, all of which are based on frequency counts, are permis-sible. These include percentages, mode, chi-square and binomial tests (see Chapter 20). It is not meaningful to compute an average student registration number, the average gender of partici-pants in a survey, or the number assigned to an average film genre, as in the example below.
Real research S:Comm Leisure Time Survey (1)
Nominal scaleIn a study of how UK adults spend their leisure time, questions were related to the arts, sport, visitor attractions and leisure breaks. One key area was devoted to the cinema and the popularity of types of films. The numbers 1 to 10 were assigned to different film genres (see extracts from the list in Table 12.2). Thus, genre 2 referred to ‘Animated’. It did not imply that Animated was in any way superior or inferior to Comedy, which was assigned the number 3. Any reassignment of the numbers, such as transposing the numbers assigned to Animated and Comedy, would have no effect on the numbering system, because the numerals did not reflect any characteristics of the genres. It is meaningful to make state-ments such as ‘95% of young, affluent and family free’ named Comedy as their favourite genre. Although the average of the assigned numbers is 5.5, it is not meaningful to state that the number of the average cinema genre is 5.5.
Table 12.2
Nominal scale Ordinal scale Interval scale Ratio scale
Amount (€) spent on cinema visits in the past three months
No. Film genre Preference rankings
Preference ratings
1–7 11–17
1 Action 1 10 7 17 200 2 Animated 5 53 5 15 35 3 Comedy 2 25 7 17 200 4 Drama 3 30 6 16 100 5 Factual 4 45 6 16 0 6 Fantasy 6 61 5 15 100 7 Light drama 7 79 5 15 0 8 Romance 8 82 4 14 0 9 Sci-fi 9 95 4 14 010 Suspense 10 115 2 12 10
Illustration of primary scales of measurement

340 Marketing Research
Ordinal scale
An ordinal scale is a ranking scale in which numbers are assigned to objects to indicate the relative extent to which the objects possess some characteristic. An ordinal scale allows you to determine whether an object has more or less of a characteristic than some other object, but not how much more or less. Thus, an ordinal scale indicates relative position, not the magnitude of the differences between the objects. The object ranked first has more of the characteristic as compared with the object ranked second, but whether the object ranked sec-ond is a close second or a poor second is not known. Common examples of ordinal scales include quality rankings, rankings of teams in a tournament and occupational status. In mar-keting research, ordinal scales are used to measure relative attitudes, opinions, perceptions and preferences. Measurements of this type include ‘greater than’ or ‘less than’ judgements from participants.
In an ordinal scale, as in a nominal scale, equivalent objects receive the same rank. Any series of numbers can be assigned that preserves the ordered relationships between the objects. Ordinal scales can be transformed in any way as long as the basic ordering of the objects is maintained.3 In other words, any monotonic positive (order-preserving) transfor-mation of the scale is permissible, since the differences in numbers are void of any meaning other than order (see the example below). For these reasons, in addition to the counting operation allowable for nominal scale data, ordinal scales permit the use of statistics based on centiles. It is meaningful to calculate percentile, quartile, median (Chapter 20), rank order correlation (Chapter 22) or other summary statistics from ordinal data.
Ordinal scaleA ranking scale in which numbers are assigned to objects to indicate the relative extent to which some characteristic is possessed. Thus, it is possible to determine whether an object has more or less of a characteristic than some other object.
Real research S:Comm Leisure Time Survey (2)
Ordinal scaleTable 12.2 gives a particular participant’s preference rankings. Participants ranked the film genres in order of which they preferred, by assigning a rank 1 to the first, rank 2 to the second, and so on. Note that Action (ranked 1) is preferred to Comedy (ranked 2), but how much it is preferred we do not know. Also, it is not necessary that we assign numbers from 1 to 10 to obtain a preference ranking. The second ordinal scale, which assigns a number 10 to Action, 25 to Comedy and 30 to Drama, is an equivalent scale, as it was obtained by a monotonic positive transformation of the first scale. The two scales result in the same ordering of the genres according to preference.
Interval scale
In an interval scale, numerically equal distances on the scale represent equal values in the characteristic being measured. An interval scale contains all the information of an ordinal scale, but it also allows you to compare the differences between objects. The difference between any two scale values is identical to the difference between any other two adjacent values of an interval scale. There is a constant or equal interval between scale values. The difference between 1 and 2 is the same as the difference between 2 and 3, which is the same as the difference between 5 and 6. A common example in everyday life is a temperature scale. In marketing research, attitudinal data obtained from rating scales are often treated as interval data.4
In an interval scale, the location of the zero point is not fixed. Both the zero point and the units of measurement are arbitrary. Hence, any positive linear transformation of the form y = a + bx will preserve the properties of the scale. Here, x is the original scale value, y is the transformed scale value, b is a positive constant and a is any constant. Therefore, two interval
Interval scaleA scale in which the numbers are used to rank objects such that numerically equal distances on the scale represent equal distances in the characteristic being measured.

341Chapter 12 Measurement and scaling: fundamentals, comparative and non-comparative scaling
scales that rate objects A, B, C and D as 1, 2, 3 and 4 or as 22, 24, 26 and 28 are equivalent. Note that the latter scale can be derived from the former by using a = 20 and b = 2 in the transforming equation.
Because the zero point is not fixed, it is not meaningful to take ratios of scale values. As can be seen, the ratio of D to B values changes from 2:1 to 7:6 when the scale is trans-formed. Yet, ratios of differences between scale values are permissible. In this process, the constants a and b in the transforming equation drop out in the computations. The ratio of the difference between D and B values to the difference between C and B values is 2:1 in both the scales.
Statistical techniques that may be used on interval scale data include all those that can be applied to nominal and ordinal data in addition to the arithmetic mean, standard deviation (Chapter 20), product moment correlations (Chapter 22) and other statistics commonly used in marketing research. Certain specialised statistics, such as geometric mean, harmonic mean and coefficient of variation, however, are not meaningful on interval scale data. The S:Comm Leisure Time Survey example gives a further illustration of an interval scale.
Ratio scale
A ratio scale possesses all the properties of the nominal, ordinal and interval scales and, in addition, an absolute zero point. Thus, ratio scales possess the characteristic of origin (and distance, order and description). With ratio scales we can identify or classify objects, rank the objects and compare intervals or differences. It is also meaningful to compute ratios of scale values. Not only is the difference between 2 and 5 the same as the difference between 14 and 17, but also 14 is seven times as large as 2 in an absolute sense. Common examples of ratio scales include height, weight, age and money. In marketing research, sales, costs, market share and number of customers are variables measured on a ratio scale.
Ratio scaleThe highest scale. This scale allows the researcher to identify or classify objects, rank-order the objects and compare intervals or differences. It is also meaningful to compute ratios of scale values.
Real research S:Comm Leisure Time Survey (3)
Interval scaleIn Table 12.2, a participant’s preferences for the 10 film genres are expressed on a seven-point rating scale (where a higher number represents a greater preference for a genre). We can see that although Drama received a preference rating of 6 and Suspense a rating of 2, this does not mean that Drama is preferred three times as much as Suspense. When the ratings are transformed to an equivalent 11 to 17 scale (next column), the ratings for those genres become 16 and 12, and the ratio is no longer 3:1. In contrast, the ratios of preference differences are identical on the two scales. The ratio of preference difference between Comedy and Suspense to the preference difference between Fantasy and Sus-pense is 5:3 on both the scales.
Ratio scales allow only proportionate transformations of the form y = bx, where b is a positive constant. One cannot add an arbitrary constant, as in the case of an interval scale. An example of this transformation is provided by the conversion of metres to yards (b = 1.094). The comparisons between the objects are identical, whether made in metres or yards.
All statistical techniques can be applied to ratio data. These include specialised statistics such as geometric mean, harmonic mean and coefficient of variation. The ratio scale is fur-ther illustrated in the context of a S:Comm Leisure Time Survey example.

342 Marketing Research
The four primary scales discussed above do not exhaust the measurement-level catego-ries. It is possible to construct a nominal scale that provides partial information on order (the partially ordered scale). Likewise, an ordinal scale can convey partial information on dis-tance, as in the case of an ordered metric scale. A discussion of these scales is beyond the scope of this text.5
Metric scaleA scale that is either interval or ratio in nature.
Real research S:Comm Leisure Time Survey (4)
Ratio scaleIn the ratio scale illustrated in Table 12.2, a participant is asked to indicate how much had been spent on cinema visits (i.e. the whole visit experience, not just the cinema ticket) in the last three months. Note that this participant spent €200 on Action films and only €10 on Suspense. The participant spent 20 times more euros on Action compared with Suspense. Also, the zero point is fixed because 0 means that the participant did not spend any money on films such as Factual and Romance. Multiplying these numbers by 100 to convert euros to cents results in an equivalent scale.
A comparison of scaling techniques
The scaling techniques commonly employed in marketing research can be classified into comparative and non-comparative scales (see Figure 12.2).
Comparative scales involve the direct comparison of stimulus objects. For example, par-ticipants may be asked whether they prefer to visit a cinema or a theatre. Comparative scale data must be interpreted in relative terms and have only ordinal or rank order properties. For
Comparative ScalesOne of two types of scaling techniques in which there is direct comparison of stimulus objects with one another.
Figure 12.2
A classification of scaling techniques
Non-comparative scales
Continuousrating scales
Itemisedrating scales
Constantsum
Q-sort and otherprocedures
Rankorder
Pairedcomparison
Likert StapelSemanticdi�erential
Scaling techniques
Comparative scales

343Chapter 12 Measurement and scaling: fundamentals, comparative and non-comparative scaling
this reason, comparative scales are also referred to as non-metric scales. As shown in Figure 12.2, comparative scales include paired comparisons, rank order, constant sum scales, Q-sort and other procedures.
The major benefit of comparative scaling is that small differences between stimulus objects can be detected. As they compare the stimulus objects, participants are forced to choose between them. In addition, participants approach the rating task from the same known reference points. Consequently, comparative scales are easily understood and can be applied easily. Other advantages of these scales are that they involve fewer theoretical assumptions, and they also tend to reduce halo or carryover effects from one judgement to another.6 The major disadvantages of comparative scales include the ordinal nature of the data and the inability to generalise beyond the stimulus objects scaled. For instance, to compare a visit to a pop concert to a cinema or theatre visit, the researcher would have to do a new study. These disadvantages are substantially overcome by the non-comparative scaling techniques.
In non-comparative scales, also referred to as monadic or metric scales, each object is scaled independently of the others in the stimulus set. The resulting data are generally assumed to be interval or ratio scaled.7 For example, participants may be asked to evaluate a cinema visit on a 1 to 6 preference scale (1 = Not at all preferred, 6 = Greatly preferred). Similar evaluations would be obtained for a theatre visit and a pop concert visit. As can be seen in Figure 12.2, non-comparative scales can be continuous rating or itemised rating scales. The itemised rating scales can be further classified as Likert, semantic differential or Stapel scales. Non-comparative scaling is the most widely used scaling technique in market-ing research.
Non-metric scaleA scale that is either nominal or ordinal in nature.
Carryover effectsWhere the evaluation of a particular scaled item significantly affects the participant’s judgement of subsequent scaled items.
Non-comparative scaleOne of two types of scaling technique in which each stimulus object is scaled independently of the other objects in the stimulus set. Also called monadic scale.
Comparative scaling techniques
Paired comparison scaling
As its name implies, in paired comparison scaling a participant is presented with two objects and asked to select one according to some criterion.8 The data obtained are ordinal in nature. A participant may state that they prefer Belgian chocolate to Swiss, like Kellogg’s cereals bet-ter than supermarket home brands, or like Adidas more than Nike. Paired comparison scales are frequently used when the stimulus objects are physical products. Coca-Cola is reported to have conducted more than 190,000 paired comparisons before introducing New Coke.9
Figure 12.3 shows paired comparison data obtained to assess a participant’s bottled beer preferences. As can be seen, this participant made 10 comparisons to evaluate five brands. In general, with n brands, [n(n – 1)/2] paired comparisons include all possible pairings of objects.10
Paired comparison data can be analysed in several ways.11 The researcher can calculate the percentage of participants who prefer one stimulus over another by summing the matri-ces of Figure 12.3 for all the participants, dividing the sum by the number of participants and multiplying by 100. Simultaneous evaluation of all the stimulus objects is also possible. Under the assumption of transitivity, it is possible to convert paired comparison data to a rank order.
Transitivity of preference implies that if Brand A is preferred to B, and Brand B is preferred to C, then Brand A is preferred to C. To arrive at a rank order, the researcher determines the number of times each brand is preferred by summing the column entries in Figure 12.3. Therefore, this participant’s order of preference, from most to least preferred, is Carlsberg, Holsten, Stella Artois, Budvar and Grolsch. It is also possible to derive an interval scale from paired comparison data using the Thurstone case V procedure. Refer to the appro-priate literature for a discussion of this procedure.12
Several modifications of the paired comparison technique have been suggested. One involves the inclusion of a neutral/no difference/no opinion response. Another extension is
Paired comparison scalingA comparative scaling technique in which a participant is presented with two objects at a time and asked to select one object in the pair according to some criterion. The data obtained are ordinal in nature.
Transitivity of preferenceAn assumption made to convert paired comparison data to rank order data. It implies that if Brand A is preferred to Brand B, and Brand B is preferred to Brand C, then Brand A is preferred to Brand C.

344 Marketing Research
graded pairs comparisons. In this method, participants are asked which brand in the pair is preferred and how much it is preferred. The degree of preference may be expressed by how much more the participant is willing to pay for the preferred brand. The resulting scale is a euro metric scale. Another modification of paired comparison scaling is widely used in obtaining similarity judgements in multidimensional scaling (see Chapter 26).
Paired comparison scaling is useful when the number of brands is limited, since it requires direct comparison and overt choice. With a large number of brands, however, the number of comparisons becomes unwieldy. Other disadvantages are that violations of the assumption of transitivity may occur, and the order in which the objects are presented may bias the results. Paired comparisons bear little resemblance to the marketplace situation, which involves selection from multiple alternatives. Also, participants may prefer one object over certain others, but they may not like it in an absolute sense.13
Rank order scaling
In rank order scaling, participants are presented with several objects simultaneously and asked to order or rank them according to some criterion. For example, participants may be asked to rank according to overall preference. As shown in Figure 12.4, these rankings are typically obtained by asking the participants to assign a rank of 1 to the most-preferred film genre, 2 to the second-most-preferred, and so on, until a rank of n is assigned to the least-preferred genre. Like paired comparison, this approach is also comparative in nature, and it is possible that the participants may dislike the genre ranked 1 in an absolute sense. Further-more, rank order scaling also results in ordinal data. See Table 12.2, which uses rank order scaling to derive an ordinal scale.
Rank order scaling is commonly used to measure attributes of products and services as well as preferences for brands. Rank order data are frequently obtained from participants in conjoint analysis (see Chapter 26), since rank order scaling forces the participants to dis-criminate among the stimulus objects. Moreover, compared with paired comparisons, this type of scaling process more closely resembles the shopping environment. It also takes less time and eliminates intransitive responses. If there are n stimulus objects, only (n – 1) scaling decisions need be made in rank order scaling. However, in paired comparison scaling, [n(n – 1)/2] decisions would be required. Another advantage is that most participants easily
Rank order scalingA comparative scaling technique in which participants are presented with several objects simultaneously and asked to order or rank them according to some criterion.
Figure 12.3
Obtaining bottled-beer preferences using paired comparisons
InstructionsWe are going to present you with 10 pairs of bottled beer brands. For each pair, please indicatewhich of the two brands of beer in the pair you prefer.
Recording form
a 1 in a particular box means that the brand in that column was preferred over the brand in the corresponding row. 0 means that the row brand was preferred over the column brand.
b The number of times a brand was preferred is obtained by summing the 1s in each column
Holsten Stella Artois BudvarCarlsbergGrolsch
0 010
1a 010
1 1 11
0 0 00
1 1 10
3 2 140
Holsten
Stella Artois
Grolsch
Carlsberg
Budvar
Number of timespreferredb

345Chapter 12 Measurement and scaling: fundamentals, comparative and non-comparative scaling
understand the instructions for ranking. The major disadvantage is that this technique pro-duces only ordinal data.
Finally, under the assumption of transitivity, rank order data can be converted to equiva-lent paired comparison data, and vice versa. This point was illustrated by examining the ‘Number of times preferred’ in Figure 12.3. Hence, it is possible to derive an interval scale from rankings using the Thurstone case V procedure. Other approaches for deriving interval scales from rankings have also been suggested.14
Constant sum scaling
In constant sum scaling, participants allocate a constant sum of units, such as points or euros, among a set of stimulus objects with respect to some criterion. As shown in Figure 12.5, participants may be asked to allocate 100 points to attributes of bottled beers in a way that reflects the importance they attach to each attribute. If an attribute is unimpor-tant, the participant assigns it zero points. If an attribute is twice as important as some other attribute, it receives twice as many points. The sum of all the points is 100, hence the name of the scale.
The attributes are scaled by counting the points assigned to each one by all the participants and dividing by the number of participants. These results are presented for three groups, or segments, of participants in Figure 12.5. Segment I attaches overwhelming importance to price. Segment II considers a high alcohol level to be of prime importance. Segment III val-ues bitterness, hop flavours, fragrance and the aftertaste. Such information cannot be obtained from rank order data unless they are transformed into interval data. Note that the constant sum also has an absolute zero; 10 points are twice as many as 5 points, and the difference
Constant sum scalingA comparative scaling technique in which participants are required to allocate a constant sum of units such as points, euros, chits, stickers or chips among a set of stimulus objects with respect to some criterion.
Figure 12.4
Preference for film genres using rank order sampling
Suspense
Sci-�
Romance
Light drama
Fantasy
Factual
Drama
Comedy
Animated
Action
InstructionsRank the listed �lm genres in order of preference. Begin by picking out the genre that you like themost and assign it a number 1. Then �nd the second-most-preferred genre and assign it a number 2.Continue this procedure until you have ranked all the genres in order of preference. The least-preferred genre should be assigned a rank of 10.
No two genres should receive the same rank number
The criterion of preference is entirely up to you. There is no right or wrong answer. Just try to beconsistent
Genre Rank order

346 Marketing Research
between 5 and 2 points is the same as the difference between 57 and 54 points. For this rea-son, constant sum scale data are sometimes treated as metric. Although this may be appropri-ate in the limited context of the stimuli scaled, these results are not generalisable to other stimuli not included in the study. Hence, strictly speaking, the constant sum should be con-sidered an ordinal scale because of its comparative nature and the resulting lack of generalis-ability. It can be seen that the allocation of points in Figure 12.5 is influenced by the specific attributes included in the evaluation task.
The main advantage of the constant sum scale is that it allows for fine discrimination among stimulus objects without requiring too much time. It has two primary disadvantages, however. Participants may allocate more or fewer units than those specified. For example, a participant may allocate 108 or 94 points. The researcher must modify such data in some way or eliminate this participant from the analysis. Another potential problem is rounding error if too few units are used. On the other hand, the use of a large number of units may be too taxing on the participant and cause confusion and fatigue.15
Q-sort and other procedures
Q-sort scaling was developed to discriminate among a relatively large number of objects quickly. This technique uses a rank order procedure in which objects are sorted into piles based on similarity with respect to some criterion. For example, participants are given 100 attitude statements on individual cards and asked to place them into 11 piles, ranging from ‘most highly agreed with’ to ‘least highly agreed with’. The number of objects to be sorted should not be less than 60 nor more than 140; a reasonable range is 60 to 90 objects. The
Q-sort scalingA comparative scaling technique that uses a rank order procedure to sort objects based on similarity with respect to some criterion.
Figure 12.5
Importance of bottled-beer attributes using a constant sum scale
InstructionsBelow are eight attributes of bottled beers. Please allocate 100 points among the attributes so thatyour allocation re�ects the relative importance you attach to each attribute. The more points anattribute receives, the more important an attribute is. If an attribute is not at all important, assign itno points. If an attribute is twice as important as some other attribute, it should receive twice asmany points.
Note: the �gures below represent the mean points allocated to bottled beers by three segments of atarget market.
Form
MEAN POINTS ALLOCATED
Attribute Segment IISegment I Segment III
Bitterness 28 171
Hop �avours 42 202
Fragrance 93 193
Country where brewed 179 44
Price 553 75
High alcohol level 607 96
Aftertaste 05 157
Package design 313 98
Sum 100100 100
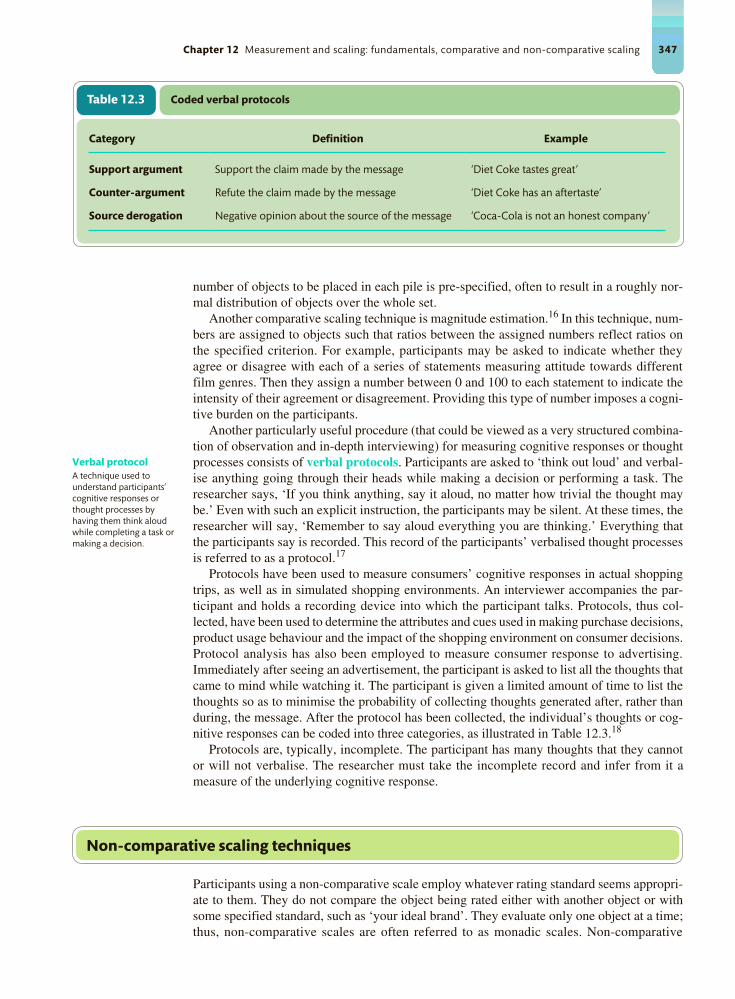
347Chapter 12 Measurement and scaling: fundamentals, comparative and non-comparative scaling
number of objects to be placed in each pile is pre-specified, often to result in a roughly nor-mal distribution of objects over the whole set.
Another comparative scaling technique is magnitude estimation.16 In this technique, num-bers are assigned to objects such that ratios between the assigned numbers reflect ratios on the specified criterion. For example, participants may be asked to indicate whether they agree or disagree with each of a series of statements measuring attitude towards different film genres. Then they assign a number between 0 and 100 to each statement to indicate the intensity of their agreement or disagreement. Providing this type of number imposes a cogni-tive burden on the participants.
Another particularly useful procedure (that could be viewed as a very structured combina-tion of observation and in-depth interviewing) for measuring cognitive responses or thought processes consists of verbal protocols. Participants are asked to ‘think out loud’ and verbal-ise anything going through their heads while making a decision or performing a task. The researcher says, ‘If you think anything, say it aloud, no matter how trivial the thought may be.’ Even with such an explicit instruction, the participants may be silent. At these times, the researcher will say, ‘Remember to say aloud everything you are thinking.’ Everything that the participants say is recorded. This record of the participants’ verbalised thought processes is referred to as a protocol.17
Protocols have been used to measure consumers’ cognitive responses in actual shopping trips, as well as in simulated shopping environments. An interviewer accompanies the par-ticipant and holds a recording device into which the participant talks. Protocols, thus col-lected, have been used to determine the attributes and cues used in making purchase decisions, product usage behaviour and the impact of the shopping environment on consumer decisions. Protocol analysis has also been employed to measure consumer response to advertising. Immediately after seeing an advertisement, the participant is asked to list all the thoughts that came to mind while watching it. The participant is given a limited amount of time to list the thoughts so as to minimise the probability of collecting thoughts generated after, rather than during, the message. After the protocol has been collected, the individual’s thoughts or cog-nitive responses can be coded into three categories, as illustrated in Table 12.3.18
Protocols are, typically, incomplete. The participant has many thoughts that they cannot or will not verbalise. The researcher must take the incomplete record and infer from it a measure of the underlying cognitive response.
Verbal protocolA technique used to understand participants’ cognitive responses or thought processes by having them think aloud while completing a task or making a decision.
Table 12.3
Category Definition Example
Support argument Support the claim made by the message ‘Diet Coke tastes great’
Counter-argument Refute the claim made by the message ‘Diet Coke has an aftertaste’
Source derogation Negative opinion about the source of the message ‘Coca-Cola is not an honest company’
Coded verbal protocols
Non-comparative scaling techniques
Participants using a non-comparative scale employ whatever rating standard seems appropri-ate to them. They do not compare the object being rated either with another object or with some specified standard, such as ‘your ideal brand’. They evaluate only one object at a time; thus, non-comparative scales are often referred to as monadic scales. Non-comparative

348 Marketing Research
techniques consist of continuous and itemised rating scales, which are described in Table 12.4 and discussed in the following sections.
Continuous rating scale
In a continuous rating scale, also referred to as a graphic rating scale, participants rate the objects by placing a mark at the appropriate position on a line that runs from one extreme of the criterion variable to the other. Thus, the participants are not restricted to selecting from marks previously set by the researcher. The form of the continuous scale may vary consider-ably. For example, the line may be vertical or horizontal: scale points, in the form of num-bers or brief descriptions, may be provided and, if provided, the scale points may be few or many. Three versions of a continuous rating scale are illustrated in Figure 12.6.
Continuous rating scaleA measurement scale that has participants rate the objects by placing a mark at the appropriate position on a line that runs from one extreme of the criterion variable to the other. The form may vary considerably. Also called graphic rating scale.
Table 12.4
Scale Basic characteristics Examples Advantages Disadvantages
Continuous rating scale
Place a mark on a continuous line
Reaction to TV advertisements
Easy to construct Scoring can be cumbersome unless computerised
Itemised rating scales
Likert scale Degree of agreement on a 1 (strongly disagree) to 5 (strongly agree) scale
Measurement of attitudes
Easy to construct, administer and understand
More time-consuming
Semantic differential scale
Seven-point scale with bipolar labels
Brand, product and company images
Versatile Controversy as to whether the data are interval
Stapel scale Unipolar 10-point scale, –5 to +5, without a neutral point (zero)
Measurement of attitudes and images
Easy to construct, administered over the phone
Confusing and difficult to apply
Basic non-comparative scales
Figure 12.6
Continuous rating scale
How would you rate the quality of seating at Odeon cinemas?
Probably the worst Probably the best
Version 1
Probably the worst Probably the best
Version 2
10 20 30 40 50 60 70 80 90 100
Probably the worst Probably the best
Version 3
10 20 30 40 50 60 70 80
✓
✓
✓90 100
Very bad Very goodNeither goodnor bad

349Chapter 12 Measurement and scaling: fundamentals, comparative and non-comparative scaling
Once the participant has provided the ratings, the researcher divides the line into as many categories as desired and assigns scores based on the categories into which the ratings fall. In Figure 12.6, the participant exhibits a favourable attitude towards the seating at the Odeon cinema. These scores are typically treated as interval data. The advantage of continuous scales is that they are easy to construct; however, scoring is cumbersome and unreliable. Moreover, continuous scales provide little new information. Recently, however, with the increase of online and mobile device surveys, their use is becoming more frequent. Continu-ous rating scales can be easily implemented in such surveys. The cursor or point of screen is touched in a continuous fashion to select the exact position on the scale that best describes the participant’s evaluation. Moreover, the scale values can be automatically scored, thus increasing the speed and accuracy of processing the data.
The following example illustrates how a technological development has enabled the use of continuous rating scales in a marketing research context.
Real research Continuous measurement and analysis of perceptions: The Perception Analyzer
The Perception Analyzer (www.dialsmith.com/dial-testing-focus-groups-products-and-services/perception-analyzer-dial-research) by Dialsmith is a computer-supported, inter-active feedback system composed of wireless or wired handheld dials for each participant, a console and software that edits questions, col-lects data and analyses participant responses. Used in the context of a focus group, for exam-ple, participants can record their emotional responses to test advertisements instantly and continuously. Each participant is given a dial and instructed to record continuously their reaction to the material being tested. As participants turn the dial, the information is fed to a computer. Thus, the researcher can determine the second-by-second response of participants as a test advertisement is run. Furthermore, this response can be superimposed on the advertisement to see the par-ticipants’ reactions to various frames and parts of the advert.
Itemised rating scales
In an itemised rating scale, participants are provided with a scale that has a number or brief description associated with each category. The categories are ordered in terms of scale position, and the participants are required to select the specified category that best describes the object being rated. Itemised rating scales are widely used in marketing research and form the basic components of more complex scales, such as multi-item rating scales. We first describe the commonly used itemised rating scales – the Likert, semantic differential and Stapel scales – and then examine the major issues surrounding the use of itemised rating scales.
Likert scale
Named after its developer, Rensis Likert, the Likert scale is a widely used rating scale that requires the participants to indicate a degree of agreement or disagreement with each of a series of statements about the stimulus objects.19 Typically, each scale item has five response
Itemised rating scaleA measurement scale having numbers or brief descriptions associated with each category. The categories are ordered in terms of scale position.
Likert scaleA measurement scale with, typically, five response categories ranging from ‘strongly disagree’ to ‘strongly agree’ that requires participants to indicate a degree of agreement or disagreement with each of a series of statements related to the stimulus objects.

350 Marketing Research
categories, ranging from ‘strongly disagree’ to ‘strongly agree’. We illustrate with a Likert scale for evaluating attitudes towards a visit to an Odeon cinema.
To conduct the analysis, each statement is assigned a numerical score, ranging either from –2 to +2 or from 1 to 5. The analysis can be conducted on an item-by-item basis (profile analysis), or a total (summated) score can be calculated for each participant by summing across items. Suppose that the Likert scale in Figure 12.7 was used to measure attitudes towards Odeon as well as a local arts-based cinema. Profile analysis would involve compar-ing the two cinema experiences in terms of the average participant ratings for each item. The summated approach is most frequently used, and, as a result, the Likert scale is also referred to as a summated scale.20 When using this approach to determine the total score for each participant on each cinema, it is important to use a consistent scoring procedure so that a high (or low) score consistently reflects a favourable response. This requires that the catego-ries assigned to the negative statements by the participants be scored by reversing the scale. Note that for a negative statement, an agreement reflects an unfavourable response, whereas for a positive statement, agreement represents a favourable response. Accordingly, a ‘strongly agree’ response to a favourable statement and a ‘strongly disagree’ response to an unfavourable statement would both receive scores of 5.21 In the example in Figure 12.7, if a higher score is to denote a more favourable attitude, the scoring of items 2, 4 and 6 will be reversed. The participant to this set of statements has an attitude score of 26. Each partici-pant’s total score for each cinema is calculated. A participant will have the most favourable attitude towards a cinema with the highest score. The procedure for developing summated Likert scales is described later in the section on the development and evaluation of scales.
The Likert scale has several advantages. It is easy to construct and administer, and par-ticipants readily understand how to use the scale, making it suitable for online surveys, kiosk, mobile, mail, telephone or personal interviews. The major disadvantage of the Likert scale is that it takes longer to complete than other itemised rating scales because participants have to read and fully reflect upon each statement. Sometimes, it may be difficult to interpret the response to a Likert item, especially if it was an unfavourable statement. In our example, the participant disagrees with statement number 2 that the Odeon sells poor-quality food. In
Figure 12.7
The Likert scale
InstructionsListed below are di�erent beliefs about the Odeon cinema. Please indicate how strongly you agree ordisagree with each by using the following scale:
1 = Strongly disagree, 2 = Disagree, 3 = Neither agree nor disagree, 4 = Agree, 5 = Strongly agree
1
1 I like to visit Odeon cinemas
2 The Odeon sells poor-quality food
3 The Odeon presents a wide variety of �lm genres
4 I do not like Odeon advertisements
5 The Odeon charges fair prices
6 Booking a seat at the Odeon is di�cult
7 The acoustics at Odeon cinemas are excellent
8 Odeon sta� serve their customers very well
2 3 4 5
9 The Odeon is a great place for families to enjoy �lms
✓
✓
✓
✓
✓
✓
✓
✓
✓

351Chapter 12 Measurement and scaling: fundamentals, comparative and non-comparative scaling
reversing the score of this item prior to summing, it is assumed that this participant would agree with a statement that the Odeon sells high-quality food. This, however, may not be true; the disagreement merely indicates that the participant would not make statement 2.
Semantic differential scale
The semantic differential is typically a seven-point rating scale with end points associated with bipolar labels that have semantic meaning. In a typical application, participants rate objects on a number of itemised, seven-point rating scales bounded at each end by one of two bipolar adjectives, such as ‘boring’ and ‘exciting’.22 We illustrate this scale in Figure 12.8 by presenting a participant’s evaluation of a visit to the Odeon cinema on six attributes.
The participants mark the blank that best indicates how they would describe the object being rated.23 Thus, in our example, an Odeon visit is evaluated as exciting, special, indul-gent, cosy and youthful, though noisy. The negative adjective or phrase sometimes appears at the left side of the scale and sometimes at the right. In this example they are mixed, and the adjectives of ‘youthful’ and ‘mature’ may not readily be classified as positive or negative. By mixing the position of positive and negative adjectives, the tendency of some partici-pants, particularly those with very positive or very negative attitudes, to mark the right- or left-hand sides without reading the labels is controlled.
Individual items on a semantic differential scale may be scored either on a –3 to +3 or on a 1 to 7 scale. The resulting data are commonly analysed through profile analysis. In profile analysis, means or median values on each rating scale are calculated and compared by plot-ting or statistical analysis. This helps determine the overall differences and similarities among the objects. To assess differences across segments of participants, the researcher can compare mean responses of different segments. Although the mean is most often used as a summary statistic, there is some controversy as to whether the data obtained should be treated as an interval scale.24 On the other hand, in cases when the researcher requires an overall comparison of objects, such as to determine cinema preference, the individual item scores are summed to arrive at a total score. As in the case of the Likert scale, the scores for the negative items are reversed before summing.
Its versatility makes the semantic differential a popular rating scale in marketing research. It has been widely used in comparing brand, product and company images. It has also been used to develop advertising and promotion strategies and in new-product development studies.25
Semantic differentialA seven-point rating scale with end points associated with bipolar labels.
Figure 12.8
Semantic differential scale
InstructionsWhat does visiting an Odeon cinema mean to you? The following descriptive scales, bounded ateach end by bipolar adjectives, summarise characteristics of a visit. Please mark in the blankthat best indicates what a visit to an Odeon cinema means to you.
Boring Exciting✗
Special Routine✗
Thrifty Indulgent✗
Cosy Uncomfortable✗
Peaceful Noisy✗
Youthful Mature✗

352 Marketing Research
Stapel scale
The Stapel scale, named after its developer, Jan Stapel, is a unipolar rating scale with 10 cate-gories numbered from –5 to +5, without a neutral point (zero).26 This scale is usually presented vertically. Participants are asked to indicate, by selecting an appropriate numerical response category, how accurately or inaccurately each term describes the object. The higher the num-ber, the more accurately the term describes the object, as shown in Figure 12.9. In this example, a visit to an Odeon cinema is perceived as being full of energy but not a special event.
The data obtained by using a Stapel scale can be analysed in the same way as semantic differential data. The Stapel scale produces results similar to the semantic differential. The Stapel scale’s advantages are that it does not require a pre-test of the adjectives or phrases to ensure true bipolarity and that it can be administered over the telephone. Some researchers, however, believe the Stapel scale is confusing and difficult to apply. Of the three itemised rating scales considered, the Stapel scale is used least. Nonetheless, this scale merits more attention than it has received.
Stapel scaleA scale for measuring attitudes that consists of a single adjective in the middle of an even-numbered range of values.
Figure 12.9
The Stapel scale
InstructionsPlease evaluate how accurately each phrase describes a visit to an Odeon cinema. Select a positivenumber for the phrases you think describe a visit accurately. The more accurately you think thephrase describes a visit, the larger the positive number you should choose. You should select a minusnumber if you do not think the phrase accurately describes a visit. The less accurately you think itdescribes a visit, the larger the negative number you should choose. You can select any number from+5 for phrases you think are very accurate, to –5 for phrases you think are very inaccurate.
A visit to an Odeon cinema+5
+4
+3
+2
+1
+5
+4
+3
+2
+1
Full of energy
–1
–2
–3
–4
–5
A special event
–1
–2
–3
–4
–5
✗
✗
Itemised rating scale decisions
As is evident from the discussion so far, non-comparative itemised rating scales can take many different forms. The researcher must make six major decisions when constructing any of these scales:
1 The number of scale categories to use.
2 Balanced versus unbalanced scale.
3 Odd or even number of categories.
4 Forced versus non-forced choice.
5 The nature and degree of the verbal description.
6 The physical form of the scale.

353Chapter 12 Measurement and scaling: fundamentals, comparative and non-comparative scaling
Number of scale categories
Two conflicting considerations are involved in deciding the number of scale categories or response options. The greater the number of scale categories, the finer the discrimination among stimulus objects that is possible. On the other hand, most participants cannot han-dle more than a few categories. Traditional guidelines suggest that the appropriate num-ber of categories should be between five and nine.27 Yet there is no single optimal number of categories. Several factors should be taken into account in deciding on the number of categories.
If the participants are interested in the scaling task and are knowledgeable about the objects, many categories may be employed. On the other hand, if the participants are not very knowledgeable or engaged with the task, fewer categories should be used. Likewise, the nature of the objects is also relevant. Some objects do not lend themselves to fine discrimina-tion, so a small number of categories is sufficient. Another important factor is the mode of data collection. If telephone interviews are involved, many categories may confuse the par-ticipants. Likewise, space limitations may restrict the number of categories in mail question-naires. If online surveys are used, there is scope for more visual treatment of scale items and categories; this will be presented in more detail later in this chapter.
How the data are to be analysed and used should also influence the number of catego-ries. In situations where several scale items are added together to produce a single score for each participant, five categories are sufficient. The same is true if the researcher wishes to make broad generalisations or group comparisons. If, however, individual responses are of interest, or if the data will be analysed by sophisticated statistical tech-niques, seven or more categories may be required. The size of the correlation coefficient, a common measure of relationship between variables (Chapter 22), is influenced by the number of scale categories. The correlation coefficient decreases with a reduction in the number of categories. This, in turn, has an impact on all statistical analysis based on the correlation coefficient.28
Balanced versus unbalanced scale
In a balanced scale, the number of favourable and unfavourable categories is equal; in an unbalanced scale, the categories are unequal.29 Examples of balanced and unbalanced scales are given in Figure 12.10.
In general, in order to obtain the most objective data, the scale should be balanced. If the distribution of responses is likely to be skewed, however, either positively or negatively, an unbalanced scale with more categories in the direction of skewness may be appropriate. If an unbalanced scale is used, the nature and degree of imbalance in the scale should be taken into account in data analysis.
Balanced scaleA scale with an equal number of favourable and unfavourable categories.
Figure 12.10
Balanced and unbalanced scales
Balanced scaleClinique moisturiser for men is:
Unbalanced scaleClinique moisturiser for men is:
Extremely good
Very good
Good
Bad
Very bad
Extremely bad
Extremely good
Very good
Good
Somewhat good
Bad
Very bad
✓ ✓

354 Marketing Research
Odd or even number of categories
With an odd number of categories, the middle scale position is generally designated as neu-tral or impartial. The presence, position and labelling of a neutral category can have a sig-nificant influence on the response. The Likert scale is a balanced rating scale with an odd number of categories and a neutral point.30
The decision to use an odd or even number of categories depends on whether some of the participants may be neutral on the response being measured. If a neutral or indifferent response is possible from at least some of the participants, an odd number of categories should be used. If, on the other hand, the researcher wants to force a response or believes that no neutral or indifferent response exists, a rating scale with an even number of categories should be used. A related issue is whether the choice should be forced or non-forced.
Forced versus non-forced choice
On forced rating scales the participants are forced to express an opinion because a ‘no opin-ion’ option is not provided. In such a case, participants without an opinion may mark the middle scale position. If a sufficient proportion of the participants do not have opinions on the topic, marking the middle position will distort measures of central tendency and vari-ance. In situations where the participants are expected to have no opinion, as opposed to simply being reluctant to disclose it, the accuracy of data may be improved by a non-forced scale that includes a ‘no opinion’ category.31
Nature and degree of verbal description
The nature and degree of verbal description associated with scale categories varies consider-ably and can have an effect on the responses. Scale categories may have verbal, numerical or pictorial descriptions. Furthermore, the researcher must decide whether to label every scale category, label only some scale categories, or label only extreme scale categories. If they are to use pictorial descriptions (which in online surveys may be moving pictures), researchers have to decide whether they are to use labels at all. Providing a verbal description for each scale category may not improve the accuracy or reliability of the data. Yet, an argument can be made for labelling all or many scale categories to reduce scale ambiguity. The category descriptions should be located as close to the response categories as possible.
The strength of the adjectives used to anchor the scale may influence the distribution of the responses. With strong anchors (1 = Completely disagree, 7 = Completely agree), par-ticipants are less likely to use the extreme scale categories. This results in less variable and more peaked response distributions. Weak anchors (1 = Generally disagree, 7 = Generally agree), in contrast, produce uniform or flat distributions. Procedures have been developed to assign values to category descriptors to result in balanced or equal interval scales.32
Physical form of the scale
A number of options are available with respect to scale form or configuration. Scales can be presented vertically or horizontally. Categories can be expressed by boxes, discrete lines or units on a continuum and may or may not have numbers assigned to them. If numerical val-ues are used, they may be positive, negative or both. Several possible configurations are presented in Figure 12.11.
Two unique rating scale configurations used in marketing research are the thermometer scale and the smiling face scale. For the thermometer scale, the higher the temperature, the more favourable the evaluation. Likewise, happier faces indicate evaluations that are more favourable. These scales are especially useful for children, although the growing familiarity with the use of emoticons on mobile devices is widening their appeal to adults.33 Examples of these scales are shown in Figure 12.12. Table 12.5 summarises the six decisions in
Forced rating scaleA rating scale that forces participants to express an opinion because a ‘no opinion’ or ‘no knowledge’ option is not provided.

355Chapter 12 Measurement and scaling: fundamentals, comparative and non-comparative scaling
Figure 12.11
Rating scale configurations
A variety of scale con�gurations may be employed to measure thegentleness of Clinique Face Scrub for Men.
Some examples include:
Clinique Face Scrub for Men is:
1 Very harsh ___ ___ ___ ___ ___ ___ ___ Very gentle
2 Very harsh 1 2 3 4 5 6 7 Very gentle
3 • Very harsh • • • Neither harsh nor gentle • • • Very gentle
4
5
Harsh Somewhatharsh
Somewhatgentle
Gentle
–3 –2 –1 0+ 1+ 2+ 3
Veryharsh
Neitherharsh
nor gentle
Verygentle
Veryharsh
Neitherharsh
nor gentle
Verygentle
Figure 12.12
Some unique rating scale configurations
Thermometer scale
InstructionsPlease indicate how much you like McDonald’s ‘Big Mac’ by colouring inthe thermometer with your red pen. Start at the bottom and colour up tothe temperature that shows how much you prefer McDonald’s ‘Big Mac’.
Form
Smiling face scale
InstructionsPlease tell me how much you like the Barbie Doll by pointing to the facethat best shows how much you like it. If you did not like the Barbie Doll atall, you would point to Face 1. If you liked it very much, you would point toFace 5. Now tell me, how much did you like the Barbie Doll?
Form
1 2 3 4 5
0°
25°
50°
75°
100°Likevery much
Dislikevery much

356 Marketing Research
designing rating scales. Table 12.6 presents some commonly used scales. Although we show these as having five categories, the number of categories can be varied depending upon the judgement of the researcher.
Table 12.5
1 Number of categories Although there is no single, optimal number, traditional guidelines suggest that there should be between five and nine categories
2 Balanced versus unbalanced In general, the scale should be balanced to obtain the most objective data
3 Odd or even number of categories If a neutral or indifferent scale response is possible from at least some of the participants, an odd number of categories should be used
4 Forced versus unforced In situations where the participants are expected to have no opinion, the accuracy of the data may be improved by a non-forced scale
5 Verbal description An argument can be made for labelling all or many scale categories. The category descriptions should be located as close to the response categories as possible
6 Physical form A number of options should be tried and the best one selected
Summary of itemised rating scale decisions
Table 12.6
Construct Scale descriptors
Attitude Very bad Bad Neither bad nor good
Good Very good
Importance Not at all important
Not important Neutral Important Very important
Satisfaction Very dissatisfied Dissatisfied Neither dissatisfied nor satisfied
Satisfied Very satisfied
Purchase intent Definitely will not buy
Probably will not buy
Might or might not buy
Probably will buy Definitely will buy
Purchase frequency
Never Rarely Sometimes Often Very often
Some commonly used scales in marketing
Multi-item scales
A multi-item scale consists of multiple items, where an item is a single question or statement to be evaluated. The Likert, semantic differential and Stapel scales presented earlier to meas-ure attitudes towards a visit to an Odeon cinema were examples of multi-item scales. Note that each of these scales has multiple items. The development of multi-item rating scales requires considerable technical expertise.34 Figure 12.13 presents a sequence of operations needed to construct multi-item scales. The researcher begins by developing the construct of interest. A construct is a specific type of concept that exists at a higher level of abstraction than everyday concepts. Examples of such constructs in marketing include ‘brand loyalty’,
Multi-item scaleA multi-item scale consists of multiple items, where an item is a single question or statement to be evaluated.
ConstructA specific type of concept that exists at a higher level of abstraction than do everyday concepts.

357Chapter 12 Measurement and scaling: fundamentals, comparative and non-comparative scaling
‘product involvement’ and ‘satisfaction’. Next, the researcher must develop a theoretical def-inition of the construct that establishes the meaning of the central idea or concept of interest. For this we need an underlying theory of the construct being measured. A theory is necessary not only for constructing the scale, but also for interpreting the resulting scores. For example, brand loyalty may be theoretically defined as the consistent repurchase of a brand prompted by a favourable attitude towards the brand. The construct of brand loyalty must be operation-alised in a way that is consistent with this theoretical definition. The operational definition specifies which observable characteristics will be measured and the process of assigning value to the construct. For example, in a context of buying fashion items, consumers could be characterised as brand loyal if they exhibit a highly favourable attitude (top quartile) and have purchased the same fashion brand on at least four of the last five purchase occasions.
The next step is to generate an initial pool of scale items. Typically, this is based on the-ory, analysis of secondary data and qualitative research. From this pool, a reduced set of potential scale items is generated by the judgement of the researcher and other knowledgea-ble individuals. Some qualitative criterion is adopted to aid their judgement. The reduced set of items may still be too large to constitute a scale. Thus, further reduction is achieved in a quantitative manner.
Data are collected on the reduced set of potential scale items from a large pre-test sample of participants. The data are analysed using techniques such as correlations, factor analysis, cluster analysis, discriminant analysis and statistical tests (discussed later in this book). As a result of these statistical analyses, several more items are eliminated, resulting in a purified scale. The purified scale is evaluated for reliability and validity by collecting more data from a different sample. On the basis of these assessments, a final set of scale items is selected. As can be seen from Figure 12.13, the scale development process is an iterative one with several feedback loops.35
Figure 12.13
Development of a multi-item scale
Develop theory
Generate initial pool of items: theory, secondarydata and qualitative research
Select a reduced set of items based onqualitative judgement
Collect data from large pre-test sample
Statistical analysis
Develop puri�ed scale
Collect more data from a di�erent sample
Final scale
Evaluate scale reliabilty, validityand generalisability

358 Marketing Research
Scale evaluation
A multi-item scale should be evaluated for accuracy and applicability.36 As shown in Figure 12.14, this involves an assessment of reliability, validity and generalisability of the scale. Approaches to assessing reliability include test–retest reliability, alternative-forms reliability and internal consistency reliability. Validity can be assessed by examining content validity, criterion validity and construct validity.
Before we can examine reliability and validity we need an understanding of measurement accuracy; it is fundamental to scale evaluation.
Measurement accuracy
A measurement is a number that reflects some characteristic of an object. A measurement is not the true value of the characteristic of interest but rather an observation of it. A variety of factors can cause measurement error, which results in the measurement or observed score being different from the true score of the characteristic being measured (see Table 12.7).
The true score model provides a framework for understanding the accuracy of measure-ment. According to this model,
XO=XT+XS+XR
where XO = the observed score or measurement XT = the true score of the characteristic XS = systematic error XR = random error
Note that the total measurement error includes the systematic error, XS, and the random error, XR. Systematic error affects the measurement in a constant way. It represents stable factors that affect the observed score in the same way each time the measurement is made, such as mechanical factors (see Table 12.7). Random error, on the other hand, is not con-stant. It represents transient factors that affect the observed score in different ways each time the measurement is made, such as short-term transient personal factors or situational factors (see Table 12.7). The distinction between systematic and random error is crucial to our understanding of reliability and validity.
Measurement errorThe variation in the information sought by the researcher and the information generated by the measurement process employed.
True score modelA mathematical model that provides a framework for understanding the accuracy of measurement.
Systematic errorAn error that affects the measurement in a constant way and represents stable factors that affect the observed score in the same way each time the measurement is made.
Random errorAn error that arises from random changes or differences in participants or measurement situations.
Figure 12.14
Scale evaluation
Reliability GeneralisabilityValidity
Criterion
Internalconsistency
Test/retest
Convergent NomologicalDiscriminantAlternativeforms
Scale evaluation
ConstructContent

359Chapter 12 Measurement and scaling: fundamentals, comparative and non-comparative scaling
Reliability
Reliability refers to the extent to which a scale produces consistent results if repeated meas-urements are made.37 Systematic sources of error do not have an adverse impact on reliabil-ity, because they affect the measurement in a constant way and do not lead to inconsistency. In contrast, random error produces inconsistency, leading to lower reliability. Reliability can be defined as the extent to which measures are free from random error, XR. If XR = 0, the measure is perfectly reliable.
Reliability is assessed by determining the proportion of systematic variation in a scale. This is done by determining the association between scores obtained from different adminis-trations of the scale. If the association is high, the scale yields consistent results and is there-fore reliable. Approaches for assessing reliability include the test–retest, alternative-forms and internal consistency methods.
In test–retest reliability, participants are administered identical sets of scale items at two different times, under as nearly equivalent conditions as possible. The time interval between tests or administrations is typically two to four weeks. The degree of similarity between the two measurements is determined by computing a correlation coefficient (see Chapter 22). The higher the correlation coefficient, the greater the reliability.
Several problems are associated with the test–retest approach to determining reliability. First, it is sensitive to the time interval between testing. Other things being equal, the longer the time interval, the lower the reliability. Second, the initial measurement may alter the character-istic being measured. For example, measuring participants’ attitude towards low-alcohol beer may cause them to become more health conscious and to develop a more positive attitude towards low-alcohol beer. Third, it may be impossible to make repeated measurements (e.g. the research topic may be the participant’s initial reaction to a new product). Fourth, the first meas-urement may have a carryover effect to the second or subsequent measurements. Participants may attempt to remember answers they gave the first time. Fifth, the characteristic being meas-ured may change between measurements. For example, favourable information about an object between measurements may make a participant’s attitude more positive. Finally, the test–retest reliability coefficient can be inflated by the correlation of each item with itself. These correla-tions tend to be higher than correlations between different scale items across administrations. Hence, it is possible to have high test–retest correlations because of the high correlations between the same scale items measured at different times, even though the correlations between different scale items are quite low. Because of these problems, a test–retest approach is best applied in conjunction with other approaches, such as alternative-forms reliability.38
ReliabilityThe extent to which a scale produces consistent results if repeated measurements are made on the characteristic.
Test–retest reliabilityAn approach for assessing reliability, in which participants are administered identical sets of scale items at two different times, under as nearly equivalent conditions as possible.
Table 12.7
1 Other relatively stable characteristics of the individual that influence the test score, such as intelligence, social desirability and education
2 Short-term or transient personal factors, such as health, emotions and fatigue
3 Situational factors, such as the presence of other people, noise and distractions
4 Sampling of items included in the scale: addition, deletion or changes in the scale items
5 Lack of clarity of the scale, including the instructions or the items themselves
6 Mechanical factors, such as poor printing, overcrowding items in the questionnaire and poor design
7 Administration of the scale, such as differences among interviewers
8 Analysis factors, such as differences in scoring and statistical analysis
Potential sources of error in measurement

360 Marketing Research
In alternative-forms reliability, two equivalent forms of the scale are constructed. The same participants are measured at two different times, usually two to four weeks apart, with a different scale form being administered each time. The scores from the administrations of the alternative scale forms are correlated to assess reliability.39
The two forms should be equivalent with respect to content, i.e. each scale item should attempt to measure the same items. There are two major problems with this approach. First, it is time-consuming and expensive to construct an equivalent form of the scale. Second, it is difficult to construct two equivalent forms of a scale. The two forms should be equivalent with respect to content. In a strict sense, it is required that the alternative sets of scale items should have the same means, variances and intercorrelations. Even if these conditions are satisfied, the two forms may not be equivalent in content. Thus, a low correlation may reflect either an unreliable scale or non-equivalent forms.
Internal consistency reliability is used to assess the reliability of a summated scale where several items are summed to form a total score. In a scale of this type, each item meas-ures some aspect of the construct measured by the entire scale, and the items should be con-sistent in what they indicate about the construct.40 This measure of reliability focuses on the internal consistency of the set of items forming the scale.
The simplest measure of internal consistency is split-half reliability. The items on the scale are divided into two halves and the resulting half scores are correlated. High correla-tions between the halves indicate high internal consistency.41 The scale items can be split into halves based on odd- and even-numbered items, or randomly. The problem is that the results will depend on how the scale items are split. A popular approach to overcoming this problem is to use the coefficient alpha.
The coefficient alpha, or Cronbach’s alpha, is the average of all possible split-half coef-ficients resulting from different ways of splitting the scale items.42 This coefficient varies from 0 to 1, and a value of 0.6 or less generally indicates unsatisfactory internal consistency reliability. An important property of coefficient alpha is that its value tends to increase with an increase in the number of scale items. Therefore, coefficient alpha may be artificially, and inappropriately, inflated by including several redundant scale items.43 Another coeffi-cient that can be employed in conjunction with coefficient alpha is coefficient beta. Coef-ficient beta assists in determining whether the averaging process used in calculating coefficient alpha is masking any inconsistent items.
Some multi-item scales include several sets of items designed to measure different aspects of a multidimensional construct. For example, a fashion boutique’ image is a multidimensional construct that includes brand image(s) of stocked merchandise, quality of merchandise, assort-ment of merchandise, layout and merchandising, service of boutique personnel, prices, physi-cal location and characteristics of other shoppers in the boutique. Hence, a scale designed to measure the fashion boutique’ image could contain items measuring each of these dimensions. Because these dimensions are somewhat independent, a measure of internal consistency com-puted across dimensions would be inappropriate. If several items are used to measure each dimension, however, internal consistency reliability can be computed for each dimension.
The following example illustrates how researchers developed scale items to encapsulate newspaper-reading behaviour. It shows how they performed reliability tests and the subject of our next section, validity tests.
Alternative-forms reliabilityAn approach for assessing reliability that requires two equivalent forms of the scale to be constructed and then the same participants to be measured at two different times.
Internal consistency reliabilityAn approach for assessing the internal consistency of a set of items, where several items are summated in order to form a total score for the scale.
Split-half reliabilityA form of internal consistency reliability in which the items constituting the scale are divided into two halves and the resulting half scores are correlated.
Coefficient alphaA measure of internal consistency reliability that is the average of all possible split-half coefficients resulting from different splittings of the scale items.
Real research Reading digital newspapers: establishing reliability and validity44
The internet has brought about a revolution in journalism. Digital media have impacted upon the speed with which news items reach readers, the low cost of distributing infor-mation and the opportunities to establish more direct contact and interaction with readers. These advantages have shifted journalism online, resulting in a proliferation of

361Chapter 12 Measurement and scaling: fundamentals, comparative and non-comparative scaling
Validity
The validity of a scale may be considered as the extent to which differences in observed scale scores reflect true differences among objects on the characteristic being measured, rather than systematic or random error. Perfect validity requires that there be no measure-ment error (XO = XT, XR = 0, XS = 0). Researchers may assess content validity, criterion validity or construct validity.45
ValidityThe extent to which a measurement represents characteristics that exist in the phenomenon under investigation.
increasingly specialised electronic journals. In a study of digital journalism, the main objective was to analyse the possible influ-ence of reader motivations on the degree of substitutability between digital and tradi-tional media. In order to develop scales to measure their chosen variables, researchers undertook an exhaustive review of the litera-ture, including a search for existing scales that could be suitably adapted. They also conducted a series of in-depth interviews with readers. They then designed a series of questions that would measure the multiple dimensions involved.
Before testing any hypotheses, the scales initially proposed were subjected to a sifting process in order to obtain measurement instruments that would allow the researchers to quantify the concepts they wanted to encapsulate. There was an exploratory analysis of reliability, the first step of which was to calculate the Cronbach’s alpha value and the item-total correlation of each of the variables analysed. The initial scales were refined and the results of the Cronbach’s alpha test showed an acceptable degree of internal consistency in the four scales they considered, being in all the cases over the 0.7 recom-mended by Cronbach. As a second step the researchers carried out a study of unidimen-sionality by means of an exploratory factor analysis. The next stage was a confirmatory analysis of reliability, in order to guarantee the proposed scales’ reliability and validity. This enabled them to sift scales by the development of successive confirmatory factor analyses. The goodness of fit of the complete confirmatory model was checked and was acceptable. Lastly, the scales that had varied in structure since the exploratory analysis were subjected to a fresh reliability assessment using Cronbach’s alpha criteria and item-total correlation. The reliability levels for each indicator, expressed in terms of R2, were at acceptable levels. In order to confirm the definitive reliability of the scales, the researchers carried out tests of the composite reliability coefficient and the average var-iance extracted.
In order to verify whether the designed scales were measuring the concepts correctly, analyses of validity were carried out. In this study, researchers considered validity to be guaranteed not only in view of the rigour used in the design of the initial scales on the basis of the literature, but also because they took into account the findings of their in-depth interviews, which were endorsed by various experts in the subject. Construct validity analysis was formed by two fundamental categories of validity: convergent and discriminatory. In terms of convergent validity the standardised coefficients in each scale were over 0.5 and significant. To assess the discriminatory validity the researchers used several tests, such as checking that value ‘1’ was not in the confidence interval of the correlations between different constructs. Likewise, they checked that correlations between different scales were not over 0.8.

362 Marketing Research
Content validity, sometimes called face validity, is a subjective but systematic evalua-tion of how well the content of a scale represents the measurement task at hand. The researcher or someone else examines whether the scale items adequately cover the entire domain of the construct being measured. Thus, a scale designed to measure a fashion bou-tique’ image would be considered inadequate if it omitted any of the major dimensions (brand image(s) of stocked merchandise, quality of merchandise, assortment of merchandise, layout and merchandising, service of boutique personnel, prices, etc.). Given its subjective nature, content validity alone is not a sufficient measure of the validity of a scale, yet it aids in a common-sense interpretation of the scale scores.46 A more formal evaluation can be obtained by examining criterion validity.
Criterion validity reflects whether a scale performs as expected in relation to other selected variables (criterion variables) as meaningful criteria. If, for example, a scale is designed to measure loyalty in customers, criterion validity might be determined by compar-ing the results generated by this scale with results generated by observing the extent of repeat purchasing. Based on the time period involved, criterion validity can take two forms, concur-rent validity and predictive validity.
Concurrent validity is assessed when the data on the scale being evaluated (e.g. loyalty scale) and the criterion variables (e.g. repeat purchasing) are collected at the same time. The scale being developed and the alternative means of encapsulating the criterion variables would be administered simultaneously and the results compared.47
Predictive validity is concerned with how well a scale can forecast a future criterion. To assess predictive validity, the researcher collects data on the scale at one point in time and data on the criterion variables at a future time. For example, attitudes towards how loyal customers feel to a particular brand could be used to predict future repeat purchases of that brand. The predicted and actual purchases (which could be tracked on CRM databases or scanned purchases) are compared to assess the predictive validity of the attitudinal scale.48
Construct validity addresses the question of what construct or characteristic the scale is, in fact, measuring. When assessing construct validity, the researcher attempts to answer the-oretical questions about why the scale works and what deductions can be made concerning the underlying theory. Thus, construct validity requires a sound theory of the nature of the construct being measured and how it relates to other constructs.49 Construct validity is the most sophisticated and difficult type of validity to establish. As Figure 12.14 shows, con-struct validity includes convergent, discriminant and nomological validity.
Convergent validity is the extent to which the scale correlates positively with other measurements of the same construct. It is not necessary that all these measurements be obtained by using conventional scaling techniques.50 Discriminant validity is the extent to which a measure does not correlate with other constructs from which it is supposed to differ. It involves demonstrating a lack of correlation among differing constructs.51 Nomological validity is the extent to which the scale correlates in theoretically predicted ways with measures of different but related constructs. A theoretical model is formulated that leads to further deductions, tests and inferences.52 Gradually, a nomological net is built in which several constructs are systematically interrelated.
An instance of construct validity can be evaluated in the following example. A researcher seeks to provide evidence of construct validity in a multi-item scale, designed to measure the concept of ‘self-image’. These findings would be sought:53
• High correlations with other scales designed to measure self-concepts and with reported classifications by friends (convergent validity).
• Low correlations with unrelated constructs of brand loyalty and variety seeking (discrimi-nant validity).
• Brands that are congruent with the individual’s self-concept are preferred, as postulated by the theory (nomological validity).
• A high level of reliability.
Content validityA type of validity, sometimes called face validity, that consists of a subjective but systematic evaluation of the representativeness of the content of a scale for the measuring task at hand.
Criterion validityA type of validity that examines whether the measurement scale performs as expected in relation to other selected variables as meaningful criteria.
Concurrent validityA type of validity that is assessed when the data on the scale being evaluated and on the criterion variables are collected at the same time.
Predictive validityA type of validity that is concerned with how well a scale can forecast a future criterion.
Construct validityA type of validity that addresses the question of what construct or characteristic the scale is measuring. An attempt is made to answer theoretical questions of why a scale works and what deductions can be made concerning the theory underlying the scale.
Convergent validityA measure of construct validity that measures the extent to which the scale correlates positively with other measures of the same construct.
Discriminant validityA type of construct validity that assesses the extent to which a measure does not correlate with other constructs from which it is supposed to differ.
Nomological validityA type of validity that assesses the relationship between theoretical constructs. It seeks to confirm significant correlations between the constructs as predicted by a theory.

363Chapter 12 Measurement and scaling: fundamentals, comparative and non-comparative scaling
Note that a high level of reliability was included as evidence of construct validity in this example. This illustrates the relationship between reliability and validity.
Relationship between reliability and validity
The relationship between reliability and validity can be understood in terms of the true score model. If a measure is perfectly valid, it is also perfectly reliable. In this case, XO = XT, XR = 0 and XS = 0. Thus, perfect validity implies perfect reliability. If a measure is unrelia-ble, it cannot be perfectly valid, since at a minimum XO = XT + XR. Furthermore, systematic error may also be present, i.e. XS ≠ 0. Thus, unreliability implies invalidity. If a measure is perfectly reliable, it may or may not be perfectly valid, because systematic error may still be present (XO = XT + XS). In other words, a reliable scale can be constructed to measure ‘cus-tomer loyalty’ but it may not necessarily be a valid measurement of ‘customer loyalty’. Con-versely, a valid measurement of ‘customer loyalty’ has to be reliable. Reliability is a necessary, but not sufficient, condition for validity.
Generalisability
Generalisability refers to the extent to which one can generalise from the observations at hand to a universe of generalisations. The set of all conditions of measurement over which the investigator wishes to generalise is the universe of generalisation. These conditions may include items, interviewers and situations of observation. A researcher may wish to general-ise a scale developed for use in personal interviews to other modes of data collection, such as kiosk and online interviews. Likewise, one may wish to generalise from a sample of items to the universe of items, from a sample of times of measurement to the universe of times of measurement, from a sample of observers to a universe of observers, and so on.54
In generalisability studies, measurement procedures are designed to investigate each uni-verse of interest by sampling conditions of measurement from each of them. For each uni-verse of interest, an aspect of measurement called a facet is included in the study. Traditional reliability methods can be viewed as single-facet generalisability studies. A test–retest cor-relation is concerned with whether scores obtained from a measurement scale are generalis-able to the universe scores across all times of possible measurement. Even if the test–retest correlation is high, nothing can be said about the generalisability of the scale to other uni-verses. To generalise to other universes, generalisability theory procedures must be employed.
GeneralisabilityThe degree to which a study based on a sample applies to the population as a whole.
Choosing a scaling technique
In addition to theoretical considerations and evaluation of reliability and validity, certain practical factors should be considered in selecting scaling techniques for a particular market-ing research problem.55 These include the level of information (nominal, ordinal, interval or ratio) desired, the capabilities and willingness of participants, the characteristics of the stim-ulus objects, method of administration, the context and cost. Selecting an appropriate rating scale is a necessary first step in developing a good measurement instrument; establishing statistical reliability and validity through a multi-step testing and retesting process should be accorded the highest priority in selecting a scale. A good rating scale should have the follow-ing characteristics:56 minimal response bias, participant interpretation and understanding, discriminating power, ease of administration, ease of use by participants, credibility and usefulness of results.
As a general rule, using the scaling technique that will yield the highest level of informa-tion feasible in a given situation will permit using the greatest variety of statistical analyses.

364 Marketing Research
Also, regardless of the type of scale used, whenever feasible, several scale items should be used to measure the characteristic of interest. This provides more accurate measurement than a single-item scale. In many situations, it is desirable to use more than one scaling technique or to obtain additional measures using mathematically derived scales.
Mathematically derived scales
All the scaling techniques discussed in this chapter require the participants to evaluate directly the constructs that the researcher believes to comprise the object of study, e.g. the cognitive state of brand loyalty. In contrast, mathematical scaling techniques allow research-ers to infer participants’ evaluations of the constructs of the object of study. These evalua-tions are inferred from the participants’ overall judgements. Two popular mathematically derived scaling techniques are multidimensional scaling and conjoint analysis (which are discussed in detail in Chapter 26).
Summary Measurement is the assignment of numbers or other symbols to characteristics of objects according to set rules. Scaling involves the generation of a continuum upon which meas-ured objects are located. The fundamental scale characteristics are description, order, distance and origin. The four primary scales of measurement are nominal, ordinal, inter-val and ratio. Of these, the nominal scale is the most basic, in that the numbers are used only for identifying or classifying objects and the only characteristic possessed is description. In the ordinal scale, the numbers indicate the relative position of the objects but not the magnitude of difference between them. Thus, only the order and description characteristics are present. The interval scale permits a comparison of the differences between the objects. Because it has an arbitrary zero point, however, it is not meaningful to calculate ratios of scale values on an interval scale. The highest level of measurement is represented by the ratio scale, in which the zero point is fixed. The researcher can compute ratios of scale values using this scale. The ratio scale incorporates all the prop-erties of the lower-level scales and also has the origin characteristic.
Scaling techniques can be classified as comparative or non-comparative. Comparative scaling involves a direct comparison of stimulus objects. Comparative scales include paired comparisons, rank order, constant sum and the Q-sort. The data obtained by these procedures have only ordinal properties. Verbal protocols, where the participant is instructed to think out loud, can be used for measuring cognitive responses. In non-comparative scaling, each object is scaled independently of the other objects in the stimulus set. The resulting data are generally assumed to be interval or ratio scaled. Non-comparative rating scales can be either continuous or itemised. The itemised rat-ing scales are further classified as Likert, semantic differential or Stapel scales. The data from all these three types of scale are typically treated as interval. Thus, these scales possess the characteristics of description, order and distance. When using non-comparative itemised rating scales, the researcher must decide on the number of scale categories, balanced versus unbalanced scales, an odd or even number of categories, forced versus non-forced choices, the nature and degree of verbal description and the physical form or configuration.
Multi-item scales consist of a number of rating scale items. These scales should be evaluated in terms of reliability and validity. Reliability refers to the extent to which a

365Chapter 12 Measurement and scaling: fundamentals, comparative and non-comparative scaling
scale produces consistent results if repeated measurements are made. Approaches to assessing reliability include test–retest, alternative forms and internal consistency. The validity of a measurement may be assessed by evaluating content validity, crite-rion validity and construct validity.
The choice of a particular scaling technique in a given situation should be based on theoretical and practical considerations. Generally, the scaling technique used should be the one that will yield the highest level of information feasible. Also, multiple measures should be obtained.
Questions 1 What is measurement?
2 Highlight any marketing phenomena that you feel may be problematic in terms of assigning numbers to characteristics of those phenomena.
3 Describe and illustrate, with examples, the differences between a nominal and an ordinal scale.
4 What are the advantages of a ratio scale over an interval scale? Are these advantages significant?
5 What is a comparative rating scale?
6 What is a paired comparison? What are the advantages and disadvantages of paired comparison scaling?
7 Describe the constant sum scale. How is it different from the other comparative rating scales?
8 Identify the type of scale (nominal, ordinal, interval or ratio) used in each of the following. Give reasons for your choice.
a I like to listen to the radio when I am revising for exams
Disagree Agree
1 2 3 4 5
b How old are you? _______________
c Rank the following activities in terms of your preference by assigning a rank from 1 to 5: (1 = Most preferred, 2 = Second-most preferred, etc.):
(i) Reading magazines
(ii) Watching television
(iii) Going to the cinema
(iv) Shopping for clothes
(v) Eating out.
d What is your university/college registration number? _______________
e In an average weekday, how much time do you spend doing class assignments?
(i) Less than 15 minutes
(ii) 15 to 30 minutes
(iii) 31 to 60 minutes

366 Marketing Research
(iv) 61 to 120 minutes
(v) More than 120 minutes.
f How much money did you spend last week in a coffee shop? _______________
9 Describe the semantic differential scale and the Likert scale. For what purposes are these scales used?
10 What are the major decisions involved in constructing an itemised rating scale? How many scale categories should be used in an itemised rating scale? Why?
11 Should an odd or even number of categories be used in an itemised rating scale?
12 How does the nature and degree of verbal description affect the response to itemised rating scales?
13 What is reliability? What are the differences between test–retest and alternative-forms reliability?
14 What is validity? What is criterion validity? How is it assessed?
15 How would you select a particular scaling technique?
Exercises 1 You work in the marketing research department of a luxury watch brand. Your firm would like to measure the attitudes of retailers towards your brand and your main competitors. The attitudes would be measured using an online survey. You have been asked to develop an appropriate scale for this purpose. You have also been asked to explain and justify your reasoning in constructing this scale.
2 Develop three comparative (paired comparison, rank order and constant sum) scales to measure attitude towards five popular brands of soft drink (e.g. Coca Cola, Pepsi, Dr. Pepper, 7 Up and Red Bull). Administer each scale to five students. No student should be administered more than one scale. Note the time it takes each student to respond. Which scale was the easiest to administer? Which scale took the shortest time?
3 Develop a constant sum scale to determine preferences for restaurants. Administer this scale to a pilot sample of 20 students to determine their preferences for some of the popular restaurants in your town or city. Based on your pilot, evaluate the efficacy of the scale items you chose, and design new scale items that could be used for a full survey.
4 Design Likert scales to measure the usefulness of the Louis Vuitton Möet Hennessy website. Visit the site at www.lvmh.com and rate it on the scales that you have developed. After your site visit, were there any aspects of usefulness that you had not considered in devising your scales, what were they and why were they not apparent before you made your site visit?
5 In a small group, discuss the following issues: ‘A brand could receive the highest median rank on a rank order scale of all the brands considered and still have poor sales’ and ‘It really does not matter which scaling technique you use. As long as your measure is reliable, you will get the right results.’

367Chapter 12 Measurement and scaling: fundamentals, comparative and non-comparative scaling
Notes
1. Bartholomew, D.J., Measurement (Thousand Oaks, CA: Sage, 2006); Wyner, G.A., ‘The right side of metrics’, Marketing Management 13 (1) (2004), 8–9; Newell, S.J., ‘The development of a scale to measure perceived corporate credibility’, Journal of Business Research (June 2001), 235; Gofton, K., ‘If it moves measure it’, Marketing (Marketing Technique Supplement) (4 September 1997), 17; Nunnally, J.C., Psychometric Theory, 2nd edn (New York: McGraw-Hill, 1978), 3.
2. Schuster, C. and Smith, D.A., ‘Estimating with a latent class model the reliability of nominal judgments upon which two raters agree’, Educational and Psychological Measurement 66 (5) (October 2006), 739; Stevens, S., ‘Mathematics, measurement and psychophysics’, in Stevens, S. (ed.), Handbook of Experimental Psychology (New York: Wiley, 1951).
3. Giovagnoli, A., Marzialetti, J. and Wynn, H.P., ‘A new approach to inter-rater agreement through stochastic orderings: The discrete case’, Metrika 67 (3) (April 2008), 349–70; Kurpius, S.E., Testing and Measurement (Thousand Oaks, CA: Sage, 2002); Moshkovich, H.M., ‘Ordinal judgments in multiattribute decision analysis’, European Journal of Operational Research 137 (3) (16 March 2002), 625; Cook, W.D., Kress, M. and Seiford, L.M., ‘On the use of ordinal data in data envelopment analysis’, Journal of the Operational Research Society 44 (2) (February 1993), 133–40; Barnard, N.R. and Ehrenberg, A.S.C., ‘Robust measures of consumer brand beliefs’, Journal of Marketing Research 27 (November 1990), 477–84; Perreault, W.D. Jr and Young, F.W., ‘Alternating least squares optimal scaling: Analysis of nonmetric data in marketing research’, Journal of Marketing Research 17 (February 1980), 1–13.
4. Halme, M., ‘Dealing with interval scale data in data envelopment analysis’, European Journal of Operational Research 137 (1) (16 February 2002), 22; Lynn, M. and Harriss, J., ‘The desire for unique consumer products: A new individual difference scale’, Psychology and Marketing 14 (6) (September 1997), 601–16.
5. For a discussion of these scales, refer to Miller, D.C. and Salkind, N.J., Handbook of Research Design and Social Measurement, 6th edn (Thousand Oaks, CA: Sage, 2002); Taiwo, A., ‘Overall evaluation rating scales: An assessment’, International Journal of Market Research (Summer 2000), 301–11; Coombs, C.H., ‘Theory and methods of social measurement’, in Festinger, L. and Katz, D. (eds), Research Methods in the Behavioral Sciences (New York: Holt, Rinehart & Winston, 1953).
6. Tellis, G.J., ‘Generalizations about advertising effectiveness in markets’, Journal of Advertising Research 49 (2) (June 2009), 240–5.
7. There is, however, some controversy regarding this issue. See Louviere, J.J. and Islam, T., ‘A comparison of importance weights and willingness-to-pay measures derived from choice based conjoint, constant sum scales and best-worst scaling’, Journal of Business Research 61 (9) (September 2008), 903–11; Campbell, D.T. and Russo, M.J., Social Measurement (Thousand Oaks, CA: Sage, 2001); Amoo, T., ‘Do the numeric values influence subjects’ responses to rating scales?’, Journal of International Marketing and Marketing Research (February 2001), 41.
8. Tavares, S., Cardoso, M. and Dias, J.G., ‘The heterogeneous best-worst choice method in market research’, International Journal of Market Research 52 (4) (2010), 533–46.
9. Anon., ‘Competition between Coca-Cola and Pepsi to start,’ Asiainfo Daily China News (19 March 2002), 1; Rickard, L., ‘Remembering New Coke’, Advertising Age 66 (16) (17 April 1995), 6; ‘Coke’s flip-flop underscores risks of consumer taste tests’, Wall Street Journal (18 July 1985), 25.
10. It is not necessary to evaluate all possible pairs of objects, however. Procedures such as cyclic designs can significantly reduce the number of pairs evaluated. A treatment of such procedures may be found in Bemmaor, A.C. and Wagner, U., ‘A multiple-item model of paired comparisons: Separating chance from latent performance’, Journal of Marketing Research 37 (4) (November 2000), 514–24; Malhotra, N.K., Jain, A.K. and Pinson, C., ‘The robustness of MDS configurations in the case of incomplete data’, Journal of Marketing Research 25 (February 1988), 95–102.
11. For an advanced application involving paired comparison data, see Bemmaor, A.C. and Wagner, U., ‘A multiple-item model of paired comparisons: Separating chance from latent performance’, Journal of Marketing Research 37 (4) (November 2000), 514–24.
12. For the assumption of transitivity, see Voorhoeve, A. and Binmore, K., ‘Transitivity, the Sorites paradox, and similarity based decision making’, Erkenntnis 64 (1) (January 2006), 101–14; Miljkovic, D., ‘Rational choice and irrational individuals or simply an irrational theory: A critical review of the hypothesis of perfect rationality’, Journal of Socio-Economics 34 (5) (October 2005), 621–34. For Thurstone scaling, see Viswanathan, M., Measurement Error and Research Design (Thousand Oaks, CA: Sage, 2005): Campbell, D.T. and Russo, M.J., Social Measurement (Thousand Oaks, CA: Sage, 2001); Likert, R., Roslow, S. and Murphy, G., ‘A simple and reliable method of scoring the Thurstone Attitude Scales’, Personnel Psychology 46 (3) (Autumn 1993), 689–90; Thurstone, L.L., The Measurement of Values (Chicago: University of Chicago Press, 1959). For an application of the case V procedure, see Malhotra, N.K., ‘Marketing linen services to hospitals: A conceptual framework and an empirical investigation using Thurstone’s case V analysis’, Journal of Health Care Marketing 6 (March 1986), 43–50.
13. Yvert-Blanchet, N. and Fournier, A., ‘Likeability, liking is not enough’, ESOMAR Fragrance Conference, Paris (November 2007).
14. Bottomley, P.A., ‘Testing the reliability of weight elicitation methods: Direct rating versus point allocation’, Journal of Marketing Research 37 (4) (November 2000), 508–13; Herman, M.W. and Koczkodaj, W.W., ‘A Monte Carlo study of pairwise comparison’, Information Processing Letters 57 (1) (15 January 1996), 25–9.
15. Chrzan, K. and Golovashkina, N., ‘An empirical test of six stated importance measures’, International Journal of Market Research 48 (6) (2006), 717–40.
16. Siciliano, T., ‘Magnitude estimation’, Quirk’s Marketing Research Review (November 1999); Noel, N.M. and Nessim, H., ‘Benchmarking consumer perceptions of

368 Marketing Research
product quality with price: An exploration’, Psychology & Marketing 13 (6) (September 1996), 591–604; Steenkamp, J.B. and Wittink, D.R., ‘The metric quality of full-profile judgments and the number of attribute levels effect in conjoint analysis’, International Journal of Research in Marketing 11 (3) (June 1994), 275–86.
17. For an application of verbal protocols, see Shao, W., Lye, A. and Rundle-Thiele, S., ‘Decisions, decisions, decisions: Multiple pathways to choice’, International Journal of Market Research 50 (6) (2008), 797–816.
18. Mick, D.G., ‘Levels of subjective comprehension in advertising processing and their relations to ad perceptions, attitudes, and memory’, Journal of Consumer Research 18 (March 1992), 411–24; Wright, P.L., ‘Cognitive processes mediating acceptance of advertising’, Journal of Marketing Research 10 (February 1973), 53–62; Wright, P.L., ‘Cognitive responses to mass media advocacy and cognitive choice processes’, in Petty, R., Ostrum, T. and Brock, T. (eds), Cognitive Responses to Persuasion (New York: McGraw-Hill, 1978).
19. Swain, S.D., Weathers, D. and Niedrich, R.W., ‘Assessing three sources of misresponse to reversed Likert items’, Journal of Marketing Research 45 (1) (February 2008), 116–31; Bartholomew, D.J., Measurement (Thousand Oaks, CA: Sage, 2006); Amoo, T. and Friedman, H.H., ‘Overall evaluation rating scales: An assessment,’ International Journal of Market Research 42 (3) (Summer 2000), 301–10; Albaum, G., ‘The Likert scale revisited - an alternative version’, Journal of the Market Research Society 39 (2) (April 1997), 331–48; Brody, C.J. and Dietz, J., ‘On the dimensionality of 2-question format Likert attitude scales’, Social Science Research 26 (2) (June 1997), 197–204; Likert, R., ‘A technique for the measurement of attitudes’, Archives of Psychology 140 (1932).
20. However, when the scale is multidimensional, each dimension should be summed separately. See Braunsberger, K., Buckler, R.B. and Ortinau, D.J., ‘Categorizing cognitive responses: An empirical investigation of the cognitive intent congruency between independent raters and original subject raters’, Journal of the Academy of Marketing Science 33 (4) (September 2005), 620–32; Stanton, J.M., ‘Issues and strategies for reducing the length of self-report scales’, Personnel Psychology 55 (1) (Spring 2002), 167–94; Aaker, J.L., ‘Dimensions of brand personality’, Journal of Marketing Research 34 (August 1997), 347–56.
21. Herche, J. and Engelland, B., ‘Reversed-polarity items and scale unidimensionality’, Journal of the Academy of Marketing Science 24 (4) (Fall 1996), 366–74.
22. Sethi, R., Smith, D.C. and Whan Park, C., ‘Cross-functional product development teams, creativity and the innovativeness of new consumer products’, Journal of Marketing Research 38 (1) (February 2001), 73–85; Chandler, T.A. and Spies, C.J., ‘Semantic differential comparisons of attributions and dimensions among participants from 7 nations’, Psychological Reports 79 (3 pt 1) (December 1996), 747–58.
23. Kurpius, S.E., Testing and Measurement (Thousand Oaks, CA: Sage, 2002); Miller, D.C. and Salkind, N.J., Handbook of Research Design and Social Measurement, 6th edn (Thousand Oaks, CA: Sage, 2002); Bearden, W.O. and Netemeyer, R.G., Handbook of Marketing
Scales: Multi-Item Measures for Marketing and Consumer Behaviour Research (Thousand Oaks, CA: Sage, 1999), 456–64.
24. There is little difference in the results based on whether the data are ordinal or interval; however, see Nishisato, S., Measurement and Multivariate Analysis (New York: Springer-Verlag, 2002); Gaiton, J., ‘Measurement scales and statistics: Resurgence of an old misconception’, Psychological Bulletin 87 (1980), 567.
25. Swenson, M., Yu, J.H. and Albaum, G., ‘Is a central tendency error inherent in the use of semantic differential scales in different cultures?’, International Journal of Market Research 45 (2) (2003), 213–28; Ofir, C., ‘In search of negative customer feedback: The effect of expecting to evaluate on satisfaction evaluations’, Journal of Marketing Research (May 2001), 170–82; Reisenwitz, T.H. and Wimbush, G.J. Jr, ‘Over-the-counter pharmaceuticals: Exploratory research of consumer preferences toward solid oral dosage forms’, Health Marketing Quarterly 13 (4) (1996), 47–61; Malhotra, S., Van Auken, S. and Lonial, S.C., ‘Adjective profiles in television copy testing’, Journal of Advertising Research (August 1981), 21–5.
26. Brady, M.K., ‘Performance only measurement of service quality: A replication and extension’, Journal of Business Research 55 (1) (January 2002), 17; Stapel, J., ‘About 35 years of market research in the Netherlands’, Markonderzock Kwartaalschrift 2 (1969), 3–7.
27. Dawes, J., ‘Do data characteristics change according to the number of scale points used?’, International Journal of Market Research 50 (1) (2008), 61–77; Anderson, E.W., ‘Foundations of the American customer satisfaction index’, Total Quality Management 11 (7) (September 2000), 5869–82; Coleman, A.M., Norris, C.E. and Peterson, C.C., ‘Comparing rating scales of different lengths - equivalence of scores from 5-point and 7-point scales’, Psychological Reports 80 (2) (April 1997), 355–62; Viswanathan, M., Bergen, M. and Childers, T., ‘Does a single response category in a scale completely capture a response?’, Psychology and Marketing 13 (5) (August 1996), 457–79; Cox, E.P., III, ‘The optimal number of response alternatives for a scale: A review’, Journal of Marketing Research 17 (November 1980), 407–22.
28. Dawes, J., ‘Do data characteristics change according to the number of scale points used? An experiment using 5-point, 7-point and 1-point scales’, International Journal of Market Research 50 (1) (2008), 61–104; Coelho, P.S. and Esteves, S.P., ‘The choice between a five-point and a ten-point scale in the framework of customer satisfaction measurement’, International Journal of Market Research 49 (3) (2007), 313–39; Dodge, Y., ‘On asymmetric properties of the correlation coefficient in the regression setting’, American Statistician 55 (1) (February 2001), 51–4; Alwin, D.F., ‘Feeling thermometers versus 7-point scales - which are better?’, Sociological Methods and Research 25 (3) (February 1997), 318–40.
29. Joshi, A., Tamang, S. and Vashisthaz, H., ‘You can’t judge a book by its cover! A way to tackle the severe acquiescence bias among Arab respondents’, ESOMAR Annual Congress, Montreal (September 2008); Jones, B.S., ‘Modeling direction and intensity in semantically balanced ordinal scales: An assessment of Congressional incumbent approval,’ American Journal of Political Science 44 (1) (January 2000), 174.

369Chapter 12 Measurement and scaling: fundamentals, comparative and non-comparative scaling
30. Morrel-Samuels, P., ‘Getting the truth into workplace surveys’, Harvard Business Review 80 (2) (February 2002), 111; Spagna, G.J., ‘Questionnaires: Which approach do you use?’, Journal of Advertising Research (February-March 1984), 67–70.
31. Kulas, J., Stachowski, A. and Haynes, B. ‘Middle response functioning in Likert responses to personality items’, Journal of Business and Psychology 22 (3) (March 2008), 251–9; McColl-Kennedy, J., ‘Measuring customer satisfaction: Why, what and how’, Total Quality Management 11 (7) (September 2000), 5883–96.
32. Kruger, J. and Vargas, P., ‘Consumer confusion of percent differences’, Journal of Consumer Psychology 18 (1) (January 2008) 49–61; Amoo, T., ‘Do numeric values influence subjects’ responses to rating scales?’, Journal of International Marketing and Market Research (February 2001), 41; Gannon, K.M. and Ostrom, T.M., ‘How meaning is given to rating scales - the effects of response language on category activation’, Journal of Experimental Social Psychology 32 (4) (July 1996), 337–60.
33. Alwin, D.F., ‘Feeling thermometers versus 7-point scales - which are better?’, Sociological Methods and Research 25 (3) (February 1997), 318–40.
34. For an example of a multi-item scale, see Bruner II, G.C. and Kumar, A., ‘Attitude toward location based advertising’, Journal of Interactive Advertising 7 (2) (Spring 2007), 3–15; Rossiter, J.R., ‘The C-OAR-SE procedure for scale development in marketing’, International Journal of Research in Marketing 19 (4) (2002), 305–35; Brown, T., ‘The customer orientation of service workers: Personality trait effects on self and supervisor-performance ratings’, Journal of Marketing Research 39 (1) (February 2002), 110–19.
35. For example, see Kidwell, B., Hardesty, D.M. and Childers, T.L., ‘Consumer emotional intelligence: Conceptualisation, measurement and the prediction of consumer decision making’, Journal of Consumer Research 35 (1) (June 2008), 154–66; Delgado-Ballester, E., Munuera-Alemén, J.L. and Yagüe-Guillén, M.J., ‘Development and validation of brand trust scale’, International Journal of Market Research 45 (1) (2003) 35–53; Flynn, L.R. and Pearcy, D., ‘Four subtle sins in scale development: Some suggestions for strengthening the current paradigm’, International Journal of Market Research 43 (4) (Fourth Quarter 2001), 409–23; King, M.F., ‘Social desirability bias: A neglected aspect of validity testing’, Psychology and Marketing 17 (2) (February 2000), 79.
36. Bassi, F., ‘Latent class analysis for marketing scale development’, International Journal of Market Research 53 (2) (2011) 211–32 ; Malhotra, N.K., Kim, S. and Agarwal, J., ‘Internet users’ information privacy concerns (IUIPC): The construct, the scale and the causal model’, Information Systems Research 15 (4) (December 2004), 336–55; Borman, W.C., ‘An examination of the comparative reliability, validity and accuracy and performance ratings made using computerised adaptive rating scales’, Journal of Applied Psychology 86 (5) (October 2001), 965.
37. Clancy, K.J. and Rabino, S., ‘The effects of visual enhancement on attribute/benefit desirability and brand perception measures: Implications for reliability and
validity’, Journal of Advertising Research 47 (1) (March 2007), 95–102; Thompson, B., Score Reliability: Contemporary Thinking on Reliability Issues (Thousand Oaks, CA: Sage, 2002); Sinha, P., ‘Determination of reliability of estimations obtained with survey research: A method of simulation’, International Journal of Market Research 42 (3) (Summer 2000), 311–17.
38. Sturman, M.C., Cheramie, R.A. and Cashen, L.H., ‘The impact of job complexity and performance measurement on the temporal consistency, stability, and test-retest reliability of employee job performance rating’, Journal of Applied Psychology 90 (2) (2005), 269–83; Viswanathan, M., Measurement Error and Research Design (Thousand Oaks, CA: Sage, 2005), 269–83; Campbell, D.T. and Russo, M.J., Social Measurement (Thousand Oaks, CA: Sage, 2001).
39. Hunt, D., Measurement and Scaling in Statistics (London: Edward Arnold, 2001); Armstrong, D., Gosling, A., Weinman, J. and Marteau, T., ‘The place of inter-rater reliability in qualitative research: An empirical study’, Sociology: The Journal of the British Sociological Association 31 (3) (August 1997), 597–606; Segal, M.N., ‘Alternate form conjoint reliability’, Journal of Advertising Research 4 (1984), 31–8.
40. Kim, K., Cheong, Y. and Zheng, L., ‘The current practices in food advertising – the usage and effectiveness of different advertising claims’, International Journal of Advertising 28 (3) (2009), 527–53.
41. Singh, N., Baack, D.W., Pereira, A. and Baack, D., ‘Culturally customizing websites for US Hispanic online consumers’, Journal of Advertising Research 48 (2) (June 2008), 224–34.
42. Cronbach, L.J., ‘Coefficient alpha and the internal structure of tests’, Psychometrika 16 (1951), 297–334.
43. Waller, N.G., ‘Commingled samples: A neglected source of bias in reliability analysis’, Applied Psychological Measurement 32 (3) (May 2008), 211–23; Duhachek, A., Coughlan, A.T. and Iacobucci, D., ‘Results on the standard error of the coefficient alpha index of reliability’, Marketing Science 24 (2) (Spring 2005), 294–301; Peterson, R.A., ‘A meta-analysis of Cronbach’s coefficient alpha’, Journal of Consumer Research 21 (September 1994), 381–91.
44. Flavién, C. and Gurrea, R., ‘Digital versus traditional newspapers: Influences on perceived substitutability’, International Journal of Market Research 51 (5) (2009), 635–57.
45. Chandon, P., Morwitz, V.G. and Reinartz, W.J., ‘Do intentions really predict behaviour? Self-generated validity effects in survey research’, Journal of Marketing 69 (2) (April 2005), 1–14; Chen, G., ‘Validation of a new general self-efficacy scale’, Organizational Research Methods 4 (1) (January 2001), 62–83; McTavish, D.G., ‘Scale validity - a computer content analysis approach’, Social Science Computer Review 15 (4) (Winter 1997), 379–93; Peter, J.P., ‘Construct validity: A review of basic issues and marketing practices’, Journal of Marketing Research 18 (May 1981), 133–45.
46. Voorveld, H., Neijens, P. and Smit, E., ‘The interactive authority of brand websites: A new tool provides new insights’, Journal of Advertising Research 50 (3) (2010), 292–304.

370 Marketing Research
47. Li, F., Zhou, N., Kashyap, R. and Yang, Z., ‘Brand trust as a second order factor: An alternative measurement model’, International Journal of Market Research 50 (6) (2008), 817–39.
48. Bergkvist, L. and Rossiter, J., ‘Tailor made single-item measures of doubly concrete constructs’, International Journal of Advertising 28 (4) (2009), 607–21.
49. Terblanche, N.S. and Boshoff, C., ‘Improved scale development in marketing: An empirical illustration’, International Journal of Market Research 50 (1) (2008), 105–19.
50. Shi, G., Shi,Y.Z., Chan, A.K.K. and Wang, Y., ‘Relationship strength in service industries: A measurement model’, International Journal of Market Research 51 (5) (2009), 659–86.
51. Yan, J. and She, Q., ‘Developing a trichotomy model to measure socially responsible behaviour in China’, International Journal of Market Research 53 (2) (2011), 255–76.
52. Brandt, C., Pahud de Mortanges, C., Bluemelhuber, C. and van Riel, A.C.R., ‘Associative networks: A new approach to market segmentation’, International Journal of Market Research 53 (2) (2011), 189–210.
53. For further details on validity, see Kidwell, B., Hardesty, D.M. and Childers, T.L., ‘Consumer emotional intelligence: Conceptualisation, measurement and the prediction of consumer decision making’, Journal of Consumer Research 35 (1) (June 2008), 154–66; Alford, B.L. and Engelland, B.T., ‘Measurement validation in marketing research: A review and commentary’, Journal of Business Research 57 (2) (2004), 95–7; Keillor, B., ‘A
cross-cultural/cross national study of influencing factors and socially desirable response biases’, International Journal of Market Research (1st Quarter 2001), 63–84; Sirgy, M.J., Grewal, D., Mangleburg, T.F., Park, J., Chon, K.S., Claiborne, C.B., Johar, J.S. and Berkman, H., ‘Assessing the predictive ability of two methods of measuring self-image congruence’, Journal of the Academy of Marketing Science 25 (3) (Summer 1997), 229–41.
54. For a discussion of the generalisability theory and its applications in marketing research, see Peng, L. and Finn, A., ‘How far can you rely on a concept test? The generalisability of testing over occasions’, International Journal of Market Research 52 (3) (2010), 353–72; Middleton, K.L., ‘Socially desirable response sets: The impact of country culture’, Psychology and Marketing (February 2000), 149; Abe, S., Bagozzi, R.P. and Sadarangani, P., ‘An investigation of construct validity and generalizability in the self concept: Self consciousness in Japan and the United States’, Journal of International Consumer Marketing 8 (3, 4) (1996), 97–123.
55. Myers, M., ‘Academic insights: An application of multiple-group causal models in assessing cross-cultural measurement equivalence’, Journal of International Marketing 8 (4) (2000), 108–21; Hinkin, T.R., ‘A review of scale development practices in the study of organisations’, Journal of Management 21 (5) (1995), 967–88.
56. Devlin, S.J., Dong, H.K. and Brown, M., ‘Selecting a scale for measuring quality’, Marketing Research (Fall 2003), 13–16.

Questionnaire design
The questionnaire must
motivate the participant to
cooperate, become involved
and provide complete, honest
and accurate answers.
Stage 1
Problem definition
Stage 2
Research approach developed
Stage 3
Research design
developed
Stage 4
Fieldwork or data
collection
Stage 5
Data integrity
and analysis
13
Stage 6
Communicating research findings

372 Marketing Research
Objectives
After reading this chapter, you should be able to:
1 explain the purpose of a questionnaire and its objectives of asking questions that participants can and will answer, engaging participants and minimising response error;
2 understand the trade-offs that have to be made when designing a questionnaire;
3 describe the process of designing a questionnaire, the steps involved and guidelines that must be followed at each step;
4 discuss the considerations involved in designing questionnaires that work across multiple countries and cultures;
5 appreciate how technology is shaping the ways in which questionnaires are designed, delivered and experienced.
This chapter discusses the importance of questionnaire design and how researchers must put themselves ‘in the shoes’ of target participants in order to create an effective questionnaire. There are no scientific principles that can guarantee an optimal questionnaire; it is more of a craft that is honed through experience. Through experience, questionnaire designers will see that, given the information needs of the decision makers they support and characteristics of target participants, they must make a series of trade-offs. These trade-offs are described and illustrated. Next, we describe the objectives of a questionnaire and the steps involved in designing questionnaires. We provide several guidelines for developing sound questionnaires. The considerations involved in designing questionnaires when conducting international marketing research are discussed. Several ethical issues that arise in questionnaire design are evaluated. The chapter concludes by examining how digital developments can help in the design of more engaging questionnaires for participants.
We begin with an example that articulates some of the main challenges of good questionnaire design and the impact of poor design. The second example illustrates an academic study where characteristics of the questionnaire design could provide an engaging experience for participants.
Overview
Real research Digital versus traditional newspapers: establishing reliability and validity1
Survey Sampling International (SSI) is a global provider of sampling solutions – online and telephone, both fixed/landline and wireless/mobile, multimode and postal mail (www.surveysampling.com). A key part of its operations is the management of access panels. There has been much criticism of sampling quality issues addressed at the use of access panels. Online panel companies have done much to tackle quality issues and conduct research necessary to understand online panellists, their motivation, behaviour, needs and wants. Researchers from SSI presented the following views of some of the questionnaires that they have to work with, as designed by professional researchers:

373Chapter 13 Questionnaire design
Real research Brands in songs2
The insertion of brands in songs is one of the most ignored forms of product placement, an idea that has aroused the interest of many advertisers. Researchers analysed the memorisation of 17 brands cited in two French songs. The study evaluated perceptions of placement, examining whether the approval of a song and the artist generated a more favourable attitude towards the use of brands. In order to test the researchers’ hypotheses, an online survey was undertaken. The general principle was to invite par-ticipants to listen to two songs, then to question about the brands mentioned. The choice of songs, ‘Tes Parents’ by Vincent Delerm and ‘Wonderbra’ by MC Solaar, met several objectives. The idea was to choose songs in French that mentioned several brands and had comparable broadcast rates. Ten brands were counted in the song by Delerm and seven in the song by MC Solaar. The songs chosen were from different musical genres (French chanson and rap) in order to improve the external validity of the study, and to examine differences according to musical preferences. In designing the survey, the aim was to limit the length of the questionnaire without compromising the quality of the measurement of the variables. The average time required to complete the questionnaire was around 15 minutes. The clarity and the context of the use of the brand involved some subjectivity, and were measured on three-point scales developed by a brand specialist and a linguist. Familiarity with the song, approval or appreciation of the singer, of the song and of the music genre, were variables that the participants had no difficulty in understanding, and were therefore measured in a direct manner. The questionnaire was placed on a personal website and designed in the form of three successive web pages. The first screen contained general questions and questions that referred to the participants’ interest in music, and it allowed them to listen to the songs. The second screen concerned the knowledge and appreciation of the songs and their singers, and the spontaneous memorisation of the brands. The final screen dealt with the assisted memorisation of brands, the perception of brand placement and with spon-taneous memorisation (with the indication of the title and extracts from the texts) of the brands in several other songs. Compared with a continuous form layout, this presenta-tion on three screens had the advantage of not revealing immediately the length of the questionnaire. It also prevented participants from modifying the responses they had already given, and made it possible to keep the object of the study secret until they had listened to the two songs.
As panel providers we are well aware of some of the quality issues surrounding ques-tionnaire design; we see the questionnaires for ourselves and receive feedback on them from our panellists (some of whom ‘vote with their feet’ and drop out of the survey or worse, leave the panel). At the same time as we strive to develop algorithms to identify poor quality data we must endeavour not to penalise otherwise good panellists who treat poor questionnaires with the disdain they deserve. We recognise that by the time we get to see the questionnaire there are very real ‘political’ and practical issues impact-ing the ability to make changes to questionnaire design. In addition, full service (pro-gramming and hosting) offerings from panel companies have allowed end-clients to directly access fieldwork and tabulation services without the need to engage a research company. At this level the breadth of quality in questionnaire design becomes even more apparent.

374 Marketing Research
Figure 13.1
Exchange of values between researchers and participants
• Tangible reward• Con�dentiality• Interesting subject and experience• Personal bene�ts from seeing the research completed• Social bene�ts from seeing the research completed• Being ‘chosen’ as a participant with expertise on a subject• Research organisation known for excellence in research• Rapport and trust
What the participant may want from the researcher:
• Honesty• Takes in reasons for the study• Follows the instructions in completing the study• Thinks through the issues before forming an answer• Social bene�ts from seeing the research completed• Says good things about the rationale for marketing research• Says good things about the research process
What the researcher may want from the participant:
Exchanges of values ParticipantsResearcher
Questionnaire definition
Survey and observation are the two sets of techniques for obtaining quantitative primary data in descriptive research (as discussed in Chapter 10). Both methods require some proce-dure for standardising the data collection process so that the data obtained are internally consistent and can be analysed in a uniform and coherent manner. If 40 different interview-ers conduct face-to-face interviews or make observations in different parts of the country, the data they collect will not be comparable unless they follow specific guidelines and ask questions and record answers in a standard way. A standardised questionnaire or form will ensure comparability of the data, increase the speed and accuracy of recording and facilitate data processing.
A questionnaire, whether it is called a schedule, interview form or measuring instru-ment, is a formalised set of questions for obtaining information from participants. Typi-cally, a questionnaire is only one element of a data-collection package that might also include: (1) fieldwork procedures, such as instructions for selecting, approaching and questioning participants (see Chapter 16); (2) some reward, gift or payment offered to participants; and (3) communication aids, such as maps, pictures, music, advertisements and products (as in many online and face-to-face interviews) and return envelopes (in postal surveys).
Any questionnaire has three specific objectives. First, it must translate the information needed into a set of specific questions that participants can and will answer. Developing questions that participants can and will answer, and which will yield the desired information, is difficult. Two apparently similar ways of posing a question may yield different informa-tion. Hence, this objective is most challenging.
Second, a questionnaire must uplift, motivate and encourage the participant to become involved, to cooperate and to complete the task. Figure 13.1 uses a basic marketing model of
QuestionnaireA structured technique for data collection consisting of a series of questions, written or verbal, that a participant answers.

375Chapter 13 Questionnaire design
exchange of values between two parties to illustrate this point. Before designing any ques-tionnaire, or indeed any research technique, the researcher must evaluate ‘what is the partici-pant going to get out of this?’. In other words, the researcher must have an empathy with target participants and appreciate what they think when approached and questioned. Such an appreciation of what participants go through affects the design of how they are approached, the stated purpose of the research, the rewards for taking part and the whole process of ques-tioning and question design.3
Not all participants are the same in what they seek from a questionnaire or interview pro-cess. In Figure 13.1, some participants may want to see some personal benefit, perhaps a tangible reward, while others may be happy to see the social benefits. Taking care in appreciating what participants expect from the questioning process can nurture responses that have been well thought through, are stated in honesty and are accurate.
Third, a questionnaire should minimise response error. The potential sources of error in research designs were discussed in Chapter 3, where response error was defined as the error that arises when participants give inaccurate answers or when their answers are mis-recorded or mis-analysed. A questionnaire can be a major source of response error. Minimising this error is an important objective of questionnaire design.
Questionnaire design process
The great weakness of questionnaire design is a lack of theory. Because there are no sci-entific principles that guarantee an optimal or ideal questionnaire, questionnaire design is a skill acquired through experience. Similarly, the correct grammatical use of lan-guage does not guarantee the optimal questionnaire. There may be participants who do not communicate in a ‘correct’ grammatical manner and find ‘correctly written’ ques-tionnaires complicated and confusing. Therefore, this section presents guidelines and rules to help develop the craft of questionnaire design. Although these guidelines and rules can help you avoid major mistakes, the ‘fine tuning’ of a questionnaire comes from the creativity of a skilled researcher.4 Developing the craft of questionnaire design requires the creative ‘trade-off’ of many factors. Figure 13.2 helps to illustrate some of
Figure 13.2
Trade-offs faced by the questionnaire designer
Actual questions
Source of idea
Question purpose Question analyses

376 Marketing Research
the trade-offs that the questionnaire designer faces and that collectively make the design process problematic.
The design process is founded upon generating information that will effectively sup-port marketing decision makers. Establishing the nature of marketing problems and corresponding marketing research problems, i.e. defining the nature of effective sup-port, was discussed in Chapter 2. Different techniques and sources of information were outlined to help in the diagnosis process, which feed directly into the stages set out below:
1 The ‘source of idea’ represents the culmination of the marketing decision makers’ and researchers’ diagnoses and the information they have available at the time of commis-sioning a marketing research project.
2 From the diagnoses, and the statement of marketing and research problems, emerge spe-cific research questions. Based upon the diagnoses, the purpose of each potential question should be established, i.e. ‘question purpose’. Some research questions may be addressed through actual measurements in questionnaires. Other research questions may not be addressed by the use of questionnaires. The following example illustrates how a large global team of stakeholders established priorities for the questionnaire design of an online survey.
3 With clear question purposes, the process of establishing ‘actual questions’ can begin. At this point, the researchers have to put themselves ‘in the shoes’ of the potential participant. It is fine to say that certain questions need to be answered, but this has to be balanced with an appreciation of whether participants are able, or indeed willing,
Real research Tango Facebook application questionnaire5
When someone is taking part in an intercept survey on a brand’s site or Facebook Fan Page, the research becomes part of that brand experience. The questionnaire’s look, feel and tone can all have an impact on the brand relationship. When a questionnaire is writ-ten in a way that fits with a brand’s values and the creative experience, the experience of the research is less likely to compromise feelings of intimacy between the participant and the brand. An example of this is from a Tango Facebook application that was cre-ated by collaboration between research experts from the brand and communications agency Hall and Partners (www.hallandpartners.com/), digital agency Nudge (www.nudgedigital.co.uk) and advertising agency BBH (www.bartleboglehegarty.com). The introduction or invitation to participate reads:
Bongiorno! So, we both know you’ve used the Tango Head Masher 3000 facebook app to mash more heads than a Zombie DJ at a funeral themed rave. The voices in your head gave permission for us to talk to you so we’re going to – Listen, we’re even doing it now. You can hear us in your head can’t you. Stop picking your nose, because we wanna ask you some questions about Tango, the facebook application and why your dad spends so long on the toilet. If you manage to complete all of the questionnaire without fainting or farting, then you’ll be entered into a PRIZE DRAW.
Examples of Tango Facebook application question phrasing included: It made me feel that I could marry a can of Tango and It made me feel Tango was pretty bloody good.

377Chapter 13 Questionnaire design
to answer particular questions. The following example illustrates the challenge of get-ting into the frame of mind, the forms of expression and words that may be meaning-ful to participants.
4 Deciding how the data collected are to be analysed does not happen when question-naires have been returned from participants. ‘Question analyses’ must be thought through from an early stage. The connections between questions and the appropriate statistical tests that fulfil the question purposes should be established as the question-naire is designed. Again, trade-offs have to be considered. In Chapter 12, different scale types were linked to different statistical tests. As one progresses from nominal through ordinal to interval and then ratio scales, more sophisticated statistical analyses can be performed. However, as one progresses through these scale types, the task for participants becomes more onerous. This trade-off can be illustrated again in the fol-lowing example.
Real research Trading-off the participant task with statistical power
In the study of banking practices in Europe, participants were asked who they thought were the top four banks in their country (ordinal scale). They were then asked why they thought the top two banks were perceived to be best and second best. This could be completed in a number of ways. A list of characteristics could be given and participants asked to tick those that they thought matched the bank. This would be easy for participants to undertake and produce nominal data. The same set of characteristics could be listed with participants asked to rank-order them. This task requires more thought and effort, though now produces the more powerful ordinal data. The same list could have been presented and participants asked to allocate 100 points using a constant sum scale. This would have been an even more onerous task but would have produced the more powerful interval scale. The ques-tionnaire designer has to consider how onerous the task is for participants, espe-cially when set in the context of all the other questions the participant is being asked, and trade this off against the meaning and interpretations that decision makers would get from the findings.
5 The understanding that is taken from the data comes back to the ‘source of idea’. By now the researcher or questionnaire designers may have collected other data, interpreted exist-ing data differently, or been exposed to new forces in the marketplace. They may even now see what questions they should have been asking!
There can be no theory to encapsulate the trade-offs illustrated in Figure 13.2. Each research project will have different demands and emphases. With the experience of design-ing a number of questionnaires, the ‘craft’ of questionnaire design is developed and the bal-ance understood to meet different demands and emphases.
In order to develop a further understanding of questionnaire design, the process will be presented as a series of steps, as shown in Figure 13.3, and we present guidelines for each step. The process outlined in Figure 13.2 shows that, in practice, the steps are interrelated and the development of a questionnaire involves much iteration and interconnection between stages.6

378 Marketing Research
Specify the information needed
The first step in questionnaire design is to specify the information needed. This is also the first step in the research design process. Note that, as the research project progresses, the information needed can become more clearly defined. It is helpful to review the components of the problem and the approach, particularly the research questions, hypotheses and characteristics that influence the research design. To ensure further that the information obtained fully addresses all the components of the problem, the researcher should prepare a set of dummy tables. A dummy table is a blank table used to present findings. It portrays how the analysis will be structured once the data have been collected.
It is also vital to have a clear idea of the target participants. The characteristics of the par-ticipant group have a great influence on questionnaire design. The wording and style of ques-tions that may be appropriate for finance directors being surveyed about their IT needs may not be appropriate for retired persons being surveyed about their holiday needs or schoolchil-dren being surveyed about games they play on mobile devices. The more diversified the par-ticipant group, the more difficult it is to design a single questionnaire appropriate for the entire group.
Figure 13.3
Questionnaire design process
Specify the information needed
Specify the type of interviewing method
Determine the content of individual questions
Overcome the participant’sinability and unwillingness to answer
Choose question structure
Choose question wording
Arrange the questions in proper order
Identify the form and layout
Reproduce the questionnaire
Eliminate problems by pilot-testing

379Chapter 13 Questionnaire design
Specify the type of interviewing method
An appreciation of how the type of interviewing method influences questionnaire design can be obtained by considering how the questionnaire is administered under each method (see Chapter 10). Online and postal surveys are self-administered, so the questions must be simple, and detailed instructions must be provided. In online surveys and computer-assisted interviewing (CAPI and CATI), complex skip patterns and ran-domisation of questions to eliminate order bias can be easily accommodated. In face-to-face interviews, participants see the questionnaire and interact with the interviewer. Thus, lengthy, complex and varied questions can be asked. In telephone interviews the participants interact with the interviewer, but they do not see the questionnaire. This limits the type of questions that can be asked to short and simple ones. Questionnaires designed for face-to-face and telephone interviews should be written in a conversa-tional style.7
Real research Effect of interviewing method
Online and postal questionnaire designPlease rank-order the following film genres in order of your preference. Begin by picking out the genre that you like the most and assign it a number 1. Then find the second-most-preferred genre and assign it a number 2. Continue until you have ranked all gen-res in order of preference. Your least-preferred genre should be assigned a rank of 10. No two genres should receive the same rank number. The criteria you use to establish your preference are entirely up to you. There are no right or wrong answers. Just try to be consistent.
Film genre Rank order
1 Action ____________ 2 Animated ____________ 3 Comedy ____________ 4 Drama ____________ 5 Factual ____________ 6 Fantasy ____________ 7 Light drama ____________ 8 Romance ____________ 9 Sci-fi ____________10 Suspense ____________
Telephone questionnaire designI will read you the names of film genres. Please rate them in terms of your preference on a scale of 1 to 10: 10 represents ‘greatly preferred’ and 1 represents ‘not so preferred’. The higher the number, the greater the degree of preference for that genre. Now, please tell me your preference for these genres . . . (READ ONE GENRE AT A TIME.)

380 Marketing Research
Film genre Not so preferred Greatly preferred
1 Action 1 2 3 4 5 6 7 8 9 102 Animated 1 2 3 4 5 6 7 8 9 103 Comedy 1 2 3 4 5 6 7 8 9 104 Drama 1 2 3 4 5 6 7 8 9 105 Factual 1 2 3 4 5 6 7 8 9 106 Fantasy 1 2 3 4 5 6 7 8 9 107 Light drama 1 2 3 4 5 6 7 8 9 108 Romance 1 2 3 4 5 6 7 8 9 109 Sci-fi 1 2 3 4 5 6 7 8 9 10
10 Suspense 1 2 3 4 5 6 7 8 9 10
Face-to-face questionnaire design(HAND GENRE NAME CARDS TO THE PARTICIPANT.) Here is a set of film genres, each written on a separate card. Please examine these cards carefully. (GIVE PARTICIPANT TIME.) Now, give me the card with the film genre that you prefer the most. (RECORD THE GENRE AND TAKE THE CARD FROM THE PARTICIPANT.) Would you carry on through the cards and hand over, in order, your second, third, fourth, etc.? (REPEAT THIS PROCESS SEQUENTIALLY UNTIL THE PARTICIPANT HAS ONLY ONE CARD LEFT.)
Genre rank Genre name
1 1 ______________________________2 2 ______________________________3 3 ______________________________4 4 ______________________________5 5 ______________________________6 6 ______________________________7 7 ______________________________8 8 ______________________________9 9 ______________________________
10 10 ______________________________
Ranking 10 film genres could be easily administered in an online survey, postal survey and on some mobile devices. Such a ranking may be too complex a task to be administered over the telephone or as an email survey. Instead, the simpler ranking task, where the genres are rated one at a time, could be selected to measure preferences. Note the use of cards to facilitate the ranking task in the face-to-face interview. Interviewer instructions (typed in capital letters) are much more extensive in the face-to-face interview. Another difference is that whereas the participant records the ranks in online and postal surveys, the interviewer records the film genres in the face-to-face interview. The type of interviewing method also influences the content of individual questions.
Determine the content of individual questions
Once the information needed is specified and the type of interviewing method decided, the next step is to determine individual question content: what to include in individual questions?
__________________________________________________

381Chapter 13 Questionnaire design
Is the question necessary?
Every question in a questionnaire should contribute to the information needed or serve some specific purpose that will help to elicit the desired information from participants. If there is no explicit and satisfactory use for the data resulting from a question, that question should be eliminated. In certain situations, however, questions may be asked that are not directly related to the needed information. It is useful to ask some neutral questions at the beginning of the questionnaire to establish involvement and rapport, particularly when the topic of the questionnaire is sensitive or controversial. Sometimes filler questions are asked to disguise the purpose or sponsorship of the project. For example, a survey on mobile devices spon-sored by Samsung may also include filler questions related to Apple and Google. Questions unrelated to the immediate problem may sometimes be included to generate client support for the project. At times, certain questions may be duplicated for the purpose of assessing reliability or validity.8
Are several questions needed instead of one?
Once we have ascertained that a question is necessary, we must make sure that it is sufficient to get the desired information. Sometimes several questions are needed to obtain the required information in an unambiguous manner. Consider the question ‘Do you think Coca-Cola is a tasty and refreshing soft drink?’ A yes answer will presumably be clear, but what if the answer is no? Does this mean that the participant thinks that Coca-Cola is not tasty, that it is not refreshing, or that it is neither tasty nor refreshing? Such a question is called a double-barrelled question, because two or more questions are combined into one. To obtain the required information, two distinct questions should be asked: ‘Do you think Coca-Cola is a tasty soft drink?’ and ‘Do you think Coca-Cola is a refreshing soft drink?’.
Another example of multiple questions embedded in a single question is the ‘why’ ques-tion. The ‘why’ question seems very simple to write in a questionnaire and may be very simple to pose in an interview. However, it may not be a simple task in responding to such a question as it may tap into many constructs that, for the participant, may be difficult to con-ceive and/or articulate. In the context of the leisure-time study focusing on cinemas, consider the question ‘Why do you like the Odeon cinema?’. The possible answers may include: ‘I was taken there by my mother and have such happy memories of that visit’, ‘the Odeon is conveniently located for me to just drop in when I feel like it’ and ‘it has the best assortment of snacks and sweets’. Each answer relates to a different question embedded in the ‘why’ question. The first tells how the participant first learnt about the Odeon, the second reveals what the participant likes about the Odeon compared with other cinemas, and the third reveals what features of the cinema the participant favours. The three answers are not com-parable, and any one answer may not be sufficient. Complete information may be obtained by asking two or even more separate questions: ‘What do you like about the Odeon com-pared with other cinemas?’ and ‘How did you first happen to visit an Odeon cinema?’. Most ‘why’ questions about the use of a product or choice alternative involve two aspects: (1) attributes of the product and (2) influences leading to knowledge of it.9
Double-barrelled questionA single question that attempts to cover two issues. Such questions can be confusing to respondents and result in ambiguous responses.
Overcoming the participant’s inability and unwillingness to answer
Researchers should not assume that participants can provide accurate or well-reasoned answers to all questions posed to them (assuming that they are willing to!). The researcher should attempt to overcome the participants’ inability to answer. Certain factors limit the participants’ ability to provide the desired information. The partici-pants may not be informed, may not remember, or may be unable to articulate certain types of responses.

382 Marketing Research
Is the participant informed?
Participants are often asked about topics on which they are not informed. Marketers and brand designers may have a deep and well-informed knowledge of the characteristics that shape their industries and environments. Their target consumers, however, may have little inclination to spend their time understanding such intricacies. Even if they do wish to under-stand issues such as, for example, the environmental impact of the use of pesticides on the growth of cotton used in a shirt they are considering buying, there may be many complexities that make them uninformed. The following example illustrates how in issues such as social responsibility and environmental sustainability, there can be many different stories and ‘facts’ that lead to uninformed participants.
Real research Understanding corporate social responsibility10
In a Global Change Network (www.theglobal-changenetwork.com) survey among commu-nications professionals, more than two-thirds of participants believed that consumers would be increasingly interested in social and envi-ronmental efforts, not, however, at the expense of economic concerns, but in concert with them. Those products that demonstrated a clear value and were good for society and the environment were likely to prosper. Proper communications can help to clear up the confusion while boosting a company’s revenues. How companies tell social and environmental stories is critical. Consumers are often uninformed or confused by much of the news and information they get. They do not necessarily understand green termi-nology, or how a company or product is really ‘giving back’.
In situations where not all participants are likely to be informed about the topic of interest, filter questions that measure familiarity, product use and past experience should be asked before questions about the topics themselves.11 Filter questions enable the researcher to filter out participants who are not adequately informed. The use of online, CATI and CAPI sur-veys allows extensive filtering to produce a variety of questionnaire formats that can be tai-lored to the familiarity, product use and past experiences of participants.
One important area to consider is situations where participants do not have sufficient knowledge of a category to give an informed answer. For example, a participant may be asked to rate preferences for a selection of movies – none of which they have heard of. A ‘don’t know’ option can reduce uninformed responses without reducing the overall response rate or the response rate for questions about which the participants have information. Hence this option should be provided when the researcher expects that participants may not be adequately informed about the subject of the question.12
Can the participant remember?
Many things that we might expect everyone to know are remembered by only a few. Test this on yourself. Can you remember the brand name of the socks you are wearing (assuming you are wearing socks), what you had for lunch a week ago, or what you were doing a month ago at noon? Further, do you know how many litres of soft drinks you consumed during the last four weeks? Evidence indicates that consumers are particularly poor at remembering
Filter questionAn initial question in a questionnaire that screens potential participants to ensure they meet the requirements of the sample.

383Chapter 13 Questionnaire design
quantities of products consumed. In situations where factual data were available for com-parison, it was found that consumer reports of product usage exceeded actual usage by 100% or more. 13 Thus, soft-drink consumption may be better obtained by asking:
How often do you consume soft drinks in a typical week?
Less than once a week
1 to 3 times a week
4 to 6 times a week
7 or more times per week
The inability to remember can lead to errors of omission, telescoping and creation. Omis-sion is the inability to recall an event that actually took place. Telescoping takes place when an individual telescopes or compresses time by remembering an event as occurring more recently than it actually occurred. 14 For example, a participant reports three trips to the super-market in the last two weeks when, in fact, one of these trips was made 18 days ago. Creation error takes place when a participant ‘remembers’ an event that did not actually occur.
The ability to remember an event is influenced by (1) the event itself, (2) the time elapsed since the event and (3) the presence or absence of things that would aid memory. We tend to remember events that are important or unusual, or that occur frequently. People remember their wedding anniversary and birthday. Likewise, more recent events are remembered bet-ter. A fashion shopper is more likely to remember what he or she purchased on the last shop-ping trip than what was bought three shopping trips ago.
Research indicates that questions that do not provide the participant with cues to the event, and that rely on unaided recall, can underestimate the actual occurrence of an event. For example, testing whether participants were exposed to a beer advertisement at the cin-ema could be measured in an unaided manner by questions like ‘What brands of beer do you remember being advertised last night at the cinema?’ (having established that the participant was at a cinema last night). Naming a brand shows that the participant saw the advert, took in the brand name and could recall it – three different stages. An aided recall approach attempts to stimulate the participant’s memory by providing cues related to the event of interest. Thus, the important features to measure may be that the participant saw the advert and took in the brand name – the fact that the participant cannot say the brand name may not affect his or her purchasing intentions. The aided-recall approach would list a number of beer brands and then ask ‘Which of these brands was advertised last night at the cinema?’. In presenting cues, the researcher must guard against biasing the responses by testing out sev-eral successive levels of stimulation. The influence of stimulation on responses can then be analysed to select an appropriate level of stimulation. 15
Is the participant able to articulate?
Participants may be unable to articulate certain types of responses. For example, if asked to describe the ‘atmosphere’ of a cinema they would prefer to frequent, most participants may be unable to phrase their answers. On the other hand, if the participants are provided with alterna-tive descriptions of cinema atmosphere, they will be able to indicate the one they like the best. If the participants are unable to articulate their responses to a question, they are likely to ignore that question and refuse to respond to the rest of the questionnaire. Thus, participants should be given aids such as pictures, maps and descriptions to help them articulate their responses.
Even if participants are able to answer a particular question, they may be unwilling to do so because too much effort is required, the situation or context may not seem appropriate for disclosure, no legitimate purpose or need for the information requested is apparent, or the information requested is too sensitive.
Telescoping A psychological phenomenon that takes place when an individual telescopes or compresses time by remembering an event as occurring more recently than it actually occurred.

384 Marketing Research
Effort required of the participants
Most participants are unwilling to devote much effort to providing information. Hence, the researcher should minimise the effort required of the participants.16 Suppose that the researcher is interested in determining from which shops a participant bought goods on the most recent shopping trip. This information can be obtained in at least two ways. The researcher could ask the participant to list all the items purchased on the most recent shop-ping trip, or the researcher could provide a list of shops and ask the participant to indicate the applicable ones. The second option is preferable, because it requires less effort from participants.
Context
Some questions may seem appropriate in certain contexts but not in others. For example, questions about personal hygiene habits may be appropriate when asked in a survey spon-sored by a health organisation but not in one sponsored by a breakfast-cereal manufacturer. Participants are unwilling to respond to questions they consider inappropriate for the given context. Sometimes, the researcher can manipulate the context in which the questions are asked so that the questions seem appropriate. For example, before asking for information on personal hygiene in a survey for a fast-food restaurant, the context could be manipulated by making the following statement: ‘As a fast-food restaurant, we are very concerned about providing a clean and hygienic environment for our customers. Therefore, we would like to ask you some questions related to personal hygiene.’
Legitimate purpose
Participants are also unwilling to divulge information that they do not see as serving a legiti-mate purpose. Why should a firm marketing breakfast cereals want to know their age, income and occupation? Explaining why the data are needed can make the request for the information seem legitimate and may increase the participants’ willingness to answer. A statement such as ‘To determine how the preferences for cereal brands vary among people of different ages, we need information on . . .’ can make the request for information seem more legitimate.
Sensitive information
Participants may be unwilling to disclose, at least accurately, sensitive information because this may cause embarrassment or threaten the participants’ prestige or self-image, or be seen as too personal and an invasion of privacy. If pressed for the answer, participants may give biased responses, especially during personal interviews17 (see Table 10.2). Sensitive topics include money, personal hygiene, family life, political and religious beliefs and involvement in accidents or crimes. In industrial surveys, sensitive questions may encompass much of what a company does, especially if it reveals strategic activities and plans. The techniques described in the following subsection can be adopted to increase the likelihood of obtaining information that participants are unwilling to give.
Increasing the willingness of participants
Participants may be encouraged to provide information that they are unwilling to give by the following techniques:18
1 Place sensitive topics at the end of the questionnaire. By then, initial mistrust has been overcome, rapport has been created, legitimacy of the project has been established and participants are more willing to give information. In this context, consider how sensitive classification questions such as gender, age and income may be perceived.

385Chapter 13 Questionnaire design
2 Preface the question with a statement that the behaviour of interest is common. For exam-ple, before requesting information on credit-card debt, say ‘Recent studies show that most European consumers are in debt.’ This technique describes the use of counter-biasing statements.
3 Ask the question using the third-person technique (see Chapter 7): phrase the question as if it refers to other people.
4 Hide the question in a group of other questions that participants are willing to answer. The entire list of questions can then be asked quickly.
5 Provide response categories rather than asking for specific figures.19 Do not ask ‘What is your household’s annual income?’. Instead, ask the participant to indicate an appropriate income category. In face-to-face interviews, give the participants cards that list the num-bered choices. The participants then indicate their responses by number.
6 Use randomised techniques. In these techniques, participants are presented with two questions, one sensitive and the other a neutral question with a known probability of yes responses (e.g. ‘Is your birthday in March?’). The participants are asked to select one question randomly by flipping a coin, for example. They then answer the selected ques-tion yes or no, without telling the researcher which question is being answered. Given the overall probability of a yes response, the probability of selecting the sensitive question and the probability of a yes response to the neutral question, the researcher can determine the probability of a yes response to the sensitive question using the law of probability. The researcher cannot, however, determine which participants have answered yes to the sensitive question.20
Choose question structure
A question may be unstructured or structured. We define unstructured questions and discuss their relative advantages and disadvantages and then consider the major types of structured questions: multiple choice, dichotomous and scales.21
Unstructured questions
Unstructured questions are open-ended questions that participants answer in their own words. They are also referred to as free-response or free-answer questions. The following are some examples:
• What is your occupation?
• What do you think of people who patronise secondhand clothes shops?
• Who is your favourite film personality?
Open-ended questions can be good first questions on a topic. They enable the partici-pants to express general attitudes and opinions that can help the researcher interpret the responses to structured questions. They can also be useful as a final question in a question-naire. After participants have thought through and given all their answers in a question-naire, there may be other issues that are important to them and that may not have been covered. Having an open-ended question at the end allows participants to express these issues. As well as providing material to help the researcher interpret other responses, the participants have the chance to express what they feel to be important. Unstructured ques-tions have a much less biasing influence on response than structured questions. Participants are free to express any views. Their comments and explanations can provide the researcher with rich insights.
Unstructured questionsOpen-ended questions that participants answer in their own words.

386 Marketing Research
A principal disadvantage in the case of face-to-face interviews is that the potential for bias is high. Whether the interviewers record the answers verbatim or write down only the main points, the data depend on the skills of the interviewers. Recorders should be used if verba-tim reporting is important.
Another major disadvantage of unstructured questions is that the coding of responses is costly and time-consuming. (This was discussed in the context of analysing qualitative data in Chapter 9.) We have discussed how there is more use of software to cope with coding open-ended responses. This can be time- and cost-efficient if the research design employed uses a multiple cross-sectional or longitudinal design, but for the ad hoc survey such approaches can still be very labour intensive.22 The coding procedures required to summa-rise responses in a format useful for data analysis and interpretation can be extensive. Implic-itly, unstructured or open-ended questions give extra weight to participants who are more articulate. Also, unstructured questions are not very suitable for self-administered question-naires (online, CAPI, email and postal), because participants tend to be briefer in writing than in speaking.
Pre-coding can overcome some of the disadvantages of unstructured questions. Expected responses are recorded in multiple-choice format, although the question is presented to the participants as an open-ended question. In the case of a face-to-face interview, based on the participant’s reply, the interviewer selects the appropriate response category. Because the response alternatives are limited, this approach may be satisfactory when the participant can easily formulate the response and when it is easy to develop pre-coded categories. In general, open-ended questions are useful in exploratory research and as opening or closing questions. They should be chosen with great care, as their disadvantages can outweigh their advantages in a large, ad hoc survey.23 Open-ended questions do not necessarily have to contain large amounts of qualitative data and may involve simple but effective forms of analysis, as illus-trated in the following example.
Real research Comparing mobile with fixed phones for surveys24
A study targeted at Portuguese adults (aged 15 years and over) aimed to compare mobile surveys with fixed-telephone survey methods. The study focused on internet usage, atti-tudes towards the internet, cultural practices and demographics. Two surveys were con-ducted by the same survey company in order to overcome problems that might confuse the assessment of survey results if multiple sources of data collection were used. The survey introduction identified Marktest (www.marktest.com) as the sponsor, one of the best-known survey companies operating in Portugal. For both surveys, interviews were conducted at the company’s CATI centre over the same time period and with the same set of interviewers working simultaneously on both surveys. Both for the fixed sample and the mobile sample, 1,000 interviews were conducted. In the fixed sample, inter-views were conducted with the person who celebrated their birthday most recently or, in the absence of this adult, with any other adult available at the time of contact. In the mobile sample, interviews were conducted with the person who answered the phone, though only persons aged 15 years or older were eligible. A common measurement instrument was used for both surveys. The questionnaire included eight questions based upon nominal scales, three batteries of ordinal scales (25 items overall), one open-ended quantitative question on time spent on the internet per week (participants were to report the hours they spend on the internet as a number, integer or not) and a section on demographics. The open-ended quantitative question on the number of hours a week spent on the internet revealed that, in the mobile-phone sample, 50% of partici-pants spent less than 5 hours a week online, while for the fixed-phone sample the same

387Chapter 13 Questionnaire design
Structured questions
Structured questions specify the set of response alternatives and the response format. A structured question may be multiple choice, dichotomous or a scale.
1 Multiple-choice questions . In multiple-choice questions, the researcher provides a choice of answers and participants are asked to select one or more of the alternatives given. Consider the following question:
Do you intend to buy a new watch within the next six months?
Definitely will not buy
Probably will not buy
Undecided
Probably will buy
Definitely will buy
Other (please specify)
Of concern in designing multiple-choice questions is the number of alternatives that should be included and the order of potential responses, known as position bias. The response alterna-tives should include the set of all possible choices. The general guideline is to list all alterna-tives that may be of importance and to include an alternative labelled ‘other (please specify)’, as shown above. The response alternatives should be mutually exclusive. Participants should also be able to identify one, and only one, alternative, unless the researcher specifically allows two or more choices (e.g. ‘Please indicate all the brands of soft drinks that you have con-sumed in the past week’). If the response alternatives are numerous, consider using more than one question, to reduce the information-processing demands on the participants.
Order bias or position bias is the participants’ tendency to tick an alternative merely because it occupies a certain position, or is listed in a certain order. Participants may tend to tick the first or the last statement in a list, particularly the first. For a list of numbers (quanti-ties or prices), there is a bias towards the central value on the list. To control for order bias, with many online or electronic forms of survey alternative responses or scale items can be positioned randomly for each participant. 25 For manually prepared forms of the question-naire, different versions can be prepared in which the alternatives vary from form to form. Each alternative should appear once in each of the extreme positions, once in the middle and once somewhere in between. 26
Multiple-choice questions overcome many of the disadvantages of open-ended questions because these questions are administered quickly and, where used, interviewer bias is reduced. In self-administered questionnaires, participant cooperation is improved if the majority of the questions are structured. Also, coding and processing of data are much less costly and time-consuming. The following example illustrates how a questionnaire built upon a large bank of multiple-choice questions proved to be an engaging and successful survey experience.
Structured questions Questions that pre-specify the set of response alternatives and the response format. A structured question could be multiple choice, dichotomous or a scale.
Order bias (position bias) A participant’s tendency to choose an alternative merely because it occupies a certain position, or is listed in a certain order.
proportion of participants spent less than 6 hours. In both samples, 25% of the partici-pants spent more than 14 hours. The significance test for the mean revealed no signifi-cant differences at p < 0.05, which meant that mobile and fixed-phone participants had similar Internet usage intensity: on average nearly 10 hours a week.

388 Marketing Research
Multiple-choice questions are not without disadvantages. Considerable effort is required to design effective multiple-choice questions. Qualitative techniques may be required to determine the appropriate wording and/or images for response alternatives. It may difficult to obtain information on alternatives not listed. Even if an ‘other (please specify)’ category is included, participants tend to choose among the listed alternatives. In addition, showing par-ticipants the list of possible answers produces biased responses. 28 There is also the potential for order bias.
2 Dichotomous questions. A dichotomous question has only two response alternatives, such as yes or no, or agree or disagree. Often, the two alternatives of interest are supple-mented by a neutral alternative, such as ‘no opinion’, ‘don’t know’, ‘both’ or ‘none’, as in this example. 29
The multiple-choice question asked before about intentions to buy a new watch can also be asked as a dichotomous question.
Do you intend to buy a new watch within the next six months?
Yes
No
Don’t know
The decision to use a dichotomous question should be guided by whether the participants approach the issue as a yes-or-no issue. Although decisions are often characterised as a series
Dichotomous question A structured question with only two response alternatives, such as yes and no, often supplemented by a neutral alternative.
Real research IKEA – love where you live 27
In planning the launch of a new IKEA store in Perth (Australia), research showed that the main barriers for new customers visiting the old store were: (1) store too far away/journey took too long; (2) parking problem/no ease of shopping; and (3) IKEA did not have the products that suited particular tastes. A new bigger store (26,600 m 2 vs. 6,640 m 2 at the old store) and its location (improved access to the freeway/train) was the starting point to addressing these barriers, but their key challenge was the third barrier indicating that a proportion of Perth’s population did not see IKEA as a brand for them. This instigated the thinking that a communications campaign needed to be so much more than simply the launch of a new store; it was about changing people’s perceptions of IKEA. To underpin this, IKEA conducted an online survey, carried out two weeks prior to the launch campaign, hosted on a purpose-built microsite and set in a virtual suburban house. The survey aimed to measure views from Perth residents about their homes, habits, likes and IKEA. To promote the survey they chose online banners, radio advertis-ing, in-store, electronic direct mail and a promotional tie-in with local radio station NOVA. The survey comprised 28 multiple-choice questions. By the time the survey phase had finished, there had been over 30,600 microsite visits, spending an average of over 8 minutes on the site, 13,850 survey attempts and 9,474 completed surveys – against an initial target of 1,000.

389Chapter 13 Questionnaire design
of binary or dichotomous choices, the underlying decision making process may reflect uncer-tainty that can best be captured by multiple-choice responses. For example, two individuals may be equally likely to buy a new car within the next six months if the economic conditions remain favourable. One individual, who is being optimistic about the economy, will answer ‘yes’, while the other, feeling pessimistic, will answer ‘no’.
Another issue in the design of dichotomous questions is whether to include a neutral response alternative. If it is not included, participants are forced to choose between yes and no even if they feel indifferent. On the other hand, if a neutral alternative is included, par-ticipants can avoid taking a position on the issue, thereby biasing the results. We offer the following guidelines. If a substantial proportion of the participants can be expected to be neutral, include a neutral alternative. If the proportion of neutral participants is expected to be small, avoid the neutral alternative. 30
The general advantages and disadvantages of dichotomous questions are very similar to those of multiple-choice questions. Dichotomous questions are the easiest types of questions to code and analyse, but they have one acute problem. The response can be influenced by the wording of the question. To illustrate, 59.6% of participants in a survey agreed with the state-ment ‘Individuals are more to blame than social conditions for crime and lawlessness in this country’. On a matched sample using an opposing statement, ‘Social conditions are more to blame than individuals for crime and lawlessness in this country’, 43.2% agreed. 31 To over-come this problem, the question should be framed in one way on one-half of the questionnaires and in the opposite way on the other half. This is referred to as the split-ballot technique.
3 Scales . (Scales were discussed in detail in Chapter 12 .) To illustrate the difference between scales and other kinds of structural questions, consider the question about intentions to buy a new watch. One way of framing this using a scale is as follows:
Do you intend to buy a new watch within the next six months?
Definitely will not buy
Probablywill not buy Undecided
Probably will buy
Definitelywill buy
This is only one of several scales that could be used to ask this question (see Chapter 12 for more examples).
Choose question wording
Question wording is the translation of the desired question content and structure into words that participants can clearly and easily understand. Deciding on question wording is perhaps the most critical and difficult task in developing a questionnaire. If a question is worded poorly, participants may refuse to answer it, or answer it incorrectly. The first condition, known as item non-response, can increase the complexity of data analysis. 32 The second condition leads to response error, discussed earlier. Unless the participants and the researcher assign exactly the same meaning to the question, the results will be seriously biased. 33
To avoid these problems, we offer the following guidelines:
1 Define the issue.
2 Use ordinary words.
3 Use unambiguous words.

390 Marketing Research
4 Avoid leading or biasing questions.
5 Avoid implicit alternatives.
6 Avoid implicit assumptions.
7 Avoid generalisations and estimates.
8 Use positive and negative statements.
Define the issue
A question should clearly define the issue being addressed. Trainee journalists are cautioned to define issues in terms of who, what, when, where, why and way (the six Ws).34 Consider the following question:
Which brand of shampoo do you use?
On the surface, this may seem to be a well-defined question, but we may reach a different conclusion when we examine it in terms of ‘who’, ‘what’, ‘when’ and ‘where’. ‘Who’ in this question refers to the participant. It is not clear, though, whether the researcher is referring to the brand the participant uses personally or the brand used by the household. ‘What’ is the brand of shampoo. But what if more than one brand of shampoo is being used? Should the participant mention the most-preferred brand, the brand used most often, the brand used most recently, or the brand that comes to mind first? ‘When’ is not clear; does the researcher mean last time, last week, last month, last year, or ever? As for ‘where’, it is implied that the sham-poo is used at home, but this is not stated clearly. A better wording for this question would be:
Which brand, or brands, of shampoo have you personally used at home during the last month? In the case of more than one brand, please list all the brands that apply.
Use ordinary words
Ordinary words should be used in a questionnaire. They should match the vocabulary level of the target participants and/or be supplemented with graphic/visual support to convey issues simply.35 In other words, even though we may speak the same language as our potential par-ticipants, there may be particular colloquialisms and ways of using words and terms they use with which we should acquaint ourselves. When choosing words, bear in mind the intellec-tual level of the target group of participants, and how comfortable they are with technical terms related to any products or services we are measuring. Most participants do not under-stand technical marketing words. For example, instead of asking ‘Do you think the distribu-tion of soft drinks is adequate?’ ask ‘Do you think soft drinks are easily available when you want to buy them?’. Never forget that you are imposing your language upon participants in the form of a questionnaire. Your language communicates and puts participants in a particu-lar frame of mind as they answer the questions you pose. Unless that language is meaningful to participants, they will be put in a frame of mind that you may not intend, and be answering different questions from those you set. The following example illustrates something of the magnitude of the challenge of using ‘ordinary’ words in questionnaire design.
Real research The forgotten 12 million36
There are 12 million adults in the UK whose first language is English, but who have a reading and writing age between 9 and 14. This represents almost a third of the adult population. It is a large and diverse audience, yet all have literacy issues that in some way limit their lives. Importantly, these people can read and write, they are not illiterate

391Chapter 13 Questionnaire design
Use unambiguous words
The words used in a questionnaire should have a single meaning that is known to the partici-pants. A number of words that may appear to be unambiguous have different meanings for different people. 37 These include ‘usually’, ‘normally’, ‘frequently’, ‘often’, ‘regularly’, ‘occasionally’ and ‘sometimes’. Consider the following question:
In a typical month, how often do you visit a boutique?
Never
Occasionally
Sometimes
Often
Regularly
The answers to this question are fraught with response bias, because the words used to describe category labels have different meanings for different participants. Three partici-pants who visit a boutique once a month may tick three different categories: occasionally, sometimes and often. A much better wording for this question would be the following:
In a typical month, how often do you visit a boutique?
Less than once
1 or 2 times
3 or 4 times
More than 4 times
or necessarily interested in improving their skill levels. They may be pretty comfortable as they are, and not publicly acknowledge that they have a problem, and may not even be aware of any need to change existing behaviour patterns. Many are likely to feel iso-lated and defined by their skills deficit and will have almost certainly developed strate-gies to cover up the fact that they are limited in reading and writing. The implications for research and questionnaire design are considerable. First, individuals will not take part in research that requires reading and writing skills. They are not going simply to volun-teer the information that they have literacy issues. They are not going to tell you why they do not come to groups or take part in research. They are just not going to partici-pate. Similarly, they are rarely going to say ‘ I’m sorry, but the reason I don’t want to do that questionnaire is because it’s got too many words .’ If they think they are going to look at something complicated, they are just not going to participate. Second, you will not get the most out of them if they do take part. Questionnaires and forms may be com-pleted by the partner or friend of a participant rather than the participant him- or her-self. In short, these adults and their views will be forgotten. Researchers need to consider how the views of these participants may be represented. How can the researchers cre-ate a research environment that is more appropriate to their needs and conducive to participation? How can they develop stimulus materials that are effective yet more suited to their needs?

392 Marketing Research
Note that this question provides a consistent frame of reference for all participants. Response categories have been objectively defined, and participants are no longer free to interpret them in their own way. Additionally, all-inclusive or all-exclusive words may be understood differ-ently by various people. Some examples of such words are ‘all’, ‘always’, ‘any’, ‘anybody’, ‘ever’ and ‘every’. Such words should be avoided. To illustrate, ‘any’ could mean ‘every’, ‘some’, or ‘one only’ to different participants, depending on how they look at it.
In deciding on the choice of words, researchers should consult a dictionary and thesaurus and ask the following questions:
1 Does the word mean what we intend?
2 Does the word mean the same to our target participants?
3 Does the word have any other meanings?
4 If so, does the context make the intended meaning clear?
5 Does the word have more than one pronunciation?
6 Is there any word or similar pronunciations that might be confused with this word?
7 Is a simpler word or phrase suggested that may be more meaningful to our target participants?
Avoid leading or biasing questions
A leading question is one that clues the participant to what answer is desired or leads the participant to answer in a certain way. Some participants have a tendency to agree with what-ever way the question is leading them to answer. This tendency is known as yea-saying and results in a bias called acquiescence bias . Consider the following question:
Do you think that patriotic French people should buy imported cars when that would put French workers out of employment?
Yes
No
Don’t know
This question would tend to lead participants to a ‘No’ answer. After all, how could patriotic French people put French people out of work? Therefore, this question would not help determine the preferences of French people for imported versus domestic cars. A better question (though, to determine preferences, Likert scales could work better than a binary choice) would be:
Do you think that French people should buy imported cars?
Yes
No
Don’t know
Bias may also arise when participants are given clues about the sponsor of the project. Par-ticipants may tend to respond favourably towards the sponsor. The question ‘Is Colgate your favourite toothpaste?’ could bias the responses in favour of Colgate. A more unbiased way of obtaining this information would be to ask ‘What is your favourite toothpaste brand?’. Like-wise, the mention of a prestigious or non-prestigious name can bias the response, as in ‘Do you agree with the British Dental Association that Colgate is effective in preventing cavi-ties?’. An unbiased question would be to ask ‘Is Colgate effective in preventing cavities?’. 38
Leading question A question that gives the participant a clue as to what answer is desired, or leads the participant to answer in a certain way.
Acquiescence bias (yea-saying) This bias is the result of some participants’ tendency to agree with the direction of a leading question.

393Chapter 13 Questionnaire design
Avoid implicit alternatives
An alternative that is not explicitly expressed in the options is an implicit alternative. Mak-ing an implied alternative explicit may increase the percentage of people selecting that alter-native, as in the following two questions:
1 Do you like to fly when travelling short distances?
2 Do you like to fly when travelling short distances, or would you rather drive?
In the first question, the alternative of driving is only implicit, but in the second question it is explicit. The first question is likely to yield a greater preference for flying than the second question.
Questions with implicit alternatives should be avoided unless there are specific reasons for including them. When the alternatives are close in preference or large in number, the alternatives at the end of the list have a greater chance of being selected. To overcome this bias, the split-ballot technique should be used to rotate the order in which the alternatives appear.39
Avoid implicit assumptions
Questions should not be worded so that the answer is dependent on implicit assumptions about what will happen as a consequence. Implicit assumptions are assumptions that are not explicitly stated in the question, as in the following example:40
1 Are you in favour of a balanced national budget?
2 Are you in favour of a balanced national budget if it would result in an increase in per-sonal income tax?
Implicit in question 1 are the consequences that will arise as a result of a balanced national budget. There might be a cut in defence expenditure, an increase in personal income tax, a cut in health spending, and so on. Question 2 is a better way to word this question. Question 1’s failure to make its assumptions explicit would result in overestimating the participants’ support for a balanced national budget.
Avoid generalisations and estimates
Questions should be specific, not general. Moreover, questions should be worded so that the participant does not have to make generalisations or compute estimates. Suppose that we were interested in households’ annual per capita expenditure on clothing. If we asked par-ticipants the question:
What is the annual per capita expenditure on clothing in your household?
they would first have to determine the annual expenditure on clothing by multiplying the monthly expenditure on clothing by 12, or even the weekly expenditure by 52. Then they would have to divide the annual amount by the number of persons in the household. Most participants would be unwilling or unable to perform these calculations. A better way of obtaining the required information would be to ask the participants two simple questions:
What is the monthly (or weekly) expenditure on clothing in your household?
and
How many members are there in your household?
The researcher can then perform the necessary calculations.
Implicit alternativeAn alternative that is not explicitly expressed.
Implicit assumptionsAn assumption that is not explicitly stated in a question.

394 Marketing Research
Use positive and negative statements
Many questions, particularly those measuring attitudes and lifestyles, are presented as state-ments with which participants indicate their degree of agreement or disagreement. Evidence indicates that the response obtained is influenced by the directionality of the statements: whether they are stated positively or negatively. In these cases, it is better to use dual state-ments, some of which are positive and others negative. Two different questionnaires could be prepared. One questionnaire would contain half-negative and half-positive statements in an interspersed way. The direction of these statements would be reversed in the other ques-tionnaire. (An example of dual statements was provided in the summated Likert scale in Chapter 12, designed to measure attitudes towards the Odeon cinema.)
Arrange the questions in proper order
The order of questions is of equal importance to the wording used in the questions. As noted in the previous section, questions communicate and set participants in a particular frame of mind. This frame of mind is set at the start of the questioning process and can change as each question is posed and responded to. It affects how participants perceive individual questions and respond to those questions. As well as understanding the characteristics of language in target participants, questionnaire designers must be aware of the logical connections between questions, as perceived by target participants. The following issues help to determine the order of questions.
Opening questions
The opening questions can be crucial in gaining the confidence and cooperation of partici-pants. These questions should be interesting, simple and non-threatening. Questions that ask participants for their opinions can be good opening questions, because most people like to express their opinions. Sometimes such questions are asked, although they are unrelated to the research problem and their responses are not analysed.41 Though classification questions seem simple to start a questionnaire, issues such as age, gender and income can be seen as very sensitive issues. Opening a questionnaire with these questions tends to make participants concerned about the purpose of these questions and, indeed, the whole survey. They can also give the questionnaire a feel of an ‘official form’ to be completed (like a national census or a tax form), rather than a positive engagement and experience with a particular topic. However, in some instances it is necessary to qualify participants to determine whether they are eligible to participate in the interview. In this case the qualifying questions serve as the opening ques-tions, and they may have to be classification questions such as the age of the participant.
Type of information
The type of information obtained in a questionnaire may be classified as (1) basic information, (2) classification information and (3) identification information. Basic information relates directly to the research problem. Classification information, consisting of socio-economic and demographic characteristics, is used to classify the participants, understand the results and validate the sample (see Chapter 14). Identification information includes name, postal address, email address and telephone number. Identification information may be obtained for a variety of purposes, including verifying that the participants listed were actually interviewed and to send promised incentives or prizes. As a general guideline, basic information should be obtained first, followed by classification and finally identification information. The basic information is of greatest importance to the research project and should be obtained first, before risking alienation of the participants by asking a series of personal questions.
Classification informationSocio-economic and demographic characteristics used to classify participants.Identification informationA type of information obtained in a questionnaire that includes name, address and phone number.

395Chapter 13 Questionnaire design
Difficult questions
Difficult questions, or questions that are sensitive, embarrassing, complex or dull, should be placed late in the sequence. After rapport has been established and the participants become involved, they are less likely to object to these questions. Thus, in the S:Comm Leisure Time study (see Chapter 12), where we focused upon cinema visits, information about the nature of film merchandise that has been purchased should be asked at the end of the section on basic information. Had participants perceived (incorrectly) that the survey was being used as a means to sell them merchandise, their trust in the survey and the nature of their subsequent responses could have been impaired. Likewise, income should be the last question in the classification section (if it is to be used at all).
Effect on subsequent questions
Questions asked early in a sequence can influence the responses to subsequent questions. As a rule of thumb, general questions should precede specific questions. This prevents specific questions from biasing responses to the general questions. Consider the following sequence of questions:
Q1: What considerations are important to you in selecting a boutique?Q2: In selecting a boutique, how important is convenience of its location?
Note that the first question is general whereas the second is specific. If these questions were asked in the reverse order, participants would be clued about convenience of location and would be more likely to give this response to the general question.
Going from general to specific is called the funnel approach. The funnel approach is particularly useful when information has to be obtained about participants’ general choice behaviour and their evaluations of specific products.42 Sometimes the inverted funnel approach may be useful. In this approach, questioning starts with specific questions and con-cludes with the general questions. The participants are compelled to provide specific infor-mation before making general evaluations. This approach is useful when participants have no strong feelings or have not formulated a point of view.
Logical order
Questions should be asked in a logical order. This may seem a simple rule, but as the researcher takes time to understand participants and how they use language, the researcher should also take time to understand their logic, i.e. what ‘logical order’ means to target par-ticipants. All questions that deal with a particular topic should be asked before beginning a new topic. When switching topics, brief transitional phrases should be used to help partici-pants switch their train of thought.
Branching questions should be designed with attention to logic, making the question-naire experience more relevant to individual participants.43 Branching questions direct par-ticipants to different places in the questionnaire based on how they respond to the question at hand. These questions ensure that all possible contingencies are covered. They also help reduce interviewer and participant error and encourage complete responses. Skip patterns based on the branching questions can become quite complex. A simple way to account for all contingencies is to prepare a flow chart of the logical possibilities and then develop branch-ing questions and instructions based on it. A flow chart used to assess the use of electronic payments in online clothes purchases is shown in Figure 13.4.
Placement of branching questions is important and the following guidelines should be fol-lowed: (1) the question being branched (the one to which the participants are being directed) should be placed as close as possible to the question causing the branching; and (2) the branching questions should be ordered so that the participants cannot anticipate what addi-tional information will be required. Otherwise, the participants may discover that they can
Funnel approachA strategy for ordering questions in a questionnaire in which the sequence starts with the general questions, which are followed by progressively specific questions, to prevent specific questions from biasing general questions.
Branching questionA question used to guide an interviewer (or participant) through a survey by directing the interviewer (or participant) to different spots on the questionnaire depending on the answers given.

396 Marketing Research
avoid detailed questions by giving certain answers to branching questions. For example, the participants should first be asked if they have seen any of the listed advertisements before they are asked to evaluate advertisements. Otherwise, the participants will quickly discover that stating that they have seen an advertisement leads to detailed questions about that adver-tisement and that they can avoid detailed questions by stating that they have not seen the advertisement.
Figure 13.4
Flow chart for questionnaire design
NoYes
YesChequeElectronic
Other
Introduction
Ownership of credit and debit cards
Bought clothes over the internet during the last month
How was thepayment made?
Other PayPalCreditcard
Debitcard
Ever purchasedvia the internet?
Intentions to use chequePayPal, credit and
debit cards
Identify the form and layout
The format, spacing and positioning of questions can have a significant effect on the results, particularly in self-administered questionnaires.44 It is good practice to divide a question-naire into several parts. Several parts may be needed for questions pertaining to the basic information. The questions in each part should be numbered, particularly when branching questions are used. Numbering of questions also makes the coding of responses easier. In addition, if the survey is conducted by post, the questionnaires should preferably be pre-coded. In pre-coding, the codes to enter in the computer can be printed on the questionnaire. Note that when conducting online CATI and CAPI surveys, pre-coding of the questionnaire is built into the questionnaire design software. (Coding of questionnaires is explained in more detail in Chapter 19 on data preparation.)
In surveys where there are hard copies of questionnaires, they should be numbered seri-ally. This facilitates the control of questionnaires in the field, as well as the coding and analysis. Numbering makes it easy to account for the questionnaires and to determine
Pre-codingIn questionnaire design, assigning a code to every conceivable response before data collection.

397Chapter 13 Questionnaire design
whether any have been lost. A possible exception to this rule is postal questionnaires. If these are numbered, participants assume that a given number identifies a particular partici-pant. Some participants may refuse to participate or may answer differently under these conditions.
With the majority of questionnaires being administered online, researchers should not think of form and structure of a questionnaire in terms of designing a paper or postal survey experience. Such thinking can lead to a dull and monotonous survey experience for online participants. With many people experiencing rich, varied and exciting websites, to move then into a flat, text-based questionnaire experience can be most off-putting. An analogy may be in terms of games technology. Imagine a participant being used to a highly interac-tive, perhaps 3D games experience, and then being expected to engage with a ‘Pong’ (one of the earliest arcade videogames, a tennis sports game featuring simple two-dimensional graphics). There may be a moment of nostalgia for such an experience but it would be quickly dismissed as boring and irrelevant.
Reproduce the questionnaire
The arguments about the form and layout of an online, SMS and CAPI survey relate to reproducing the questionnaire. In the design of an online questionnaire, variations of lan-guage, branching, graphics and visuals and the survey experience can be almost tailored to individual participants. Time and money that in the past may have been devoted to the printing of paper-based questionnaires can now be avoided and invested in designing the form, layout and look to give participants the most engaging experience. In surveys where there are hard copies of questionnaires (or even in multi-mode surveys where par-ticipants have a choice of survey type), how a questionnaire is reproduced for administra-tion can influence the results. For example, if the questionnaire is reproduced on poor-quality paper or is otherwise shabby in appearance, participants will think that the project is unimportant and the quality of response will be adversely affected. Therefore, the questionnaire should be reproduced on good-quality paper and have a professional appearance.
In face-to-face interviews and postal surveys, when a printed questionnaire runs to several pages, it should take the form of a booklet rather than a number of sheets of paper clipped or stapled together. Booklets are easier for the interviewer and the participants to handle and do not easily come apart with use. They allow the use of a double-page format for questions and look more professional. Each question should be reproduced on a single page (or double-page spread). Researchers should avoid splitting a question, including its response catego-ries. Split questions can mislead the interviewer or the participant into thinking that the question has ended at the end of a page. This will result in answers based on incomplete questions.
Vertical response columns should be used for individual questions. It is easier for interviewers and participants to read down a single column rather than reading sideways across several columns. Sideways formatting and splitting, done frequently to conserve space, should be avoided. The tendency to crowd questions together to make the ques-tionnaire look shorter should be avoided. Overcrowded questions with little blank space between them can lead to errors in data collection and yield shorter and less informative replies. Moreover, it gives the impression that the questionnaire is complex and can result in lower cooperation and completion rates. Although shorter questionnaires are more desirable than longer ones, the reduction in size should not be obtained at the expense of crowding.
Directions or instructions for individual questions should be placed as close to the ques-tions as possible. Instructions relating to how the question should be administered or

398 Marketing Research
answered by the participant should be placed just before the question. Instructions concerning how the answer should be recorded or how the probing should be done should be placed after the question (for more information on probing and other interviewing procedures, see Chap-ter 16). It is common practice to distinguish instructions from questions by using different typefaces (such as capital, italic or boldfaced letters).
Although colour does not generally influence response rates to questionnaires, it can be employed advantageously in many respects. Colour coding is useful for branching questions. The next question to which the participant is directed is printed in a colour that matches the space in which the answer to the branching question was recorded. The questionnaire should be reproduced in such a way that it is easy to read and answer. The type should be large and clear. Reading the questionnaire should not impose a strain.
Eliminate problems by pilot-testing
Pilot-testing refers to testing the questionnaire on a small sample of participants to identify and eliminate potential problems, as illustrated in the following example.45
Pilot-testingTesting the questionnaire on a small sample of participants for the purpose of improving the questionnaire by identifying and eliminating potential problems.
Real research Re-inventing long-haul travel46
Air New Zealand worked with Synovate (www.synovate.com) to conduct a survey on all areas of designing the flying experience: seats, in-flight entertainment, food and bev-erage specification, service flow, kitchen design. The researchers also helped realise other ideas that had not been considered before, such as on-board events. The actual questionnaire had to be relatively straightfor-ward in structure, but it was critical that the attitudinal statements at the core of the questionnaire were sufficiently discriminatory to separate out what might be quite soft attitudes and feelings. The researchers set up a series of statements for the question-naire that were a combination of both the findings from a study conducted by the design consultancy IDEO (www.ideo.com) and their learning from previous Air New Zealand research. Lengthy discussions between Air New Zealand and IDEO, as well as the inclusion of the Qualitative Research Director, Grant Storry (www.grantstorry.com), led to the final draft. An online pilot questionnaire was tested on 40 long-haul travel-lers, who were clearly informed that they were testing the questionnaire. The test ques-tionnaire contained only the attitudinal statements. Pilot participants were asked to pause after each block of attitudinal questions and reflect on whether these statements were clear, easy to understand, and whether they captured the concept of the wider need that Air New Zealand was interested in. Their open-ended responses were reviewed by the researchers and used to refine the statements. In addition, the pilot participants’ actual ratings were analysed to determine whether each statement was sufficiently discriminative across the sample to be useful for segmentation purposes. The final questionnaire included a total of 50 attitudinal statements across the whole long-haul experience.

399Chapter 13 Questionnaire design
Even the best questionnaire can be improved by pilot-testing. As a general rule, a questionnaire should not be used in the field survey without adequate pilot-testing. A pilot-test should be extensive. All aspects of the questionnaire should be tested, including question content, wording, sequence, form and layout, question difficulty and instructions. The participants in the pilot-test should be similar to those who will be included in the actual survey in terms of background characteristics, famili-arity with the topic and attitudes and behaviours of interest.47 In other words, par-ticipants for the pilot-test and for the actual survey should be drawn from the same population.
Pilot-tests are best done by face-to-face interviews, even if the actual survey is to be conducted by online, postal or telephone methods, because interviewers can observe participants’ reactions and attitudes. After the necessary changes have been made, another pilot-test could be conducted by online, postal or telephone methods if those methods are to be used in the actual survey. The latter pilot-tests should reveal problems peculiar to the interviewing method. To the extent possible, a pilot-test should involve administering the questionnaire in the environment and context similar to that of the actual survey.
A variety of interviewers should be used for pilot-tests. The project director, the researcher who developed the questionnaire and other key members of the research team should conduct some pilot-test interviews. This will give them a good feel for potential problems and the nature of the expected data. If the survey involves face-to-face inter-views, pilot-tests should be conducted by regular interviewers. It is good practice to employ both experienced and novice interviewers. Experienced interviewers can easily perceive uneasiness, confusion and resistance in the participants, and novice interviewers can help the researcher identify interviewer-related problems. The sample size of the pilot-test is typically small, varying from 15 to 30 participants for the initial testing, depending on the heterogeneity (e.g. a wide array of education levels) of the target popu-lation. The sample size can increase substantially if the pilot-testing involves several stages or waves.
Protocol analysis and debriefing are two commonly used procedures in pilot-testing. In protocol analysis, the participant is asked to ‘think aloud’ while answering the question-naire (as explained in Chapter 12). Typically, the participant’s remarks are recorded and analysed to determine the reactions invoked by different parts of the questionnaire. Debriefing occurs after the questionnaire has been completed. Participants are told that the questionnaire they just completed was a pilot-test and the objectives of pilot-testing are described to them. They are then asked to describe the meaning of each question, to explain their answers and to state any problems they encountered while answering the questionnaire.
Editing involves correcting the questionnaire for the problems identified during pilot-testing. After each significant revision of the questionnaire, another pilot-test should be con-ducted using a different sample of participants. Sound pilot-testing involves several stages. One pilot-test is a bare minimum. Ideally, pilot-testing should be continued until no further changes are needed.
Finally, the responses obtained from the pilot-test should be analysed. The analysis of pilot-test responses can serve as a check on the adequacy of the problem definition and the data and analysis required to obtain the necessary information. The dummy tables prepared before developing the questionnaire will point to the need for the various sets of data. If the response to a question cannot be related to one of the pre-planned dummy tables, either those data are superfluous or some relevant analysis has not been foreseen. If part of a dummy table remains empty, a necessary question may have been omitted. Analysis of pilot-test data helps to ensure that all data collected will be utilised and that the questionnaire will obtain all the necessary data.48

400 Marketing Research
Summarising the questionnaire design process
Table 13.1 summarises the questionnaire design process in the form of a checklist.
Table 13.1
Step 1: Specify the information needed
1 Ensure that the information obtained fully addresses all the components of the problem. Review components of the problem and the approach, particularly the research questions, hypotheses and characteristics that influence the research design.
2 Prepare a set of dummy tables.3 Have a clear idea of the characteristics and motivations of the target participants.
Step 2: Specify the type of interviewing method
1 Review the type of interviewing method determined based on considerations discussed in Chapter 10.
Step 3: Determine the content of individual questions
1 Is the question necessary?2 Are several questions needed instead of one to obtain the required information in an unambiguous manner?3 Do not use double-barrelled questions.
Step 4: Overcome the participant’s inability and unwillingness to answer
1 Is the participant informed? 2 If the participant is not likely to be informed, filter questions that measure familiarity, product use and past experience
should be asked before questions about the topics themselves. 3 Can the participant remember? 4 Avoid errors of omission, telescoping and creation. 5 Questions that do not provide the participant with cues can underestimate the actual occurrence of an event. 6 Can the participant articulate? 7 Minimise the effort required of the participant. 8 Is the context in which the questions are asked appropriate? 9 Make the request for information seem legitimate.
10 If the information is sensitive:
(a) Place sensitive topics at the end of the questionnaire.
(b) Preface the question with a statement that the behaviour of interest is common.
(c) Ask the question using the third-person technique.
(d) Hide the question in a group of other questions that participants are willing to answer.
(e) Provide response categories rather than asking for specific figures.
(f) Use randomised techniques, if appropriate.
Step 5: Choose question structure
1 Open-ended questions are useful in exploratory research and as closing questions.2 Use structured questions whenever possible.3 In multiple-choice questions, the response alternatives should include the set of all possible choices and should be
mutually exclusive.4 In a dichotomous question, if a substantial proportion of the participants can be expected to be neutral, include a neutral
alternative.5 Consider the use of the split-ballot technique to reduce order bias in dichotomous and multiple-choice questions.6 If the response alternatives are numerous, consider using more than one question to reduce the information-processing
demands on the participants.
Questionnaire design checklist

401Chapter 13 Questionnaire design
Table 13.1
Step 6: Choose question wording
1 Define the issue in terms of ‘who’, ‘what’, ‘when’ and ‘where’.2 Use ordinary words. Words should match the vocabulary level of the participants.3 Avoid ambiguous words such as ‘usually ’, ‘normally’, ‘frequently’, ‘often’, ‘regularly’, ‘occasionally ’, ‘sometimes’, etc.4 Avoid leading or biasing questions that cue the participant to what the answer should be.5 Avoid implicit alternatives that are not explicitly expressed in the options.6 Avoid implicit assumptions.7 Participants should not have to make generalisations or compute estimates.8 Use positive and negative statements.
Step 7: Arrange the questions in proper order
1 The opening questions should be interesting, simple and non-threatening.2 Qualifying questions should serve as the opening questions.3 Basic information should be obtained first, followed by classification and finally identification information.4 Difficult, sensitive or complex questions should be placed late in the sequence.5 General questions should precede specific questions.6 Questions should be asked in a logical order.7 Branching questions should be designed carefully to cover all possible contingencies.8 The question being branched should be placed as close as possible to the question causing the branching, and the
branching questions should be ordered so that the participants cannot anticipate what additional information will be required.
Step 8: Design the form and layout
1 Divide a questionnaire into several parts.2 Questions in each part should be numbered.3 If hard copies of the questionnaires are used, coding should be printed on the forms to facilitate manual data entry.
Step 9: Publish the questionnaire
1 The questionnaire should be designed to be visually engaging.2 Vertical response columns should be used.3 Grids are useful when there are a number of related questions that use the same set of response categories.4 The tendency to crowd questions to make the questionnaire look shorter should be avoided.5 Directions or instructions for individual questions should be placed as close to the questions as possible.6 If hard copies of the questionnaires are used, a booklet format should be used for long questionnaires; each question
should be reproduced on a single page (or double-page spread).
Step 10: Eliminate problems by pilot-testing
1 Pilot-testing should always be done. 2 All aspects of the questionnaire should be tested, including question content, wording, sequence, form and layout,
question difficulty, instructions and rewards for taking part in the survey. 3 The participants in the pilot-test should be similar to those who will be included in the actual survey. 4 Begin the pilot-test by using face-to-face interviews. 5 The pilot-test should also be conducted by online, postal or telephone methods if those methods are to be used in the
actual survey. 6 A variety of interviewers should be used for pilot-tests. 7 The pilot-test sample size should be small, varying from 15 to 30 participants for the initial testing. 8 Use protocol analysis and debriefing to identify problems. 9 After each significant revision of the questionnaire, another pilot-test should be conducted using a different sample of
participants.10 The responses obtained from the pilot-test should be analysed to check the set-up of tables and charts.11 The responses obtained from the pilot-test should not be aggregated with responses from the final survey.
Continued

402 Marketing Research
Designing surveys across cultures and countries
Questionnaire design should be adapted to specific cultural environments and all efforts made to avoid bias in terms of any one culture. This requires careful attention to each step of the questionnaire design process. The information needed should be clearly specified and form the focus of the questionnaire design. This should be balanced by taking into account any participant differences in terms of underlying consumer behaviour, decision making processes, psychographics, lifestyles and demographic variables. In the context of demo-graphic characteristics, information on marital status, education, household size, occupation, income and dwelling unit may have to be specified differently for different countries, as these variables may not be directly comparable across countries. For example, household definition and size vary greatly, given the extended family structure in some countries and the practice of two or even three families living under the same roof.
Although online surveys may dominate as a survey method in Western countries, differ-ent survey methods may be favoured or more prevalent in different countries for a variety of reasons. Hence, the questionnaire may have to be suitable for administration by more than one mode. Using different survey modes can be readily facilitated by the use of online research communities. The following example illustrates a study on the use of online research communities in different countries and how online research is used in different countries.
Even if there is a global trend that questionnaires have to be designed to be administered in online surveys, there still remains a need for cultural adaptation of questionnaires. Exam-ples of such adaptation can include the challenges of comprehension and translation. It is desirable to have two or more simple questions rather than a single complex question. In overcoming the inability to answer, the variability in the extent to which participants in dif-ferent cultures are informed about the subject matter of the survey should be taken into account. Participants in some parts of the world may not be as well informed on many issues as people in Europe (and vice versa of course!). The use of unstructured or open-ended ques-tions may be desirable if the researcher lacks knowledge about the determinants of response in other countries. Because they do not impose any response alternatives, unstructured ques-tions also reduce cultural bias, but they are more affected by differences in educational levels than structured questions. They should be used with caution in countries with low literacy and, indeed, low readership levels.
The questionnaire may have to be translated for administration in different cultures and the researcher must ensure that the questionnaires in different languages are equivalent. Pilot-testing the questionnaire is complicated in international research because linguistic equivalence must be pilot-tested. Two sets of pilot-tests are recommended. The translated questionnaire should be pilot-tested on monolingual subjects in their native language, and the original and translated versions should also be administered to bilingual subjects. The pilot-test data from administering the questionnaire in different countries or cultures should be analysed and the pattern of responses compared to detect any cultural biases.
Real research Online research communities: a cross-cultural review of participants’ perceptions49
Online research communities have been described as the fastest-growing sector of mar-keting research. Among the benefits credited to online research communities are phrases such as ‘authentic voice of the consumer’ and ‘increased engagement’. These benefits were unsupported by data, raising questions about whether participants really felt better about online research communities. A study examined this issue and compared views of different survey modes across five countries: Australia, Canada, China, Indonesia and the

403Chapter 13 Questionnaire design
USA. The study represented a collaboration of four companies: Colmar Brunton (www.colmarbrunton.com.au) in Australia, Social Data Research in Canada, SSI (www.survey-sampling.com) in China and the USA and Nielsen (www.nielsen.com) in Indonesia. An online survey looked at the perceptions of interviews conducted face to face, by tele-phone, via online access panels, focus groups and online research communities. In Indo-nesia and China, research could be conducted online but infrastructure issues and access problems for some socio-economic groups continued to make the challenges for online research formidable. There were considerable similarities between the countries. This suggested that once a citizen of any of the five countries became a member of an online access panel, the citizen started to be like members of panels in other countries, at least in terms of views about the different ways to conduct research. It was possible to draw a distinction between the three more-developed research markets (Australia, Canada and USA) and the two less-developed research markets (Indonesia and China), with China being part-way between Indonesia and the three more developed markets. The two less developed research markets showed higher degrees of participants being members of online access panels and also being participants for other survey modes, suggesting that they represented a highly researched minority. This change probably reflected the fact that in Australia, Canada and the USA, research started by using random sampling approaches based on face-to-face, migrating to telephone and, more recently, to online access panels. In China, and even more so in Indonesia, marketing research had jumped the earlier phases and arrived online much earlier (and with the complexity of telephone research being identified with mobile phones from the outset). Chinese participants were the least positive about face-to-face research, and Indonesia was the most positive about telephone research. Across all countries, participants reported lower levels of sat-isfaction with telephone surveys than with any of the other survey modes. While research online communities were seen as having several strengths, they needed to be more engaging or they may turn participants off. One key area for improvement for online research communities was the need to ensure that participants felt the return they received was worth their effort. This may require both improvements to incentives and processes that increased other types of rewards, including recognition, feedback and the provision of information. One major caveat that should be borne in mind was that this study focused on online participants and their views of all modes. In Australia, Canada, and the USA, online was the single largest mode. However, in China, and even more so in Indonesia, online was a relatively smaller mode, but one that was growing rapidly.
Summary A questionnaire has three objectives. It must translate the information needed into a set of specific questions that the participants can and will answer. It must motivate partici-pants to complete the interview. It must also minimise response error. Designing a ques-tionnaire is more of a craft than a science. This is primarily due to the interrelationship of stages and the trade-offs that questionnaire designers make in balancing the source of ideas, question purposes, actual questions and question analyses. The steps involved in the questionnaire design process involve:
1 Specifying the information needed. Understanding what information decision makers need and the priorities they face.
2 Specifying the type of interviewing method. Understanding which means of elicit-ing the information will work best, given the research design constraints that the researcher has to work with.

404 Marketing Research
3 Determining the content of individual questions. Understanding the purpose of each question and working out how a posed question may fulfil that purpose.
4 Overcoming the participants’ inability and unwillingness to answer questions. Understanding the process of approaching and questioning participants – from their perspective. Knowing what benefits they get from taking part in the survey process. Knowing what they find engaging and/or boring as a questionnaire experience.
5 Choosing the question structure. Understanding how individual questions help to elicit information from participants and help them to express their feelings.
6 Choosing the question wording. Understanding the meaning of words from the perspective of the participant.
7 Arranging the questions in a proper order. Understanding what ‘proper’ means from the perspective of the participant. Recognising that, as each question is posed to a participant and the participant thinks about the response, he or she changes. Information is not only drawn out of participants, it is communicated to them and they change as each question is tackled.
8 Identifying the form and layout of the questionnaire. Understanding how, in a self-completion scenario, the form and layout motivate and help the participant to answer the questions in an honest and reflective manner. Understanding, when needed, how the form and layout help the interviewer to conduct and record the interview.
9 Publishing the questionnaire. Understanding how the professional appearance of a questionnaire affects the perceived credibility and professional ability of researchers.
10 Eliminating problems by pilot-testing. Understanding that, no matter how much experience the researcher has in designing questionnaires, the issues, participant characteristics and context of questioning make each survey unique – pilot- testing is vital.
Questions 1 What is the purpose of a questionnaire?
2 What expectations does the researcher have of potential questionnaire participants – in terms of how they will react to the experience of completing a questionnaire?
3 What does the researcher have to offer potential questionnaire participants? Why should this question be considered?
4 How would you determine whether a specific question should be included in a questionnaire?
5 What are the reasons why participants may be (a) unable to answer and (b) unwilling to answer the question asked?
6 Explain the errors of omission, telescoping and creation. What can be done to reduce such errors?
7 Explain the concepts of aided and unaided recall.
8 What can a researcher do to make the request for information seem legitimate?

405Chapter 13 Questionnaire design
9 What are the advantages and disadvantages of unstructured questions?
10 What are the issues involved in designing multiple-choice questions?
11 What are the guidelines available for deciding on question wording?
12 What is a leading question? Give an example.
13 What is the proper order for questions intended to obtain basic, classification and identification information?
14 What guidelines are available for deciding on the form and layout of a questionnaire?
15 Describe the issues involved in pilot-testing a questionnaire.
Exercises 1 Heineken beer would like to conduct a survey of 18–25-year-old Europeans to determine the characteristics of its corporate image. Design a full questionnaire using survey software such as Google Forms, Qualtrics or SurveyMonkey. Administer this questionnaire in a mode of your choice to 25 fellow students. Write a short report based upon your experience of using the software, the findings you have generated and any limitations you see in the whole process (i.e. how would you do this differently if you were to repeat it?).
2 Develop a questionnaire for determining household preferences for popular brands of cold breakfast cereals. Administer the questionnaire to five adult females, five adult males and five children. How would you modify the questionnaire if it was to be administered by telephone? What changes would be necessary if it was to be administered online? Are there distinctive characteristics of your different participant types that could affect your questionnaire design?
3 You have been hired as a management trainee by a firm that manufactures major household appliances. Your boss has asked you to develop a questionnaire to determine how households plan, purchase and use major appliances. This questionnaire is to be used in five European countries. However, you feel that you do not have the expertise or the experience to construct such a complex questionnaire. Present your case to your boss.
4 In a small group, discuss the following issues: ‘Because questionnaire design is a craft, it is useless to follow a rigid set of guidelines. Rather, the process should be left entirely to the creativity and ingenuity of the researcher.’ and ‘Asking sensitive classification questions such as age or income at the start of a questionnaire upsets the sensibilities only of older participants; young participants are not concerned about where these questions are asked.’
Notes
1. Flavián, C. and Gurrea, R., ‘Digital versus traditional newspapers: Influences on perceived substitutability’, International Journal of Market Research 51 (5) (2009), 635–57.
2. Delattre, E. and Colovic, A., ‘Memory and perception of brand mentions and placement of brands in songs’, International Journal of Advertising 28 (5) (2009), 807–42.
3. Livin, J., ‘Improving response rates in web surveys with default setting: The effects of default on web survey participation and permission’, International Journal of Market Research 53 (1) (2011), 75–94; Balabanis, G., Mitchell, V.W. and Heinonen-Mavrovouniotis, S., ‘SMS-based surveys: Strategies to improve participation’, International Journal of Advertising 26 (3) (2007), 369–85.

406 Marketing Research
4. The founding reference to this subject is Payne, S.L., The Art of Asking Questions (Princeton, NJ: Princeton University Press, 1951). See also Lietz, P., ‘Research into questionnaire design: A summary of the literature’, International Journal of Market Research 52 (2) (2010), 249–72; Schrage, M., ‘Survey says’, Adweek Magazines’ Technology Marketing 22 (1) (January 2002), 11; Gillham, B., Developing a Questionnaire (New York: Continuum International, 2000).
5. Woodnutt, T. and Owen, R., ‘The research industry needs to embrace radical change in order to thrive and survive in the digital era’, Market Research Society: Annual Conference (2010).
6. These guidelines are drawn from several books on questionnaire design: Dillman, D.A., Smyth, J.D. and Melani, L., Internet, Mail, and Mixed-Mode Surveys: The Tailored Design Method, 3rd edn (Hoboken, NJ: Wiley, 2008); Bradburn, N.M., Sudman, S. and Wansink, B., Asking Questions: The Definitive Guide to Questionnaire Design – For Market Research, Political Polls, and Social and Health Questionnaires (San Francisco: Jossey-Bass, 2004); Gillham, B., Developing a Questionnaire (New York: Continuum International, 2000); Peterson, R.A., Constructing Effective Questionnaires (Thousand Oaks, CA: Sage, 2000); Schuman, H. and Presser, S., Questions and Answers in Attitude Surveys (Thousand Oaks, CA: Sage, 1996); Fink, A., How to Ask Survey Questions (Thousand Oaks, CA: Sage, 1995); Sudman, S. and Bradburn, N.M., Asking Questions (San Francisco: Jossey-Bass, 1983).
7. Cierpicki, S., Davis, C., Eddy, C., Lorch, J., Phillips, K., Poynter, R., York, S. and Zuo, B., ‘From clipboards to online research communities: A cross cultural review of respondents’ perceptions’, ESOMAR Congress Odyssey, Athens (September 2010).
8. Biering, P., Becker, H., Calvin, A. and Grobe, S.J., ‘Casting light on the concept of patient satisfaction by studying the construct validity and the sensitivity of a questionnaire’, International Journal of Health Care Quality Assurance 19 (3) (2006), 246–58; Clark, B.H., ‘Bad examples’, Marketing Management 12 (2) (2003), 34–8; Bordeaux, D.B., ‘Interviewing – part II: Getting the most out of interview questions’, Motor Age 121 (2) (February 2002), 38–40.
9. Bressette, K., ‘Deeply understanding the mind to unmask the inner human’, ESOMAR Qualitative, Marrakech (November 2009); Reynolds, T.J., ‘Methodological and strategy development implications of decision segmentation’, Journal of Advertising Research 46 (4) (December 2006) 445–61; Healey, B., Macpherson, T. and Kuijten, B., ‘An empirical evaluation of three web survey design principles’, Marketing Bulletin, 16 (May 2005), 1–9; Hess, J., ‘The effects of person-level versus household-level questionnaire design on survey estimates and data quality’, Public Opinion Quarterly 65 (4) (Winter 2001), 574–84.
10. Fairfield, A., ‘Doing the right thing is a brand communicator’s imperative’, Admap 504 (April 2009), 32–5.
11. Alioto, M.F. and Parrett, M., ‘The use of “respondent-based intelligent” surveys in cross-national research’, ESOMAR Latin American Conference, São Paulo (May 2002), 157–220; Knauper, B., ‘Filter questions and
question interpretation: Presuppositions at work’, Public Opinion Quarterly 62 (1) (Spring 1998), 70–8; Stapel, J., ‘Observations: A brief observation about likeability and interestingness of advertising’, Journal of Advertising Research 34 (2) (March/April 1994), 79–80.
12. Graeff, T.R., ‘Reducing uninformed responses: The effects of product class familiarity and measuring brand knowledge on surveys’, Psychology and Marketing 24 (8) (August 2007), 681–702; Graeff, T.R., ‘Uninformed response bias in telephone surveys’, Journal of Business Research 55 (3) (March 2002), 251.
13. Braunsberger, K., Gates, R. and Ortinau, D.J., ‘Prospective respondent integrity behaviour in replying to direct mail questionnaires: A contributor in overestimating nonresponse rates’, Journal of Business Research 58 (3) (March 2005), 260–7; Lee, E., Hu, M.Y. and Toh, R.S., ‘Are consumer survey results distorted? Systematic impact of behavioural frequency and duration on survey response errors’, Journal of Marketing Research 37 (1) (February 2000), 125–33.
14. Wilson, E.J. and Woodside, A.G., ‘Respondent inaccuracy’, Journal of Advertising Research 42 (5) (September/October 2002), 7–18; Gaskell, G.D., ‘Telescoping of landmark events: Implications for survey research’, Public Opinion Quarterly 64 (1) (Spring 2000), 77–89; Menon, G., Raghubir, P. and Schwarz, N., ‘Behavioural frequency judgments: An accessibility-diagnosticity framework’, Journal of Consumer Research 22 (2) (September 1995), 212–28; Cook, W.A., ‘Telescoping and memory’s other tricks’, Journal of Advertising Research (February–March 1987), 5–8.
15. Goodrich, K., ‘What’s up? Exploring upper and lower visual field advertising effects’, Journal of Advertising Research 50 (1) (2010), 91–106.
16. Bednall, D.H.B., Adam, S. and Plocinski, K., ‘Ethics in practice: Using compliance techniques to boost telephone response rates’, International Journal of Market Research 52 (2) (2010), 155–68.
17. Nancarrow, C. and Brace, I., ‘Let’s get ethical: Dealing with socially desirable responding online’, Market Research Society: Annual Conference (2008); Tourangeau, R. and Yan, T., ‘Sensitive questions in surveys’, Psychological Bulletin 133 (5) (September 2007), 859–83; France, M., ‘Why privacy notices are a sham’, Business Week (18 June 2001), 82.
18. Manfreda, K.L., Bosnjak, M., Berzelak, J., Haas, I. and Vehovar, V., ‘Web surveys versus other survey modes: A meta analysis comparing response rates’, International Journal of Market Research 50 (1) (2008), 79–104; Hanrahan, P., ‘Mine your own business’, Target Marketing (February 2000), 32; Tourangeau, R. and Smith, T.W., ‘Asking sensitive questions: The impact of data collection mode, question format, and question context’, Public Opinion Quarterly 60 (20) (Summer 1996), 275–304.
19. Maehle, N., and Supphellen, M., ‘In search of the sources of brand personality’, International Journal of Market Research 53 (1) (2011), 95–114; Peterson, R.A., ‘Asking the age question: A research note’, Public Opinion Quarterly (Spring 1984), 379–83.
20. Nancarrow, C. and Brace, I., ‘Let’s get ethical: Dealing with socially desirable responding online’, Market

407Chapter 13 Questionnaire design
Research Society: Annual Conference (2008); Larkins, E.R., Hume, E.C. and Garcha, B.S., ‘The validity of the randomized response method in tax ethics research’, Journal of Applied Business Research 13 (3) (Summer 1997), 25–32; Mukhopadhyay, P., ‘A note on UMVU-estimation under randomized-response model’, Communications in Statistics – Theory and Methods 26 (10) (1997), 2415–20.
21. Millican, P. and Kolb, C., ‘Connecting with Elizabeth: Using artificial intelligence as a data collection aid’, Market Research Society: Annual Conference (2006); Patten, M.L., Questionnaire Research: A Practical Guide (Los Angeles: Pyrczak, 2001); Newman, L.M., ‘That’s a good question’, American Demographics (Marketing Tools) (June 1995), 10–13.
22. Esuli, A. and Sebastiani, F., ‘Machines that learn how to code open-ended survey data’, International Journal of Market Research 52 (6) (2010), 775–800; Popping, R., Computer-Assisted Text Analysis (Thousand Oaks, CA: Sage, 2000); Luyens, S., ‘Coding verbatims by computers’, Marketing Research: A Magazine of Management and Applications 7 (2) (Spring 1995), 20–5.
23. Verhaeghe, A., De Ruyck, T. and Schillewaert, N., ‘Join the research – participant-led open-ended questions’, International Journal of Market Research 50 (5) (2008), 655–78; Pothas, A.M., ‘Customer satisfaction: Keeping tabs on the issues that matter’, Total Quality Management 12 (1) (January 2001), 83.
24. Vicente, P., Reis, E. and Santos, M., ‘Using mobile phones for survey research: A comparison with fixed phones’, International Journal of Market Research 51 (5) (2009), 613–34.
25. Bellman, S., Schweda, A. and Varan, D., ‘The importance of social motives for watching and interacting with digital television’, International Journal of Market Research 52 (1) (2010), 67–87.
26. Russell, M., Fischer, M.J., Fischer, C.M. and Premo, K., ‘Exam question sequencing effects on marketing and management sciences student performance’, Journal for Advancement of Marketing Education 3 (Summer 2003), 1–10; Javeline, D., ‘Response effects in polite cultures’, Public Opinion Quarterly 63 (1) (Spring 1999), 1–27; Krosnick, J.A. and Alwin, D.F., ‘An evaluation of a cognitive theory of response order effects in survey measurement’, Public Opinion Quarterly (Summer 1987), 201–19; Blunch, N.J., ‘Position bias in multiple-choice questions’, Journal of Marketing Research 21 (May 1984), 216–20, has argued that position bias in multiple-choice questions cannot be eliminated by rotating the order of the alternatives. This viewpoint is contrary to common practice.
27. ‘IKEA – love where you live’, The Communications Council, Bronze, Australian Effie Awards (2009).
28. DeMoranville, C.W. and Bienstock, C.C., ‘Question order effects in measuring service quality’, International Journal of Research in Marketing 20 (3) (2003), 457–66; Singer, E., ‘Experiments with incentives in telephone surveys’, Public Opinion Quarterly 64 (2) (Summer 2000), 171–88; Schuman, H. and Presser, S., Questions and Answers in Attitude Surveys (Thousand Oaks, CA: Sage, 1996).
29. Dolnicar, S., Grün, B. and Leisch, F., ‘Quick, simple and reliable: Forced binary survey questions’, International
Journal of Market Research 53 (2) (2011), 233–54; Blumenschein, K., ‘Hypothetical versus real willingness to pay in the health care sector: Results from a field experiment’, Journal of Health Economics 20 (3) (May 2001), 441; Herriges, J.A. and Shogren, J.F., ‘Starting point bias in dichotomous choice valuation with follow-up questioning’, Journal of Environmental Economics and Management 30 (1) (January 1996), 112–31.
30. Kalton, G. and Schuman, H., ‘The effect of the question on survey responses: A review’, Journal of the Royal Statistical Society Series A 145, Part 1 (1982), 44–5.
31. Albaum, G., Roster, C., Yu, J.H. and Rogers, R.D., ‘Simple rating scale formats: Exploring extreme response’, International Journal of Market Research 49 (5) (2007), 1–17; Vriends, M., Wedel, M. and Sandor, Z., ‘Split-questionnaire design’, Marketing Research 13 (2) (2001), 14–19; Conrad, F.G., ‘Clarifying question meaning in a household telephone survey’, Public Opinion Quarterly 64 (1) (Spring 2000), 1–27; McBurnett, M., ‘Wording of questions affects responses to gun control issue’, Marketing News 31 (1) (6 January 1997), 12.
32. Cape, P., Lorch, J. and Piekarski, L., ‘A tale of two questionnaires’, ESOMAR Panel Research, Orlando, (October 2007); Colombo, R., ‘A model for diagnosing and reducing nonresponse bias’, Journal of Advertising Research 40 (1/2) (January/April 2000), 85–93; Etter, J.F. and Perneger, T.V., ‘Analysis of nonresponse bias in a mailed health survey’, Journal of Clinical Epidemiology 50 (10) (25 October 1997), 1123–8; Omura, G.S., ‘Correlates of item non-response’, Journal of the Market Research Society (October 1983), 321–30.
33. Manfreda, K.L., Bosnjak, M., Berzelak, J., Haas, I. and Vehovar, V., ‘Web surveys versus other survey modes: A meta-analysis comparing response rates’, International Journal of Market Research 50 (1) (2008), 79–104; Bollinger, C.R., ‘Estimation with response error and nonresponse: Food-stamp participation in the SIPP’, Journal of Business and Economic Statistics 19 (2) (April 2001), 129–41.
34. Gillham, B., Developing a Questionnaire (New York: Continuum International, 2000); Saltz, L.C., ‘How to get your news release published’, Journal of Accountancy 182 (5) (November 1996), 89–91.
35. Reid, J., Morden, M. and Reid, A., ‘Maximising respondent engagement: The use of rich media’, ESOMAR Annual Congress, Berlin (September 2007); Couper, M.P., ‘Web surveys: A review of issues and approaches’, Public Opinion Quarterly 64 (4) (Winter 2000), 464–94; Edmondson, B., ‘How to spot a bogus poll’, American Demographics 8 (10) (October 1996), 10–15; O’Brien, J., ‘How do market researchers ask questions?’, Journal of the Market Research Society 26 (April 1984), 93–107.
36. Cohen, J., ‘Reading and writing: The forgotten 12 million’, Market Research Society: Annual Conference (2006).
37. Snowden, D., and Stienstra, J., ‘Stop asking questions: Understanding how consumers make sense of it all’, ESOMAR Annual Congress, Berlin (September 2007); Chisnall, P.M., ‘Marketing research: State of the art perspectives’, International Journal of Marketing

408 Marketing Research
Research 44 (1) (First Quarter 2002), 122–5; Abramson, P.R. and Ostrom, C.W., ‘Question wording and partisanship’, Public Opinion Quarterly 58 (1) (Spring 1994), 21–48.
38. Charney, C., ‘Top ten ways to get misleading poll results’, Campaigns and Elections 28 (7) (July 2007), 66–7; Dubelaar, C. and Woodside, A.G., ‘Increasing quality in measuring advertising effectiveness: A meta analysis of question framing in conversion studies’, Journal of Advertising Research 43 (1) (March 2003), 78–85; Becker, B., ‘Take direct route when data gathering’, Marketing News 33 (20) (27 September 1999), 29–30.
39. Brinkmann, S., ‘Could interviews be epistemic? An alternative to qualitative opinion polling’, Qualitative Inquiry 13 (8) (December 2007), 1116–38; Gillham, B., Developing a Questionnaire (New York: Continuum International, 2000); Adamek, R.J., ‘Public opinion and Roe v. Wade: Measurement difficulties’, Public Opinion Quarterly 58 (3) (Fall 1994), 409–18.
40. Chen, S., Poland, B. and Skinner, H.A., ‘Youth voices: Evaluation of participatory action research’, Canadian Journal of Program Evaluation 22 (1) (March 2007), 125; Ouyand, M., ‘Estimating marketing persistence on sales of consumer durables in China’, Journal of Business Research 55 (4) (April 2002), 337; Jacoby, J. and Szybillo, G.J., ‘Consumer research in FTC versus Kraft (1991): A case of heads we win, tails you lose?’, Journal of Public Policy and Marketing 14 (1) (Spring 1995), 1–14.
41. Phillips, S. and Hamburger S., ‘A quest for answers: The campaign against Why’, ESOMAR Annual Congress, Berlin (September 2007); Glassman, N.A. and Glassman, M., ‘Screening questions’, Marketing Research 10 (3) (1998), 25–31; Schuman, H. and Presser, S., Questions and Answers in Attitude Surveys (Thousand Oaks, CA: Sage, 1996).
42. Rating a brand on specific attributes early in a survey may affect responses to a later overall brand evaluation. For example, see Gendall, P. and Hoek, J., ‘David takes on Goliath: An overview of survey evidence in a trademark dispute’, International Journal of Market Research 45 (1) (2003), 99–122; Bartels, L.M., ‘Question order and declining faith in elections’, Public Opinion Quarterly 66 (1) (Spring 2002), 67–79. See also
McAllister, I. and Wattenberg, M.P., ‘Measuring levels of party identification: Does question order matter?’, Public Opinion Quarterly 59 (2) (Summer 1995), 259–68.
43. Watson, P.D., ‘Adolescents’ perceptions of a health survey using multimedia computer-assisted self-administered interview’, Australian & New Zealand Journal of Public Health 25 (6) (December 2001), 520; Bethlehem, J., ‘The routing structure of questionnaires’, International Journal of Market Research 42 (1) 2000, 95–110; Willits, F.K. and Ke, B., ‘Part-whole question order effects: Views of rurality’, Public Opinion Quarterly 59 (3) (Fall 1995), 392–403.
44. Puleston, J. and Sleep, D., ‘Measuring the value of respondent engagement – innovative techniques to improve panel quality’, ESOMAR Panel Research, Dublin (October 2008).
45. Schlegelmilch, B.B., Diamantopoulos, A. and Reynolds, N., ‘Pre-testing in questionnaire design: A review of the literature and suggestions for further research’, International Journal of Market Research 35 (2) (1993), 171–82.
46. Feldhaeuser, H. and Smales, H., ‘Flying with the Simpsons: An award-winning research paper that helped Air New Zealand reinvent the long-haul air travel’, ESOMAR Asia Pacific, Melbourne (2011).
47. Blair, J. and Srinath, K.P., ‘A note on sample size for behaviour coding pretests’, Field Methods 85 (11) (February 2008), 20; Conrad, F.G., ‘Clarifying question meaning in a household telephone survey’, Public Opinion Quarterly 64 (1) (Spring 2000), 1–27; Diamantopoulos, A., Schlegelmilch, B.B. and Reynolds, N., ‘Pre-testing in questionnaire design: The impact of participant characteristics on error detection’, Journal of the Market Research Society 36 (October 1994), 295–314.
48. Meir, D., ‘The seven stages of effective survey research’, American Marketing Association (2002); Gillham, B., Developing a Questionnaire (New York: Continuum International, 2000).
49. Cierpicki, S., Davis, C., Eddy, C., Lorch, J., Phillips, K., Poynter, R., York, S. and Zuo, B., ‘From clipboards to online research communities: A cross-cultural review of participants’ perceptions’, ESOMAR Congress Odyssey, Athens (September 2010).

Sampling: design and procedures
There is no hope of making
scientific statements about a
population based on the
knowledge obtained from a
sample, unless we are
circumspect in choosing a
sampling method.
Stage 1
Problem definition
Stage 2
Research approach developed
Stage 3
Research design
developed
Stage 4
Fieldwork or data
collection
Stage 5
Data integrity
and analysis
14
Stage 6
Communicating research findings

410 Marketing Research
Objectives
After reading this chapter, you should be able to:
1 differentiate a sample from a census and identify the conditions that favour the use of a sample versus a census;
2 discuss the sampling design process: definition of the target population, determination of the sampling frame, selection of sampling technique(s), determination of sample size, execution of the sampling process and validating the sample;
3 classify sampling techniques as non-probability and probability sampling techniques;
4 describe the non-probability sampling techniques of convenience, judgemental, quota and snowball sampling;
5 describe the probability sampling techniques of simple random, systematic, stratified and cluster sampling;
6 identify the conditions that favour the use of non-probability sampling versus probability sampling;
7 understand the sampling design process and the use of sampling techniques across countries;
8 appreciate how the growth in online panels is shaping the manner in which sampling may be designed and executed.
Sampling is a key component of any research design. Sampling design involves several basic questions:
1 Should a sample be taken?
2 If so, what process should be followed?
3 What kind of sample should be taken?
4 How large should it be?
5 What can be done to control and adjust for non-response errors?
This chapter introduces the fundamental concepts of sampling and the qualitative considerations necessary to answer these questions. We address the question of whether or not to sample and describe the steps involved in sampling. Included in questions of the steps involved in sampling are the use, benefits and limitations of the access panel in sample design. We present the nature of non-probability and probability sampling and related sampling techniques. We discuss the use of sampling techniques in international marketing research and identify the relevant ethical issues. We conclude by examining the issues around designing and executing well-focused samples in the context of conducting online surveys. (Statistical determination of sample size, and the causes for control of and adjustments for non-response error, are discussed in Chapter 15.)
We begin with two examples. The first illustrates the choice of a sampling method in a complex international study, with hard-to-access participants. The second illustrates a key debate that challenges many researchers. Given the demand for researchers to sample ‘willing’ participants to match specific profiles, the use of the access panel has grown enormously in the research industry. As you progress through questions of the nature, purpose and techniques of sampling, the key debates in this example should be addressed.
Overview

411Chapter 14 Sampling: design and procedures
Real research Measuring the impact of empowerment1
Research by the United Nations has demonstrated that in most economies, women are the linchpin to the advancement of many indicators of prosperity. In the West, it is often believed that greater financial prosperity always equates to greater happiness. In those countries where women appear to be doing well financially, are these women really happier? In societies where women’s pursuit of prosperity and happiness is not sup-ported, research has a role to play both in providing them with a voice to let their hopes and dreams be heard and in public policy designed to support them. To address some of these issues, D3 Systems (www.d3systems.com) launched the Women in Muslim Coun-tries study (WIMC). WIMC consisted of annually repeated, nationally representative quantitative research in 22 Muslim-majority countries of the globe. The questions used for the WIMC were designed to measure women’s empowerment in actual daily prac-tice, providing a deep look into the gap between current public policy and empower-ment initiatives and actual practice on the personal and local level. In some cases, WIMC got at the issues indirectly, as in many Muslim countries asking with direct wording would not yield honest answers. Individual country surveys were conducted, either face to face or via CATI as appropriate. Each country’s sampling frame was designed to pro-vide the best possible representation of the attitudes and experience of that country’s women. In all cases, the sample was two-stage, stratified random. In the case of Egypt, the sampling frame was limited to urban areas only. At its launch WIMC focused upon the following 10 countries:
Country Mode Women only, n
Afghanistan Face-to-face nationwide 1175Bangladesh Face-to-face nationwide 753Egypt Face-to-face nationwide, seven main cities and suburbs 500Iran CATI nationwide 1003Iraq Face-to-face nationwide 1093Jordan Face-to-face nationwide 500Kosovo Face-to-face nationwide 538Pakistan Face-to-face nationwide 960Saudi Arabia CATI nationwide 514Turkey CATI nationwide 490
Real research Down with random sampling
Peter Kellner, President of YouGov (www.yougov.co.uk), the online political polling company, presented these contentious views on the challenges of conducting random sampling:2
We know that perfection does not exist. Pure random samples are too expensive. Besides 100% response rates belong to the world of fantasy. So we are told to do the best we can. There are two separate phenomena to address: the quality of the ‘designed’ sample and the quality of the ‘achieved’ sample. When we deliver results to our clients, what matters is the second, not the first. If the achieved sample is badly skewed, it is no defence to say that we used impeccably random samples to obtain it. Our aim should be to present our clients with ‘representative achieved samples’. This means developing a much more

412 Marketing Research
This example infers that the ‘best’ form of sampling is the probability random sample. It may be an ideal that researchers would prefer to administer. However, researchers have long rec-ognised the balance between what may be seen as the scientific ideal of sampling and the administrative constraints in achieving that ideal. This balance will be addressed throughout this chapter. Before we discuss these issues in detail, we address the question of whether the researcher should sample or take a census.
purposive approach to sampling and weighting. At YouGov we have been forced into this approach by the very nature of our business. Our samples are drawn from a panel of more than 150,000 people throughout Great Britain. By definition, we don’t approach the remaining 45 million adults who have not joined our panel. Random sample purists look at our methods with scorn. Yet our record demonstrates an overall accuracy that our rivals envy.
We draw on existing knowledge of a population in question to construct samples that are representative of that population. We also apply weights that are relevant to each group, not simply all purpose demographic weights. Of course, the non-response prob-lem can never be completely eliminated. We can never be sure of the views of people who never respond to pollsters of any kind.
In response, Harmut Schffler of TNS Infratest (www.tns-infratest.com) commented:3
Whilst we need to develop our expertise, and refusal rates are a growing problem, to say random sampling is obsolete and then present modulated access panels as the solution is astounding. Yes, Peter Kellner will want to defend his business model. He at least hints that access panels can produce enormous distortion with respect to who does and does not participate. Instead of declaring the death of random sampling, we should improve its quality through better promoting our industry to the public and finding more intelli-gent ways to address potential participants so we can increase response rates. We need random methods. And so does Peter Kellner’s model or he will find no solution to his own recruitment distortion problem.
Andrew Zelin and Patten Smith of Ipsos MORI (www.ipsos-mori.com) added:
We agree that a high quality of designed sample does not guarantee a high quality of achieved sample, that poor response rates coupled with differences between responders and non-responders lead to non-response bias and that demographic weighting may be a poor tool for removing this bias. However, his arguments depend upon the implication that random probability samples produce unacceptable levels of non-response bias. For some samples and some variables this will be true, but often it will not. Unless we are certain that the alternatives to random probability sampling are superior, we should investigate non-response bias on a variable-by-variable survey-by-survey basis.
Sample or census
The objective of most marketing research projects is to obtain information about the charac-teristics or parameters of a population. A population is the aggregate of all the elements that share some common set of characteristics and that comprise the universe for the purpose of the marketing research problem. The population parameters are typically numbers, such as the proportion of consumers who are loyal to a particular fashion brand. Information about
PopulationThe aggregate of all the elements, sharing some common set of characteristics, that comprise the universe for the purpose of the marketing research problem.

413Chapter 14 Sampling: design and procedures
population parameters may be obtained by taking a census or a sample. A census involves a complete enumeration of the elements of a population. The population parameters can be calculated directly in a straightforward way after the census is enumerated. A sample, on the other hand, is a subgroup of the population selected for participation in the study. Sample characteristics, called statistics, are then used to make inferences about the population parameters. The inferences that link sample characteristics and population parameters are estimation procedures and tests of hypotheses. (These inference procedures are considered in Chapters 20 to 26.)
Table 14.1 summarises the conditions favouring the use of a sample versus a census. Budget and time limits are obvious constraints favouring the use of a sample. A census is both costly and time-consuming to conduct. A census is unrealistic if the population is large, as it is for most consumer products. In the case of many industrial products, however, the population is small, making a census feasible as well as desirable. For example, in investigat-ing the use of certain machine tools by Italian car manufacturers, a census would be pre-ferred to a sample. Another reason for preferring a census in this case is that variance in the characteristic of interest is large. For example, machine-tool usage of Fiat may vary greatly from the usage of Ferrari. Small population sizes as well as high variance in the characteris-tic to be measured favour a census.
CensusA complete enumeration of the elements of a population or study objects.
SampleA subgroup of the elements of the population selected for participation in the study.
Table 14.1
Factors Conditions favouring the use of
Sample Census
1 Budget Small Large2 Time available Short Long3 Population size Large Small4 Variance in the characteristic Small Large5 Cost of sampling errors Low High6 Cost of non-sampling errors High Low7 Nature of measurement Destructive Non-destructive8 Attention to individual cases Yes No
Sample versus census
If the cost of sampling errors is high (e.g. if the sample omitted a major manufacturer such as Ford, the results could be misleading), a census, which eliminates such errors, is desirable. If the cost of non-sampling errors is high (e.g. interviewers incorrectly questioning target participants) a sample, where fewer resources would have been spent, would be favoured.
A census can greatly increase non-sampling error to the point that these errors exceed the sampling errors of a sample. Non-sampling errors are found to be the major contributor to total error, whereas random sampling errors have been relatively small in magnitude.4 Hence, in most cases, accuracy considerations would favour a sample over a census.
A sample may be preferred if the measurement process results in the destruction or contamination of the elements sampled. For example, product usage tests result in the con-sumption of the product. Therefore, taking a census in a study that requires households to use a new brand of toothpaste would not be feasible. Sampling may also be necessary to focus attention on individual cases, as in the case of in-depth interviews. Finally, other pragmatic considerations, such as the need to keep the study secret, may favour a sample over a census.

414 Marketing Research
Define the target population
Sampling design begins by specifying the target population. This is the collection of ele-ments or objects that possess the information sought by the researcher and about which infer-ences are to be made. The target population must be defined precisely. Imprecise definition of the target population will result in research that is ineffective at best and misleading at worst. Defining the target population involves translating the problem definition into a pre-cise statement of who should and should not be included in the sample.
The target population should be defined in terms of elements, sampling units, extent and time. An element is the object about which, or from which, the information is desired. In survey research, the element is usually the participant. A sampling unit is an element, or a unit containing the element, that is available for selection at some stage of the sampling process. Suppose that Clinique wanted to assess consumer response to a new line of lipsticks and wanted to sample females over 25 years of age. It may be pos-sible to sample females over 25 directly, in which case a sampling unit would be the same as an element. Alternatively, the sampling unit might be households. In the latter case, households would be sampled and all females over 25 in each selected household would be interviewed. Here, the sampling unit and the population element are different. Extent refers to the geographical boundaries of the research, and the time refers to the period under consideration.
Target populationThe collection of elements or objects that possess the information sought by the researcher and about which inferences are to be made.
The sampling design process
The sampling design process includes six steps, which are shown sequentially in Figure 14.1. These steps are closely interrelated and relevant to all aspects of the marketing research pro-ject, from problem definition to the presentation of the results. Therefore, sample design decisions should be integrated with all other decisions in a research project.5
Figure 14.1
The sampling design process
De�ne the target population
Determine the sampling frame
Select a sampling technique
Determine the sample size
Execute the sampling process
Validate the sample
ElementAn object that possesses the information sought by the researcher and about which inferences are to be made.
Sampling unitAn element, or a unit containing the element, that is available for selection at some stage of the sampling process.

415Chapter 14 Sampling: design and procedures
Defining the target population may not be as easy as it was in this example. Consider a marketing research project assessing consumer response to a new brand of men’s moistur-iser. Who should be included in the target population? All men? Men who have used a mois-turiser during the last month? Men of 17 years of age or older? Should females be included, because some women buy moisturiser for men whom they know? These and similar ques-tions must be resolved before the target population can be appropriately defined.6 This chal-lenge is further illustrated in the following example.
Real research Kiasma: the insightful museum7
Kiasma Museum of Contemporary Art (www.kiasma.fi) in Finland is dedicated to con-temporary art. Throughout its existence Kiasma has been the most visited museum in Finland. Kiasma’s marketing and management team wanted to explore the museum’s marketing strategy, contextual development and changes in the external working envi-ronment. Research was planned between Kiasma and the media agency Dagmar (www.dagmar.fi), with whom it had been working for over 10 years. One of the first challenges was to establish what the population for the research would be. Would it be the total population for Finland? Kiasma had a public duty to serve the whole population, but it was unfeasible in the context of the research to segment the whole Finnish population, since the museum was located in Helsinki and just pure distance was a hindrance for visiting and/or visiting regularly. The approach the researchers chose was to first gauge the interest in contemporary art in an online panel. The question they posed was a sim-ple ‘Are you interested in contemporary art – yes/no?’. The result was that a discouraging 33% had an interest in contemporary art. A follow-up question was open-ended, about why the participant was interested or not interested. The results helped the researchers to define a population for their planned survey as ‘people living a maximum of 60 km from Helsinki, 15–74 years of age and interested in any form of cultural activities, or, fail-ing that, are interested in new experiences’. The reasoning behind this was that a person who was interested in at least some form of culture would more easily be persuaded to come to Kiasma.
Determine the sampling frame
A sampling frame is a representation of the elements of the target population. It consists of a list or set of directions for identifying the target population. Examples of a sampling frame include the telephone book, an association directory listing the firms in an indus-try, a customer database, a mailing list on a database purchased from a commercial organisation, a city directory, a map or, most frequently in marketing research, an access panel.8 If a list cannot be compiled, then at least some directions for identifying the target population should be specified, such as random-digit dialling procedures in telephone surveys.
With growing numbers of individuals, households and businesses, it may be possible to compile or obtain a list of population elements, but the list may omit some elements of the population or may include other elements that do not belong. Therefore, the use of a list will lead to sampling frame error (which was discussed in Chapter 3).9
Sampling frameA representation of the elements of the target population that consists of a list or set of directions for identifying the target population.

416 Marketing Research
In some instances, the discrepancy between the population and the sampling frame is small enough to ignore. In most cases, however, the researcher should recognise and attempt to treat the sampling frame error. One approach is to redefine the population in terms of the sampling frame. For example, if a specialist business directory is used as a sampling frame, the population of businesses could be redefined as those with a correct listing in a given location. Although this approach is simplistic, it does prevent the researcher from being misled about the actual population being investigated.10 Ulti-mately, the major drawback of redefining the population based upon available sampling frames is that the nature of the research problem may be compromised. Who is being measured and ultimately to whom the research findings may be generalised may not match the target group of individuals identified in a research problem definition. Evaluating the accuracy of sampling frames matches the issues of evaluating the quality of secondary data (see Chapter 4).
Another way is to account for sampling frame error by screening the participants in the data collection phase. The participants could be screened with respect to demographic char-acteristics, familiarity, product usage and other characteristics to ensure that they satisfy the criteria for the target population. Screening can eliminate inappropriate elements contained in the sampling frame, but it cannot account for elements that have been omitted. Yet another approach is to adjust the data collected by a weighted scheme to counterbalance the sampling frame error. These issues were presented in the opening example ‘Down with random sam-pling’ (and will be further discussed in Chapters 15 and 19). Regardless of which approach is used, it is important to recognise any sampling frame error that exists, so that inappropriate inferences can be avoided.
Select a sampling technique
Selecting a sampling technique involves several decisions of a broader nature. The researcher must decide whether to use a Bayesian or traditional sampling approach, to sample with or without replacement, and to use non-probability or probability sampling.
In the Bayesian approach, the elements are selected sequentially. After each element is added to the sample, the data are collected, sample statistics computed and sampling costs determined. The Bayesian approach explicitly incorporates prior information about popula-tion parameters, as well as the costs and probabilities associated with making wrong deci-sions.11 This approach is theoretically appealing. Yet it is not used widely in marketing research because much of the required information on costs and probabilities is not available. In the traditional sampling approach, the entire sample is selected before data collection begins. Because the traditional approach is the most common approach used, it is assumed in the following sections.
In sampling with replacement, an element is selected from the sampling frame and appropriate data are obtained. Then the element is placed back in the sampling frame. As a result, it is possible for an element to be included in the sample more than once. In sampling without replacement, once an element is selected for inclusion in the sample it is removed from the sampling frame and therefore cannot be selected again. The calcula-tion of statistics is done somewhat differently for the two approaches, but statistical infer-ence is not very different if the sampling frame is large relative to the ultimate sample size. Thus, the distinction is important only when the sampling frame is small compared with the sample size.
The most important decision about the choice of sampling technique is whether to use non-probability or probability sampling. Non-probability sampling relies on the judgement of the researcher, while probability sampling relies on chance. Given its importance, the issues involved in this decision are discussed in detail below, in the next section.
If the sampling unit is different from the element, it is necessary to specify precisely how the elements within the sampling unit should be selected. With home face-to-face interviews
Bayesian approachA selection method where the elements are selected sequentially. The Bayesian approach explicitly incorporates prior information about population parameters as well as the costs and probabilities associated with making wrong decisions.
Sampling with replacementA sampling technique in which an element can be included in the sample more than once.
Sampling without replacementA sampling technique in which an element cannot be included in the sample more than once.

417Chapter 14 Sampling: design and procedures
and telephone interviews, merely specifying the address or the telephone number may not be sufficient. For example, should the person answering the doorbell or the telephone be inter-viewed, or someone else in the household? Often, more than one person in a household may qualify. For example, both the male and female head of household, and even their children, may be eligible to participate in a study examining family leisure-time activities. When a probability sampling technique is being employed, a random selection must be made from all the eligible persons in each household. A simple procedure for random selection is the ‘next birthday’ method. The interviewer asks which of the eligible persons in the household has the next birthday and includes that person in the sample.
Determine the sample size
Sample size refers to the number of elements to be included in the study. Determining the sample size involves several qualitative and quantitative considerations. The qualitative fac-tors are discussed in this subsection, and the quantitative factors are considered in Chapter 15. Important qualitative factors to be considered in determining the sample size include: (1) the importance of the decision; (2) the nature of the research; (3) the number of variables; (4) the nature of the analysis; (5) sample sizes used in similar studies; (6) incidence rates; (7) com-pletion rates; and (8) resource constraints.
In general, for more important decisions more information is necessary, and that informa-tion should be obtained very precisely. This calls for larger samples, but as the sample size increases, each unit of information is obtained at greater cost. The degree of precision may be measured in terms of the standard deviation of the mean, which is inversely proportional to the square root of the sample size. The larger the sample, the smaller the gain in precision by increasing the sample size by one unit.
The nature of the research also has an impact on the sample size. For exploratory research designs, such as those using qualitative research, the sample size is typically small. For con-clusive research, such as descriptive surveys, larger samples are required. Likewise, if data are being collected on a large number of variables, i.e. many questions are asked in a survey, larger samples are required. The cumulative effects of sampling error across variables are reduced in a large sample.
If sophisticated analysis of the data using multivariate techniques is required, the sample size should be large. The same applies if the data are to be analysed in great detail. Thus, a larger sample would be required if the data are being analysed at the subgroup or segment level than if the analysis is limited to the aggregate or total sample.
Sample size is influenced by the average size of samples in similar studies. Table 14.2 gives an idea of sample sizes used in different marketing research studies. These sample sizes have been determined based on experience and can serve as rough guidelines, particu-larly when non-probability sampling techniques are used.
Finally, the sample size decision should be guided by a consideration of the resource con-straints. In any marketing research project, money and time are limited. The sample size required should be adjusted for the incidence of eligible participants and the completion rate. The quantitative decisions involved in determining the sample size are covered in detail in the next chapter.
Execute the sampling process
Execution of the sampling process requires a detailed specification of how the sampling design decisions with respect to the population, sampling unit, sampling frame, sampling technique and sample size are to be implemented. While individual researchers may know how they are going to execute their sampling process, once more than one individual is involved a specification for execution is needed to ensure that the process is conducted in a consistent manner.
Sample sizeThe number of elements to be included in a study.

418 Marketing Research
For example, if households are the sampling unit, an operational definition of a household is needed. Procedures should be specified for empty housing units and for call-backs in case no one is at home.
Table 14.2
Type of study Minimum size Typical range
Problem identification 500 1,000–2,500 research (e.g. market potential)Problem-solving research 200 300–500 (e.g. pricing)Product tests 200 300–500Test marketing studies 200 300–500TV, radio, print or online advertising 150 200–300 (per advertisement tested)Test-market audits 10 stores 10–20 storesFocus groups 6 groups 6–12 groups
Usual sample sizes used in marketing research studies
Validate the sample
Sample validation aims to account for sampling frame error by screening the participants in the data collection phase. Participants can be screened with respect to demographic charac-teristics, familiarity, product usage and other characteristics to ensure that they satisfy the criteria for the target population. Screening can eliminate inappropriate elements contained in the sampling frame, but it cannot account for elements that have been omitted. The suc-cess of the validation process depends upon the accuracy of base statistics that describe the structure of a target population.
Once data are collected from a sample, comparisons between the structure of the sample and the target population should be made, as practised in the following example. Once data have been collected and it is found that the structure of a sample does not match the target population, a weighting scheme can be used (this is discussed in Chapter 19).
Real research How consumers are affected by online banking layouts12
A study was conducted to examine banking store layout effects on consumer behaviour. The target population for this study was adult heavy internet users who used either offline or online banking services in Greece. Three versions of a web banking store were developed and tested. Two of the layout types were transformed from conventional banking and one type was designed by incorporating users’ preferences and sugges-tions. The study was conducted in three phases. Phase 1 involved a series of semi-structured in-depth interviews with design experts from four major multinational banks in Greece. Phase 2 involved a series of focus groups with banking users and heavy online shoppers to evaluate requirements as far as the most preferred layout type was con-cerned. Phase 3 consisted of a within-group laboratory experiment to test three alterna-tive versions of a virtual e-banking store. Sample validation was conducted, enabling the researchers to demonstrate that the sample used satisfied the population criteria. Vali-dation was further strengthened as participants were further questioned upon comple-tion of their questionnaires in a semi-structured face-to-face interview conducted by the experiment’s administrator.

419Chapter 14 Sampling: design and procedures
A classification of sampling techniques
Sampling techniques may be broadly classified as non-probability and probability (see Figure 14.2). Non-probability sampling relies on the personal judgement of the researcher rather than on chance to select sample elements. The researcher can arbitrarily or consciously decide which elements to include in the sample. Non-probability samples may yield good esti-mates of the population characteristics, but they do not allow for objective evaluation of the precision of the sample results. Because there is no way of determining the probability of select-ing any particular element for inclusion in the sample, the estimates obtained are not statistically projectable to the population. Commonly used non-probability sampling techniques include convenience sampling, judgemental sampling, quota sampling and snowball sampling.
In probability sampling, sampling units are selected by chance. It is possible to pre-specify every potential sample of a given size that could be drawn from the population, as well as the probability of selecting each sample. Every potential sample need not have the same probability of selection, but it is possible to specify the probability of selecting any particular sample of a given size. This requires not only a precise definition of the target population, but also a general specification of the sampling frame. Because sample elements are selected by chance, it is possible to determine the precision of the sample estimates of the characteristics of interest. Confidence intervals, which contain the true population value with a given level of certainty, can be calculated. This permits the researcher to make infer-ences or projections about the target population from which the sample was drawn. Classifi-cation of probability sampling techniques is based on:
• element versus cluster sampling;
• equal unit probability versus unequal probabilities;
• unstratified versus stratified selection;
• random versus systematic selection;
• one-stage versus multistage techniques.
All possible combinations of these five aspects result in 32 different probability sampling techniques. Of these techniques, we consider simple random sampling, systematic sampling,
Non-probability samplingSampling techniques that do not use chance selection procedures but rather rely on the personal judgement of the researcher.
Probability samplingA sampling procedure in which each element of the population has a fixed probabilistic chance of being selected for the sample.
Confidence intervalsThe range into which the true population parameter will fall, assuming a given level of confidence.
Figure 14.2
A classification of sampling techniques
Strati�edsampling
Systematicsampling
Clustersampling
Other samplingtechniques
Quotasampling
Judgementalsampling
Conveniencesampling
Snowballsampling
Non-probabilitysampling
techniques
Probabilitysampling
techniques
Samplingtechniques
Simple randomsampling

420 Marketing Research
stratified sampling and cluster sampling in depth and briefly touch on some others. First, however, we discuss non-probability sampling techniques.
Non-probability sampling techniques
Figure 14.3 presents a graphical illustration of the various non-probability sampling tech-niques. The population consists of 25 elements and we have to select a sample of size 5: A, B, C, D and E represent groups and can also be viewed as strata or clusters.
Convenience sampling
Convenience sampling attempts to obtain a sample of convenient elements. The selection of sampling units is left primarily to the interviewer. Often, participants are selected because they happen to be in the right place at the right time. Examples of convenience sampling include: (1) use of students, religious groups and members of social organisations; (2) street
Convenience samplingA non-probability sampling technique that attempts to obtain a sample of convenient elements. The selection of sampling units is left primarily to the interviewer.
Figure 14.3
A graphical illustration of non-probability sampling techniques
Group D happens to assemble at a convenient timeand place. So all the elements in this group areselected. The resulting sample consists of elements16, 17, 18, 19 and 20. Note that no elements areselected from groups A, B, C or E
A graphical illustration of non-probability techniques1 Convenience sampling
A B C D E
1 6 11 16 21 2 7 12 17 22 3 8 13 18 23 4 9 14 19 24 5 10 15 20 25
The researcher considers groups B, C and E to betypical and convenient. Within each of these groupsone or two elements are selected based on typicalityand convenience. The resulting sample consists ofelements 8, 10, 11, 13 and 24. Note that noelements are selected from groups A and D
2 Judgemental sampling
A B C D E
1 6 11 16 21 2 7 12 17 22 3 8 13 18 23 4 9 14 19 24 5 10 15 20 25
A quota of one element from each group, A to E, isimposed. Within each group, one element is selectedbased on judgement or convenience. The resultingsample consists of elements 3, 6, 13, 20 and 22.Note that one element is selected from each columnor group
3 Quota sampling
A B C D E
1 6 11 16 21 2 7 12 17 22 3 8 13 18 23 4 9 14 19 24 5 10 15 20 25
Elements 2 and 9 are selected randomly from groupsA and B. Element 2 refers elements 12 and 13.Element 9 refers element 18. The resulting sampleconsists of elements 2, 9, 12, 13 and 18. Note thatno element is selected from group E
4 Snowball sampling
A B C D E
1 6 11 16 21 2 7 12 17 22 3 8 13 18 23 4 9 14 19 24 5 10 15 20 25
RandomSelection Referrals

421Chapter 14 Sampling: design and procedures
interviews without qualifying the participants; (3) some forms of online and email surveys; (4) tear-out questionnaires included in a newspaper or magazine; and (5) journalists inter-viewing ‘people on the street’, or on radio or TV shows.13
Convenience sampling is the least expensive and least time-consuming of all sampling techniques. The sampling units are accessible, easy to measure and cooperative. Despite these advantages, this form of sampling has serious limitations. Many potential sources of selection bias are present, including participant self-selection. Convenience samples are not representa-tive of any definable population.14 Hence, it is not theoretically meaningful to generalise any population from a convenience sample, and convenience samples are not appropriate for mar-keting research projects involving population inferences. Convenience samples are not rec-ommended for descriptive or causal research, but they can be used in exploratory research for generating ideas, insights or hypotheses. Convenience samples can be used for pre-testing questionnaires, or pilot studies. Even in these cases, caution should be exercised in interpret-ing the results. Nevertheless, this technique is sometimes used even in large surveys. For example, in the following case, samples ranging in size from 200 to 1,500 were selected to represent visitors to different Olympic Games. With no means to validate these samples, how confident would you be in using these findings to represent all of the visitors?
Real research Olympic convenience15
The International Olympic Committee (IOC) (www.olympic.org) used surveys at the 2000 Olympic Games in Sydney to find out what visitors thought about the level of com-mercialism in Sydney. One survey was given to a convenience sample of 200 visitors to the Games and they were asked about the level of commercialism they find appropriate, whether they thought the event was too commercial and whether company sponsor-ship of the games was perceived to be positive. The survey, conducted by Performance Research (www.performanceresearch.com), revealed that 77% of the visitors found the presence of large corporations such as Coca-Cola and McDonald’s to be appropriate. Furthermore, 88% of the visitors thought the sponsors contributed to the Olympics pos-itively. Performance Research continued its study of Olympic sponsorship by conduct-ing 300 on-site, 900 telephone and 1,500 online surveys using convenience samples in conjunction with the 2002 Winter Olympics in Salt Lake City, Utah. The results with respect to companies’ sponsorship and involvement in the Olympics were again posi-tive. A survey was also conducted at the 2004 Olympics in Athens to assess spectators’ satisfaction with the Games. A convenience sample of 1,024 persons (46% Greeks, 13% Americans and the rest different nationalities) was used and the results indicated an overwhelming seal of approval for the Olympic Games in Athens. Surveys based on con-venience samples were also conducted for the 2008 Olympics in Beijing. According to a survey by Survey Sampling International (www.surveysampling.com), more than 80% of Chinese citizens agreed that having the 2008 Olympic Games held in their country strengthened people’s participation in sports activities.
Judgemental sampling
Judgemental sampling is a form of convenience sampling in which the population elements are selected based on the judgement of the researcher. The researcher, exercising judgement or expertise, chooses the elements to be included in the sample because it is believed that they are representative of the population of interest, or are otherwise appropriate, as illus-trated in the following example.
Judgemental samplingA form of convenience sampling in which the population elements are purposely selected based on the judgement of the researcher.

422 Marketing Research
Common examples of judgemental sampling include: (1) test markets selected to deter-mine the potential of a new product; (2) purchasing professionals selected in business-to-business marketing research because they are considered to be representative of particular companies; (3) product testing with individuals who may be particularly fussy or who hold extremely high expectations; (4) expert witnesses used in court; and (5) boutiques or fashion flagship stores selected to test a new merchandising display system.
Judgemental sampling is inexpensive, convenient and quick, yet it does not allow direct generalisations to a specific population, usually because the population is not defined explic-itly. Judgemental sampling is subjective and its value depends entirely on the researcher’s judgement, expertise and creativity. It can be useful if broad population inferences are not required. Judgemental samples are frequently used in business-to-business marketing research projects, given that in many projects the target population is relatively small (see Chapter 29).
Quota sampling
Quota sampling may be viewed as two-stage restricted judgemental sampling that has traditionally been associated with street interviewing. It is now used extensively, and with much debate, in drawing samples from access panels.17 The first stage consists of develop-ing control characteristics, or quotas, of population elements such as age or gender. To develop these quotas, the researcher lists relevant control characteristics and determines the distribution of these characteristics in the target population, such as Males 48%, Females 52% (resulting in 480 men and 520 women being selected in a sample of 1,000 participants). Often, the quotas are assigned so that the proportion of the sample ele-ments possessing the control characteristics is the same as the proportion of population elements with these characteristics. In other words, the quotas ensure that the composition of the sample is the same as the composition of the population with respect to the charac-teristics of interest.
In the second stage, sample elements are selected based on convenience or judgement. Once the quotas have been assigned, there is considerable freedom in selecting the elements to be included in the sample. The only requirement is that the elements selected fit the con-trol characteristics.18 This technique is illustrated with the following example.
Quota samplingA non-probability sampling technique that is a two-stage restricted judgemental sampling. The first stage consists of developing control categories or quotas of population elements. In the second stage, sample elements are selected based on convenience or judgement.
Real research Establishing marketing relationships in the advertising agency business16
For long-term success, relationships must be nurtured and developed between a client and an advertising agency. There are numerous advantages that such relationships can bring to both sides, including transaction cost savings, strengthening competitive or col-laborative advantages and achieving growth in exchange volume. A Slovenian study explored how partnerships between clients and advertising agencies develop into long-term relationships. A questionnaire was tested on a small sample of agency experts, marketing academics and agency clients. The starting point for the sample was a list of 300 leading Slovenian enterprises according to revenues and/or profits, out of which a judgemental sample of 200 main advertisers was drawn. Participants were marketing managers and other managers, selected by title, responsible for decision making with regard to their cooperation with advertising agencies. Revenues of companies in the sample ranged from €60 to €485 million. The sample included the vast majority of advertisers from the area, plus subsidiaries of international companies, and was seen as representative of advertisers among leading Slovenian enterprises.

423Chapter 14 Sampling: design and procedures
In this example, quotas were assigned such that the composition of the sample mirrored the population. In certain situations, however, it is desirable either to under- or over-sample elements with certain characteristics. To illustrate, it may be desirable to over-sample heavy users of a product so that their behaviour can be examined in detail. Although this type of sample is not representative, nevertheless it may be very relevant to allow a particular group of individuals to be broken down into subcategories and analysed in depth.
Even if the sample composition mirrors that of the population with respect to the control characteristics, there is no assurance that the sample is representative. If a characteristic that is relevant to the problem is overlooked, the quota sample will not be representative. Rele-vant control characteristics are often omitted because there are practical difficulties associ-ated with including certain control characteristics. For example, suppose a sample was sought that was representative of the different strata of socio-economic classes in a popula-tion. Imagine street interviewers approaching potential participants who they believe would fit into the quota they have been set. Could interviewers ‘guess’ (from their clothes, acces-sories, posture?) which potential participants fit into different socio-economic classes, in the same way that they may guess the gender and age of participants? The initial questions of a street interview could establish the characteristics of potential participants to see whether they fit a set quota. But given the levels of non-response and ineligibility found by such an approach, this is not an ideal solution.
Real research How is epilepsy perceived?
A study was undertaken by the Scottish Epilepsy Association to determine the percep-tions of the condition of epilepsy by the adult population in the Scottish city of Glasgow. A quota sample of 500 adults was selected. The control characteristics were gender, age and propensity to donate to a charity. Based on the composition of the adult population of the city, the quotas assigned were as follows:
Propensity to donate Male 48% Female 52%
Have a flag No flag Have a flag No flag Totals
Age 50% 50% 50% 50%
18 to 30 25% 30 30 33 32 12531 to 45 40% 48 48 52 52 20046 to 60 15% 18 18 19 20 75Over 60 20% 24 24 26 26 100Totals 120 120 130 130Totals 240 260 500
Note that the percentages of gender and age within the target population were taken from local census statistics. The percentages of ‘propensity to donate’ could not be gleaned from secondary data sources and so were split on a 50/50 basis. The interviews were conducted on a Saturday when it was customary to see charity ‘flag sellers’ operat-ing. One of the hypotheses to be tested in the study was the extent to which those who donated to charities on flag days were more aware of the condition of epilepsy and how to treat epileptic sufferers. Thus the instruction to interviewers was to split interviews between those who wore the ‘flag’ that they had bought from a street collector and those who had not bought a flag. It was recognised that this was a crude measure of propensity to donate to a charity but was the only tangible clue that could be consist-ently observed.

424 Marketing Research
Because the elements within each quota are selected based on convenience or judge-ment, many sources of selection bias are potentially present. The interviewers may go to selected areas where eligible participants are more likely to be found. Likewise, they may avoid people who look unfriendly, or are not well dressed, or those who live in undesirable locations. Quota sampling does not permit assessment of sampling error.19 Quota sam-pling attempts to obtain representative samples at a relatively low cost. Its advantages are the lower costs and greater convenience to the interviewers in selecting elements for each quota. Under certain conditions, quota sampling obtains results close to those for conven-tional probability sampling.20
Snowball sampling
In snowball sampling, an initial group of participants is selected, sometimes on a random basis but more typically targeted at a few individuals who are known to possess the desired characteristics of the target population. After being interviewed, these participants are asked to identify others who also belong to the target population of interest. Subsequent partici-pants are selected based on the referrals. By obtaining referrals from referrals, this process may be carried out in waves, thus leading to a snowballing effect. Even though probability sampling can be used to select the initial participants, the final sample is a non-probability sample. The referrals will have demographic and psychographic characteristics more similar to the persons referring them than would occur by chance.21
The main objective of snowball sampling is to estimate characteristics that are rare in the wider population. Examples include: users of particular government or social services, such as parents who use nurseries or child minders, whose names cannot be revealed; special cen-sus groups, such as widowed males under 35; and members of a scattered minority ethnic group. Another example is research in industrial buyer–seller relationships, using initial con-tacts to identify buyer–seller pairs and then subsequent ‘snowballed’ pairs. The major advan-tage of snowball sampling is that it substantially increases the likelihood of locating the desired characteristic in the population. It also results in relatively low sampling variance and costs.22 Snowball sampling is illustrated by the following example.
Snowball samplingA non-probability sampling technique in which an initial group of participants is selected randomly. Subsequent participants are selected based on the referrals or information provided by the initial participants. By obtaining referrals from referrals, this process may be carried out in waves.
Real research Sampling horse owners
Dalgety Animal Feeds wished to question horse owners about the care and feeding of their horses. The firm could not locate any sampling frame that listed all horse owners, with the exception of registers of major racing stables. However, the firm wished to con-tact owners who had one or two horses as it believed this group was not well under-stood and held great marketing potential. The initial approach involved locating interviewers at horse feed outlets. The interviewers ascertained basic characteristics of horse owners but, more importantly, they invited them along to focus groups. When the focus groups were conducted, issues of horse care and feeding were developed in greater detail to allow the construction of a meaningful postal questionnaire. As a rap-port and trust was built up with those who attended the focus groups, names as referrals were given that allowed a sampling frame for the first wave of participants to the subse-quent postal survey. The process of referrals continued, allowing a total of four waves and a response of 800 questionnaires.
In this example, note the non-random selection of the initial group of participants through focus group invitations. This procedure was more efficient than random selection, which given the absence of an appropriate sampling frame would be very cumbersome. In other

425Chapter 14 Sampling: design and procedures
cases where an appropriate sampling frame exists (appropriate in terms of identifying the desired characteristics in a number of participants, not in terms of being exhaustive – if it were exhaustive, a snowball sample would not be needed), random selection of participants through probability sampling techniques may be more appropriate.
Probability sampling techniques
Probability sampling techniques vary in terms of sampling efficiency. Sampling efficiency is a concept that reflects a trade-off between sampling cost and precision. Precision refers to the level of uncertainty about the characteristic being measured. Precision is inversely related to sampling errors but positively related to cost. The greater the precision, the greater the cost, and most studies require a trade-off. The researcher should strive for the most efficient sampling design, subject to the budget allocated. The efficiency of a probability sampling technique may be assessed by comparing it with that of simple random sampling. Figure 14.4
Figure 14.4
A graphical illustration of probability sampling techniques
Select �ve random numbers from 1 to 25. Theresulting sample consists of population elements3, 7, 9, 16 and 24. Note that there is no elementfrom group C
A graphical illustration of probability sampling techniques1 Simple random sampling
A B C D E
1 6 11 16 21 2 7 12 17 22 3 8 13 18 23 4 9 14 19 24 5 10 15 20 25
Select a random number between 1 and 5, say 2.The resulting sample consists of a population 2,(2 + 5) = 7, (2 + 5 x 2) = 12, (2 + 5 x 3) = 17and (2 + 5 x 4) = 22. Note that all the elementsare selected from a single row
2 Systematic sampling
A B C D E
1 6 11 16 21 2 7 12 17 22 3 8 13 18 23 4 9 14 19 24 5 10 15 20 25
Randomly select a number from 1 to 5 from eachstratum, A to E. The resulting sample consists ofpopulation elements 4, 7, 13, 19 and 21. Notethat one element is selected from each column
3 Strati�ed sampling
A B C D E
1 6 11 16 21 2 7 12 17 22 3 8 13 18 23 4 9 14 19 24 5 10 15 20 25
Randomly select three clusters, B, D and E. Withineach cluster, randomly select one or two elements.The resulting sample consists of population elements7, 18, 20, 21 and 23. Note that no elements areselected from clusters A and C
4 Cluster sampling (two-stage)
A B C D E
1 6 11 16 21 2 7 12 17 22 3 8 13 18 23 4 9 14 19 24 5 10 15 20 25

426 Marketing Research
presents a graphical illustration of the various probability sampling techniques. As in the case of non-probability sampling, the population consists of 25 elements and we have to select a sample of size 5; A, B, C, D and E represent groups and can also be viewed as strata or clusters.
Simple random sampling
In simple random sampling (SRS), each element in the population has a known and equal probability of selection. Furthermore, each possible sample of a given size (n) has a known and equal probability of being the sample actually selected. This implies that every element is selected independently of every other element. The sample is drawn by a random proce-dure from a sampling frame. This method is equivalent to a lottery system in which names are placed in a container, the container is shaken and the names of the winners are then drawn out in an unbiased manner.
To draw a simple random sample, the researcher first compiles a sampling frame in which each element is assigned a unique identification number. Then random numbers are generated to determine which elements to include in the sample. The random numbers may be generated with a computer routine or a table. Suppose that a sample of size 10 is to be selected from a sampling frame containing 800 elements. This could be done by starting with row 1 and col-umn 1 of Table 1, considering the three rightmost digits, and going down the column until 10 numbers between 1 and 800 have been selected. Numbers outside this range are ignored. The elements corresponding to the random numbers generated constitute the sample. Thus, in our example, elements 480, 368, 130, 167, 570, 562, 301, 579, 475 and 553 would be selected. Note that the last three digits of row 6 (921) and row 11 (918) were ignored, because they were out of range. Using these tables is fine for small samples, but can be very tedious. A more pragmatic solution is to turn to random-number generators in most data analysis pack-ages. For example, in Excel, the Random Number Generation Analysis Tool allows you to set a number of characteristics of your target population, including the nature of distribution of the data, and to create a table of random numbers on a separate worksheet.
SRS has many desirable features. It is easily understood and the sample results may be projected to the target population. Most approaches to statistical inference assume that the data have been collected by SRS. However, SRS suffers from at least four significant limita-tions. First, it is often difficult to construct a sampling frame that will permit a simple ran-dom sample to be drawn. Second, SRS can result in samples that are very large or spread over large geographical areas, thus increasing the time and cost of data collection. Third, SRS often results in lower precision with larger standard errors than other probability sam-pling techniques. Fourth, SRS may or may not result in a representative sample. Although samples drawn will represent the population well on average, a given simple random sample may grossly misrepresent the target population. This is more likely if the size of the sample is small. For these reasons, SRS is not widely used in marketing research,23 though there are exceptions, as illustrated in the following example.
Simple random sampling (SRS)A probability sampling technique in which each element has a known and equal probability of selection. Every element is selected independently of every other element, and the sample is drawn by a random procedure from a sampling frame.
Real research An attitudinal segmentation of parents and young people24
In the UK, the Department of Education (https://www.gov.uk/government/organisations/department-for-education) was looking for more effective ways to understand its key audiences of parents and carers and children and young people. Its Customer Insight Unit (CIU) identified a need for a robust quantitative segmentation study that gave it a better understanding of underlying attitudes and values of its audiences. It felt that such a study could be used for policy and communications development across a range of issues. Specifically, the aims of the segmentation were to enable staff and stakeholders

427Chapter 14 Sampling: design and procedures
Systematic sampling
In systematic sampling, the sample is chosen by selecting a random starting point and then picking every ith element in succession from the sampling frame.25 The sampling interval, i, is determined by dividing the population size N by the sample size n and rounding to the nearest whole number. For example, there are 100,000 elements in the population and a sam-ple of 1,000 is desired. In this case, the sampling interval, i, is 100. A random number between 1 and 100 is selected. If, for example, this number is 23, the sample consists of elements 23, 123, 223, 323, 423, 523 and so on.26
Systematic sampling is similar to SRS in that each population element has a known and equal probability of selection. It is different from SRS, however, in that only the permissible samples of size n that can be drawn have a known and equal probability of selection. The remaining samples of size n have a zero probability of being selected. For systematic sam-pling, the researcher assumes that the population elements are ordered in some respect. In some cases, the ordering (e.g. alphabetical listing in a telephone book) is unrelated to the characteristic of interest. In other instances, the ordering is directly related to the characteris-tic under investigation. For example, credit-card customers may be listed in order of out-standing balance, or firms in a given industry may be ordered according to annual sales. If the population elements are arranged in a manner unrelated to the characteristic of interest, systematic sampling will yield results quite similar to SRS.
On the other hand, when the ordering of the elements is related to the characteristic of interest, systematic sampling increases the representativeness of the sample. If firms in an industry are arranged in increasing order of annual sales, a systematic sample will include some small and some large firms. A simple random sample may be unrepresentative because it may contain, for example, only small firms or a disproportionate number of small firms. If the ordering of the elements produces a cyclical pattern, systematic sampling may decrease
Systematic samplingA probability sampling technique in which the sample is chosen by selecting a random starting point and then picking every ith element in succession from the sampling frame.
to: think about parents and young people in a new way (as an alternative to demo-graphics), uncovering new ‘target groups’ and issues that required action; identify new insights affecting families; provide insights to guide communications with dif-ferent groups; and identify knowledge gaps and new areas for further research. Researchers developed the National Sur-vey of Parents and Children, using qualita-tive findings to inform their questionnaire design fully. They wished to collect a robust, nationally representative dataset of the various types of parenting conduct and parent-ing values. To capture both sides of the parent–child relationship, the survey needed a linked sample of parents and children belonging to the same household. In order to achieve this the researchers selected random addresses in England, drawn from the Postcode Address File. Parents of children aged 19 or under were randomly chosen from those households for an adult interview, and asked about their relationship with one of their children. Then a selected child (as long as they were resident in the household and over the age of 10) was invited for the child interview. The ‘link’ connecting the adult to the child added a vital extra dimension to the analysis and segmentations, while the random probability sampling approach ensured that all sections of society were repre-sented: fathers as well as mothers from all social backgrounds, with various levels of parenting experience, as well as dependent children of all ages.
Lord
Kel
vin

428 Marketing Research
the representativeness of the sample. To illustrate, consider the use of systematic sampling to generate a sample of monthly sales from the Harrods luxury department store in London. In such a case, the sampling frame could contain monthly sales for the last 60 years or more. If a sampling interval of 12 were chosen, the resulting sample would not reflect the month-to-month and seasonal variations in sales.27
Systematic sampling is less costly and easier than SRS because random selection is done only once to establish a starting point. Moreover, random numbers do not have to be matched with individual elements as in SRS. Because some lists contain millions of elements, consid-erable time can be saved, which reduces the costs of sampling. If information related to the characteristic of interest is available for the population, systematic sampling can be used to obtain a more representative and reliable (lower sampling error) sample than SRS. Another relative advantage is that systematic sampling can even be used without knowledge of the elements of the sampling frame. For example, every ith person accessing a website, leaving a shop or passing a point in the street can be intercepted (provided very strict control of the flow of potential participants is exercised). For these reasons, systematic sampling is often employed in online surveys, postal, telephone and street interviews, as illustrated by the fol-lowing example.
Real research Service quality expectations of Hong Kong Chinese shoppers28
Global retailers in the last century have focused on the presumed similarities of consumers across borders, and used the management of product novelty or new-ness to attract foreign customers. When novelty and newness fades, however, suc-cess moves to a dependence on under-standing differences among consumers in different cultures. A study examined how cultural differences affected retail customers’ service-quality perception in a cultural context distinctly different from Western culture – the Hong Kong Chinese retail super-market. The key research objective was to examine underlying service-quality dimen-sions of experienced shoppers in two supermarkets. The population was defined as all Chinese shoppers who had previously shopped in the selected Park’N Shop and Well-come stores. The sample was a systematic sample using a random start with the selec-tion of Chinese shoppers occurring as they approached the stores. Each potential participant was qualified by being asked if they had previously shopped at the store, with an alternative line of questionning if they did not qualify. A total of 100 interviews were completed at each of four stores for a total of 400 completed interviews.
Lord
Kel
vin
Stratified sampling
Stratified sampling is a two-step process in which the population is partitioned into sub-populations, or strata. The strata should be mutually exclusive and collectively exhaustive in that every population element should be assigned to one and only one stratum and no population elements should be omitted. Next, elements are selected from each stratum by a random procedure, usually SRS. Technically, only SRS should be employed in selecting the elements from each stratum. In practice, sometimes systematic sampling and other probability sampling procedures are employed. Stratified sampling differs from quota sampling in that the sample elements are selected probabilistically rather than based on
Stratified samplingA probability sampling technique that uses a two-step process to partition the population into subsequent subpopulations, or strata. Elements are selected from each stratum by a random procedure.

429Chapter 14 Sampling: design and procedures
convenience or judgement. A major objective of stratified sampling is to increase preci-sion without increasing cost.29
The variables used to partition the population into strata are referred to as stratification variables. The criteria for the selection of these variables consist of homogeneity, heteroge-neity, relatedness and cost. The elements within a stratum should be as homogeneous as possible, but the elements in different strata should be as heterogeneous as possible. The stratification variables should also be closely related to the characteristic of interest. The more closely these criteria are met, the greater the effectiveness in controlling extraneous sampling variation. Finally, the variables should decrease the cost of the stratification pro-cess by being easy to measure and apply. Variables commonly used for stratification include demographic characteristics (as illustrated in the example for quota sampling), type of cus-tomer (e.g. credit card versus non-credit card), size of firm, or type of industry. It is possible to use more than one variable for stratification, although more than two are seldom used because of pragmatic and cost considerations. Although the number of strata to use is a mat-ter of judgement, experience suggests the use of no more than six. Beyond six strata, any gain in precision is more than offset by the increased cost of stratification and sampling.
Another important decision involves the use of proportionate or disproportionate sam-pling. In proportionate stratified sampling, the size of the sample drawn from each stratum is proportionate to the relative size of that stratum in the total population. In disproportionate stratified sampling, the size of the sample from each stratum is proportionate to the relative size of that stratum and to the standard deviation of the distribution of the characteristic of interest among all the elements in that stratum. The logic behind disproportionate sampling is simple. First, strata with larger relative sizes are more influential in determining the popu-lation mean, and these strata should also exert a greater influence in deriving the sample estimates. Consequently, more elements should be drawn from strata of larger relative size. Second, to increase precision, more elements should be drawn from strata with larger stand-ard deviations and fewer elements should be drawn from strata with smaller standard devia-tions. (If all the elements in a stratum are identical, a sample size of one will result in perfect information.) Note that the two methods are identical if the characteristic of interest has the same standard deviation within each stratum.
Disproportionate sampling requires that some estimate of the relative variation, or stand-ard deviation of the distribution of the characteristic of interest, within strata be known. As this information is not always available, the researcher may have to rely on intuition and logic to determine sample sizes for each stratum. For example, large fashion stores might be expected to have greater variation in the sales of some products as compared with small bou-tiques. Hence, the number of large stores in a sample may be disproportionately large. When the researcher is primarily interested in examining differences between strata, a common sampling strategy is to select the same sample size from each stratum.
Stratified sampling can ensure that all the important subpopulations are represented in the sample. This is particularly important if the distribution of the characteristic of interest in the population is skewed. For example, very few households have annual incomes that allow them to own a second home overseas. If a simple random sample is taken, households that have a second home overseas may not be adequately represented. Stratified sampling would guarantee that the sample contains a certain number of these households. Stratified sampling combines the simplicity of SRS with potential gains in precision and is, therefore, a popular sampling technique.
Cluster sampling
In cluster sampling, the target population is first divided into mutually exclusive and col-lectively exhaustive subpopulations, or clusters. These subpopulations or clusters are assumed to contain the diversity of participants held in the target population. A random sample of clusters is selected, based on a probability sampling technique such as SRS. For each selected cluster, either all the elements are included in the sample or a sample of
Cluster samplingA two-step probability sampling technique where the target population is first divided into mutually exclusive and collectively exhaustive subpopulations called clusters, and then a random sample of clusters is selected based on a probability sampling technique such as SRS. For each selected cluster, either all the elements are included in the sample, or a sample of elements is drawn probabilistically.

430 Marketing Research
Figure 14.5
Types of cluster sampling
Simple clustersampling
Probability-proportionate-
to-size sampling
One-stagesampling
Multi-stagesampling
Cluster sampling
Two-stagesampling
elements is drawn probabilistically. If all the elements in each selected cluster are included in the sample, the procedure is called one-stage cluster sampling. If a sample of elements is drawn probabilistically from each selected cluster, the procedure is two-stage cluster sampling. As shown in Figure 14.5, two-stage cluster sampling can be either simple two-stage cluster sampling involving SRS, or probability-proportionate-to-size sampling. Furthermore, a cluster sample can have multiple (more than two) stages, as in multi-stage cluster sampling.
The key distinction between cluster sampling and stratified sampling is that in cluster sampling only a sample of subpopulations (clusters) is chosen, whereas in stratified sampling all the subpopulations (strata) are selected for further sampling. The objectives of the two methods are also different. The objective of cluster sampling is to increase sampling effi-ciency by decreasing costs, but the objective of stratified sampling is to increase precision. With respect to homogeneity and heterogeneity, the criteria for forming clusters are just the opposite of those for strata. Elements within a cluster should be as heterogeneous as possi-ble, but clusters themselves should be as homogeneous as possible. Ideally, each cluster should be a small-scale representation of the population. In cluster sampling, a sampling frame is needed only for those clusters selected for the sample. The differences between stratified sampling and cluster sampling are summarised in Table 14.3.
A common form of cluster sampling is area sampling, in which the clusters consist of geographical areas, such as counties, housing districts or residential blocks. If only one level of sampling takes place in selecting the basic elements (e.g. if the researcher samples blocks
Area samplingA common form of cluster sampling in which the clusters consist of geographical areas such as counties, housing tracts, blocks or other area descriptions.
Table 14.3
Factor Stratified sampling Cluster sampling (one stage)
Objective Increase precision Decrease costSubpopulations All strata are included A sample of clusters is chosenWithin subpopulations Each stratum should be homogeneous Each cluster should be heterogeneousAcross subpopulations Strata should be heterogeneous Clusters should be homogeneousSampling frame Needed for the entire population Needed only for the selected clustersSelection of elements Elements selected from each stratum
randomlyAll elements from each selected cluster are included
Differences between stratified and cluster sampling

431Chapter 14 Sampling: design and procedures
and then all the households within the selected blocks are included in the sample), the design is called one-stage area sampling. If two or more levels of sampling take place before the basic elements are selected (if the researcher samples blocks and then samples households within the sampled blocks), the design is called two-stage (or multi-stage) area sampling. The distinguishing feature of one-stage area sampling is that all the households in the selected blocks (or geographical areas) are included in the sample.
There are two types of two-stage cluster sampling designs, as shown in Figure 14.5. Sim-ple two-stage cluster sampling involves SRS at the first stage (e.g. sampling blocks) as well as the second stage (e.g. sampling households within blocks). In this design the fraction of elements (e.g. households) selected at the second stage is the same for each sample cluster (e.g. selected blocks). This process was administered in a project that investigated the behav-iour of high net worth consumers. A simple random sample of 800 block groups was selected from a listing of neighbourhoods with average incomes exceeding €35,000 in locations ranked in the top half by income according to census data. Commercial database companies supplied head-of-household names for approximately 95% of the census-tabulated homes in the 800 block groups. From the 213,000 enumerated households, 9,000 were selected by SRS.30
This design is appropriate when the clusters are equal in size; that is, when the clusters contain approximately the same number of sampling units. If they differ greatly in size, how-ever, simple two-stage cluster sampling can lead to biased estimates. Sometimes the clusters can be made of equal size by combining clusters. When this option is not feasible, probability-proportionate-to-size (PPS) sampling can be used.
In the sampling method probability proportionate to size (PPS), the size of a cluster is defined in terms of the number of sampling units within that cluster. Thus, in the first stage, large clusters are more likely to be included than small clusters. In the second stage, the probability of selecting a sampling unit in a selected cluster varies inversely with the size of the cluster. Thus, the probability that any particular sampling unit will be included in the sample is equal for all units, because the unequal first-stage probabilities are balanced by the unequal second-stage probabilities. The numbers of sampling units included from the selected clusters are approximately equal. This type of multi-stage sampling is presented in the following example.
Probability proportionate to size (PPS)A selection method where the probability of selecting a sampling unit in a selected cluster varies inversely with the size of the cluster. Therefore, the size of all the resulting clusters is approximately equal.
Real research Teleuse on a shoestring31
In the telecommunications industries, com-panies are beginning to understand the needs of low-income consumers – adapting their products and business models to bet-ter serve their needs. Many commentators predict that the low-income, developing markets will be where new telecom growth will come from. A study addressing the needs of these consumers was conducted in five Asian countries, namely Pakistan, India, Sri Lanka, Philippines and Thailand. Given the necessity for cross-country compari-sons among the less privileged strata of society, the target groups had to be defined as close as possible in a universal manner. Target participants of the study were tele-com users, defined as those who had used a phone (their own or someone else’s; paid for or free of charge) during the preceding three months. Participants were males and females between the ages of 18 and 60 years, from rural and urban locations. A multi-stage stratified cluster sampling by probability proportionate to size (PPS) was used

432 Marketing Research
Cluster sampling has two major advantages: feasibility and low cost. In many situations the only sampling frames readily available for the target population are clusters, not popula-tion elements. It is often impossible to compile a list of all consumers in a population, given the resources and constraints. Lists of geographical areas, telephone exchanges and other clusters of consumers, however, can be constructed relatively easily. Cluster sampling is the most cost-effective probability sampling technique. This advantage must be weighed against several limitations.32 Cluster sampling results in relatively imprecise samples, and it is dif-ficult to form clusters in which the elements are heterogeneous because, for example, house-holds in a block tend to be similar rather than dissimilar.33 It can be difficult to compute and interpret statistics based on clusters.
Other probability sampling techniques
In addition to the four basic probability sampling techniques, there is a variety of other sam-pling techniques. Most of these may be viewed as extensions of the basic techniques and were developed to address complex sampling problems. Two techniques with some rele-vance to marketing research are sequential sampling and double sampling.
In sequential sampling, the population elements are sampled sequentially, data collec-tion and analysis are done at each stage and a decision is made as to whether additional population elements should be sampled. The sample size is not known in advance, but a decision rule is stated before sampling begins. At each stage, this rule indicates whether sampling should be continued or whether enough information has been obtained. Sequential sampling has been used to determine preferences for two competing alternatives. In one study, participants were asked which of two alternatives they preferred and sampling was terminated when sufficient evidence was accumulated to validate a preference. It has also been used to establish the price differential between a standard model and a deluxe model of a consumer durable.34
In double sampling, also called two-phase sampling, certain population elements are sampled twice. In the first phase, a sample is selected and some information is collected from all the elements in the sample. In the second phase, a subsample is drawn from the original sample and additional information is obtained from the elements in the sub sam-ple. The process may be extended to three or more phases, and the different phases may take place simultaneously or at different times. Double sampling can be useful when no sampling frame is readily available for selecting final sampling units but when the ele-ments of the frame are known to be contained within a broader sampling frame. For example, a researcher wants to select households in a given city that consume apple juice. The households of interest are contained within the set of all households, but the researcher does not know which ones they are. In applying double sampling, the researcher would
Sequential samplingA probability sampling technique in which the population elements are sampled sequentially, data collection and analysis are done at each stage and a decision is made as to whether additional population elements should be sampled.
Double samplingA sampling technique in which certain population elements are sampled twice.
to select the target number of urban and rural centres. After determining the number of centres to be selected from each cell (strata in respective provinces), urban and rural areas were selected again using PPS on a constant population interval on geo-graphically ordered centres within each cell. In each selected centre, a common place such as a road, park, hospital was designated the starting point for contacting house-holds. Only one participant was selected from each household. In households with more than one valid participant, a random-number chart was used to select the par-ticipant. Within each country, data were weighted by gender, province group/zone and socio-economic group to correct over- or under-sampling in certain areas and socio-economic groups.

433Chapter 14 Sampling: design and procedures
obtain a sampling frame of all households in the first phase. This would be constructed from a directory of city addresses. Then a sample of households would be drawn, using systematic random sampling to determine the amount of apple juice consumed. In the second phase, households that consume apple juice would be selected and stratified according to the amount of apple juice consumed. Then a stratified random sample would be drawn and detailed questions regarding apple-juice consumption asked.35
Choosing non-probability versus probability sampling
The choice between non-probability and probability samples should be based on considera-tions such as the nature of the research, relative magnitude of non-sampling versus sampling errors and variability in the population, as well as statistical and operational considerations (see Table 14.4). For example, in exploratory research the judgement of the researcher in selecting participants with particular qualities may be far more effective than any form of probability sampling. On the other hand, in conclusive research where the researcher wishes to use the results to estimate overall market shares or the size of the total market, probability sampling is favoured. Probability samples allow statistical projection of the results to a tar-get population.
For some research problems, highly accurate estimates of population characteristics are required. In these situations, the elimination of selection bias and the ability to calculate sam-pling error make probability sampling desirable. However, probability sampling will not always result in more accurate results. If non-sampling errors are likely to be an important factor, then non-probability sampling may be preferable because the use of judgement may allow greater control over the sampling process.
Another consideration is the homogeneity of the population with respect to the variables of interest. A heterogeneous population would favour probability sampling because it would be more important to secure a representative sample. Probability sampling is preferable from a statistical viewpoint, as it is the basis of most common statistical techniques.
Probability sampling generally requires statistically trained researchers, generally costs more and takes longer than non-probability sampling, especially in the establishment of accurate sampling frames. In many marketing research projects, it is difficult to justify the additional time and expense. Therefore, in practice, the objectives of the study dictate which sampling method will be used.
Table 14.4
FactorsConditions favouring the use of:
Non-probability sampling Probability sampling
Nature of research Exploratory ConclusiveRelative magnitude of sampling and non-sampling errors
Non-sampling errors are larger Sampling errors are larger
Variability in the population Homogeneous (low) Heterogeneous (high)Statistical considerations Unfavourable FavourableOperational considerations Favourable Unfavourable
Choosing non-probability vs. probability sampling

434 Marketing Research
Non-probability sampling is used in concept tests, package tests, name tests and copy tests where projections to the populations are usually not needed. In such studies, interest centres on the proportion of the sample that gives various responses or expresses various attitudes.
Samples for these studies can be drawn using access panels and employing methods such as online surveys, street interviewing and quota sampling. On the other hand, probability sampling is used when there is a need for highly accurate estimates of market share or sales volume for the entire market. National market-tracking studies, which provide information on product category and brand usage rates as well as psychographic and demographic pro-files of users, use probability sampling.
Summary of sampling techniques
The strengths and weaknesses of basic sampling techniques are summarised in Table 14.5. Table 14.6 describes the procedures for drawing probability samples.
Table 14.5
Technique Strengths Weaknesses
Non-probability sampling
Convenience sampling Least expensive, least time-consuming, most convenient
Selection bias, sample not representative, not recommended for descriptive or causal research
Judgemental sampling Low cost, convenient, not time-consuming ideal for exploratory research designs
Does not allow generalisation, subjective
Quota sampling Sample can be controlled for certain characteristics
Selection bias, no assurance of representativeness
Snowball sampling Can estimate rare characteristics Time-consuming
Probability sampling
Simple random sampling (SRS) Easily understood, results projectable Difficult to construct sampling frame, expensive, lower precision, no assurance of representativeness
Systematic sampling Can increase representativeness, easier to implement than SRS, sampling frame not always necessary
Can decrease representativeness depending upon ‘order’ in the sampling frame
Stratified sampling Includes all important subpopulations, precision
Difficult to select relevant stratification variables, not feasible to stratify on many variables, expensive
Cluster sampling Easy to implement, cost effective Imprecise, difficult to compute and interpret results
Strengths and weaknesses of sampling techniques

435Chapter 14 Sampling: design and procedures
Table 14.6
Simple random sampling
1 Select a suitable sampling frame.2 Each element is assigned a number from 1 to N (population size).3 Generate n (sample size) different random numbers between 1 and N using a software package or a table of simple
random numbers. To use a table, select the appropriate number of digits (e.g. if N = 900, select three digits). Arbitrarily select a beginning number. Then proceed up or down until n different numbers between 1 and N have been selected. Discard 0, duplicate numbers and numbers greater than N.
4 The numbers generated denote the elements that should be included in the sample.
Systematic sampling
1 Select a suitable sampling frame.2 Each element is assigned a number from 1 to N (population size).3 Determine the sampling interval i, where i = N/n. If i is a fraction, round to the nearest whole number.4 Select a random number, r, between 1 and i, as explained in simple random sampling.5 The elements with the following numbers will comprise the systematic random sample:
r, r + i, r + 2i, r + 3i, r + 4i, ..., r + (n–1)i
Stratified sampling
1 Select a suitable sampling frame.2 Select the stratification variable(s) and the number of strata, H.3 Divide the entire population into H strata. Based on the classification variable, each element of the population is
assigned to one of the H strata.4 In each stratum, number the elements from 1 to Nh (the population size of stratum h).5 Determine the sample size of each stratum, nh, based on proportionate or disproportionate stratified sampling, where
nh = n
h=1
H
∑6 In each stratum, select a simple random sample of size nh.
Cluster sampling
We describe the procedure for selecting a simple two-stage sample, because this represents the most commonly used general case:1 Assign a number from 1 to N to each element in the population.2 Divide the population into C clusters, of which c will be included in the sample.3 Calculate the sampling interval i, where i = N/c. If i is a fraction, round to the nearest whole number.4 Select a random number, r, between 1 and i, as explained in simple random sampling.5 Identify elements with the following numbers: r, r + i, r + 2i, r + 3i, . . . , r + (c – 1)i.6 Select the clusters that contain the identified elements.7 Select sampling units within each selected cluster based on SRS or systematic sampling. The number of sampling units
selected from each sample cluster is approximately the same and equal to n/c.8 If the population of the cluster exceeds the sampling interval i, that cluster is selected with certainty. That cluster is
removed from further consideration. Calculate the new proportion size, N*, the number of clusters to be selected, c* (= c – 1) and the new sampling interval i*. Repeat this process until each of the remaining clusters has a population less than the relevant sampling interval. If b clusters have been selected with certainty, select the remaining c − b clusters according to steps 1 to 7. The fraction of units to be sampled from each cluster selected with certainty is the overall sampling fraction n/N. Thus, for clusters selected with certainty, we would select ns(n/N)(N1 + N2 + . . . + Nb) units. The units selected from clusters selected under two-stage sampling will therefore be n* = n – ns.
Procedures for drawing probability samples

436 Marketing Research
Issues in sampling across countries and cultures
The ease with which samples can be accessed can vary between, and within, countries. Sam-pling through face-to-face contact can be complex in developing countries that have limited census data or no postcode system. This can demand more training, with senior interviewers versed in sampling design needed to ensure that the sample reflects the desired population. This is especially important in markets with strong population growth and changing classifica-tion of urban areas. In Vietnam, for example, people are quickly moving into urban areas as a result of new wealth-generating opportunities and birth rates remaining high. It should not be assumed that developing countries are simply behind the pace of change in marketing research simply because they have not progressed from ‘door-to-door, pen-and-paper’ interviewing to CATI or online research. While face-to-face interviewing remains important in these markets, it will not be the only method of data collection. Cambodia, for example, has limited fixed-line coverage for telecoms, but it has bypassed the development of fixed-line communications and moved straight to a mobile infrastructure. The situation is the same across Africa and many other developing countries and signifies a different evolution in the development of technology that can be used for data capture in research to that for developed countries.36
Developing an appropriate sampling frame is a difficult task. In many countries, particu-larly developing countries, reliable information about the target population may not be avail-able from secondary sources. Government data may be unavailable or highly biased. Population lists may not be available commercially. The time and money required to compile these lists may be prohibitive. The census data available (even for demographics at house-hold level) in some countries have one or more of the following problems: limited availabil-ity of variables, outdated data, unreliable data, outdated or unavailable maps. Reliable and updated information from the National Economic Census is not necessarily available for business-to-business, agricultural or industrial studies. It is possible to find countries where the information at household level is quite reliable, updated and available online. Mexico, for example, was the first country in the Latin American region to provide this.37
Given the lack of suitable sampling frames, the inaccessibility of certain participants, such as women in some cultures, and the dominance of face-to-face interviewing, probability sampling techniques are uncommon in international marketing research. New modes of data collection, namely email, online, SMS and mobile devices, have necessitated new sampling methods primarily through the use of access panels. With such approaches the validation of survey findings or provision of relevant weighting is not generally feasible, especially in international studies where there may be a lack of valid population data. In international research, the growth of online surveys has caused concern when used with online panels, where sampling is usually based upon non-probability methods. What constitutes an ade-quate sampling frame includes adequate coverage, known probabilities of selection and being up to date. Access panels with adequate sampling frames, adequate selection/recruitment procedures and adequate controls can provide verifiable research findings. However, the American Association for Public Opinion Research38 reported:
The majority of studies comparing results from surveys using non-probability online panels with those using probability-based methods (most often RDD [Random-Digit Dialling] telephone) often report significantly different results on a wide array of behaviour and attitudes.
One common element in almost all panels being evaluated is that the recruitment of the panel members is self-selecting, from either direct contact by potential panel members to a particular panel provider, or after seeing an invitation on certain web pages. Good-quality access panels can be specified and created but there are major challenges in achieving such standards across international markets. This can only be achieved by adequate investment in design, process, IT systems, skills and management control.39

437Chapter 14 Sampling: design and procedures
Real research Accessing panels across the globe40
Cint (www.cint.com) is a Swedish software company that produces and sells online mar-keting research products. Cint developed Direct Sample as an open marketplace plat-form. This enables online research to be conducted by bringing together panel owners and sample buyers. Together they can buy and sell access to over 5 million members of research panels in more than 40 countries. The company has an extensive list of clients and partners spanning most of the large market research groups, media and web-based companies, branding and advertising agencies, plus medium and small research agen-cies and other organisations involved in marketing research. The panels accessed through Cint were built by several major brands, such as Habbo, Bounty and Metro, plus leading research agencies. These brands have strong relationships with their customers so the affinity levels and participant engagement were high. Cint performs quality checks for surveys (language, logic, adherence to the industry standards) for online question-naires coming to the Cint Panel Exchange (Cint’s global marketplace for buyers and sell-ers of samples) from market research professionals, before allowing these surveys to be dispatched to the panels.
Summary Information about the characteristics of a population may be obtained by carrying out either a sample or a census. Budget and time limits, large population size and small variance in the characteristic of interest favour the use of a sample. Sampling is also preferred when the cost of sampling error is low, the cost of non-sampling error is high, the nature of measurement is destructive and attention must be focused on individual cases. The opposite set of conditions favours the use of a census.
Sampling design begins by defining the target population in terms of elements, sam-pling units, extent and time. Then the sampling frame should be determined. A sam-pling frame is a representation of the elements of the target population. It consists of a list of directions for identifying the target population. At this stage, it is important to recognise any sampling frame errors that may exist. The next step involves selecting a sampling technique and determining the sample size. In addition to quantitative anal-ysis, several qualitative considerations should be taken into account in determining the sample size. Execution of the sampling process requires detailed specifications for each step in the sampling process. Finally, the selected sample should be validated by comparing characteristics of the sample with known characteristics of the target population.
Sampling techniques may be classified as non-probability and probability techniques. Non-probability sampling techniques rely on the researcher’s judgement. Conse-quently, they do not permit an objective evaluation of the precision of the sample results, and the estimates obtained are not statistically projectable to the population. The commonly used non-probability sampling techniques include convenience sam-pling, judgemental sampling, quota sampling and snowball sampling.
In probability sampling techniques, sampling units are selected by chance. Each sam-pling unit has a non-zero chance of being selected, and the researcher can pre-specify every potential sample of a given size that could be drawn from the population, as well as the probability of selecting each sample. It is also possible to determine the

438 Marketing Research
precision of the sample estimates and inferences and make projections to the target population. Probability sampling techniques include simple random sampling, sys-tematic sampling, stratified sampling, cluster sampling, sequential sampling and dou-ble sampling. The choice between probability and non-probability sampling should be based on the nature of the research, degree of error tolerance, relative magnitude of sampling and non-sampling errors, variability in the population and statistical and operational considerations.
When conducting marketing research across multiple countries, it is desirable to achieve comparability in sample composition and representativeness, even though this may require the use of different sampling techniques in different countries. The growth of online research has seen a corresponding growth in the use of online panels. Such panels have offered many advantages to researchers wishing to access samples of suf-ficient size and structure from across the globe, quickly and relatively cheaply. Such panels create much debate about representativeness, the challenges of working primar-ily with non-probability samples and the actions required to create probability samples.
Questions 1 Under what conditions would a sample be preferable to a census? A census preferable to a sample?
2 Describe the sampling design process.
3 How should the target population be defined? How does this definition link with the definition of a marketing research problem?
4 What is a sampling unit? How is it different from the population element?
5 To what extent may the availability of sampling frames determine the definition of a population?
6 What qualitative factors should be considered in determining the sample size?
7 How do probability sampling techniques differ from non-probability sampling techniques? What factors should be considered in choosing between probability and non-probability sampling?
8 What is the least expensive and least time-consuming of all sampling techniques? What are the major limitations of this technique?
9 What is the major difference between judgemental and convenience sampling? Give examples of where each of these techniques may be successfully applied.
10 Describe snowball sampling. How may the technique be supported by qualitative research techniques?
11 What are the distinguishing features of simple random sampling?
12 Describe the procedure for selecting a systematic random sample.
13 Describe stratified sampling. What are the criteria for the selection of stratification variables?
14 What are the differences between proportionate and disproportionate stratified sampling?
15 Describe the cluster sampling procedure. What is the key distinction between cluster sampling and stratified sampling?

439Chapter 14 Sampling: design and procedures
Exercises 1 Examine online databases and secondary data sources to determine all of the airlines operating in the EU. If a survey of airlines was conducted to determine their future plans to purchase/lease aircraft, would you take a sample or census? Explain why.
2 Visit www.ralphlauren.com (or your local equivalent) and collect further secondary data and intelligence to obtain information on the segmentation strategy of Ralph Lauren. As the vice president of marketing for Ralph Lauren, what information would you like to support decisions around an idea to launch a new line of unisex shirts in Europe? Imagine that the company had launched these shirts and wanted to determine initial consumer reactions. If non-probability sampling were used, which sampling technique would you recommend and why?
3 The Alumni Office of your university would like to conduct a survey of on-campus students who are in their final year of study. The office wishes to determine attitudes to joining alumni associations as students progress through further study and their careers. As a consultant you must develop a quota sample. What quota variables would you use? Design a quota matrix. Base this matrix upon your chosen variables and the proportions of these variables within your university.
4 You work as the marketing research manager for ING in Amsterdam. Managers would like to know if the attitudes towards saving differ between ethnic groups. They wonder whether, given the varied population of the Netherlands, it is meaningful to segment the market according to ethnic background. A survey is planned. You have been asked to design a sampling plan for this task. Present your plan to a group of students representing the board of ING.
5 In a small group, discuss the following issues: ‘Given that many governments use sampling to check the accuracy of various censuses and that non-response rates to censuses are growing, national decennial censuses should be abolished in favour of the use of existing databases and sample surveys’ and ‘Because non-sampling errors are greater in magnitude than sampling errors, it really does not matter which sampling method is used.’
Notes
1. Feld, K., ‘Women in the world’s Muslim economies: Measuring the effectiveness of empowerment’, ESOMAR Annual Congress, Berlin (September 2007).
2. Kellner, P., ‘Down with random samples’, ResearchWorld (May 2009), 31.
3. Scheffler, H., Zelin, A. and Smith, P., ‘Down with random sampling?’, ResearchWorld (November 2007), 44–5.
4. Kent, R., ‘Rethinking data analysis – part one: The limitations of frequentist approaches’, International Journal of Market Research 51 (1) (2009), 51–69; Semon, T.T., ‘Nonresponse bias affects all survey research’, Marketing News 38 (12) (July 2004), 7; Anon., ‘Random sampling’, Marketing News (16 July 2001), 10; Wilcox, S., ‘Sampling and controlling a TV audience measurement panel’, International Journal of Market Research 42 (4) (Winter 2000), 413–30; Verma, V. and
Le, T., ‘An analysis of sampling errors for the demographic and health surveys’, International Statistical Review 64 (3) (December 1966), 265–94; Assael, H. and Keon, J., ‘Non-sampling vs. sampling errors in sampling research’, Journal of Marketing (Spring 1982), 114–23.
5. Wywial, J.L., ‘Sampling design proportional to order statistic of auxiliary variable’, Statistical Papers 49 (2) (April 2008), 277–89; Huizing, L., van Ossenbruggen, R., Muller, M., van der Wal, C., Gerty, J.L.M. Lensvelt-Mulders and Hubregtse, M., ‘Improving panel sampling: Embedding propensity scores and response behaviour in sampling frames’, ESOMAR Panel Research, Orlando (October 2007); Anon., ‘Random sampling: Bruised, battered, bowed,’ Marketing News 36 (5) (4 March 2002), 12; Fink, A., How to Sample in Surveys (Thousand Oaks, CA: Sage, 1995); Frankel, M.R., ‘Sampling theory’, in

440 Marketing Research
Rossi, P.H., Wright, J.D. and Anderson, A.B. (eds), Handbook of Survey Research (Orlando, FL: Academic Press, 1983), 21–67.
6. Coleman, L., ‘Preferences towards sex education and information from a religiously diverse sample of young people’, Health Education 108 (1) (2007), 72–91; Reiter, J.P., ‘Topics in survey sampling/finite population sampling and inference: A prediction approach’, Journal of the American Statistical Association 97 (457) (March 2002), 357–8; Henry, G.T., Practical Sampling (Thousand Oaks, CA: Sage, 1995); Sudman, S., ‘Applied sampling’, in Rossi, P.H., Wright, J.D. and Anderson, A.B. (eds), Handbook of Survey Research (Orlando, FL: Academic Press, 1983), 145–94.
7. Jäntti, S.M. and Järn, C., ‘The insightful museum – how to create a customer centred marketing strategy’, ESOMAR Consumer Insights, Dubai (February 2009).
8. Körner, T. and Nimmergut, A., ‘Using an access panel as a sampling frame for voluntary household surveys’, Statistical Journal of the United Nations 21 (2004), 33–52;. Cage, R., ‘New methodology for selecting CPI outlet samples’, Monthly Labor Review 119 (12) (December 1996), 49–83.
9. Wyner, G.A., ‘Survey errors’, Marketing Research 19 (1) (April 2007), 6–8; Couper, M.P., ‘Web surveys: A review of issues and approaches,’ Public Opinion Quarterly 64 (4) (Winter 2000), 464–94; Smith, W., Mitchell, P., Attebo, K. and Leeder, S., ‘Selection bias from sampling frames: Telephone directory and electoral roll compared with door-to-door population census: Results from the Blue Mountain eye study’, Australian & New Zealand Journal of Public Health 21 (2) (April 1997), 127–33.
10. For the effect of sample frame error on research results, see Murphy, G.B., ‘The effects of organizational sampling frame selection’, Journal of Business Venturing 17 (3) (May 2002), 237; Fish, K.E., Barnes, J.H. and Banahan, B.F. III, ‘Convenience or calamity’, Journal of Health Care Marketing 14 (Spring 1994), 45–9.
11. Kent, R., ‘Rethinking data analysis – part two: Some alternatives to frequentist approaches’, International Journal of Market Research 51 (2) (2009), 181–202; Bakken, D.G., ‘The Bayesian revolution in marketing research’, Innovate! Conference, Paris (February 2005).
12. Vrechopoulos, A. and Atherinos, E., ‘Web banking layout effects on consumer behavioural intentions’, International Journal of Bank Marketing 27 (7) (2009), 524–46.
13. For an application of convenience sampling, see Schwaiger, M., Sarstedt, M. and Taylor, C.R., ‘Art for the sake of the corporation: Audi, BMW Group, Daimler Chrysler, Montblanc, Siemens and Volkswagen help explore the effect of sponsorship on corporate reputations’, Journal of Advertising Research 50 (1) (2010), 77–91; Ritchie, L., ‘Empowerment and Australian community health nurses’ work with aboriginal clients: The sociopolitical context’, Qualitative Health Research 11 (2) (March 2001), 190–205; Ho, F., Ong, B.S. and Seonsu, A., ‘A multicultural comparison of shopping patterns among Asian consumers’, Journal of Marketing Theory and Practice 5 (1) (Winter 1997), 42–51.
14. Kerr, G. and Schultz, D., ‘Maintenance person or architect? The role of academic advertising research in building better understanding’, International Journal of Advertising 29 (4) (2010), 547–68.
15. Maddox, K., ‘XIX Winter Olympics: Marketing hot spot’, B to B 87 (2) (11 February 2002), 1–2.
16. Jancic, Z. and Zabkar, V., ‘Establishing marketing relationships in the advertising agency business: A transitional economy case’, Journal of Advertising Research 38 (6) (November/December 1998).
17. Huizing, L., van Ossenbruggen, R., Muller, M., van der Wal, C., Lensvelt-Mulders, G.J.L.M. and Hubregtse, M., ‘Improving panel sampling: Embedding propensity scores and response behavior in sampling frames’, ESOMAR Panel Research, Orlando (October 2007).
18. Thompson, S.K., Sampling (New York: Wiley, 2002); Sudman, S., ‘Sampling in the twenty-first century’, Academy of Marketing Science Journal 27 (2) (Spring 1999), 269–77; Kish, L., Survey Sampling (New York: Wiley, 1965), 552.
19. Curtice, J. and Sparrow, N., ‘How accurate are traditional quota opinion polls?’, Journal of the Market Research Society 39 (3) (July 1997), 433–48.
20. de Gaudemar, O., ‘Benefits and challenges of multi-sourcing – understanding differences between sample sources’, ESOMAR Panel Research, Barcelona (November 2006); Getz, P.M., ‘Implementing the new sample design for the current employment statistics survey’, Business Economics 35 (4) (October 2000), 47–50; Anon., ‘Public opinion: Polls apart’, The Economist 336 (7927) (12 August 1995), 48; Kalton, G., Introduction to Survey Sampling (Beverly Hills, CA: Sage, 1982); Sudman, S., ‘Improving the quality of shopping center sampling’, Journal of Marketing Research 17 (November 1980), 423–31.
21. For applications of snowball sampling, see Zeng, F., Huang, L. and Dou, W., ‘Social factors in user perceptions and responses to advertising in online social networking’, Journal of Interactive Advertising 10 (1) (Fall 2009); Winkler, T. and Buckner, K., ‘Receptiveness of gamers to embedded brand messages in advergames: Attitudes towards product placement’, Journal of Interactive Advertising 7 (1) (Fall 2006); Maher, L., ‘Risk behaviours of young Indo-Chinese injecting drug users in Sydney and Melbourne’, Australian & New Zealand Journal of Public Health (February 2001), 50–4; Frankwick, G.L., Ward, J.C., Hutt, M.D. and Reingen, P.H., ‘Evolving patterns of organisational beliefs in the formation of strategy’, Journal of Marketing 58 (April 1994), 96–110.
22. If certain procedures for listing members of the rare population are followed strictly, the snowball sample can be treated as a probability sample. See Sampath, S., Sampling Theory and Methods (Boca Raton, FL: CRC Press, 2000); Henry, G.T., Practical Sampling (Thousand Oaks, CA: Sage, 1995); Kalton, G. and Anderson, D.W., ‘Sampling rare populations’, Journal of the Royal Statistical Association 149 (1986), 65–82; Biemacki, P. and Waldorf, D., ‘Snowball sampling: Problems and techniques of chain referred sampling’, Sociological Methods and Research 10 (November 1981), 141–63.
23. Campbell, C., Parent, M. and Plangger, K., ‘Instant innovation: From zero to full speed in fifteen years – how online offerings have reshaped marketing research’, Journal of Advertising Research 51 (1) 50th Anniversary Supplement (2011), 72–86.

441Chapter 14 Sampling: design and procedures
24. Clark, J., Jones, S., Romanou, E. and Harrison, M., ‘Segments, hugs and rock’n’roll: An attitudinal segmentation of parents and young people’, Market Research Society: Annual Conference (2009).
25. Lavrakas, P.J., Mane, S. and Laszlo, J., ‘Does anyone really know if online ad campaigns are working? An evaluation of methods used to assess the effectiveness of advertising on the internet’, Journal of Advertising Research 50 (4) (2010), 354–73.
26. When the sampling interval, i, is not a whole number, the easiest solution is to use as the interval the nearest whole number below or above i. If rounding has too great an effect on the sample size, add or delete the extra cases.
27. For an application of systematic random sampling, see Man, Y.S. and Prendergast, G., ‘Perceptions of handbills as a promotional medium: An exploratory study’, Journal of Advertising Research 45 (1) (March 2005), 124–31; MacFarlane, P., ‘Structuring and measuring the size of business markets’, International Journal of Market Research 44 (1) (First Quarter 2002), 7–30; Qu, H. and Li, I., ‘The characteristics and satisfaction of mainland Chinese visitors to Hong Kong’, Journal of Travel Research 35 (4) (Spring 1997), 37–41; Chakraborty, G., Ettenson, R. and Gaeth, G., ‘How consumers choose health insurance’, Journal of Health Care Marketing 14 (Spring 1994), 21–33.
28. Meng, J., Summey, J.H., Herndon, N.C. and Kwong, K.K., ‘On the retail service quality expectations of Chinese shoppers’, International Journal of Market Research 51 (6) (2009), 773–96.
29. For applications of stratified random sampling, see Truong, Y., ‘Personal aspirations and the consumption of luxury goods’, International Journal of Market Research 52 (5) (2010), 655–73; Okazaki, S., ‘Social influence model and electronic word of mouth: PC versus mobile internet’, International Journal of Advertising 28 (3) (2009), 439–72; Kjell, G., ‘The level-based stratified sampling plan’, Journal of the American Statistical Association 95 (452) (December 2000), 1185–91.
30. Opdyke, J.D. and Mollenkamp, C., ‘Yes, you are “High Net Worth’”, Wall Street Journal (May 21, 2002), D1, D3.
31. de Silva, H., Zainudeen, A. and Cader, S., ‘Teleuse on a shoestring’, ESOMAR Telecoms Conference, Barcelona (November 2006).
32. Zelin, A. and Stubbs, R., ‘Cluster sampling: A false economy?’, International Journal of Market Research 47 (5) (2005), 501–22.
33. Geographic clustering of rare populations, however, can be an advantage. See Laaksonen, S., ‘Retrospective
two-stage cluster sampling for mortality in Iraq’, International Journal of Market Research 50 (3) (2008), 403–17; Rao, P.S., Sampling Methodologies with Applications (Boca Raton, FL: CRC Press, 2001); Carlin, J.B., ‘Design of cross-sectional surveys using cluster sampling: An overview with Australian case studies’, Australian & New Zealand Journal of Public Health 23 (5) (October 1999), 546–51; Raymondo, J.C., ‘Confessions of a Nielsen Housechild’, American Demographics 19 (3) (March 1997), 24–7; Sudman, S., ‘Efficient screening methods for the sampling of geographically clustered special populations’, Journal of Marketing Research 22 (February 1985), 20–9.
34. Sergeant, J. and Bock, T., ‘Small sample market research’, International Journal of Market Research 44 (2) (2002), 235–44; Walker, J., ‘A sequential discovery sampling procedure’, Journal of the Operational Research Society 53 (1) (January 2002), 119; Park, J.S., Peters, M. and Tang, K., ‘Optimal inspection policy in sequential screening’, Management Science 37 (8) (August 1991), 1058–61; Anderson, E.J., Gorton, K. and Tudor, R., ‘The application of sequential analysis in market research’, Journal of Marketing Research 17 (February 1980), 97–105.
35. For more discussion of double sampling, see Brewer, K., Design and Estimation in Survey Sampling (London: Edward Arnold, 2001); Shade, J., ‘Sampling inspection tables: Single and double sampling’, Journal of Applied Statistics 26 (8) (December 1999), 1020; Baillie, D.H., ‘Double sampling plans for inspection by variables when the process standard deviation is unknown’, International Journal of Quality & Reliability Management 9 (5) (1992), 59–70; Frankel, M.R. and Frankel, L.R., ‘Probability sampling’, in Ferber, R. (ed.), Handbook of Marketing Research (New York: McGraw-Hill, 1974), 230–46.
36. Green, A., Heak, J. and Staplehurst, S., ‘Measuring the business elites of India and China: Powerhouse methodology meets powerhouse economies’, ESOMAR Asia Pacific Conference, Singapore (April 2008).
37. Worthington, P., ‘Research in developing markets: Upwardly mobile’, Admap (July/August 2010), 28–9.
38. García-González, J., ‘How to avoid the pitfalls of multi-country research’, ESOMAR Latin America Conference, Buenos Aires (September 2005).
39. ‘Report on online panels’, AAPOR (March 2010).
40. Davison, L. and Thornton, R., ‘DIY – new life or the death of research? It’s like giving the keys to a Ferrari to a child who has just learned to drive’, ESOMAR Congress Odyssey, Athens (September 2010).

Sampling: determining sample size
Making a sample too big
wastes resources, making it too
small diminishes the value of
findings – a dilemma resolved
only with the effective use of
sampling theory.
15Stage 1
Problem definition
Stage 2
Research approach developed
Stage 3
Research design
developed
Stage 4
Fieldwork or data
collection
Stage 5
Data integrity
and analysis
Stage 6
Communicating research findings

443Chapter 15 Sampling: determining sample size
Objectives
After reading this chapter, you should be able to:
1 define the key concepts and symbols relating to sampling;
2 understand the concepts of the sampling distribution, statistical inference and standard error;
3 discuss the statistical approach to determining sample size based on simple random sampling and the construction of confidence intervals;
4 derive the formulae to determine statistically the sample size for estimating means and proportions;
5 discuss the importance of non-response issues in sampling;
6 appreciate approaches for improving response rates and adjusting for non-response.
This chapter focuses on the question of how we determine the appropriate sample size when undertaking simple random sampling. We define various concepts and symbols and discuss the properties of the sampling distribution. Additionally, we describe statistical approaches to sample size determination based on confidence intervals. We present the formulae for calculating the sample size with these approaches and illustrate their use. We briefly discuss the extension to determining sample size in other probability sampling designs. The sample size determined statistically is the final or net sample size; that is, it represents the completed number of interviews or observations. To obtain this final sample size, however, a much larger number of potential participants have to be initially contacted. We describe the adjustments that need to be made to the statistically determined sample size to account for incidence and completion rates and calculate the initial sample size. We also cover the non-response issues in sampling, with a focus on improving response rates and adjusting for non-response.
Statistical determination of sample size requires knowledge of the normal distribution, which is bell shaped and symmetrical. If you are unfamiliar with the concept of the normal distribution, a detailed description is provided in the appendix at the end of this chapter. Its mean, median and mode are identical. The first example illustrates the statistical aspects of sampling. The second example illustrates how an online survey was administered in terms of the sample selected, response rate and validation. The example says that the survey method was ‘random’. Given the sampling frame was an online panel, would you consider this to be a probability sample?
Overview
Real research Has there been a shift in opinion?
The sample size used in opinion polls commissioned and published by most national newspapers is influenced by statistical considerations. The allowance for sampling error may be limited to around three percentage points.
The table that follows can be used to determine the allowances that should be made for sampling error. These intervals indicate the range (plus or minus the figure shown) within which the results of repeated samplings in the same time period could be expected to vary, 95% of the time, assuming that the sample procedure, survey execu-tion and questionnaire used were the same.

444 Marketing Research
Recommended allowance for sampling error of a percentage
In percentage points (at 95% confidence level for a sample size of 355)
Percentage near 10 3Percentage near 20 4Percentage near 30 4Percentage near 40 5Percentage near 50 5Percentage near 60 5Percentage near 70 4Percentage near 80 4Percentage near 90 3
The table should be used as follows. If a reported percentage is 43 (e.g. 43% of French chief executives believe their company will have to lay off workers in the next 12 months), look at the row labelled ‘percentages near 40’. The number in this row is 5, so the 43% obtained in the sample is subject to a sampling error of 5 percentage points. Another way of saying this is that, very probably (95 times out of 100) the average of repeated samplings would be somewhere between 38% and 48%. The reader can be 95% confident that in the total population of French chief executives, between 38% and 48% believe their company will have to lay off workers in the next 12 months, with the most likely figure being 43%.
The fortunes of political parties measured through opinion polls are regularly reported in newspapers throughout Europe. The next time that you read a report of a political opinion poll, examine the sample size used, the confidence level assumed and the stated margin of error. When comparing the results of a poll with a previous poll, consider whether a particular political party or politician has really grown or slumped in popularity. If there is a news item that the popularity of Party X has grown or the approval of President Y has diminished, is there really anything to report? Can the reported change be accounted for within the set margin of error, as summarised in this example?
Real research Are product placements ethical?1
In a US study, a sample of 3,340 consumers was surveyed to measure attitudes towards ethical standards of product placement in films, sup-port for regulation of this practice and the level of acceptability for various types of products to be placed. The study was based upon an online survey administered via an access panel. Potential participants were randomly selected from the panel, with a total of 18,640 active panel members receiving a survey invitation via email. Among them, 2,859 panel members completed the survey. Two weeks later, a reminder email was sent to the remaining 15,781 members and a total of 3,722 completed the survey. The final sample size (n = 3,340) reflected a reduction in the initial number of participants eliminated due to incomplete surveys, and represented a response rate of almost 20%. This was in line with reviews of online panel response rates (typically in the 16–25% range).2 Among the 3,340 participants, 64.6% were female and 34.3% were male. Approximately 28% of the participants were aged 26–35, followed by those aged 36–45 (27.0%) and 46–55 (23.1%).

445Chapter 15 Sampling: determining sample size
In order to check the validity and representativeness of the sample, researchers compared their profile with the US national population, US cinema-going audiences, TV-viewing audiences and videotape/DVD film renters.
Definitions and symbols
Confidence intervals and other statistical concepts that play a central role in sample size determination are defined in the following list:
• Parameter. A parameter is a summary description of a fixed characteristic or measure of the target population. A parameter denotes the true value that would be obtained if a cen-sus rather than a sample were undertaken.
• Statistic. A statistic is a summary description of a characteristic or measure of the sample. The sample statistic is used as an estimate of the population parameter.
• Finite population correction. The finite population correction (fpc) is a correction for overestimation of the variance of a population parameter – for example, a mean or pro-portion – when the sample size is 10% or more of the population size.
• Precision level. When estimating a population parameter by using a sample statistic, the precision level is the desired size of the estimating interval. This is the maximum permis-sible difference between the sample statistic and the population parameter.
• Confidence interval. The confidence interval is the range into which the true population parameter will fall, assuming a given level of confidence.
• Confidence level. The confidence level is the probability that a confidence interval will include the population parameter.
The symbols used in statistical notation for describing population and sample characteris-tics are summarised in Table 15.1.
Table 15.1
Variable Population Sample
Mean m X
Proportion P p
Variance s2 s2
Standard deviation s s
Size N n
Standard error of the mean sx s x
Standard error of the proportion sp sp
Standardised variate (z)X−µs s
X−X
Coefficient of variation (C)µs s
x
Symbols for population and sample variables

446 Marketing Research
The sampling distribution
The sampling distribution is the distribution of the values of a sample statistic computed for each possible sample that could be drawn from the target population under a specified sampling plan.3 Suppose that a simple random sample of 5 sponsors is to be drawn from a population of 20 sponsors of the Paris Fashion Week. There are (20 × 19 × 18 × 17 × 16)/ (1 × 2 × 3 × 4 × 5) or 15,504 different samples of size 5 that can be drawn. The relative fre-quency distribution of the values of the mean of these 15,504 different samples would spec-ify the sampling distribution of the mean.
An important task in marketing research is to calculate statistics, such as the sample mean and sample proportion, and use them to estimate the corresponding true popula-tion values. This process of generalising the sample results to a target population is referred to as statistical inference. In practice, a single sample of predetermined size is selected, and the sample statistics (such as mean and proportion) are computed. Theo-retically, to estimate the population parameter from the sample statistic, every possible sample that could have been drawn should be examined. If all possible samples were actually to be drawn, the distribution of the statistic would be the sampling distribution. Although in practice only one sample is actually drawn, the concept of a sampling dis-tribution is still relevant. It enables us to use probability theory to make inferences about the population values.
The important properties of the sampling distribution of the mean, and the corresponding properties for the proportion, for large samples (30 or more) are as follows:
1 The sampling distribution of the mean is a normal distribution. Strictly speaking, the sampling distribution of a proportion is a binomial. For large samples (n = 30 or more), however, it can be approximated by the normal distribution.
2 The mean of the sampling distribution of the mean
==1
Xn
ni
iX /© or the proportion p = X/n (X = the count of the characteristic of interest) equals the corre-
sponding population parameter value, m or p, respectively.
3 The standard deviation is called the standard error of the mean or the proportion to indi-cate that it refers to a sampling distribution of the mean or the proportion and not to a sample or a population. The formulae are:
Mean Proportion
=s
sX n
=p ns
p(1−p)
4 Often the population standard deviation, s, is not known. In these cases, it can be esti-mated from the sample by using the following formula:
=( )2
sn−1
n
i=1
Xi−X©
or
=
2 2−( )
s
n n
n
Xi Xi© ©n−1
i=1 i=1
Sampling distributionThe distribution of the values of a sample statistic computed for each possible sample that could be drawn from the target population under a specified sampling plan.
Statistical inferenceThe process of generalising the sample results to a target population.
Normal distributionA basis for classical statistical inference that is bell shaped and symmetrical in appearance. Its measures of central tendency are all identical.
Standard errorThe standard deviation of the sampling distribution of the mean or proportion.

447Chapter 15 Sampling: determining sample size
In cases where s is estimated by s, the standard error of the mean becomes:
est.s =s
n
Assuming no measurement error, the reliability of an estimate of a population parameter can be assessed in terms of its standard error.
5 Likewise, the standard error of the proportion can be estimated by using the sample pro-portion p as an estimator of the population proportion, p, as:
est.s( )
=−1
p
pn
p
6 The area under the sampling distribution between any two points can be calculated in terms of z values. The z value for a point is the number of standard errors a point is away from the mean. The z values may be computed as follows:
nZ= Z=andX – p
s sp – p
For example, the areas under one side of the curve between the mean and points that have z values of 1.0, 2.0 and 3.0 are, respectively, 0.3413, 0.4772 and 0.4986.
7 When the sample size is 10% or more of the population size, the standard error formulae will overestimate the standard deviation of the population mean or proportion. Hence, these should be adjusted by a finite population correction factor, defined by:
N−1N−n
In this case,
=X
ss
n N−1N−n
and =s np
p(1−p)N−1N−n
z valueThe number of standard errors a point is away from the mean.
Statistical approaches to determining sample size
Several qualitative factors should also be taken into consideration when determining the sample size (see Chapter 14). These include the importance of the decision, the nature of the research, the number of variables, the nature of the analysis, sample sizes used in similar studies, inci-dence rates (the occurrence of behaviour or characteristics in a population), completion rates and resource constraints. The statistically determined sample size is the net or final sample size: the sample remaining after eliminating potential participants who do not qualify or who do not complete the interview. Depending on incidence and completion rates, the size of the initial sample may have to be much larger. In commercial marketing research, limits on time, money and expert resources can exert an overriding influence on sample size determination.
The statistical approach to determining sample size that we consider is based on tradi-tional statistical inference.4 In this approach the precision level is specified in advance. This approach is based on the construction of confidence levels around sample means or proportions.

448 Marketing Research
The z values corresponding to (XL) and (XU
) may be calculated as:
=
XL−m
XU−m
X
X
ZU s
sZL=
where zL = –z and zU = +z. Therefore, the lower value of X is:
XXL=m−Zs
and the upper value of X is:
XXU =m+Zs
Note that μ is estimated by X . The confidence interval is given by:
±X
X Zs
We can now set a 95% confidence interval around the sample mean of €182. As a first step, we compute the standard error of the mean:
= = =55
3.18300X n
ss
The confidence interval approach
The confidence interval approach to sample size determination is based on the construction of confidence intervals around the sample means or proportions using the standard error formula. As an example, suppose that a researcher has taken a simple random sample of 300 households to estimate the monthly amount invested in savings schemes and found that the mean household monthly investment for the sample is €182. Past studies indicate that the population standard deviation s can be assumed to be €55.
We want to find an interval within which a fixed proportion of the sample means would fall. Suppose that we want to determine an interval around the population mean that will include 95% of the sample means, based on samples of 300 households. The 95% could be divided into two equal parts, half below and half above the mean, as shown in Figure 15.1.
Calculation of the confidence interval involves determining a distance below (XL) and
above (XL) the population mean (μ), which contains a specified area of the normal curve.
Figure 15.1
The 95% confidence interval
0.475 0.475
XXL XU

449Chapter 15 Sampling: determining sample size
The central 95% of the normal distribution lies within 61.96 z values. The 95% confidence interval is given by:
±
±
± =
=X
X s1.96 1.96(3.18)182.00
182.00 6.23
Thus, the 95% confidence interval ranges from €175.77 to €188.23. The probability of find-ing the true population mean to be within €175.77 and €188.23 is 95%.
Sample size determination: means
The approach used here to construct a confidence interval can be adapted to determine the sample size that will result in a desired confidence interval.5 Suppose that the researcher wants to estimate the monthly household savings investment more precisely so that the esti-mate will be within 6€5.00 of the true population value. What should be the size of the sample? The following steps, summarised in Table 15.2, will lead to an answer:
1 Specify the level of precision. This is the maximum permissible difference (D) between the sample mean and the population mean. In our example, D = 6€5.00.
2 Specify the level of confidence. Suppose that a 95% confidence level is desired.
3 Determine the z value associated with the confidence level. For a 95% confidence level, the probability that the population mean will fall outside one end of the interval is 0.025 (0.05/2). The associated z value is 1.96.
Table 15.2
Steps Means Proportions
Specify the level of precision D = ± €5.00 D = p – π = 60.05
Specify the confidence level (CL) CL = 95% CL = 95%
Determine the z value associated with the CL z value is 1.96 z value is 1.96
Determine the standard deviation of the population Estimate s. s = 55 Estimate π:π = 0.64
Determine the sample size using the formula for the standard error =
2 2
2
sn
z
D
=465
=55 (1.96)2 2
52
=
=
=
0.64 (1−0.64) (1.96)D
nz
355
2
2
2
(0.05)2
π (1−π)
If the sample size represents ≥10% of the population, apply the finite factor popular correction (fpc)
If necessary, re-estimate the confidence interval by employing s to estimate s
=
= ±
nc
nN
X zsxN+n−1
=
= ±
nc
nN
p pzsN+n−1
If precision is specified in relative rather than absolute terms, determine the sample size by substituting for D
D = Rμ
=2 2
2R
C zn
D = Rπ
=2
2n
R
z (1−π )
π
Summary of sample size determination for means and proportions

450 Marketing Research
4 Determine the standard deviation of the population. This may be known from secondary sources. lf not, it might be estimated by conducting a pilot study. Alternatively, it might be estimated on the basis of the researcher’s judgement. For example, the range of a nor-mally distributed variable is approximately equal to 63 standard deviations, and one can thus estimate the standard deviation by dividing the range by 6. The researcher can often estimate the range based on knowledge of the phenomenon.
5 Determine the sample size using the formula for the standard error of the mean:
Xs
X−mZ=
=D
Xs
or
=D
Xs
Z
=D
n
s
Z
or
=2 2
2Dn
s Z
In our example:
=55 (1.96)2 2
52n
= 464.83= 465 (rounded to the next highest integer)
It can be seen from the formula for sample size that sample size increases with an increase in the population variability, the degree of confidence and the precision level required of the estimate. Because the sample size is directly proportional to s2, the larger the population variability, the larger the sample size. Likewise, a higher degree of confi-dence implies a larger value of z, and thus a larger sample size. Both s2 and z appear in the numerator. Greater precision means a smaller value of D, and thus a larger sample size because D appears in the denominator.
6 If the resulting sample size represents 10% or more of the population, the finite popula-tion correction (fpc) should be applied.6 The required sample size should then be calcu-lated from the formula:
=+ −( )1nN
Nn
nc
where n = sample size without fpc nc = sample size with fpc.
7 If the population standard deviation, s2, is unknown and an estimate is used, it should be re-estimated once the sample has been drawn. The sample standard deviation, s, is used as an estimate of s. A revised confidence interval should then be calculated to determine the precision level actually obtained.
Suppose that the value of 55.00 used for s was an estimate because the true value was unknown. A sample of n = 465 is drawn, and these observations generate a mean

451Chapter 15 Sampling: determining sample size
X of 180.00 and a sample standard deviation s of 50.00. The revised confidence inter-val is then:
± = ± ( / )X ZS 180 1.96 50.0 465X
=180±4.55
or
175.45 ≤ m ≤ 184.55
Note that the confidence interval obtained is narrower than planned, because the population standard deviation was overestimated, as judged by the sample standard deviation.
8 In some cases, precision is specified in relative rather than absolute terms. In other words, it may be specified that the estimate be within plus or minus R percentage points of the mean. Symbolically:
D = Rm
In these cases, the sample size may be determined by:
=
=
2 2
2
2 2
2RC
ns Z
Z
where the coefficient of variation C = s/μ would have to be estimated.
The population size, N, does not directly affect the size of the sample, except when the fpc factor has to be applied. Although this may be counter-intuitive, upon reflection it makes sense. For example, if all the population elements are identical on the characteristics of interest, then a sample size of one will be sufficient to estimate the mean perfectly. This is true whether there are 50, 500, 5,000 or 50,000 elements in the population. What directly affects the sample size is the variability of the characteristic in the population. This varia-bility enters into the sample size calculation by way of population variance s2 or sample variance s2. Also, note that the larger the sample size, the more accurate the parameter estimation (sample mean), i.e. the smaller the precision level (error) for a given level of confidence. This can be seen from the formula in step 5. A larger sample will also result in a narrower confidence level. This can be seen from the formula for the confidence interval in step 7.
Sample size determination: proportions
If the statistic of interest is a proportion rather than a mean, the approach to sample size determination is similar. Suppose that the researcher is interested in estimating the propor-tion of households in a particular region that have bought fashion apparel online. The follow-ing steps, also summarised in Table 15.2, should be followed:7
1 Specify the level of precision. Suppose that the desired precision is such that the allowable interval is set as D = p – π = 60.05.
2 Specify the level of confidence. Suppose that a 95% confidence level is desired.
3 Determine the z value associated with the confidence level. As explained in the case of estimating the mean, this will be z = 1.96.
4 Estimate the population proportion π. As explained earlier, the population proportion may be estimated from secondary sources, or from a pilot study, or may be based on the

452 Marketing Research
judgement of the researcher. Suppose that, based on secondary data, the researcher esti-mates that 64% of the households in the target population have bought fashion apparel online. Hence, π = 0.64.
5 Determine the sample size using the formula for the standard error of the proportion:
=
=
=p(1−p)
D
p
n
sp−p
Z
Z
or
=p(1−p) 2
2n
DZ
In our example:
n2(0.05)
=20.64(1−0.64)(1.96)
= 354.04= 355 (rounded to the next highest integer)
6 If the resulting sample size represents 10% or more of the population, the fpc should be applied. The required sample size should then be calculated from the formula:
=nN
n+ −( )1N nc
where n = sample size without fpc nc = sample size with fpc
7 If the estimate of π turns out to be poor, the confidence interval will be more or less pre-cise than desired. Suppose that after the sample has been taken, the proportion p is calcu-lated to have a value of 0.55. The confidence interval is then re-estimated by employing sp to estimate the unknown sp as:
p± zsp
where
( )=
−1pn
psp
In our example:
=
=
sp
0.55(1−0.55)355
0.0264
The confidence interval, then, is:
0.55 ± 1.96(0.0264) = 0.55 ± 0.052
which is wider than that specified. This could be attributed to the fact that the sample standard deviation based on p = 0.55 was larger than the estimate of the population stand-ard deviation based on π = 0.64.

453Chapter 15 Sampling: determining sample size
If a wider interval than specified is unacceptable, the sample size can be determined to reflect the maximum possible variation in the population. This occurs when the product π(1 – π) is the greatest, which happens when π is set at 0.5. This result can also be seen intuitively. Since half of the population has one value of the characteristic and the other half the other value, more evidence would be required to obtain a valid inference than if the situation was more clear cut and the majority had one particular value. In our example, this leads to a sample size of:
=
20.5(0.5)(1.96)
384.16
2(0.05)n=
=385 (rounded to the next higher integer)
8 Sometimes, precision is specified in relative rather than absolute terms. In other words, it may be specified that the estimate be within plus or minus R percentage points of the population proportion. Symbolically:
D = Rp
In such a case, the sample size may be determined by:
= 2R pn
2(1−p)Z
Real research The impact of organic labelling8
The German firm Huober Brezeln (www.huoberbrezel.de) is a traditional Swabian busi-ness with a long history, including the introduction of the ‘Dauerbrezel’ (a long-lasting dry pretzel). In a study, Huober wished to test the assumption that an organic seal of approval was needed to associate ‘sustainability’ into a brand image; 175 participants were interviewed in a face-to-face survey. In the sample 33.1% were male, 66.9% were female. These quotas were agreed upon with Huober, since the majority of snack buyers were women. Of all participants, 66.3% came from the areas of Bavaria, Baden-Würt-temberg and Hesse. The northern area was represented by 23.4%, the eastern area by 10.3%. This roughly equated with the German sales area of Huober, which was mainly focused on southern Germany. In evaluating the survey findings, Huober wished to determine what the maximum margin of error was in this study using a 95% confidence interval. Understanding at this confidence level would enable Huober to determine that if all German consumers were to participate in a similar survey, the responses would change by no more than 6X%. To confirm a maximum margin of error with a sample size of 175, calculations for sample size determination by proportions were made as fol-lows. The calculation uses the maximum population variation (π = 0.5). To estimate the unknown 6X% or sp, the calculation makes the estimate employing sp:
=sp n
p(1−p)
=0.074
Therefore, the confidence interval is 0.5 6 0.074, i.e. a rather large margin of 6 7.4%. If Huober were concerned by this maximum error of margin, it could form estimates for individual questions, such as those that addressed the effects of an organic seal of approval on a brand.

454 Marketing Research
There are a number of websites and apps that offer free use of sample size and confidence interval calculators, for example Survey System (www.surveysystem.com/sscalc.htm) or MaCorr Research Solutions (www.macorr.com/sample-size-calculator.htm). You can use these calculators to determine how many participants you need to interview in order to get results that reflect the target population as precisely as needed. By incorporating the cost of each sampling unit, the sample size can be adjusted based upon budget considerations.
Multiple characteristics and parameters
In the preceding examples, we focused on the estimation of a single parameter. In most mar-keting research projects, several characteristics are of interest. The researcher is required to estimate several parameters and not just one. The calculation of sample size in these cases should be based on a consideration of all the parameters to be estimated.
For example, suppose that in addition to the mean household spend at a supermarket, it was decided to estimate the mean household spend on clothes and on gifts. The sample sizes needed to estimate each of the three mean monthly expenses are given in Table 15.3 and are 465 for supermarket shopping, 246 for clothes and 217 for gifts. If all three variables were equally important, the most conservative approach would be to select the largest value of n = 465 to determine the sample size. This will lead to each variable being estimated at least as precisely as specified. If the researcher was most concerned with the mean household monthly expense on clothes, however, a sample size of n = 246 could be selected.
Table 15.3
Variable monthly household spend on:
Supermarket Clothes Gifts
Confidence level 95% 95% 95%
z value 1.96 1.96 1.96
Precision level (D) €5 €5 €4
Standard deviation of the population (s) €55 €40 €30
Required sample size (n) 465 246 217
Sample size for estimating multiple parameters
Other probability sampling techniques
So far, the discussion of sample size determination has been based on the methods of tradi-tional statistical inference and has assumed simple random sampling. Next, we discuss the determination of sample size when other sampling techniques are used. The determination of sample size for other probability sampling techniques is based on the same underlying prin-ciples. The researcher must specify the level of precision and the degree of confidence and estimate the sampling distribution of the test statistic.
In simple random sampling, cost does not enter directly into the calculation of sample size. In the case of stratified or cluster sampling however, cost has an important influence. The cost per observation varies by strata or cluster, and the researcher needs some initial estimates of these costs.9 In addition, the researcher must take into account within-strata

455Chapter 15 Sampling: determining sample size
variability or within- and between-cluster variability. Once the overall sample size is deter-mined, the sample is apportioned among strata or clusters. This increases the complexity of the sample size formulae. The interested reader is referred to standard works on sampling theory for more information.10 In general, to provide the same reliability as simple random sampling, sample sizes are the same for systematic sampling, smaller for stratified sampling and larger for cluster sampling.
Adjusting the statistically determined sample size
Sample size determined statistically represents the final sample size that must be achieved to ensure that the parameters are estimated with the desired degree of precision and set level of confidence. In surveys, this represents the number of completed interviews or question-naires. To achieve this final sample size, a much greater number of potential participants have to be contacted. In other words, the initial sample size has to be much larger because typically the incidence rates and completion rates are less than 100%.11
Incidence rate refers to the rate of occurrence or the percentage of persons eligible to participate in the study. Incidence rate determines how many contacts need to be screened for a given sample size requirement.12 For example, suppose that a study of pet ownership targets a sample of households. Of the households that might be approached to see if they qualify, approximately 75% own a pet. This means that, on average, 1.33 households would be approached to obtain one qualified participant. Additional criteria for qualifying partici-pants (e.g. product usage behaviour) will further increase the number of contacts. Suppose that an added eligibility requirement is that the household should have bought a toy for their pet during the last two months. It is estimated that 60% of the households contacted would meet this criterion. Then the incidence rate is 0.75 × 0.6 = 0.45. Thus the final sample size will have to be increased by a factor of (1/0.45) or 2.22.
Similarly, the determination of sample size must take into account anticipated refusals by people who qualify. The completion rate denotes the percentage of qualified partici-pants who complete the interview.13 If, for example, the researcher expects an interview completion rate of 80% of eligible participants, the number of contacts should be increased by a factor of 1.25. The incidence rate and the completion rate together imply that the number of potential participants contacted, i.e. the initial sample size, should be 2.22 × 1.25, or 2.78 times the sample size required. In general, if there are c qualifying factors with an incidence of Q1 × Q2 × Q3 . . . ×Qc, each expressed as a proportion, the following are true:
final sample sizeInitial sample size=
incidence rate×completion rate
Incidence rate = Q1 × Q
2 × Q
3 × ... × Q
c
The number of units that will have to be sampled will be determined by the initial sample size. These calculations assume that an attempt to contact a participant will result in a deter-mination as to whether the participant is eligible. However, this may not be the case. An attempt to contact the participant may be inconclusive as the participant may refuse to answer, not be at home, be busy, or for many other reasons. Such instances will further increase the initial sample size. These instances are considered later when we calculate the response rate. Often, a number of variables are used for qualifying potential participants, thereby decreasing the incidence rate. Completion rates are affected by non-response issues. These issues deserve particular attention and are detailed in the next section. Some of the challenges of qualifying potential participants through incidence and completion are illus-trated in the following example.
Incidence rateIncidence rate refers to the rate of occurrence or the percentage of persons eligible to participate in a study.
Completion rateThe percentage of qualified participants who complete the interview. It enables researchers to take into account anticipated refusals by people who qualify.

456 Marketing Research
Real research Sampling cosmetic surgery consumers14
The German Federal Ministry of Food, Agri-culture and Consumer Protection funded a study of suppliers and customers of cosmetic surgery, examining market supply, the quality of surgery results and any needs for con-sumer-oriented political action. The low prev-alence of cosmetic surgery made it clear that a multiple-mode approach was needed to engage sufficient qualified participants. As the intention of the study was to analyse not only demand but supply as well, the size of the market was estimated by a survey of all physi-cians and institutions offering cosmetic sur-gery. For that purpose, a sampling frame of all suppliers was built. Following that, a question-naire was sent to 1,712 physicians and institu-tions covering the number, type, costs and risks of operations, as well as age and gender of their patients. Due to mistrust of the physicians, who expected negative consequences by the tax authorities, the response rate was lower than usual (8.8%). In examining demand issues, customer data were collected by a survey of 620 patients from all over Germany who had undergone cosmetic surgery between 2004 and 2006. The mix of data collection modes included face-to-face as well as telephone, online and postal surveys. The majority were completed using the online mode, which used a screening process with a covering question to define the target population. Postal questionnaires were used for patients of cosmetics who declared their willingness to participate in the study. Consumers of cos-metic surgery for the face-to-face interviews were identified randomly and participants were recruited for telephone interviews through approaches to chat rooms of patients.
Calculation of response rates
Response rate can be defined as:15
=number of completed interviews
Response ratenumber of eligible units in sample
To illustrate how the formula is used, consider the following simple example involving a single-stage online survey with individuals where no screening is involved. The sample con-sists of 2,000 email addresses, generated from an access panel. Three attempts are made to reach each participant. The results are summarised as follows:
Call # AttemptsParticipants who complete survey Cumulative Response rate
1 2,000 1,200 1,200 60%
2 800 400 1,600 80%3 400 100 1,700 85%

457Chapter 15 Sampling: determining sample size
In this example, the number of eligible units is 2,000 and the response rate after three emails is 85%. Now consider the case of a single-stage sample where screening is required to deter-mine the eligibility of participants, i.e. to ascertain whether the participant is qualified for the survey. The attempt to screen each participant will result in one of three outcomes: (1) eligi-ble, (2) ineligible, (3) not ascertained (NA). The NA category will include refusals or par-ticipants not able to access their email accounts. In this case we determine the number of eligible participants in the NAs by distributing NAs in the ratio of (1) to (1 + 2). Suppose that we sent out 2,000 emails that resulted in the following outcomes:
Number of completed surveys = 800Number of eligible participants = 900Number of ineligible participants = 600Not ascertained (NA) = 500
The first step is to determine the number of eligible units in the NAs. This can be calculated as:
500 × [900/(900 + 600)] = 300
Thus the total number of eligible units in the sample is 900 + 300 = 1,200. And the response rate is 800/1,200 = 66.7%.
Although we illustrate the calculation of response rates for online surveys, the calcula-tions for other survey methods are similar. Response rates are affected by non-response, which is a major issue for marketing researchers.16
Non-response issues in sampling
The two major non-response issues in sampling are improving response rates and adjusting for non-response. Non-response error arises when some of the potential participants included in the sample do not respond (see Chapter 3). This is one of the most significant problems in survey research. Non-participants may differ from participants in terms of demographic, psychographic, personality, attitudinal, motivational and behavioural variables.17 (Evaluat-ing these differences was detailed in Chapter 14 in the process of sample validation.) For a given study, if the non-participants differ from the participants on the characteristics of inter-est, the sample estimates can be seriously biased. Higher response rates, in general, imply lower rates of non-response bias, yet response rate may not be an adequate indicator of non-response bias. Response rates themselves do not indicate whether the participants are repre-sentative of the original sample.18 Increasing the response rate may not reduce non-response bias if the additional participants are no different from those who have already responded but do differ from those who still do not respond. As low response rates increase the probability of non-response bias, an attempt should be made to improve the response rate.19 This is not an issue that should be considered after a survey approach has been decided and a question-naire designed. Factors that improve response rates are integral to survey and questionnaire design. The researchers should build up an awareness of what motivates their target partici-pants to participate in a research study (as detailed in Chapter 13). The researchers should ask themselves what their target participants get in return for spending time and effort answering set questions in a full and honest manner. The following subsection details the techniques involved in improving response rates and adjusting for non-response. There is no definitive formula or theory that explains why the non-response occurs, or what to do about it. There have been many practitioner and academic studies about non-response in individual survey modes, in cross-comparisons between modes and in specific contexts, e.g. particular countries, participant types and the nature of topic. We continue with ideas to improve non-response, based upon this body of studies. The following two examples illustrate academic and practitioner views of non-response in specific contexts.

458 Marketing Research
Real research Comparing mobile with fixed phones for surveys
A number of studies have looked at the differences between responses from mobile and fixed-lined phones. One study20 targeted at Portuguese adults (aged 15 years and over), focused on internet usage, attitudes towards the internet, cultural practices and demo-graphics. Two surveys were conducted by the same survey company in order to over-come problems that might confuse the assessment of survey results if multiple sources of data collection were used. There were no conclusive results regarding the perfor-mance of mobile phone surveys as opposed to fixed phone surveys in terms of response rates. However, there were several features of mobile phones that could induce lower overall response rates. First, a mobile phone was seen as a personal device and many users may consider receiving a call from strangers on their mobile phone an invasion of their privacy. The reaction may be a refusal or even a hang-up-without-answering as soon as they see an unfamiliar number on the phone screen. Second, the participant may be more or less willing to cooperate depending on the tariff that has been con-tracted for the mobile phone. Charging for receiving calls may discourage the accept-ance of some calls, namely those from unknown sources. Mobile phones have the advantage of making the person accessible at any time of the day because it is a personal device carried at all times.
A second study21 by Peter Lynn and Olena Kaminska from the University of Essex compared the impact of mobile phones on measurement errors in surveys compared to fixed-line phones. Only small differences in survey measures between the mobile phone interviews and the fixed phone interviews were found, but these differences indicate that data quality may be higher with mobile phone interviews. The paper suggests that an explanation is that survey respondents have greater control over whether other people are within earshot and whether others can listen in from another line. When on a fixed line, other people may be able to hear the responses, meaning that respondents may censor their responses to avoid socially undesirable answers.
Real research ‘No time’ main reason for refusal22
Research from Nielsen Media Research (www.nielsenmedia.com) showed that there were four basic ‘causes’ for non-cooperation. These were ‘no time or interest’, ‘privacy and confidentiality concerns’, ‘not enjoying the survey experience’ and ‘not believing one’s opinions are important’. It is known that mentioning the survey’s topic could sig-nificantly affect response rates, as explained by Paul Larraka Vixe President of Nielsen Media Research (www.nielsenmedia.com):
Response rates for surveys on topics that are of higher interest to participants can be up to 40% higher. Health issue surveys, for instance, usually get high response rates. But is it acceptable to mention the topic in the introduction to a survey? One professor at the Ohio State University Survey Center insisted that we not mention the survey topic because of the risk of non-response due to only people being interested in the survey being willing to be interviewed. Balancing effective measures to improve response rates and concerns about non-response errors will always be a very difficult trade-off.

459Chapter 15 Sampling: determining sample size
Improving the response rates
The primary causes of low response rates are refusals and not-at-homes, as shown in Figure 15.2.
1 Refusals. Refusals, which result from the unwillingness or inability of people included in the sample to participate, result in lower response rates and increased potential for non-response bias. Given the potential differences between participants and non-participants, researchers should attempt to lower refusal rates. This can be done by prior notification, incentives, good questionnaire design and administration, follow-up and other facilitators:
• Prior notification. In prior notification, potential participants are sent an email, a letter or are telephoned notifying them of the imminent online, postal, telephone or face-to-face survey. Prior notification increases response rates, as the participant’s attention is drawn to the purpose of a study and the potential benefits, without the apparent ‘chore’ of the questionnaire. With the potential participant’s attention focused upon the
Figure 15.2
Improving response rates
Otherfacilitators
Follow-upQuestionnairedesign and
administrationIncentives
Priornoti�cation
Reducingnot-at-homes
Call-backs
Methods of improving response rates
Reducingrefusals
Real research Only incentives increase response rates?24
In a study organised by a New Zealand mar-keting research agency that conducted omnibus surveys using CATI, a measure of the effectiveness of ‘introductions’ upon response rates was made. Four introduction elements were tested: an incentive (prize draw for a weekend holiday); an assurance that the survey was not a sales pitch; an assurance of confidentiality; and a short ver-sus longer description of the survey topic. Overall, only the prize draw incentive significantly increased the response rate. In com-bination, the best result and the only one to achieve a significantly higher response rate was the use of the incentive coupled with a ‘no-sales’ assurance. The use of the incentive did not appear to encourage people to lie about their eligibility as participants.

460 Marketing Research
purpose and benefits, the chances increase for a greater reception when approached actually to complete a survey.23 A key element of notifying potential participants lies in how surveys are introduced, as illustrated in the following example.
• Incentives. Response rates can be increased by offering monetary as well as non-mon-etary incentives to potential participants. Monetary incentives can be prepaid or prom-ised. The prepaid incentive is included with the survey or questionnaire. The promised incentive is sent only to those participants who complete the survey. The most com-monly used non-monetary incentives are premiums and rewards, such as pens, pencils, books and offers of survey results.25 Prepaid incentives have been shown to increase response rates to a greater extent than promised incentives. The amount of incentive can vary, from trivial amounts to tens of euros. The amount of incentive has a positive relationship with response rate, but the cost of large monetary incentives may out-weigh the value and quality of additional information obtained.
• Questionnaire design and administration. A well-designed questionnaire can decrease the overall refusal rate as well as refusals to specific questions (see Chapter 13). If the questionnaire and experience of answering the questions are interesting for the partici-pants, using words, logic and visual appeal that are meaningful to them, the response rate can improve. Likewise, the skill used to administer the questionnaire in telephone and face-to-face interviews can increase the response rate. Trained interviewers are skilled in refusal conversion or persuasion. They do not accept a ‘no’ response without an additional plea. The additional plea might emphasise the brevity of the question-naire or importance of the participant’s opinion. (Interviewing procedures are dis-cussed in more detail in Chapter 16.)
• Follow-up. Follow-up, or contacting the non-participants periodically after the initial contact, is particularly effective in decreasing refusals in online, SMS and postal surveys. The researcher might send a reminder to non-participants to complete and return the questionnaire. Two or three mailings may be needed in addition to the original one. With proper follow-up, the response rate in postal surveys can be increased to 80% or more. Follow-ups can be done by postcard, letter, telephone, email or face-to-face contacts.26
• Other facilitators. Personalisation, or sending letters addressed to specific individuals, is effective in increasing response rates, especially when practised in conjunction with prior notification.27 The only downside of such an approach is actually obtaining the names and contact details of those to whom a questionnaire should be sent. The follow-ing example illustrates elements of the approach to increasing response rates at the German research company GfK. The example is set in the context of the company changing from a postal-based panel to an online panel.
Real research GfK’s online panel28
The Web Portal is the ‘web presence’ of an online panel. This is where the panel mem-bers go to interact with a research agency and thus is a hugely important aspect of online research. The portal is used to build a relationship with the panel members and achieve the high panel retention that is necessary for the quality of continuous research. When communicating with the panel members it is important to retain the personal ‘feel’. The GfK website is compared by their panel members with every site they visit, not just those of other research companies. Therefore, the Web Portal had to offer a comparable experience to that offered by, for example, banks and retailers, in terms of functionality and user experience. The system must also be extremely reliable, as any problems will have a direct effect on response rates and panel retention. Response levels have been

461Chapter 15 Sampling: determining sample size
2 Not-at-homes. The second major cause of low response rates is not-at-homes. This factor has contributed to the growth of online and mobile surveys. Where telephone and home face-to-face interviews are planned, low response rates can result if the potential partici-pants are not at home when contact is attempted. A study analysing 182 commercial tel-ephone surveys involving a total sample of over 1 million consumers revealed that a large percentage of potential participants were never contacted. The median non-contact rate was 40%. In nearly 40% of the surveys, only a single attempt was made to contact poten-tial participants. The results of 259,088 first-call attempts using a sophisticated random-digit dialling system show that less than 10% of the calls resulted in completed interviews, and 14.3% of those contacted refused to participate.29
The likelihood that potential participants will not be at home varies with several factors. People with small children are more likely to be at home. Consumers are more likely to be at home at weekends than on weekdays, and in the evening as opposed to during the afternoon. Pre-notification and appointments increase the likelihood that the participant will be at home when contact is attempted.
The percentage of not-at-homes can be substantially reduced by employing a series of call-backs, or periodic follow-up attempts, to contact non-participants. The decision about the number of call-backs should weigh the benefits of reducing non-response bias against the additional costs. As call-backs are completed, the call-back participants should be compared with those who have already responded, to determine the usefulness of making further call-backs. In most consumer surveys, three or four call-backs may be desirable. Although the first call yields the most responses, the second and third calls have a higher response per call. It is important that call-backs be made and controlled according to a prescribed plan.30
raised to well above the industry average for online access panels, although still below their postal panel peak of 85%. GfK has seen response rates rise directly in line with its increase in the understanding of the differences between the online and offline postal panel. The online panel has a ‘core’ of panellists from which GfK experiences an 80% response rate. Outside this group there is a continuous influx of panellists who partici-pate for about a year and then drop off. When analysing this against its experience with the postal panels, GfK offered the following lessons:
• Receiving a questionnaire through the post is a much more tangible experience. The questionnaire sits on a ‘to-do’ pile and this is a constant reminder to complete it. The participant is also able to see the entirety of the questionnaire and can easily make an estimation of the time required to complete it.
• People are far more likely to change their email address, than they are to move. It is therefore much easier to lose contact with participants. ‘Spam’ mailing is a major reason for switching email address, and is therefore a major issue for companies run-ning continuous panels.
• The internet is a rapidly changing environment and it is very easy for panellists to become tired of a website. There are many more distractions for people when they are online. Social media sites such as Facebook take up increasing amounts of online time. There has also been an increase in entertainment available online, such as gam-ing and online TV services such as Netflix or BBC iPlayer.
Taking these factors into account means that the panellist communication strategy and incentive schemes are constantly under review. It is always necessary to value the impor-tance of building and maintaining the relationship with the panellists and ensuring they feel valued for the help they provide in conducting the research.

462 Marketing Research
Adjusting for non-response
Low response rates increase the probability that non-response bias will be substantial. Response rates should always be reported and, whenever possible, the effects of non-response should be estimated. This can be done by linking the non-response rate to estimated differ-ences between participants and non-participants. Information on differences between the two groups may be obtained from the sample itself. For example, differences found through call-backs could be extrapolated, or a concentrated follow-up could be conducted on a subsample of the non-participants. Alternatively, it may be possible to estimate these differences from other sources.31 To illustrate, in a survey of owners of vacuum cleaners, demographic and other information may be obtained for participants and non-participants from their guarantee cards. For a postal panel, a wide variety of information is available for both groups from syndicate organisations. If the sample is supposed to be representative of the general popula-tion, then comparisons can be made with census figures. Even if it is not feasible to estimate the effects of non-response, some adjustments can still be made during data analysis and interpretation.32 The strategies available to adjust for non-response error include subsam-pling of non-participants, replacement, substitution, subjective estimates, trend analysis, simple weighting and imputation.
1 Subsampling of non-participants. Subsampling of non-participants, particularly in the case of postal surveys, can be effective in adjusting for non-response bias. In this tech-nique, the researcher contacts a subsample of the non-participants, usually by means of telephone, face-to-face interviews or by email. This often results in a high response rate within that subsample. The values obtained for the subsample are then projected to all the non-participants, and the survey results are adjusted to account for non-response. This method can estimate the effect of non-response on the characteristic of interest.
2 Replacement. In replacement, the non-participants in the current survey are replaced with non-participants from an earlier, similar survey. The researcher attempts to contact these non-participants from the earlier survey and administer the current survey questionnaire to them, possibly by offering a suitable incentive. It is important that the nature of non-response in the current survey be similar to that of the earlier survey. The two surveys should use similar kinds of participants, and the time interval between them should be short. The non-participants in the present survey may be replaced by the non-participants in the original survey.
3 Substitution. In substitution, the researcher substitutes for non-participants other ele-ments from the sampling frame who are expected to respond. The sampling frame is divided into subgroups that are internally homogeneous in terms of participant character-istics but heterogeneous in terms of response rates. These subgroups are then used to identify substitutes who are similar to particular non-participants but dissimilar to partici-pants already in the sample. Note that this approach would not reduce non-response bias if the substitutes were similar to participants already in the sample.
4 Subjective estimates. When it is no longer feasible to increase the response rate by sub-sampling, replacement or substitution, it may be possible to arrive at subjective esti-mates of the nature and effect of non-response bias. This involves evaluating the likely effects of non-response based on experience and available information. For example, married adults, with young children are more likely to be at home than single or divorced adults or than married adults with no children. This information provides a basis for evaluating the effects of non-response due to not-at-homes in face-to-face or telephone surveys.
5 Trend analysis. Trend analysis is an attempt to discern a trend between early and late participants. This trend is projected to non-participants to estimate where they stand on
SubstitutionA procedure that substitutes for non-participants other elements from the sampling frame who are expected to respond.
Trend analysisA method of adjusting for non-response, in which the researcher tries to discern a trend between early and late participants. This trend is projected to non-participants to estimate their characteristic of interest.

463Chapter 15 Sampling: determining sample size
the characteristic of interest. For example, Table 15.4 presents the results of several waves of a postal survey. The characteristic of interest is money spent on shopping in supermarkets during the last two months. The known value of the characteristic for the total sample is given at the bottom of the table. The value for each successive wave of participants becomes closer to the value for non-participants. For example, those responding to the second mail-ing spent 79% of the amount spent by those who responded to the first mailing. Those responding to the third mailing spent 85% of the amount spent by those who responded to the second mailing. Continuing this trend, one might estimate that those who did not respond spent 91% [85 + (85 – 79)] of the amount spent by those who responded to the third mailing. This results in an estimate of €252 (277 × 0.91) spent by non-participants and an estimate of €288 [(0.12 × 412) + (0.18 × 325) + (0.13 × 277) + (0.57 × 252)] for the average amount spent in shopping at supermarkets during the last two months for the overall sample. Suppose we knew from consumer panel records that the actual amount spent by non-participants was €230 rather than €252, and that the actual sample average was €275 rather than the €288 estimated by trend analysis. Although the trend estimates are wrong, the error is smaller than the error that would have resulted from ignoring the non-participants. Had the non-participants been ignored, the average amount spent would have been estimated at €335 [(0.12 × 412) + (0.18 × 325) + (0.13 × 277)]/(0.12 + 0.18 + 0.13) for the sample.
6 Weighting. Weighting attempts to account for non-response by assigning differential weights to the data depending on the response rates.33 For example, in a survey on per-sonal computers, the sample was stratified according to income. The response rates were 85%, 70% and 40% respectively, for the high-, medium- and low-income groups. In ana-lysing the data, these subgroups are assigned weights inversely proportional to their response rates. That is, the weights assigned would be 100/85, 100/70 and 100/40 respec-tively, for the high-, medium- and low-income groups. Although weighting can correct for the differential effects of non-response, it destroys the self-weighting nature of the sampling design and can introduce complications.34 (Weighting is further discussed in Chapter 19 on data integrity.)
7 Imputation. Imputation involves imputing, or assigning, the characteristic of interest to the non-participants based on the similarity of the variables available for both non-partic-ipants and participants.35 For example, a participant who does not report brand usage may be imputed based on the usage of a participant with similar demographic characteristics. Often there is a high correlation between the characteristic of interest and some other variables. In such cases, this correlation can be used to predict the value of the character-istic for the non-participants (see Chapter 14).
WeightingA statistical procedure that attempts to account for non-response by assigning differential weights to the data depending on the response rates.
ImputationA method to adjust for non-response by assigning the characteristic of interest to the non-participants based on the similarity of the variables available for both non-participants and participants.
Table 15.4
Percentage response
Average euro expenditure
Percentage of previous wave’s response
First mailing 12 412 –
Second mailing 18 325 79
Third mailing 13 277 85
Non-response (57) (230) 91
Total 100 275
Use of trend analysis in adjusting for non-response

464 Marketing Research
Real research Participation or engagement – do declining response rates matter?
A recurring theme in marketing research has been the long-term decline in response rates. This is not a recent phenomenon, or a result of the growth in social media or mobile devices, but has been happening for decades. The question is, what we can do about it? In response to the question, Peter Mouncey, a leading authority on market research and Editor in Chief of the International Journal of Market Research, believes that the real problem is that researchers have forgotten that participation depends on engagement:36
The real issue is that response, or participation, rates are still falling. In my view we should be talking about participation or engagement, not simply response rates. We seem decreasingly able to persuade people to engage with us. And most commercial research is not based on random probability meth-ods, or even quota samples, but convenience or self-selected samples. Over-all, it appears that people are less comfortable with sharing their attitudes, opinion and behaviours with us, whatever the purpose of the research. Is it because of a lack of trust, or are there other reasons – we don’t really know. For example, the rise of social media provides new ways for people to express their views. Maybe people feel these have a more direct impact than partici-pating in a survey. They don’t have to hope a researcher will call when they have a bad customer experience – and they know that companies are listen-ing to all that noise on social media.
Summary The statistical approaches to determining sample size are based on confidence intervals. These approaches may involve the estimation of the mean or proportion. When estimat-ing the mean, determination of sample size using the confidence interval approach requires the specification of precision level, confidence level and population standard deviation. In the case of proportion, the precision level, confidence level and an estimate of the population proportion must be specified. The sample size determined statistically represents the final or net sample size that must be achieved. To achieve this final sample size, a much greater number of potential participants have to be contacted to account for a reduction in response due to incidence rates and completion rates.
Non-response error arises when some of the potential participants included in the sample do not respond. The primary causes of low response rates are refusals and not-at-homes. Refusal rates may be reduced by prior notification, incentives, excellent questionnaire design and administration and follow-up. The percentage of not-at-homes can be substantially reduced by call-backs. Adjustments for non-response can be made by subsampling non-participants, replacement, substitution, subjective esti-mates, trend analysis, simple weighting and imputation.
Questions 1 Define:
a the sampling distribution
b finite population correction
c confidence intervals.

465Chapter 15 Sampling: determining sample size
2 What is the standard error of the mean?
3 What is the procedure for constructing a confidence interval around a mean?
4 Describe the difference between absolute precision and relative precision when estimating a population mean.
5 How do the degree of confidence and the degree of precision differ?
6 Describe the procedure for determining the sample size necessary to estimate a population mean, given the degree of precision and confidence and a known population variance. After the sample is selected, how is the confidence interval generated?
7 Describe the procedure for determining the sample size necessary to estimate a population mean, given the degree of precision and confidence but where the population variance is unknown. After the sample is selected, how is the confidence interval generated?
8 How is the sample size affected when the absolute precision with which a population mean is estimated is doubled?
9 How is the sample size affected when the degree of confidence with which a population mean is estimated increases from 95% to 99%?
10 Define what is meant by absolute precision and relative precision when estimating a population proportion.
11 Describe the procedure for determining the sample size necessary to estimate a population proportion given the degree of precision and confidence. After the sample is selected, how is the confidence interval generated?
12 How can the researcher ensure that the generated confidence interval will be no larger than the desired interval when estimating a population proportion?
13 When several parameters are being estimated, what is the procedure for determining the sample size?
14 Define incidence rate and completion rate. How do these rates affect the determination of the final sample size?
15 What strategies are available for adjusting for non-response?
Exercises 1 Using a spreadsheet (e.g. Excel), program the formulae for determining the sample size under the various approaches described in this chapter.
2 Using the website of a national newspaper in your country, search for reports of three recent major surveys. Write a report on the sample sizes used and the extent to which details of precision, confidence levels and any other factors affecting the sample were reported. Note any reporting that sensationalises statistical changes over time that are within the margin of error tolerances.
3 Examine online databases and secondary data sources to determine the average monthly household spend on broadband services in your country. Assuming a confidence level of €10, and a standard deviation of €100, what should be the sample size to determine the average monthly household expenditure on broadband services?

466 Marketing Research
4 You work as the marketing research manager for a chain of themed restaurants. A new menu has been developed based upon organic and fairtrade produce. Before the new menu is introduced, management are concerned about how existing and potential customers will react. How would you approach the sample size calculations for this task? Present your plan to a group of students representing the board of the chain.
5 In a small group, discuss the following issues: ‘Statistical considerations are more important than administrative considerations in determining sample size’ and ‘The real determinant of sample size is what managers feel confident with; it has little to do with statistical confidence.’
Appendix: The normal distribution
In this appendix, we provide a brief overview of the normal distribution and the use of the normal distribution table. The normal distribution is used in calculating the sample size, and it serves as the basis for classical statistical inference. Many continuous phenomena follow the normal distribution, or can be approximated by it. The normal distribution can, likewise, be used to approximate many discrete probability distributions.37
The normal distribution has some important theoretical properties. It is bell shaped and symmetrical in appearance. Its measures of central tendency (mean, median and mode) are all identical. Its associated random variable has an infinite range (–∞< x < +∞).
The normal distribution is defined by the population mean μ and population standard deviation s. Since an infinite number of combinations of μ and s exist, an infinite number of normal distributions exist and an infinite number of tables would be required. By standardis-ing the data, however, we need only one table. Any normal random variable X can be con-verted to a standardised normal random variable z by the formula:
s
X – pZ=
Note that the random variable z is always normally distributed with a mean of 0 and a standard deviation of 1. The normal probability tables are generally used for two purposes: (1) finding probabilities corresponding to known values of X or z; and (2) finding values of X or z corresponding to known probabilities. Each of these uses is discussed.
Finding probabilities corresponding to known values
Suppose that Figure 15.A1 represents the distribution of the number of engineering con-tracts received per year by an engineering firm. Because the data span the entire history of the firm, Figure 15.A1 represents the population. Therefore, the probabilities or pro-portion of area under the curve must add up to 1.0. The marketing director wishes to determine the probability that the number of contracts received next year will be between 50 and 55.
This probability is 0.3413. As shown in Figure 15.A1, the probability is 0.3413 that the number of contracts received by the firm next year will be between 50 and 55. It can also be concluded that the probability is 0.6826 (2 × 0.3413) that the number of contracts received next year will be between 45 and 55.

467Chapter 15 Sampling: determining sample size
This result could be generalised to show that for any normal distribution the probability is 0.6826 that a randomly selected item will fall within 61 standard deviations above or below the mean. Also, it can be verified from Table 2 that there is a 0.9544 probability that any randomly selected, normally distributed observation will fall within 62 standard deviations above or below the mean, and a 0.9973 probability that the observation will fall within 63 standard deviations above or below the mean.
Finding values corresponding to known probabilities
Suppose that the marketing director wishes to determine how many contracts must come in so that this number represents 5% of the contracts expected for the year. If 5% of the con-tracts have come in, 95% of the contracts have yet to come. As shown in Figure 15.A2, this 95% can be broken down into two parts: contracts above the mean (i.e. 50%) and contracts between the mean and the desired z value (i.e. 45%). The desired z value can be determined from Table 2, since the area under the normal curve from the standardised mean, 0, to this z must be 0.4500. From Table 2, we search for the area or probability 0.4500. The closest value is 0.4495 or 0.4505. For 0.4495, we see that the z value corresponding to the particular
Figure 15.A1
Finding probability corresponding to a known value
Figure 15.A2
Finding values corresponding to known probabilities
Area is 0.4500 Area is 0.5000
50X
Area is 0.0500
–z
X Scale
Z Scale0

468 Marketing Research
Figure 15.A3
Finding values corresponding to known probabilities: confidence interval
Area is 0.4750 Area is 0.4750
50
Area is 0.0250
z = –1.96
X Scale
Z Scalez = 1.96
Area is 0.0250
0
z row (1.6) and z column (0.04) is 1.64. The z value, however, must be recorded as negative (i.e. z = –1.64), since it is below the standardised mean of 0. Similarly, the z value corre-sponding to the area of 0.4505 is –1.65. Since 0.4500 is midway between 0.4495 and 0.4505, the appropriate z value could be midway between the two z values and estimated as –1.645. The corresponding X value can then be calculated from the standardisation formula, as follows:
X + z= 50 + (–1.645)5= 41.775
s= m
Suppose that the marketing director wanted to determine the interval in which 95% of the contracts for the next year are expected to lie. As can be seen from Figure 15.A3, the corre-sponding z values are 61.96. This corresponds to X values of 50 6 (1.96)5, or 40.2 and 59.8. This range represents the 95% confidence interval.
Notes
1. Sung, Y., de Gregorio, F. and Jung, J.H., ‘Non-student consumer attitudes towards product placement – implications for public policy and advertisers’, International Journal of Advertising 28 (2) (2009), 257–85.
2. Joinson, A.H. and Reips, U., ‘Personalized salutation, power of sender and response rates to web-based surveys’, Computers in Human Behavior 23 (3) (2007), 1372–83; Couper, M.P., ‘Web surveys: A review of issues and approaches’, Public Opinion Quarterly 64 (4) (2000), 464–94.
3. A discussion of the sampling distribution may be found in any basic statistics textbook. For example, see Berenson, M.L., Levine, D.M. and Krehbiel, T., Basic Business Statistics: Concepts and Applications, 9th edn (Englewood Cliffs, NJ: Prentice Hall, 2009).
4. Other statistical approaches are also available. A discussion of these is beyond the scope of this book, however. The interested reader is referred to Rohm,
A.J., Milne, G.R. and McDonald, M.A., ‘A mixed-method approach to developing market segmentation typologies in the sports industry’, Sport Marketing Quarterly 15 (1) (2006), 29–39; Reynolds, M.R. Jr., ‘EWMA control charts with variable sample sizes and variable sampling intervals’, IIE Transactions 33 (6) (June 2001), 511–30; Sampath, S., Sampling Theory and Methods (Boca Raton, FL: CRC Press, 2000); Yeh, L. and Van, L.C., ‘Bayesian double-sampling plans with normal distributions’, Statistician 46 (2) (1997), 193–207; Blyth, W.G. and Marchant, L.J., ‘A self-weighting random sampling technique’, Journal of the Market Research Society 38 (4) (October 1996), 473–9; Nowell, C. and Stanley, L.R., ‘Length-biased sampling in mall intercept surveys’, Journal of Marketing Research 28 (November 1991), 475–9; Gillett, R., ‘Confidence interval construction by Stein’s method: A practical and economical approach to sample size determination’, Journal of Marketing Research 26 (May 1989), 237.

469Chapter 15 Sampling: determining sample size
5. Sharot, T., ‘The design and precision of data-fusion studies’, International Journal of Market Research 49 (4) (2007), 449–70; Kelley, K., ‘Sample size planning for the coefficient of variation from the accuracy in parameter estimation approach’, Behavior Research Methods 39 (4) (November 2007), 755–66; Thompson, S.K., Sampling (New York: Wiley, 2002); Wall, M.M., ‘An effective confidence interval for the mean with samples of size one and two’, American Statistician (May 2001), 102–5; Chow, S.L., Statistical Significance (Thousand Oaks, CA: Sage, 1996).
6. Valliant, R.L., Dorfinan, A.H. and Royall, R.M., Finite Population Sampling and Inference: A Prediction Approach (New York: Wiley, 2000).
7. Joseph, L. and Wolfson, D.B., ‘Interval-based versus decision-theoretic criteria for the choice of a sample size’, Statistician 46 (2) (1997), 145–9; Frankel, M., ‘Sampling theory’, in Rossi, P.H., Wright, J.D. and Anderson, A.B. (eds), Handbook of Survey Research (New York: Academic Press, 1983), 21–67.
8. Götze, S., ‘Sustainability as a monetary brand value – a social-psychological and economical framework’, ESOMAR Congress, Montreux (September 2009).
9. For a discussion of estimating sample costs, see Davies, R.J. and McIntosh, A., ‘The sampling on non-domestic populations’, International Journal of Market Research 38 (4) (1996); Sudman, S., Applied Sampling (New York: Academic Press, 1976); Kish, L., Survey Sampling (New York: Wiley, 1965).
10. See, for example, Sampath, S., Sampling Theory and Methods, 2nd edn (Oxford: Alpha Science International, 2005); Bradley, N., ‘Sampling for internet surveys: An examination of participant selection for internet research’, Journal of the Market Research Society 41 (4) (October 1999), 387–95; Adcock, C.J., ‘Sample size determination: A review’, Statistician 46 (2) (1997), 261–83; Sudman, S., ‘Applied sampling’, in Rossi, P.H., Wright, J.D. and Anderson, A.B. (eds), Handbook of Survey Research (New York: Academic Press, 1983), 145–94.
11. Adjusting for incidence and completion rates is discussed in Lavrakas, P.J., Mane, S. and Laszlo, J., ‘Does anyone really know if online ad campaigns are working? An evaluation of methods used to assess the effectiveness of advertising on the internet’, Journal of Advertising Research 50 (4) (2010) 354–73; Rao, P.S., Sampling Methodologies with Applications (Boca Raton, FL: CRC Press, 2001); Bickart, B., ‘The distribution of survey contact and participation in the United States: Constructing a survey-based estimate’, Journal of Marketing Research 36 (2) (May 1999), 286–94; Dillman, D.A., Singer, E., Clark, J.R. and Treat, J.B., ‘Effects of benefits appeals, mandatory appeals, and variations in statements of confidentiality on completion rates for census questionnaires’, Public Opinion Quarterly 60 (3) (Fall 1996), 376–89.
12. Stevens, C., Jethwani, T. and Renaud, D., ‘Online = research nirvana?’, ESOMAR Conference on Panel Research, Budapest (April 2005); Lee, K.G., ‘Incidence is a key element’, Marketing News (13 September 1985), 50.
13. Till, A., Souza, F. and Mele, S., ‘Right here… right now… – location specific mobile research’, ESOMAR Annual Congress, London (September 2006).
14. Korczak, D., ‘Do I want to be beautiful? Consumer decision making for cosmetic surgery’, ESOMAR Healthcare Conference, Rome (February 2008).
15. Council of American Survey Research Organisations, www.casro.org.
16. ESOMAR, ‘Global Market Research’, ESOMAR Industry Report (2010), 48.
17. Cooke, M., Johnson, A., Rolfe, G. and Parker, K., ‘Association for Survey Computing (ASC): Pizzazz in research: Renewing the rules of engagement’, International Journal of Market Research 53 (1) (2011), 115–25; Van Kenhove, P., ‘The influence of topic involvement on mail-survey response behaviour’, Psychology & Marketing 19 (3) (March 2002), 293; Fisher, M.R., ‘Estimating the effect of nonresponse bias on angler surveys’, Transactions of the American Fisheries Society 125 (1) (January 1996), 118–26; Martin, C., ‘The impact of topic interest on mail survey response behaviour’, Journal of the Market Research Society 36 (October 1994), 327–38.
18. Heerwegh, D., ‘Effects of personal salutations in email invitations to participate in a web survey’, Public Opinion Quarterly 69 (4) (Winter 2005), 588–98; Cummings, S.M., ‘Reported response rates to mailed physician questionnaires’, Health Services Research 35 (6) (February 2001), 1347–55; Hill, A., Roberts, J., Ewings, P. and Gunnell, D., ‘Nonresponse bias in a lifestyle survey’, Journal of Public Health Medicine 19 (2) (June 1997), 203–7; McDaniel, S.W., Madden, C.S. and Verille, P., ‘Do topic differences affect survey non-response?’, Journal of the Market Research Society (January 1987), 55–66.
19. For minimising the incidence of non-response and adjusting for its effects, see Lozar Manfreda, K., Bosnjak, M., Berzelak, J., Haas, I. and Vehovar, V., ‘Web surveys versus other survey modes: A meta-analysis comparing response rates’, International Journal of Market Research 50 (1) (2008), 79–104; Columbo, R., ‘A model for diagnosing and reducing non-response bias’, Journal of Advertising Research 40 (1/2) (January/April 2000), 85–93; Chen, H.C., ‘Direction, magnitude, and implications of nonresponse bias in mail surveys’, Journal of the Market Research Society 38 (3) (July 1996), 267–76.
20. Vicente, P., Reis, E. and Santos, M., ‘Using mobile phones for survey research: A comparison with fixed phones’, International Journal of Market Research 51 (5) (2009), 613–34.
21. Lynn, P. and Kaminska, O. ‘The impact of mobile phones on survey measurement error’, Public Opinion Quarterly (March 2013), 586–605.
22. Havermans, J., ‘Strict rules for telemarketers may help research’, Research World (June 2004), 14.
23. Brennan, M., Benson, S. and Kearns, Z., ‘The effect of introductions on telephone survey response rates’, International Journal of Market Research 47 (1) (2005), 65–74; Van Kenhove, P., ‘The influence of topic involvement on mail-survey response behaviour’, Psychology & Marketing 19 (3) (March 2002), 293; Groves, R.M., ‘Leverage-saliency theory of survey participation: Description and an illustration’, Public Opinion Quarterly 64 (3) (Fall 2000), 299–308; Everett, S.A., Price, J.H., Bedell, A.W. and Telljohann, S.K.,

470 Marketing Research
‘The effect of a monetary incentive in increasing the return rate of a survey of family physicians’, Evaluation and the Health Professions 20 (2) (June 1997), 207–14; Armstrong, J.S. and Lusk, E.J., ‘Return postage in mail surveys: A meta-analysis’, Public Opinion Quarterly (Summer 1987), 233–48; Yu, J. and Cooper, H., ‘A quantitative review of research design effects on response rates to questionnaires’, Journal of Marketing Research 20 (February 1983), 36–44.
24. Brennan, M., Benson, S. and Kearns, Z., ‘The effect of introductions on telephone survey participation rates’, International Journal of Market Research 47 (1) (January 2005), 65–74.
25. Gendall, P. and Healey, B., ‘Effect of a promised donation to charity on survey response’, International Journal of Market Research 52 (5) (2010), 565–77; Rose, D.S., Sidle, S.D. and Griffith, K.H., ‘A penny for your thoughts: Monetary incentives improve response rates for company-sponsored employee surveys’, Organizational Research Methods 10 (2) (April 2007), 225–40; Hansen, K.M., ‘The effects of incentives, interview length and interviewer characteristics on response rates in a CATI study’, International Journal of Public Opinion Research 19 (1) (April 2007), 112–21; Saunders, J., Jobber, D. and Mitchell, V., ‘The optimum prepaid monetary incentives for mail surveys’, Journal of the Operational Research Society 57 (10) (October 2006), 1224–30; Shaw, M.J., ‘The use of monetary incentives in a community survey: Impact on response rates, data, quality and cost’, Health Services Research 35 (6) (February 2001), 1339–46.
26. McCarty, C., House, M., Harman, J. and Richards, S., ‘Effort in phone survey response rates: The effects of vendor and client controlled factors’, Field Methods 18 (2) (May 2006), 172; Zafer Erdogan, B., ‘Increasing mail survey response rates from an industrial population: A cost effectiveness analysis of four follow-up techniques’, Industrial Marketing Management 31 (1) (January 2002), 65.
27. Ladik, D.M., Carrillat, F.A. and Solomon, P.J., ‘The effectiveness of university sponsorship in increasing survey response rate’, Journal of Marketing Theory & Practice 15 (3) (July 2007), 263–71; Byrom, J., ‘The effect of personalization on mailed questionnaire response rates’, International Journal of Market Research (Summer 2000), 357–9; Dillman, D.A., Singer, E., Clark, J.R. and Treat, J.L.B., ‘Effects of benefits appeals, mandatory appeals, and variations in statements of confidentiality on completion rates for census questionnaires’, Public Opinion Quarterly 60 (3) (Fall 1996), 376–89; Gendall, P., Hoek, J. and Esslemont, D., ‘The effect of appeal, complexity and tone in a mail survey covering letter’, Journal of the Market Research Society 37 (3) (July 1995), 251–68; Greer, T.V. and Lohtia, R., ‘Effects of source and paper color on response rates in mail surveys’, Industrial Marketing Management 23 (February 1994), 47–54.
28. Van Walwyk, M. and Garland, C., ‘Turning the super tanker – the migration from a postal to online methodology’, ESOMAR Panel Research, Dublin (October 2008).
29. Keeter, S., ‘Consequences of reducing non-response in a national telephone survey’, Public Opinion Quarterly 64 (2) (Summer 2000), 125–48; Bowen, G.L., ‘Estimating the reduction in nonresponse bias from using a mail survey as a backup for nonparticipants to a
telephone interview survey’, Research on Social Work Practice 4 (1) (January 1994), 115–28; Kerin, R.A. and Peterson, R.A., ‘Scheduling telephone interviews’, Journal of Advertising Research (May 1983), 44.
30. van Goor, H. and van Goor, A., ‘The usefulness of the basic question – procedure for determining nonresponse bias in substantive variables: A test of four telephone questionnaires’, International Journal of Market Research 49 (2) (2007), 221–36.
31. Phillips, A., Curtice, J., Sparrow, N., Whiteley, P., Clarke, H., Sanders, D., Stewart, M. and Moon, N., ‘Lessons from the polls: Retrospective views on the performance of the opinion polls conducted in the run-up to the 2010 UK General Election’, International Journal of Market Research 52 (5) (2010), 675–96; Groves, R.M., ‘Nonresponse rates and nonresponse bias in household surveys’, Public Opinion Quarterly 70 (5) (2006), 646–75; Columbo, R., ‘A model for diagnosing and reducing nonresponse bias,’ Journal of Advertising Research (January/April 2000), 85–93.
32. Abraham, K.G., Maitland, A. and Bianchi, S.M., ‘Nonresponse in the American Time Use Survey’, Public Opinion Quarterly 70 (5) (2006), 676–703; Larsen, M.D., ‘The psychology of survey response’, Journal of the American Statistical Association 97 (457) (March 2002), 358–9; Dey, E.L., ‘Working with low survey response rates: The efficacy of weighting adjustments’, Research in Higher Education 38 (2) (April 1997), 215–27.
33. de Jong, M.G., Steenkamp, J.B.E.M., Fox, J.P. and Baumgartner, H., ‘Using item response theory to measure extreme response style in marketing research: A global investigation’, Journal of Marketing Research 45 (1) (February 2008), 104–15; Sobh, R. and Perry, C., ‘Research design and data analysis in realism research’, European Journal of Marketing 40 (11) (January 2006), 1194; Qin, J., ‘Estimation with survey data under non-ignorable non-response or informative sampling’, Journal of the American Statistical Association 97 (457) (March 2002), 193–200; Kessler, R.C., Little, R.J. and Grover, R.M., ‘Advances in strategies for minimising and adjusting for survey nonresponse’, Epidemiologic Reviews 17 (1) (1995), 192–204.
34. Sparrow, N., ‘Developing reliable online polls’, International Journal of Market Research 48 (6) (2006), 659–80.
35. Groves, R.M. and Peytcheva, E., ‘The impact of nonresponse rates on nonresponse bias: A meta-analysis’, Public Opinion Quarterly 72 (2) (Summer 2008), 167–89; Brewer, K., Design and Estimation in Survey Sampling (London: Edward Arnold, 2001); Sao, J., ‘Variance estimation for survey data with composite imputation and non-negligible sampling fractions’, Journal of American Statistical Association (March 1999), 254–65; Drane, J.W., Richter, D. and Stoskopf, C., ‘Improved imputation of nonresponse to mailback questionnaires’, Statistics in Medicine 12 (34) (February 1993), 283–8.
36. Mouncey, P., ‘Engaging consumers (citizens) in research’, IJMR Blog. Available at: https://www.mrs.org.uk/ijmr_blog_archive/blog/1592, accessed 7 March 2017.
37. This material is drawn from Berenson, M.L., Levine, D.M. and Krehbiel, T., Basic Business Statistics: Concepts and Applications, 11th edn (Upper Saddle River, NJ: Prentice Hall, 2000).

Survey fieldwork
No matter how well the research
process is designed, the
individuals working in the field
hold the key to quality data.
Stage 1
Problem definition
Stage 2
Research approach developed
Stage 3
Research design
developed
Stage 4
Fieldwork or data
collection
Stage 5
Data integrity
and analysis
16
Stage 6
Communicating research findings

472 Marketing Research
Objectives
After reading this chapter, you should be able to:
1 describe the survey fieldwork process and explain the selecting, training and supervising of fieldworkers, validating fieldwork and evaluating fieldworkers;
2 discuss the training of fieldworkers in making the initial contact, asking the questions, probing, recording the answers and concluding the interview;
3 discuss supervising fieldworkers in terms of quality control and editing, sampling control, control of cheating and central office control;
4 describe evaluating fieldworkers in areas of cost and time, response rates, quality of interviewing and the quality of data;
5 explain the issues related to fieldwork when conducting research across international markets;
6 appreciate how the growth in internet-based research is changing the nature of fieldwork.
Survey fieldwork is a vital process, helping to generate sound marketing research data. During this phase, fieldworkers make contact with potential participants, administer questionnaires or observation forms, record data and turn in completed forms for processing. A worker managing online research engagements, a face-to-face interviewer administering questionnaires door to door, an interviewer intercepting shoppers in the street, a telephone interviewer calling from a central location, a worker mailing questionnaires from an office, an observer counting customers in a particular section of a store, a mystery shopper experiencing the service of a retail outlet and others involved in data collection and supervision of the process are all fieldworkers.
The researcher faces two major problems when managing fieldwork operations. First of all, fieldwork should be carried out in a consistent manner so that regardless of who administers a questionnaire, the same process is adhered to. This is vital to allow comparisons between all completed questionnaires. Second, fieldworkers to some extent have to approach and motivate potential participants in a manner that sets the correct purpose for a study and motivates the participant to spend time answering the questions properly. This cannot be done in a ‘robotic’ manner; it requires good communication skills and an amount of empathy with participants, but could be interpreted as a means to bias responses. These two problems may be seen as conflicting, but, for the researcher, fieldwork management means resolving these conflicts for each individual data-gathering process. This makes survey fieldwork an essential task in the generation of sound research data.
This chapter describes the nature of survey fieldwork and the general survey fieldwork/data-collection process. This process involves selecting, training and supervising fieldworkers, validating fieldwork and evaluating fieldworkers. We briefly discuss survey fieldwork in the context of international marketing research and identify the relevant ethical issues. We conclude by discussing how digital developments in marketing research are enabling more efficient and effective fieldwork. To begin, we present two examples. The first example illustrates the role of fieldwork in the administration of an online panel. The second illustrates the challenges faced by fieldwork managers. There is much pressure on fieldwork managers to achieve high response rates, and this second example illustrates a study designed to understand how they feel about methods to gain compliance from participants.
Overview

473Chapter 16 Survey fieldwork
Real research The Clubhouse: a panel of out-of-home sports TV viewers1
The broadcaster Sky UK appointed the research company Ipsos MORI (www.ipsos-mori.com) to measure out-of-home viewing of the Sky Sports subscription sports service. The research objectives were to: (1) provide analysis of out-of-home viewing on a game-by-game basis; (2) provide out-of-home viewing figures for all major sporting events; (3) establish the demographic profile, reach and audience share for Sky Sports in an out-of-home environment; (4) determine the environment in which out-of-home view-ing was taking place (e.g. local pub, other pub, clubs, at work, etc.); (5) provide a research design that did not rely so heavily on participant recall as the then-current two-weekly telephone survey; and (6) determine which were the most popular pub channels for out-of-home viewing. The research approach to fulfil these objectives included:
• Universe. Out-of-home sports viewers aged 18 years or over (15.5 million).
• Method. Online panel of viewers to sporting events on TV in out-of-home locations.
• Sample size. 7,000.
• Recruitment. Primarily online.
• Panel interface. Panellists logged on to their own home page with access to the mes-sage boards, latest survey, report summaries and the latest incentives.
• Incentives. Mixture of points, prize draws, charity donations and vouchers.
• Fieldwork. The panel was subdivided into four matched panels and each was sur-veyed weekly. The questionnaire content was agreed by Tuesday each week; field-work ran from Thursday to Wednesday and was reported on a Thursday.
• Questionnaire. Each week 8–10 fixtures were measured, along with ad hoc questions that included advertisement testing, pub-visiting habits, brand awareness and usage. Questionnaires were agreed weekly.
• Reporting. Weekly reporting included viewing of football fixtures only. Monthly reporting included viewing of all other sports, ad hoc questions and incorporate qualitative insights from the message boards. Quarterly reports summarised key trends and viewing patterns and were enhanced with qualitative insight from the message boards.
In order to engage with participants throughout the key fieldwork period (English foot-ball season August–May), a competition was held to predict the score of one match each week. In taking part in this competition participants were taken back to their home page and could complete their survey, if eligible to do so, contribute to the message boards and be reminded of their link to The Clubhouse.
Real research Using compliance techniques to boost response rates2
Survey researchers use a variety of compliance appeals to boost response rates. Where they involve deliberate deception or misinformation they clearly violate marketing research ethics and codes of practice. Where researchers use what might be called ‘sharp practice’, in making exaggerated claims or in making participants uncomfortable if they do not comply, it is contrary to the broader aspirations of codes of practice. Such prac-tices may be considered detrimental to building long-term cooperation with partici-pants. In light of these issues, an Australian study sought answers to the following

474 Marketing Research
questions: (1) To what extent are these compliance techniques considered contrary to the commercial researchers’ Code of Professional Behaviour?; and (2) To what extent do marketing research companies actually use them in seeking to improve cooperation? In asking participants about their own ethical behaviour, it was recognised that a social desirability bias was possible. The method adopted aimed to identify not only reported behaviours, but also the reasons for them. The study focused on the field managers of telephone surveys in marketing research firms. They had the responsibility for managing interviewers and implementing survey designs. The study was conducted in two stages. The first involved eight in-depth interviews with participants from companies with extensive experience in telephone survey facilities in Australia. This stage was used to generate the items included in a survey. This survey formed the second stage of the study, targeted at Australian marketing research companies. The field managers disliked the use of most of the compliance principles. They were concerned about the ethics of misleading participants about the true duration of an interview. Concerns were also raised about the use of a social validation compliance principle, which involved inter-viewers mentioning to participants that the survey had met with ‘great enthusiasm and cooperation from others’. Managers saw the industry as trying to distance itself from telemarketing because the public’s confusion of the two activities worked against mar-keting research. A principle of ‘liking’ was commonly engaged in telephone research as interviewers were instructed to sound friendly, pleasant and courteous, but not to sound too familiar as a telemarketer may do. They believed that in the current climate of par-ticipants being concerned about privacy, appealing to ‘scarcity’ by making participants feel that they have been specially chosen might make them feel even more nervous and suspicious about how a research company acquired their details. The managers indi-cated that, when appropriate, they would be likely to emphasise a survey’s sponsorship by an authority such as a government department or a university to increase coopera-tion. It could also help to assure participants about confidentiality.
The nature of survey fieldwork
In the commercial world marketing research data are rarely collected by the persons who design the research. Researchers have two major options for collecting their data: they can manage this within their own organisations, or they can contract with a fieldwork agency. In either case, data collection involves the use of some kind of field force. The field force may operate either from an office (online, telephone and postal surveys) or in the field (face-to-face interviews at home or a workplace, street interview, CAPI and observation). The field-workers who collect data typically may have little formal marketing research or marketing training. Their training primarily focuses upon the essential tasks of selecting the correct participants, motivating them to take part in the research, eliciting the correct answers from them, accurately recording the answers and conveying those answers for analysis. An appre-ciation of why these tasks fit into the overall context of conducting marketing research is important, but it is not necessary for the survey fieldworker to be trained in the whole array of research skills.
The growth in online research has changed the nature and emphasis of fieldwork. Tradi-tionally, marketing research used a ‘personal attention’ approach, in which every interviewer paid attention to nurturing and addressing each specific participant. Online research has shifted the service design from a personalised to a more ‘self-service’ approach. Analogous to transactions at self-service petrol stations, or company websites, or e-tickets for airlines,

475Chapter 16 Survey fieldwork
the participant becomes a ‘partial interviewer’ – participating in the production of the service. Conducting online research eliminates the bias and the pressure that are usually introduced by the presence of the interviewer in the participant’s environment. The intentional or unin-tentional behaviour and appearance of the interviewer does not influence the participants and how they respond. As a corollary, the participants may provide more truthful answers than would be the case in the presence of another party. Many participants like online research because it puts them in control. For many other participants the ‘self-service’ form of engag-ing with researchers is treated with much scepticism. Many participants need to develop a sense of trust, and the benefits of participation need to be clearly promoted by human con-tact.3 For these participants, telephone or face-to-face interviews will be required, using tra-ditional forms of fieldwork.
Survey fieldwork and the data-collection process
All survey fieldwork involves selecting, training and supervising persons who collect and manage data.4 The validation of fieldwork and the evaluation of fieldworkers are also parts of the process. Figure 16.1 represents a general framework for the survey fieldwork and data-collection process. Even though we describe a general process, it should be recognised that the nature of survey fieldwork can vary widely with the mode of data collection and that the relative emphasis on the different steps will be different for online, telephone, face-to-face and postal surveys.
Figure 16.1
Survey fieldwork/data-selection process Training �eldworkers
Supervising �eldworkers
Validating �eldwork
Evaluating �eldworkers
Selecting �eldworkers
Selecting survey fieldworkers
The first step in the survey fieldwork process is the selection of fieldworkers. The researcher should: (1) develop job specifications for the project, taking into account the mode of data collection; (2) decide what characteristics the fieldworkers should have; and (3) recruit appropriate individuals. Interviewers’ background characteristics, opinions, perceptions, expectations and attitudes can affect the responses they elicit.5
For example, the social acceptability of a fieldworker to the participant may affect the quality of data obtained, especially in face-to-face interviewing. Researchers generally agree that the appearance and demeanour of the interviewer have a direct impact upon participants’ willingness to take part in an interview. This factor is illustrated in the following example.

476 Marketing Research
Real research Barclays Brand Health Monitor6
Barclays Bank decided to establish a consistent framework across business divisions, which integrated strategic measures of brand health and advertising tracking. This was conducted in the context of a concern that the role of interviewers in the research process was being neglected, resulting in a detrimental effect on the quality of information collected. Barclays felt there was an opportunity to draw these elements together and so developed a survey that addressed both interviewer and participant issues while providing a sound basis of understanding from which the business could make strategic decisions. The result was the Barclays Brand Health Monitor (BHM). Each month the BHM interviewed 600 individuals with either a current account or a savings account, of which two-thirds were representative of the sample universe and the remainder were recruited to boost a survey of Barclays customers, the impact of which was weighted at analysis. Interviews were conducted at home. The extent to which the interview truly engaged participants was established, to some extent, by the degree to which they felt the interview covered their views on the sub-ject. The majority (in excess of 80%) responded positively on this measure and there was a direct relationship between this and enjoyment. There was a fair understanding of market-ing research and its role and this supported participants’ initial interest in taking part. In addition, the appearance and demeanour of the interviewer were also key influences on initial participation; interviewers must be friendly and approachable as well as appearing trustworthy, professional and polite in order to be allowed into participants’ homes.
Training survey fieldworkers
Training survey fieldworkers is critical to the quality of data collected. Training may be con-ducted in person at a central location or, if the interviewers are geographically dispersed, online, by video-conferencing or even by mail. Training ensures that all interviewers admin-ister the questionnaire in the same manner so that the data can be collected uniformly. Train-ing should cover making the initial contact, asking the questions, probing, recording the answers and concluding the interview.7
Making the initial contact
The initial contact can result in either cooperation or the loss of potential participants.8 It also sets the potential participant in a ‘frame of mind’ to answer subsequent questions. Thus, interviewers should be trained to make opening remarks that will convince potential partici-pants that their participation is important. Interviewers should also motivate potential participants to reflect properly upon the questions posed to them and to answer honestly.
Asking the questions
Even a slight change in the wording, sequence or manner in which a question is asked can distort its meaning and bias the response. Training in asking questions can yield high divi-dends in eliminating potential sources of bias. Changing the phrasing or order of questions during the interview can make significant differences in the response obtained:
While we could be faulted for not writing as perfect a questionnaire as we possibly could, still it must be asked in the exact way it is written. It’s a challenge for us to try to get the interviewers to be more conversational but, despite this, the field force absolutely must ask questions as they are written!9

477Chapter 16 Survey fieldwork
It was argued in Chapter 13 that questionnaire design is a craft. The researchers have to understand and step into the shoes of the participants they hope to elicit information from. Researchers impose their language and logic onto participants as they lead them through a questionnaire. If the interviewer is to behave as stated in the above quotation, researchers must appreciate what interviewers go through as they pose questions, probe and motivate participants. This is because asking questions is also a craft. The subtle smiles, body lan-guage, tone of voice all get the most out of the vast array of personalities, intellects and con-texts in which the interviewer must work. The craft of interviewing develops with experience, allowing questions to be posed in a consistent manner.10
The following are guidelines for interviewers in becoming consistent in asking questions:11
1 Be thoroughly familiar with the purpose of the questionnaire.
2 Be thoroughly familiar with the structure of the questionnaire.
3 Ask the questions in the order in which they appear in the questionnaire.
4 Use the exact wording given in the questionnaire.
5 Read each question slowly.
6 Repeat questions that are not understood.
7 Ask every applicable question.
8 Follow instructions, working through any filter questions, and probe carefully.
Probing
Probing is intended to motivate participants to enlarge on, clarify or explain their answers. Probing also helps participants focus on the specific content of the interview and provide only relevant information. Probing should not introduce any bias. An example of the effect of interviewer bias comes from a survey in which one of the authors helped in data analysis (but not in the design of the questionnaire or in the management of the whole research process!). The survey related to bread- and cake-buying habits, with one particular question focusing upon ‘large cakes’ that participants had bought over the previous 12 months. In analysing the data, a percentage of participants had replied ‘Christmas cake’. When analysed further, all the participants who said ‘Christmas cake’ had been interviewed by the same interviewer. The conclusion from this analysis was that the interviewer in question had used their own probe in a manner that would have answered the question and, in the interviewer’s view, to make the interview process work. None of the other interviewers had used this probe, which meant there was an inconsistent approach in eliciting answers from participants. The paradox faced by the survey designers in this example was that the ‘rogue’ interviewer may have used a probe that elicited a true representation of large-cake purchasing – the other interviewers consistently failing to draw out a ‘true’ response.
To help in the process of probing, the following list details some commonly used tech-niques:12
1 Repeating the question. Repeating the question in the same words can be effective in eliciting a response.
2 Repeating the participant’s reply. Participants can be stimulated to provide further com-ments by repeating their replies verbatim. This can be done as the interviewer records the replies.
3 Using a pause or silent probe. A silent probe, or an expectant pause or look, can cue the participant to provide a more complete response. The silence should not become embar-rassing, however.
ProbingA motivational technique used when asking questions to induce the participants to enlarge on, clarify or explain their answers.

478 Marketing Research
4 Boosting or reassuring the participant. If the participant hesitates, the interviewer should reassure the participant with comments such as ‘There are no right or wrong answers. We are just trying to get your opinions’. If the participant needs an explanation of a word or phrase, the interviewer should not offer an interpretation, unless written instructions to do so have been provided. Rather, the responsibility for the interpretation should be returned to the participant. This can be done with a comment such as ‘Just whatever it means to you’.
5 Eliciting clarification. The participant’s motivation to cooperate with the interviewer and provide complete answers can be aroused with a question: ‘I don’t quite understand what you mean by that. Could you please tell me a little more?’.
6 Using objective or neutral questions or comments. Table 16.1 provides several examples of the common questions or comments used as probes.13 Corresponding abbreviations are also provided. The interviewer should record the abbreviations in parentheses next to the question asked.
The above list may seem to be simple, but there are hidden dangers. For example, probing ‘why’ participants behave in a particular manner or feel about a particular issue takes the interview into the realms of the qualitative interview. Compare the context of the street inter-view using a short, structured questionnaire with the context of the qualitative interview using a questioning approach structured to the participant and where a greater amount of rapport may be developed. The latter scenario is much more conducive to eliciting ‘why’ participants behave or feel as they do. The question ‘why’ is an example of a seemingly sim-ple question that can create many problems of consistency in fieldwork. In the greater major-ity of circumstances, ‘why’ should be treated as a qualitative issue. The following example illustrates the challenges of probing. Trying to uncover how participants really feel about an issue may be beyond simple probing.
Table 16.1
Standard interviewer’s probe Abbreviation
Any other reason? (AO?)Any others? (Other?)Anything else? (AE? or Else?)Could you tell me more about your thinking on that? (Tell more)How do you mean? (How mean?)Repeat question (RQ)What do you mean? (What mean?)Which would be closer to the way you feel? (Which closer?)Why do you feel this way? (Why?)Would you tell me what you have in mind? (What in mind?)
Commonly used probes and abbreviations
Real research The emerging digital frontier: does probing help?14
TNS Global (www.tnsglobal.com) managed an ongoing conversation or community with young people in China for over six months. To set up and run an online community meant adapting and adopting conversational research techniques, moving away from some of the question formats TNS used in focus groups. Typically, in a focus group, the

479Chapter 16 Survey fieldwork
conversation topics and flow are pre-set, with the moderator very much in charge. It was more challenging to manage the discussion in the same way online, where probing by the researcher may actually interrupt the atmosphere and create ‘distance’ between researcher and participants. TNS found it more insightful to give young people the space and time to talk about topics that they found engaging. Although they may have talked about completely irrelevant things from the desired topic, sometimes insightful infor-mation emerged unexpectedly. ‘Stories’ and ‘pictures’ were found to be more helpful than ‘what do you think . . . ’ or ‘in your opinion . . . ’ kind of questions. The participants would only engage when they liked the community and were willing to understand more about other participants in the community and to introduce more about them-selves. There was no hurry to ‘probe’, as researchers always had the opportunity to re-ask a question from a different angle or in a different way. TNS found with this community that young people were much more spontaneous online than in offline conversation. They were also very likely to answer a question very abruptly if they were not in the mood to elaborate; from time to time it was found difficult to gain responses with ‘depth’, but highly possible on another day when the participants initiated a relevant topic and some very interesting discussion took place voluntarily.
Recording the answers
Although recording participant answers seems simple, several mistakes are common.15 All interviewers should use the same format and conventions to record the interviews and edit completed interviews. Although the rules for recording answers to structured questions vary with each specific questionnaire, the general rule is to check the box that reflects the partici-pant’s answer. The general rule for recording answers to unstructured questions is to record the responses verbatim. The following guidelines help to record answers to unstructured questions:
1 Record responses during the interview.
2 Use the participant’s own words.
3 Do not summarise or paraphrase the participant’s answers.
4 Include everything that pertains to the question objectives.
5 Include all probes and comments.
6 Repeat the response as it is written down.
Concluding the interview
The interview should not be closed before all the information is obtained. Any spontaneous comments the participant offers after all the formal questions have been asked should also be recorded. The interviewer should answer the participant’s questions about the project. The participant should be left with a positive feeling about the interview. It is important to thank the participant and express appreciation.
Saying ‘thank you’ can take many forms. As well as genuinely thanking participants for their cooperation, it serves the purpose of educating participants about the nature and purpose of marketing research.

480 Marketing Research
Summary of training issues
To encapsulate the process of interviewer training, the following list summarises the nature and scope of areas in which a marketing research interviewer should be trained:
1 The marketing research process: how a study is developed, implemented and reported.
2 The importance of the interviewer to this process; the need for honesty, objectivity, organisational skills and professionalism.
3 Confidentiality of the participant and the client.
4 Familiarity with marketing research terminology.
5 The importance of following the exact wording and recording responses verbatim.
6 The purpose and use of probing and clarifying techniques.
7 The reason for and use of classification and participant information questions.
8 A review of samples of instructions and questionnaires.
9 The importance of the participant’s positive feelings about survey research.
Conversely, researchers should be trained in the ‘experience’ of gathering data in the field with a practical knowledge of what works in terms of:
• motivating potential participants to take part in a survey;
• questions that will elicit the required data;
• probes that can be consistently applied; and
• an interview process that does not confuse or cause boredom in the participant.
The researcher needs to appreciate what the participant and the interviewer go through in the interview process. Without such an understanding, the questionnaires and interview proce-dures, which seem fine on paper, can lead to very poor-quality data. The following example illustrates the experiences of a ‘typical’ participant and researcher. While the feelings expressed cannot be generalised to all interview situations, the lesson from this is that the researcher should aim to understand how the target participants and interviewers feel about the process. These feelings must form an integral part of any research design that generates sound and accurate data.
Real research How was it for you?16
A participant and an interviewer describe what their interview experiences were like for them.
The participantI felt sorry for the interviewer, she was going around all these houses and nobody was in, so I agreed to take part in the survey. The interview did not take that long, only about 10 to 15 minutes, slightly less time than the interviewer said it would. The interviewer was smartly dressed, professional and helpful. She prompted me but did not actually push me. The experience was enjoyable, it was fun, and not a bad way to spend 10 to 15 min-utes, although I think that was long enough. I like taking part in a survey if the subject matter is relevant to your life and you feel that your views are being taken into account.

481Chapter 16 Survey fieldwork
I think a lot of women prefer other females (or gay men) to interview them as there is an empathy there, and they might not feel they can be as honest or chatty with men. The age of the interviewer should relate to the subject matter. For example, if you are asking about children, then you should have an interviewer in a mother’s age group. I think it is important to actually be in the same position as someone being sur-veyed. In an interview, you should be honest, do not tell them what you think they want to hear, relax, be friendly and go with the flow. A lot depends on the participant as well as the interviewer. There has to be a bit of banter between the two of you.
The interviewerI do not have a typical day. If I am doing quota sampling I will do around 10 interviews a day. If it is pre-selected, then I will do 3 to 4 in-depth interviews. But if it’s exit inter-viewing, I can do as many as 20 in a shift. There are pressures to the job sometimes. Get-ting your quota is like looking for a needle in a haystack. People are much more suspicious, and fewer will open the doors these days. I have interviewed through wrought-iron gates, letter boxes, front-room windows and with the chain on the door. For your own safety, you must be aware of where you are and what’s around you. Technology has not made my job easier, I feel that interviewing using pen and paper flows better.
My job could be made easier by keeping questionnaires short, and using proper screening questions. The essence is to keep it interesting. The worst thing in the world is when you have got a survey that repeats itself and is boring; huge lists are our worst enemy. All I ask of a participant is that they are honest, they do not have to be articulate or have strong opinions. There are two keys to successful interviewing, smile and be polite at all times (so that it is very hard for people to be rude to you) and be firm and in control of the interview.
Supervising survey fieldworkers
Supervising survey fieldworkers means making sure that they are following the procedures and techniques in which they were trained. Supervision involves quality control and editing, sampling control, control of cheating and central office control.
Quality control and editing
Quality control of fieldworkers requires checking to see whether the field procedures are being properly implemented.17 If any problems are detected, the supervisor should discuss them with the fieldworkers and, if necessary, provide additional training. To understand the inter-viewers’ problems related to a specific study, the supervisors should also do some interview-ing. Supervisors should ensure that there are no technical problems in recording and transferring data through electronic means. If a survey is being conducted with hard copies of question-naires, the supervisors should collect and check them daily. They should examine the ques-tionnaires to make sure all appropriate questions have been completed, that unsatisfactory or incomplete answers have not been accepted. Supervisors should also keep a record of hours

482 Marketing Research
worked and expenses. This will allow a determination of the cost per completed interview, whether the job is moving on schedule and whether any interviewers are having problems.
Sampling control
An important aspect of supervision is sampling control, which attempts to ensure that the interviewers are strictly following the sampling plan rather than selecting sampling units based on convenience or accessibility.18 Interviewers tend to avoid homes, workplaces and people (sampling units) that they perceive as difficult or undesirable. If the sampling unit is not at home, for example, interviewers may be tempted to substitute the next available unit rather than call back. Interviewers sometimes stretch the requirements of quota samples. For example, a 58-year-old person may be placed in the 46–55 category and interviewed to fulfil quota requirements. To control these problems, supervisors should keep daily records of the number of calls made, the number of not-at-homes, the number of refusals, the number of completed interviews for each interviewer and the total for all interviewers under their control.
Validating survey fieldwork
An interviewer may falsify part of an answer to make it acceptable, or may fake answers. The most blatant form of cheating occurs when the interviewer falsifies the entire question-naire, merely filling in fake answers – either on their own or through the use of friends or family members. Cheating can be minimised through proper training, supervision and by rewarding interviewers properly. Most importantly, their work should be validated, which includes recording the names and contact details of participants.19 Supervisors usually call 10–25% of the participants to enquire whether the fieldworkers actually conducted the inter-views. The supervisors ask about the length and quality of the interview, reaction to the interviewer and basic demographic data. The demographic information is cross-checked against the information reported by the interviewers on the questionnaires. The major draw-back of this approach is that participants may not trust interviewers with a name and tele-phone number, perhaps believing that it is to be used to generate a sale.
Central office control
Supervisors provide quality and cost-control information to the central office so that a total progress report can be maintained. In addition to the controls initiated in the field, other con-trols may be added at the central office to identify potential problems. Central office control includes tabulation of quota variables, important demographic characteristics and answers to key variables.
Sampling controlAn aspect of supervising that ensures that the interviewers strictly follow the sampling plan rather than select sampling units based on convenience or accessibility.
Evaluating survey fieldworkers
It is important to evaluate survey fieldworkers to provide them with feedback on their perfor-mance as well as to identify the better fieldworkers and build a superior, high-quality field force. The evaluation criteria should be clearly communicated to the fieldworkers during their training. The evaluation of fieldworkers should be based on the criteria of cost and time, response rates, quality of interviewing and quality of data.20
Cost and time
Interviewers can be compared in terms of the total cost (salary and expenses) per completed interview. If the costs differ by city size, comparisons should be made only among field-workers working in comparable cities. Fieldworkers should also be evaluated on how they

483Chapter 16 Survey fieldwork
spend their time. Time should be broken down into categories such as actual interviewing, travel and administration.
Response rates
It is important to monitor response rates on a timely basis so that corrective action can be taken if these rates are too low.21 Supervisors can help interviewers with an inordinate num-ber of refusals by listening to the introductions they use and providing immediate feedback. When all the interviews are over, different fieldworkers’ percentage of refusals can be com-pared to identify the more able interviewers and to help understand what has impacted upon non-response for particular types of participant. Interviewers can be a rich source of under-standing why a particular survey works well or not.
Quality of interviewing
To evaluate interviewers on the quality of interviewing, the supervisor must directly observe the interviewing process. The supervisor can do this in person or the fieldworker can record the interview. The quality of interviewing should be evaluated in terms of: (1) the appropriateness of the introduction; (2) the precision with which the fieldworker asks questions; (3) the ability to probe in an unbiased manner; (4) the ability to ask sensi-tive questions; (5) interpersonal skills displayed during the interview; and (6) the manner in which the interview is terminated.
Quality of data
The completed questionnaires of each interviewer should be evaluated for the quality of data. Some indicators of quality data are that: (1) the recorded data are legible; (2) all instructions, including skip patterns, are followed; (3) the answers to unstructured questions are recorded verbatim; (4) the answers to unstructured questions are meaningful and complete enough to be coded; and (5) item non-response occurs infrequently.
Fieldwork and online research
Digital applications in marketing research
The majority of survey research is now conducted online and the fieldwork related to such approaches occurs in a virtual world. The skills and demands of fieldworkers where there may be no face-to-face, audio or visual contact are different from the more traditional tele-phone and face-to-face survey techniques. The underlying principles of fieldwork in terms of building a relationship with participants, eliciting data, managing and validating data, remain the same whatever mode of collection is adopted. What differs is the nature of fieldwork tasks. The following example illustrates the administration of a digital diary that contained survey elements. In evaluating this case, consider what fieldwork means and how quality fieldwork standards could be relevant for the target participants.
Note in this case how much work would be needed to build and maintain a good relation-ship with participants, and in this context what materials were designed and ‘fed’ to partici-pants. This relationship was vital to draw out what participants felt about particular issues; managing this in a consistent manner was a key fieldwork task.
In fieldwork activities where face-to-face or telephone contact is made, online systems can play a valuable role in all the phases of survey fieldwork: selection, training, supervision, validation and evaluation of fieldworkers. As far as selection is concerned, interviewers can be located, interviewed and hired online. This process can be initiated, for example, by

484 Marketing Research
posting job vacancy notices for interviewers on company websites, social networking sites, bulletin boards and at other suitable locations. While this would confine the search to only online-savvy interviewers, this may well be a qualification to look for in the current market-ing research environment.
Similarly, multimedia capabilities offered by online engagements can be a good supple-mentary tool for training fieldworkers in all aspects of interviewing. Training in this manner can complement personal training programmes and add value to the process. Supervision is enhanced by facilitating communication between the supervisors and the interviewers via email and secured chat rooms. Central office control can be strengthened by posting progress reports and quality and cost-control information at a secured location on a website, so that they are easily available to all the relevant parties.
Validation of fieldwork, especially for face-to-face and telephone interviews, can be eas-ily accomplished for those participants who have an email address or online access. These participants can be sent a short verification survey by email, or be asked to visit a website where the survey is posted. Finally, the evaluation criteria can be communicated online to fieldworkers during their training stage, and performance feedback can also be provided to them by using this medium.
Real research Careers, relationships and bullying22
The digital marketing agency Brass (www.brassagency.com) helped to develop a strat-egy for how the UK Government should communicate online with young people aged 14 to 19. The research project required panellists to keep a weekly diary of their lives in order to understand the challenges young people faced over a six-month period. Paper diary methods were not deemed suit-able; cumbersome hard-copy documents were not easy to use or sufficiently private. The solution was to design a bespoke pro-ject website to facilitate the diary process. The site was an extranet, effectively a ‘walled garden’, accessed via a username and password. The panellists could log on and write their entries, which would then be visible only to the project team. This ensured privacy – an important consideration as the project team was keen to make them feel comfortable and to get them to open up and share the details of their lives with the team. Each entry was recorded so the large number of entries could be categorised and analysed with relative ease. The website also allowed the project team to commu-nicate with the panellists, should they have any queries. To support participants, a 16-page booklet was created containing all the relevant project information such as the website’s URL, the contact details of their moderator, the dates they could expect their incentives once they had completed their blog entries, as well as the relevant Market Research Society information for reference. The aim was that the booklet would act as an aide-mémoire for the six-month fieldwork period. As the project pro-gressed, the team needed to get feedback from participants on the hypotheses that the creative team had developed. The team felt it important to ensure that the hypotheses were clearly explained – concisely and in a replicable manner – ensuring each partici-pant was given the same description in order to be consistent. Brass created an inter-active media player (similar to Windows Media Player) for participants to interact with.

485Chapter 16 Survey fieldwork
This took the form of a chaptered case study video. It was filmed from a central char-acter’s perspective showing a young person’s decision-making process about what career to choose, set over a six-week summer holiday. Different hypotheses were included in the narrative as the person progressed, such as taking part in an online careers fair. As each hypothesis was shown, an ‘information point’ icon appeared on the player; participants could click this to find out more about any third-party site being described (e.g. Habbo Hotel) if they were not familiar with it. Presenting ideas in this way was more user-centric, allowing participants a degree of active involvement in the process. They could pause the narrative to ask questions, repeat sections to recap on the ideas, or look at an ‘information point’ if they were unsure about a third-party website being described.
Fieldwork across countries and cultures
The quality of local fieldwork agencies can vary a great deal across many countries and so it may be necessary to recruit and train local fieldworkers. The use of local fieldworkers is desirable, because they are familiar with the subtleties of language and culture. They can cre-ate an appropriate climate for the interview and sensitivity to the concerns of the participants. Even with these advantages, extensive training may be required, and close supervision, in order to ensure that the questions are presented as intended. As observed in many countries, local interviewers may help the participant with answers or select households or sampling units based on personal considerations rather than the sampling plan. This means that the validation of fieldwork is critical. Proper application of fieldwork procedures can greatly reduce these difficulties and result in consistent and useful findings. International marketing research studies add more complexity, regardless of how simple a survey may seem. Collect-ing data that is comparable between countries may be difficult, but it can be done using some conventional research techniques, with adaptations when needed and/or using mixed-mode approaches. Equivalent research procedures enable researchers to detect, analyse and better understand the world’s socio-cultural differences.
Real research International fieldwork challenges in an Olympic Interest Survey23
ResearchNow (www.researchnow.com) conducted a study that had fieldwork chal-lenges to test its online access panels across the world. Specific countries were selected to ensure an interesting and likely diverse representation across five continents, includ-ing both established and emerging consumer markets. The countries examined were Australia, Brazil, China, the UK and the USA. The sample size was based upon 4,542 par-ticipants. The length of the interview was five minutes, covering interests and attitudes towards the Olympic Games. One of the prime considerations when designing the Olympic Interest Survey was whether consumers in the countries selected could be reached via online access panels. Panel members were sourced from a mix of email mar-keting, search engine optimisation, website banners, co-registration, affiliate and viral marketing. Panels were also sourced by offline methods such as converting telephone call lists and in-person interviews. However, as the majority of panels tended to be

486 Marketing Research
sourced online and future response rates depended on participating in an online modality, the extent of a country’s online penetration was considered. In designing the questionnaire and interview format, it could have been argued that an informal lan-guage style would be more appropriate for the ‘informal’ environment of the internet and social networking sites. However, Research Now recognised that in surveys designed to engage a wide range of consumers in a population, ‘informal’ may not always be suit-able. For the Olympic Interest Survey, therefore, a formal style was used as the target was a broad swathe of age groups and an informal style would have potentially appeared disrespectful to older participants. Interviews were conducted in the mainstream lan-guage of the country in which they were living: in Brazil, all were interviewed in Brazilian Portuguese; in China the interviews were in Mandarin; and in Australia, the UK and the USA, all were interviewed in localised English.
Real research Survey fieldwork from the inside of a four-tonne armoured vehicle24
While carrying out survey research has its challenges in Europe, the situation in other parts of the world can be far more difficult. UK Government statistician Kim Bradford Smith found this out first hand when she experienced arguably the world’s most chal-lenging research environment as part of a secondment to the Afghan Central Statistics Office in 2013. Due to war and instability, decision making in the country had suffered from a shortage of data, including lack of accurate estimates of the population of the country, out-of-date life expectancy and fer-tility rates and insufficient knowledge of where the population lived due to large-scale internal migration.
Even with international support, address-ing the shortage of data was difficult. Out-side of the capital, Kabul, security and cultural difficulties hampered data collection as Kim Bradford Smith highlights:
I quickly learned that survey and census taking is not an easy job in this country, where people are reluctant to answer their door to strangers, or be seen talking to strangers for fear of retribution. To ensure households felt comfortable responding to the survey, enu-merators were recruited from each of the local districts within Kabul Province. Of course, enumerators needed to be literate – which reduced the available pool of staff due to low levels of literacy across the country.

487Chapter 16 Survey fieldwork
Summary Researchers have two major options in the generation of sound research data: develop-ing data themselves from within their own organisations or contracting with fieldwork agencies. In either case, data collection involves the use of a field force. The growth in online research has changed the nature and emphasis of fieldwork. Traditionally, mar-keting research used a ‘personal attention’ approach, in which every interviewer paid attention to nurturing and addressing each specific participant. Online research has shifted the service design from a personalised to a more ‘self-service’ approach. Though fieldwork tasks differ between survey modes, especially comparing face-to-face with online approaches, the underlying principles of good fieldwork remain the same. Field-workers should be trained in important aspects of fieldwork, including making the initial contact, asking the questions, probing, recording the answers and concluding the inter-view. Supervising fieldworkers involves quality control and editing, sampling control, control of cheating and central office control. Validating fieldwork can be accomplished by calling 10–25% of those who have been identified as interviewees and enquiring whether the interviews took place. Fieldworkers should be evaluated on the basis of cost and time, response rates, quality of interviewing and quality of data collection.
Fieldwork should be carried out in a consistent manner so that, regardless of who administers a questionnaire, the same process is adhered to. This is vital to allow comparisons between collected data. Fieldworkers to some extent have to approach and motivate potential participants in a manner that sets the correct purpose for a study and that motivates the participant to spend time answering the questions prop-erly. This cannot be done in a ‘robotic’ manner; it requires good communication skills and an amount of empathy with participants. This makes the issue of managing field-work an essential task in the generation of sound research data.
Selecting, training, supervising and evaluating fieldworkers is even more critical in international marketing research because the quality of local fieldwork agencies can be highly variable between countries. Ethical issues include making the participants feel comfortable in the data collection process so that their experience is positive. The growth of online survey techniques has meant that the nature of participant engage-ment has changed. The skills and demands of fieldworkers where there may be no face-to-face, audio or visual contact are changing but the underlying principles of quality fieldwork remain the same.
Questions 1 Why do researchers need to use survey fieldworkers?
2 Describe the survey fieldwork/data-collection process.
3 What qualifications should survey fieldworkers possess?
4 What are the guidelines for asking questions?
5 Describe and illustrate the differences between probing in a survey and in an in-depth interview.
6 Evaluate what may be done to help interviewers probe correctly and consistently.
7 Outline the advantages and disadvantages of the interviewer developing a rapport with participants.
8 How should the answers to unstructured questions be recorded?
9 How should the survey fieldworker conclude an interview?

488 Marketing Research
10 What aspects are involved in the supervision of survey fieldworkers?
11 How can participant selection problems be controlled?
12 What is validation of survey fieldwork? How is this done?
13 Describe the criteria that should be used for evaluating survey fieldworkers.
14 Describe the major sources of error related to survey fieldwork.
15 Comment on the following field situations, making recommendations for corrective action:
a One of the interviewers has an excessive rate of refusals in face-to-face home interviews.
b In a CATI situation, many phone numbers are giving a busy signal during the first dialling attempt.
c An interviewer reports that, at the end of the interviews, many participants asked if they had answered the questions correctly.
d During validation of the fieldwork, a participant reports that they cannot remember being interviewed over the telephone, but the interviewer insists that the interview was conducted.
Exercises 1 Visit the websites of three major marketing research agencies. Evaluate how they present their quality management of fieldwork. Write a report that details what you feel to be the best elements of their respective practices. Note also what additional practices they should be highlighting to reassure potential marketing research buyers and users.
2 You are a field supervisor. Ask a fellow student to assume the role of an interviewer and another student the role of a participant. Train the interviewer to conduct a home interview by giving a live demonstration.
3 In teams of four, design a questionnaire to be used in a street interview. One of the team then takes on the role of the interviewer, the other three act as participants. Conduct three interviews and video the process. Replay the video and write a report that focuses upon:
a the questionnaire design;
b stopping and motivating participants;
c interviewer instructions;
d the consistency of the process; and
e ethical issues involved in the process.
4 Visit www.clinique.com and examine online databases, secondary data and intelligence sources to obtain information on men’s usage of moisturisers, soaps and shampoos. As a brand manager for Clinique, what information would you like to have to formulate brand extension strategies, targeted at men? How would you select and train fieldworkers to conduct a face-to-face survey (home, office or street) to determine men’s usage of ‘grooming products’?
5 In a small group, discuss the following issues: ‘What makes street interviewing a craft?’ and ‘Why do interviewers cheat?’.

489Chapter 16 Survey fieldwork
Video case exercise: HSBC
HSBC wishes to understand the changing expectations and lifestyles of its target customers and the social events they attend. It plans to target the rising wealthy strata of India to conduct a face-to-face home survey. HSBC has chosen three cities to conduct the fieldwork: Chennai, Delhi and Mumbai. What challenges would HSBC face in conducting fieldwork for this survey? What advice would you offer to help overcome these fieldwork challenges?
Notes
1. Malagoni, L. and Barnsdale, A., ‘A pint of lager and panel membership: Measurement of out-of-home TV viewing’, ESOMAR Panel Research, Orlando (October 2007).
2. Bednall, D.H.B., Adam, S. and Plocinski, K., ‘Ethics in practice: Using compliance techniques to boost response rates’, International Journal of Market Research 52 (2) (2010), 155–68.
3. Akaoui, J., ‘Brand experience on the pitch: How the sponsors fared in the World Cup’, Journal of Advertising Research 47 (2) (June 2007), 147–57.
4. Guest, G., Bunce, A. and Johnson, L., ‘How many interviews are enough? An experiment with data saturation and variability’, Field Methods 18 (1) (February 2006), 59–83; Gubrium, J.F. and Holstein, J.A., Handbook of Survey Research: Context and Method (Thousand Oaks, CA: Sage, 2000); Frey, J.H. and Oishi, S.M., How to Conduct Interviews by Telephone and In Person (Thousand Oaks, CA: Sage, 1995).
5. Dommeyer, C.J., ‘The effects of the researcher’s physical attractiveness and gender on mail survey response’, Psychology and Marketing 25 (1) (January 2008), 47–70; Sacco, J.M., Scheu, C.R., Ryan, A.M. and Schmitt, N., ‘An investigation of race and sex similarity effects in interviews: A multilevel approach to relational demography’, Journal of Applied Psychology 88 (5) (2003), 852–65; McCombie, S.C., ‘The influences of sex of interviewer on the results of an AIDS survey in Ghana’, Human Organization 61 (1) (Spring 2002), 51–5; Catania, J.A., Binson, D., Canchola, J., Pollack, L.M., Hauck, W. and Coates, T.J., ‘Effects of interviewer gender, interviewer choice, and item wording on responses to questions concerning sexual behaviour’, Public Opinion Quarterly 60 (3) (Fall 1996), 345–75; Coulter, P.B., ‘Race of interviewer effects on telephone interviews’, Public Opinion Quarterly 46 (Summer 1982), 278–84; Singer, E., Frankel, M.R. and Glassman, M.B., ‘The effect of interviewer characteristics and expectations on response’, Public Opinion Quarterly 41 (Spring 1983), 68–83.
6. Miles, K., ‘Improving the research interview experience’, Market Research Society: Annual Conference (2000).
7. Lai, J. and Shuttles, C., ‘Improving cooperation of Asian households through cultural sensitivity training for field interviewers’, Conference Papers – American Association
for Public Opinion Research (2004); Anon., ‘Renewing your interviewing skills’, Healthcare Executive 17 (1) (January/February 2002), 29; Kiecker, P. and Nelson, J.E., ‘Do interviewers follow telephone survey instructions?’, Journal of the Market Research Society 38 (2) (April 1996), 161–76; Guenzel, P.I., Berkmans, T.R. and Cannell, C.F., General Interviewing Techniques (Ann Arbor, MI: Institute for Social Research, 1983).
8. Rogelberg, S.G. and Stanton, J.M., ‘Introduction, understanding and dealing with organizational survey nonresponse’, Organizational Research Methods 10 (2) (April 2007), 195–209; Robertson, B., ‘The effect of an introductory letter on participation rates using telephone recruitment’, Australian & New Zealand Journal of Public Health 24 (5) (October 2000), 552; Feld, K., ‘Good introductions save time, money’, Marketing News 34 (5) (28 February 2000), 19–20; Couper, M.P., ‘Survey introductions and data quality’, Public Opinion Quarterly (Summer 1997), 317–38.
9. Bordeaux, D.B., ‘Interviewing Part II: Getting the most out of interview questions’, Motor Age 121 (2) (February 2002), 38–40; Anon., ‘Market research industry sets up interviewing quality standards’, Management Auckland 44 (2) (March 1997), 12.
10. Sethuraman, R., Kerin, R.A. and Cron, W.L., ‘A field study comparing online and offline data collection methods for identifying product attribute preferences using conjoint analysis’, Journal of Business Research 58 (5) (May 2005), 602–10.
11. This list follows closely the material in Interviewer’s Manual, rev. edn (Ann Arbor, MI: Survey Research Center, Institute for Social Research, University of Michigan, 1976); Guenzel, P.J., Berkmans, T.R. and Cannell, C.E., General Interviewing Techniques (Ann Arbor, MI: Institute for Social Research, 1983).
12. For an extensive treatment of probing, see Henderson, N.R., ‘The power of probing’, Marketing Research 19 (4) (January 2007), 38–9; Gubrium, J.F. and Holstein, J.A., Handbook of Interview Research: Context and Method (Thousand Oaks, CA: Sage, 2001), 15–19.
13. Ting, D.H., ‘Further probing of higher order in satisfaction construct,’ International Journal of Bank Marketing 24 (2/3) (2006) 98–113; Institute for Social Research, University of Michigan, Interviewer’s Manual, rev. edn (Ann Arbor, MI: Survey Research Center, 1976), 16.

490 Marketing Research
14. Ryan, L. and Klaassen, B., ‘Mapping the emerging digital frontier’, ESOMAR Annual Congress, Montreal (September 2008).
15. Trembly, A.C., ‘Poor data quality: A $600 billion issue’, National Underwriter 106 (11) (18 March 2002), 48; Anon., ‘Market research industry sets up interviewing quality standards’, Management Auckland 44 (2) (March 1997), 12; Morton-Williams, J. and Sykes, W., ‘The use of interaction coding and follow-up interviews to investigate comprehension of survey questions’, Journal of the Market Research Society 26 (April 1984), 109–27.
16. Park, C., ‘How was it for you?’, Research, Fieldwork Supplement (July 2000), 8–9.
17. Sparrow, N., ‘Quality issues in online research’, Journal of Advertising Research 47 (2) (June 2007), 179–82; Cri, D. and Micheuax, A., ‘From customer data to value: What is lacking in the information chain?’, Journal of Database Marketing and Customer Strategy Management 13 (4) (July 2006), 282–99; Pallister, J., ‘Navigating the righteous course: A quality issue’, Journal of the Market Research Society 41 (3) (July 1999), 327–43; Hurley, R.F. and Laitamaki, J.M., ‘Total quality research: Integrating markets and the organization’, California Management Review 38 (1) (Fall 1995), 59–78.
18. Sparrow, N., ‘What is an opinion anyway? Finding out what people really think’, International Journal of Market Research 53 (1) (2011), 25–39; Czaja, R., Blair, J. and Sebestik, J.P., ‘Participant selection in telephone survey: A comparison of three techniques’, Journal of Marketing Research (August 1982), 381–5.
19. de Jong, K., ‘CSI Berlin: The strange case of the death of panels’, ESOMAR Online Research, Berlin (October 2010); Frost-Norton, T., ‘The future of mall research: Current trends affecting the future of marketing research in malls’, Journal of Consumer Behaviour 4 (4) (June 2005), 293–301; Fielding, N.G., Interviewing: Four Volume Set (Thousand Oaks, CA: Sage, 2003);
Greengard, S., ‘50% of your employees are lying, cheating & stealing’, Workforce 76 (10) (October 1997), 44–53; Tull, D.S. and Richards, L.E., ‘What can be done about interviewer bias?’, in Sheth, J. (ed.), Research in Marketing (Greenwich, CT: SAT Press, 1980), 143–62.
20. Chapman, D.S. and Rowe, P.M., ‘The impact of videoconference technology, interview structure and interviewer gender on interviewer evaluations in the employment interview: A field experiment’, Journal of Occupational and Organizational Psychology 74 (3) (September 2001), 279–98; Johnson, C., ‘Making sure employees measure up’, HRMagazine 46 (3) (March 2001), 36–41; Pulakos, E.D., Schmitt, N., Whitney, D. and Smith, M., ‘Individual differences in interviewer ratings: The impact of standardization, consensus discussion and sampling error on the validity of a structured interview’, Personnel Psychology 49 (1) (Spring 1996), 85–102.
21. Manfreda, K.L., Bosnjak, M., Berzelak, J., Haas, I. and Vehovar,V., ‘Web surveys versus other survey modes: A meta analysis comparing response rates’, International Journal of Market Research 50 (1) (2008), 79–104; Smith, J., ‘How to boost DM response rates quickly’, Marketing News 35 (9) (23 April 2001), 5; Turley, S.K., ‘A case of response rate success’, Journal of the Market Research Society 41 (3) (July 1999), 301–9; Edmonston, S., ‘Why response rates are declining’, Advertising Age’s Business Marketing 82 (8) (September 1997), 12.
22. Shaw, S., ‘Communicating creatively: From digital media to stains on the bedroom floor’, Market Research Society: Annual Conference (2010).
23. Pearson, C., Smith, E., Ridlen, R., Zhang, H. and Cooper, A., ‘Using global online panels: A comparative study on the Beijing 2008 Olympics’, ESOMAR Asia Pacific Conference, Singapore (April 2008).
24. Bradford Smith, K., ‘Counting people in a conflict zone’, Significance Magazine (2016) 38–41.

Social media research
Stage 1
Problem definition
Stage 2
Research approach developed
Stage 3
Research design
developed
Stage 4
Fieldwork or data
collection
Stage 5
Data integrity
and analysis
17
Stage 6
Communicating research findings
Utilising social media data is
challenging, but increasingly
important to understand peoples
online lives. Researchers must
adapt and find new ways in which
to generate insights from this data.

492 Marketing Research
Objectives
After reading this chapter, you should be able to:
1 understand the concept of social media and how its usage varies between countries;
2 describe the difference between social media and a social network;
3 explain the key approaches to social media marketing research, including passive and active research strategies;
4 understand the use of crowdsourcing and market research online communities within social media research;
5 analyse the role and effectiveness of sentiment analysis techniques to generate insight from social media data;
6 discuss the limitations of social media research, including the difficulties in gaining access to data.
Over the last decade, social media has grown to play a crucial role in how individuals live their online lives and communicate with each other. Alongside search engines, it can be argued that social media is the defining feature of consumer use of the internet. It has been suggested that the growth in user-generated content and the ease with which opinions can be shared with friends, and strangers, has helped to tilt the balance of power towards customers and away from companies. As such, data held on social media sites provide an important channel through which to generate new insights into customers. Many researchers have recognised that social media provides a number of opportunities for marketing research, particularly around the analysis of user-generated data. At the same time, social media presents a paradox for marketing researchers. Despite the opportunities provided by new forms of data, the increased use of social media disrupts many of the more traditional approaches to research discussed elsewhere in this text. Nevertheless, a core part of marketing research is understanding social activity between consumers. If this social interaction has shifted from offline to online contexts, then researchers must adapt and find new ways in which to generate insights from this data.
This chapter begins by introducing a definition of social media that goes beyond classifications of technology platforms. Key approaches to social media research are then outlined, including both passive and active forms of research. Finally, the limitations of social media research are explored, with particular attention to the difficulties that researchers face when attempting to access data.
Overview
What do we mean by ‘social media’?
Before understanding the role of social media in research, it is first necessary to build a bet-ter understanding of exactly what is meant by the term. When thinking of ‘social media’, the first thing that comes to mind may be a particular social network that we use ourselves, such as Facebook, Twitter or Instagram. In other words, social media can be viewed as a specific set of technologies or platforms. This approach has some benefits, as leading social media platforms are distinctive and require some differentiation in the approach taken to manage them. However, this view ignores the fact that social media as a term existed long before Facebook or Twitter had got off the ground. To effectively understand social media as a concept, rather than as a list of technologies, a more holistic approach is needed.

493Chapter 17 Social media research
One common issue of terminology centres around the use of the terms social network and social media. Often these are used interchangeably, but within academic literature there is recognition that they encompass two different areas. Social media is understood as a wider term that reflects the sharing of user-generated content without necessarily leveraging exist-ing interactions between users.4 On the other hand, social networks can be understood as tools that enable communication between people who are already connected through some form of social group.5 Social networking sites can therefore be seen as making use of social media technologies (i.e. they are a subset of social media), but not all social media technol-ogy is necessary a social network.
UK academic Stephan Dahl identifies three categories of social media site:6
1 Social networking sites where the emphasis is on social networking between users who already know each other. Examples of these would be sites such as Facebook and LinkedIn. Here, online connections may be weaker than their offline counterparts, par-ticularly as the size of the networks gets larger, but there is nevertheless usually some personal connection.
2 Social media sites where there is user-generated content shared among users who are not known to each other – for example, hotel reviews on TripAdvisor or product reviews on Amazon. Although users may have something in common, such as having stayed in the same hotel, they do not normally know each other personally. The focus here is on the creation of user-generated content but not the maintenance of personal relationships.
Social mediaActivity that reflects the sharing of user-generated content without necessarily leveraging existing connections between users.
Social networkTools that enable communication between people who are already connected through some form of social group. Social networking sites can therefore be seen as making use of social media technologies (i.e. they are a subset of social media) but not all social media technology are necessary a social network.
Real research Social media around the world
When carrying out social media research, it is important to remember that the technolo-gies that individuals use vary around the world. Just because everyone you know makes use of a particular social media service, it doesn’t mean that the same can be said for the participants you are trying to reach.
In its early stages, social media was characterised by a high degree of fragmentation as different markets developed their own social media platforms from the ground up. Over time, network effects have led to these platforms coalescing into a smaller number of social media properties. Of these, Facebook has been the most successful in develop-ing a global appeal and has become the most popular social network in the majority of countries, with the number of Facebook users outside North America and Europe over-taking those within these regions as early as 2013.1 One analysis found that Facebook was the leading social network in 129 out of 137 countries included in the study.2 Growth in lower-income countries was helped by the importance Facebook attached to com-patibility with a wide range of mobile devices, including the lower-end mobile phones being used in these countries. The small number of countries where Facebook is not a leading social network, such as Russia, Iran or North Korea, can be seen as a reflection of of political and economic considerations within those countries. However, it is the use of social media within China that presents the greatest difference with social networks used in Europe or North America. Facebook, among other US-based firms, is effectively blocked through China’s Golden Shield Project (often referred to by the media as the ‘Great Firewall’), which controls access to internet traffic in and out of China.3 Because of the scale and size of the Chinese marketplaces, China has now developed its own social media ecosystem and marketing researchers should be careful to recognise the need to address local social media use patterns when operating in these markets.

494 Marketing Research
3 Sites that have aspects both of social network and social media. For example, photo-based sites such as Instagram or Flickr allow both the public and private sharing of photos.
The boundaries between these categories are not clear. Indeed, by allowing both public and private communications Facebook and Twitter could be said to be increasingly enabling communication in both categories simultaneously. However, the message that should be taken away from these definitions is the importance of relationships in social networks. It is the strength of the relationships that defines the nature of communication and, it could be argued, the quality of communication. One look at the generally low quality and usefulness of anonymous comments on sites such as YouTube highlights the role that personal connec-tions have in generating good-quality data from social media. Researching social networks can be seen, as with the study of social connections in the offline world, as study of relation-ships – not content.
The emergence of social media research
The attraction of social media for research purposes can be summarised in the following quote from Jack Dorsey, the founder of Twitter:
When people come to Twitter and they want to express something in the world, the technology fades away. It’s them writing a simple message and them knowing that people are going to see it.
In short, the value of social media in research is the idea that social media can give research-ers a view onto what people are really thinking, and that these data can be gathered and analysed on a mass scale.
The growth of social media research has emerged alongside the growth in online tech-nologies for research, which were covered in earlier chapters. Social media research pro-vides a number of advantages that could surmount many of the perceived limitations of traditional research methods, particularly those impacting surveys. These limitations have been driven by a ‘command and control’ paradigm of research, where researchers frame questions from their own social and cultural perspective while omitting certain topics that participants find important.7 Social media research could address the concerns of many in the marketing research sector who felt that, while internet technology was being adopted, researchers were using the same methods and techniques that they had always done. By being ‘stuck in the 90s’ researchers risk only scratching the surface of the kinds of insights that are available.8 As a result, the growth of social media has led not only to a number of new research methods, but also to critical reflection on the planning and implementation of traditional marketing research techniques.
The benefits of social media research can be seen as:9
• Spontaneity. Enabling access to natural, spontaneous conversations, to consumer agen-das, ways of thinking and the subtleties of their language.
• Heartfelt. More emotionally rich responses, facilitated by the anonymity of the internet.
• Cutting edge. Enabling access to more leading-edge and involved consumers – those who wish to articulate views (positive and negative) about brands, products, services and experiences.
• Immediacy. Enabling feedback in real time as events unfold, rather than when their impact begins to be felt in the marketplace.
At the same time, it is important not to get carried away by the potential for social media research to solve all the problems facing marketing researchers. Social media research has not replaced traditional marketing research; each approach has strengths and weaknesses.

495Chapter 17 Social media research
These are outlined in Table 17.1. It is important to remember the benefits listed above can only be realised if it is possible for researchers to readily access social media data. Gaining access to data is proving increasingly difficult and we will address these challenges later in this chapter.
Table 17.1 The relative strengths and challenges of traditional marketing research and social media research methods
Strengths Challenges
Traditional marketing research Robust theoretical underpinnings to sampling, research methods and data analyses
Gaining access to participants – declining response rates
Robust development of ethical codes of practice, especially in protecting participant anonymity
Complaints of boring research experiences
Breadth of quantitative and qualitative research methods to measure and understand participants
Debates over the quality of samples used in survey work, particularly when access panels are used
Focus upon specific existing or potential consumers to capture behaviour, attitudes, emotions, aspirations and sensory experiences
The costs and time taken to conduct high-quality research relative to other forms of data that may support decision makers
Social media research Can research target participants who would otherwise be very difficult to reach
Newly developed methods with little theoretical underpinning
Engaging experiences; technology and context suited to participants
Representativeness – can count incidences of behaviour, but research tends to be qualitative
Participants can express themselves in ways that they are comfortable with
Ethical challenges in maintaining participant anonymity
Speed of capturing a great amount of disparate data
Inability to target specific types of participants and/or specific issues
Approaches to social media research
Social media research methods can be broadly classified as passive and active.10 Passive social media research involves analysing what is already being discussed in social media channels. The analysis is therefore of pre-existing data. On the other hand, active social media research involves researchers engaging with communities themselves, or even start-ing them.
Passive social media research
Passive social media research is also known as ‘social listening’. Every day, billions of consumers talk about every aspect of their lives on social media. This wealth of natu-rally occurring consumer expression offers the opportunity to understand consumers on their terms, using their language and logic. People talk with one another about their problems, experiences, likes and dislikes, life in general and their feelings and experi-ences of products and services. They do this by having conversations on major social networks, such as Twitter or Facebook, but also on rate-and-review sites such as Trip-Advisor or Amazon, not to mention personal blogs or specialist community sites. By tuning into relevant conversations, it is argued that more can be learned about consumer
Passive social media researchAnalysing what is already being discussed in social media channels (i.e. the analysis of pre-existing data).
Active social media researchResearchers engaging with communities themselves or starting them (i.e. the active generation of social media data, such as through a MROC).

496 Marketing Research
attitudes and need than through traditional ‘questioning’ methods alone. By listening, researchers can learn more about their current and potential customers by understanding natural, rich and unfiltered word of mouth around the kinds of experiences individuals are having with products and services.
Real research Social listening at British Airways11
Every day, vast numbers of consumers share their views about products or services that they have experienced on social media. Mak-ing sense of such a large volume of unstruc-tured data can be a real challenge. Leading research agency TNS worked with British Airways to analyse more than 130,000 tweets over a three-month period. The data were reduced to focus on mentions related to cus-tomer experience and were then mapped onto the customer journey for a typical flight. Aspects around delayed flights received the most negative ‘buzz’, while the attitudes of staff the most positive.
This social-listening exercise was followed by interviews with 2,000 British Airways travellers to identify how important each step in the customer journey was in terms of building customer relationships. This revealed that social media buzz did not necessar-ily relate to building strong relationships. For example, the volume of negative social media feedback around delays was due to travellers waiting in departure lounges with access to Wifi – the opportunity to complain was therefore higher. Further analysis found that three areas would significantly increase the likelihood of travellers recom-mending British Airways: i) information about delays; ii) flexibility in dealing with missed flights; and iii) compensation. In turn, this analysis allows British Airways to understand better where to allocate its resources to social media activities.
Active social media research
Active social media research can be seen as an approach for both observing and engaging in what is being discussed and displayed on social media. Rather than standing back, observing and listening, researchers can join communities and may choose to direct spe-cific questions or tasks to participants. The main advantage of this approach is that researchers can direct participants and communities to address issues and questions that they deem to be important. They can also establish quality standards in how data is col-lected in much the same way that many qualitative researchers work. The main disadvan-tage is that specific research issues and questions driven by researchers may not be of interest to participants or communities. Great care has to be taken to protect the values of brands that may be seen as alien to the agendas of particular communities. For example, energy company British Gas asked its customers for suggestions on Twitter using the #AskBG tag around the same time that it was increasing prices. The subsequent sugges-tions from customers were at the heart of a PR disaster for the firm. For example, a typical response was ‘which items of furniture do you, in your humble opinion, think people should burn first this Winter? #AskBG’.12

497Chapter 17 Social media research
Real research How Braun used an online community to generate ideas for a new hairdryer13
Proctor and Gamble, owner of the Braun brand, worked with research firm HYVE Inno-vation Research to run what is known as a market research online community (MROC) to help in the development of ideas for a new hairdryer. Braun wanted to move beyond quantitative measures of brand preference and develop a deeper understanding of the underlying motivations behind product choice. Specifically, they wanted to build a bet-ter understanding of what the ideal hairdryer looked like and which features could be combined to make this ideal product. Establishing an online community provided a mechanism through which to achieve this. However, while a hairdryer is a relatively simple product to use from a features perspective, consumers may be less familiar with the engineering requirements and specific cababilities that make up a hairdryer. To resolve this issue a ‘digital configurator for hairdryers’ was provided that allowed for a point-and-click means through which to create combinations of ideas for new hair-dressers. This provided a visual way through which respondents in the community could translate their ideas into practical solutions that could be accepted within a goal-oriented R&D setup, where there are practical limitations on the kinds of solutions that can be provided.
This online community was successful because, by providing the digital configurator, the research participants were able to feel empowered and in control, while also creat-ing an efficient way of generating useful insights.
Accessing social media data
Early approaches to gathering social media data for research use often revolved around primary data collection via questionnaires or structured interviews.14 The limitations of this approach include the limited generalisability15 and poor respondent recall of the actions they have taken on particular social media channels. It was quickly recognised that social listening would need to be based upon a more automated analysis of actual data, which, in turn, is reliant upon the ability of researchers to be able to access data from these social media platforms.
The great difficulty, disappointment even, with social media research is the challenges involved in accessing data. These challenges have two aspects: (i) the difficulties in getting hold of the data in the first place; and (ii) the quality of the data once they have been accessed.
The difficulties in getting hold of data relate to the extent that social networks, or the indi-viduals who use these networks, allow researchers to access and analyse data. There is rela-tively limited access to authorised individual-level data from social networks. Of the major social networks, only Twitter provides access to its data through an API (Application Pro-gramming Interface), in a way that allows Twitter data to be built into other applications. However, even this requires a significant level of technical skills. It is for this reason (that it is possible to get access to a representative set of data) that use of Twitter data among researchers has been so widespread. This is problematic, as although a sample may be repre-sentative of Twitter it is not necessarily representative of the wider public.
On other social networks, official APIs that allow researchers to access underlying data are not common. Although Facebook has started providing some access to group-level data, this does not provide the potential for analysis of individual conversations and thought in the way that the individual-level data from Twitter does. Of course, there are a number of good

498 Marketing Research
reasons that social media firms have for restricting access to their data. Firstly, the business model of these companies is built around the collection and use of as wide a range of data as possible. This gives such firms a strong economic incentive to prevent external access to their data sets, which they consider as the principle asset of their firms. A second motivation is to protect the privacy of personal data that are held on social media. This is not purely driven by altruism, as firms are well aware of the impact that perceived privacy issues can have on usage of social media and, in turn, the information that individuals are willing to share.16 They therefore realise that restricting external access to data can be in both their interests and those of the users of social media.
Where data is unavailable through official channels, a second approach is the use of web ‘scraping’. Web scraping is essentially an application that is programmed to simulate a human user of a website and, while doing so, download and store information found on a web page.17 Web scrapers can visit millions, tens of millions, or even more pages, and have become a popular choice for building up a data set at low cost. They work because social media firms require some element of at least semi-public access to social media data to create and enhance the shareability of such data. Researchers should remember that data that are scraped should always be considered as a partial data set. This does not account for data that are private, not to mention data that have been deleted before the scraping took place. In addition, scraping typically focuses on individual accounts, which can fail to capture the social connectedness present within social media. Scraping also typically focuses on text data rather than the images or videos associated with such data – an increasingly important part of social media research.
Researchers should also be cautious of the ethical challenges caused by scraping data without the permission of the website owner. Scraping operates in a legal grey area, with an increasing complex set of laws and regulations covering the scraping of data without permis-sion, depending on which country a researcher is based in.18 Researchers should therefore consider using services that have secured the permission of content providers, even where this information provides access to a smaller data set. An example of such a company is the UK-based firm DataSift (www.datasift.com).
When dealing with these data there remain questions over the extent and quality of that data set as individuals move their personal communication onto private channels, be it pri-vate chat services such as WhatsApp, messenger services such as Facebook, or simply to make greater use of privacy settings within existing social media channels. As a result, an increasing portion of social media data are not accessible to researchers. Even where data are public, there is the challenge for researchers in effectively locating those data. Because the major social networks are often competitors to Google, searching for data on social networks is not as straightforward as searching for information on other parts of the web.
In summary, regardless of the potential for social media, a major restriction for research-ers is accessing appropriate sources of high-quality data. Despite the revolutions we have seen in technology, some of the challenges surrounding social media have similarities to those that have faced researchers trying to access traditional face-to-face samples!
Real research Can social media data be used to predict election outcomes?
A research problem that has been held up as a useful test of social media data analysis is whether it can be used to predict election outcomes. While predicting election outcomes is a difficult challenge, looking for opinions on social media has a number of advantages as a research activity. Elections happen on a specified date, have a discrete number of choices and involve a large proportion of the population generating a significant volume of social media data to analyse. Conversely, it could be argued that if it isn’t possible to generate useful outcomes from election data then it demonstrates the difficulty in trying to generate outcomes from less clear-cut data sets, such as those around brands.

499Chapter 17 Social media research
There have been a number of attempts to look at the link between social media data and political outcomes, including election results and politician popularity. Results over time have been mixed. For example, analysis of social media could not predict the out-come of the 2005 German Federal elections although it was more successful in the subse-quent German elections in 2009.19 Social media data overestimated the popularity of Barrack Obama as US President in 2008,20 while more accurate results were returned in the 2012 French Presidential Elections.21 These differences are to some extent reflective of the difficulties that all opinion researchers have in predicting election outcomes. The most public of these in a European context was the failure to predict the Conservative party majority in the 2015 UK General elections, resulting in an enquiry into the effectiveness of such opinion polls.22 This enquiry found that a major problem was unrepresentative sam-ples – that too many people who took part in polls were those who were deeply interested and engaged in politics. Analysis of discussion on social media of political issues tells a similar story, in that many of the (intense) discussions are from those who are deeply engaged with politics while the majority of individuals do not want to discuss their political views in such a public channel. In this sense, predicting election outcomes with social media faces the same challenge of accessing quality data that are available. It reminds us that social media data should primarily be thought of as qualitative and we should show caution when trying to make generalisations.
Perhaps this focus on predicting outcomes has got things the wrong way round. Given the increasing focus that political parties are putting upon communicating through social media,23 the real question may be how the use of social media influences outcomes?
Social media research methods
Sentiment analysis
One of the most commonly discussed ways that social media listening is carried out is through the use of sentiment analysis, sometimes referred to as ‘buzz analysis’ or ‘buzz min-ing’. This is a form of passive research that involves the analysis of data from social media and determining whether those data show an emotional response to a particular topic, such as a person, brand or product. At its most basic, sentiment analysis involves analysing whether a message on social media is positive, negative or neutral towards a particular brand, product or service. This might have a number of uses in marketing research, including as a measure of brand sentiment or to identify potential customer service issues.
Sentiment analysis is typically understood to be an automated process whereby a software algorithm analyses text automatically and then allocates a particular sentiment score to it. A common form of sentiment analysis relates to positive/negative/neutral classification. Take a look at the following two samples of social media data (Table 17.2) and judge whether the sentiment of each is positive, negative or neutral with regards to the food.
Table 17.2 Examples of social media data
Example 1 ‘If you love cold food, bad service and an evening of regret then you *must* trust this restaurant. 5 stars’
Example 2 ‘I had a great time at the theatre. Really entertaining. Tried to get into that new Italien restaurant but it was full so ended up at a MacDonalds! Not good.’

500 Marketing Research
It should be relatively easy to work out whether each of the above is positive, negative or neutral. Even though the messages have multiple contexts, spelling mistakes and use of humour it should still be straight forward for a human to identify the sentiment. However, dealing with thousands, or even millions, of data points that have been gathered from social media is not practical for individuals to manually analyse. Hence the need for automated analysis of sentiment.
Sentiment analysis is typically based around a dictionary approach, where individual words are attached to a particular sentiment, such as a positive or negative number, and the overall sentiment is calculated by adding the sum of words in a particular phrase. More sophisticated approaches and additional rules, or industry-specific phrases, can be added to improve the effectiveness of sentiment tools.
There are a number of reasons why automated sentiment analysis can have problems with accuracy:
1 Humour or sarcasm. Algorithms have difficulty in understanding humour or sarcasm – this form of content is particularly prevalent within social media messages.
2 Context. It is often hard to determine exactly what the subject is of the sentiment. One important aspect of context is that the same words can have different meanings depending on the way that they are used. Take, for example, the word ‘cool’. Phrases such as ‘that place was really cool’ and ‘the weather in that place was too cool’ carry with them differ-ent contexts depending on the way that the words are used.
3 Spelling and grammar. Social media data often have spelling errors, non-conventional sentence structure and slang, which can be difficult for dictionary-based sentiment analy-sis algorithms to correctly interpret.
4 Reliability of data. There is the question as to whether the data on social media, at least those data available publicly to researchers, are an accurate reflection of real sentiment. In other words, are people saying what they are really thinking when they post on social media, or a form of social media they regard as semi-public?
So far, the examples discussed assume that sentiment has only two levels – positive or negative. In reality, there are multiple levels of positive sentiment, and distinguishing between these is where sentiment analysis gets really challenging. Knowing whether a con-sumer is slightly unhappy or very unhappy may make all the difference when delivering high-quality customer service.
Real research Using emoticons to determine sentiment24
Although sentiment analysis tools make use of analysis of dictionary text, some researchers have recognised the importance of other forms of communication on social media. One example of this is research into emoticons.
With face-to-face communication it is rela-tively simple to determine sentiment by look-ing at the expression on someone’s face. In text-based online discussions it can be much harder to identify sentiment because people may be less likely to state their actual emotional state in text. A proxy for this is the use of emoticons, such as smiley :-) or sad :-( faces within social media test. In one recent study a team of researchers from the Netherlands looked at a large body of messages from

501Chapter 17 Social media research
Twitter and forum posts that contained emoticons. The research found that emoticons were used to express, stress, or disambiguate the emotion associated with a particular body of text. Including emoticons increased the accuracy of the attempts to classify sen-timent from 22% to 94%, suggesting that emoticons are a very good proxy for the actual sentiment of messages. As emoticons become more widely used (many smartphones now ship with keyboards with hundreds of emoticons included), researchers are begin-ning to recognise the important, but often complex, role that emoticons play in deter-mining human emotions.25
Entity recognition
Named entity recognition, or entity extraction, is a version of automated analysis of social media data. Instead of trying to infer sentiment (i.e human emotion) it analyses entities – or facts – in the text.
An example of entity extraction is given in Table 17.3, which is based upon an entity extraction for the text ‘I went with my family to Paris. We are staying in a terrible room – the air-conditioning is broken.’ This shows how a relatively small amount of text from social media, for example information from a review or complaint around a service experience, can be automatically thematically categorised. This could be seen as being equivalent to the sort of manual thematic analysis that is carried out in qualitative research. By enabling words to be allocated to categories it allows for the easier understanding of large volumes of data.
Table 17.3 Example of entity extraction
Highlight Entity name Types Categories Wikipedia URL
Paris Paris Place, populated place, settlement
3rd-century BC establishments, capitals in Europe, companions of the Liberation, European Capitals of Culture, host cities of the Summer Olympic Games, Paris, World Heritage Sites in France, prefectures in France
http://en.wikipedia.org/wiki/Paris
Air-conditioning Air-conditioning 1902 introductions, automation, cooling technology, heating, ventilating, and air conditioning, home appliances
http://en.wikipedia.org/wiki/ Air_conditioning
Entity extraction using the Dandelion Sentiment Analysis API (https://dandelion.eu/semantic-text/entity-extraction-demo/)
Social media communities and blogs
Although the focus of social media research is often on large, well-known platforms, there are many smaller communities that have social characteristics. While these communities may not get as much publicity as services such as Facebook, they play an important role in bringing together individuals with shared interests. They are beneficial from a research per-spective as they provide a level of focused content and shared interests. This solves some of the problems with finding samples appropriate for specific research questions that may occur with more general social media platforms.

502 Marketing Research
Online communities are spaces where individuals co-exist and share their interests and aspirations. An example of an online community is the UK-centric parents’ website Mumsnet (www.mumsnet.com). The idea behind this community was to create a website where par-ents could swap advice about parenting topics, such as schools, holidays or baby equipment, as well as non-parenting topics – such as what was on TV the previous evening. Mumsnet has grown to more than 17 million visits a month and is the leading parents’ site in the UK.26 Its influence is such that it has been cited as an important factor in influencing voter inten-tions, maybe even more important than the mainstream print media.27 But how can research-ers benefit from sites such as Mumsnet? Within such a community, individuals are likely to be emotionally charged, supportive and, most importantly, open. Given that such forums typically provide a form of anonymity that is less likely to be present on platforms such as Facebook, it might be argued that these sorts of online communities provide a form of open-ness, and richness of data, that is not found elsewhere. As a form of passive research, the content on such communities can be analysed to find out how people approach a specific problem or challenge. As these forums enable multiple actors to discuss and debate issues they could be regarded as having some of the characteristics of focus groups. The data gath-ered from online forums can therefore be analysed in the same way as text gathered from other forms of qualitative data collection, such as interviews or focus groups.
This example used just one example of an online community, but there are many, many others representing nearly every aspect of everyday lives. Their specificity, anonymity and reach means that they continue to succeed, even as more generalist social networks continue to grow. These networks are also more geographically and culturally defined, and because they serve smaller communities are likely to vary in terms of their reach. Examples of three categories of communities are given in Table 17.4.
Table 17.4 Categories and examples of online communities
Sports related Nearly every major sports team, and many minor ones, has both official and unofficial fan forums. For example, www.redcafe.net (Manchester United) or www.bayernkurve.de (Bayern Munich) are two unofficial football fan forums
Motoring While motoring forums are popular in terms of discussing particular car brands, forums also play an important role in terms of the construction of identities. For many car owners, the car you drive says a lot about who you are. For example, www.pistonheads.com (a UK-based motoring forum), www.volkswagenownersclub.com (for owners of Volkswagen cars) or www.speakev.com (a forum for discussion of electric cars)
Illnesses and health issues
The internet has played an important role in bringing together discussion among individuals with illnesses, often providing a way of sharing experiences and advice in a safe and anonymous way that could not be replicated in an offline context. For example, www.mentalhealthforum.net (a forum to discuss mental health issues) or www.spine-health.com/forum (for discussion of issues relating to spinal injuries)
While the above example of online communities facilitates passive analysis of pre-existing social media data, another important part of online research is the use of market research online communities, or MROCs (which were discussed earlier in Chapter 7). These online research communities are usually focused on a particular group of individuals who have been signed up (e.g. from a research panel) to take part in the community. However, given the costs in setting up an MROC they are typically established around a single brand, such as was highlighted in the earlier example of Braun. A dedicated brand MROC can enable a company to recruit a

503Chapter 17 Social media research
panel of ‘consumer-advisers’. A company and its researchers can engage with members using a variety of quantitative and qualitative techniques, often unfolding over a period of months. The brand MROC establishes a channel that decision makers and designers working for a brand can use to communicate with participants and engage in activities ranging from measur-ing attitudes, exploration and ethnography, to concept and product development and testing.28
Brand MROCs can be seen as a means to address specific research objectives. However, a fundamental difference between brand MROC and other research approaches is the extent to which they feature brand engagement. Within an MROC participants are actively encour-aged to immerse themselves in the world of the brand. This can mean that the aim of an MROC is to develop a relationship with participants to a stage where they become ‘critical friends’ to the brand, offering a level of deep and honest feedback that might not be achiev-able from those with lower levels of involvement.29 Some firms who use brand MROCs see research as being just one of several uses, and design and invest in these communities to address a wider spectrum of marketing purposes.30 Taking into account this wider range of uses, communicating to a brand community can fulfil three distinct purposes:31
1 The creation of brand ambassadors. This nurtures participants who are seen as thought leaders. With a deep understanding of the values and personality of the brand, plus an emotional commitment to the brand, these participants could be highly persuasive to an array of target markets.
2 The creation of brand analysts. This nurtures participants who would test particular con-cepts and designs. With a deep understanding of the brand, the ‘fit’ of a new idea to the values of a brand could be tested.
3 The creation of consumer insights. This elicits characteristics of participants’ behaviour, attitudes and emotions. Measuring and understanding characteristics of participants’ behaviour could work with a wide range of research techniques, allowing participants to reflect and express themselves in a variety of ways.
Blogs can be considered as another form of social media and could be characterised as a ‘community of one’. While blogs were a popular early form of social media research, the popularity of blogging has declined as other services, particularly online communities and social media, have taken over the earlier role of blogs.32 The weakness of blogs was building an audience, whereas social media sites are built around the concept of sharing information with existing audiences.
Where some emphasis of the MROC is towards researching and testing participants, com-munication within a community is vital to improve the ultimate quality of research. Every brand has distinctive values, a competitive landscape and potential directions in which it may develop. Participants can enrich their understanding of a brand and appreciate the array of marketing and design decisions that can share a brand’s future. With such enrichment and appreciation, participants can respond to research challenges in a more positive manner. The following example shows how an MROC is used by consumer goods company Diageo. Of particular note in this example is the importance of targeting communications at respondents in a highly personal way to help build engagement and a sense of community.
Real research Understanding, embracing and evolving marketing research online communities33
Diageo’s Altitude Lounge was an online community run by research company join the dots (www.jointhedotsmr.com/).34 Diageo is a consumer goods company with a port-folio of leading drinks brands. This MROC covered five markets: China, Germany,

504 Marketing Research
Researchers have long recognised the value of communities as a research tool, whether they are existing online communities, groups within social networks such as Facebook, or artificially created communities such as MROCs. The key challenge they face in working with communities is connecting with participants in an ethical way that maintains the integ-rity of the research process. Many online communities are wary of outsiders, even when they are bona fide researchers, to the extent that communities will often have rules preventing researchers from posting messages without previously gaining permission. When carrying out active social media research, it is therefore important that researchers gain permission (for example, from administrators or community influencers) as well as credibility among members of the community before they begin research.
Crowdsourcing
Crowdsourcing is the act of taking a job traditionally performed by a designated agent (usu-ally an employee) and outsourcing it to an undefined, generally large group of people, in the form of an open call.35 Crowdsourcing has been applied in many areas to perform services, design products and solve problems. In terms of conducting research, crowdsourcing ena-bles ideas to be elicited and actionable solutions based on those insights to be tested and developed. The process of crowdsourcing is a means to draw together the creative thinking and talents of a wide body of individuals. Through the use of online communities, a great breadth and diversity of thinking and talents can be drawn together to generate ideas and actionable solutions.
Perhaps the best-known example of crowdsourcing in action is Wikipedia (www.wikipedia.org) the free online encyclopaedia that has more than 5 million articles in the English edition alone.36 Every day an average of 800 new articles are added, and thousands more updated,
South Korea, the United Kingdom and the United States. Before development of the community they wanted to ensure that they were able to understand the cultural con-text of the countries in question. This helped them improve how they communicated with participants and learn more about what might motivate them to take part. The community consisted of a number of characteristics to help improve engagement among participants:
• Online guide. A visual help guide was translated into the languages of participants so it was easier to understand how the community worked.
• Native language. Emails about topics were sent out in native languages and styled in an appropriate way to reach members in each country.
• Private comments. They made it easier for people to make comments privately by enabling them to replay to their email address any further comments, rather than leaving these publicly in the discussion.
• Shared results. Specific feedback was offered to participants on the concepts they had tested, explaining the impact the research had on strategies applied by Diageo.
• Incentives. They offered premium alcohol as an additional incentive to participants, matching brands to the types of participant taking part.
• Prize. They conducted country-specific prize draws, which guaranteed a prize per country.
• User feedback. Members were asked what they liked about taking part and how they could improve the community. Diaego saw response rates improve substantially as participants became more interested in taking part in research.

505Chapter 17 Social media research
by individuals from all over the world. While Wikipedia has been identified as a useful source of information, concerns have been raised over a number of biases, not least gender bias. For example, a 2011 survey found that only 9% of those editing pages on Wikipedia were women,37 while at the end of 2015 it was reported that 85% of the individuals profiled in Wikipedia articles were men.38 The insights that are generated by crowdsourcing activi-ties must therefore be seen as driven by the characteristics of the crowd.
In the context of marketing research, crowdsourcing constitutes an active social media research method. Its impact is realised by researchers contacting and engaging self-selecting participants through different online communities, primarily through social media. If these individuals can be inspired by a particular research challenge that they see as being credible, they may spread the word to other individuals within their communities using, for example, social networks such as Facebook or Twitter. As with MROC-based communities, well-planned and targeted communications are vital to inspire individuals to become part of the crowd and to engage in the tasks that have been set.
Real research Bristol’s adventures in crowdsourcing39
Bristol City Council, the public body responsible for running the largest city in the South West of England, faced a major challenge in planning its future support for the city. Like many public sector bodies across Europe, it was facing declines in funding and needed to save 20 per cent from its budget. In order to plan these savings it decided to use crowdsourcing techniques. These techniques helped it to communicate the challenge it faced, generate ideas and issues from its citizens and to test the viability of the solutions it devised. The council decided to focus the creative energy of the crowd upon urban development in terms of areas that should be ‘cherished’ or ‘changed’. Crowdsourcing helped it to identify issues with Bristol’s central areas and develop solutions that fed into its Central Area Action Plan. Using social media platforms such as Facebook and Twitter, it spread the word that it wanted the public to suggest ideas for Bristol. Participants could make suggestions, upload photos and feedback on other ideas and potential solu-tions. The council took great care to make the process engaging, through the use of mapping techniques, presenting ideas that could be voted upon and with strong visual design to communicate results. The process integrated different social media sources, generating 925 comments, which were grouped into 10 main themes. Crowdsourcing worked well for Bristol but didn’t replace its other means to engage with citizens – pri-marily conducted through surveys and face-to-face meetings. In particular it maintained Bristol’s Citizens’ Panel, neighbourhood forum meetings and public displays and drop-in sections for consultation around big projects.
The Bristol crowdsourcing project was seen as a great success for the city and was used as an exemplar for other cities that also wanted to realise the benefits. However, despite the innovative nature of crowdsourcing it is important to recognise that the technique has a num-ber of disadvantages:
1 Self-selection bias. This is not a problem solely associated with crowdsourcing and, as has been highlighted earlier in this text, exists with many other types of research. However, the nature of crowdsourcing can accentuate the impact of any bias, as with the example of Wikipedia given earlier. Wherever participants choose to take part in a research project, the characteristics of the groups who have been drawn in can create specific challenges. Even where the ‘crowd’ is very large, notions of representativeness in sample survey

506 Marketing Research
terms can be dismissed. We must remember that brainstorming and debating ideas – central activities in crowdsourcing – are primarily qualitative tasks. As such, the qualities of participants and the quality of information drawn from them is key.
2 Disputes. Participants may have disagreements about particular ideas, or the way that these ideas are expressed. This is not a new problem itself, as disputes are a common fea-ture in any group-based form of qualitative research. Indeed, disputes play an intrinsic role in the nurturing of debate and seeking out of differences that are a key part of such research. The problem lies more in how disagreements may develop and are manifested. Anyone who has watched arguments develop online can understand how, in the absence of face-to-face communication, misunderstandings and differences can be exaggerated and arguments quickly get out of hand. In the same way that a moderator in a focus group maintains order and harmony in debates, it is even more important for moderators to be active in addressing any online disputes before they have the potential to get out of hand.
3 Public domain and intellectual property. The nature of the ideas that are generated through social media, and the ways that they are generated, can make them difficult to protect legally. In the case of Bristol City Council, as a public body it would be happy for any ideas and solutions to be in the public domain as there are no competitors to worry about. However, for commercial brands the use of such public domains may make it dif-ficult for it to protect any competitive advantage that it has gained. In an era where pro-tecting intellectual property is a key priority for commercial organisations, it may be difficult to identify exactly who owns an idea that has been developed online. This is particularly the case when those ideas have elements of design, for example logos, where the questions of ownership and intellectual property must be clearly articulated and agreed to by participants in any crowdsourcing activity.
Real research Can crowdsourcing predict the flu?
Monitoring, and predicting, the spread of outbreaks of influenza (flu) has become one of the greatest public health challenges in industrialised countries. Monitoring flu has also become one of the most widely used public examples of crowdsourcing being used in action. In 2008 Google started its ‘Google Flu Trends’ service, attempting to use search queries as a form of crowdsourcing to identify potential new cases of flu. The idea behind this tool was that it could be possible to predict the spread of flu by analysing the terms that individuals typed into a search engine. Specifically, if one tracks the way that the public searches for symptoms of flu on social media it may be possible to track out-breaks of flu before they happen. Although the Flu Trends service was effective for the first few years, the quality of findings began to worsen over time. Although the original results had a high correlation with incidents of flu,40 some researchers criticised the focus on correlation rather than causation. This meant that the Flu Trends service was, in part, a Winter detector41 and was producing positive results only as long as the onset of flu cases was tied to the onset of Winter. Facing declining accuracy, Google finally closed down its public Flu Trends service in 2015, although it continues to provide the data to other public health bodies and explore ways to make the data generated by the service more accurate.42

507Chapter 17 Social media research
Gamification
Gamification refers to the applications of the principles of gaming into traditionally non-game processes, such as education and research. This is achieved through the purposeful introduction of mechanisms that are designed to elicit specific, predictable behaviours, while simultaneously absorbing individuals in the experience by making it engaging and compel-ling.43 Gamification has its origins in the emergence of the concept of ‘serious games’ in the 1970s. This recognised that games could play a role in enabling individuals to navigate the increasing abstraction of everyday life and deal with the consequences of an ever more tech-nologically complex society. The use of the word ‘serious’ served to reinforce the educa-tional purposes of such games. An early example of serious games technology was in military war games, and given the costs of technology at the time it is perhaps not surprising that most uses were in the security or defence sectors. Over time, as technology has improved and costs have lowered, the concepts behind ‘serious games’ have found their way into the main-stream.
A definition of gamification identifies it as ‘the process of adding game mechanics to processes, programs and platforms that wouldn’t traditionally use such concepts’.44 The enthusiasm over gamification among researchers has been driven by the observation that games engage people, and that this engagement is sustained over a period of time45 It stands that gamification techniques may have a role to play in improving engagement with research, and therefore the quality and volume of responses.
In research, two types of gamification can be identified.46 The first has been labelled as ‘hard gamification’47 which refers to embedding research instruments, for example survey questions, within a game. These are closer in practice to a computer game and it may be the case that participants do not even realise that they are taking part in a research project. Gamifi-cation is often misunderstood as being about turning something serious into something that looks like a computer game. However, a more typical approach to gamification in marketing research is through the use of game mechanics within the context of existing research techniques – known as‘soft gamification’.48 This involves applying certain characteristics of games that are associated with motivation or engagement, rather than actually turning the research process into a ‘game’. Examples of game mechanics include status, reward, competition and achieve-ment.49 Perhaps the most common form of a game mechanic is the provision of a reward for completing certain tasks.50 The use of this can be seen in many online customer communities that provide an opportunity for consumers to gain status through points or badges in return for posting. For example, the e-commerce site Amazon provides a number of badges for frequent reviewers, including ‘#1 Reviewer’ and ‘Top 1000 reviewer’. Rewards can also be provided for encouraging desirable behaviour, such as the Amazon ‘Real Name’ badge, given to indi-viduals who provide accurate data when leaving online reviews. Another example is the online fashion retailer ASOS, which enables users to create and then share ‘outfits’ with other online shoppers and compete to see who receives the most ‘follows’. These examples reinforce the point that gamification is not about the application of computer games but is rather through more subtle addition of game elements within the context of existing processes.
These kinds of gamification techniques can be applied in the context of marketing research, for example:
• Question framing. Use questions that encourage participants to put themselves into a spe-cific context.
• Use of question rules. Impose a time limit on answering a question, or require a response to be given in a particular number of words.51
• Reward and achievement. Give participants in online communities points or other activi-ties in return for taking part in research.
• Competition. Enable participants to see their responses in relation to other participants’.
• Use of visuals. The use of images, such as emoticon ‘smiley/sad’ faces, in survey responses.
GamificationThe process of adding game mechanics to processes, programs and platforms that wouldn’t traditionally use such concepts.

508 Marketing Research
Although gamification remains a ‘hot’ topic, the processes and techniques through which it can be integrated into everyday marketing research are not yet fully developed. For exam-ple, questions might be asked about how ‘gamifying’ research processes influences the responses that are given. Does encouraging research participants to be more active, through rewards or competition, create risks around bias? Even small changes in question order or wording are understood to impact findings, and encouraging faster, longer or more frequent responses could increase the proportion of inaccurate responses.52
In general terms, gamification in research can be understood as finding the elements that encourage motivation and engagement in traditional games and then building this into the areas of the research process where participant motivation and engagement is missing. Within social media research gamification can help to improve the participant experience and make the overall process more entertaining. This kind of mind-set can improve research in all areas, even in survey design. However, it is in social media research that gamification can be most easily applied and most readily benefitted from.
Research with image and video data
Much of the focus of this chapter so far has been on the analysis of text data. This is not sur-prising, given the overall focus of market research on collecting and analysing forms of text. However, an increasing proportion of data that are created on social media take the form of non-text data, such as images and video. This can be put down to the omnipresence of high-quality mobile screens available wherever consumers go.53 Indeed, in terms of data volume it is image and video content that dominates online postings, particularly among millennial age groups. Some social media platforms, such as Instagram, have built their popularity almost entirely based around the posting of images, while YouTube and the growing volume of video posted on Facebook demonstrate the value of video as a way through which indi-viduals project their self-identity. To fully understand the way that social lives are lived online, marketing researchers need to be able to apply effective tools that enable the analysis of such visual data.
Alongside the automated analysis of text data from social media there is increasing interest in the role of automated analysis of images. As with the automated analysis of text, images analysis seeks to extract both sentiment and entity (i.e. fact) information from online data. Although this technology has typically been expensive and of varying accuracy, the quality of the technology is improving while the price is reducing. One example of this is the Vision API from Google54 (https://cloud.google.com/vision/), which uses advanced machine learning technology to understand the content of images.
The Google Vision API can determine examples of content within photographs including:
• Objects. Thousands of common categories of objects, including flowers, animals and transportation.
• Detecting inappropriate content. Using the same technology behind the Google ‘safe search’ functionality, it allows identification of various types of inappropriate content.
• Image sentiment analysis. This analyses facial expressions of people in a photo, for exam-ple joy, sorry or anger.
• Text extraction. Using optical character recognition, text in images can be identified, together with the language in the text.
In terms of marketing research, a practical use for this sort of artificial intelligence tech-nology might be to identify brand names of products or brands in a photo. More advanced uses that may become common in the future include analysing the emotions of customers, either through photo or video analysis.

509Chapter 17 Social media research
As it stands, Google Vision requires considerable technical skills to integrate into research software and cannot be used directly on its own. However, it demonstrates the potential of technology to automate not only analysis of text but also of images. The technology will not stop here, with researchers already focusing on the next challenge – the automated analysis of videos. It is also important to remember the limitations of automated analysis of image data. While the ability of algorithms to derive meaning from photos may seem impressive, it can only gather a small proportion of the data that could be gathered via human analysis. As with automated text analysis, such algorithms are poor at identifying context, social and cultural cues and levels of sentiment. While the use of these automated tools is likely to increase within research, there will also remain an important role for manual analysis.
Limitations of social media research
While there are a number of specific limitations of social media research, a general one is the amount of hype that has surrounded discussion of the commercial use of social media. Many of the forms of communication that happen through social media were going on long before social media appeared. As such, social media can be thought of as evolutionary rather than revolutionary, with its impact being on speeding up and expanding the geographic bounda-ries of communication.55 Although this is an important trend, the limits of social media research mean that the potential for generating insights does not always live up to the hype, as was highlighted by the earlier example of crowdsourcing with Google Flu Trends.
While technology is constantly improving, there remain a number of factors that limit the potential utility of social media for marketing research and go beyond what can be addressed through technological innovation alone.
Does what people say on social media reflect what they are actually thinking?
An assumption of much research with social media data is that it accurately reflects what people are thinking. However, access to social media data is often reliant on public or semi-public data. This raises the question of whether the social media data that researchers can access is reflective of actual beliefs and behaviour.
Are marketing researchers welcome on social media?
When carrying out active social media research it is necessary to address the question of whether researchers are welcome on social media platforms. Many online forums now have policies that specifically prohibit researchers from posting invitations to take part in surveys or interviews, suggesting that the volume of researchers (or marketers posing as legitimate researchers) seeking access to data via social media is too great. This reinforces the impor-tance of gaining permission before accessing social media data.
Where do the boundaries of public vs. private data lie on social media?
The boundaries of public and private data on social media are not necessarily clear. While data may be accessible through an API or other service, just because they can be accessed by researchers does not mean that the original poster intended it to be fully public. Privacy set-tings are not always clear, and how can we be sure that the ‘participant’ has agreed that their data have been freely made available to participate in the research? (These difficult issues will be addressed in Chapter 30, when we focus on key ethical issues in research, many of which relate to social media.)

510 Marketing Research
Summary Social media has become an important part of the way in which individuals communi-cate. Understanding the role of social media in research plays an important part in being an effective researcher in today’s business environment. This chapter has intro-duced the concept of social media as a set of technologies that exist throughout the web, rather than named platforms such as Facebook and Twitter. A broad range of sites can be classified as having elements of social media, leading to a wide range of opportunities for data collection. The core characteristic of social media can be seen as user-generated content, while social networks can be defined as a subset of social media focused on facilitating communication between individuals who have a pre-existing relationship.
Techniques for analysing social media can be split into passive and active research. While passive techniques, such as sentiment analysis, present the great-est potential for generating new insights, there are significant challenges in terms of researchers being able to access data. Active social media techniques leverage existing research techniques but position them in the context of social media. Per-haps unsurprisingly, given the growth in social media use among consumers, there has been a great deal of hype over the potential for social media research to provide new and valuable streams of data for analysis. However, the potential of social media research is hindered by a number of challenges, principally around the difficulty in accessing data as well as questions over participant willingness to accept researchers operating in what, to many, is the private space of social media. Despite these challenges the increasing importance of social media in consumers’ lives means that its importance in research activities is only likely to increase in coming years.
Questions 1 Describe the nature of social media research.
2 What is the difference between social media and social networks?
3 Evaluate the factors that have led to the growth of social media research.
4 What are the key differences between active and passive forms of social media research?
5 What is crowdsourcing? What are the advantages and disadvantages of this method?
6 What is gamification and how can gamification techniques be used to improve research?
7 What is an MROC? How does use of an MROC differ from passive approaches to research?
8 Why is analysing image data on social media important?
9 Discuss the key challenges relating to accessing social media data for research.
10 What is sentiment analysis? Why can automated sentiment analysis of social media be so difficult?

511Chapter 17 Social media research
Exercises 1 In groups, discuss which online communities you are members of. Select one of these communities and consider the range of research issues that might be addressed using the data that are available.
2 Select a brand, product or service with which you are familiar and identify some discussions taking place about the organisation you have selected on a social media site (for example, Twitter). Looking at these data, identify any issues that might occur if attempting automated sentiment analysis on this text.
3 In small groups, discuss the following statement: ‘The information people post on social media is unreliable – it’s mostly people showing off and doesn’t reflect what they are really thinking or feeling.’
4 One of the fastest-growing content types on social media is video. Using the information in this chapter, as well as information on analysis covered previously in this text, consider the ways in which researchers could analyse video content on social media as part of a passive research strategy.
Notes
1. Internet World Stats, ‘Facebook users in the world’, http://www.internetworldstats.com/facebook.htm, accessed 28 April 2016.
2. World Map of Social Networks, ‘World Map of Social Networks January 2016’, http://vincos.it/world-map-of-social-networks/, accessed 28 April 2016.
3. Torfox, ‘The Great Firewall of China: Background’, http://cs.stanford.edu/people/eroberts/cs181/projects/2010-11/FreedomOfInformationChina/the-great-firewall-of-china-background/index.html, accessed 28 April 2016.
4. Kaplan, A. and Haenlein, M., ‘Users of the world, unite! The challenges and opportunities of social media’, Business Horizons 53 (1) (2010), 59–68.
5. Boyd, D. and Ellison, N., ‘Social network sites: Definition, history, and scholarship’, Journal of Computer-Mediated Communication 13 (1) (2007), 210–30.
6. Dahl, S., Social Media Marketing (Sage: London, 2014).
7. Kearon, J. and Earls, M., ‘Me-to-we research’, ESOMAR Congress, Leading the Way, Montreaux (September 2009).
8. Oxley, M. and Light, B., ‘Research 2.0: Engage or give up the ghost?’ Market Research Conference (2010).
9. Besprosvan, K. and Ovarzun, D., ‘“Tweetmiotics” – using Twitter as a consumer centric research tool’, ESOMAR Online Research, Chicago (October 2009).
10. Cierpicki, S., Cape, P., Lewis, A., Poynter, R. and Viera, S., ‘What does research 2.0 mean to consumers in Asia Pacific?’ ESOMAR Asia Pacific Conference, Beijing (April 2009).
11. Nau, C. and Mütze, B., ‘You’re listening, but are you learning? Deciphering social mentions to improve customer experience’ TNS, Intelligence Applied (June 2015).
12. Dahl, S., Social Media Marketing (Sage: London, 2014).
13. Bilgram, V., Stadler, D. and Stahl, G., ‘(Con-)figure it out! How Braun uses product configurators to empower consumers in MROC environments and turn ideas into new products’, ESOMAR Qualitative (November 2014).
14. Domingos Canhoto, A. and Clark, M., ‘Customer service 140 characters at a time – the users’ perspective’, Journal of Marketing Management 29 (5–6), (2013) 522–44.
15. Lenhart, A., Purcell, K., Smith, A. and Zickuhr, K., ‘Social media and mobile internet use among teens and young adults’. Millennials: Pew Internet & American Life Project. Vancouver (2010).
16. Tessem, B., and Nyre, L., The influence of social media use on willingness to share location information, Lecture Notes in Computer Science 8058 (2013) 161–72.
17. Wagnon, J., ‘Web scraping – data collection or illegal activity?’, https://devcentral.f5.com/articles/web-scraping-data-collection-or-illegal-activity, accessed 29 April 2016.
18. ‘Website operators can prohibit “screen scraping” of unprotected data via terms and conditions, says EU court in Ryanair case’, http://www.out-law.com/en/articles/2015/january/website-operators-can-prohibit-screen-scraping-of-unprotected-data-via-terms-and-conditions-says-eu-court-in-ryanair-case/, accessed 29 April 2016.
19. Tumasjan, A., Sprenger T.O., Philipp, G.S., et al. ‘Predicting elections with Twitter: What 140 characters reveal about political sentiment’ in: Proceedings of the Fourth International AAAI Conference on Weblogs and Social Media, Washington, DC, (23–26 May).
20. Gayo-Avello, D. ‘Don’t turn social media into another “Literary Digest” poll,’ Communications of the ACM 54 (10), 121–8.
21. Ceron, A., Curini, L. and Iacus, S., ‘Every tweet counts? How sentiment analysis of social media can improve our knowledge of citizens’ political preferences with an application to Italy and France’, New Media & Society 16 (2), 340–58.

512 Marketing Research
22. ‘Report of the Inquiry into the 2015 British general election opinion polls, National Centre for Research Methods’, http://www.ncrm.ac.uk/polling/document.php, accessed 29 April 2016.
23. Hong, S. and Nadler, D., ‘Which candidates do the public discuss online in an election campaign?: The use of social media by 2012 presidential candidates and its impact on candidate salience’, Government Information Quarterly 29 (4), 455–61.
24. Hogenboom, A., Bal, D., Frasincar, F., Bal, M. de Jong, F. and Kaymak, U., ‘Exploiting emoticons in sentiment analysis; SAC, (13 March 2013) Coimbra, Portugal, 18–22.
25. Robb, A., ‘How using emoji makes us less emotional’, https://newrepublic.com/article/118562/emoticons-effect-way-we-communicate-linguists-study-effects, accessed 29 April 2016.
26. http://www.mumsnet.com/info/aboutus, accessed 29 April 2016.
27. www.mumsnet.com/media/mumsnet-election, accessed 29 April 2016.
28. Kennedy, J. and Gerard, L., ‘Online community platforms – a macro-overview and case study’, ESOMAR Online Research, Chicago (October 2009).
29. Child, P., Fleming, K., Shaw, R. and Skillbeck, T., ‘Vive La Difference: Understanding, embracing and evolving MROCs globally’, ESOMAR Online Research, Chicago (October 2009).
30. Ewing, T. ‘Cultures of collaboration’, Market Research Society, Annual Conference (2010).
31. Wilson, D. and Birks, D.F., ‘The development of the KubeMatrix™ as a mobile app for Market Research Online Communities’, The Association for Survey Computing, 6th International Conference, Bristol (2011).
32. Kopytoff, V., ‘Blogs wane as the young drift to sites like Twitter’, New York Times, (2011), http://www.nytimes.com/2011/02/21/technology/internet/21blog.html, accessed 29 April 2016
33. Child, P., Fleming, K., Shaw, R. and Skillbeck, T., ‘Vive La Difference: Understanding, embracing and evolving MROCs globally’, ESOMAR Online Research, Chicago (October 2009).
34. ‘Diageo – travel retail community: Altitude Lounge’, https://www.jointhedotsmr.com/case-studies/diageo/, accessed 29 April 2016.
35. Howe, J., Crowdsourcing: How the Power of the Crowd is Driving the Future of Business (London: Random House Business, 2009).
36. ‘Wikipedia: Statistics’, https://en.wikipedia.org/wiki/Wikipedia:Statistics, accessed 29 April 2016.
37. ‘Gender bias on Wikipedia’, https://en.wikipedia.org/wiki/Gender_bias_on_Wikipedia, accessed 29 April 2016.
38. ‘Female scientist fights harassment with Wikipedia’, http://www.bbc.co.uk/news/blogs-trending-35787730, accessed 29 April 2016.
39. McDermott, A. and Higgins, P. ‘Bristol’s adventures in crowdsourcing’, Association for Survey Computing,
Shifting the Boundaries of Research, 6th International Conference, Bristol (September 2011).
40. Ginsberg, J., Mohebbi, M., Patel, R., Brammer, L., Smolinski, M. and Brilliant, L., ‘Detecting influenza epidemics using search engine query data’ – Nature 457 (2009), 1012–14.
41. ‘Google Flu Trends is no longer good at predicting flu, scientists find’, www.theguardian.com/technology/2014/mar/27/google-flu-trends-predicting-flu, accessed 29 April 2016.
42. ‘The next chapter for Flu Trends’, http://googleresearch.blogspot.co.uk/2015/08/the-next-chapter-for-flu-trends.html, accessed 29 April 2016.
43. Albets, K. and Findley, F. ‘Gamification: Future or fail’, South African Market Research Association (SAMRA) Conference (2011).
44. Swan, C., ‘Gamification: A new way to shape behavior’, Communication World 29 (3) (2012), 13–14.
45. Insley, V. and Nunan, D., ‘Gamification and the online retail experience’, International Journal of Retail & Distribution Management 42 (5) (2013).
46. Bailey, P., Pritchard, G. and Kernohan, H., ‘Gamification in market research: Increasing enjoyment, participant engagement and richness of data, but what of data validity?’, International Journal of Market Research 57 (1) (2015), 17–28.
47. ‘Four types of gamification that can be used in market research’, http://theicg.co.uk/opinion/6000072/four-types-of-gamification-that-can-be-used-in-market-research, accessed 29 April 2016.
48. Bailey, P., Pritchard, G. and Kernohan, H., ‘Gamification in market research: Increasing enjoyment, participant engagement and richness of data, but what of data validity?’, International Journal of Market Research 57 (1) (2015), 17–28.
49. Zichermann, G. and Cunningham, C. ‘Gamification by design: Implementing game mechanics in web and mobile apps’, O’Reilly Media, Sebastopol, CA (2011).
50. Swan, C. ‘Gamification: A new way to shape behavior’, Communication World 29 (3) (2012), 13–14.
51. Bailey, P., Pritchard, G. and Kernohan, H., ‘Gamification in market research: Increasing enjoyment, participant engagement and richness of data, but what of data validity?’, International Journal of Market Research 57 (1) (2015), 17–28.
52. Earthy, P.J., MacFie, H.J.H. and Hedderley, D., ‘Effect of question order on sensory perception and preference in central location trials’, Journal of Sensory Studies 12 (3) (1997), 215–37.
53. Sparkler and Instagram, ‘The Instagram lens: Ways of seeing in the digital age’ MRS Awards: Finalist (December 2015).
54. ‘Google Cloud Vision API enters Beta, open to all to try!’, https://cloudplatform.googleblog.com/2016/02/Google-Cloud-Vision-API-enters-beta-open-to-all-to-try.html, accessed 29 April 2016.
55. Dahl, S., Social Media Marketing (London: Sage, 2014)

Mobile research
Stage 1
Problem definition
Stage 2
Research approach developed
Stage 3
Research design
developed
Stage 4
Fieldwork or data
collection
Stage 5
Data integrity
and analysis
18
Stage 6
Communicating research findings
Mobile devices are often the
primary means through which
individuals interact with the
internet. Any methods used by
marketing researchers must
therefore be effective on mobile.

514 Marketing Research
Objectives
After reading this chapter, you should be able to:
1 understand the scope of the term ‘mobile device’;
2 understand how mobile devices are impacting consumer behaviour;
3 evaluate key approaches to the use of mobile devices within marketing research;
4 discuss the benefits and issues associated with the collection of passive data from mobile devices;
5 consider the implications of a ‘mobile first’ strategy for research design;
6 evaluate the differences in response rates and quality between mobile and non-mobile platforms.
Mobile devices are ubiquitous; six out of every seven adults in the world use a mobile phone and mobile devices now outnumber people.1 Another statistic with resonance for marketing researchers is that in most developed countries the number of people who only have a mobile device is now greater than those who have a landline.2 In some countries the segment of the population that used only a mobile phone was dominant as far back as 2007,3 and in developing markets this trend is likely to only be more pronounced. However, the use of mobile devices for phone calls is only half the picture, as phone calls are no longer the main use of mobile devices – having been replaced by apps and use of the mobile internet. In terms of internet services, there is more usage of Facebook and Google on mobile devices than on laptops or desktop. Mobile has therefore become a key consideration in any marketing strategy and, as a result, has become of critical importance for marketing research.
If mobile devices are the primary means through which individuals interact with the internet, then it stands to reason that any methods used by marketing researchers must be effective on mobile devices. As a result, mobile research is not something that researchers do to reach a specific group – it needs to be considered in all forms of research. For example, if a link to take part in a survey is emailed to potential respondents it is likely that the email will be read on a mobile device. It is critical that the survey itself is designed and written with the mobile screen in mind.
This chapter addresses the role of mobile devices in marketing research by first building an understanding of what exactly we mean by the term ‘mobile device’ and how the ubiquity of these devices is impacting upon consumer behaviour. Although mobile devices are widely used in research, techniques can be broadly divided into quantitative passive techniques and (usually) qualitative active techniques. We explore both of these in this chapter, while also considering a number of important issues around response rates, quality of responses and the ways in which mobile devices may impact upon research designs themselves.
Overview
What is a mobile device?
While a mobile device might traditionally be thought of as synonymous with a mobile phone, the boundary between what is, and isn’t, a mobile device has become blurred as a result of the growth in tablets, phablets (devices bigger than traditional smartphones but smaller than tablets) and larger, laptop-replacement tablets. This raises the question of what counts as a mobile device? When Apple launched their first iPad Pro, the 32.7 centimetre display actu-ally had larger dimensions than the Macbook Air laptop also being sold by the company at the time. At the other end of the spectrum, at least in terms of physical size, the growth in

515Chapter 18 Mobile research
smartwatches (such as the Apple Watch) and fitness wristbands means that we can’t necessarily assume that all mobile devices are phones. The boundaries of what a mobile device is, and isn’t, are therefore fluid. The key message here is that we need to set these boundaries through understanding of the types of behaviour that individuals use the mobile devices for, rather than a label ascribed by a manufacturer or brand. If we consider mobile devices in a general sense, they can be described as having the following characteristics:
1 Mobile devices are portable and can therefore be carried. It may be self-evident, but a key characteristic is that mobile devices need to be mobile. As mobile devices have grown in popularity there has been increasing discussion over the portability of these devices. When the original iPad came out in 2010, Mark Zuckerberg, Founder of Facebook, was quoted as saying: ‘iPad’s not mobile . . .It’s a computer. That’s a different thing.’4 This was based on a definition of mobile devices as only those that could be put in a pocket. As phones have got bigger and tablets smaller it has become clear that even those devices far too big to fit in most pockets can still be regarded as ‘portable’. Eric Bader, CMO of advertising network RadiumOne, provides an alternative way of thinking about this prob-lem–it is consumers not the devices that can be considered as mobile:5
‘Mobile’ is not a description of a particular device; it’s a segment of consumers that are readily moving . . . As far as advertisers are concerned, much of the con-sumer behavior taking place on a tablet is similar to a smartphone, less the phone calling.
2 Mobile devices are internet connected. A second characteristic is that devices are capable of connecting to the internet anywhere. While laptops require a wired or WiFi connection, smartphones and tablets come with cellular connections enabling access to the internet anywhere where there is mobile reception. For marketing researchers this is important, as it means that research participants can be reached in a natural, everyday setting, rather than requiring them to be in their office or sitting at home. The growing reach of WiFi connections is starting to mean that cellular connections are not always required but, regardless of the technology, it is the ability to reach consumers any place, any time that is of critical importance to marketing research.
3 Mobile devices are personal.6 While mobile devices are technical devices they also play an important role in helping individuals form their own identities. It has even been argued that smartphones have taken on much of the role that cars once held as a means of self-expression.7 For example, research has indicated that use of mobile phones closely matches patterns of consumption in other parts of consumers’ lives in ways that have not been seen with traditional forms of technology, such as desktop computers.8 Mobile devices are not therefore just a piece of technology but a channel through which to pro-vide valuable insights into consumers’ lives. At the same time, the personal nature of mobile devices makes it even more important that researchers respect and value partici-pant privacy when carrying out mobile research.
4 Mobile devices play a key part in the purchase process. This goes beyond the act of browsing products and making a purchase, and extends into the decision-making and information-gathering phase that happens before purchases take place. One example that highlights the disruptive effect that mobile devices are having on consumer behaviour is the growth in ‘showrooming’. This refers to a type of behaviour whereby consumers will research a product in a physical store then go on to purchase it online. Research suggests that nearly a quarter of US consumers now use showrooming9, particularly in categories such as fashion or furniture, where the product needs to be seen in person. Although retailers accept that the role of the internet in a multichannel world is a fact of life,10 the impact of mobile devices has been particularly problematic. The issue for physical retail-ers is that they must carry the costs of the physical retail premises while at the same time having to compete with online retailers who have none of those costs, and can pass them

516 Marketing Research
on to consumers in the means of lower prices. In addition, mobile devices are now becoming increasingly used as a payment mechanism themselves, such as with the ‘Apple Pay’ service. As a result of all these trends, mobile devices play an important role in developing a better understanding of consumer behaviour.
Real research Mobile devices around the world
While smartphones are the most popular devices within Europe and North America, they should not be considered as universal. For example, when researching in an emerg-ing market such as South Africa, using a sur-vey that required a smartphone for completion would create a bias towards more affluent consumers.11 Although phone models used in emerging markets have some resemblance to high-end smartphones, together with similar level of internet con-nectivity, they make use of lower-power processors and typically have less storage and memory. According to Alistair Hill of OnDevice Research, this means that any use of these platforms must require less compli-cated surveys that do not require significant amounts of processing power.12 Working with these less-advanced mobile platforms may also mean that approaches requiring app downloads that are effective on high-end smartphones may not be appropriate.
Approaches to mobile research
Although the common ground with mobile research is that the participant is interacting with a mobile device, there is a diversity of ways in which these devices can be used. Some key approaches are as follows:13
1 Survey research. Typically quantitative, the survey is completed on a mobile device. This may be when responses only come from mobile devices, or a mixed-mode approach where some responses are mobile and others from a desktop or laptop. This mixed-mode approach is increasingly common due to the difficulty in determining what device some-one will complete a survey on, particularly when invitations to participate in research are sent via email.
2 Passive data. Research where the mobile device is the data-collection device. This can involve the installation of a specific app that can collect background data without interac-tion from the research participant. This is typically referred to as ‘passive data collection’. The most common data point that is collected via this method is geolocation data gained from the GPS sensor on phones, although other data points, including social media data, app use or even health information, are now becoming accessible via apps. This form of research carries with it a number of issues relating to ethics, particularly around informed consent, which are touched on later in the chapter.

517Chapter 18 Mobile research
3 Research Communities. As social media is now primarily a mobile activity, it is unsur-prising that mobile platforms have become an important way of accessing market research online communities (MROCs). If research communities are to effectively capture the natural conversation that happens in offline environments, then by being available on a mobile device researchers will more easily access this activity. Research communities are often enabled by specific downloadable apps that have the advantage of providing passive data to the research (as with item 2). However, they can be as simple as online forums accessed through a web browser.
4 Mobile ethnography. Mobile devices increase the range of data that can be collected via ethnographic methods. This includes utilising the audio, video or photographic function-ality of a mobile device to create rich descriptions of the lives of participants. The use of these techniques has become increasingly important among younger generations, who are more comfortable expressing themselves in visual ways rather than the text data on which many traditional research techniques depend. As highlighted with the example of Face-book later in this chapter, the use of mobile devices for research can be a powerful way of eliciting information from groups that might otherwise be reluctant to engage deeply with researchers.
5 SMS research. The popularity of SMS messaging has grown and ebbed as the nature of mobile devices has evolved. In the early era of mobile market research, where mobile devices had limited capabilities to access the internet, SMS messages were the only con-sistent way through which to reach participants (other than phoning them!).14 As internet-enabled smartphones became more widespread following the launch of the first iPhone in 2007, SMS messaging declined in popularity as more fully featured web-based options became available. More recently, text-based options have made a comeback as messaging becomes a key communications device. Text-based research methods have the advantage of immediacy and a potential response rate. At the same time, they are limited as to the length of questions and responses that can be gathered. In practical terms, only short responses are likely to be effective in terms of response rates. As a result, SMS messaging remains popular in terms of being the voice of customer research where suitable permis-sion to contact has been established via a commercial relationship and a short answer can be given. For example, many Net Promoter Score-style questions gather answers via text messaging.
Real research SMS Diaries15
Diary research using a paper and pen is a long-established research technique. Diary techniques involve participants writing down reports on aspects of their social lives and events in a natural context. The diary is typically written in the location and context in which the event is happening, rather than an artificial ‘research’ context where a researcher is present. However, in a digital world where writing pen and paper diaries would not be considered a normal social activity for many people, what could be con-sidered an appropriate equivalent for a digital audience? In other words, what is the modern equivalent of a paper diary?
A paper by Dublin-based marketing academic Louise Maguire16 outlined a study where SMS text messages were used to create a form of diary. Research participants were asked to send text messages before and after partaking in a set of pre-defined services – for example, having a meal at a restaurant, visiting a hairdresser or having a car repaired. Then, during these service events they were asked to send messages indicating emotions that were being experienced during the service ‘event’. Findings highlighted the way that

518 Marketing Research
emotional experiences can change quickly during a service encounter, lurching from one extreme to another, as can be seen in this excerpt from the study:17
The text messages also allowed participants to inadvertently communicate how quickly their emotions changed during their service encounters, going from happy to angry in mere minutes – or less. The research participant . . . may not have been actively process-ing the fact that her emotions were changing so erratically, but the ‘time stamps’ on her text messages facilitated this finding.
20.37 pm: We’ve just arrived. Late. Our fault, we shouldn’t have driven. I’m really appre-hensive that we won’t get our table now. I’ll be in even worse form if we can’t get our table. (Gaelle, 31 years, restaurant)
20.41 pm: Phew! We’re ok! We’re sitting down. Am so happy – and hungry!
20.50 pm: Am getting a bit annoyed. We’ve been here for, like, 10 minutes or something and no one has come over to take our order. We tried so hard to be on time and now they leave us waiting.
The study highlights the effectiveness of SMS diaries as a way to engage participants in ‘real time’ research. While length of text information gathered via SMS might be much shorter than that gathered from traditional diaries, they are more reflective of the modes of communications that match research participants’ behaviours and needs in a con-temporary world.
Guidelines specific to mobile marketing research
While mobile research can be viewed as a new way of applying existing research techniques, there are number of characteristics that are specific to mobile research. The importance of mobile marketing is recognised by the provision of specific mobile marketing guidelines by the main professional bodies that represent marketing research. These guidelines are repre-sented in two documents:
• ‘Guideline for conducting mobile market research’, published by ESOMAR and available at: https://www.esomar.org/knowledge-and-standards/codes-and-guidelines/mobile-guideline.php
• ‘Mobile research guidelines’, jointly published by the MRS, CASRO (Council of Ameri-can Survey Research Organizations) and AMRS (Australian Market & Social Research Society). It is available at: https://www.mrs.org.uk/standards/guidance/
These sets of guidelines are written for professional researchers and provide detailed, and helpful, advice for anyone considering carrying out mobile research. Although these are sep-arate documents, they are largely complementary in terms of the advice they provide. These guidelines reflect the variety of ways in which mobile devices can be included in research, both for standalone research projects and as an integral part of existing research projects. The guidelines can be summarised as follows.
Downloading apps
Although mobile devices can access research activities, such as surveys or communities, via a web browser, it is increasingly common for mobile research to be carried out via an app download. Apps have become the dominant mechanism through which individuals interact

519Chapter 18 Mobile research
with web services through their mobile device. From the perspective of marketing research-ers, apps provide a number of advantages over the participant accessing the research activity through a web browser.
Apps were once used as a means of providing more visually engaging and interactive content than could be made available via a web page. However, growth in technologies such as HTML5 and javascript has reduced the gap and most forms of content can now be deliv-ered via a web browser. Where the gap now exists is in the level of data that can be gained by use of a mobile app that would not be accessible via a web page, particularly if background data collection was required. This includes location data and other forms of sensor data that might be available through the device. With appropriate permissions, an app can collect data even when a participant is not using an app. The use of apps therefore presents a unique set of technical and ethical challenges that require particular attention from researchers. This is reflected in the extensive set of guidelines for using apps for mobile research that is provided by ESOMAR and highlighted in the following table.18
Table 18.1 Guidelines for research with mobile apps
1 Researchers must not install software that modifies the mobile settings beyond what is necessary to conduct research and does not cause any conflicts with operating systems or cause other installed software to behave erratically or in unexpected ways
2 Researchers must not install software that is hidden within other software that may be downloaded or that is difficult to uninstall
3 Researchers must not install software that delivers advertising content, with the exception of software for the purpose of advertising testing
4 Researchers must not install upgrades to software without notifying users and giving the participant the opportunity to opt out
5 Researchers must not create a risk of exposing personal data during data transmission or storage
6 Researchers must not change the nature of any identification and tracking technologies without notifying the user
7 Researchers must notify the user of privacy practice changes relating to upgrades to the software
8 Researchers must not collect identifiable data that may be used by the app provider for non-research purposes
Real research Mobile apps or native websites?
A key decision for researchers who are look-ing to deliver content or services via mobile platforms is whether to provide specific mobile apps or a native website. When smartphones were first launched, many thought that mobile apps were a stopgap, and would eventually be replaced by web browser access as phones became more powerful. This is because mobile apps were able to store many elements on the phone, as well as make greater use of the phones processor rather than relying on a website. On the other hand, mobile-optimised websites were dependent on powerful processors and were tied into the user interface limitations of the web. Over time, as web technolo-gies became more powerful, it was assumed that the need for apps would go away.

520 Marketing Research
Passive data collection
Passive data has traditionally been understood as the data that can automatically be collected without actively asking any questions.20 In other words, data that are collected without the participant being necessarily aware that the data are being collected at the specific moment of collection – although they may be aware in general terms that the data collection is taking place. In the context of mobile research, passive data collection is often focused on location data that can be returned by the GPS sensor available in most smartphones. When combined with other data collected by surveys, or other methods, understanding where a participant is, geographically, can help add a great deal of insight into their life. As smartphones and other mobile devices begin to encompass a broader range of sensors, the corresponding range of passive data sources that might be collected has increased. In addition to location data (also referred to as geolocation data), this might include data on usage of other apps, social media data or even health data. Although the collection of passive data can be carried out with con-sent from respondents, there are a number of ethical issues and potential legal issues around the collection of such data. (These are covered in detail in Chapter 30.)
However, the reverse has been the case, with more use of the mobile web driven by apps. There are also a number of technical reasons why apps are so popular. For exam-ple, there are potential security advantages over websites and they typically have more responsive user interfaces. However, one more practical explanation from a research participant’s perspective is that by presenting a single icon on a smartphone screen, apps are considerably more convenient for users. Evidence increasingly suggests that mobile platforms are being dominated by apps rather than the web.19 This has the potential to create important implications for the way in which researchers provide access to their research studies.
Real research Is passive data collection better?
One of the key questions around passive data collection is understanding when it should replace other forms of ‘active’ data collection. The reality is that passive data can provide different types of data from those collected actively. It is therefore not a straight replacement. Research has indicated that passive data collection can be much better then asking questions that relate to recall of online activity–for example which website has been visited.21 Due to the nature of passive data collection it is therefore more suited to the types of objective data that would be normally associated with poor recall by respondents.
Given this, researchers might believe that passive data collection comes with no prac-tical cost. If the participant has agreed to take part in research then researchers might as well collect as many data points as is possible. However, passive data collection carries with it some limitations and some risks. The most significant is that passive data collec-tion can only be legitimately collected from those who agree to their behaviour on their mobile device being monitored.22 Because of growing public concerns over privacy, combined with general issues over declining response rates, researchers should be aware that requiring passive data collection will make the sample less representative of a general population. This is because some research participants will decline to take part due to privacy concerns.

521Chapter 18 Mobile research
Calling respondents via telephone
While much of the focus in this chapter has been on the more ‘hi-tech’ elements of mobile research, it is important not to lose sight of the ways in which mobile technology might be important to more traditional forms of market research. One example is in telephone-based research, where participants are increasingly likely to be contacted via mobile phone. Even if researchers attempt to filter out telephone numbers that have ‘mobile’ area codes, this may not be accurate as many telecom providers enable landline calls to be forwarded to a mobile number. The researcher should also consider the likelihood of the call being made at an inap-propriate time, or being received in an inappropriate place. The MRS/AMRS/CASRO ‘Mobile research guidelines’ highlight the scope of this issue:23
researchers may sometimes contact potential respondents who are engaged in an activity or in a setting not normally encountered in landline-based calling. This might include driving a vehicle, operating machinery, or walking in a public space. In such cases, the interviewer should confirm whether the potential respondent is in a situation where it is legal, safe and convenient for the potential respondent to take the call. If the interviewer does not receive confirmation, then the call should be terminated while allowing the possibility of making further attempts at another time.
Potential for costs to research participants
Researchers should be sure that there are no potential for costs to be incurred by research participants for taking part in a research project. If mobile apps are being downloaded there is the potential for additional data charges to be incurred if the research participant is not on a WiFi network. If the participant is travelling outside their home country, then these roam-ing charges could be potentially very large and the participant may also be charged for receiving a call when roaming. It is an important aspect of marketing research that research participants should not incur costs in taking part in research. Researchers should be mindful of the potential for unwanted and unnecessary charges when carrying out mobile research and take steps to avoid such charges from occurring.
Collecting photograph, video or audio data
Much of the potential associated with mobile research relates to the ability of mobile devices to capture non-text data. The ability for mobile devices to quickly capture image, video or audio data provides the potential for participants to provide much richer forms of data. Two examples of where these kinds of data are becoming integrated within marketing research are ethnography and mystery shopping. An example of video ethnography is given in the follow-ing case study of Facebook. Where video ethnography is being used, the researcher has less control over the extent to which research participants include third-parties within the research. This could increase the risk of personally identifiable information on an individual being col-lected (e.g. a photo of their face), which would in turn require formal consent to be gathered from that individual. Mystery shopping happens within a more controlled environment and therefore could allow for a more structured set of rules and guidelines to prevent these kinds of issues. Still, researchers must be careful to avoid the inadvertent collection of personal data while also making sure they do not record video in places where recording might normally be prohibited. As with text-based information, video collected that contains personally identifi-able information should be anonymised, for example by editing out segments or pixelating faces. The same principles apply to audio, where recordings of private conversations, even inadvertently, could also lead to personally identifiable information being gathered.
Researchers should therefore take extra care when participants are using mobile devices to record audio or visual data to ensure that normal standards of privacy and consent are maintained.

522 Marketing Research
Real research Citizen journalism and video diaries on Facebook24
Facebook wanted to build a better understanding of what was important to teens and young adults in the 13-to-24-year-old age group This group is often seen as homo-genous, and Facebook needed to build a more detailed and granular understanding of the individuals who would represent the next generation of consumers.
Working with research agency Crowd DNA, an expert in cultural research, a range of research approaches were applied including a large-scale online survey and interviews of consumers across 13 key markets (Australia, Brazil, Canada, Denmark, France, Ger-many, India, Indonesia, Italy, Norway, Sweden, UK and the USA). A subset of this group was selected to take part in a form of citizen journalism to use their mobile devices to record short mobile video accounts of various aspects of their everyday lives, such as friends, family and their social and educational lives.
This technique, and the ability for it to enable participants to collect research data without being accompanied by a researcher, created a degree of candidness and depth that would not have been available from traditional techniques. Additionally, the impor-tance of using visual rather than text-based methods to reach these demographics was highlighted by the researchers:25
people growing up today express themselves via a new visual vocabulary, often replac-ing the need for text. It’s important that brand content be in a language that young people speak and that language is increasingly visual. Our work highlighted the need for brands and marketers to think about assets that will resonate for an image-oriented generation.
Real research Mobile diaries for an eBay Christmas26
Online marketplace and retailer eBay needed to address an issue where it was missing out on last-minute shopping at Christmas in both Germany and the UK due to concerns over its ability to deliver products on time and customers’ fears of difficulties when returning products.
Working with research firm 2CV, eBay ran a piece of research where, using a mobile diary, research participants were asked to log each time they saw a Christmas deal, either online or in a physical store, note the details and state whether they made a purchase as a result of seeing the deal. This was combined with other research activity, including an MROC, that helped to build a better understanding of how consumers shop in advance of Christmas. Findings suggested that physical retail premises were still important for online shoppers and that despite strong performance in other areas, concerns around delivery and returns were still putting off customers. This feedback led to a number of improvements being taken by eBay to address these issues.
Key challenges in mobile research
Building for a ‘mobile first’ world
While mobile platforms create opportunities, they also create challenges for researchers seek-ing to apply existing techniques to mobile platforms. A strategy that managers have been encouraged to adopt when integrating mobile technologies into their business is to take a

523Chapter 18 Mobile research
‘mobile first’ approach.27 This contrasts with the older ‘desktop first’ approach, where brands first build for large-screen devices and then adapt or launch a separate service to reach a mobile audience. Mobile first puts the mobile-device user first and ensures that any activity aimed at customers is built with a mobile audience in mind. It could be argued that there is a strong case for mobile first to also be applied to the practice of marketing research. If research was to be designed on the assumption that research participants were primarily interacting with a mobile device, this would have a number of implications for carrying out research.
Take the example of survey research (although the following points may apply to any form of research):
• Survey invitations. Invitations to carry out research, if sent by email, will need to be read-able by a mobile email client. The invitations should be sufficiently short and clear that they can be easily read on a mobile device. Design should be used that is responsive and will enable the key content to be read on a narrow-width screen.
• Survey design. Any survey should be easy to fill in on a mobile device so it is important to ensure that design elements are compatible with the screen size. This includes ensuring that the font is a readable size and that any design elements fit within the width of the mobile device. Many traditional elements of surveys, for example large numbers of radio buttons, take up a large amount of screen space and may not be practical within the limita-tions imposed by small screen size.28
• Survey Content. Mobile devices have a number of limitations that are not solvable by changing the design. Put simply, small screens are not as good as large screens for read-ing and writing text. This means that overly long survey questions or accompanying text may render a survey difficult to complete. Similarly, asking for Likert scale-type ques-tions, or even using emoticon-style faces, is likely to be easier to navigate on a touch-based user interface than asking research participants to type a paragraph of text in response to a question.
One of the more difficult issues with mobile first approaches is that even if we assume a mobile device is being used, we cannot predict the size of the screen. This could range from anything from a tiny screen on a device such as an Apple Watch to a large ‘phablet’ device with visual capabilities and resolutions approaching that of a laptop screen. Researchers should therefore adopt research designs that take an agnostic view of screen sizes and resolutions.
Response quality in mobile market research
While mobile research provides a number of advantages, these assume that participants are both willing and able to engage with research that is carried out on mobile devices. For example, in the case of a piece of mobile research requiring use of an app it could be argued that the level of engagement required to download and install an app is much greater than that to partake in a basic online survey.
It important to recognise that surveys that might be effective on desktop, or offline plat-forms, may simply not be effective on mobile devices. This is why viewing mobile devices as just another research channel underestimates the potential impact on both the response rates and the quality of responses. Mobile devices are not just a piece of technology, they are highly personal devices that also act as a signal of identity,29 so the implications of concerns over privacy and use of personal data are more prominent than with research in other chan-nels. This was seen with the earlier example of passive data collection, where the inclusion of such data-collection approaches skews the sample towards those segments of the popula-tion who are more willing to give up part of their personal privacy.30
Although research into response quality on mobile devices is a developmental area, there have been indications that screen size can impact response quality when very small screen sizes are being used (i.e. those more likely to be found on a smartphone rather than tablet-style devices).31

524 Marketing Research
Costs of research
Marketing research does not take place in a vacuum and researchers always need to be mindful of the budget they are working with. Gathering sufficient budget to carry out research is a constant challenge, with increasing pressure from managers for research to be carried out at lower cost. Researchers are competing not only with other budget priorities, for example expenditure on product development or marketing communications, but with other forms of research data that are perceived to be lower cost – or even free. For example, the increasing volume of secondary data available through analytics tools has created a very cost-effective ‘competitor’ to research based on the collection of primary data. Justifying the return-on-investment of a marketing research project is difficult as the types of insights that could be generated by a research project are unknown at the outset. This means that the realities of contemporary business life require budgetary considerations to be paramount when carrying out research projects. With this in mind, when planning mobile research researchers should be aware that it can take longer to carry out and cost more than online research. Of course, this expenditure may result in higher-quality insights being generated. Overall, it raises the importance of marketing researchers not just understanding how mobile techniques work, but also being able to convince those who are providing budget for a research project to do so.
Real research Which produces better insights – mobile or online research?32
Although mobile has become a key part of consumer lives, research agencies can still be hesitant to use mobile techniques out of concern that clients may be unfamiliar with them, or concerned about their effectiveness.
A study by research technology firm uSamp compared the use of online techniques with that of mobile, exploring the following hypotheses:
• Mobile methodology is preferable for shopper/shopability studies because mobile technology can capture insights closer to the moment of purchase, and it can deliver point-of-sale truth via photographic evidence, rather than relying on memory recall of an online respondent.
• Mobile research delivers more granular responses in sensory evaluations on IHUTS than laptop/desktop, because recall bias is eliminated.
• Mobile delivers richer insights overall, including on open-ended questions.
The research was based on a study of UK and US consumers’ in-store purchasing of a range of leading-brand crisps (potato chips in the USA). Research participants either completed the survey on their mobile device or online on their PC/laptop browser. The research was run as a mini-diary approach, with completion on their mobiles while in-store. Online respondents were asked to complete their next phase ‘as soon as pos-sible’ after the purchase.
Findings suggested that there was a much higher accuracy among participants responding on mobile devices because they were less reliant on recall. When triangulat-ing answers, for example on where the products were stocked on shelves, online respondents were found to be often guessing the answers. This study highlights the value of mobile research, in that it enables consumers to provide data with in the con-text of the environment in which they are currently operating. The only downside that was found relating to the use of mobile devices was that respondents were likely to be less patient when it came to complicated or difficult-to-complete surveys.

525Chapter 18 Mobile research
Real research From mobile device to wearable device
A sub–category of mobile devices is the growing number of wearable devices – also known as ‘wearables’. Wearable devices range from glasses, such as the Google Glass, to smartwatches, such as the Apple Watch. Such devices have brought with them a great deal of interest from researchers convinced that they provide the potential for even richer and more detailed data than can be gathered from smartphone-based mobile devices. Crucially, wearable devices broaden the range of passive data that can be required. Wearable glasses could automati-cally take photos or video, while a smartwatch could monitor health information. Stephen Mellor, managing director of Clicked Research Agency, cautions against some of this early enthusiasm for wearable devices.33 Consumers remain confused about why they need to use the devices, and a focus on passive data collection is likely to create increased concerns over privacy and use of personal data. Nevertheless, this is a fast-emerging market and with major companies such as Google and Apple continuing to invest in wearable technology, this is an area on which researchers should keep an eye for the future.
Summary This chapter has reviewed the importance and wide range of research activities that can be carried out with mobile devices. As mobile devices have become more common, they have inevitably become a part of the everyday practice of marketing research. While the reduction in screen size can result in a reduction in the willingness of participants to provide long and detailed survey responses, avenues are opened up for new forms of research. In the same way that understanding social media research is necessary to fully access the social lives of individuals in contemporary society, building knowledge of mobile marketing research is necessary to appreciate the mechanism through which peo-ple interact with internet services.
To date, mobile marketing research has often been characterised as an additional or novel channel that only needs to be used for certain research projects. However, this could be seen as representative of the sort of command-and-control attitude that has become a common criticism of marketing research. Ultimately, it is not for the researcher to decide whether mobile platforms are the most appropriate device – it could be argued that it has already been decided by research participants voting with their feet, or perhaps their fingers! The future of mobile devices is at the centre of the connected hub, being the channel for social interaction, text messages, phone calls, internet access, photography, video, e-commerce and more. In other words, many of the core activities marketing researchers are interested in, together with the channels through which to reach participants, are now embedded within mobile devices. Understanding how to leverage mobile devices within marketing research is, in a dig-ital world, a key facet of future success. Indeed, mobile devices should not be consid-ered as a peripheral activity but instead might be thought of as the central point around which research activities should be designed.

526 Marketing Research
Although smartphones are approaching a critical level of adoption among many con-sumer demographics, it has been argued that we have yet to see the potential for these devices to be put to their full use. The future of marketing research is likely to see increasingly innovative approaches being applied to the use of mobile techniques and technologies to generate valuable insights.
Questions 1 What do we mean by ‘mobile devices’? Where does the boundary lie between mobile and non-mobile devices?
2 What kind of research activity is SMS-based research appropriate for?
3 What does ‘mobile first’ mean for research designs?
4 Why do researchers need to be careful when carrying out telephone research with mobile devices?
5 What is passive data? Give some examples of types of passive data collection that can be carried out with mobile devices.
6 What are the advantages to the researcher of having an app for their MROC?
7 Why do researchers need to be careful when using mobile-based image or video functionality as part of a mystery shopping exercise?
8 What are the circumstances under which a researcher would use a mobile app rather than a mobile web browser?
9 What are wearables? How could they be used in marketing research?
Exercises 1 Critically discuss the extent to which you agree with the following statement: ‘In the near future mobile phones will be everywhere, all the time. This means that mobile research will be the only sort of research we need to think about.’
2 Working in groups, imagine that you are research participants. What forms of passive data would you be happy for a mobile app that you have downloaded as part of a market research online community to access on your phone?
3 Find a survey that is available on the web – either one that is public or one that you have created yourself. View the survey through a web browser on a smartphone and evaluate whether the survey is still effective. Consider both the design and the content of the survey.
Notes
1. Mack, E., ‘There are now more gadgets on Earth than people’, http://www.cnet.com/uk/news/there-are-now-more-gadgets-on-earth-than-people/, accessed 1 May 2016.
2. Banks, R., ‘Who needs a landline telephone? 95% of UK households don’t’, http://www.mobileindustryreview.com/2014/12/who-needs-a-landline-telephone.html, accessed 1 May 2016.
3. Geoghegan, T., ‘The slow death of landline phones’, http://news.bbc.co.uk/1/hi/8355504.stm, accessed 1 May 2016.
4. Heine, C., ‘Are tablets just as “mobile” as smartphones? Market researchers say yes, but ad players think it’s controversial’, http://www.adweek.com/news/advertising-branding/are-tablets-just-mobile-smartphones-160457, accessed 1 May 2016.

527Chapter 18 Mobile research
5. Heine, C., ‘Are tablets just as “mobile” as smartphones? Market researchers say yes, but ad players think it’s controversial’, http://www.adweek.com/news/advertising-branding/are-tablets-just-mobile-smartphones-160457, accessed 1 May 2016.
6. Stokes, R., eMarketing: The Essential guide to marketing in a Digital World Quirk eMarketing (Pty) Ltd, 5th edn (4 February 2014).
7. ‘Why phones are replacing cars’, http://www.economist.com/node/2628969, accessed 1 May 2016.
8. Wilska, T., ‘Mobile phone use as part of young people’s consumption styles’, Journal of Consumer Policy 26 (4) (2003) 441–63.
9. Precourt, G., ‘How marketers should tackle mobile advertising and “showrooming”’, WARC Event Reports: BRITE, (March 2013).
10. Mehra, A., Kumar, S. and Raju, J., “Showrooming” and the competition between store and online retailers’ (14 January 2013). Available at SSRN: http://ssrn.com/abstract=2200420 or http://dx.doi.org/10.2139/ssrn.2200420, accessed 7 March 2017.
11. Carruthers, B., ‘Feature phones to wearables: Covering all the bases in mobile research’, Event Reports: MRMW London (September 2015).
12. Carruthers, B., ‘Feature phones to wearables: Covering all the bases in mobile research’, Event Reports: MRMW London (September 2015).
13. Poynter, M., Williams, N. and York, S., The 900 Handbook of Mobile Market Research: Tools and Techniques for Market Researchers (Chichester, UK: John Wiley & Sons, 2014)
14. Haig, M., Mobile Marketing: The Message Revolution (London: Kogan Page, 2002).
15. Maguire, L., ‘Capturing consumption emotions in service encounters: Why immediacy matters when studying service-related emotions’, International Journal of Market Research 58 (2) (2016), 227–52.
16. Maguire, L., ‘Capturing consumption emotions in service encounters: Why immediacy matters when studying service-related emotions’, International Journal of Market Research 58 (2) (2016), 227–52.
17. Maguire, L., ‘Capturing consumption emotions in service encounters: Why immediacy matters when studying service-related emotions’, International Journal of Market Research 58 (2) (2016), 227–52.
18. ESOMAR, ‘ESOMAR Guidelines for conducting mobile market research’, https://www.esomar.org/uploads/public/knowledge-and-standards/codes-and-guidelines/ESOMAR_Guideline-for-conducting-Mobile-Market-Research.pdf, accessed 1 May 2015.
19. Arthur, C., ‘Apps more popular than the mobile web, data shows’, http://www.theguardian.com/technology/appsblog/2014/apr/02/apps-more-popular-than-the-mobile-web-data-shows, accessed 1 May 2016.
20. MRS, ‘Mobile research guidelines’, https://www.mrs.org.uk/pdf/2013-08-30%20Draft%20AMSRS%20CASRO%20MRS%20Mobile%20Research%20Guidelines.pdf, accessed 1 May 2016.
21. Revilla, M., Ochoa, C., Voorend, R. and Loewe, G. ‘When should we ask, when should we measure?: Comparing information from passive and active data collection’, ESOMAR Congress, Dublin (September 2015).
22. MRS, ‘Mobile research guidelines’, https://www.mrs.org.uk/pdf/2013-08-30%20Draft%20AMSRS%20CASRO%20MRS%20Mobile%20Research%20Guidelines.pdf, accessed 1 May 2016.
23. MRS, ‘Mobile research guidelines’, https://www.mrs.org.uk/pdf/2013-08-30%20Draft%20AMSRS%20CASRO%20MRS%20Mobile%20Research%20Guidelines.pdf, accessed 1 May 2016.
24. Tenzer, J. and Crysell, A., ‘Coming of age on screens: How Facebook explored what it’s like to grow up in today’s world’, ESOMAR Congress, Dublin (September 2015).
25. Tenzer, J. and Crysell, A., ‘Coming of age on screens: How Facebook explored what it’s like to grow up in today’s world’, ESOMAR Congress, Dublin (September 2015).
26. Lugthart, S. and Noble, R., ‘From eBay with love: How research helped put the sparkle on eBay’s Christmas planning’, MRS Awards: Winner (December 2013).
27. Morrison, M., ‘Is a mobile-first approach really best?’, http://adage.com/article/digital/a-mobile-approach/302774/, accessed 1 May 2016.
28. Toepoel, V. and Funke, F., ‘Investigating response quality in mobile and desktop surveys: A comparison of radio buttons, visual analogue scales and slider scales’, XVIII ISA World Congress of Sociology, Yokohama (13–19 July 2014).
29. Wilska, T., ‘Mobile phone use as part of young people’s consumption styles’, Journal of Consumer Policy 26 (4) (2003), 441–63.
30. Revilla, M., Ochoa, C., Voorend, R. and Loewe, G., ‘When should we ask, when should we measure?: Comparing information from passive and active data collection’, ESOMAR Congress, Dublin (September 2015).
31. Guidry, K., ‘Response quality and demographic characteristics of respondents using a mobile device on a web-based survey’, The American Association for Public Opinion Research (AAPOR) 67th Annual Conference (2012).
32. Leet, B. and Appleton, B., ‘The great market research debate: Are mobile insights better than online?’, Research on Warc (January 2015).
33. Carruthers, B., ‘Feature phones to wearables: Covering all the bases in mobile research’, Event Reports: MRMW London (September 2015).

Stage 1
Problem definition
Stage 2
Research approach developed
Stage 3
Research design
developed
Stage 4
Fieldwork or data
collection
Stage 5
Data integrity
and analysis
Stage 6
Communicating research findings
19 Data integrity
Perhaps the most neglected
series of activities in the
marketing research process.
Handled with care, data
integrity can substantially
enhance the quality of
statistical results.

529Chapter 19 Data integrity
Objectives
After reading this chapter, you should be able to:
1 discuss the nature and scope of data integrity and the data integrity process;
2 explain questionnaire checking and editing and the treatment of unsatisfactory responses by returning to the field, assigning missing values and discarding unsatisfactory responses;
3 describe the guidelines for coding questionnaires, including the coding of structured and unstructured questions;
4 discuss the data cleaning process and the methods used to treat missing responses: substitution of a neutral value, imputed response, casewise deletion and pairwise deletion;
5 state the reasons for and methods of statistically adjusting data: weighting, variable respecification and scale transformation;
6 describe the procedure for selecting a data analysis strategy and the factors influencing the process;
7 classify statistical techniques and give a detailed classification of univariate techniques as well as a classification of multivariate techniques;
8 understand the intra-cultural, pan-cultural and cross-cultural approaches to data analysis when carrying out research across countries and cultures;
9 appreciate how the use of SPSS software can shape the manner and quality of data integrity.
Decisions related to data integrity and analysis should not take place after data have been collected. Before the raw data contained in questionnaires can be subjected to statistical analysis, they must be converted into a form suitable for analysis. The suitable form and the means of analysis should be considered as a research design is developed. This ensures that the output of the analyses will satisfy the research objectives set for a particular project. The care exercised in the data integrity phase has a direct effect upon the quality of statistical results and, ultimately, the support offered to marketing decision makers. Paying inadequate attention to data integrity can seriously compromise statistical results, leading to biased findings and incorrect interpretation. Due to the computerised nature of contemporary research, most of the data integrity process and the quality checks inherent in this process are now completed automatically. Online modes that form the majority of surveys have in-built parameters to ensure the quality of data prepared for statistical analysis. Survey software helps researchers to perform quality checks at all stages of data integrity, whatever the mode of collection. With software developments, many researchers will not have to intervene manually in the data integrity process. However, it is important to understand what this process entails and what survey software does to monitor data quality. Even computerised surveys can suffer from issues with data integrity if the checks have not been appropriately built in at the design stage.
This chapter describes the data collection process, which begins with checking the questionnaires for completeness. Then we discuss the editing of data and provide guidelines for handling illegible, incomplete, inconsistent, ambiguous or otherwise unsatisfactory responses. We also describe coding, transcribing and data cleaning, emphasising the treatment of missing responses and statistical adjustment of data. We discuss the selection of a data analysis strategy and classify statistical techniques. The intra-cultural, pan-cultural and cross-cultural approaches to data analysis in carrying out marketing research across countries are explained.
We begin with an illustration of the data integrity process set in the context of a Formula One Racetrack study.
Overview

530 Marketing Research
Real research Data integrity
In a Formula One Racetrack Project, carried out by IFM Sports Marketing Surveys, the data were obtained by face-to-face and telephone interviews. As the questionnaire was developed and finalised, a preliminary plan was drawn up of how the findings could be analysed. The questionnaires were edited by a supervisor as they were being returned from Australia, Brazil, France, Germany, Italy, Japan, Spain and the UK. The question-naires were checked for incomplete, inconsistent and ambiguous responses. Question-naires with problematic responses were queried with supervisors in each of the eight countries. In some circumstances, the supervisors were asked to re-contact the partici-pants to clarify certain issues. Thirty-five questionnaires were discarded because the proportion of incomplete or unsatisfactory responses rendered them too poor to use. This resulted in a final sample size of 2,050.
A codebook was developed for coding the questionnaires; this was done automati-cally as the questionnaire was designed using the SNAP software (www.snapsurveys.com). Data were transcribed by being directly keyed in as the telephone interview mode was conducted. In the face-to-face mode, data were transcribed using personal digital assistants (PDAs) as the interviews were conducted. The software has a built-in error check that identified out-of-range responses; 10% of the data were verified for other data entry errors. The data were cleaned by identifying logically inconsistent responses. Most of the rating information was obtained using five-point scales, so responses of 0, 6 and 7 were considered out of range and a code of 9 was assigned to missing responses. If an out-of-range response was keyed in, the SNAP software issued an audible warning and prohibited any continuation of data entry. New variables were created that were composites of original variables. Finally, a data analysis strategy was developed.
This example describes the various phases of the data integrity process. Note that the process was initiated while the fieldwork was still in progress. A systematic description of the data integrity process follows.
The data integrity process
The data integrity process is shown in Figure 19.1. The entire process is guided by the preliminary plan of data analysis that was formulated in the research design phase. The first step is to check for acceptable questionnaires. This is followed by editing, coding and transcribing the data. The data are cleaned and a treatment for missing responses is pre-scribed. Often, after the stage of sample validation, statistical adjustment of the data may be necessary to make them representative of the population of interest. The researcher should then select an appropriate data analysis strategy. The final data analysis strategy differs from the preliminary plan of data analysis due to the information and insights gained since the preliminary plan was formulated. Data integrity should begin as soon as the first batch of questionnaires is received from the field, while the fieldwork is still going on. Thus, if any problems are detected, the fieldwork can be modified to incorporate cor-rective action.
EditingA review of the questionnaires with the objective of increasing accuracy and precision.
CodingAssigning a code to represent a specific response to a specific question, along with the data record and column position that the code will occupy.

531Chapter 19 Data integrity
Figure 19.1
Data preparation process
Prepare preliminary plan of data analysis
Check questionnaire
Edit
Code
Transcribe
Clean data
Statistically adjust the data
Select data analysis strategy
Checking the questionnaire
The initial step in questionnaire checking involves reviewing all questionnaires to assess how well they have been completed, as illustrated in the following example.
Real research Custom cleaning1
According to Johan Harristhal of Gfk Custom Research (www.gfk.com/gfkcr), completed questionnaires from the field often have many small errors because of the inconsistent quality of interviewing. For example, qualifying responses are not circled, or skip patterns are not followed accurately. These small errors can be costly. When responses from such questionnaires are put onto a computer, Custom Research runs a cleaning program that checks for completedness and logic. Discrepancies are identified on a computer printout, which is checked by the tabulation supervisors. Once the errors are identified, appropri-ate corrective action is taken before data analysis is carried out. Custom Research has found that this procedure substantially increases the quality of statistical results.
Researchers do not just depend upon error checks at the data entry stage; checks should be made while fieldwork is still under way. If the fieldwork was contracted to a data collection agency, the researcher should make an independent check after it is over. A questionnaire returned from the field may be unacceptable for several reasons:
532 Marketing Research
1 Parts of the questionnaire may be incomplete.
2 The pattern of responses may indicate that the participant did not understand or follow the instructions. For example, filter questions may not have been followed.
3 The responses show little variance. For example, a participant has ticked all 4s on a series of seven-point rating scales.
4 The returned questionnaire is physically incomplete: one or more pages is missing.
5 The questionnaire is received after a pre-established cut-off date.
6 The questionnaire is answered by someone who does not qualify for participation.
If quotas or cell group sizes have been imposed, the acceptable questionnaires should be classified and counted accordingly. Any problems in meeting the sampling requirements should be identified, and corrective action, such as conducting additional interviews in the under-represented cells, should be taken where this is possible, before the data are edited. Note that in online surveys, each of the above factors will usually be automatically moni-tored. Participants may not be allowed to continue with a survey if they leave gaps in their responses, or an error report may be automatically generated, such as when participants have a pattern of responses that demonstrates they have not read the instructions or engaged with the survey process.
Editing
Editing is the review of the questionnaires with the objective of increasing accuracy and precision. It consists of screening questionnaires to identify illegible, incomplete, incon-sistent or ambiguous responses. Responses may be illegible if they have been poorly recorded. This is particularly common in questionnaires with a large number of unstruc-tured questions. The replies must be legible if they are to be properly coded. Likewise, questionnaires may be incomplete to varying degrees. A few or many questions may be unanswered.
At this stage, the researcher makes a preliminary check for consistency. Certain obvious inconsistencies can be easily detected. For example, participants in a financial survey may have answered a whole series of questions relating to their perceptions of a particular bank, yet in other questions may have indicated that they have not used that particular bank or even heard of it.
Responses to unstructured questions may be ambiguous and difficult to interpret clearly. The answer may be abbreviated, or some ambiguous words may have been used. For struc-tured questions, more than one response may be marked for a question designed to elicit a single response. Suppose that a participant circles 2 and 3 on a five-point rating scale. Does this mean that 2.5 was intended? To complicate matters further, the coding procedure may allow for only a single-digit response.
Treatment of unsatisfactory responses
Unsatisfactory responses are commonly handled by returning to the field to get better data, assigning missing values and discarding unsatisfactory participants:
• Returning to the field. Questionnaires with unsatisfactory responses may be returned to the field, where the interviewers re-contact the participants. This approach is particularly attractive for business and industrial marketing surveys, where the sample sizes are small and the participants are easily identifiable. The data obtained the second time, however,

533Chapter 19 Data integrity
may be different from those obtained during the original survey. These differences may be attributed to changes over time or differences in the mode of questionnaire administra-tion (e.g. online versus a face-to-face interview).
• Assigning missing values. If returning the questionnaires to the field is not feasible, the editor may assign missing values to unsatisfactory responses. This approach may be desir-able if: (1) the number of participants with unsatisfactory responses is small; (2) the pro-portion of unsatisfactory responses for each of these participants is small; or (3) the variables with unsatisfactory responses are not the key variables.
• Discarding unsatisfactory participants. In another approach, the participants with unsat-isfactory responses are simply discarded. This approach may have merit when: (1) the proportion of unsatisfactory participants is small (less than 10%); (2) the sample size is large; (3) the unsatisfactory participants do not differ from satisfactory participants in obvious ways (e.g. demographics, product usage characteristics); (4) the proportion of unsatisfactory responses for each of these participants is large; or (5) responses on key variables are missing. Unsatisfactory participants may differ from satisfactory partici-pants in systematic ways, however, and the decision to designate a participant as unsatis-factory may be subjective. Both these factors bias the results. If the researcher decides to discard unsatisfactory participants, the procedure adopted to identify these participants and their number should be reported, as in the following example.
Real research Declaring ‘discards’2
In a cross-cultural survey of marketing man-agers from English-speaking African coun-tries, questionnaires were mailed to 565 firms. A total of 192 completed question-naires were returned, of which four were dis-carded because participants suggested that they were not in charge of overall marketing decisions. The decision to discard the four questionnaires was based on the considera-tion that the sample size was sufficiently large and the proportion of unsatisfactory partici-pants was small.
Coding
Many questionnaire design and data entry software packages code data automatically. Learn-ing how to use such packages or even using spreadsheet packages means that the process of coding is now a much simpler task for the researcher. Many of the principles of coding are based on the days of data processing using ‘punched cards’. While there may be many data analysts who could present coherent cases for the use of original forms of data entry, the greater majority of researchers enjoy the benefits of a simpler, speedier and less error-prone form of data entry, using proprietary software packages. The nature and importance of

534 Marketing Research
Table 19.1
Question 1 – Have you watched at least one hour of a Formula One race on television in the 2010 season? (5)
1 Yes
2 No (terminate interview)
Question 2 – Please enter gender (6)
1 Male
2 Female
3 Refused
Classification questions from the Formula One Racetrack survey
coding for qualitative data were introduced in Chapters 6 and 9. For quantitative data, which can include coping with open-ended responses or responses to ‘Other – Please State. . .’, it is still important to understand the principles of coding, as reference to the process is made by so many in the marketing research industry.
Coding means assigning a code, usually a number, to each possible answer to each ques-tion. For example, a question on the gender of participants may be assigned a code of 1 for females and 2 for males. For every individual question in a questionnaire, the researcher decides which codes should be assigned to all its possible answers.
If the question posed has only two possible answers, the codes assigned of 1 or 2 take up one digit space. If the question posed has 25 possible answers, such as ‘Apart from Formula One, what other sports do you follow on TV or through any other media?’, the possible answers and assigned codes of 1 to 25 would take up two digit spaces. The reason for focusing upon the digit spaces required for any particular question relates to an old convention in mar-keting research to record the answers from individual questionnaire participants in ‘flat ASCII files’. Such files were typically 80 columns wide. The columns would be set out into ‘fields’, i.e. assigned columns that relate to specific questions. Thus the task for the researcher after assigning codes to individual question responses was to set out a consecutive series of fields or columns. These fields would represent where the answers to particular questions would be positioned in the ASCII file. In each row of a computer file would be the coded responses from individual questionnaire participants. Each row is termed a ‘record’, i.e. all the fields that make up the response from one participant. All the attitudinal, behavioural, demographic and other classification characteristics of a participant may be contained in a single record.
Table 19.1 shows an extract from the Formula One Racetrack questionnaire and Table 19.2 illustrates the answers to these questions from a selection of participants as set out in codes, fields and records. The classification questions set out on Table 19.1 were placed at the start of the questionnaire, forming the ‘Screening’ part of the questionnaire. It is followed by the first question in the section on ‘Attitudes and Opinions towards F1’.
Question 2 has two possible answers, coded 1 to 2, that take up one digit space (there could be a space for ‘Refused’, to cope with the very rare occasions where the participants refuse to state their gender and the interviewer cannot discern their gender). Non-responses to gender and age questions are usually more prevalent in postal questionnaires.3 Question 3 has eight possible answers, coded 1 to 8, that take up one digit space. Question 4 has seven possible answers, coded 1 to 7, that take up one digit space. Note that if the actual number of Grands Prix viewed were entered (rather than a category), two digit spaces would be needed. Question 5 has 12 possible answers, which are coded 01 to 12, taking up two digit spaces. Note that to the right of each question is a number in parentheses. These numbers represent the first field positions of each question, as illustrated in Table 19.2.

535Chapter 19 Data integrity
Table 19.1
Question 3 – Please could you tell me how old you are? (7)
1 18–24
2 25–29
3 30–34
4 35–39
5 40–44
6 45–49
7 50–55
8 Refused
Question 4 – Out of 16 Formula One Grands Prix held in the 2010 season, how many have you watched on television? (8)
1 1–2
2 3–4
3 5–6
4 7–9
5 10–12
6 13–15
7 16
Question 5 – Which one Formula One team do you support? (DO NOT READ OUT AND TICK ONLY ONE.) (9–10)
01 Don’t have a favourite team
02 Don’t know
03 Ferrari
04 Force India-Mercedes
05 Lotus-Renault
06 McLaren-Mercedes
07 Renault
08 RBR Renault
09 Sauber
10 STR Ferrari
11 Williams Cosworth
12 Virgin Cosworth
Continued

536 Marketing Research
In Table 19.2, the columns represent the fields and the rows represent the records of each participant. The field space 1–4 is used to record an assigned number to each participant. Table 19.3 illustrates how the same data may be entered using a spreadsheet. Each row rep-resents an individual participant and each column represents the fields required to hold the response to an individual question. Note that there is a column that identifies a specific num-ber attached to each record. Many survey analysis packages record a unique ID for each record so that, as the answers to an individual questionnaire are entered, the ID is automati-cally updated. However, if a unique ID is attached to each questionnaire before it is sent out (e.g. in a postal survey), the ID may be entered as a distinct field (see column A).
Table 19.2
Fields
Records 1–4 5 6 7 8 9–10
Record #1 0001 1 1 2 2 01Record #11 0011 1 1 3 1 03Record #21 0021 1 2 7 6 04Record #2050 2050 1 1 5 4 11
Illustrative computer file held on a flat ASCII file
Table 19.3
Records in rows Individual fields in columns
A B C D E F
ID Question 1 Question 2 Question 3 Question 4 Question 5
2 1 1 1 2 2 0112 11 1 1 3 1 0322 21 1 2 7 6 04
2051 2050 1 1 5 4 11
Example of computer file held on a spreadsheet program
Coding is still required to identify the individual responses to individual questions. Spreadsheets are normally wide enough to allow an individual record to be recorded on one line, and they can be set up so that whoever is entering the data can clearly keep track of which questions relate to which columns. Spreadsheets can be used as a format to analyse data in a number of data analysis packages and so are very versatile. They do, however, have shortcomings. The next paragraph will go on to illustrate these.
In many surveys, multiple-response questions are widely used. An example of a multiple- response question is shown in Table 19.4, a question from the Formula One Racetrack survey, which examines participants’ perceptions of Formula One.
In essence, each of the options presented in question 8 is an individual ‘yes’ or ‘no’ ques-tion. In the example shown, the participant has replied ‘yes’ to the second, fifth, sixth and ninth variables. Using a spreadsheet, this question would be coded as shown in Table 19.5

537Chapter 19 Data integrity
where the response in Table 19.4 is represented as ‘Record 1’. The ‘ticks’ have been coded as a ‘1’ to represent ‘yes’ and ‘0’ as ‘no’.
Entering data for multiple-response questions is a fairly simple task on a spreadsheet, pro-vided that there are not so many of these question types in a survey. In the Formula One Race-track questionnaire there was one question related to which cars ‘belonged’ (owned, leased or a company car) to particular households. Had the open-ended question been closed into a
Table 19.4
Question 8 – Please tell me which of the following words you think best describe Formula One. (READ OUT AND TICK ALL THAT APPLY.)
01 Boring
02 ✓ Competitive
03 Dangerous
04 Dynamic
05 ✓ Elitist
06 ✓ Exciting
07 Expensive
08 Extravagant
09 ✓ Innovative
10 Inspirational
11 Prestigious
12 Safe
13 Sexy
14 Too technical
Multiple-response question from the Formula One Racetrack survey
Table 19.5
Records Individual fields in columns
Question 8
AJ AK AL AM AN AO AP AQ AU
Q8(1) Q8(2) Q8(3) Q8(4) Q8(5) Q8(6) Q8(7) Q8(8) Q8(9)
1 1 0 0 0 1 1 0 0 12 1 1 0 0 0 1 1 0 03 0 0 1 1 1 0 0 0 04 1 1 0 0 1 0 1 1 1. . . n 0 1 1 0 0 1 1 0 0
Formula One Racetrack, Question 8 spreadsheet presentation

538 Marketing Research
multiple-response question of 38 different car manufacturers, this would have meant a spread-sheet of 38 columns. Had the question gone beyond the manufacturer, e.g. Renault, to the type of Renault, e.g. Clio, the number of columns could have run to thousands. If participants had indicated that they had a Renault, this would mean finding the precise column to enter a ‘1’ and then 37 ‘0s’. This is a lengthy and potentially error-prone task. This is where proprietary questionnaire design and survey packages really hold many advantages, i.e. they make the data entry task very simple for multiple-response questions of any length and they check for errors. Again, the use of proprietary packages will be outlined at the end of this chapter.
Codebook
Regardless of the system used, a summary of the whole questionnaire, showing the position of the fields and the key to all the codes, should be produced. With proprietary software packages, this summary is created automatically as the questionnaire is designed. Such a summary is called a codebook. Table 19.6 shows an extract from the Formula One Racetrack codebook. The codebook shown is based upon using a spreadsheet to enter the data. Depend-ing upon which type of data entry is used, the codebook style will change, but in essence the type of information recorded is the same.
Table 19.6
Column identifier Question name Question number Coding instructions
A Participant ID Enter handwritten number from top right-hand corner of the questionnaire
B Watched Formula One 1 Yes = ‘1’
No = ‘2’
C Gender 2 Male = ‘1’
Female = ‘2’
Refused = ‘3’
D Age band 3 Enter number as seen alongside ticked box:
18–24 = ‘1’
25–29 = ‘2’
30–34 = ‘3’
35–39 = ‘4’
40–44 = ‘5’
45–49 = ‘6’
50–55 = ‘7’
Refused = ‘8’
E Viewing frequency 4 Enter number as seen alongside ticked box:
1–2 = ‘1’
3–4 = ‘2’
5–6 = ‘3’
7–9 = ‘4’
10–12 = ‘5’
13–15 = ‘6’
16 = ‘7’
Extract from the Formula One Racetrack survey codebook

539Chapter 19 Data integrity
A codebook contains instructions and the necessary information about the questions and potential answers in a survey. A codebook guides the ‘coders’ in their work and helps the researcher identify and locate the questions properly. Even if the questionnaire has been pre-coded, it is helpful to prepare a formal codebook. As illustrated in Table 19.6, a code-book generally contains the following information: (1) column identifier, (2) question name, (3) question number and (4) coding instructions.
Coding open-ended questions
The coding of structured questions, be they single or multiple choice, is relatively simple because the options are predetermined. The researcher assigns a code for each response to each question and specifies the appropriate field or column in which it will appear; this is termed ‘pre-coding’.4 The coding of unstructured or open-ended questions is more complex; this is termed ‘post-coding’. Participants’ verbatim responses are recorded on the questionnaire. One option the researcher has is to go through all the completed questionnaires, list the verbatim responses and then develop and assign codes to these responses. Another option that is allowed on some data entry packages is to enter the verbatim responses directly onto the computer, allowing a print-off of the collective responses and codes to be assigned before all of the ques-tionnaires have been entered. The coding process here is similar to the process of assigning codes in the analysis of qualitative data, as described in Chapter 9.5 The verbatim responses to 1,000 questionnaires may generate 1,000 different answers. The words may be different but the essence of the response may mean that 20 issues have been addressed. The researcher decides what those 20 issues are, names the issues and assigns codes from 1 to 20, and then goes through all the 1,000 questionnaires to enter the code alongside the verbatim response.
The following guidelines are suggested for coding unstructured questions and questionnaires in general.6 Category codes should be mutually exclusive and collectively exhaustive. Catego-ries are mutually exclusive if each response fits into one and only one category code. Categories should not overlap. Categories are collectively exhaustive if every response fits into one of the assigned category codes. This can be achieved by adding an additional category code of ‘other’ or ‘none of the above’. An absolute maximum of 10% of responses should fall into the ‘other’ category; the researcher should strive to assign all responses into meaningful categories.
Category codes should be assigned for critical issues even if no one has mentioned them. It may be important to know that no one has mentioned a particular response. For example, a car manufacturer may be concerned about its new website design. In a question ‘How did you learn about the new Renault Clio?’, key responses such as ‘Google’ or ‘Facebook’ should be included as a distinct category, even if no participants gave these answers.
CodebookA book containing coding instructions and the necessary information about the questions and potential answers in a survey.
Transcribing
Transcribing data involves keying the coded data from the collected questionnaires into computers. If the data have been collected online or via CATI or CAPI, this step is unneces-sary because the data are entered directly into the computer as they are collected. Besides the direct keying of data, they can be transferred by using optical recognition, digital technolo-gies, bar codes or other technologies (see Figure 19.2).
Optical character recognition programs transcribe handwritten text onto computer files. Opti-cal scanning is a data transcribing process by which answers recorded on computer-readable forms are scanned to form a data record. This requires responses to be recorded in a pre- designated area and for a device then to read that response. A more flexible process is optical mark recognition, where a spreadsheet type of interface is used to read and process forms cre-ated by users. These mark-sensed forms are then processed by optical scanners and the data are stored in a computer file. Digital technology has resulted in computerised sensory analysis sys-tems, which automate the data collection process. The questions appear on a computerised grid

540 Marketing Research
pad, and responses are recorded directly into the computer using a sensing device. Field inter-viewers use iPads, notebook computers, or other mobile devices to record responses, which are then sent via a built-in communication modem, wireless or cellular link directly to another com-puter in the field or to a remote location. Bar codes involve direct machine reading of the codes and simultaneous transcription. Many national censuses use bar codes to identify participants.
Several other technologies may also be used to transcribe the data. Voice recognition and voice response systems can translate recorded voice responses into data files. For example, advanced speech recognition software is available for both Windows and MacOS systems that can be used to transcribe data by speaking into a microphone. However, accuracy with such software requires the software to become familiar and ‘trained’ with a specific voice, which can take some time to master. When online, CATI or CAPI modes are employed and data are verified as they are collected. In the case of inadmissible responses, the computer will prompt the interviewer or participant. In the case of admissible responses, the interviewer or the participant can see the recorded response on the screen and verify it before proceeding.
The selection of a data transcription method is guided by the type of interviewing method used and the availability of technology. If online, CATI or CAPI modes are used and the replies are entered directly into the computer. Entry via a computer is most frequently used for ordinary telephone, home and street interviewing and postal surveys. However, the use of digital technology in face-to-face interviews is growing with the increasing use of handheld mobile devices (see Chapter 18). Optical scanning can be used in structured and repetitive surveys, and mark-sensed forms are used in special cases.7 The following example illustrates the use of scanned data and the advantage it can have over keypunching.
Figure 19.2
Data transcription
Online/CATICAPI
Keypunching
Veri�cation
Opticalrecognition
Raw data
Computer storage
Data for analysis
Bar codeOther
technologies
Real research Scanning the seas8
Princess Cruises (www.princess.com) carries more than a million passengers a year. Princess wished to know what passengers thought of the cruise experience, but wanted to deter-mine this information in a cost-effective way. A scannable questionnaire was developed that allowed the cruise line to transcribe the data quickly from thousands of responses, thus expediting data integrity and analysis. The questionnaire was designed and distributed to measure customer satisfaction on all voyages. In addition to saving time as compared with

541Chapter 19 Data integrity
keypunching, scanning also increased the accu-racy of survey results. The Senior Researcher for Princess Cruises, Jamie Goldfarb, commented:
When we compared the data files from the two methods, we found that although the scanned system occasionally missed marks because they had not been filled in properly, the scanned data was still more accurate than the keypunched file.
A monthly report with analyses based upon cruise destination and ship was produced. This report identified any specific problems that had been noticed, and steps were taken to make sure these problems were addressed.
Cleaning the data
Data cleaning includes consistency checks and treatment of missing responses. Even though preliminary consistency checks have been made during editing, the checks at this stage are more thorough and extensive, because they are made by computer.
Consistency checks
Consistency checks identify data that are out of range or logically inconsistent, or have extreme values. Out-of-range data values are inadmissible and must be corrected. For exam-ple, participants may be asked to express their degree of agreement with a series of lifestyle statements on a 1–5 scale. Assuming that 9 has been designated for missing values, data val-ues of 0, 6, 7 and 8 would be out of range. Computer packages can be programmed to identify out-of-range values for each variable and will not progress to another variable within a record until a value in the set range is entered. Other packages can be programmed to print out the participant code, variable code, variable name, record number, column number and out-of-range value. This makes it easy to check each variable systematically for out-of-range values. The correct responses can be determined by going back to the edited and coded questionnaire.
Responses can be logically inconsistent in various ways. For example, participants may indicate that they charge long-distance calls to a calling card from a credit card company, although they do not have such a credit card. Alternatively, participants might report both unfamiliarity with and frequent usage of the very same product. The necessary information (participant code, variable code, variable name, record number, column number and incon-sistent values) can be printed to locate these responses and to take corrective action.
Finally, extreme values should be closely examined. Not all extreme values result from errors, but they may point to problems with the data. For example, in the Formula One Racetrack sur-vey, participants were asked to name the manufacturer of the cars that ‘belonged’ to their house-holds. Certain participants recorded 10 or more cars. In these circumstances the extreme values can be identified and the actual figure validated in many cases by re-contacting the participant.9
Treatment of missing responses
Missing responses represent values of a variable that are unknown, either because participants provided ambiguous answers or because their answers were not properly recorded. Treatment of missing responses poses problems, particularly if the proportion of missing responses is more than 10%. The following options are available for the treatment of missing responses:10
Data cleaningThorough and extensive checks for consistency and treatment of missing responses.
Consistency checksA part of the data cleaning process that identifies data that are out of range, logically inconsistent or have extreme values. Data with values not defined by the coding scheme are inadmissible.
Missing responsesValues of a variable that are unknown because the participants concerned provided ambiguous answers to the question or because their answers were not properly recorded.

542 Marketing Research
1 Substitute a neutral value. A neutral value, typically the mean response to the variable, is substituted for the missing responses. Thus, the mean of the variable remains unchanged, and other statistics such as correlations are not affected much. Although this approach has some merit, the logic of substituting a mean value (say 4) for participants who, if they had answered, might have used either high ratings (6 or 7) or low ratings (1 or 2) is questionable.11
2 Substitute an imputed response. The participants’ pattern of responses to other questions is used to impute or calculate a suitable response to the missing questions. The researcher attempts to infer from the available data the responses that the individuals would have given if they had answered the questions. This can be done statistically by determining the relationship of the variable in question to other variables based on the available data. For example, product usage could be related to household size for participants who have provided data on both variables. Given that participant’s household size, the missing product usage response for a participant could then be calculated. This approach, how-ever, requires considerable effort and can introduce serious bias. Sophisticated statistical procedures have been developed to calculate imputed values for missing responses.12
Real research Imputation increases integrity13
A project was undertaken to assess the willingness of households to implement the rec-ommendations of an energy audit (dependent variable) having been given the financial implications (independent variables). Five financial factors were used as independent variables and they were manipulated at known levels. The values of these factors were always known by virtue of the design adopted. However, several values of the depend-ent variable were missing. These missing values were replaced with imputed values. The imputed values were statistically calculated, given the corresponding values of the inde-pendent variables. The treatment of missing responses in this manner greatly increased the simplicity and validity of subsequent analysis.
3 Casewise deletion. In casewise deletion, cases or participants with any missing responses are discarded from the analysis. Because many participants may have some missing responses, this approach could result in a small sample. Throwing away large amounts of data is undesirable because it is costly and time-consuming to collect data. Furthermore, participants with missing responses could differ from participants with complete responses in systematic ways. If so, casewise deletion could seriously bias the results.
4 Pairwise deletion. In pairwise deletion, instead of discarding all cases with any missing responses, the researcher uses only the cases or participants with complete responses for each calculation. As a result, different calculations in an analysis may be based on differ-ent sample sizes. This procedure may be appropriate when: (1) the sample size is large; (2) there are few missing responses; and (3) the variables are not highly related. However, this procedure can produce unappealing or even infeasible results.
The different procedures for the treatment of missing responses may yield different results, particularly when the responses are not missing at random and the variables are related. Hence, missing responses should be kept to a minimum. The researcher should care-fully consider the implications of the various procedures before selecting a particular method for the treatment of non-response.
Casewise deletionA method for handling missing responses in which cases or participants with any missing responses are discarded from the analysis.
Pairwise deletionA method for handling missing responses in which all cases or participants with any missing responses are not automatically discarded; rather, for each calculation, only the cases or participants with complete responses are considered.

543Chapter 19 Data integrity
Statistically adjusting the data
Procedures for statistically adjusting the data consist of weighting, variable respecification and scale transformation. These adjustments are not always necessary but can enhance the quality of data analysis.
Weighting
In weighting, each case or participant in the database is assigned a weight to reflect its importance relative to other cases or participants.14 The value 1.0 represents the unweighted case. The effect of weighting is to increase or decrease the number of cases in the sample that possess certain characteristics. (See Chapter 15, which discussed the use of weighting to adjust for non-response bias.)
Weighting is most widely used to make the sample data more representative of a target population on specific characteristics. For example, it may be used to give greater impor-tance to cases or participants with higher-quality data. Another use of weighting is to adjust the sample so that greater importance is attached to participants with certain characteristics. If a study is conducted to determine what modifications should be made to an existing product, the researcher might want to attach greater weight to the opinions of heavy users of the product. This could be accomplished by assigning weights of 3.0 to heavy users, 2.0 to medium users and 1.0 to light users and non-users. Because it destroys the self-weight-ing nature of the sample design, weighting should be applied with caution. If used, the weighting procedure should be documented and made a part of the project report.15
WeightingA statistical procedure that attempts to account for non-response by assigning differential weights to the data depending on the response rates.
Real research Determining the weight of community centre users
A postal survey was conducted in the Scottish city of Edinburgh to determine the patron-age of a community centre. The resulting sample composition differed in age structure from the area population distribution, as compiled from recent census data. Therefore, the sample was weighted to make it representative in terms of age structure. The weights applied were determined by dividing the population percentage by the corresponding sample percentage. The distribution of age structure for the sample and population, as well as the weights applied, are given in the following table.
Age group percentage Sample percentage Population Weight
13–18 4.32 6.13 1.4219–24 5.89 7.45 1.2625–34 12.23 13.98 1.1435–44 17.54 17.68 1.0145–54 14.66 15.59 1.0655–64 13.88 13.65 0.9865–74 15.67 13.65 0.87
75 plus 15.81 11.87 0.75Totals 100.00 100.00
Age groups under-represented in the sample received higher weights, whereas over-represented age groups received lower weights. Thus, the data for a participant aged 13–18 would be overweighted by multiplying by 1.42, whereas the data for a participant aged 75 plus would be underweighted by multiplying by 0.75.

544 Marketing Research
Variable respecification
Variable respecification involves the transformation of data to create new variables or to modify existing variables. The purpose of respecification is to create variables that are consistent with the objectives of the study. For example, suppose that the original varia-ble was product usage, with 10 response categories. These might be collapsed into four categories: heavy, medium, light and non-user. Or the researcher may create new varia-bles that are composites of several other variables. For example, the researcher may cre-ate an index of information search (ISS), which is the sum of information new car customers seek from dealers, promotional sources, online and other independent sources. Likewise, one may take the ratio of variables. If the number of purchases at a clothes shop (X1) and the number of purchases where a credit card was used (X2) have been measured, the proportion of purchases charged to a credit card can be a new variable, created by tak-ing the ratio of the two (X2/X1). Other respecifications of variables include square root and log transformations, which are often applied to improve the fit of the model being estimated.
An important respecification procedure involves the use of dummy variables for respecifying categorical variables.16 Dummy variables are also called binary, dichoto-mous, instrumental or qualitative variables. They are variables that may take on only two values, such as 0 or 1. The general rule is that to respecify a categorical variable with K categories, K – 1 dummy variables are needed. The reason for having K – 1, rather than K, dummy variables is that only K – 1 categories are independent. Given the sample data, information about the Kth category can be derived from information about the other K – 1 categories. Consider gender, a variable having two categories. Only one dummy variable is needed. Information on the number or percentage of males in the sample can be readily derived from the number or percentage of females. The following example further illus-trates the concept of dummy variables.
Dummy variablesA respecification procedure using variables that take on only two values, usually 0 or 1.
Variable respecificationThe transformation of data to create new variables or the modification of existing variables so that they are more consistent with the objectives of the study.
Real research ‘Frozen’ consumers treated as dummies
In a survey of consumer preferences for frozen foods, the participants were classified as heavy users, medium users, light users and non-users, and they were origi-nally assigned codes of 4, 3, 2 and 1, respectively. This coding was not meaningful for several statistical analy-ses. To conduct these analyses, product usage was rep-resented by three dummy variables, X1, X2 and X3, as shown in the table.
Product usageOriginal
variable codeDummy variable
code category
X1 X2 X3
Non-users 1 1 0 0Light users 2 0 1 0Medium users 3 0 0 1Heavy users 4 0 0 0
Note that X1 = 1 for non-users and 0 for all others. Likewise, X2 = 1 for light users and 0 for all others, and X3 = 1 for medium users and 0 for all others. In analysing the data, X1, X2 and X3 are used to represent all user/non-user groups.

545Chapter 19 Data integrity
Scale transformation
Scale transformation involves a manipulation of scale values to ensure comparability with other scales or to otherwise make the data suitable for analysis.17 Frequently, different scales are employed for measuring different variables. For example, image variables may be meas-ured on a seven-point semantic differential scale, attitude variables on a continuous rating scale and lifestyle variables on a five-point Likert scale. Therefore, it would not be meaning-ful to make comparisons across the measurement scales for any participant. To compare attitudinal scores with lifestyle or image scores, it would be necessary to transform the vari-ous scales. Even if the same scale is employed for all the variables, different participants may use the scale differently. For example, some participants consistently use the upper end of a rating scale whereas others consistently use the lower end. These differences can be cor-rected by appropriately transforming the data, as illustrated in the following example.
Scale transformationA manipulation of scale values to ensure compatibility with other scales or to otherwise make the data suitable for analysis.
Real research Health care services: transforming consumers18
In a study examining preference segmentation of health care services, participants were asked to rate the importance of 18 factors affecting preferences for hospitals on a three-point scale (very, somewhat, or not important). Before analysing the data, each individu-al’s ratings were transformed. For each individual, preference responses were averaged across all 18 items. Then this mean was X subtracted from each item rating, Xi, and a con-stant, C, was added to the difference. Thus, the transformed data, Xt, were obtained by
= – +Xt iX X C
Subtraction of the mean value corrected for any uneven use of the importance scale. The constant, C, was added to make all the transformed values positive, since negative impor-tance ratings are not meaningful conceptually. This transformation was desirable because some participants, especially those with low incomes, had rated almost all the prefer-ence items as very important. Others, high-income participants in particular, had assigned the very important rating to only a few preference items. Thus, subtraction of the mean value provided a more accurate idea of the relative importance of the factors.
In this example, the scale transformation is corrected only for the mean response. A more common transformation procedure is standardisation. To standardise a scale, Xi, we first subtract the mean, X from each score and then divide by the standard deviation, sx. Thus, the standardised scale will have a mean of 0 and a standard deviation of 1. This is essentially the same as the calculation of z scores (see Chapter 15). Standardisation allows the researcher to compare variables that have been measured using different types of scales.19 Mathemati-cally, standardised scores, zi, may be obtained as:
ZSi
Xi X( – )=
StandardisationThe process of correcting data to reduce them to the same scale by subtracting the sample mean and dividing by the standard deviation.
Selecting a data analysis strategy
The process of selecting a data analysis strategy is described in Figure 19.3. The selection of a data analysis strategy should be based on the earlier steps of the marketing research process, known characteristics of the data, properties of statistical techniques and the background and philosophy of the researcher.

546 Marketing Research
Data analysis is not an end in itself. Its purpose is to produce information that will help address the problem at hand and support effective decision making. The selection of a data analysis strategy must begin with a consideration of the earlier steps in the research process: problem definition (step 1), development of an approach (step 2) and research design (step 3). The preliminary plan of data analysis prepared as part of the research design should be used to facilitate a richer engagement and understanding of meaning that may lie within collected data. Changes in analysis techniques may be necessary in the light of additional information generated in subsequent stages of the research process.
The next step is to consider the known characteristics of the data. The measurement scales used exert a strong influence on the choice of statistical techniques (see Chapter 12). In addi-tion, the research design may favour certain techniques. For example, analysis of variance (see Chapter 21) is suited for analysing experimental data from causal designs. The insights into the data obtained during data integrity can be valuable for selecting a strategy for analysis.
It is also important to take into account the properties of the statistical techniques, particu-larly their purpose and underlying assumptions. Some statistical techniques are appropriate for examining differences in variables, others for assessing the magnitudes of the relation-ships between variables, and still others for making predictions. The techniques also involve different assumptions, and some techniques can withstand violations of the underlying assumptions better than others. A classification of statistical techniques is presented below.
Finally, the researcher’s background and philosophy affect the choice of a data analysis strategy. The experienced, statistically trained researcher will employ a range of techniques, including advanced statistical methods. Researchers differ in their willingness to make assump-tions about the variables and their underlying populations. Researchers who are conservative about making assumptions will limit their choice of techniques to distribution-free methods. In general, several techniques may be appropriate for analysing the data from a given project.
A classification of statistical techniques
Statistical techniques can be classified as univariate or multivariate. Univariate techniques are appropriate when there is a single measurement of each element in the sample, or when there are several measurements of each element but each variable is analysed in isolation. Multivariate techniques, on the other hand, are suitable for analysing data when there are two or more measurements of each element and the variables are analysed simultaneously. Multivariate techniques are concerned with the simultaneous relationships among two or
Univariate techniquesStatistical techniques appropriate for analysing data when there is a single measurement of each element in the sample, or, if there are several measurements on each element, when each variable is analysed in isolation.
Multivariate techniquesStatistical techniques suitable for analysing data when there are two or more measurements on each element and the variables are analysed simultaneously. Multivariate techniques are concerned with the simultaneous relationships among two or more phenomena.
Figure 19.3
Selecting a data analysis strategy
Known characteristics of the data
Earlier stages of marketing research process:• problem de�nition• development of a research approach• research design
Background and philosophy ofthe researcher
Properties of statistical techniques
Data analysis strategy

547Chapter 19 Data integrity
more phenomena. Multivariate techniques differ from univariate techniques in that they shift the focus away from the levels (averages) and distributions (variances) of the phenomena, concentrating instead on the degree of relationships (correlations or covariances) among these phenomena.20 The univariate and multivariate techniques are described in detail in Chapters 20 to 26, but here we show how the various techniques relate to each other in an overall scheme of classification.
Univariate techniques can be further classified based on whether the data are metric or non-metric (as introduced in Chapter 12). Metric data are measured on an interval or ratio scale, whereas non-metric data are measured on a nominal or ordinal scale. These tech-niques can be further classified based on whether one, two or more samples are involved. It should be noted that the number of samples is determined by how the data are treated for the purpose of analysis, not how the data were collected. For example, the data for males and females may well have been collected as a single sample, but if the analysis involves an examination of gender differences, two samples will be used. The samples are independent samples if they are drawn randomly from different populations. For the purpose of analysis, data pertaining to different groups of participants, e.g. males and females, are generally treated as independent samples. On the other hand, the samples are paired samples when the data for the two samples relate to the same group of participants.
For metric data, when there is only one sample, the z test and the t test can be used. When there are two or more independent samples, the z test and t test can be used for two samples, and one-way analysis of variance (one-way ANOVA) can be used for more than two sam-ples. In the case of two or more related samples, the paired t test can be used. For non-metric data involving a single sample, frequency distribution, chi-square, Kolmogorov–Smirnov (K–S), runs and binomial tests can be used. For two independent samples with non-metric data, the chi-square, Mann–Whitney, median, K–S and Kruskal–Wallis one-way analysis of variance (K–W ANOVA) can be used. In contrast, when there are two or more related sam-ples, the sign, Wilcoxon, McNemar and chi-square tests should be used (see Figure 19.4).
Metric dataData that are interval or ratio in nature.
Non-metric dataData derived from a nominal or ordinal scale.
Independent samplesThe samples are independent if they are drawn randomly from different populations.
Paired samplesThe samples are paired when the data for the two samples relate to the same group of participants.
Figure 19.4
A classification of univariate techniques
Metricdata
Non-metricdata
Univariate techniques
One sample
• Frequency• Chi-square• K–S• Runs• Binomial
Two or moresamples
One sample
• t test• z test
Independent
• Chi-square• Mann–Whitney• Median• K–S• K–W ANOVA
Related
• Sign• Wilcoxon• McNemar• Chi-square
Independent
• Two-group t test• t test• z test• One-way ANOVA
Related
• Paired t test
Two or moresamples

548 Marketing Research
Multivariate statistical techniques can be classified as dependence techniques or interde-pendence techniques (see Figure 19.5). Dependence techniques are appropriate when one or more variables can be identified as dependent variables and the remaining ones as inde-pendent variables. When there is only one dependent variable, cross-tabulation, analysis of variance and covariance, multiple regression, two-group discriminant analysis and conjoint analysis can be used. If there is more than one dependent variable, however, the appropriate techniques are multivariate analysis of variance and covariance, canonical correlation and multiple discriminant analysis. In interdependence techniques, the variables are not clas-sified as dependent or independent; rather, the whole set of interdependent relationships is examined. These techniques focus on either variable interdependence or interobject simi-larity. The major technique for examining variable interdependence is factor analysis. Analysis of interobject similarity can be conducted by cluster analysis and multidimen-sional scaling.21
Dependence techniquesMultivariate techniques appropriate when one or more of the variables can be identified as dependent variables and the remaining ones as independent variables.
Interdependence techniquesMultivariate statistical techniques that attempt to group data based on underlying similarity and thus allow for interpretation of the data structures. No distinction is made as to which variables are dependent and which are independent.
Figure 19.5
A classification of multivariate techniques
Dependencetechniques
Interdependencetechniques
Multivariate techniques
Variableinterdependence
Interobjectsimilarity
Onedependent
variable
More thanone dependent
variable• Factor analysis • Cluster analysis
• Multidimensional scaling
• Multivariate analysis of variance and covariance• Canonical correlation• Multiple discriminant analysis
• Cross-tabulation• Analysis of variance and covariance• Multiple regression• Two-group discriminant analysis• Conjoint analysis
Data integrity across countries and cultures
Data analysis can be conducted at three levels: (1) individual; (2) within country or cultural unit; and (3) across countries or cultural units. Individual-level analysis requires that the data from each participant be analysed separately. For example, one might compute a correlation coefficient or run a regression analysis for each participant. This means that enough data must be obtained from each individual to allow analysis at the individual level, which is often not feasible. Yet it has been argued that, in international marketing or cross-cultural research, the researcher should possess a sound knowledge of the consumer in each culture. This can best be accomplished by individual-level analysis.22
In within-country or cultural unit analysis, the data are analysed separately for each coun-try or cultural unit. This is also referred to as intra-cultural analysis. This level of analysis is quite similar to that conducted in domestic marketing research. The objective is to gain an understanding of the relationships and patterns existing in each country or cultural unit. In across-countries analysis, the data from all the countries are analysed simultaneously. Two
Intra-cultural analysisWithin-country analysis of international data.

549Chapter 19 Data integrity
approaches to this method are possible. The data for all participants from all the countries can be pooled and analysed. This is referred to as pan-cultural analysis. Alternatively, the data can be aggregated for each country, and then these aggregate statistics can be analysed. For example, one could compute the means of variables for each country, and then compute correlations on these means. This is referred to as cross-cultural analysis. The objective of this level of analysis is to assess the comparability of findings from one country to another. The similarities as well as the differences between countries should be investigated. When examining differences, not only differences in means but also differences in variance and distribution should be assessed. All the statistical techniques that have been discussed in this text can be applied to within-country or across-countries analysis and, subject to the amount of data available, to individual-level analysis as well.23
Pan-cultural analysisAcross-countries analysis in which the data for all participants from all the countries are pooled and analysed.
Cross-cultural analysisA type of across-countries analysis in which the data could be aggregated for each country and these aggregate statistics analysed.
Real research A worldwide scream for ice cream24
Over half the sales of Häagen-Dazs (www.haagen-dazs.com), the US ice cream manufac-turer, come from markets outside the USA. Its sales across Europe and Asia have increased at a phenomenal rate. Marketing research has played a key role in the success of this brand. Research conducted in several European countries (e.g. the UK, France and Germany) and several Asian countries (e.g. Japan, Singapore and Taiwan) revealed that consumers were hungry for a high-quality ice cream with a high-quality image and were willing to pay a premium price for it. These consistent findings emerged after the price of ice cream in each country was standardised to have a mean of zero and a standard deviation of unity. Standardisation was desirable because the prices were specified in different local currencies and a common basis was needed for comparison across coun-tries. Also, in each country, the premium price had to be defined in relation to the prices of competing brands. Standardisation accomplished both of these objectives. Based on these findings, Häagen-Dazs first introduced the brand at a few high-end retailers; it then built company-owned stores in high-traffic areas; and finally it rolled into conveni-ence stores and supermarkets. It maintained the premium-quality brand name by start-ing first with a few high-end retailers. It also supplied free freezers to retailers. Hungry for quality products, consumers in the new markets paid double or triple the price of home brands. Häagen-Dazs remains popular, although faced with intense competition and health-conscious consumers.
Practise data analysis with SPSS
We have developed demonstration movies that give step-by-step instructions to run all the SPSS examples that are discussed in this text. These demonstrations can be downloaded from the website for this book. The instructions for running these demonstrations are given in Exhibit 19.2 below. The step-by-step instructions for running the various SPSS examples are also illustrated in screen captures with appropriate notes. These screen captures can be downloaded from the website for this book.
SPSS for Windows or Mac
Using the Base module of SPSS, out-of-range values can be selected using the SELECT IF command. These cases, with the identifying information (subject ID, record number, varia-ble name and variable value) can then be printed using the LIST or PRINT commands. The

550 Marketing Research
PRINT command will save active cases to an external file. If a formatted list is required, the SUMMARIZE command can be used.
SPSS Data Entry can facilitate data integrity. You can verify that participants have answered completely by setting rules. These rules can be used on existing data sets to vali-date and check the data, whether or not the questionnaire used to collect the data was con-structed in Data Entry. Data Entry allows you to control and check the entry of data through three types of rules: validation, checking and skip and fill rules. Although the missing values can be treated within the context of the Base module, SPSS Missing Values Analysis can assist in diagnosing missing values with estimates. TextSmart by SPSS can help in the cod-ing and analysis of open-ended responses.
Creating a variable called Overall Evaluation
We illustrate the use of the Base module in creating new variables and recoding existing ones using the data of Exhibit 19.1. We want to create a variable called Overall Evaluation ( Overall) that is the sum of the ratings on quality, quantity, value and service. Thus:
Overall = Quality + Quantity + Value + Service
These steps are as follows:
1 Select TRANSFORM.
2 Click COMPUTE VARIABLE.
3 Type ‘overall’ in the TARGET VARIABLE box.
4 Click ‘quality’ and move it to the NUMERIC EXPRESSIONS box.
5 Click the ‘+’ sign.
6 Click ‘quantity’ and move it to the NUMERIC EXPRESSIONS box.
7 Click the ‘+’ sign.
8 Click ‘value’ and move it to the NUMERIC EXPRESSIONS box.
9 Click the ‘+’ sign.
10 Click ‘service’ and move it to the NUMERIC EXPRESSIONS box.
11 Click TYPE & LABEL under the TARGET VARIABLE box and type ‘Overall Evalua-tion’. Click CONTINUE.
12 Click OK.
Recoding to create new variable called Recoded Income
We also want to illustrate the recoding of variables to create new variables. Income category 1 occurs only once and income category 6 occurs only twice. So we want to combine income categories 1 and 2 and categories 5 and 6, and create a new income variable ‘rincome’ labelled ‘Recoded Income’. Note that rincome has only four categories that are coded as 1 to 4. This can be done in SPSS Windows as follows:
1 Select TRANSFORM.
2 Click RECODE and select INTO DIFFERENT VARIABLES.
3 Click income and move it to NUMERIC VARIABLE S OUTPUT VARIABLE box.
4 Type ‘rincome’ in OUTPUT VARIABLE NAME box.
5 Type ‘Recode Income’ in OUTCOME VARIABLE LABEL box.

551Chapter 19 Data integrity
Exhibit 19.1
ID Preference Quality Quantity Value Service Income
1 2 2 3 1 3 62 6 5 6 5 7 23 4 4 3 4 5 34 1 2 1 1 2 55 7 6 6 5 4 16 5 4 4 5 4 37 2 2 3 2 3 58 3 3 4 2 3 49 7 6 7 6 5 2
10 2 3 2 2 2 511 2 3 2 1 3 612 6 6 6 6 7 213 4 4 3 3 4 314 1 1 3 1 2 415 7 7 5 5 4 216 5 5 4 5 5 317 2 3 1 2 3 418 4 4 3 3 3 319 7 5 5 7 5 520 3 2 2 3 3 3
Restaurant preference
6 Click OLD AND NEW VALUES box.
7 Under OLD VALUES on the left, click RANGE. Type ‘1’ and ‘2’ in the range boxes. Under NEW VALUES on the right, click VALUE and type ‘1’ in the value box. Click ADD.
8 Under OLD VALUES on the left, click VALUE. Type ‘3’ in the value box. Under NEW VALUES on the right, click VALUE and type ‘2’ in the value box. Click ADD.
9 Under OLD VALUES on the left, click VALUE. Type ‘4’ in the value box. Under NEW VALUES on the right, click VALUE and type ‘3’ in the value box. Click ADD.
10 Under OLD VALUES on the left, click RANGE. Type ‘5’ and ‘6’ in the range boxes. Under NEW VALUES on the right, click VALUE and type ‘4’ in the value box. Click ADD.
11 Click CONTINUE.
12 Click CHANGE.
13 Click OK.
14 Click RUN.
Exhibit 19.2
To make the examples given in these chapters easier, video demonstrations are available for each of the SPSS exercises on the website. They are clearly organised by chapter and full instructions are provided on the website.
Instructions for running video demonstrations
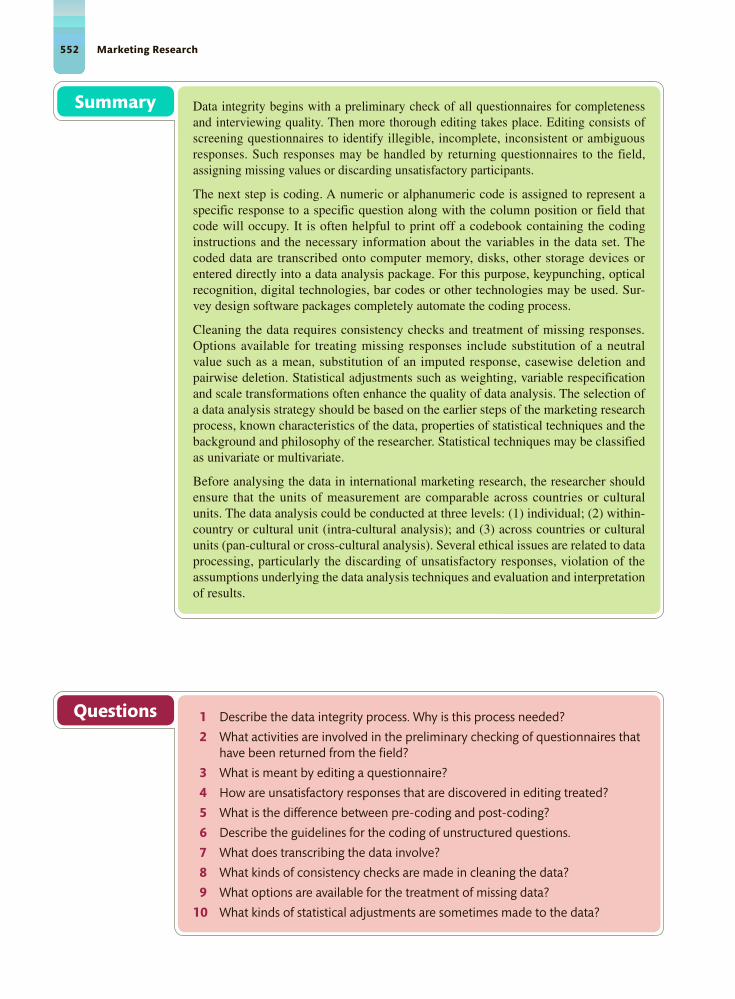
552 Marketing Research
Summary Data integrity begins with a preliminary check of all questionnaires for completeness and interviewing quality. Then more thorough editing takes place. Editing consists of screening questionnaires to identify illegible, incomplete, inconsistent or ambiguous responses. Such responses may be handled by returning questionnaires to the field, assigning missing values or discarding unsatisfactory participants.
The next step is coding. A numeric or alphanumeric code is assigned to represent a specific response to a specific question along with the column position or field that code will occupy. It is often helpful to print off a codebook containing the coding instructions and the necessary information about the variables in the data set. The coded data are transcribed onto computer memory, disks, other storage devices or entered directly into a data analysis package. For this purpose, keypunching, optical recognition, digital technologies, bar codes or other technologies may be used. Sur-vey design software packages completely automate the coding process.
Cleaning the data requires consistency checks and treatment of missing responses. Options available for treating missing responses include substitution of a neutral value such as a mean, substitution of an imputed response, casewise deletion and pairwise deletion. Statistical adjustments such as weighting, variable respecification and scale transformations often enhance the quality of data analysis. The selection of a data analysis strategy should be based on the earlier steps of the marketing research process, known characteristics of the data, properties of statistical techniques and the background and philosophy of the researcher. Statistical techniques may be classified as univariate or multivariate.
Before analysing the data in international marketing research, the researcher should ensure that the units of measurement are comparable across countries or cultural units. The data analysis could be conducted at three levels: (1) individual; (2) within-country or cultural unit (intra-cultural analysis); and (3) across countries or cultural units (pan-cultural or cross-cultural analysis). Several ethical issues are related to data processing, particularly the discarding of unsatisfactory responses, violation of the assumptions underlying the data analysis techniques and evaluation and interpretation of results.
Questions 1 Describe the data integrity process. Why is this process needed?
2 What activities are involved in the preliminary checking of questionnaires that have been returned from the field?
3 What is meant by editing a questionnaire?
4 How are unsatisfactory responses that are discovered in editing treated?
5 What is the difference between pre-coding and post-coding?
6 Describe the guidelines for the coding of unstructured questions.
7 What does transcribing the data involve?
8 What kinds of consistency checks are made in cleaning the data?
9 What options are available for the treatment of missing data?
10 What kinds of statistical adjustments are sometimes made to the data?

553Chapter 19 Data integrity
11 Describe the weighting process. What are the reasons for weighting?
12 What are dummy variables? Why are such variables created?
13 Explain why scale transformations are made.
14 Which scale transformation procedure is most commonly used? Briefly describe this procedure.
15 What considerations are involved in selecting a data analysis strategy?
Exercises 1 Visit www.ettinger.co.uk and examine online databases, secondary data and intelligence sources to obtain information on the criteria buyers use in selecting luxury leather accessories. Demographic and psychographic data were obtained in a survey designed to explain the choice of luxury leather accessories. What kind of consistency checks, treatment of missing responses and variable respecification should be conducted?
2 To a sample of five male and five female fellow students, pose the question ‘Which of the following sports have you participated in over the last 12 months?’ Create a list of what you think may be the top 10 sports that fellow students may have participated in, with space for ‘Others – please specify’. After conducting the 10 interviews, how would you cope with the coding of the ‘Others’? How would you rewrite this question and potential list of sports if you were to repeat the exercise?
3 You are the Marketing Research Manager for AGA (www.agaliving.com). AGA has developed a luxury refrigerator and matching freezer retailing at a cost of €5,000 each. A European survey was conducted to determine consumer response to the proposed models. The data were obtained by conducting a face-to-face survey at shopping malls in 10 European capital cities. Although the resulting sample of 2,500 is fairly representative on all other demographic variables, it under-represents the upper-income households. The marketing research analyst who reports to you feels that weighting is not necessary. Discuss this question with the analyst (a student in your class).
4 You are the project manager for a data analysis firm. You are supervising the data integrity process for a large survey on personal hygiene issues. The data were collected via a postal survey and 1,823 questionnaires have been returned. The response rate was excellent, partially due to an enticing prize draw that accompanied the survey. However, you are suspicious about the quality of many responses and 290 questionnaires have missing responses. The data analyst preparing the data has not seen such a level of missing data and does not know how to cope with this survey. Explain to the data analyst how the missing responses and checks on the quality of data to be analysed should be performed.
5 In a small group, discuss the following issues: ‘Data processing is tedious, time-consuming and costly; it should be circumvented whenever possible’ and ‘Conducting robust sampling is tedious, time-consuming and costly; any structural problems in a sample can simply be resolved through weighting.’

554 Marketing Research
Notes
1. Trembly, A.C., ‘Poor data quality: A $600 billion issue’, National Underwriter 106 (11) (18 March 2002), 48; Higgins, K.T., ‘Never ending journey’, Marketing Management 6 (1) (Spring 1997), 4–7; Harristhal, J., ‘Interviewer tips’, Applied Marketing Research 28 (Fall 1988), 42–5.
2. Keillor, B., Owens, D. and Pettijohn, C., ‘A cross-cultural/cross-national study of influencing factors and socially desirable response biases’, International Journal of Market Research 43 (1) (First Quarter 2001), 63–84; Dadzie, K.Q., ‘Demarketing strategy in shortage marketing environment’, Journal of the Academy of Marketing Science (Spring 1989), 157–65. See also Nishisato, S., Measurement and Multivariate Analysis (New York: Springer-Verlag, 2002).
3. Healey, B. and Gendall, P., ‘Forum – asking the age question in mail and online surveys’, International Journal of Market Research 50 (3) (2008), 309–17.
4. Schmidt, M., ‘Quantification of transcripts from depth interviews, open-ended responses and focus groups: Challenges, accomplishments, new applications and perspectives for market research’, International Journal of Market Research 52 (4) (2010), 483–509; Jenkins, S., ‘Automating questionnaire design and construction’, Journal of the Market Research Society 42 (1) (Winter 1999–2000), 79–85; Fink, A., How to Analyze Survey Data (Thousand Oaks, CA: Sage, 1995).
5. Esuli, A. and Sebastiani, F., ‘Machines that learn how to code open-ended survey data’, International Journal of Market Research 52 (6) (2010), 775–800.
6. Kearney, I., ‘Measuring consumer brand confusion to comply with legal guidelines’, International Journal of Market Research 43 (1) (First Quarter 2001), 85–91; Luyens, S., ‘Coding verbatims by computer’, Marketing Research: A Magazine of Management and Applications 7 (2) (Spring 1995), 20–5.
7. Hammett, Y.C., ‘Voters in Hillsborough County, Florida try out touch-screen voting machines’, Knight Ridder Tribune Business News (3 April 2007), 1; Studt, T., ‘Exclusive survey reveals move to high-tech solutions’, Research & Development 43 (3) (March 2001), 37–8; Frendberg, N., ‘Scanning questionnaires efficiently’, Marketing Research: A Magazine of Management and Applications 5 (2) (Spring 1993), 38–42.
8. Rydholm, J., ‘Scanning the seas’, Marketing Research Review (May 1993), www.princess.com, accessed 23 May 2002.
9. Albaum, G., Roster, C., Yu, J.H. and Rogers , R.D., ‘Simple rating scale formats: Exploring extreme response’, International Journal of Market Research 49 (5) (2007), 633–50.
10. Vicente, P., Reis, E. and Santos, M., ‘Using mobile phones for survey research: A comparison with fixed phones’, International Journal of Market Research 51 (5) (2009), 613–34; Allison, P.D., Missing Data (Thousand Oaks, CA: Sage, 2001); Lee, B.J., ‘Sample selection bias correction for missing response observations’, Oxford Bulletin of Economics and Statistics 62 (2) (May 2000), 305; Freedman, V.A. and Wolf, D.A., ‘A case study on the use of multiple imputation’, Demography 32 (3)
(August 1995), 459–70; Malhotra, N.K., ‘Analysing marketing research data with incomplete information on the dependent variable’, Journal of Marketing Research 24 (February 1987), 74–84.
11. A meaningful and practical value should be imputed. The value imputed should be a legitimate response code. For example, a mean of 3.86 may not be practical if only single-digit response codes have been developed. In such cases, the mean should be rounded to the nearest integer. See Allen, N.J., Williams, H., Stanley, D.J. and Ross, S.J., ‘Assessing dissimilarity relations under missing data conditions: Evidence from computer simulations’, Journal of Applied Psychology 92 (5) (September 2007), 1414–26.
12. Kent, R.A., ‘Cases as configurations: Using combinatorial and fuzzy logic to analyse marketing data’, International Journal of Market Research (47) 2 (2005), 205–28; Murphy, K.M., ‘Estimation and inference in two-step econometric models’, Journal of Business & Economic Statistics 20 (1) (January 2002), 88–97; Kara, A., Nielsen, C., Sahay, S. and Sivasubramaniam, N., ‘Latent information in the pattern of missing observations in global mail surveys’, Journal of Global Marketing 7 (4) (1994), 103–26.
13. Zeithammer, R. and Lenk, P., ‘Bayesian estimation of multivariate-normal models when dimensions are absent’, Quantitative Marketing and Economics 4 (3) (September 2006), 241–64.
14. Sparrow, N., ‘Quality issues on online research’, Journal of Advertising Research 47 (2) (June 2007), 179–82.
15. Some weighting procedures require adjustments in subsequent data analysis techniques. See Curtice, J. and Sparrow, N., ‘The past matters: Eliminating the pro-Labour bias in British opinion polls’, International Journal of Market Research 52 (2) (2010), 169–89; Dawes, J., ‘Do data characteristics change according to the number of scale points used?’, International Journal of Market Research 50 (1) (2008), 61–77; Tucker, C., Brick, M. and Meekins, B., ‘Household telephone service and usage patterns in the United States in 2004: Implications for telephone samples’, Public Opinion Quarterly 71 (1) (April 2007), 3–22; Bartholomew, D.J., Steele, F., Moustaki, I and Galbraith, J.I., The Analysis and Interpretation of Multivariate Data for Social Scientists, 2nd edn (Boca Raton, FL: CRC Press, 2008).
16. Labeaga-Azcona, J.M., Lado-Cousté, N. and Martos-Partal, M., ‘The double jeopardy loyalty effect using discrete choice models’, International Journal of Market Research 52 (5) (2010), 635–54.
17. Dolnicar, S., Grün, B. and Leisch, F., ‘Quick, simple and reliable: Forced binary survey questions’, International Journal of Market Research 53 (2) (2011), 233–54.
18. Akinci, F. and Healey, B.J., ‘The role of social marketing in understanding access to primary health care services: Perceptions and experiences’, Health Marketing Quarterly 21 (4) (January 2004), 3–30; Bradford, M., ‘Health care access services for expats gain in popularity’, Business Insurance 36 (1) (7 January 2002), 19–20; Woodside, A.G., Nielsen, R.L., Walters, F. and Muller, G.D., ‘Preference segmentation of health care

555Chapter 19 Data integrity
services: The old-fashioneds, value conscious, affluents, and professional want-it-alls’, Journal of Health Care Marketing (June 1988), 14–24. See also Jayanti, R., ‘Affective responses toward service providers: Implications for service encounters’, Health Marketing Quarterly 14 (1) (1996), 49–65.
19. See, for specific transformations frequently used in marketing research, Gomez, M. and Okazaki, S., ‘Estimating store brand shelf space: A new framework using neural networks and partial least squares’, International Journal of Market Research 51 (2) (2009), 243–66; Johnson, R.A. and Wichern, D.W., Applied Multivariate Statistical Analysis (Paramus, NJ: Prentice Hall, 2001); Swift, B., ‘Preparing numerical data’, in Sapsford, R. and Jupp, V. (eds), Data Collection and Analysis (Thousand Oaks, CA: Sage, 1996); Frank, R.E., ‘Use of transformations’, Journal of Marketing Research 3 (August 1966), 247–53.
20. Bivariate techniques have been included here with multivariate techniques. Although bivariate techniques are concerned with pairwise relationships, multivariate techniques examine more complex simultaneous relationships among phenomena. See DeSarbo, W.S., Hausman, R.E. and Kukitz, J.M., ‘Restricted principal components analysis for marketing research’, Journal of Modeling in Management 2 (3) (2007), 305; Spicer, J., Making Sense of Multivariate Data Analysis: An Intuitive Approach (Thousand Oaks, CA: Sage, 2004); Tacq, J., Multivariate Analysis Techniques in Social Science Research Analysis (Thousand Oaks, CA: Sage, 1996).
21. Drossos, D., Giaglis, G.M., Lekakos, G., Kokkinaki, F. and Stavraki, M.G., ‘Determinants of effective SMS advertising: An experimental study’, Journal of Interactive Advertising 7 (2) (Spring 2007), 16–27; DeSarbo, W.S., ‘The joint spatial representation of multiple variable batteries collected in marketing
research’, Journal of Marketing Research 38 (2) (May 2001), 244–53; Carroll, J.D. and Green, P.E., ‘Psychometric methods in marketing research: Part II, multidimensional scaling’, Journal of Marketing Research 34 (2) (May 1997), 193–204.
22. Ford, J.B., Mueller, B., Taylor, C.R. and Hollis, N., ‘The tension between strategy and execution: Challenges for international advertising research – globalization is much more than universal branding’, Journal of Advertising Research 51 (1), 50th Anniversary Supplement (2011), 27–41; Dolnicar, S. and Grun, B., ‘Cross-cultural differences in survey response patterns’, International Marketing Review 24 (2) (2007), 127; McDonald, G., ‘Cross-cultural methodological issues in ethical research’, Journal of Business Ethics 27 (1/2) (September 2000), 89–104; Alasuutari, P., Researching Culture (Thousand Oaks, CA: Sage, 1995).
23. See, for example, McCarty, J.A., Horn, M.I., Szenasy, M.K. and Feintuch, J., ‘An exploratory study of consumer style: Country differences and international segments’, Journal of Consumer Behaviour 6 (1) (February 2007), 48; Tian, R.G., ‘Cross-cultural issues in Internet marketing’, Journal of American Academy of Business 1 (2) (March 2002), 217–24; Spiller, L.D. and Campbell, A.J., ‘The use of international direct marketing by small businesses in Canada, Mexico, and the United States: A comparative analysis’, Journal of Direct Marketing 8 (Winter 1994), 7–16; Nyaw, M.K. and Ng, I., ‘A comparative analysis of ethical beliefs: A four country study’, Journal of Business Ethics 13 (July 1994), 543–56.
24. Slavens, R., ‘Haagen-Dazs tastes success with crème de la crème campaign’, B to B 92 (1) (January 2007), 23; Anon., ‘For a scoop of their own’, Businessline (17 January 2002), 1; Kilburn, D., ‘Häagen-Dazs is flavor of month’, Marketing Week 20 (23) (4 September 1997), 30.

Frequency distribution, cross-tabulation and hypothesis testing
Frequency distribution, cross-
tabulation and hypothesis testing
are the fundamental building
blocks of quantitative data
analysis. They provide insights
into the data, guide subsequent
analyses and aid the
interpretation of results.
Stage 1
Problem definition
Stage 2
Research approach developed
Stage 3
Research design
developed
Stage 4
Fieldwork or data
collection
Stage 5
Data integrity
and analysis
Stage 6
Communicating research findings
20

557Chapter 20 Frequency distribution, cross-tabulation and hypothesis testing
Objectives
After reading this chapter, you should be able to:
1 describe the significance of preliminary data analysis and the insights that can be obtained from such analyses;
2 discuss data analysis associated with frequencies, including measures of location, measures of variability and measures of shape;
3 explain data analysis associated with cross-tabulations and the associated statistics: chi-square, phi coefficient, contingency coefficient, Cramer’s V and lambda coefficient;
4 describe data analysis associated with parametric hypothesis testing for one sample, two independent samples and paired samples;
5 understand data analysis associated with non-parametric hypothesis testing for one sample, two independent samples and paired samples;
6 understand the use of software to analyse frequency distributions, cross-tabulations and hypothesis testing.
Overview
Once the data have been prepared for analysis (Chapter 19), the researcher should conduct basic analyses. This chapter describes basic data analyses, including frequency distribution, cross-tabulation and hypothesis testing. First, we describe the frequency distribution and explain how it provides both an indication of the number of out-of-range, missing or extreme values as well as insights into the central tendency, variability and shape of the underlying distribution. Next, we introduce hypothesis testing by describing the general procedure. Hypothesis testing procedures are classified as tests of associations or tests of differences. We consider the use of cross-tabulation for understanding the associations between variables taken two or three at a time. Although the nature of the association can be observed from tables, statistics are available for examining the significance and strength of the association. We present tests for examining hypotheses related to differences based on one or two samples. Finally, help is provided to use SPSS in the data analysis challenges presented in this chapter.
Many marketing research projects do not go beyond basic data analysis. These findings are often displayed using tables and graphs (as discussed further in Chapter 27). Although the findings of basic analysis are valuable in their own right, they also provide guidance for conducting multivariate analysis. The insights gained from the basic analysis are also invaluable in interpreting the results obtained from more sophisticated statistical techniques. The following examples provide a ‘flavour’ of basic data analysis techniques. We illustrate the use of cross-tabulation, chi-square analysis and hypothesis testing.
Real research FIBA Brand Tracker (1)
In 2009, the International Basketball Federation (FIBA) commissioned IFM Sports Marketing Surveys to conduct a Brand Health Tracker study. FIBA wished to monitor per-ceptions of the FIBA brand and FIBA events. It wanted to know what affected the devel-opment of its brand. FIBA was particularly interested in how perceptions of basketball differed in the countries under study and

558 Marketing Research
whether any differences were statistically significant. The sample of sports fans was classified based upon the number of games they had watched in the previous year. The following table focuses upon the levels of interest in basketball of Chinese, Italian, Spanish and UK participants.
Cross-tabulation and chi-square analysis provided the following:
Sports fans’ level of interest in basketball
Country (absolute numbers of participants – and column %)
China Italy Spain UK
Avid 187 (31%) 146 (24%) 83 (15%) 85 (14%)Occasional 115 (19%) 158 (26%) 226 (41%) 219 (36%)Low 242 (40%) 238 (39%) 187 (34%) 194 (32%)None 60 (10%) 67 (11%) 55 (10%) 115 (19%)Totals 604 (100%) 645 (100%) 609 (100%) 607 (100%)
x2 = 145.56 p ≤ 0.0001
These results indicate that there was little difference across the four countries in terms of ‘Low’ or ‘No’ levels of interest in basketball. However, there was a much higher propor-tion of Chinese and Italians that had an ‘Avid’ interest. UK sports fans had the lowest levels of ‘Avids’ and the highest levels of fans with no interest in basketball. The chi-square test indicated that there were statistically significant differences in levels of inter-est in basketball across the countries studied.
Real research Catalogues are risky business1
Twelve product categories were examined to compare shopping by catalogue with store shopping. The hypothesis that there is no significant difference in the overall amount of risk perceived when buying products by catalogue compared with buying the same products in a retail store was rejected. The hypothesis was tested by computing 12 (one for each product) paired observation t tests. Mean scores for overall perceived risk for some of the products in both buying situations are presented in the following table, with higher scores indicating greater risk.
Overall perceived risk
Product Catalogue Store
Shoes 58.60 50.80*Pocket calculator 49.62 42.00*Hi-fi 48.89 41.98*Digital camera 48.13 39.52*Sports socks 35.22 30.22*Perfume 34.85 29.79*
* Significant at 0.01 level.
As can be seen, a significantly (p < 0.01) higher overall amount of perceived risk was attached to products purchased by catalogue as compared with those purchased from a retail store. Although this study reveals risk associated with buying from a catalogue, ter-rorist threats, time shortage and increased convenience have increased the amount of products that are purchased from catalogues, as well as online.

559Chapter 20 Frequency distribution, cross-tabulation and hypothesis testing
These two examples show how basic data analysis can be useful in its own right. The cross-tabulation and chi-square analysis in the FIBA example and the paired t tests in the catalogue shopping example enabled us to draw specific conclusions from the data. These and other concepts discussed in this chapter are illustrated in the context of explaining internet usage for personal (non-professional) reasons. Table 20.1 contains data for 30 participants, giving the gender (1 = male, 2 = female), familiarity with the internet (1 = very unfamiliar, 7 = very familiar), internet usage in hours per week, attitude towards the internet and towards technol-ogy, both measured on a seven-point scale (1 = very unfavourable, 7 = very favourable) and whether the participants have done online shopping or banking (1 = yes, 2 = no). For illustra-tive purposes, we consider only a small number of observations. In actual practice, frequen-cies, cross-tabulations and hypothesis tests are performed on much larger samples. For example, the FIBA study sample size was 4,288.
Table 20.1
Participant no. Gender Familiarity Internet usage
Attitude towards internet
Attitude towards
technology
Usage of internet
shopping
Usage of internet banking
1 1 7 14 7 6 1 12 2 2 2 3 3 2 23 2 3 3 4 3 1 24 2 3 3 7 5 1 25 1 7 13 7 7 1 16 2 4 6 5 4 1 27 2 2 2 4 5 2 28 2 3 6 5 4 2 29 2 3 6 6 4 1 2
10 1 9 15 7 6 1 211 2 4 3 4 3 2 212 2 5 4 6 4 2 213 1 6 9 6 5 2 114 1 6 8 3 2 2 215 1 6 5 5 4 1 216 2 4 3 4 3 2 217 1 6 9 5 3 1 118 1 4 4 5 4 1 219 1 7 14 6 6 1 120 2 6 6 6 4 2 221 1 6 9 4 2 2 222 1 5 5 5 4 2 123 2 3 2 4 2 2 224 1 7 15 6 6 1 125 2 6 6 5 3 1 226 1 6 13 6 6 1 127 2 5 4 5 5 1 128 2 4 2 3 2 2 229 1 4 4 5 3 1 230 1 3 3 7 5 1 2
Internet usage data

560 Marketing Research
Marketing researchers often need to answer questions about a single variable. For example:
• How many users of the brand may be characterised as brand loyal?
• What percentage of the market consists of heavy users, medium users, light users and non-users?
• How many customers are very familiar with a new product offering? How many are famil-iar, somewhat familiar, or unfamiliar with the brand? What is the mean familiarity rating? Is there much variance in the extent to which customers are familiar with the new product?
• What is the income distribution of brand users? Is this distribution skewed towards low-income brackets?
The answers to these kinds of questions can be determined by examining frequency distributions. In a frequency distribution, one variable is considered at a time.
The objective is to obtain a count of the number of responses associated with different val-ues of the variable. The relative occurrence, or frequency, of different values of the variable is expressed in percentages. A frequency distribution for a variable produces a table of frequency counts, percentages and cumulative percentages for all the values associated with that variable.
Table 20.2 gives the frequency distribution of familiarity with the internet. In the table, the first column contains the labels assigned to the different categories of the variable and the second column indicates the codes assigned to each value. Note that a code of 9 has been assigned to missing values. The third column gives the number of participants ticking each value. For example, three participants ticked value 5, indicating that they were somewhat familiar with the internet. The fourth column displays the percentage of participants ticking each value. The fifth column shows percentages calculated by excluding the cases with miss-ing values. If there are no missing values, the fourth and fifth columns are identical. The last column represents cumulative percentages after adjusting for missing values. As can be seen, of the 30 participants who participated in the survey, 10% entered a figure of ‘5’. If the one participant with a missing value is excluded, this changes to 10.3%. The cumulative percent-age corresponding to the value of 5 is 58.6. In other words, 58.6% of the participants with valid responses indicated a familiarity value of 5 or less.
A frequency distribution helps determine the extent of item non-response (1 participant out of 30 in Table 20.2). It also indicates the extent of illegitimate responses. Values of 0 and
Frequency distributionA mathematical distribution whose objective is to obtain a count of the number of responses associated with different values of one variable and to express these counts in percentage terms.
Frequency distribution
Table 20.2
Value label Value Frequency (N) Percentage Valid percentage Cumulative percentage
Very unfamiliar 1 0 0.0 0.0 0.02 2 6.7 6.9 6.93 6 20.0 20.7 27.64 6 20.0 20.7 48.35 3 10.0 10.3 58.66 8 26.7 27.6 86.2
Very familiar 7 4 13.3 13.8 100.0
Missing 9 1 3.3
Total 30 100.0 100.0
Frequency distribution of ‘Familiarity with the internet’

561Chapter 20 Frequency distribution, cross-tabulation and hypothesis testing
8 would be illegitimate responses, or errors. The cases with these values could be identified and corrective action could be taken. The presence of outliers or cases with extreme values can also be detected. For example, in the case of a frequency distribution of household size, a few isolated families with household sizes of nine or more might be considered outliers. A frequency distribution also indicates the shape of the empirical distribution of the variable. The frequency data may be used to construct a histogram, or a vertical bar chart, in which the values of the variable are portrayed along the X axis and the absolute or relative frequencies of the values are placed along the Y axis.
Figure 20.1 is a histogram of the frequency data in Table 20.2. From the histogram, one could examine whether the observed distribution is consistent with an expected or assumed distribution.
Real research FIBA Brand Tracker (2)
In the FIBA branding study, avid fans of basketball were asked how they followed basket-ball. Of the sample of 4,288, there were 900 classified as avid fans of the sport.
The results showed that the top three forms of media favoured by avid basketball fans were: ‘watch dedicated TV’, ‘read newspaper articles’ and ‘visit websites’. Of particu-lar interest was the use of new media in terms of ‘visit websites’, ‘read blogs’ and ‘receive results via mobile’. FIBA took particular note of these new media forms and the differ-ences between countries in how forms of media were favoured. In subsequent brand health studies, FIBA would take particular note of changes in media usage, especially in the use of new media.
All countries – avid fans regularly follow basketball through . . .
Media used Frequency Percentage
Watch dedicated TV 495 55Read newspaper articles 423 47Visit websites 315 35Participate 270 30Read specialist magazines 234 26Read blogs 234 26Listen to radio broadcasts 225 25Attend events 180 20Receive results via mobile 126 14Did not respond 10 0.01Total 900* 100.0
* This refers to participants’ responses to a multiple-choice question.
Figure 20.1
Frequency histogram
0
2
4
6
8
10
1 2 3 4 5 6Familiarity with the internet
Freq
uenc
y
7

562 Marketing Research
Note that the numbers and percentages in the preceding example indicate the extent of media usage to follow basketball by avid fans of the sport. Because numbers are involved, a fre-quency distribution can be used to calculate descriptive or cumulative statistics.
Statistics associated with frequency distribution
As illustrated in the previous section, a frequency distribution is a convenient way of looking at different values of a variable. A frequency table is easy to read and provides basic infor-mation, but sometimes this information may be too detailed and the researcher must sum-marise it by the use of descriptive statistics. The most commonly used statistics associated with frequencies are measures of location (mean, mode and median), measures of variability (range, interquartile range, variance, standard deviation and coefficient of variation) and measures of shape (skewness and kurtosis).2
Measures of location
The measures of location that we discuss are measures of central tendency because they tend to describe the centre of the distribution. If the entire sample is changed by adding a fixed constant to each observation, then the mean, mode and median change by the same fixed amount:
1 Mean. The mean, or average value, is the most commonly used measure of central ten-dency. The measure is used to estimate the mean when the data have been collected using an interval or ratio scale. The data should display some central tendency, with most of the responses distributed around the mean.
The mean, X , is given by:
where Xi = observed values of the variable X n = number of observations (sample size).
Generally, the mean is a robust measure and does not change markedly as data values are added or deleted. For the frequencies given in Table 20.2, the mean value is calculated as follows:
= (2 × 2) + (6 × 3) + (6 × 4) + (3 × 5) + (8 × 6) + (4 × 7)/29= (4 + 18 + 24 + 15 + 48 + 28)/29= 137/29= 4.724
X
2 Mode. The mode is the value that occurs most frequently. It represents the highest peak of the distribution. The mode is a good measure of location when the variable is inherently categorical or has otherwise been grouped into categories. The mode in Table 20.2 is 6.
3 Median. The median of a sample is the middle value when the data are arranged in ascending or descending order. If the number of data points is even, the median is usu-ally estimated as the midpoint between the two middle values by adding the two middle values and dividing their sum by 2. The median is the 50th percentile. The median is an appropriate measure of central tendency for ordinal data. In Table 20.2, the middle value is 5, so the median is 5.
Measure of locationA statistic that describes a location within a data set. Measures of central tendency describe the centre of the distribution.
MeanThe average; that value obtained by summing all elements in a set and dividing by the number of elements.v
= =1XX
n
ni
i©
ModeA measure of central tendency given as the value that occurs with the most frequency in a sample distribution.
MedianA measure of central tendency given as the value above which half of the values fall and below which half of the values fall.

563Chapter 20 Frequency distribution, cross-tabulation and hypothesis testing
As can be seen from Table 20.2, the three measures of central tendency for this distri-bution are different (mean = 4.724, mode = 6, median = 5). This is not surprising, since each measure defines central tendency in a different way. So which measure should be used? If the variable is measured on a nominal scale, the mode should be used. If the variable is measured on an ordinal scale, the median is appropriate. If the variable is measured on an interval or ratio scale, the mode is a poor measure of central tendency. This can be seen from Table 20.2. Although the modal value of 6 has the highest fre-quency, it represents only 27.6% of the sample. In general, for interval or ratio data, the median is a better measure of central tendency, although it too ignores available informa-tion about the variable. The actual values of the variable above and below the median are ignored. The mean is the most appropriate measure of central tendency for interval or ratio data. The mean makes use of all the information available since all of the values are used in computing it. However, it is sensitive to extremely small or extremely large val-ues (outliers). When there are outliers in the data, the mean is not a good measure of central tendency, and it is useful to consider both the mean and the median. In Table 20.2, since there are no extreme values and the data are treated as interval, the mean value of 4.724 is a good measure of location or central tendency. Although this value is greater than 4, it is still not high (i.e. it is less than 5).
Measures of variability
The measures of variability, which are calculated on interval or ratio data, include the range, interquartile range, variance or standard deviation and coefficient of variation:
1 Range. The range measures the spread of the data. It is simply the difference between the largest and smallest values in the sample:
Range = Xlargest X –
smallest
As such, the range is directly affected by outliers. If all the values in the data are mul-tiplied by a constant, the range is multiplied by the same constant. The range in Table 20.2 is 7 – 2 = 5.
2 Interquartile range. The interquartile range is the difference between the 75th and 25th percentiles. For a set of data points arranged in order of magnitude, the pth percentile is the value that has p% of the data points below it and (100 – p)% above it. If all the data points are multiplied by a constant, the interquartile range is multiplied by the same con-stant. The interquartile range in Table 20.2 is 6 – 3 = 3.
3 Variance. The difference between the mean and an observed value is called the deviation from the mean. The variance is the mean squared deviation from the mean. The variance can never be negative. When the data points are clustered around the mean, the variance is small. When the data points are scattered, the variance is large. If all the data values are multiplied by a constant, the variance is multiplied by the square of the constant.
4 Standard deviation. The standard deviation is the square root of the variance. Thus, the standard deviation is expressed in the same units as the data, rather than in squared units. The standard deviation of a sample, Sx, is calculated as:
We divide by n − 1 instead of n because the sample is drawn from a population and we are trying to determine how much the responses vary from the mean of the entire population. The population mean is unknown, however; therefore, the sample mean is used instead. The use of the sample mean makes the sample seem less variable than it really is. By
Measure of variabilityA statistic that indicates the distribution’s dispersion.
RangeThe difference between the smallest and largest values of a distribution.
Interquartile rangeThe range of a distribution encompassing the middle 50% of the observations.
VarianceThe mean squared deviation of all the values of the mean.
Standard deviationThe square root of the variance.
=(X – X) 2
S
n
n –1i–1
i©

564 Marketing Research
dividing by n − 1 instead of by n, we compensate for the smaller variability observed in the sample. For the data given in Table 20.2, the variance is calculated as follows:
2 = [2 × (2 – 4.724)2 + 6 × (3 – 4.724)2 + 6 × (4 – 4.724)2 + 3 × (5 – 4.724)2
+ 8 × (6 – 4.724)2 + 4 × (7 – 4.724)2]/28= [14.840 + 17.833 + 3.145 + 0.229 + 13.025 + 20.721]/28= 69.793/28= 2.493
sx
The standard deviation, therefore, is calculated as:
S =
=
2.493
1.579
5 Coefficient of variation. The coefficient of variation is the ratio of the standard deviation to the mean expressed as a percentage, and it is a unitless measure of relative variability. The coefficient of variation, CV, is expressed as:
CV=XS
The coefficient of variation is meaningful only if the variable is measured on a ratio scale. It remains unchanged if all the data values are multiplied by a constant. Because familiarity with the internet is not measured on a ratio scale, it is not meaningful to calculate the coef-ficient of variation for the data in Table 20.2. From a managerial viewpoint, measures of variability are important because if a characteristic shows good variability, then perhaps the market could be segmented based on that characteristic.
Measures of shape
In addition to measures of variability, measures of shape are also useful in understanding the nature of the distribution. The shape of a distribution is assessed by examining skewness and kurtosis:
1 Skewness. Distributions can be either symmetric or skewed. In a symmetric distribution, the values on either side of the centre of the distribution are the same, and the mean, mode and median are equal. The positive and corresponding negative deviations from the mean are also equal. In a skewed distribution, the positive and negative deviations from the mean are unequal. Skewness is the tendency of the deviations from the mean to be larger in one direction than in the other. It can be thought of as the tendency for one tail of the distribution to be heavier than the other (see Figure 20.2). The skewness value for the data of Table 20.2 is –0.094, indicating a slight negative skew.
Coefficient of variationA useful expression in sampling theory for the standard deviation as a percentage of the mean.
SkewnessA characteristic of a distribution that assesses its symmetry about the mean.
Figure 20.2
Skewness of a distribution
MeanMedianMode
Symmetric distribution Skewed distribution
Median ModeMean

565Chapter 20 Frequency distribution, cross-tabulation and hypothesis testing
2 Kurtosis. Kurtosis is a measure of the relative peakedness or flatness of the curve defined by the frequency distribution. The kurtosis of a normal distribution is zero. If the kurtosis is positive, then the distribution is more peaked than a normal distribution. A negative value means that the distribution is flatter than a normal distribution. The value of this statistic for Table 20.2 is –1.261, indicating that the distribution is flatter than a normal distribution. Measures of shape are important, because if a distribution is highly skewed or markedly peaked or flat, then statistical procedures that assume normality should be used with caution.
KurtosisA measure of the relative peakedness of the curve defined by the frequency distribution.
A general procedure for hypothesis testing
Basic analysis invariably involves some hypothesis testing. Examples of hypotheses gener-ated in marketing research abound:
• A cinema is being attended by more than 10% of the households in a city.
• The heavy and light users of a brand differ in terms of psychographic characteristics.
• One hotel has a more ‘luxurious’ image than its close competitor.
• Familiarity with a restaurant results in greater preference for that restaurant.
Chapter 15 covered the concepts of the sampling distribution, standard error of the mean or the proportion, and the confidence interval.3 All these concepts are relevant to hypothesis testing and should be reviewed. We now describe a general procedure for hypothesis testing that can be applied to test hypotheses about a wide range of parameters.
The following steps are involved in hypothesis testing (Figure 20.3):
1 Formulate the null hypothesis H0 and the alternative hypothesis H1.
2 Select an appropriate statistical technique and the corresponding test statistic.
3 Choose the level of significance, a.
4 Determine the sample size and collect the data. Calculate the value of the test statistic.
5 Determine the probability associated with the test statistic under the null hypothesis, using the sampling distribution of the test statistic. Alternatively, determine the critical values associated with the test statistic that divide the rejection and non-rejection regions.
6 Compare the probability associated with the test statistic with the level of significance specified. Alternatively, determine whether the test statistic has fallen into the rejection or non-rejection region.
7 Make the statistical decision to reject or not reject the null hypothesis.
8 Express the statistical decision in terms of the marketing research problem.
Step 1: Formulate the hypothesis
The first step is to formulate the null and alternative hypotheses. A null hypothesis is a state-ment of the status quo, one of no difference or no effect. If the null hypothesis is not rejected, no changes will be made. An alternative hypothesis is one in which some difference or effect is expected. Accepting the alternative hypothesis will lead to changes in opinions or actions. Thus, the alternative hypothesis is the opposite of the null hypothesis.
The null hypothesis is always the hypothesis that is tested. The null hypothesis refers to a specified value of the population parameter (e.g. m, s, p), not a sample statistic (e.g. X–). A null hypothesis may be rejected, but it can never be accepted based on a single test. A statis-tical test can have one of two outcomes: that the null hypothesis is rejected and the alterna-tive hypothesis accepted, or that the null hypothesis is not rejected based on the evidence.
Null hypothesisA statement in which no difference or effect is expected. If the null hypothesis is not rejected, no changes will be made.
Alternative hypothesisA statement that some difference or effect is expected. Accepting the alternative hypothesis will lead to changes in opinions or actions.

566 Marketing Research
It would be incorrect, however, to conclude that since the null hypothesis is not rejected, it can be accepted as valid. In classical hypothesis testing, there is no way to determine whether the null hypothesis is true.
In marketing research, the null hypothesis is formulated in such a way that its rejection leads to the acceptance of the desired conclusion. The alternative hypothesis represents the conclusion for which evidence is sought. For example, a FIBA sponsor (a basketball sports-wear brand) may be considering introducing an online store to complement its physical retail outlets. Given the investment in systems and personnel to make this plan work, it will only be introduced if more than 40% of internet users shop online. The appropriate way to formu-late the hypotheses is:
0:
1:
HH
p≤ 0.40p> 0.40
If the null hypothesis H0 is rejected, then the alternative hypothesis H1 will be accepted and the new online shopping service introduced. On the other hand, if H0 is not rejected, then a planned online shopping service should not be introduced until additional supporting evi-dence is obtained. The test of the null hypothesis is a onetailed test because the alternative hypothesis is expressed directionally: the proportion of customers who express a preference is greater than 0.40.
On the other hand, suppose that the researcher wanted to determine whether the propor-tion of internet users who shop via the internet is different than 40%. Then a twotailed test would be required, and the hypotheses would be expressed as:
0:
1:
HH
p = 0.40p ≠ 0.40
One-tailed testA test of the null hypothesis where the alternative hypothesis is expressed directionally.
Two-tailed testA test of the null hypothesis where the alternative hypothesis is not expressed directionally.
Figure 20.3
A general procedure for hypothesis testing
Formulate H0 anf H1
Select an appropriate test
Choose the level of signi�cance a
Collect data and calculate the test statistic TSCAL
Reject or do not reject H0
Draw a marketing research conclusion
Determine the probabilityassociated with the test
statistic, TSCAL
Compare probability withlevel of signi�cance, a
Step 1
Step 2
Step 3
Step 4
Step 7
Step 8
Step 5
Step 6
Determine the criticalvalue of the test
statistic, TSCR
Determine if TSCAL fallsinto rejection or
non-rejection region

567Chapter 20 Frequency distribution, cross-tabulation and hypothesis testing
In commercial marketing research, the one-tailed test is used more often than a two-tailed test. Typically, there is some preferred direction for the conclusion for which evidence is sought. For example, the higher the profits, sales and product quality, the better. The one-tailed test is more powerful than the two-tailed test. The power of a statistical test is dis-cussed further in step 3.
Step 2: Select an appropriate statistical technique
To test the null hypothesis, it is necessary to select an appropriate statistical technique. The researcher should take into consideration how the test statistic is computed and the sampling distribution that the sample statistic (e.g. the mean) follows. The test statistic measures how close the sample has come to the null hypothesis. The test statistic often follows a well-known distribution, such as the normal, t, or chi-square distribution. Guidelines for selecting an appropriate test or statistical technique are discussed later in this chapter. In our example, the z statistic, which follows the standard normal distribution, would be appropriate. This statistic would be computed as follows:
= =whereps
p ns
p−p p(1−p)Z
Step 3: Choose the level of significance, A
Whenever we draw inferences about a population, there is a risk that an incorrect conclusion will be reached. Two types of error can occur.
Type I error occurs when the sample results lead to the rejection of the null hypothesis when it is, in fact, true. In our example, a Type I error would occur if we concluded, based on sample data, that the proportion of customers preferring an online store was greater than 0.40, when in fact it was less than or equal to 0.40. The probability of Type I error (a) is also called the level of significance. The Type I error is controlled by establishing the tolerable level of risk of rejecting a true null hypothesis. The selection of a particular risk level should depend on the cost of making a Type I error.
Type II error occurs when, based on the sample results, the null hypothesis is not rejected when it is, in fact, false. In our example, the Type II error would occur if we concluded, based on sample data, that the proportion of customers preferring an online store was less than or equal to 0.40 when in fact it was greater than 0.40. The probability of Type II error is denoted by b. Unlike a, which is specified by the researcher, the magnitude of b depends on the actual value of the population parameter (proportion). The probability of Type I error (a) and the probability of Type II error (b) are shown in Figure 20.4.
The complement (1 − b) of the probability of a Type II error is called the power of a statistical test. The power of a test is the probability (1 − b) of rejecting the null hypothesis when it is false and should be rejected. Although b is unknown, it is related to a. An extremely low value of a (e.g. 0.001) will result in intolerably high b errors. So it is neces-sary to balance the two types of errors. As a compromise, a is often set at 0.05; sometimes it is 0.01; other values of a are rare. The level of a along with the sample size will determine the level of b for a particular research design. The risk of both a and b can be controlled by increasing the sample size. For a given level of a, increasing the sample size will decrease b, thereby increasing the power of the test.
Step 4: Collect the data and calculate the test statistic
Sample size is determined after taking into account the desired a and b errors and other qualitative considerations, such as budget constraints. Then the required data are collected and the value of the test statistic is computed. In our example, 30 users were surveyed and
Test statisticA measure of how close the sample has come to the null hypothesis. It often follows a well-known distribution, such as the normal, t, or chi-square distribution.
Type I errorAn error that occurs when the sample results lead to the rejection of a null hypothesis that is, in fact, true. Also called alpha error (a).
Level of significanceThe probability of making a Type I error.
Type II errorAn error that occurs when the sample results lead to acceptance of a null hypothesis that is, in fact, false. Also called beta error (b ).
Power of a statistical testThe probability of rejecting the null hypothesis when it is, in fact, false and should be rejected.

568 Marketing Research
17 indicated that they shopped online. Thus, the value of the sample proportion is p = 17/30 = 0.567. The value of sp can be determined as follows:
=
= ×=
p
/
s p(1−p)/ n
0.4
0.089
0.6 30
The test statistic, z, can be calculated as follows:
p
= 0.567 – 0.40/0.089= 1.88
= p – p/sZ
Step 5: Determine the probability or the critical value
Using standard normal tables, the probability of obtaining a z value of 1.88 can be calculated (see Figure 20.5). The shaded area between –∞ and 1.88 is 0.9699. Therefore, the area to the right of z = 1.88 is 1.0000 – 0.9699 = 0.0301. This is also called the p value and is the prob-ability of observing a value of the test statistic as extreme as, or more extreme than, the value actually observed, assuming the null hypothesis is true.
p valueThis is the probability of observing a value of the test statistic as extreme as, or more extreme than, the value actually observed, assuming that the null hypothesis is true.
Figure 20.5
Probability of z with a one-tailed test
0
Unshadedarea is 0.0301
z = 1.88
Shaded area= 0.9699
Figure 20.4
Type I error (A) and Type II error (B) 95% of
total area
Criticalvalue of z
z
z
99% oftotal area
π = 0.45
π = 0.40
α = 0.05
zα = 1.645

569Chapter 20 Frequency distribution, cross-tabulation and hypothesis testing
Alternatively, the critical value of z, which will give an area to the right side of the critical value of 0.05, is between 1.64 and 1.65 and equals 1.645. Note that, in determining the criti-cal value of the test statistic, the area to the right of the critical value is either a or a/2. It is a for a one-tailed test and a/2 for a two-tailed test.
Steps 6 and 7: Compare the probability or critical values and make the decision
The probability associated with the calculated or observed value of the test statistic is 0.0301. This is the probability of getting a p value of 0.567 when π = 0.40. This is less than the level of significance of 0.05. Hence, the null hypothesis is rejected. Alterna-tively, the calculated value of the test statistic z = 1.88 lies in the rejection region, beyond the value of 1.645. Again, the same conclusion to reject the null hypothesis is reached. Note that the two ways of testing the null hypothesis are equivalent but mathematically opposite in the direction of comparison. If the probability associated with the calculated or observed value of the test statistic (TSCAL) is less than the level of significance (a), the null hypothesis is rejected. If the calculated value of the test statistic is greater than the critical value of the test statistic (TSCR), however, the null hypothesis is again rejected. The reason for this sign shift is that the larger the value of TSCAL, the smaller the proba-bility of obtaining a more extreme value of the test statistic under the null hypothesis. This sign shift can be easily seen:
if probability of TSCAL
< significance level (a), then reject H0
butif |TS
CAL| > |TS
CR|, then reject H
0
Step 8: Draw the marketing research conclusion
The conclusion reached by hypothesis testing must be expressed in terms of the marketing research problem. In our example, we conclude that there is evidence that the proportion of internet users who shop online is significantly greater than 0.40. Hence, the recommendation would be to launch the new online store.
As can be seen from Figure 20.6, hypothesis testing can be related to either an examina-tion of associations or an examination of differences. In tests of associations the null hypothesis is that there is no association between the variables (H0: . . . is not related to . . .). In tests of differences the null hypothesis is that there is no difference (H0: . . . is not
Figure 20.6
A broad classification of hypothesis testing procedures
MeansDistributions Proportions Medians/rankings
Tests ofassociation
Tests ofdi�erences
Hypothesistests

570 Marketing Research
different than . . .). Tests of differences could relate to distributions, means, proportions, or medians or rankings. First, we discuss hypotheses related to associations in the context of cross-tabulations.
Cross-tabulations
Although answers to questions related to a single variable are interesting, they often raise additional questions about how to link that variable to other variables. To introduce the fre-quency distribution, we pose several representative marketing research questions. For each of these, a researcher might pose additional questions to relate these variables to other vari-ables. For example:
• How many brand-loyal users are males?
• Is product use (measured in terms of heavy users, medium users, light users and non-users) related to interest in outdoor leisure activities (high, medium and low)?
• Is familiarity with a new product related to age and income levels?
• Is product ownership related to income (high, medium and low)?
The answers to such questions can be determined by examining crosstabulations. A frequency distribution describes one variable at a time, but a cross-tabulation describes two or more variables simultaneously. A cross-tabulation is the merging of the frequency distribution of two or more variables in a single table. It helps us to understand how one variable, such as brand loyalty, relates to another variable, such as gender. Cross-tabulation results in tables that reflect the joint distribution of two or more variables with a limited number of categories or distinct values. The categories of one variable are cross-classified with the categories of one or more other variables. Thus, the frequency distribution of one variable is subdivided according to the values or categories of the other variables.
Suppose we are interested in determining whether internet usage is related to gender. For the purpose of cross-tabulation, participants are classified as ‘light’ or ‘heavy’ users. Those reporting five hours or less usage were classified as ‘light’ users, and the remaining were ‘heavy’ users. The cross-tabulation is shown in Table 20.3. A cross-tabulation includes a cell for every combination of the categories of the two variables. The number in each cell shows how many participants gave that combination of responses. In Table 20.3, 10 participants were females who reported light internet usage. The marginal totals in this table indicate that of the 30 participants with valid responses on both variables, 15 reported light usage and 15 were heavy users. In terms of gender, 15 participants were females and 15 were males. Note that this information could have been obtained from a separate frequency distribution for each variable. In general, the margins of a cross-tabulation show the same information as the frequency tables for each of the variables. Cross-tabulation tables are also called contingency tables. The data are considered to be qualitative or categorical data, because each variable is assumed to have only a nominal scale.4
Cross-tabulation is widely used in commercial marketing research because: (1) cross-tabulation analysis and results can be easily interpreted and understood by managers who are not statistically oriented; (2) the clarity of interpretation provides a stronger link between research results and managerial action; (3) a series of cross-tabulations may pro-vide greater insights into a complex phenomenon than a single multivariate analysis; (4) cross-tabulation may alleviate the problem of sparse cells, which could be serious in discrete multivariate analysis; and (5) cross-tabulation analysis is simple to conduct and appealing to both qualitative and quantitative researchers.5 We discuss cross-tabulation for two and three variables.
Cross-tabulationA statistical technique that describes two or more variables simultaneously and results in tables that reflect the joint distribution of two or more variables that have a limited number of categories or distinct values.
Contingency tableA cross-tabulation table. It contains a cell for every combination of categories of the two variables.

571Chapter 20 Frequency distribution, cross-tabulation and hypothesis testing
Two variables
Cross-tabulation with two variables is also known as bivariate cross-tabulation. Consider again the cross-classification of internet usage with gender, given in Table 20.3. Is usage related to gender? It appears to be from Table 20.3. We see that disproportionately more of the participants who are male are heavy internet users as compared with females. Computa-tion of percentages can provide more insight.
Because two variables have been cross-classified, percentages could be computed either column-wise, based on column totals (Table 20.4), or row-wise, based on row totals (Table 20.5). Which table is more useful?
Table 20.3
Gender
Internet usage Male Female Row total
Light (1) 5 10 15Heavy (2) 10 5 15Column totals 15 15
Gender and internet usage
Table 20.4
Gender
Internet usage Male Female
Light (1) 33.3% 66.7%Heavy (2) 66.7% 33.3%Column totals 100% 100%
Gender and internet usage – column totals
Table 20.5
Gender total
Internet usage Male Female Row total
Light (1) 33.3% 66.7% 100%Heavy (2) 66.7% 33.3% 100%
Gender and internet usage – row totals
The answer depends on which variable will be considered as the independent variable and which as the dependent variable.6 The general rule is to compute the percentages in the direction of the independent variable, across the dependent variable. In our analysis, gender may be considered as the independent variable and internet usage as the dependent variable, and the correct way of calculating percentages is shown in Table 20.4. Note that whereas

572 Marketing Research
66.7% of the males are heavy users, only 33.3% of females fall into this category. This seems to indicate that males are more likely to be heavy users of the internet as compared with females.
Note that computing percentages in the direction of the dependent variable across the independent variable, as shown in Table 20.5, is not meaningful in this case. Table 20.5 implies that heavy internet usage causes people to be males. This latter finding is implausi-ble. It is possible, however, that the association between internet usage and gender is medi-ated by a third variable, such as age or income. This kind of possibility points to the need to examine the effect of a third variable.
Three variables
Often the introduction of a third variable clarifies the initial association (or lack of it) observed between two variables. As shown in Figure 20.7, the introduction of a third varia-ble can result in four possibilities:
1 It can refine the association observed between the two original variables.
2 It can indicate no association between the two variables, although an association was ini-tially observed. In other words, the third variable indicates that the initial association between the two variables was spurious.
3 It can reveal some association between the two original variables, although no association was initially observed. In this case, the third variable reveals a suppressed association between the first two variables: a suppressor effect.
4 It can indicate no change in the initial association.7
These cases are explained with examples based on a sample of 1,000 participants. Although these examples are contrived to illustrate specific cases, such sample sizes are not uncommon in commercial marketing research.
Figure 20.7
The introduction of a third variable in cross-tabulation
No associationbetween the twooriginal variables
Re�ned associationbetween the twooriginal variables
No change inthe original
pattern
Some associationbetween the two
variables
Originaltwo variables
Some associationbetween the twooriginal variables
No associationbetween the two
variables
Introduce athird variable
Introduce athird variable

573Chapter 20 Frequency distribution, cross-tabulation and hypothesis testing
1 Refine an initial relationship. An examination of the relationship between the purchase of luxury branded clothing and marital status resulted in the data reported in Table 20.6. The participants were classified into either high or low categories based on their purchase of lux-ury branded clothing. Marital status was also measured in terms of two categories: currently married or unmarried. As can be seen from Table 20.6, 52% of unmarried participants fell in the high-purchase category, as opposed to 31% of the married participants. Before con-cluding that unmarried participants purchase more luxury branded clothing than those who are married, a third variable, the buyer’s gen-der, was introduced into the analysis.
The buyer’s gender was selected as the third variable based on past research. The relation-ship between purchase of luxury branded clothing and marital status was re-examined in light of the third variable, as shown in Table 20.7. In the case of females, 60% of the unmarried participants fall in the high-purchase category compared with 25% of those who are married. On the other hand, the percentages are much closer for males, with 40% of the unmarried participants and 35% of the married participants falling in the
Table 20.6
Marital status
Purchase of luxury branded clothing Married Unmarried
High 31% 52%Low 69% 48%Column 100% 100%Number of participants 700 300
Purchase of luxury branded clothing by marital status
Table 20.7
Gender
Male marital status Female marital status
Purchase of luxury branded clothing Married Unmarried Married Unmarried
High 35% 40% 25% 60%Low 65% 60% 75% 40%Column 100% 100% 100% 100%Number of participants 400 120 300 180
Purchase of luxury branded clothing by marital status and gender

574 Marketing Research
3 Reveal suppressed association. A researcher suspected that desire to travel abroad may be influenced by age. A cross-tabulation of the two variables produced the results in Table 20.10, indicating no association. When gender was introduced as the third varia-ble, Table 20.11 was obtained. Among men, 60% of those under 45 indicated a desire to travel abroad compared with 40% of those 45 or older. The pattern was reversed for women, where 35% of those under 45 indicated a desire to travel abroad as opposed to 65% of those 45 or older.
Table 20.8
Education
Own expensive car Degree No degree
Yes 32% 21%No 68% 79%Column 100% 100%Number of participants 250 750
Ownership of expensive cars by education level
Table 20.9
Income
Low-income education High-income education
Own expensive car Degree No degree Degree No degree
Yes 20% 20% 40% 40%No 80% 80% 60% 60%Column totals 100% 100% 100% 100%Number of participants 100 700 150 50
Ownership of expensive cars by education and income levels
high-purchase category. Hence, the introduction of gender (third variable) has refined the relationship between marital status and purchase of luxury branded clothing (original variables). Unmarried participants are more likely to fall into the high-purchase category than married ones, and this effect is much more pronounced for females than for males.
2 Initial relationship was spurious. A researcher working for an advertising agency pro-moting a car brand costing more than €80,000 was attempting to explain the ownership of expensive cars (see Table 20.8). The table shows that 32% of those with university degrees own an expensive (more than €80,000) car, compared with 21% of those with-out university degrees. The researcher was tempted to conclude that education influ-enced ownership of expensive cars. Realising that income may also be a factor, the researcher decided to re-examine the relationship between education and ownership of expensive cars in the light of income level. This resulted in Table 20.9. Note that the percentages of those with and without university degrees who own expensive cars are the same for each income group. When the data for the high-income and low-income groups are examined separately, the association between education and ownership of expensive cars disappears, indicating that the initial relationship observed between these two variables was spurious.

575Chapter 20 Frequency distribution, cross-tabulation and hypothesis testing
Since the association between desire to travel abroad and age runs in the opposite direction for males and females, the relationship between these two variables is masked when the data are aggregated across gender, as in Table 20.10. But when the effect of gender is controlled, as in Table 20.11, the suppressed association between preference and age is revealed for the separate categories of males and females.
Table 20.11
Gender
Male age Female age
Desire to travel abroad Under 45 45 or older Under 45 45 or older
Yes 60% 40% 35% 65%No 40% 60% 65% 35%Column totals 100% 100% 100% 100%Number of participants 300 300 200 200
Desire to travel abroad by age and gender
Table 20.12
Eat frequently in fast-food restaurants
Family size
Small Large
Yes 65% 65%No 35% 35%Column totals 100% 100%Number of participants 500 500
Eating frequently in fast-food restaurants by family size
Table 20.10
Desire to travel abroad
Age
Under 45 45 or older
Yes 50% 50%No 50% 50%Column totals 100% 100%Number of participants 500 500
Desire to travel abroad by age
4 No change in initial relationship. In some cases, the introduction of the third variable does not change the initial relationship observed, regardless of whether the original vari-ables were associated. This suggests that the third variable does not influence the rela-tionship between the first two. Consider the cross-tabulation of family size and the tendency to eat in fast-food restaurants frequently, as shown in Table 20.12. The partici-pants’ families were classified into small- and large-size categories based on a median

576 Marketing Research
split of the distribution, with 500 participants in each category. No association is observed. The participants were further classified into high- or low-income groups based on a median split. When income was introduced as a third variable in the analysis, Table 20.13 was obtained. Again, no association was observed.
General comments on cross-tabulation
More than three variables can be cross-tabulated; the interpretation is quite complex. Also, because the number of cells increases multiplicatively, maintaining an adequate number of participants or cases in each cell can be problematic. As a general rule, there should be at least five expected observations in each cell for the computed statistics to be reliable. Thus, cross-tabulation is an inefficient way of examining relationships when there are more than a few variables. Note that cross-tabulation examines association between variables, not causation. To examine causation, the causal research design framework should be adopted (see Chapter 11).
Table 20.13
Eat frequently in fast-food restaurants
Income
Low-income family size High-income family size
Small Large Small Large
Yes 65% 65% 65% 65%No 35% 35% 35% 35%Column total 100% 100% 100% 100%Number of participants 250 250 250 250
Eating frequently in fast-food restaurants by family size and income
Statistics associated with cross-tabulation
We now discuss the statistics commonly used for assessing the statistical significance and strength of association of cross-tabulated variables. The statistical significance of the observed association is commonly measured by the chi-square statistic. The strength of asso-ciation, or degree of association, is important from a practical or substantive perspective. Generally, the strength of association is of interest only if the association is statistically sig-nificant. The strength of the association can be measured by the phi correlation coefficient, the contingency coefficient, Cramer’s V and the lambda coefficient. These statistics are described in detail.
Chi-square
The chisquare statistic (x2) is used to test the statistical significance of the observed asso-ciation in a cross-tabulation. It assists us in determining whether a systematic association exists between the two variables. The null hypothesis, H0, is that there is no association between the variables. The test is conducted by computing the cell frequencies that would be expected if no association were present between the variables, given the existing row and column totals. These expected cell frequencies, denoted fe, are then compared with the actual observed frequencies, fo, found in the cross-tabulation to calculate the chi-square statistic. The greater the discrepancies between the expected and observed frequencies, the larger the value of the statistic. Assume that a cross-tabulation has r rows and c columns and a random
Chi-square statisticThe statistic used to test the statistical significance of the observed association in a cross-tabulation. It assists us in determining whether a systematic association exists between the two variables.

577Chapter 20 Frequency distribution, cross-tabulation and hypothesis testing
sample of n observations. Then the expected frequency for each cell can be calculated by using a simple formula:
=fe
n nnr c
where nr = total number in the row nc = total number in the column n = total sample size.
For the data in Table 20.3, the expected frequencies for the cells, going from left to right and from top to bottom, are:
15 × 15/30 = 7.50, 15 15/30 = 7.50, 15 × 15/30 = 7.50, 15 × 15/30 = 7.50
Then the value of x2 is calculated as follows:
For the data in Table 20.2, the value of x2 is calculated as:
x2 = (5 – 7.5)2/7.5 + (10 – 7.5)2/7.5 + (10 – 7.5)2/7.5 + (5 – 7.5)2/7.5 = 0.833 + 0.833 + 0.833 + 0.833 = 3.333
To determine whether a systematic association exists, the probability of obtaining a value of chi-square as large as or larger than the one calculated from the cross-tabulation is estimated. An important characteristic of the chi-square statistic is the number of degrees of freedom (df) associated with it. In general, the number of degrees of freedom is equal to the number of observations less the number of constraints needed to calculate a statistical term. In the case of a chi-square statistic associated with a cross-tabulation, the number of degrees of freedom is equal to the product of number of rows (r) less one and the number of columns (c) less one. That is, df = (r − 1) × (c − 1).8 The null hypothesis (H0) of no association between the two variables will be rejected only when the calculated value of the test statistic is greater than the critical value of the chi-square distribution with the appropriate degrees of freedom, as shown in Figure 20.8.
The chisquare distribution is a skewed distribution whose shape depends solely on the number of degrees of freedom.9 As the number of degrees of freedom increases, the chi-square distribution becomes more symmetrical. To illustrate: for 1 degree of freedom, the value for an upper tail area of 0.05 is 3.841. This indicates that for 1 degree of free-dom the probability of exceeding a chi-square value of 3.841 is 0.05. In other words, at the 0.05 level of significance with 1 degree of freedom, the critical value of the chi-square statistic is 3.841.
2
2
=−( )
xall cells
f
f f
e
o e©
Chi-square distributionA skewed distribution whose shape depends solely on the number of degrees of freedom. As the number of degrees of freedom increases, the chi-square distribution becomes more symmetrical.
Figure 20.8
Chi-square test of association
Criticalvalue
Do notreject H0
Reject H0
χ2

578 Marketing Research
For the cross-tabulation given in Table 20.3, there are (2 − 1) × (2 − 1) = 1 degree of free-dom. The calculated chi-square statistic had a value of 3.333. Because this is less than the critical value of 3.841, the null hypothesis of no association cannot be rejected, indicating that the association is not statistically significant at the 0.05 level. Note that this lack of sig-nificance is mainly due to the small sample size (30). If, instead, the sample size were 300 and each data entry of Table 20.3 were multiplied by 10, it can be seen that the value of the chi-square statistic would be multiplied by 10 and would be 33.33, which is significant at the 0.05 level.
The chi-square statistic can also be used in goodness-of-fit tests to determine whether certain models fit the observed data. These tests are conducted by calculating the signifi-cance of sample deviations from assumed theoretical (expected) distributions and can be performed on cross-tabulations as well as on frequencies (one-way tabulations). The calcula-tion of the chi-square statistic and the determination of its significance are the same, as illus-trated above.
The chi-square statistic should be estimated only on counts of data. When the data are in percentage form, they should first be converted to absolute counts or numbers. In addition, an underlying assumption of the chi-square test is that the observations are drawn indepen-dently. As a general rule, chi-square analysis should not be conducted when the expected or theoretical frequency in any of the cells is less than five. If the number of observations in any cell is less than 10, or if the table has two rows and two columns (a 2 × 2 table), a cor-rection factor should be applied.10 With the correction factor, the value is 2.133, which is not significant at the 0.05 level. In the case of a 2 × 2 table, the chi-square is related to the phi coefficient.
Phi coefficient
The phi coefficient (f) is used as a measure of the strength of association in the special case of a table with two rows and two columns (a 2 × 2 table). The phi coefficient is proportional to the square root of the chi-square statistic. For a sample of size n, this statistic is calculated as:
2
nx
f=
It takes the value of 0 when there is no association, which would be indicated by a chi-square value of 0 as well. When the variables are perfectly associated, phi assumes the value of 1 and all the observations fall just on the main or minor diagonal. (In some computer pro-grams, phi assumes a value of −1 rather than +1 when there is perfect negative association.) In our case, because the association was not significant at the 0.05 level, we would not nor-mally compute the phi value. However, for the purpose of illustration, we show how the values of phi and other measures of the strength of association would be computed. The value of phi is:
=3.333 / 30 0.333f=
Thus, the association is not very strong. In the more general case involving a table of any size, the strength of association can be assessed by using the contingency coefficient.
Contingency coefficient
Although the phi coefficient is specific to a 2 × 2 table, the contingency coefficient (C) can be used to assess the strength of association in a table of any size. This index is also related to chi-square, as follows:
=+
2
Cn
x2x
Phi coefficient (f)A measure of the strength of association in the special case of a table with two rows and two columns (a 2 × 2 table).
Contingency coefficientA measure of the strength of association in a table of any size.

579Chapter 20 Frequency distribution, cross-tabulation and hypothesis testing
The contingency coefficient varies between 0 and 1. The value of 0 occurs in the case of no association (i.e. the variables are statistically independent), but the maximum value of 1 is never achieved. Rather, the maximum value of the contingency coefficient depends on the size of the table (number of rows and number of columns). For this reason, it should be used only to compare tables of the same size. The value of the contingency coefficient for Table 20.3 is:
3.333 / (3.333+ 30)=0.316=C
This value of C indicates that the association is not very strong. Another statistic that can be calculated for any table is Cramer’s V.
Cramer’s V
Cramer’s V is a modified version of the phi correlation coefficient, f, and is used in tables larger than 2 × 2. When phi is calculated for a table larger than 2 × 2, it has no upper limit. Cramer’s V is obtained by adjusting phi for either the number of rows or the number of columns in the table, based on which of the two is smaller. The adjustment is such that V will range from 0 to 1. A large value of V merely indicates a high degree of association. It does not indicate how the variables are associated. For a table with r rows and c columns, the relationship between Cramer’s V and the phi correlation coefficient is expressed as:
=2
min(r−1), (c−1)
fV
or
=min(r−1), (c−1)
x nV
2 /
The value of Cramer’s V for Table 20.3 is:
(3.333 / 30)/1 = 0.333V=
Thus, the association is not very strong. As can be seen, in this case V = f. This is always the case for a 2 × 2 table. Another statistic commonly estimated is the lambda coefficient.
Lambda coefficient
The lambda coefficient assumes that the variables are measured on a nominal scale. Asymmetric lambda measures the percentage improvement in predicting the value of the dependent variable, given the value of the independent variable. The lambda coeffi-cient also varies between 0 and 1. A value of 0 means no improvement in prediction. A value of 1 indicates that the prediction can be made without error. This happens when each independent variable category is associated with a single category of the dependent variable.
Asymmetric lambda is computed for each of the variables (treating it as the dependent variable). In general, the two asymmetric lambdas are likely to be different, since the mar-ginal distributions are not usually the same. A symmetric lambda is also computed, which is a kind of average of the two asymmetric values. The symmetric lambda does not make an assumption about which variable is dependent. It measures the overall improvement when prediction is done in both directions.11 The value of asymmetric lambda in Table 20.3, with usage as the dependent variable, is 0.333. This indicates that knowledge of gender increases our predictive ability by the proportion of 0.333, i.e. a 33% improvement. The symmetric lambda is also 0.333.
Cramer’s VA measure of the strength of association used in tables larger than 2 × 2.
Asymmetric lambdaA measure of the percentage improvement in predicting the value of the dependent variable given the value of the independent variable in contingency table analysis. Lambda also varies between 0 and 1.
Symmetric lambdaThe symmetric lambda does not make an assumption about which variable is dependent. It measures the overall improvement when prediction is done in both directions.
580 Marketing Research
Other statistics
Note that in the calculation of the chi-square statistic, the variables are treated as being meas-ured only on a nominal scale. Other statistics, such as tau b, tau c and gamma, are available to measure association between two ordinal-level variables. All these statistics use informa-tion about the ordering of categories of variables by considering every possible pair of cases in the table. Each pair is examined to determine whether its relative ordering on the first vari-able is the same as its relative ordering on the second variable (concordant), the ordering is reversed (discordant), or the pair is tied. The manner in which the ties are treated is the basic difference between these statistics. Both tau b and tau c adjust for ties. Tau b is the most appropriate with square tables, in which the number of rows and the number of columns are equal. Its value varies between +1 and −1. Thus the direction (positive or negative) as well as the strength (how close the value is to 1) of the relationship can be determined. For a rectan-gular table in which the number of rows is different from the number of columns, tau c should be used. Gamma does not make an adjustment for either ties or table size. Gamma also varies between +1 and −1 and generally has a higher numerical value than tau b or tau c. For the data in Table 20.3, as gender is a nominal variable, it is not appropriate to calculate ordinal statis-tics. All these statistics can be estimated by using the appropriate analysis software that incor-porates cross-tabulation. (Other statistics for measuring the strength of association, namely product moment correlation and non-metric correlation, are discussed in Chapter 22.)
Cross-tabulation in practice
While conducting cross-tabulation analysis in practice, it is useful to proceed through the following steps:
1 Test the null hypothesis that there is no association between the variables using the chi-square statistic. If you fail to reject the null hypothesis, then there is no relationship.
2 If H0 is rejected, then determine the strength of the association using an appropriate statis-tic (phi coefficient, contingency coefficient, Cramer’s V, lambda coefficient, or other sta-tistics).
3 If H0 is rejected, interpret the pattern of the relationship by computing the percentages in the direction of the independent variable, across the dependent variable.
4 If the variables are treated as ordinal rather than nominal, use tau b, tau c or gamma as the test statistic. If H0 is rejected, then determine the strength of the association using the magnitude, and the direction of the relationship using the sign of the test statistic.
5 Translate the results of hypothesis testing, strength of association and pattern of associa-tion into managerial implications and recommendations.
tau bA test statistic that measures the association between two ordinal-level variables. It makes an adjustment for ties and is the most appropriate when the table of variables is square.
tau cA test statistic that measures the association between two ordinal-level variables. It makes an adjustment for ties and is most appropriate when the table of variables is not square but a rectangle.
GammaA test statistic that measures the association between two ordinal-level variables. It does not make an adjustment for ties.
Hypothesis testing related to differences
The previous section considered hypothesis testing related to associations. We now focus on hypothesis testing related to differences. A classification of hypothesis testing procedures for examining differences is presented in Figure 20.9. Note that this figure is consistent with the classification of univariate techniques presented in Figure 19.4. The major difference is that Figure 19.4 also accommodates more than two samples and thus deals with techniques such as one-way ANOVA and K–W ANOVA, whereas Figure 20.9 is limited to no more than two samples. Also, one-sample techniques, such as frequencies, which do not involve statistical testing, are not covered in Figure 20.9.

581Chapter 20 Frequency distribution, cross-tabulation and hypothesis testing
Hypothesis testing procedures can be broadly classified as parametric or non-parametric, based on the measurement scale of the variables involved. Parametric tests assume that the variables of interest are measured on at least an interval scale. Nonparametric tests assume that the variables are measured on a nominal or ordinal scale. These tests can be further clas-sified based on whether one or two or more samples are involved. As explained in Chapter 19, the number of samples is determined by how the data are treated for the purpose of analysis, not based on how the data were collected. The samples are independent if they are drawn randomly from different populations. For the purpose of analysis, data pertaining to different groups of participants, e.g. males and females, are generally treated as independent samples. On the other hand, the samples are paired when the data for the two samples relate to the same group of participants.
The most popular parametric test is the t test, conducted for examining hypotheses about means. The t test could be conducted on the mean of one sample or two samples of observations. In the case of two samples, the samples could be independent or paired. Non-parametric tests based on observations drawn from one sample include the chi-square test, the Kolmogorov–Smirnov test, the runs test and the binomial test. In the case of two independent samples, the chi-square test, the Mann–Whitney U test, the median test and the Kolmogorov–Smirnov two-sample test are used for examining hypotheses about loca-tion. These tests are non-parametric counterparts of the two-group t test. For paired sam-ples, non-parametric tests include the Wilcoxon matched-pairs signed-ranks test and the sign test. These tests are the counterparts of the paired t test. In addition, the McNemar and chi-square tests can also be used. Parametric as well as non-parametric tests are also avail-able for evaluating hypotheses relating to more than two samples. These tests are consid-ered in later chapters.
Parametric testsHypothesis testing procedures that assume that the variables of interest are measured on at least an interval scale.
Non-parametric testsHypothesis testing procedures that assume that the variables are measured on a nominal or ordinal scale.
Figure 20.9
Hypothesis testing procedures
Parametric tests(metric data)
Non-parametric tests(non-metric data)
Hypothesis tests
One sample Twosamples
One sample Twosamples
Independentsamples
Pairedsamples
Independentsamples
Pairedsamples
• Chi-square• K–S• Runs• Binomial
• t test• z test
• Chi-square• Mann–Whitney• Median• K–S
• Sign• Wilcoxon• McNemar• Chi-square
• Two-group t test• z test
• Paired t test

582 Marketing Research
Parametric tests
Parametric tests provide inferences for making statements about the means of parent popula-tions. A t test is commonly used for this purpose. This test is based on Student’s t statistic. The t statistic assumes that the variable is normally distributed and the mean is known (or assumed to be known), and the population variance is estimated from the sample. Assume that the random variable, X, is normally distributed, with mean m and unknown population variance s2, which is estimated by the sample variance, s2. Recall that the standard deviation of the sample mean, X , is estimated as:
= /S S nX
Thent = (X – m)/ X
S
is t distributed with n − 1 degrees of freedom.The t distribution is similar to the normal distribution in appearance. Both distributions
are bell shaped and symmetric. Compared with the normal distribution, however, the t distri-bution has more area in the tails and less in the centre. This is because the population vari-ance, s2, is unknown and is estimated by the sample variance, s2. Given the uncertainty in the value of s2, the observed values of t are more variable than those of z. Thus, we must go out a larger number of standard deviations from zero to encompass a certain percentage of values from the t distribution than is the case with the normal distribution. Yet, as the number of degrees of freedom increases, the t distribution approaches the normal distribution. In fact, for large samples of 120 or more, the t distribution and the normal distribution are virtually indistinguishable. Although normality is assumed, the t test is quite robust to departures from normality.
The procedure for hypothesis testing, for the special case when the t statistic is used, is as follows:
1 Formulate the null (H0) and the alternative (H1) hypotheses.
2 Select the appropriate formula for the t statistic.
3 Select a significance level, a, for testing H0. Typically, the 0.05 level is selected.12
4 Take one or two samples and compute the mean and standard deviation for each sample.
5 Calculate the t statistic assuming that H0 is true.
6 Calculate the degrees of freedom and estimate the probability of getting a more extreme value of the statistic. (Alternatively, calculate the critical value of the t statistic.)
7 If the probability computed in step 6 is smaller than the significance level selected in step 3, reject H0. If the probability is larger, do not reject H0. (Alternatively, if the abso-lute value of the calculated t statistic in step 5 is larger than the absolute critical value determined in step 6, reject H0. If the absolute calculated value is smaller than the abso-lute critical value, do not reject H0.) Failure to reject H0 does not necessarily imply that H0 is true. It only means that the true state is not significantly different from that assumed by H0.13
8 Express the conclusion reached by the t test in terms of the marketing research problem.
We illustrate the general procedure for conducting t tests in the following sections, begin-ning with the one-sample case.
t testA univariate hypothesis test using the t distribution, which is used when the standard deviation is unknown and the sample size is small.
t statisticA statistic that assumes that the variable has a symmetric bell-shaped distribution, that the mean is known (or assumed to be known) and that the population variance is estimated from the sample.
t distributionA symmetrical, bell-shaped distribution that is useful for sample testing (n < 30). It is similar to the normal distribution in appearance.

583Chapter 20 Frequency distribution, cross-tabulation and hypothesis testing
One sample
In marketing research, the researcher is often interested in making statements about a single variable against a known or given standard. Examples of such statements are that the market share for a new product will exceed 15%, that at least 65% of customers will like a new pack-age design, or that 80% of retailers will prefer a new pricing policy. These statements can be translated to null hypotheses that can be tested using a one-sample test, such as the t test or the z test. In the case of a t test for a single mean, the researcher is interested in testing whether the population mean conforms to a given hypothesis (H0). For the data in Table 20.2, suppose we wanted to test the hypothesis that the mean familiarity rating exceeds 4.0 – the neutral value on a seven-point scale. A significance level of a = 0.05 is selected. The hypoth-esis may be formulated as:
0
1
H : m≤4.0
H : m>4.0
=1.579 / 29= 1.579 / 5.385=0.293
t=(4.724−4.0) / 0.293=0.724 / 0.293=2.471
= /S S nX
SX
XSt =(X – m) /
The degrees of freedom for the t statistic to test the hypothesis about one mean are n − 1. In this case, n − 1 = 29 − 1, or 28. From Table 4 in the Appendix, the probability of get-ting a more extreme value than 2.471 is less than 0.05. (Alternatively, the critical t value for 28 degrees of freedom and a significance level of 0.05 is 1.7011, which is less than the calculated value.) Hence, the null hypothesis is rejected. The familiarity level does not exceed 4.0.
Note that if the population standard deviation was assumed to be known as 1.5, rather than estimated from the sample, a z test would be appropriate. In this case, the value of the z statistic would be:
=X−m
Xs
Z
where
=1.5/ 29=1.5/5.385=0.279X
s
and
= (4.724 – 4.0)/0.279 = 0.724/0.279 = 2.595Z
The probability of getting a more extreme value of z than 2.595 is less than 0.05. (Alterna-tively, the critical z value for a one-tailed test and a significance level of 0.05 is 1.645, which is less than the calculated value.) Therefore, the null hypothesis is rejected, reaching the same conclusion arrived at earlier by the t test.
The procedure for testing a null hypothesis with respect to a proportion was illustrated earlier in this chapter when we introduced hypothesis testing.
Two independent samples
Several hypotheses in marketing relate to parameters from two different populations. For example, the users and non-users of a brand differ in terms of their perceptions of the brand, high-income consumers spend more on leisure activities than low-income consumers and the proportion of brand-loyal users in segment I is more than the proportion in segment II.
z testA univariate hypothesis test using the standard normal distribution.

584 Marketing Research
Samples drawn randomly from different populations are termed independent samples. As in the case for one sample, the hypotheses could relate to means or proportions:
1 Means. In the case of means for two independent samples, the hypotheses take the fol-lowing form:
::
H0
H1
m1 = m2
m1 ≠ m2
The two populations are sampled and the means and variances are computed based on samples of sizes n1 and n2. If both populations are found to have the same variance, a pooled variance estimate is computed from the two sample variances, as follows:
1( )2
2
2
1
1 2
=+ −
=−
n
s 2s2s sn 22X X
i=11i i1
2
−( ) 2 1
21 2( ) + −( )+ −
n
n
n n1 2 2+ −n n
X Xi=1
© ©
The standard deviation of the test statistic can be estimated as:
2
1 2
1 1−
= +s sn nX X
The appropriate value of t can be calculated as:
=− −
−
1 2
1 2
1 2m−mt s
X
X X
X
The degrees of freedom in this case are (n1 + n2 − 2).If the two populations have unequal variances, an exact t cannot be computed for the
difference in sample means. Instead, an approximation to t is computed. The number of degrees of freedom in this case is usually not an integer, but a reasonably accurate prob-ability can be obtained by rounding to the nearest integer.14
An F test of sample variance may be performed if it is not known whether the two populations have equal variance. In this case the hypotheses are:
12
22
12
22
::
H0
H1
s = ss ≠ s
The F statistic is computed from the sample variances, as follows:
1 21
2
1 1− − =,F n n2s2s
where n1= size of sample 1
n2= size of sample 2
n1
– 1 = degrees of freedom for sample 1n
2– 1 = degrees of freedom for sample 2
= sample variance for sample 1s12
2s = sample variance for sample 2.2
As can be seen, the critical value of the F distribution depends on two sets of degrees of freedom: those in the numerator and those in the denominator. If the probability of F is greater than the significance level, a, then H0 is not rejected and t based on the pooled variance estimate can be used. On the other hand, if the probability of F is less than or equal to a, H0 is rejected and t based on a separate variance estimate is used.
Using the data in Table 20.1, suppose we wanted to determine whether internet usage was different for males as compared with females. A two-independent-samples t test can be
Independent samplesThe samples are independent if they are drawn randomly from different populations.
F testA statistical test of the equality of the variances of two populations.
F statisticThe ratio of two sample variances.
F distributionA frequency distribution that depends upon two sets of degrees of freedom: the degrees of freedom in the numerator and the degrees of freedom in the denominator.

585Chapter 20 Frequency distribution, cross-tabulation and hypothesis testing
conducted. The results of this test are presented in Table 20.14. Note that the F test of sample variances has a probability that is less than 0.05. Accordingly, H0 is rejected and the t test based on the ‘equal variances not assumed’ should be used. The t value is –4.492 and, with 18.014 degrees of freedom, this gives a probability of 0.000, which is less than the signifi-cance level of 0.05. Therefore, the null hypothesis of equal means is rejected. Because the mean usage for males (gender = 1) is 9.333 and that for females (gender = 2) is 3.867, males use the internet to a significantly greater extent than females. We also show the t test assuming equal variances because most software packages automatically conduct the t test both ways.
Table 20.14
Summary statistics
Number of cases Mean Standard error mean
Male 15 9.333 1.137Female 15 3.867 0.435
F test for equality of variances
F value Two-tail probability
15.507 0.000
t test
Equal variances assumed Equal variances not assumed
t value Degrees of freedom
Two-tail probability
t value Degrees of freedom
Two-tail probability
−4.492 28 0.000 −4.492 18.014 0.000
Two-independent-samples t test
For another application of the t test, consider the following example.
Real research Shops seek to suit elderly to a ‘t’15
A study based on a sample of 789 partici-pants who were 65 or older attempted to determine the effect of a lack of mobility on shop patronage. A major research question related to the differences in the physical requirements of dependent and self-reliant elderly persons. That is, did the two groups require different things to get to the shop or after they arrived at the shop? A more detailed analysis of the physical requirements conducted by the t tests of two independent samples (shown in the table) indicated that dependent elderly persons were more likely to look for shops that offer home delivery and phone orders and for shops to which they have accessible transportation. They were also more likely to look for a variety of shops located close together.

586 Marketing Research
In this example, we tested the difference between means. A similar test is available for testing the difference between proportions for two independent samples.
2 Proportions. A case involving proportions for two independent samples is also illus-trated using the data from Table 20.1, which gives the number of males and females who shop online. Is the proportion of participants who shop online the same for males and females? The null and alternative hypotheses are:
::
H0
H1
p1 = p2p1 ≠ p2
A z test is used, as in testing the proportion for one sample. In this case, however, the test statistic is given by:
= 1 2
1 2
–
–Z
PPP Ps
In the test statistic, the numerator is the difference between the proportions in the two samples, P1 and P2. The denominator is the standard error of the difference in the two proportions and is given by:
1 21 2
11 1
– ( – )= +s p pn nP P
where
=++
1 1 2 2
1 2
nn
nnp
PP
A significance level of a = 0.05 is selected. Given the data in Table 20.1, the test statistic can be calculated as:
1 2–
1 2=–S
P P
P P
p
Z
=0.733 – 0.400=0.333
=(11/15) – (6 /15)
=(15×0.733+15×0.4)/(15+15)=0.567
=0.333/0.181=1.84
0.567×0.433(1/15+1/15=0.181
Given a two-tail test, the area to the right of the critical value is a/2, or 0.025. Hence, the critical value of the test statistic is 1.96. Because the calculated value is less than the critical value, the null hypothesis cannot be rejected. Thus, the proportion of users (0.733) for males and (0.400) for females is not significantly different for the two samples. Note that although the difference is substantial, it is not statistically significant due to the small sample sizes (15 in each group).
Differences in physical requirements between dependent and self-reliant elderly
Mean*
Physical requirement items Self-reliant Dependent t test probability
Delivery to home 1.787 2.000 0.023Phone-in order 2.030 2.335 0.003Transportation to store 2.188 3.098 0.000Convenient parking 4.001 4.095 0.305Location close to home 3.177 3.325 0.137Variety of shops close together 3.456 3.681 0.023
*Measured on a five-point scale from not important (1) to very important (5).

587Chapter 20 Frequency distribution, cross-tabulation and hypothesis testing
Paired samples
In many marketing research applications, the observations for the two groups are not selected from independent samples. Rather, the observations relate to paired samples, in that the two sets of observations relate to the same participants. A sample of participants may rate compet-ing brands, may indicate the relative importance of two attributes of a product, or may evalu-ate a brand at two different times. The differences in these cases are examined by a paired samples t test. To compute t for paired samples, the paired difference variable (denoted by D), is formed and its mean and variance calculated. Then the t statistic is computed. The degrees of freedom are n − 1, where n is the number of pairs. The relevant formulae are:
::
H0
H1
mD = 0mD ≠ 0
=t D
Dsn–1
n
D – m
where
=
= −( )=
=1
2
/
D
D
D D
D
Ds
s s
D
n
n
n
n
ii
=1ii
©
©
In the internet usage example (Table 20.1), a paired t test could be used to determine whether the participants differed in their attitude towards the internet and attitude towards technol-ogy. The resulting output is shown in Table 20.15. The mean attitude towards the internet is 5.167 and that towards technology is 4.10. The mean difference between the variables is 1.067, with a standard deviation of 0.828 and a standard error of 0.1511. This results in a t value of (1.067/0.1511) = 7.06, with 30 − 1 = 29 degrees of freedom and a probability of less than 0.001. Therefore the participants have a more favourable attitude towards the internet as compared with technology in general. An implication, if this were a large and representative sample, would be that internet service providers should not hesitate to market their services to consumers who do not have a very positive attitude towards technology and do not con-sider themselves to be technologically savvy. Another application is provided in the context of determining the relative effectiveness of 15-second versus 30-second TV commercials.
Paired samplesThe samples are paired when the data for the two samples relate to the same group of participants.
Paired samples t testA test for differences in the means of paired samples.
Table 20.15
Variable Number of cases Mean Standard deviation Standard error
Internet attitude 30 5.167 1.234 0.225Technology attitude 30 4.100 1.398 0.255
Difference = Internet – Technology
Difference mean
Standard deviation
Standard error
Correlation Two-tail probability
t value Degrees of freedom
Two-tail probability
1.067 0.828 0.1511 0.809 0.000 7.059 29 0.000
Paired samples t test

588 Marketing Research
The difference in proportions for paired samples can be tested by using the McNemar test or the chi-square test, as explained in the following section on non-parametric tests.
Real research Seconds count16
A survey of 83 media directors of the largest Canadian advertising agencies was con-ducted to determine the relative effectiveness of 15-second versus 30-second commer-cial advertisements. By use of a five-point rating scale (1 being excellent and 5 being poor), 15- and 30- second commercials were rated by each participant for brand aware-ness, main idea recall, persuasion and ability to tell an emotional story. The table indi-cates that 30-second commercials were rated more favourably on all the dimensions. Paired t tests indicated that these differences were significant, and the 15-second com-mercials were evaluated as less effective.
Mean rating 15- and 30-second commercials on four communication variables
Brand awareness Main idea recall Persuasion Ability to tell an emotional story
15 30 15 30 15 30 15 302.5 1.9 2.7 2.0 3.7 2.1 4.3 1.9
Non-parametric tests
Non-parametric tests are used when the variables are non-metric. Like parametric tests, non-parametric tests are available for testing variables from one sample, two independent sam-ples or two related samples.
One sample
Sometimes the researcher wants to test whether the observations for a particular variable could reasonably have come from a particular distribution, such as the normal, uniform or Poisson distribution. Knowledge of the distribution is necessary for finding probabilities cor-responding to known values of the variable, or variable values corresponding to known prob-abilities (see the Appendix at the end of Chapter 15). The Kolmogorov–Smirnov (K–S) onesample test is one such goodness-of-fit test. The K–S test compares the cumulative distribution function for a variable with a specified distribution. Ai denotes the cumulative relative frequency for each category of the theoretical (assumed) distribution, and Oi denotes the comparable value of the sample frequency. The K–S test is based on the maximum value of the absolute difference between Ai and Oi. The test statistic is:
= max|i – O
i|K A
The decision to reject the null hypothesis is based on the value of K. The larger K is, the more confidence we have that H0 is false. Note that this is a one-tailed test, since the value of K is always positive, and we reject H0 for large values of K. For a = 0.05, the critical value of K for large samples (over 35) is given by 1.36/∙n.17 Alternatively, K can be transformed into a normally distributed z statistic and its associated probability determined.
In the context of the internet usage example, suppose we wanted to test whether the distribution of internet usage was normal. A K–S one-sample test is conducted, yielding
Kolmogorov–Smirnov (K–S) one-sample testA one-sample non-parametric goodness-of-fit test that compares the cumulative distribution function for a variable with a specified distribution.

589Chapter 20 Frequency distribution, cross-tabulation and hypothesis testing
the data shown in Table 20.16. The largest absolute difference between the observed and normal distribution was K = 0.222. Although our sample size is only 30 (less than 35), we can use the approximate formula and the critical value of K is 1.36/∙30 = 0.248. Because the calculated value of K is smaller than the critical value, the null hypothesis cannot be rejected. Alternatively, Table 20.16 indicates that the probability of observing a K value of 0.222, as determined by the normalised z statistics, is 0.103. Because this is more than the significance level of 0.05, the null hypothesis cannot be rejected, leading to the same con-clusion. Hence the distribution of internet usage does not deviate significantly from the normal distribution. The implication is that we are safe in using statistical tests (e.g., the z test) and procedures that assume the normality of this variable.
As mentioned earlier, the chi-square test can also be performed on a single variable from one sample. In this context, the chi-square serves as a goodness-of-fit test. It tests whether a significant difference exists between the observed number of cases in each category and the expected number. Other one-sample non-parametric tests include the runs test and the binomial test. The runs test is a test of randomness for dichotomous variables. This test is con-ducted by determining whether the order or sequence in which observations are obtained is random. The binomial test is also a goodness-of-fit test for dichotomous variables. It tests the goodness of fit of the observed number of observations in each category to the number expected under a specified binomial distribution. For more information on these tests, refer to the standard statistical literature.18
Two independent samples
When the difference in the location of two populations is to be compared based on observa-tions from two independent samples and the variable is measured on an ordinal scale, the Mann–Whitney U test can be used.19 This test corresponds to the two-independent-samples t test, for interval-scale variables, when the variances of the two populations are assumed equal.
In the Mann–Whitney U test, the two samples are combined and the cases are ranked in order of increasing size. The test statistic, U, is computed as the number of times a score from sample or group 1 precedes a score from group 2. If the samples are from the same population, the distribution of scores from the two groups in the rank list should be random. An extreme value of U would indicate a non-random pattern, pointing to the inequality of the two groups. For samples of less than 30, the exact significance level for U is computed. For larger samples, U is transformed into a normally distributed z statistic. This z can be cor-rected for ties within ranks.
We examine again the difference in the internet usage of males and females. This time, though, the Mann–Whitney test is used. The results are given in Table 20.17. Again, a
Runs testA test of randomness for a dichotomous variable.
Binominal testA goodness-of-fit statistical test for dichotomous variables. It tests the goodness of fit of the observed number of observations in each category to the number expected under a specified binominal distribution.
Mann–Whitney U testA statistical test for a variable measured on an ordinal scale, comparing the differences in the location of two populations based on observations from two independent samples.
Table 20.16
Test distribution, normal
Mean 6.600Standard deviation 4.296Cases 30
Most extreme differences
Absolute Positive Negative K–S z Two-tailed p
0.222 0.222 −0.142 1.217 0.103
K–S one-sample test for normality for internet usage

590 Marketing Research
Table 20.17
Gender Mean rank Cases
Male 20.93 15Female 10.07 15
Total 30
U W z Corrected for ties, two-tailed p
31.000 151.000 −3.406 0.001
Note: U = Mann–Whitney test statistics, W = Wilcoxon W statistic, z = U transformed into normally dis-tributed z statistics.
Mann–Whitney U and Wilcoxon rank sum W tests: internet usage by gender
significant difference is found between the two groups, corroborating the results of the two-independent-samples t test reported earlier. Because the ranks are assigned from the smallest observation to the largest, the higher mean rank of males (20.93) indicates that they use the internet to a greater extent than females (mean rank = 10.07).
Researchers often wish to test for a significant difference in proportions obtained from two independent samples. In this case, as an alternative to the parametric z test considered earlier, one could also use the cross-tabulation procedure to conduct a chi-square test.20 In this case, we will have a 2 × 2 table. One variable will be used to denote the sample and will assume a value of 1 for sample 1 and a value of 2 for sample 2. The other variable will be the binary variable of interest.
Two other independent-samples non-parametric tests are the median test and the Kolmogorov–Smirnoff test. The twosample median test determines whether the two groups are drawn from populations with the same median. It is not as powerful as the Mann–Whitney U test because it merely uses the location of each observation relative to the median, and not the rank, of each observation. The Kolmogorov–Smirnoff twosample test exam-ines whether the two distributions are the same. It takes into account any differences between the two distributions, including the median, dispersion and skewness, as illustrated by the following example.
In this example, the marketing research directors and users comprised two independent samples. The samples, however, are not always independent. In the case of paired samples, a different set of tests should be used.
Two-sample median testNon-parametric test statistic that determines whether two groups are drawn from populations with the same median. This is not as powerful as the Mann–Whitney U test.
Kolmogorov–Smirnov (K–S) two-sample testNon-parametric test statistic that determines whether two distributions are the same. It takes into account any differences in the two distributions, including median, dispersion and skewness.
Real research Directors change direction21
How do marketing research directors and users in Fortune 500 manufacturing firms per-ceive the role of marketing research in initiating changes in marketing strategy formula-tion? A study found that marketing research directors were more strongly in favour of initiating changes in strategy and less in favour of holding back than were users of mar-keting research. The percentage responses to one of the items, ‘Initiate change in the marketing strategy of the firm whenever possible’, are given in the following table. Using the K–S test, these differences of role definition were statistically significant at the 0.05 level, as shown below.

591Chapter 20 Frequency distribution, cross-tabulation and hypothesis testing
Paired samples
An important non-parametric test for examining differences in the location of two popu-lations based on paired observations is the Wilcoxon matchedpairs signedranks test. This test analyses the differences between the paired observations, taking into account the magnitude of the differences. So it requires that the data are measured at the interval level of measurement. However, it does not require assumptions about the form of the distribution of the measurements. It should therefore be used whenever the distributional assumptions that underlie the t test cannot be satisfied. The test computes the differences between the pairs of variables and ranks the absolute differences. The next step is to sum the positive and negative ranks. The test statistic, z, is computed from the positive and negative rank sums. Under the null hypothesis of no difference, z is a standard normal variate with mean 0 and variance 1 for large samples. This test corresponds to the paired t test considered earlier.22
The example considered for the paired t test, whether the participants differed in terms of attitude towards the internet and attitude towards technology, is considered again. Suppose we assume that both these variables are measured on ordinal rather than interval scales. Accordingly, we use the Wilcoxon test. The results are shown in Table 20.18. Again, a significant difference is found in the variables, and the results are in accordance with the conclusion reached by the paired t test. There are 23 negative dif-ferences (attitude towards technology is less favourable than attitude towards the inter-net). The mean rank of these negative differences is 12.72. On the other hand, there is only one positive difference (attitude towards technology is more favourable than atti-tude towards the internet). The mean rank of the difference is 7.50. There are six ties, or observations with the same value for both variables. These numbers indicate that the
Wilcoxon matched-pairs signed-ranks testA non-parametric test that analyses the differences between the paired observations, taking into account the magnitude of the differences.
The role of marketing research in strategy formulation
Responses (%)
Sample n Absolutely must
Preferably should
May or may not
Preferably should not
Absolutely must not
D 77 7 26 43 19 5U 68 2 15 32 35 16
K–S significance = 0.05. D = directors, U = users.
Table 20.18
Internet with technology
(Technology–Internet) Cases Mean rank
− Ranks 23 12.72+ Ranks 1 7.50
Ties 6Total 30
z = −4.207 Two-tailed p = 0.000
Wilcoxon matched-pairs signed-ranks test

592 Marketing Research
Table 20.19
Sample Application Level of scaling Test/comments
One sample
One sample Distributions Non-metric K–S and chi-square for goodness of fit
Runs test for randomness
Binomial test for goodness of fit for dichotomous variables
One sample Means Metric t test, if variance is unknown
z test, if variance is known
One sample Proportions Metric z test
Two independent samples
Two independent samples Distributions Non-metric K–S two-sample test for examining equivalence of two distributions
Two independent samples Means Metric Two-group t test
F test for equality of variances
Two independent samples Proportions Metric z test
Non-metric Chi-square test
Two independent samples Rankings/medians Non-metric Mann–Whitney U test more powerful than median test
Paired samples
Paired samples Means Metric Paired t testPaired samples Proportions Non-metric McNemar test for binary variables
Chi-square testPaired samples Rankings/medians Non-metric Wilcoxon matched-pairs ranked-signs test more
powerful than sign test
A summary of hypothesis testing
attitude towards the internet is more favourable than that towards technology. Further-more, the probability associated with the z statistic is less than 0.05, indicating that the difference is indeed significant.
Another paired sample non-parametric test is the sign test.23 This test is not as powerful as the Wilcoxon matched-pairs signed-ranks test because it compares only the signs of the differences between pairs of variables without taking into account the ranks. In the special case of a binary variable where the researcher wishes to test differences in proportions, the McNemar test can be used. Alternatively, the chi-square test can also be used for binary variables.
The various parametric and non-parametric tests are summarised in Table 20.19. The tests in Table 20.19 can be easily related to those in Figure 20.9. Table 20.19 classifies the tests in more detail, as parametric tests (based on metric data) are classified separately for means and proportions. Likewise, non-parametric tests (based on non-metric data) are classified sepa-rately for distributions and rankings/medians. The final example illustrates the use of hypoth-esis testing in international branding strategy.
Sign testA non-parametric test for examining differences in the location of two populations, based on paired populations, that compares only the signs of the differences between pairs of variables without taking into account the magnitude of the differences.

593Chapter 20 Frequency distribution, cross-tabulation and hypothesis testing
Real research International brand equity – the name of the game24
In an era of global marketing, how can marketers develop their brands in diverse social, cultural and historical environments? A study showed that, in general, a firm’s interna-tional brand structure includes firm-based characteristics, product-market characteris-tics and market dynamics. More specifically, according to Bob Kroll, the former President of Del Monte International, uniform packaging may be an asset to marketing interna-tionally, but catering to the culinary taste preferences of individual countries is more important. One survey on international product marketing made this clear. Participants included 100 brand and product managers and marketing executives from some of the world’s largest food, pharmaceutical and personal product companies. For international markets, 39% said it was not a good idea to use uniform packaging and 38% said it was a good idea. Those who said it was not a good idea mentioned, however, the desirability of maintaining as much brand equity and package consistency from market to market. But they also believed it was necessary to tailor the package to fit the linguistic and regu-latory needs of different markets.
Based on this finding, a suitable research question could be: ‘Do consumers in differ-ent countries prefer to buy global name brands with different packaging customised to suit their local needs?’ Based on this research question, one could frame a hypothesis that, other things being constant, standardised branding with customised packaging for a well-established brand name will result in a greater market share. The hypotheses may be formulated as follows:
H0: Standardised branding with customised packaging for a well-established brand name will not lead to greater market share in an international market.H1: Other factors remaining equal, standardised branding with customised packaging for a well-established brand name will lead to greater market share in the interna-tional market.
To test the null hypothesis, a well-established brand such as Colgate toothpaste, which has followed a mixed strategy, could be selected. The market share in countries with standardised branding and standardised packaging can be compared with market share in countries with standardised branding and customised packaging, after control-ling for the effect of other factors. A two-independent-samples t test could be used.
Practise data analysis with SPSS
SPSS Windows and Mac
The main program in SPSS is FREQUENCIES. It produces a table of frequency counts, per-centages and cumulative percentages for the values of each variable. It gives all of the asso-ciated statistics except for the coefficient of variation. If the data are interval scaled and only the summary statistics are desired, the DESCRIPTIVES procedure can be used. All of the statistics computed by DESCRIPTIVES are available in FREQUENCIES. However, DESCRIPTIVES is more efficient because it does not sort values into a frequency table. Moreover, the DESCRIPTIVES procedure displays summary statistics for several variables in a single table and can also calculate standardised values (z scores). The EXPLORE proce-dure produces summary statistics and graphical displays, either for all the cases or separately for groups of cases. Mean, median, variance, standard deviation, minimum, maximum and range are some of the statistics that can be calculated.

594 Marketing Research
To select these procedures, click
Analyze>Descriptive Statistics>Frequencies
Analyze>Descriptive Statistics>Descriptives
Analyze>Descriptive Statistics>Explore
We give detailed steps for running frequencies on familiarity with the internet (Table 20.1) and plotting the histogram (Figure 20.1):
1 Select ANALYZE on the SPSS menu bar.
2 Click DESCRIPTIVE STATISTICS and select FREQUENCIES.
3 Move the variable ‘Familiarity [familiar]’ to the VARIABLE(S) box.
4 Click STATISTICS.
5 Select MEAN, MEDIAN, MODE, STD. DEVIATION, VARIANCE and RANGE.
6 Click CONTINUE.
7 Click CHARTS.
8 Click HISTOGRAMS, then click CONTINUE.
9 Click OK.
The major cross-tabulation program is CROSSTABS. This program will display cross-classifi-cation tables and provide cell counts, row and column percentages, the chi-square test for sig-nificance and all the measures of the strength of the association that have been discussed.
To select these procedures, click
Analyze>Descriptive Statistics>Crosstabs
We give detailed steps for running the cross-tabulation of gender and usage of the internet given in Table 20.3 and calculating the chi-square, contingency coefficient and Cramer’s V:
1 Select ANALYZE on the SPAA menu bar.
2 Click on DESCRIPTIVE STATISTICS and select CROSSTABS.
3 Move the variable ‘Internet Usage Group [iusagegr]’ to the ROW(S) box.
4 Move the variable ‘Sex [sex]’ to the COLUMN(S) box.
5 Click CELLS.
6 Select OBSERVED under COUNTS and COLUMN under PERCENTAGES.
7 Click CONTINUE.
8 Click STATISTICS.
9 Click CHI-SQUARE, PHI and CRAMER’S V.
10 Click CONTINUE.
11 Click OK.
The major program for conducting parametric tests in SPSS is COMPARE MEANS. This program can be used to conduct t tests on one sample or independent or paired samples. To select these procedures using SPSS for Windows, click
Analyze>Compare Means>Means . . .
Analyze>Compare Means>One-Sample T Test . . .

595Chapter 20 Frequency distribution, cross-tabulation and hypothesis testing
Analyze>Compare Means>Independent-Samples T Test . . .
Analyze>Compare Means>Paired-Samples T Test . . .
We give detailed steps for running a one-sample test on the data of Table 20.1. We wanted to test the hypothesis that the mean familiarity rating exceeds 4.0. The null hypothesis is that the mean familiarity rating is less than or equal to 4.0:
1 Select ANALYZE from the SPSS menu bar.
2 Click COMPARE MEANS and then ONE SAMPLE T TEST.
3 Move ‘Familiarity [familiar]’ into the TEST VARIABLE(S) box.
4 Type ‘4’ in the TEST VALUE box.
5 Click OK.
We give the detailed steps for running a two-independent-samples t test on the data of Table 20.1. The null hypothesis is that the internet usage for males and females is the same:
1 Select ANALYZE from the SPSS menu bar.
2 Click COMPARE MEANS and then INDEPENDENT SAMPLES T TEST.
3 Move ‘Internet Usage Hrs/Week [iusage]’ into the TEST VARIABLE(S) box.
4 Move ‘Sex [sex]’ to the GROUPING VARIABLE box.
5 Click DEFINE GROUPS.
6 Type ‘1’ in box GROUP 1 and ‘2’ in box GROUP 2.
7 Click CONTINUE.
8 Click OK.
We give the detailed steps for running a paired samples t test on the data of Table 20.1. The null hypothesis is that there is no difference in the attitude towards the internet and attitude towards technology:
1 Select ANALYZE from the SPSS menu bar.
2 Click COMPARE MEANS and then PAIRED SAMPLES T TEST.
3 Move ‘Attitude Toward Internet [iattitude]’ and then select ‘Attitude Toward Technology [tattitude]’. Move these variables into the PAIRED VARIABLE(S) box.
4 Click OK.
The non-parametric tests discussed in this chapter can be conducted using NONPARAMET-RIC TESTS. To select these procedures using SPSS for Windows, click
Analyze>Nonparametric Tests>Chi-Square . . .
Analyze>Nonparametric Tests>Binomial . . .
Analyze>Nonparametric Tests>Runs . . .
Analyze>Nonparametric Tests>1-Sample K-S . . .
Analyze>Nonparametric Tests>2 Independent Samples . . .
Analyze>Nonparametric Tests>2 Related Samples . . .
The detailed steps for the non-parametric tests are similar to those for parametric tests.

596 Marketing Research
Summary Basic data analysis provides valuable insights and guides the rest of the data analysis, as well as the interpretation of the results. A frequency distribution should be obtained for each variable in the data. This analysis produces a table of frequency counts, percent-ages and cumulative percentages for all the values associated with that variable. It indi-cates the extent of out-of-range, missing or extreme values. The mean, mode and median of a frequency distribution are measures of central tendency. The variability of the distri-bution is described by the range, the variance or standard deviation, coefficient of varia-tion and interquartile range. Skewness and kurtosis provide an idea of the shape of the distribution.
The general procedure for hypothesis testing involves eight steps. Formulate the null and alternative hypotheses, select an appropriate test statistic, choose the level of significance (a), calculate the value of the test statistic and determine the probability associated with the test statistic calculated from the sample data under the null hypothesis. Alternatively, determine the critical value associated with the test statistic. Compare the probability associated with the test statistic with the level of significance specified or, alternatively, determine whether the calculated value of the test statistic falls into the rejection or the non-rejection region. Accordingly, make the decision to reject or not reject the null hypothesis, and arrive at a conclusion.
Cross-tabulations are tables that reflect the joint distribution of two or more varia-bles. In cross-tabulation, the percentages can be computed either by column, based on column totals, or by row, based on row totals. The general rule is to compute the percentages in the direction of the independent variable, across the dependent vari-able. Often the introduction of a third variable can provide additional insights. The chi-square statistic provides a test of the statistical significance of the observed association in a cross-tabulation. The phi coefficient, contingency coefficient, Cramer’s V and lambda coefficient provide measures of the strength of association between the variables.
Parametric and non-parametric tests are available for testing hypotheses related to differences. In the parametric case, the t test is used to examine hypotheses related to the population mean. Different forms of the t test are suitable for testing hypoth-eses based on one sample, two independent samples or paired samples. In the non-parametric case, popular one-sample tests include the Kolmogorov–Smirnov, chi-square, runs test and binomial test. For two-independent non-parametric sam-ples, the Mann–Whitney U test, median test, Kolmogorov–Smirnov and chi-square tests can be used. For paired samples, the sign, Wilcoxon matched-pairs signed-ranks, McNemar and chi-square tests are useful for examining hypotheses related to measures of location.
Questions 1 Describe the procedure for computing frequencies.
2 What measures of location are commonly computed?
3 What measures of variability are commonly computed?
4 How is the relative flatness or peakedness of a distribution measured?
5 What is a skewed distribution? What does it mean?

597Chapter 20 Frequency distribution, cross-tabulation and hypothesis testing
6 What is the major difference between cross-tabulation and frequency distribution?
7 What is the general rule for computing percentages in cross-tabulations?
8 Define a spurious correlation.
9 What is meant by a suppressed association? How is it revealed?
10 Discuss the reasons for the frequent use of cross-tabulations. What are some of the limitations?
11 Present a classification of hypothesis testing procedures.
12 Describe the general procedure for conducting a t test.
13 What is the major difference between parametric and non-parametric tests?
14 Which non-parametric tests are the counterparts of the two-independent-samples t test for parametric data?
15 Which non-parametric tests are the counterparts of the paired samples t test for parametric data?
Exercises 1 In each of the following situations, indicate the statistical analysis you would conduct and the appropriate test or test statistic that should be used:
a Consumer preferences for The Body Shop shampoo were obtained on an 11-point Likert scale. The same consumers were then shown a commercial about The Body Shop. After the commercial, preferences for The Body Shop were again measured. Has the commercial been successful in inducing a change in preferences?
b Does the preference for The Body Shop shampoo follow a normal distribution?
c Participants in a survey of 1,000 households were classified as heavy, medium, light and non-users of ice cream. They were also classified as being in high-, medium- or low-income categories. Is the consumption of ice cream related to income level?
d In a survey of 2,000 households, participants were asked to rank 10 supermarkets, including Lidl, in order of preference. The sample was divided into small and large households based on a median split of the household size. Does preference for shopping in Lidl vary by household size?
2 The current advertising campaign for Red Bull would be changed if less than 30% of consumers like it.
a Formulate the null and alternative hypotheses.
b Discuss the Type I and Type II errors that could occur in hypothesis testing.
c Which statistical test would you use? Why?
d A random sample of 300 consumers was surveyed and 84 participants indicated that they liked the campaign. Should the campaign be changed? Why?

598 Marketing Research
3 An electrical goods chain is having a New Year sale of refrigerators. The number of refrigerators sold during this sale at a sample of 10 stores was
80 110 0 40 70 80 100 50 80 30
a Is there evidence that an average of more than 50 refrigerators per store was sold during this sale? Use a = 0.05.
b What assumption is necessary to perform this test?
4 In a survey pre-test, data were obtained from 45 participants on Benetton clothes. These data are given in the table overleaf, which gives the usage, gender, awareness, attitude, preference, intention and loyalty towards Benetton of a sample of Benetton users. Usage was coded as 1, 2 or 3, representing light, medium or heavy users. Gender was coded as 1 for females and 2 for males. Awareness, attitude, preference, intention and loyalty were measured on a seven-point Likert-type scale (1 = very unfavourable, 7 = very favourable). Note that five participants have missing values, which are denoted by 9.
Analyse the Benetton data to answer the following questions. In each case, formulate the null and alternative hypotheses and conduct the appropriate statistical test(s):
a Obtain a frequency distribution for each of the following variables and calculate the relevant statistics: awareness, attitude, preference, intention and loyalty towards Benetton.
b Conduct a cross-tabulation of the usage with gender. Interpret the results.
c Does the awareness for Benetton exceed 3.0?
d Do males and females differ in their awareness of Benetton? Their attitude towards Benetton? Their loyalty to Benetton?
e Do the participants in the pre-test have a higher level of awareness than loyalty?
f Does awareness of Benetton follow a normal distribution?
g Is the distribution of preference for Benetton normal?
h Assume that awareness towards Benetton was measured on an ordinal scale rather than an interval scale. Do males and females differ in their awareness of Benetton?
i Assume that loyalty towards Benetton was measured on an ordinal scale rather than an interval scale. Do males and females differ in their loyalty towards Benetton?
j Assume that attitude and loyalty towards Benetton were measured on an ordinal scale rather than an interval scale. Do the participants have a greater awareness of Benetton than loyalty to Benetton?
Notes
1. Keen, C., Wetzels, M., de Ruyter, K. and Feinberg, R., ‘E-tailers versus retailers: Which factors determine consumer preferences’, Journal of Business Research 57 (7) (July 2004), 685; Mathwick, C., Malhotra, N.K.
and Rigdon, E., ‘The effect of dynamic retail experience on experiential perceptions of value: An internet and catalog comparison’, Journal of Retailing 78 (2002), 51–60.

599Chapter 20 Frequency distribution, cross-tabulation and hypothesis testing
2. See any introductory statistics book for a more detailed description of these statistics; for example, see Berenson, M.L., Levine, D.M. and Krehbiel, T.C., Basic Business Statistics: Concepts and Applications, 11th edn (Upper Saddle River, NJ: Prentice Hall, 2009).
3. For our purposes, no distinction will be made between formal hypothesis testing and statistical inference by means of confidence intervals. See, for example, Larocque, D. and Randles, R.H., ‘Confidence intervals for a discrete population median’, American Statistician 62 (1) (February 2008), 32–9.
4. Excellent discussions of ways to analyse cross-tabulations can be found in Wagner, W.W., Using SPSS for Social Statistics and Research Methods (Thousand Oakes, CA: Pine Forge Press, 2007); Denman, B.E., ‘Advanced categorical statistics: Issues and applications in communication research’, Journal of Communication 52 (1) (March 2002), 162; Hellevik, O., Introduction to Causal Analysis: Exploring Survey Data by Crosstabulation (Beverley Hills, CA: Sage, 1984).
5. McKechnie, D.S., Grant, J., Korepina, V. and Sadykova, N., ‘Women: Segmenting the home fitness equipment market’, Journal of Consumer Marketing 24 (1) (2007), 18–26; Kivetz, R. and Simonson, I., ‘Earning the right to indulge: Effort as a determinant of customer preferences toward frequency program rewards’, Journal of Marketing Research 39 (2) (May 2002), 155–70; Feick, L.F., ‘Analyzing marketing research data with association models’, Journal of Marketing Research 21 (November 1984), 376–86.
6. Lenell, W. and Boissoneau, R., ‘Using causal-comparative and correlational designs in conducting market research’, Journal of Professional Services Marketing 13 (2) (1996), 59–69. See also the classic book by Zeisel, H., Say It with Figures, 5th edn (New York: Harper & Row, 1968).
7. Sirkin, R.M., Statistics for the Social Sciences, 3rd edn (Thousand Oaks, CA: Sage, 2005); Wright, D.B., First Steps in Statistics (Thousand Oaks, CA: Sage, 2002); Sirkin, R.M., Statistics for the Social Sciences (Thousand Oaks, CA: Sage, 1994).
8. Higgins, J.J., Introduction to Modern Nonparametric Statistics (Pacific Grove, CA: Duxbury, 2002); Pet, M.A., Nonparametric Statistics for Health Care Research (Thousand Oaks, CA: Sage, 1997). For a more extensive treatment see Lancaster, H.O., The Chi Squared Distribution (New York: Wiley, 1969). For a recent application, see Bakir, A., ‘Some assembly required: Comparing disclaimers in children’s TV advertising in Turkey and the United States’, Journal of Advertising Research 49 (1) (March 2009), 93–103.
9. Berenson, M.L., Levine, D.M. and Krehbiel, T.C., Basic Business Statistics: Concepts and Applications, 11th edn (Upper Saddle River, NJ: Prentice Hall, 2009).
10. Some statisticians, however, disagree. They feel that a correction should not be applied. See, for example, Overall, J.E., ‘Power of chi-square tests for 2 × 2 contingency tables with small expected frequencies’, Psychological Bulletin (January 1980), 132–5. See also Betancourt, R.R., Cortinas, M., Elorz, M. and Mugica, J.M., ‘The demand for and the supply of distribution services: A basis for the analysis of customer satisfaction in retailing’, Quantitative Marketing and Economics 5 (3) (September 2007), 293–312.
11. Significance tests and confidence intervals are also available for either asymmetric lambda or symmetric lambda. See Goodman, L.A. and Kruskal, W.H., ‘Measures of association for cross classification: Appropriate sampling theory’, Journal of the American Statistical Association 88 (June 1963), 310–64.
12. Fields, A., Discovering Statistics Using SPSS, 2nd edn (Thousand Oaks, CA: Sage, 2005); Hoenig, J.M., ‘The abuse of power: The pervasive fallacy of power calculation for data analysis’, American Statistician 55 (1) (February 2001), 19–24; Cowles, M. and Davis, C., ‘On the origins of the .05 level of statistical significance’, American Psychologist 37 (5) (May 1982), 553–8. See also Kotabe, M., Duhan, D.E., Smith, D.K. Jr and Wilson, R.I.D., ‘The perceived veracity of PIMS strategy principles in Japan: An empirical inquiry’, Journal of Marketing 55 (January 1991), 26–41.
13. Technically, a null hypothesis cannot be accepted. It can be either rejected or not rejected. This distinction, however, is inconsequential in marketing research.
14. The condition when the variances cannot be assumed to be equal is known as the Behrens–Fisher problem. There is some controversy over the best procedure in this case. For an example, see Hulten, B., ‘Customer segmentation: The concepts of trust commitment and relationships’, Journal of Targeting, Measurement and Analysis for Marketing 15 (4) (September 2007), 256–69; Heilman, C.M., Nakamoto, K. and Rao, A.G., ‘Pleasant surprises: Consumer response to unexpected in-store coupons’, Journal of Marketing Research 39 (2) (May 2002), 242–52.
15. Iyer, R. and Eastman, J.K., ‘The elderly and their attitudes toward the internet: The impact on internet use, purchase and comparison shopping’, Journal of Marketing Theory and Practice 14 (1) (January 2006), 57–66; Chandler, S., ‘Some retailers begin to cater to growing group of aging shoppers’, Knight Ridder Tribune Business News (17 March 2001), 1; Lumpkin, J.R. and Hunt, J.B., ‘Mobility as an influence on retail patronage behavior of the elderly: Testing conventional wisdom’, Journal of the Academy of Marketing Science (Winter 1989), 1–12.
16. Schleis, P., ‘Startup bets on Super Bowl: Local entrepreneurs hope pricey 15-second ad draws viewers to new website’, McClatchy-Tribune Business News (January 2008); Ives, N., ‘In a TV world filled with clutter, some commercials are running longer, hoping to be noticed’, New York Times (28 July 2004), C.11; Dunst, L., ‘Is it possible to get creative in 15 seconds?’, Advertising Age 64 (50) (29 November 1993), 18; Rosenblatt, J.A. and Mainprize, J., ‘The history and future of 15-second commercials: An empirical investigation of the perception of ad agency media directors’, in Lazer, W., Shaw, E. and Wee, C.H. (eds), World Marketing Congress, International Conference Series, Vol. 4 (Boca Raton, FL: Academy of Marketing Science, 1989), 169–77.
17. Grover, R. and Vriens, M., The Handbook of Marketing Research: Uses, Misuses and Future Advances (Thousand Oaks, CA: Sage, 2006); Kanji, G.K., 100 Statistical Tests (Thousand Oaks, CA: Sage, 1999); Harnett, D.L., Statistical Methods, 3rd edn (Reading, MA: Addison-Wesley, 1982).
18. Higgins, J.J., Introduction to Modern Nonparametric Statistics (Pacific Grove, CA: Duxbury, 2002); Pen,

600 Marketing Research
M.A., Nonparametric Statistics for Health Care Research (Thousand Oaks, CA: Sage, 1997).
19. There is some controversy over whether non-parametric statistical techniques should be used to make inferences about population parameters.
20. The t test in this case is equivalent to a chi-square test for independence in a 2 × 2 contingency table. The relationship is
x2.95(1) = t2.0005(n1 + n2 − 2)
For large samples, the t distribution approaches the normal distribution and so the t test and the z test are equivalent.
21. Swaddling, D., ‘Good data still worth the investment’, Marketing News 35 (2) (15 January 2001), 20–1; Krum, J.R., Rau, P.A. and Keiser, S.K., ‘The marketing research process: Role perceptions of researchers and users’, Journal of Advertising Research (December–January 1988), 9–21. See also Miller, C., ‘Gallup Brothers analyze the research industry’, Marketing News 31 (1) (6 January 1997), 2.
22. Bergmann, R., ‘Different outcomes of the Wilcoxon–Mann–Whitney test from different statistics packages’, American Statistician 54 (1) (February 2000), 72–7; for an example of Wilcoxon matched-pairs signed-ranks test, see Kalwani, M.U. and Narayandas, N., ‘Long-term manufacturer–supplier relationships: Do they pay off for supplier firms?’, Journal of Marketing 59 (January 1995), 1–16.
23. Bailey, W., ‘Data use: Nonparametric tests: Sturdy alternatives’, www.quirks.com/articles/a2002/20020509.aspx?searchID=3435634, accessed 23 March 2008; Pett, M.A., Nonparametric Statistics for Health Care Research (Thousand Oaks, CA: Sage, 1997); Field, J.G., ‘The world’s simplest test of significance’, Journal of the Market Research Society (July 1971), 170–2.
24. Strange, R., ‘Branding and externalization of production’, International Marketing Review 23 (6) (2006), 578; Miles, L., ‘Finding a balance in global research’, Marketing (29 November 2001), 33; de Chernatony, L., Halliburton, C. and Bernath, R., ‘International branding: Demand or supply driven?’, International Marketing Review 12 (2) (1995), 9–21.

Analysis of variance and covariance
Analysis of variance is a
straightforward way to examine
the differences between groups
of responses that are measured
on interval or ratio scales.
Stage 1
Problem definition
Stage 2
Research approach developed
Stage 3
Research design
developed
Stage 4
Fieldwork or data
collection
Stage 5
Data integrity
and analysis
21
Stage 6
Communicating research findings

602 Marketing Research
Objectives
After reading this chapter, you should be able to:
1 discuss the scope of the analysis of variance (ANOVA) technique and its relationship to the t test, and regression;
2 describe one-way analysis of variance, including decomposition of the total variation, measurement of effects significance testing and interpretation of results;
3 describe n-way analysis of variance and the testing of the significance of the overall effect, the interaction effect and the main effect of each factor;
4 describe analysis of covariance and show how it accounts for the influence of uncontrolled independent variables;
5 explain key factors pertaining to the interpretation of results with emphasis on interactions, relative importance of factors and multiple comparisons;
6 discuss specialised ANOVA techniques applicable to marketing, such as repeated measures ANOVA, non-metric ANOVA and multivariate analysis of variance (MANOVA);
7 understand the use of software for analyses of variance and covariance.
In Chapter 20, we examined tests of differences between two means or two medians. In this chapter, we discuss procedures for examining differences between more than two means or medians. These procedures are called analysis of variance and analysis of covariance. These procedures have traditionally been used for analysing experimental data, but they are also used for analysing survey or observational data.
We describe analysis of variance and covariance procedures and discuss their relationship to other techniques. Then we describe one-way analysis of variance, the simplest of these procedures, followed by n-way analysis of variance and analysis of covariance. Special attention is given to issues in interpretation of results as they relate to interactions, relative importance of factors and multiple comparisons. Some specialised topics, such as repeated measures analysis of variance, non-metric analysis of variance and multivariate analysis of variance, are briefly discussed. Finally, guidance is provided on the use of software to address the data analysis challenges presented in this chapter. We begin with two examples that illustrate applications of analysis of variance.
Overview
Real research Analysis of tourism destinations1
A survey conducted by EgeBank in Istanbul, Turkey, focused upon the importance of tour operators’ and travel agents’ perceptions of selected Mediterranean tourist destinations (Egypt, Greece, Italy and Turkey). Operators/travel agents were mailed questionnaires based on the location of tours, broken down as follows: Egypt (53), Greece (130), Italy (150) and Turkey (65). The survey consisted of ques-tions on affective and cognitive evaluations of the four destinations. The four affective questions were asked on a seven-point semantic differential scale, whereas the 14 cognitive

603Chapter 21 Analysis of variance and covariance
Real research Online shopping risks2
Analysis of variance was used to test differences in preferences for online shopping for products with different economic and social risks. In a 2 × 2 design, economic risk and social risk were varied at two levels each (high or low). Preference for online shopping served as the dependent variable. The results indicated a significant interaction of social risk with economic risk. Online shopping was not perceived favourably for high-social-risk products, regardless of the level of economic product risk, but it was preferred for low-economic-risk over high-economic-risk products, when the level of social risk was low.
evaluations were measured on a five-point Likert scale (1 = offers very little, 2 = offers some-what little, 3 = offers neither little nor much, 4 = offers somewhat much, and 5 = offers very much). The differences in the evaluations of the four locations were examined using one-way analysis of variance (ANOVA), as seen in the following table.
The ANOVA table shows that ‘unpleasant–pleasant’ and ‘distressing–relaxing’ affec-tive factors had significant differences among the four destinations. For instance, Greece and Italy were perceived as being significantly more relaxing than Egypt. As for the per-ceptual factors, 8 of the 14 factors were significant. Turkey was perceived as significantly better value for money than Greece and Italy. Turkey’s main strength appeared to be ‘good value’, and the country’s tourist agencies should promote this in their marketing strategies. On the other hand, Turkey needed to improve the perception of its infrastruc-ture, cleanliness and entertainment to attract more tour operators and travel agencies.
Image variations of destinations promoted to tour operators and travel agencies
Image items Turkey (n = 36)
Egypt (n = 29)
Greece (n = 37)
Italy (n = 34)
Sig.
Affective (scale 1–7)Unpleasant–pleasant 6.14 5.62 6.43 6.50 0.047*Sleepy–arousing 6.24 5.61 6.14 6.56 0.053Distressing–relaxing 5.60 4.86 6.05 6.09 0.003*Gloomy–exciting 6.20 5.83 6.32 6.71 0.061
Perceptual (scale 1–5)
Good value for money 4.62 4.32 3.89 3.27 0.000*Beautiful scenery and natural attractions 4.50 4.04 4.53 4.70 0.011*Good climate 4.29 4.00 4.41 4.35 0.133Interesting cultural attractions 4.76 4.79 4.67 4.79 0.781Suitable accommodations 4.17 4.28 4.35 4.62 0.125Appealing local food (cuisine) 4.44 3.57 4.19 4.85 0.000*Great beaches and water sports 3.91 3.18 4.27 3.65 0.001*Quality of infrastructure 3.49 2.97 3.68 4.09 0.000*Personal safety 3.83 3.28 4.19 4.15 0.000*Interesting historical attractions 4.71 4.86 4.81 4.82 0.650Unpolluted and unspoiled environment 3.54 3.34 3.43 3.59 0.784Good nightlife and entertainment 3.44 3.15 4.06 4.27 0.000*Standard hygiene and cleanliness 3.29 2.79 3.76 4.29 0.000*Interesting and friendly people 4.34 4.24 4.35 4.32 0.956
*Significant at 0.05 level.

604 Marketing Research
Analysis of variance and analysis of covariance are used for examining the differences in the mean values of the dependent variable associated with the effect of the controlled independ-ent variables, after taking into account the influence of the uncontrolled independent varia-bles. Essentially, analysis of variance (ANOVA) is used as a test of means for two or more populations. The null hypothesis, typically, is that all means are equal. For example, suppose that the researcher was interested in examining whether heavy users, medium users, light users and non-users of yogurt differed in their preference for Müller yogurt, measured on a nine-point Likert scale. The null hypothesis that the four groups were not different in prefer-ence for Müller could be tested using ANOVA.
In its simplest form, ANOVA must have a dependent variable (preference for Müller yogurt) that is metric (measured using an interval or ratio scale). There must also be one or more independent variables (product use: heavy, medium, light and non-users). The inde-pendent variables must all be categorical (non-metric). Categorical independent variables are also called factors. A particular combination of factors, or categories, is called a treatment. One-way analysis of variance involves only one categorical variable, or a single factor. The differences in preference of heavy users, medium users, light users and non-users would be examined by one-way ANOVA. In this, a treatment is the same as a factor level (medium users constitute a treatment). If two or more factors are involved, the analysis is termed n-way analysis of variance. If, in addition to product use, the researcher also wanted to examine the preference for Müller yogurt of customers who are loyal and those who are not, an n-way ANOVA would be conducted.
If the set of independent variables consists of both categorical and metric variables, the technique is called analysis of covariance (ANCOVA). For example, analysis of covari-ance would be required if the researcher wanted to examine the preference of product use groups and loyalty groups, taking into account the participants’ attitudes towards nutrition and the importance they attached to dairy products. The latter two variables would be meas-ured on nine-point Likert scales. In this case, the categorical independent variables (product use and brand loyalty) are still referred to as factors, whereas the metric-independent vari-ables (attitude towards nutrition and importance attached to dairy products) are referred to as covariates.
The relationship of ANOVA to t tests and other techniques, such as regression (see Chapter 20), is shown in Figure 21.1. These techniques all involve a metric-dependent variable. ANOVA and ANCOVA can include more than one independent variable (prod-uct use, brand loyalty, attitude, importance, etc.). Furthermore, at least one of the inde-pendent variables must be categorical, and the categorical variables may have more than two categories (in our example, product use has four categories). A t test, on the other hand, involves a single, binary independent variable. For example, the difference in the preferences of loyal and non-loyal participants could be tested by conducting a t test. Regression analysis, as with ANOVA and ANCOVA, can also involve more than one independent variable. All the independent variables, however, are generally interval scaled, although binary or categorical variables can be accommodated using dummy
Analysis of variance (ANOVA)A statistical technique for examining the differences among means for two or more populations.
FactorsCategorical independent variables in ANOVA. The independent variables must all be categorical (non-metric) to use ANOVA.
TreatmentIn ANOVA, a particular combination of factor levels or categories.
One-way analysis of varianceAn ANOVA technique in which there is only one factor.
n-way analysis of varianceAn ANOVA model where two or more factors are involved.
Analysis of covariance (ANCOVA)An advanced ANOVA procedure in which the effects of one or more metric-scaled extraneous variables are removed from the dependent variable before conducting the ANOVA.
CovariateA metric-independent variable used in ANCOVA.
Relationship among techniques
The tourist destination example presented a situation with four categories. The t test was not appropriate for examining the overall difference in category means, so analysis of variance was used instead. The online shopping study involved a comparison of means when there were two factors (independent variables), each of which was varied at two levels. In this example t tests were not appropriate, because the effect of each factor was not independent of the effect of the other factor (in other words, interactions were significant). Analysis of variance provided meaningful conclusions in these studies. The relationship of analysis of variance to the t test and other techniques is considered in the next section.

605Chapter 21 Analysis of variance and covariance
variables. For example, the relationship between preference for Müller yogurt, attitude towards nutrition and importance attached to dairy products could be examined via regression analysis, with preference for Müller serving as the dependent variable and attitude and importance as independent variables.
Figure 21.1
Relationship between t test, analysis of variance, analysis of covariance and regression
N-wayanalysis ofvariance
One-wayanalysis ofvariance
RegressionAnalysis ofvariance
Analysis ofcovariance
More thanone factor
Onefactor
Metric-dependent variables
One or moreindependent
variables
Oneindependent
variable
Binary
t test
IntervalCategorical:
factorialCategoricaland interval
One-way ANOVA
Researchers are often interested in examining the differences in the mean values of the dependent variable for several categories of a single independent variable or factor. For example:
• Do various market segments differ in terms of their volume of product consumption?
• Do brand evaluations of groups exposed to different advertisements vary?
• Do retailers, wholesalers and agents differ in their attitudes towards the firm’s distribution policies?
• How do consumers’ intentions to buy the brand vary with different price levels?
• What is the effect of consumers’ familiarity with a car manufacturer (measured as high, medium or low) on preference for the car?
The answer to these and similar questions can be determined by conducting one-way ANOVA. Before describing the procedure, we define the important statistics associated with one-way ANOVA.3

606 Marketing Research
Statistics associated with one-way ANOVA
1 eta2 (h2). The strength of the effects of X (independent variable or factor) on Y (dependent variable) is measured by eta2 (h2). The value of h2 varies between 0 and 1.
2 F statistic. The null hypothesis that the category means are equal in the population is tested by an F statistic based on the ratio of mean square related to X and mean square related to error.
3 Mean square. This is the sum of squares divided by the appropriate degrees of freedom.
4 SSbetween. Also denoted as SSx, this is the variation in Y related to the variation in the means of the categories of X. This represents variation between the categories of X or the portion of the sum of squares in Y related to X.
5 SSwithin. Also denoted as SSerror, this is the variation in Y due to the variation within each of the categories of X. This variation is not accounted for by X.
6 SSy. The total variation in Y is SSy.
Conducting one-way ANOVA
The procedure for conducting one-way ANOVA is described in Figure 21.2. It involves identifying the dependent and independent variables, decomposing the total variation, meas-uring the effects, testing significance and interpreting the results. We consider these steps in detail and illustrate them with some applications.
Identifying the dependent and independent variables
The dependent variable is denoted by Y and the independent variable by X, and X is a cate-gorical variable having c categories. There are n observations on Y for each category of X, as shown in Table 21.1. As can be seen, the sample size in each category of X is n, and the total sample size N = n × c. Although the sample sizes in the categories of X (the group sizes) are assumed to be equal for the sake of simplicity, this is not a requirement.
Figure 21.2
Conducting one-way ANOVA
Identify the dependent andindependent variables
Decompose the total variation
Measure the e�ects
Test signi�cance
Interpret the results

607Chapter 21 Analysis of variance and covariance
Decompose the total variation
In examining the differences among means, one-way ANOVA involves the decomposition of the total variation observed in the dependent variable. This variation is measured by the sums of squares corrected for the mean (SS). ANOVA is so named because it examines the variability or variation in the sample (dependent variable) and, based on the variability, determines whether there is reason to believe that the population means differ.
The total variation in Y, denoted by SSy, can be decomposed into two components:
= + withinbetweenSS SSSSy
where the subscripts between and within refer to the categories of X. SSbetween is the variation in Y related to the variation in the means of the categories of X. It represents variation between the categories of X. In other words, SSbetween is the portion of the sum of squares in Y related to the independent variable or factor X. For this reason, SSbetween is also denoted as SSx. SSwithin is the variation in Y related to the variation within each category of X. SSwithin is not accounted for by X. Therefore, it is referred to as SSerror. The total variation in Y may be decomposed as
= + errorSS SS SSxy
where
=
=
=
=
=
=
( – )
( – )
2
1
2
1
1
( – )2SS
SS
SS
error
x
y
j
N
i
Yi Y
c
n Y Yjjj
c
Y Yij j
©
©
©and Yi = individual observation j = mean for category j
= mean over the whole sample or grand mean Yij = ith observation in the jth category.
Decomposition of the total variationIn one-way ANOVA, separation of the variation observed in the dependent variable into the variation due to the independent variables plus the variation due to error.
Y
Y
Table 21.1 Decomposition of the total variation: one-way ANOVA
Independent variable X
Categories Total sample
Within-category variation = SSwithin
X1 X2 X3 … Xc
Total variation = SSy
Y1 Y1 Y1 … Y1 Y1
Y2 Y2 Y2 … Y2 Y2
…
…
Yn Yn Yn … Yn Yn
Category mean—Y1
—Y2—Y2 …
—Yc—Y
Between-category variation = SSbetween
{ {{

608 Marketing Research
The logic of decomposing the total variation in Y, SSy, into SSbetween and SSwithin in order to examine differences in group means can be intuitively understood. Recall from Chapter 20 that, if the variation of the variable in the population was known or estimated, one could estimate how much the sample mean should vary because of random variation alone. In ANOVA, there are several different groups (e.g. heavy, medium and light users and non-users). If the null hypothesis is true and all the groups have the same mean in the population, one can estimate how much the sample means should vary because of sampling (random) variations alone. If the observed variation in the sample means is more than what would be expected by sampling variation, it is reasonable to conclude that this extra variability is related to differences in group means in the population.
In ANOVA, we estimate two measures of variation: within groups (SSwithin) and between groups (SSbetween). Within-group variation is a measure of how much the observations, Y values, within a group vary. This is used to estimate the variance within a group in the popu-lation. It is assumed that all the groups have the same variation in the population. But because it is not known that all the groups have the same mean, we cannot calculate the variance of all the observations together. The variance for each of the groups must be calculated indi-vidually, and these are combined into an ‘average’ or ‘overall’ variance. Likewise, another estimate of the variance of the Y values may be obtained by examining the variation between the means. (This process is the reverse of determining the variation in the means, given the population variances.) If the population mean is the same in all the groups, then the variation in the sample means and the sizes of the sample groups can be used to estimate the variance of Y. The reasonableness of this estimate of the Y variance depends on whether the null hypothesis is true. If the null hypothesis is true and the population means are equal, the vari-ance estimate based on between-group variation is correct. On the other hand, if the groups have different means in the population, the variance estimate based on between-group varia-tion will be too large. Thus, by comparing the Y variance estimates based on between-group and within-group variation, we can test the null hypothesis. Decomposition of the total vari-ation in this manner also enables us to measure the effects of X on Y.
Measuring the effects
The effects of X on Y are measured by SSx. Because SSx is related to the variation in the means of the categories of X, the relative magnitude of SSx increases as the differences among the means of Y in the categories of X increase. The relative magnitude of SSx also increases as the variations in Y within the categories of X decrease. The strength of the effects of X on Y is measured as follows:
2= =− errorSS
SS SS
SS SSx y
y y
h
The value of h2 varies between 0 and 1. It assumes a value of 0 when all the category means are equal, indicating that X has no effect on Y. The value of h2 will be 1 when there is no variability within each category of X but there is some variability between categories. Thus, h2 is a measure of the variation in Y that is explained by the independent variable X. Not only can we measure the effects of X on Y, but we can also test for their significance.
Testing the significance
In one-way ANOVA, the interest lies in testing the null hypothesis that the category means are equal in the population.4 In other words,
0 1 2 3: = = = =…H μ μ μ μc
Under the null hypothesis, SSx and SSerror come from the same source of variation. In such a case, the estimate of the population variance of Y can be based on either between-category

609Chapter 21 Analysis of variance and covariance
variation or within-category variation. In other words, the estimate of the population variance of Y,
2
1=
−==
mean square due to X
sy
MSx
cxSS
or2=
−==
mean square due to error
SSerror
N csy
MSerror
The null hypothesis may be tested by the F statistic based on the ratio between these two estimates:
=−−
=/( )
/( )
1SSSS
Ferror N c
x c MS x
MSerror
This statistic follows the F distribution, with (c – 1) and (N – c) degrees of freedom (df). As mentioned in Chapter 20, the F distribution is a probability distribution of the ratios of sam-ple variances. It is characterised by degrees of freedom for the numerator and degrees of freedom for the denominator.5
Interpreting results
If the null hypothesis of equal category means is not rejected, then the independent variable does not have a sig-nificant effect on the dependent variable. On the other hand, if the null hypothesis is rejected, then the effect of the independent variable is significant. In other words, the mean value of the dependent variable will be different for different categories of the independent variable. A com-parison of the category mean values will indicate the nature of the effect of the independent variable. Other salient issues in the interpretation of results, such as examination of differences among specific means, are discussed later.
Illustrative data
We illustrate the concepts discussed in this section using the data presented in Table 21.2. For illustrative purposes, we consider only a small number of observations. In actual prac-tice, ANOVA is performed on a much larger sample. These data were generated by an exper-iment in which Mercedes wanted to examine the effect of direct mail offers and dealership promotions upon the level of sales of new cars. Dealership promotion was varied at three levels: high (1), medium (2) and low (3). Direct mail efforts were manipulated at two levels. Either an exclusive set of leather-bound books that detailed the history of Mercedes was offered to customers who bought a new car (denoted by 1) or it was not (denoted by 2 in Table 21.2). Dealership promotion and direct mail offer were crossed, resulting in a 3 × 2 design with six cells. Thirty Mercedes dealerships were randomly selected, and five dealer-ships were randomly assigned to each treatment condition. The experiment ran for two months. The sales levels of new cars were measured, normalised to account for extraneous factors (e.g. dealership size, competitive dealerships in town) and converted to a 1 to 10 scale (10 representing the highest level of sales). In addition, a qualitative assessment was made of the relative affluence of the clientele of each dealership, again using a 1 to 10 scale. In these scales, higher numbers denote higher sales or more affluent clientele.

610 Marketing Research
Illustrative applications of one-way ANOVA
We illustrate one-way ANOVA first with an example showing calculations done by hand, and then by computer. Using the above mercedes example, suppose that only one factor, namely dealership promotion, was manipulated; that is, let us ignore the direct mail efforts for the purpose of this illustration. Mercedes is attempting to determine the effect of dealer-ship promotion (X) on the sales of new cars (Y). For the purpose of illustrating hand calcula-tions, the data of Table 21.2 are transformed in Table 21.3 to show the dealership (Yij) for each level of promotion.
The null hypothesis is that the category means are equal:
0 1 2 3: = =µ µ µH
Table 21.2
Dealership number Direct mail offer Dealership promotion Sales Clientele rating
1 1 1 10 9
2 1 1 9 10
3 1 1 10 8
4 1 1 8 4
5 1 1 9 6
6 1 2 8 8
7 1 2 8 4
8 1 2 7 10
9 1 2 9 6
10 1 2 6 9
11 1 3 5 8
12 1 3 7 9
13 1 3 6 6
14 1 3 4 10
15 1 3 5 4
16 2 1 8 10
17 2 1 9 6
18 2 1 7 8
19 2 1 7 4
20 2 1 6 9
21 2 2 4 6
22 2 2 5 8
23 2 2 5 10
24 2 2 6 4
25 2 2 4 9
26 2 3 2 4
27 2 3 3 6
28 2 3 2 10
29 2 3 1 930 2 3 2 8
Direct mail offer, dealership promotion, sales of new cars and clientele rating

611Chapter 21 Analysis of variance and covariance
To test the null hypothesis, the various sums of squares are computed as follows:
= − + − + − + −( . ) ( . ) ( . ) ( .10 6 067 9 6 067 10 6 067 8 6 0672 2 2 )) ( . ) ( . )
( . ) ( . )
2 2 2
2 2
9 6 067 8 6 067
8 6 067 7 6 067
+ − + −
+ − + − + − + − + − + −
+
( . ) ( . ) ( . ) ( . )
(
9 6 067 6 6 067 5 6 067 7 6 0672 2 2 2
66 6 067 4 6 067 5 6 067 8 6 067 92 2 2 2− + − + − + − + −. ) ( . ) ( . ) ( . ) ( 66 067 7 6 067
7 6 067 6 6 067 4 6
2 2
2 2
. ) ( . )
( . ) ( . ) ( .
+ −
+ − + − + − 0067 5 6 067 5 6 067 6 6 067
4 6 06
2 2 2 2) ( . ) ( . ) ( . )
( .
+ − + − + −
+ − 77 2 6 067 3 6 067 2 6 067 1 6 0672 2 2 2) ( . ) ( . ) ( . ) ( . )+ − + − + − + − 22 22 6 067
185 867
+ −=
( . )
.
y
SSx= 10(8.3−6.067)2+10(6.2−6.067)2+10(3.7−6.067)2
=106.067
SSerror
= (10−8.3)2+(9−8.3)2+(10−8.3)2+(8−8.3)2+(9−8.3)2+(8−8.3)2
+(9 – 8.3)2+(7−8.3)2+(7−8.3)2+(6−8.3)2+(8−8.3)2+(8 – 8.3)2
+(7 – 8.3)2+(9−8.3)2+(6−8.3)2+(4−8.3)2+(5−8.3)2+(5 – 8.3)2
+(6 – 8.3)2+(4−8.3)2+(5−8.3)2+(7−8.3)2+(6−8.3)2+(4 – 8.3)2
+(5 – 8.3)2 + (2−8.3)2+(3−8.3)2+(2−8.3)2+(1−8.3)2+(2 – 8.3)2
= 79.80
SS
It can be verified that
= + errorSS SS SSxy
as follows:
185.867=106.067+79.80
Table 21.3
Level of dealership promotion
Dealership number High Medium Low
Normalised sales
1 10 8 5
2 9 8 7
3 10 7 6
4 8 9 4
5 9 6 5
6 8 4 2
7 9 5 3
8 7 5 2
9 7 6 1
10 6 4 2
Column totals 83 62 37
Category means: Y 83
108.3=
62
106.2=
37
103.7=
Grand means:
= =83+62+37
306.067Y
Effect of dealership promotion on sales of new cars

612 Marketing Research
The strength of the effects of X on Y are measured as follows:
2=
=
=
106.067185.8970.571
hSS
SSx
y
In other words, 57.1% of the variation in sales (Y) is accounted for by dealership promotion (X), indicating a modest effect. The null hypothesis may now be tested:
( )−
=−−
=
=−
/( )
/( )
/(
1
106.067 3 179.8 30 3
17.944
)/
=
SSSS
Ferror
x c MSx
MSerrorcN
For 2 and 27 degrees of freedom, the critical value of F is 3.35 for a = 0.05. Because the calculated value of F is greater than the critical value, we reject the null hypothesis. We con-clude that the population means for the three levels of dealership promotion are indeed dif-ferent. The relative magnitudes of the means for the three categories indicate that a high level of dealership promotion leads to significantly higher sales of new car sales.
We now illustrate the ANOVA procedure using a computer program. The results of con-ducting the same analysis by computer are presented in Table 21.4.
The value of SSx denoted by main effects is 106.067 with 2 df; that of SSerror (within-group sums of squares) is 79.80 with 27 df. Therefore, MSx = 106.067/2 = 53.033 and MSerror = 79.80/27 = 2.956. The value of F = 53.033/2.956 = 17.944 with 2 and 27 df, resulting in a probability of 0.000. Since the associated probability is less than the significance level of 0.05, the null hypothesis of equal population means is rejected. Alternatively, the critical value of F for 2 and 27 df is 3.35. Since the calculated value of F (17.944) is larger than the critical value, the null hypothesis is rejected. As can be seen from Table 21.4, the sample means with values of 8.3, 6.2 and 3.7 are quite different. Dealerships with a high level of pro-motions have the highest average sales (8.3) and dealerships with a low level of promotions
Table 21.4
Source of variation Sum of squares df Mean square F ratio F probability
Between groups (dealership promotion)
106.067 2 53.033 17.944 0.000
Within groups (error) 79.800 27 2.956
Total 185.867 29 6.409
Cell means
Level of dealership promotion Count Mean
High (1) 10 8.300
Medium (2) 10 6.200
Low (3) 10 3.700
Total 30 6.067
One-way ANOVA: effect of dealership promotion on the sale of new cars

613Chapter 21 Analysis of variance and covariance
have the lowest average sales (3.7). Dealerships with a medium level of promotions have an intermediate level of sales (6.2). These findings seem plausible.
Assumptions in ANOVA
The procedure for conducting one-way ANOVA and the illustrative applications help us understand the assumptions involved. The salient assumptions in ANOVA can be summa-rised as follows:
1 Ordinarily, the categories of the independent variable are assumed to be fixed. Inferences are made only to the specific categories considered. This is referred to as the fixed-effects model. Other models are also available. In the random-effects model, the categories or treatments are considered to be random samples from a universe of treatments. Inferences are made to other categories not examined in the analysis. A mixed-effects model results if some treatments are considered fixed and others random.6
2 The error term is normally distributed, with a zero mean and a constant variance. The error is not related to any of the categories of X. Modest departures from these assump-tions do not seriously affect the validity of the analysis. Furthermore, the data can be transformed to satisfy the assumption of normality or equal variances.
3 The error terms are uncorrelated. If the error terms are correlated (i.e. the observations are not independent), the F ratio can be seriously distorted.
In many data analysis situations, these assumptions are reasonably met. ANOVA is there-fore a common procedure, as illustrated in the following example.
Real research Viewing ethical perceptions from different lenses7
A survey was conducted to examine differences in perceptions of ethical issues. The data were obtained from 31 managers, 21 faculty, 97 undergraduate business students and 48 MBA students. As part of the survey, participants were required to rate five ethical items on a scale of 1 = Strongly agree to 5 = Strongly disagree, with 3 representing a neutral response. The means for each group are shown. One-way analysis of variance was conducted to examine the significance of differences between groups for each sur-vey item, and the F and p values obtained are shown.
Item no. Survey item Managers Faculty
MBA students
Undergrad students F value p value
1 Students caught cheating should receive an F
3.7 3.8 3.8 4.0 0.94 0.42
2 Plagiarism should be reported
4.1 3.4 3.8 3.5 2.2 0.09
3 Student grades should be raised to get employer pay for course
1.6 1.7 2.7 2.8 18.3 0.00
4 Use of school printers for personal printing should be stopped
4.5 3.4 3.5 3.2 11.0 0.00
5 Coursework should be simplified to accommo-date weaker students
1.7 1.8 2.4 2.8 13.4 0.00

614 Marketing Research
The findings indicating significant differences on three of the five ethics items point to the need for more communication among the four groups so as to better align percep-tions of ethical issues in management education.
n-way ANOVA
In marketing research, one is often concerned with the effect of more than one factor simul-taneously.8 For example:
• How do consumers’ intentions to buy a brand vary with different levels of price and dif-ferent levels of distribution?
• How do advertising levels (high, medium and low) interact with price levels (high, medium and low) to influence a brand’s sale?
• Do income levels (high, medium and low) and age (younger than 35, 35–55, older than 55) affect consumption of a brand?
• What is the effect of consumers’ familiarity with a bank (high, medium and low) and bank image (positive, neutral and negative) on preference for taking a loan out with that bank?
In determining such effects, n-way ANOVA can be used. A major advantage of n-way ANOVA is that it enables the researcher to examine interactions between the factors. Inter-actions occur when the effects of one factor on the dependent variable depend on the level (category) of the other factors. The procedure for conducting n-way ANOVA is similar to that for one-way ANOVA. The statistics associated with n-way ANOVA are also defined similarly. Consider the simple case of two factors, X1 and X2, having categories c1 and c2. The total variation in this case is partitioned as follows:
= + +due to due to due to interaction of1 and1 +SS SS X SS X 2 SStotal X X 2 SSwithin
or
= + + +ySS SSx xSS SS errorSSxx
A larger effect of X1 will be reflected in a greater mean difference in the levels of X1 and a larger SSx1. The same is true for the effect of X2. The larger the interaction between X1 and X2, the larger SSx1x2 will be. On the other hand, if X1 and X2 are independent, the value of SSx1x2 will be close to zero.9
The strength of the joint effect of two factors, called the overall effect, or multiple H2, is
Multiple 2= + +( ) /h x x x x ySS SS SS SS
The significance of the overall effect may be tested by an F test, as follows:
=+ +
=
( ) /
/
, , /
/
, ,=
SS
SS
SS
SS
SS
SSx x x x d fn
error d fd
x x x x d fn
error
error
d fd
MSx x x x
MS
F
InteractionWhen assessing the relationship between two variables, an interaction occurs if the effect of X1 depends on the level of X2, and vice versa.
Multiple H2
The strength of the joint effect of two (or more) factors, or the overall effect.
Significance of the overall effectA test that some differences exist between some of the treatment groups.

615Chapter 21 Analysis of variance and covariance
where dfn = degrees of freedom for the numerator = (c1 – 1) + (c2 – 1) + (c1 – 1) (c2 – 1) = c1c2 – 1 dfd = degrees of freedom for the denominator = N – c1c2 MS = mean square.If the overall effect is significant, the next step is to examine the significance of the interaction effect. Under the null hypothesis of no interaction, the appropriate F test is:
=
=
/
/
SS
SS
df nx
error
error
d fd
MSx x
MS
F x
where dfn = (c
1 – 1) (c
2 – 1)
dfd = N – c
1c
2
If the interaction effect is found to be significant, then the effect of X1 depends on the level of X2, and vice versa. Since the effect of one factor is not uniform but varies with the level of the other factor, it is not generally meaningful to test the significance of the main effect of each factor. However, it is meaningful to test the significance of each main effect of each factor, if the interaction effect is not significant.10
The significance of the main effect of each factor may be tested as follows for X1:
=
=
/
/
SS
SSx dfn
error df d
MSx
MSerror
F
where dfn = c
1 – 1
dfd = N – c
1c
2
The foregoing analysis assumes that the design was orthogonal, or balanced (the number of cases in each cell was the same). If the cell size varies, the analysis becomes more complex.
Illustrative example of N-way ANOVA
Returning to the data in Table 21.2, let us now examine the effect of the level of dealership promotion and direct mail efforts on the sales of new cars. The results of running a 3 × 2 ANOVA on the computer are presented in Table 21.5.
For the main effect of level of promotion, the sum of squares SSxp, degrees of freedom and mean square MSxp are the same as determined earlier in Table 21.4. The sum of squares for direct mail is SSxd = 53.333 with 1 df, resulting in an identical value for the mean square MSxd. The combined main effect is determined by adding the sum of squares due to the two main effects (SSxp + SSxd = 106.067 + 53.333 = 159.400), as well as adding the degrees of freedom (2 + 1 = 3). For the promotions and direct mail interaction effect, the sum of squares is SSxpxd = 3.267 with (3 – 1) × (2 – 1) = 2 df, resulting in MSxpxd = 3.267/2 = 1.633. For the overall (model) effect, the sum of squares is the sum of squares for promotions main effect, direct mail main effect and interaction effect = 106.067 + 53.333 + 3.267 = 162.667 with 2 + 1 + 2 = 5 df, resulting in a mean square of 162.667/5 = 32.533. Note, however, that the error statistics are now different from those in Table 21.4. This is due to the fact that we now have two factors instead of one, SSerror = 23.2 with [30 – (3 × 2)] or 24 df resulting in MSerror = 23.2/24 = 0.967.
Significance of the interaction effectA test of the significance of the interaction between two or more independent variables.
Significance of the main effect of each factorA test of the significance of the main effect for each individual factor.

616 Marketing Research
Table 21.5
Source of variation Sum of squares df Mean squares F Sig. of F v2
Main effects
Dealer promotions 106.067 2 53.033 54.843 0.000 0.557Direct mail 53.333 1 53.333 55.153 0.000 0.280Combined 159.400 3 53.133 54.966 0.000Two-way interaction 3.267 2 1.633 1.690 0.206Model 162.667 5 32.533 33.643 0.000Residual (error) 23.200 24 0.967Total 185.867 29 6.409
Cell means
Dealership promotions Direct mail Count Mean
High Yes 5 9.200High No 5 7.400Medium Yes 5 7.600Medium No 5 4.800Low Yes 5 5.400Low No 5 2.000
Factor-level means
Dealership promotions Direct mail Count Mean
High 10 8.300Medium 10 6.200Low 10 3.700
Yes 15 7.400No 15 4.733
Grand mean 30 6.067
Two-way ANOVA
The test statistic for the significance of the overall effect is:
=
=
32 5330 967
33 643
...
F
with 5 and 24 degrees of freedom, which is significant at the 0.05 level.The test statistic for the significance of the interaction effect is:
=
=
1 6330 9671 69
.
..
F
with 2 and 24 degrees of freedom, which is not significant at the 0.05 level.

617Chapter 21 Analysis of variance and covariance
As the interaction effect is not significant, the significance of the main effects can be evaluated. The test statistic for the significance of the main effect of promotion is:
=
=
53 0330 967
54 843
...
F
with 2 and 24 degrees of freedom, which is significant at the 0.05 level.The test statistic for the significance of the main effect of direct mail is:
=
=
53 3330 967
55 153
...
F
with 1 and 24 degrees of freedom, which is significant at the 0.05 level. Thus, higher levels of promotions result in higher sales. The use of a direct mail campaign results in higher sales. The effect of each is independent of the other.
The following example illustrates the use of n-way analysis.
Real research Country affects TV reception11
A study examined the impact of country affil-iation on the credibility of product-attribute claims for TVs. The dependent variables were the following product-attribute claims: good sound, reliability, crisp-clear picture and styl-ish design. The independent variables that were manipulated consisted of price, country affiliation and store distribution. A 2 × 2 × 2 between-subjects design was used. Two lev-els of price, ‘low’ and ‘high’, two levels of country affiliation, South Korea and Germany, and two levels of store distribution, Kaufhof
and without Kaufhof, were specified.Data were collected from two shopping centres in a large German city. Thirty partici-
pants were randomly assigned to each of the eight treatment cells for a total of 240 subjects. Table 1 presents the results for manipulations that had significant effects on each of the dependent variables.
The directions of country-by-distribution interaction effects for the three dependent variables are shown in Table 2. Although the credibility ratings for the crisp-clear picture, reliability and stylish design claims are improved by distributing the Korean-made TV set through Kaufhof rather than some other distributor, the same is not true of a German-made set. Similarly, the directions of country-by-price interaction effects for the two dependent variables are shown in Table 3. At the ‘high’ price level, the credibility ratings for the ‘good sound’ and ‘reliability’ claims are higher for the German-made TV set than for its Korean counterpart, but there is little difference related to country affiliation when the product is at the ‘low’ price.

618 Marketing Research
Table 1 Analyses for significant manipulations
Univariate
Effect Dependent variable F df p
Country × price Good sound 7.57 1.232 0.006
Country × price Reliability 6.57 1.232 0.011
Country × distribution Crisp-clear picture 6.17 1.232 0.014
Country × distribution Reliability 6.57 1.232 0.011
Country × distribution Stylish design 10.31 1.232 0.002
Table 2 Country-by-distribution interaction means
Country × distribution Crisp-clear picture Reliability Stylish design
South Korea
Kaufhof 3.67 3.42 3.82
Without Kaufhof 3.18 2.88 3.15
Germany
Kaufhof 3.60 3.47 3.53
Without Kaufhof 3.77 3.65 3.75
Table 3 Country-by-price interaction means
Country × price Good sound Reliability
Low price
Kaufhof 3.75 3.40
Without Kaufhof 3.53 3.45
High price
Kaufhof 3.15 2.90
Without Kaufhof 3.73 3.67
This study demonstrates that credibility of attribute claims, for products traditionally exported to Germany by a company in a relatively newly industrialised country, can be significantly improved if the same company distributes the product through a prestig-ious German retailer and considers making manufacturing investments in Europe. Spe-cifically, three product-attribute claims (crisp-clear picture, reliability and stylish design) are perceived as more credible when the TVs are made in South Korea if they are also distributed through a prestigious German retailer. Also, the ‘good sound’ and ‘reliability’ claims for TVs are perceived to be more credible for a German-made set sold at a higher price, possibly offsetting the potential disadvantage of higher manufacturing costs in Europe.

619Chapter 21 Analysis of variance and covariance
Analysis of covariance (ANCOVA)
When examining the differences in the mean values of the dependent variable related to the effect of the controlled independent variables, it is often necessary to take into account the influence of uncontrolled independent variables. For example:
• In determining how consumers’ intentions to buy a brand vary with different levels of price, attitude towards the brand may have to be taken into consideration.
• In determining how different groups exposed to different advertisements evaluate a brand, it may be necessary to control for prior knowledge.
• In determining how different price levels will affect a household’s breakfast cereal con-sumption, it may be essential to take household size into account.
In such cases, ANCOVA should be used. ANCOVA includes at least one categorical inde-pendent variable and at least one interval or metric-independent variable. The categorical inde-pendent variable is called a factor, whereas the metric-independent variable is called a covariate. The most common use of the covariate is to remove extraneous variation from the dependent variable, because the effects of the factors are of major concern. The variation in the dependent variable due to the covariates is removed by an adjustment of the dependent variable’s mean value within each treatment condition. An ANOVA is then performed on the adjusted scores.12 The significance of the combined effect of the covariates, as well as the effect of each covariate, is tested by using the appropriate F tests. The coefficients for the covariates provide insights into the effect that the covariates exert on the dependent variable. ANCOVA is most useful when the covariate is linearly related to the dependent variable and is not related to the factors.13
Illustrative application of covariance
We again use the data of Table 21.2 to illustrate ANCOVA. Suppose that we wanted to determine the effect of dealership promotion and direct mail on sales while controlling for the affluence of clientele. It is felt that the affluence of the clientele may also have an effect on the sales of new cars. The dependent variable consists of new car sales. As before, promo-tion has three levels and direct mail has two. Clientele affluence is measured on an interval scale and serves as the covariate. The results are shown in Table 21.6.
Table 21.6
Source of variation Sum of squares df Mean square F Sig. of F
Covariates
Clientele 0.838 1 0.838 0.862 0.363
Main effects
Promotions 106.067 2 53.033 54.546 0.000Direct mail 53.333 1 53.333 54.855 0.000Combined 159.400 3 53.133 54.649 0.000
Two-way interaction
Promotions × Direct mail 3.267 2 1.633 1.680 0.208Model 163.505 6 27.251 28.028 0.000Residual (error) 22.362 23 0.972Total 185.867 29 6.409Covariate Raw coefficient
Clientele –0.078
ANCOVA

620 Marketing Research
Issues in interpretation
Important issues involved in the interpretation of ANOVA results include interactions, rela-tive importance of factors and multiple comparisons.
Interactions
The different interactions that can arise when conducting ANOVA on two or more factors are shown in Figure 21.3. One outcome is that ANOVA may indicate that there are no inter-actions (the interaction effects are not found to be significant). The other possibility is that the interaction is significant. An interaction effect occurs when the effect of an independent variable on a dependent variable is different for different categories or levels of another inde-pendent variable. The interaction may be ordinal or disordinal. In ordinal interaction, the rank order of the effects related to one factor does not change across the levels of the second factor. Disordinal interaction, on the other hand, involves a change in the rank order of the effects of one factor across the levels of another. If the interaction is disordinal, it could be of a non-crossover or crossover type.14 These interaction cases are displayed in Figure 21.4, which assumes that there are two factors, X1 with three levels (X11, X12 and X13) and X2 with two levels (X21 and X22). Case 1 depicts no interaction.
The effects of X1 on Y are parallel over the two levels of X2. Although there is some depar-ture from parallelism, this is not beyond what might be expected from chance. Parallelism implies that the net effect of X22 over X21 is the same across the three levels of X1. In the absence of interaction, the joint effect of X1 and X2 is simply the sum of their individual main effects.
Ordinal interactionAn interaction where the rank order of the effects attributable to one factor does not change across the levels of the second factor.
Disordinal interactionThe change in the rank order of the effects of one factor across the levels of another.
Figure 21.3
A classification of interaction effects
Possibleinteraction e�ects
No interaction(case 1)
Interaction
Ordinal(case 2)
Disordinal
Non-crossover(case 3)
Crossover(case 4)
As can be seen, the sum of squares attributable to the covariate is very small (0.838), with 1 df resulting in an identical value for the mean square. The associated F value is 0.838/0.972 = 0.862, with 1 and 23 df, which is not significant at the 0.05 level. Thus, the conclusion is that the affluence of the clientele does not have an effect on the sales of new Mercedes cars (which may be a tough conclusion to draw, demanding further investigation). If the effect of the covar-iate is significant, the sign of the raw coefficient can be used to interpret the direction of the effect on the dependent variable.

621Chapter 21 Analysis of variance and covariance
Case 2 depicts an ordinal interaction. The line segments depicting the effects of X1 and X2 are not parallel. The difference between X22 and X21 increases as we move from X11 to X12 and from X12 to X13, but the rank order of the effects of X1 is the same over the two levels of X2. This rank order, in ascending order, is X11, X12, X13, and it remains the same for X21 and X22 .
Disordinal interaction of a non-crossover type is displayed by case 3. The lowest effect of X1 at level X21 occurs at X11, and the rank order of effects is X11, X12, X13. At level X22, however, the lowest effect of X1 occurs at X12, and the rank order is changed to X12, X11, X13. Because it involves a change in rank order, disordinal interaction is stronger than ordinal interaction.
In disordinal interactions of a crossover type, the line segments cross each other, as shown by case 4 in Figure 21.4. In this case, the relative effect of the levels of one factor changes with the levels of the other. Note that X22 has a greater effect than X21 when the levels of X1 are X11 and X12. When the level of X1 is X13, the situation is reversed, and X21 has a greater effect than X22 . (Note that in cases 1, 2 and 3, X22 had a greater impact than X21 across all three levels of X1.) Hence, disordinal interactions of a crossover type represent the strongest interactions.15
Relative importance of factors
Experimental designs are usually balanced, in that each cell contains the same number of participants. This results in an orthogonal design in which the factors are uncorrelated. Hence, it is possible to determine unambiguously the relative importance of each factor in explaining the variation in the dependent variable. The most commonly used measure in ANOVA is omega squared (V2). This measure indicates what proportion of the variation in the dependent variable is related to a particular independent variable or factor. The rela-tive contribution of a factor, X, is calculated as follows:16
2=− ×
+( )
vx
SS
SSx xdf MSerror
errortotal MS
Note that the estimated value of v2 can be negative, in which case the estimated value of v2 is set equal to zero. Normally, v2 is interpreted only for statistically significant
Omega squared (V2)A measure indicating the proportion of the variation in the dependent variable that is related to a particular independent variable or factor.
Figure 21.4
Patterns of interaction
Case 1:No interaction
Y
Case 2:Ordinal interaction
Y
Case 4:Disordinal interaction:
crossover
Y
Case 3:Disordinal interaction:
non-crossover
Y
X21
X22
X21
X22
X21
X22
X21
X22
X11 X12 X13 X11 X12 X13
X11 X12 X13 X11 X12 X13

622 Marketing Research
effects.17 In Table 21.4, v2 associated with level of dealership promotions is calculated as follows:
2 106067 2 0 967185867 0 967
1041331868
=− ×
+
=
. ( . ). .
.
. 3340 557= .
vp
In Table 21.5 note that:
=185867
= + + +106067 53 333 3 267 23 2. . . .
.totalSS
Likewise, the v2 associated with direct mail is:
2 53 333 1 0 967185867 0 967
52 366186834
=− ×
+
=
=
. ( . ). .
..
00 280.
v
As a guide to interpreting v2, a large experimental effect produces an v2 of 0.15 or greater, a medium effect produces an index of around 0.06 and a small effect produces an index of 0.01.18 In Table 21.5, while the effects of promotions and direct mail are both large, the effect of promotions is much larger. Therefore, dealership promotions will be more effective in increasing sales than direct mail.
Multiple comparisons
The ANOVA F test examines only the overall difference in means. If the null hypothesis of equal means is rejected, we can only conclude that not all the group means are equal. Only some of the means may be statistically different, however, and we may wish to examine differences among specific means. This can be done by specifying appropriate contrasts, or comparisons used to determine which of the means are statistically different. Contrasts may be a priori or a posteriori. A priori contrasts are determined before conducting the analysis, based on the researcher’s theoretical framework. Generally, a priori contrasts are used in lieu of the ANOVA F test. The contrasts selected are orthogonal (they are independent in a statistical sense).
A posteriori contrasts are made after the analysis. These are generally multiple com-parison tests. They enable the researcher to construct generalised confidence intervals that can be used to make pairwise comparisons of all treatment means. These tests, listed in order of decreasing power, include least significant difference, Duncan’s multiple range test, Stu-dent–Newman–Keuls, Tukey’s alternate procedure, honestly significant difference, modi-fied least significant difference and Scheffé’s tests. Of these tests, least significant difference is the most powerful and Scheffé’s the most conservative. For further discussion on a priori and a posteriori contrasts, refer to the literature.19
Our discussion so far has assumed that each subject is exposed to only one treatment or experimental condition. Sometimes subjects are exposed to more than one experimental con-dition, in which case repeated measures ANOVA should be used.
ContrastsIn ANOVA, a method of examining differences among two or more means of the treatment groups.
A priori contrastsContrasts determined before conducting the analysis, based on the researcher’s theoretical framework.
A posteriori contrastsContrasts made after conducting the analysis. These are generally multiple comparison tests.
Multiple comparison testsA posteriori contrasts that enable the researcher to construct generalised confidence intervals that can be used to make pairwise comparisons of all treatment means.
Repeated measures ANOVA
In marketing research, there are often large differences in the background and individual characteristics of participants. If this source of variability can be separated from treatment effects (effects of the independent variable) and experimental error, then the sensitivity of the experiment can be enhanced. One way of controlling the differences between subjects is

623Chapter 21 Analysis of variance and covariance
by observing each subject under each experimental condition (see Table 21.7). In this sense, each subject serves as its own control. For example, in a survey attempting to determine dif-ferences in evaluations of various airlines, each participant evaluates all the major competing airlines. Because repeated measurements are obtained from each participant, this design is referred to as within-subjects design or repeated measures ANOVA. This differs from the assumption we made in our earlier discussion that each participant is exposed to only one treatment condition, also referred to as between-subjects design.20 Repeated measures ANOVA may be thought of as an extension of the paired samples t test to the case of more than two related samples.
Repeated measures ANOVAAn ANOVA technique used when participants are exposed to more than one treatment condition and repeated measurements are obtained.
Table 21.7 Decomposition of the total variation: repeated measures ANOVA
Independent variable X
Subject no.
Categories Total sample
Between-people variation = SSbetween people
1 X1 X2 X3 … Xc
Total variation = SSy
2 Y11 Y12 Y13 … Y1c Y1
Y21 Y22 Y23 … Y2c Y2
… …
…
n Yn1 Yn2 Yn3 … Ync Yn
Category mean—Y1
—Y2—Y3 …
—Yc—Y
Within-people variation = SSwithin people
{ {{In the case of a single factor with repeated measures, the total variation, with n(c – 1)
degrees of freedom, may be split into between-people variation and within-people variation:
= +total SSwithin peoplebetween peopleSSSS
The between-people variation, which is related to the differences between the means of people, has n – 1 degrees of freedom. The within-people variation has n(c – 1) degrees of freedom. The within-people variation may, in turn, be divided into two different sources of variation. One source is related to the differences between treatment means, and the second consists of residual or error variation. The degrees of freedom corresponding to the treatment variation are c – 1 and those corresponding to residual variation are (c – 1)(n – 1). Thus:
= +SSwithin people errorSS SSx
A test of the null hypothesis of equal means may now be constructed in the usual way:
=−
− −
=
/( )
/( )( )
1
1 1F
SSerror
xSS cn c
MSx
MSerror
So far we have assumed that the dependent variable is measured on an interval or ratio scale. If the dependent variable is non-metric, however, a different procedure should be used.

624 Marketing Research
Non-metric ANOVA
Non-metric ANOVA examines the difference in the central tendencies of more than two groups when the dependent variable is measured on an ordinal scale. One such procedure is the k-sample median test. As its name implies, this is an extension of the median test for two groups (which was considered in Chapter 20). The null hypothesis is that the medians of the k populations are equal. The test involves the computation of a common median over the k samples. Then, a 2 × k table of cell counts based on cases above or below the common median is generated. A chi-square statistic is computed. The significance of the chi-square implies a rejection of the null hypothesis.
A more powerful test is the Kruskal–Wallis one-way ANOVA. This is an extension of the Mann–Whitney test (Chapter 20). This test also examines the difference in medians. The null hypothesis is the same as in the k-sample median test, but the testing procedure is differ-ent. All cases from the k groups are ordered in a single ranking. If the k populations are the same, the groups should be similar in terms of ranks within each group. The rank sum is calculated for each group. From these, the Kruskal–Wallis H statistic, which has a chi-square distribution, is computed.
The Kruskal–Wallis test is more powerful than the k-sample median test because it uses the rank value of each case, not merely its location relative to the median. If there are a large number of tied rankings in the data, however, the k-sample median test may be a better choice.
Non-metric ANOVA is not popular in marketing research. Another procedure that is also only rarely used is multivariate ANOVA.
Non-metric ANOVAAn ANOVA technique for examining the difference in the central tendencies of more than two groups when the dependent variable is measured on an ordinal scale.
k-sample median testA non-parametric test used to examine differences among more than two groups when the dependent variable is measured on an ordinal scale.
Kruskal–Wallis one-way ANOVAA non-metric ANOVA test that uses the rank value of each case, not merely its location relative to the median.
Real research The commonality of unethical research practices worldwide22
A study examined marketing professionals’ perceptions of how common unethical practices in marketing research were across different countries, i.e. ‘the commonality of unethical mar-keting research practices’. A sample of marketing professionals was drawn from Australia, the UK, Canada and the USA. Participants’ evaluations were analysed using MANOVA and ANOVA techniques. The predictor variable was the ‘country of participant’ and 15 evaluations of
Multivariate ANOVA
Multivariate analysis of variance (MANOVA) is similar to ANOVA except that instead of one metric-dependent variable we have two or more. The objective is the same, since MANOVA is also concerned with examining differences between groups. Although ANOVA examines group differences on a single dependent variable, MANOVA examines group dif-ferences across multiple dependent variables simultaneously. In ANOVA, the null hypothe-sis is that the means of the dependent variables are equal across the groups. In MANOVA, the null hypothesis is that the vector of the means of multiple dependent variables is equal across groups. MANOVA is appropriate when there are two or more dependent variables that are correlated. If there are multiple dependent variables that are uncorrelated or orthogo-nal, ANOVA on each of the dependent variables is more appropriate than MANOVA.21
As an example, suppose that four groups, each consisting of 100 randomly selected individu-als, were exposed to four different advertisements about the ‘B Class’ Mercedes. After seeing the advertisement, each individual provided ratings on preference for the ‘B Class’, preference for Mercedes and preference for the advertisement itself. Because these three preference variables are correlated, MANOVA should be conducted to determine which advertisement is the most effec-tive (produced the highest preference across the three preference variables). The following exam-ple illustrates the application of ANOVA and MANOVA in international marketing research.
Multivariate analysis of variance (MANOVA)An ANOVA technique using two or more metric dependent variables.

625Chapter 21 Analysis of variance and covariance
Real research ‘MAN’OVA demonstrates that man is different from woman23
In order to investigate differences between research ethics judgements in men and women, the statistical techniques of MANOVA and ANOVA were used. Participants were asked to indicate their degree of approval with regard to a series of scenarios involving decisions of an ethical nature. These evaluations served as the dependent variable in the analysis, and participant gender as the independent variable. MANOVA was used for multivariate analysis and its resultant F value was significant at the p < 0.001 level, indi-cating that there was an ‘overall’ difference between males and females in research eth-ics judgements. Univariate analysis was conducted via ANOVA, and F values indicated that three items were the greatest contributors to the overall gender difference in ethical evaluations: the use of ultraviolet ink to pre-code a mail questionnaire; the use of an advertisement that encourages consumer misuse of a product; and unwillingness of a researcher to offer data help to an inner-city advisory group. Another recent study examined how ethical beliefs were related to age and gender of business professionals. The results of this particular study indicated that, overall, younger business professionals exhibited a lower standard of ethical beliefs. In the younger age group, females demon-strated a higher level of ethical beliefs to males. However, in the older age group, results showed that males had a slightly higher level of ethical beliefs. Thus, companies should emphasise ethical values and training to the younger professionals, especially men.
Practise data analysis with SPSS
SPSS Windows and Mac
One-way ANOVA can be efficiently performed using the program COMPARE MEANS and then ONE-WAY ANOVA. To select this procedure click:
Analyze>Compare Means>One-Way ANOVA . . .
The following are the detailed steps for running a one-way ANOVA on the data of Table 21.2. The null hypothesis is that there is no difference in mean normalised sales for the three levels of dealership promotion:
1 Select ANALYZE from the SPSS menu bar.2 Click COMPARE MEANS and then ONE-WAY ANOVA.3 Move ‘Sales [sales]’ into the DEPENDENT LIST box.4 Move ‘Dealership Promotion [promotion]’ to the FACTOR box.5 Click OPTIONS.6 Click Descriptive.7 Click CONTINUE.8 Click OK.
‘ commonality’ served as the criterion variables. The F values from the ANOVA analyses indi-cated that only 2 of the 15 commonality evaluations achieved significance (p < 0.05 or better). Further, the MANOVA F value was not statistically significant, implying the lack of overall dif-ferences in commonality evaluations across participants of the four countries. It was con-cluded that marketing professionals in the four countries demonstrated similar perceptions of the commonality of unethical research practices. This finding was not surprising, given other research evidence that organisations in the four countries reflect similar corporate cultures.

626 Marketing Research
Summary In ANOVA and ANCOVA, the dependent variable is metric and the independent variables are all categorical and metric variables. One-way ANOVA involves a single independent categorical variable. Interest lies in testing the null hypothesis that the category means are equal in the population. The total variation in the dependent variable may be decomposed into two components: variation related to the independent variable and variation related to error. The variation is measured in terms of the sum of squares corrected for the mean (SS). The mean square is obtained by dividing the SS by the corresponding degrees of freedom (df). The null hypothesis of equal means is tested by an F statistic, which is the ratio of the mean square related to the independent variable to the mean square related to error.
N-way analysis of variance involves the simultaneous examination of two or more categorical independent variables. A major advantage is that the interactions between the independent variables can be examined. The significance of the overall effect, interaction terms and the main effects of individual factors are examined by appropri-ate F tests. It is meaningful to the significance of main effects only if the correspond-ing interaction terms are not significant.
ANCOVA includes at least one categorical independent variable and at least one interval or metric-independent variable. The metric-independent variable, or covari-ate, is commonly used to remove extraneous variation from the dependent variable.
When ANOVA is conducted on two or more factors, interactions can arise. An inter-action occurs when the effect of an independent variable on a dependent variable is different for different categories or levels of another independent variable. If the inter-action is significant, it may be ordinal or disordinal. Disordinal interaction may be of a non-crossover or crossover type. In balanced designs, the relative importance of factors in explaining the variation in the dependent variable is measured by omega squared (v2). Multiple comparisons in the form of a priori or a posteriori contrasts can be used for examining differences among specific means.
N-way ANOVA, analysis of covariance, MANOVA and repeated measures ANOVA can be performed using GENERAL LINEAR MODEL. To select this procedure, click:
Analyze>General Linear Model>Univariate. . .Analyze>General Linear Model>Multivariate. . .Analyze>General Linear Model>Repeated Measures. . .
We show the detailed steps for performing the analysis of covariance given in Table 21.6:
1 Select ANALYZE from the SPSS menu bar.2 Click GENERAL LINEAR MODEL and then UNIVARIATE.3 Move ‘Sales [sales]’ into the DEPENDENT LIST box.4 Move ‘Dealership Promotion [promotion]’ to the FIXED FACTOR(S) box. Then move
‘Direct Mail [coupon]’ to the FIXED FACTOR(S) box.5 Move ‘Clientele [clientel]’ to the COVARIATE(S) box.6 Click OK.
For non-metric ANOVA, including k-sample median test and Kruskal–Wallis one-way ANOVA, the program NONPARAMETRIC TESTS should be used:
Analyze>Nonparametric Tests>K Independent Samples . . .Analyze>Nonparametric Tests>K Related Samples . . .
The detailed steps for the other procedures are similar to those shown.

627Chapter 21 Analysis of variance and covariance
In repeated measures analysis of variance, observations on each subject are obtained under each treatment condition. This design is useful for controlling for the differ-ences in subjects that exist prior to the experiment. Non-metric analysis of variance involves examining the differences in the central tendencies of two or more groups when the dependent variable is measured on an ordinal scale. Multivariate analysis of variance (MANOVA) involves two or more metric-dependent variables.
Questions 1 Discuss the similarities and differences between analysis of variance and analysis of covariance.
2 What is the relationship between analysis of variance and the t test?
3 What is total variation? How is it decomposed in a one-way analysis of variance?
4 What is the null hypothesis in one-way ANOVA? What basic statistic is used to test the null hypothesis in one-way ANOVA? How is this statistic computed?
5 How does n-way analysis of variance differ from the one-way procedure?
6 How is the total variation decomposed in n-way analysis of variance?
7 What is the most common use of the covariate in ANCOVA?
8 What is the difference between ordinal and disordinal interaction?
9 How is the relative importance of factors measured in a balanced design?
10 What is an a priori contrast?
11 What is the most powerful test for making a posteriori contrasts? Which test is the most conservative?
12 What is meant by repeated measures ANOVA? Describe the decomposition of variation in repeated measures ANOVA.
13 What are the differences between metric and non-metric analyses of variance?
14 Describe two tests used for examining differences in central tendencies in non-metric ANOVA.
15 What is multivariate analysis of variance? When is it appropriate?
Exercises 1 A researcher wants to test the hypothesis that there is no difference in the importance attached to shopping by consumers living in Belgium, France, Germany and the Netherlands. A study is conducted and analysis of variance is used to analyse the data. The results obtained are presented in the following table:
Source df Sum of squares Mean squares F ratio F probability
Between groups 3 70.212 23.404 1.12 0.3
Within groups 996 20,812.416 20.896
a Is there sufficient evidence to reject the null hypothesis?
b What conclusion can be drawn from the table?
c If the average importance was computed for each group, would you expect the sample means to be similar or different?
d What was the total sample size in this study?

628 Marketing Research
2 In a pilot study examining the effectiveness of three advertisements (A, B and C), 10 consumers were assigned to view each advertisement and rate it on a nine-point Likert scale. The data obtained from the 30 participants are shown in the following table:
Advertisement A Advertisement B Advertisement C
4 7 8
5 4 7
3 6 7
4 5 6
3 4 8
4 6 7
4 5 8
3 5 8
5 4 5
5 4 6
a Calculate the category means and the grand mean.
b Calculate SSy into SSx and SSerror.
c Calculate h2.
d Calculate the value of F.
e Are the three advertisements equally effective?
3 An experiment tested the effects of package design and shelf display on the likelihood of buying a breakfast cereal. Package design and shelf display were varied at two levels each, resulting in a 2 × 2 design. Purchase likelihood was measured on a seven-point scale. The results are partially described in the following table:
Source of variation Sum of squares df Mean square F Sig. of F v2
Package design 68.76 1
Shelf display 320.19 1
Two-way interaction 55.05 1
Residual error 176.00 40
a Complete the table by calculating the mean square, F, significance of F, and v2 values.
b How should the main effects be interpreted?
4 In an experiment designed to measure the effect of gender and frequency of travel on preference for long-haul holidays, a 2 (gender) × 3 (frequency of travel) between-subjects design was adopted. Five participants were assigned to each cell for a total sample size of 30. Preference for long-haul holidays was measured on a nine-point scale (1 = No preference, 9 = Strong preference). Gender was coded as Male = 1 and Female = 2. Frequency of travel was coded as light = 1, medium = 2 and heavy = 3. The data obtained are shown in the table:

629Chapter 21 Analysis of variance and covariance
Number Gender Travel group Preference
1 1 1 2
2 1 1 3
3 1 1 4
4 1 1 4
5 1 1 2
6 1 2 4
7 1 2 5
8 1 2 5
9 1 2 3
10 1 2 3
11 1 3 8
12 1 3 9
13 1 3 8
14 1 3 7
15 1 3 7
16 2 1 6
17 2 1 7
18 2 1 6
19 2 1 5
20 2 1 7
21 2 2 3
22 2 2 4
23 2 2 5
24 2 2 4
25 2 2 5
26 2 3 6
27 2 3 6
28 2 3 6
29 2 3 7
30 2 3 8
Using software of your choice, perform the following analysis:
a Do males and females differ in their preference for long-haul travel?
b Do the light, medium and heavy travellers differ in their preference for long-haul travel?
c Conduct a 2 × 3 analysis of variance with preference for long-haul travel as the dependent variable and gender and travel frequency as the independent variables or factors. Interpret the results.
5 In a small group discuss the following issues: ‘Which procedure is more useful in marketing research – analysis of variance or analysis of covariance?’ and ‘There are few marketing research applications where t tests are used; the complexity of marketing phenomena means that analysis of variance or analysis of covariance are much more commonplace.’

630 Marketing Research
Notes
1. Wang, Y., ‘Web-based destination marketing systems: Assessing the critical factors for management and implementation’, International Journal of Tourism Research 10 (1) (February 2008), 55; Mangaloglu, S.B.M., ‘Tourism destination images of Turkey, Egypt, Greece and Italy as perceived by US based tour operators and travel agents’, Tourism Management 22 (1) (February 2001), 1–9.
2. Weltevreden, J.W.J. and Boschma, R.A., ‘Internet strategies and performance of Dutch retailers’, Journal of Retailing and Consumer Services 15 (3) (May 2008), 163–78.
3. For applications of ANOVA, see Ahmed, S.A. and d’Astous, A., ‘Antecedents, moderators and dimensions of country of origins evaluations’, International Marketing Review 25 (1) (2008), 75; Swait, J. and Erdem, T., ‘Brand effects on choice and choice set formation under uncertainty’, Marketing Science 26 (5) (October 2007), 679–700; Sengupta, J. and Gorn, G.J., ‘Absence makes the mind grow sharper: Effects of element omission on subsequent recall’, Journal of Marketing Research 39 (2) (May 2002), 186–201.
4. Sirkin, R.M., Statistics for the Social Sciences, 3rd edn (Thousand Oaks, CA: Sage 2005); Janky, D.G., ‘Sometimes pooling for analysis of variance hypothesis tests: A review and study of a split level model’, American Statistician 54 (4) (November 2000), 269–79; Driscoll, W.C., ‘Robustness of the ANOVA and Tukey-Kramer statistical tests’, Computers and Industrial Engineering 31 (1, 2) (October 1996), 265–8.
5. The F test is a generalised form of the t test. If a random variable is t distributed with N degrees of freedom, then t 2 is F distributed with 1 and N degrees of freedom. Where there are two factor levels or treatments, ANOVA is equivalent to the two-sided t test.
6. Although computations for the fixed-effects and random-effects models are similar, interpretations of results differ. A comparison of these approaches is found in Turner, J.R. and Thayer, J., Introduction to Analysis of Variance: Design, Analysis and Interpretation (Thousand Oaks, CA: Sage, 2001); Erez, A., Bloom, M.C. and Wells, M.T., ‘Using random rather than fixed effects models in meta-analysis: Implications for situational specificity and validity generalization’, Personnel Psychology 49 (2) (Summer 1996), 275–306; Neter, J.W., Applied Linear Statistical Models, 4th edn (Burr Ridge, IL: Irwin, 1996).
7. Hall, A. and Berardino, L., ‘Teaching professional behaviours: Differences in the perceptions of faculty, students and employers’, Journal of Business Ethics 63 (2006), 407–15.
8. We consider only the full factorial designs, which incorporate all possible combinations of factor levels. For example, see Menon, G., ‘Are the parts better than the whole? The effects of decompositional questions on judgments of frequent behaviors’, Journal of Marketing Research 34 (August 1997), 335–46.
9. Pecotich, A. and Ward, S., ‘Global branding, country of origin and expertise: An experimental evaluation’, International Marketing Review 24 (3) (2007), 271; Kamins, M.A., Dreze, X. and Folkes, V.S., ‘Effects of
seller-supplied prices on buyers’ product evaluations: Reference prices in an internet auction context’, Journal of Consumer Research 30 (March 2004), 622–8; Jaccard, J., Interaction Effects in Factorial Analysis of Variance (Thousand Oaks, CA: Sage, 1997); Mayers, J.L., Fundamentals of Experimental Design, 3rd edn (Boston, MA: Allyn & Bacon, 1979).
10. Field, A., Discovering Statistics Using SPSS, 2nd edn (Thousand Oaks, CA: Sage, 2005); Nishisato, S., Measurement and Multivariate Analysis (New York: Springer-Verlag, 2002).
11. Maheswaran, D. and Chen, C.Y., ‘Nation equity: Incidental emotions in country of origin effects’, Journal of Consumer Research 33 (3) (December 2006), 370–6; Desai, K.K., ‘The effects of ingredient branding strategies on host brand extendibility’, Journal of Marketing 66 (1) (January 2002), 73–93; Peterson, R.A. and Jolibert, A.J.P., ‘A meta-analysis of country-of-origin effects’, Journal of International Business Studies 26 (4) (Fourth Quarter 1995), 883–900; Chao, P., ‘The impact of country affiliation on the credibility of product attribute claims’, Journal of Advertising Research (April–May 1989), 35–41.
12. Although this is the most common way in which analysis of covariance is performed, other situations are also possible. For example, covariate and factor effects may be of equal interest, or the set of covariates may be of major concern. For applications, see Sharot, T., ‘The design and precision of data-fusion studies’, International Journal of Market Research 49 (4) (2007), 449–70; Bolton, L.E. and Reed, A., ‘Sticky priors: The perseverance of identity effects on judgment’, Journal of Marketing Research 41 (November 2004), 397–410.
13. For more detailed discussions, see Turner, J.R. and Thayer, J., Introduction to Analysis of Variance: Design, Analysis and Interpretation (Thousand Oaks, CA: Sage, 2001); Glantz, S.A. and Slinker, B.K., Primer of Applied Regression and Analysis of Variance (Blacklick, OH: McGraw-Hill, 2000); Neter, J.W., Applied Linear Statistical Models, 4th edn (Burr Ridge, IL: Irwin, 1996); Wildt, A.R. and Ahtola, O.T., Analysis of Covariance (Beverly Hills, CA: Sage, 1978).
14. See Zhang, S. and Schmitt, B.H., ‘Creating local brands in multilingual international markets’, Journal of Marketing Research 38 (3) (August 2001), 313–25; Umesh, U.N., Peterson, R.A., McCann-Nelson, M. and Vaidyanathan, R., ‘Type IV error in marketing research: The investigation of ANOVA interactions’, Journal of the Academy of Marketing Science 24 (1) (Winter 1966), 17–26; Ross, W.T. Jr and Creyer, E.H., ‘Interpreting interactions: Raw means or residual means’, Journal of Consumer Research 20 (2) (September 1993), 330–8; Leigh, J.H. and Kinnear, T.C., ‘On interaction classification’, Educational and Psychological Measurement 40 (Winter 1980), 841–3.
15. For an examination of interactions using an ANOVA framework, see Jaccard, J., Interaction Effects in Factorial Analysis of Variance (Thousand Oaks, CA: Sage, 1997); Wansink, B., ‘Advertising’s impact on category substitution’, Journal of Marketing Research 31 (November 1994), 505–15.

631Chapter 21 Analysis of variance and covariance
16. This formula does not hold if repeat measurements are made on the dependent variable. See Fern, E.F. and Monroe, K.B., ‘Effect size estimates: Issues and problems in interpretation’, Journal of Consumer Research 23 (2) (September 1996), 89–105; Dodd, D.H. and Schultz, R.F. Jr, ‘Computational procedures for estimating magnitude of effect for some analysis of variance designs’, Psychological Bulletin (June 1973), 391–5.
17. The v2 formula is attributed to Hays. See Hays, W.L., Statistics for Psychologists (New York: Holt, Rinehart & Winston, 1963).
18. Johnson, R.A. and Wichern, D.W., Applied Multivariate Statistical Analysis (Paramus, NJ: Prentice Hall, 2001); Fern, E.F. and Monroe, K.B., ‘Effect-size estimates: Issues and problems in interpretation’, Journal of Consumer Research 23 (2) (September 1996), 89–105; Cohen, J., Statistical Power Analysis for the Behavioral Sciences (Mahwah, NJ: Lawrence Erlbaum Associates, 1988).
19. Ximnez, C. and Revuelta, J., ‘Extending the CLAST sequential rule to one-way ANOVA under group sampling’, Behaviour Research Methods 39 (1) (February 2007), 86–100; Turner, J.R. and Thayer, J., Introduction to Analysis of Variance: Design, Analysis and Interpretation (Thousand Oaks, CA: Sage, 2001); Neter, J.W., Applied Linear Statistical Models, 4th edn (Burr Ridge, IL: Irwin, 1996); Winer, B.J., Brown, D.R. and Michels, K.M., Statistical Principles in Experimental Design, 3rd edn (New York: McGraw-Hill, 1991).
20. It is possible to combine between-subjects and within-subjects factors in a single design. See, for example, Vickner, F. and Hofmann, J., ‘The price-perceived quality relationship: A meta analytic review and assessment of its determinants’, Marketing Letters 18 (3) (July 2007), 181–96; Ahluwalia, R., Unnava, H.R. and Burnkrant, R.E., ‘The moderating role of commitment on the
spillover effect of marketing communications’, Journal of Marketing Research 38 (4) (November 2001), 458–70.
21. See Schott, J.R., ‘Some high-dimensional tests for a one-way MANOVA’, Journal of Multivariate Analysis 98 (9) (October 2007), 1825–39; Kim, S. and Olejnik, S., ‘Bias and precision of measures of association for a fixed-effect multivariate analysis of variance model’, Multivariate Behavioural Research 40 (4) (October 2005), 401–25; Roehm, M.L., Pullins, E.B. and Roehm, H.A. Jr, ‘Designing loyalty-building programs for packaged goods brands’, Journal of Marketing 39 (2) (May 2002), 202–13; Bray, J.H. and Maxwell, S.E., Multivariate Analysis of Variance (Beverly Hills, CA: Sage, 1985). For an application of MANOVA, see Piercy, N.F., ‘Sales manager behaviour control strategy and its consequences: The impact of gender differences’, Journal of Personal Selling & Sales Management 21 (1) (Winter 2001), 39–49.
22. Kimmel, A.J. and Smith, N.C., ‘Deception in marketing research: Ethical, methodological and disciplinary implications’, Psychology and Marketing 18 (7) (July 2001), 663–89; Abramson, N.R., Keating, R.J. and Lane, H.W., ‘Cross-national cognitive process differences: A comparison of Canadian, American and Japanese managers’, Management International Review 36 (2) (Second Quarter 1996), 123–47; Akaah, I.P., ‘A cross-national analysis of the perceived commonality of unethical practices in marketing research’, in Lazer, L., Shaw, E. and Wee, C.H. (eds), World Marketing Congress, International Conference Series, Vol. 4 (Boca Raton, FL: Academy of Marketing Science, 1989), 2–9.
23. Peterson, D., Rhoads, A. and Vaught, B.C., ‘Ethical beliefs of business professionals: A study of gender, age and external factors’, Journal of Business Ethics 31 (3) (June 2001), 1; Akaah, I.P., ‘Differences in research ethics judgments between male and female marketing professionals’, Journal of Business Ethics 8 (1989), 375–81.

632
Correlation and regression
Correlation is the simplest way
to understand the association
between two metric variables.
When extended to multiple
regression, the relationship
between one variable and
several others becomes
more clear.
Stage 1
Problem definition
Stage 2
Research approach developed
Stage 3
Research design
developed
Stage 4
Fieldwork or data
collection
Stage 5
Data integrity
and analysis
Stage 6
Communicating research findings
22

633Chapter 22 Correlation and regression
Objectives
After reading this chapter, you should be able to:
1 discuss the concepts of product moment correlation, partial correlation and part correlation, and show how they provide a foundation for regression analysis;
2 explain the nature and methods of bivariate regression analysis and describe the general model, estimation of parameters, standardised regression coefficient, significance testing, prediction accuracy, residual analysis and model cross-validation;
3 explain the nature and methods of multiple regression analysis and the meaning of partial regression coefficients;
4 describe specialised techniques used in multiple regression analysis, particularly stepwise regression, regression with dummy variables and analysis of variance and covariance with regression;
5 discuss non-metric correlation and measures such as Spearman’s rho and Kendall’s tau;
6 understand the use of software in analyses of correlation and regression.
Overview
Chapter 21 examined the relationship among the t test, analysis of variance and covariance and regression. This chapter describes regression analysis, which is widely used for explaining variation in market share, sales, brand preference and other marketing results. This is done in terms of marketing management variables such as advertising, price, distribution and product quality. Before discussing regression, however, we describe the concepts of product moment correlation and partial correlation coefficient, which lay the conceptual foundation for regression analysis.
In introducing regression analysis, we discuss the simple bivariate case first. We describe estimation, standardisation of the regression coefficients and testing and examination of the strength and significance of association between variables, prediction accuracy and the assumptions underlying the regression model. Next, we discuss the multiple regression model, emphasising the interpretation of parameters, strength of association, significance tests and examination of residuals.
We then cover topics of special interest in regression analysis, such as stepwise regression, multicollinearity, relative importance of predictor variables and cross-validation. We describe regression with dummy variables and the use of this procedure to conduct analysis of variance and covariance. Finally, guidance is provided on the use of software to address the data analysis challenges presented in this chapter. We begin with two examples that illustrate applications of regression analysis.
Real research Regression hits the right bell for Avon1
Avon Products (www.avon.com) was having significant problems with its sales staff. The company’s business, dependent upon sales representatives, was facing a shortage of sales staff and was facing difficulties in signing up new ones. Regression models were developed to reveal the possible variables that were fuel-ling this situation. The models revealed that the most significant variable was the level of

634 Marketing Research
appointment fee that representatives pay for materials, and second was the employee benefits. With data to back up its actions, the company lowered the fee. Avon also recruited a senior manager to improve the way it communicated to new recruits its employee ben-efits package. The ‘Guide to your personal benefits’ was an informative and easy-to-navi-gate information source. These changes resulted in an improvement in the recruitment and retention of sales representatives.
Real research Retailing revolution2
Many experts argue that online shopping has revolutionised retailing. While many tradi-tional retailers experience sluggish, single-digit sales growth, online sales records are off the charts. Although online shopping continues to make up a small portion of overall retail sales, the prospects look very promising for the future. A research project investi-gating this trend looked for correlates of consumers’ preferences for online shopping. The sample was made up of participants who were familiar with online shopping. The explanation of consumers’ preferences was sought in psychographic, demographic and communications variables suggested in the literature. Multiple regression was used to analyse the data. The overall multiple regression model was significant at a 0.05 level. Univariate t tests indicated that the following variables in the model were significant at a 0.05 level or better: price orientation, gender, age, occupation, ethnicity and education. None of the three communication variables (mass media, word of mouth and publicity) was significantly related to consumer preference, the dependent variable. The results suggested that electronic shopping was preferred by white females who were older, bet-ter educated, working in supervisory or higher-level occupations, and price oriented.
These examples illustrate some of the uses of regression analysis in determining which inde-pendent variables explain a significant variation in the dependent variable of interest, the structure and form of the relationship the strength of the relationship, and predicted values of the dependent variable. Fundamental to regression analysis is an understanding of product moment correlation.
Product moment correlation
In marketing research, we are often interested in summarising the strength of association between two metric variables, as in the following situations:
• How strongly are sales related to advertising expenditures?
• Is there an association between market share and size of the sales force?
• Are consumers’ perceptions of quality related to their perceptions of prices?
In situations like these, the product moment correlation (r) is the most widely used statis-tic, summarising the strength of association between two metric (interval- or ratio-scaled) variables, say X and Y. It is an index used to determine whether a linear or straight-line rela-tionship exists between X and Y. It indicates the degree to which the variation in one variable, X, is related to the variation in another variable, Y. Because it was originally proposed by Karl Pearson, it is also known as the Pearson correlation coefficient and also referred to as
Product moment correlation (r)A statistic summarising the strength of association between two metric variables.

635Chapter 22 Correlation and regression
simple correlation, bivariate correlation or merely the correlation coefficient. From a sam-ple of n observations, X and Y, the product moment correlation, r, can be calculated as:
=
= =
=− −
−
©
©©1
1
2
1
2
( )( )
( )n n
i
i ii
i i
r
n
X
X X
X Y
Y Y
Y
−i( )
Division of the numerator and denominator by n – 1 gives:
=
=
©
= =
− −
−
−−
−−© ©
1
11
1
( )( )
( ) ( ))1
r
COVs s
xy
x y
n
n
n
n
n
i i
X
X X
X Y
Y Y
Y
In these equations, X and Y denote the sample means and sx and sy the standard devia-tions. COVxy, the covariance between X and Y, measures the extent to which X and Y are related. The covariance may be either positive or negative. Division by sxsy achieves standardisation so that r varies between –1.0 and +1.0. Note that the correlation coeffi-cient is an absolute number and is not expressed in any unit of measurement. The correla-tion coefficient between two variables will be the same regardless of their underlying units of measurement.
As an example, suppose that a researcher wants to explain attitudes towards a partici-pant’s city of residence in terms of duration of residence in the city. The attitude is meas-ured on an 11-point scale (1 = do not like the city, 11 = very much like the city), and the duration of residence is measured in terms of the number of years the participant has lived in the city. In a pre-test of 12 participants, the data shown in Table 22.1 are obtained. For illustrative purposes, we consider only a small number of observations so that we can show the calculations by hand. In practice, correlation and regression analyses are performed on much larger samples.
CovarianceA systematic relationship between two variables in which a change in one implies a corresponding change in the other (COVxy).
Table 22.1
Participant number Attitude towards the city Duration of residence Importance attached to weather
1 6 10 32 9 12 113 8 12 44 3 4 15 10 12 116 4 6 17 5 8 78 2 2 49 11 18 8
10 9 9 1011 10 17 812 2 2 5
Explaining attitude towards the city of residence

636 Marketing Research
The correlation coefficient may be calculated as follows:
Y =(6+9+8+3+10+4+5+2+11+9+10+2)/12
X=(10+12+12+4+12+6+8+2+18+9+17+2)/12
=9.333
=6.583
( ) ( ) (10 9.33)(6 6.58)(12 9.33)(
− − − −
−−
−−− − − −
−−−−− − − −
−−−−− − − −
+
+
++
+ + + + ++++++
++
++
++
+=
=
=
=©1 9 6.58)
(12 9.33)(8 6.58) (4 9.33)(3 6.58)
(12 9.33)(1 6.58)0
6.58
(6 9.33)(4 6.58)
(8 9.33)(5 ) (2 9.33)(2 6.58)
− − − −+ +6.58(8 9.33)(10 ) (6 9.33)(4 6.58)
(18 9.33)(11 6.58) (9 9.333)(9 6.58)
(17 9.33)(1 60 .58) (2 9.33)(2 6.58)
0.3886 6.4614 3.7914 19.0814 9.1314 8.5914
22.1014 33.5714 38.3214 0.7986 26.2314 33.5714
179.6668
X Xi
i i
n
YY
( ) (10 9.33) (12 9.33) (12 9.33) (4 9.32 2 2 2 33)
(12 9.33) (6 9.33) (8 9.33) (2 9.3
2
2 2 2©
133) (18 9.33)
(9 9.33) (17 9.33) (2 9.33)
2 2
2 2 2
00.4489 7.1289 7.1289 28.4089 7.1289 11.0889 1.77689
53.7289 75.1689 0.1089 58.8289 53.7289
3046668.
=
=
=
+ ++ + + + +
++++++
+
++
++
++
+ +
−
−− −
−
−
−−
−
−−−
−=
X Xn
ii
1
2 2 2 26 6 58 9 6 58 8 6 58 3 6( ) ( ) ( ) ( ) ( 58 3 6 58
10 6 58 4 6 58 5 6 58
2 2
2 2 2
) ( )
( ) ( ) )( ( ) ( )
( ) ( ) (
2 6 58 11 6 58
9 6 58 10 6 58 2
2 2
2 2 66 58
0 3364 5 8564 2 0164 12 8164 11 6964 6
2)
66564 2 4964
20 9764 19 5364 5 8564 11 6964 20 99764
120 9168.. . . . .
. ....... . .
. ..... . . . .
=
=
=© + + + ++++++
+ + ++ + ++++
+ + + + +
− − − − −−−−−−
− − −
−=
Y Yn
ii
Thus:
1796668
3046668 120 9168
0 9361
.
( . )( . )
.
=
=
r
In this example, r = 0.9361, a value close to 1.0. This means that participants’ duration of residence in the city is strongly associated with their attitude towards the city. Furthermore, the positive sign of r implies a positive relationship; the longer the duration of residence, the more favourable the attitude, and vice versa.
Since r indicates the degree to which variation in one variable is related to variation in another, it can also be expressed in terms of the decomposition of the total variation (see Chapter 21). In other words:

637Chapter 22 Correlation and regression
2 explained variationtotal variation
tottal variation error variationtotal variation
=
=
=
=
−
−
SSSS
SS
SS SS
r
x
y
y
y
error
Hence, r2 measures the proportion of variation in one variable that is explained by the other. Both r and r2 are symmetric measures of association. In other words, the correlation of X with Y is the same as the correlation of Y with X. It does not matter which variable is consid-ered to be the dependent variable and which the independent. The product moment coeffi-cient measures the strength of the linear relationship and is not designed to measure non-linear relationships. Thus r = 0 merely indicates that there is no linear relationship between X and Y. It does not mean that X and Y are unrelated. There could well be a non-linear relationship between them, which would not be captured by r (see Figure 22.1).
When computed for a population rather than a sample, the product moment correlation is denoted by the Greek letter rho, r. The coefficient r is an estimator of r. Note that the calcu-lation of r assumes that X and Y are metric variables whose distributions have the same shape. If these assumptions are not met, r is deflated and underestimates r. In marketing research, data obtained by using rating scales with a small number of categories may not be strictly interval. This tends to deflate r, resulting in an underestimation of r.3
The statistical significance of the relationship between two variables measured by using r can be conveniently tested. The hypotheses are:
H0 : r = 0H1 : r ≠ 0
The test statistic is:
2
1 2
12
=−
−t r
rn
which has a t distribution with n – 2 degrees of freedom.4 For the correlation coefficient cal-culated based on the data given in Table 22.1:
Figure 22.1
A non-linear relationship for which r = 0
0
1
2
3
4
5
6
–2 –1 0 1 2 3
Y
X–3

638 Marketing Research
.
.
0 936112 2
8 414
=
=
−.1 0 9361( )−
t
and the degrees of freedom df = 12 – 2 = 10. From the t distribution table (available on the accompanying website for this book), the critical value of t for a two-tailed test and a = 0.05 is 2.228. Hence, the null hypothesis of no relationship between X and Y is rejected. This, along with the positive sign of r, indicates that attitude towards the city is positively related to the duration of residence in the city. Moreover, the high value of r indicates that this rela-tionship is strong. If this were a large and representative sample, the implication would be that managers, city officials and politicians wishing to reach people with a favourable atti-tude to the city should target long-term residents of that city.
In conducting multivariate data analysis, it is often useful to examine the simple correla-tion between each pair of variables. These results are presented in the form of a correlation matrix, which indicates the coefficient of correlation between each pair of variables. Usually, only the lower triangular portion of the matrix is considered. The diagonal elements all equal 1.00, since a variable correlates perfectly with itself. The upper triangular portion of the matrix is a mirror image of the lower triangular portion, since r is a symmetric measure of association. The form of a correlation matrix for five variables, V1 to V5, is as follows:
V1 V2 V3 V4 V5
V1
V2 0.5V3 0.3 0.4V4 0.1 0.3 0.6V5 0.2 0.5 0.3 0.7
Although a matrix of simple correlations provides insights into pairwise associations, some-times researchers want to examine the association between two variables after controlling for one or more other variables. In the latter case, partial correlation should be estimated.
Partial correlation
Whereas the product moment or simple correlation is a measure of association describing the linear association between two variables, a partial correlation coefficient measures the association between two variables after controlling for or adjusting for the effects of one or more additional variables. This statistic is used to answer the following questions:
• How strongly are sales related to advertising expenditures when the effect of price is controlled?
• Is there an association between market share and size of the sales force after adjusting for the effect of sales promotion?
• Are consumers’ perceptions of quality related to their perceptions of prices when the effect of brand image is controlled?
As in these situations, suppose that a researcher wanted to calculate the association between X and Y after controlling for a third variable, Z. Conceptually, one would first remove the effect of Z from X. To do this, one would predict the values of X based on knowledge of Z by using the product moment correlation between X and Z – rxz. The predicted value of X is then subtracted from the actual value of X to construct an adjusted value of X. In a similar manner, the values of Y are adjusted to remove the effects of Z. The product moment correlation
Partial correlation coefficientA measure of the association between two variables after controlling or adjusting for the effects of one or more additional variables.

639Chapter 22 Correlation and regression
between the adjusted values of X and the adjusted values of Y is the partial correlation coef-ficient between X and Y, after controlling for the effect of Z, and is denoted by rxy·z. Statisti-cally, since the simple correlation between two variables completely describes the linear relationship between them, the partial correlation coefficient can be calculated from knowl-edge of the simple correlations alone, without using individual observations:
( )( )
1 12 2. =
−
− −xy
xyxz yz
xz yz
zrr r r
rr
To continue our example, suppose that the researcher wanted to calculate the association between attitude towards the city, Y, and duration of residence, X1, after controlling for a third variable, importance attached to weather, X2. These data are presented in Table 22.1.
The simple correlations between the variables are:
0 9361 0 7334 0 5495. ..= = =r r ryx yx xx
The required partial correlation may be calculated as follows:
0 9361 0 5495 0 7334
1 0 5495 1 02.
. ( . )( . )
( . ) ( .77334
0 9386
2)
.
=
=
−
− −rxy x
As can be seen, controlling for the effect of importance attached to weather has little effect on the association between attitude towards the city and duration of residence. Thus, regard-less of the importance they attach to weather, those who have stayed in a city longer have more favourable attitudes towards the city, and vice versa.
Partial correlations have an order associated with them. The order indicates how many variables are being adjusted or controlled. The simple correlation coefficient, r, has a zero order, because it does not control for any additional variables while measuring the association between two variables. The coefficient rxy·z is a first-order partial correlation coefficient, because it controls for the effect of one additional variable, Z. A second-order partial correlation coefficient controls for the effects of two variables, a third-order for the effects of three variables and so on. The higher-order partial correlations are calcu-lated similarly. The (n + 1)-th-order partial coefficient may be calculated by replacing the simple correlation coefficients on the right side of the preceding equation with the nth-order partial coefficients.
Partial correlations can be helpful for detecting spurious relationships (see Chapter 20). The relationship between X and Y is spurious if it is solely because X is associated with Z, which is indeed the true predictor of Y. In this case, the correlation between X and Y disap-pears when the effect of Z is controlled. Consider a case in which consumption of a break-fast cereal brand (C) is positively associated with income (I), with rci = 0.28. Because this brand was popularly priced, income was not expected to be a significant factor. Therefore, the researcher suspected that this relationship was spurious. The sample results also indi-cated that income is positively associated with household size (H), rhi = 0.48, and that household size is associated with breakfast cereal consumption, rch = 0.56. These figures seem to indicate that the real predictor of breakfast cereal consumption is not income but household size. To test this assertion, the first-order partial correlation between cereal con-sumption and income is calculated, controlling for the effect of household size. The reader can verify that this partial correlation, rci·h, is 0.02, and the initial correlation between cereal consumption and income vanishes when the household size is controlled. Therefore, the correlation between income and cereal consumption is spurious. The special case when a partial correlation is larger than its respective zero-order correlation involves a suppressor effect (see Chapter 20).5
Another correlation coefficient of interest is the part correlation coefficient. This coefficient represents the correlation between Y and X when the linear effects of the other
Part correlation coefficientA measure of the correlation between Y and X when the linear effects of the other independent variables have been removed from X (but not from Y).

640 Marketing Research
independent variables have been removed from X but not from Y. The part correlation coefficient, ry(x·z), is calculated as follows:
( )
–
–1 2=r
r r r
ry yx
xy xz
xz
yz.
The part correlation between attitude towards the city and the duration of residence, when the linear effects of the importance attached to weather have been removed from the duration of residence, can be calculated as
( . )
. ( . )( . )
( . )
.
1 2 2
0 9361 0 5495 0 7334
1 0 5495
0 663806
=
=
−
−ry xx
The partial correlation coefficient is generally viewed as more important than the part cor-relation coefficient. The product moment correlation, partial correlation and part correlation coefficients all assume that the data are interval or ratio scaled. If the data do not meet these requirements, the researcher should consider the use of non-metric correlation.
Real research Selling ads to home shoppers6
Advertisements play a very important role in forming attitudes to and preferences for brands. Often, advertisers use celebrity endorsement to present hopefully a credible source to influ-ence consumers’ attitudes and purchase intentions. Another type of source credibility is corporate credibility, which can also influence consumer reactions to advertisements and shape brand attitudes. In general, it has been found that for low-involvement products, atti-tude towards the advertisement mediates brand cognition (beliefs about the brand) and attitude towards the brand. What would happen to the effect of this mediating variable when products are purchased through a home shopping network? Home Shopping Budapest in Hungary conducted research to assess the impact of advertisements towards purchase. A survey was conducted in which several measures were taken, such as attitude towards the product, attitude towards the brand, attitude towards the ad characteristics and brand cogni-tions. It was hypothesised that in a home shopping network, advertisements largely deter-mined attitude towards the brand. To find the degree of association of attitude towards the ad with both attitude towards the brand and brand cognition, a partial correlation coefficient was computed. The partial correlation was calculated between attitude towards the brand and brand cognitions after controlling for the effects of attitude towards the ad on the two variables. If attitude towards the ad was significantly high, then the partial correlation coeffi-cient should have been significantly less than the product moment correlation between brand cognition and attitude towards the brand. Research was conducted which supported this hypothesis. Subsequently Saatchi & Saatchi (www.saatchi.com) designed the advertise-ments aired on Home Shopping Budapest to generate a positive attitude towards the adver-tising. This turned out to be a major competitive weapon for the network.
Non-metric correlation
At times, the researcher may have to compute the correlation coefficient between two varia-bles that are non-metric. It may be recalled that non-metric variables do not have interval-or ratio-scale properties and do not assume a normal distribution. If the non-metric variables are ordinal and numeric, Spearman’s rho (rs) and Kendall’s tau (t) are two measures of

641Chapter 22 Correlation and regression
non-metric correlation that can be used to examine the correlation between them. Both these measures use rankings rather than the absolute values of the variables, and the basic concepts underlying them are quite similar. Both vary from –1.0 to +1.0. (See Chapter 20.)
In the absence of ties, Spearman’s rs yields a closer approximation to the Pearson product moment correlation coefficient, r, than does Kendall’s t. In these cases, the absolute magni-tude of t tends to be smaller than Pearson’s r. On the other hand, when the data contain a large number of tied ranks, Kendall’s t seems more appropriate. As a rule of thumb, Kend-all’s t is to be preferred when a large number of cases fall into a relatively small number of categories (thereby leading to a large number of ties). Conversely, the use of Spearman’s rs is preferable when we have a relatively larger number of categories (thereby having fewer ties).7
The product moment as well as the partial and part correlation coefficients provide a con-ceptual foundation for bivariate as well as multiple regression analysis.
Non-metric correlationA correlation measure for two non-metric variables that relies on rankings to compute the correlation.
Regression analysis
Regression analysis is a powerful and flexible procedure for analysing associative relation-ships between a metric-dependent variable and one or more independent variables. It can be used in the following ways:
1 To determine whether the independent variables explain a significant variation in the dependent variable: whether a relationship exists.
2 To determine how much of the variation in the dependent variable can be explained by the independent variables: strength of the relationship.
3 To determine the structure or form of the relationship: the mathematical equation relating the independent and dependent variables.
4 To predict the values of the dependent variable.
5 To control for other independent variables when evaluating the contributions of a specific variable or set of variables.
Although the independent variables may explain the variation in the dependent variable, this does not necessarily imply causation. The use of the terms dependent or criterion variables and independent or predictor variables in regression analysis arises from the mathematical relationship between the variables. These terms do not imply that the criterion variable is dependent on the independent variables in a causal sense. Regression analysis is concerned with the nature and degree of association between variables and does not imply or assume any causality. Bivariate regression is discussed first, followed by multiple regression.
Regression analysisA statistical procedure for analysing associative relationships between a metric-dependent variable and one or more independent variables.
Bivariate regression
Bivariate regression is a procedure for deriving a mathematical relationship, in the form of an equation, between a single metric-dependent or criterion variable and a single metric-independ-ent or predictor variable. The analysis is similar in many ways to determining the simple cor-relation between two variables. Since an equation has to be derived, however, one variable must be identified as the dependent variable and the other as the independent variable. The examples given earlier in the context of simple correlation can be translated into the regression context:
• Can variation in sales be explained in terms of variation in advertising expenditures? What is the structure and form of this relationship, and can it be modelled mathematically by an equation describing a straight line?
Bivariate regressionA procedure for deriving a mathematical relationship, in the form of an equation, between a single metric-dependent variable and a single metric-independent variable.

642 Marketing Research
• Can the variation in market share be accounted for by the size of the sales force?
• Are consumers’ perceptions of quality determined by their perceptions of price?
Before discussing the procedure for conducting bivariate regression, we define some impor-tant statistics associated with bivariate regression analysis.
Statistics associated with bivariate regression analysis
The following statistics and statistical terms are associated with bivariate regression analysis:
• Bivariate regression model. The basic regression equation is Yi = b0 + b1Xi + ei, where Y = dependent or criterion variable, X = independent or predictor variable, b0 = intercept of the line, b1 = slope of the line and ei is the error term associated with the ith observation.
• Coefficient of determination. The strength of association is measured by the coefficient of determination, r2. It varies between 0 and 1 and signifies the proportion of the total varia-tion in Y that is accounted for by the variation in X.
• Estimated or predicted value. The estimated or predicted value of Yi is Ŷ bi = a + bx, where Ŷi is the predicted value of Yi, and a and b are estimators of b0 and b1, respectively.
• Regression coefficient. The estimated parameter, b, is usually referred to as the non- standardised regression coefficient.
• Scattergram. A scatter diagram, or scattergram, is a plot of the values of two variables for all the cases or observations.
• Standard error of estimate. This statistic, the SEE, is the standard deviation of the actual Y values from the predicted Ŷ values.
• Standard error. The standard deviation of b, SEb, is called the standard error.
• Standardised regression coefficient. Also termed the beta coefficient or beta weight, this is the slope obtained by the regression of Y on X when the data are standardised.
• Sum of squared errors. The distances of all the points from the regression line are squared and added together to arrive at the sum of squared errors, which is a measure of total error,
2©ej .
• t statistic. A t statistic with n – 2 degrees of freedom can be used to test the null hypothesis that no linear relationship exists between X and Y, or:
=H0
: ß1=0, where
bSEb
t
Conducting bivariate regression analysis
The steps involved in conducting bivariate regression analysis are described in Figure 22.2. Suppose that the researcher wants to explain attitudes towards the city of residence in terms of the duration of residence (see Table 22.2). In deriving such relationships, it is often useful first to examine a scatter diagram.
Plot the scatter diagram
A scatter diagram, or scattergram, is a plot of the values of two variables for all the cases or observations. It is customary to plot the dependent variable on the vertical axis and the inde-pendent variable on the horizontal axis. A scatter diagram is useful for determining the form of the relationship between the variables. A plot can alert the researcher to patterns in the

643Chapter 22 Correlation and regression
Table 22.2
Multiple R 0.93608
R2 0.87624
Adjusted R2 0.86387
Standard error 1.22329
Analysis of variance
df Sum of squares Mean square
Regression 1 105.95222 105.95222
Residual 10 14.96444 1.49644
F = 70.80266 Significance of F = 0.0000
Variables in the equation
Variable b SEB Beta (b) t Sig. of t
Duration 0.58972 0.07008 0.93608 8.414 0.0000
(Constant) 1.07932 0.74335 1.452 0.1772
Bivariate regression
Figure 22.2
Conducting bivariate regression analysis
Plot the scatter diagram
Formulate the general model
Estimate the parameters
Estimate standardised regression coe�cient
Test for signi�cance
Determine strength and signi�cance of association
Check prediction accuracy
Examine the residuals
Cross-validate the model

644 Marketing Research
data or to possible problems. Any unusual combinations of the two variables can be easily identified. A plot of Y (attitude towards the city) against X (duration of residence) is given in Figure 22.3. The points seem to be arranged in a band running from the bottom left to the top right. One can see the pattern: as one variable increases, so does the other. It appears from this scattergram that the relationship between X and Y is linear and could be well described by a straight line. However, as seen in Figure 22.4, several straight lines can be drawn through the data. How should the straight line be fitted to best describe the data?
The most commonly used technique for fitting a straight line to a scattergram is the least squares procedure. This technique determines the best-fitting line by minimising the square of the vertical distances of all the points from the line; the procedure is called ordinary least squares (OLS) regression. The best-fitting line is called the regression line. Any point that does not fall on the regression line is not fully accounted for. The vertical distance from the point to the line is the error, ej (see Figure 22.5). The distances of all the points from the line are squared and added together to arrive at the sum of squared errors, which is a measure of
Least squares procedureA technique for fitting a straight line to a scattergram by minimising the vertical distances of all the points from the line.
Figure 22.3
Plot of attitude with duration
2.25 4.5 6.75 9 11.2513.5 1815.75
3
6
9
Duration of residence
Atti
tude
Figure 22.4
Which straight line is best?
2.25 4.5 6.75 9 11.25
Line 1
Line 2
Line 3
Line 4
13.5 1815.75
3
6
9
Duration of residence
Atti
tude

645Chapter 22 Correlation and regression
total error, 2©ej . In fitting the line, the least squares procedure minimises the sum of squared
errors. If Y is plotted on the vertical axis and X on the horizontal axis, as in Figure 22.4, the best-fitting line is called the regression of Y on X, since the vertical distances are mini-mised. The scatter diagram indicates whether the relationship between Y and X can be mod-elled as a straight line and, consequently, whether the bivariate regression model is appropriate.
Formulate the general model
In the bivariate regression model, the general form of a straight line is:
0 1= + XY ß ß
where dependent or criterion variable
indeppendent or predictor variable
intercept of0 the line
slope of the line.1
===
=
X
Y
ß
ß
This model implies a deterministic relationship, in that Y is completely determined by X. The value of Y can be perfectly predicted if b0 and b1 are known. In marketing research, how-ever, very few relationships are deterministic. Thus, the regression procedure adds an error term to account for the probabilistic or stochastic nature of the relationship. The basic regres-sion equation becomes:
0 1= + +X eYi i iß ß
where ei is the error term associated with the ith observation.8 Estimation of the regression parameters, b0 and b1, is relatively simple.
Estimate the parameters
In most cases, b0 and b1 are unknown and are estimated from the sample observations using the equation:
Yi=a+bxiˆ
Figure 22.5
Bivariate regression
X1 X2 X3 X4 X5 X
Yb0 + b1x
Yj
ej
ei
Yi

646 Marketing Research
where Ŷi is the estimated or predicted value of Yi, and a and b are estimators of b0 and b1 respectively. The constant b, is usually referred to as the non-standardised regression coef-ficient. It is the slope of the regression line, and it indicates the expected change in Y when X is changed by one unit. The formulae for calculating a and b are simple.9 The slope, b, may be computed in terms of the covariance between X and Y (COVxy) and the variance of X as:
©©
©
2
1
1
2
1
( )( )
( )
©1
2 2
=
=
=
−
−
−
− −
=
=
=
=X
X
X XY Y
X
X Y Y
X X
COV
n
n
sb
n
n
n
n
ii i
ii
i
i
i i
i
xy
x
The intercept, a, may then be calculated using:
= −bXa Y
For the data in Table 22.2, the estimation of parameters may be illustrated as follows:
( )( ) ( )( ) ( )( ) ( )( ) ( )( ) (10 6 12 9 12 8 4 3 12 10 6))( ) ( )( ) ( )( )
( )( ) ( )( ) ( )(
4 8 5 2 2
18 11 9 9 171
12
©110 2 2
10 12 4 12 62
1
122 2 2 2 2
) ( )( )
© 88 2 18 9 17 22 2 2 2 2 2
1350=
=
917=
=
+ + + + + + + + + +
+ + + +
+ + + + + + +
=
=
X
X Y
ii
ii i
It may be recalled from earlier calculations of the simple correlation that:
9 333
6 583
==
.
.X
Y
Given n = 12, b can be calculated as:
917 12 9 333 6 583
1350 12 9 333
0 589
2
( )( . )( . )
( )( . )
. 7
6 583 0 5897 9 333
1 0793
. ( . )( . )
.
=
=
===
−−
−−XY
b
ba
Note that these coefficients have been estimated on the raw (untransformed) data. Should standardisation of the data be considered desirable, the calculation of the standardised coef-ficients is also straightforward.
Estimate the standardised regression coefficient
Standardisation is the process by which the raw data are transformed into new variables that have a mean of 0 and a variance of 1. When the data are standardised, the intercept assumes
Estimated or predicted valueThe value Yi = a + bx, where a and b are, respectively, estimators of b0 and b1, the corresponding population parameters.

647Chapter 22 Correlation and regression
a value of 0. The term beta coefficient or beta weight is used to denote the standardised regression coefficient. In this case, the slope obtained by the regression of Y on X, Byx, is the same as the slope obtained by the regression of X on Y, Bxy. Moreover, each of these regres-sion coefficients is equal to the simple correlation between X and Y:
= =B B ryx xy xy
There is a simple relationship between the standardised and non-standardised regression coefficients:
=B bssyx yx
x
y
For the regression results given in Table 22.2, the value of the beta coefficient is estimated as 0.9361. Note that this is also the value of r, calculated earlier in this chapter.
Once the parameters have been estimated, they can be tested for significance.
Test for significance
The statistical significance of the linear relationship between X and Y may be tested by exam-ining the hypotheses:
0 1
1 1
: 0
: 0
=
≠
H
H
ß
ß
The null hypothesis implies that there is no linear relationship between X and Y. The alter-native hypothesis is that there is a relationship, positive or negative, between X and Y. Typically, a two-tailed test is done. A t statistic with n – 2 degrees of freedom can be used, where:
=SE
b
tb
and SEb denotes the standard deviation of b, called the standard error.10 (The t distribution was discussed in Chapter 20.)
Using quantitative data analysis software, the regression of attitude on duration of resi-dence, using the data shown in Table 22.1, yielded the results shown in Table 22.2. The inter-cept, a, equals 1.0793, and the slope, b, equals 0.5897. Therefore, the estimated equation is:
attitude duration of residence( ˆ ) ( )1 0793 0 5897= +Y . .
The standard error or standard deviation of b is estimated as 0.07008, and the value of the t statistic, t = 0.5897/0.0701 = 8.414, with n – 2 = 10 df. The critical value of t with 10 df and r = 0.05 is 2.228 for a two-tailed test. Since the calculated value of t is larger than the critical value, the null hypothesis is rejected. Hence, there is a significant linear relationship between attitude towards the city and duration of residence in the city. The positive sign of the slope coefficient indicates that this relationship is positive. In other words, those who have lived in the city for a longer time have more positive attitudes towards it.
Determine strength and significance of association
A related inference involves determining the strength and significance of the association between Y and X. The strength of association is measured by the coefficient of determina-tion, r2. In bivariate regression, r2 is the square of the simple correlation coefficient obtained by correlating the two variables. The coefficient, r2, varies between 0 and 1. It signifies the proportion of the total variation in Y that is accounted for by the variation in X. The decom-position of the total variation in Y is similar to that for analysis of variance (Chapter 21).

648 Marketing Research
As shown in Figure 22.6, the total variation, SSy, may be decomposed into the variation accounted for by the regression line, SSreg, and the error or residual variation, SSerror or SSres, as follows:
where ©( )
( ˆ )
2
1
2
1
1
2
©
©( ˆ )
=
=
=
=
+
−
−
−
=
=
=
SSy
SSy
SSreg
SSreg
SSres
SSres
Y Y
Y Y
Y Y
n
n
n
i
i
ii i
i
i
The strength of the association may then be calculated as follows:
2=
=−
SSreg
SSres
SSy
SSy
SSy
r
To illustrate the calculations of r2, let us consider again the effect of attitude towards the city on the duration of residence. It may be recalled from earlier calculations of the simple cor-relation coefficient that:
( )=
=2
1120.9168© −=
iiSS
y
n
Y Y
The predicted values (Ŷ) can be calculated using the regression equation:
attitude( ) = 1.0793 + 0.5897(duration of residence)
For the first observation in Table 22.1, this value is:
( ) = 1.0793 + (0.5897 × 10) = 6.9763
For each successive observation, the predicted values are, in order, 8.1557, 8.1557, 3.4381, 8.1557, 4.6175, 5.7969, 2.2587, 11.6939, 6.3866, 11.1042, 2.2587. Therefore:
Ŷ
Ŷ
Figure 22.6
Decomposition of the total variation in bivariate regression
X
Y
Explained variationSSreg
Residual variationSSres
Y
Totalvariation
SSy

649Chapter 22 Correlation and regression
1=i©=
=(6−6.9763)2+(9−8.1557)2+(8−8.1557)2+(3−3.4381)2
+(3.4381−6.5833)2+(8.1557−6.5833)2+(4.6175−6.5833)2
=(6.9763−6.5833)2+(8.1557−6.5833)2+(8.1557−6.5833)2
+(5.7969−6.5833)2+(2.2587−6.5833)2+(11.6939−6.5833)2
+(6.3866−6.5833)2+(11.1042−6.5833)2+(2.2587−6.5833)2
+(10−8.1557)2+(4−4.6175)2+(5−5.7969)2+(2−2.2587)2
+(11−11.6939)2+(9−6.3866)2+(10−11.1042)2+(2−2.2587)2
=0.1544+2.4724+2.4724+9.8922+2.4724+3.8643+0.6184
+18.7021+26.1182+0.0387+20.4385+18.7021
=105.9466
=14.9644
1=i©= 2( ˆ )−Y Yi i
2( ˆ )−Y YiSSreg
n
SSreg
n
It can be seen that SSy = SSreg + SSres. Furthermore:
2
105.9466120.91680.8762
=
=
=
rSS
SSreg
y
Another equivalent test for examining the significance of the linear relationship between X and Y (significance of b) is the test for the significance of the coefficient of determination. The hypotheses in this case are:
>0pop
: R2
: R2
H 0
H 1
=0pop
The appropriate test statistic is the F statistic:
/( )2=
n−F
SS
SSres
reg
which has an F distribution with 1 and (n – 2) df. The F test is a generalised form of the t test (see Chapter 20). If a random variable is t distributed with n degrees of freedom, then t2 is F distributed with 1 and n df. Hence, the F test for testing the significance of the coefficient of determination is equivalent to testing the following hypotheses:
0 1
1 1
: 0
: 0
=
≠
H
H
ß
ß
or
H 0
H 1
: r=0
: r ≠ 0

650 Marketing Research
From Table 22.2, it can be seen that:
2 105.9522105.9522 14.96440.8762=
=+
r
which is the same as the value calculated earlier. The value of the F statistic is:
=
=
105.952214.964/10
70.8028
F
with 1 and 10 df. The calculated F statistic exceeds the critical value of 4.96 determined from Table 5 in the Appendix. Therefore, the relationship is significant at a = 0.05, corroborating the results of the t test. If the relationship between X and Y is significant, it is meaningful to predict the values of Y based on the values of X and to estimate prediction accuracy.
Check prediction accuracy
To estimate the accuracy of predicted values, Ŷ it is useful to calculate the standard error of estimate, SEE. This statistic is the standard deviation of the actual Y values from the pre-dicted Ŷ values:
=
−=
−=©
SEE
SEE
n
Y Yii
n1
2
2
( ˆ )
−nSSres
2
or, more generally, if there are k independent variables:
SEE=−1
SSres
n k−
SEE may be interpreted as a kind of average residual or average error in predicting Y from the regression equation.11
Two cases of prediction may arise. The researcher may want to predict the mean value of Y for all the cases with a given value of X, say X0, or predict the value of Y for a single case. In both situations, the predicted value is the same and is given by Ŷ where:
=Y a+bX0ˆ
But the standard error is different in the two situations, although in both situations it is a function of SEE. For large samples, the standard error for predicting the mean value of Y is
/ nSEE and for predicting individual Y values it is SEE. Hence, the construction of confi-dence intervals (see Chapter 15) for the predicted value varies, depending upon whether the mean value or the value for a single observation is being predicted. For the data given in Table 22.2, SEE is estimated as follows:
=−
=
14.964412 2
1.22329
SEE
The final two steps in conducting bivariate regression, namely examination of residuals and model cross-validation, are considered later, and we now turn to the assumptions underlying the regression model.

651Chapter 22 Correlation and regression
Assumptions
The regression model makes a number of assumptions in estimating the parameters and in significance testing, as shown in Figure 22.5:
1 The error term is normally distributed. For each fixed value of X, the distribution of Y is normal.12
2 The means of all these normal distributions of Y, given X, lie on a straight line with slope b.
3 The mean of the error term is 0.
4 The variance of the error term is constant. This variance does not depend on the values assumed by X.
5 The error terms are uncorrelated. In other words, the observations have been drawn inde-pendently.
Insights into the extent to which these assumptions have been met can be gained by an exam-ination of residuals, which is covered in the next section, on multiple regression.13
Multiple regression
Multiple regression involves a single dependent variable and two or more independent var-iables. The questions raised in the context of bivariate regression can also be answered via multiple regression by considering additional independent variables:
• Can variation in sales be explained in terms of variation in advertising expenditures, prices and level of distribution?
• Can variation in market shares be accounted for by the size of the sales force, advertising expenditures and sales promotion budgets?
• Are consumers’ perceptions of quality determined by their perceptions of prices, brand image and brand attributes?
Additional questions can also be answered by multiple regression:
• How much of the variation in sales can be explained by advertising expenditures, prices and level of distribution?
• What is the contribution of advertising expenditures in explaining the variation in sales when the levels of prices and distribution are controlled?
• What levels of sales may be expected given the levels of advertising expenditures, prices and level of distribution?
Multiple regressionA statistical technique that simultaneously develops a mathematical relationship between two or more independent variables and an interval-scaled dependent variable.
Real research Global brands, local ads14
European consumers welcome brands from across the globe, but when it comes to adver-tising, they seem to prefer brands from their own country. A survey conducted by Yan-kelovich and Partners and its affiliates found that most European consumers’ favourite advertisements were for local brands, even though they were more than likely to buy brands from other countries. Participants in

652 Marketing Research
the UK, France and Germany named Coca-Cola as the most-often purchased soft drink. The French, however, selected the famous award-winning spot for France’s Perrier bottled water as their favourite advertisement. Similarly, in Germany, the favourite advertising was for a German brand of non-alcoholic beer, Clausthaler. In the UK, though, Coca-Cola was the favourite soft drink and also the favourite advertising. In the light of such findings, the impor-tant question was: does advertising help? Does it help increase the purchase probability of the brand or does it merely maintain a high brand recognition rate? One way of finding out was by running a regression where the dependent variable was the likelihood of brand pur-chase and the independent variables were brand attribute evaluations and advertising eval-uations. Separate models with and without advertising could be run to assess any significant difference in the contribution. Individual t tests could also be examined to find out the sig-nificant contribution of both the brand attributes and advertising. The results could indicate the degree to which advertising plays an important part in brand purchase decisions.
In conjunction with these results, a study revealed that attempting to build brand loyalty purchases by means of a sales promotion is not a desirable way to achieve such an objec-tive. According to the study, sales promotions only encourage momentary brand switching and merely enhance short-term performance for companies. Furthermore, over the long run a sales promotion may imply a low-quality or unstable brand image to consumers or it may confuse them, which could also lead to a decline in brand loyalty. The results of this study show that sacrificing advertising and relying on sales promotions reduces brand asso-ciations, which ultimately leads to a decrease in brand loyalty purchases.
The general form of the multiple regression model is as follows:
= ++ ++ + +0 1 21 2 3 3 . . .Y XXX X ek kß ß ß ß ß
which is estimated by the following equation:
Ŷ 1 1 2 2 3 3a +b X +b X b X . . . b Xk k+++=
As before, the coefficient a represents the intercept, but the bs are now the partial regres-sion coefficients. The least squares criterion estimates the parameters in such a way as to minimise the total error, SSres. This process also maximises the correlation between the actual values of Y and the predicted values of Ŷ . All the assumptions made in bivariate regression also apply in multiple regression. We define some associated statistics and then describe the procedure for multiple regression analysis.15
Multiple regression modelAn equation used to explain the results of multiple regression analysis.
Statistics associated with multiple regression
Most of the statistics and statistical terms described under bivariate regression also apply to multiple regression. In addition, the following statistics are used:
• Adjusted R2. R2, the coefficient of multiple determination, is adjusted for the number of independent variables and the sample size to account for the diminishing returns. After the first few variables, the additional independent variables do not make much contribution.
• Coefficient of multiple determination. The strength of association in multiple regression is measured by the square of the multiple correlation coefficient, R2, which is also called the coefficient of multiple determination.
• F test. The F test is used to test the null hypothesis that the coefficient of multiple determi-nation in the population, R2
pop, is zero. This is equivalent to testing the null hypothesis H0: b1 = b2 = b3 = . . . = bk = 0. The test statistic has an F distribution with k and (n – k – 1) df.

653Chapter 22 Correlation and regression
• Partial F test. The significance of a partial regression coefficient, bi, of Xi may be tested using an incremental F statistic. The incremental F statistic is based on the increment in the explained sum of squares resulting from the addition of the independent variable Xi to the regression equation after all the other independent variables have been included.
• Partial regression coefficient. The partial regression coefficient, b1, denotes the change in the predicted value, Ŷ , per unit change in X1 when the other independent variables, X2 to Xk, are held constant.
Conducting multiple regression analysis
The steps involved in conducting multiple regression analysis are similar to those for bivari-ate regression analysis. The discussion focuses on partial regression coefficients, strength of association, significance testing and examination of residuals.
Estimating the partial regression coefficients
To understand the meaning of a partial regression coefficient, let us consider a case in which there are two independent variables, so that:
Ŷ=a+b1X
1+b
2X
2
First, note that the relative magnitude of the partial regression coefficient of an independent variable is, in general, different from that of its bivariate regression coefficient. In other words, the partial regression coefficient, b1, will be different from the regression coefficient, b, obtained by regressing Y on only X1. This happens because X1 and X2 are usually corre-lated. In bivariate regression, X2 was not considered, and any variation in Y that was shared by X1 and X2 was attributed to X1. In the case of multiple independent variables, however, this is no longer true.
The interpretation of the partial regression coefficient, b1, is that it represents the expected change in Y when X1 is changed by one unit but X2 is held constant or other-wise controlled. Likewise, b2 represents the expected change in Y for a unit change in X2 when X1 is held constant. Thus, calling b1 and b2 partial regression coefficients is appro-priate. It can also be seen that the combined effects of X1 and X2 on Y are additive. In other words, if X1 and X2 are each changed by one unit, the expected change in Y would be (b1 + b2).
Conceptually, the relationship between the bivariate regression coefficient and the partial regression coefficient can be illustrated as follows. Suppose that one were to remove the effect of X2 from X1. This could be done by running a regression of X1 on X2. In other words, one would estimate the equation ˆ
1X and calculate the residual ˆ1X . The
partial regression coefficient, b1, is then equal to the bivariate regression coefficient, br, obtained from the equation Ŷ In other words, the partial regression coefficient, b1, is equal to the regression coefficient, br, between Y and the residuals of X1, from which the effect of X2 has been removed. The partial coefficient, b2, can also be interpreted along similar lines.
Extension to the case of k variables is straightforward. The partial regression coeffi-cient, b1, represents the expected change in Y when X1 is changed by one unit and X2 to Xk are held constant. It can also be interpreted as the bivariate regression coefficient, b, for the regression of Y on the residuals of X1, when the effect of X2 to Xk has been removed from X1.
The beta coefficients are the partial regression coefficients obtained when all the varia-bles (Y, X1, X2, . . ., Xk) have been standardised to a mean of 0 and a variance of 1 before estimating the regression equation. The relationship of the standardised to the non- standardised coefficients remains the same as before:

654 Marketing Research
…
ssxk
y
1B1=b1
Bk=bk
ssx
y
The intercept and the partial regression coefficients are estimated by solving a system of simultaneous equations derived by differentiating and equating the partial derivatives to zero. Since these coefficients are automatically estimated by various computer programs, we will not present the details. Yet it is worth noting that the equations cannot be solved if (1) the sample size, n, is smaller than or equal to the number of independent variables, k, or (2) one independent variable is perfectly correlated with another.
Suppose that in explaining the attitude towards the city (as in our former example) we now introduce a second variable, importance attached to the weather. The data for the 12 pre-test participants on attitude towards the city, duration of residence and importance attached to the weather are given in Table 22.1. The results of multiple regression analysis are depicted in Table 22.3. The partial regression coefficient for duration (X1) is now 0.4811, different from what it was in the bivariate case. The corresponding beta coefficient is 0.7636.
Table 22.3
Multiple R 0.97210R2 0.94498Adjusted R2 0.93276Standard error 0.85974
Analysis of variance
df Sum of squares Mean squareRegression 2 114.26425 57.13213Residual 9 6.65241 0.73916F = 77.29364 Significance of F = 0.0000
Variables in the equation
Variable b SEB Beta (b) t Sig. of t
Importance 0.28865 0.08608 0.31382 3.353 0.0085Duration 0.48108 0.05895 0.76363 8.160 0.0000(Constant) 0.33732 0.56736 0.595 0.5668
Multiple regression
The partial regression coefficient for importance attached to weather (X2) is 0.2887, with a beta coefficient of 0.3138. The estimated regression equation is:
( ˆ )=0.33732+0.48108X1+0.28865X2Y
or
attitude = 0.33732 + 0.48108(duration) + 0.28865(importance)
This equation can be used for a variety of purposes, including predicting attitudes towards the city, given a knowledge of the participants’ duration of residence in the city and the importance they attach to weather. Note that duration and importance are significant and useful in the prediction.

655Chapter 22 Correlation and regression
Strength of association
The strength of the relationship stipulated by the regression equation can be determined by using appropriate measures of association. The total variation is decomposed, as in the bivariate case:
SSy=SS
reg+SS
res
where
SSy= (Y
i−Y )2
i=1
n
© −
SSreg
= (Yi−Y )2
i=1
n
© −
SSres
= (Yi−Y )2
i=1
n
©
ˆ
ˆ
The strength of association is measured by the square of the multiple correlation coefficient, R2, which is also called the coefficient of multiple determination:
R2=SSregSSy
The multiple correlation coefficient, R, can also be viewed as the simple correlation coeffi-cient, r, between Y and Ŷ . Several points about the characteristics of R2 are worth noting. The coefficient of multiple determination, R2, cannot be less than the highest bivariate, r2, of any individual independent variable with the dependent variable. R2 will be larger when the correlations between the independent variables are low. If the independent variables are sta-tistically independent (uncorrelated), then R2 will be the sum of bivariate r2 of each inde-pendent variable with the dependent variable. R2 cannot decrease as more independent variables are added to the regression equation. Yet diminishing returns set in, so that after the first few variables, the additional independent variables do not make much of a contribu-tion.16 For this reason, R2 is adjusted for the number of independent variables and the sample size by using the following formula:
adjusted R2=R2 −k(1−R2)
n−k−1
For the regression results given in Table 22.3, the value of R2 is:
114.2643114.2643+6.6524
R2=
=0.9450
This is higher than the r2 value of 0.8762 obtained in the bivariate case. The r2 in the bivari-ate case is the square of the simple (product moment) correlation between attitude towards the city and duration of residence. The R2 obtained in multiple regression is also higher than the square of the simple correlation between attitude and importance attached to weather (which can be estimated as 0.5379). The adjusted R2 is estimated as:
2(1.0−0.9450)12−2−1
adjusted R2=0.9450 −
=0.9328
Note that the value of adjusted R2 is close to R2 and both are higher than r2 for the bivariate case. This suggests that the addition of the second independent variable, importance attached to weather, makes a contribution in explaining the variation in attitude towards the city.

656 Marketing Research
Test for significance
Significance testing involves testing the significance of the overall regression equation as well as specific partial regression coefficients. The null hypothesis for the overall test is that the coefficient of multiple determination in the population, R2
pop, is zero:
H0 : R2 =0
pop
This is equivalent to the following null hypothesis:
H0: ß
1=ß
2=ß
3=…=ß
k=0
The overall test can be conducted by using an F statistic:
SSreg
/ k
R2 / k
SSreg
/ (n−k−1)
(1−R2) / (n−k−1)
F=
=
which has an F distribution with k and (n – k – 1) df.17 For the multiple regression results given in Table 22.3:
1142642 26 6524 9
77 2937. /
. /.= =F
which is significant at a = 0.05.If the overall null hypothesis is rejected, one or more population partial regression coef-
ficients have a value different from 0. To determine which specific coefficients (the bis) are non-zero, additional tests are necessary. Testing for the significance of the bis can be done in a manner similar to that in the bivariate case by using t tests. The significance of the partial coefficient for importance attached to weather may be tested by the following equation:
0 28870 08608
3 354..
.
=
= =
tb
SEb
which has a t distribution with (n – k – 1) df. This coefficient is significant at a = 0.05. The significance of the coefficient for duration of residence is tested in a similar way and found to be significant. Therefore, both the duration of residence and importance attached to weather are important in explaining attitude towards the city.
Some data analysis programs provide an equivalent F test, often called the partial F test, which involves a decomposition of the total regression sum of squares, SSreg, into compo-nents related to each independent variable. In the standard approach, this is done by assum-ing that each independent variable has been added to the regression equation after all the other independent variables have been included. The increment in the explained sum of squares, resulting from the addition of an independent variable, Xi, is the component of the variation attributed to that variable and is denoted by SSXi.
18 The significance of the partial regression coefficient for this variable, bi, is tested using an incremental F statistic:
/
/( )
1
1=
−−n kF
SSXi
SSres
which has an F distribution with 1 and (n – k – 1) df.Although high R2 and significant partial regression coefficients are comforting, the effi-
cacy of the regression model should be evaluated further by an examination of the residuals.

657Chapter 22 Correlation and regression
Examine the residuals
A residual is the difference between the observed value of Yi and the value predicted by the regression equation Ŷi. Residuals are used in the calculation of several statistics associated with regression. In addition, scattergrams of the residuals – in which the residuals are plotted against the predicted values, Ŷi, time, or predictor variables – provide useful insights in examining the appropriateness of the underlying assumptions and regression model fitted.19
The assumption of a normally distributed error term can be examined by constructing a histogram of the standardised residuals. A visual check reveals whether the distribution is normal. It is also useful to examine the normal probability plot of standardised residuals compared with the expected standardised residuals from a normal distribution. If the observed residuals are normally distributed, they will fall on a 45° line. Also, look at the table of residual statistics and identify any standardised predicted values or standardised residuals that are more than plus or minus one or two standard deviations. These percentages can be compared with what would be expected under the normal distribution (68% and 95%, respectively). More formal assessment can be made by running the K–S one-sample test.
The assumption of constant variance of the error term can be examined by plotting the residuals against the predicted values of the dependent variable, Ŷi. If the pattern is not ran-dom, the variance of the error term is not constant. Figure 22.7 shows a pattern whose vari-ance is dependent on the Ŷi values.
ResidualThe difference between the observed value of Yi and the value predicted by the regression equation Ŷi.
A plot of residuals against time, or the sequence of observations, will throw some light on the assumption that the error terms are uncorrelated. A random pattern should be seen if this assumption is true. A plot like the one in Figure 22.8 indicates a linear relationship between residuals and time. A more formal procedure for examining the correlations between the error terms is the Durbin–Watson test.20
Plotting the residuals against the independent variables provides evidence of the appropri-ateness or inappropriateness of using a linear model. Again, the plot should result in a ran-dom pattern. The residuals should fall randomly, with relatively equal distribution dispersion about zero. They should not display any tendency to be either positive or negative.
To examine whether any additional variables should be included in the regression equa-tion, one could run a regression of the residuals on the proposed variables. If any variable explains a significant proportion of the residual variation, it should be considered for inclu-sion. Inclusion of variables in the regression equation should be strongly guided by the researcher’s theory. Thus, an examination of the residuals provides valuable insights into the appropriateness of the underlying assumptions and the model that is fitted. Figure 22.9 shows a plot that indicates that the underlying assumptions are met and that the linear model is appropriate. If an examination of the residuals indicates that the assumptions underlying linear regression are not met, the researcher can transform the variables in an attempt to sat-isfy the assumptions. Transformations, such as taking logs, square roots or reciprocals, can stabilise the variance, make the distribution normal or make the relationship linear.
Figure 22.7
Residual plot indicating that variance is not constant
Predicted Y values
Resi
dual
s

658 Marketing Research
The plots and residual table can be requested when the regression is run, e.g. when using SPSS. It is worth conducting these analyses for multiple regression on the data of Table 22.1. From the histogram, it can be seen that five residuals are positive, whereas seven residuals are negative. By comparing the frequency distribution with the normal distribution that is plotted in the same output, it can be seen that the assumption of normality might not be severe. It is possible to conduct a more formal test for normality if that is warranted. All the standardised residuals are within plus or minus two standard deviations. Furthermore, many of the residu-als are relatively small, which means that most of the model predictions are quite good.
The normal probability plot shows that the residuals are quite close to the 45° line shown in the graph. When the plot of the standardised residuals is compared with the standardised predicted values, no systematic pattern can be discerned in the spread of the residuals. Finally, the table of residual statistics indicates that all the standardised predicted values and all the standardised residuals are within plus or minus two standard deviations. Hence, it can be concluded that multiple regression on the data of Table 22.1 does not appear to result in gross violations of the assumptions. This suggests that the relationship we are trying to pre-dict is linear and that the error terms are more or less normally distributed.
As in this example, some independent variables considered in a study often turn out not to be significant. When there are a large number of independent variables and the researcher suspects that not all of them are significant, stepwise regression should be used.
Stepwise regression
The purpose of stepwise regression is to select, from a large number of predictor variables, a small subset of variables that account for most of the variation in the dependent or criterion variable. In this procedure, the predictor variables enter or are removed from the regression equation one at a time.21 There are several approaches to stepwise regression:
Stepwise regressionA regression procedure in which the predictor variables enter or leave the regression equation one at a time.
Figure 22.8
Plot indicating a linear relationship between residuals and time
Time
Resi
dual
s
Figure 22.9
Plot of residuals indicating that a fitted model is appropriate
Predicted Y values
Resi
dual
s

Real research What influences sports ticket prices? A new stadium!22
A major source of revenue from any professional sports team is through ticket sales, especially sales to season-ticket holders. A study performed a regression analysis to determine what factors caused ticket prices to vary among teams in the same league within a given year. The regression equation was:
LTIX = ao + a1HWIN + a2INCOME + a3PAY + a4POPL + a5TREND + a6CAP + a7STAD
where LTIX = natural log of average ticket price TIX = average ticket price HWIN = average number of wins by the team in the previous three seasons INCOME = average income level of city population PAY = team payroll POPL = population size of city TREND = trends in the industry CAP = attendance as a percentage of capacity STAD = if the team is playing in a new stadium.
The research gathered data over a period of seven years. The financial data were gathered through team marketing reports and the rest of the data were col-lected using publicly available sources, such as sports reports. The results of the regression analysis can be seen in the table below. The results suggest that several factors influenced ticket prices, and the largest factor was that the team was playing in a new stadium.
Regression results
MLB NBA NFL NHL
Variable Coefficient t statistic p value Coefficient t statistic p value Coefficient t statistic p value Coefficient t statistic p value
Constant 1.521 12.012 0.000 2.965 20.749 0.000 2.886 18.890 0.000 3.172 16.410 0.000POPL 0.000 5.404 0.000 0.000 5.036 0.000 0.000 −2.287 0.023 0.000 2.246 0.026INCOME 0.000 3.991 0.000 0.000 0.208 0.836 0.000 3.645 0.000 0.000 0.669 0.504STAD 0.337 5.356 0.000 0.108 3.180 0.002 0.226 3.357 0.001 0.321 4.087 0.000HWIN 0.000 0.091 0.927 0.004 3.459 0.001 0.013 2.190 0.030 0.001 0.369 0.713CAP 0.006 8.210 0.000 0.000 2.968 0.003 0.002 1.325 0.187 0.005 3.951 0.000PAY 0.004 4.192 0.000 0.008 5.341 0.000 0.001 0.607 0.545 0.002 1.099 0.273TREND 0.047 6.803 0.000 0.016 1.616 0.100 0.058 6.735 0.000 0.009 0.718 0.474CAN (Canada) −0.146 −3.167 0.002Adjusted R2 0.778 0.488 0.443 0.292F statistic 98.366 28.227 24.763 9.545F significance 0.000 0.000 0.000659

660 Marketing Research
1 Forward inclusion. Initially, there are no predictor variables in the regression equation. Predictor variables are entered one at a time, only if they meet certain criteria specified in terms of F ratio. The order in which the variables are included is based on the contribution to the explained variance.
2 Backward elimination. Initially, all the predictor variables are included in the regression equation. Predictors are then removed one at a time, based on the F ratio.
3 Stepwise solution. Forward inclusion is combined with the removal of predictors that no longer meet the specified criterion at each step.
Stepwise procedures do not result in regression equations that are optimal, in the sense of producing the largest R2 for a given number of predictors. Because of the correlations between predictors, an important variable may never be included, or less important variables may enter the equation. To identify an optimal regression equation, one would have to com-pute combinatorial solutions in which all possible combinations are examined. Nevertheless, stepwise regression can be useful when the sample size is large in relation to the number of predictors, as shown in the following example.
Real research Browsers step out23
Many commentators consider store-based retailers to have an advantage over online retailers when it comes to browsing, because store-based retailers are larger in size and product offerings. Online retailing has great attractions to many shoppers but the shop-ping centre can remain a dominant force, having so many entertainment factors built into the shopping experience. A profile of browsers in regional shopping centres was constructed using three sets of independent variables: demographics, shopping behav-iour and psychological and attitudinal variables. The dependent variable consisted of a browsing index. In a stepwise regression including all three sets of variables, demo-graphics were found to be the most powerful predictors of browsing behaviour. The final regression equation, which contained 20 of the possible 36 variables, included all the demographics. The table presents the regression coefficients, standard errors of the coefficients and their significance levels.
In interpreting the coefficients, it should be recalled that the smaller the browsing index (the dependent variable), the greater the tendency to exhibit behaviours associ-ated with browsing. The two predictors with the largest coefficients were gender and employment status. Browsers were more likely to be employed females. They also tended to be somewhat ‘downscale’ compared with other shopping-centre patrons, exhibiting lower levels of education and income, after accounting for the effects of gen-der and employment status. Although browsers tend to be somewhat younger than non-browsers, they are not necessarily single; those who reported larger family sizes tended to be associated with smaller values of the browsing index.
The ‘downscale’ profile of browsers relative to other patrons indicates that speciality stores in shopping centres should emphasise moderately priced products. This may explain the historically low rate of failure in shopping centres among such stores and the tendency of high-priced speciality shops to be located in only the prestigious shopping centres or ‘upscale’ non-enclosed shopping centres.

661Chapter 22 Correlation and regression
Regression of browsing index on descriptive and attitudinal variables by order of entry into stepwise regression
Variable description Coefficient SE Significance
Gender (0 = male, 1 = female) −0.485 0.164 0.001Employment status (0 = employed) 0.391 0.182 0.003Self-confidence −0.152 0.128 0.234Education 0.079 0.072 0.271Brand intention −0.063 0.028 0.024Watch daytime TV? (0 = yes) 0.232 0.144 0.107Tension −0.182 0.069 0.008Income 0.089 0.061 0.144Frequency of shopping centre visits −0.130 0.059 0.028Fewer friends than most 0.162 0.084 0.054Good shopper −0.122 0.090 0.174Others’ opinions important −0.147 0.065 0.024Control over life −0.069 0.069 0.317Family size −0.086 0.062 0.165Enthusiastic person −0.143 0.099 0.150Age 0.036 0.069 0.603Number of purchases made −0.068 0.043 0.150Purchases per store 0.209 0.152 0.167Shop on tight budget −0.055 0.067 0.412Excellent judge of quality −0.070 0.089 0.435Constant 3.250Overall R2 = 0.477
Multicollinearity
Stepwise regression and multiple regression are complicated by the presence of multicol-linearity. Virtually all multiple regression analyses done in marketing research involve pre-dictors or independent variables that are related. Multicollinearity, however, arises when intercorrelations among the predictors are very high. Multicollinearity can result in several problems, including the following:
1 The partial regression coefficients may not be estimated precisely. The standard errors are likely to be high.
2 The magnitudes, as well as the signs of the partial regression coefficients, may change from sample to sample.
3 It becomes difficult to assess the relative importance of the independent variables in explaining the variation in the dependent variable.
4 Predictor variables may be incorrectly included or removed in stepwise regression.
What constitutes serious multicollinearity is not always clear, although several rules of thumb and procedures have been suggested in the literature. Procedures of varying complexity have also been suggested to cope with multicollinearity.24 A simple procedure consists of using only
MulticollinearityA state of high intercorrelations among independent variables.

662 Marketing Research
one of the variables in a highly correlated set of variables. Alternatively, the set of independent variables can be transformed into a new set of predictors that are mutually independent by using techniques such as principal components analysis (see Chapter 24). More specialised techniques, such as ridge regression and latent root regression, can also be used.25
Relative importance of predictors
When multicollinearity is present, special care is required in assessing the relative impor-tance of independent variables. In marketing research, it is valuable to determine the relative importance of the predictors. In other words, how important are the independent variables in accounting for the variation in the criterion or dependent variable?26 Unfortunately, because the predictors are correlated, there is no unambiguous measure of relative importance of the predictors in regression analysis.27 Several approaches, however, are commonly used to assess the relative importance of predictor variables:
1 Statistical significance. If the partial regression coefficient of a variable is not significant, as determined by an incremental F test, that variable is judged to be unimportant. An exception to this rule is made if there are strong theoretical reasons for believing that the variable is important.
2 Square of the simple correlation coefficient. This measure, r2, represents the proportion of the variation in the dependent variable explained by the independent variable in a bivariate relationship.
3 Square of the partial correlation coefficient. This measure, R2yxi,xj,xk, is the coefficient of
determination between the dependent variable and the independent variable, controlling for the effects of the other independent variables.
4 Square of the part correlation coefficient. This coefficient represents an increase in R2 when a variable is entered into a regression equation that already contains the other inde-pendent variables.
5 Measures based on standardised coefficients or beta weights. The most commonly used measures are the absolute values of the beta weights, |bi|, or the squared values, bi
2. Because they are partial coefficients, beta weights take into account the effect of the other independent variables. These measures become increasingly unreliable as the correlations among the predictor variables increase (multicollinearity increases).
6 Stepwise regression. The order in which the predictors enter or are removed from the regression equation is used to infer their relative importance.
Given that the predictors are correlated, at least to some extent, in virtually all regression situa-tions, none of these measures is satisfactory. It is also possible that the different measures may indicate a different order of importance of the predictors.28 Yet if all the measures are exam-ined collectively, useful insights may be obtained into the relative importance of the predictors.
Cross-validation
Before assessing the relative importance of the predictors or drawing any other inferences, it is necessary to cross-validate the regression model. Regression and other multivariate proce-dures tend to capitalise on chance variations in the data. This could result in a regression model or equation that is unduly sensitive to the specific data used to estimate the model. One approach for evaluating the model for this and other problems associated with regres-sion is cross-validation. Cross-validation examines whether the regression model continues
Cross-validationA test of validity that examines whether a model holds on comparable data not used in the original estimation.

663Chapter 22 Correlation and regression
to hold on comparable data not used in the estimation. The typical cross-validation procedure used in marketing research is as follows:
1 The regression model is estimated using the entire data set.
2 The available data are split into two parts, the estimation sample and the validation sam-ple. The estimation sample generally contains 50–90% of the total sample.
3 The regression model is estimated using the data from the estimation sample only. This model is compared with the model estimated on the entire sample to determine the agree-ment in terms of the signs and magnitudes of the partial regression coefficients.
4 The estimated model is applied to the data in the validation sample to predict the values of the dependent variable, Ŷ i for the observations in the validation sample.
5 The observed values, Yi, and the predicted values, Ŷ i, in the validation sample are corre-lated to determine the simple r2. This measure, r2, is compared with R2 for the total sam-ple and with R2 for the estimation sample to assess the degree of shrinkage.
A special form of validation is called double cross-validation. In double cross-validation the sample is split into halves. One half serves as the estimation sample, and the other is used as a validation sample in conducting cross-validation. The roles of the estimation and valida-tion halves are then reversed, and the cross-validation is repeated.
Double cross-validationA special form of validation in which the sample is split into halves. One half serves as the estimation sample and the other as a validation sample. The roles of the estimation and validation halves are then reversed and the cross-validation process is repeated.
Regression with dummy variables
Cross-validation is a general procedure that can be applied even in some special applications of regression, such as regression with dummy variables. Nominal or categorical variables may be used as predictors or independent variables by coding them as dummy variables. The concept of dummy variables was introduced in Chapter 21. In that chapter, we explained how a categorical variable with four categories (heavy users, medium users, light users and non-users) can be coded in terms of three dummy variables, D1, D2 and D3, as shown.
Suppose that the researcher was interested in running a regression analysis of the effect of attitude towards the brand on product use. The dummy variables, D1, D2 and D3, would be used as predictors. Regression with dummy variables would be modelled as follows:
Ŷi=a+b1D
1+b
2D
2+b
3D
3
Product usage category
Original variable code
Dummy variable code
D1 D2 D3
Non-users 1 1 0 0
Light users 2 0 1 0
Medium users 3 0 0 1
Heavy users 4 0 0 0
In this case, ‘heavy users’ has been selected as a reference category and has not been directly included in the regression equation. Note that for heavy users, D1, D2 and D3 assume a value of 0, and the regression equation becomes:
ˆ =Y ai
For non-users, D1 = 1 and D2 = D3 = 0, and the regression equation becomes:
Ŷi=a+b1

664 Marketing Research
Thus, the coefficient, b1, is the difference in predicted Ŷ i for non-users, as compared with heavy users. The coefficients b2 and b3 have similar interpretations. Although ‘heavy users’ was selected as a reference category, any of the other three categories could have been selected for this purpose.29
Analysis of variance and covariance with regression
Regression with dummy variables provides a framework for understanding the analysis of variance and covariance. Although multiple regression with dummy variables provides a general procedure for the analysis of variance and covariance, we show only the equivalence of regression with dummy variables to one-way analysis of variance. In regression with dummy variables, the predicted Ŷ for each category is the mean of Y for each category. To illustrate using the dummy variable coding of product use we just considered, the pre-dicted Ŷ and mean values for each category are as follows:
Product usage category Predicted value Mean value
Ŷi Ŷi
Non-users a + b1 a + b1
Light users a + b2 a + b2
Medium users a + b3 a + b3
Heavy users a a
Given this equivalence, it is easy to see further relationships between dummy variable regres-sion and one-way ANOVA.30
Thus, we see that regression in which the single independent variable with c categories has been recoded into c – 1 dummy variables is equivalent to one-way ANOVA. Using similar correspondences, one can also illustrate how n-way ANOVA and analysis of covari-ance can be performed using regression with dummy variables:
Dummy variable regression One-way ANOVA
= −©( ˆ )Yi Yi
n
1
2
iSSres
= SSwithin = SSerror
= −©( ˆ )Yi Yn
1
2
iSSreg
= SSbetween = SSx
R2 = h2
Overall F test = F test
Regression analysis in its various forms is a widely used technique, as further illustrated in the following example, which shows how regression can be used in investigating ethics in marketing research.
Real research Reasons for researchers regressing to unethical behaviour31
For reasons of time, convenience and cost, online channels have become the dominant in many areas of marketing research. It has been recognised for some time that the research community needs a coherent ethical code of practice to guide research activi-ties conducted online. Many online researchers are distressed at the manner in which

665Chapter 22 Correlation and regression
some researchers abuse the internet as a means of collecting data. In particular, market-ing research has been charged with engaging in deception, conflict of interest, violation of anonymity, invasion of privacy, data falsifications, dissemination of faulty research findings and the use of research as a guise to sell merchandise. It has been posited that when a researcher chooses to participate in unethical activities, that decision may be influenced by organisational factors. Therefore, a study using multiple regression analy-sis was designed to examine organisational factors as determinants of the incidence of unethical research practices. Six organisational variables were used as the independent variables, namely: extent of ethical problems within the organisation; top management actions on ethics; code of ethics; organisational rank; industry category; and organisa-tional role. The participant’s evaluation of the incidence of unethical marketing research practices served as the dependent variable. Regression analysis of the data suggested that four of the six organisational variables influenced the extent of unethical research practice: extent of ethical problems within the organisation; top management actions on ethics; industry category; and organisational role. Thus, to reduce the incidence of unethical research practice, top management should take stern actions, clarify roles and responsibilities for ethical violations and address the extent of general ethical problems within the organisation.
Practise data analysis with SPSS
SPSS Windows and Mac
The CORRELATE program computes Pearson product moment correlations with significance levels. Univariate statistics, covariance and cross-product deviations may also be requested. Sig-nificance levels are included in this output. To select this procedure, click:
Analyze>Correlate>Bivariate . . .Analyze>Correlate>Partial . . .
Scatterplots can be obtained by clicking:
Graphs>Scatter> . . . >Simple>Define
The following are the detailed steps for running a correlation between attitude towards the city and duration of residence, given in Table 22.1. A positive correlation is to be expected:
1 Select ANALYZE from the SPSS menu bar.2 Click CORRELATE and then BIVARIATE.3 Move ‘Attitude[attitude]’ into the VARIABLES box. Then move ‘Duration[duration]’
into the VARIABLES box.4 Click PEARSON under CORRELATION COEFFICIENTS.5 Check ONE_TAILED under TEST OF SIGNIFICANCE.6 Check FLAG SIGNIFICANT CORRELATIONS.7 Click OK.
REGRESSION calculates bivariate and multiple regression equations, associated statistics and plots. It allows easy examination of residuals. To select this procedure, click:
Analyze>Regression>Linear . . .
The following are the detailed steps for running a bivariate regression, with attitude towards the city as the dependent variable and duration of residence as the independent variable, using the data of Table 22.1:

666 Marketing Research
Summary The product moment correlation coefficient, r, measures the linear association between two metric (interval- or ratio-scaled) variables. Its square, r2, measures the proportion of variation in one variable explained by the other. The partial correlation coefficient meas-ures the association between two variables after controlling, or adjusting for, the effects of one or more additional variables. The order of a partial correlation indicates how many variables are being adjusted or controlled. Partial correlations can be very helpful for detecting spurious relationships.
Bivariate regression derives a mathematical equation between a single metric criterion variable and a single metric predictor variable. The equation is derived in the form of a straight line by using the least squares procedure. When the regression is run on standardised data, the intercept assumes a value of 0, and the regression coefficients are called beta weights. The strength of association is measured by the coefficient of determination, r2, which is obtained by computing a ratio of SSreg to SSy. The standard error of estimate is used to assess the accuracy of prediction and may be interpreted as a kind of average error made in predicting Y from the regression equation.
Multiple regression involves a single dependent variable and two or more independ-ent variables. The partial regression coefficient, b1, represents the expected change in Y when X1 is changed by one unit and X2 to Xk are held constant. The strength of association is measured by the coefficient of multiple determination, R2. The signifi-cance of the overall regression equation may be tested by the overall F test. Individual partial regression coefficients may be tested for significance using the incremental F test. Scattergrams of the residuals, in which the residuals are plotted against the pre-dicted values, Ŷ i time, or predictor variables, are useful for examining the appropri-ateness of the underlying assumptions and the regression model fitted. It is also useful to examine the histogram of standardised residuals, normal probability plot of stand-ardised residuals and the table of residual statistics.
In stepwise regression, the predictor variables are entered or removed from the regres-sion equation one at a time for the purpose of selecting a smaller subset of predictors that account for most of the variation in the criterion variable. Multicollinearity, or very high intercorrelations among the predictor variables, can result in several problems. Because the predictors are correlated, regression analysis provides no unambiguous
1 Select ANALYZE from the SPSS menu bar. 2 Click REGRESSION and then LINEAR. 3 Move ‘Attitude[attitude]’ into the DEPENDENT box. 4 Move ‘Duration[duration]’ into the INDEPENDENT(S) box. 5 Select ENTER in the METHOD box. 6 Click STATISTICS and check ESTIMATES under REGRESSION COEFFICIENTS. 7 Check MODEL FIT. 8 Click CONTINUE. 9 Click PLOTS. 10 In the LINEAR REGRESSION:PLOTS box, move *ZRESID into the Y: box and
*ZPRED into the X: box. 11 Check HISTOGRAM and NORMAL PROBABILITY PLOT in the STANDARDIZED
RESIDUAL PLOTS. 12 Click CONTINUE. 13 Click OK.
The steps for running multiple regression are similar except for step 4. In step 4, move ‘Duration[duration]’ and ‘Importance[importance]’ into the INDEPENDENT(S) box.

667Chapter 22 Correlation and regression
Questions 1 What is the product moment correlation coefficient? Does a product moment correlation of zero between two variables imply that the variables are not related to each other?
2 What are the main uses of regression analysis?
3 What is the least squares procedure?
4 Explain the meaning of standardised regression coefficients.
5 How is the strength of association measured in bivariate regression? In multiple regression?
6 What is meant by prediction accuracy? What is the standard error of the estimate?
7 What is multiple regression? How is it different from bivariate regression?
8 Explain the meaning of a partial regression coefficient. Why is it called that?
9 State the null hypothesis in testing the significance of the overall multiple regression equation. How is this null hypothesis tested?
10 What is gained by an examination of residuals?
11 Explain the stepwise regression approach. What is its purpose?
12 What is multicollinearity? What problems can arise because of multicollinearity?
13 Describe the cross-validation procedure. Describe double cross-validation.
14 What are some of the measures used to assess the relative importance of predictors in multiple regression?
15 Demonstrate the equivalence of regression with dummy variables to one-way ANOVA.
measure of relative importance of the predictors. Cross-validation examines whether the regression model continues to hold true for comparable data not used in estimation. It is a useful procedure for evaluating the regression model. Nominal or categorical variables may be used as predictors by coding them as dummy variables. Multiple regression with dummy variables provides a general procedure for the analysis of vari-ance and covariance.
Exercises 1 A supermarket chain wants to determine the effect of promotion on relative competitiveness. Data were obtained from 15 cities on the promotional expenses relative to a major competitor (competitor expenses = 100) and on sales relative to this competitor (competitor sales = 100).
City number Relative promotional expense Relative sales
1 95 982 92 943 103 1104 115 1255 77 82

668 Marketing Research
City number Relative promotional expense Relative sales
6 79 847 105 1128 94 999 85 93
10 101 10711 106 11412 120 13213 118 12914 75 7915 99 105
You are assigned the task of telling the manager whether there is any relationship between relative promotional expense and relative sales.
a Plot the relative sales (Y axis) against the relative promotional expense (X axis), and interpret the diagram.
b Which measure would you use to determine whether there is a relationship between the two variables? Why?
c Run a bivariate regression analysis of relative sales on relative promotional expense.
d Interpret the regression coefficients.
e Is the regression relationship significant?
f If the company matched the competitor in terms of promotional expense (if the relative expense was 100), what would the company’s relative sales be?
g Interpret the resulting r2.
2 To understand the role of quality and price in influencing the patronage of shoe shops, 14 major shoe shops in a large city were rated in terms of preference to shop, quality of shoes sold and price fairness. All the ratings were obtained on an 11-point scale, with higher numbers indicating more positive ratings.
Shoe shop number Preference Quality Price
1 6 5 32 9 6 113 8 6 44 3 2 15 10 6 116 4 3 17 5 4 78 2 1 49 11 9 8
10 9 5 1011 10 8 812 2 1 513 9 8 514 5 3 2
a Run a multiple regression analysis explaining shoe shop preference in terms of shoe quality and price fairness.

669Chapter 22 Correlation and regression
b Interpret the partial regression coefficients.
c Determine the significance of the overall regression.
d Determine the significance of the partial regression coefficients.
e Do you think that multicollinearity is a problem in this case? Why or why not?
3 You come across a magazine article reporting the following relationship between annual expenditure on prepared dinners (PD) and annual income (INC):
PD = 23.4 + 0.003INC
The coefficient of the INC variable is reported as significant.
a Does this relationship seem plausible? Is it possible to have a coefficient that is small in magnitude and yet significant?
b From the information given, can you tell how good the estimated model is?
c What are the expected expenditures on prepared dinners of a family earning €30,000?
d If a family earning €40,000 spent €130 annually on prepared dinners, what is the residual?
e What is the meaning of the negative residual?
4 In a survey pre-test, data were obtained from 20 participants on preference for boots (V1) on a seven-point scale (1 = not preferred, 7 = greatly preferred). The participants also provided their evaluations of the boots on comfort (V2), style (V3) and durability (V4), also on seven-point scales (1 = poor, 7 = excellent). The resulting data are given in the following table:
Number V1 V2 V3 V4
1 6 6 3 52 2 3 2 43 7 5 6 74 4 6 4 55 1 3 2 26 6 5 6 77 5 6 7 58 7 3 5 49 2 4 6 3
10 3 5 3 611 1 3 2 312 5 4 5 413 2 2 1 514 4 5 4 615 6 5 4 716 3 3 4 217 4 4 3 218 3 4 3 219 4 4 3 220 2 3 2 4
a Calculate the simple correlations between V1 and V4 and interpret the results.

670 Marketing Research
b Run a bivariate regression with preference for boots (V1) as the dependent variable and evaluation on comfort (V2) as the independent variable. Interpret the results.
c Run a bivariate regression with preference for boots (V1) as the dependent variable and evaluation on style (V3) as the independent variable. Interpret the results.
d Run a bivariate regression with preference for boots (V1) as the dependent variable and evaluation on durability (V4) as the independent variable. Interpret the results.
e Run a multiple regression with preference for boots (V1) as the dependent variable and V2 to V4 as the independent variables. Interpret the results. Compare the coefficients for V2, V3 and V4 obtained in the bivariate and the multiple regressions.
5 In a small group, discuss the following issues: ‘Regression is such a basic technique that it should always be used in analysing data’ and ‘What is the relationship between bivariate correlation, bivariate regression, multiple regression and analysis of variance?’
Notes
1. Harrington, A. and Bartsiewicz, P., ‘Who’s up? Who’s down?’, Fortune 150 (8) (18 October 2004), 181–6; Wojcik, J., ‘Avon’s benefits booklet presents easily understood information to all levels of the corporation’, Business Insurance 35 (47) (19 November 2001), 14; Miller, C., ‘Computer modeling rings the right bell for Avon’, Marketing News (9 May 1988), 14.
2. Maddox, K., ‘Online ad sales expected to keep growing in ‘05’, B to B 89 (11) (11 October, 2004), 12; Korgaonkar, P.K. and Smith, A.E., ‘Shopping orientation, demographic and media preference correlates of electronic shopping’, in Balm, K.D. (ed.), Developments in Marketing Science Vol. 11 (Blacksburg, VA: Academy of Marketing Science, 1988), 52–5.
3. Chen, P.Y. and Popovich, P.M., Correlation: Parametric and Nonparametric Measures (Thousand Oaks, CA: Sage, 2002); Bobko, P., Roth, P.L. and Bobko, C., ‘Correcting the effect size of d for range restriction and unreliability’, Organizational Research Methods 4 (1) (January 2001), 46–61; Draper, N.R. and Smith, H., Applied Regression Analysis, 3rd edn (New York: Wiley, 1998); Doherty, M.E. and Sullivan, J.A., ‘rho = p’, Organizational Behaviour and Human Decision Processes 43 (1) (February 1989), 136–44; Martin, W.S., ‘Effects of scaling on the correlation coefficient: Additional considerations’, Journal of Marketing Research 15 (May 1978), 304–8; Bollen, K.A. and Barb, RH., ‘Pearson’s R and coarsely categorized measures’, American Sociological Review 46 (1981), 232–9.
4. Cox, T. and Branco, J., Introduction to Multivariate Analysis (New York: Oxford University Press, 2002); Tacq, J., Multivariate Analysis Techniques in Social Science Research (Thousand Oaks, CA: Sage, 1997).
5. Although the topic is not discussed here, partial correlations can also be helpful in locating intervening variables and making certain types of causal inferences.
6. ‘Global gallery’, Advertising Age 78 (9) (February 2007), S-10; Goldsmith, R.E., ‘The impact of corporate credibility and celebrity credibility on consumer reaction to advertisements and brands’, Journal of Advertising 29 (3) (Fall 2000), 43–54; ‘Bates Saatchi & Saatchi, Budapest: Accounting for change’, Accountancy 116 (224) (August 1995), 31; Kasriel, K., ‘Hungary’s million-dollar slap’, Advertising Age (8 June 1992).
7. Another advantage to t is that it can be generalised to a partial correlation coefficient. Higgins, J.J., Introduction to Modern Nonparametric Statistics (Pacific Grove, CA: Duxbury, 2002); Pett, M.A., Nonparametric Statistics for Health Care Research (Thousand Oaks, CA: Sage, 1997); Siegel, S. and Castellan, N.J., Nonparametric Statistics, 2nd edn (New York: McGraw-Hill, 1988).
8. In a strict sense, the regression model requires that errors of measurement be associated only with the criterion variable and that the predictor variables be measured without error. For serially correlated errors, see Berk, R.A., Regression (Thousand Oaks, CA: Sage, 2003); Canjels, E. and Watson, M.W., ‘Estimating deterministic trends in the presence of serially correlated errors’, Review of Economics and Statistics 79 (2) (May 1997), 184–200. See also Bobko, P., Correlation and Regression: Applications for Industrial/Organizational Psychology and Management, 2nd edn (Thousand Oaks, CA: Sage, 2001). See also Fox, J., Applied Regression Analysis and Generalized Linear Models, 2nd edn (Thousand Oaks, CA: Sage, 2008).

671Chapter 22 Correlation and regression
9. See any text on regression, such as Kahane, L.H., Regression Basics, 2nd edn (Thousand Oaks, CA: Sage, 2007).
10. Technically, the numerator is b – b. Since it has been hypothesised that b = 0.0, however, it can be omitted from the formula.
11. The larger the SEE, the poorer the fit of the regression.
12. The assumption of fixed levels of predictors applies to the ‘classical’ regression model. It is possible, if certain conditions are met, for the predictors to be random variables. Their distribution is not allowed to depend on the parameters of the regression equation. See Allison, P.D., Fixed Effects Regression Models (Thousand Oaks, CA: Sage, 2009); Miles, J. and Shevlin, M., Applying Regression and Correlation: A Guide for Students and Researchers (Thousand Oaks, CA: Sage, 2001); Draper, N.R. and Smith, H., Applied Regression Analysis, 3rd edn (New York: Wiley, 1998).
13. For an approach to handling the violations of these assumptions, see Fong, D.K.H. and DeSarbo, W.S., ‘A Bayesian methodology for simultaneously detecting and estimating regime change points and variable selection in multiple regression models for marketing research’, Quantitative Marketing and Economics 5 (4) (December 2007), 427–53; Zellner, A., ‘Further results on Bayesian method of moments analysis of the multiple regression model’, International Economic Review 42 (1) (February 2001), 121–40; Dispensa, G.S., ‘Use logistic regression with customer satisfaction data’, Marketing News 31 (1) (6 January 1997), 13; Reddy, S.K., Holak, S.L. and Bhat, S., ‘To extend or not to extend: Success determinants of line extensions’, Journal of Marketing Research 31 (May 1994), 243–62.
14. da Silva Lopes, T. and Casson, M., ‘Entrepreneurship and the development of global brands’, Business History Review 81 (4) (January 2007), 651–80; Fan, Y., ‘The national image of global brands’, Journal of Brand Management 9 (3) (January 2002), 180–92; Donthu, N., Lee, S. and Yoo, B., ‘An examination of selected marketing mix elements and brand equity’, Academy of Marketing Science 28 (2) (Spring 2000), 195–211; Giges, N., ‘Europeans buy outside goods, but like local ads’, Advertising Age International (27 April 1992).
15. For other applications of multiple regression see Binninger, A.S., ‘Exploring the relationships between retail brands and consumer store loyalty’, International Journal of Retail & Distribution Management 36 (2) (2008), 94; Kirca, A.H., Jayachandran, S. and Bearden, W.O., ‘Market orientation: A meta-analytic review and assessment of its antecedents and impact upon performance’, Journal of Marketing 69 (April 2005), 24–41; Wertenbroch, K. and Skiera, B., ‘Measuring consumers’ willingness to pay at the point of purchase’, Journal of Marketing Research 39 (2) (May 2002), 228–41.
16. Yet another reason for adjusting R2 is that, as a result of the optimising properties of the least squares approach, it is a maximum. Thus, to some extent, R2 always overestimates the magnitude of a relationship.
17. If R2pop is zero, then the sample R2 reflects only sampling
error, and the F ratio will tend to be equal to unity.
18. Another approach is the hierarchical method, in which the variables are added to the regression equation in an order specified by the researcher.
19. Sirkin, R.M., Statistics for the Social Sciences, 3rd edn (Thousand Oaks, CA: Sage, 2005); Irwin, J.R. and McClelland, G.H., ‘Misleading heuristics and moderated multiple regression models’, Journal of Marketing Research 38 (1) (February 2001), 100–9; Atkinson, A.C., Koopman, S.J. and Shephard, N., ‘Detecting shocks: Outliers and breaks in time series’, Journal of Econometrics 80 (2) (October 1997), 387–422; Wang, G.C.S. and Akabay, C.K., ‘Autocorrelation: Problems and solutions in regression modeling’, Journal of Business Forecasting Methods and Systems 13 (4) (Winter 1994/95), 18–26; Belsley, D., Kub, E. and Walsh, R.E., Regression Diagnostics (New York: Wiley, 1980).
20. The Durbin–Watson test is discussed in virtually all regression textbooks. See also Allison, P.D., Fixed Effects Regression Models (Thousand Oaks, CA: Sage, 2009); Halkos, G.E. and Kevork, I.S., ‘A comparison of alternative root tests’, Journal of Applied Statistics 32 (1) (January 2005), 45–60.
21. Meiri, R. and Zahavi, J., ‘Using simulated annealing to optimize the feature selection problem in marketing applications’, European Journal of Operational Research 171 (3) (June 2006), 842–58; Fox, E.J. and Hoch, S.J., ‘Cherry-picking’, Journal of Marketing 69 (January 2005), 46–62; Schmitt, N., ‘Estimates for cross-validity for stepwise regression and with predictor selection’, Journal of Applied Psychology 84 (1) (February 1999), 50; Fox, J., Applied Regression Analysis, Linear Models and Related Methods (Thousand Oaks, CA: Sage, 1997); McIntyre, S.H., Montgomery, D.B., Srinivasan, V. and Weitz, B.A., ‘Evaluating the statistical significance of models developed by stepwise regression’, Journal of Marketing Research 20 (February 1983), 1–11.
22. Mondello, M. and Rishe, P., ‘Ticket price determination in professional sports: An empirical analysis of the NBA, NFL, NHL and Major League Baseball’, Sports Marketing Quarterly 13 (2004), 104–12.
23. Forseter, M. and Mahler, D.Q., ‘The Roper Starch Report’, Drug Store News (2000), 46–63; Jarboe, G.R. and McDaniel, C.D., ‘A profile of browsers in regional shopping malls’, Journal of the Academy of Marketing Science (Spring 1987), 46–53.
24. Possible procedures are given in Echambadi, R. and Hess, J.D., ‘Mean-centering does not alleviate collinearity problems in moderated multiple regression models’, Marketing Science 26 (3) (June 2007), 438–45; Sethi, R., Smith, D.C. and Whan Park, C., ‘Cross-functional product development teams, creativity and the innovations of new consumer products’, Journal of Marketing Research 38 (1) (February 2001), 73–85; Grapentine, T., ‘Path analysis vs. structural equation modeling’, Journal of Business Forecasting Methods and Systems 15 (1) (Spring 1996), 23–7; Wang, G.C.S., ‘How to handle multicollinearity in regression modelling’, Journal of Business Forecasting Methods and Systems 15 (1) (Spring 1996), 23–7; Mason, C.H. and Perreault, W.D. Jr, ‘Collinearity, power, and interpretation of multiple regression analysis’, Journal of Marketing Research 28 (August 1991), 268–80; Hocking, R.R., ‘Developments in linear regression methodology: 1959–1982’, Technometrics 25 (August 1983), 219–30; Snee, R.D., ‘Discussion’, Technometrics 25 (August 1983), 230–7.

672 Marketing Research
25. Billor, N., ‘An application of the local influence approach to ridge regression’, Journal of Applied Statistics 26 (2) (February 1999), 177–83; Holzworth, J.R., ‘Policy capturing with ridge regression’, Organizational Behavior and Human Decision Processes 68 (2) (November 1996), 171–9; Wildt, A.R., ‘Equity estimation and assessing market response’, Journal of Marketing Research 31 (February 1994), 437–51; Shanna, S. and James, W.L., ‘Latent root regression: An alternative procedure for estimating parameters in the presence of multicollinearity’, Journal of Marketing Research 18 (May 1981), 154–61.
26. Only relative importance can be determined, since the importance of an independent variable depends upon all the independent variables in the regression model.
27. Field, A., Discovering Statistics Using SPSS, 2nd edn (Thousand Oaks, CA: Sage, 2005); McClendon, M.J., Multiple Regression and Causal Analysis (Prospect Heights, IL: Waveland Press, 2002); Rugimbana, R., ‘Predicting automated teller machine usage: The relative importance of perceptual and demographic factors’, International Journal of Bank Marketing 13 (4) (1995), 26–32; Green, P.E., Carroll, S.D. and DeSarbo, W.S., ‘A new measure of predictor variable importance in multiple regression’, Journal of Marketing Research 15 (August 1978), 356–60; Jackson, B.B., ‘Comment on “A new measure of predictor variable importance in multiple regression”’, Journal of Marketing Research 17 (February 1980), 116–18.
28. In the rare situation in which all the predictors are uncorrelated, simple correlations = partial correlations = part correlations = betas. Hence, the squares of these measures will yield the same rank order of the relative importance of the variables.
29. For further discussion and applications of dummy variable regression, see Mauro, J., Hernandez, C. and
Mazzon, J.A., ‘Adoption of internet banking: Proposition and implementation of an integrated methodology approach’, International Journal of Bank Marketing 25 (3) (2007), 72–82; Glantz, S.A. and Slinker, B.K., Primer of Applied Regression and Analysis of Variance (Blacklick, OH: McGraw-Hill, 2000); Yavas, U., ‘Demand forecasting in a service setting’, Journal of International Marketing and Marketing Research 21 (1) (February 1996), 3–11. For further discussion on dummy variable coding, see Cohen, J. and Cohen, P., Applied Multiple Regression Correlation Analysis for the Behavioural Sciences, 2nd edn (Hillsdale, NJ: Lawrence Erlbaum Associates, 1983), 191–222.
30. Goode, M.M.H. and Harris, L.C., ‘Online behavioural intentions: An empirical investigation of antecedents and moderators’, European Journal of Marketing 41 (5/6) (2007), 512; Aguinis, H., Beaty, J.C., Boik, R.J. and Pierce, C.A., ‘Effect size and power in assessing moderating effects of categorical variables using multiple regression: A 30 year review’, Journal of Applied Psychology 90 (1) (2005), 94–107; Glantz, S.A. and Slinker, B.K., Primer of Applied Regression and Analysis of Variance (Blacklick, OH: McGraw-Hill, 2000); Fox, J., Applied Regression Analysis, Linear Models and Related Methods (Thousand Oaks, CA: Sage, 1997). For an application of regression analysis to conduct analysis of covariance, see Barone, M.J., Manning, K.C. and Miniard, P.W., ‘Consumer response to retailers’ use of partially comparative pricing’, Journal of Marketing 68 (July 2004), 37–47.
31. Anon., ‘World airline performance: Asia Pacific-transpacific recovery continues’, Interavia 58 (671) (May/June 2003), 35; Flottau, J., ‘Asian carriers advised to seek new formulas’, Aviation Week & Space 155 (23) (3 December, 2001), 45.

Discriminant and logit analysis
Discriminant analysis is used to
estimate the relationship
between a categorical dependent
variable and a set of interval-
scaled independent variables.
Stage 1
Problem definition
Stage 2
Research approach developed
Stage 3
Research design
developed
Stage 4
Fieldwork or data
collection
Stage 5
Data integrity
and analysis
23
Stage 6
Communicating research findings

674 Marketing Research
Objectives
After reading this chapter, you should be able to:
1 describe the concept of discriminant analysis, its objectives and its applications in marketing research;
2 outline the procedures for conducting discriminant analysis, including the formulation of the problem, estimation of the discriminant function coefficients, determination of significance, interpretation and validation;
3 discuss multiple discriminant analysis and the distinction between two-group and multiple discriminant analysis;
4 explain stepwise discriminant analysis and describe the Mahalanobis procedure;
5 describe the binary logit model and its advantages over discriminant and regression analysis;
6 understand the use of software to support discriminant and logit analysis.
This chapter discusses the technique of discriminant analysis. We begin by examining the relationship of this procedure to regression analysis (Chapter 22) and analysis of variance (Chapter 21). We present a model and describe the general procedure for conducting discriminant analysis, with an emphasis on formulation, estimation, determination of significance, interpretation and validation of the results. The procedure is illustrated with an example of two-group discriminant analysis, followed by an example of multiple (three-group) discriminant analysis. The stepwise discriminant analysis procedure is also covered. When the dependent variable is binary, the logit model can also be used instead of two-group discriminant analysis. We explain the logit model and discuss its relative merits versus discriminant and regression analyses. Finally, guidance is provided on the use of software to address the data analysis challenges presented in this chapter. We begin with an example that illustrates an application of multiple discriminant analysis.
Overview
Real research An eye for a bargain1
A study of 294 consumers was undertaken to determine the correlates of ‘rebate prone-ness’: in other words, the characteristics of consumers who respond favourably to direct mail promotions that offer a discount on the normal purchase price. The predictor vari-ables were four factors related to household shopping attitudes and behaviour and selected demographic characteristics (gender, age and income). The dependent variable was the extent to which participants were predisposed to take up the offer of a rebate, of which three levels were identified. Participants who reported no purchases triggered by a rebate during the past 12 months were classified as non-users, those who reported one or two such purchases were light users and those with more than two purchases were frequent users of discounts. Multiple discriminant analysis was used to analyse the data. Two primary findings emerged. First, consumers’ perception of the effort/value relation-ship was the most effective variable in discriminating among frequent users, light users and non-users of rebate offers. Clearly, ‘rebate-prone’ consumers associate less effort

675Chapter 23 Discriminant and logit analysis
with fulfilling the requirements of the rebated purchase, and are willing to accept a rela-tively smaller refund than other customers. Second, consumers who were aware of the regular prices of products, so that they recognise bargains, are more likely than others to respond to rebate offers. These findings were used by Dell (www.dell.com) to offer cash rebates on its notebook computers. The company felt that this would encourage rebate-sensitive customers to choose Dell notebooks.
Basic concept of discriminant analysis
Discriminant analysis is a technique for analysing data when the criterion or dependent variable is categorical and the predictor or independent variables are interval in nature.2 For example, the dependent variable may be the choice of the make of a new car (A, B or C) and the independent variables may be ratings of attributes of mobile phones on a seven-point Likert scale. The objectives of discriminant analysis are as follows:
1 Development of discriminant functions, or linear combinations of the predictor or inde-pendent variables, that best discriminate between the categories of the criterion or depend-ent variable (groups).
2 Examination of whether significant differences exist among the groups, in terms of the predictor variables.
3 Determination of which predictor variables contribute to most of the intergroup differences.
4 Classification of cases to one of the groups, based on the values of the predictor variables.
5 Evaluation of the accuracy of classification.
Discriminant analysis techniques are described by the number of categories possessed by the criterion variable. When the criterion variable has two categories, the technique is known as two-group discriminant analysis. When three or more categories are involved, the tech-nique is referred to as multiple discriminant analysis. The main distinction is that in the two-group case it is possible to derive only one discriminant function, but in multiple discri-minant analysis more than one function may be computed.3
Examples of discriminant analysis abound in marketing research. This technique can be used to answer questions such as:
• In terms of demographic characteristics, how do customers who exhibit loyalty to a par-ticular fashion brand differ from those who do not?
• Do heavy users, medium users and light users of soft drinks differ in terms of their con-sumption of frozen foods?
• What psychographic characteristics help differentiate between price-sensitive and non-price-sensitive buyers of groceries?
• Do market segments differ in their media consumption habits?
• What are the distinguishing characteristics of consumers who respond to direct mail offers?
Discriminant analysisA technique for analysing marketing research data when the criterion or dependent variable is categorical and the predictor or independent variables are interval in nature.
Discriminant functionThe linear combination of independent variables developed by discriminant analysis that will best discriminate between the categories of the dependent variable.
Two-group discriminant analysisDiscriminant analysis technique where the criterion variable has two categories.
Multiple discriminant analysisDiscriminant analysis technique where the criterion variable involves three or more categories.
In this example, significant intergroup differences were found using multiple predictor variables. An examination of differences across groups lies at the heart of the basic concept of discriminant analysis.

676 Marketing Research
Relationship of discriminant and logit analysis to ANOVA and regression
The relationships among discriminant analysis, analysis of variance (ANOVA) and regres-sion analysis are shown in Table 23.1. We explain these relationships with an example in which the researcher is attempting to explain the amount of life insurance purchased in terms of age and income. All three procedures involve a single criterion or dependent variable and multiple predictor or independent variables. The nature of these variables differs, however. In ANOVA and regression analysis, the dependent variable is metric or interval scaled (amount of life insurance purchased in euros), whereas in discriminant analysis, it is categor-ical (amount of life insurance purchased classified as high, medium or low). The independ-ent variables are categorical in the case of ANOVA (age and income are each classified as high, medium or low) but metric in the case of regression and discriminant analysis (age in years and income in euros, i.e. both measured on a ratio scale).
Two-group discriminant analysis, in which the dependent variable has only two catego-ries, is closely related to multiple regression analysis. In this case, multiple regression, in which the dependent variable is coded as a 0 or 1 dummy variable, results in partial regres-sion coefficients that are proportional to discriminant function coefficients (see the following section on the discriminant analysis model). The nature of dependent and independent vari-ables in the binary logit model is similar to that in the two-group discriminant analysis.
Discriminant analysis model
The discriminant analysis model involves linear combinations of the following form:
D = b0 + b1 + X1 + b2 + X2 + b3X3 + . . . + bkXk
where D = discriminant score
bs = discriminant coefficients or weight
Xs = predictor or independent variable.
The coefficients or weights (b) are estimated so that the groups differ as much as possible on the values of the discriminant function. This occurs when the ratio of between-group sum of squares to within-group sum of squares for the discriminant scores is at a maximum. Any other linear combination of the predictors will result in a smaller ratio.
We give a brief geometrical exposition of two-group discriminant analysis. Suppose we had two groups, G1 and G2, and each member of these groups was measured on two variables
Discriminant analysis modelThe statistical model on which discriminant analysis is based.
Table 23.1
ANOVA Regression Discriminant/Logit analysis
SimilaritiesNumber of dependent variables One One OneNumber of independent variables Multiple Multiple Multiple
DifferencesNature of the dependent variable Metric Metric Categorical/binaryNature of the independent variable Categorical Metric Metric
Similarities and differences among ANOVA, regression and discriminant analysis

677Chapter 23 Discriminant and logit analysis
X1 and X2. A scatter diagram of the two groups is shown in Figure 23.1, where X1 and X2 are the two axes. Members of G1 are denoted by 1 and members of G2 by 2. The resultant ellipses encompass some specified percentage of the points (members), say 93% in each group. A straight line is drawn through the two points where the ellipses intercept and then projected to a new axis, D. The overlap between the univariate distributions G1’ and G2’, represented by the shaded area in Figure 23.1, is smaller than would be obtained by any other line drawn through the ellipses representing the scatterplots. Thus the groups differ as much as possible on the D axis. Several statistics are associated with discriminant analysis.
Figure 23.1
A geometric interpretation of two-group discriminant analysis
X2
X1
D
G1́
G2́
G1
G2 11
1
111
1
11
11
1
1
1
1
1
2
222
2
22
2
2
2 22
2
2 2
2
Statistics associated with discriminant analysis
The important statistics associated with discriminant analysis include the following:
• Canonical correlation. Canonical correlation measures the extent of association between the discriminant scores and the groups. It is a measure of association between the single discriminant function and the set of dummy variables that define the group membership.
• Centroid. The centroid is the mean values for the discriminant scores for a particular group. There are as many centroids as there are groups, as there is one for each group. The means for a group on all the functions are the group centroids.
• Classification matrix. Sometimes also called the confusion or prediction matrix, the clas-sification matrix contains the number of correctly classified and misclassified cases. The correctly classified cases appear on the diagonal, because the predicted and actual groups are the same. The off-diagonal elements represent cases that have been incorrectly classi-fied. The sum of the diagonal elements divided by the total number of cases represents the hit ratio.
• Discriminant function coefficients. The discriminant function coefficients (unstandard-ised) are the multipliers of variables, when the variables are in the original units of measurement.
• Discriminant scores. The unstandardised coefficients are multiplied by the values of the variables. These products are summed and added to the constant term to obtain the discri-minant scores.

678 Marketing Research
• Eigenvalue. For each discriminant function, the eigenvalue is the ratio of between-group to within-group sums of squares. Large eigenvalues imply superior functions.
• F values and their significance. F values are calculated from a one-way ANOVA, with the grouping variable serving as the categorical independent variable. Each predictor, in turn, serves as the metric-dependent variable in the ANOVA.
• Group means and group standard deviations. Group means and group standard devia-tions are computed for each predictor for each group.
• Pooled within-group correlation matrix. The pooled within-group correlation matrix is computed by averaging the separate covariance matrices for all the groups.
• Standardised discriminant function coefficients. The standardised discriminant function coefficients are the discriminant function coefficients that are used as the multipliers when the variables have been standardised to a mean of 0 and a variance of 1.
• Structure correlations. Also referred to as discriminant loadings, the structure correla-tions represent the simple correlations between the predictors and the discriminant func-tion.
• Total correlation matrix. If the cases are treated as if they are from a single sample and the correlations are computed, a total correlation matrix is obtained.
• Wilks’ l. Sometimes also called the U statistic, Wilks’ l for each predictor is the ratio of the within-group sum of squares to the total sum of squares. Its value varies between 0 and 1. Large values of l (near 1) indicate that group means do not seem to be different. Small values of l (near 0) indicate that the group means seem to be different.
The assumptions in discriminant analysis are that each of the groups is a sample from a mul-tivariate normal population and that all the populations have the same covariance matrix. The role of these assumptions and the statistics just described can be better understood by examining the procedure for conducting discriminant analysis.
Conducting discriminant analysis
The steps involved in conducting discriminant analysis consist of formulation, estimation, determination of significance, interpretation and validation (see Figure 23.2). These steps are discussed and illustrated within the context of two-group discriminant analysis. Discriminant analysis with more than two groups is discussed later in this chapter.
Formulate the problem
The first step in discriminant analysis is to formulate the problem by identifying the objec-tives, the criterion variable and the independent variables. The criterion variable must consist of two or more mutually exclusive and collectively exhaustive categories. When the depend-ent variable is interval or ratio scaled, it must first be converted into categories. For example, attitude towards the brand, measured on a seven-point scale, could be categorised as unfa-vourable (1, 2, 3), neutral (4) or favourable (5, 6, 7). Alternatively, one could plot the distri-bution of the dependent variable and form groups of equal size by determining the appropriate cut-off points for each category. The predictor variables should be selected based on a theoretical model or previous research, or, in the case of exploratory research, the expe-rience of the researcher should guide their selection.
The next step is to divide the sample into two parts. One part of the sample, called the estimation or analysis sample, is used for estimation of the discriminant function. The other part, called the holdout or validation sample, is reserved for validating the discriminant function. When the sample is large enough, it can be split in half. One half serves as the
Analysis samplePart of the total sample used to check the results of the discriminant function.
Validation sampleThat part of the total sample used to check the results of the estimation sample.

679Chapter 23 Discriminant and logit analysis
analysis sample and the other is used for validation. The roles of the halves are then inter-changed and the analysis is repeated. This is called double cross-validation and is similar to the procedure discussed in regression analysis (Chapter 22).
Often, the distribution of the number of cases in the analysis and validation samples fol-lows the distribution in the total sample. For instance, if the total sample contained 50% loyal and 50% non-loyal consumers, then the analysis and validation samples would each contain 50% loyal and 50% non-loyal consumers. On the other hand, if the sample contained 25% loyal and 75% non-loyal consumers, the analysis and validation samples would be selected to reflect the same distribution (25% vs. 75%).
Finally, it has been suggested that the validation of the discriminant function should be conducted repeatedly. Each time, the sample should be split into different analysis and vali-dation parts. The discriminant function should be estimated and the validation analysis carried out. Thus, the validation assessment is based on a number of trials. More rigorous methods have also been suggested.4
To better illustrate two-group discriminant analysis, let us look at an example. Suppose we want to determine the salient characteristics of families that have visited a skiing resort during the last two years. Data were obtained from a pre-test sample of 42 households. Of these, 30 households, shown in Table 23.2, were included in the analysis sample and the remaining 12, shown in Table 23.3, were part of the validation sample. The households that visited a resort during the last two years were coded as 1; those that did not, as 2 (VISIT). Both the analysis and validation samples were balanced in terms of VISIT. As can be seen, the analysis sample contains 15 households in each category, whereas the validation sample had 6 in each category. Data were also obtained on annual family income (INCOME), atti-tude towards travel (TRAVEL, measured on a nine-point scale), importance attached to a family skiing holiday (HOLIDAY, measured on a nine-point scale), household size (HSIZE) and age of the head of the household (AGE).
Estimate the discriminant function coefficients
Once the analysis sample has been identified, as in Table 23.2, we can estimate the discrimi-nant function coefficients. Two broad approaches are available. The direct method involves estimating the discriminant function so that all the predictors are included simultaneously. In this case, each independent variable is included, regardless of its discriminating power. This method is appropriate when, based on previous research or a theoretical model, the researcher
Direct methodAn approach to discriminant analysis that involves estimating the discriminant function so that all the predictors are included simultaneously.
Figure 23.2
Conducting discriminant analysis
Formulate the problem
Estimate the discriminantfunction coe�cients
Determine the signi�canceof the discriminant function
Interpret the results
Assess validity ofdiscriminant analysis

680 Marketing Research
wants the discrimination to be based on all the predictors. An alternative approach is the stepwise method. In stepwise discriminant analysis, the predictor variables are entered sequentially, based on their ability to discrimi-nate among groups. This method, described in more detail later in this chapter, is appropriate when the researcher wants to select a subset of the predictors for inclusion in the discriminant function.
The results of running two-group discriminant analysis on the data of Table 23.2 using a popular statistical analy-sis package are presented in Table 23.4. Some intuitive feel for the results may be obtained by examining the group means and standard deviations. It appears that the two groups are more widely separated in terms of
Stepwise discriminant analysisDiscriminant analysis in which the predictors are entered sequentially based on their ability to discriminate between the groups.
Table 23.2 Information on skiing holiday: analysis sample
Number Resort visit Annual family income (€000)
Attitude towards travel
Importance attached to family skiing
holiday
Household size
Age of head of
household
Amount spent on family skiing
holiday
1 1 50.2 5 8 3 43 M (2) 2 1 70.3 6 7 4 61 H (3) 3 1 62.9 7 5 6 52 H (3) 4 1 48.5 7 5 5 36 L (1) 5 1 52.7 6 6 4 55 H (3) 6 1 75.0 8 7 5 68 H (3) 7 1 46.2 5 3 3 62 M (2) 8 1 57.0 2 4 6 51 M (2) 9 1 64.1 7 5 4 57 H (3)10 1 68.1 7 6 5 45 H (3)11 1 73.4 6 7 5 44 H (3)12 1 71.9 5 8 4 64 H (3)13 1 56.2 1 8 6 54 M (2)14 1 49.3 4 2 3 56 H (3)15 1 62.0 5 6 2 58 H (3)16 2 32.1 5 4 3 58 L (1)17 2 36.2 4 3 2 55 L (1)18 2 43.2 2 5 2 57 M (2)19 2 50.4 5 2 4 37 M (2)20 2 44.1 6 6 3 42 M (2)21 2 38.3 6 6 2 45 L (1)22 2 55.0 1 2 2 57 M (2)23 2 46.1 3 5 3 51 L (1)24 2 35.0 6 4 5 64 L (1)25 2 37.3 2 7 4 54 L (1)26 2 41.8 5 1 3 56 M (2)27 2 57.0 8 3 2 36 M (2)28 2 33.4 6 8 2 50 L (1)29 2 37.5 3 2 3 48 L (1)30 2 41.3 3 3 2 42 L (1)

681Chapter 23 Discriminant and logit analysis
Table 23.3 Information on skiing holiday: validation sample
Number Resort visit Annual family income (€000)
Attitude towards travel
Importance attached to family skiing
holiday
Household size
Age of head of
household
Amount spent on family skiing
holiday
1 1 50.8 4 7 3 45 M (2) 2 1 63.6 7 4 7 55 H (3) 3 1 54.0 6 7 4 58 M (2) 4 1 45.0 5 4 3 60 M (2) 5 1 68.0 6 6 6 46 H (3) 6 1 62.1 5 6 3 56 H (3) 7 2 35.0 4 3 4 54 L (1) 8 2 49.6 5 3 5 39 L (1) 9 2 39.4 6 5 3 44 H (3)10 2 37.0 2 6 5 51 L (1)11 2 54.5 7 3 3 37 M (2)12 2 38.2 2 2 3 49 L (1)
Table 23.4 Results of two-group discriminant analysis
Group means
Visit INCOME TRAVEL HOLIDAY HSIZE AGE
1 60.52000 5.40000 5.80000 4.33333 53.733332 41.91333 4.33333 4.06667 2.80000 50.13333
Total 51.21667 4.86667 4.93333 3.56667 51.93333
Group standard deviations
1 9.83065 1.91982 1.82052 1.23443 8.770622 7.55115 1.95180 2.05171 0.94112 8.27101
Total 12.79523 1.97804 2.09981 1.33089 8.57395
Pooled within-groups correlation matrix
INCOME TRAVEL HOLIDAY HSIZE AGE
INCOME 1.00000TRAVEL 0.19745 1.00000
HOLIDAY 0.09148 0.08434 1.00000HSIZE 0.08887 –0.01681 0.07046 1.00000AGE –0.01431 –0.19709 0.01742 –0.04301 1.00000

682 Marketing Research
Table 23.4 Continued
Wilks’ L (U statistic) and univariate F ratio with 1 and 28 degrees of freedom
Variable Wilks’ l F Significance
INCOME 0.45310 33.800 0.0000TRAVEL 0.92479 2.277 0.1425
HOLIDAY 0.82377 5.990 0.0209HSIZE 0.65672 14.640 0.0007AGE 0.95441 1.338 0.2572
Canonical discriminant functions
Function Eigenvalue Per cent of variance
Cumulative percentage
Canonical correlation
After function
Wilks’ l
Chi- square
df Sig.
1* 1.7862 100.00 100.00 0.8007 0 0.3589 26.13 5 0.0001
*Marks the one canonical discriminant function remaining in the analysis.
Standard canonical discriminant function coefficients
Func 1
INCOME 0.74301TRAVEL 0.09611
HOLIDAY 0.23329HSIZE 0.46911AGE 0.20922
Structure matrix: pooled within-groups correlations between discriminating variables and canonical discriminant functions (variables ordered by size of correlation within function)
Func 1
INCOME 0.82202HSIZE 0.54096
HOLIDAY 0.34607TRAVEL 0.21337
AGE 0.16354
Unstandardised canonical discriminant function coefficients
Func 1
INCOME 0.8476710E-01TRAVEL 0.4964455E-01
HOLIDAY 0.1202813HSIZE 0.4273893AGE 0.2454380E-01
(Constant) –7.975476

683Chapter 23 Discriminant and logit analysis
income than other variables, and there appears to be more of a separation on the importance attached to the family skiing holiday than on attitude towards travel. The difference between the two groups on age of the head of the household is small, and the standard deviation of this variable is large.
The pooled within-groups correlation matrix indicates low correlations between the pre-dictors. Multicollinearity is unlikely to be a problem. The significance of the univariate F ratios indicates that, when the predictors are considered individually, only income, impor-tance of holiday and household size significantly differentiate between those who visited a resort and those who did not.
Table 23.4 Continued
Canonical discriminant functions evaluated at group means (group centroids)
Group Func 1
1 1.291182 –1.29118
Classification results
Predicted group membership Total
Visit 1 2
Original Count 1 12 3 152 0 15 15
% 1 80.0 20.0 100.02 0.0 100.0 100.0
Cross-validated Count 1 11 4 152 2 13 15
% 1 73.3 26.7 100.02 13.3 86.7 100.0
a Cross-validation is done only for those cases in the analysis. In cross-validation, each case is classified by the functions derived from all cases other than that case.b 90.0% of original grouped cases correctly classified.c 80.0% of cross-validated grouped cases correctly classified.
Classification results for cases not selected for use in analysis (holdout sample)
Predicted group membership
Actual group No. of cases 1 2
Group 1 6 4 266.7% 33.3%
Group 2 6 0 60.0% 100%
Percentage of grouped cases correctly classified: 83.33%

684 Marketing Research
Because there are two groups, only one discriminant function is estimated. The eigen-value associated with this function is 1.7862, and it accounts for 100% of the explained variance. The canonical correlation associated with this function is 0.8007. The square of this correlation, (0.8007)2 = 0.64, indicates that 64% of the variance in the dependent varia-ble (VISIT) is explained or accounted for by this model. The next step is determination of significance.
Determine the significance of the discriminant function
It would not be meaningful to interpret the analysis if the discriminant functions estimated were not statistically significant. The null hypothesis that, in the population, the means of all discriminant functions in all groups are equal can be statistically tested. In SPSS, this test is based on Wilks’ l. If several functions are tested simultaneously (as in the case of multiple discriminant analysis), the Wilks’ l statistic is the product of the univariate l for each function. The significance level is estimated based on a chi-square transformation of the statistic. In testing for significance in the holiday resort example (see Table 23.4), it may be noted that the Wilks’ l associated with the function is 0.3589, which transforms to a chi-square of 26.13 with 5 degrees of freedom. This is significant beyond the 0.05 level. If the null hypothesis is rejected, indicating significant discrimination, one can proceed to interpret the results.5
Interpret the results
The interpretation of the discriminant weights, or coefficients, is similar to that in multiple regression analysis. The value of the coefficient for a particular predictor depends on the other predictors included in the discriminant function. The signs of the coefficients are arbi-trary, but they indicate which variable values result in large and small function values and associate them with particular groups.
Given the multicollinearity in the predictor variables, there is no unambiguous measure of the relative importance of the predictors in discriminating between the groups.6 With this caveat in mind, we can obtain some idea of the relative importance of the variables by exam-ining the absolute magnitude of the standardised discriminant function coefficients. Gener-ally, predictors with relatively large standardised coefficients contribute more to the discriminating power of the function, as compared with predictors with smaller coefficients, and are therefore more important.
Some idea of the relative importance of the predictors can also be obtained by examining the structure correlations, also called canonical loadings or discriminant loadings. These simple correlations between each predictor and the discriminant function represent the vari-ance that the predictor shares with the function. Like the standardised coefficients, these correlations must also be interpreted with caution.
An examination of the standardised discriminant function coefficients for the holiday resort example is instructive. Given the low intercorrelations between the predictors, one might cautiously use the magnitudes of the standardised coefficients to suggest that income is the most important predictor in discriminating between the groups, followed by household size and importance attached to the family skiing holiday. The same observation is obtained from examination of the structure correlations. These simple correlations between the pre-dictors and the discriminant function are listed in order of magnitude.
The unstandardised discriminant function coefficients are also given. These can be applied to the raw values of the variables in the holdout set for classification purposes. The group centroids, giving the value of the discriminant function evaluated at the group means, are also shown. Group 1, those who have visited a resort, has a positive value, whereas group 2 has an equal negative value. The signs of the coefficients associated with all the predictors are positive, which suggests that higher family income, household size, importance attached

685Chapter 23 Discriminant and logit analysis
to family skiing holiday, attitude towards travel and age are more likely to result in the fam-ily visiting the resort. It would be reasonable to develop a profile of the two groups in terms of the three predictors that seem to be the most important: income, household size and importance of holiday. The values of these three variables for the two groups are given at the beginning of Table 23.4.
The determination of relative importance of the predictors is further illustrated by the fol-lowing example.
Real research Satisfied salespeople stay7
A survey asked business people about the cli-mate of hiring and maintaining employees in harsh economic conditions. It was reported that 85% of participants were concerned about recruiting employees and 81% said they were concerned about retaining employees. When the economy is down, turnover is rapid. Generally speaking, if an organisation wants to retain its employees, it must learn why people leave their jobs and why others stay and are satisfied with their jobs. Discriminant analysis was used to determine what factors explained the differences between salespeople who left a large computer manufacturing company and those who stayed. The independent variables were company rating, job security, seven job satisfac-tion dimensions, four role-conflict dimensions, four role-ambiguity dimensions and nine measures of sales performance. The dependent variable was the dichotomy between those who stayed and those who left. The canonical correlation, an index of discrimination (R = 0.4572), was significant (Wilks’ l = 0.7909, F26,173 = 1.7588, p = 0.0180). This result indicated that the variables discriminated between those who left and those who stayed.
Discriminant analysis results
Variable Coefficients Standardised coefficients
Structure correlations
1 Worka 0.0903 0.3910 0.54462 Promotiona 0.0288 0.1515 0.50443 Job security 0.1567 0.1384 0.49584 Customer relationsb 0.0086 0.1751 0.49065 Company rating 0.4059 0.3240 0.48246 Working with othersb 0.0018 0.0365 0.46517 Overall performanceb –0.0148 –0.3252 0.45188 Time-territory managementb 0.0126 0.2899 0.44969 Sales producedb 0.0059 0.1404 0.4484
10 Presentation skillb 0.0118 0.2526 0.438711 Technical informationb 0.0003 0.0065 0.417312 Pay benefitsa 0.0600 0.1843 0.378813 Quota achievedb 0.0035 0.2915 0.378014 Managementa 0.0014 0.0138 0.3571

686 Marketing Research
15 Information collectionb –0.0146 –0.3327 0.332616 Familyc –0.0684 –0.3408 –0.322117 Sales managera –0.0121 –0.1102 0.290918 Coworkera 0.0225 0.0893 0.267119 Customerc –0.0625 –0.2797 –0.260220 Familyd 0.0473 0.1970 0.218021 Jobd 0.1378 0.5312 0.211922 Jobc 0.0410 0.5475 –0.102923 Customerd –0.0060 –0.0255 0.100424 Sales managerc –0.0365 –0.2406 –0.049925 Sales managerd –0.0606 –0.3333 0.046726 Customera –0.0338 –0.1488 0.0192
Note: Rank order of importance is based on the magnitude of the canonical loadings:a Satisfactionb Performancec Ambiguityd Conflict.
The results from simultaneously entering all variables in discriminant analysis are pre-sented in the table above. The rank order of importance, as determined by the relative magnitude of the canonical loadings, is presented in the first column. Satisfaction with the job and promotional opportunities were the two most important discriminators, fol-lowed by job security. Those who stayed in the company found the job to be more exciting, satisfying, challenging and interesting than those who left.
Variable Coefficients Standardised coefficients
Structure correlations
In this example, promotion was identified as the second-most important variable based on the canonical loadings. However, it is not the second-most important variable based on the absolute magnitude of the standardised discriminant function coefficients. This anomaly results from multicollinearity.
Another aid to interpreting discriminant analysis results is to develop a characteristic profile for each group by describing each group in terms of the group means for the predictor variables. If the important predictors have been identified, then a comparison of the group means on these variables can assist in understanding the intergroup differences. Before any findings can be interpreted with confidence, however, it is necessary to validate the results.
Assess the validity of discriminant analysis
Many programs, such as SPSS, offer a leave-one-out cross-validation option. In this option, the discriminant model is re-estimated as many times as there are participants in the sample. Each re-estimated model leaves out one participant and the model is used to predict for that participant. When a large holdout sample is not possible, this gives a sense of the robustness of the estimate using each participant, in turn, as a holdout.
As explained earlier, the data should be randomly divided into two subsamples: analysis and validation. The analysis sample is used for estimating the discriminant function; the validation sample is used for developing the classification matrix. The discriminant weights, estimated by using the analysis sample, are multiplied by the values of the predictor varia-bles in the holdout sample to generate discriminant scores for the cases in the holdout sample.
Characteristic profileAn aid to interpreting discriminant analysis results by describing each group in terms of the group means for the predictor variables.

687Chapter 23 Discriminant and logit analysis
The cases are then assigned to groups based on their discriminant scores and an appropriate decision rule. For example, in two-group discriminant analysis, a case will be assigned to the group whose centroid is the closest. The hit ratio, or the percentage of cases correctly clas-sified, can then be determined by summing the diagonal elements and dividing by the total number of cases.8
It is helpful to compare the percentage of cases correctly classified by discriminant analy-sis with the percentage that would be obtained by chance. When the groups are equal in size, the percentage of chance classification is one divided by the number of groups. How much improvement should be expected over chance? No general guidelines are available, although some authors have suggested that classification accuracy achieved by discriminant analysis should be at least 25% greater than that obtained by chance.9
Most discriminant analysis programs also estimate a classification matrix based on the analysis sample. Because they capitalise on chance variation in the data, such results are invariably better than the classification obtained on the holdout sample.
Table 23.4, for the holiday resort example, also shows the classification results based on the analysis sample. The hit ratio, or the percentage of cases correctly classified, is (12 + 15)/30 = 0.90, or 90%. One might suspect that this hit ratio is artificially inflated, as the data used for estimation were also used for validation. Leave-one-out cross-validation correctly classifies only (11 + 13)/30 = 0.80, or 80% of the cases. Conducting classification analysis on an independent holdout set of data results in the classification matrix with a slightly lower hit ratio of (4 + 6)/12 = 0.833, or 83.3% (see Table 23.4). Given two groups of equal size, by chance one would expect a hit ratio of 1/2 = 0.50, or 50%. Hence, the improvement over chance is more than 25%, and the validity of the discriminant analysis is judged as satisfactory.
Another application of two-group discriminant analysis is provided by the following example.
Hit ratioThe percentage of cases correctly classified by discriminant analysis.
Real research Home bodies and couch potatoes10
Two-group discriminant analysis was used to assess the strength of each of five dimen-sions used in classifying individuals as TV users or non-users. The discriminant analysis procedure was appropriate for this use because of the nature of the predefined categor-ical groups (users and non-users) and the interval scales used to generate individual factor scores.
Two equal groups of 185 elderly consumers, users and non-users (total n = 370), were created. The discriminant equation for the analysis was estimated by using a subsample of 142 participants from the sample of 370. Of the remaining participants, 198 were used as a validation subsample in a cross-validation of the equation. Thirty participants were excluded from the analysis because of missing discriminant values.
The canonical correlation for the discriminant function was 0.4291, significant at the p < 0.0001 level. The eigenvalue was 0.2257. The table below summarises the standard-ised canonical discriminant coefficients. A substantial portion of the variance is explained by the discriminant function. In addition, as the table shows, the home- orientation dimension made a fairly strong contribution to classifying individuals as users or non-users of TV. Morale, security and health and respect also contributed sig-nificantly. The social factor appeared to make little contribution.
The cross-validation procedure using the discriminant function from the analysis sample gave support to the contention that the dimensions aided researchers in dis-criminating between users and non-users of TV. As the table shows, the discriminant function was successful in classifying 75.76% of the cases. This suggests that considera-tion of the identified dimensions will help marketers understand elderly consumers.

688 Marketing Research
The extension from two-group discriminant analysis to multiple discriminant analysis involves similar steps and is illustrated with an application.
Summary of discriminant analysis
Standard canonical discriminant function coefficients
Morale 0.27798Security and health 0.39850Home orientation 0.77496Respect 0.32069Social –0.01996
Classification results for cases selected for use in the analysis
Predicted group membership
Actual group No. of cases Non-users Users
TV non-users 77 56 2172.7% 27.3%
TV users 65 24 4136.9% 63.1%
Per cent of grouped cases correctly classified: 68.31%
Classification results for cases selected for cross-validation
Predicted group membership
Actual group No. of cases Non-users Users
TV non-users 108 85 2378.7% 21.3%
TV users 90 25 6527.8% 72.2%
Per cent of grouped cases correctly classified: 75.76%
Conducting multiple discriminant analysis
Formulate the problem
The data presented in Tables 23.2 and 23.3 can also be used to illustrate three-group discri-minant analysis. In the last column of these tables, the households are classified into three categories, based on the amount spent on their family skiing holiday (high, medium or low). Ten households fall in each category. The question of interest is whether the households that spend high, medium or low amounts on their holidays (AMOUNT) can be differentiated in terms of annual family income (INCOME), attitude towards travel (TRAVEL), importance attached to family skiing holiday (HOLIDAY), household size (HSIZE) and age of the head of household (AGE).11

689Chapter 23 Discriminant and logit analysis
Estimate the discriminant function coefficients
Table 23.5 presents the results of estimating three-group discriminant analysis. An examina-tion of group means indicates that income appears to separate the groups more widely than any other variable. There is some separation on travel and holiday. Groups 1 and 2 are very close in terms of household size and age. Age has a large standard deviation relative to the separation between the groups. The pooled within-groups correlation matrix indicates some correlation of holiday and household size with income. Age has some negative correlation with travel. Yet these correlations are on the lower side, indicating that, although multicol-linearity may be of some concern, it is not likely to be a serious problem. The significance attached to the univariate F ratios indicates that, when the predictors are considered individu-ally, only income and travel are significant in differentiating between the two groups.
In multiple discriminant analysis, if there are G groups, G − 1 discriminant functions can be estimated if the number of predictors is larger than this quantity. In general, with G groups and k predictors, it is possible to estimate up to the smaller of G − 1, or k, discriminant func-tions. The first function has the highest ratio of between-groups to within-groups sum of squares. The second function, uncorrelated with the first, has the second highest ratio, and so on. Not all the functions may be statistically significant, however.
Because there are three groups, a maximum of two functions can be extracted. The eigen-value associated with the first function is 3.8190, and this function accounts for 93.93% of variance in the data. The eigenvalue is large, so the first function is likely to be superior. The second function has a small eigenvalue of 0.2469 and accounts for only 6.07% of the variance.
Table 23.5 Results of three-group discriminant analysis
Group means
Amount INCOME TRAVEL HOLIDAY HSIZE AGE
1 38.57000 4.50000 4.70000 3.10000 50.300002 50.11000 4.00000 4.20000 3.40000 49.500003 64.97000 6.10000 5.90000 4.20000 56.00000
Total 51.21667 4.86667 4.93333 3.56667 51.93333
Group standard deviations
1 5.29718 1.71594 1.88856 1.19722 8.097322 6.00231 2.35702 2.48551 1.50555 9.252633 8.61434 1.19722 1.66333 1.13529 7.60117
Total 12.79523 1.97804 2.09981 1.33089 8.57395
Pooled within-groups correlation matrix
INCOME TRAVEL HOLIDAY HSIZE AGE
INCOME 1.00000TRAVEL 0.05120 1.00000HOLIDAY 0.30681 0.03588 1.00000HSIZE 0.38050 0.00474 0.22080 1.00000AGE –0.20939 –0.34022 –0.01326 –0.02512 1.00000

690 Marketing Research
Table 23.5 Continued
Wilks’ L (U statistic) and univariate F ratio with 2 and 27 degrees of freedom
Variable Wilks’ l F Significance
INCOME 0.26215 38.000 0.0000TRAVEL 0.78790 3.634 0.0400HOLIDAY 0.88060 1.830 0.1797HSIZE 0.87411 1.944 0.1626AGE 0.88214 1.804 0.1840
Canonical discriminant functions
Function Eigenvalue Per cent of variance
Cumulative percentage
Canonical correlation
After function
Wilks’ l Chi-square
df Sig.
0 0.1664 44.831 10 0.001* 3.8190 93.93 93.93 0.8902 1 0.8020 5.517 4 0.242* 0.2469 6.07 100.00 0.4450
* Marks the two canonical discriminant functions remaining in the analysis.
Standardised canonical discriminant function coefficients
Func 1 Func 2
INCOME 1.04740 –0.42076TRAVEL 0.33991 0.76851HOLIDAY –0.14198 0.53354HSIZE –0.16317 0.12932AGE 0.49474 0.52447
Structure matrix: pooled within-groups correlations between discriminating variables and canonical discriminant functions (variables ordered by size of correlation within function)
Func 1 Func 2
INCOME 0.85556* –0.27833HSIZE 0.19319* 0.07749HOLIDAY 0.21935 0.58829*TRAVEL 0.14899 0.45362*AGE 0.16576 0.34079*
Unstandardised canonical discriminant function coefficients
Func 1 Func 2
INCOME 0.1542658 –0.6197148E-01TRAVEL 0.1867977 0.4223430HOLIDAY –0.6952264E-01 0.2612652HSIZE –0.1265334 0.1002796AGE 0.5928055E-01 0.6284206E-01(Constant) –11.09442 –3.791600

691Chapter 23 Discriminant and logit analysis
Table 23.5 Continued
Canonical discriminant functions evaluated at group means (group centroids)
Group Func 1 Func 2
1 –2.04100 0.418472 –0.40479 –0.658673 2.44578 0.24020
Classification results
Predicted group membership
Amount 1 2 3 Total
Original Count 1 9 1 0 102 1 9 0 103 0 2 8 10
% 1 90.0 10.0 0.0 100.02 10.0 90.0 0.0 100.03 0.0 20.0 80.0 100.0
Cross-validated
Count 1 7 3 0 102 4 5 1 103 0 2 8 10
% 1 70.0 30.0 0.0 100.02 40.0 50.0 10.0 100.03 0.0 20.0 80.0 100.0
aCross-validation is done only for those cases in the analysis. In cross-validation, each case is classified by the functions derived from all cases other than that case.b86.7% of original grouped cases correctly classified.c66.7% of cross-validated grouped cases correctly classified.
Classification results for cases not selected for use in analysis
Predicted group membership
Actual group No. of cases 1 2 3
Group 1 4 3 1 075.0% 25.0% 0.0%
Group 2 4 0 3 10.0% 75.0% 25.0%
Group 3 4 1 0 325.0% 0.0% 75.0%
Percentage of grouped cases correctly classified: 75.00%

692 Marketing Research
Determine the significance of the discriminant function
To test the null hypothesis of equal group centroids, both the functions must be considered simultaneously. It is possible to test the means of the functions successively by first testing all means simultaneously. Then one function is excluded at a time, and the means of the remaining functions are tested at each step. In Table 23.5, the 0 below the ‘After function’ heading indicates that no functions have been removed. The value of Wilks’ l is 0.1644. This transforms to a chi-square of 44.831, with 10 degrees of freedom, which is significant beyond the 0.05 level. Thus, the two functions together significantly discriminate among the three groups. When the first function is removed, however, the Wilks’ l associated with the second function is 0.8020, which is not significant at the 0.05 level. Therefore, the second function does not contribute significantly to group differences.
Interpret the results
The interpretation of the results is aided by an examination of the standardised discriminant function coefficients, the structure correlations and certain plots. The standardised coeffi-cients indicate a large coefficient for income on function 1, whereas function 2 has relatively larger coefficients for travel, holiday and age. A similar conclusion is reached by an exami-nation of the structure matrix (see Table 23.5). To help interpret the functions, variables with large coefficients for a particular function are grouped together. These groupings are shown with asterisks. Thus income and household size have asterisks for function 1 because these variables have coefficients that are larger for function 1 than for function 2. These variables
Figure 23.3
All-groups scattergram
4.0
0.0
1
1
11
–6.0 –4.0 –2.0 2.0 4.0 6.00.0
2 2
2
1 *2 2
11 2 3* 3
1
Across: Function 1Down: Function 2
1 3
33323*1
–4.0
*indicates a group centroid
3

693Chapter 23 Discriminant and logit analysis
are associated primarily with function 1. On the other hand, travel, holiday and age are pre-dominantly associated with function 2, as indicated by the asterisks.
Figure 23.3 is a scattergram plot of all the groups on function 1 and function 2. It can be seen that group 3 has the highest value on function 1, and group 1 the lowest. Because func-tion 1 is primarily associated with income and household size, one would expect the three groups to be ordered on these two variables. Those with higher incomes and higher house-hold size are likely to spend large amounts of money on holidays. Conversely, those with low incomes and smaller household size are likely to spend small amounts on holidays. This interpretation is further strengthened by an examination of group means on income and household size.
Figure 23.3 further indicates that function 2 tends to separate group 1 (highest value) and group 2 (lowest value). This function is primarily associated with travel, holiday and age. Given the positive correlations of these variables with function 2 in the structure matrix, we expect to find group 1 to be higher than group 2 in terms of travel, holiday and age. This is indeed true for travel and holiday, as indicated by the group means of these variables. If families in group 1 have more favourable attitudes towards travel and attach more impor-tance to a family skiing holiday than group 2, why do they spend less? Perhaps they would like to spend more on holidays but cannot afford it because they have low incomes.
A similar interpretation is obtained by examining a territorial map, as shown in Figure 23.4. In a territorial map, each group centroid is indicated by an asterisk. The group boundaries are shown by numbers corresponding to the groups. Thus, group 1 centroid is bounded by ls, group 2 centroid by 2s and group 3 centroid by 3s.
Territorial mapA tool for assessing discriminant analysis results by plotting the group membership of each case on a graph.
Figure 23.4
Territorial map
+
1 3
1 3
1 3
1 3
1 3
1 3
1 3
1 1 3
1 1 2 3
1 1 2 2* 2 2 3
2 3 31 1 2 2
1 1 2 2 2 2 3 3
2 2 31 1 1 2 2
2 3 31 1 2 2 2
2 2 31 1 2 2
1 1 1 2 2 2 3 3
2 2 3 31 1 1 2 2
1 1 2 2 2 2 3
1 1 1 2 2 2 3 3
1 1 2 2 3 3
*1 1 1 2 2 2 2 3 3*
+ + + + + +
+ + + + + +
+ + + + +
–8.0 –6.0 –4.0 –2.0 0.0 2.0 4.0 6.0 8.0
Across: Function 1Down: Function 2
–8.0
–4.0
0.0
4.0
8.0
*indicates a group centroid

694 Marketing Research
Assess the validity of discriminant analysis
The classification results based on the analysis sample indicate that (9 + 9 + 8)/30 = 86.67% of the cases are correctly classified. Leave-one-out cross-validation correctly classifies only (7 + 5 + 8)/30 = 0.667 or 66.7% of the cases. When the classification analysis is conducted on the independent holdout sample of Table 23.3, a hit ratio of (3 + 3 + 3)/12 = 75% is obtained. Given three groups of equal size, by chance alone one would expect a hit ratio of 1/3 = 0.333 or 33.3%. The improvement over chance is more than 25%, indicating at least satisfactory validity.
Further illustration of multiple group discriminant analysis is provided by the following example.
Real research The home is where the patient’s heart is12
In the majority of developed nations, the largest sector in the economy is the health care industry. It is expected that spending on health care services will continue to grow faster than national economies. Contributing to this growth are demographic forces, with shrinking birth rates, ageing populations, longer life expectancies and with rapidly growing numbers of elderly patients seeking health support of some kind. Consumers were surveyed to determine their attitudes towards four systems of health care delivery (home health care, hospitals, nursing homes and outpatient clinics) along 10 attributes. A total of 102 responses were obtained, and the results were analysed using multiple discriminant analysis (Table 1 below). Three discriminant functions were identified. Chi-square tests performed on the results indi-cated that all three discriminant functions were significant at the 0.01 level. The first function accounted for 63% of the total discriminative power, and the remaining two functions contributed 29.4% and 7.6%, respectively.
Table 1 gives the standardised discriminant function coefficients of the 10 variables in the discriminant equations. Coefficients ranged in value from –1 to +1. In determining the ability of each attribute to classify the delivery system, absolute values were used. In the first discriminant function, the two variables with the largest coefficients were com-fort (0.53) and privacy (0.40). Because both related to personal attention and care, the first dimension was labelled ‘personalised care’. In the second function, the two variables with the largest coefficients were quality of medical care (0.67) and likelihood of faster recovery (0.32). Hence, this dimension was labelled ‘quality of medical care’. In the third discriminant function, the most significant attributes were sanitation (–0.70) and expense (0.52). Because these two attributes represent value and price, the third discriminant function was labelled ‘value’.
The four group centroids are shown in Table 2. This table shows that home health care was evaluated most favourably along the dimension of personalised care, and hos-pitals were evaluated least favourably. Along the dimension of quality of medical care, there was a substantial separation between nursing homes and the other three systems. Also, home health care received higher evaluations on the quality of medical care than did outpatient clinics. Outpatient clinics, on the other hand, were judged to offer the best value.

695Chapter 23 Discriminant and logit analysis
Classification analysis of the 102 responses, reported in Table 3, showed correct clas-sifications ranging from 86% for hospitals to 68% for outpatient clinics. The misclassifica-tions for hospitals were 6% each to nursing homes and outpatient clinics and 2% to home health care. Nursing homes showed misclassifications of 9% to hospitals, 10% to outpatient clinics and 3% to home health care. For outpatient clinics, 9% misclassifica-tions were made to hospitals, 13% to nursing homes and 10% to home health care. For home health care, the misclassifications were 5% to hospitals, 4% to nursing homes and 13% to outpatient clinics. The results demonstrated that the discriminant functions were fairly accurate in predicting group membership.
Table 1 Standardised discriminant function coefficients
Variable systemDiscriminant function
1 2 3
Safe –0.20 –0.04 0.15Convenient 0.08 0.08 0.07Chance of medical complicationsa –0.27 0.10 0.16Expensivea 0.30 –0.28 0.52Comfortable 0.53 0.27 –0.19Sanitary –0.27 –0.14 –0.70Best medical care –0.25 0.67 –0.10Privacy 0.40 0.08 0.49Faster recovery 0.30 0.32 –0.15Staffed with best medical personnel –0.17 –0.03 0.18 Percentage of variance explained 63.0 29.4 7.6 Chi-square 663.3b 289.2b 70.1b
aThese two items were worded negatively on the questionnaire. They were reverse coded for purposes of data analysis.bp < 0.01.
Table 2 Centroids of health care systems in discriminant space
SystemDiscriminant function
1 2 3
Hospital –1.66 0.97 –0.08Nursing home –0.60 –1.36 –0.27Outpatient clinic 0.54 –0.13 0.77Home health care 1.77 0.50 –0.39
Table 3 Classification table
SystemClassification (%)
Hospital Nursing home Outpatient clinic Home health care
Hospital 86 6 6 2Nursing home 9 78 10 3Outpatient clinic 9 13 68 10Home health care 5 4 13 78

696 Marketing Research
Stepwise discriminant analysis
Stepwise discriminant analysis is analogous to stepwise multiple regression (see Chapter 22) in that the predictors are entered sequentially based on their ability to discriminate between the groups. An F ratio is calculated for each predictor by conducting a univariate ANOVA in which the groups are treated as the categorical variable and the predictor as the criterion variable. The predictor with the highest F ratio is the first to be selected for inclusion in the discriminant function, if it meets certain significance and tolerance criteria. A second predic-tor is added based on the highest adjusted or partial F ratio, taking into account the predictor already selected.
Each predictor selected is tested for retention based on its association with other predic-tors selected. The process of selection and retention is continued until all predictors meeting the significance criteria for inclusion and retention have been entered in the discriminant function. Several statistics are computed at each stage. In addition, at the conclusion, a sum-mary of the predictors entered or removed is provided. The standard output associated with the direct method is also available from the stepwise procedure.
The selection of the stepwise procedure is based on the optimising criterion adopted. The Mahalanobis procedure is based on maximising a generalised measure of the distance between the two closest groups. This procedure allows researchers to make maximum use of the available information.13
The Mahalanobis method was used to conduct a two-group stepwise discriminant analysis on the data pertaining to the visit variable in Tables 23.2 and 23.3. The first predictor variable to be selected was income, followed by household size and then holiday. The order in which the variables were selected also indicates their importance in discriminating between the groups. This was further corroborated by an examination of the standardised discriminant function coefficients and the structure correlation coefficients. Note that the findings of the stepwise analysis agree with the conclusions reported earlier by the direct method.
Mahalanobis procedureA stepwise procedure used in discriminant analysis to maximise a generalised measure of the distance between the two closest groups.
The logit model
When the dependent variable is binary and there are several independent variables that are met-ric, in addition to two-group discriminant analysis one can also use ordinary least squares (OLS) regression, and the logit and the probit models for estimation. The data preparation for running OLS regression and the logit and probit models is similar in that the dependent variable is coded as 0 or 1. OLS regression was discussed in Chapter 22. The probit model is less commonly used and will not be discussed, but here we give an explanation of the binary logit model.
Conducting binary logit analysis
The steps involved in conducting binary logit analysis are given in Figure 23.5.14
Formulate the problem
As discussed earlier under the basic concept of discriminant analysis, there are several instances in marketing where we want to explain a binary dependent variable in terms of metric independent variables. (Note that logit analysis can also handle categorical independ-ent variables when these are recoded using dummy variables, as discussed in Chapters 19 and 22.) Discriminant analysis deals with the issue of which group an observation is likely to belong to. On the other hand, the binary logit model commonly deals with the issue of how
Binary logit modelThe binary logit model commonly deals with the issue of how likely an observation is to belong to each group. It estimates the probability of an observation belonging to a particular group.

697Chapter 23 Discriminant and logit analysis
likely an observation is to belong to each group. Thus, the logit model falls somewhere between regression and discriminant analysis in application. We can estimate the probability of a binary event taking place using the binary logit model, also called logistic regression. Consider an event that has two outcomes: success and failure. The probability of success may be modelled using the logit model as:
1–log =e X + + +...0 1 1a a X 2 2a X k ka
pp
or
=©
01–log =e i i
i
kpp
Xa
or
=+
=©
©
exp
exp
0
1
p
Xak
k
ii
=0i
i
Xai i
where p = probability of success Xi = independent variable i ai = parameter to be estimated.
It can be seen from the third equation that although Xi may vary from –∞ to +∞, p is con-strained to lie between 0 and 1. When Xi approaches –∞, p approaches 0, and when Xi approaches +∞, p approaches 1. This is desirable because p is a probability and must lie between 0 and 1. On the other hand, when OLS regression is used the estimation model is:
=©
0
=p Xan
ii
i
Thus, when OLS regression is used, p is not constrained to lie between 0 and 1; it is possible to obtain estimated vales of p that are less than 0 or greater than 1. These values are, of course, conceptually and intuitively unappealing. We demonstrate this phenomenon in our illustrative application. As in the case of discriminant analysis, the researcher should specify the objectives and clearly identify the binary criterion variables and the independent variables
Figure 23.5
Conducting binary logit analysis.
Formulate the binary logit problem
Estimate the binary logit model
Determine model �t
Test the signi�cance of individual parameters
Interpret the coe�cients and validate

698 Marketing Research
that will be considered in the analysis. Moreover, the sample may have to be divided into analysis and validation subsamples.
Estimating the binary logit model
As discussed in Chapter 22, the linear regression model is fit by the OLS procedure. In OLS regression, the parameters are estimated so as to minimise the sum of squared errors of prediction. The error terms in regression can take on any values and are assumed to fol-low a normal distribution when conducting statistical tests. In contrast, in the binary logit model, each error can assume only two values. If Y = 0, the error is p, and if Y = 1, the error is 1–p. Therefore, we would like to estimate the parameters in such a way that the estimated values of p would be close to 0 when Y = 0 and close to 1 when Y = 1. The pro-cedure that is used to achieve this and estimate the parameters of the binary logit model is called the maximum likelihood method. This method is so called because it estimates the parameters so as to maximise the likelihood, or probability, of observing the actual data.
Model fit
In multiple regression the model fit is measured by the square of the multiple correlation coef-ficient, R2, which is also called the coefficient of multiple determination (see Chapter 22). In logistic regression (binary logit), commonly used measures of model fit are based on the like-lihood function and are the Cox and Snell R square and Nagelkerke R square. Both these measures are similar to R2 in multiple regression. The Cox and Snell R square is constrained in such a way that it cannot equal 1.0, even if the model perfectly fits the data. This limitation is overcome by the Nagelkerke R square.
As discussed earlier in the chapter, in discriminant analysis the model fit is assessed by determining the proportion of correct prediction. A similar procedure can also be used for the binary logit model. If the estimated probability is greater than 0.5, then the predicted value of Y is set to 1. On the other hand, if the estimated probability is less than 0.5, then the predicted value of Y is set to 0. The predicted values of Y can then be compared with the corresponding actual values to determine the percentage of correct predictions.
Significance testing
The testing of individual estimated parameters or coefficients for significance is similar to that in multiple regression. In this case, the significance of the estimated coefficients is based on Wald’s statistic. This statistic is a test of significance of the logistic regression coefficient based on the asymptotic normality property of maximum likelihood estimates, and is estimated as:
2( a / SE )
i=Wald ai
where ai = logistical coefficient for that predictor variable SEai = standard error of the logistical coefficient.
The Wald statistic is chi-square distributed with 1 degree of freedom if the variable is metric, and the number of categories minus 1 if the variable is non-metric.
The associated significance has the usual interpretation. For practical purposes, the sig-nificance of the null hypothesis is that ai can also be tested using a t test where the degrees of freedom equal the number of observations minus the number of estimated parameters. The ratio of the coefficient to its standard error is compared with the critical t value. For a large number of observations, the z test can be used.
Interpretation of the coefficients and validation
The interpretation of the coefficients or estimated parameters is similar to that in multiple regression, taking into account, of course, that the nature of the dependent variable is different. In logistic regression, the log odds, that is loge(p/1–p), is a linear function of the estimated parameters. Thus, if Xi is increased by one unit, the log odds will increase by ai

699Chapter 23 Discriminant and logit analysis
units, when the effect of other independent variables is held constant. Thus ai is the size of the increase in the log odds of the dependent variable event when the corresponding inde-pendent variable Xi is increased by one unit and the effect of the other independent variables is held constant. The sign of ai will determine whether the probability increases (if the sign is positive) or decreases (if the sign is negative). The validation process is very similar to that discussed for discriminant analysis. The analysis sample is used for estimating the model coefficients; the validation sample is used for developing the classification matrix. As before, the hit ratio is the percentage of cases correctly classified.
An illustrative application of logistic regression
We illustrate the logit model by analysing the data of Table 23.6. This table gives the data for 30 participants, 15 of whom are brand loyal (indicated by 1) and 15 of whom are not (indi-cated by 0). We also measure attitude towards the brand (Brand), attitude towards the prod-uct category (Product) and attitude towards shopping (Shopping), all on a 1 (unfavourable) to 7 (favourable) scale. The objective is to estimate the probability of a consumer being brand loyal as a function of attitude towards the brand, the product category and shopping.
Table 23.6
No. Loyalty Brand Product Shopping
1 1 4 3 52 1 6 4 43 1 5 2 44 1 7 5 55 1 6 3 46 1 3 4 57 1 5 5 58 1 5 4 29 1 7 5 4
10 1 7 6 411 1 6 7 212 1 5 6 413 1 7 3 314 1 5 1 415 1 7 5 516 0 3 1 317 0 4 6 218 0 2 5 219 0 5 2 420 0 4 1 321 0 3 3 422 0 3 4 523 0 3 6 324 0 4 4 225 0 6 3 626 0 3 6 327 0 4 3 228 0 3 5 229 0 5 5 330 0 1 3 2
Explaining brand loyalty

700 Marketing Research
First we run an OLS regression on the data of Table 23.6 to illustrate the limitations of this procedure for analysing binary data. The estimated equation is given by:
p=−0.684+0.183(Brand)+0.020(Product)+0.074(Shopping)
wherep = probability of a consumer being brand loyal.
Only the constant term and ‘Brand’ are significant at the 0.05 level. It can be seen from the estimated regression equation that the estimated values of p are negative for the low val-ues of the independent variables (e.g. when Brand = 1, Product = 1 and Shopping = 1, and for many other values of Brand = 1, 2 or 3). Likewise, the estimated values of p are greater than 1 for high values of the independent variables (e.g. when Brand = 7, Product = 7 and Shop-ping = 7). This is intuitively and conceptually unappealing because p is a probability and must lie between 0 and 1.
This limitation of OLS regression is overcome by logistic regression. The output for logistic regression when analysing the data for Table 23.6 is shown in Table 23.7. The Cox and Snell R square and Nagelkerke R square measures indicate a reasonable fit of the model to the data. This is further verified by the classification table that reveals that 24 of the 30 cases, i.e. 80%, are correctly classified. The significance of the estimated coefficients is based on Wald’s statistic. We note that only attitude towards the brand is significant in explaining brand loyalty. Unlike discriminant analysis, logistic regression results in standard
Table 23.7
Dependent variable encoding
Original value Internal value
Not loyal
Loyal
0
1
Model summary
Step –2 log likelihood Cox and Snell R square Nagelkerke R square
1 23.471a 0.453 0.604
a Estimation terminated at iteration number 6 because parameter estimates changed by less than 0.001.
Classification tablea
Predicted
Loyalty to the brand
Not loyal Loyal Percentage correct
Step 1 Loyalty to the brand Not loyal 12 3 80.0
Loyal 3 12 80.0
Overall percentage 80.0
a The cut value is 0.500.
Results of binary logit model or logistic regression

701Chapter 23 Discriminant and logit analysis
Table 23.7
Variables in the equation
B SE Wald df Sig. Exp(B)
Step 1a Brand 1.274 0.479 7.075 1 0.008 3.575
Product 0.186 0.322 0.335 1 0.563 1.205
Shopping 0.590 0.491 1.442 1 0.230 1.804
Constant –8.642 3.346 6.672 1 0.010 0.000
a Variable(s) entered on step 1: Brand, Product, Shopping.
Continued
error estimates for the estimated coefficients, and hence their significance can be assessed. The positive sign for the coefficient indicates that positive attitude towards the brand results in higher loyalty towards the brand. Attitude towards the product category and attitude towards shopping do not influence brand loyalty. Thus, a manager seeking to increase brand loyalty should focus on fostering a more positive attitude towards the brand and not worry about attitude towards the product category or attitude towards shopping. The logit model can also be used when the dependent variable has more than two categories. In this case, the model is termed the multinomial logit.15
Discriminant analysis in its various forms is a widely used technique as further illustrated in the following two examples. The first example illustrates an application in the context of international marketing research. The second example shows how discriminant analysis can be used in investigating ethical behaviour.
Real research Satisfactory results of satisfaction programmes16
In their marketing strategies, computer companies are emphasising the quality of their customer service programmes rather than focusing upon technical features and capa-bilities. Hewlett-Packard learned this lesson in Europe. Research conducted across Europe revealed that there was a difference in emphasis on service requirements across age segments. Focus groups revealed that customers above 40 years of age had a hard time with the technical aspects of the computer and greatly required the customer ser-vice programmes. On the other hand, younger customers appreciated the technical aspects of the product that added to their satisfaction. To uncover the factors leading to differences in the two segments, further research in the form of a large single cross-sec-tional survey was undertaken. A two-group discriminant analysis was conducted with satisfied and dissatisfied customers as the two groups, with several independent varia-bles such as technical information, ease of operation and variety and scope of customer service programmes. Results confirmed the fact that the variety and scope of customer satisfaction programmes was indeed a strong differentiating factor. This was a crucial finding because Hewlett-Packard could better handle dissatisfied customers by focusing more on customer services than on technical details. Consequently, Hewlett-Packard successfully started three programmes on customer satisfaction: customer feedback, customer satisfaction surveys and total quality control. This effort resulted in increased customer satisfaction.

702 Marketing Research
Real research Discriminant analysis discriminates ethical and unethical behaviour17
In order to identify the important variables that predict ethical and unethical behaviour, discriminant analysis was used. Prior research suggested that the variables that affect ethical decisions were attitudes, leadership, the presence or absence of ethical codes of conduct and the organisation’s size. To determine which of these variables were the best predictors of ethical behaviour, 149 firms were surveyed and asked to indicate how their firm operated in 18 different ethical situations. Of these 18 situations, 9 related to mar-keting activities. These activities included using misleading sales presentations, accept-ing gifts for preferential treatment and pricing below out-of-pocket expenses. Based on these nine issues, the participating firms were classified into two groups: ‘never practice’ and ‘practice’. An examination of the variables that influenced classification via two-group discriminant analysis indicated that attitudes and a company’s size were the best predictors of ethical behaviour. Evidently, smaller firms tended to demonstrate more ethical behaviour on marketing issues.
Practise data analysis with SPSS
SPSS Windows and Mac
The DISCRIMINANT program performs both two-group and multiple discriminant analy-sis. To select this procedure, click:
Analyze>Classify>Discriminant …
The following are the detailed steps for running a two-group discriminant analysis with Resort Visit (visit) as the dependent variable and annual family income (income), attitude towards travel (attitude), importance attached to family vacation (vacation), household size (hsize), and age of the household (age) as the independent variables, using the data in Table 23.2:
1 Select ANALYZE from the SPSS menu bar.
2 Click CLASSIFY and then DISCRIMINANT.
3 Move ‘visit’ into the GROUPING VARIABLE box.
4 Click DEFINE RANGE. Enter 1 for MINIMUM and 2 for MAXIMUM. Click CONTINUE.
5 Move ‘income,’ ‘travel,’ ‘vacation,’ ‘hsize’ and ‘age’ into the INDEPENDENTS box.
6 Select ENTER INDEPENDENTS TOGETHER (default option).
7 Click on STATISTICS. In the pop-up window, in the DESCRIPTIVES box check MEANS and UNIVARIATE ANOVAS. In the MATRICES box check WITHIN-GROUP CORRELATIONS. Click CONTINUE.
8 Click CLASSIFY … In the pop-up window in the PRIOR PROBABILITIES box check ALL GROUPS EQUAL (default). In the DISPLAY box check SUMMARY TABLE and LEAVE-ONE-OUT CLASSIFICATION. In the USE COVARIANCE MATRIX box check WITHIN-GROUPS. Click CONTINUE.
9 Click OK.

703Chapter 23 Discriminant and logit analysis
The steps for running three-group discriminant analysis are similar. Select the appropriate dependent and independent variables. In step 4, click DEFINE RANGE. Enter 1 for MINI-MUM and 3 for MAXIMUM. Click CONTINUE. For running stepwise discriminant analy-sis, in step 6 select USE STEPWISE METHOD.
To run logit analysis or logistic regression, click:
Analyze>Regression>Binary Logistic …
The following are the detailed steps for running logit analysis with brand loyalty as the dependent variable and attitude towards the brand (brand), attitude towards the product cat-egory (product) and attitude toward shopping (shopping) as the independent variables, using the data of Table 23.6:
1 Select ANALYZE from the SPSS menu bar.
2 Click REGRESSION and then BINARY LOGISTIC.
3 Move ‘Loyalty to the Brand [Loyalty]’ into the DEPENDENT VARIABLE box.
4 Move ‘Attitude towards the Brand [Brand]’, ‘Attitude towards the Product category [Product]’ and ‘Attitude towards Shopping [Shopping]’ into the COVARIATES (S box).
5 Select ENTER for METHOD (default option).
6 Click OK.
Summary Discriminant analysis is useful for analysing data when the criterion or dependent vari-able is categorical and the predictor or independent variables are interval scaled. When the criterion variable has two categories, the technique is known as two-group discrimi-nant analysis. Multiple discriminant analysis refers to the cases where three or more categories are involved.
Conducting discriminant analysis is a five-step procedure. First, formulating the dis-criminant problem requires identification of the objectives and the criterion and pre-dictor variables. The sample is divided into two parts. One part, the analysis sample, is used to estimate the discriminant function. The other part, the holdout sample, is reserved for validation. Estimation, the second step, involves developing a linear com-bination of the predictors, called discriminant functions, so that the groups differ as much as possible on the predictor values.
Determination of statistical significance is the third step. It involves testing the null hypothesis that, in the population, the means of all discriminant functions in all groups are equal. If the null hypothesis is rejected, it is meaningful to interpret the results.
The fourth step, the interpretation of discriminant weights or coefficients, is similar to that in multiple regression analysis. Given the multicollinearity in the predictor vari-ables, there is no unambiguous measure of the relative importance of the predictors in discriminating between the groups. Some idea of the relative importance of the vari-ables, however, may be obtained by examining the absolute magnitude of the stand-ardised discriminant function coefficients and by examining the structure correlations or discriminant loadings. These simple correlations between each predictor and the discriminant function represent the variance that the predictor shares with the func-tion. Another aid to interpreting discriminant analysis results is to develop a charac-teristic profile for each group, based on the group means for the predictor variables.

704 Marketing Research
Validation, the fifth step, involves developing the classification matrix. The discrimi-nant weights estimated by using the analysis sample are multiplied by the values of the predictor variables in the holdout sample to generate discriminant scores for the cases in the holdout sample. The cases are then assigned to groups based on their discriminant scores and an appropriate decision rule. The percentage of cases cor-rectly classified is determined and compared with the rate that would be expected by chance classification. Two broad approaches are available for estimating the coeffi-cients. The direct method involves estimating the discriminant function so that all the predictors are included simultaneously. An alternative is the stepwise method in which the predictor variables are entered sequentially, based on their ability to dis-criminate among groups.
In multiple discriminant analysis, if there are G groups and k predictors, it is possible to estimate up to the smaller of G – 1, or k, discriminant functions. The first function has the highest ratio of between-group to within-group sums of squares; the second function, uncorrelated with the first, has the second highest ratio, and so on.
Logit analysis, also called logistic regression, is an alternative to two-group discrimi-nant analysis when the dependent variable is binary. The logit model estimates the probability of a binary event. Unlike OLS regression, the logit model constrains the probability to lie between 0 and 1. Unlike discriminant analysis, logistic regression results in standard error estimates for the estimated coefficients and hence their sig-nificance can be assessed.
Questions 1 What are the objectives of discriminant analysis?
2 Describe four examples of the application of discriminant analysis.
3 What is the main distinction between two-group and multiple discriminant analysis?
4 Describe the relationship of discriminant analysis to regression and ANOVA.
5 What are the steps involved in conducting discriminant analysis?
6 How should the total sample be split for estimation and validation purposes?
7 What is Wilks’ l? For what purpose is it used?
8 Define discriminant scores.
9 Explain what is meant by an eigenvalue.
10 What is a classification matrix?
11 Explain the concept of structure correlations.
12 How is the statistical significance of discriminant analysis determined?
13 Describe a common procedure for determining the validity of discriminant analysis.
14 When the groups are of equal size, how is the accuracy of chance classification determined?
15 How does the stepwise discriminant procedure differ from the direct method?

705Chapter 23 Discriminant and logit analysis
Exercises 1 In investigating the differences between heavy, light or non-users of frozen foods, it was found that the two largest standardised discriminant function coefficients were 0.97 for convenience orientation and 0.61 for income. Is it correct to conclude that convenience orientation is more important than income when each variable is considered by itself?
2 Given the following information, calculate the discriminant score for each participant. The value of the constant is 2.04.
Unstandardised discriminant function coefficients
Age 0.38
Income 0.44
Risk taking –0.39
Optimistic 1.26
Participant ID Age Income Risk taking Optimistic
0246 36 43.7 21 65
1337 44 62.5 28 56
2375 57 33.5 25 40
2454 63 38.7 16 36
3 Analyse the Benetton data (taken from Exercise 4, Chapter 20). Do the three usage groups differ in terms of awareness, attitude, preference, intention and loyalty towards Benetton when these variables are considered simultaneously?
4 In a small group, discuss the following issue: ‘Is it meaningful to determine the relative importance of predictors in discriminating between the groups? Why or why not?’
Notes
1. Qiang, L. and Moorthy, S., ‘Coupons versus rebates’, Marketing Science 26 (1) (February 2007), 67–82; Michealree, J., ‘Incentive programs mean more than money to retailers’, Agri Marketing 42 (5) (June 2004), 32; Lichtenstein, D.R., Burton, S. and Netemeyer, R.G., ‘An examination of deal proneness across sales promotion types: A consumer segmentation perspective’, Journal of Retailing 73 (2) (Summer 1997), 283–97; Jolson, M.A., Wiener, J.L. and Rosecky, R.B., ‘Corrleates of rebate proness’, Journal of Advertising Research (February–March 1987), 33–43.
2. A detailed discussion of discriminant analysis may be found in McLachlan, G.J., Discriminant Analysis and Statistical Pattern Recognition (Hoboken, NJ: Wiley, 2004); Kemsley, E.K., Discriminant Analysis and Class Modeling of Spectroscopic Data (New York: Wiley, 1998); Tacq, J., Multivariate Analysis Techniques in Social Science Research (Thousand Oaks, CA: Sage, 1996); Lachenbruch, P.A., Discriminant Analysis (New York: Hafner Press, 1975). For an application, see Ofir,
C., ‘Reexamining latitude of price acceptability and price thresholds: Predicting basic consumer reaction to price’, Journal of Consumer Research 30 (March 2004), 612–21.
3. See Johnson, R.A. and Wichern, D.W., Applied Multivariate Statistical Analysis, 5th edn (Paramus, NJ: Prentice Hall, 2001); Klecka, W.A., Discriminant Analysis (Beverly Hills, CA: Sage, 1980). See also Sinclair, S.A. and Stalling, E.C., ‘How to identify differences between market segments with attribute analysis’, Industrial Marketing Management 19 (February 1990), 31–40.
4. Ping, R., ‘Second-order latent variables: Interactions, specification, estimation and an example’, American Marketing Association, Conference Proceedings, Chicago, 18 (January 2007), 286; Yoon, S.J. and Kang, J.W., ‘Validation of marketing performance model for service industries in Korea’, Services Marketing Quarterly 26 (4) (2005), 57; Franses, P.H., ‘A test for the hit rate in binary response models’, International Journal of Market Research 42 (2) (Spring 2000), 239–45;

706 Marketing Research
Mitchell, V.W., ‘How to identify psychographic segments: Part 2’, Marketing Intelligence and Planning 12 (7) (1994), 11–16; Crask, M.R. and Perrault, W.D. Jr, ‘Validation of discriminant analysis in marketing research’, Journal of Marketing Research 14 (February 1977), 60–8.
5. Strictly speaking, before testing for the equality of group means, the equality of group covariance matrices should be tested. Box’s M test can be used for this purpose. If the equality of group covariance means is rejected, the results of discriminant analysis should be interpreted with caution. In this case, the power of the test for the equality of group means decreases.
6. See Hanna, N., ‘Brain dominance and the interpretation of advertising messages’, International Journal of Commerce & Management 9 (3/4) (1999), 19–32; Fok, L., Angelidis, J.P., Ibrahim, N.A. and Fok, W.M., ‘The utilization and interpretation of multivariate statistical techniques in strategic management’, International Journal of Management 12 (4) (December 1995), 468–81; Morrison, D.G., ‘On the interpretation of discriminant analysis’, Journal of Marketing Research 6 (May 1969), 156–63.
7. Miodonski, B., ‘Retaining good employees starts at the top’, Contractor 51 (10) (October 2004), 7–8; Fern, E.E., Avila, R.A. and Grewal, D., ‘Salesforce turnover: Those who left and those who stayed’, Industrial Marketing Management (1989), 1–9.
8. For the validation of discriminant analysis, see Yoon, S.J. and Kang, J.W., ‘Validation of marketing performance model for service industries in Korea’, Service Marketing Quarterly 26 (4) (2005), 57; Reinartz, W.J. and Kumar, V., ‘On the profitability of long life customers in a non-contractual setting: An empirical investigation and implications for marketing’, Journal of Marketing 64 (4) (October 2000), 17–35.
9. Hair, J.E. Jr, Black, W.C., Babin, B.J. and Anderson, R.E., Multivariate Data Analysis with Readings, 7th edn (Upper Saddle River, NJ: Prentice Hall, 2010). See also Glen, J.J., ‘Classification accuracy in discriminant analysis: A mixed integer programming approach’, Journal of the Operational Research Society 52 (3) (March 2001), 328.
10. Anon., ‘Interactive TV growth to erupt over the next five years’, Satellite News 24 (2) (8 January 2001), 1; Rahtz, D.R., Sirgy, M.J. and Kosenko, R., ‘Using demographics and psychographic dimensions to discriminate between mature heavy and light television users: An exploratory analysis’, in Bahn, K.D. (ed.), Developments in Marketing Science, Vol. 11 (Blacksburg, VA: Academy of Marketing Science, 1988), 2–7.
11. For advanced discussion of multiple discriminant analysis, see Johnson, R.A. and Wichern, D.W., Applied
Multivariate Statistical Analysis, 5th edn (Upper Saddle River, NJ: Prentice Hall, 2002). For an application, see Duffy, R.S., ‘Towards a better understanding of partnership attributes: An exploratory analysis of relationship type classification’, Industrial Marketing Management 37 (2) (April 2008), 228–44; Shoham, A. and Ruvio, A., ‘Opinion leaders and followers: A replication and extension’, Psychology & Marketing 25 (3) (March 2008), 280–97.
12. Tudor, J., ‘Valuation of the health services industry’, Weekly Corporate Growth Report (1133) (26 March 2001), 11237–8; Dansky, K.H. and Brannon, D., ‘Discriminant analysis: A technique for adding value to patient satisfaction surveys’, Hospital and Health Services Administration 41 (4) (Winter 1996), 503–13; Lim, J.S. and Zallocco, R., ‘Determinant attributes in formulation of attitudes toward four health care systems’, Journal of Health Care Marketing 8 (June 1988), 25–30.
13. Hair, J.E. Jr, Black, W.C., Babin, B.J. and Anderson, R.E., Multivariate Data Analysis with Readings, 7th edn (Upper Saddle River, NJ: Prentice Hall, 2010); Johnson, R.A. and Wichern, D.A., Applied Multivariate Statistical Analysis, 5th edn (Upper Saddle River, NJ: Prentice Hall, 2002).
14. For a discussion of the logit model, see Malhotra, N.K., ‘The use of linear logit models in marketing research’, Journal of Marketing Research 21 (February 1984), 20–31. For a comparison of OLS regression, discriminant, logit and probit models, see Malhotra, N.K., ‘A comparison of the predictive validity of procedures for analyzing binary data’, Journal of Business and Economic Statistics 1 (October 1983), 326–36.
15. Richards, T.J., ‘A nested logit model of strategic promotion’, Quantitative Marketing and Economics 5 (1) (March 2007), 63–91; Sriram, S., Chintagunta, P.K. and Neelamegham, R., ‘Effects of brand preference, product attributes and marketing mix variables in technology product markets’, Marketing Science 25 (5) (June 2006), 440; Malhotra, N.K., ‘The use of linear logit models in marketing research’, Journal of Marketing Research 21 (February 1984), 20–31.
16. Sterlicchi, J., ‘Customer satisfaction just catching on in Europe’, Marketing News (28 May 1990).
17. Segal, M.N. and Giacobbe, R.W., ‘Ethical issues in Australian marketing research services: An empirical investigation’, Services Marketing Quarterly 28 (3) (2007), 33; Schwepker, C.H. and Hartline, M.D., ‘Managing the ethical climate of customer-contact service employees’, Journal of Service Research 7 (4) (May 2005), 377–96; Murphy, P.R., Smith, J.E. and Daley, J.M., ‘Executive attitudes, organisational size and ethical issues: Perspectives on a service industry’, Journal of Business Ethics 11 (1982), 11–19.

Factor analysis
Factor analysis allows an
examination of the potential
interrelationships among a
number of variables and the
evaluation of the underlying
reasons for these relationships.
Stage 1
Problem definition
Stage 2
Research approach developed
Stage 3
Research design
developed
Stage 4
Fieldwork or data
collection
Stage 5
Data integrity and problem
definition
24
Stage 6
Communicating research findings

708 Marketing Research
Objectives
After reading this chapter, you should be able to:
1 describe the concept of factor analysis and explain how it is different from analysis of variance, multiple regression and discriminant analysis;
2 discuss the procedure for conducting factor analysis, including problem formulation, construction of the correlation matrix, selection of an appropriate method, determination of the number of factors, rotation and interpretation of factors;
3 understand the distinction between principal component factor analysis and common factor analysis methods;
4 explain the selection of surrogate variables and their application, with emphasis on their use in subsequent analysis;
5 describe the procedure for determining the fit of a factor analysis model using the observed and the reproduced correlations;
6 appreciate how software is used in factor analysis.
In analysis of variance (Chapter 21), regression (Chapter 22) and discriminant analysis (Chapter 23), one of the variables is clearly identified as the dependent variable. We now turn to a procedure, factor analysis, in which variables are not classified as independent or dependent. Instead, the whole set of interdependent relationships among variables is examined. This chapter discusses the basic concept of factor analysis and gives an exposition of the factor model. We describe the steps in factor analysis and illustrate them in the context of principal components analysis. Next, we present an application of common factor analysis. Finally, guidance is provided on the use of software to address the data analysis challenges presented in this chapter. We begin with an example that illustrates an application of factor analysis.
Overview
Real research Personal alarms1
In a study of personal alarms, women were asked to rate eight personal alarms using the following 15 statements:
1 Feels comfortable in the hand.
2 Could be easily kept in the pocket.
3 Would fit easily into a handbag.
4 Could be easily worn on the person.
5 Could be carried to be very handy when needed.
6 Could be set off almost as a reflex action.
7 Would be difficult for an attacker to take it off me.
8 Could keep a very firm grip on it if attacked.
9 An attacker might be frightened that I might attack him with it.

709Chapter 24 Factor analysis
10 Would be difficult for an attacker to switch off.
11 Solidly built.
12 Would be difficult to break.
13 Looks as if it would give off a very loud noise.
14 An attacker might have second thoughts about attacking me if he saw me with it.
15 I would be embarrassed to carry it around with me.
The question was ‘Could these 15 variables be reduced to a smaller number of derived variables, known as factors, in such a way that too much information was not lost?’. Factor analysis enabled these 15 variables to be reduced to four underlying dimensions, or factors that women used to evaluate the alarms. Factor 1 seemed to measure a dimension of size, on a continuum of small to large. Factor 2 tapped into aspects of the appearance of a personal alarm. Factor 3 revealed robustness characteristics, with factor 4 related to hand feel.
Basic concept
Factor analysis is a general name denoting a class of procedures primarily used for data reduction and summarisation. In marketing research, there may be a large number of varia-bles, most of which are correlated and which must be reduced to a manageable level. Rela-tionships among sets of many interrelated variables are examined and represented in terms of a few underlying factors. For example, the image of a fashion brand may be measured by asking participants to evaluate competing fashion brands on a series of items on a semantic differential scale or a Likert scale. These item evaluations may then be analysed to determine the factors underlying the image of a fashion brand.
In analysis of variance, multiple regression and discriminant analysis, one variable is considered the dependent or criterion variable and the others are considered independent or predictor variables. But no such distinction is made in factor analysis. Rather, factor analysis is an interdependence technique in that an entire set of interdependent relation-ships is examined.2
Factor analysis is used in the following circumstances:
1 To identify underlying dimensions, or factors, that explain the correlations among a set of variables. For example, a set of lifestyle statements may be used to measure the psycho-graphic profiles of consumers. These statements may then be factor analysed to identify the underlying psychographic factors, as illustrated in the opening example. This is also illustrated in Figure 24.1, based upon empirical analysis, where seven psychographic var-iables can be represented by two factors. In this figure, factor 1 can be interpreted as homebody vs. socialite, and factor 2 can be interpreted as sports vs. cinema/theatre.
2 To identify a new, smaller set of uncorrelated variables to replace the original set of cor-related variables in subsequent multivariate analysis (regression or discriminant analy-sis). For example, the psychographic factors identified may be used as independent variables in explaining the differences between loyal and non-loyal consumers. Thus, instead of the seven correlated psychographic variables of Figure 24.1, we can use the two uncorrelated factors, i.e. homebody versus socialite, and sports versus cinema/theatre, in subsequent analysis.
Factor analysisA class of procedures primarily used for data reduction and summarisation.
FactorAn underlying dimension that explains the correlations among a set of variables.
Interdependence techniqueA multivariate statistical technique in which the whole set of interdependent relationships is examined.

710 Marketing Research
3 To identify a smaller set of salient variables from a larger set for use in subsequent mul-tivariate analysis. For example, a few of the original lifestyle statements that correlate highly with the identified factors may be used as independent variables to explain the dif-ferences between the loyal and non-loyal users. Specifically, based upon theory and empirical results (Figure 24.1), we can select ‘Home is the best place’ and ‘Football’ as independent variables, and drop the other five variables to avoid problems due to multi-collinearity (see Chapter 22)
All these uses are exploratory in nature and therefore factor analysis is also called explora-tory factor analysis (EFA). Factor analysis has numerous applications in marketing research. For example:
• It can be used in market segmentation for identifying the underlying variables on which to group the customers. New car buyers might be grouped based on the relative emphasis they place on economy, convenience, performance, comfort and luxury. This might result in five segments: economy seekers, convenience seekers, performance seekers, comfort seekers and luxury seekers.
• In product research, factor analysis can be employed to determine the brand attributes that influence consumer choice. Toothpaste brands might be evaluated in terms of protection against cavities, whiteness of teeth, taste, fresh breath and price.
• In advertising studies, factor analysis can be used to understand the media consumption habits of the target market. The users of frozen foods may be heavy viewers of horror films, play a lot of electronic games and listen to rock music.
• In pricing studies, factor analysis can be used to identify the characteristics of price- sensitive consumers. For example, these consumers might be methodical, economy minded and home centred.
Figure 24.1
Factors underlying selected psychographics and lifestyles
Factor 2
Factor 1
Evening at home
CinemaTheatre
Go to a party Home is the best place
RugbyFootball
Factor analysis model
Mathematically, factor analysis is somewhat similar to multiple regression analysis in that each variable is expressed as a linear combination of underlying factors. The amount of variance a variable shares with all other variables included in the analysis is referred to as communality. The covariation among the variables is described in terms of a small number of

711Chapter 24 Factor analysis
common factors plus a unique factor for each variable. These factors are not overtly observed. If the variables are standardised, the factor model may be represented as:
=A1F
1 + + + +...+ V UXi i A
2F
2i A3F
3i A m Fmi ii
where = ith standardised variable = standardised multiple regression coe�cient of variable i on common factor j
XAFVUm
i
i
i
ij
= common factor= standardised regression coe�cient of variable i on unique factor i= the unique factor for variable i= number of common factors.
The unique factors are correlated with each other and with the common factors.3 The com-mon factors themselves can be expressed as linear combinations of the observed variables:
F W X W X W X W Wi i i i ik k= + + +...+1 1 2 2 3 3
where
Fi
= estimate of ith factor W
i= weight or factor score coe�cient
k = number of variables.
It is possible to select weights or factor score coefficients so that the first factor explains the largest portion of the total variance. Then a second set of weights can be selected so that the second factor accounts for most of the residual variance, subject to being uncor-related with the first factor. This same principle could be applied to selecting additional weights for the additional factors. Thus, the factors can be estimated so that their factor scores, unlike the values of the original variables, are not correlated. Furthermore, the first factor accounts for the highest variance in the data, the second factor for the second high-est and so on. A simplified graphical illustration of factor analysis in the case of two vari-ables is presented in Figure 24.2. Several statistics are associated with factor analysis.
Figure 24.2
Graphical illustration of factor analysis
Fi = Wi1X1 + Wi2X2
X2
X1
Statistics associated with factor analysis
The key statistics associated with factor analysis are as follows:
• Bartlett’s test of sphericity. This is a test statistic used to examine the hypothesis that the variables are uncorrelated in the population. In other words, the population correlation matrix is an identity matrix; each variable correlates perfectly with itself (r = 1) but has no correlation with the other variables (r = 0).
• Communality. This is the amount of variance a variable shares with all the other variables being considered. It is also the proportion of variance explained by the common factors.

712 Marketing Research
• Correlation matrix. A correlation matrix is a lower triangular matrix showing the simple correlations, r, between all possible pairs of variables included in the analysis. The diago-nal elements, which are all one, are usually omitted.
• Eigenvalue. The eigenvalue represents the total variance explained by each factor.
• Factor loadings. These are simple correlations between the variables and the factors.
• Factor loading plot. A factor loading plot is a plot of the original variables using the fac-tor loadings as coordinates.
• Factor matrix. A factor matrix contains the factor loadings of all the variables on all the factors extracted.
• Factor scores. These are composite scores estimated for each participant on the derived factors.
• Factor scores coefficient matrix. This matrix contains the weights, or factor score coeffi-cients, used to combine the standardised variables to obtain factor scores.
• Kaiser–Meyer–Olkin (KMO) measure of sampling adequacy. The KMO measure of sam-pling adequacy is an index used to examine the appropriateness of factor analysis. High values (between 0.5 and 1.0) indicate that factor analysis is appropriate. Values below 0.5 imply that factor analysis may not be appropriate.
• Percentage of variance. This is the percentage of the total variance attributed to each factor.
• Residuals. These are the differences between the observed correlations, as given in the input correlation matrix, and the reproduced correlations, as estimated from the factor matrix.
• Scree plot. A scree plot is a plot of the eigenvalues against the number of factors in order of extraction.
We describe the uses of these statistics in the next section, in the context of the procedure for conducting factor analysis.
Conducting factor analysis
The steps involved in conducting factor analysis are illustrated in Figure 24.3. The first step is to define the factor analysis problem and identify the variables to be factor analysed. Then a correlation matrix of these variables is constructed and a method of factor analysis is selected. The researcher decides on the number of factors to be extracted and the method of rotation. Next, the rotated factors should be interpreted. Depending on the objectives, the factor scores may be calculated, or surrogate variables selected, to represent the factors in subsequent multivariate analysis. Finally, the fit of the factor analysis model is determined. We discuss these steps in more detail in the following subsections.4
Formulate the problem
Formulating the problem includes several tasks. First, the objectives of factor analysis should be identified. The variables to be included in the factor analysis should be specified based on past research (quantitative or qualitative), theory and judgement of the researcher. It is important that the variables be appropriately measured on an interval or ratio scale. An appropriate sample size should be used. As a rough guide, there should be at least four or five times as many observations (sample size) as there are variables.5 In many marketing research situations the sample size is small, and this ratio is considerably lower. In these cases, the results should be interpreted cautiously.
To illustrate factor analysis, suppose that the researcher wanted to determine the underlying benefits that consumers seek from the purchase of a toothpaste. A sample of 30 participants

713Chapter 24 Factor analysis
was interviewed using street interviewing. The participants were asked to indicate their degree of agreement with the following statements using a seven-point scale (1 = strongly disagree, 7 = strongly agree):
V1 It is important to buy a toothpaste that prevents cavities.V2 I like a toothpaste that gives shiny teeth.V3 A toothpaste should strengthen your gums.V4 I prefer a toothpaste that freshens breath.V5 Prevention of tooth decay should be an important benefit offered by a toothpaste.V6 The most important consideration in buying a toothpaste is attractive teeth.
The data obtained are given in Table 24.1. For illustrative purposes, we consider only a small number of observations. In practice, factor analysis is performed on much larger samples. A correlation matrix was constructed based on these ratings data.
Construct the correlation matrix
The analytical process is based on a matrix of correlations between the variables. Valuable insights can be gained from an examination of this matrix. For factor analysis to be meaning-ful, the variables should be correlated. In practice, this is usually the case. If the correlations between all the variables are small, factor analysis may not be appropriate. We would also expect that variables that are highly correlated with each other would also highly correlate with the same factor, or factors.
Formal statistics are available for testing the appropriateness of the factor model. Bartlett’s test of sphericity can be used to test the null hypothesis that the variables are uncorrelated in the
Figure 24.3
Conducting factor analysis
Formulate the problem
Construct the correlation matrix
Determine the number of factors
Rotate factors
Interpret factors
Calculatefactorscores
Selectsurrogatevariables
Determine model �t
Determine the method of factor analysis

714 Marketing Research
Table 24.1 Toothpaste attribute ratings
Participant number V1 V2 V3 V4 V5 V6
1 7 3 6 4 2 4 2 1 3 2 4 5 4 3 6 2 7 4 1 3 4 4 5 4 6 2 5 5 1 2 2 3 6 2 6 6 3 6 4 2 4 7 5 3 6 3 4 3 8 6 4 7 4 1 4 9 3 4 2 3 6 310 2 6 2 6 7 611 6 4 7 3 2 312 2 3 1 4 5 413 7 2 6 4 1 314 4 6 4 5 3 615 1 3 2 2 6 416 6 4 6 3 3 417 5 3 6 3 3 418 7 3 7 4 1 419 2 4 3 3 6 320 3 5 3 6 4 621 1 3 2 3 5 322 5 4 5 4 2 423 2 2 1 5 4 424 4 6 4 6 4 725 6 5 4 2 1 426 3 5 4 6 4 727 4 4 7 2 2 528 3 7 2 6 4 329 4 6 3 7 2 730 2 3 2 4 7 2
population; in other words, the population correlation matrix is an identity matrix. In an iden-tity matrix, all the diagonal terms are 1 and all off-diagonal terms are 0. The test statistic for sphericity is based on a chi-square transformation of the determinant of the correlation matrix. A large value of the test statistic will favour the rejection of the null hypothesis. If this hypoth-esis cannot be rejected, then the appropriateness of factor analysis should be questioned. Another useful statistic is the Kaiser–Meyer–Olkin (KMO) measure of sampling adequacy. This index compares the magnitudes of the observed correla-tion coefficients with the magnitudes of the partial correlation coefficients. Small values of the KMO statistic indicate that the correlations between pairs of variables cannot be explained by other variables and that factor analysis may not be appropriate. Generally, a value greater than 0.5 is desirable.
The correlation matrix, constructed from the data obtained to understand toothpaste benefits, is

715Chapter 24 Factor analysis
shown in Table 24.2. There are relatively high correlations among V1 (prevention of cavi-ties), V3 (strong gums) and V5 (prevention of tooth decay). We would expect these variables to correlate with the same set of factors. Likewise, there are relatively high correlations among V2 (shiny teeth), V4 (fresh breath) and V6 (attractive teeth). These variables may also be expected to correlate with the same factors.6
The results of factor analysis are given in Table 24.3. The null hypothesis, that the popula-tion correlation matrix is an identity matrix, is rejected by Bartlett’s test of sphericity. The approximate chi-square statistic is 111.314 with 15 degrees of freedom, which is significant at the 0.05 level. The value of the KMO statistic (0.660) is also large (>0.5). Thus, factor analysis may be considered an appropriate technique for analysing the correlation matrix of Table 24.2.
Table 24.2 Correlation matrix
Participant V1 V2 V3 V4 V5 V6
V1 1.00V2 −0.053 1.00V3 0.873 −0.155 1.00V4 −0.086 0.572 −0.248 1.00V5 −0.858 0.020 −0.778 −0.007 1.00V6 0.004 0.640 −0.018 0.640 −0.136 1.00
Table 24.3 Results of principal components analysis
Bartlett test of sphericityApproximate chi-square = 111.314, df = 15, significance = 0.00000Kaiser–Meyer–Olkin measure of sampling adequacy = 0.660
Communalities
Variable Initial Extraction
V1 1.000 0.926V2 1.000 0.723V3 1.000 0.894V4 1.000 0.739V5 1.000 0.878V6 1.000 0.790
Initial eigenvalues
Factor Eigenvalue Percentage of variance Cumulative percentage
1 2.731 45.520 45.5202 2.218 36.969 82.4883 0.442 7.360 89.8484 0.341 5.688 95.5365 0.183 3.044 98.5806 0.085 1.420 100.000

Table 24.3
Extraction sums of squared loadings
Factor Eigenvalue Percentage of variance Cumulative percentage
1 2.731 45.520 45.5202 2.218 36.969 82.488
Factor matrix
Factor 1 Factor 2
V1 0.928 0.253V2 −0.301 0.795V3 0.936 0.131V4 −0.342 0.789V5 −0.869 −0.351V6 −0.177 0.871
Rotation sums of squared loadings
Factor Eigenvalue Percentage of variance Cumulative percentage
1 2.688 44.802 44.8022 2.261 37.687 82.488
Rotated factor matrix
Factor 1 Factor 2
V1 0.962 −0.027V2 −0.057 0.848V3 0.934 −0.146V4 −0.098 0.854V5 −0.933 −0.084V6 0.083 0.885
Factor score coefficient matrix
Factor 1 Factor 2
V1 0.358 0.011V2 −0.001 0.375V3 0.345 −0.043V4 −0.017 0.377V5 −0.350 −0.059V6 0.052 0.395
Reproduced correlation matrix
Variables V1 V2 V3 V4 V5 V6
V1 0.926* 0.024 −0.029 0.031 0.038 −0.053V2 −0.078 0.723* 0.022 −0.158 0.038 −0.105V3 0.902 −0.177 0.894* −0.031 0.081 0.033V4 −0.117 0.730 −0.217 0.739* −0.027 −0.107V5 −0.895 −0.018 0.859 0.020 0.878* 0.016V6 0.057 −0.746 −0.051 0.748 −0.152 0.790
*The lower-left triangle contains the reproduced correlation matrix; the diagonal, the communalities; and the upper-right triangle, the residuals between the observed correlations and the reproduced correlations.
Continued

717Chapter 24 Factor analysis
Determine the method of factor analysis
Once it has been determined that factor analysis is an appropriate technique for analysing the data, an appropriate method must be selected. The approach used to derive the weights or factor score coefficients differentiates the various methods of factor analysis. The two basic approaches are principal components analysis and common factor analysis. In principal components analysis, the total variance in the data is considered. The diagonal of the correla-tion matrix consists of unities, and full variance is brought into the factor matrix. Principal components analysis is recommended when the primary concern is to determine the mini-mum number of factors that will account for maximum variance in the data for use in subse-quent multivariate analysis. The factors are called principal components.
In common factor analysis, the factors are estimated based only on the common vari-ance. Communalities are inserted in the diagonal of the correlation matrix. This method is appropriate when the primary concern is to identify the underlying dimensions and the com-mon variance is of interest. This method is also known as principal axis factoring.
Other approaches for estimating the common factors are also available. These include unweighted least squares, generalised least squares, maximum likelihood, alpha method and image factoring. These methods are complex and are not recommended for inexperi-enced users.7
Table 24.3 shows the application of principal components analysis to the toothpaste example.
Under ‘Communalities’, in the ‘Initial’ column, it can be seen that the communality for each variable, V1 to V6, is 1.0 as unities were inserted in the diagonal of the correlation matrix. The section labelled ‘Initial eigenvalues’ gives the eigenvalues. The eigenvalues for the fac-tors are, as expected, in decreasing order of magnitude as we go from factor 1 to factor 6. The eigenvalue for a factor indicates the total variance attributed to that factor. The total variance accounted for by all the six factors is 6.00, which is equal to the number of variables. Factor 1 accounts for a variance of 2.731, which is (2.731/6) or 45.52% of the total variance. Likewise, the second factor accounts for (2.218/6) or 36.97% of the total variance, and the first two fac-tors combined account for 82.49% of the total variance. Several considerations are involved in determining the number of factors that should be used in the analysis.
Determine the number of factors
It is possible to compute as many principal components as there are variables, but in doing so no parsimony is gained, i.e. we would not have summarised the information nor revealed any underlying structure. To summarise the information contained in the original variables, a smaller number of factors should be extracted. The question is: how many? Several proce-dures have been suggested for determining the number of factors. These include a priori determination and approaches based on eigenvalues, scree plot, percentage of variance accounted for, split-half reliability and significance tests:
• A priori determination. Sometimes, because of prior knowledge, the researcher knows how many factors to expect and thus can specify the number of factors to be extracted beforehand. The extraction of factors ceases when the desired number of factors has been extracted. Most computer programs allow the user to specify the number of factors, allow-ing for an easy implementation of this approach.
• Determination based on eigenvalues. In this approach, only factors with eigenvalues greater than 1.0 are retained; the other factors are not included in the model. An eigen-value represents the amount of variance associated with the factor. Hence, only factors with a variance greater than 1.0 are included. Factors with a variance less than 1.0 are no better than a single variable because, due to standardisation, each variable has a variance of 1.0. If the number of variables is less than 20, this approach will result in a conservative number of factors.
Principal components analysisAn approach to factor analysis that considers the total variance in the data.
Common factor analysisAn approach to factor analysis that estimates the factors based only on the common variance. Also called principal axis factoring.

718 Marketing Research
• Determination based on scree plot. A scree plot is a plot of the eigenvalues against the number of factors in order of extraction. The shape of the plot is used to determine the number of factors. Typically, the plot has a distinct break between the steep slope of fac-tors, with large eigenvalues and a gradual trailing off associated with the rest of the fac-tors. This gradual trailing off is referred to as the scree. Experimental evidence indicates that the point at which the scree begins denotes the true number of factors. Generally, the number of factors determined by a scree plot will be one or a few more than that deter-mined by the eigenvalue criterion.
• Determination based on percentage of variance. In this approach, the number of factors extracted is determined so that the cumulative percentage of variance extracted by the fac-tors reaches a satisfactory level. What level of variance is satisfactory depends upon the problem. It is recommended that the factors extracted should account for at least 60% of the variance.
• Determination based on split-half reliability. The sample is split in half, and factor analy-sis is performed on each half. Only factors with high correspondence of factor loadings across the two subsamples are retained.
• Determination based on significance tests. It is possible to determine the statistical sig-nificance of the separate eigenvalues and retain only those factors that are statistically significant. A drawback is that with large samples (size greater than 200), many factors are likely to be statistically significant – although from a practical viewpoint many of these account for only a small proportion of the total variance.
In Table 24.3, we see that the eigenvalue greater than 1.0 (default option) results in two fac-tors being extracted. Our a priori knowledge tells us that toothpaste is bought for two major reasons. The scree plot associated with this analysis is given in Figure 24.4. From the scree plot, a distinct break occurs at three factors. Finally, from the cumulative percentage of vari-ance accounted for, we see that the first two factors account for 82.49% of the variance and that the gain achieved in going to three factors is marginal. Furthermore, split-half reliability also indicates that two factors are appropriate. Thus, two factors appear to be reasonable in this situation.
The ‘extraction’ column under the ‘Communalities’ heading in Table 24.3 gives relevant information after the desired number of factors has been extracted. The communalities for the variances under ‘Extraction’ are different from those under ‘Initial’ because all of the variances associated with the variables are not explained unless all the factors are retained. The ‘Extraction sums of squared loadings’ section gives the variances associated with the factors that are retained.
Figure 24.4
Scree plot
0.01 2 3 4 5 6
3.0
Number of factors
Eige
nval
ues
2.0
2.0
1.0
1.0
0.5

719Chapter 24 Factor analysis
Note that these are the same as those under ‘Initial eigenvalues’. This is always the case in principal components analysis. The percentage variance accounted for by a factor is deter-mined by dividing the associated eigenvalue by the total number of factors (or variables) and multiplying by 100. Thus, the first factor accounts for (2.731/6) × 100, or 45.52% of the variance of the six variables. Likewise, the second factor accounts for (2.218/6) × 100, or 36.967% of the variance. Interpretation of the solution is often enhanced by a rotation of the factors.
Rotate factors
An important output from factor analysis is the factor matrix, also called the factor pattern matrix. The factor matrix contains the coefficients used to express the standardised variables in terms of the factors. These coefficients, the factor loadings, represent the correlations between the factors and the variables. A coefficient with a large absolute value indicates that the factor and the variable are closely related. The coefficients of the factor matrix can be used to interpret the factors.
Although the initial or unrotated factor matrix indicates the relationship between the fac-tors and individual variables, it seldom results in factors that can be interpreted, because the factors are correlated with many variables. For example, in Table 24.3, factor 1 is at least somewhat correlated with five of the six variables (absolute value of factor loading greater than 0.3). Likewise, factor 2 is at least somewhat correlated with four of the six variables. Moreover, variables 2 and 5 load at least somewhat on both the factors. This is illustrated in Figure 24.5(a). How should this factor be interpreted? In such a complex matrix, it is diffi-cult to interpret the factors. Therefore, through rotation, the factor matrix is transformed into a simpler one that is easier to interpret.
In rotating the factors, we would like each factor to have non-zero, or significant, loadings or coefficients for only some of the variables. Likewise, we would like each variable to have non-zero or significant loadings with only a few factors, and if possible with only one. If several factors have high loadings with the same variable, it is difficult to interpret them. Rotation does not affect the communalities and the percentage of total variance explained. The percentage of variance accounted for by each factor does change, however. This is seen in Table 24.3 by comparing ‘Extraction sums of squared loadings’ with ‘ Rotation sums of squared loadings’. The variance explained by the individual factors is redistributed by rota-tion. Hence, different methods of rotation may result in the identification of different factors.
The rotation is called orthogonal rotation if the axes are maintained at right angles. The most commonly used method for rotation is the varimax procedure. This is an orthogonal method of rotation that minimises the number of variables with high loadings on a factor,
Orthogonal rotationRotation of factors in which the axes are maintained at right angles.
Varimax procedureAn orthogonal method of factor rotation that minimises the number of variables with high loadings on a factor, thereby enhancing the interpretability of the factors.
Figure 24.5
Factor matrix before and after rotation
Factors
1 2Variables
X1
X2
X3
X4
X5
(b) High loadings after rotation
X6
Factors
1 2Variables
X1
X X2
X3
X X4
X X5
(a) High loadings before rotation
X6

720 Marketing Research
thereby enhancing the interpretability of the factors.8 Orthogonal rotation results in factors that are uncorrelated. The rotation is called oblique rotation when the axes are not main-tained at right angles, and the factors are correlated. Sometimes, allowing for correlations among factors can simplify the factor pattern matrix. Oblique rotation should be used when factors in the population are likely to be strongly correlated.
In Table 24.3, by comparing the varimax rotated factor matrix with the unrotated matrix (entitled simply ‘Factor matrix’), we can see how rotation achieves simplicity and enhances interpretability. Whereas five variables correlated with factor 1 in the unrotated matrix, only variables V1, V3 and V5 correlate highly with factor 1 after rotation. The remaining variables, V2, V4 and V6, correlate highly with factor 2. Furthermore, no variable correlates highly with both the factors. The rotated factor matrix forms the basis for interpretation of the factors.
Interpret factors
Interpretation is facilitated by identifying the variables that have large loadings on the same factor. That factor can then be interpreted in terms of the variables that load high on it. Another useful aid in interpretation is to plot the variables, using the factor loadings as coor-dinates. Variables at the end of an axis are those that have high loadings on only that factor and hence describe the factor. Variables near the origin have small loadings on both the fac-tors. Variables that are not near any of the axes are related to both the factors. If a factor cannot be clearly defined in terms of the original variables, it should be labelled as an unde-fined or a general factor.
In the rotated factor matrix of Table 24.3, factor 1 has high coefficients for variables V1 (prevention of cavities) and V3 (strong gums), and a negative coefficient for V5 (prevention of tooth decay is not important). Therefore, this factor may be labelled a health benefit fac-tor. Note that a negative coefficient for a negative variable (V5) leads to a positive interpreta-tion that prevention of tooth decay is important. Factor 2 is highly related with variables V2 (shiny teeth), V4 (fresh breath) and V6 (attractive teeth). Thus factor 2 may be labelled a social benefit factor. A plot of the factor loadings, given in Figure 24.6, confirms this inter-pretation. Variables V1, V3 and V5 (denoted 1, 3 and 5, respectively) are at the end of the horizontal axis (factor 1), with V5 at the end opposite to V1 and V3, whereas variables V2, V4 and V6 (denoted 2, 4 and 6) are at the end of the vertical axis (factor 2). One could summarise the data by stating that consumers appear to seek two major kinds of benefits from tooth-paste: health benefits and social benefits.
Oblique rotationRotation of factors when the axes are not maintained at right angles.
Figure 24.6
Factor loading plot
Fact
or 2
Factor 1
V6
–1.0–1.0 –0.5 0.0 0.5 1.0
–0.5
0.0
0.5
1.0
V1
V3V5
V2
V4

721Chapter 24 Factor analysis
Calculate factor scores
Following interpretation, factor scores can be calculated, if necessary. Factor analysis has its own stand-alone value. If the goal of factor analysis is to reduce the original set of variables to a smaller set of composite variables (factors) for use in subsequent multivariate analysis, however, it is useful to compute factor scores for each participant. A factor is simply a linear combination of the original variables. The factor scores for the ith factor may be estimated as follows:
F W X W X W X W Wi i i i ik k= + + +...+1 1 2 2 3 3
These symbols were defined earlier in the chapter.The weights or factor score coefficients used to combine the standardised variables are
obtained from the factor score coefficient matrix. Most computer programs allow you to request factor scores. Only in the case of principal components analysis is it possible to com-pute exact factor scores. Moreover, in principal components analysis these scores are uncor-related. In common factor analysis, estimates of these scores are obtained and there is no guarantee that the factors will be uncorrelated with each other. Factor scores can be used instead of the original variables in subsequent multivariate analysis. For example, using the ‘Factor score coefficient matrix’ in Table 24.3, one could compute two factor scores for each participant. The standardised variable values would be multiplied by the corresponding fac-tor score coefficients to obtain the factor scores.
Select surrogate variables
Sometimes, instead of computing factor scores, the researcher wishes to select surrogate vari-ables. Selection of substitute or surrogate variables involves singling out some of the original variables for use in subsequent analysis. This allows the researcher to conduct subsequent anal-ysis and to interpret the results in terms of original variables rather than factor scores. By exam-ining the factor matrix, one could select for each factor the variable with the highest loading on that factor. That variable could then be used as a surrogate variable for the associated factor. This process works well if one factor loading for a variable is clearly higher than all other factor loadings. The choice is not as easy, however, if two or more variables have similarly high load-ings. In such a case, the choice between these variables should be based on theoretical and measurement considerations. For example, theory may suggest that a variable with a slightly lower loading is more important than one with a slightly higher loading. Likewise, if a variable has a slightly lower loading but has been measured more precisely, it should be selected as the surrogate variable. In Table 24.3, the variables V1, V3 and V5 all have high loadings on factor 1, and all are fairly close in magnitude, although V1 has relatively the highest loading and would therefore be a likely candidate. However, if prior knowledge suggests that prevention of tooth decay is a very important benefit, V5 would be selected as the surrogate for factor 1. Also, the choice of a surrogate for factor 2 is not straightforward. Variables V2, V4 and V6 all have com-parable high loadings on this factor. If prior knowledge suggests that attractive teeth are the most important social benefit sought from a toothpaste, the researcher would select V6.
Determine the model fit
The final step in factor analysis involves the determination of model fit. A basic assumption underlying factor analysis is that the observed correlation between variables can be attrib-uted to common factors. Hence, the correlations between the variables can be deduced or reproduced from the estimated correlations between the variables and the factors. The differ-ences between the observed correlations (as given in the input correlation matrix) and the reproduced correlations (as estimated from the factor matrix) can be examined to determine model fit. These differences are called residuals. If there are many large residuals, the factor model does not provide a good fit to the data and the model should be reconsidered. In the upper-right triangle of the ‘Reproduced correlation matrix’ of Table 24.3, we see that only five residuals are larger than 0.05, indicating an acceptable model fit.
Factor scoresComposite scores estimated for each participant on the derived factors.
Surrogate variablesA subset of original variables selected for use in subsequent analysis.

722 Marketing Research
The following example further illustrates principal components factoring in the context of trade promotion.
Real research Manufacturing promotion components9
The objective of this study was to develop a comprehensive inventory of manufacturer-controlled trade promotion variables and to demonstrate that an association exists between these variables and the retailers’ promotion support decision. Retailer support was defined operationally as the trade buyers’ attitude towards the promotion.
Factor analysis was performed on the explanatory variables with the primary goal of data reduction. The principal components method, using varimax rotation, reduced the 30 explanatory variables to eight factors having eigenvalues greater than 1.0. For the purpose of interpretation, each factor was composed of variables that loaded 0.40 or higher on that factor. In two instances, where variables loaded 0.40 or above on two fac-tors, each variable was assigned to the factor where it had the highest loading. Only one variable, ‘ease of handling/stocking at retail’, did not load at least 0.40 on any factor. In all, the eight factors explained 62% of the total variance. Interpretation of the factor loading matrix was straightforward. Table 1 lists the factors in the order in which they were extracted.
Stepwise discriminant analysis was conducted to determine which, if any, of the eight factors predicted trade support to a statistically significant degree. The factor scores for the eight factors were the explanatory variables. The dependent variable consisted of the retail buyer’s overall rating of the deal (rating), which was collapsed into a three-group (low, medium and high) measure of trade support. The results of the discriminant analyses are shown in Table 2. All eight entered the discriminant functions. Goodness-of-fit measures indicated that, as a group, the eight factors dis-criminated between high, medium and low levels of trade support. Multivariate F ratios, indicating the degree of discrimination between each pair of groups, were significant at p < 0.001. Correct classification into high, medium and low categories was achieved for 65% of the cases. The order of entry into discriminant analysis was used to determine the relative importance of factors as trade support influencers, as shown in Table 3.
Table 1 Factors influencing trade promotional support
Factor Factor interpretation (% variance explained)
Loading Variables included in the factor
F1 Item importance (16.3%) 0.77 Item is significant enough to warrant promotion0.75 Category responds well to promotion0.66 Closest trade competitor is likely to promote item0.64 Importance of promoted product category0.59 Item regular (non-deal) sales volume0.57 Deal meshes with trade promotional requirements
Buyer’s estimate of sales increase on the basis of:F2 Promotion elasticity(9.3%) 0.86 Price reduction and display
0.82 Display only0.80 Price reduction only0.70 Price reduction, display and advertising

723Chapter 24 Factor analysis
Factor Factor interpretation (% variance explained)
Loading Variables included in the factor
Manufacturer’s brand support in the form of:F3 Manufacturer brand
support (8.2%)0.85 Coupons
0.81 Radio and television advertising0.80 Newspaper advertising0.75 Point of purchase promotion (e.g. display)
F4 Manufacturer reputation (7.3%)
0.72 Manufacturer’s overall reputation
0.72 Manufacturer’s cooperation in meeting trade’s promotional needs
0.64 Manufacturer’s cooperation on emergency orders
0.55 Quality of sales presentation0.51 Manufacturer’s overall product quality
F5 Promotion wearout (6.4%)
0.93 Product category is overpromoted
0.93 Item is overpromotedF6 Sales velocity (5.4%) −0.81 Brand market share rank*
0.69 Item regular sales volume*0.46 Item regular sales volume
F7 Item profitability (4.5%) 0.79 Item regular gross margin0.72 Item regular gross margin*0.49 Reasonableness of deal performance
requirementsF8 Incentive amount (4.2%) 0.83 Absolute amount of deal allowances
0.81 Deal allowances as per cent of regular trade cost*0.49 Absolute amount of deal allowances*
*Denotes objectives (archival) measure.
Table 2 Discriminant analysis results: analysis of rating (n = 564)
Standardised discrimination coefficients Analysis of rating
Factor Function 1 Function 2
F1 Item importance 0.861 −0.253F2 Promotion elasticity 0.081 0.398F3 Manufacturer brand support 0.127 −0.036F4 Manufacturer reputation 0.394 0.014F5 Promotion wearout −0.207 0.380F6 Sales velocity 0.033 −0.665F7 Item profitability 0.614 0.357F8 Incentive amount 0.461 0.254
Wilks’ l (for each factor) All significant at p < 0.001Multivariate F ratios All significant at p < 0.001Percentage of cases correctly classified 65% correct

724 Marketing Research
Table 3 Relative importance of trade support influencers (as indicated by order of entry into the discriminant analysis)
Analysis of rating
Order of entry Factor name
1 Item importance2 Item profitability3 Incentive amount4 Manufacturer reputation5 Promotion wearout6 Sales velocity7 Promotion elasticity8 Manufacturer brand support
Applications of common factor analysis
The data of Table 24.1 were analysed using the common factor analysis model. Instead of using unities in the diagonal, the communalities were inserted. The output, shown in Table 24.4, is similar to the output from principal components analysis presented in Table 24.3. Beneath the ‘Communalities’ heading, below the ‘Initial’ column, the communalities for the variables are no longer 1.0. Based on the eigenvalue criterion, again two factors are extracted. The variances, after extracting the factors, are different from the initial eigenvalues. The first factor accounts for 42.84% of the variance, whereas the second accounts for 31.13%, in each case a little less than what was observed in principal components analysis.
The values in the unrotated factor pattern matrix of Table 24.4 are a little different from those in Table 24.3, although the pattern of the coefficients is similar. Sometimes, however, the pattern of loadings for common factor analysis is different from that for principal compo-nents analysis, with some variables loading on different factors. The rotated factor matrix has the same pattern as that in Table 24.3, leading to a similar interpretation of the factors. We end with another application of common factor analysis, in the context of consumer per-ception of rebates.
Table 24.4
Bartlett test of sphericity Approximate chi-square = 111.314, df = 15, significance = 0.00000 Kaiser–Meyer–Olkin measure of sampling adequacy = 0.660
Communalities
Variable Initial Extraction
V1 0.859 0.928V2 0.480 0.562V3 0.814 0.836V4 0.543 0.600V5 0.763 0.789V6 0.587 0.723
Results of common factor analysis

725Chapter 24 Factor analysis
Table 24.4
Initial eigenvalues
Factor Eigenvalue Percentage of variance Cumulative percentage
1 2.731 45.520 45.5202 2.218 36.969 82.4883 0.442 7.360 89.8484 0.341 5.688 95.5365 0.183 3.044 98.5806 0.085 1.420 100.000
Extraction sums of squared loadings
Factor Eigenvalue Percentage of variance Cumulative percentage
1 2.570 42.837 42.8372 1.868 31.126 73.964
Factor matrix
Factor 1 Factor 2
V1 0.949 0.168V2 −0.206 0.720V3 0.914 0.038V4 −0.246 0.734V5 −0.850 −0.259V6 −0.101 0.844
Rotation sums of squared loadings
Factor Eigenvalue Percentage of variance Cumulative percentage
1 2.541 42.343 42.3432 1.897 31.621 73.964
Rotated factor matrix
Factor 1 Factor 2
V1 0.963 −0.030V2 −0.054 0.747V3 0.902 −0.150V4 −0.090 0.769V5 −0.885 −0.079V6 0.075 0.847
Continued

726 Marketing Research
Table 24.4
Factor score coefficient matrix
Factor 1 Factor 2
V1 0.628 0.101V2 −0.024 0.253V3 0.217 −0.169V4 −0.023 0.271V5 −0.166 −0.059V6 0.083 0.500
Reproduced correlation matrix
V1 V2 V3 V4 V5 V6
V1 0.928* 0.022 −0.000 0.024 −0.008 −0.042V2 −0.075 0.562* 0.006 −0.008 0.031 0.012V3 0.873 −0.161 0.836* −0.051 0.008 0.042V4 −0.110 0.580 −0.197 0.600* −0.025 −0.004V5 −0.850 −0.012 0.786 0.019 0.789* −0.003V6 0.046 0.629 −0.060 0.645 −0.133 0.723*
*The lower-left triangle contains the reproduced correlation matrix; the diagonal, the communalities; and the upper-right triangle, the residuals between the observed correlations and the reproduced correlations.
Continued
Real research ‘Common’ rebate perceptions10
Rebates are effective in obtaining new users, brand switching and repeat purchases among current users. AT&T deployed a rebate pro-gramme as a means to draw new users to its internet services. AT&T’s intent behind this rebate plan was to acquire new users from rivals such as Verizon. The question faced by decision makers at AT&T was: ‘What makes rebates effective?’.
A study was undertaken to determine the factors underlying consumer perception of rebates. A set of 24 items measuring consumer perceptions of rebates was constructed. Participants were asked to express their degree of agreement with these items on five-point Likert scales. The data were collected by telephone survey, with a total of 303 usable questionnaires.
The 24 items measuring perceptions of rebates were analysed using common factor analysis. The initial factor solution did not reveal a simple structure of underlying rebate perceptions. Therefore, items that had low loadings were deleted from the scale and the factor analysis was performed on the remaining items. This second solution yielded

727Chapter 24 Factor analysis
In this example, when the initial factor solution was not interpretable, items that had low loadings were deleted and the factor analysis was performed on the remaining items. If the number of variables is large (greater than 15), principal components analysis and common factor analysis result in similar solutions. Principal components analysis is less prone to mis-interpretation, however, and is recommended for the non-expert user. Factor analysis in its various forms is a widely used technique, as further illustrated in the following two exam-ples. The first example illustrates an application in the context of international marketing research. The second example shows how factor analysis can be used in investigating ethical behaviour.
three interpretable factors. The factor loadings are presented in the accompanying table, where large loadings have been underscored. The three factors contained four, four and three items, respectively. Factor 1 was defined as a representation of consumers’ faith in the rebate system (Faith). Factor 2 seemed to capture the consumers’ perceptions of the efforts and difficulties associated with rebate redemption (Efforts). Factor 3 represented consumers’ perceptions of the manufacturers’ motives for offering rebates (Motives). The loadings of items on their respective factors ranged from 0.527 to 0.744. Significant loadings are underscored.
Therefore, companies such as AT&T that employ rebates should ensure that the effort and difficulties of consumers in taking advantage of the rebates are minimised. Compa-nies should also try to build consumers’ faith in the rebate system and portray honest motives for offering rebates.
Factor analysis of perceptions of rebates
Factor loading
Scale itemsa Factor 1 Factor 2 Factor 3
Manufacturers make the rebate process too complicated 0.194 0.671 −0.127
Postal rebates are not worth the trouble involved −0.031 0.612 0.352
It takes too long to receive the rebate from the manufacturer 0.013 0.718 0.051
Manufacturers could do more to make rebates easier to use 0.205 0.616 0.173
Manufacturers offer rebates because consumers want them 0.660 0.172 0.101b
Today’s manufacturers take real interest in consumer welfareb
0.569 0.203 0.334
Consumer benefit is usually the primary consideration in rebate offersb
0.660 0.002 0.318
In general, manufacturers are sincere in their rebate offers to consumersb
0.716 0.047 −0.033
Manufacturers offer rebates to get consumers to buy something they do not really need
0.099 0.156 0.744
Manufacturers use rebate offers to induce consumers to buy slow-moving items
0.090 0.027 0.702
Rebate offers require you to buy more of a product than you need
0.230 0.066 0.527
Eigenvalues 2.030 1.344 1.062
Percentage of explained variance 27.500 12.200 9.700
a The response categories for all items were strongly agree (l), agree (2), neither agree nor disagree (3), disagree (4), strongly disagree (5) and don’t know (6). ‘Don’t know’ responses were excluded from data analysis. b The scores of these items were reversed.

728 Marketing Research
Real research Driving nuts for Beetles11
Consumer preferences for cars need to be continually tracked to identify changing demands and specifications. However, there is one car that is quite an exception – the Volkswagen Beetle. More than 22 million of the original model were built between 1938 and 2003. Surveys have been conducted in dif-ferent countries to determine the reasons why people purchased Beetles. Principal compo-nents analysis of the variables measuring the reasons for owning Beetles have consistently revealed one factor – fanatical loyalty. The company had long wished for the car’s natural death, but without any effect. The noisy and cramped ‘bug’ inspired devotion in drivers across the generations. Now old bugs are being sought across the globe. VW reintroduced the brand in 1998 as the ‘New Beetle’, which has won several distinguished automotive awards.
Real research Factors predicting unethical marketing research practices12
Unethical employee behaviour was identified as a root cause for the global banking and financial mess of 2008–9. If companies want ethical employees, then they themselves must conform to high ethical standards. This also applies to the marketing research indus-try. In order to identify organisational variables that are determinants of the incidence of unethical marketing research practices, a sample of 420 marketing professionals was sur-veyed. These marketing professionals were asked to provide responses on several scales, and to provide evaluations of incidence of 15 research practices that have been found to pose research ethics problems. One of these scales included 11 items pertaining to the extent that ethical problems plagued the organisation, and what top management’s actions were towards ethical situations. A principal components analysis with varimax rotation indicated that the data could be represented by two factors. These two factors were then used in a multiple regression, along with four other predictor variables. They were found to be the two best predictors of unethical marketing research practices.
Factor analysis of ethical problems and top management action scales
Extent of ethical problems within the
organisation (Factor 1)
Top management actions on ethics
(Factor 2)
1 Successful executives in my company make rivals look bad in the eyes of important people in my company
0.66
2 Peer executives in my company often engage in behaviours that I consider to be unethical
0.68
3 There are many opportunities for peer executives in my company to engage in unethical behaviours
0.43
4 Successful executives in my company take credit for the ideas and accomplishment of others
0.81

729Chapter 24 Factor analysis
Factor analysis of ethical problems and top management action scales
Extent of ethical problems within the
organisation (Factor 1)
Top management actions on ethics
(Factor 2)
5 In order to succeed in my company, it is often necessary to compromise one’s ethics
0.66
6 Successful executives in my company are gener-ally more unethical than unsuccessful executives
0.64
7 Successful executives in my company look for a ‘scapegoat’ when they feel they may be associ-ated with failure
0.78
8 Successful executives in my company withhold information that is detrimental to their self-interest
0.68
9 Top management in my company have let it be known in no uncertain terms that unethical behaviours will not be tolerated
0.73
10 If an executive in my company is discovered to have engaged in unethical behaviour that results primarily in personal gain (rather than corporate gain), he or she will be promptly reprimanded
0.80
11 If an executive in my company is discovered to have engaged in unethical behaviour that results primarily in corporate gain (rather than personal gain), he or she will be promptly reprimanded
0.78
EigenvaluesPercentage of explained varianceCoefficient alpha
5.0646%0.87
1.1711%0.75
To simplify the table, only varimax rotated loadings of 0.40 or greater are reported. Each was rated on a five-point scale, with 1 = ‘strongly agree’ and 5 = ‘strongly disagree’.
Practise data analysis with SPSS
SPSS Windows and Mac
To select this procedure, click:
Analyze>Dimension Reduction>Factor . . .
(N.B. in older versions of SPSS the ‘Dimension Reduction’ menu item is labelled ‘Data Reduction’.)
The following are the detailed steps for running principal components analysis on the toothpaste attribute ratings (V1 to V6) using the data of Table 24.1:
1 Select ANALYZE from the SPSS menu bar.
2 Click DIMENSION REDUCTION and then FACTOR.
3 Move ‘Prevents Cavities [v1]’ ‘Shiny Teeth [v2]’, ‘Strengthen Gums [v3]’, ‘Freshens Breath [v4]’, ‘Tooth Decay Unimportant [v5]’ and ‘Attractive Teeth [v6]’ into the VARIABLES box.
4 Click DESCRIPTIVES. In the pop-up window, in the STATISTICS box check INITIAL SOLUTION. In the CORRELATION MATRIX box check KMO AND

730 Marketing Research
Summary Factor analysis, also called exploratory factor analysis (EFA), is a class of procedures used for reducing and summarising data. Each variable is expressed as a linear combina-tion of the underlying factors. Likewise, the factors themselves can be expressed as lin-ear combinations of the observed variables. The factors are extracted in such a way that the first factor accounts for the highest variance in the data, the second for the next high-est and so on. Additionally, it is possible to extract the factors so that the factors are uncorrelated, as in principal components analysis.
In formulating the factor analysis problem, the variables to be included in the analysis should be specified based on past research, theory and the judgement of the researcher. These variables should be measured on an interval or ratio scale. Factor analysis is based on a matrix of correlation between the variables. The appropriateness of the correlation matrix for factor analysis can be statistically tested.
The two basic approaches to factor analysis are principal components analysis and common factor analysis. In principal components analysis, the total variance in the data is considered. Principal components analysis is recommended when the research-er’s primary concern is to determine the minimum number of factors that will account for maximum variance in the data for use in subsequent multivariate analysis. In com-mon factor analysis, the factors are estimated based only on the common variance. This method is appropriate when the primary concern is to identify the underlying dimensions and when the common variance is of interest. This method is also known as principal axis factoring.
The number of factors that should be extracted can be determined a priori or based on eigenvalues, scree plots, percentage of variance, split-half reliability or significance tests. Although the initial or unrotated factor matrix indicates the relationships between the factors and individual variables, it seldom results in factors that can be interpreted, because the factors are correlated with many variables. Therefore, rotation is used to transform the factor matrix into a simpler one that is easier to interpret. The most com-monly used method of rotation is the varimax procedure, which results in orthogonal factors. If the factors are highly correlated in the population, oblique rotation can be used. The rotated factor matrix forms the basis for interpreting the factors.
BARTLETT’S TEST OF SPHERICITY and also check REPRODUCED. Click CONTINUE.
5 Click EXTRACTION. In the pop-up window, for METHOD select PRINCIPAL COM-PONENTS (default). In the ANALYZE box, check CORRELATION MATRIX. In the EXTRACT box, select BASED ON EIGENVALUE and enter 1 in EIGENVALUES GREATER THAN box. In the DISPLAY box check UNROTATED FACTOR SOLU-TION. Click CONTINUE.
6 Click ROTATION. In the METHOD box check VARIMAX. In the display box check ROTATED SOLUTION. Click CONTINUE.
7 Click SCORES. In the pop-up window, check DISPLAY FACTOR SCORE COEFFICIENT MATRIX. Click CONTINUE.
8 Click OK.
The procedure for running common factor analysis is similar, except that, in step 5, for METHOD select PRINCIPAL AXIS FACTORING.

731Chapter 24 Factor analysis
Questions 1 How is factor analysis different from multiple regression and discriminant analysis?
2 What are the major uses of factor analysis?
3 Describe the factor analysis model.
4 What hypothesis is examined by Bartlett’s test of sphericity? For what purpose is this test used?
5 What is meant by the term ‘communality of a variable’?
6 Briefly define the following: eigenvalue, factor loadings, factor matrix and factor scores.
7 For what purpose is the Kaiser–Meyer–Olkin measure of sampling adequacy used?
8 What is the major difference between principal components analysis and common factor analysis?
9 Explain how eigenvalues are used to determine the number of factors.
10 What is a scree plot? For what purpose is it used?
11 Why is it useful to rotate the factors? Which is the most common method of rotation?
12 What guidelines are available for interpreting the factors?
13 When is it useful to calculate factor scores?
14 What are surrogate variables? How are they determined?
15 How is the fit of the factor analysis model examined?
Factor scores can be computed for each participant. Alternatively, surrogate variables may be selected by examining the factor matrix and selecting for each factor a varia-ble with the highest or near-highest loading. The differences between the observed correlations and the reproduced correlations, as estimated from the factor matrix, can be examined to determine model fit.
Exercises 1 Complete the following portion of an output from principal components analysis:
Variable Communality Factor Eigenvalue % of variance
V1 1.0 1 3.25V2 1.0 2 1.78V3 1.0 3 1.23V4 1.0 4 0.78V5 1.0 5 0.35V6 1.0 6 0.30V7 1.0 7 0.19V8 1.0 8 0.12
a Draw a scree plot based on these data.
b How many factors should be extracted? Explain your reasoning.

732 Marketing Research
2 In a study of the relationship between household behaviour and shopping behaviour, data on the following lifestyle statements were obtained on a seven-point scale (1 = disagree, 7 = agree):V1 I would rather spend a quiet evening at home than go out to a party.V2 I always check prices, even on small items.V3 Magazines are more interesting than movies.V4 I would not buy products advertised on billboards.V5 I am a homebody.V6 I save and cash coupons.V7 Companies waste a lot of money advertising.
The data obtained from a pre-test sample of 25 participants are given below:
No. V1 V2 V3 V4 V5 V6 V7
1 6 2 7 6 5 3 52 5 7 5 6 6 6 43 5 3 4 5 6 6 74 3 2 2 5 1 3 25 4 2 3 2 2 1 36 2 6 2 4 3 7 57 1 3 3 6 2 5 78 3 5 1 4 2 5 69 7 3 6 3 5 2 4
10 6 3 3 4 4 6 511 6 6 2 6 4 4 712 3 2 2 7 6 1 613 5 7 6 2 2 6 114 6 3 5 5 7 2 315 3 2 4 3 2 6 516 2 7 5 1 4 5 217 3 2 2 7 2 4 618 6 4 5 4 7 3 319 7 2 6 2 5 2 120 5 6 6 3 4 5 321 2 3 3 2 1 2 622 3 4 2 1 4 3 623 2 6 3 2 1 5 324 6 5 7 4 5 7 225 7 6 5 4 6 5 3
a Analyse these data using principal components analysis, using the varimax rotation procedure.
b Interpret the factors extracted.
c Calculate factor scores for each participant.
d If surrogate variables were to be selected, which ones would you select?
e Examine the model fit.
f Analyse the data using common factor analysis, and answer parts b to e.

733Chapter 24 Factor analysis
3 Analyse the Benetton data (taken from Exercise 4, Chapter 20). Consider only the following variables: awareness, attitude, preference, intention and loyalty towards Benetton.
a Analyse these data using principal components analysis, using the varimax rotation procedure.
b Interpret the factors extracted.
c Calculate factor scores for each participant.
d If surrogate variables were to be selected, which ones would you select?
e Examine the model fit.
f Analyse the data using common factor analysis, and answer parts b to e.
4 You are a marketing research analyst for a manufacturer of fashion clothing targeted at teenage boys. You have been asked to develop a set of 10 statements for measuring psychographic characteristics and lifestyles that you feel would relate to their fashion personas. The participants would be asked to indicate their degree of agreement with the statements using a seven-point scale (1 = completely disagree, 7 = completely agree). Question 40 students on campus using these scale items. Factor analyse the data to identify the underlying psychographic factors.
5 In a small group, identify the uses of factor analysis in each of the following major decision areas in marketing:
a Market segmentation
b Product decisions
c Promotions decisions
d Pricing decisions
e Distribution decisions
f Service delivery decisions.
Notes
1. Magnusson, P.R., ‘Benefits of involving users in service innovation’, European Journal of Innovation Management 6 (4) (2003), 228–38; Alt, M., Exploring Hyperspace (New York: McGraw-Hill, 1990), 74.
2. For a detailed discussion of factor analysis, see Loehlin, J.C., Latent Variable Models: An Introduction to Factor, Path, and Structural Equation Analysis (Mahwah, NJ: Lawrence Erlbaum Associates, 2004); Tacq, J., Multivariate Analysis Techniques in Social Science Research (Thousand Oaks, CA: Sage, 1996); Dunteman, G.H., Principal Components Analysis (Newbury Park, CA: Sage, 1989). For applications, see Aaker, J.L., ‘Dimensions of brand personality’, Journal of Marketing Research 34 (August 1997), 347–56; Birks, D.F. and Birts, A.N., ‘Service quality in domestic cash management banks’, in Birks, D.F. (ed.), Global Cash
Management in Europe (Basingstoke: Macmillan, 1998), 175–205. See also Cudeck, R. and MacCallum, R.C., Factor Analysis at 100: Historical Developments and Future Directions (Mahwah, NJ: Lawrence Erlbaum Associates, 2007).
3. See Cudeck, R. and MacCallum, R.C., Factor Analysis at 100: Historical Developments and Future Directions (Mahwah, NJ: Lawrence Erlbaum Associates, 2007); Pett, M.A., Lackey, N. and Sullivan, J., Making Sense of Factor Analysis: The Use of Factor Analysis for Instrument Development in Health Care Research (Thousand Oaks, CA: Sage, 2006); Ding, A.A., ‘Prediction intervals, factor analysis models and high-dimensional empirical linear prediction’, Journal of the American Statistical Association 94 (446) (June 1999), 446–55; Gaur, S., ‘Adelman and Morris factor

734 Marketing Research
analysis of developing countries’, Journal of Policy Modeling 19 (4) (August 1997), 407–15; Lastovicka, J.L. and Thamodaran, K., ‘Common factor score estimates in multiple regression problems’, Journal of Marketing Research 28 (February 1991), 105–12; Dillon, W.R. and Goldstein, M., Multivariate Analysis: Methods and Applications (New York: Wiley, 1984), 23–99.
4. For applications of factor analysis, see Logan, K., ‘Hulu.com or NBC? Streaming videos versus traditional TV: A study of an industry in its infancy’, Journal of Advertising Research 51 (1) (2011), 276–87; Vanden Bergh, B.G., Lee, M., Quilliam, E.T. and Hove, T., ‘The multidimensional nature and brand impact of user-generated ad parodies in social media’, International Journal of Advertising 30 (1) (2011), 103–31; Bellman, S., Schweda, A. and Varan, D., ‘The importance of social motives for watching and interacting with digital television’, International Journal of Market Research 52 (1) (2010), 67–87.
5. Child, D., The Essentials of Factor Analysis, 3rd edn (New York: Continuum, 2006); Bartholomew, D.J. and Knott, M., Latent Variable Models and Factor Analysis (London: Edward Arnold, 1999); Hair, J.E. Jr, Anderson, R.E., Tatham, R.L. and Black, W.C., Multivariate Data Analysis With Readings, 5th edn (Englewood Cliffs, NJ: Prentice Hall, 1999), 364–419; Basilevsky, A., Statistical Factor Analysis and Related Methods: Theory and Applications (New York: Wiley, 1994).
6. Factor analysis is influenced by the relative size of the correlations rather than the absolute size.
7. See Wu, J., DeSarbo, W., Chen, P.J. and Fu, Y.Y., ‘A latent structure factor analytic approach for customer satisfaction measurement’, Marketing Letters 17 (3) (July 2006), 221–37; Henderson, P.W., Giese, J.L. and Cote, J., ‘Impression management using typeface design’, Journal of Marketing 68 (October 2004), 60–72; Kamakura, W.A. and Wedel, M., ‘Factor analysis and missing data’, Journal of Marketing Research 37 (4) (November 2000), 490–8; Roberts, J.A. and Beacon, D.R., ‘Exploring the subtle relationships between environmental concern and
ecologically conscious behavior’, Journal of Business Research 40 (1) (September 1997), 79–89; Chatterjee, S., Jamieson, L. and Wiseman, F., ‘Identifying most influential observations in factor analysis’, Marketing Science (Spring 1991), 145–60; Acito, F. and Anderson, R.D., ‘A Monte Carlo comparison of factor analytic methods’, Journal of Marketing Research 17 (May 1980), 228–36.
8. Other methods of orthogonal rotation are also available. The quartimax method minimises the number of factors needed to explain a variable. The equimax method is a combination of varimax and quartimax.
9. Park, H., ‘US retailers’ cooperation with manufacturer promotional support’, Journal of Fashion Management 8 (4) (2004), 412–24; Silva-Risso, J.M., Bucklin, R.E. and Morrison, D.G., ‘A decision support system for planning manufacturers’ sales promotion calendars’, Marketing Science 18 (3) (1999), 274; Curhan, R.C. and Kopp, R.J., ‘Obtaining retailer support for trade deals: Key success factors’, Journal of Advertising Research (December 1987–January 1988), 51–60.
10. Chtourou, M.S., Chandon, J.L. and Zollinger, M., ‘Effect of price information and promotion on click-through rate for internet banners’, Journal of Euromarketing 11 (2) (2002), 23–40; Tat, P., Cunningham, W.A. III and Babakus, E., ‘Consumer perceptions of rebates’, Journal of Advertising Research (August–September 1988), 45–50.
11. Guyer, L., ‘Fitting in at VW: Try “Raumwunder”’, Advertising Age 77 (16) (April 2006), S-8 (2); Hammonds, D., ‘Volkswagen’s new Beetle acquits itself well in sporting world’, Knight Ridder Tribune Business News (July 23, 2004), 1.
12. Rittenburg, T., Valentine, S. and Faircloth, J., ‘An ethical decision-making framework for competitor intelligence gathering’, Journal of Business Ethics 70 (3) (February 2007), 235–45; Akaah, I.P and Riordan, E.A., ‘The incidence of unethical practices in marketing research: An empirical investigation’, Journal of the Academy of Marketing Science 18 (1990), 143–52.

Cluster analysis
Cluster analysis aims to identify
and classify similar entities, based
upon the characteristics they
possess. It helps the researcher to
understand patterns of similarity
and difference that reveal
naturally occurring groups.
25 Stage 1
Problem definition
Stage 2
Research approach developed
Stage 3
Research design
developed
Stage 4
Fieldwork or data
collection
Stage 5
Data integrity
and analysis
Stage 6
Communicating research findings

736 Marketing Research
Objectives
After reading this chapter, you should be able to:
1 describe the basic concept and scope of cluster analysis and its importance in marketing research;
2 discuss the statistics associated with cluster analysis;
3 explain the procedure for conducting cluster analysis, including formulating the problem, selecting a distance measure, selecting a clustering procedure, deciding on the number of clusters, interpreting clusters and profiling clusters;
4 describe the purpose and methods for evaluating the quality of clustering results and assessing reliability and validity;
5 discuss the applications of non-hierarchical clustering and clustering of variables;
6 appreciate how software is used to carry out factor analysis.
Overview
As with factor analysis (Chapter 24), cluster analysis examines an entire set of interdependent relationships. Cluster analysis makes no distinction between dependent and independent variables. Rather, interdependent relationships between the whole set of variables are examined. The primary objective of cluster analysis is to classify objects into relatively homogeneous groups based on the set of variables considered. Objects in a group are relatively similar in terms of these variables and different from objects in other groups. When used in this manner, cluster analysis is the obverse of factor analysis in that it reduces the number of objects, not the number of variables, by grouping them into a much smaller number of clusters.
This chapter describes the basic concept of cluster analysis. The steps involved in conducting cluster analysis are discussed and illustrated in the context of hierarchical clustering. Then an application of non-hierarchical clustering is presented, followed by a discussion of clustering of variables. Finally, guidance is provided on the use of software to address the data analysis challenges presented in this chapter. We begin with an example that illustrates the use of clustering to aid the process of defining target markets.
Real research Ice cream ‘hot spots’1
Häagen-Dazs Shoppe Co. (www.haagen-dazs.com), with more than 850 retail ice cream shops in over 50 countries, was inter-ested in expanding its customer base. The objective was to identify potential consumer segments that could generate additional sales. It used geodemographic techniques (as discussed in Chapter 5), which are based upon clustering consumers using geographic, demographic and lifestyle data. Additional primary data were collected to develop an understanding of the demographic, lifestyle and behavioural characteristics of Häagen-Dazs Shoppe users, which included fre-quency of purchase, time of day to visit café, day of the week and a range of other prod-uct variables. The postcodes or zip codes of participants were also obtained. The

737Chapter 25 Cluster analysis
participants were then assigned to 40 geodemographic clusters based upon a clustering procedure developed by Nielsen Claritas (www.nielsen.com). Häagen-Dazs compared its profile of customers with the profile of geodemographic classifications to develop a clearer picture of the types of consumer it was attracting. From this it decided which profiles of consumer or target markets it believed to hold the most potential for addi-tional sales. New products were developed and advertising was established and profiled to target specific consumer types.
Basic concept
Cluster analysis is a class of techniques used to classify objects, or cases, into relatively homogeneous groups called clusters. Objects in each cluster tend to be similar to each other and dissimilar to objects in the other clusters. Cluster analysis is also called clas-sification analysis or numerical taxonomy.2 We are concerned with clustering proce-dures that assign each object to one, and only one cluster.3 Figure 25.1 shows an ideal clustering situation in which the clusters are distinctly separated on two variables: qual-ity consciousness (variable 1) and price sensitivity (variable 2). Note that each consumer falls into one cluster and there are no overlapping areas. Figure 25.2, on the other hand, presents a clustering situation more likely to be encountered in practice. In Figure 25.2, the boundaries for some of the clusters are not clear cut, and the classification of some consumers is not obvious because many of them could be grouped into one cluster or another.
Figure 25.1
An ideal clustering solution
Variable 2
Var
iabl
e 1
Both cluster analysis and discriminant analysis are concerned with classification. Discriminant analysis, however, requires prior knowledge of the cluster or group membership for each object or case included, to develop the classification rule. In contrast, in cluster analysis there is no a priori information about the group or cluster membership for any of the objects. Groups or clusters are suggested by the data, not defined a priori.4 Cluster analysis has been used in marketing for a variety of purposes, including the following:5

738 Marketing Research
Figure 25.2
A practical clustering solution
Variable 2
Var
iabl
e 1
Real research Thailand escapists7
In a study examining decision-making patterns among international tourists, 260 par-ticipants provided information on six psychographic orientations: psychological, educa-tional, social, relaxational, physiological and aesthetic. Cluster analysis was used to group participants into psychographic segments. The results suggested that there were three meaningful segments based upon their lifestyles. The first segment (53%) consisted of individuals who were high on nearly all lifestyle scales. This group was called the ‘demanders’. The second group (20%) was high on the educational scale and was named the ‘educationalists’. The last group (26%) was high on relaxation and low on social scales and was named the ‘escapists’. Specific marketing strategies were formulated to attract tourists in each segment. In order to recover from the aftermath of the economic down-turn in 2008–2009, Thailand made a special effort to reach the ‘escapists’, as the country, with its many relaxation opportunities and natural beauty, would appeal the most to these tourists.
• Segmenting the market. For example, consumers may be clustered on the basis of benefits sought from the purchase of a product. Each cluster would consist of consumers who are relatively homogeneous in terms of the benefits they seek.6 This approach is called benefit segmentation, as illustrated in the following example.
• Understanding buyer behaviours. Cluster analysis can be used to identify homogeneous groups of buyers. Then the buying behaviour of each group may be examined separately, as can happen for example with different types of car buyers. Cluster analysis has been used to identify the kinds of strategies car buyers use to obtain information to support their buying decisions.
• Identifying new product opportunities. By clustering brands and products, competitive sets within the market can be determined. Brands in the same cluster compete more fiercely with each other than with brands in other clusters. A firm can examine its cur-rent offerings compared with those of its competitors to identify potential new product opportunities.
• Selecting test markets. By grouping cities into homogeneous clusters, it is possible to select comparable cities to test various marketing strategies.

739Chapter 25 Cluster analysis
Before discussing the statistics associated with cluster analysis, it should be mentioned that most clustering methods are relatively simple procedures that are not supported by an extensive body of statistical reasoning. Rather, most clustering methods are heuris-tics, which are based on algorithms. Thus, cluster analysis contrasts sharply with anal-ysis of variance, regression, discriminant analysis and factor analysis, which are based upon an extensive body of statistical reasoning. Although many clustering methods have important statistical properties, the fundamental simplicity of these methods needs to be recognised.8 The following statistics and concepts are associated with clus-ter analysis:
• Agglomeration schedule. An agglomeration schedule gives information on the objects or cases being combined at each stage of a hierarchical clustering process.
• Cluster centroid. The cluster centroid is the mean values of the variables for all the cases or objects in a particular cluster.
• Cluster centres. The cluster centres are the initial starting points in non-hierarchical clus-tering. Clusters are built around these centres or seeds.
• Cluster membership. This indicates the cluster to which each object or case belongs.
• Dendrogram. A dendrogram, or tree graph, is a graphical device for displaying clustering results. Vertical lines represent clusters that are joined together. The position of the line on the scale indicates the distances at which clusters were joined. The dendrogram is read from left to right. Figure 25.8, later in this chapter, is a dendrogram.
• Distances between cluster centres. These distances indicate how separated the indi-vidual pairs of clusters are. Clusters that are widely separated are distinct and there-fore desirable.
• Icicle diagram. An icicle diagram is a graphical display of clustering results, so called because it resembles a row of icicles hanging from the eaves of a house. The columns correspond to the objects being clustered, and the rows correspond to the number of clus-ters. An icicle diagram is read from bottom to top. Figure 25.7, later in this chapter, is an icicle diagram.
• Similarity/distance coefficient matrix. A similarity/distance coefficient matrix is a lower triangular matrix containing pairwise distances between objects or cases.
Statistics associated with cluster analysis
Conducting cluster analysis
The steps involved in conducting cluster analysis are listed in Figure 25.3. The first step is to formulate the clustering problem by defining the variables on which the clustering will be based. Then, an appropriate distance measure must be selected. The distance measure deter-mines how similar or dissimilar the objects being clustered are. Several clustering procedures
• Reducing data. Cluster analysis can be used as a general data reduction tool to develop clusters or subgroups of data that are more manageable than individual observations. Sub-sequent multivariate analysis is conducted on the clusters rather than on the individual observations. For example, to describe differences in consumers’ product usage behav-iour, the consumers may first be clustered into groups. The differences among the groups may then be examined using multiple discriminant analysis.

740 Marketing Research
have been developed, and the researcher should select one that is appropriate for the problem at hand. Deciding on the number of clusters requires judgement on the part of the researcher. The derived clusters should be interpreted in terms of the variables used to cluster them and profiled in terms of additional salient variables. Finally, the researcher must assess the valid-ity of the clustering process.
Formulate the problem
Perhaps the most important part of formulating the clustering problem is selecting the variables on which the clustering is based. Inclusion of even one or two irrelevant varia-bles may distort an otherwise useful clustering solution. Basically, the set of variables selected should describe the similarity between objects in terms that are relevant to the marketing research problem. The variables should be selected based on past research, theory or a consideration of the hypotheses being developed or tested. If cluster analysis is used as an exploratory approach, the researcher naturally exercises their judgement and intuition.
To illustrate, we consider a clustering of consumers based on attitudes towards shopping. Based on past research, six attitudinal variables were identified as being the most relevant to the marketing research problem. Consumers were asked to express their degree of agreement with the following statements on a seven-point scale (1 = disagree, 7 = agree):
V1 Shopping is fun.
V2 Shopping is bad for your budget.
V3 I combine shopping with eating out.
V4 I try to get the best buys while shopping.
V5 I don’t care about shopping.
V6 You can save a lot of money by comparing prices.
Data obtained from a pre-test sample of 20 participants are shown in Table 25.1. Note that, in practice, clustering is done on much larger samples of 100 or more, but here a small sample size has been used to illustrate the clustering process.
Figure 25.3
Conducting cluster analysis
Formulate the problem
Select a distance measure
Select a clustering procedure
Decide on the number of clusters
Interpret and pro�le clusters
Assess the reliability and validity

741Chapter 25 Cluster analysis
Select a distance measure
Because the objective of clustering is to group similar objects together, some measure is needed to assess how similar or different the objects are. The most common approach is to measure similarity in terms of distance between pairs of objects. Objects with smaller dis-tances between them are more similar to each other than are those at larger distances. There are several ways to compute the distance between two objects.9
The most commonly used measure of similarity is the Euclidean distance or its square. The Euclidean distance is the square root of the sum of the squared differences in values for each variable. Other distance measures are also available. The city-block or Manhattan dis-tance between two objects is the sum of the absolute differences in values for each variable. The Chebychev distance between two objects is the maximum absolute difference in values for any variable. For our example, we use the squared Euclidean distance.
If the variables are measured in vastly different units, the clustering solution will be influ-enced by the units of measurement. In a supermarket shopping study, attitudinal variables may be measured on a nine-point Likert-type scale; patronage, in terms of frequency of visits per month and the amount spent; and brand loyalty, in terms of percentage of grocery shopping expenditure allocated to the favourite supermarket. In these cases, before clustering partici-pants, we must standardise the data by rescaling each variable to have a mean of 0 and a stand-ard deviation of 1. Although standardisation can remove the influence of the unit of measurement, it can also reduce the differences between groups on variables that may best discriminate groups or clusters. It is also desirable to eliminate outliers (cases with atypical values).10
Use of different distance measures may lead to different clustering results. Hence, it is advisable to use different measures and to compare the results. Having selected a distance or similarity measure, we can next select a clustering procedure.
Euclidean distanceThe square root of the sum of the squared differences in values for each variable.
Table 25.1
Case number V1 V2 V3 V4 V5 V6
1 6 4 7 3 2 3 2 2 3 1 4 5 4 3 7 2 6 4 1 3 4 4 6 4 5 3 6 5 1 3 2 2 6 4 6 6 4 6 3 3 4 7 5 3 6 3 3 4 8 7 3 7 4 1 4 9 2 4 3 3 6 310 3 5 3 6 4 611 1 3 2 3 5 312 5 4 5 4 2 413 2 2 1 5 4 414 4 6 4 6 4 715 6 5 4 2 1 416 3 5 4 6 4 717 4 4 7 2 2 518 3 7 2 6 4 319 4 6 3 7 2 720 2 3 2 4 7 2
Attitudinal data for clustering

742 Marketing Research
Select a clustering procedure
Figure 25.4 is a classification of clustering procedures. Clustering procedures can be hierarchi-cal or non-hierarchical, or other procedures. Hierarchical clustering is characterised by the development of a hierarchy or treelike structure. Hierarchical methods can be agglomerative or divisive. Agglomerative clustering starts with each object in a separate cluster. Clusters are formed by grouping objects into bigger and bigger clusters. This process is continued until all objects are members of a single cluster. Divisive clustering starts with all the objects grouped in a single cluster. Clusters are divided or split until each object is in a separate cluster.
Agglomerative methods are commonly used in marketing research. They consist of link-age methods, error sums of squares or variance methods, and centroid methods. Linkage methods include single linkage, complete linkage and average linkage. The single linkage method is based on minimum distance, or the nearest neighbour rule. The first two objects clustered are those that have the smallest distance between them. The next shortest distance is identified, and either the third object is clustered with the first two or a new two-object cluster is formed. At every stage, the distance between two clusters is the distance between their two closest points (see Figure 25.5). Two clusters are merged at any stage by the sin-gle shortest link between them. This process is continued until all objects are in one cluster. The single linkage method does not work well when the clusters are poorly defined. The complete linkage method is similar to single linkage, except that it is based on the maxi-mum distance, or the farthest neighbour approach. In complete linkage, the distance between two clusters is calculated as the distance between their two farthest points (see Figure 25.5). The average linkage method works similarly. In this method, however, the distance between two clusters is defined as the average of the distances between all pairs of objects, where one member of the pair is from each of the clusters (Figure 25.5). As can be seen, the average linkage method uses information on all pairs of distances, not merely the minimum or maximum distances. For this reason, it is usually preferred to the single and complete linkage methods.
Hierarchical clusteringA clustering procedure characterised by the development of a hierarchy or treelike structure.
Agglomerative clusteringA hierarchical clustering procedure where each object starts out in a separate cluster. Clusters are formed by grouping objects into bigger and bigger clusters.
Divisive clusteringA hierarchical clustering procedure where all objects start out in one giant cluster. Clusters are formed by dividing this cluster into smaller and smaller clusters.
Linkage methodsAgglomerative methods of hierarchical clustering that cluster objects based on a computation of the distance between them.
Single linkageA linkage method based on minimum distance, or the nearest neighbour rule.
Complete linkageA linkage method that is based on maximum distance, or the farthest neighbour approach.
Figure 25.4
A classification of clustering procedures
TwoStep
Clustering procedures
Hierarchical OtherNon-hierarchical
Agglomerative Divisive
Sequentialthreshold
Optimisingpartitioning
Parallelthreshold
Linkagemethods
Centroidmethods
Variancemethods
Singlelinkage
Averagelinkage
Completelinkage
Ward’s method

743Chapter 25 Cluster analysis
The variance methods attempt to generate clusters to minimise the within-cluster vari-ance. A commonly used variance method is Ward’s procedure. For each cluster, the means for all the variables are computed. Then, for each object, the squared Euclidean distance to the cluster means is calculated (Figure 25.6), and these distances are summed for all the objects. At each stage, the two clusters with the smallest increase in the overall sum of squares within cluster distances are combined. In the centroid method, the distance between two clusters is the distance between their centroids (means for all the variables), as shown in Figure 25.6. Every time objects are grouped, a new centroid is computed. Of the hierarchical methods, the average linkage method and Ward’s procedure have been shown to perform better than the other procedures.11
The second type of clustering procedures, the non-hierarchical clustering methods, are frequently referred to as k-means clustering. These methods include sequential threshold, parallel threshold and optimising partitioning. In the sequential threshold method, a cluster centre is selected and all objects within a pre-specified threshold value from the centre are grouped together. A new cluster centre or seed is then selected, and the process is repeated for the unclustered points. Once an object is clustered with a seed, it is no longer considered for clustering with subsequent seeds. The parallel threshold method operates similarly, except that several cluster centres are selected simultaneously and objects within the threshold level are grouped with the nearest centre. The optimising partitioning method differs from the two threshold procedures in that objects can later be reassigned to clusters to optimise an overall criterion, such as average within-cluster distance for a given number of clusters.
Two major disadvantages of the non-hierarchical procedures are that the number of clus-ters must be pre-specified and that the selection of cluster centres is arbitrary. Furthermore, the clustering results may depend on how the centres are selected. Many non-hierarchical programs select the first k cases (k = number of clusters) without missing values as initial cluster centres. Thus, the clustering results may depend on the order of observations in the
Figure 25.5
Linkage methods of clustering
Minimum
distance
Single linkage
Cluster 1 Cluster 2
Maximum
distance
Complete linkage
Cluster 1 Cluster 2
Averagedistance
Average linkage
Cluster 1 Cluster 2
Average linkageA linkage method based on the average distance between all pairs of objects, where one member of the pair is from each of the clusters.
Variance methodAn agglomerative method of hierarchical clustering in which clusters are generated to minimise the within-cluster variance.
Ward's procedureA variance method in which the squared Euclidean distance to the cluster means is minimised.
Centroid methodA method of hierarchical clustering in which clusters are generated so as to maximise the distances between the centres, or centroids, of clusters.
Non-hierarchical clusteringA procedure that first assigns or determines a cluster centre and then groups all objects within a pre-specified threshold value from the centre(s).
Sequential threshold methodA non-hierarchical clustering method in which a cluster centre is selected and all objects within a pre-specified threshold value from the centre are grouped together.
Parallel threshold methodA non-hierarchical clustering method that specifies several cluster centres at once. All objects that are within a pre-specified threshold value from the centre are grouped together.
Optimising partitioning methodA non-hierarchical clustering method that allows for later reassignment of objects to clusters to optimise an overall criterion.

744 Marketing Research
data. Yet non-hierarchical clustering is faster than hierarchical methods and has merit when the number of objects or observations is large. It has been suggested that the hierarchical and non-hierarchical methods be used in tandem. First, an initial clustering solution is obtained using a hierarchical procedure, such as average linkage or Ward’s. The number of clusters and cluster centroids so obtained are used as inputs to the optimising partitioning method.12
Other clustering procedures are also available; one of particular interest is TwoStep clus-ter analysis. This procedure can automatically determine the optimal number of clusters by comparing the values of model-choice criteria across different clustering solutions. It also has the ability to create cluster models based on categorical and continuous variables. In addition to Euclidean distance, the TwoStep procedure also uses the log-likelihood measure. The log-likelihood measure places a probability distribution on the variables. It also accom-modates two clustering criteria: Schwarz’s Bayesian Information Criterion (BIC) or the Akaike Information Criterion (AIC).13
The choice of a clustering method and the choice of a distance measure are interrelated. For example, squared Euclidean distances should be used with Ward’s and the centroid methods. Several non-hierarchical procedures also use squared Euclidean distances. In the TwoStep procedure, the Euclidean measure can be used only when all of the variables are continuous.
We will use Ward’s procedure to illustrate hierarchical clustering. The output obtained by clustering the data of Table 25.1 is given in Table 25.2. Useful information is contained in the agglomeration schedule, which shows the number of cases or clusters being combined at each stage. The first line represents stage 1, with 19 clusters. Participants 14 and 16 are com-bined at this stage, as shown in the columns labelled ‘Clusters combined’. The squared Euclidean distance between these two participants is given under the column labelled ‘Coef-ficients’. The columns entitled ‘Stage cluster first appears’ indicate the stage at which a cluster is first formed. To illustrate, an entry of 1 at stage 6 indicates that participant 14 was first grouped at stage 1. The last column, ‘Next stage’, indicates the stage at which another case (participant) or cluster is combined with this one. Because the number in the first line of the last column is 6, we see that, at stage 6, participant 10 is combined with 14 and 16 to form a single cluster. Similarly, the second line represents stage 2 with 18 clusters. In stage 2, participants 6 and 7 are grouped together.
Another important part of the output is contained in the icicle plot, given in Figure 25.7. The columns correspond to the objects being clustered; in this case, they are the participants labelled 1 to 20. The rows correspond to the number of clusters. This figure is read from bottom to top.
Figure 25.6
Other agglomerative clustering methods
Centroid method
Ward’s procedure

745Chapter 25 Cluster analysis
Table 25.2
Case processing summarya,b
Valid Missing Total
N % N % N %20 100.0 0 0.0 20 100.0
a Squared Euclidean distance used.b Ward linkage.
Ward linkage: agglomeration schedule
Clusters combined Stage cluster first appears
Stage Cluster 1 Cluster 2 Coefficients Cluster 1 Cluster 2 Next stage
1 14 16 1.000 0 0 6 2 6 7 2.000 0 0 7 3 2 13 3.500 0 0 15 4 5 11 5.000 0 0 11 5 3 8 6.500 0 0 16 6 10 14 8.167 0 1 9 7 6 12 10.500 2 0 10 8 9 20 13.000 0 0 11 9 4 10 15.583 0 6 1210 1 6 18.500 0 7 1311 5 9 23.000 4 8 1512 4 19 27.750 9 0 1713 1 17 33.100 10 0 1414 1 15 41.333 13 0 1615 2 5 51.833 3 11 1816 1 3 64.500 14 5 1917 4 18 79.667 12 0 1818 2 4 172.667 15 17 1919 1 2 328.600 16 18 0
Cluster membership
Number of clusters
Case Four clusters Three clusters Two clusters
1 1 1 1 2 2 2 2 3 1 1 1 4 3 3 2 5 2 2 2 6 1 1 1 7 1 1 1 8 1 1 1 9 2 2 210 3 3 211 2 2 212 1 1 113 2 2 214 3 3 215 1 1 116 3 3 217 1 1 118 4 3 219 3 3 220 2 2 2
Results of hierarchical clustering

746 Marketing Research
Vertical icicle plot using Ward’s procedureFigure 25.7
Case18
XXXXXXXXXXXXXXXXXXX
XXX
19
XXXXXXXXXXXXXXXXXXX
XXXXXXXX
16
XXXXXXXXXXXXXXXXXXX
XXXXXXXXXXXXXXXXXXX
14
XXXXXXXXXXXXXXXXXXX
XXXXXXXXXXXXXX
10
XXXXXXXXXXXXXXXXXXX
XXXXXXXXXXX
4
XXXXXXXXXXXXXXXXXXX
XX
20
XXXXXXXXXXXXXXXXXXX
XXXXXXXXXXXX
9
XXXXXXXXXXXXXXXXXXX
XXXXXXXXX
11
XXXXXXXXXXXXXXXXXXX
XXXXXXXXXXXXXXXX
5
XXXXXXXXXXXXXXXXXXX
XXXXX
13
XXXXXXXXXXXXXXXXXXX
XXXXXXXXXXXXXXXXX
2
XXXXXXXXXXXXXXXXXXX
X
8
XXXXXXXXXXXXXXXXXXX
XXXXXXXXXXXXXXX
3
XXXXXXXXXXXXXXXXXXX
XXXX
15
XXXXXXXXXXXXXXXXXXX
XXXXXX
17
XXXXXXXXXXXXXXXXXXX
XXXXXXX
12
XXXXXXXXXXXXXXXXXXX
XXXXXXXXXXXXX
7
XXXXXXXXXXXXXXXXXXX
XXXXXXXXXXXXXXXXXX
6
XXXXXXXXXXXXXXXXXXX
XXXXXXXXXX
1
XXXXXXXXXXXXXXXXXXX
Numberof
clusters12345678910111213141516171819
At first, all cases are considered as individual clusters. Since there are 20 participants, there are 20 initial clusters. At the first step, the two closest objects are combined, resulting in 19 clus-ters. The last line of Figure 25.7 shows these 19 clusters. The two cases, participants 14 and 16, that have been combined at this stage have no blank space separating them. Row number 18 corresponds to the next stage, with 18 clusters. At this stage, participants 6 and 7 are grouped together. Thus, at this stage there are 18 clusters; 16 of them consist of individual participants, and 2 contain two participants each. Each subsequent step leads to the formation of a new clus-ter in one of three ways: (1) two individual cases are grouped together; (2) a case is joined to an already existing cluster; or (3) two clusters are grouped together.
Another graphic device that is useful in displaying clustering results is the dendrogram (see Figure 25.8). The dendrogram is read from left to right. Vertical lines represent clusters that are joined together. The position of the line on the scale indicates the distances at which clusters were joined. Because many distances in the early stages are of similar magnitude, it is difficult to tell the sequence in which some of the early clusters are formed. It is clear, however, that in the last two stages the distances at which the clusters are being combined are large. This information is useful in deciding on the number of clusters.
It is also possible to obtain information on cluster membership of cases if the number of clusters is specified. Although this information can be discerned from the icicle plot, a tabu-lar display is helpful. Table 25.2 contains the cluster membership for the cases, depending on whether the final solution contains two, three or four clusters. Information of this type can be obtained for any number of clusters and is useful for deciding on the number of clusters.
Decide on the number of clusters
A major issue in cluster analysis is deciding on the number of clusters. Although there are no hard and fast rules, some guidelines are available:

747Chapter 25 Cluster analysis
1 Theoretical, conceptual or practical considerations may suggest a certain number of clus-ters. For example, if the purpose of clustering is to identify market segments, manage-ment may want a particular number of clusters.
2 In hierarchical clustering, the distances at which clusters are combined can be used as criteria. This information can be obtained from the agglomeration schedule or from the dendrogram. In our case, we see from the agglomeration schedule in Table 25.2 that the value in the ‘Coefficients’ column suddenly more than doubles between stages 17 (three clusters) and 18 (two clusters). Likewise, at the last two stages of the dendrogram in Figure 23.8, the clusters are being combined at large distances. Therefore, it appears that a three-cluster solution is appropriate.
3 In non-hierarchical clustering, the ratio of total within-group variance to between-group variance can be plotted against the number of clusters. The point at which an elbow or a sharp bend occurs indicates an appropriate number of clusters. Increasing the number of clusters beyond this point is usually not worthwhile.
4 The relative sizes of the clusters should be meaningful. In Table 25.2, by making a simple frequency count of cluster membership, we see that a three-cluster solution results in clus-ters with eight, six and six elements. If we go to a four-cluster solution, however, the sizes of the clusters are eight, six, five and one. It is not meaningful to have a cluster with only one case, so a three-cluster solution is preferable in this situation.
Interpret and profile clusters
Interpreting and profiling clusters involves examining the cluster centroids. The centroids represent the mean values of the objects contained in the cluster on each of the variables. The centroids enable us to describe each cluster by assigning it a name or label. If the clustering program does not print this information, it may be obtained through discriminant analysis. Table 25.3 gives the centroids or mean values for each cluster in our example. Cluster 1 has relatively high values on variables V1 (Shopping is fun) and V3 (I combine shopping with
Figure 25.8
Dendrogram using Ward's procedure
0 5 10 15 20
Rescaled distance clusters combine
151761
12783
20915
132
18194
101614
Cas
e la
bel n
umbe
r
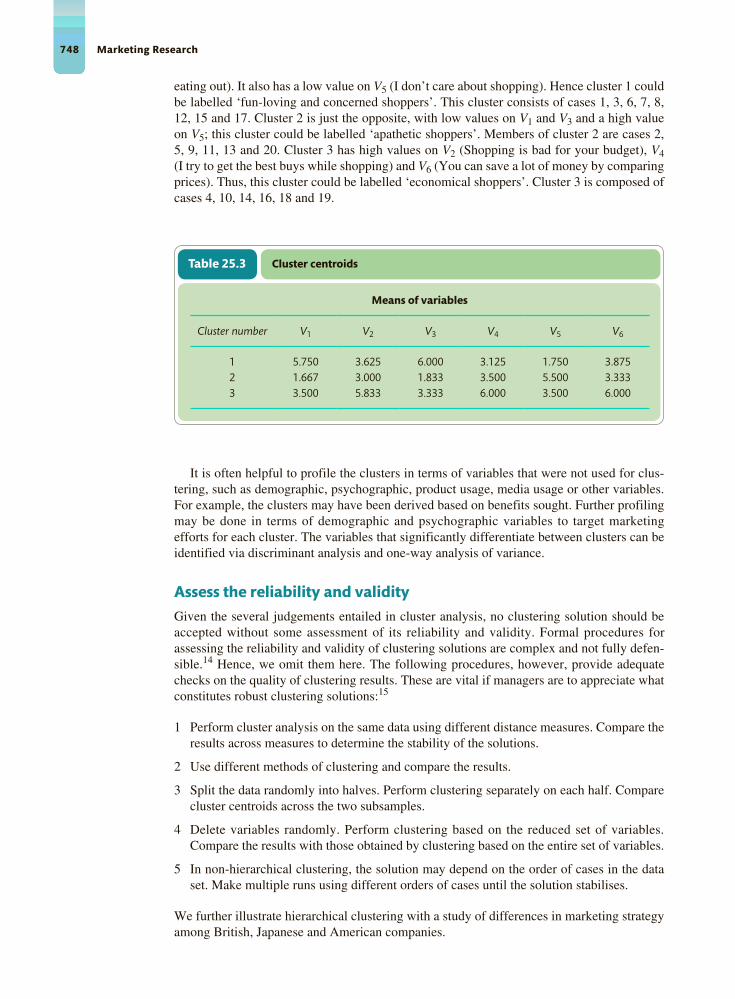
748 Marketing Research
eating out). It also has a low value on V5 (I don’t care about shopping). Hence cluster 1 could be labelled ‘fun-loving and concerned shoppers’. This cluster consists of cases 1, 3, 6, 7, 8, 12, 15 and 17. Cluster 2 is just the opposite, with low values on V1 and V3 and a high value on V5; this cluster could be labelled ‘apathetic shoppers’. Members of cluster 2 are cases 2, 5, 9, 11, 13 and 20. Cluster 3 has high values on V2 (Shopping is bad for your budget), V4 (I try to get the best buys while shopping) and V6 (You can save a lot of money by comparing prices). Thus, this cluster could be labelled ‘economical shoppers’. Cluster 3 is composed of cases 4, 10, 14, 16, 18 and 19.
Table 25.3
Means of variables
Cluster number V1 V2 V3 V4 V5 V6
1 5.750 3.625 6.000 3.125 1.750 3.8752 1.667 3.000 1.833 3.500 5.500 3.3333 3.500 5.833 3.333 6.000 3.500 6.000
Cluster centroids
It is often helpful to profile the clusters in terms of variables that were not used for clus-tering, such as demographic, psychographic, product usage, media usage or other variables. For example, the clusters may have been derived based on benefits sought. Further profiling may be done in terms of demographic and psychographic variables to target marketing efforts for each cluster. The variables that significantly differentiate between clusters can be identified via discriminant analysis and one-way analysis of variance.
Assess the reliability and validity
Given the several judgements entailed in cluster analysis, no clustering solution should be accepted without some assessment of its reliability and validity. Formal procedures for assessing the reliability and validity of clustering solutions are complex and not fully defen-sible.14 Hence, we omit them here. The following procedures, however, provide adequate checks on the quality of clustering results. These are vital if managers are to appreciate what constitutes robust clustering solutions:15
1 Perform cluster analysis on the same data using different distance measures. Compare the results across measures to determine the stability of the solutions.
2 Use different methods of clustering and compare the results.
3 Split the data randomly into halves. Perform clustering separately on each half. Compare cluster centroids across the two subsamples.
4 Delete variables randomly. Perform clustering based on the reduced set of variables. Compare the results with those obtained by clustering based on the entire set of variables.
5 In non-hierarchical clustering, the solution may depend on the order of cases in the data set. Make multiple runs using different orders of cases until the solution stabilises.
We further illustrate hierarchical clustering with a study of differences in marketing strategy among British, Japanese and American companies.

749Chapter 25 Cluster analysis
Real research It is a small world16
Data for a study of British, Japanese and American competitors were obtained from detailed face-to-face interviews with chief executives and top marketing decision mak-ers for defined product groups in 90 companies. To control for market differences, the methodology was based upon matching 30 British companies with their major Japanese and American competitors in the British market. The study involved 30 triads of compa-nies, each composed of a British, Japanese and American business that competed directly with one another. Most of the data on the characteristics of the companies’ performance, strategy and organisation were collected on five-point semantic differen-tial scales. The first stage of the analysis involved factor analysis of variables describing the firms’ strategies and marketing activities. The factor scores were used to identify groups of similar companies using Ward’s hierarchical clustering routine. A six-cluster solution was developed.
Cluster I II III IV V VI
Name Innovators Quality marketers
Price promoters
Product marketers
Mature marketers
Aggressive pushers
Size 22 11 14 13 13 17Successful (%) 55 100 36 38 77 41
Nationality (%)
British 23 18 64 38 31 29Japanese 59 46 22 31 15 18American 18 36 14 31 54 53
Membership in the six clusters was then interpreted against the original performance, strategy and organisational variables. All the clusters contained some successful compa-nies, although some contained significantly more than others. The clusters lent support to the hypothesis that successful companies were similar irrespective of nationality, since British, Japanese and American companies were found in all the clusters. There was, however, a preponderance of Japanese companies in the more successful clusters and a predominance of British companies in the two least successful clusters. Appar-ently, Japanese companies did not deploy strategies that were unique to them; rather, more of them pursued strategies that worked effectively in the British market. The find-ings indicated that there were generic strategies that described successful companies, irrespective of their industry. Three successful strategies could be identified. The first was the quality marketing strategy. These companies had strengths in marketing and research and development. They concentrated their technical developments on achieving high quality rather than pure innovation. These companies were characterised by entrepre-neurial organisations, long-range planning and a well-communicated sense of mission. The second generic strategy was that of the innovators, who were weaker on advanced research and development but were entrepreneurial and driven by a quest for innova-tion. The last successful group were the mature marketers, who were highly profit ori-ented and had in-depth marketing skills. All three appeared to consist of highly marketing-oriented businesses.

750 Marketing Research
Applications of non-hierarchical clustering
We illustrate the non-hierarchical procedure using the data in Table 25.1 and an optimising partitioning method. Based on the results of hierarchical clustering, a three-cluster solution was pre-specified. The results are presented in Table 25.4.
Table 25.4
Initial cluster centres
Cluster
1 2 3
V1
V2
V3
V4
V5
V6
4
6
3
7
2
7
2
3
2
4
7
2
7
2
6
4
1
3
Iteration history*
Change in cluster centres
Iteration 1 2 3
1 2.154 2.102 2.5502 0.000 0.000 0.000
*Convergence achieved due to no or small distance change. The maximum distance by which any centre has changed is 0.000. The current iteration is 2. The minimum distance between initial centres is 7.746.
Cluster membership
Case number Cluster Distance
1 3 1.4142 2 1.3233 3 2.5504 1 1.4045 2 1.8486 3 1.2257 3 1.5008 3 2.1219 2 1.756
10 1 1.14311 2 1.04112 3 1.58113 2 2.5984 1 1.404
15 3 2.82816 1 1.62417 3 2.59818 1 3.55519 1 2.15420 2 2.102
Results of non-hierarchical clustering

751Chapter 25 Cluster analysis
Table 25.4
Final cluster centres
Cluster
1 2 3
V1
V2
V3
V4
V5
V6
4
6
3
6
4
6
2
3
2
4
6
3
6
4
6
3
2
4
Distances between final cluster centres
Cluster 1 2 3
1 0.0002 5.568 0.0003 5.698 6.928 0.000
Analysis of variance
Variable Cluster mean square
df Error mean square
df F Sig.
V1
V2
V3
V4
V5
V6
29.108
13.546
31.392
15.713
22.537
12.171
2
2
2
2
2
2
0.608
0.63
0.833
0.728
0.816
1.071
17
17
17
17
17
17
47.888
21.505
37.67
21.585
27.614
11.363
0
0
0
0
0
0.001
The F tests should be used only for descriptive purposes because the clusters have been chosen to maximise the differences among cases in different clusters. The observed significance levels are not corrected for this and thus cannot be interpreted as tests of the hypothesis that the cluster means are equal.
Number of cases in each cluster
Cluster
1 62 63 8
Missing 0Total 20
Continued
The ‘Initial cluster centres’ are the values of three randomly selected cases. In some pro-grams, the first three cases are selected. The classification cluster centres are interim centres used for the assignment of cases. Each case is assigned to the nearest classification cluster

752 Marketing Research
centre. The classification centres are updated until the stopping criteria are reached. The ‘Final cluster centres’ represent the variable means for the cases in the final clusters. In SPSS, these are rounded to the nearest integer.
Table 25.4 also displays ‘Cluster membership’ and the distance between each case and its classification centre. Note that the cluster memberships given in Table 25.2 (hierarchi-cal clustering) and Table 25.4 (non-hierarchical clustering) are identical. (Cluster 1 of Table 25.2 is labelled cluster 3 in Table 25.4, and cluster 3 of Table 25.2 is labelled clus-ter 1 in Table 25.4.) The ‘Distances between the final cluster centres’ indicate that the pairs of clusters are well separated. The univariate F test for each clustering variable is presented. These F tests are only descriptive. Because the cases or objects are systemati-cally assigned to clusters to maximise differences on the clustering variables, the resulting probabilities should not be interpreted as testing the null hypothesis of no differences among clusters.
The following example of hospital choice further illustrates non-hierarchical clustering.
Real research Segmentation with surgical precision17
Cluster analysis was used to classify and seg-ment participants, based upon their prefer-ences for hospitals that provide inpatient care. The clustering was based on the reasons participants gave for preferring a particular hospital. The demographic profiles of the grouped participants were compared to learn whether the segments could be identified more efficiently. The k-means clustering method (SPSS) was used for grouping the participants based on their answers to the hospital preference items. The squared Euclidean distances between all clustering vari-ables were minimised. Because different individuals perceive scales of importance dif-ferently, each individual’s ratings were normalised before clustering. The results indicated that the participants could be best classified into four clusters. The cross-validation pro-cedure for cluster analysis was run twice, on halves of the total sample. As expected, the four groups differed substantially by their distributions and average responses to the reasons for their hospital preferences. The names assigned to the four groups reflected the demographic characteristics and reasons for hospital preferences: ‘old-fashioned’, ‘affluent’, ‘value conscious’ and ‘professional want-it-alls’.
Applications of TwoStep clustering
The data of Table 25.1 were also analysed using the TwoStep procedure in SPSS. Since all of the variables were continuous, we used the Euclidean distance measure. The clustering criterion was the Akaike Information Criterion (AIC). The number of clusters was deter-mined automatically. The results are shown in Table 25.5. As can be seen, the three-cluster solution was obtained, similar to that in hierarchical and non-hierarchical clustering. Note that the AIC is at a minimum (97.594) for a three-cluster solution. A comparison of cluster centroids in Table 25.5 with those in Table 25.3 shows that cluster 1 of Table 25.5 corre-sponds to cluster 2 in Table 25.3 (hierarchical clustering), cluster 2 of Table 25.5 corre-sponds to cluster 3 of Table 25.3 and cluster 3 of TwoStep corresponds to cluster 1. The

753Chapter 25 Cluster analysis
Table 25.5
Auto-clustering
Number of clusters Akaike’s information criterion (AIC)
AIC changea Ratio of AIC changesb
Ratio of distance measuresc
1 104.1402 101.171 −2.969 1.000 0.8473 97.594 −3.577 1.205 1.5834 116.896 19.302 −6.502 2.1155 138.230 21.335 −7.187 1.2226 158.586 20.355 −6.857 1.0217 179.340 20.755 −6.991 1.2248 201.628 22.288 −7.508 1.0069 224.055 22.426 −7.555 1.111
10 246.522 22.467 −7.568 1.58811 269.570 23.048 −7.764 1.00112 292.718 23.148 −7.798 1.05513 316.120 23.402 −7.883 1.00214 339.223 23.103 −7.782 1.04415 362.650 23.427 −7.892 1.004
aThe changes are from the previous number of clusters in the table.bThe ratios of changes are relative to the change for the two-cluster solution.cThe ratios of distance measures are based on the current number of clusters against the previous number of clusters.
Cluster distribution
Cluster N % of combined % of total
1 6 30 302 6 30 303 8 40 40
Combined 20 100 100Total 20 100
Centroids
Fun Bad for budget
Cluster Mean Std deviation Mean Std deviation
1 1.67 0.516 3.00 0.6322 3.50 0.548 5.83 0.7533 5.75 1.035 3.63 0.916
Combined 3.85 1.899 4.10 1.410
Results of TwoStep clustering

754 Marketing Research
Clustering variables
Sometimes cluster analysis is also used for clustering variables to identify homogeneous groups. In this instance, the units used for analysis are the variables, and the distance meas-ures are computed for all pairs of variables. For example, the correlation coefficient, either the absolute value or with the sign, can be used as a measure of similarity (the opposite of distance) between variables.
Hierarchical clustering of variables can aid in the identification of unique variables, or variables that make a unique contribution to the data. Clustering can also be used to reduce the number of variables. Associated with each cluster is a linear combination of the varia-bles in the cluster, called the cluster component. A large set of variables can often be replaced by the set of cluster components with little loss of information. A given number of cluster components does not generally explain as much variance as the same number of principal components, however. Why, then, should the clustering of variables be used? Cluster components are usually easier to interpret than the principal components, even if the latter are rotated.18 We illustrate the clustering of variables with an example from advertising research.
interpretation and implications are similar to those discussed earlier. In this case all three methods (hierarchical, non-hierarchical and TwoStep) give similar results. In other cases, different methods may yield different results. It is a good idea to analyse a given data set using different methods to examine the stability of clustering solutions.
Table 25.5
Centroids
Eating out Best buys
Cluster Mean Std deviation Mean Std deviation
1 1.83 0.753 3.50 1.0492 3.33 0.816 6.00 0.6323 6.00 1.089 3.13 0.835
Combined 3.95 2.012 4.10 1.518
Centroids
Don’t care Compare prices
Cluster Mean Std deviation Mean Std deviation
1 5.50 1.049 3.33 0.8162 3.50 0.837 6.00 1.5493 1.80 0.835 3.88 0.641
Combined 3.45 1.761 4.35 1.496
Continued

755Chapter 25 Cluster analysis
Real research Feelings – nothing more than feelings19
As it faced stiff competition in digital cameras, Nikon (www.nikon.com) was marketing its Coolpix line with the tag lines ‘passion made powerful’, ‘brilliance made beautiful’ and ‘memories made easy’. The advertising cam-paign was designed to evoke emotional feel-ings in consumers. Nikon based this campaign on a study conducted to identify feelings that were intuitively evoked. A total of 655 feelings were reduced to a set of 180 that were judged by participants to be most likely to be stimulated by advertising. This group was clus-tered on the basis of judgements of similarity between feelings, resulting in 31 ‘feelings’ clusters. These were divided into 16 positive and 15 negative clusters, as shown in the table.
Positive feelings Negative feelings
1 Playful/childish 1 Fear 2 Friendly 2 Bad/sick 3 Humorous 3 Confused 4 Delighted 4 Indifferent 5 Interested 5 Bored 6 Strong/confident 6 Sad 7 Warm/tender 7 Anxious 8 Relaxed 8 Helpless/timid 9 Energetic/impulsive 9 Ugly/stupid10 Eager/excited 10 Pity/deceived11 Contemplative 11 Mad12 Pride 12 Disagreeable13 Persuaded/expectant 13 Disgusted14 Vigorous/challenged 14 Irritated15 Amazed 15 Moody/frustrated16 Set/informed
Thus, 655 feelings responses to advertising were reduced to a core set of 31 feelings. In this way, advertisers now have a manageable set of feelings for understanding and measuring responses to advertising. When measured, these feelings can provide infor-mation on a commercial’s ability to persuade target consumers, as in the case of Nikon cameras.
Cluster analysis in its various forms is a widely used technique, as further illustrated in the following two examples. The first example illustrates an application in the context of international marketing research. The second example shows how cluster analysis can be used in researching ethical evaluations.

756 Marketing Research
Real research Perceived product parity – once rarity, now reality20
How do consumers in different countries perceive brands in different product catego-ries? Surprisingly, the answer is that the product perception parity rate is quite high. Perceived product parity means that consumers perceive all/most of the brands in a product category as similar to each other, or at par. A study by BBDO Worldwide (www.bbdo.com) showed that two-thirds of consumers surveyed in 28 countries considered brands in 13 product categories to be at parity. The product categories ranged from airlines to credit cards to coffee. Perceived parity averaged 63% for all categories in all countries. The Japanese had the highest perception of parity across all product catego-ries at 99%, and the Colombians the lowest at 28%. Viewed by product category, credit cards had the highest parity perception at 76% and cigarettes the lowest at 52%.
BBDO clustered the countries based on product parity perceptions to arrive at clus-ters that exhibited similar levels and patterns of parity perceptions. The highest percep-tion parity figure came from the Asia–Pacific region (83%) (which included Australia, Japan, Malaysia and South Korea), and also France. It was no surprise that France was in this list because, for most products, it used highly emotional, visual advertising that was ‘feelings oriented’. The next cluster was US-influenced markets (65%), which included Argentina, Canada, Hong Kong, Kuwait, Mexico, Singapore and the USA. The third clus-ter, primarily European countries (60%), included Austria, Belgium, Denmark, Italy, the Netherlands, South Africa, Spain, the UK and Germany. What all this means is that in order to differentiate a brand, advertising cannot just focus on product performance, but also must relate the product to the consumer’s life in an important way. Also, much greater marketing effort would be required in the Asia–Pacific region and France in order to differentiate the brand from the competition and establish a unique image.
Real research Clustering marketing professionals based on ethical evaluations21
Cluster analysis can be used to explain differences in ethical perceptions by using a large, multi-item, multidimensional scale developed to measure how ethical different situations are. One such scale was developed by Reidenbach and Robin.22 This scale has 29 items that compose five dimensions that measure how a participant judges a certain action. To illustrate, a given participant will read about a researcher who has provided proprietary information on one of their clients to another client. The participant is then asked to complete the 29-item ethics scale. For example, the participant marks the following semantic differential scale to indicate if this action is:
Just ___ : ___ : ___ : ___ : ___ : ___ UnjustTraditionally acceptable ___ : ___ : ___ : ___ : ___ : ___ UnacceptableViolates ___ : ___ : ___ : ___ : ___ : ___ Does not violate an
unwritten contract
The scale could be administered to a sample of marketing professionals. By clustering participants based on these 29 items, two important questions could be investigated. First, how do the clusters differ with respect to five ethical dimensions that have been recognised, i.e. ‘Justice’, ‘Relativist’, ‘Egoism’, ‘Utilitarianism’ and ‘Deontology’? Second, what types of firms compose each cluster? The participants in the clusters could be described in terms of their industrial category, size and profitability. Answers to these questions should provide insight into the differences between types of firms in their use of criteria to evaluate ethical situations.

757Chapter 25 Cluster analysis
Practise data analysis with SPSS
SPSS Windows and Mac
In SPSS, the main program for hierarchical clustering of objects or cases is HIERARCHICAL CLUSTER. Different distance measures can be computed, and all the hierarchical clustering procedures discussed here are available. For non-hierarchical clustering, the K-MEANS CLUSTER program can be used. This program is particularly helpful for clustering a large number of cases. The TWOSTEP CLUSTER procedure is also available. To select these procedure, click:
Analyze>Classify>Hierarchical Cluster . . .Analyze>Classify>K-Means Cluster . . .Analyze>Classify>TwoStep Cluster . . .
The following are the detailed steps for running hierarchical cluster analysis on the attitudinal data (V1 to V6) of Table 25.1:
1 Select ANALYZE from the SPSS menu bar.
2 Click CLASSIFY and then HIERARCHICAL CLUSTER.
3 Move ‘Fun [v1]’, ‘Bad for Budget [v2]’, ‘Eating Out [v3]’, ‘Best Buys [v4]’, ‘Don’t Care [v5]’ and ‘Compare Prices [v6]’ into the VARIABLES box.
4 In the CLUSTER box check CASES (default option). In the DISPLAY box check STATISTICS and PLOTS (default options).
5 Click STATISTICS. In the pop-up window, check AGGLOMERATION SCHEDULE. In the CLUSTER MEMBERSHIP box check RANGE OF SOLUTIONS. Then for MINIMUM NUMBER OF CLUSTERS enter ‘2’, and for MAXIMUM NUMBER OF CLUSTERS enter ‘4’. Click CONTINUE.
6 Click PLOTS. In the pop-up window, check DENDROGRAM. In the ICICLE box check ALL CLUSTERS (default). In the ORIENTATION box, check VERTICAL. Click CONTINUE.
7 Click METHOD. For CLUSTER METHOD select WARD’S METHOD. In the MEASURE box check INTERVAL and select SQUARED EUCLIDEAN DISTANCE. Click CONTINUE.
8 Click OK.
The procedure for clustering of variables is the same as that for hierarchical clustering except that, in step 4, in the CLUSTER box check VARIABLES.
The following are the detailed steps for running non-hierarchical (k-means) cluster analy-sis on the attitudinal data (V1 to V6) of Table 25.1:
1 Select ANALYZE from the SPSS menu bar.
2 Click CLASSIFY and then K-MEANS CLUSTER.
3 Move ‘Fun [v1]’, ‘Bad for Budget [v2]’, ‘Eating Out [v3]’, ‘Best Buys [v4]’, ‘Don’t Care [v5]’ and ‘Compare Prices [v6]’ into the VARIABLES box.
4 For NUMBER OF CLUSTERS select 3.
5 Click OPTIONS. In the pop-up window, in the STATISTICS box check INITIAL CLUS-TER CENTERS and CLUSTER INFORMATION FOR EACH CASE. Click CONTINUE.
6 Click OK.

758 Marketing Research
The following are the detailed steps for running TwoStep cluster analysis on the attitudinal data (V1 to V6) of Table 25.1:
1 Select ANALYZE from the SPSS menu bar.
2 Click CLASSIFY and then TWOSTEP CLUSTER.
3 Move ‘Fun [v1]’, ‘Bad for Budget [v2]’, ‘Eating Out [v3]’, ‘Best Buys [v4]’, ‘Don’t Care [v5]’ and ‘Compare Prices [v6]’ into the CONTINUOUS VARIABLES box.
4 For DISTANCE MEASURE select EUCLIDEAN.
5 For NUMBER OF CLUSTERS select DETERMINE AUTOMATICALLY.
6 For CLUSTERING CRITERION select AKAIKE’S INFORMATION CRITERION (AIC).
7 Click OK.
Summary Cluster analysis is used for classifying objects or cases, and sometimes variables, into relatively homogeneous groups. The groups or clusters are suggested by the data and are not defined a priori.
The variables on which the clustering is based should be selected based on past research, theory, the hypotheses being tested, or the judgement of the researcher. An appropriate measure of distance or similarity should be selected. The most commonly used measure is the Euclidean distance or its square.
Clustering procedures may be hierarchical or non-hierarchical. Hierarchical cluster-ing is characterised by the development of a hierarchy or treelike structure. Hierarchi-cal methods can be agglomerative or divisive. Agglomerative methods consist of linkage methods, variance methods and centroid methods. Linkage methods are com-posed of single linkage, complete linkage and average linkage. A commonly used variance method is Ward’s procedure. The non-hierarchical methods are frequently referred to as k-means clustering. These methods can be classified as sequential threshold, parallel threshold and optimising partitioning. Hierarchical and non- hierarchical methods can be used in tandem. The TwoStep procedure can automati-cally determine the optimal number of clusters by comparing the values of model-choice criteria across different clustering solutions. The choice of a clustering procedure and the choice of a distance measure are interrelated.
The number of clusters may be based on theoretical, conceptual or practical consid-erations. In hierarchical clustering, the distance at which the clusters are being com-bined is an important criterion. The relative sizes of the clusters should be meaningful. The clusters should be interpreted in terms of cluster centroids. It is often helpful to profile the clusters in terms of variables that were not used for clustering. The reliabil-ity and validity of the clustering solutions may be assessed in different ways.

759Chapter 25 Cluster analysis
Questions 1 Discuss the similarity and difference between cluster analysis and discriminant analysis.
2 What is a ‘cluster’?
3 What are some of the uses of cluster analysis in marketing?
4 Briefly define the following terms: dendrogram, icicle plot, agglomeration schedule and cluster membership.
5 What is the most commonly used measure of similarity in cluster analysis?
6 Present a classification of clustering procedures.
7 Upon what basis may a researcher decide which variables should be selected to formulate a clustering problem?
8 Why is the average linkage method usually preferred to single linkage and complete linkage?
9 What are the two major disadvantages of non-hierarchical clustering procedures?
10 What guidelines are available for deciding the number of clusters?
11 What is involved in the interpretation of clusters?
12 What role may qualitative methods play in the interpretation of clusters?
13 What are some of the additional variables used for profiling the clusters?
14 Describe some procedures available for assessing the quality of clustering solutions.
15 How is cluster analysis used to group variables?
Exercises 1 Analyse the data in Table 25.1 using the following hierarchical methods:
a Single linkage (nearest neighbour).
b Complete linkage (furthest neighbour).
c Method of centroid.
2 Analyse the Benetton data (taken from Exercise 4, Chapter 22). Consider only the following variables: awareness, attitude, preference, intention and loyalty towards Benetton.
a Cluster the participants based on the identified variables using hierarchical clustering. Use Ward’s method and squared Euclidean distances. How many clusters do you recommend and why?
b Cluster the participants based on the identified variables using k-means clustering and the number of clusters identified in part a. Compare the results to those obtained in part a.
3 You are a marketing research analyst for a major airline. You have been set the task of determining consumers’ attitudes towards budget airlines. Construct a 15-item scale for this purpose. In a group of five students, obtain data on this scale and standard demographic characteristics from 25 males and 25 females in your community. These data should then be used to cluster participants and to cluster the 15 variables measuring consumer attitudes towards budget airlines.
4 In a small group, discuss the following issues: ‘The consequences of inappropriate validation of cluster analysis solutions can be disastrous’ and ‘User-friendly statistical packages can create cluster solutions in situations where naturally occurring clusters do not exist’.

760 Marketing Research
Notes
1. Slavens, R., ‘Häagen-Dazs tastes success with Crème de la Crème campaign’, B to B 92 (1) (January 2007), 23; Reynolds, E., ‘Is Häagen-Dazs shrewd to drop its sexy image?’, Marketing (6 September 2001), 17; Stuart, L., ‘Häagen-Dazs aims to scoop a larger share’, Marketing Week 19 (46/2) (21 February 1997), 26.
2. For applications of cluster analysis, see Bassi, F., ‘Latent class factor models for market segmentation: An application to pharmaceuticals’, Statistical Methods and Applications 16 (2) (January 2007), 279–87; Mathwick, C. and Rigdon, E., ‘Play, flow, and the online search experience’, Journal of Consumer Research 31 (September 2004), 324–32; Moe, W.W. and Fader, P.S., ‘Modeling hedonic portfolio products: A joint segmentation analysis of music compact disc sales’, Journal of Marketing Research 38 (3) (August 2001), 376–88; Arimond, G., ‘A clustering method for categorical data in tourism market segmentation research’, Journal of Travel Research 39 (4) (May 2001), 391–7; Birks, D.F. and Birts, A.N., ‘Cash management market segmentation’, in Birks, D.F. (ed.), Global Cash Management in Europe (Basingstoke: Macmillan, 1998), 83–109.
3. Overlapping clustering methods that permit an object to be grouped into more than one cluster are also available. See Curry, B., Davies, F., Evans, M., Moutinho, L. and Phillips, P., ‘The Kohonen self-organising map as an alternative to cluster analysis: An application to direct marketing’, International Journal of Market Research 45 (2) (February 2003), 191–211; Chaturvedi, A., Carroll, J.D., Green, P.E. and Rotondo, J.A., ‘A feature based approach to market segmentation via overlapping k-centroids clustering’, Journal of Marketing Research 34 (August 1997), 370–7.
4. Excellent discussions on the various aspects of cluster analysis may be found in Abonyi, J. and Feil, B., Cluster Analysis for Data Mining and System Identification (Basle: Birkhäuser, 2007); Kaufman, L. and Rousseeuw, P.J., Finding Groups in Data: An Introduction to Cluster Analysis (Hoboken, NJ: Wiley, 2005); Romsburg, H.C., Cluster Analysis for Researchers (Melbourne: Krieger, 2004); Everitt, B.S., Landau, S. and Leese, M., Cluster Analysis, 4th edn (Oxford: Oxford University Press, 2001).
5. Ali, J. and Rao, C.P., ‘Micro-market segmentation using a neural network model approach’, Journal of International Consumer Marketing 13 (2001), 7–27; Douglas, V., ‘Questionnaires too long? Try variable clustering’, Marketing News 29 (5) (27 February 1995), 38; Punj, G. and Stewart, D., ‘Cluster analysis in marketing research: Review and suggestions for application’, Journal of Marketing Research 20 (May 1983), 134–48.
6. For use of cluster analysis for segmentation, see Tuma, M.N., Decker, R. and Scholz, S.W., ‘A survey of the challenges and pitfalls of cluster analysis application in market segmentation’, International Journal of Market Research 53 (3) (2011), 391–414; Clark, J., Jones, S., Romanou, E. and Harrison, M., ‘Segments, hugs and rock ‘n’ roll: An attitudinal segmentation of parents and young people’, Market Research Society: Annual Conference (2009).
7. Hyde, K.F., ‘Contemporary information search strategies of destination-naïve international vacationers’, Journal of Travel and Tourism Marketing 21 (2/3) (2006), 63–76; Brown, T.J., Qu, H. and Rittichainuwat, B.N., ‘Thailand’s international travel image: Mostly favourable’, Cornell Hotel and Restaurant Administration Quarterly 42 (2) (April 2001), 85–95.
8. Caragea, P.C. and Smith, R.L., ‘Asymptotic properties of computationally efficient alternative estimators for a class of multivariate normal models’, Journal of Multivariate Analysis 98 (104) (August 2007), 1417–40; Sambandam, R., ‘Cluster analysis gets complicated’, Marketing Research (Spring 2003), 16–21; Everitt, B.S., Landau, S. and Leese, M., Cluster Analysis, 4th edn (Oxford: Oxford University Press, 2001).
9. For a detailed discussion on the different measures of similarity, and formulae for computing them, see Brandt, C., de Mortanges, C.P., Bluemelhuber, C. and van Riel, A.C.R., ‘Associative networks: A new approach to market segmentation’, International Journal of Market Research 53 (2) (2011), 189–210; Bradlow, E.T. and Fitzsimmons, G.J., ‘Subscale distance and item clustering effects in self-administered surveys: A new metric’, Journal of Marketing Research 38 (May 2001), 254–61; Chepoi, V. and Dragan, F., ‘Computing a median point of a simple rectilinear polygon’, Information Processing Letters 49 (6) (22 March 1994), 281–5; Romsburg, H.C., Cluster Analysis for Researchers (Belmont, CA: Lifetime Learning, 1984).
10. For further discussion of the issues involved in standardisation, see Hair, J.E. Jr, Anderson, R.E., Tatham, R.L. and Black, W.C., Multivariate Data Analysis With Readings, 5th edn (Englewood Cliffs, NJ: Prentice Hall, 1999), 364–419; Romsburg, H.C., Cluster Analysis for Researchers (Melbourne: Krieger, 1990).
11. Everitt, B.S., Landau, S. and Leese, M., Cluster Analysis, 4th edn (Oxford: Oxford University Press, 2001); Johnson, R.A. and Wichern, D.W., Applied Multivariate Statistical Analysis, 5th edn (Paramus, NJ: Prentice Hall, 2001); Milligan, G., ‘An examination of the effect of six types of error perturbation on fifteen clustering algorithms’, Psychometrika 45 (September 1980), 325–42.
12. MacLachlan, D.L. and Mulhern, M.G., ‘Segment optimization: An empirical comparison’, ESOMAR Marketing Conference, Warsaw (October 2004); Everitt, B.S., Landau, S. and Leese, M., Cluster Analysis, 4th edn (Oxford: Oxford University Press, 2001); Punj, G. and Stewart, D., ‘Cluster analysis in marketing research: Reviews and suggestions for application’, Journal of Marketing Research 20 (May 1983), 134–48.
13. Tuma, M.N., Decker, R. and Scholz, S.W., ‘A survey of the challenges and pitfalls of cluster analysis application in market segmentation’, International Journal of Market Research 53 (3) (2011), 391–414.
14. For a formal discussion of reliability, validity and significance testing in cluster analysis, see Barnes, S., Bauer, H.H., Neumann, M.M. and Huber, F., ‘Segmenting cyberspace: A customer typology for the internet’, European Journal of Marketing 41 (1/2) (2007), 71–93;

761Chapter 25 Cluster analysis
Brusco, M.J., Cradit, J.D. and Stahl, S., ‘A simulated annealing heuristic for a bicriterion partitioning problem in market segmentation’, Journal of Marketing Research 39 (1) (February 2002), 99–109; Chen, H.M., ‘Using clustering techniques to detect usage patterns in a web-based information system’, Journal of the American Society for Information Science and Technology 52 (11) (September 2001), 888; Dibbs, S. and Stern, P., ‘Questioning the reliability of market segmentation techniques’, Omega 23 (6) (December 1995), 625–36; Funkhouser, G.R., ‘A note on the reliability of certain clustering algorithms’, Journal of Marketing Research 30 (February 1983), 99–102; Klastorin, T.D., ‘Assessing cluster analysis results’, Journal of Marketing Research 20 (February 1983), 92–8; Arnold, S.J., ‘A test for clusters’, Journal of Marketing Research 16 (November 1979), 545–51.
15. Bottomley, P. and Nairn, A., ‘Blinded by science: The managerial consequences of inadequately validated cluster analysis solutions,’ International Journal of Market Research 46 (2) (2004), 171–87.
16. Saunders, J. and Forrester, R.H., ‘Capturing learning and applying knowledge: An investigation of the use of innovation teams in Japanese and American automotive firms’, Journal of Business Research 47 (1) (January 2000), 35; Saunders, J., Wong, V. and Doyle, P., ‘The congruence of successful international competitors: A study of the marketing strategies and organizations of Japanese and US competitors in the UK’, Journal of Global Marketing 7 (3) (1994), 41–59; Doyle, P., Saunders, J. and Wong, V., ‘International marketing strategies and organizations: A study of U.S., Japanese, and British competitors’, in Bloom, P., Winer, R., Kassarjian, H.H., Scammon, D.L., Weitz, B., Spekman, R.E., Mahajan, V. and Levy, M. (eds), Enhancing Knowledge Development in Marketing, Series No. 55 (Chicago: American Marketing Association, 1989), 100–4.
17. Moschis, G.P., Bellenger, D.N. and Folkman Curasi, C., ‘What influences the mature consumer?’, Marketing Health Services 23 (4) (January 2003), 16; Lin, A., Lenert, L.A., Haltky, M.A. and McDonald, K.M., ‘Clustering and the design of preference-assessment surveys in healthcare’, Health Services Research 34 (5)
(December 1999), 1033–45; Holohean, E.J. Jr, Banks, S.M. and Maddy, B.A., ‘System impact and methodological issues in the development of an empirical typology of psychiatric hospital residents’, Journal of Mental Health Administration 22 (2) (Spring 1995), 177–88.
18. Liu, H.H., ‘Variable selection in clustering for marketing segmentation using genetic algorithms’, Expert Systems with Applications: An International Journal Archive 34 (1) (January 2008), 502–10; Barnes, S., Bauer, H.H., Neumann, M.M. and Huber, F., ‘Segmenting cyberspace: A customer typology for the internet’, European Journal of Marketing 41 (1/2) (2007), 71–93; Everitt, B.S., Landau, S. and Leese, M., Cluster Analysis, 4th edn (Oxford: Oxford University Press, 2001); Douglas, V., ‘Questionnaire too long? Try variable clustering’, Marketing News 29 (5) (27 February 1995), 38.
19. Mooradian, T.A., Matzler, K. and Szykman, L., ‘Empathetic responses to advertising: Testing a network of antecedents and consequences’, Marketing Letters 19 (2) (June 2008), 79–92; Baar, A., ‘Polaroid ads play up emotion’, Adweek 42 (15) (9 April 2001); Helgesen, T., ‘The power of advertising – myths and realities’, Marketing and Research Today 24 (2) (May 1996), 63–71; Aaker, D.A., Stayman, D.M. and Vezina, R., ‘Identifying feelings elicited by advertising’, Psychology and Marketing (Spring 1988), 1–16.
20. Pickett, G.M., ‘The impact of product type and parity on the informational content of advertising’, Journal of Marketing Theory and Practice 9 (3) (Summer 2001), 32–43; Zandpour, F. and Harich, K.R., ‘Think and feel country clusters: A new approach to international advertising standardisation’, International Journal of Advertising 15 (4) (1996), 325–44.
21. Fraedrich, J.P., Herndon, N.C. Jr and Yeh, Q.J., ‘An investigation of moral values and the ethical content of the corporate culture’, Journal of Business Ethics 30 (1) (March 2001), 73–85; Akaah, I.P., ‘Organizational culture and ethical research behavior’, Journal of the Academy of Marketing Science 21 (1) (Winter 1993), 59–63.
22. Reidenbach, R.E. and Robin, D.P., ‘Some initial steps toward improving the measurement of ethical evaluations of marketing activities’, Journal of Business Ethics 7 (1988), 871–9.

Multidimensional scaling and conjoint analysis
Multidimensional scaling allows
the perceptions and preferences
of consumers to be clearly
represented in a spatial map.
Conjoint analysis helps to
determine the relative importance
of attributes that consumers use
in choosing products.
Stage 1
Problem definition
Stage 2
Research approach developed
Stage 3
Research design
developed
Stage 4
Fieldwork or data
collection
Stage 5
Data integrity
and analysis
Stage 6
Communicating research findings
26

763Chapter 26 Multidimensional scaling and conjoint analysis
Objectives
After reading this chapter, you should be able to:
1 discuss the basic concept and scope of multidimensional scaling (MDS) in marketing research and describe its various applications;
2 describe the steps involved in MDS of perception data, including formulating the problem, obtaining input data, selecting an MDS procedure, deciding on the number of dimensions, labelling the dimensions and interpreting the configuration and assessing reliability and validity;
3 explain the MDS scaling of preference data and distinguish between internal and external analysis of preferences;
4 explain correspondence analysis and discuss its advantages and disadvantages;
5 understand the relationship between MDS discriminant analysis and factor analysis;
6 discuss the basic concepts of conjoint analysis, contrast it with MDS and discuss its various applications;
7 describe the procedure for conducting conjoint analysis, including formulating the problem, constructing the stimuli, deciding the form of input data, selecting a conjoint analysis procedure, interpreting the results and assessing reliability and validity;
8 define the concept of hybrid conjoint analysis and explain how it simplifies the data collection task;
9 appreciate how software is used in multidimensional scaling and conjoint analysis.
This chapter presents two related techniques for analysing consumer perceptions and preferences: multidimensional scaling (MDS) and conjoint analysis. We outline and illustrate the steps involved in conducting MDS and discuss the relationships among MDS, factor analysis and discriminant analysis. Then we describe conjoint analysis and present a step-by-step procedure for conducting it. We also provide brief coverage of hybrid conjoint models. Finally, guidance is provided on the use of software to address the data analysis challenges presented in this chapter. We begin with examples illustrating MDS and conjoint analysis.
Overview
Real research Colas collide1
In a survey, participants were asked to rank-order all the possible pairs of nine brands of soft drinks in terms of their similarity. These data were analysed via multidimensional scaling and resulted in the following spatial representation of soft drinks.
From other information obtained in the questionnaire, the horizontal axis was labelled ‘cola flavour’. Diet Coke was perceived to be the most cola flavoured and 7-Up the least cola flavoured. The vertical axis was labelled ‘dietness’, with Diet Coke being perceived to be the most dietetic and Dr Pepper the least dietetic. Note that Coke and Pepsi were perceived to be very similar, as indicated by their closeness in the perceptual map. Close similarity was also perceived between 7-Up and Tango, Diet 7-Up and Diet Tango, and Diet Coke and Diet Pepsi. Notice that Dr Pepper is perceived to be relatively dissimilar to the other brands. Such MDS maps are very useful in understanding the competitive structure of the soft drink market.

764 Marketing Research
–0.8–1.5 –1.0 –0.5 0.0 0.5 1.0 1.5
–0.6
–0.4
–0.2
0.0
0.2
0.4
0.6
0.8
Diet 7-Up
Diet Tango
Coke
Pepsi
7-Up
Tango
Dr Pepper
Diet Pepsi
Diet Coke
Real research The conjoint path over the cultural divide2
Boots the Chemist was considering whether to open new stores in the Netherlands, Japan and Thailand. Research was conducted to help decide whether to enter these markets and also to decide which element of Boots’ prod-uct and service offerings to prioritise.
The key research objectives were to:
• Understand the key drivers of store choice.
• Assess the performance of main competi-tors already in the market.
• Estimate the proportion of shoppers likely to visit new Boots stores.
Conjoint analysis was used to understand the key drivers of store choice, the impact of features such as range, price, quality, service and convenience, and the trade-offs made in prioritising these features. To understand the strengths and weaknesses of existing retailers, participants stated for each of the attributes under review what the named competitors offered. To enable take-up of the new stores to be forecast, participants were first shown a video of the Boots concept store. The concept store was then assessed on the same series of attributes used for the existing competitors. Over 1,000 interviews were conducted in each country. The research results found:
• The characteristics of the target market in terms of age, sex, income and lifestage, frequency of and attitudes to shopping.
• The key success factors in each product area, which influenced store design, mer-chandising, staff training and marketing decisions.
• Which existing players posed the greatest threat, in terms of being differentiated from current competitors and having possible areas of leverage against Boots.

765Chapter 26 Multidimensional scaling and conjoint analysis
The first example illustrates the derivation and use of perceptual maps, which lie at the heart of MDS. The Boots example involves the trade-offs that participants make while evaluating alternatives in choosing stores, and desirable features within those stores. The conjoint anal-ysis procedure is based on these trade-offs.
Basic concepts in MDS
Multidimensional scaling (MDS) is a class of procedures for representing perceptions and preferences of participants spatially by means of a visual display. Perceived or psychological relationships among stimuli are represented as geometric relationships among points in a multidimensional space. These geometric representations are often called spatial maps. The axes of the spatial map are assumed to denote the psychological bases or underlying dimen-sions that participants use to form perceptions and preferences for stimuli.3 MDS has been used in marketing to identify the following:
1 The number and nature of dimensions that consumers use to perceive different brands.
2 The positioning of brands on these dimensions.
3 The positioning of consumers’ ideal brand on these dimensions.
Information provided by MDS has been used for a variety of marketing applications, including:
• Image measurement. Comparing the customers’ and non-customers’ perceptions of a company with the company’s perceptions of itself and thus identifying perceptual gaps.
• Market segmentation. Positioning brands and consumers in the same space and then iden-tifying groups of consumers with relatively homogeneous perceptions.
• New product development. Looking for gaps in a spatial map, which indicate potential opportunities for positioning new products. Also to evaluate new product concepts and existing brands on a test basis to determine how consumers perceive the new concepts. The proportion of preferences for each new product is one indicator of its success.
• Assessing advertising effectiveness. Spatial maps can be used to determine whether adver-tising has been successful in achieving the desired brand positioning.
• Pricing analysis. Spatial maps developed with and without pricing information can be compared to determine the impact of pricing.
• Channel decisions. Judgements on compatibility of brands with different retail outlets could lead to spatial maps useful for making channel decisions.
• Attitude-scale construction. MDS techniques can be used to develop the appropriate dimensionality and configuration of the attitude space.
Multidimensional scaling (MDS)A class of procedures for representing perceptions and preferences of participants spatially by means of a visual display.
Statistics and terms associated with MDS
The important statistics and terms associated with MDS include the following:
• Similarity judgements. These are ratings on all possible pairs of brands or other stimuli in terms of their similarity using a Likert-type scale.
• Preference rankings. These are rank orderings of the brands or other stimuli from the most preferred to the least preferred. They are normally obtained from participants.

766 Marketing Research
• Stress. This is a lack-of-fit measure; higher values of stress indicate poorer fits.
• R-square. This is a squared correlation index that indicates the proportion of variance of the optimally scaled data that can be accounted for by the MDS procedure. R-square is a goodness-of-fit measure.
• Spatial map. Perceived relationships among brands or other stimuli are represented as geometric relationships among points in a multidimensional space.
• Coordinates. These indicate the positioning of a brand or a stimulus in a spatial map.
• Unfolding. The representation of both brands and participants as points in the same space.
Conducting MDS
Figure 26.1 shows the steps in MDS. The researcher must formulate the MDS problem care-fully because a variety of data may be used as input into MDS. The researcher must also determine an appropriate form in which data should be obtained, and select an MDS proce-dure for analysing the data. An important aspect of the solution involves determining the number of dimensions for the spatial map. Also, the axes of the map should be labelled and the derived configuration interpreted. Finally, the researcher must assess the quality of the results obtained.4 We describe each of these steps, beginning with problem formulation.
Figure 26.1
Conducting MDS
Formulate the problem
Obtain input data
Select an MDS procedure
Decide on the number of dimensions
Label the dimensions and interpret the con�guration
Assess reliability and validity
Formulate the problem
Formulating the problem requires that the researcher specify the purpose for which the MDS results would be used and select the brands or other stimuli to be included in the analysis. The number of brands or stimuli selected and the specific brands included determine the nature of the resulting dimensions and configurations. At a minimum, eight brands or stimuli should be included to obtain a well-defined spatial map. Including more than 25 brands is likely to be cumbersome and may result in participant fatigue.5
The decision regarding which specific brands or stimuli to include should be made care-fully. Suppose that a researcher is interested in obtaining consumer perceptions of fashion brands. If luxury fashion brands were not included in the stimulus set, this dimension may not emerge in the results. The choice of the number and specific brands or stimuli to be

767Chapter 26 Multidimensional scaling and conjoint analysis
included should be based on the statement of the marketing research problem, theory and the judgement of the researcher.
MDS will be illustrated in the context of obtaining a spatial map for 10 brands of beer. These brands are Becks, Budvar, Budweiser, Carlsberg, Corona, Grolsch, Harp, Holsten, San Miguel and Stella Artois. Given the list of brands, the next question is: how should we obtain data on these 10 brands?
Obtain input data
As shown in Figure 26.2, input data obtained from the participants may be related to percep-tions or preferences. Perception data, which may be direct or derived, are discussed first.
Figure 26.2
Input data for MDS
Perceptions Preferences
Direct(similarity
judgements)
Derived(attributeratings)
MDS input data
1 Perception data: direct approaches. In direct approaches to gathering perception data, participants are asked to judge how similar or dissimilar various brands or stimuli are, using their own criteria. Participants are often required to rate all possible pairs of brands or stimuli in terms of similarity on a Likert scale. These data are referred to as similarity judgements. For example, similarity judgements on all the possible pairs of bottled beer brands may be obtained in the following manner:
Very dissimilar Very similar
Becks versus Budweiser 1 2 3 4 5 6 7
Budweiser versus Carlsberg 1 2 3 4 5 6 7
Carlsberg versus Corona 1 2 3 4 5 6 7
. . . . . . . .
. . . . . . . .
. . . . . . . .
Becks versus Stella Artois 1 2 3 4 5 6 7
The number of pairs to be evaluated is n(n – 1)/2, where n is the number of stimuli. Other procedures are also available. Participants could be asked to rank-order all the possible pairs from the most similar to the least similar. In another method, the participant rank-orders the brands in terms of their similarity to an anchor brand. Each brand, in turn, serves as the anchor. In our example, the direct approach was adopted. Subjects were asked to provide similarity judgements for all 45 (10 × 9/2) pairs of bottled beer brands, using a seven-point scale. The data obtained from one participant are given in Table 26.1.6
2 Perception data: derived approaches. Derived approaches to collecting perception data are attribute-based approaches requiring the participants to rate the brands or stimuli on
Derived approachesIn MDS, attribute-based approaches to collecting perception data requiring participants to rate the stimuli on the identified attributes using semantic differential or Likert scales.

768 Marketing Research
the identified attributes using semantic differential or Likert scales. For example, the dif-ferent brands of bottled beer may be rated on attributes like these:
Best drunk with food ___:___:___:___:___:___:___ Best drunk on its ownBottle feels good to hold ___:___:___:___:___:___:___ Bottle does not feel good to hold
.
.
.Has a strong smell of hops ___:___:___:___:___:___:___ No smell of hops
Sometimes an ideal brand is also included in the stimulus set. The participants are asked to evaluate their hypothetical ideal brand on the same set of attributes. If attribute ratings are obtained, a similarity measure (such as Euclidean distance) is derived for each pair of brands.
3 Direct vs. derived approaches. Direct approaches have the advantage that the researcher does not have to identify a set of salient attributes. Participants make similarity judge-ments using their own criteria, as they would under normal circumstances. The disadvan-tages are that the criteria are influenced by the brands or stimuli being evaluated. If various fashion brands being evaluated are in the same price range, then price will not emerge as an important factor. It may be difficult to determine before analysis if and how the individual participant’s judgements should be combined. Furthermore, it may be dif-ficult to label the dimensions of the spatial map.
Table 26.1
Becks Budvar Budweiser Carlsberg Corona Grolsch Harp Holsten San Miguel
Stella Artois
BecksBudvar 5Budweiser 6 7Carlsberg 4 6 6Corona 2 3 4 5Grolsch 3 3 4 4 5Harp 2 2 2 3 5 5Holsten 2 2 2 2 6 5 6San Miguel 2 2 2 2 6 6 7 6Stella Artois 1 2 4 2 4 3 3 4 3
Similarity ratings of bottled beer brands
The advantage of the attribute-based approach is that it is easy to identify participants with homogeneous perceptions. The participants can be clustered based on the attribute ratings. It is also easier to label the dimensions. A disadvantage is that the researcher must identify all the salient attributes – a difficult task. The spatial map obtained depends on the attributes identified.
The direct approaches are more frequently used than the attribute-based approaches. It may, however, be best to use both these approaches in a complementary way. Direct similarity judgements may be used for obtaining the spatial map, and attribute ratings may be used as an aid to interpreting the dimensions of the perceptual map. Similar pro-cedures are used for preference data.
4 Preference data. Preference data order the brands or stimuli in terms of participants’ prefer-ence for some property. A common way in which such data are obtained is preference rank-ings. Participants are required to rank the brands from the most preferred to the least preferred.

769Chapter 26 Multidimensional scaling and conjoint analysis
Alternatively, participants may be required to make paired comparisons and indicate which brand in a pair they prefer. Another method is to obtain preference ratings for the various brands. (The rank order, paired comparison and rating scales were discussed in Chapter 12 on scaling techniques.) When spatial maps are based on preference data, distance implies differ-ences in preference. The configuration derived from preference data may differ greatly from that obtained from similarity data. Two brands may be perceived as different in a similarity map yet similar in a preference map, and vice versa. For example, Becks and Harp may be perceived by a group of participants as very different brands and thus appear far apart on a perception map. But these two brands may be about equally preferred and may appear close together on a preference map. We continue using the perception data obtained in the bottled beer example to illustrate the MDS procedure and then consider the scaling of preference data.
Select an MDS procedure
Selecting a specific MDS procedure depends on whether perception or preference data are being scaled, or whether the analysis requires both kinds of data. The nature of the input data is also a determining factor. Non-metric MDS procedures assume that the input data are ordinal, but they result in metric output. The distances in the resulting spatial map may be assumed to be interval scaled. These procedures find, in a given dimensionality, a spatial map whose rank orders of estimated distances between brands or stimuli best preserve or reproduce the input rank orders. In contrast, metric MDS methods assume that input data are metric. Since the output is also metric, a stronger relationship between the output and input data is maintained, and the metric (interval or ratio) qualities of the input data are preserved. The metric and non-metric methods produce similar results.7
Another factor influencing the selection of a procedure is whether the MDS analysis will be conducted at the individual participant level or at an aggregate level. In individual-level analysis, the data are analysed separately for each participant, resulting in a spatial map for each participant. Although individual-level analysis is useful from a research perspective, it is not appealing from a managerial standpoint. With some exceptions, especially in luxury goods and business-to-business relationships, marketing strategies are typically formulated at the segment or aggregate level, rather than at the individual level. If aggregate-level analy-sis is conducted, some assumptions must be made in aggregating individual data. Typically, it is assumed that all participants use the same dimensions to evaluate the brands or stimuli, but that different participants weight these common dimensions differentially.
The data of Table 26.1 were treated as rank ordered and scaled using a non-metric proce-dure. Because these data were provided by one participant, an individual-level analysis was conducted. Spatial maps were obtained in one to four dimensions, and then a decision on an appropriate number of dimensions was made. This decision is central to all MDS analyses; therefore, it is explored in greater detail in the following subsection.
Decide on the number of dimensions
The objective in MDS is to obtain a spatial map that best fits the input data in the smallest number of dimensions. However, spatial maps are computed in such a way that the fit improves as the number of dimensions increases, which means that a compromise has to be made. The fit of an MDS solution is commonly assessed by the stress measure. Stress is a lack-of-fit measure; higher values of stress indicate poorer fits. The following guidelines are suggested for determining the number of dimensions:
1 A priori knowledge. Theory or past research may suggest a particular number of dimensions.
2 Interpretability of the spatial map. Generally, it is difficult to interpret configurations or maps derived in more than three dimensions.
3 Elbow criterion. A plot of stress versus dimensionality should be examined. The points in this plot usually form a convex pattern, as shown in Figure 24.3. The point at which an
Non-metric MDSA type of MDS that assumes that the input data are ordinal.
Metric MDSAn MDS method that assumes that input data are metric.

770 Marketing Research
elbow or a sharp bend occurs indicates an appropriate number of dimensions. Increasing the number of dimensions beyond this point is usually not worth the improvement in fit. This criterion for determining the number of dimensions is called the elbow criterion.
4 Ease of use. It is generally easier to work with two-dimensional maps or configurations than with those involving more dimensions.
5 Statistical approaches. For the sophisticated user, statistical approaches are also available for determining the dimensionality.8
Based on the plot of stress versus dimensionality (Figure 26.3), interpretability of the spatial map and ease-of-use criteria, it was decided to retain a two-dimensional solution. This is shown in Figure 26.4.
Elbow criterionA plot of stress versus dimensionality used in MDS. The point at which an elbow or a sharp bend occurs indicates an appropriate dimensionality.
Figure 26.3
Plot of stress versus dimensionality
0.01 2 3 4 5
0.1
0.2
Number of dimensions
Stre
ss
Figure 26.4
A spatial map of beer brands
–2.0–2.0 –1.5 –1.0 –0.5 0.0 0.5 1.0 1.5 2.0
–1.5
–1.0
–0.5
0.0
0.5
1.0
1.5
2.0
Holsten
Harp
Budweiser
Budvar
Carlsberg
Grolsch
CoronaBecks
Stella Artois
San Miguel

771Chapter 26 Multidimensional scaling and conjoint analysis
Label the dimensions and interpret the configuration
Once a spatial map is developed, the dimensions must be labelled and the configuration interpreted. Labelling the dimensions requires subjective judgement on the part of the researcher. The following guidelines can assist in this task:
1 Even if direct similarity judgements are obtained, ratings of the brands on researcher-supplied attributes may still be collected. Using statistical methods such as regression, these attribute vectors may be fitted in the spatial map (see Figure 26.5). The axes may then be labelled for the attributes with which they are most closely aligned.
2 After providing direct similarity or preference data, the participants may be asked to indi-cate the criteria they used in making their evaluations. These criteria may then be subjec-tively related to the spatial map to label the dimensions.
3 If possible, the participants can be shown their spatial maps and asked to label the dimen-sions by inspecting the configurations.
4 If objective characteristics of the brands are available (e.g. horsepower or kilometres per litre for cars), these could be used as an aid in interpreting the subjective dimensions of the spatial maps.
Often, the dimensions represent more than one attribute. The configuration or the spatial map may be interpreted by examining the coordinates and relative positions of the brands. For example, brands located near each other compete more fiercely than brands far apart. An isolated brand has a unique image. Brands that are farther along in the direction of a descrip-tor are stronger on that characteristic than others. Thus, the strengths and weaknesses of each product can be understood. Gaps in the spatial map may indicate potential opportunities for introducing new products.
In Figure 26.5, the vertical axis may be labelled as ‘strength’, representing the power of particular flavours and smells when the beer is first tasted. Brands with high positive values on this axis include Grolsch, Harp, Holsten and Corona. The horizontal axis may be labelled as ‘after-taste’, representing the flavour of the beer that lingers on the palate after the beer
Figure 26.5
Using attribute vectors to label dimensions
–2.0–2.0 –1.5 –1.0 –0.5 0.0 0.5 1.0 1.5 2.0
–1.5
–1.0
–0.5
0.0
0.5
1.0
1.5
2.0
Holsten
Harp
Budweiser
Budvar
Carlsberg
Grolsch
CoronaBecks
StellaArtois
SanMiguel
Strong �avour
Strongaftertaste
Freshafter-taste

772 Marketing Research
has been drunk. Brands with large negative values on this dimension include Stella Artois, Holsten and San Miguel. Note that negative scores on the map do not necessarily represent negative characteristics for certain consumers. Thus, the strength of flavour from initial smell and taste through to a strong after-taste in a brand such as Stella Artois may be seen as desirable characteristics for many beer drinkers. The gaps in the spatial map indicate potential opportunities for new brands, or for the relaunch or repositioning of an existing brand: for example, a brand that has a strong initial taste but does not have a strong linger-ing after-taste.
Assess reliability and validity
The input data, and consequently the MDS solutions, are invariably subject to substantial random variability. Hence, it is necessary that some assessment be made of the reliability and validity of MDS solutions. The following guidelines are suggested:
1 The index of fit, or R-square, should be examined. This is a squared correlation index that indicates the proportion of variance of the optimally scaled data that can be accounted for by the MDS procedure. Thus, it indicates how well the MDS model fits the input data. Although higher values of R-square are desirable, values of 0.60 or better are considered acceptable.
2 Stress values are also indicative of the quality of MDS solutions. Whereas R-square is a measure of goodness of fit, stress measures badness of fit, or the proportion of vari-ance of the optimally scaled data that is not accounted for by the MDS model. Stress values vary with the type of MDS procedure and the data being analysed. For Kruskal’s stress formula 1, the recommendations for evaluating stress values are as follows:9
Stress (%) Goodness of fit
20 Poor
10 Fair
5 Good
2.5 Excellent
0 Perfect
3 If an aggregate-level analysis has been done, the original data should be split into two or more parts. MDS analysis should be conducted separately on each part and the results compared.
4 Stimuli can be selectively eliminated from the input data and the solutions determined for the remaining stimuli.
5 A random error term could be added to the input data. The resulting data are subjected to MDS analysis and the solutions compared.
6 The input data could be collected at two different points in time and the test–retest relia-bility determined.
Formal procedures are available for assessing the validity of MDS. In the case of our illustrative example, the stress value of 0.095 indicates a fair fit. One brand, namely Stella Artois, is different from the others. Would the elimination of Stella Artois from the stimulus set appreciably alter the relative configuration of the other brands? The spatial map obtained by deleting Stella Artois is shown in Figure 26.6. There is some change in the relative posi-tions of the brands, particularly Corona and Holsten, yet the changes are modest, indicating fair stability.10

773Chapter 26 Multidimensional scaling and conjoint analysis
It is worthwhile to point out some assumptions and limitations of MDS. It is assumed that the similarity of stimulus A to B is the same as the similarity of stimulus B to A. There are some instances where this assumption may be violated. For example, New Zealand is perceived as more similar to Australia than Australia is to New Zealand. MDS assumes that the distance (similarity) between two stimuli is some function of their partial similarities on each of sev-eral perceptual dimensions. Not much research has been done to test this assumption. When a spatial map is obtained, it is assumed that inter-point distances are ratio scaled and that the axes of the map are multidimensional interval scaled. A limitation of MDS is that dimension interpretation relating physical changes in brands or stimuli to changes in the perceptual map is difficult at best. These limitations also apply to the scaling of preference data.
Figure 26.6
Assessment of stability by deleting one brand
–2.0–2.0 –1.5 –1.0 –0.5 0.0 0.5 1.0 1.5 2.0
–1.5
–1.0
–0.5
0.0
0.5
1.0
1.5
2.0
Holsten
Harp
Budweiser
BudvarCarlsberg Grolsch
Corona
BecksSan Miguel
Assumptions and limitations of MDS
Scaling preference data
Analysis of preference data can be internal or external. In internal analysis of prefer-ences, a spatial map representing both brands or stimuli and participant points or vectors is derived solely from the preference data. Thus, by collecting preference data, both brands and participants can be represented in the same spatial map. In external analysis of pref-erences, the ideal points or vectors based on preference data are fitted in a spatial map derived from perception (e.g. similarities) data. To perform external analysis, both prefer-ence and perception data must be obtained. The representation of both brands and partici-pants as points in the same space, by using internal or external analysis, is referred to as unfolding.
External analysis is preferred in most situations. In internal analysis, the differences in perceptions are confounded with differences in preferences. It is possible that the nature and relative importance of dimensions may vary between the perceptual space and the preference space. Two brands may be perceived to be similar (located closely to each other in the per-ceptual space), yet one brand may be distinctly preferred over the other (i.e. the brands may
Internal analysis of preferencesA method of configuring a spatial map such that the spatial map represents both brands or stimuli and participant points or vectors, and is derived solely from the preference data.
External analysis of preferencesA method of configuring a spatial map such that the ideal points or vectors based on preference data are fitted in a spatial map derived from the perception data.

774 Marketing Research
be located apart in the preference space). These situations cannot be accounted for in internal analysis. In addition, internal analysis procedures are beset with computational difficulties.11
We illustrate external analysis by scaling the preferences of our participant into the spatial map. The participant ranked the brands in the following order of preference (most-preferred first): Stella Artois, Holsten, Harp, San Miguel, Carlsberg, Grolsch, Budvar, Budweiser, Corona and Becks. These preference rankings, along with the coordinates of the spatial map (Figure 26.5), were used as input into a preference scaling program to derive Figure 26.7. Notice the location of the ideal point. It is close to Stella Artois, Holsten, Carlsberg and San Miguel, the four most-preferred brands, and far from Corona and Becks, the two least- preferred brands. If a new brand were to be located in this space, its distance from the ideal point, relative to the distances of other brands from the ideal point, would determine the degree of preference for this brand. Another application is illustrated in the following example.
Figure 26.7
External analysis of preference data
–2.0–2.0 –1.5 –1.0 –0.5 0.0 0.5 1.0 1.5 2.0
–1.5
–1.0
–0.5
0.0
0.5
1.0
1.5
2.0
Holsten
Harp
Budweiser
Budvar
Carlsberg
Grolsch
CoronaBecks
Stella Artois
San MiguelIdeal point
Real research Participants park in different spaces12
A study examined consumer perceptions of car brands using multidimensional scaling. Participants rated several attributes of cars and the effect those attributes had on their final choice in buying a car. Ratings were conducted using a five-point scale, and each participant’s responses were summed across each dimension. The five highest-scoring attributes overall were: price, fuel economy, net horsepower, braking and acceleration. The use of MDS can help car brands better understand what attributes are most impor-tant to consumers and then make segmentation, targeting and postioning decisions.
An illustrative MDS map of selected car brands derived from similarity data is shown. In this spatial representation, each brand is identified by its distance from the other brands. The closer two brands are (e.g. VW and Chrysler), the more similar they are per-ceived to be. The farther apart two brands are (e.g. VW and Mercedes), the less similar they are perceived to be. Small distance (i.e. similarity) may also indicate competition. To illustrate, Honda competes closely with Toyota but not with Porsche. The dimensions can be interpreted as economy/prestige and sportiness/non-sportiness. The position of each car on these dimensions can be easily determined.

775Chapter 26 Multidimensional scaling and conjoint analysis
Although we have considered only quantitative data so far, qualitative data can also be mapped using procedures such as correspondence analysis.
The preference data consisted of a simple rank order of the brands according to con-sumers’ preferences. Participants’ ideal points are also located in the same spatial repre-sentation. Each ideal point represents the preferred position of a particular participant. Thus, participant 1 (denoted by P1) prefers the sporty cars: Porsche, Jaguar and Audi. Participant 2 (denoted by P2), on the other hand, prefers luxury cars: Mercedes, Lexus and Cadillac. Such analysis can be done at the individual-participant level, enabling the researcher to segment the market according to similarities in participants’ ideal posi-tions. Alternatively, participants can be clustered based upon their similarity with respect to the original preference ranking and ideal points established for each segment.
Joint space configuration of car brands and consumer preferences (Illustrative output)
Audi
ToyotaHonda
Jaguar
Porsche
CadillacMercedes
P2
P1
LexusVW
Chrysler
Hyundai
(low)
Sportiness(high)
Hig
h pr
estig
e/ex
pens
ive
Econ
omy
Correspondence analysis
Correspondence analysis is an MDS technique for scaling qualitative data in marketing research. The input data are in the form of a contingency table, indicating a qualitative asso-ciation between the rows and columns. Correspondence analysis scales the rows and col-umns in corresponding units so that each can be displayed graphically in the same low-dimensional space. These spatial maps provide insights into:
1 Similarities and differences within the rows with respect to a given column category.
2 Similarities and differences within the column categories with respect to a given row category.
3 Relationships among the rows and columns.13
The interpretation of results in correspondence analysis is similar to that in principal compo-nents analysis (Chapter 24), given the similarity of the algorithms. Correspondence analysis results in the grouping of categories (activities, brands or other stimuli) found within the contingency table, just as principal components analysis involves the grouping of the
Correspondence analysisAn MDS technique for scaling qualitative data that scales the rows and columns of the input contingency table in corresponding units so that each can be displayed in the same low-dimensional space.

776 Marketing Research
independent variables. The results are interpreted in terms of proximities among the rows and columns of the contingency table. Categories that are closer together than others are more similar in underlying structure.
Compared with other MDS techniques, the advantage of correspondence analysis is that it reduces the data collection demands imposed on the participants, since only binary or cate-gorical data are obtained. Participants are merely asked to tick which attributes apply to each of several brands. The input data are the number of ‘yes’ responses for each brand on each attribute. The brands and the attributes are then displayed in the same multidimensional space. The disadvantage is that between-set (i.e. between column and row) distances cannot be meaningfully interpreted. Other users have criticised the technique as causing confusion when interpreting attribute–brand relationships and complications in the tracking of percep-tual changes.14 Ultimately, it must be remembered that correspondence analysis is an explor-atory data analysis technique (with the many advantages that exploration holds), and so it is not suitable for hypothesis testing.15
MDS, including correspondence analysis, is not the only procedure available for obtain-ing perceptual maps. Two other techniques that we have discussed before, discriminant anal-ysis (Chapter 23) and factor analysis (Chapter 24), can also be used for this purpose.
Relationship among MDS, factor analysis and discriminant analysis
If the attribute-based approaches are used to obtain input data, spatial maps can also be obtained by using factor or discriminant analysis. In this approach, each participant rates n brands on m attributes. By factor-analysing the data, one could derive for each participant n factor scores for each factor, one for each brand (see Chapter 24). By plotting brand scores on the factors, a spatial map could be obtained for each participant. If an aggregate map is desired, the factor score for each brand for each factor can be averaged across participants. The dimensions would be labelled by examining the factor loadings, which are estimates of the correlations between attribute ratings and underlying factors.
The goal of discriminant analysis is to select the linear combinations of attributes that best discriminate between the brands or stimuli (Chapter 23). To develop spatial maps by means of discriminant analysis, the dependent variable is the brand rated and the independent or predictor variables are the attribute ratings. A spatial map can be obtained by plotting the discriminant scores for the brands. The discriminant scores are the ratings on the perceptual dimensions, based on the attributes which best distinguish the brands. The dimensions can be labelled by examining the discriminant weights, or the weightings of attributes that make up a discriminant function or dimension.16
Basic concepts in conjoint analysis
Conjoint analysis attempts to determine the relative importance that consumers attach to salient attributes and the utilities they attach to the levels of attributes. This informa-tion is derived from consumers’ evaluations of brands, or from brand profiles composed of these attributes and their levels. The participants are presented with stimuli that con-sist of combinations of attribute levels. They are asked to evaluate these stimuli in terms of their desirability. Conjoint procedures attempt to assign values to the levels of each attribute so that the resulting values or utilities attached to the stimuli match, as closely as possible, the input evaluations provided by the participants. The underlying assump-tion is that any set of stimuli – such as products, brands or companies – is evaluated as a bundle of attributes.17
Conjoint analysisA technique that attempts to determine the relative importance that consumers attach to salient attributes and the utilities they attach to the levels of attributes.

777Chapter 26 Multidimensional scaling and conjoint analysis
Like MDS, conjoint analysis relies on participants’ subjective evaluations. In MDS, how-ever, the stimuli are products or brands. In conjoint analysis, the stimuli are combinations of attribute levels determined by the researcher. The goal in MDS is to develop a spatial map depicting the stimuli in a multidimensional perceptual or preference space. Conjoint analy-sis, on the other hand, seeks to develop the part-worth or utility functions describing the util-ity that consumers attach to the levels of each attribute. The two techniques are complementary.
Conjoint analysis has been used in marketing for a variety of purposes, including the fol-lowing:
• Determining the relative importance of attributes in the consumer choice process. A standard output from conjoint analysis consists of derived relative importance weights for all the attributes used to construct the stimuli presented in an evaluation task. The relative importance weights indicate which attributes are important in influencing consumer choice.
• Estimating market share of brands that differ in attribute levels. The utilities derived from conjoint analysis can be used as input into a choice simulator to determine the share of choices, and hence the market share, of different brands.
• Determining the composition of the most-preferred brand. Brand features can be varied in terms of attribute levels and the corresponding utilities determined. The brand features that yield the highest utility indicate the composition of the most-preferred brand.
• Segmenting the market based on similarity of preferences for attribute levels. The part-worth functions derived for the attributes may be used as a basis for clustering partici-pants to arrive at homogeneous preference segments.18
Applications of conjoint analysis have been made in consumer goods, industrial goods and financial and other services. Moreover, these applications have spanned all areas of market-ing. A survey of conjoint analysis reported applications in the areas of new product and concept identification, competitive analysis, pricing, market segmentation, advertising and distribution.19
Statistics and terms associated with conjoint analysis
The important statistics and terms associated with conjoint analysis include the following:
• Part-worth functions. The part-worth or utility functions describe the utility that consum-ers attach to the levels of each attribute.
• Relative importance weights. The relative importance weights are estimated and indicate which attributes are important in influencing consumer choice.
• Attribute levels. These levels denote the values assumed by the attributes.
• Full profiles. Full or complete profiles of brands are constructed in terms of all the attrib-utes by using the attribute levels specified by the design.
• Pairwise tables. Participants evaluate two attributes at a time until all the required pairs of attributes have been evaluated.
• Cyclical designs. These designs are employed to reduce the number of paired comparisons.
• Fractional factorial designs. These designs are employed to reduce the number of stimu-lus profiles to be evaluated in the full-profile approach.
• Orthogonal arrays. These are a special class of fractional designs that enable the efficient estimation of all main effects.
• Internal validity. This involves correlations of the predicted evaluations for the holdout or validation stimuli with those obtained from the participants.

778 Marketing Research
Figure 26.8 lists the steps in conjoint analysis. Formulating the problem involves identifying the salient attributes and their levels. These attributes and levels are used for constructing the stimuli to be used in a conjoint evaluation task. The participants rate or rank the stimuli using a suitable scale, and the data obtained are analysed. The results are interpreted and their reli-ability and validity assessed. We now describe each of the steps of conjoint analysis in detail.
Conducting conjoint analysis
Figure 26.8
Conducting conjoint analysis
Formulate the problem
Construct the stimuli
Decide on the form of input data
Select a conjoint analysis procedure
Interpret the results
Assess the reliability and validity
Formulate the problem
In formulating the conjoint analysis problem, the researcher must identify the attributes and attribute levels to be used in constructing the stimuli. Attribute levels denote the values assumed by the attributes. From a theoretical standpoint, the attributes selected should be salient in influencing consumer preference and choice. For example, in the choice of a car, price, fuel efficiency, interior space and so forth should be included. From a managerial perspective, the attributes and their levels should be characteristics that management can change and take action upon. To tell a manager that consumers prefer a sporty car to one that is conservative looking is not helpful, unless sportiness and conservativeness are defined in terms of attributes over which a manager has control. The attributes can be identi-fied through discussions with management and industry experts, analysis of secondary data, qualitative research and pilot surveys. A typical conjoint analysis study may involve six or seven attributes.
Once the salient attributes have been identified, their appropriate levels should be selected. The number of attribute levels determines the number of parameters that will be estimated and also influences the number of stimuli that will be evaluated by the participants. To mini-mise the participant evaluation task and yet estimate the parameters with reasonable accu-racy, it is desirable to restrict the number of attribute levels. The utility or part-worth function for the levels of an attribute may be non-linear. For example, a consumer may prefer a medium-sized car to either a small or a large one. Likewise, the utility for price may be non-linear. The loss of utility in going from a low price to a medium price may be much smaller than the loss in utility in going from a medium price to a high price. In these cases, at least three levels should be used. Some attributes, though, may naturally occur in binary form (two levels): for example, a car does or does not have a sun-roof.

779Chapter 26 Multidimensional scaling and conjoint analysis
The attribute levels selected will affect the consumer evaluations. If the price of a car brand is varied at €16,000, €18,000 and €20,000, price will be relatively unimportant. On the other hand, if the price is varied at €25,000, €30,000 and €40,000, it will be an important factor. Hence, the researcher should take into account the attribute levels prevalent in the market-place and the objectives of the study. Using attribute levels that are beyond the range reflected in the marketplace will decrease the believability of the evaluation task, but it will increase the accuracy with which the parameters are estimated. The general guideline is to select attribute levels so that the ranges are somewhat greater than those prevalent in the marketplace, but not so large as to impact adversely upon the believability of the evaluation task.
We illustrate the conjoint methodology by considering the problem of how students evalu-ate boots, e.g. brands such as Dr Martens, Timberland, Bally and Caterpillar. Qualitative research identified three attributes as salient: the material used for the upper, the country or region in which the boots were designed and manufactured and the price. Each was defined in terms of three levels, as shown in Table 26.2. These attributes and their levels were used for constructing the conjoint analysis stim-uli. Note that, to keep the illustration simple, we are using only a limited number of attrib-utes, i.e. only three. It has been argued that pictorial stimuli should be used when con-sumers’ marketplace choices are strongly guided by the product’s styling, such that the choices are heavily based on an inspection of actual products or pictures of products.20
Table 26.2
Attribute
Level
Number Description
Uppers 3 Leather2 Suede1 Imitation leather
Country 3 Italy2 USA1 Far East
Price 3 €502 €1251 €200
Boot attributes and levels
Construct the stimuli
Two broad approaches are available for constructing conjoint analysis stimuli: the pairwise approach and the full-profile procedure. In the pairwise approach, also called two-factor evaluations, participants evaluate two attributes at a time until all the possible pairs of attrib-utes have been evaluated. This approach is illustrated in the context of the boots example in Figure 26.9. For each pair, participants evaluate all the combinations of levels of both the attributes, which are presented in a matrix.
In the full-profile approach, also called multiple-factor evaluations, full or complete profiles of brands are constructed for all the attributes. Typically, each profile is described on a separate index card. This approach is illustrated in the context of the boots example in Table 26.3.

780 Marketing Research
It is not necessary to evaluate all the possible combinations, nor is it feasible in all cases.21 In the pairwise approach, it is possible to reduce the number of paired comparisons by using cyclical designs. Likewise, in the full-profile approach, the number of stimulus profiles can be greatly reduced by means of fractional factorial designs. A special class of fractional designs, orthogonal arrays, allows for the efficient estimation of all main effects. Orthogo-nal arrays permit the measurement of all main effects of interest on an uncorrelated basis. These designs assume that all interactions are negligible.22 Generally, two sets of data are obtained. One, the estimation set, is used to calculate the part-worth functions for the attrib-ute levels. The other, the holdout set, is used to assess reliability and validity.
The advantage of the pairwise approach is that it is easier for the participants to provide these judgements. Its relative disadvantage, however, is that it requires more evaluations than the full-profile approach. Also, the evaluation task may be unrealistic when only two attrib-utes are being evaluated simultaneously. Studies comparing the two approaches indicate that both methods yield comparable utilities, yet the full-profile approach is more commonly used.
The boots example follows the full-profile approach. Given three attributes, defined at three levels each, a total of 3 × 3 × 3 = 27 profiles can be constructed. To reduce the participant evaluation task, a fractional factorial design was employed and a set of nine profiles was constructed to consti-tute the estimation stimuli set (see Table 26.4). Another set of nine stimuli was constructed for vali-dation purposes. Input data were obtained for both the estimation and validation stimuli. Before the data could be obtained, however, it was necessary to decide on the form of the input data.
Table 26.3
Example of boot product profile
Upper Made of leatherCountry Designed and made in ItalyPrice Costing €200
Full-profile approach to collecting conjoint data
Figure 26.9
Pairwise approach to collecting conjoint data
Country
USAItaly Far East
Suede
Leather
Imitationleather
Upp
er
Country
USAItaly Far East
€125
€50
€200Pri
ce
Price
€125€50 €200
Suede
Leather
Imitationleather
Upp
er
You will be presented with information on boots in terms of pairs of features describedin the form of a matrix. For each matrix, please rank the nine feature combinations interms of your preference. A rank of 1 should be assigned to the most preferredcombination and 9 to least preferred.

781Chapter 26 Multidimensional scaling and conjoint analysis
Decide on the form of input data
As in the case of MDS, conjoint analysis input data can be either non-metric or metric. For non-metric data, participants are typically required to provide rank order evaluations. For the pairwise approach, participants rank all the cells of each matrix in terms of their desirability. For the full-profile approach, they rank all the stimulus profiles. Rankings involve relative evaluations of the attribute levels. Proponents of ranking data believe that such data accu-rately reflect the behaviour of consumers in the marketplace.
In the metric form, participants provide ratings, rather than rankings. In this case, the judgements are typically made independently. Advocates of rating data believe they are more convenient for the participants and easier to analyse than rankings. In recent years, the use of ratings has become increasingly common.
In conjoint analysis, the dependent variable is usually preference or intention to buy. In other words, participants provide ratings or rankings in terms of their preference or inten-tions to buy. The conjoint methodology, however, is flexible and can accommodate a range of other dependent variables, including actual purchase or choice.
In evaluating boot profiles, participants were required to provide preference ratings for the boots described by the nine profiles in the estimation set. These ratings were obtained using a nine-point Likert scale (1 = not preferred, 9 = greatly preferred). Ratings obtained from one participant are shown in Table 26.4.
Table 26.4
Profile number Attribute levelsa
Upper Country Price Preference rating
1 1 1 1 92 1 2 2 73 1 3 3 54 2 1 2 65 2 2 3 56 2 3 1 67 3 1 3 58 3 2 1 79 3 3 2 6
a The attribute levels correspond to those in Table 26.2.
Boot profiles and their ratings
Select a conjoint analysis procedure
The basic conjoint analysis model may be represented by the following formula:23
( )===©©
11U X
m k
i jij ija X
where U(X) = overall utility of an alternative aij = the part-worth contribution or utility associated with the jth level ( j = 1, 2, . . . , kj) of the ith attribute (i = 1, 2, . . . , m) ki = number of levels of attribute i m = number of attributes xij = 1 if the jth level of the ith attribute is present = 0 otherwise.
The importance of an attribute, Ii, is defined in terms of the range of the part-worths, aij, across the levels of that attribute:
Ij = {max(aij) – min(aij)} for each i
Conjoint analysis modelThe mathematical model expressing the fundamental relationship between attributes and utility in conjoint analysis.

782 Marketing Research
The attribute’s importance is normalised to ascertain its importance relative to other attrib-utes, Wi :
=
=©
1
W
ii
ii
m
I
I
so that
==© 1
1i
i
m
W
Several different procedures are available for estimating the basic model. The simplest, and one which is gaining in popularity, is dummy variable regression (see Chapter 22). In this case, the predictor variables consist of dummy variables for the attribute levels. If an attrib-ute has ki levels, it is coded in terms of ki – 1 dummy variables (see Chapter 19). If metric data are obtained, the ratings, assumed to be interval scaled, form the dependent variable. If the data are non-metric, the rankings may be converted to 0 or 1 by making paired compari-sons between brands. In this case, the predictor variables represent the differences in the attribute levels of the brands being compared. Other procedures that are appropriate for non-metric data include LINMAP, MONANOVA and the LOGIT model (see Chapter 23).24
The researcher must also decide whether the data will be analysed at the individual- participant or the aggregate level. At the individual level, the data of each participant are analysed separately. If an aggregate-level analysis is to be conducted, some procedure for grouping the participants must be devised. One common approach is to estimate individual-level part-worth or utility functions first. Participants are then clustered on the basis of the similarity of their part-worth functions. Aggregate analysis is then conducted for each clus-ter. An appropriate model for estimating the parameters should be specified.25
The data reported in Table 26.4 were analysed using ordinary least squares (OLS) regres-sion with dummy variables. The dependent variable was the preference ratings. The inde-pendent variables or predictors were six dummy variables, two for each variable. The transformed data are shown in Table 26.5. Since the data pertain to a single participant, an individual-level analysis was conducted. The part-worth or utility functions estimated for each attribute, as well as the relative importance of the attributes, are given in Table 26.6.26
Table 26.5 Boot data coded for dummy variable regression
Preference ratings
Attributes
Upper Country Price
Y X1 X2 X3 X4 X5 X6
9 1 0 1 0 1 07 1 0 0 1 0 15 1 0 0 0 0 06 0 1 1 0 0 15 0 1 0 1 0 06 0 1 0 0 1 05 0 0 1 0 0 07 0 0 0 1 1 06 0 0 0 0 0 1

783Chapter 26 Multidimensional scaling and conjoint analysis
The model estimated may be represented as:
U = b0 + b
1X
1 + b
2X
2 + b
3X
3 + b
4X
4 + b
5X
5 + b
6X
6
where X1, X2 = dummy variables representing uppers X3, X4 = dummy variables representing country X5, X6 = dummy variables representing price.
For uppers, the attribute levels were coded as follows:
X1 X2
Level 1 1 0Level 2 0 1Level 3 0 0
The levels of the other attributes were coded similarly. The parameters were estimated as follows:
b0 = 4.222
b1 = 1.000
b2 = –0.333
b3 = 1.000
b4 = 0.667
b5 = 2.333
b6 = 1.333
Given the dummy variable coding, in which level 3 is the base level, the coefficients may be related to the part-worths. As explained in Chapter 22, each dummy variable coefficient rep-resents the difference in the part-worth for that level minus the part-worth for the base level. For uppers, we have the following:
11 –
13 =
1
12 –
13 =
2
bba
aaa
To solve for the part-worths, an additional constraint is necessary. The part-worths are esti-mated on an interval scale, so the origin is arbitrary. Therefore, the additional constraint imposed is of the form:
11 +
12 +
13 = 0a a a
Table 26.6
AttributeLevel
Number Description Utility Importance
Uppers 3 Leather 0.7782 Suede −0.5561 Imitation leather −0.222 0.268
Country 3 Italy 0.4452 USA 0.1111 Far East −0.556 0.214
Price 3 ¤50 1.1112 ¤125 0.1111 ¤200 −1.222 0.500
Results of conjoint analysis

784 Marketing Research
These equations for the first attribute, uppers, are:
11 –
13 = 1.000
12 –
13 = –0.333
11 +
12 +
13 = 0
a a
a a
a a a
Solving these equations, we get:
11 = 0.778
12 = –0.556
13 = –0.222
a
a
a
The part-worths for other attributes reported in Table 26.6 can be estimated similarly. For country, we have:
21 –
23 =
3
22 –
23 =
4
21 +
22 +
23 = 0
a
a a
a a a
a bb
For the third attribute, price, we have:
31 –
33 =
5
32 –
33 =
6
31 +
32 +
33 = 0
a a ba
a a a
a b
The relative importance weights were calculated based on ranges of part-worths, as follows:
Sum of ranges of part-worths = − +[ . ( . )] [0 778 0 556 00 445 0 556
1 111 1 222
4 668
. ( . )]
[ . ( . )]
.
− −
+ − −
=
Relative importance of uppers[ . –(– . )]0 778 0 556
4....
.668
1 3344 668
0 286
Relative importance of couuntry
Re ==
= = =
= = =[ . –(– . )]
...
.0 445 0 556
4 6681 0014 668
0 214
llative importance of price =[ . –(– . )]
.1 111 1 222
4 66682 3334 668
0 500..
.
The estimation of the part-worths and the relative importance weights provides the basis for interpreting the results.
Interpret the results
For interpreting the results, it is helpful to plot the part-worth functions. The part-worth func-tion values for each attribute given in Table 26.6 are graphed in Figure 26.10. As can be seen from Table 26.6 and Figure 26.10, this participant has the greatest preference for leather uppers when evaluating boots. Second preference is for imitation leather uppers, and suede uppers are least preferred. An Italian boot is most preferred, followed by American boots and boots from the Far East. As may be expected, a price of €50.00 has the highest utility and a price of €200.00 the lowest. The utility values reported in Table 26.6 have only interval scale properties, and their origin is arbitrary. In terms of relative importance of the attributes, we see that price is number one. Second-most important is uppers, followed closely by country. Because price is by far the most important attribute for this participant, this person could be labelled as ‘price sensitive’.

785Chapter 26 Multidimensional scaling and conjoint analysis
Assess the reliability and validity
Several procedures are available for assessing the reliability and validity of conjoint analysis results:27
1 The goodness of fit of the estimated model should be evaluated. For example, if dummy variable regression is used, the value of R2 will indicate the extent to which the model fits the data. Models with poor fit are suspect.
2 Test–retest reliability can be assessed by obtaining a few replicated judgements later in data collection. In other words, at a later stage in the interview, the participants are asked to evaluate certain selected stimuli again. The two values of these stimuli are then corre-lated to assess test–retest reliability.
3 The evaluations for the holdout or validation stimuli can be predicted by the estimated part-worth functions. The predicted evaluations can then be correlated with those obtained from the participants to determine internal validity.
Figure 26.10
Part-worth functions
Leather Suede Imitation leather–2.0
–1.5
–1.0
–0.5
0.0
Uppers
Utilit
y
Italy USA Far East–1.2
–0.8
–0.4
0.0
Country
Utilit
y
€50 €125 €200–3.0
–1.5
–1.0
–0.5
0.0
Price
Utilit
y
–2.0
–2.5

786 Marketing Research
4 If an aggregate-level analysis has been conducted, the estimation sample can be split in several ways and conjoint analysis conducted on each subsample. The results can be com-pared across subsamples to assess the stability of conjoint analysis solutions.
In running a regression analysis on the data of Table 26.5, an R2 of 0.934 was obtained, indicating a good fit. The preference ratings for the nine validation profiles were predicted from the utilities reported in Table 26.6. These were correlated with the input ratings for these profiles obtained from the participant. The correlation coefficient was 0.95, indicating a good predictive ability. This correlation coefficient is significant at a = 0.05.
Assumptions and limitations of conjoint analysis
Although conjoint analysis is a popular technique, as with MDS it carries a number of assumptions and limitations. Conjoint analysis assumes that the important attributes of a product can be identified. Furthermore, it assumes that consumers evaluate the choice alternatives in terms of these attributes and make trade-offs. In situations where image or brand name is important, however, consumers may not evaluate the brands or alter-natives in terms of attributes. Even if consumers consider product attributes, the trade-off model may not be a good representation of the choice process. Another limitation is that data collection may be complex, particularly if a large number of attributes are involved and the model must be estimated at the individual level. This problem has been mitigated to some extent by procedures such as interactive or adaptive conjoint analysis and hybrid conjoint analysis. It should also be noted that the part-worth func-tions are not unique.
Hybrid conjoint analysis
Hybrid conjoint analysis is an attempt to simplify the burdensome data-collection task required in traditional conjoint analysis. Each participant evaluates a large number of profiles, yet usually only simple part-worth functions, without any interaction effects, are estimated. In the simple part-worths or main-effects model, the value of a combina-tion is simply the sum of the separate main effects (simple part-worths). In actual prac-tice, two attributes may interact in the sense that the participant may value the combination more than the average contribution of the separate parts. Hybrid models have been developed to serve two main purposes: (1) to simplify the data-collection task by imposing less of a burden on each participant; and (2) to permit the estimation of selected interactions (at the subgroup level), as well as all main (or simple) effects at the individual level.
In the hybrid approach, the participants evaluate a limited number, generally no more than nine, of conjoint stimuli, such as full profiles. These profiles are drawn from a large master design and different participants evaluate different sets of profiles so that, over a group of participants, all the profiles of interest are evaluated. In addition, participants directly evalu-ate the relative importance of each attribute and desirability of the levels of each attribute. By combining the direct evaluations with those derived from the evaluations of the conjoint stimuli, it is possible to estimate a model at the aggregate level and still retain some indi-vidual differences.28
MDS and conjoint analysis are complementary techniques and may be used in combina-tion, as in the following example.
Hybrid conjoint analysis
A form of conjoint analysis that can simplify the data-collection task and estimate selected interactions as well as all main effects.

787Chapter 26 Multidimensional scaling and conjoint analysis
Both MDS and conjoint analysis are widely used techniques, as further illustrated in the following two examples. The first example illustrates an application of conjoint analysis in the context of international marketing research. The second example shows how MDS can be used in researching ethical perceptions.
Real research Weeding out the competition29
ICI Agricultural Products (now part of AkzoNobel) did not know whether it should lower the price of Fusilade, its herbicide. It knew that it had developed a potent herbicide, but it was not sure that its weed-killer would survive in a price-conscious market. So a survey was designed to assess the relative impor-tance of different attributes in selecting herbicides and to measure and map perceptions of major her-bicides on the same attributes. Face-to-face inter-views were conducted with 601 soybean and cotton farmers who had at least 200 hectares dedicated to growing these crops and who had used herbicides during the past growing season. First, conjoint anal-ysis was used to determine the relative importance of the attributes farmers use when selecting herbi-cides. Then MDS was used to map farmers’ percep-tions of herbicides. The study showed that price greatly influenced herbicide selections, and participants were particularly sensitive when costs were more than €10 per hectare. But price was not the only determinant. Farmers also considered how much weed control the herbicide provided. They were willing to pay higher prices to keep weeds off their land. The study showed that herbicides that failed to control even one of the four most common weeds would have to be very inex-pensive to attain a reasonable market share. Fusilade promised good weed control. Fur-thermore, MDS indicated that one of Fusilade’s competitors was considered to be expensive. Hence, ICI kept its original pricing plan and did not lower the price of Fusilade.
Real research Fab’s fabulous foamy fight30
Competition in the detergent market was intensifying in Thailand. Market potential research in Thailand indicated that superconcentrates would continue to grow at a healthy rate, although the detergent market had slowed. In addition, this category had already dominated other Asian markets such as Taiwan, Hong Kong and Singapore. Con-sequently, Colgate entered this new line of competition with Fab Power Plus, with the objective of capturing 4% market share. Based on secondary data and qualitative research, Colgate assessed the critical factors for the success of superconcentrates. Some of these factors were: environmental appeal; hand washing and machine washing convenience; superior cleaning abilities; optimum level of suds for hand washing; and brand name. Research also revealed that no brand had both hand and machine wash capabilities and a formula that had both these qualities was desirable. A conjoint study was designed and these factors varied at either two or three levels. Preference ratings were gathered from participants and part-worths for the factors estimated at both the individual and group

788 Marketing Research
level. Results showed that the factor of hand–machine capability had a substantial contri-bution, supporting earlier claims. Based on these findings, Fab Power Plus was success-fully introduced as a brand with both hand and machine wash capabilities.
Practise data analysis with SPSS
SPSS Windows and Mac
The multidimensional scaling program allows individual differences as well as aggregate analysis using ALSCAL. The level of measurement can be ordinal, interval or ratio. Both the direct and derived approaches can be accommodated. To select multidimensional scaling procedures, click:
Analyze>Scale>Multidimensional Scaling . . .
Following are the detailed steps for running multidimensional scaling on the similarity rating, using the data from Table 26.1. First, convert similarity ratings to distances by subtracting
Real research Ethical perceptions of marketing research firms31
In a refined scale to measure the degree to which a certain situation is ethical or unethi-cal, three factors have been found to have acceptable validity and parsimony. Two of these dimensions are particularly interesting. These are a broad-based moral equity dimension (factor 1) and a relativistic dimension (factor 2). Using multidimensional scal-ing, one can plot the perceived ethics of marketing research firms using these dimen-sions. For example, an MDS plot might look like the diagram here.
In this example, internal marketing research departments were perceived to be the most ethical on both dimensions. Large marketing research firms were perceived to be more ethical on the relativistic dimension, whereas small firms were more ethical on the moral equity factor. International research firms were more ethical on relativistic terms (coping in an environment where there are no absolute truths), whereas domestic firms were higher on the moral equity dimension. Full-service research firms were perceived to be more ethical on both the dimensions, as compared with limited-service firms.
An MDS plot might look like this . . .
Domestic �rms
Internal departments
Full service
External �rms
Small �rms
Limited service Large �rms
International�rms
Broad-based moral equity
Rela
tivis
tic

789Chapter 26 Multidimensional scaling and conjoint analysis
each value of Table 26.1 from 8. The form of the data matrix has to be square symmetric (diagonal elements zero and distances above and below the diagonal; see SPSS file ‘Table 26.1 Input’). Note that SPSS gives solutions that are different from those presented in this chapter using different software. Note also that the example in Table 26.1 is based upon beer preferences. In the following, the example is based upon toothpaste preferences. However, the data set is identical:
1 Select ANALYZE from the SPSS menu bar.
2 Click SCALE and then MULTIDIMENSIONAL SCALING (ALSCAL).
3 Move ‘Aqua-Fresh [var00001]’, ‘Crest [var00002]’, ‘Colgate [var00003]’, ‘Aim [var00004]’, ‘Gleem [var00005]’, ‘Plus White [var00006]’, ‘Ultra-Brite [var00007]’, ‘Close-Up [var00008]’, ‘Pepsodent [var00009]’ and ‘Sensodyne [var00010]’ into the VARIABLES box.
4 In the DISTANCES box check DATA ARE DISTANCES. SHAPE should be SQUARE SYMMETRIC (default).
5 Click MODEL. In the pop-up window, in the LEVEL OF MEASUREMENT box, check INTERVAL. In the SCALING MODEL box, check EUCLIDEAN DISTANCE. In the CONDITIONALITY box, check MATRIX. Click CONTINUE.
6 Click OPTIONS. In the pop-up window, in the DISPLAY box, check GROUP PLOTS, DATA MATRIX and MODEL AND OPTIONS SUMMARY. Click CONTINUE.
7 Click OK.
The conjoint analysis approach can be implemented using regression if the dependent variable is metric (interval or ratio). This procedure can be run by clicking:
Analyze>Regression>Linear . . .
Detailed steps for running a regression are given in Chapter 22. SPSS Conjoint is a spe-cialised program that is available as a separate module.
Summary Multidimensional scaling (MDS) is used for obtaining spatial representations of partici-pants’ perceptions and preferences. Perceived or psychological relationships among stimuli are represented as geometric relationships among points in a multidimensional space. Formulating the MDS problem requires a specification of the brands or stimuli to be included. The number and nature of brands selected influence the resulting solution. Input data obtained from participants can be related to perceptions or preferences. Per-ception data can be direct or derived. The direct approaches are more common in mar-keting research.
The selection of an MDS procedure depends on the nature (metric or non-metric) of the input data and whether perceptions or preferences are being scaled. Another deter-mining factor is whether the analysis will be conducted at the individual or aggregate level. The decision about the number of dimensions in which to obtain a solution should be based on theory, interpretability, elbow criterion and ease-of-use considera-tions. Labelling of the dimensions is a difficult task that requires subjective judge-ment. Several guidelines are available for assessing the reliability and validity of MDS solutions. Preference data can be subjected to either internal or external analysis. If the input data are of a qualitative nature, they can be analysed via correspondence analysis. If the attribute-based approaches are used to obtain input data, spatial maps can also be obtained by means of factor or discriminant analysis.

790 Marketing Research
Conjoint analysis is based on the notion that the relative importance that consumers attach to salient attributes, and the utilities they attach to the levels of attributes, can be determined when consumers evaluate brand profiles that are constructed using these attributes and their levels. Formulating the problem requires an identification of the salient attributes and their levels. The pairwise and the full-profile approaches are com-monly employed for constructing the stimuli. Statistical designs are available for reduc-ing the number of stimuli in the evaluation task. The input data can be either non-metric (rankings) or metric (ratings). Typically, the dependent variable is preference or inten-tion to buy.
Although other procedures are available for analysing conjoint analysis data, regres-sion using dummy variables is becoming increasingly important. Interpreting the results requires an examination of the part-worth functions and relative importance weights. Several procedures are available for assessing the reliability and validity of conjoint analysis results.
Questions 1 For what purposes are MDS procedures used?
2 Identify two marketing research problems where MDS could be applied. Explain how you would apply MDS in these situations.
3 What is meant by a spatial map?
4 Describe the steps involved in conducting MDS.
5 Describe the direct and derived approaches to obtaining MDS input data.
6 What factors influence the choice of an MDS procedure?
7 What guidelines are used for deciding on the number of dimensions in which to obtain an MDS solution?
8 Describe the ways in which the reliability and validity of MDS solutions can be assessed.
9 What is the difference between internal and external analysis of preference data?
10 What is involved in formulating a conjoint analysis problem?
11 Describe the full-profile approach to constructing stimuli in conjoint analysis.
12 Describe the pairwise approach to constructing stimuli in conjoint analysis.
13 How can regression analysis be used for analysing conjoint data?
14 Graphically illustrate what is meant by part-worth functions.
15 What procedures are available for assessing the reliability and validity of conjoint analysis results.
Exercises 1 Identify two marketing research problems where MDS could be applied and two where conjoint analysis could be applied. Explain how you would use these techniques in these situations.
2 A participant’s ratings of nine luxury car brands on four dimensions are shown. Each brand was evaluated on each dimension (prestige, performance, luxury

791Chapter 26 Multidimensional scaling and conjoint analysis
and value) on a seven-point scale with ‘1 = poor’ and ‘7 = excellent’. Develop an MDS plot in two dimensions. Explain the plot.
Brand Prestige Performance Luxury Value
Ferrari 5 7 5 7
Jaguar 5 6 5 7BMW 5 7 6 5Mercedes 6 6 6 6Audi 5 5 6 5Lexus 6 6 5 5Porsche 5 6 5 4Bentley 7 4 7 3
Rolls 7 4 7 1
3 Consider 12 brands of bath soap (you can use the following – or other brands that you are more familiar with): Dove, Zest, Dial, Imperial Leather, Body Shop, Camay, Ivory, Palmolive, Irish Spring, Lux, Safeguard, Fairy. Form all the possible 66 pairs of these brands. Rate these pairs of brands in terms of similarity using a seven-point scale. Write a report on what you would see as the participant experience in completing the task of comparing these brands.
4 Construct the nine boot profiles given in Table 26.4. Rate these nine profiles in terms of your preference, using a nine-point rating scale.
5 In a small group, discuss the similarities and differences between MDS, factor analysis and discriminant analysis, and consider the following statement: ‘simplifying MDS solutions to two-dimensional graphics works well in conveying a solution, but they can only rarely convey the complexity of how consumers differentiate between brands’.
Notes
1. Foote, A, ‘Another wake up call’, Beverage World 124 (3) (March 2005), 4; Foust, D., ‘Things go better with. . . Juice: Coke’s new CEO will have to move quickly to catch up in noncarbonated drink’, Business Week 3883 (17 May, 2004), 81; Green, P.E., Carmone, F.J. Jr and Smith, S.M., Multidimensional Scaling: Concepts and Applications (Boston, MA: Allyn & Bacon, 1989), 16–17.
2. Anon., ‘Boots Laboratories Serum 7 – Alliance Boots’, Design Business Association, Gold, Design Effectiveness Awards (2009); Kara, A., Kaynak, E. and Kucukemiroglu, O., ‘Credit card development strategies for the youth market: The use of conjoint analysis’, International Journal of Bank Marketing 12 (6) (1994), 30–6; Barrett, P., Burr, P. and Dolman, N., ‘The conjoint path over the cultural divide’, Marketing Week (14 October 1997).
3. For a review of MDS studies in marketing, see Howaldt, K. and Mitchell, A., ‘Can segmentation ever deliver the goods?’, Market Leader 36 (Spring 2007), 54–8; DeSarbo, W. and Wu, J., ‘The joint spatial representation of multiple variable batteries collected in marketing
research’, Journal of Marketing Research 38 (2) (May 2001), 244; Andrews, R.L. and Manrai, A.K., ‘MDS maps for product attributes and market response: An application to scanner panel data’, Marketing Science 18 (4) (1999), 584–604; Bijmolt, T.H.A. and Wedel, M., ‘A comparison of multidimensional scaling methods for perceptual mapping’, Journal of Marketing Research 36 (2) (May 1999), 277–85; Carroll, J.D. and Green, P.E., ‘Psychometric methods in marketing research: Part II. Multidimensional scaling’, Journal of Marketing Research 34 (February 1997), 193–204; Cooper, L.G., ‘A review of multidimensional scaling in marketing research’, Applied Psychological Measurement 7 (Fall 1983), 427–50.
4. An excellent discussion of the various aspects of MDS may be found in Borg, I. and Groenen, P.J.F., Modern Multidimensional Scaling: Theory and Applications, 2nd edn (New York: Springer-Verlag, 2005); Kruskal, J.B. and Wish, M., Multidimensional Scaling (Newbury Park, CA: Sage, 2005); Green, P.E. and Wind, Y., Marketing Research and Modeling: Progress and Prospects: A Tribute to Paul E. Green (New York: Springer-Verlag,

792 Marketing Research
2005); Bijmolt, T.H.A. and Wedel, M., ‘A comparison of multidimensional scaling methods for perceptual mapping’, Journal of Marketing Research 36 (2) (May 1999), 277–85.
5. Lines, R. and Denstadli, J.M., ‘Information overload in conjoint experiments’, International Journal of Market Research 46 (3) (2004), 297–310.
6. The data are commonly treated as symmetric. For an asymmetric approach, see Desarbo, W.S. and Grewal, R., ‘An alternative efficient representation of demand based competitive asymmetry’, Strategic Management Journal 28 (7) (July 2007), 755–66; Desarbo, W.S. and Manrai, A.K., ‘A new multidimensional scaling methodology for the analysis of asymmetric proximity data in marketing research’, Marketing Science 11 (1) (Winter 1992), 1–20. For other approaches to MDS data, see Juvoung, K., ‘Incorporating context effects in the multidimensional scaling of “Pick Any/N” choice data’, International Journal of Research in Marketing 16 (1) (February 1999), 35–55; Bijmolt, T.H.A. and Wedel, M., ‘The effects of alternative methods of collecting similarity data for multidimensional scaling’, International Journal of Research in Marketing 12 (4) (November 1995), 363–71.
7. See Borg, I. and Groenen, P.J.F., Modern Multidimensional Scaling: Theory and Applications, 2nd edn (New York: Springer-Verlag, 2005); Cox, T.F. and Cox, M.A., Multidimensional Scaling, 2nd edn (New York: Chapman & Hall, 2000); Steenkamp, J.B.E.M. and Van Trijp, H.C.M., ‘Task experience and validity in perceptual mapping: A comparison of two consumer-adaptive techniques’, International Journal of Research in Marketing 13 (3) (July 1996), 265–76; Malhotra, N.K., Jain, A.K. and Pinson, C., ‘The robustness of MDS configurations in the case of incomplete data’, Journal of Marketing Research 25 (February 1988), 95–102.
8. See Cox, T.F. and Cox, M.A., Multidimensional Scaling, 2nd edn (New York: Chapman & Hall, 2000). For an application see Dreyfuss, L., Danilo, S. and Garrel, C., ‘Fragrance innovation – understanding consumer perceptions of fragrance’, ESOMAR Fragrance Research, Cannes (June 2009); d’Astous, A. and Boujbel, L., ‘Positioning countries on personality dimensions: Scale development and implications for country marketing’, Journal of Business Research 60 (3) (March 2007), 231–9.
9. Kruskal’s stress is probably the most commonly used measure for lack of fit. See Kruskal, J.B. and Wish, M., Multidimensional Scaling (Newbury Park, CA: Sage, 2005). For the original article, see Kruskal, J.B., ‘Multidimensional scaling by optimising goodness of fit to a nonmetric hypothesis’, Psychometrika 29 (March 1964), 1–27.
10. For an examination of the reliability and validity of MDS solutions, see DeSarbo, W.S., ‘The joint spatial representation of multiple variable batteries collected in marketing research’, Journal of Marketing Research 38 (2) (May 2001), 244–53; Carroll, J.D. and Green, P.E., ‘Psychometric methods in marketing research: Part II. Multidimensional scaling’, Journal of Marketing Research 34 (February 1997), 193–204; Malhotra, N.K., ‘Validity and structural reliability of multidimensional scaling’, Journal of Marketing Research 24 (May 1987), 164–73.
11. See, for example, Desarbo, W.S. and Grewal, R., ‘An alternative efficient representation of demand based competitive asymmetry’, Strategic Management Journal 28 (7) (July 2007), 755–66; Lee, J.K.H., Sudhir, K. and Steckel, J.H., ‘A multiple ideal point model: Capturing multiple preference effects from within an ideal point framework’, Journal of Marketing Research 39 (1) (February 2002), 73–86; DeSarbo, W.S., Hoffman, D. and Rangaswamy, A., ‘A parametric multidimensional unfolding procedure for incomplete nonmetric preference/choice set data marketing research’, Journal of Marketing Research 34 (4) (November 1997), 499–516; Mackay, D.B., Easley, R.F. and Zinnes, J.L., ‘A single ideal point model for market structure analysis’, Journal of Marketing Research 32 (4) (November 1995), 433–43.
12. Ferris, P., ‘All the right designs’, Marketing 109 (15) (26 April, 2004), 3; Odekerken-Schroder, G., Ouwersloot, H., Lemmink, J. and Semeijn, J., ‘Consumers’ trade-off between relationship, service and package and price: An empirical study in the car industry’, European Journal of Marketing 37 (1/2) (2003), 219–44.
13. For an application of correspondence analysis, see Gomez, M. and Benito, N.R., ‘Manufacturer’s characteristics that determine the choice of producing store brands’, European Journal of Marketing 42 (1/2) (2008), 154–77; Inman, J., Shankar, V. and Ferraro, R., ‘The roles of channel-category associations and geodemographics in channel patronage’, Journal of Marketing 68 (April 2004), 51–71; Malhotra, N.K. and Charles, B., ‘Overcoming the attribute prespecification bias in international marketing research by using nonattribute based correspondence analysis’, International Marketing Review 19 (1) (2002), 65–79; Reed, K., ‘The use of correspondence analysis to develop a scale to measure workplace morale from multi-level data’, Social Indicators Research 57 (3) (March 2002), 339.
14. Whitlark, D.B. and Smith, S.M., ‘Using correspondence analysis to map relationships’, Marketing Research: A Magazine of Management and Applications 13 (4) (Fall 2001), 22–7.
15. See Bartholomew, D.J., Analysis of Multivariate Social Science Data, 2nd edn (Boca Raton, FL: CRC Press, 2008); Blasius, J. and Greenacre, M.J., Visualization of Categorical Data (New York: Academic Press, 1998); Greenacre, M.J., Correspondence Analysis in Practice (New York: Academic Press, 1993); Greenacre, M.J., ‘The Carroll–Green–Schaffer scaling in correspondence analysis: A theoretical and empirical appraisal’, Journal of Marketing Research 26 (August 1989), 358–65; Greenacre, M.J., Theory and Applications of Correspondence Analyses (New York: Academic Press, 1984); Hoffman, D.L. and Franke, G.R., ‘Correspondence analysis: Graphical representation of categorical data in marketing research’, Journal of Marketing Research 23 (August 1986), 213–27.
16. Borg, I. and Groenen, P.J.F., Modern Multidimensional Scaling: Theory and Application, 2nd edn (New York: Springer-Verlag, 2005); Bijmolt, T.H.A. and Wedel, M., ‘A comparison of multidimensional scaling methods for perceptual mapping’, Journal of Marketing Research 36 (2) (May 1999), 277–85; Hauser, J.R. and Koppelman, F.S., ‘Alternative perceptual mapping techniques:

793Chapter 26 Multidimensional scaling and conjoint analysis
Relative accuracy and usefulness’, Journal of Marketing Research 16 (November 1979), 495–506. Hauser and Koppelman conclude that factor analysis is superior to discriminant analysis.
17. For applications and issues in conjoint analysis, see Meißner, M. and Decker, R., ‘Eye-tracking information processing in choice-based conjoint analysis’, International Journal of Market Research 52 (5) (2010), 593–612; Mønness, E. and Coleman, S., ‘Comparing a survey and a conjoint study: The future vision of water intermediaries’, Journal of Applied Statistics 35 (1) (January 2008), 19–30; Orth, U.R. and Malkewitz, K., ‘Holistic package design and consumer brand impressions’, Journal of Marketing 72 (3) (July 2008), 64–81; Backhaus, K., Hillig, T. and Wilken, R., ‘Predicting purchase decisions with different conjoint analysis methods: A Monte Carlo simulation’, International Journal of Market Research 49 (3) (2007), 341–64; Poynter, R., ‘The power of conjoint analysis and choice modeling in online surveys’, Market Research Society: Annual Conference (2006).
18. Wilsom-Jeanselme, M. and Reynolds, J., ‘The advantages of preference based segmentation: An investigation of online grocery retailing’, Journal of Targeting, Measurement & Analysis for Marketing 14 (4) (July 2006), 297–308; Dickson, M.A., Lennon, S.J., Montalto, C.P., Shen, D. and Zhang, L., ‘Chinese consumer market segments for foreign apparel products’, Journal of Consumer Marketing 21 (4/5) (2004), 301; Vriens, M., ‘Linking attributes, benefits, and consumer values’, Marketing Research 12 (3) (Fall 2000), 4–10; Thomas-Miller, J., Ogden, J.R. and Latshaw, C.A., ‘Using trade-off analysis to determine value–price sensitivity of custom calling features’, American Business Review 16 (1) (January 1998), 8–13. For an overview of conjoint analysis in marketing, see Carroll, J.D. and Green, P.E., ‘Psychometric methods in marketing research: Part I. Conjoint analysis’, Journal of Marketing Research 32 (November 1995), 385–91; Green, P.E. and Srinivasan, V., ‘Conjoint analysis in marketing: New developments with implications for research and practice’, Journal of Marketing 54 (October 1990), 3–19.
19. Hatzinger, R. and Mazanec, J.A., ‘Measuring the part-worth of the mode of transport in a trip package: An extended Bradley Terry model for paired comparison conjoint data’, Journal of Business Research 60 (12) (December 2007), 1290–1302; Liechty, J.C., Fong, D.K.H. and DeSarbo, W.S., ‘Dynamic models incorporating individual heterogeneity: Utility evolution in conjoint analysis’, Marketing Science 24 (2) (March 2005), 285–93; Bloch, P.H., Brunel, F.F. and Arnold, T.J., ‘Individual differences in the centrality of visual product aesthetics: Concept and measurement’, Journal of Consumer Research 29 (March 2003), 551–65; Sandor, Z. and Wedel, M., ‘Designing conjoint choice experiments using managers’ prior beliefs’, Journal of Marketing Research 38 (4) (November 2001), 430–44; Srinivasan, V., ‘Predictive validation of multiattribute choice models’, Marketing Research 11 (4) (Winter 1999/Spring 2000), 29–34; Wittink, D.R., Vriens, M. and Burhenne, W., ‘Commercial uses of conjoint analysis in Europe: Results and critical reflections’, International Journal of Research in Marketing 11 (1) (January 1994), 41–52.
20. Jansson, C., Bointon, B. and Marlow, N., ‘An exploratory conjoint analysis study of consumers’ aesthetic responses of point of purchase materials’, International Review of Retail, Distribution and Consumer Research 13 (1) (January 2003), 59–76; Wetzels, M., ‘Measuring service quality trade-offs in Asian distribution channels: A multilayer perspective’, Total Quality Management 11 (3) (May 2000), 307–18; Loosschilder, G.H., Rosbergen, E., Vriens, M. and Wittink, D.R., ‘Pictorial stimuli in conjoint analysis – to support product styling decisions’, Journal of the Market Research Society 37 (January 1995), 17–34.
21. McCullough, D., ‘A users guide to conjoint analysis’, Marketing Research (Summer 2002), 19–23.
22. See Grunert, K.G., Esbjerg, L., Bech-Larsen, T., Bruns, K. and Juhl, H., ‘Consumer preferences for retail brand architectures: Results from a conjoint study’, International Journal of Retail and Distribution Management 34 (8) (2006), 597–608; Toubia, O., Hauser, J.R. and Simester, D.I., ‘Polyhedral methods for adaptive choice based conjoint analysis’, Journal of Marketing Research 41 (1) (February 2004), 116–31; Green, P.A., Krieger, A.M. and Wind, Y., ‘Thirty years of conjoint analysis: Reflections and prospects’, Interfaces 31 (3) (May/June 2001), S56; Carroll, J.D. and Green, P.E., ‘Psychometric methods in marketing research: Part I. Conjoint analysis’, Journal of Marketing Research 32 (November 1995), 385–91; Kuhfeld, W.F., Tobias, R.D. and Garratt, M., ‘Efficient experimental designs with marketing applications’, Journal of Marketing Research 31 (November 1994), 545–57; Addleman, S., ‘Orthogonal main-effect plans for asymmetrical factorial experiments’, Technometrics 4 (February 1962), 21–36; Green, P.E., ‘On the design of choice experiments involving multifactor alternatives’, Journal of Consumer Research 1 (September 1974), 61–8.
23. Iyengar, R.I., Jedidi, K. and Kohli, R., ‘A conjoint approach to multipart pricing’, Journal of Marketing Research 45 (2) (May 2008), 195–210; Haaijer, R., Kamakura, W. and Wedel, M., ‘Response latencies in the analysis of conjoint choice experiments’, Journal of Marketing Research 37 (3) (August 2000), 376–82; Carroll, J.D. and Green, P.E., ‘Psychometric methods in marketing research: Part I. Conjoint analysis’, Journal of Marketing Research 32 (November 1995), 385–91.
24. Helm, R., Scholl, A. and Manthey, L., ‘A comparative empirical study on common methods for measuring preferences’, International Journal of Management and Decision Making 9 (3) (2008), 242–65; Ding, M., ‘An incentive aligned mechanism for conjoint analysis’, Journal of Marketing Research 44 (2) (May 2007), 214; Sandor, Z. and Wedel, M., ‘Designing conjoint choice experiments using managers’ prior beliefs’, Journal of Marketing Research 38 (4) (November 2001), 430–44; Oppewal, H., Timmermans, H.J. and Louviere, J.J., ‘Modeling the effect of shopping center size and store variety in consumer choice behaviour’, Environment and Planning 29 (6) (June 1997), 1073–90.
25. Evgeniou, T., Boussios, C. and Zacharia, G., ‘Generalised robust conjoint estimation’, Marketing Science 24 (3) (June 2005), 415–29; Arora, N. and Allenby, G.M., ‘Measuring the influence of individual preference structures in group decision making’, Journal of Marketing Research 36 (4) (November 1999), 476–87;

794 Marketing Research
Brice, R., ‘Conjoint analysis: A review of conjoint paradigms and discussion of the outstanding design issues’, Marketing and Research Today 25 (4) (November 1997), 260–6; Carroll, J.D. and Green, P.E., ‘Psychometric methods in marketing research: Part I. Conjoint analysis’, Journal of Marketing Research 32 (November 1995), 385–91; Carmone, E.J. and Green, P.E., ‘Model mis-specification in multiattribute parameter estimation’, Journal of Marketing Research 18 (February 1981), 87–93.
26. Chhajed, D. and Kim, K., ‘The role of inclination and part-worth differences across segments is designing a price-discriminating product line’, International Journal of Research in Marketing 21 (3) (September 2004), 313. For an application of conjoint analysis using OLS regression, see Haaijer, R., Kamakura, W. and Wedel, M., ‘The “No-Choice” alternative to conjoint choice experiments’, International Journal of Market Research 43 (1) (First Quarter 2001), 93–106; Ostrom, A. and Iacobucci, D., ‘Consumer trade-offs and the evaluation of services’, Journal of Marketing 59 (January 1995), 17–28; Danaher, P.J., ‘Using conjoint analysis to determine the relative importance of service attributes measured in customer satisfaction surveys’, Journal of Retailing 73 (2) (Summer 1997), 235–60.
27. Ding, M., Grewal, R. and Liechty, J., ‘Incentive aligned conjoint analysis’, Journal of Marketing Research 42 (1) (February 2005), 67; Moore, W.L., ‘A cross-validity comparison of rating-based and choice-based conjoint analysis models’, International Journal of Research in Marketing 21 (3) (2004), 299–312; Andrews, R.L., ‘Hierarchical Bayes versus finite mixture conjoint analysis: A comparison of fit, prediction and part-worth recovery’, Journal of Marketing Research 39 (1) (February 2002), 87–98; Carroll, J.D. and Green, P.E., ‘Psychometric methods in marketing research: Part I. Conjoint analysis’, Journal of Marketing Research 32 (November 1995), 385–91; Malhotra, N.K., ‘Structural reliability and stability of nonmetric conjoint analysis’, Journal of Marketing Research 19 (May 1982), 199–207; Leigh, T.W., MacKay, D.B. and Summers, J.O., ‘Reliability and validity of conjoint analysis and self-explicated weights: A comparison’, Journal of Marketing Research 21 (November 1984), 456–62; Segal, M.N., ‘Reliability of conjoint analysis: Contrasting data
collection procedures’, Journal of Marketing Research 19 (February 1982), 139–43.
28. Hofstede, F.T., Kim, Y. and Wedel, M., ‘Bayesian prediction in hybrid conjoint analysis’, Journal of Marketing Research 39 (2) (May 2002), 253–61; Vavra, T.G., Green, P.E. and Krieger, A.M., ‘Evaluating EZPass’, Marketing Research 11 (2) (Summer 1999), 4–14; Hu, C. and Hiemstra, S.J., ‘Hybrid conjoint analysis as a research technique to measure meeting planners’ preferences in hotel selection’, Journal of Travel Research 35 (2) (Fall 1996), 62–9; Green, P.E. and Krieger, A.M., ‘Individualized hybrid models for conjoint analysis’, Management Science 42 (6) (June 1996), 850–67; Green, P.E., ‘Hybrid models for conjoint analysis: An expository review’, Journal of Marketing Research 21 (May 1984), 155–69.
29. Lusk, J.L., Fields, D. and Prevatt, W., ‘An incentive compatible conjoint ranking mechanism’, American Journal of Agricultural Economics 90 (2) (May 2008), 487–98; Boyle, K.J., ‘A comparison of conjoint analysis response formats’, American Journal of Agricultural Economics 83 (2) (May 2001), 441–54; McDonald, D., ‘Industry giants’, Farm Industry News 34 (3) (February 2001), 6; Schneidman, D., ‘Research method designed to determine price for new products, line extensions’, Marketing News (23 October 1987), 11.
30. Anon., ‘Lever Faberge plans major softener launch’, Marketing Week (9 September 2004), 5; Jitpleecheep, S., ‘Thailand’s detergent market growth rate slows’, Knight Ridder Tribune Business News (24 May 2002), 1; Grant, L., ‘Outmarketing P & G’, Fortune 137 (1) (12 January 1998), 150–2; Butler, D., ‘Thai superconcentrates foam’, Advertising Age (18 January 1993).
31. Srnka, K.J., ‘Culture’s role in marketers’ ethical decision making: An integrated theoretical framework’, Academy of Marketing Science Review (2004), 1; Peterson, D., Rhoads, A. and Vaught, B.C., ‘Ethical beliefs of business professionals: A study of gender, age and external factors’, Journal of Business Ethics 31 (3) (June 2001), 1; Vitell, S.J. and Ho, F.N., ‘Ethical decision making in marketing: A synthesis and evaluation of scales measuring the various components of decision making in ethical situations’, Journal of Business Ethics 16 (7) (May 1997), 699–717.

Structural equation modelling and path analysis
Structural equation modelling
can test the descriptive ability
of different models, thus
allowing them to be compared.
Stage 1
Problem definition
Stage 2
Research approach developed
Stage 3
Research design
developed
Stage 4
Fieldwork or data
collection
Stage 5
Data integrity
and analysis
27
Stage 6
Communicating research findings

796 Marketing Research
Objectives
After reading this chapter, you should be able to:
1 define the nature and unique characteristics of structural equation modelling (SEM);
2 explain the basic concepts in SEM such as theory, model, path diagram, exogenous versus endogenous constructs, dependence and correlational relationships, model fit and model identification;
3 discuss the basic statistics associated with SEM;
4 describe the process of conducting SEM and explain the various steps involved;
5 know how to specify a measurement model and assess its validity;
6 explain the concept of model fit and the differences between absolute, incremental and parsimony fit indices;
7 describe how to specify a structural model and assess its validity;
8 discuss the relationship of SEM to other multivariate techniques;
9 explain path analysis and discuss its relationship to SEM.
This chapter provides an overview of structural equation modelling (SEM), a procedure for estimating a series of dependence relationships among a set of concepts or constructs represented by multiple measured variables and incorporated into an integrated model. The principles of regression (Chapter 22) and factor analysis (Chapter 24) provide a foundation for understanding SEM. We start by discussing the basic concepts of SEM, followed by an explanation of the key statistics and terms associated with the procedure. Then we describe the procedure for conducting SEM. We also cover second-order confirmatory factor analysis (CFA) and present illustrative applications of SEM. Then, we describe the related technique of path analysis. We begin with an example of the use of SEM and confirmatory factor analysis.1
Overview
Real research Personal aspirations and the consumption of luxury goods2
The market for luxury goods and services has been enlarging, steadily and strongly, since the early 1990s. The economic factors driving this trend include increasing disposable income, lower unemployment, reducing production costs and increasing female employment, as well as a growing wealthy class in developing nations. Studies have found significant and meaningful relationships between luxury con-sumption and a conspicuous consumption motive, but few have investigated other social motivations. A study proposed to develop and validate an empirical model that included both extrinsic and intrinsic ante-cedents to buying luxury goods. Extrinsic goals included financial success (money and luxury), social recognition (fame) and appealing appearance (image);
Structural equation modelling (SEM)Structural equation modelling (SEM) is a procedure for estimating a series of dependence relationships among a set of concepts or constructs represented by multiple measured variables and incorporated into an integrated model.

797Chapter 27 Structural equation modelling and path analysis
intrinsic goals were self-acceptance (growth), affiliation (relatedness), community feeling (helpfulness) and physical fitness (health). Research hypotheses were set to assess the effects of antecedents on consumer preference for luxury goods. A theoretical model was built, depicting the relationships between intrinsic and extrinsic aspirations, quality search, conspicuous consumption behaviour and self-directed pleasure. It was validated and tested by means of confirmatory factor analysis and structural equation modelling. Validation of the structural and measurement models was by means of discriminant and convergent validity tests.
Basic concepts in SEM
In many instances, researchers must answer a set of interrelated questions. For example, a hotel company may be interested in the following questions: What variables determine ser-vice quality? How does service quality influence service attitude and service satisfaction? How does satisfaction with the service result in patronage intention? How does attitude towards the service combine with other variables to affect intention to patronise the service? Such interrelated questions cannot be examined in a unified analysis by any single statistical technique we have discussed so far. To answer such questions in a unified and integrated manner, the researcher must make use of structural equation modelling (SEM). SEM can help us assess the measurement properties and test the proposed theoretical relationships by using a single technique.3 For example, based upon theory and previous research, we could contend that service quality has five dimensions or factors, such as tangibility, reliability, responsiveness, assurance and empathy. Service quality could be depicted as a latent con-struct that is not directly observed or measured. Rather, service quality is represented by the five dimensions that are observed or measured. SEM can determine the contribution of each dimension in representing service quality and evaluate how well a set of observed variables measuring these dimensions represents quality, i.e. how reliable the construct is. We can then incorporate this information into the estimation of the relationships between service quality and other constructs. Service quality has a direct and positive influence on both atti-tude and satisfaction towards the service. Service attitude and satisfaction, in turn, deter-mine attitude to patronise the service. Thus service attitude and service satisfaction are both dependent and independent variables in our theory. A hypothesised dependent variable (ser-vice attitude/satisfaction) can become an independent variable in a subsequent dependence relationship (explaining patronage intention). Later in this chapter we give an empirical application of service quality in the context of personal banking.
SEM examines the structure of these interrelationships, which are expressed in a series of structural equations. This concept is similar to estimating a series of multiple regression equations (see Chapter 22). These equations model all the relationships among constructs, dependent as well as independent. In SEM, the constructs are unobservable or latent factors that are represented by multiple variables. This is similar to the concept of variables repre-senting a factor in factor analysis (see Chapter 24), but SEM explicitly takes into account the measurement error. Measurement error is the degree to which the observed variables do not describe the latent constructs of interest in SEM.
SEM is distinguished from the other multivariate techniques we have discussed by the following characteristics:4
1 Representation of constructs as unobservable or latent factors in dependence relationships.
2 Estimation of multiple and interrelated dependence relationships incorporated in an inte-grated model.
ConstructIn SEM, a construct is a latent or unobservable concept that can be defined conceptually but cannot be measured directly or without error. Also called a factor, a construct is measured by multiple indicators or observed variables.
Measurement errorThe degree to which the observed variables do not describe the latent constructs of interest in SEM.

798 Marketing Research
3 Incorporation of measurement error in an explicit manner. SEM can explicitly account for less than perfect reliability of the observed variables, providing analyses of attenuation and estimation bias due to measurement error.
4 Explanation of the covariance among the observed variables. SEM seeks to represent hypotheses about the means, variances and covariances of observed data in terms of a smaller number of structural parameters defined by a hypothesised underlying model.
SEM is also known by other names such as covariance structure analysis, latent varia-ble analysis and causal modelling. However, it should be noted that SEM by itself cannot establish causality, although it can assist in that process. To make causal inferences, all of the three conditions of causality (discussed in Chapter 11) must be satisfied. This is seldom the case in SEM as such models are generally estimated on single cross-sectional data (Chapter 3) collected by surveys at a single point in time. However, SEM can provide evi-dence of systematic covariation.5 SEM is mainly used as a confirmatory, rather than explor-atory, technique. Generally we use SEM to determine whether a certain model is valid, rather than using SEM to ‘find’ a suitable model. However, SEM analyses often involve an exploratory aspect.
Statistics and terms associated with SEM
The following statistics and statistical terms are associated with SEM:
• Absolute fit indices. These indices measure the overall goodness of fit or badness of fit for both the measurement and structural models. Larger values of goodness of fit and smaller values of badness of fit represent better fits.
• Average variance extracted (AVE). A measure used to assess convergent and discriminant validity, which is defined as the variance in the indicators or observed variables that is explained by the latent construct.
• Chi-square difference statistic (Δx2). A statistic used to compare two competing, nested SEM models. It is calculated as the difference between the models’ chi-square values. Its degrees of freedom equal the difference in the models’ degrees of freedom.
• Composite reliability (CR). This is defined as the total amount of true score variation in relation to the total score variance. Thus, composite reliability corresponds to the conven-tional notion of reliability in classical test theory.
• Confirmatory factor analysis (CFA). A technique used to estimate the measurement model. It seeks to confirm whether the number of factors (or constructs) and the loadings of observed (indicator) variables on them conform to what is expected on the basis of theory. Indicator variables are selected on the basis of theory, and CFA is used to see if they load as predicted on the expected number of factors.
• Endogenous construct. This is a latent, multi-item equivalent of a dependent variable. It is determined by constructs or variables within the model and thus it is dependent on other constructs.
• Estimated covariance matrix. Denoted by ©k, this matrix consists of the predicted covari-ances between all observed variables based on equations estimated in SEM.
• Exogenous construct. This is the latent, multi-item equivalent of an independent variable in traditional multivariate analysis. An exogenous construct is determined by factors out-side of the model and it cannot be explained by any other construct or variable in the model.

799Chapter 27 Structural equation modelling and path analysis
• First-order factor model. Covariances between observed variables are explained with a single latent factor or construct layer.
• Incremental fit indices. These measures assess how well a model specified by the researcher fits relative to some alternative baseline model. Typically, the baseline model is a null model in which all observed variables are unrelated to each other.
• Measurement model. The first two models estimated in SEM. This represents the theory that specifies the observed variables for each construct and permits the assessment of construct validity.
• Modification index. An index calculated for each possible relationship that is not freely estimated but is fixed. The index shows the improvement in the overall model x2 if that path was freely estimated.
• Nested model. A model is nested within another model if it has the same number of con-structs and variables and can be derived from the other model by altering relationships, by adding or deleting relationships.
• Non-recursive model. A structural model that contains feedback loops or dual depend-ences.
• Parsimony fit indices. Designed to assess fit in relation to model complexity and useful in evaluating competing models, these indices are goodness-of-fit measures and can be improved by a better fit or by a simpler, less complex model that estimates fewer parameters.
• Parsimony ratio. This is calculated as the ratio of degrees of freedom used by the model to the total degrees of freedom available.
• Path analysis (PA). A special case of SEM with only single indicators for each of the variables in the causal model. In other words, path analysis is SEM with a structural model, but no measurement model.
• Path diagram. A graphical representation of a model showing the complete set of rela-tionships among the constructs. Dependence relationships are portrayed by straight arrows, and correlational relationships by curved arrows.
• Recursive model. A structural model that does not contain any feedback loops or dual dependencies.
• Sample covariance matrix. Denoted by S, this matrix consists of the variances and covar-iances for the observed variables.
• Second-order factor model. There are two levels or layers. A second-order latent con-struct causes multiple first-order latent constructs, which in turn cause the observed vari-ables. Thus, the first-order constructs now act as indicators or observed variables for the second-order factor.
• Squared multiple correlations. Similar to communality, these values denote the extent to which an observed variable’s variance is explained by a latent construct or factor.
• Structural error. This is similar to an error term in regression analysis. In the case of com-pletely standardised estimates, squared multiple correlation is equal to 1 – the structural error.
• Structural model. The second of two models estimated in SEM. It represents the theory that specifies how the constructs are related to each other, often with multiple dependence relationships.
• Structural relationship. Dependence relationship between an endogenous construct and an exogenous or other endogenous construct.
• Unidimensionality. A notion that a set of observed variables represent only one underly-ing construct. All cross-loadings are zero.

800 Marketing Research
Foundations of SEM
Foundational to the understanding of SEM are the concepts of theory, model, path diagram, exogenous versus endogenous constructs, dependence and correlational relationships, model fit and model identification. These fundamental concepts are discussed next.
Theory, model and path diagram
The role of theory and models in developing an approach to the problem was discussed in Chapter 2. There we defined a theory as a conceptual scheme based on foundational state-ments or axioms that are assumed to be true. A theory serves as a conceptual foundation for developing a model. It is very important that an SEM model be based on theory because all relationships must be specified before the SEM model can be estimated. In SEM, models are often constructed to test certain hypotheses derived from the theory. An SEM model consists of two models: the measurement model and the structural model.6 The measurement model depicts how the observed (measured) variables represent con-structs. It represents the theory that specifies the observed variables for each construct and permits the assessment of construct validity (Chapter 12). The observed variables are measured by the researcher and are also referred to as measured variables, manifest vari-ables, indicators or items of the construct. Typically, observed variables are assumed to be dependent upon constructs.7 Thus, straight arrows are drawn from a construct to the observed variables that are indicators of the construct (Figure 27.1). No single indicator can completely represent a construct but is used as an indication of that construct. The measurement model uses the technique of CFA in which the researcher specifies which variables define each construct (or factor). It seeks to confirm whether the number of fac-tors (or constructs) and the loadings of observed (indicator) variables on them conform to what is expected on the basis of theory. Thus, CFA is used to verify the factor structure of a set of observed variables. CFA allows the researcher to test the hypothesis that a rela-tionship between observed variables and their underlying latent constructs exists. The researcher uses knowledge of the theory, empirical research, or both; postulates the rela-tionship pattern a priori; and then tests the hypothesis statistically. Indicator variables are selected on the basis of theory, and CFA is used to see if they load as predicted on the expected number of factors. The terms construct and factor are used interchangeably. In other words, in testing for the measurement model, the researcher has complete control over which indicators describe each construct. On the other hand, a structural model shows how the constructs are related to each other, often with multiple dependence rela-tionships. It specifies whether a relationship exists or does not exist. If a relationship is hypothesised by the theory, then an arrow is drawn. If a relationship is not hypothesised, then no arrow is drawn.
Figure 27.1
Dependence and correlational relationships in a simple SEM model
(a) Dependence relationship
Y2 Y3Y1
Exogenousconstruct: C2
X2 X3X1
Exogenousconstruct: C1
(b) Correlational relationship
X5 X6X4
Exogenousconstruct: C2
X2 X3X1
Exogenousconstruct: C1

801Chapter 27 Structural equation modelling and path analysis
A model is portrayed in a graphical form (see Chapter 2), known as a path diagram. The following norms are followed in constructing a path diagram for a measurement model. Con-structs are represented by ovals or circles, while measured variables are represented by squares. Straight arrows are drawn from the constructs to the measured variables, as in Figure 27.1(a). Dependence relationships are portrayed by straight arrows – Figure 27.1(a), and correlational relationships by curved arrows – Figure 27.1(b).
Exogenous versus endogenous constructs
As stated earlier, in SEM a construct is an unobservable or latent variable that can be defined in conceptual terms but cannot be measured directly, e.g. by asking questions in a question-naire. Also, a construct cannot be measured without error. Rather, a construct is measured approximately and indirectly by examining the consistency among multiple observed or measured variables.
An exogenous construct is the latent, multi-item equivalent of an independent variable in traditional multivariate analysis. Multiple observed variables or items are used to represent an exogenous construct that acts as an independent variable in the model. An exogenous construct is determined by factors outside of the model, and it cannot be explained by any other construct or variable in the model. Graphically, an exogenous construct does not have any paths (single-headed arrows) coming into it from any other construct or variable in the model: it will only have paths (single-headed arrows) going out of it. In a measurement model, the indicators or measured variables for an exogenous construct are referred to as X variables. Thus, the construct C1 in Figure 27.1(a) is an exogenous variable.
In contrast, an endogenous construct is the latent, multi-item equivalent of a dependent variable. It is determined by constructs or variables within the model and thus it is depend-ent on other constructs. Graphically, an endogenous construct has one or more paths (single-headed arrows) coming into it from one or more exogenous constructs or from other endogenous constructs. In a measurement model, the indicators or measured variables for an endogenous construct are referred to as Y variables, as in the case of construct C2 in Figure 27.1(a).
Dependence and correlational relationships
A dependence relationship is shown by straight arrows. The arrows flow from the antecedent (independent) to the subsequent effect (dependent) measured variable or latent construct. In a measurement model, the straight arrows are drawn from the construct to its measured vari-ables. In a structural model, the dependence occurs between constructs and so straight arrows are drawn between constructs, as shown in Figure 27.1(a). The specification of dependence relationships is also related to whether a construct is considered exogenous or endogenous, as explained earlier. Thus construct C2 is endogenous in this case. It should be noted that an endogenous construct can be an antecedent of other endogenous constructs.
A correlational relationship, also called covariance relationship, specifies a simple cor-relation between exogenous constructs. The theory posits that these constructs are correlated but it is not assumed that one construct is dependent upon another. A correlation relationship is depicted by a two-headed curved arrow, as shown in Figure 27.1(b). Note that both con-structs, C1 and C2, are exogenous in this case. A path diagram typically involves a combina-tion of dependence and correlational relationships among endogenous and exogenous constructs, as stipulated by theory.
Model fit
SEM tests a set of multiple relationships that are represented by multiple equations. There-fore, the fit or predictive accuracy has to be determined for the model as a whole, not for any single relationship. Other multivariate techniques decompose variance (as explained in

802 Marketing Research
Chapter 21 for analysis of variance and covariance, and in Chapter 22 for multiple regres-sion). In contrast, SEM analyses correlation or covariance. SEM determines how well the proposed theory explains the observed correlation or covariance matrix among measured variables. The data analysis is primarily based on a correlation or covariance matrix at the item level. Thus, one of the preparatory steps for SEM is to produce correlations or covari-ances among the items (measured or observed variables). Most contemporary SEM pro-grams automatically generate correlations or covariances for subsequent analysis and thus this step may not be apparent to most users of such software. Yet it is important to note that SEM analysis is based on a correlation or covariance matrix, rather than raw data. As com-pared with correlations, we advocate the estimation of SEM based on covariances. A correla-tion matrix is a special case of the covariance matrix when the data are standardised (see Chapter 22). As compared with correlations, covariances contain greater information and provide more flexibility. Based on the proposed measurement and structural models, it is possible to estimate the covariance matrix between the observed variables ∑k. Model fit is then determined by comparing how closely the estimated covariance matrix, ∑k, matches the observed (sample) covariance matrix, S, i.e. the fit statistics are based on |S – ∑k|. A residual in SEM is the difference between the observed value and the estimated value of a covariance. Specific fit indices used in SEM are discussed later in the chapter.8
Model identification
Model identification concerns whether there is enough information in the covariance matrix to enable us to estimate a set of structural equations. We can estimate one model parameter for each unique variance or covariance among the observed variables. If there are p observed variables, then up to a maximum of (p(p + 1))/2 parameters can be estimated. Note that this number is the sum of all the unique covariances (p(p + 1)/2 and all the variances, p. Thus:
(p(p + 1))/2 = p(p – 1))/2 + p
If the actual number of estimated parameters, k, is less than (p(p + 1))/2, the model is over identified. In that case, we have positive degrees of freedom. Conversely, if k is greater than (p(p + 1))/2, the model is underidentified and a unique solution cannot be found. As a general guideline, having at least three observed variables for each latent construct helps in model identification, i.e. results in an overidentified model. This practice is therefore recommended.
Model fitModel fit is determined by comparing how closely the estimated covariance matrix, ∑k, matches the observed (sample) covariance matrix, S, i.e. the fit statistics are based on |S − ∑k|.
ResidualsIn SEM, the residuals are the differences between the observed and estimated covariance matrices.
Model identificationModel identification concerns whether there is enough information in the covariance matrix to enable us to estimate a set of structural equations.
Conducting SEM
The process of conducting SEM is described in Figure 27.2. The steps involved in conduct-ing SEM are: (1) define the individual constructs; (2) specify the measurement model; (3) assess measurement model reliability and validity; (4) specify the structural model if the measurement model is valid; (5) assess structural model validity; and (6) draw conclusions and make recommendations if the structural model is valid. We will describe each of these steps and discuss the relevant issues involved.
Define the individual constructs
As already mentioned, it is very important that SEM analysis be grounded in theory. The specific constructs, how each construct will be defined and measured and the interrelation-ships among constructs must all be specified based on theory. Generally, the interest in SEM is to test both the measurement theory and the structural theory. Measurement theory specifies how the constructs are represented; structural theory posits how the constructs are interrelated. Structural relationships posited by theory are converted to hypotheses (see Chapter 2), which are then tested using SEM. The test of these hypotheses will be

803Chapter 27 Structural equation modelling and path analysis
valid only if the underlying measurement model specifying how these constructs are rep-resented is valid. Hence, great care should be taken in operationalising, measuring and scaling the relevant variables as identified and defined by theory. The measurement and scaling considerations involved, including the development of multi-item scales, were dis-cussed in Chapter 12. This process results in scales used to measure the observed variables or indicators.
Specify the measurement model
Once the constructs have been defined and their observed or indicator variables measured, we are in a position to specify the measurement model. This involves the assignment of the relevant measured variables to each latent construct. The measurement model is usually rep-resented by a diagram, as indicated in Figure 27.3. Figure 27.3 represents a simple measure-ment model having two correlated constructs, with each construct being represented by three indicator or measured variables. The assignment of measured variables to each latent con-struct is graphically equivalent to drawing arrows from each construct to the measured vari-ables that represent that construct. The degree to which each measured variable is related to its construct is represented by that variable’s loading, also shown in Figure 27.3. Only the loadings linking each measured variable to its latent construct as specified by the arrows are estimated; all other loadings are set to zero. Also, since a latent factor does not explain a measured variable perfectly, an error term is added. In a measurement model, we do not dis-tinguish between exogenous and endogenous constructs; they are all treated as being of the same type, similar to that in factor analysis (Chapter 24).
Figure 27.2
The process for SEM
De�ne the individual constructs
Develop and specify the measurement model
Assess measurement model validity
Specify the structural model
Re�ne measuresand design anew study
Yes
No
Re�ne modeland test with
new data
No
Yes
Measurementmodel valid?
Structural modelvalid?
Assess structural model validity
Draw conclusions and make recommendations

804 Marketing Research
In a measurement model, it is common to represent constructs by Greek characters and measured variables by alphabets. The common notations used are:
= latent factorsX = measured variables
x= factor loadings= errors= correlation between constructs.
j
d
l
f
It can be seen that Figure 27.3 is similar to Figure 27.1(b) except that all the notations have been added. In equation form, the measurement model may be represented as:
X1 =
x1,1 1 +
1j dl
In the model of Figure 27.3, a total of 13 parameters need to be estimated. The parameters consist of six loading estimates, six error estimates and one between-construct correlation. All the other paths have not been specified, i.e. no arrows have been shown. These paths will be set to zero, i.e. they will not be estimated. For each possible parameter in the model, the researcher should specify whether it is estimated or not. A free parameter is one that is esti-mated in the analysis. A fixed parameter is one that is not estimated by SEM but whose value is set by the researcher. Often, the value of a fixed parameter is set at zero, indicating that the specific relationship is not estimated. Specifying the observed variables or indicators for each latent construct requires ‘setting the scale’ of the latent construct. Because a latent con-struct is not observed, it has no metric scale, i.e. no range of values. Therefore this must be provided, and either one of the following two options may be used:
1 One of the factor loadings can be fixed, generally to a value of 1.
2 The construct variance can be fixed, generally to a value of 1. In this case, the relation-ships between constructs are represented by a correlation matrix.
Sample size requirements
The sample size required for SEM depends upon several considerations, including the com-plexity of the model, estimation technique, amount of missing data, amount of average error variance among the indicators or measured variables and multivariate distribution of the data. In terms of complexity, models with more constructs or more measured variables require larger samples. Larger samples are also needed if there are less than three measured variables for each construct. Regarding estimation technique, if maximum likelihood estimation (MLE – see Chapter 23) is used, the sample size should be generally in the range
Figure 27.3
Path diagram of a simple measurement model
X5 X6X4
C2j2
X2
d2 d3d1
lx1,1 lx3,1
f21
lx2,1
d5 d6d4
lx4,2 lx6,2lx5,2
X3X1
C1j1

805Chapter 27 Structural equation modelling and path analysis
of 200 to 400, subject to other considerations.9 If the extent of missing data is higher than 10%, then problems may be encountered and larger samples are required. The impact of the average error variance of indicators can be understood in terms of communality. Similar to the notion in factor analysis (see Chapter 24), communality is the variance of a measured variable that is explained by the construct on which it loads. Research shows that as com-munalities become smaller, larger samples are required. In particular, when the communali-ties are less than 0.5, larger samples will be required. The problem is magnified when the constructs have been measured with fewer than three indicators. Finally, as the data deviate more and more from the assumption of multivariate normality, larger samples are needed. To minimise problems with deviations from normality, it has been suggested that there should be at least 15 participants for each parameter estimated in the model.10
We offer the following simplified guidelines. SEM models with five or fewer constructs, each with more than three measured variables, and communalities of at least 0.5 should be estimated with sample sizes of at least 200. For five or fewer constructs, when even some of the constructs are measured with fewer than three indicators, or the communalities are less than 0.5, the sample size should be at least 300. When there are more than five constructs, with several constructs being measured with fewer than three indicators, and there are multi-ple low (less than 0.5) communalities, the sample size should be at least 400. In general, larger samples produce more stable solutions and the researcher should ensure that the SEM model is being estimated on an adequate sample size.11
Assess measurement model reliability and validity
The validity of the measurement model depends on the goodness-of-fit results, reliability and evidence of construct validity, especially convergent and discriminant validity:
1 Assess measurement model fit. As stated earlier, goodness of fit means how well the specified model reproduces the covariance matrix among the indicator items. That is, how similar is the estimated covariance of the indicator variables (∑k) to the observed covariance in the sample data (S). The closer the values of the two matrices are to each other, the better the model is said to ‘fit’. As shown in Figure 27.4, the various meas-ures designed to assess fit consist of absolute fit, incremental fit and parsimony fit indi-ces. In absolute fit indices, each model is evaluated independently of other possible models. These indices directly measure how well the specified model reproduces the observed or sample data. Absolute fit indices may measure either goodness of fit or
CommunalityCommunality is the variance of a measured variable that is explained by the construct on which it loads.
Figure 27.4
A classification of fit measures
Incremental�t indices
Fit measures
Goodness of �t• NFI• NNFI• CFI• TLI• RNI
Parsimony�t indices
Goodness of �t• PGFI• PNFI
Badness of �t• x2
• RMSR• SRMR• RMSEA
Absolute�t indices
Goodness of �t• GFI• AGFI

806 Marketing Research
badness of fit. Goodness-of-fit indices indicate how well the specified model fits the observed or sample data, and so higher values of these measures are desirable. Meas-ures that are commonly used are the goodness-of-fit-index (GFI) and the adjusted goodness-of-fit index (AGFI). On the other hand, badness-of-fit indices measure error or deviation in some form and so lower values on these indices are desirable. The com-monly used badness-of-fit measures are the chi-square (x2), root mean square residual (RMSR), standardised root mean square residual (SRMR) and the root mean square error of approximation (RMSEA).
In contrast to the absolute fit indices, the incremental fit indices evaluate how well the specified model fits the sample data relative to some alternative model that is treated as a baseline model. The baseline model that is commonly used is the null model, which is based on the assumption that the observed variables are uncorrelated. These are goodness-of-fit measures, and the commonly used incremental fit indices include the nor-med fit index (NFI), non-normed fit index (NNFI), comparative fit index (CFI), the Tucker Lewis index (TLI) and the relative non-centrality index (RNI).
The parsimony fit indices are designed to assess fit in relation to model complexity and are useful in evaluating competing models. These are goodness-of-fit measures and can be improved by a better fit or by a simpler, less complex model that estimates fewer parameters. These indices are based on the parsimony ratio that is calculated as the ratio of degrees of freedom used by the model to the total degrees of freedom available. The commonly used parsimony fit indices are the parsimony goodness-of-fit index (PGFI) and the parsimony normed-fit index (PNFI). We discuss these indices briefly and provide guidelines for their use. Given its foundational nature, chi-square (x2) is discussed first, followed by other indices.12
2 Chi-square (x2). A chi-square test provides a statistical test of the difference in the covar-iance matrices, such that x2 = (n − 1)(observed sample covariance matrix – estimated covariance matrix), where n is the sample size, or:
2 = (n – 1) (S – k)x ©
At specified degrees of freedom, since the critical value of the x2 distribution is known, the probability that the observed covariance is actually equal to the estimated covariance in a given population can be found. The smaller the probability (p < 0.05), the greater will be the chance that the two covariance matrices are not equal, similar to the x2 test dis-cussed in Chapter 20. For SEM, the degrees of freedom (df ) are determined by the fol-lowing formula:
df = (1/2)[ p(p + 1)] – k
where p is the total number of observed variables and k is the number of estimated param-eters. Although the chi-square is the only statistically based fit measure, its limitation is that it increases with sample size and the number of observed variables, introducing a bias in the model fit. Hence, we should examine alternative model fit indices.
3 Other absolute fit indices: goodness of fit. The goodness-of-fit index (GFI) is a measure of absolute fit, whereas the adjusted goodness-of-fit index (AGFI) accounts for the degrees of freedom in the model. If Fk is the minimum fit function of the estimated model and F0 is the fit function of the baseline model with no free parameters, then GFI = 1 – Fk/F0. As the model fit improves, Fk/F0 decreases and, as a result, GFI increases. AGFI adjusts for degrees of freedom and is useful for comparing across models and different complexities. AGFI = {1 – [p(p + 1)/2df](1 – GFI)} where p is the total number of observed variables and df is the degrees of freedom of the model. Higher values in the 0.90 range are considered acceptable for GFI and AGFI, but GFI and AGFI are affected by sample size and can be large for models that are poorly specified, and as such their use as fit indices is rather limited.

807Chapter 27 Structural equation modelling and path analysis
4 Other absolute fit indices: badness of fit. The notion of a residual was discussed earlier. The root mean square residual (RMSR) is the square root of the mean of these squared residuals. Thus, RMSR is an average residual covariance that is a function of the units used to meas-ure the observed variables. Therefore it is problematic to compare RMSR across models unless standardisation is done. Standardised root mean residual (SRMR) is the standardised value of the root mean square residual and helps in comparing fit across models. Like RMSR, lower values of SRMR indicate better model fit, and values of 0.08 or less are desir-able. Root mean square error of approximation (RMSEA) examines the difference between the actual and the predicted covariance, i.e. residual or, specifically, the square root of the mean of the squared residuals. RMSEA = ∙[(x² /df – 1)/(n – 1)], which adjusts the chi-square value by factoring in the degrees of freedom and the sample size. Lower RMSEA values indicate better model fit. An RMSEA value of ≤0.08 is considered conservative.
5 Incremental fit indices. Normed fit index (NFI) and comparative fit index (CFI) are also widely used model fit measures, and these represent incremental fit indices in that the specified model is compared with the null model in which the variables are assumed to be uncorrelated (i.e. the independence model). NFI is a ratio of the difference in the x2 value for the proposed model (x2
prop) and the null model (x2null) divided by the x2 value for the
null model (x2null), i.e. NFI = (x2
null – x2prop)/x2
null. As the χ2 value for the proposed model approaches zero, NFI tends to be a perfect fit of 1. NFI does not reflect parsimony: the more parameters in the model, the larger the NFI, which is why NNFI is now preferred. NFI = (x2
null /dfnull – x2prop /dfprop)/[(x2
null /dfnull) – 1]where dfprop and dfnull) are the degrees of freedom for the proposed and null models respectively. For both NFI and NNFI, values of ≥0.90 are considered acceptable.
The CFI is related to NFI and factors in degrees of freedom for model complexity. It is determined by the following formula: CFI = 1 – (χ2
prop – dfprop)/ (χ2null – dfnull) where
χ2prop and dfprop are the chi-square value and degrees of freedom for the theoretically
based proposed model and χ2null and dfnull are the same for the null model. CFI varies
from 0 to 1, and values of 0.90 or greater are usually associated with good model fit. CFI is similar in meaning to NFI but penalises for sample size. The Tucker Lewis index (TLI) is conceptually similar to CFI, but is not normed and so the values can fall outside of the 0 to 1 range. Models with good fit have a TLI value that is close to 1. The relative non-centrality index (RNI) is another incremental fit index, and its values generally range between 0 and 1, with values that are 0.90 or larger indicating a good fit.
6 Parsimony fit indices. It should be emphasised that parsimony fit indices are not appropri-ate for evaluating the fit of a single model but are useful in comparing models of different complexities. The parsimony goodness-of-fit index (PGFI) adjusts the goodness-of-fit index by using the parsimony ratio that was defined earlier. The values of PGFI range between 0 and 1. A model with a higher PGFI is preferred, based on fit and complexity. The parsimony normed fit index (PNFI) adjusts the normed fit index (NFI) by multiplica-tion with the parsimony ratio. As with PGFI, higher values of PNFI also indicate better models in terms of fit and parsimony. Both PGFI and PNFI should be used only in a rela-tive sense, i.e. in comparing models. PNFI is used to a greater extent as compared to PGFI.
Of the measures we have considered, CFI and RMSEA are among the measures least affected by sample size and quite popular in use. It is highly desirable that we use multiple (at least three) indices of different types. It is good practice always to report the χ2 value with the associated degrees of freedom. In addition, use at least one absolute goodness-of-fit, one absolute badness-of-fit and one incremental fit measure. If models of different complexities are being compared, one parsimony fit index should also be considered.
7 Assess reliability and validity. The measurement accuracy, reliability, validity and gen-eral-isability considerations discussed for multi-item scales in Chapter 12 also apply to SEM. You are advised to review those concepts. Here we discuss the approaches to reliability, convergent validity and discriminant validity that are unique to SEM.

808 Marketing Research
8 Reliability. Recall from Chapter 12 that an unreliable construct cannot be valid. So first we should assess the reliability of the constructs in the measurement model. As in Chapter 12, the coefficient alpha can be used to assess reliability. In addition, we compute composite reliability (CR), which is defined as the total amount of true score variance in relation to the total score variance. CR is computed as:
©=
+i=1
i=1i
ii=1
2
1
2
l
l
d
©
©
p
CRp p
where CR = composite reliability λ = completely standardised factor loading δ = error variance p = number of indicators or observed variables.
Thus, CR corresponds to the conventional notion of reliability in classical test theory (see Chapter 12). As general guidelines, CRs of 0.7 or higher are considered good. Esti-mates between 0.6 and 0.7 may be considered acceptable if the estimates of the model validity are good.
9 Convergent validity. Recall from Chapter 12 that convergent validity measures the extent to which the scale correlates positively with other measures of the same construct. Hence the size of the factor loadings provides evidence of convergent validity. High factor load-ings indicate that the observed variables converge on the same construct. At a minimum, all factor loadings should be statistically significant and higher than 0.5, ideally higher than 0.7. A loading of 0.7 or higher indicates that the construct is explaining 50% or more of the variation in the observed variable, since (0.71)2 = 0.5. Sometimes a cut-off level of 0.6 is used.13
Another measure that is used to assess convergent validity is the average variance extracted (AVE), which is defined as the variance in the indicators or observed variables that is explained by the latent construct.14 AVE is calculated in terms of the (completely) standardised loadings as:
=+
2
1
2
i=1 i=1
i=1i
i
l
l d
©© ©
p
pAVE p
where AVE = average variance extracted λ = completely standardised factor loading δ = error variance p = number of indicators or observed variables.
AVE varies from 0 to 1, and it represents the ratio of the total variance that is due to the latent variable. Using the logic presented earlier, an AVE of 0.5 or more indicates satisfactory con-vergent validity, as it means that the latent construct accounts for 50% or more of the vari-ance in the observed variables, on average. If AVE is less than 0.5, the variance due to measurement error is larger than the variance captured by the construct, and the validity of the individual indicators as well as the construct is questionable. Note that AVE is a more conservative measure than CR. On the basis of CR alone, the researcher may conclude that the convergent validity of the construct is adequate, even though more than 50% of the vari-ance is due to error. One should also interpret the standardised parameter estimates to ensure that they are meaningful and in accordance with theory.

809Chapter 27 Structural equation modelling and path analysis
10 Discriminant validity. In order to establish discriminant validity, we must show that the construct is distinct from other constructs and thus makes a unique contribution. First, individual observed variables should load on only one latent construct. Cross-loadings indicate lack of distinctiveness and present potential problems in establishing discrimi-nant validity. In SEM, we typically assume that a set of observed variables represents only one underlying construct, and this concept is called unidimensionality. All cross-loadings are specified (i.e. fixed) to be zero.
One formal way to show distinctiveness is to set the correlation between any two constructs as equal to 1, i.e. we are specifying that observed variables measuring the two constructs might as well be represented by one construct. Evidence of discriminant validity is obtained if the fit of the two-construct model is significantly better than the fit of the one-construct model. However, this actually turns out to be a weak test, as sig-nificant fit differences may be obtained even when the correlations between the two constructs are very high.
An alternative test of discriminant validity is based on the logic that a construct should explain its observed variables better than it explains any other construct. The test is conducted by showing that the average variance extracted is greater than the square of the correlations. Equivalently, discriminant validity is achieved if the square root of the average variance extracted is larger than the correlation coefficients.
Lack of validity: diagnosing problems
If the validity of the proposed measurement model is not satisfactory, then you can make use of the diagnostic information provided by CFA to make appropriate modifications. The diagnostic cues that can be used to make appropriate modifications include: (1) the path estimate or loadings; (2) standardised residual; (3) modification indices; and (4) specifica-tion search.
The path estimates or loadings link each construct to its indicators or observed variables. You should examine the completely stand-ardised loadings because standardisation removes the effect due to the scales of meas-urement. Different indicators may be meas-ured using different scales, and this is taken into account via standardisation. Completely standardised loadings that are not in the −1.0 to 1.0 range are infeasible and suggest prob-lems that should be identified and investi-gated. A loading should be statistically significant. A non-significant loading sug-gests that the corresponding indicator should be dropped, unless there are strong theoreti-cal reasons for retaining it. Furthermore, the loadings should preferably be above 0.7, or at least minimally greater than 0.5 when absolute values are compared. These guidelines were provided earlier. Significant but low loadings (less than 0.5) suggest that the corresponding indicators may still be candidates for deletion. The signs of the loadings should be in the direction hypothesised by theory, and the loadings should be meaningful from a theoretical viewpoint. It is also useful to evaluate the squared multiple correlations. A squared multiple correlation represents the extent to which the variance of an observed variable is explained by the associated latent construct.
As noted earlier, residuals refer to the differences between the observed covariances (i.e. the sample data) and the estimated covariance terms. A standardised residual is the residual divided by its standard error. The following guidelines are observed with respect to the abso-lute values of the standardised residuals. Absolute values of standardised residuals exceeding
Standardised residualsUsed as a diagnostic measure of model fit, these are residuals each divided by its standard error.

810 Marketing Research
4.0 are problematic, while those between 2.5 and 4.0 should also be examined carefully but may not suggest any changes to the model if no other problems are associated with the cor-responding indicators or observed variables.
SEM programs also calculate a modification index for each possible relationship that is not freely estimated but is fixed. The index shows the improvement in the overall model, x2, if that path was freely estimated. As a general guideline, the value of the index should be less than 4.0; the values of 4.0 or more indicate that the fit could be improved by freely estimat-ing the relationship or path.
A specification search is an empirical approach that uses the model diagnostics and trial and error to find a better-fitting model. It can be easily implemented using SEM software. In spite of this, the approach should be used with caution because there are problems associated with determining a better-fitting model simply based on empirical data. We do not recom-mend this approach for the non-expert user.
It should be noted that all the adjustments, whether based on path estimates, standardised residuals, modification indices or specification searches, are against the intrinsic nature of CFA, which is a confirmatory technique. In fact, such adjustments are more in keeping with exploratory factor analysis (EFA). However, if the modifications are minor (e.g. deleting less than 10% of the observed variables), you may be able to proceed with the prescribed model and data after making the suggested changes. However, if the modifications are sub-stantial then you must modify the measurement theory, specify a new measurement model and collect new data to test the new model.15
Specify the structural model
Once the validity of the measurement model has been established, you can proceed with the specification of the structural model. In moving from the measurement model to the struc-tural model, the emphasis shifts from the relationships between latent constructs and the observed variables to the nature and magnitude of relationships between constructs. Thus, the measurement model is altered based on the relationships among the latent constructs. Because the measurement model is changed, the estimated covariance matrix based on the set of relationships examined will also change. However, the observed covariance matrix, based on the sample data, does not change as the same data are used to estimate the structural model. Thus, in general, the fit statistics will also change, indicating that the fit of the struc-tural model is different from the fit of the measurement model.
Figure 27.5 shows the structural model that is based on the measurement model of Figure 27.3. While the constructs C1 and C2 were correlated in Figure 27.3, there is now a dependence relationship, with C2 being dependent on C1. Note that the two-headed curved arrow in Figure 27.1 is now replaced with a one-headed straight arrow representing the path from C1 to C2. There are also some changes in the notations and symbols. The con-struct C2 is now represented by h1. This change helps us to distinguish an endogenous construct (C2) from an exogenous construct (C1). Also note that only the observed
Specification searchAn empirical approach that uses the model diagnostics and trial and error to find a better-fitting model.
Figure 27.5
Path diagram of a simple structural model
Y2 Y3Y1
Construct 2: C2h2
X2
d2 d3d1
lx1,1 lx3,1
g1,1
lx2,1
e2 e3e1
ly1,1 ly3,1ly2,1
X3X1
Construct 1: C1j1

811Chapter 27 Structural equation modelling and path analysis
variables for the exogenous C1 are represented by X (X1 to X3). On the other hand, the observed variables for the endogenous construct (C2) are represented by Y (Y1 to Y3). The error variance terms for the Y variables are denoted by e, rather than by d. The loadings also reflect the endogenous and exogenous distinction. Loadings for the exogenous con-struct, as before, are still represented by lx. However, the loadings for the endogenous construct are represented by ly. The graphical representation of a structural model, such as in Figure 27.5, is called a path diagram. The relationships among the latent constructs are shown with one-headed straight arrows in the path diagram; fixed parameters, typi-cally set at zero, are not shown. The structural parameters fall into two groups. Parameters representing relationships from exogenous constructs (j) to endogenous constructs (h) are denoted by the symbol g (gamma), as shown in Figure 27.5. Parameters representing rela-tionships from endogenous constructs to endogenous constructs are denoted by the sym-bol b (beta).
If the measurement model is identified, then the structural model is too, provided that it is recursive in that there are no feedback loops or dual dependencies and, in addition, there are no interaction terms. In such cases, generally the structural model is nested within the meas-urement model and contains fewer estimated parameters. A model is nested within another model if it has the same number of constructs and variables and can be derived from the other model by altering relationships, such as by adding or deleting relationships. Dual dependencies exist when C1 and C2 are mutually dependent on each other, and models con-taining such relationships are referred to as non-recursive.
In specifying the structural model, it is desirable also to estimate the factor loadings and the error variances, along with the structural parameters. These standardised estimates from the structural model can then be compared with the corresponding estimates from the meas-urement model to identify any inconsistencies (differences larger than 0.05). This approach also allows us to use the measurement model fit as a basis for evaluating the fit of the struc-tural model. An alternative approach, which uses the estimates of factor loadings and error variances obtained in the measurement model as fixed parameters in the structural model, is not recommended. The reason is that the change in fit between the measurement model and the structural model may be due to problems with the measurement theory instead of prob-lems with the structural theory.
Assess structural model validity
Assessing the validity of the structural model involves: (1) examining the fit; (2) comparing the proposed structural model with competing models; and (3) testing structural relationships and hypotheses:
1 Assessing fit. The fit of a structural model is examined along the same lines as that for the measurement model discussed earlier. As explained, in general a recursive structural model has fewer relationships than a measurement model from which it is derived. At most, the number of relationships in a structural model can equal those in a measurement model. This means that comparatively fewer parameters are estimated in the structural model. Therefore the value of x2 in a recursive structural model cannot be lower than that in the corresponding measurement model. In other words, a recursive structural model cannot have a better fit. Thus, the fit of the measurement model provides an upper bound to the goodness of fit of a structural model. The closer the fit of a structural model is to the fit of a measurement model, the better. The other statistics and guidelines for assessing the fit of a structural model are similar to those discussed earlier for the measurement model, and the same fit indices are used.
2 Comparison with competing models. In addition to having a structural model with a good fit, it is good practice to show that the proposed model has a better fit than competing models that might be considered as alternatives. A good fit does not prove that the

812 Marketing Research
proposed theory or structural model best explains the sample data (covariance matrix). An alternative model may produce the same or even a better fit. Thus, a good fit does not prove that the proposed structural model is the only true explanation. Our confidence in the proposed model can be enhanced by comparing it with competing models. The pro-posed model (M1) and the competing model (M2) can be compared in terms of differ-ences in x2, incremental or parsimony fit indices (see Figure 27.4).
When the models are nested, the comparison can be done by assessing the chi-square difference statistic (Δx2). From the value of x2 for the proposed model, M1, the x2 value for a lesser constrained model, M2, is subtracted. For example, M2 can have additional paths compared with M1. The degrees of freedom for the x2 difference are also deter-mined as the difference in the degrees of freedom for M1 and M2.16 The equations involved may be represented as:
∆ ∆ = 2(M1) – (M2)
x2x 2xdf df df
and
∆ = (M1) – (M2)df df df
The difference of two chi-square distribution values also has a chi-square distribution. Therefore, we can test whether the difference Δx2 with Δdf degrees of freedom is statisti-cally significant. This procedure can also be used to test the significance of the difference in the fits of the structural and measurement models. The structural model is more con-strained than the measurement model and is nested within it. If the fit of the structural model is significantly and substantially worse than the fit of the measurement model, then the validity of the structural theory is questionable. On the other hand, if the fit of the structural model is not significantly worse than the fit of the measurement model, then there is evidence for the validity of the structural theory.
3 Testing hypothesised relationships. In SEM, theoretical relationships are generally trans-formed into hypotheses that can be empirically tested. The structural theory is considered to be valid to the extent that these hypotheses are supported in the SEM analysis. The esti-mated parameter for a hypothesised relationship should be statistically significant and have the correct sign. You should also examine the variance-explained estimates for the endog-enous constructs, and analysis that is similar to h2 in analysis of variance (Chapter 21) or R2 in multiple regression (Chapter 22). If SEM is being used to examine the nomologi-cal validity of a newly developed scale, then the hypotheses are replaced by known rela-tionships that are empirically investigated to provide support for nomological validity.
Structural model diagnostics
The model diagnostics for the structural model are the same as for the measurement model. Thus, this examination is similar to that of the measurement model. Based on the model diagnostics, additional analysis may be conducted. For example, one or more additional paths may be specified that were not hypothesised by the original theory. However, it should be emphasised that any relationships that result based upon the modifications do not have theoretical support and should not be treated in the same way as the original relationships based on structural theory. The relationships based on modifications should be theoretically meaningful and should be validated by testing the modified model on new data.
Draw conclusions and make recommendations
If the assessment of the measurement model and the structural model indicates satisfactory validity, then we can arrive at conclusions and, if appropriate, make recommendations to decision makers. The conclusions can be reached regarding the measurement of key constructs based on CFA. For example, it may be concluded that a newly developed scale

813Chapter 27 Structural equation modelling and path analysis
has satisfactory reliability and validity and should be used in further research. Conclusions can be arrived at based on tests of hypotheses in the structural model. It may be concluded that relationships with significant and meaningful estimated structural parameters are sup-ported. The theoretical, managerial and decision-based implications of the relationships can be discussed. Appropriate recommendations to decision makers may be made based upon what are perceived to be the managerial implications.17
Higher-order CFA
The measurement model presented in Figure 27.3 is a first-order factor model. A first-order factor model is one in which the covariates between the observed variables (X) are explained by a single level or layer of latent constructs. In contrast, a higher-order factor model contains two or more levels or layers of latent constructs. The most common higher-order model is a second-order factor model in which there are two levels or layers. In such models, a second-order latent construct causes multiple first-order latent constructs, which in turn cause the observed variables. Thus, the first-order constructs now act as indicators or observed varia-bles for the second-order factor. The differences between a first-order and a second-order measurement model are illustrated in Figure 27.6 and Figure 27.7 respectively. These figures describe the representation of a scale to measure internet users’ information privacy concern (IUIPC). IUIPC has three dimensions – collection (COL), control (CON) and awareness (AWA) – measured by four, three and three observed variables, respectively. Note that the covariances between the three latent constructs, COL, CON and AWA, are freely estimated in the first-order model, as shown by the two-headed curved arrows. On the other hand, the second-order model accounts for these covariances by specifying another higher-order con-struct (IUIPC), which causes the first-order constructs (COL, CON and AWA).
Figure 27.6
First-order model of IUIPC
X9 X10X8
AWA
X6 X7X5
CON
f2,1
f3,1
f3,2
X3X1 X4X2
COL
Figure 27.7
Second-order model of IUIPC
X9 X10X8
AWA
X6 X7X5
CON
IUIPCLayer 2
Layer 1
X3X1 X4
X1,1 X2,1X3,1
X2
COL

814 Marketing Research
When we move from the measurement model to the structural model, a structural relation-ship between information privacy concern and another latent construct, such as trust (TRU), will be represented by multiple paths in a first-order model (COLSTRU, CONSTRU, AWASTRU). However, in the second-order model it will be represented by a single path (IUIPCSTRU). Thus, a second-order model assumes that all the first-order dimensions (COL, CON and AWA) will affect the other theoretically related latent constructs (e.g. TRU) in the same way. If this assumption is not reasonable, then the first-order factor model is preferred.
If there are four or more first-order constructs, a second-order model is more parsimoni-ous as it uses fewer paths than a first-order model. However, it is not necessarily simpler because it involves a higher level of abstraction. We emphasise that the choice between a first-order and a second-order factor model should be made based upon theory.
Relationship of SEM to other multivariate techniques
SEM is a multivariate technique because there are multiple variables that are analysed simul-taneously (see Chapter 19). Exogenous constructs are used to predict endogenous constructs. In this vein, SEM is a dependence technique (Chapter 19) that is similar to other multivariate dependence techniques, such as multiple regression (Chapter 22). The equation for each endogenous construct can be written in a form similar to a multiple regression equation. The endogenous construct is the dependent variable and the constructs with arrows pointing to the endogenous construct are the independent variables. However, there are two major dif-ferences. One is that the dependent construct in one relationship may become the independ-ent construct in another relationship. The other is that all of the equations are estimated simultaneously. Using the same reasoning, when categorical variables are used in SEM, one can see its similarity to MANOVA (Chapter 21). (See also Chapter 22 on the similarity of analysis of variance and covariance to regression.)
The measurement model in SEM is similar to factor analysis (Chapter 24), in that both techniques have variables with loadings on factors. Concepts such as correlations and covar-iances are also common to both techniques. However, there is also a major difference. In SEM we have to specify, based upon theory, which variables are associated with each con-struct. Thus SEM requires the specification of the measurement model. The loadings are estimated only for these specified relationships; all other loadings are assumed to be zero. The estimation then serves as a test of the measurement theory. In this sense, then, SEM is a confirmatory technique. As noted earlier, the technique to estimate the measurement model is called confirmatory factor analysis (CFA). In contrast, factor analysis (as discussed in Chapter 24) is an exploratory technique, often called exploratory factor analysis (EFA). EFA identifies underlying dimensions or factors that explain the correlations among a set of variables. Every variable has a loading on every factor extracted and these loadings are con-tained in the factor matrix (see Chapter 24). Thus, EFA does not require specification; rather, the underlying structure is revealed by the data. EFA results can be useful in developing theory that leads to a proposed measurement model that can be tested using CFA.18 When SEM is used to test a structural theory, the analysis is analogous to performing factor analy-sis and a series of multiple regression analyses in one step.
Application of SEM: first-order factor model
We give an application of SEM in the context of the technology acceptance model (TAM). TAM is a well-established model that has been used to predict individuals’ reactions to an information technology application.19 In essence, this model holds that one’s intention to use a technology application (INT) is determined by two factors, namely perceived usefulness

815Chapter 27 Structural equation modelling and path analysis
(PU) and perceived ease of use (PE). Perceived usefulness refers to the degree to which the person finds it useful to use the technology application, whereas perceived ease of use is defined as the degree to which the person finds it easy to use the technology application. This theoretical framework was applied to explain university students’ use of an educational por-tal in a certain university. To collect data, an online survey was administered to a sample of students. A total of 253 completed questionnaires were analysed on questions related to the use of a web portal on campus. In the following, we illustrate how the various steps involved in SEM, presented in Figure 27.2, were carried out.
Define the individual constructs
In an attempt to assess measurement errors, each research latent construct was measured by multiple observed variables or items. The items were measured on seven-point scales anchored with ‘strongly disagree’ (1) and ‘strongly agree’ (2). Perceived usefulness was measured by three items. The items were ‘Using this (website) increases my performance’ (PU1), ‘Using this (website) improves my productivity’ (PU2) and ‘Using this (website) enhances my effectiveness’ (PU3). Perceived ease of use consisted of three items. The items were ‘This (website) is easy to use’ (PE1), ‘It is easy to become skilful using this (website)’ (PE2) and ‘Learning to operate this (website) is easy’ (PE3). Intention to use was measured by the following three items: ‘I plan to use this (website) in the next 3 months’ (INT1), ‘I predict that I would use this (website) in the next 3 months’ (INT2) and ‘I intend to use this (website) in the next 3 months’ (INT3). Table 27.1 shows the means, standard deviations and correlations of the nine variables based on the collected data.
Table 27.1
Correlations matrix
ME SD 1 2 3 4 5 6 7 8 9
1 PU1 3.58 1.37 12 PU2 3.58 1.37 0.900* 13 PU3 3.58 1.36 0.886* 0.941* 14 PE1 4.70 1.35 0.357* 0.403* 0.392* 15 PE2 4.76 1.34 0.350* 0.374* 0.393* 0.845* 16 PE3 4.79 1.32 0.340* 0.356* 0.348* 0.846* 0.926* 17 INT1 3.72 2.10 0.520* 0.545* 0.532* 0.442* 0.419* 0.425* 18 INT2 3.84 2.12 0.513* 0.537* 0.540* 0.456* 0.433* 0.432* 0.958* 19 INT3 3.68 2.08 0.534* 0.557* 0.559* 0.461* 0.448* 0.437* 0.959* 0.950* 1
*p < 0.5. ME = means, SD = standard deviations.
TAM model: means, standard deviations and correlations
Specify the measurement model
The estimates of structural relationships are likely to be biased unless the measurement instrument is reliable and valid. In this case, the measurement model is specified in such a way that the three factors are allowed to correlate with each other, and each of the three fac-tors is associated with the designated three items but not with the other items. Figure 27.8 depicts the resulting measurement model. The result of data analysis produces model fit as well as various parameter estimates, such as item loadings, item measurement errors and factor correlations.

816 Marketing Research
Assess measurement model reliability and validity
A three-factor measurement model was set up to validate the scales, and CFA was conducted to test the measurement model. The fit of the model was evaluated based on three different fit indices: comparative fit index (CFI), goodness-of-fit index (GFI) and root mean square error of approximation (RMSEA). The results of CFA indicated that the model fits the data quite well (x2 = 43.32, p < 0.01, given that df = 24); specifically CFI was found to be 0.99, GFI was 0.96 and RMSEA was 0.057.
In addition to model–data fit, other psychometric properties of the scales, such as com-posite reliability and validity, were examined. As shown in Table 27.2, in terms of composite reliability (CR), the scales exceed the recommended cut-off value of 0.70; thus it is reason-able to conclude that the scales are reliable. In terms of AVE, all the values were greater than 0.50. Furthermore, Table 27.2 shows that each of the item loadings is greater than 0.80, which provides empirical support for the convergent validity of the scales.
The estimates of correlations and their standard deviations indicated that the scales are empirically distinct from each other. Formally, the square root of the average variance extracted is larger than the correlation coefficients, indicating discriminant validity of the scales. Overall, the measurement model was believed to be appropriate given the evidence of good model fit, reliability, convergent validity and discriminant validity.
Figure 27.8
Measurement model for TAM
INT2 INT3INT1
INT
PE2 PE3PE1
CON
f2,1
f3,1
f3,2
PU3PU1 PU4PU2
PU
Table 27.2
Constructs Items Item loadings Item errors CR AVE
PU 0.97 0.91PU1 0.92*** 0.15***PU2 0.98*** 0.05***PU3 0.96*** 0.07***
PE 0.95 0.87PE1 0.88*** 0.23***PE2 0.96*** 0.07***PE3 0.96*** 0.08***
INT 0.98 0.95INT1 0.98*** 0.03***INT2 0.97*** 0.05***INT3 0.98*** 0.05***
***p < 0.001 (two tailed). CR = composite reliability; AVE = average variance extracted.
TAM model: results of measurement model

817Chapter 27 Structural equation modelling and path analysis
Assess structural model validity
The results of data analysis are shown in Figure 27.9. First, as with the case of the measure-ment model, the proposed model was found to fit the data satisfactorily as the fit values were well within acceptable ranges (x2(24) = 43.32, p < 0.01, CFI = 0.99, GFI = 0.96 and RMSEA = 0.057). According to TAM, perceived usefulness and perceived ease of use are the significant predictors of intention to use. As shown in Figure 27.9, perceived usefulness is significant in determining intention to use (path estimate = 0.46, p < 0.001). Similarly, per-ceived ease of use is found to have a significant effect on intention to use (path estimate = 0.28, p < 0.001). The squared multiple correlation (SMC) coefficient for intention to use is 0.40, which indicates that the two predictors, i.e. perceived usefulness and perceived ease of use, together explained 40% of the variance on intention to use.
Conclusions and recommendations
Overall, the results of TAM indicate that it is a reasonable representation of individuals’ reactions to a web portal in a university setting. In order to increase the use of the portal by the students, this university should enhance the perceived usefulness and perceived ease of use of the website. Perceived usefulness could be increased by adding features, such as checking email, weather, current events on the campus, schedule of classes, etc., that the students find useful and check frequently. Perceived ease of use could be enhanced by making the website easy to navigate.
Specify the structural model
The structural model was specified based upon TAM theory, as shown in Figure 27.9.
Figure 27.9
Structural model for TAM
Perceivedusefulness
(PU)
Intention to use(INT)
0.60
0.46
0.28
0.40
Perceivedease of use
(PE)
Application of SEM: second-order factor model
We give an illustrative application of SEM in the context of personal banking services. The data were collected through face-to-face interviews. The sample size selected for this analy-sis was based upon 250 participants. The data set used in this analysis can be downloaded from the website for this book. In the following, we illustrate how the various steps involved in SEM presented in Figure 27.2 were carried out.
Define the individual constructs
The purpose of this study was to predict bank patronage intent based upon service quality. The theory developed was based on past research in which ‘service quality’ was conceptualised

818 Marketing Research
as having five dimensions.20 The theory postulated that service quality would influence ser-vice attitude and service satisfaction, and the latter two constructs would then influence patronage intent. Thus, in our data set, we have eight constructs and 30 indicators, with each construct having multiple indicator variables. These are the five service quality dimensions: tangibility (4 indicators), reliability (4 indicators), responsiveness (3 indicators), assurance (4 indicators) and empathy (4 indicators), and the three outcome constructs of attitude (4 indicators), satisfaction (4 indicators) and patronage intention (3 indicators). These indica-tors are contained in Table 27.3. Each indicator of the dimensions was measured using a nine-point scale. For example, indicator 1 was ‘When it comes to modern equipment (tangibles), my perception of my bank’s service performance’ is:
Low 1__2__3__4__5__6__7__8__9 High
To measure global attitude, we used four indicators on a seven-point scale: favourable–unfavourable, good–bad, positive–negative and pleasant–unpleasant. All attitude indica-tors were reverse coded for analysis. To measure overall satisfaction, we used the following four indicators using a nine-point scale: ‘I believe I am satisfied with my bank’s services’ (strongly disagree–strongly agree); ‘Overall I am pleased with my bank’s services’ (strongly disagree–strongly agree); ‘Using services from my bank is usually a satisfying experience’ (strongly disagree–strongly agree); and ‘My feelings towards my bank’s ser-vices can best be characterised as’ (very dissatisfied–very satisfied). We used three indica-tors to measure patronage using a nine-point scale: ‘The next time my friend needs the services of a bank I will recommend my bank’ (strongly disagree–strongly agree); ‘I have no regrets for having patronised my bank in the past’ (strongly disagree–strongly agree); and ‘I will continue to patronise the services of my bank in the future’ (strongly disagree–strongly agree).
Specify the measurement model
We first test the measurement model in order to validate the psychometric proper-ties of our measures. In our example, because prior research has already estab-lished the reliability and validity of the five-component service quality construct, we test for the measurement properties in our sam-ple using a confirmatory mode. In testing for the measurement model, we freely correlate the eight constructs and fix the factor load-ing of one indicator per construct to a value of unity. All measured indicators are allowed to load on only one construct each, and the error terms are not allowed to correlate with each other. The measurement model is described in Figure 27.10.
Assess measurement model reliability and validity
Our measurement model (n = 250) yields the following model fit results: x2 (df = 377) = 767.77; RMSEA = 0.064; SRMR = 0.041; NNFI = 0.94; and CFI = 0.95 (see Table 27.4). Notice that the program computes the degrees of freedom (df = 377) by using the formula df = (1/2)[p(p + 1)] – k, where p is the total number of observed variables and k is the number of estimated parameters. Since p = 30 and k = 88 (i.e., number of loadings (= 22), measure-ment errors (= 30), factor covariance (= 28) and variances (= 8) estimated by the program), df = (1/2)[30(30 + 1)] – 88, which equals 377. NNFI is computed using the formula NNFI = (x2
null /dfnull – x2prop /dfprop)/[(x2
null /dfnull) – 1], where dfprop and dfnull are degrees of freedom for the proposed and the null models respectively. The null model x2
null equals 7780.15 with

819Chapter 27 Structural equation modelling and path analysis
df = 435 and the proposed model (xprop) equals 767.77 with df = 377. NNFI = (7780.15/435 − 767.77/377)/[(7780.15/435) − 1], which equals 0.939 or approximately 0.94. CFI = 1 – (x2
prop – dfprop)/(x2null – dfnull) computes to 1 − (767.77 − 377)/(7780.15 − 435), which
equals 0.947 or approximately 0.95. Similarly for RMSEA, √[x2/df – 1)/(n – 1)] can be com-puted as √[(767.77/377 – 1)/(250 – 1)], which equals 0.064. Based on our previous discussion of model fit criteria, these fit indices collectively indicate that overall fit of the measurement model is acceptable and that the researcher needs now to test for reliability and validity.
Table 27.3
When it comes to… Loadings
TANG1: Modern equipment 0.71
TANG2: Visual appeal of physical facilities 0.80
TANG3: Neat professional appearance of employees 0.76
TANG4: Visual appeal of materials associated with the service 0.72
REL1: Keeping a promise by a certain time 0.79
REL2: Performing service right the first time 0.83
REL3: Providing service at the promised time 0.91
REL4: Telling customers the exact time the service will be delivered 0.81
RESP1: Giving prompt service to customers 0.73
RESP2: Willingness to always help customers 0.89
RESP3: Responding to customer requests despite being busy 0.81
ASSU1: Employees instilling confidence in customers 0.81
ASSU2: Customers’ safety feelings in transactions (e.g. physical, financial, emotional, etc.) 0.71
ASSU3: Consistent courtesy to customers 0.80
ASSU4: Employees’ knowledge to answer customer questions 0.86
EMP1: Giving customers individual attention 0.80
EMP2: Dealing with customers with care 0.84
EMP3: Having customer’s best interests at heart 0.87
EMP4: Understanding specific needs of customers 0.87
Overall attitude towards your bank (items reverse coded)ATT1: Favourable 1___2___3___4___5___6___7 Unfavourable 0.95
ATT2: Good 1___2___3___4___5___6___7 Bad 0.95
ATT3: Positive 1___2___3___4___5___6___7 Negative 0.95
ATT4: Pleasant 1___2___3___4___5___6___7 Unpleasant 0.95
SAT1: I believe I am satisfied with my bank’s services 0.93
SAT2: Overall I am pleased with my bank’s services 0.93
SAT3: Using services from my bank is usually a satisfying experience 0.88
SAT4: My feelings towards my bank’s services can best be characterised as 0.92
PAT1: The next time my friend needs the services of a bank I will recommend my bank 0.88PAT2: I have no regrets of having patronised my bank in the past 0.89
PAT3: I will continue to patronise the services of my bank in the future 0.88
Service quality model: psychometric properties of measurement model

820 Marketing Research
Measurement model for banking applicationFigure 27.10
X3X1 X4X2
TANGz1
d3 d4d2d1
X7X5 X8X6
RELz2
d7 d8d6d5
X10 X11X9
RESPz3
d10 d11d9
X29 X30X28
PATz8
d29 d30d28
X14X12 X15X13
ASSUz4
d14 d15d13d12
X18X16 X19X17
EMPz5
d18 d19d17d16
X22X20 X23X21
ATTz6
d22 d23d21d20
X26X24 X27X25
SATz7
d26 d27d25d24
Table 27.4
Degrees of freedom = 377
Minimum fit function chi-square = 767.77 (p = 0.0)Chi-square for independence model with 435 degrees of freedom = 7780.15Root mean square error of approximation (RMSEA) = 0.064Standardised RMR = 0.041Normed fit index (NFI) = 0.90Non-normed fit index (NNFI) = 0.94
Comparative fit index (CFI) = 0.95
Goodness-of-fit statistics (measurement model)
Reliability and validity tests
The main purpose of the measurement model is to assess and verify that the indicators or scale items used for each construct are both reliable and valid. We first conduct a test of reli-ability by examining the composite reliability. The factor loadings and the measurement error for all indicator variables are presented in Table 27.3. For example, the composite reli-ability for tangibility is [(0.71 + 0.80 + 0.76 + 0.72)2]/[(0.71 + 0.80 + 0.76 + 0.72)2 + (0.49 + 0.36 + 0.42 + 0.48)], which equals 8.94/10.69 = 0.84. AVE reflects the overall variance in the indicators accounted for by the latent construct. For the tangibility dimension, AVE is [(0.712 + 0.802 + 0.762 + 0.722)]/[(0.712 + 0.802 + 0.762 + 0.722) + (0.49 + 0.36 + 0.42 + 0.48)], which equals 2.24/3.99 = 0.56. Values of CR and AVE for each measurement are shown in Table 27.5. All constructs exceed the critical levels of 0.70 and 0.50 for CR and AVE respectively. This establishes the reliability and convergent validity of the measure-ment scales in our study.
Convergent validity is further established if all item loadings are equal to or above the recommended cut-off level of 0.70. In our sample, of a total of 30 items in the measurement model, 8 items had loadings ≥ 0.90, 16 items with loadings in the range ≥0.80 to <0.90, and 6 items with loadings in the range ≥0.70 to <0.80 (see Table 27.3). All the factor loadings

821Chapter 27 Structural equation modelling and path analysis
were statistically significant at the p < 0.05 level. Thus the data in our study support conver-gent validity of the model. Discriminant validity is achieved if the square root of the AVE is larger than the correlation coefficients. In our study, we found all of the correlation estimates met the criterion except in 4 out of the 28 cases. Given that the five dimensions measure dif-ferent aspects of service quality, some degree of intercorrelation can be expected. However, given the size of the correlation matrix (i.e. 28 estimates), some violations can occur through chance. The test for discriminant validity is shown in Table 27.5. Values on the diagonal of the correlation matrix represent the square root of the AVE. For example, to test for discrimi-nant validity between tangibility and responsiveness, we compare the correlation between tangibility and responsiveness with their respective square root of the AVE. So, the square roots of the AVE for the tangible and responsiveness dimensions are 0.75 and 0.81, and both are greater than their correlation of 0.65. In summary, and overall, the scale items were both reliable and valid for testing the structural model.
Specify the structural model
Based upon theoretical considerations, we hypothesised perceived service quality as a higher-order construct consisting of five dimensions of tangibility (TANG), reliability (REL), respon-siveness (RESP), assurance (ASSU) and empathy (EMP). Specifically we model service quality as a second-order model with first-order dimensions of TANG, REL, RESP, ASSU and EMP. In other words, these five dimensions are indicators of service quality and therefore the arrows flow out from service quality to the five dimensions (see Figure 27.11). On the right-hand side of Figure 27.11 we link second-order service quality with attitude towards service (ATT) and satisfaction with service (SAT). The latter two constructs are linked to patronage intention (PAT). The entire structural model (i.e. eight constructs) is tested simultaneously, as shown in Figure 27.11. In testing for the structural model, we free the structural linkages and fix the factor loading of one indicator per construct to the value of unity. All measured items are allowed to load on only one construct each, and the error terms are not allowed to correlate with each other. We also fix the second-order loading of one dimension (i.e. tangibility) to unity for scaling purposes. While the measurement model tests for reliability and validity of the measures, the structural model tests for the structural relations in the model.
Table 27.5
Correlations matrix
Construct Construct reliability
Average variance extracted
1 2 3 4 5 6 7 8
1 TANG 0.84 0.56 0.752 REL 0.90 0.70 0.77 0.84
3 RESP 0.85 0.66 0.65 0.76 0.81
4 ASSU 0.87 0.63 0.73 0.80 0.92 0.80
5 EMP 0.91 0.71 0.69 0.75 0.85 0.90 0.85
6 ATT 0.97 0.90 0.42 0.46 0.52 0.54 0.58 0.95
7 SAT 0.85 0.83 0.53 0.56 0.66 0.67 0.69 0.72 0.91
8 PAT 0.92 0.78 0.50 0.55 0.57 0.62 0.62 0.66 0.89 0.89
TANG = Tangibility, REL = Reliability, RESP = Responsiveness, ASSU = Assurance, EMP = Empathy, ATT = Attitude, SAT = Satisfaction, PAT = Patronage.Value on the diagonal of the correlation matrix is the square root of AVE.
Measurement model: construct reliability, average variance extracted and correlation matrix

822 Marketing Research
Assess structural model validity
We estimated the structural model with the same sample (n = 250) yielding the following model fit results: x2(df = 396) = 817.16; RMSEA = 0.065; SRMR = 0.096; NNFI = 0.94; and CFI = 0.94 (see Table 27.6). These fit indices were computed using the formulae given earlier. For example, CFI = 1 – (x2
prop – dfprop)/(x2null – dfnull) computes to 1 –
(817.16 − 396)/(7780.15 − 435) which equals to 0.943 or approximately 0.94. Similarly RMSEA = √[(x2/df – 1)/(n – 1)] can be computed as √[(817.16/396 – 1)/(250 – 1)] which equals 0.065. Both CFI and NNFI are ≥0.90 and RMSEA and SRMR are ≤0.08. Collec-tively these fit indices indicate that the structural model is acceptable. That is, the second-order perceived service quality model is robust and theoretically explains the constructs of attitude, satisfaction and patronage intention. The structural coefficients linking the five dimensions with second-order service quality (i.e. the second-order load-ings) were all significant and in the expected direction. Table 27.7 contains the structural coefficients with corresponding t values. For example, the loading for tangibility is 0.82, which indicates that service quality explains 67% (= (0.82)2) of the variance in tangibil-ity. Similarly, the loading for reliability is 0.85, which indicates that service quality explains 72% (= (0.85)2) of the variance in reliability. On the right-hand side of the figure, the coef-ficient for SQSATT is 0.60, for SQSSAT is 0.45, for ATTSSAT is 0.47, for ATTSPAT is 0.03, and SATSPAT is 0.88. All these links are significant at p < 0.005, except for ATTSPAT.
Figure 27.11
Structure model for banking application
Serviceattitude(ATT)
Servicesatisfaction
(SAT)
Servicequality(SQ)
RESP
ASSU
EMP
REL
TANG
Patronageintention(PAT)
Table 27.6
Degrees of freedom = 396
Minimum fit function chi-square = 817.16 (p = 0.0)
Chi-square for independence model with 435 degrees of freedom = 7780.15
Root mean square error of approximation (RMSEA) = 0.065
Standardised RMR = 0.096
Normed fit index (NFI) = 0.89
Non-normed fit index (NNFI) = 0.94
Comparative fit index (CFI) = 0.94
Goodness-of-fit statistics (structural model)

823Chapter 27 Structural equation modelling and path analysis
Draw conclusions and make recommendations
The magnitude and significance of the loading estimates indicate that all of the five dimen-sions of service quality are relevant in predicting service attitude and service satisfaction. Moreover, service quality has a significant impact on both service attitude and service satis-faction as the structural coefficients for these paths are significant. Service satisfaction, in turn, has a significant impact upon patronage intent. Service attitude does not directly impact upon patronage intent; rather it has only an indirect effect through service satisfaction.
If the sample was representative of the target population, we could cautiously suggest the following marketing implications to the management of a bank. All the dimensions of ser-vice quality are relevant and should be emphasised. Marketing campaigns should be crafted to enhance customers’ perceptions of tangibility, reliability, responsiveness, assurance and empathy. The indicators for each service quality dimension suggest how that dimension should be affected by management action. Also, customer satisfaction with banking services is important in influencing patronage intent. Therefore the bank should conduct customer satisfaction surveys at regular intervals, e.g. quarterly. This will help the bank to monitor customer satisfaction and take appropriate actions as needed to ensure that a high level of satisfaction is maintained.
Table 27.7
Dimensions of service quality Second-order loading estimates
t values
TANG g11 0.82 l fixed to 1REL g21 0.85 13.15
RESP g31 0.93 13.37ASSU g41 0.98 16.45EMP g51 0.93 15.18
Consequences of service quality Structural coefficient estimates
SQSATT g61 0.60 10.25
SQSSAT g71 0.45 8.25
ATTSSAT β760.47 8.91
ATTSPAT β860.03 0.48
SATSPAT β870.88 13.75
Structural model coefficients
Path analysis
Path analysis (PA) can be viewed as a special case of SEM. We could think of PA as SEM with only single indicators for each of the variables in the causal model. In other words, PA is SEM with a structural model, but no measurement model. Other terms used to refer to PA include causal modelling, analysis of covariance structure and latent variable models.21 PA may also be viewed as an extension of the regression model. The PA model is depicted in a rectangle-and-arrow figure in which single-headed arrows indicate causation. A regres-sion is done for each variable in the model as dependent on others, which the model indicates are causes. The regression weights estimated by the model are compared with the observed correlation matrix for the variables, and a goodness-of-fit statistic is calculated. PA calculates

824 Marketing Research
the strength of each relationship using only a correlation or covariance matrix as input. We illustrate PA with an example.
Illustrative example of PA
Suppose we observe the following correlation matrix between three variables Y1, X1 and X2:
X1
X2
Y1
X1
1X
20.40 1
Y1
0.50 0.60 1
The first step is to construct a path diagram, as in Figure 27.12. This is similar to that done in SEM for the structural model and should be specified by the researcher based on theory. Figure 27.12 portrays a simple model with two exogenous constructs, X1 and X2, both caus-ally related to the endogenous construct Y1. The correlational path A is X1 correlated with X2. Path B is the effect of X1 predicting Y1, and path C shows the effect of X2 predicting Y1. The value for Y1 can be modelled as:
Y1 = b
1X
1+ b
2X
2
Note that this is similar to a regression equation. The direct and indirect paths in our model can now be identified:
Direct paths Indirect paths
A = X1 to X2 AC = X1 to Y1 (via X2)B = X1 to Y1 AB = X2 to Y1 (via X1)C = X2 to Y1
In PA, the simple or bivariate correlation between two variables is decomposed into the sum of the direct and indirect paths connecting these variables. In our illustrative example, the unique correlations among the three constructs can be shown to be composed of direct and indirect paths, as follows:
Corrx1x2
= ACorr
x1y1= B + AC
Corrx2y1
= C + AB
The correlation of X1 and X2 is simply equal to A. The correlation of X1 and Y1 (Corrx1,y1) can be represented by two paths: B and AC. B represents the direct path from X1 to Y1. AC is a compound path that follows the curved arrow from X1 to X2 and then to Y1. Similarly, the correlation of X2 and Y1 can be shown to consist of two causal paths: C and AB. Given our observed correlation matrix, these equations can become:
Figure 27.12
Diagram for PA
Y1Purchase intention
X1Attitude
X2Emotion
B
C
A

825Chapter 27 Structural equation modelling and path analysis
0.40 = A 0.50 = B + AC 0.60 = C + AB Substituting A = 0.40 0.50 = B + 0.40C 0.60 = C + 0.40B Solving for B and C B = 0.310 C = 0.476
The paths represent either correlational estimates or causal relationships between constructs, and their interpretation is similar to that in SEM. SEM is used widely in marketing research, as further illustrated in the following two examples. The first example illustrates an application of SEM in the context of international marketing research. The second example shows how SEM can be used in researching the relationships among values, ideology and ethical beliefs.
Real research The path to international success22
A study sought to explain the internationalisation of professional service firms. The under-lying theoretical framework was based upon attribution theory. The structural model pos-ited that three causal constructs or factors (i.e. uniqueness of offering, financial resources and competitive pricing) influenced cognitive social consequences (i.e. expectations of success) and the resulting behavioural consequence (i.e. international success). The model is shown below. The data were obtained from a sample of 152 USA-based professional service firms via a postal survey. First, a measurement model was specified and estimated using confirmatory factor analysis. The results showed acceptable composite reliability and convergent and discriminant validity. Then, the structural model was estimated and found to be valid. The results of the structural model provided support for all the four hypotheses (H1 to H4), thereby providing support for the attribution theory framework. Several mana-gerial implications were drawn. For example, the influence of cognitive psychological con-sequence on behavioural consequence means that managers who expect international success tend to be successful. Hence, professional service firms wishing to make greater inroads into international markets may wish to search out and promote such managers.
Attribution model of internationalisation of professional service firms
H4: +
Uniquenessof o�ering
j1
Causal factors
Financialresources
j2
Expectationsof success
h1
Internationalsuccess
h1
Cognitive psychologicalconsequence
Behaviouralconsequence
H2: +
H1: –
H3: +Competitive
pricingj3

826 Marketing Research
Real research Personal values, ethical ideology and ethical beliefs23
The relationships among an individual’s personal values, ethical ideology and ethical beliefs were investigated using structural equation modelling. The data were collected in an online survey based upon a final sample size of 609 participants. First, a measurement model was tested for key validity dimensions. Then the hypothesised causal relation-ships were examined in several path models. The results indicated that individual differ-ences in values directly and indirectly (through idealism) influence the judgement of ethically questionable consumer practices. The findings not only contributed to the theoretical understanding of ethical decision making, but also had managerial implica-tions. For example, understanding what underlies consumers’ unethical attitudes and behaviour would enable retailers to influence appropriate behaviour positively by appealing to personal values. This could result in a reduction of unethical behaviours, such as shoplifting.
Software to support SEM
Several computer programs are available for SEM. The most widely used programs include LISREL (www.ssicentral.com/lisrel/) and Amos (www.ibm.com/software/products/en/ spss-amos). LISREL, an acronym for LInear Structural RELations, is a flexible but powerful program that can be used in a range of SEM applications normally encountered in marketing research. Amos (Analysis of Moment Structures) is an alternative software that has a visual ‘point and click’ interface that is often found to be a more user-friendly program than LISREL. While LISREL is widely use within academic research, Amos may be more appro-priate for those new to SEM. Although a standalone piece of software, Amos is closely related with SPSS (IBM has rebranded it SPSS Amos), and if you are familiar with SPSS then Amos will also be more straightforward to get up to speed with.
One challenge that faces users of software such as Amos and LISREL within commercial marketing research is the cost of the software, which can be prohibitive in commercial envi-ronments (even though the software may be low cost or free for student use). Another chal-lenge is that the most recent versions are only available for use on computers running Windows operating systems, not on Mac operating Systems. As a result there has been a growth in the use of open source (and free!) software, such as OpenMx (openmx.psyc.virginia.edu) that integrates with R (www.r-project.org). While tools such as OpenMx and R are both powerful and flexible, they have a very steep learning curve compared to commercial tools.
SEM is an advanced technique within marketing research but there is a wide range of additional information, including examples and guides, available on the internet for those wishing to learn more about using software to carry out SEM.
Summary Structural equation modelling (SEM) is a procedure for estimating a series of depend-ence relationships among a set of concepts or constructs represented by multiple meas-ured variables and incorporated into an integrated model. SEM is mainly used as a confirmatory rather than exploratory technique.
It is very important that an SEM model be based on theory, because all relationships must be specified before the SEM model can be estimated. A construct is an

827Chapter 27 Structural equation modelling and path analysis
unobservable or latent variable that can be defined in conceptual terms but cannot be measured directly. Rather, a construct is measured approximately and indirectly by examining the consistency among multiple observed or measured variables. It is rec-ognised that each construct be measured by using at least three observed variables. The steps involved in conducting SEM are: (1) define the individual constructs; (2) specify the measurement model; (3) assess measurement model validity; (4) specify the structural model if the measurement model is valid; (5) assess structural model validity; and (6) draw conclusions and make recommendations if the structural model is valid.
Within SEM analyses covariance, model fit is determined by comparing how closely the estimated covariance matrix, ∑k, matches the observed covariance matrix, S, i.e. the fit statistics are based on |S − ∑k|. The various measures designed to assess fit con-sist of absolute fit, incremental fit and parsimony fit indices. In absolute fit indices, each model is evaluated independently of other possible models. In contrast to the absolute fit indices, the incremental fit indices evaluate how well the specified model fits the sample data relative to some alternative model that is treated as a baseline model. The baseline model that is commonly used is the null model, which is based on the assumption that the observed variables are uncorrelated. The parsimony fit indices are designed to assess fit in relation to model complexity and are useful in evaluating competing models. These indices are based on the parsimony ratio that is calculated as the ratio of degrees of freedom used by the model to the total degrees of freedom available.
In assessing the validity of the measurement model, it is useful to examine composite reliability and convergent and discriminant validity. Composite reliability (CR) is defined as the total amount of true score variance in relation to the total score vari-ance. High factor loadings indicate that the observed variables converge on the same construct. Another measure that is used to assess convergent validity is the average variance extracted (AVE), which is defined as the variance in the indicators or observed variables that is explained by the latent construct. Cross-loadings indicate lack of distinctiveness and present potential problems in establishing discriminant validity. Discriminant validity is established by showing that the average variance extracted is greater than the square of the correlations.
If the validity of the proposed measurement model is not satisfactory, then you can make use of the diagnostic information provided by confirmatory factor analysis to make appropriate modifications. The diagnostic cues that can be used to make appro-priate modifications include: (1) the path estimates of loadings; (2) standardised residual; (3) modification indices; and (4) specification search. If the modifications are substantial, then you must modify the measurement theory, specify a new meas-urement model and collect new data to test the new model.
Once the validity of the measurement model has been established, you can proceed with the specification of the structural model. In moving from the measurement model to the structural model, the emphasis shifts from the relationships between latent con-structs and the observed variables to the nature and magnitude of the relationships between constructs. Assessing the validity of the structural model is similar to that for the measurement model and involves: (1) examining the fit; (2) comparing the pro-posed structural model with competing models; and (3) testing structural relation-ships and hypotheses.

828 Marketing Research
Questions 1 What characteristics distinguish SEM from other multivariate techniques?
2 What is the role of theory in SEM?
3 What is a measurement model? Why is it estimated?
4 How is model fit assessed in SEM?
5 What are the similarities and differences between an absolute and incremental fit index?
6 What are the similarities and differences between a parsimony and incremental fit index?
7 What is confirmatory factor analysis? How is it similar to and different from exploratory factor analysis?
8 How do you assess the validity of a measurement model?
9 How do you establish convergent and discriminant validity in an SEM framework?
10 What is average variance extracted? Why is it useful to calculate this statistic?
11 What is a second-order factor model? How is it different from a first-order factor model?
12 What is a structural theory and how is it different from measurement theory?
13 How do we determine whether the difference between two structural path coefficients is significant?
14 What is a recursive model? Why is this aspect relevant in SEM?
15 SEM is similar to what other multivariate techniques? How is it similar?
Exercises 1 As a research consultant to the Union of European Football Associations (UEFA), you are to develop a model that explains supporters’ attendance at professional games. Evaluate literature, secondary data and intelligence sources to identify the factors that influence attendance at professional football games. Formulate a structural model and draw a path diagram.
2 As a research consultant for Google, you are to develop a model that explains consumers’ patronage of an internet portal. Evaluate literature, secondary data and intelligence sources to identify the factors that influence patronage of an internet portal. Formulate a structural model and draw a path diagram. If you were a director of marketing at Google, how would you use the structural model in any design decisions?
3 Draw a path diagram with three exogenous constructs and one endogenous construct. The exogenous constructs are measured by five, four and three observed variables or indicators. The endogenous construct is measured by four indicators. Two exogenous constructs are expected to be positively related and one negatively related to the endogenous construct. What are the degrees of freedom of the associated measurement model?
4 In a small group, discuss the similarities and differences between EFA and CFA. Which is the more useful?

829Chapter 27 Structural equation modelling and path analysis
Notes
1. The help of Professor James Agarwal with the banking service application and Professor Sung Kim with the TAM application is gratefully acknowledged. The material presented in this chapter is drawn from several sources on SEM. Special mention is made of Bollen, K.A., Structural Equation Modelling with Latent Variables (New York: Wiley, 1989) and Hair, J.F., Black, W.C., Babin, B.J., Anderson, R.E. and Tatham, R.L., Multivariate Data Analysis, 6th edn (Upper Saddle River, NJ: Prentice Hall, 2006).
2. Truong, Y., ‘Personal aspirations and the consumption of luxury goods’, International Journal of Market Research 52 (5) (2010), 653–72.
3. Good sources for an introduction to SEM include: Harrington, D., Confirmatory Factor Analysis (New York: Oxford University Press, 2008); Kline, R.B., Principles and Practice of Structural Equation Modelling, 2nd edn (New York: Guilford Press, 2005); Arbuckle, J.L., AMOS 6.0 User’s Guide (Chicago: SPSS, 2005); Bollen, K.A., Structural Equations With Latent Variables (New York: Wiley, 1989).
4. For a history of SEM, see Bielby, W.T. and Hauser, R.M., ‘Structural equation models’, Annual Review of Sociology 3 (1977), 137–61; Bollen, K.A., Structural Equations With Latent Variables (New York: Wiley, 1989); Epstein, R.J., A History of Econometrics (Amsterdam: Elsevier, 1987).
5. Berk, R.A., ‘Causal inference for sociological data’, in Smelser, N.J., ed., Handbook of Sociology (Newbury Park, CA: Sage, 1988).
6. Anderson, J.C. and Gerbing, D.W., ‘Structural equation modelling in practice: A review and recommended two-step approach’, Psychological Bulletin 103 (1988), 411–23.
7. Typically, we assume reflective measurement theory. This theory posits that latent constructs caused the observed variables, and the inability to explain fully the observed variables results in errors. Therefore the arrows are drawn from the latent constructs to the observed variables. An alternative approach that is sometimes used is formative measurement theory, where the observed variables cause the construct. Formative constructs are not considered latent. Reflective measurement theory is commonly used in marketing and the social sciences, and hence the approach is adopted here.
8. For more discussion, see Cudek, R., ‘Analysis of correlation matrices using covariance structure models’, Psychological Bulletin 2 (1989), 317–27.
9. MLE is the most widely used estimation approach and is the default option in most SEM programs. However, alternative methods such as weighted least squares (WLS), generalised least squares (GLS) and asymptotically distribution free (ADF) are also available.
10. Hair, J.F., Black, W.C., Babib, B.J., Anderson, R.E. and Tatham, R.L., Multivariate Data Analysis, 6th edn (Upper Saddle River, NJ: Prentice Hall, 2006).
11. Harrington, D., Confirmatory Factor Analysis (New York: Oxford University Press, 2008); Jackson, D.L., ‘Sample size and number of parameter estimates in maximum likelihood confirmatory factor analysis: A Monte Carlo investigation’, Structural Equation Modelling 8 (2)
(2001), 205–23; Kaplan, D., ‘Statistical power in structural equation modelling’, in Hoyle, R. (ed.), Structural Equation Modelling: Concepts, Issues and Applications (Thousand Oaks, CA: Sage, 1995), 100–17; Hu, L.T. and Bentler, P.M., ‘Cutoff criteria for fit indexes in covariance structure analysis: Conventional criteria versus new alternatives’, Structural Equation Modelling 6 (1999), 1–55.
12. Hu, L. and Bentler, P.M., ‘Fit indices in covariance structure modelling: Sensitivity to underparameterized model misspecification’, Psychological Methods 3 (4) (1998), 424–53; Hu, L.T. and Bentler, P.M., ‘Cutoff criteria for fit indexes in covariance structure analysis: Conventional criteria versus new alternatives’, Structural Equation Modelling 6 (1999), 1–55; Marsh, H.W., Balla, J.R. and McDonald, R.P., ‘Goodness of fit indexes in confirmatory factor analysis: The effect of sample size’, Psychological Bulletin 103 (1988), 391–410; Marsh, H.W., Balla, J.R. and Hau, K., ‘An evaluation of incremental fit indices: A clarification of mathematical and empirical properties’, in Marcoulides, G.A. and Schumacker, R.E., (eds), Advanced Structural Equation Modelling: Issues and Techniques (Mahwah, NJ: Lawrence Erlbaum Associates, 1996), 315–53; Nevitt, J. and Hancock, G.R., ‘Improving the root mean squared error of approximation for nonnormal conditions in structural equation modelling’, Journal of Experimental Education 68 (2000), 251–68; Marsh, H.W. and Hau, K.T., ‘Assessing goodness of fit: Is parsimony always desirable?’, Journal of Experimental Education 64 (1996), 364–90.
13. Chin, W.W., Gopal, A. and Salisbury, W.D., ‘Advancing the theory of adaptive structuration: The development of a scale to measure faithfulness of appropriation’, Information Systems Research 8 (4) (1997), 342–67.
14. Fornell, C. and Larcker, D.F., ‘Evaluating structural equation models with unobservable variables and measurement error’, Journal of Marketing Research 18 (February 1981), 39–50.
15. MacCallum, R.C., Roznowski, M. and Necowitz, L.B., ‘Model modifications in covariance structure analysis: The problem of capitalization on chance’, Psychological Bulletin 111 (1992), 490–504.
16. MacCallum, R.C., Browne, M.W. and Cai, L., ‘Testing differences between nested covariance structure models: Power analysis and null hypotheses’, Psychological Models 11 (2006), 19–35.
17. Boomsma, A., ‘Reporting analyses of covariate structures’, Structural Equation Modelling 7 (2000), 461–83; McDonald, R.P. and Ho, M.H., ‘Principles and practice in reporting structural equation analyses’, Psychological Methods 7 (2002), 64–82.
18. Brown, T.A., Confirmatory Factor Analysis for Applied Research (New York: Guilford Press, 2006); Hurley, A.E., Scandura, T.A., Schriesheim, C.A., Brannick, M.T., Seers, A., Vandenberg, R.J. and Williams, L.J. ‘Exploratory and confirmatory factor analysis: Guidelines, issues and alternatives’, Journal of Organizational Behavior 18 (1997), 667–83.
19. Davis, F.D., Bagozzi, R.P. and Warshaw, P.R., ‘User acceptance of computer technology: A comparison of two

830 Marketing Research
theoretical models’, Management Science 35 (August 1989), 982–1003; Kim, S. and Malhotra, N.K., ‘A longitudinal model of continued IS use: An integrative view of four mechanisms underlying post-adoption phenomena’, Management Science 51 (5) (May 2005), 741–55; Malhotra, N.K., Kim, S. and Patil, A., ‘Common method variance in IS research: A comparison of alternative approaches and a reanalysis of past research’, Management Science 52 (December 2006), 1865–83.
20. Parasuraman, A., Zeithaml, V.A. and Berry, L.L., ‘SERVQUAL: A multiple item scale for measuring consumer perceptions of service quality’, Journal of Retailing 64 (1) (1988), 12–40.
21. Croon, M., Methods for Correlational Research: Factor Analysis, Path Analysis and Structural Equation Modelling (Harlow: Pearson, 2008); Bollen, K.A., ‘Total, direct and indirect effects in structural equation models’,
in Clogg, C.C. (ed), Sociological Methodology (Washington, DC: American Sociological Association, 1987), 37–69; Kelm, L., ‘Path analysis’, in Grimm, L.G. and Yarnold, P.R. (eds), Reading and Understanding Multivariate Statistics (Washington, DC: American Psychological Association, 2000), 65–97; Loehlin, J.C., Latent Variable Models: An Introduction to Factor, Path and Structural Analysis, 3rd edn (Mahwah, NJ: Lawrence Erlbaum Associates, 1998).
22. Cort, K.T., Griffith, D.A. and White, D.S., ‘An attribution theory approach for understanding the internationalization of professional service firms’, International Marketing Review 24 (1) (2007), 9–25.
23. Steenhaut, S. and van Kenhove, P., ‘An empirical investigation of the relationships among a consumer’s personal values, ethical ideology and ethical beliefs’, Journal of Business Ethics 64 (2006), 137–55.

Communicating research findings
Research findings should be
clearly communicated so they
can be easily understood, and
managers are clear about the
action they should take.
Stage 1
Problem definition
Stage 2
Research approach developed
Stage 3
Research design
developed
Stage 4
Fieldwork or data
collection
Stage 5
Data integrity
and analysis
28
Stage 6
Communicating research findings

832 Marketing Research
Objectives
After reading this chapter, you should be able to:
1 understand the difference between communicating and disseminating research findings;
2 discuss the basic requirements of report preparation, including report format, report writing, graphs and tables;
3 discuss the nature and scope of oral presentation of research findings;
4 understand the concept of infographics and the role of visual communication;
5 describe the approach to the marketing research report from the client’s perspective;
6 explain the reason for follow-up with the client and describe the assistance that should be given to the client as well as the evaluation of the research project.
This chapter describes the importance of effective communication of research findings. We provide guidelines for report preparation, including report writing and preparing tables and graphs. Many reports are now presented in digital formats in manners that allow data to be interrogated. We discuss these developments in the context of describing the nature and use of digital dashboards, together with the increasing use of visual communication techniques such as infographics. We discuss the nature and characteristics of successful oral research presentations. Research follow-up, including assisting the client and evaluating the research process, is described.
We begin with an example of how the BMW Group devised an innovative and engaging means to convey the findings of a large, complex study. The challenge that companies and decision makers face is to find the meaning and insight in this data. This example, and further ones in this chapter, illustrate that the researcher has to go beyond just feeding research findings, to find a reporting format that is relevant, engaging and credible to decision makers.
Overview
Real research Visualising future consumers1
A client approached BMW Group Designworks (www.bmwgroup.com) with the follow-ing brief:
Devise a method to transfer 2,000 pages of research content, communicating very new consumer environments in under an hour to 15,000 corporate knowledge workers.
The research the group was asked to communicate represented a very large study on changes in consumer behaviour in the future. As part of the study, the group’s researchers created text-based scenarios around personas from different age seg-ments, and tested the communication impact on a small sample of the target audi-ence. They designed four short films to act as ‘visual management summaries’, communicating the most important five to seven points for different future time frames. Another 40–50 supporting points per time frame were woven into dialogue or

833Chapter 28 Communicating research findings
communicated visually in set, action sequences, costume design, or graphic effects. The films were structured as interviews with consumers typical of an age and time frame. Set against black backgrounds for neutrality, the characters answered ques-tions in a way that implied an off-screen narrator, delivering the audience observa-tions on their behaviours and values. As the characters talked, their observations were shown in live action scenes, which were cut into the studio footage. When a key point was reached, it was punctuated either through sound (a narrated voice-over), visuals (graphic overlays) or pacing (shift in flow). The researchers used a variety of tech-niques to juxtapose the present and the future in these films. The work was tested iteratively during development to ensure the general approach and the specific tech-niques were creating the intended impact and increased retention. The researchers searched for techniques that had transferability, and tested these on sample members of development and marketing teams including engineers, general managers, researchers, designers and financial controllers.
Why does communication of research findings matter?
As a researcher you have gone through each stage of the research process, defined a prob-lem, specified a method, collected data and carried out analysis. You are convinced that the research findings have the potential to create value for the research client. The only problem now is getting the client to listen to what you have found. Why should this be a problem? You might think that, having gone to the effort to fund research, managers will be more than appreciative of any findings and eager to put them into practice. Sadly, the reality is different and a number of factors are making it more difficult to persuade man-agers to actually take action on the research and insight that has been generated. Under-standing how to communicate research findings effectively is therefore more important than ever.
It is important to understand that communicating research findings is not the same as dis-seminating research findings. Emailing your research report to managers does not guarantee they will action the report. Indeed, in the increasingly busy and fragmented world that faces managers today, emailing your research report to a manager does not even guarantee that they will open the email! Before addressing the challenge of communicating research find-ings it is necessary to take a step back and think about why managers find it so hard to use evidence to make decisions. Bob Sutton, a leading Professor of management at Stanford University, defines evidence-based decision making as:2
A simple willingness to find the best evidence you can, and then act on it. That may sound incredibly simplistic, yet the market for business knowledge works in such a way that it is incredibly hard to do that.
Why exactly is it so hard? Sutton provides six examples of things that managers use as sub-stitutes for evidence.3 All of these are characteristics that you may come across in your own dealings with managers:
1 Obsolete knowledge. Something worked in the past, so people keep repeating it.
2 Personal experience. People like to continue with what they are familiar. For example, if people have a lot of experience with quantitative marketing research methods they may be

834 Marketing Research
less willing to try qualitative techniques, even when they are more appropriate for the task at hand.
3 Specialist skills capitalising on their strengths. Have you ever head the saying ‘To a ham-mer everything looks like a nail’? The same thing can happen with managers.
4 Hype and marketing. How many marketing managers want to invest in social media research, or some other technology, without analysis of whether it is relevant for their business or research problem?
5 Dogma and belief and being influenced by ideology. Within management there are many common pieces of conventional wisdom that are not backed by the evidence. For exam-ple, the persistence of the ‘first-mover advantage’ myth.
6 Mindless mimicry of top performers. This can include uncritical emulation, such as casual benchmarking. Look at the number of management books and articles encour-aging managers to emulate successful leaders such as Steve Jobs without analys-ing how the circumstances, market or environment facing these leaders might be different.
All of these points combine to raise the importance of ensuring that research findings are communicated in the most effective and robust way.
Real research Did communicating with PowerPoint make NASA dumb?
Although not a marketing research problem, the problems that faced NASA perfectly illustrate how even relatively basic cases of poor communication of research findings can cause damaging consequences.
PowerPoint slides are the dominant means of communicating information at NASA. Edward Tufte, Yale statistician and pioneer in the field of data visualisation, describes the incident as follows:4
During the January 2003 spaceflight of Shuttle Columbia, 82 seconds after lift off a 760 gram piece of foam insulation broke off from the liquid fuel tank, hit the wing, and broke through the wing’s thermal insulation. After orbiting the earth for 2 weeks with an undetected hole in its wing the Columbia burned up during re-entry . . . the only evidence of a possible problem was a very brief video sequence showing that something hit the wing somewhere.
On discovery of the video, and before the space shuttle attempted re-entry, NASA had to quickly decide what to do. They commissioned engineers from Boeing to pro-duce three reports, which totalled 28 pages of PowerPoint slides. The slides were text-heavy, contained a lot of technical terms and repeatedly used the words ‘signifi-cant’ and ‘significantly’ inconsistently. Tuft argues that while the Boeing engineers wanted to communicate uncertainty, they just weren’t sure of the consequences of the foam insulation hitting the wing. NASA managers took away from the slides the message that there was nothing to worry about. As a result the space shuttle was allowed to re-enter, with disastrous consequences. While an extreme example, this case study illustrates the importance of effective communication of research findings and taking into account the skills and knowledge of the audience to whom it is being communicated.

835Chapter 28 Communicating research findings
Importance of the report and presentation
Although there are alternative approaches, which we cover later in the chapter, a written report and oral presentation are still the two most common techniques for presenting find-ings. In fact, we could argue that the report and its presentation are important parts of the marketing research project because:
1 These are the tangible products of the research effort. After the project is complete and management have made the decision, there is little documentary evidence of the project other than the written report. The report serves as a historical record of the project.
2 Management decisions are guided by the report and the presentation. If the first five steps in the project are carefully conducted but inadequate attention is paid to the sixth step, the value of the project to decision makers will be greatly diminished.
3 The involvement of many decision makers in a research project is limited to reading the written report and listening to the oral presentation. These managers evaluate the quality of the entire project on the quality of the report and presentation.
4 Decision makers’ decision to undertake marketing research in the future or to use the particular research supplier again will be influenced by the perceived usefulness of the report and the presentation.
The above factors of importance seem self-evident, but many researchers fail to heed this advice. The following quote encapsulates the environment in which researchers have to engage decision makers:5
In today’s ever more complex and fragmenting business environment one thing is clear. Everyone is time pressured, low attention spans are prevalent and if you have something to say, often you have to say it clearly and concisely. And just to make things even more difficult, real ‘face time’ with clients is at a premium and importantly the synopsis of a research study is most often widely distributed and communicated in a written form primarily by email and the dreaded PowerPoint.
There has long been criticism of how researchers fail to appreciate the needs of decision makers and engage them in presenting reports. It has been argued that the barriers between researchers and decision makers have grown due to the following factors:6
• Overload. Decision makers can be overloaded with marketing research, which can mean large numbers of presentations and meetings every month. As well as marketing research, there is an increasing amount of other data that decision makers have to deal with, including financial reports, information systems data, corporate news feeds and other intelligence sources.
• Pace of work. The pace of work has increased; this is driven in part by personal technol-ogy, adoption of other countries’ working practices and also by increased competition. Distractions add to this pace, with a ‘BlackBerry culture’, meaning that decision makers get easily distracted and have short attention spans.
• Quality. Researchers make presentations of variable quality; sometimes they are too long (100-page presentations are still being produced), sometimes they are badly presented, sometimes they are not very easy to understand and lack a point of view and/or insight – and sometimes they are just plain boring.
Researchers need to appreciate the context and manner in which decision makers use infor-mation. Based upon this appreciation, they need to address the quality of their written (be that digital or hard-copy) reports and their oral presentations. If decision makers view researchers as responsible for poor-quality presentations that do not address their needs and/or engage them, the researchers’ credibility can be seriously harmed.

836 Marketing Research
Preparation and presentation process
To develop high-quality presentations, we begin by examining the report preparation and presentation process. The process begins by interpreting the results of data analysis in light of the marketing research problem, approach, research design and fieldwork. Instead of merely summarising the quantitative and/or qualitative analyses, the researcher should pre-sent the findings in such a way that they can be used directly as input into decision making. Wherever appropriate, conclusions should be drawn and recommendations made. The researcher should aim to make the recommendations actionable. Before writing the report, the researcher should discuss the major findings, conclusions and recommendations with the key decision makers. These discussions play a major role in ensuring that the report meets the decision makers’ needs and is ultimately accepted. These discussions should confirm specific dates for the delivery of the written report and other data.
The entire marketing research project should be summarised in a single written report, or in several reports addressed to different readers. Generally, an oral presentation supplements the written documents. The client should be given an opportunity to read the report. After that, the researcher should take the necessary follow-up actions. The researcher should assist
Real research What do managers really think of research reports?
A study into what managers felt about marketing research found that nearly 80% of managers felt that they needed to have strong technical and sta-tistical skills to properly understand the results of reports.7 Most telling were the qualitative com-ments that came from an open-ended survey question asking about how results were reported:
A voluminous report from a company such as XXX
. . . as a long report that usually contradicts the results
Groupings of respondents are provided on factors that are too extensive in the range they cover. E.g age groups or type of employment are too wide – greater precision is required.
has varied on many occasions over the years, rarely with a clear executive summary
in a powerpoint presentation with a slick handout
. . . in a rushed slap hazard fashion with the attitude that [sic] ‘leave the details to us’ . . .
. . . mostly incomplete, unless I define the survey myself, there is too much understood [sic] or unclear. The result is usually ranged in numbers and percentages across a few (up to say 10) variables, but mostly insufficiently conclusive.
. . . often meaningless information
These comments hint at the levels of frustration felt by managers who are have to read poor-quality reports that lack sufficient clarity to help with the decision-making process.

837Chapter 28 Communicating research findings
the client in understanding the report, help in interpretations of the findings that can affect their implementation, offer to undertake further research and reflect upon the research pro-cess to evaluate its overall worth.
Figure 28.1
The report preparation and presentation process
Problem de�nition, approach,research design and �eldwork
Data analysis
Interpretation, conclusionand recommendations
Report preparation
Oral presentation
Reading of the reportby the client
Research follow-up
Report preparation
Researchers differ in the way they prepare a research report. The personality, background, expertise and responsibility of the researcher, along with the decision maker to whom the report is addressed, interact to give each report a unique character. Yet there are guidelines for formatting and writing reports and designing tables and graphs.8
Report format
Report formats are likely to vary with the researcher or the marketing research firm conduct-ing the project, the client for whom the project is being conducted and the nature of the pro-ject itself. Hence, the following is intended as a guide from which the researcher can develop a format for the research project at hand. Most research reports are broadly structured around the following elements:
1 Submission letter
2 Title page
3 Table of contents

838 Marketing Research
4 Executive summary
a Summary of prime objectives
b Major findings
c Conclusions and recommendations
5 Problem definition
a Background to the problem
b Statement of the marketing problem
c Statement of the research objectives – information needs
6 Approach to the problem and research design
a Type of research design
b Data collection from secondary sources
c Data collection from primary sources
7 Data analysis
a Research design
b Plan of data analysis and means of interpreting results
8 Results
9 Conclusions and recommendations
10 Limitations and caveats
11 Appendices
This format closely follows the earlier steps of the marketing research process. The results may be presented in several chapters of the report. For example, in a national or international survey, data analysis may be conducted for the overall sample and then the data for each geographical region may be analysed separately. If so, the results from each analysis may be presented in a separate chapter.
1 Submission letter. A formal report generally contains a letter of submission that delivers the report to the client and summarises the researcher’s overall experience with the pro-ject, without mentioning the findings. The letter should also identify the need for further action on the part of the client, such as implementation of the findings or further research that should be undertaken.
2 Title page. The title page should include the title of the report, information (name, address and telephone number) about the researcher or organisation conducting the research, the name of the client for whom the report was prepared and the date of release. The title should encapsulate the nature of the project with a tone that is meaningful to the target decision makers, not one of technical ‘research-speak’.
3 Table of contents. The table of contents should list the topics covered and the appropri-ate page numbers. In most reports, only the major headings and subheadings are included. The table of contents is followed by a list of tables, a list of graphs, a list of appendices and a list of exhibits.
4 Executive summary. The executive summary is of vital importance in a report. In many instances this may be the only portion of the report that decision makers read. The sum-mary should concisely describe the problem, approach and research design that was adopted. A summary section should be devoted to the major results, conclusions and

839Chapter 28 Communicating research findings
recommendations. The executive summary should be written after the rest of the report has been written.
5 Problem definition. The problem definition section of the report gives the background to the problem. This part summarises elements of the marketing and research problem diagnosis. Key elements of any discussions with decision makers, industry experts and initial secondary data analyses are presented. Having set this context for the whole pro-ject, a clear statement of the marketing decision problem(s) and the marketing research problem(s) should be presented.
6 Approach to the problem and research design. The approach to the problem section should discuss the broad approach that was adopted in addressing the problem. This sec-tion should summarise the theoretical foundations that guided the research, any analyti-cal models formulated, research questions, hypotheses and the factors that influenced the research design. The research design should specify the details of how the research was conducted, preferably with a graphical presentation of the stages undertaken, show-ing the relationships between stages. This should detail the methods undertaken in the data collection from secondary and primary sources. These topics should be presented in a non-technical, easy-to-understand manner. The technical details should be included in an appendix. This section of the report should justify the specific methods selected.
7 Data analysis. The section on data analysis, be it quantitative or qualitative, should describe the plan of data analysis and justify the data analysis strategy and techniques used. The techniques used for analysis should be described in simple, non-technical terms, with examples to guide the reader through the interpretations.
8 Results. The results section is normally the longest part of the report and may entail sev-eral chapters. It may be presented in any of the following ways:
• Forms of analysis. For example, in a health care marketing survey of hospitals, the results were presented in four chapters. One chapter presented the overall results, another examined the differences between geographical regions, a third presented the differences between for-profit and non-profit hospitals, and a fourth presented the differences according to bed capacity. Often, results are presented not only at the ag-gregate level but also at the subgroup level (market segment, geographical area, etc.).
• Forms of data collection. For example, a study may contain significant elements of secondary data collection and analyses, a series of focus group interviews and a sur-vey. The results in such circumstances may be best presented by drawing conclusions from one method before moving on to another method. The conclusions derived from focus groups, for example, may need to be established to show the link to a sample design and questions used in a survey.
• Objectives. There may be a series of research objectives whose fulfilment may incor-porate a variety of data collection methods and levels of analysis. In these circum-stances the results combine methods and levels of analyses to show connections and to develop and illustrate emerging issues.
The results should be organised in a coherent and logical way. Choosing whether to present by forms of analysis, forms of data collection or objectives helps to build that coherence and logic. The presentation of the results should be geared directly to the components of the marketing research problem and the information needs that were di-agnosed in the initial research brief and proposal. The nature of the information needs and characteristics of the recipients of the report ultimately determine the best way to present results.
9 Conclusions and recommendations. Presenting a mere summary of the quantitative or qualitative findings is not enough for most marketing research users. The researcher should interpret the results in light of the problem being addressed to arrive at major conclusions. Based on the results and conclusions, the researcher may make

840 Marketing Research
recommendations to the decision makers. Sometimes, researchers are not asked to make recommendations because they research only one area and do not understand the bigger picture at the client firm. The researcher may not have been fully involved in the diagnosis of the marketing and research problems, in which case the research-er’s interpretations may not fit into the context that the decision maker understands.
In any research project there are many approaches that can be taken to analyse the data. This can result in a potential overabundance of data (quantitative and/or qualitative), and distilling the ‘meaning’ from the data and presenting this in a clear report can result in much of the original meaning or richness being lost.9 To maintain the meaning or richness, the researcher should strive to understand the nature of the decision-making process that is being supported. Only then can sound interpretations of the collected data be made. This is illustrated in the following example, where the main factor in selecting a research agency to work with is an understanding of the decision-making process that is being supported.
10 Limitations and caveats. All marketing research projects have limitations caused by time, budget and other organisational constraints. Furthermore, the research design adopted may be limited in terms of the various types of errors, and some of these may be serious enough to warrant discussion. This section should be written with great care and a balanced perspective. On the one hand, the researcher must make sure that decision makers do not rely too heavily on the results or use them for unintended purposes, such as projecting them to unintended populations. On the other hand, this section should not erode management’s confidence in the research or unduly minimise its importance.
11 Appendices. At the end of the report, documents can be compiled that may be used by different readers to help them to understand characteristics of the research project in more detail. These should include the letter of authorisation to conduct the research; this authorisation could include the agreed research proposal. Details that relate to individual techniques should be included relating to questionnaires, interview guides, sampling and fieldwork activities. The final part of the appendix should include lists of contacts, refer-ences used and further sources of reference.
Real research French marketing research looks abroad
Mark Whiting, Research Director at Hennessy, was quite content with the support he got from French marketing research agencies. He pointed out that 99% of the cognac brand’s business was conducted outside France, and he therefore could not expect to find every-thing he needs among French agencies. What drives his desire to work with a particular agency?10
Above all, I’m looking to work with agencies who understand the business issues which concern us and who can make recommendations as to how to solve those issues, based on the research data that they have collected. This means searching near and far, so sometimes I find what I’m looking for in France, and sometimes I use agencies in the UK, the US and Asia.
Report writing
1 Readers. A report should be written for a specific reader or readers: namely, the decision makers who will use the results. The report should take into account the readers’ technical sophistication and interest in the project, as well as the circumstances under which they will read the report and how they will use it.11

841Chapter 28 Communicating research findings
Technical jargon should be avoided unless the researcher is absolutely sure of the tech-nical abilities and demands of the readers of a report. As expressed by one expert, ‘The readers of your reports are busy people; and very few of them can balance a research report, a cup of coffee, and a dictionary at one time.’12 Instead of technical terms such as maximum likelihood, heteroscedasticity and non-parametric, researchers should try to use descriptive explanations. If some technical terms cannot be avoided, definitions should be presented in a glossary or appendix. When it comes to marketing research, decision mak-ers would rather live with a problem they cannot solve than accept a solution they cannot understand. Often the researcher must cater to the needs of several audiences with differ-ent levels of technical sophistication and interest in the project. Such conflicting needs may be met by including different sections in the report for different readers, or separate reports entirely.
2 Easy to follow. The report should be easy to follow.13 It should be structured logically and written clearly. The material, particularly the body of the report, should be structured in a logical manner so that the reader can easily see the inherent connections and linkages. Headings should be used for different topics, and subheadings for subtopics. A logical organisation also leads to a coherent report. Clarity can be enhanced by using well-con-structed sentences that are short and to the point. The words used should express precisely what the researcher wants to communicate. Difficult words, slang and clichés should be avoided. An excellent check on the clarity of a report is to have two or three people who are unfamiliar with the project read it and offer critical comments. Several revisions of the report may be needed before the final document emerges.
3 Presentable and professional appearance. The look of a report is important. The report should be professionally reproduced with quality paper, typing and binding for hard cop-ies, and with skilful graphic design for online reports. Variation in type size and skilful use of white space can greatly contribute to the appearance and readability of the report. However, a balance should be sought with styles of variation. Too much variation can lead to confusion; variation is only useful if it aids understanding.
4 Objective. Objectivity is a virtue that should guide report writing. Researchers can become so fascinated with their project that they overlook their ‘objective’ role. The report should accurately present the research design, results and conclusions of the project, without slanting the findings to conform to the expectations of management. Decision makers are unlikely to receive with enthusiasm a report that reflects unfavourably on their judgement or actions. Yet the researcher must have the courage to present and defend the results objectively.
5 Reinforce text with tables and graphs. It is important to reinforce key information in the text with tables, graphs, pictures, maps and other visual devices. Visual aids can greatly facilitate communication and add to the clarity and impact of the report. Guidelines for tabular and graphical presentation are discussed later.
6 Reinforce tables and graphs with text. Conversely, it is important to illustrate tables and graphs with verbatim quotes from questionnaires and interviews. Quotes can bring to life the meaning in tables and graphs and, used carefully, can make the reading of the report far more interesting than a solid body of statistics.
7 Conciseness. A report should be concise. Anything unnecessary should be omitted. If too much information is included, important points may be lost. Avoid lengthy discussions of common procedures. However, brevity should not be achieved at the expense of com-pleteness.
Drawing together the above considerations in writing a good report can be challenging. There can be a delicate balance between keeping a report short and concise against superfici-ality and not addressing specific information needs of decision makers. The following list

842 Marketing Research
should focus the mind of the report writer as it encapsulates typical mistakes that can make good research ineffective:14
• The order in the report is based on the order of the questionnaire. A report based on the order of questions in a questionnaire typically has no beginning or end and has to be com-pletely rewritten by the buyer before it can be used by anybody else in the organisation.
• The report does not discriminate between relevant subgroups but only shows totals. The need to go back and ask for more, deeper analysis (sometimes at extra cost) can be a great factor of annoyance.
• The report contains too much research jargon, so that any reader outside of the profes-sion can only guess at its meaning.
• The report contains tables with too many figures. In the end, there is only confusion. For researchers, the percentages derived from their data files have meaning, but not so for the reader.
• The report does not distinguish between different audiences in the organisation buying the research.
• The vast majority of reports are still prepared and delivered on ‘paper’ (including virtual paper, such as Word, PowerPoint or PDF documents). In a modern-day business environ-ment, with its fast-pace decision making, research information on ‘paper’ can be too dif-ficult to find and penetrate. Decision makers need the right information at the right time and have no time to wait or to search through reports.
As a general rule, graphical aids should be employed whenever practical. Graphical dis-play of information can effectively comple-ment the text and tables to enhance clarity of communication and impact.15 As the saying goes, a picture is worth a thousand words. This section focuses on the different types of graphical aids.
Geographic and other maps
Geographic and other maps, such as product positioning maps, can communicate relative location and other comparative information. Geographic maps form the bases of presenta-tions in geodemographic analyses, as discussed in Chapter 5. The maps used in geodemo-graphic analyses can portray customer locations and types, potential consumers, location of competitors, road networks to show consumer flows and other facilities that may attract consumers to certain locations.
Round or pie charts
In a pie chart, the area of each section, as a percentage of the total area of a circle, reflects the percentage associated with the value of a specific variable. Pie charts are very useful in pre-senting simple relative frequencies in numbers or percentages. A pie chart is not useful for displaying relationships over time or relationships among several variables (see Figure 28.2). As a general guide, a pie chart should not contain more than seven sections. Great care must be taken with 3D pie charts as the relative sizes of the pie segments can become distorted.
Pie chartA round chart divided into sections.
Guidelines for graphs

843Chapter 28 Communicating research findings
Line charts
A line chart connects a series of data points using continuous lines. This is an attractive way of illustrating trends and changes over time. Several series can be compared on the same chart, and forecasts, interpolations and extrapolations can be shown. If several series are dis-played simultaneously, each line should have a distinctive colour or form (see Figure 28.3).
Histograms and bar charts
A bar chart displays data in various bars that may be positioned horizontally or vertically. Bar charts can be used to present absolute and relative magnitudes, differences and change. A histogram is a vertical bar chart in which the height of the bar represents the relative or cumulative frequency of occurrence of a specific variable (see Figure 28.4). Other variations on the basic bar chart include the stacked bar chart (Figure 28.5) and the 3D bar chart (Figure 28.6). Stacked and cluster bar charts can work well with a few data items presented, to represent differences qualitatively between groups. As noted with pie charts, 3D charts should be used with great caution as they can distort the message and confuse an audience. Most graphics packages have a great array of 3D options; however, there are few circum-stances where they can be used to present data in a clear and unbiased manner.
Line chartA chart that connects a series of data points using continuous lines.
Bar chartA chart that displays data in bars positioned horizontally or vertically.
HistogramA vertical bar chart in which the height of the bar represents the relative or commulative frequency of occurrence.
Figure 28.2
Pie chart that shows the percentage of different forms of travel to work
Car 40%
Bus 25%
Walk 14%
Train 13%
Cycle 8%
Figure 28.3
Line chart of target and actual sales by month
0
500
1,000
1,500
2,000
2,500
Janua
ry
Febr
uary
March
April
MayJun
eJul
y
Augu
st
Septem
ber
Octobe
r
Novem
ber
Decem
ber
Target salesActual sales

844 Marketing Research
Figure 28.4
Bar chart of preferred fast food by age
0%
10%
30%
40%
50%
60%
20%
Hamburger
Pizza
Kebab
under 25 25–44Age
45+
Figure 28.5
Stacked bar chart of the rating aspects of service
Choice offood
0% 10% 20% 30% 40% 50% 60% 70% 80% 90% 100%
18% 34% 17% 20% 12%
Quality offood 16% 29% 28% 18% 10%
Cleanliness 12% 16% 29% 38% 4%
Speed ofservice 6%
Very poor Poor Good Very good Don’t know
19% 48% 26% 2%
Figure 28.6
The 3D bar chart of preferred fast food by age
60%
50%
40%
30%
20%
10%
0%
Hamburger
Ham
burger
Pizza
Kebab
Pizza
Kebabunder 25
25–44
45+

845Chapter 28 Communicating research findings
Schematic figures and flow charts
Schematic figures and flow charts take on a number of different forms. They can be used to display the steps or components of a process, as in Figure 28.1. They can also be of great value in presenting qualitative data analyses by representing the nature and interconnection of ideas that have been uncovered (see Chapter 9). Another useful form of these charts is classification diagrams. Examples of classification charts for classifying secondary data were provided in Chapter 4 (Figures 4.1 to 4.4). An example of a flow chart for questionnaire design was given in Chapter 13 (Figure 13.3).
Report distribution
The marketing research report should be distributed to appropriate personnel who may use (or influence the use of) the findings in different ways. The report could be distributed in a variety of formats, including hard copy and electronic, static and interactive. Increasingly, research reports are being published or posted directly online. Normally these reports are not located in publicly accessible areas but in locations that are protected by passwords, or on intranets. The various presentation, word-processing and spreadsheet packages have the capacity to produce material in a format that can be posted directly online. There are a num-ber of advantages to publishing reports online. These reports can incorporate all kinds of multimedia presentations, including graphs, pictures, animation, audio and full-motion video, as illustrated in the opening example of this chapter. The dissemination is immediate and the reports can be accessed by authorised persons online on a global basis. These reports can be electronically searched to identify materials of specific interest.
Digital dashboards
The dashboard of a car, given its simplicity and broad familiarity, is a fitting visual metaphor for software that displays business performance. The purpose of a dashboard is to communi-cate a rich and often dense assortment of information in an instant. There should be no place for useless content and complexity that our eyes and brains must sort. To achieve data rich-ness that is intuitive, what decision makers see on a dashboard must be the result of thought-ful and skilful design, using graphics and displays specifically designed to work well on a dashboard. It is appropriate and sometimes most effective to enhance dashboard displays with key charts, graphs or even tabular data, and so the principles of clarity we presented earlier also apply in the context of dashboards.16
Digital dashboards have long been used within organisations to consolidate data from internal and external sources, such as operational, financial and marketing data. Such a con-solidation delivers at-a-glance summaries presented in a highly visual and intuitive format. It can take valuable time to sift through masses of tabular data and graphical presentations to determine how a business is performing against key business metrics. It is easy to get caught up in the analysis and miss the bigger picture. However, with dashboards, because attention is directed to the most important information, decision makers can quickly identify problem areas and take corrective action. Immediacy is a crucial element in any successful dashboard, since decision makers can only take the right action when they have timely information.17
Dashboards provide a rapid and convenient way to assess quickly how a business is doing by observing critical business, marketing and consumer metrics.18 Though sometimes diffi-cult to capture and integrate, many business metrics can include findings from marketing research studies. The following example illustrates why and how Heineken uses a digital dashboard, and how marketing research data in the form of consumer performance indicators were integrated with other data sources.

846 Marketing Research
Dashboards are typically used in businesses and in marketing research at three levels:20
1 Operational. Managers need to be aware of short-term changes in performance, so that they can target resources appropriately to optimise performance and profitability, identify fail-ures and work towards remedying any shortfall. A marketing research example would be for a CATI supervisor to monitor interviewers or to monitor progress with online surveys.
2 Tactical. Managers need to be aware of activities such as resource planning, ordering stock and monitoring the effectiveness of advertising or marketing campaigns – activities where a greater level of discretion and decision-making input is required. A marketing research application would be in managing an access panel made up of thousands of par-ticipants. A dashboard could be used in monitoring the performance of panellists; identi-fying ‘underperforming’ participants and identifying shortfalls in areas where recruitment needs to take place.
3 Strategic. Whereas the tactical or operational user’s view of data is typically restricted on a need-to-have basis, the strategic user needs to be able to roam freely across all sources of data. There is a need for the strategic dashboard to be highly tailored to individual deci-sion makers’ needs for data, with the ability to turn controls on and off and drill down into data. Senior strategic users will expect to find the numbers they are seeking with very few mouse clicks. They may have very sophisticated analytical requirements, which may even mean creating custom reports from the raw data that make up the metrics.
Many decision makers working at these three levels are using digital dashboards to view disparate data from across their businesses. Marketing researchers need to think how they may be able to fit their research findings and reports into such formats. This is particularly important at the strategic level, where senior decision makers need to see the value of mar-keting research supporting major decisions. The principal use of dashboards in marketing
Real research The Heineken brand dashboard19
The Heineken Company has a strong decentralised organisation structure. Local markets are responsible for all their business activities, including marketing research, within given rules and guidelines. Following a major reorganisation, Heineken developed a more fact-based management and measurement style. One of the key projects in this reorganisation was to develop a Heineken brand dashboard. In devising this dashboard, Heineken decided that key performance indicators (KPIs) should indicate their brand performance in the areas of consumer performance (CPIs), sales/marketing perfor-mance (S&MPIs) and financial performance (FPIs). In developing CPIs, it faced a major challenge to ensure a uniform measuring model of over 80 markets across the world. For the CPIs a standard questionnaire was composed, measuring the variables upon which the CPIs were calculated. This basis questionnaire could be extended to cater for specific local information needs. Heineken’s local research agencies had to adhere to a number of guidelines to achieve a consistency in: (1) sample size and type of sampling; (2) fre-quency of measurement; (3) timing of data delivery; and (4) deliverables (all consumer data were delivered as cleaned raw data files instead of processed result files). A uniform coding system was set up to synchronise brands, markets and time, which were also common dimensions for the other KPI data sources. In technical terms the system con-sisted of: (1) a presentation layer that presented the dashboards in a web browser; (2) an analytical layer, performing online KPI calculations depending on the user query; (3) a data storage layer storing the data and some pre-calculated KPIs; and (4) a data process-ing layer to manage both the CPI and the S&MPI processing.

847Chapter 28 Communicating research findings
research, has been in large-scale studies, primarily surveys that are administered in longitu-dinal studies and multiple cross-sectional research designs. The most common continuous applications that use dashboards lie in customer satisfaction monitoring, brand health, brand positioning studies and in mystery shopping. With software developments in marketing research, this format may be used to deliver results from surveys and even qualitative studies. Digital dashboards offer great possibilities for ad hoc marketing research projects.
Infographics
One popular new form of visual communication being adopted by marketing research firms is the infographic. Infographics make the most of the cognitive value of visual communica-tion to enhance our ability to see patterns and trends that might not be so straightforward in purely textual data. Visual forms of communication, such as graphs, have been found to increase recall of data from 20% to as much as 80%.21 As an example of the growth of info-graphics within marketing research, Mintel (http://www.mintel.com/mintel-reports) now makes many of its research reports available in infographic form.
It is important to note that infographics are not replacements for traditional forms of marketing research report. Rather, they are complementary and designed to enable such reports to reach a broader and non-technical audience. As an approach there are very few formal rules on what an infographic should look like, and it is as easy to find bad examples of infographics as it is good ones. However, there are some general points that should be considered:
• Infographics are a balance between information density and the effectiveness of visual communication. This means that while they need to display a reasonable amount of data, they should not entirely replicate the contents of a research report.
• Infographics should not make assumptions as to the statistical skills of an audience – they should be non-technical and use clear language that any member of the business audience can understand.
• They should be visually appealing – effective visual design helps engagement with read-ers, many of whom might not be used to engaging with findings from research reports.
Oral presentation
The entire marketing research project should be presented to the management of the organi-sation that has commissioned the research (bearing in mind this may be in-house). The oral presentation will help decision makers understand and accept the written report. Any pre-liminary questions that decision makers may have can be addressed in the presentation. Because many executives form their first and lasting impressions about the project based on the oral presentation, its importance cannot be overemphasised.22
The key to an effective presentation is preparation. A written script or detailed outline should be prepared following the format of the written report. The presentation must be geared to the audience. This audience may physically be in the same room as the researcher(s) and/or they may be at remote locations through video-conferencing. Wher-ever the audience is located, the researcher should determine the backgrounds, interests and involvement of those in the project, as well as the extent to which they are likely to be affected by it. The presentation should be rehearsed several times before it is made. Visual aids such as tables and graphs should be displayed with a variety of media. Flip charts

848 Marketing Research
mounted on an easel enable the researcher to manipulate numbers or respond in a spontane-ous manner. They are particularly useful in communicating answers to technical questions. Visual aids can also be drawn on the pages in advance, and the speaker flips through the pages during the presentation. Although not as flexible, magnetic boards and felt boards allow for rapid presentation of previously prepared material. Overhead and high-definition projectors can present simple charts as well as complex overlays produced by the succes-sive additions of new images and even certain objects to the screen. The use of presentation packages such as PowerPoint or Keynote help, but the presenter must not lose sight of the message. They must not just think that the audience have to be ‘talked to,’ and must put every effort into engaging them. The value of ‘performance’ in presenting research find-ings is illustrated in the following example.
Real research Researching international millionaires23
In presenting the findings of a study for the Swiss Bank UBS (www.ubs.com), Spring Research (www.springresearch.co.uk) deliv-ered a one-day workshop that brought together over 30 stakeholders from Publicis Starcom (UBS’s media partner) and UBS teams. This grouping brought together a broad mix of experience and creativity. Spring wanted to hold the session in a cli-mate where people felt confident about themselves and could work well with one another. It picked a comfortable, relaxed hotel in Zurich that allowed freedom of move-ment. Spring arrived early to dress the room with insights, images and stories of indi-viduals who took part in the research as it wanted the environment to act as a stimulus. All workshop participants were given an HNWI (High Net Worth Individual, the type of participant the research project had focused upon) in advance of the session and asked to spend time thinking about this person’s needs, wants and desires. The workshop began with objectives for the day and a quick introduction on the state of the market. Spring then asked the workshop participants to really get into the minds of the HNWIs. Each was asked to get into character and then form into teams of eight people. In their teams, each individual was asked to introduce themselves before being interviewed by a journalist from ‘The Examiner’ (a fake national newspaper), who was tasked with find-ing out as much as possible about them and their colleagues. Each team was then asked to put together a ‘front-page story’ that would give the world the inside scoop on the audience’s lives. Each team was then asked to present its story to the rest of the group. As well as the individual consumer profiles, the teams put together verbatim comments and six short films to bring to life individuals and key themes. There was some reluc-tance about role playing before the event, but for many it ended up being the most rewarding element as they really got into the minds of the people they wanted most to reach. The level of involvement generated through this approach ensured greater own-ership and commitment to the outcomes of the research from UBS and Publicis Starcom, and really helped introduce consumer insight directly into the ‘bloodstream’ of each organisation. It also enabled Spring to fast-track ideas as the right people were in attendance, so the session worked as an effective means of taking key decision mak-ers on a journey that led to consensus and an agreed forward direction that was able to be acted on immediately.

849Chapter 28 Communicating research findings
After the presentation of research findings, decision makers should be given time to read the report in detail. This means that there are two other tasks for the researchers after the oral presentation. First, the researcher should help the client understand and implement the find-ings and take follow-up action. Second, while it is still fresh in the researcher’s mind, the entire marketing research project should be evaluated.
Assisting the client
After the client has read the report in detail, several questions may arise. Parts of the report, particularly those dealing with technical matters, may not be understood and the researcher should provide the help needed. Sometimes the researcher helps implement the findings. Often, the client retains the researcher to help with the selection of a new product or advertis-ing agency, development of a pricing policy, market segmentation or other marketing actions. An important reason for client follow-up is to discuss further research projects. For example, the researcher and decision makers may agree to repeat the study after two years. Where possible the researcher should also aim to make links between the findings of a pro-ject and other studies. By reviewing ‘historical’ findings in the context of current issues, project findings can be seen as more valid and decision makers may increase their trust in the process.24 Finally, the researcher should help the client firm make the information generated in the marketing research project a part of the firm’s decision support system. Ad hoc mar-keting research should be seen as a significant component of an ongoing link and under-standing of target consumers.
A key element of researchers being able to assist marketing decision makers is the level of trust that exists between the two parties. The nature of personal interaction between manag-ers and researchers is very important in creating trust in the researcher and consequently in the results of the research. The quality of personal interaction affects managers’ perceptions of the overall quality of the report itself. Trust between the decision maker and the researcher has been found to influence the perceived quality of user–researcher interactions, the level of researcher involvement, the level of user commitment to the relationship and the level of market research utilisation.25
A warning: avoiding oversimplification
While it is important to make sure that research findings are communicated in a clear way, it’s equally important to ensure that research findings are not ‘dumbed down’ or oversim-plified. Given the increasingly complex nature of techniques available to marketing researchers, together with the growing volumes of data open for analysis, the complexity of findings has also increased. Research findings are often not absolutely clear, but this is a characteristic of research and why it is managers who must, ultimately, make decisions. For example, what does a p value of 0.05 actually mean in terms of a business decision? Understanding the difference between statistical significance and real-world importance is an important part of this managerial decision-making process. This issue can be demon-strated by a piece by Science journalist and Statistics Professor Regina Nuzzo, who asked a number of leading statistical experts to explain the concept of the p-value in simple terms – they couldn’t:26
What I learned by asking all these very smart people to explain p-values is that I was on a fool’s errand. Try to distill the p-value down to an intuitive concept and it loses all its nuances and complexity. Then people get it wrong, and this is why statisticians are upset and scientists are confused. You can get it right, or you can make it intuitive, but it’s all but impossible to do both.
Research follow-up

850 Marketing Research
Evaluating the research project
Although marketing research is scientific, which may seem to imply a rigid, systematic pro-cess, it clearly involves creativity, intuition and personal judgement. Hence, every marketing research project provides an opportunity for learning, and the researcher should critically evaluate the entire project to obtain new insights and knowledge. The key question to ask is: ‘Could this project have been conducted more effectively or efficiently?’. This question, of course, raises several more specific questions. Could the problem have been defined differ-ently so as to enhance the value of the project to the client or reduce the costs? Could a dif-ferent approach have yielded better results? Was the research design that was used the best? How about the method of data collection? Should an SMS survey have been used instead of an online survey? Was the sampling plan employed the most appropriate? Were the sources of possible design error correctly anticipated and kept under control, at least in a qualitative sense? If not, what changes could have been made? How could the selection, training and supervision of fieldworkers be altered to improve data collection? Was the data analysis strategy effective in yielding information useful for decision making? Were the conclusions and recommendations appropriate and useful to the client? Was the report adequately written and presented? Was the project completed within the time and budget allocated? If not, what went wrong? The insights gained from such an evaluation will benefit the researcher and the subsequent projects conducted.
Summary Communicating research findings is the final step in the marketing research project. This process begins with interpretation of data analysis results and leads to conclusions and recommendations. Typically, a formal report is written and an oral presentation made. However, researchers should not view dissemination of the report as sufficient on its own to ensure the research findings are followed. After decision makers have read the report, the researcher should conduct a follow-up – assisting management and undertak-ing a thorough evaluation of the marketing research project.
For the researcher, the oral presentation is usually considered the end of what could have been months of long hours, exhausting travel and intense data analysis, all in search of the valuable insights. The presentation is delivered and the researcher may see it is finally over, and time to move on to the next project. For the receiver of the research report, this may be just the beginning. The researcher may have delivered some pro-vocative insights and may have considered every possible angle. Reports, however, can raise more questions, and decision makers may want more details.27 The researcher has to consider how to assist decision makers to get the most out of reports and presenta-tions. Researchers also have to learn from the experience of presenting their findings, in order to plan more creative, efficient and effective research in the future.
As within other areas of marketing research, technology is enabling reports and pres-entations to be delivered in far more engaging and relevant formats. With the use of mobile technology, this can mean that research users can access reports and presenta-tions anywhere and at any time. The uses of digital dashboards in marketing research are facilitating new ways to present reports. Digital dashboards can enable research data to be interrogated and juxtaposed with performance data from across an organi-sation. With these new forms of communicating research findings, the old style linear research report may become of less import.
This last example presents a metaphor on the use of the guitar in supporting presenta-tions. It is a final reminder that digital developments that facilitate professional pres-entations can never replace the creative skills of conveying the story and impact of a piece of research upon a decision-making situation.

851Chapter 28 Communicating research findings
Real research My paradigm is the guitar28
Developments in modern technology have had a profound impact on the art of business presentation. There is no doubt that the standard of visualisation in presentations has improved immeasurably, but has the presentation itself? Technically good presentations are becoming commonplace, perhaps even predictable. Predictability precedes bore-dom. Presenters spend too much time creating a slide show and not enough on their performance. Presenters have forgotten to plan their personal involvement and the involvement of their audience.
My paradigm is the guitar. The guitar represents a tool that supports presentation, but that can never do the performance for you. From my own experience as a guitarist, pres-entations and gigs have many parallels. You have to prepare diligently, and have a good plan for the progress of the performance. You should know your material. You must be able to excite the audience and get them involved. You must be able to improvise and respond to requests. You should have a good guitar, but the good guitar on its own won’t carry the day. You will.
Questions 1 Why is the quality of report presentation vital to the success of a marketing research project?
2 What is the difference between dissemination and communication of research findings?
3 Describe a commonly used format for writing marketing research reports.
4 Why is the ‘limitations and caveats’ section included in the report?
5 Discuss the importance of objectivity in writing a marketing research report.
6 Describe the guidelines for report writing.
7 What is an infographic? Why can visual communication techniques sometimes be more effective than text at communicating research findings?
8 What is a pie chart? For what type of information is it suitable? For what type of information is it not suitable?
9 Describe a line chart. What kind of information is commonly displayed using such charts?
10 What are the advantages and disadvantages of presenting data using 3D charts?
11 What is the purpose of an oral presentation? What guidelines should be followed in an oral presentation?
12 To what extent should researchers interpret the information they present in a report?
13 Why should marketing research projects be evaluated after they have been completed?

852 Marketing Research
Exercises 1 Obtain a copy of an old marketing research report (many marketing research agencies or companies that have commissioned research will provide copies of old reports for educational purposes). Evaluate the ways in which you could improve the structure and style of presentation in this report.
2 Prepare an oral presentation of the report above, to be targeted at senior marketing managers. Deliver your presentation to a group of fellow students (role playing the managers) and ask them to critique the presentation.
3 Finally, for the same report create an infographic that will be effective at communicating research findings to a broad and non-technical group.
4 You are a researcher preparing a report for a high-tech firm on ‘The potential demand for electric cars in Europe’. Develop a format for your report. How is that format different from the one given in this book? Discuss the format and purposes of each section with your boss (role played by a student in your class).
5 In a small group, discuss the following issues: ‘Writing reports is an art. Presenting reports is an art. Reading reports is an art. It is all a matter of art.’ and ‘Writing a report that is concise and yet complete is virtually impossible as these two objectives are conflicting.’
Notes
1. Bernstein, A., Robin, L. and Zych, M., ‘The art of research narratives – impact through entertainment’, ESOMAR Annual Congress, London (September 2006).
2. Pearlman, E., ‘Robert I. Sutton: Making a case for evidence-based management’ (2006), http://www.cioinsight.com/c/a/Expert-Voices/Robert-I-Sutton-Making-a-Case-for-EvidenceBased-Management, accessed 3 May 2016.
3. Pfeffer, J. and Sutton, B., Hard Facts, Dangerous Half-Truths, and Total Nonsense: Profiting from Evidence-based Management (Cambridge, MA: Harvard Business Review Press, 2006).
4. Tufte, E., The Cognitive Style of PowerPoint, 2nd edn (Cheshive, CT: Graphics Press, 2006)
5. Saxton, G. and Davidson, A., ‘The business of storytelling with qualitative research’, Market Research Society: Annual Conference (2009).
6. Johnston, A., ‘It’s engagement, but is it research? Effectively engaging decision makers’, ESOMAR Qualitative Research, Istanbul (November 2008).
7. Dolnicar, S. and Lazarevski, K., ‘Methodological reasons for the theory/practice divide in market segmentation’ Journal of Marketing Management, 25 (3–4) (2009), 357–73.
8. Few. S., Show Me the Numbers: Designing Tables and Graphs to Enlighten (Burlingame, CA: Analytics Press, 2004); Tufte, E.R., Visual Explanations: Images and Quantities, Evidence and Narrative (Cheshire, CT: Graphic, 1997); Fink, A., How to Report on Surveys (Thousand Oaks, CA: Sage, 1995).
9. Birks, D.F., ‘Market research’, in Baker, M.J. (ed.), The Marketing Book, 3rd edn (Oxford: Butterworth–Heinemann, 1994), 262.
10. Heeg, R., ‘We have some catching up to do’, Research World (November 2004), 6–7.
11. Keys, T. Jr, ‘Report writing’, Internal Auditor 53 (4) (August 1996), 65–6.
12. Anon., ‘What you say’, Advertising Age 79 (14) (April 2008), 4; Wolcott, H.F., Writing Up Qualitative Research, 2nd edn (Thousand Oaks, CA: Sage, 2001); Britt, S.H., ‘The writing of readable research reports’, Journal of Marketing Research 8 (2) (May 1971), 265. See also Mort, S., Professional Report Writing (Brookfield, IL: Ashgate, 1995); Shair, D.I., ‘Report writing’, HR Focus 71 (2) (February 1994), 20.
13. Anon., ‘New international aims for young readers with quick response codes in news stories’, Marketing Week 31 (11) (March 2008), 13; Low, G.S., ‘Factors affecting the use of information in the evaluation of marketing communications productivity’, Academy of Marketing Science Journal 29 (1) (Winter 2001), 70–88; Boland, A., ‘Got report-o-phobia? Follow these simple steps to get those ideas onto paper’, Chemical Engineering 103 (3) (March 1996), 131–2.
14. van Meel, I. and Rietberg, J., ‘Information à la carte – the need to select, prepare and present’, ESOMAR Congress, Montreux (September 2009).
15. Wallgren, A., Wallgren, B., Persson, R., Jorner, U. and Haaland, J.A., Graphing Statistics and Data (Thousand Oaks, CA: Sage, 1996); Tufte, E.R., Visual Display of Quantitative Information (Cheshire, CT: Graphic, 1992).
16. Dagen, B., ‘Dashboards and scorecards aid in performance management and monitoring’, Management Science (September 2007), 23–7.

853Chapter 28 Communicating research findings
17. Dover, C., ‘How dashboards can change your culture’, Strategic Finance 86 (4) (October 2004), 42.
18. Dagen, B., ‘Dashboards and scorecards aid in performance management and monitoring’, Management Science (September 2007), 23–7.
19. Koornstra, S. and de Nooij, G.J., ‘Monitoring brand health – the worldwide Heineken brand dashboard’, ESOMAR Annual Congress, Cannes (September 2005).
20. Macer, T. and Birks, D.F., ‘Digital dashboards: An enquiry among research buyers and research providers’, Consultancy Report (April 2010).
21. Frost, A. Stuart, T. and Puleston, J. (2015). ‘Exploring the use of visuals in the delivery of research data’. ESOMAR Congress, Dublin (September 2015).
22. Bendzko, A. and Ricketts, A., ‘No more death by research debrief: Innovative ways to convert insights into action’, ESOMAR Annual Congress, Berlin (September 2007); Desiderio, L., ‘At the sales presentation: Ask and listen’, ID 38 (4) (April 2002), 55; McConnell, C.R., ‘Speak up: The manager’s guide to oral presentations’, Health Care Manager 18 (3) (March 2000), 70–7; Verluyten, S.P., ‘Business communication and intercultural communication in Europe: The state of the art’, Business Communication Quarterly 60 (2) (June 1997), 135–43.
23. Hamburger, S. and Lawry, P., ‘Storytelling with international millionaires – a creative approach to research’, ESOMAR Annual Congress, Montreal (September 2008).
24. Eshpeter, B., ‘Communicating research findings: Eight common pitfalls’, Imprints (January 2004), 8–9.
25. Niven, A. and Imms, M., ‘Connecting with clients: Re-thinking the debrief’, Market Research Society: Annual Conference (2006); Moorman, C., Deshpande, R. and Zaltman, G., ‘Factors affecting trust in market research relationships’, Journal of Marketing 57 (January 1993), 81–101; Deshpande, R. and Zaltman, G., ‘Factors affecting the use of market research information: A path analysis’, Journal of Marketing Research 19 (February 1982), 25.
26. Aschwanden, C., ‘Not even scientists can easily explain p-values’, (2015) http://fivethirtyeight.com/features/not-even-scientists-can-easily-explain-p-values/, accessed 3 May 2016.
27. Bendzko, A. and Ricketts, A., ‘No more death by research debrief: Innovative ways to convert insights into action’, ESOMAR Annual Congress, Berlin (September 2007).
28. Willetts N.J., ‘Going live’, Marketing Week (13 November 1997), 47–8.

854
Business-to-business (b2b) marketing research
The management of customer
relationships is the core task
of the b2b marketer. The
researcher must help to unlock
the nature and dynamism of
these relationships.
Stage 1
Problem definition
Stage 2
Research approach developed
Stage 3
Research design
developed
Stage 4
Fieldwork or data
collection
Stage 5
Data integrity
and analysis
Stage 6
Communicating research findings
29

855Chapter 29 Business-to-business (b2b) marketing research
Objectives
After reading this chapter, you should be able to:
1 explain what b2b marketing is;2 describe the differences between b2b and consumer marketing;3 explain the marketing research challenges that emerge from the differences between b2b and
consumer marketing decision making;4 understand how the concepts of networks and relationships underpin the distinctive challenges faced
by b2b decision makers;5 understand what competitor intelligence is and how it may supplement or even take the place of
marketing research for some businesses;6 appreciate how technology is shaping the way in which b2b research is planned and administered.
Overview
This chapter starts by defining the nature of b2b marketing, presenting a definition that introduces the concept of ‘relationships’. This is followed by a short introduction to the differences between b2b and consumer marketing. Understanding these differences is crucial to the effective practice of b2b marketing research. The chapter then sets out the key underlying concepts of relationship and networks that frame b2b marketing decision making. The key differences between b2b and consumer marketing are then outlined and explained in more detail. The ‘threat’ to conventional marketing research is explored, with a review of the growth of competitor intelligence and the ethical issues that accompany it. We frame this chapter by examining how technology is influencing approaches to b2b marketing and, in turn, b2b marketing research.
We begin with two examples illustrating how marketing research may be used in b2b marketing. The first example demonstrates the use of social media techniques within b2b marketing research. It highlights a technique that could be used by any consumer marketing organisation to generate insights. As such, this illustrates the point that all the techniques that have been presented and discussed in this text can also be used in a b2b context. It might also be used as an example to support the argument that there is no difference between marketing research in b2b contexts compared with consumer marketing.
Real research b2b social media research with Maersk1
Maersk is a global shipping and energy company, has 88,000 employees and operates in more than 130 countries with revenues of in excess of 40 billion dollars. It is an effective user of social media and operates nine different channels, including LinkedIn (www.linkedin.com/company/maersk-line). It has several closed groups that enable shipping experts to debate industry challenges – with names such as the ‘Shipping Circle Group’ and the ‘Reefer Circle Group’. This gives Maersk access to shipping knowledge it would not otherwise be able to access and, at the same time, enables customers to co-create products with Maersk. This gives Maersk the ability to communicate with experts in the field as well as its own customers for research purposes.
The second example illustrates the breadth of decision-making areas that b2b research can support – in this case the importance of the interplay between price and delivery times. As with the first example, it highlights how similar techniques used in consumer research (in this example: conjoint analysis) can be applied to b2b research.

856 Marketing Research
Real research Understanding the relationship between prices and sales at Premier Farnell2
Premier Farnell (www.premierfarnell.com) markets and distributes electronic compo-nents and related industrial products from more than 3,000 suppliers. Premier Farnell’s proposition rests upon consistently reliable, appropriately priced deliveries. Working with specialist b2b research agency Circle Research (www.circle-research.com), Premier Farnell needed to answer the following questions:
• What is the relationship between delivery price and sales?
• What price premium do ‘value add’ elements of delivery justify (e.g. speed)?
• What is the optimum price for each delivery option – the point at which Premier Far-nell can maximise profitability?
Circle was aware that Premier Farnell was going to make major commercial decisions on the basis of the research, so it needed to be highly reliable. Buying decisions involve a very complex and subtle relationship between price and benefit, and this relationship needed to be investigated if the research was to provide an accurate steer.
More than 2,000 customers globally were surveyed. Conjoint analysis (Chapter 26) was used to help understand the relationship between features, price and purchase behaviour. Different elements of the delivery proposition (including price) and the dif-ferent levels at which these might be realistically set were identified, such as different delivery speeds. Using this information, a series of hypothetical delivery propositions were created, each with slightly different features and prices. These hypothetical offer-ings were then grouped into sets of three and customers were asked which one, if any, they would be most likely to buy under.
This was repeated several times until hundreds of potential combinations had been compared. Analysis of these data was then used to reveal the level of demand under dif-ferent feature combinations and at different price points. This exercise revealed which aspects of the delivery proposition held greatest value and helped build an understand-ing of how changes in pricing would impact sales.
What is b2b marketing and why is it important?
The term ‘b2b marketing’ is a relatively new one used to describe business marketing, indus-trial marketing or even organisational marketing. It is often viewed in comparison to tradi-tional consumer marketing (typically called ‘b2c marketing’). It is a simple acronym that was initially used to distinguish online business transactions, but is now used as the generic term for business marketing. In very simple terms b2b means businesses that sell products or services to other businesses.
Having highlighted similarities, it is important to acknowledge that there are many researchers who believe that b2b marketing research has distinctive characteristics that set it apart from consumer marketing research. This view is supported by a professional group, the Business Intelligence Group (BIG) (www.b2bresearch.org), which was launched in 2001 to support the interests of individuals involved in b2b marketing research. We will start by evaluating the question of whether there really are distinctive characteristics of b2b market-ing decision making that may require a different approach to marketing research. To begin such an evaluation, we continue by looking at the nature of b2b marketing and the similari-ties and distinctions when compared with consumer marketing.

857Chapter 29 Business-to-business (b2b) marketing research
But why do we need a separate term for b2b marketing? The answer is that marketing focus is often driven by the issues and problems faced by managers in consumer marketing sectors. For example, many industry surveys of the opinions of ‘leading’ marketers focus on managers of large consumer-facing brands. Yet, despite this focus on consumer markets, b2b markets typically make up a larger portion of GDP in developed countries.3 This would not matter so much if b2b marketing managers faced the same set of issues as those in their consumer-facing counterparts. However, the similarity of the terms ‘b2b’ and ‘b2c’ masks the many differences in carrying out b2b marketing and subsequently b2b marketing research.
We can understand b2b marketing better by looking at two definitions. In the first, Dibb et al.4 highlight the activities involved in the process of exchange between two parties. This definition presents little distinction between b2b marketing and the generic process of mar-keting, with the primary difference being the nature of markets and producers:
Industrial [b2b] marketing concerns activities directed towards facilitating and expediting exchanges between industrial markets and industrial producers.
In the second definition, Ford et al.5 present a view of b2b marketing that goes beyond the more traditional marketing notions of exchange, as presented above:
Business [b2b] marketing is the task of selecting, developing and managing cus-tomer relationships for the advantage of both customer and supplier, with regard to their respective skills, resources, technologies, strategies and objectives.
In this definition the key element is the task of managing customer relationships. This can be seen as a process that goes beyond the facilitating and expediting of exchanges of goods, although it could be argued that the facilitation of exchanges can include the management of relationships. Nonetheless, Ford et al.’s emphasis upon the management of relationships forming the essence of b2b marketing could lead to the case that there are more differences than similarities between b2b marketing and consumer marketing.
The distinction between b2b and consumer marketing
There are many products and services that may be clearly identified as b2b transactions, such as electrical components used in the manufacture of earthmoving equipment. Other products and services, which at first glance may appear to be b2b transactions, may also be sold to consumer markets. The distinction between b2b and consumer marketing might best be thought of as a continuum, with purely b2b products/services at one end and purely b2c products/services at the other. At the extremes of b2b marketing lie services that are sold to governments, sometimes labelled ‘b2g’ marketing. For example, in the market for nuclear-powered submarines there is typically only one purchaser (a national government) but also only one supplier (a nationally supported defence contractor).
Other examples of products and services that may be bought by both businesses and con-sumers include: cars, private health insurance, meals in restaurants, laptop computers and stationery equipment – the list could go on. The key factor that distinguishes b2b and con-sumer transactions is the purpose for which products and services are sold.6 In b2b transac-tions, products are bought for resale or for the production of other goods, and services are bought to facilitate the resale and production of goods. In consumer transactions, products and services are generally bought for oneself, the household or as gifts. This distinction clearly does not rule out consumers reselling products, as a search on eBay (www.ebay.com) for unwanted gifts would quickly reveal!
The underlying reason for differences between b2b and consumer marketing has often been based on an idea that business consumers tend to be seen as rational buyers, while con-sumers tend to be seen as more intuitive and emotive. In examining the differences between

858 Marketing Research
business and consumer purchases, it is difficult to dispel these persistent images of profes-sional committees deciding proactively on organisational purchases, and wilful or manipu-lated individual consumers engaging in semi-rational or impulsive buying behaviour.7 These stereotypes can be only defended by carefully selecting examples to illustrate the argument. For example, if we were to contrast the buying decision for a train manufacturer selecting the supplier of braking mechanisms compared with a consumer buying chocolates, there would very different time frames and stages to the decision-making process. If we were to compare the differences between the two sectors in the decision to buy a Christmas hamper as a gift, the time frame and stages to the decision-making process may be very similar. The purposes behind the decision to buy a Christmas hamper may also be very similar. There are also many examples of consumer purchasing that may be very ‘professional’ in terms of knowl-edge of prices, quality, source reliability, product availability and product applications. Such ‘professional’ purchasing behaviour has been supported by the growth of price comparison sites (e.g. www.moneysupermarket.com or www.uswitch.com). There are clearly many grey areas between a notion of business purchasing equating to being rational and ‘professional’ and consumer purchasing equating to being emotive and impulsive.8 The task of setting out clear differences is difficult given the breadth of products and services that are purchased by businesses and consumers and the great overlap in the nature and intention of the purchase. Many years ago, one of the foremost industrial marketing writers, Frederick Webster,9 rec-ognised that many of the differences may be only by degree, but that there are substantial differences:
If we are to understand and intelligently attack industrial marketing problems, a number of substantial differences between industrial and consumer marketing must be recognized. While it may be true that these are often differences of degree rather than kind, the degrees of difference are substantial.
Before we examine the impact of these differences for the b2b researcher, two factors at the heart of the defence for the distinction of b2b marketing need addressing, namely relation-ships and networks. These factors are founded in Ford et al.’s definition of business market-ing and are the basis for the contention that there are fundamental differences between b2b and consumer marketing, and thus differences in the approaches and challenges faced by b2b and consumer researchers.
Concepts underlying b2b marketing research
Relationships
Ford et al. use the term ‘relationship’ to describe ‘the pattern of interactions and mutual con-ditioning of behaviours over time, between a company and a customer, a supplier or other organisation’.10 The time dimension of a relationship requires decision makers to shift their emphasis away from each single discrete transaction towards tracking how things unfold in the relationship over time and changing them when appropriate. Relationships with business customers are likely to be complex. A business’s relationships with its suppliers, develop-ment partners and financial institutions that constitute its network all depend upon its rela-tionships with its customers and on solving their problems in those relationships. Ford et al. make the clear distinction between the growth of customer relationship management (CRM) systems and the stream of books and articles dealing with ‘relationship marketing’. They contend that the idea that underpins most relationship marketing literature is that relation-ships are the creation of the marketing company. Such views do not help b2b marketers, who have to cope with:
• The history of their relationship and the impact of those events upon how different indi-viduals in separate businesses react to each other.

859Chapter 29 Business-to-business (b2b) marketing research
• Relationships that are not necessarily positive and coping with differences in aims and understanding that may result in conflict as well as cooperation.
• Both businesses interacting with each other, and both attempting to manage the relation-ship in a way that they think appropriate.
The b2b relationship is not a relationship that is managed in a unilateral manner, i.e. a rela-tionship that the marketer can ‘drive’. CRM systems that hold the details relating to every customer, which are typically used to ensure all interactions with the customer are consistent and knowledge driven, are typically ‘unilateral’. Though CRM systems may measure and model characteristics of transactions that develop over time, they are electronic observations of measurable characteristics of those transactions. CRM systems are not a means to acquire a realistic understanding of the rich and qualitative complexities of continually developing b2b relationships.
In the context of understanding networks and relationships, the prime objective of researchers in business markets is to establish and support an understanding of how suc-cessful relationships evolve and how networks operate. There is a need to understand how networks develop and how businesses and individuals in them relate to each other. By being able to recognise patterns of behaviour in the network, businesses should gain some guid-ance on how they should act and react. To develop such an understanding of patterns requires more than analysis in the traditional sense of gathering and interpreting the avail-able data on patterns of sales and market shares. It means capitalising on the tacit knowl-edge inside the business and in other networked businesses. Tacit knowledge in this sense could mean, for example, understanding the psychological barriers that may exist in manag-ers when presented new offerings that evidently offer better monetary value than they get from their present suppliers. They may have worked with their present suppliers for many years and developed economically and socially together; what price would they pay to sever that relationship?
The network
Is has been argued that the transactions between a business supplier and its custom-ers are not isolated events that are unrelated to each other.11 Instead, each of the transac-tions takes place in a relationship and each is related to the previous experience of the companies and what they plan for the future. Business marketers have relationships with their suppliers, and these relationships are vital if the marketer aims to build strong relationships with their customers. Each of their suppliers will have relationships with other suppliers and with their customers. All of these relationships are affected by the other ones and are intertwined in a network, and it is in this network that the b2b market operates. The distinctive element of seeing b2b marketing as a series of relationships in a network is that, if researchers wish to understand the behav-iour of an individual company, then they have to understand its relationships with other com-panies. Businesses are not seen as free agents, able to develop and implement their strategy in isolation; each is dependent upon the other in order to act and react to the strategies of others. In other words, the basic assumption of network thinking is that ‘no business is an island’.12 Figure 29.1 illustrates a distribution network from the perspective of a large sup-plying company: IBM. The figure demonstrates the different ways that computers can reach customers in Italy.
In order to understand a network, a focal relationship is usually chosen. By choosing a particular relationship the network can be examined from that perspective. As soon as the

860 Marketing Research
focal relationship changes, a new set of relationships emerges. By examining a network care-fully, b2b marketers can achieve a realistic and balanced understanding of their own position in the minds of customers and suppliers. It is very important to evaluate the network from different focal points because drawing the network from the perspective of just one business can lead it to believe that it is more important to others than it actually is. The existence of a network should not cloud the fact that the key task of b2b marketing is to manage each single relationship. It is through its relationships that a business learns and adapts to its surrounding network, that a business exploits and develops its own abilities and gains access to others; and it is also through relationships that a business can influence different businesses else-where in the network.
Faced with such a challenge in understanding networks and relationships, b2b research-ers have all the techniques as detailed and illustrated in this text, at their disposal. Having the techniques available is one thing; implementing them is another. The challenge for b2b researchers is to adapt creatively and develop the techniques to overcome the obsta-cles in the b2b environment. In order to understand the challenge set for these researchers we now examine the implications they face from the differences between business and consumer purchases.
Figure 29.1
IBM’s distribution network
Joint venturepartner
Independentdistributors
Value-addedreseller
IBM
Softwarehouse
Installer
Mail ordercompanies
Value-addeddistributors
Dedicatedpartners
Full-serviceretailers
Othersuppliers
Component suppliers
End usersEnd users Y ZX
B C DA
Implications of the differences between business and consumer purchases for researchers
The differences between b2b and consumer purchases have implications for the approach, research design and individual data gathering and analysis techniques that may be employed by researchers. We now examine the nature of the differences between business and con-sumer marketing and the challenges faced in applying marketing research techniques, using the framework of arguments as presented by Ford et al.13 As we work through the individual

861Chapter 29 Business-to-business (b2b) marketing research
Figure 29.2
Summary of differences between b2b and consumer marketing
b2b marketingtends towards
High
Consumer marketingtends towards
Low
Key di�erences between b2b and consumer marketing
1 Number of people involved in purchasing decision
More rational More emotive2 Professionalism of those involved in the purchasing decision
Lengthy Short3 Time taken to negotiate from decision to buy to actual purchase
High Low4 Importance of individual consumer to supplier
Joint negotiation Unilateral5 Relationship development
challenges you will also see how these challenges become interrelated. The five key differ-ences are summarised in Figure 29.2 and then individually evaluated.
Number of people involved in purchasing decision
The concept of the ‘buying centre’ is well established in business purchasing. Collective decisions are more typical of complex, expensive or controversial purchasing decisions in larger businesses, whereas routine decisions and/or decisions made by smaller organisations are typically made by individuals rather than by groups.14 However, even in cases of deci-sions apparently made by an individual, there could still be many other roles of influence involved in the phases of the purchasing process before and after the actual decision itself.
Webster and Wind famously identified five buying ‘roles’ within the context of ‘buying centres’.15 We can illustrate these roles by using an example of a b2b scenario involving an FMCG business buying marketing research services:
1 Users. This may be a brand manager seeking marketing research support for the decisions faced in the launch of a new product.
2 Influencers. This may be a human resources director who has used a range of research organisations for staff surveys over the past two years.
3 Buyers. This may be a purchaser who is responsible for drawing up a research brief, con-tacting research organisations, gathering research proposals and managing the negotiation process.
4 Deciders. This may be the marketing director if the budget for the project exceeds a set amount.
5 Gatekeepers. This may be another brand manager who may be supportive or downright secretive and may help or hinder in feeding information and the interpretation of that information.
Further categories have been suggested such as those of:
6 Initiator.16 This may be a more senior manager to the brand manager, who recognises the decision problems faced by the brand manager/user and encourages that manager to purchase marketing research support, or even champions the case for marketing research support.
7 Analyst.17 This may be an individual who has the technical ability to evaluate critically the offerings and associated costs as presented in the proposals from competing research agencies.

862 Marketing Research
8 Spectator. This may be the brand manager of a competing brand who may react in the way the brand manager/user desires. A feeling of ‘sheer panic’ may be introduced by the thought that the competition is employing a major ethnographic study to support the development of a new integrated communications strategy.
This example shows eight people involved in the decision. In some organisations, these roles may be performed by one person, in others there may be numerous influencers and gatekeepers, sometimes working in different managerial functions, hierarchical levels and geographic locations. The people in the ‘buying centre’ will have different needs because of their different responsibilities, so a buyer is likely to be more interested in price and contrac-tual details than a user is. Behind these roles there are individuals who will have their own perceptions, expectations and objectives based on their personalities and backgrounds.18 The researcher needs to help decision makers measure and understand these individuals and their interrelationships.
Marketing research challenges. The main challenge of the number of people involved in a business purchase is one of sampling. In a team such as that illustrated above, who would be the target element when putting together a sampling plan? Even if there were sampling frames that listed the managerial roles of individuals in an organisation, it is highly improb-able that they would be listed by their roles in a ‘buying centre’. The following views of the researcher Ruth McNeil illustrate this point.
Real research Open for business?19
Sampling is becoming ever more demanding. Clients are requiring specialist samples, targeting particular people with particular job titles or skill sets. Such detailed specifica-tions require the fieldwork company to know both where to find and how to access good lists. The absence of good, globally relevant sampling frames is still an issue. Given that SIC codes are rapidly becoming out of date, the increasingly specific demands for participant type mean that a b2b researcher’s skill now lies as much in finding the right participant as in conducting and analysing a good interview.
The above example illustrates something of the ‘detective’ skills in tracking down the right participant for a survey or interview. Researchers building b2b samples via telephone typically recruit participants at their place of work, giving researchers some guarantee that participants are who they claim to be. As researchers have come to rely increasingly on online panels in b2b data collection, concerns about data quality have grown.20 These con-cerns can be justified, because a growing literature provides evidence that within online panels, participant behaviours and response patterns have the potential to compromise data quality.21 Even when researchers track down the right target participants, the challenge of getting them to respond in the manner desired can be great. This challenge is developed in the next difference between b2b and consumer purchases, discussed below.
Professionalism of those involved in the purchasing decision
The concept of the professional buyer is well established in business purchasing. Businesses use professional buyers to make economically sound purchases that support their strategic and operational decisions. Such professionals establish auditable systems of purchasing to cope with relatively cheap and routine goods through to expensive, complex and risky one-off products and services, such as the purchase of a new accounting information system in a

863Chapter 29 Business-to-business (b2b) marketing research
multinational company. Purchasing professionals in essence aim to manage b2b transactions in a rational and economic manner. The following example briefly describes the nature and mission of the professional body that represents purchasing professionals.
Real research The professional buyer – a chartered purchaser
The Chartered Institute of Purchasing and Supply (CIPS) is an international education and qualification body representing purchasing and supply chain professionals. CIPS exists to promote and develop high standards of professional skill, ability and integrity among all those engaged in purchasing and supply chain management. It is the largest organisation of its kind in Europe, and a central reference point worldwide on matters relating to purchasing and supply chain management. Its Professional Code of Ethics is the model for the international code and the domestic codes of many countries. CIPS acts as a centre of excellence for the whole profession of purchasing and supply chain management.
A body of professionals with rational, economic and ethical practices and who are audit-able in a business should make the research challenge of measuring their practices relatively easy when compared with emotive and fickle consumers. However, even assuming that it is professional buyers who make the purchasing decision, one has to consider why they would want to divulge or share their practices with researchers.
Marketing research challenges. The first major challenge for researchers targeting pro-fessionals is access. Access can be described as working at two levels:
1 Initial contact. Getting to meet target participants in the first instance so that they understand the nature, purpose and benefits of taking part in an interview or completing a questionnaire.
2 True feelings. Assuming that a researcher has managed to persuade target participants to participate, are they able to access what they really feel or think about the research sub-ject? How guarded or sensitive may the participants be in responding to the set questions and probes? Will they be responsive to research techniques that seek to uncover issues that are difficult to conceive and/or express?
An earlier example in Chapter 2 illustrated how increasingly difficult it is to gain access to chief executive officers, especially in a b2b context. It illustrated the despair faced by researchers when they are briefed to interview managers who the researchers know have been targeted in many other studies, and they realise the difficulty or impossibility of gaining access to them, at both levels of access described above.
Real research Is nothing straightforward in b2b research?22
Organisational changes are making it increasingly difficult to complete business research. It is, for example, harder to contact business executives. Routes to them are less likely to be through a secretary or even a switchboard. Phone numbers are more likely to be direct, unlisted or routed through a central department or an automatic exchange that is immune to the persuasive interviewer. On a wider level, researchers have also had to

864 Marketing Research
Beyond quantitative or qualitative interviewing, other techniques such as ethnography are increasingly difficult to conduct through the challenges of gaining initial access. In b2b eth-nography, business people may be reluctant to allow researchers into their office to shadow them, or to walk around with video cameras. Both processes are highly visible to colleagues and bosses in a way that in-depth interviews are not. While researchers can give participants incentives, for many the money given does not outweigh the inconvenience. In addition, the length of the working day and the need for work–life balance also mean that putting time aside for a lengthy research interview becomes almost impossible.23
The second level of access (‘true feelings’) also presents major challenges for the b2b researcher. The issue raised by professional purchasers at this level is whether they actually behave in a rational and economic manner and whether they understand or are willing to discuss any emotive or subjective reasons for their purchasing behaviour. The following quote illustrates that, although business purchasers may be professional and strive to be rational in economic terms, the reality is somewhat different:24
. . . consider how an SME or Owner/Manager buys. They typically buy as an indi-vidual would, but in a quasi-corporate context. The rationalist approach is strictly limited. Even where it is applicable, good qualitative research also needs to cover the irrational, spontaneous and emotional response set. They don’t stop being human beings just because they buy a suit and carry a briefcase.
The following example illustrates the techniques used by Insight Research Group to clar-ify the issues that may cloud rationalism in b2b purchases.
contend with both the seemingly inexorable conglomeration of the business world and policy changes on compliance. Increasingly, corporate policy forbids interviews – even in corporations that need, and commission, research themselves. In areas where there is a restricted pool of potential participants, one cannot afford low strike rates. It does not just take longer to complete the quotas, one just runs out of contacts.
Real research A spoonful of research helps the medicine go down25
The only difference between doctors and other consumers is that this is a classic b2b mar-ket, in which customers are not in themselves the end consumers. However, they still have a set of beliefs about the value of a brand for themselves and their patients. It is imperative, therefore, that researchers get beyond doctors’ rational and logical outer shell. They need to find a robust way to underpin functional data with the kind of emotionally driven infor-mation that could be used to feed into differentiated pharmaceutical products. Having long known that doctors were adept at assuming and maintaining a professional, logical ‘distance’ in research, the Insight Research Group began looking at how this behaviour might affect the depth of the overall findings. The often thoughtful, cogent, technical and articulate responses from doctors were in themselves something of a barrier to getting at the more fundamental drivers and triggers for prescribing that were required to make really compelling campaigns. This led to the development of a research approach that placed a greater emphasis on non-direct questioning, increased observation and interpre-tation of materials, generated from purpose-designed exercises. In small workshops, doc-tors participated in group and individual work that helped to dismantle the ‘doctor’ behaviour and facilitate access to their deeper ‘sensing’ levels. At the analysis stage, the specific sorts of communication, imagery, language and even tone that would help the brand to trigger response at both rational and emotional levels became the focus.

865Chapter 29 Business-to-business (b2b) marketing research
It could be argued that such research approaches are commonplace in consumer market-ing research; there is nothing distinctive in such an approach for b2b researchers. What makes it distinctive is the juxtaposition of the access issues discussed above, i.e. getting to interview professional purchasers in the first instance and, if access is gained, getting them to cooperate – with the implementation of qualitative techniques. The following example illus-trates the difficulties and expense involved in making such approaches work.
Real research Engineering the group discussion – the GlobalCash solution
Trying to bring together finance directors and cash managers from the largest compa-nies in Europe to participate in focus groups could be viewed as an impossible task. The logistics of bringing together such senior managers, the rewards they may demand for attending such an event and the question of how much they would reveal to other man-agers and researchers in such a forum make the whole technique questionable. The solution demanded many months of planning, great expense to create an event that would draw managers together and the careful setting of a context that made managers relaxed enough to be open with their responses. Part of the incentive to complete a GlobalCash survey was an invitation to take part in a ‘closed forum for participants’. This meant that a date was set to present findings from the survey exclusively to participants. The date and meeting place of The Management Centre in Brussels (a forum for ‘serious’ discussion of high quality) were established well in advance to allow managers the chance to put the date in their diaries. The day started with an initial session of present-ing statistical findings to the whole group of managers who had participated in a previ-ous survey. As questions were fielded in this forum, particular topics of interest were identified and focus groups (never named as focus groups but as ‘workshops’) were built around these topics. By mid-morning, groups of around 10 to 12 managers were together tackling a theme of importance to them. With a loose set of topics to develop into questions and probes, the format for a focus group was achieved.
The second major challenge of the people involved in a business purchase being profes-sional is one of interviewer credibility. The subject of an interview may be technical in nature given the complexity of the product or service. This was discussed in Chapter 8 in the con-text of qualitative in-depth interviewing. The interviewer with credibility in the eyes of the participant would appreciate the significance of particular revelations, understand the lan-guage (even technical language and jargon in certain areas) and ultimately get the participant to open up, i.e. gain a greater level of access.
The nature of networks or relationships within an industry may have a level of com-plexity that could prove to be difficult for an interviewer to comprehend. These com-plexities may not present problems when a structured interview is being conducted. However, if there are open-ended questions or areas where probing is required, as would be necessary in any qualitative interview, the ‘technical competence’ of the interviewer will be revealed. If the interviewer has technical knowledge, probing can be much more meaningful to the participant, the process of building a rapport can be much stronger and a richer and more revealing response may be obtained. In the GlobalCash example, the very precise technical nature of the subject and the seniority of the participants meant that interviewer credibility had to be tackled when the series of in-depth interviews was planned. The use of senior academics as supporting researchers from business schools in individual European countries helped in gaining access to key participants, and a local professor would be at hand to help with any language and cultural issues. The nature of the questions and probes was handled by a consultant with an international reputation in

866 Marketing Research
the field of cash management, who the participants respected, wanted to talk to and could relate to at their technical level. The consultant had knowledge of the banking techniques and, just as important, the nature of networks and relationships that operated in a highly competitive industry.
Time taken to negotiate from decision to buy to actual purchase
Given the complexity of a business customer’s requirements, the importance or value of its purchase, the number of individuals involved in the purchase and the level of their knowl-edge, and the help and advice that negotiating suppliers can give, a business purchase can be a very lengthy process. The following example illustrates the time taken for what may seem to be a simple decision, i.e. to choose to work with a new bank.
Real research Interfering parents
Hitachi Europe operated from offices in the UK and Germany. They managed transac-tions with wholesalers and retailers through-out Europe involving the euro and other currencies, e.g. Swiss francs and British pounds. They managed these transactions and the relationships with the parent com-pany in Japan through a number of domes-tic and international banks. One of the key challenges that Hitachi Europe faced was trying to simplify the process of managing transactions and cutting down on the expense incurred in its thousands of transac-tions. The first route that it took was to purchase and implement a new accounting system, which in itself took three years from the moment of recognising the nature of the problem through to evaluating possible solutions, negotiations with alternative suppliers and on to buying and implementing the system through to changes in prac-tices and training the staff. The second route was to concentrate the banking business by cutting down on the number of banks Hitachi Europe had accounts with and to develop a new business relationship with a bank that had the international expertise, compatible information systems and service support of the quality level it sought. For an organisation such as Hitachi, choosing a new bank and setting up a new account was not like a consumer going into a bank branch or to a website and selecting a product from a range of standard products. The main obstacle to change faced by Hitachi Europe was the parent company’s insistence that the European offices worked with certain Japanese banks. It is left to your imagination to appreciate the nature and intricacy of the networks and relationships between individuals working in Hitachi headquarters, regional offices, country offices, wholesalers, retailers and the banks that support their operations. Developing a new relationship between Hitachi Europe and a new bank, which would involve the demise of many established relationships, would involve much negotiation within Hitachi and between existing banks and the new bank. For Hitachi Europe, the process started at the time of choosing a new accounting system. Working with the new bank took another two years to complete, five years in all.

867Chapter 29 Business-to-business (b2b) marketing research
In this example, the compounding factors of the time taken from the moment when an issue is first raised to final delivery, emerge from the numbers of individuals who may be involved in the negotiations and the fact that they are professionals expected to present clear cost/benefit analyses. Assuming, then, that researchers can identify who to talk to and gain access to them, what new challenges emerge given lengthy decision-making processes?
Marketing research challenges. The main challenge of the time taken to make a business purchase is one of participant error.
In Chapter 13 we discussed the errors caused when administering questionnaires through the inability of participants to remember events. Telescoping takes place when an individual telescopes or compresses time by remembering an event as occurring more recently than it actually occurred.26 The ability to remember an event is influenced by: (1) the event itself; (2) the time elapsed since the event; and (3) the presence or absence of things that would aid memory. We tend to remember events that are important or unusual, or that occur frequently. Decision makers that are part of a ‘buying centre’ are more likely to remember the negotia-tions, events and individuals associated with their most recent decisions. In the Hitachi example, the time taken to conduct negotiations developed over five years. During that time, negotiations may unfold in different geographical locations, involving different business functions and types of decision maker. The personnel involved may even change as decision makers move on to other projects or other organisations. For the researcher this presents challenges in terms of accessing potential participants who were present through the process of negotiations. If such decision makers can be accessed, the next challenge is to get them to remember key events and individuals. Questions that do not provide the participant with cues to the event, and that rely on unaided recall, can underestimate the actual occurrence and nature of an event.
In Chapter 3 we discussed the non-sampling errors termed ‘response errors’. It was noted that a non-sampling error is likely to be more problematic than a sampling error. Its problem-atic nature emerges from the difficulties involved in identifying the error, measuring it and making changes in estimates. Response errors can be broken down into ‘participant inability’ and ‘participant unwillingness’:
• Inability error results from the participant’s inability to provide accurate answers. Par-ticipants may provide inaccurate answers because language and logic used in a survey or questionnaire bear no relevance to their experiences, or the question format and content may be taking them into issues that are meaningless in their work context. Such an experi-ence may result in participants suffering from fatigue, boredom and a general lack of engagement with the process of questioning. For example, in the GlobalCash example, imagine a participant being asked to respond to a series of Likert-scale items about the service quality of online technical support. Though the organisation may use such sup-port, a professional buyer responding to the scales may see the overall issue of online technical support as being of very low priority in the context of all the issues involved in negotiating with a new bank. Could the researcher trust that the participant has thought through the measured issues carefully and is being honest?
• Unwillingness error arises from the participant’s unwillingness to provide accurate information. Participants may intentionally misreport their answers because of a desire to provide socially acceptable answers, to avoid embarrassment or to please the inter-viewer, or, more especially in the b2b scenario, their answers have great commercial sensitivity and responding truthfully would reveal their commercial intellectual prop-erty. For example, to impress the interviewer participants may intentionally say that their business works with The Cooperative Bank in order to portray themselves as having relationships with organisations that profess a socially responsible agenda. They may not have any business with this bank, but would the interviewer be able to validate this response? As another example, the interviewer may pose questions about weaknesses in
TelescopingA psychological phenomenon that takes place when an individual telescopes or compresses time by remembering an event as occuring more recently than it actually occured.

868 Marketing Research
the services offered by a particular bank. The participants may consider this sensitive as the weaknesses may reveal flaws and, by implication, the individuals involved in these flaws in their own organisation. The participants may also question what may happen to their responses. If given directly to other banks in an unaggregated form, it would pre-sent all the elements required for another bank to make a sales pitch that may upset an established relationship.
Overcoming telescoping and participant errors raises fundamental questions about the techniques used to elicit information and the benefits and rewards given to participants. These types of error cannot simply be managed by larger samples, as we will explore in the next subsection.
Importance of individual consumer to supplier
An example to illustrate this difference between b2b and consumer marketing is the extreme situation of dependence that can occur in commercial aviation, where there are only two main suppliers of airliners and only a few dozen major customers. In the following example, IAG conducted research to better understand its customer needs. The outcome resulted in an analysis of and focus upon individual customers. This can occur in consumer marketing, but the depth of individual analyses and the resources allocated to important individual custom-ers are a distinctive characteristic of b2b marketing.
Real research Researching customer priorities at IAG Cargo27
IAG Cargo emerged out of the merger between British Airways World Cargo and Iberia Cargo. Its mission is to be the world’s leading air cargo provider. Specialist b2b research agency Circle Research (www.circle-research.com) worked with the organisation before its merger to identify what really mattered to its customers.
As with many b2b organisations, success is measured by operational metrics; for example, in this industry, numbers of waybills written, proportions of shipments flown-as-booked and success in notification of delivery. These metrics are business-and employee-performance indicators but are not directly related to customer satisfaction or loyalty. They may measure success but cannot shed light on what matters to cus-tomers.
A series of in-depth customer interviews were scheduled in the organisation’s princi-pal trading locations: USA, Germany, UK, India and China. The discussions were informal and enjoyable and ensured participants opened up and spoke freely. Circle also used a variety of exploratory and projective techniques to identify the most important ‘moments of truth’ when customers come into contact with the airline. Importantly, the ways in which those moments of truth sometimes fail to live up to expectations and a definition of excellence was elicited.
Armed with this information, Circle used a series of internal focus groups to establish how employees viewed their customers. What did they feel to be the most important customer priorities and, of course, what was preventing them from offering the best possible levels of service at each of those key moments?
Circle then quantified performance across the key customer touch points. With over 2,000 respondents, this was the largest survey of its kind and it enabled competitors to be evaluated against the priority touch points. This research then improved not only traditional performance indicators but enabled the customer priorities to be embedded in its culture.

869Chapter 29 Business-to-business (b2b) marketing research
Not all b2b marketers have few target customers. A manufacturer selling photocopier paper could have potentially huge numbers of businesses to sell its wares to, from major multinationals through to home businesses. In consumer marketing, a manufacturer of bespoke shoes such as John Lobb (www.johnlobb.com) may retail at ;3,000 a pair. John Lobb may have relatively small numbers of target consumers who are responsible for a sig-nificant proportion of its total sales.
In b2b and consumer marketing, examples can be found of businesses that have a few high-value customers and those that have huge numbers of customers with low-value trans-actions. In general, however, b2b marketers have a higher propensity to deal with fewer customers of high value when compared with consumer marketers. The comparison between the two is illustrated in Figure 29.3.
Figure 29.3
Customer number/value trade-off
Low
High
Number of customersn0
Val
ue o
f cu
stom
ers
Tends towards b2b marketing relationships
Tends towards consumer marketing relationships
Real research Size matters
Imagine yourself going on holiday and wanting to exchange your local currency for Australian dollars. All banks can help you make currency exchanges. The trans-action is paid for through an exchange rate that is constantly changing and a commission fee. If you were a small business conducting transactions that involved a few currency exchanges per year, then you may have to pay the ‘going rates’ at your local bank, or shop around for the best rates. However, for a company such as Renault, imagine the variation in its profits depending upon the relative value of the euro to the US dollar and how much it costs for each currency transfer. Think of the currencies that Renault may have to deal in and the number of transactions and flows of funds. To Renault, the fluctuations in cur-rency values and timing of cash transfers are crucial factors that can make the difference between sound profits and a loss. Given the volume of its business and the size of its transactions, Renault would not pay the ‘going rate’ to a bank that you or a small busi-ness would. Renault would expect a cash-management banking service tailored specifi-cally to its operations, which may be radically different from the operations and expectations of, for example, BMW. The target markets in cash-management banking

870 Marketing Research
This example illustrates how the essence of relatively few consumers may be of high value – through careful target marketing. Some businesses may have a mass-marketing strat-egy that aims to target a great breadth of business types; others may have to tailor their offer-ings specifically to suit the individual needs of quite distinctive businesses.
Marketing research challenges. The main challenge of each business customer being individually important to a supplier and responsible for a significant proportion of its total sales is one of coping with relatively few target consumers. As most quantitative marketing research techniques tend to assume large numbers of potential target consumers and survey participants, the challenge faced by b2b researchers is one of sampling methods and the sub-sequent analyses that may be performed given sample selection.
We have already presented the challenges of ‘element’ definition in a sampling plan, gaining access to participants (and the effect upon response rates) and response error. If we add on the challenge of conducting surveys when there are relatively few target participants, it is clear to see that the whole sampling process becomes very challenging.
In choosing a sampling method for a small target population, probability methods such as random and systematic sampling can be utilised. With simple random sampling it is often difficult to construct a sampling frame that will permit a simple random sample to be drawn. Simple random sampling may or may not result in a representative sample; this is the para-dox faced when drawing a random sample – one does not know if it will be representative of a target population, only the probability that it will be, within margins of error. Although samples drawn will represent the population well on average, a given simple random sample may grossly misrepresent the target population. This is more likely if the size of the sample is small, as faced in many b2b surveys.
With systematic sampling, when the ordering of the sample elements is related to the characteristic of interest the technique increases the representativeness of the sample. If busi-nesses within an industry are arranged in increasing order of annual sales, a systematic sam-ple will include some small and some large firms. A simple random sample may be unrepresentative because it may contain, for example, only small firms or a disproportionate number of small firms. Choosing the right characteristics by which to order sample elements is crucial. With the wrong criteria, systematic sampling may decrease the representativeness of the sample. Thus, the power of systematic sampling lies in the accuracy of the sampling frame and the criteria used to order or arrange the sample elements.
With the time and cost factors of sourcing and building up-to-date and accurate sampling frames, with details of sample elements, many b2b researchers will favour administrative, i.e. timing and cost, criteria in preference to statistical criteria, and ultimately be forced to use non-probability sampling techniques. Non-probability sampling relies on the personal judgement of the researcher, rather than on chance, to select sample elements. The b2b researcher would aim to build the elements to include in a sample, rather than starting from a point of having an up-to-date and accurate sampling frame that resembles the target popula-tion. Building up the sample in this manner leads the b2b researcher commonly to use judge-mental sampling and snowball sampling techniques (as discussed in Chapter 14). Samples
Non-probability samplingSampling techniques that do not use chance selection procedures but rather rely on the personal judgement of the researcher.
sought by major banks are those companies that operate internationally or even glob-ally, dealing in huge sums and a variety of currencies. There may be millions of individual transactions to manage, huge networks of transactions across many countries or very high values to the transactions. When examining the nature of businesses that fulfil these requirements, there are relatively few compared with the total number of busi-nesses, which is why the GlobalCash study, conducted on behalf of 15 of the largest pan-European banks, targeted just the largest 5,000 companies in Europe – a very small fraction of the total number of European businesses.

871Chapter 29 Business-to-business (b2b) marketing research
created using these techniques may yield good estimates of the population characteristics, but they do not allow for objective evaluation of the precision of the sample results. Because there is no way of determining the probability of selecting any particular element for inclu-sion in the sample, the estimates obtained are not statistically projectable to the population.
Real research Targeting business elites in India28
In a study of the ‘business elite’ in India (senior executives living very comfortably, travel-ling widely, consuming luxury goods and services and making important business pur-chases for their companies), many sampling challenges were faced. Though the number of participants surveyed was relatively high, researchers recognised that their work should be considered a pilot and that much more work was needed to generate a com-plete sampling frame. For their study, a systematic random sample was drawn from a ‘cleaned-up’ database of companies. In an initial telephone screening exercise, they tar-geted 1,714 companies and made successful contact with 859 of them (50.1%). They asked each of these companies: (1) who the most senior person in the company in that city was; (2) whether the company employed heads of a pre-defined list of other func-tions; and (3) what the contact details were for the most senior person and a randomly selected other function. Job functions were those core to the decision-making process and included: chief executive (most senior person); deputy chief executive/managing director (second-most senior person); head of finance; head of international/domestic sales; head of marketing and communications; head of production management/operations; head of information technology. From the interviews, they estimated that the universe of eligible business executives in qualifying companies across eight Indian cities totalled 106,307. This was based on the incidence, at each of the companies sam-pled, of a randomly generated list of job functions. They also pinpointed 1,499 execu-tives they wanted to contact, of whom 600 (40%) agreed to be interviewed face to face.
Summary of sampling challenges. While the theory of sampling is the same for all types of markets, whatever their nature, there are key differences between sampling in b2b and consumer markets. These may be summarised as:29
1 Unit definition. Is it the site (establishment), organisation, legal entity or some other busi-ness unit? Each definition offers different benefits and drawbacks, depending upon the research objectives. In consumer research, only the individual or household has to be considered.
2 Element definition. In b2b research, an individual is interviewed as a representative of the business. We have to be sure to interview the right individual in each business, and be consistent across businesses. This can be complex, as business titles and responsibilities vary widely across businesses of different sizes and sectors.
3 Heterogeneity. There is a lack of homogeneity in the business universe. There is much more variance between a small business and a large organisation than between any two consumers. There is also great variation between different types of small business.
4 Sampling frames. The available sampling frames of businesses and the nature of their detail could allow stratification to vary considerably in accuracy and coverage.
5 Public/private sector. The public sector generally counts as business, though the usage and buying patterns are frequently very different from the private sector.

872 Marketing Research
Relationship development
Salespeople, purchasing professionals and indeed anyone making decisions in a ‘buying cen-tre’ do not just meet, negotiate a deal and move on to other things. Imagine a cement manu-facturer wishing to buy a furnace that is expected to be part of its cement production process for over 20 years. There would be many meetings with staff from the cement company, the various competing furnace manufacturers and many potential suppliers of key components for the furnace. Even when the decision to buy from one particular supplier has been made, the interactions between technical, financial, production and legal staff could take place over many months, or even years. The purchase could be the forerunner to servicing and repair contracts and the installation of similar equipment in other cement-making plants. In buying a new furnace, there could be a time when modifications need to be made. There are loca-tions where local authorities allow cement manufacturers to burn old car tyres in their fur-naces. Adding old tyres to a gas-fired furnace may require modifications to allow the tyres to be fed in, changes to the chimneys to get rid of different fumes and the lining of the furnace. All of these developments may again unfold over time, involving purchasing, technical, pro-duction, logistics, marketing and legal personnel. There may be components that need to be replaced frequently, given the immense temperatures in the furnace. The delivery of these components may involve a repeat order, which may need a simple telephone call or even be automatically generated without human intervention.
In all of these cases, the customer and supplier interact on the basis of their experiences of previous purchases between them, and given the nature of their expectations for future pur-chases. The interaction between a customer and supplier is a single episode in the relation-ship between them. Each episode is affected by the relationship of which it forms part and each interaction in turn affects the relationship itself.30 Each interaction and each purchase or sale can only be understood in the context of that relationship, and ultimately within the net-work or businesses that enable the relationships to work.
Marketing research challenges. The main challenge of a b2b purchase or sale not being an isolated event is finding a research design that is appropriate to understanding complex networks and relationships. The cross-sectional study is the most frequently used descriptive design in marketing research. Cross-sectional designs involve the collection of information from any given sample of population elements only once. They may be either single cross-sectional or multiple cross-sectional designs. In single cross-sectional designs, only one sample of participants is drawn from the target population, and information is obtained from this sample only once. These designs are also called sample survey research designs. In multiple cross-sectional designs, there are two or more samples of participants, and infor-mation from each sample is obtained only once. In either variation of the design, much of the richness of the context of individual relationships and the network of relationships is lost. A more appropriate though more expensive and resource-intensive design is the longitudinal design. In longitudinal designs, a fixed sample (or samples) of population elements is meas-ured repeatedly. A longitudinal design differs from a cross-sectional design in that the sample or samples remain the same over time. In other words, the same people are studied over time. In contrast to the typical cross-sectional design, which gives a snapshot of the variables of interest at a single point in time, a longitudinal study provides a series of ‘pictures’. These ‘pictures’ give an in-depth view of the situation and the changes that take place over time.
A key feature of creating such ‘pictures’ of relationships and networks is the building of contextual material from sources such as sales data, customer data, secondary data statistics, intelligence through press and trade commentary that focuses upon particular markets or industries, and a vast resource of intelligence held within the employees of a business that may be seeking research support.31
However, there may be a lack of resources devoted to allowing b2b researchers to use longitudinal studies and develop knowledge management systems. Depending solely upon cross-sectional studies may not uncover the wider contextual issues that would allow detailed
Cross-sectional designsA type of research design involving the collection of information from any given sample of population elements only once.
Single cross-sectional designsA cross-sectional design in which one sample of participants is drawn from the target population and information is obtained from this sample once.
Multiple cross-sectional designsA cross-sectional design in which there are two or more samples of participants, and information from each sample is obtained only once.
Longitudinal designsA type of research design involving a fixed sample of population elements measured repeatedly. The sample remains the same over time, thus providing a series of pictures that, when viewed together, rapidly illustrate the situation and the charges that are taking place.

873Chapter 29 Business-to-business (b2b) marketing research
knowledge of relationships and networks. There could be a limitation on the way that b2b researchers view the value of contextual material. It has been argued that many b2b research-ers demonstrate ‘tunnel vision’, which fails to recognise the wider business context of busi-ness findings.32 Many researchers work comfortably within the standard research process of a brief, proposal, research setup, fieldwork, presentation and report. They continue to argue that ‘desk research is a dying art and that the multitude of excellent internet resources is sadly neglected’; many b2b researchers are consistently failing to put their research into a wider market or business context. Such a failing can affect the briefing/proposal stage as well as the analysis/reporting stage. This means that research findings are often set in a ‘vacuum’ without reference to the challenges faced by b2b marketers. The danger of this is that b2b marketing research is seen by decision makers as a ‘nice-to-know’ or luxury item rather than a key part of the planning and decision-making process. Adding value by drawing on the various sources of market intelligence available reduces the risk of marketing research appearing irrelevant to decision makers. It can also improve the research process so that decision makers value the information provided.
The weaknesses of cross-sectional research designs, the resources required to perform longitudinal designs and the limitations of some b2b researchers to appreciate the wider con-text of their investigations may result in b2b decision makers looking to other sources for decision support. Over recent years there has been a growth in the use and practice of com-petitor intelligence. Many organisations have developed competitor intelligence systems that allow them to have a relatively low-cost ‘picture’ of their environment, competitors and sometimes even their customers. Competitive intelligence uses many marketing research techniques and by using multiple sources aims to set a broad context to allow the b2b deci-sion makers to understand the networks in which they operate. The next section briefly explores the nature of competitive intelligence and its ‘threat’ to the nature and standards of conventional marketing research.
The growth of competitive intelligence
The research designs and techniques employed in competitive intelligence (CI) differ in some respects from the structured methods of marketing research; in other respects there are many similarities. Over the past 20 years or so, those who professionally gather competitive intelligence have continued to refine their research techniques, while also ensuring that their activities are distinguished from industrial espionage. In general, the research design employed for competitive intelligence is exploratory, using primarily secondary data, intel-ligence sources and qualitative primary data.33 Competitive intelligence has been defined as a systematic process by which a firm gathers, analyses and disseminates information about its rivals,34 or as a process of researching a competitor’s organisation, products, prices, financial performance, technology and strategy.35
From these definitions we can see, in ‘systematic’ and ‘process’ the continuous develop-ment of an understanding or knowledge of competitors. In the first definition we see the elements of managing data that replicate the marketing research process in terms of gather-ing, analysing and disseminating data. In the second definition we see the focus of data gathering in terms of products, prices, financial performance, technology and strategy. These are areas of measurement and understanding that go beyond the remit of marketing researchers.
While the nature of competitive intelligence has evolved, there has been much confusion over what competitive intelligence is and what it is not. Competitive intelligence is not cor-porate espionage, stealing competitive documents or accessing competitors’ computer files. Rather, the discipline is a structured approach to a different type of research, which has evolved as an outgrowth of strategic planning and market research. The Society of Competi-tive Professionals (SCIP) was formed in 1986 to develop behavioural standards and a code

874 Marketing Research
of ethics.36 This includes a focus on ethical information acquisition – for example using information that is in the public domain. SCIP has been criticised for essentially being a way of making industrial-level ‘spying’ more acceptable to corporations who are concerned about their own reputations.37 The ethical dilemmas that surround the ownership and extent of ‘public’ data on social media also apply here, and we will explore this in more depth in the following chapter (30) on research ethics.
The most commonly used techniques in competitive intelligence are:
1 Review of public records. This is the monitoring of secondary sources of information, such as government records, commercial databases, media reports and news clippings and company-produced literature, for potential threats and opportunities. Increasingly it involves the use of information gathered from the growing range of online data sources.
2 Observational techniques. Directly observing competitors’ activities or facilities through overt surveillance is another way to acquire competitive data, though such practices may be viewed with suspicion. Likewise, learning about a competitor’s capabilities, strengths and weaknesses through physical inspection of its products or actual use of its services is seen to be within the bounds of acceptable practice. Observers contribute to the gather-ing of ‘informal’ information concerning the market and business at different levels. Observers are not formal researchers but members of business departments, marketing specialists, technicians in engineering departments or plant-building departments. Employees in every department, including sales, purchasing and research and develop-ment, hear industry news well before it appears in a trade journal or in databases. These observers and their contacts form key components of b2b relationships set in the context of networks.
3 Face-to-face interviews. Conversing with informed sources is beneficial when hard-to-find information about a competitor’s strategies and intentions is used to fill criti-cal gaps in secondary data and provide a more complete understanding of the competition.38
In the gathering and interpretation of ‘public records’, conducting face-to-face interviews and overt observations, competitive intelligence targets individuals from the following types of organisation:39
• Competitor companies
• Customers
• Suppliers
• Distributors
• Government organisations
• Trade associations
• Financial institutions.
Given the range of data sources, data-gathering techniques, institutions and individuals that may be targeted (including consumers in some instances), and the array of employees that may be used to ‘observe’, competitive intelligence is clearly a ‘broad-brush’ approach. Competitive intelligence can offer the broad context, and in many instances detail specific areas to b2b decision makers that may be missing in conventional marketing research. Mar-keting research techniques may be more error free, less subjective and carried out with much stronger and more well-established codes of conduct when compared with competitive intel-ligence. However, b2b decision makers may forgo an amount of error, interpret subjective and biased views and even push the boundaries of ethical practice to gain the information that they need to make decisions. An example of this is contained in the following example of competitive intelligence on a new type of pizza.

875Chapter 29 Business-to-business (b2b) marketing research
Is competitive intelligence ethical?
Competitive intelligence studies do not generally reveal the purpose of the study to research ‘participants’, nor do they describe how the information will be used. Essentially, the com-petitive intelligence interviewers must develop a ‘story’ as to why they are calling the par-ticipants – e.g. they are interested in their products, they are conducting a general industry study, they are conducting a study as part of their degree or they are looking at specific issues within the industry (such as legislation or product safety). This may generate a response and some participants may be happy to cooperate. However, this would clearly be considered unethical by traditional marketing research organisations.42 Being misleading in order to gain access to participants could potentially damage the reputation of legitimate researchers and ultimately damage response rates, making access continually more difficult. Nevertheless, the value of some of the data points that can be collected by competitive intelligence practi-tioners, as seen in the following example, makes it a popular choice among b2b managers.
Real research Research leads to better-tasting frozen pizza40
Schwan, a leading US frozen food specialist, faced a key strategic problem. It learnt that its main competitor – Kraft – was working on a new type of frozen pizza that had a rising crust. Schwan knew that if Kraft could succeed in creating a better-tasting frozen pizza, then it had the potential to command a market that was dominated by lower-quality products. As one article put it ‘. . . . it was often hard to taste the difference between a fro-zen pizza and the cardboard box it came in.’41 What Schwan didn’t know was how fast Kraft was planning on rolling out this new product and, therefore, how quickly it needed to respond.
To find this information out it contracted a corporate intelligence firm (a SCIP mem-ber), who in turn hired a former undercover law enforcement specialist who had built his skills by spending years infiltrating criminal gangs. Through adopting a series of ‘fake’ phone disguises, including a journalist, environmental campaigner and potential sup-plier, the specialist made phone calls to various individuals involved with the construc-tion and operation of a new plant, together with public employees involved with approving construction and running. Through this he was able to piece together an accurate picture of a very high projected volume of sales. Based on this advice, Schwan invested considerable resources into launching its own ‘Freschetta’ brand, which was able to secure a large part of this important new market.
Real research What information can you get from competitive intelligence?43
The ethical issues surrounding competitive intelligence (CI) can be understood by look-ing at some of the activities that practitioners of CI claim they can undertake. The follow-ing list comes from an article profiling a CI professional in the USA and lists some of the things they claim they can undertake, the likelihood of success and how long it will take to gather the information:
• Cell-phone number of your competitor’s main contact with Walmart:• 80% chance; five minutes.
• The names and contact information of the people suing your biggest rival:• 80% chance; 30 minutes.

876 Marketing Research
• Stake out your competitor’s booth at a trade show to see what people are saying about your product:• 95 % chance; four hours.
• The market segmentation your competitor is using in its advertising:• 95% chance; one to three days.
• Stake out your competitor’s manufacturing facility to see how much stuff it’s making:• 95% chance; three days to three weeks.
• The names of your competitor’s top five salespeople and their salaries:• 80% chance; margin of error +/− 10%; three days.
• Identify which of your competitor’s former executives are most likely to come to work for you:• 80% chance; one week.
• Profit margin of your competitor:• 50–50 chance; margin of error +/− 10%; five to ten days.
The future of b2b marketing research
In many ways, b2b marketing faces similar sets of forces as those impacting consumer marketing, particularly in terms of technology. Although b2b marketing may not (usu-ally!) be carried out on Facebook, the increasing availability of online information is threatening some of the traditional dynamics that drive b2b relationships. In particular, parts of the role of the salesperson as a gatekeeper are being threatened by the easy avail-ability of information online that would have previously been filtered through the salesper-son. On the other hand, research has suggested that the internet has played an important role in making sales teams more effective by improving the flow of information within companies.44
Moving onto the specific case of b2b marketing research, the increasing use of online communication tools has created opportunities to engage with business participants in more convenient and less intrusive manners than other forms of data collection. With the growth of mobile device usage, research engagement can occur at a time and place that are con-venient for the participant. However, researchers face challenges when researching busi-ness participants online, similar to the issues currently facing consumer online research. If researchers do not treat business participants with respect, if they are not engaged and rewarded fairly, they can be easily alienated. It has been argued that business participants should not be treated in the same way that many panel companies treat their consumer pan-ellists. Measures should be taken to avoid the more common examples of poor practice, such as:45
• too many survey invitations. . . and reminders;
• too many ‘screen outs’ (establishing whether a participant has the qualities sought for a study), especially those that could have been avoided with adequate profiling information and sample selection protocols;
• long, dull and repetitive surveys;
• poorly designed and irrelevant surveys;
• a heavy reliance on prize draws, which typically do not deliver sustained engagement and loyalty.

877Chapter 29 Business-to-business (b2b) marketing research
Summary This chapter explored the key question of whether there are substantial differences between b2b and consumer marketing and how these differences influence b2b market-ing researchers. In the context of understanding relationships and networks, the prime objective of researchers in business markets therefore is to support an understanding of how successful relationships evolve and how the network operates. The nature of rela-tionships and networks underpins five key differences between b2b marketing and con-sumer marketing. These can be summarised as differences in: the number of people who may be involved in a b2b purchasing decision; the professionalism of those involved in the purchasing decision; the time taken to negotiate from decision to buy to actual pur-chase; the importance of individual consumers to a supplier; and b2b purchases or sales not being isolated events. These are the reasons why there are distinctive differences in the approaches adopted and challenges faced by b2b and consumer researchers.
The key challenges b2b marketing researchers face are in:
• Administering effective sampling plans with the associated problems of finding appropriate sampling techniques and the limitations of inference from the statistics that they may generate.
• Gaining access to key participants, in terms of getting to interview participants in the first instance and getting them to be open and honest. A key element of this access lies in how credible interviewers are perceived to be by business participants.
• Business participants actually remembering what has happened and why they or their organisation behaved as they did. The events may have taken a long time to unfold, involved numerous individuals and taken a great deal of time subsequently.
• Creating research designs that can measure or help to create an understanding of the dynamics of relationships and networks.
b2b researchers face further challenges from practitioners in competitor intelligence who have to work with decision makers who may forgo an amount of error, interpret subjective and biased views and even push the boundaries of ethical practice to gain support that is more attuned to the decisions they face.
b2b researchers tackle the challenges summarised above mostly in very creative ways, as illustrated in the examples throughout this chapter and indeed throughout this text. They do this so well that b2b researchers sometimes see themselves as superior to consumer researchers! Digital developments have enabled the management and con-trol of international b2b marketing research to become far more cost effective. Social media research techniques are proving to be of great value in b2b research. Such techniques do not replace face-to-face engagement, which may not be feasible in many studies. They do, however, support the initial contact with participants, and the nurturing and growth of relationships. They can help to demonstrate the respect and integrity of researchers – a vital attribute in b2b marketing research.
Questions 1 Why is it important to ask the question ‘Is b2b marketing research significantly different from consumer marketing research?’
2 What characteristics distinguish b2b marketing from consumer marketing?
3 What challenges do b2b marketers face in managing relationships?
4 How do the concepts of business networks and relationships relate to each other?

878 Marketing Research
5 What are the five major differences between b2b and consumer marketing?
6 Describe the sampling challenges that the b2b researcher faces.
7 What does ‘access’ mean in the context of b2b marketing research?
8 What is b2g marketing? What kinds of challenges might be associated with b2g marketing research?
9 Evaluate the reasons why gaining access to key participants may be so difficult. Why may gaining access grow more difficult over time?
10 What is meant by ‘interviewer credibility ’? What may interviewers do to be seen as more credible in the eyes of target participants?
11 Describe the potential participant errors that may occur in b2b marketing research. What may be done to reduce these potential errors?
12 What is competitive intelligence? How does this definition differ from notions of ‘conventional marketing research’?
Exercises 1 Visit the website of Business Intelligence Group (BIG) (www.b2bresearch.org). Evaluate why it came into existence and present a case for why b2b researchers need a distinctive professional body to represent their interests.
2 You are the marketing research manager of a bank. Management have asked you to assess the demand potential for ‘high-growth start-up businesses’. What sources of secondary data would you consult? What kinds of information would you expect to obtain from each source? Ask a group of fellow students to play the role of management and explain to them the role of secondary data in this project.
3 You are a marketing manager for a company that manufactures adhesives for the construction industry. You wish to invest in an online focus-group study of construction engineers and architects. Explain how you would identify and recruit such participants from across the globe. What incentive(s) would you offer potential participants?
4 Re-read the case study around competitive intelligence and the pizza industry. In a small group discuss the following statement: ‘There can never be any convergence in values between the professional bodies representing marketing research and competitive intelligence because competitive intelligence is unethical.’
Notes
1. ‘How Maersk Line uses social media case study’, http://linkhumans.com/case-study/maersk-line last accessed 9 June 2016.
2. ‘Premier Farnell case study’, https://www.circle-research.com/case-studies/premier-farnell/, last accessed 9 June 2016.
3. Wiersema, F., ‘The b2b agenda: The current state of b2b marketing and a look ahead’, Industrial Marketing Management, 42 (2013) (4), 470–88.
4. Dibb, S., Simkin, L., Pride, W.M. and Ferrell, O.C., Marketing: Concepts and Strategies, 4th edn (Boston: Houghton-Mifflin, 2000), 158.
5. David Ford conducts his work with a team of researchers in the IMP (International Marketing and Purchasing) Group. This group was founded in 1976 by researchers from five European countries. The group’s ‘interaction approach’ is based on the importance for both researchers and managers of understanding the interaction between

879Chapter 29 Business-to-business (b2b) marketing research
active buyers and sellers in continuing business relationships. Ford, D., The Business Marketing Course: Managing in Complex Networks (Chichester: Wiley, 2002), 6. See www.impgroup.org.
6. Littler, D., ‘Organizational marketing’, in Baker, M.J. (ed.), The Marketing Book, 3rd edn (Oxford: Butterworth–Heinemann, 1994), 610.
7. Wilson, D.F., ‘Why divide consumer and organizational buyer behaviour?’, European Journal of Marketing 34 (7) (2000), 780–96.
8. McPhee, N., ‘Is there a future for “real” qualitative market research interviewing in the digital age?’, ESOMAR Congress Odyssey, Athens (September 2010).
9. Webster, F.E. Jr, ‘Management science in industrial marketing’, Journal of Marketing 42 (January 1978), 22.
10. Ford, D., Gadde, L.E., Hakansson, H. and Snehota, I., Managing Business Relationships, 2nd edn (Chichester: Wiley, 2003), 38.
11. Ford, D., The Business Marketing Course: Managing in Complex Networks (Chichester: Wiley, 2002), 29.
12. Hakansson, H. and Snehota, I., ‘No business is an island: The network concept of business strategy’, Scandinavian Journal of Management 14 (3) (1990), 177–200.
13. Ford, D., The Business Marketing Course: Managing in Complex Networks (Chichester: Wiley, 2002), 3–6.
14. Spekman, R.E. and Stern, L.W., ‘Environmental uncertainty and buying group structure: An empirical investigation’, Journal of Marketing 43 (1979), 54–64.
15. Webster, F.E. Jr and Wind, Y., ‘A general model of organizational buying behaviour’, Journal of Marketing 36 (2) (1972), 12–19.
16. Pettit, R., ‘The march toward quality: The ARF’s quality enhancement process’, Journal of Advertising Research 50 (2) (2010), 120–4; Bonoma, T.V., ‘Major sales: Who really does the buying?’, Harvard Business Review 60 (3) (1982), 111–19.
17. Wilson, D.F., Organizational Marketing (London: Routledge, 1998).
18. Ford, D., The Business Marketing Course: Managing in Complex Networks (Chichester: Wiley, 2002), 79.
19. McNeil, R., ‘Open for business’, Research (May 2003), 3.
20. Harlow, B., ‘Analytic implications of panel data quality – the role of panel recruitment’, ESOMAR Panel Research, Dublin (October 2008).
21. Downes-Le Guin, T., Mechling, J. and Baker, R., ‘Great results from ambiguous sources – cleaning internet panel data’, ESOMAR Panel Research, Barcelona (November 2006).
22. Field, R., ‘Open for business’, Research (May 2003), 6.
23. Staig, J. and Tomlins, R., ‘Technography/ethnography in the real world’, ESOMAR Qualitative Research, Istanbul (November 2008).
24. McPhee, N., ‘Is there a future for “real” qualitative market research interviewing in the digital age?’, ESOMAR Congress Odyssey, Athens (September 2010).
25. Hamilton-Stent, S., ‘A spoonful of research helps the medicine go down’, Research (November 2003), 63.
26. Wilson, E.J. and Woodside, A.G., ‘Respondent inaccuracy’, Journal of Advertising Research 42 (5)
(September/October 2002), 7–18; Menon, G., Raghubir, P. and Schwarz, N., ‘Behavioural frequency judgments: An accessibility–diagnosticity framework’, Journal of Consumer Research 22 (2) (September 1995), 212–28; Cook, W.A., ‘Telescoping and memory’s other tricks’, Journal of Advertising Research (February–March 1987), 5–8; Sudman, S., Finn, A. and Lannom, L., ‘The use of bounded recall procedures in single interviews’, Public Opinion Quarterly (Summer 1984), 520–4.
27. ‘IAG Cargo case study’, https://www.circle-research.com/case-studies/british-airways/, accessed 10 June 2016.
28. Green, A., Heak, J. and Staplehurst, S., ‘Measuring the business elites in India and China: A powerhouse methodology meets powerhouse economies’, ESOMAR Asia Pacific Conference, Singapore (April 2008).
29. Anon., ‘Warc exclusive – WARC briefing: SMEs’, (November 2010); Macfarlane, P., ‘Structuring and measuring the size of business markets’, International Journal of Market Research 44 (1) (2002).
30. Ford, D., Gadde, L.E., Hakansson, H. and Snehota, I., Managing Business Relationships, 2nd edn (Chichester: Wiley, 2003), 4.
31. Cummings, S., ‘Secondary research: An essential part of the b2b toolkit’, Imprints (May 2003), 30–31.
32. Bairfelt, S. and Wilkinson, T., ‘Future proof’, Research (May 2003), 13.
33. Page, A. and Lai, S., ‘Understanding your competitors – completing the marketing intelligence jigsaw’, ESOMAR Asia Pacific Conference, Tokyo (March 2005); Le Meunier-FitzHugh, K. and Piercy, N., ‘Integrating marketing intelligence sources – reconsidering the role of the salesforce’, International Journal of Market Research 48 (6) (2006), 699–716; Stanat, R., ‘The relationship between market research and competitive intelligence’, ESOMAR Power of Knowledge Congress, Berlin (September 1998).
34. Kahaner, L., Competitive Intelligence: From Black Ops to Boardrooms. How Businesses Gather, Analyze, and Use Information to Succeed in a Global Marketplace (New York: Simon & Schuster, 1996).
35. Stanat, R., ‘The relationship between market research and competitive intelligence’, ESOMAR Power of Knowledge Congress, Berlin (September 1998).
36. van Hamersveld, M., ‘What are we talking about? A short frame of reference’, ESOMAR Marketing & Competitive Intelligence, Geneva (March 1999).
37. ‘The Pizza Plot’, http://partners.nytimes.com/library/magazine/home/20001203mag-penenberg.html, accessed 10 June 2016.
38. Lithwick, D., ‘How to conduct a competitive intelligence phone interview’, Imprints (December 2004), 15–16; Kassler, H.S., ‘Mining the internet for competitive intelligence’, Online (September/October 1997), 34–45.
39. Stanat, R., ‘The relationship between market research and competitive intelligence’, ESOMAR Journal (1998).
40. ‘The Pizza Plot’, http://partners.nytimes.com/library/magazine/home/20001203mag-penenberg.html, accessed 10 June 2016.
41. ‘The Pizza Plot’, http://partners.nytimes.com/library/magazine/home/20001203mag-penenberg.html, accessed 10 June 2016.

880 Marketing Research
42. Stanat, R., ‘The relationship between market research and competitive intelligence’, ESOMAR Journal (1998).
43. ‘Confessions of a Corporate Spy’, http://www.inc.com/magazine/201302/george-chidi/confessions-of-a-corporate-spy.html, accessed 10 June 2016.
44. Avlonitis, G., ‘The impact of internet use on business-to-business marketing examples from american and
european companies’, Industrial Marketing Management, 29 (2000), 441–59.
45. Walton, M., ‘Engaging business decision-makers online: What do they love and hate about online market research?’, Market Research Society: Annual Conference (2010).
Research ethics
All marketing research is
underpinned by effective ethical
practice. Marketing researchers
have a duty to participants and
society to behave ethically.
Applying ethical principles to
marketing research is essential
to producing high-quality
research findings.
30

882 Marketing Research
Objectives
After reading this chapter, you should be able to:
1 understand the importance of research ethics within marketing research;
2 understand the context in which research ethics has been developed;
3 apply key research ethics codes to your own research projects;
4 evaluate key concepts of research ethics including anonymity and consent;
5 apply the principles of research ethics within the context of the marketing research process;
6 consider research ethics from the participants’ perspective, taking into account the role of privacy and the need to maintain trust;
7 understand the key ethical challenges facing marketing research in the future.
Research ethics is a key defining characteristic of marketing research. One strength of marketing research that is often lacking from other fields of marketing is a commitment towards embedding ethical practice in all areas of activity. This commitment dates back to the early days of marketing research in the late 1940s. In fact, marketing research was one of the first areas of business to adopt ethics standards into everyday business practice. Reflecting its growing importance, in this edition research ethics has been expanded to cover a full chapter. This is also the last chapter of the book, but this is not because research ethics should be viewed as an afterthought! Rather, it is such an important part of the research that it needs a full understanding of the research process in order to apply it. By the same token, research ethics should not be understood as a ‘step’ in the research process. For example, many students view research ethics as the process through which their research is approved by a research ethics committee. This chapter demonstrates that research ethics is something that pervades the research process at each stage.
While most researchers will agree on the importance of ethical behaviour, the difficulty arises when trying to understand how this translates into actual behaviour. To many marketing researchers, ethics remains a nebulous and ambiguous context when put to use in a commercial context. If there is one lesson we can draw from case studies of unethical business practice, it is that it is easy for firms to talk about being ethical but embedding it in practice is far more difficult. However, this commitment to research ethics has been critical to the success of marketing research for more than 70 years, and this chapter seeks to build a practical understanding of applied research ethics.
A theme through this text has been the impact of technology, and corresponding social and economic changes, upon marketing research. These changes also present challenges to existing approaches to research ethics. Indeed, it is precisely because research ethics is so well embedded into the practice of marketing research that anything that undermines ethical principles creates large risks for research. Some have argued that maintaining existing ethical principles is essential for marketing research, while others suggest that they are holding research back. As industry expert Ray Poytner puts it:1
If market research companies abide by the old ethics, in particular anonymity and informed consent, they will not be able to compete for business in most areas where market research is growing.
This chapter addresses the key issues in marketing research ethics. It first addresses the background to ethics becoming an important part of research practice. We then move onto discussion of the specifics of ethical practice within marketing research – particularly the role of codes of conduct. Following this the chapter then looks further into several of the core concepts that underlie research ethics within marketing research, including
Overview

883Chapter 30 Research ethics
anonymity and informed consent. We consider the importance of ethical research practice for maintaining consumer trust and conclude by looking at several of the major future themes that present challenges to the marketing research sector.
Despite the centrality of ethics within contemporary management research and practice, the concept itself is relatively new. The core ideas of research ethics, such as the central role and importance of minimising harm and ensuring informed consent, emerged as a response to the ethical issues resulting from actions of scientists in the Second World War.2 From this starting point two ethical traditions emerged. The first relates to the development of ethical guidelines within academic and scientific research, most notably medical fields that involve research on human subjects. A second tradition of research ethics emerged among commercial research firms, such as those in the market and social research sectors. This led to the development of the first ethics code by ESOMAR in 1948. The drivers for this were pragmatic as much as philosophical, with practitioners recognising the need to build public trust and a desire to avoid the kinds of regulation that might limit the scope of their commercial activity.
Real research Research ethics and the Milgram experiments
Perhaps the most famous example of ethical issues in social research came from a set of experiments carried out by Yale University psychologist Stanley Milgram. In the Summer of 1961 more than 700 people came to Yale in order to take part in an experiment that, they were told, was about memory and learning.3 As part of the experiment one research participant (the ‘teacher’) was asked to administer electric shocks to a second research participant (the ‘learner’) in order to test their ability to remember words. However, the experiment was fixed – the learner was a confederate (i.e. an insider who worked with Milgram). The experiment proceeded as follows:4
The teacher was told to administer an electric shock every time the learner makes a mis-take, increasing the level of shock each time. There were 30 switches on the shock gen-erator marked from 15 volts (slight shock) to 450 (danger – severe shock).
The learner gave mainly wrong answers (on purpose) and for each of these the teacher gave him an electric shock. When the teacher refused to administer a shock the experi-menter was to give a series of orders/prods to ensure they continued. There were four prods and if one was not obeyed then the experimenter (Mr. Williams) read out the next prod, and so on.
Prod 1: Please continue.Prod 2: The experiment requires you to continue.Prod 3: It is absolutely essential that you continue.Prod 4: You have no other choice but to continue.
After the experiments were completed, Milgram claimed that two-thirds of respondents had gone to the final switch (450 volts), creating the fear that they may have seriously harmed or even killed the ‘learner’.
The experiment raised a broad range of ethical issues for researchers and has created debate around human behaviour ever since. In terms of factors relevant to marketing research, the ethical issues raised by Milgram’s experiments centred on the potential for harm to the research participants. The participants were misled during the experimental process so could not have been considered to have given informed consent. Further-more, there was a potential for trauma for research participants following the experi-ment. The ethics of the research methods used, as much as the findings, have been a source of discussion every since.

884 Marketing Research
Ever since this time, the maintenance of both ethical standards and self-regulation has become a key feature of commercial research. Although developed by different groups with different motivations, these commercial codes have similarities with the scientific codes that, in many cases, they pre-date. Namely, they seek to encapsulate the concept of professional research standards and protect research participants – for example, through the policies requiring a right-to-privacy and informed consent.
Ethics in marketing research
The need for a focus on ethics in marketing research is driven by specific characteristics that do not necessarily exist in other areas of marketing. Marketing research often involves direct contact with the participants and the wider public, usually by way of data collection, dis-semination of the research findings and marketing activities such as advertising campaigns based on these findings. Because of this, there is the potential to abuse or misuse marketing research by taking advantage of these people. If participants feel that they or their views are being misused or misrepresented, they either will not take part in future studies or may do so without honesty or full engagement in the issues being researched. They may also lobby politicians to protect them from what they see as intrusions into their privacy and liberties. In short, unethical research practices can severely impair the quality of the research process, undermine the validity of research findings and ultimately inflict serious damage upon the body of professional researchers. If participants cannot distinguish between genuine market-ing research and unethical telemarketing or direct marketing, there can be severe repercus-sions for the marketing research industry through legislation designed to protect the privacy of citizens. Given these factors, it is not surprising that the marketing research industry in Europe and the USA puts significant effort into defending its practices.
Professional bodies, such as the MRS and ESOMAR, distinguish marketing research from other competitive forms of data gathering, primarily through the issue of the anonymity of participants. They stress that in marketing research the identity of the provider of informa-tion is not disclosed. Within the codes of conduct they provide, they make a clear distinction between marketing research and database or direct marketing where the names and addresses of the people contacted are to be used for individual selling, promotional, fundraising or other non-research purposes. With the growth in use of information from online sources, such as social media, the distinction between marketing research and the database as a research tool is ultimately not so clear. There is a growing amount of support given to mar-keting decision makers from database analyses and digital activities that are not ‘participant specific’. We shall address some of the issues relating to the impact of technology upon research ethics later in this chapter.
Professional ethics codes
On a day-to-day basis, ethical practice within marketing research is governed by professional ethics codes produced by professional research associations. Key codes of conduct have been created by ESOMAR and the MRS, although other national or regional professional associates representing marketing research have their own codes. A full list of research asso-ciations is available on the ESOMAR site at: https://www.esomar.org/knowledge-and- standards/research-associations.php. Examples of the core principles of each set of codes are contained in Table 30.1 and Table 30.2 below. While these codes use different language, they cover the same broad principles. Firstly, they emphasise that participation in research is voluntary and is based on informed consent – note that the ESOMAR code describes

885Chapter 30 Research ethics
informed consent but doesn’t use those exact terms. Secondly, that research should not cause any harm to participants and that particular care should be taken with vulnerable groups, such as children. Thirdly, that participant privacy should be protected and data should not be used for purposes other than research – such as direct marketing, as has already been dis-cussed. Finally, like in the majority of professional codes, there is a requirement to uphold the standards of the research profession, behave with integrity and abide by all relevant laws.
The existence of these codes of conduct are driven, in part, by a desire within the market-ing research industry to maintain the ability to self-regulate. By developing strong codes of conduct, marketing research firms seek to avoid the creation of new government-level regu-lations that could curtail their activities. The fear of regulation is not driven by a fear that marketing research will be specifically limited by governments, as this would be
Table 30.1
1. Researchers shall ensure that participation in their activities is based on voluntary informed consent
2. Researchers shall be straightforward and honest in all their professional and business relationships
3. Researchers shall be transparent as to the subject and purpose of data collection 4. Researchers shall respect the confidentiality of information collected in their professional
activities 5. Researchers shall respect the rights and well-being of all individuals 6. Researchers shall ensure that participants are not harmed or adversely affected by their
professional activities 7. Researchers shall balance the needs of individuals, clients, and their professional activities 8. Researchers shall exercise independent professional judgement in the design, conduct and
reporting of their professional activities 9. Researchers shall ensure that their professional activities are conducted by persons with
appropriate training, qualifications and experience10. Researchers shall protect the reputation and integrity of the profession
Key principles of the MRS Code of Conduct5
Table 30.2
1. Market researchers shall conform to all relevant national and international laws 2. Market researchers shall behave ethically and shall not do anything which might damage
the reputation of market research 3. Market researchers shall take special care when carrying out research among children and
young people 4. Respondents’ cooperation is voluntary and must be based on adequate, and not
misleading, information about the general purpose and nature of the project when their agreement to participate is being obtained and all such statements shall be honoured
5. The rights of respondents as private individuals shall be respected by market researchers and they shall not be harmed or adversely affected as the direct result of cooperating in a market research project
6. Market researchers shall never allow personal data they collect in a market research project to be used for any purpose other than market research
7. Market researchers shall ensure that projects and activities are designed, carried out, reported and documented accurately, transparently and objectively
8. Market researchers shall conform to the accepted principles of fair competition
Key fundamentals of the ESOMAR code on market and social research6

886 Marketing Research
counter-intuitive given how much of the public sector as well as government decision mak-ing is informed by aspects of social and opinion research. Rather, the concern is that vaguely worded regulations targeted more generally at marketers or firms that collect data on cus-tomers will have unintentional consequences for marketing research. Some of these concerns were realised when proposals for a new set of EU-wide data protection laws were made – a topic discussed in the following case study.
Ultimately, the strength of codes of conduct lies in the willingness of firms to abide by these codes, and here lies a weakness. While there are formal mechanisms within profes-sional associations through which to investigate and sanction firms – for example, by pre-venting them from being a member of a professional association – the professional associations rely on members of the public to report transgressions. It also requires marketing researchers to be a member of an appropriate professional association to be punished in the first place. Although the number of complaints is increasing, it is still at a very low level in comparison to the size of the marketing research sector.7 For example, in 2014 ESOMAR upheld only one complaint against a member firm,8 while over the same period the MRS upheld two com-plaints against member firms and none against individual members.9 The question is whether the existing self-regulation processes are strong enough to survive the challenges that are being faced by marketing research going forward. The need to keep codes updated in response to the changes facing marketing research is acknowledged by ESOMAR:10
We cannot be naive about the wide range of new, passive, and in some cases, unseen mechanisms for collecting and analysing data. Our Code and associated guidelines need to be reviewed with increasing regularity, in order that we can continue to provide the most up-to-date best practice references, and deliver the most relevant and practical guidance to help researchers.
Real research New EU-data protection laws and marketing research
One of the most significant current events that has the potential to impact market research is the development of a new Euro-pean data protection policy. The new laws are due to take effect in 2018. They are important for two reasons. Firstly, data protection law is the most significant regulatory factor that impacts the day-to-day operation of market-ing research. Many existing data protection laws were drafted before the use of the inter-net became widespread and are generally agreed to be ineffective in the light of techno-logical advances and the corresponding change in uses of data. Secondly, these changes herald the start of a pan-European data protection policy. Given the intercon-nected nature of internet data, what impacts Europe has broader implications throughout the world, and many countries outside the EU are looking to adopt the European model of data protection. ESOMAR summarises the changes as follows:11
European citizens get a whole set of new rights that market, opinion, and social research agencies and research clients alike will need to cater for. Ranging from a right

887Chapter 30 Research ethics
Although Tables 30.1 and 30.2 outline a number of key principles of ethics codes, there is more detailed and in-depth documentation available on the ESOMAR or MRS websites. In addition, both ESOMAR and the MRS provide a number of guideline docu-ments that not only help researchers to comply with ethical guidelines, but provide practical advice to assist researchers in undertaking research in specific domains, as listed in Table 30.3.
to be forgotten, a right to object to profiling activities, a strengthened right to prior notification before data collection, a right to data portability, European citizens now have – more than ever – a right to know before, during and after you collect their data. These requirements will need to be incorporated into business practices if they are not already.
Another important development focusses on profiling, one of the most hotly contested points in the reform. Any profiling that may have a significant or legal effect on an indi-vidual has been banned by the reform, and in all cases European citizens have a right to object, including research. This may create a need to adapt how sampling activities are conducted as they would likely fall under the broad definition of profiling adopted by the negotiators.
In addition to rights for consumers, the new legislation could apply to any company col-lecting data on EU citizens – regardless of where they are based in the world. This has important implications for many US internet firms that serve EU-based customers, which will now need to follow the legislation rather than less stringent US laws. As part of the process of developing the legislation there was also a considerable amount of lobbying by professional research associations to ensure that legitimate research activ-ity was not treated in the same way as direct marketing. Full details of the legislation and the role of ESOMAR in the process of developing legislation is available at the following address: https://www.esomar.org/utilities/news-multimedia/news.php?idnews=195
Table 30.3
Guideline name Published by
Food and Drink Hall Test Check List MRSCode of practice for conducting market research in town centres MRSMobile Research Guidelines MRSGuidelines for business-to-business research MRSGuidelines for mystery shopping research MRSGuidelines for online research MRSGuidelines for qualitative research MRSGuidelines for questionnaire design MRSGuidelines for researching children and young people MRSGuidelines for research with employees ESOMARGuideline for Online Sample Quality ESOMARGuideline on Opinion Polls and Published Surveys ESOMARGuideline for Conducting Mobile Market Research ESOMARInterviewing Children and Young People ESOMARGuidelines on Social Media Research ESOMAR
Examples of guidelines made available by the MRS12 and ESOMAR13

888 Marketing Research
Ethics in the research process
As stated earlier in this chapter, ethics is not simply a step in the research process but some-thing that exists throughout the research process. Often, research ethics can only be fully understood by looking at the ways it is applied practically in day-to-day research. With this in mind, in this section we outline some of the more specific examples of where ethical fac-tors come into play at each stage of the research process.
Ethics in problem definition and developing a research approach
Ethical situations arising from the process of problem definition and developing an approach are likely to occur between the researcher and the client. As explained earlier, identifying the correct marketing research problem is crucial to the success of the project. This process can, however, be compromised by the personal agendas of the researcher or the decision maker. For example, the researcher, after performing the tasks involved in problem definition and analysing the environmental context of the problem, realises that the correct marketing research problem may be defined in a way that makes primary research unnecessary. This would reduce the cost of the project and the research firm’s profit margin substantially. Does the researcher define the problem correctly, fabricate a research problem that involves primary data collection, or refuse to proceed with this pro-ject in lieu of those more profitable? The researcher is faced with an ethical dilemma, as in the following example.
Real research Taste (profits) or image (ethics)?
A marketing research firm was hired by a soft drinks company to conduct taste tests to determine why its newly introduced soft drink brand had not captured the expected market share. The researcher, after following the process outlined in this chapter, deter-mined that the problem was not one of taste but of image and product positioning. The client, however, had already defined the problem as a taste problem and not as the broader, market-share problem. The researcher had to weigh the relatively high profit margin of taste test research against the less lucrative survey research needed to answer questions pertaining to soft drink image. What should the research firm have done? Should it have simply conducted the research the client wanted, rather than the research it felt the client needed?
Such ethical situations would be satisfactorily resolved if the client–researcher relation-ship is based upon communication, cooperation and a high level of confidence. This would provide a relationship of mutual trust that would check any unethical tendencies.
Ethical situations affecting the researcher and the client may also arise in developing an approach to the problem. When researchers conduct studies for different clients in related industries (e.g. banking and financial services), or in similar research areas (e.g. customer satisfaction), they may be tempted to cut corners in theoretical framework and

889Chapter 30 Research ethics
model development. Take an example where a grocery-chain client has on its board of directors the chairman of a bank. The bank had recently conducted customer satisfaction research using a client-specific model, and the bank-affiliated board member has access to this research. The researcher feels that a customer satisfaction model for the bank could be easily adapted to work for the grocery chain. The client feels that it would not be a good business decision to have access to this information and not use it. Is it ethical for the client and researcher to obtain and use this model developed for another company by another research firm? There is an underlying trust between the researcher and the client that the research firm is honour bound not to reuse client-specific models or findings for other projects.
The client also has an ethical responsibility not to solicit proposals merely to gain the expertise of the research firms without pay. It is unethical for a client to solicit proposals from a few research firms, then adopt one, or a combination of the approaches suggested in them, and conduct the project in-house. The client must respect the rights of a firm by realis-ing that an unpaid proposal belongs to the research firm that generated it. However, if the client firm pays for the development of the proposal, it has a right to use the information contained in it. However, as research clients are not subject to the same codes of conduct as researchers, enforcement of such practices comes down to good business practice and a level of trust between client and researcher.
Ethics in research design
During the research design stage, not only are the concerns of the researcher and the client involved, but the rights of the participants also must be respected. Although normally there is no direct contact between the participants and the other stakeholders (client and researcher) during the research design phase, this is the stage when decisions with ethical ramifications, such as using hidden video- or audiotape recorders, are made. Responsibili-ties to research participants must not be overlooked. The researcher should design the study so as not to violate the participants’ rights to safety, rights to privacy, or rights to choose. Furthermore, the client must not abuse its power to jeopardise the anonymity of the participants. These concerns are exacerbated with developments in social media that create new privacy, security and safety issues. Social media have changed the rules on how ‘find-able’ somebody is. This has enormous implications for privacy and safety of respondents and has generated considerable discussion over whether respondent privacy can be guaran-teed in the future. We cover this important issue in depth later in this chapter in the section on anonymity.
Research ethics may also be applied to the fundamental question of the type of research design that should be adopted (i.e. descriptive or causal, cross-sectional or lon-gitudinal). For example, when studying brand switching in toothpaste purchases, a longi-tudinal design is the only actual way to assess changes in an individual participant’s brand choice. A research firm that has not conducted many longitudinal studies may try to justify the use of a cross-sectional design. Is this ethical? Researchers must ensure that the research design utilised will provide the information needed to address the marketing research problem that has been identified. The client should have the integrity not to misrepresent the project and should describe the constraints under which the researcher must operate and not make unreasonable demands. Longitudinal research takes time. Descriptive research might require interviewing customers. If time is an issue, or if cus-tomer contact has to be restricted, the client should make these constraints known at the start of the project. The client buying services from a marketing research firm should not take undue advantage of it to ask for unreasonable concessions or discounts for a current project by making false promises of future research contracts, as illustrated in the follow-ing example.

890 Marketing Research
Real research Big Brother or Big Bully?
Ethical dilemmas may arise due to the strong desire of marketing research firms to become suppliers to large organisations that invest heavily in marketing research projects. Many companies in financial services, airlines, bev-erages and automobiles, for example, have enormous marketing budgets and regularly employ external marketing research firms. Large clients can manipulate the price for a current project or demand unreasonable con-cessions in the research design (e.g. the exam-ination of additional variables, more focus groups, a larger or more targeted sample for the survey, or additional data analyses) by implying that there is the potential for the marketing research firms to become a regular supplier. This may be considered just busi-ness, but it becomes unethical when there is no intention to follow up with a larger study or to use the research firm in the future.
Ethics in data collection
This section considers ethical issues raised by specific aspects of the data collection process. Before we address these, there are some general ethical points that researchers must consider when collecting data – not least that researchers and survey fieldworkers should make par-ticipants feel comfortable when participating in research activities. This is vital in order to elicit the correct responses for a specific project, but also more broadly for the health of the marketing research industry. A participant who feels that their trust has been abused, who found an interview to be cumbersome and boring, or who fails to see the purpose of a par-ticular study, is less likely to participate in further marketing research efforts. Collectively, the marketing research industry has the responsibility to look after its most precious assets – willing and honest participants.
Many researchers that craft research designs do not meet participants face to face, or if they have it may have occurred many years ago. Not being in the field, researchers can lose an awareness of what it is like actually to collect data in the field. Without this awareness, research designs that on paper seem feasible are difficult to administer in the field in a con-sistent manner. If there are problems in collecting data in the field, these may not always be attributable to the training and quality of fieldworkers; the blame may lie with the research designer. The researcher, therefore, has an ethical responsibility to the fieldworker and the participant. The researcher’s responsibility lies in an awareness of the process that the field-worker and participant go through in the field for each individual piece of research they design. Poor design can leave fieldworkers facing very disgruntled participants and can cause great damage.
Good researchers have an awareness of their responsibilities to fieldworkers and partici-pants. The researcher may take great care in understanding the difficulties of collecting data in the field and go to great pains to ensure that the data-gathering process works well for the

891Chapter 30 Research ethics
fieldworker and participant alike. The fieldworker may have been told about the purpose of the study, the purpose of particular questions, the means to select and approach participants and the means to elicit responses correctly from participants. However, fieldworkers may behave in an unethical manner. They may cut corners in terms of selecting the correct par-ticipants, posing questions and probes and recording responses. In such circumstances the fieldworker can cause much damage to an individual study and to the long-term relationship with potential participants. Thus, it becomes a vital part of fieldworker training to demon-strate the ethical responsibilities that fieldworkers have in collecting data.
Ethics when working with secondary data
Possible ethical dilemmas exist when using secondary data including the unnecessary collec-tion of primary data, the converse of cutting corners through the use of only secondary data and compromising the anonymity of participants.
The unnecessary collection of expensive primary data when the research problem can be addressed using only secondary data is unethical. In this case, the researcher is using a more expensive method that is less appropriate. Similarly, the exclusive reliance on secondary data when the research problem requires primary data collection could raise ethical concerns. This is particularly true if the researcher is charging a fixed fee for the project and the research design was not specified in advance. Here again, the researcher’s profit goes up, but at the expense of the client. The researcher is ethically obliged to ensure the relevance and usefulness of secondary data to the problem at hand.
Finally, the ethical issues related to the growth of digital measurement of consumers in creating secondary data have to be considered. A lot of attention has been focused on the array of digital measurement tools and how much secondary data are collected, analysed and reported online. Relatively less consideration has been given to people’s acceptance of these devices and processes. The challenge that researchers face is overcoming the perception and, in many cases the practices that digital measurement poses as a privacy threat. Protecting participant privacy and client confidentiality has never been as challenging for researchers as it is now, and we return to these important issues later in the chapter.
Sample size
Although the statistical determination of sample size is mainly objective, it is nonetheless susceptible to ethical concerns. As outlined earlier in the book, the sample size is heavily dependent on the standard deviation of the variable and there is no way of knowing the standard deviation until the data have been collected. An estimate of the standard deviation is used to calculate the sample size. This estimate is derived based on secondary data, judge-ment or a small pilot study. By inflating the standard deviation, it is possible to increase the required sample size and thus the revenue to be generated from the project. Using the sample size formula, it can be seen that increasing the standard deviation by 20%, for example, will increase the sample size by 44%. It is clearly unethical to inflate the standard deviation, and thereby increase the sample size, simply to enhance the revenue of a research company. Ethical dilemmas can arise even when the standard deviation is estimated honestly. It is pos-sible, indeed common, that the standard deviation in the actual study is different from that estimated initially. When the standard deviation is larger than initially estimated, the confi-dence interval will also be larger than desired. In such a situation, the researcher has the responsibility to discuss this with the client and jointly decide on a course of action.
Bias
Researchers also have the ethical responsibility to investigate the possibility of non-response bias, and make a reasonable effort to adjust for non-response. The research design adopted and the extent of non-response bias found should be clearly communicated. There are ethical

892 Marketing Research
ramifications of poor communications that affect non-response and confidence intervals of survey estimates based on statistical samples.
Ethics in qualitative research
Qualitative researchers have an ethical responsibility to the participants with whom they engage and to their clients or the decision makers they are supporting. The researchers have a duty to ensure that the intentions of their research are transparent, that participants engage in activities on a voluntary basis and that they have sufficient knowledge and understanding of what may be involved in a project to make this decision. The best researchers ensure that transparency, informed consent, knowledge and control are paramount in all research, regardless of medium. However, as some of the examples in this chapter illustrate, accessing the rich array of qualitative data available through internet developments presents ethical challenges that researchers have yet to resolve clearly. One major qualitative technique that has benefited from internet and social media developments is ethnography. A number of ethical challenges relate to ethnography in electronic community research. These surround the protection of participants, the means of collecting research data and the reporting of results. These challenges address the implications of attempting to be transparent, gaining informed consent and delivering knowledge and control to participants. The challenges are summarised here, based on the work of US and UK academics, Neil Hair and Moira Clark:14
• Challenge 1: Preventing harm or wrongdoing to participants, and preserving their dignity. What is harm, physical and psychological, in an electronic context? The answer will often be dependent on the nature of the community. What is dignity in the specific electronic community? This is particularly difficult to answer given the research that identifies peo-ple often playing out alternative personalities in electronic environments, perhaps within the same community. Who defines what is right and wrong in research terms within the community? Community members? The researcher? The owners of the community’s technical infrastructure or the sponsors of the research?
• Challenge 2: Preserving the confidentiality, anonymity and privacy of participants. While the ethical principles of confidentiality, anonymity and privacy are well known in market-ing research, these issues present a number of unique challenges in virtual environments. Throughout the field of electronic community research there has been a tendency to con-sider community postings as ‘public’. Ensuring privacy through name changes and pseu-donyms and offering participants access to materials held on them are also well-cited steps in ensuring ethical practice. However, the nature of the internet continues to exacer-bate potential issues of privacy. An increasing sophistication with search engines such as Google makes it possible for readers to search for quotes taken verbatim from community postings.
• Challenge 3: Avoiding deception and remaining honest. A major issue is one of whether research should be conducted covertly or overtly with the researcher as a participant and community member. Issues here surround the impact the researcher will have on that which is being researched. Clearly, acting as a member of the community will have some impact upon it. To be involved may be to damage, pollute and alter. A further challenge to researchers is being honest and open about the aims of a project while maintaining participants’ agreed involvement and preserving their trust. One means of maintaining honesty and avoiding deception is through the challenge of ensuring informed consent.
• Challenge 4: Ensuring informed consent. Traditionally, ethnographers would seek the written permission of every participant in their research. That may extend itself to the entire community. This is clearly not always possible in electronic communities that may have tens of thousands of participants, and given the transient nature of community mem-bership. Ethnographic research often lacks a predetermined definition of the study’s aims, favouring highly exploratory and inductive research processes. This poses the question: to what extent can researchers ever offer a comprehensive view of the study? Doing so

893Chapter 30 Research ethics
ignores the organic and participative nature of qualitative research. Ensuring informed consent in its own right is not sufficient, especially given the interconnectedness of these challenges.
• Challenge 5: Maintaining transparency, avoiding misrepresentation and ensuring reci-procity through the reporting of results. Ethnographers have, in the past, tended towards larger monologues that capture the essence of the culture they purport to examine; in this way they claim transparency. Researchers have the difficulty that 50 pages of script are unlikely to impress decision makers. A challenge exists for researchers trying to capture sufficient depth and richness without the length normally associated with ethnographers, and this can lead to ethical lapses. One way of meeting this challenge is by publishing details of the steps taken. This is traditionally done by returning results to participants and the wider community for assessment.
• Challenge 6: The challenge of diversity. The above challenges are perhaps eclipsed by one final issue for the virtual ethnographer and that is the diverse nature of online com-munities and the technology they use. What counts as ethical research in one community will clearly differ from the next. Exploring a sports community versus a community of social support will involve differing degrees of challenge. While the nature and diversity of electronic communities make it difficult to be prescriptive, the answers to these com-plex situations and considerations are perhaps best served in ethical relativism. With a relativistic approach comes the need to open up the decision-making process of research-ers to the external scrutiny of other stakeholders.
Qualitative research is dependent on participant cooperation and trust. Researchers rely on participants’ cooperation in order to tap into an in-depth understanding of consumers. But the non-directive and open-ended nature of qualitative questioning and observation tech-niques means that researchers also rely on participants being positively engaged by the pro-cess, willing and eager to apply their minds and happy to reveal their behaviour, thoughts and aspirations.
Ethics in qualitative research: focus groups
A number of ethical issues related to running focus groups have emerged in this chapter. The focus group can be a direct qualitative research technique, where the purpose of the discus-sion is made clear to participants before it starts. However, the focus group can incorporate observational and projective techniques that introduce elements of indirectness, i.e. elements or all of the purpose of the discussion being hidden from participants. This is where research-ers face a real ethical dilemma. If they fully reveal the purpose of their study, would this put off potential participants whose views are important to the success of the study? Even if they do manage to recruit potential participants, the researchers have to consider how they may feel when the real purpose of the study becomes apparent through the nature of the discus-sion or by the moderator revealing all at the end. The nature of the dilemma faced by researchers is that by revealing too much at the start of the study they may compromise the quality of their discussion. A full revelation may not be conducive to participants reflecting, making new connections and expressing themselves about issues that may be deeply held and difficult to conceive and express.
Researchers should take all reasonable precautions to ensure that participants are in no way adversely affected or embarrassed as a result of the focus group. What is meant by an adverse effect and embarrassment will largely depend upon the issues being explored and how they are perceived by target participants. Some participants may find personal hygiene issues very embarrassing to talk about in a group scenario, but not financial issues. Other individuals may be very frank about their sexual behaviour, while others would be shocked at the notion of talking about sex with a group of strangers. The researchers must get to know how the issues they wish to explore are perceived by their target participants by examining the literature, secondary data and the use of experimental focus groups.

894 Marketing Research
Another major ethical problem that is research issue and participant specific is the use of alcoholic drinks during focus groups. For certain groups of participants, relaxing and social-ising in a comfortable context drinking wine or beer is very natural. Researchers with experi-ence of running many focus groups would argue that serving alcoholic drinks can help to reduce tension in certain participants and give them the confidence to express their particular viewpoint. Other researchers would argue that this is unethical practice, that in effect the researcher is ‘drugging’ the participants. Whatever the researcher decides is right for the type of participants, the issues they are questioning them about and the context in which the dis-cussion takes place, there are practical problems involved with serving alcohol. Controlling the flow of alcohol and how much is given to certain participants may take attention away from the discussion. If control is not exerted, particular participants may get out of hand and disrupt or even destroy the discussion. Researchers could be accused of not taking reasona-ble precautions to ensure that participants are in no way adversely affected or embarrassed as a result of the focus group, should the use of alcohol be abused by certain participants. In no circumstances should researchers use audio or video recording or two-way mirrors in focus groups without gaining the consent of participants. It must be made clear to participants that recording or observation equipment is to be used and why it needs to be used. Participants must then be free to decline any offer to take part in a discussion.
Many of the challenges of physically managing traditional focus groups have been over-come with e-groups. Children can be more comfortable and engaged in the use of online dis-cussions. This, however, brings major ethical challenges for the researcher in understanding who is actually contributing to a discussion, what the child’s characteristics are and what the impact of the discussion may be upon that child. Research companies such as Dubit (www.dubitlimited.com) use e-groups that allow children to air/share their views in ways that chil-dren may have not been able to do before. Speaking through an avatar, they have found that children are often much more comfortable than they would be in a face-to-face focus group where concerns about confidence and appearance are much more acute. E-groups may be a natural location for youth research and marketing but many ethical challenges emerge from this development. ESOMAR has codes of practice that address the challenges of researching children but the emergence of new online techniques presents ethical challenges that have yet to be fully debated and addressed in a manner that gives clear guidance to researchers.
Ethics in qualitative research: interviews
The essence of qualitative research is that consumers are examined in great depth. They may be questioned and probed about subjects they hardly reflect upon on a day-to-day basis, never mind talk to strangers about. Great care must be taken not to upset or disturb partici-pants through such intensive questioning. In survey work, reassuring participants that their responses will be confidential can work if there is a demonstrable link between their responses to questions and a means of aggregating all of the findings, making the individual response ‘hidden’. In qualitative research, the process is far more intimate and the link between the response and the participant is far more difficult to break.
The marketing research industry is so concerned about how qualitative research partici-pants are handled because more consumers are being questioned in both domestic and busi-ness scenarios. If they are to ‘open up’ and reveal deeply held feelings, perhaps in front of a group of strangers, or if they are to take part in projective techniques that they may see as being unorthodox, they have to be reassured about how the data captured will be used. As well as the ethical questions of potentially damaging participants come the problems of participants either not being willing to take part or, if they are, being very guarded with their responses.
Ethical questions also arise when video-recording sessions with participants. Some of the pertinent questions involve how to tell participants and when clients should be allowed access. When video-recording participants, regardless of whether or not they were aware of the camera during the meeting, at the end of the meeting they should be asked to sign a writ-ten declaration conveying their permission to use the recording. This declaration should

895Chapter 30 Research ethics
disclose the full purpose of the video, including who will be able to view it. If any participant refuses, the tape should be either destroyed or edited to omit that participant’s identity and comments completely. The researcher should be sensitive to the comfort level of the partici-pants, and respect for the participants should warrant restraint. When a participant feels uncomfortable and does not wish to go on, the researcher should not aggressively probe or confront any further. It has also been suggested that participants should be allowed to reflect on all they have said at the end of the interview and should be given the opportunity to ask questions. This may help return the participants to their pre-interview emotional state.
Ethics in quantitative research: experiments
As was explained in Chapter 10, it is often believed that if participants are aware of the purpose of a research project, they may give biased responses. In these situations, a deliberate attempt is made by the researcher to disguise the purpose of the research. This is often necessary with experimentation, where disguise is needed to produce valid results. One solution is to disclose the possible existence of deception before the start of the experiment and allow the participants the right to redress at the conclusion of the experiment. The following four items should be conveyed: (1) inform participants that in an experiment of this nature a disguise of the purpose is often required for valid results; (2) inform them of the general nature of the experiment and what they will be asked to do; (3) make sure they know that they can leave the experiment at any time; and (4) inform them that the study will be fully explained after the data have been gathered and at that time they may request that their information be withdrawn.
The procedure outlined in item (4) is called debriefing. It could be argued that disclosure in this way would also bias results. There is evidence, however, indicating that data collected from subjects informed of the possibility of deception and those not informed are similar. Debriefing can alleviate the stress caused by the experiment and make the experiment a learning experi-ence for the participants. However, if not handled carefully, debriefing itself can be unsettling to subjects. The researcher should anticipate and address this issue in the debriefing session.
Ethics in quantitative research: scales
Researchers have an ethical responsibility to use scales that have reasonable reliability, validity and generalisability. Research findings generated by scales that are unreliable, inva-lid or not generalisable to stated target populations are questionable and at best raise serious ethical issues. Moreover, researchers should not bias scales so as to slant the findings in any particular direction. This is easy to do by biasing the wording of statements (Likert-type scales), the scale descriptors or other aspects of the scales. Consider, for example, the use of scale descriptors. The descriptors used to frame a scale can be chosen to bias results in a desired direction, e.g. to generate a positive view of the client’s brand or a negative view of a competitor’s brand. A researcher who wants to project the client’s brand favourably can ask participants to indicate their opinion of the brand on several attributes using seven-point scales framed by the descriptors ‘extremely poor’ to ‘good’. In such a case, participants may be reluctant to rate the product extremely poorly. Using a strongly negative descriptor with only a mildly positive one has an interesting effect. As long as the product is not the worst, participants will be reluctant to rate the product extremely poorly. In fact, participants who believe the product to be only mediocre will end up responding favourably.
Thus, we see how important it is to use balanced scales with comparable positive and negative descriptors. When this guide is not practised, responses can be biased and should be interpreted accordingly. This concern also underscores the need to establish adequately the reliability, validity and generalisability of scales before using them in a research project. Scales that are invalid, unreliable or not generalisable to the target population provide the client with flawed results and misleading findings, thus raising serious ethical issues. The researcher has a responsibility to both the client and participants to ensure the applicability and usefulness of the scale.

896 Marketing Research
Ethics in quantitative research: questionnaire design
Several ethical issues related to the researcher–participant relationship and the researcher–client relationship may have to be addressed in questionnaire design. Of particular concern are the use of overly long questionnaires, asking sensitive questions, combining questions of more than one client in the same questionnaire or survey (piggybacking) and deliberately biasing the question-naire. Participants are volunteering their time and should not be overburdened by soliciting too much information. The researcher should avoid overly long questionnaires. An overly long ques-tionnaire may vary in length or completion time depending upon variables such as the topic of the survey, the effort required, the number of open-ended questions, the frequency of use of complex scales and the method of administration. According to the guidelines of the Canadian Marketing Research and Intelligence Association (www.mria-arim.ca), with the exception of home face-to-face interviews, questionnaires that take more than 30 minutes to complete are generally consid-ered ‘overly long’. Face-to-face home interviews can take up to 60 minutes without overloading the participants. Overly long questionnaires are burdensome on the participants and adversely affect the quality of responses. Similarly, questions that are confusing, exceed the participants’ ability, are difficult, or are otherwise improperly worded should be avoided.
Sensitive questions deserve special attention. A real ethical dilemma exists for researchers investigating social problems such as poverty, drug use and sexually transmitted diseases such as AIDS, or conducting studies of highly personal products such as feminine hygiene products or financial products. Candid and truthful responses are needed to generate meaningful results. But how do researchers obtain such data without asking sensitive questions that invade par-ticipants’ privacy? When asking sensitive questions, researchers should attempt to minimise the discomfort of the participants. It should be made clear at the beginning of the questionnaire that participants are not obligated to answer any question that makes them uncomfortable.
An important researcher–client issue is piggybacking, which occurs when a questionnaire contains questions pertaining to more than one client. This is often done in omnibus surveys (see Chapter 4) that different clients can use to field their questions. One sponsor’s questions may take up a part of the questionnaire, while a second sponsor’s study takes up the rest. Although there is some risk that one study will contaminate the other or that the question-naire may not be very coherent, piggybacking can substantially reduce the cost. Thus, it can be a good way for clients with limited research budgets to collect primary data they would not be able to afford otherwise. In these cases, all clients must be aware of and consent to the arrangement. Unfortunately, piggybacking is sometimes used without disclosure to the cli-ents for the sole purpose of increasing the researcher’s income. This is unethical.
Finally, the researcher has the ethical responsibility of designing the questionnaire so as to obtain the required information in an unbiased manner. Deliberately biasing the question-naire in a desired direction, e.g. by asking leading questions, cannot be condoned. In decid-ing the question structure, the most appropriate rather than the most convenient option should be adopted. Also, the questionnaire should be thoroughly pilot-tested before fieldwork begins, or an ethical breach has occurred.
Data analysis
It is interesting to note that within the ESOMAR code of conduct, little reference is made to ethical data analysis, be that quantitative or qualitative. This is understandable, as the chief concern for the marketing research industry is how participants are handled, i.e. the process of eliciting data from them. Care must be taken to ensure that the precious resource of par-ticipants is not misled or manipulated. However, with the emergence of social media research techniques, the ability to gather characteristics and views of consumers from multiple sources has generated new ethical challenges.
With quantitative data there are many established and consistent procedures of analysis. With qualitative data, even though there exists a broad framework to manage analysis

897Chapter 30 Research ethics
procedures, the body of consistent and established procedures of analysis is less established. The difficulty in establishing consistent procedures lies primarily in the great diversity of data that can be included in the analysis procedure. Combining the researcher’s notes, transcripts of interviews, pictures, audio and video recordings and mood boards does not lead to a structured process. It is a messy process that owes much to individual patience, creativity and vision.
In searching for support of ethical practice to cope with such a ‘messy process’, there is one area of support that comes from the 2014 Code of Conduct of the Market Research Soci-ety.15 In its section ‘Analysis and reporting of findings’, Rules 52 to 54 state:
52. Members must ensure that data include sufficient technical information to enable reasonable assessment of the validity of results.53. Members must ensure that reports include sufficient information to enable reasonable assessment of the validity of results.54. Members must ensure that outputs and presentations clearly distinguish between facts, opinion, and interpretation.
The key element of these rules is that the researcher should be explicit about their interpreta-tion of the data collected. This takes us back to the start, when we discussed the self- reflection of the social and cultural values of researchers. If qualitative researchers fail or cannot be bothered to reflect upon their own values and cultural norms, their interpretation of qualita-tive data may be extremely biased. It therefore follows that, for the most valid as well as the most ethical interpretation of qualitative data, researchers must continually reflect and test the extent and effect of their social and cultural values.
Data integrity
Ethical issues that arise during the data integrity and analysis step of the marketing research process pertain mainly to the researcher. While checking, editing, coding, transcribing and cleaning, researchers should try to get some idea about the quality of the data. An attempt should be made to identify participants who have provided data of questionable quality. Con-sider, for example, a participant who ticks the ‘7’ response to all the 20 items measuring attitude to spectator sports on a 1–7 Likert scale. Apparently, this participant did not realise that some of the statements were negative whereas others were positive. Thus, this partici-pant has indicated an extremely favourable attitude towards spectator sports on all the posi-tive statements and an extremely negative attitude on the statements that were reversed. Decisions on whether such participants should be discarded, i.e. not included in the analysis, can raise ethical concerns. A good rule of thumb is to make such decisions during the data integrity phase before conducting any analysis.
In contrast, suppose that the researcher conducted the analysis without first attempting to identify unsatisfactory responses. The analysis, however, does not reveal the expected rela-tionship; the analysis does not show that attitude towards spectator sports influences attend-ance at spectator sports. The researcher then decides to examine the quality of data obtained. In checking the questionnaires, a few participants with unsatisfactory data are identified. In addition to the type of unsatisfactory responses mentioned earlier, there were responses of ‘4’, the ‘neither agree nor disagree’ response, to all the 20 items measuring attitude towards spectator sports. When these participants are eliminated and the reduced data set is analysed, the expected results are obtained showing a positive influence of attitude on attendance of spectator sports. Discarding participants after analysing the data raises ethical concerns, par-ticularly if the report does not state that the initial analysis was inconclusive. Moreover, the procedure used to identify unsatisfactory participants and the number of participants dis-carded should be clearly disclosed.
While analysing the data, the researcher may also have to deal with ethical issues. The assumptions underlying the statistical techniques used to analyse the data must be satisfied to obtain meaningful results. Any departure from these assumptions should be critically exam-ined to determine the appropriateness of the technique for analysing the data at hand. The researcher has the responsibility of justifying the statistical techniques used for analysis.

898 Marketing Research
When this is not done, ethical questions can be raised. Moreover, there should be no inten-tional or deliberate misrepresentation of research methods or results. Similarly, ethical issues can arise in interpreting the results, drawing conclusions, making recommendations and in implementation. For example, the error terms in bivariate regression must be normally dis-tributed about zero, with a constant variance, and be uncorrelated. The researcher has the responsibility to test these assumptions and take appropriate corrective actions if necessary. Although interpretations, conclusions, recommendations and implementations necessarily involve subjective judgement, this judgement must be exercised honestly free from personal biases or agendas of the researcher or the client.
Ethical communication of research findings
Report preparation and presentation involves many problem issues relating to research integ-rity. These issues include defining the research problem to suit hidden agendas, ignoring pertinent data, compromising the research design, deliberately misusing statistics, falsifying figures, altering research results, misinterpreting the results with the objective of supporting a personal or corporate point of view and withholding information. A survey of 254 research-ers found that 33% believed that the most difficult ethical problems they face encompass issues of research integrity. The researcher must address these issues when preparing the report and presenting the findings. The dissemination of research results to the client and other stakeholders, as may be appropriate, should be honest, accurate and complete.
Ethical challenges are also faced when research procedures and analyses do not reveal anything new or significant. For example, the discriminant function may not classify better than chance. Ethical dilemmas can arise in these instances if the researcher nevertheless attempts to draw conclusions from such analyses. The researchers are being paid for their expert interpretation of data, and can nothing meaningful be said?
Like researchers, clients also have the responsibility for full and accurate disclosure of the research findings and are obligated to employ these findings honourably. For example, consumers can be negatively affected by a client who distorts the research findings to develop a biased advertising campaign that makes brand claims that have not been substanti-ated by marketing research. Ethical issues also arise when client firms, such as tobacco com-panies, use marketing research findings as a foundation to formulate questionable marketing campaigns. This is reflected in the 2014 MRS Code of Conduct, which states, in rule 57:
If members are aware, or ought reasonably to be aware, that findings from a pro-ject have been incorrectly or misleadingly reported by a client they must at the earliest opportunity:
a. refuse permission for the client to use the member’s name further in connection with the incorrect or misleading published findings; and
b. publish in an appropriate forum (e.g. their website) the relevant technical details of the project to correct any incorrect or misleading reporting.
Key issues in research ethics: informed consent
We now address in more detail some of the key contemporary issues in research ethics, start-ing with the concept of informed consent. Put simply, this requires that research participants have formally agreed to take part in marketing research purposes and demonstrated an under-standing of the implications of providing data. Informed consent is typically gathered through the research participant being asked to sign, or otherwise indicate acceptance, that they understand the purpose of the research and agree to take part. This can be via a paper form,

899Chapter 30 Research ethics
verbal communication (for example, in a recorded interview) or electronic acceptance in the case of an online survey.
Like other ethical issues, informed consent arose out of the changing status of profession-als and the progress of the ethics movement within health care after the Second World War.16 Thus, while informed consent may appear to be highly embedded within marketing research, as with ethics as a whole the concept is a relatively recent one. The challenge, and dilemma, for marketing research is how to deal with consent when information is gathered online.
To stay relevant, marketing researchers need to use the best sources of data available in their research. In an age where marketing is increasingly data-driven, and even the most jun-ior marketing employee often has access to a wide range of easily accessible online analytics and transactional data, researchers cannot ignore online sources of data. However, to stay in business, market researchers need to adopt an approach that is seen as ethical both by con-sumers (i.e. research participants) and clients. To ensure effective self-regulation, profes-sional ethics guidelines must reflect the environment in which they operate and consider changing consumer norms, however contradictory they may be. The privacy paradox, where consumers freely provide private data but then object to its use,17 contributes to four chal-lenges facing existing concepts of informed consent:
1 Much of the actual collection of data via social media is carried out before the purpose of the data collection has been determined. Even if the data are collected for their pre-determined purpose, a wealth of other forms of analysis can be carried out on collected data. Unlike in traditional forms of commercial research, where the scope of the research is determined in advance, many of the research questions can only be developed after data have been collected.
2 Social media data collection is often unintentional, or at least unanticipated. In offline interactions a significant proportion of human activity goes unrecorded or unnoticed, even under conditions of widespread surveillance. However, the nature of online activity means that a ‘digital exhaust’ is created, regardless of whether the data at the time are intended for collection.
3 The inherently participative and co-creative nature of social media. Informed consent has been criticised as a one-directional approach that fails to take account of the dyadic and collaborative nature of social media, and the way in which value is created online.
4 Where does the ownership of data lie? Individuals are sometimes giving information about other people through their online activity. If they are being asked for informed consent it could apply not just to themselves but also to their friends, family and acquaintances.
Real research Informed or uninformed consent?
The increasing use of social networks as a source of data in marketing research has raised questions as to the extent to which researchers have consent from individuals to use data. A 2013 paper by Nunan and Yenicoglu in the International Journal of Market Research18 argues that many social networks actively seek a form of uninformed consent when users of these services agree to privacy policies. Such privacy policies appear com-mercially fair, but they also encourage a culture of information sharing. In this case the penalty is a reduction of value derived from the social graph and less utility from the site overall. The label ‘uninformed consent’ is used because while these policies provide a form of legal protection for the service, they do not inform the user of the service of the full range of potential uses. Read the consent policies for the social networks highlighted in the table below and judge for yourself whether you think these could be classified as ‘informed consent’:

900 Marketing Research
Site Consent policy
Facebook You own all of the content and information you post on Facebook, and you can control how it is shared through your privacy and application settings. In addition:For content that is covered by intellectual property rights, like photos and videos (IP content), you specifically give us the following permission, subject to your privacy and application settings: you grant us a non-exclusive, transferable, sub- licensable, —royalty-free, worldwide license to use any IP content that you post on or in connection with Facebook (IP License). This IP License ends when you delete your IP content or your account unless your content has been shared with others, and they have not deleted it.
Twitter Our Services are primarily designed to help you share information with the world. Most of the information you provide us is information you are asking us to make public. This includes not only the messages you Tweet and the metadata provided with Tweets, such as when you Tweeted, but also the lists you create, the people you follow, the Tweets you mark as favorites or Retweet, and many other bits of informa-tion that result from your use of the Services. Our default is almost always to make the information you provide public for as long as you do not delete it from Twitter, but we generally give you settings to make the information more private if you want. Your public information is broadly and instantly disseminated.
LinkedIn You own the information you provide LinkedIn under this Agreement, and may request its deletion at any time, unless you have shared information or content with others and they have not deleted it, or it was copied or stored by other users. Additionally, you grant LinkedIn a nonexclusive, irrevocable, worldwide, perpetual, unlimited, assignable, sublicenseable, fully paid up and royalty-free right to us to copy, prepare derivative works of, improve, distribute, publish, remove, retain, add, process, analyze, use and commercialize, in any way now known or in the future dis-covered, any information you provide, directly or indirectly to LinkedIn, including, but not limited to, any user generated content, ideas, concepts, techniques or data to the services, you submit to LinkedIn, without any further consent, notice and/or compensation to you or to any third parties.
Pinterest Pinterest allows you to post content, including photos, comments, and other materials. Anything that you post or otherwise make available on our Products is referred to as ‘User Content’. You retain all rights in, and are solely responsible for, the User Content you post to Pinterest.
You grant Pinterest and its users a non-exclusive, royalty-free, transferable, sublicensable, worldwide license to use, store, display, reproduce, re-pin, modify, create derivative works, perform, and distribute your User Content on Pinterest solely for the purposes of operating, developing, providing, and using the Pinterest Products. Nothing in these Terms shall restrict other legal rights Pinterest may have to User Content, for example under other licenses. We reserve the right to remove or modify User Content for any reason, including User Content that we believe violates these Terms or our policies.
Key issues in research ethics: maintaining respondent trust
One of the weaknesses of ethics within marketing research is that there is often insufficient reflection on why research ethics is important. If you asked a room full of professional researchers whether they follow ethical guidelines there would most likely be a unanimous show of hands. If you asked them why ethics was so important, the answers might be less certain. No doubt, people would point out the need to protect participants and also the need to follow professional codes of conduct. There might be some knowledge of the historical basis of research ethics, such that we have already highlighted in this chapter, but less so of their relevance to contemporary practice in marketing research. The more honest researchers might also mention the need to abide by their organisations’ ethics policies, and the severe penalties in not doing so to their careers. However, it is likely that relatively few would be able to consider some of the broader consequences of not doing so.

901Chapter 30 Research ethics
Perhaps the most serious of these relates to the potential for the loss of trust in research in the face of ethical breaches. A survey of UK and US consumers carried out in 2014 by sev-eral leading research associations found that 41% of consumers did not trust marketing research companies with their data.19 More worryingly, people were more trusting of search engine companies, mobile phone providers and even national security agencies – not organi-sations normally associated with high levels of consumer trust!
Trust has long been recognised as a key factor in facilitating the forms of relationships upon which market research relies.20 It plays a key role in reducing the perception of risks in research,21 while having a positive impact on respondent engagement in research.22 Any fac-tors that have the potential to impact the trust that the public has in the research process are therefore significant. Within the context of the growing importantance of secondary online data, the role of respondent trust has been recognised as playing an increasingly important role in the level of and quality of responses. Conversely, a lack of trust has been associated with a number of negative impacts for researchers. These include lower response rates, fab-rication of personal information as well as other forms of obfuscation taken as acts to protect personal privacy.23,24 The consequences of unethical behaviour leading to the potential loss of trust are therefore particularly problematic for market research. If we look further into the reasons why individuals feel a lack of trust, not just over marketing researchers but all organ-isations who are collecting data, it often comes down to concerns over individual privacy. Given that marketing research has long differentiated itself by working with anonymous data, the existence of such public concern is particularly troubling.
Key issues in research ethics: anonymity and privacy
Anonymisation is rooted in the defining principle of research ethics: that participants in research should not be harmed as a result of participation. Data collected during a research process could, if gathered in the wrong hands, cause harm to respondents by making public information that was not designed to be. Harm can be caused both directly and indirectly. In the direct case, the reidentification of personal identifiers such as name or address could lead to linking back personal details, such as financial or health information. In the indirect case, reidentification can happen through the combination of multiple data sets, even without any active or malicious attempt to reidentify the data.
Real research Does anonymity matter?25
What if we were to create research methods where anonymity did not matter? Where cli-ents could ask straight questions of customers on customer databases or customer websites, and get straight answers back from them? John Griffiths (www.planningaboveandbe-yond.com) offers the view:
I am reminded of my induction into digital telephony over 20 years ago, where a tech-nologist explained that by going digital, tel-ephone companies had found a way to put voices and computer data into packets that they could send down a wire. Once they had

902 Marketing Research
The importance of understanding anonymisation is two-fold.Firstly, working with anonymised data has been adopted by the research profession as a
defining characteristic of the field. Ensuring that any data collected is correctly anonymised is a core feature of market research. Secondly, anonymisation has also become, in legal and regulatory terms, a boundary against what might be considered as personal data and thus subject to data protection legislation. The importance of anonymisation has partly been driven by a view that anonymised data is of little interest to regulators. Thus, in an environ-ment where personal data is coming increasingly under regulatory scrutiny anonymisation provides a route through which to more easily protect the existence of self-regulation.
Secondly, due to rising concern over the potential for reidentification, with scare stories such as those highlighted in the case studies below appearing in the media on a near-daily basis,26 if the techniques that underlie the principles of anonymisation are shown to be bro-ken there are serious implications for those who rely upon it to maintain trust. The concept that anonymisation might be broken has become the subject of increasing debate among experts, with two alternative, and competing, views. On the one hand there is the importance of anonymisation to maintain the key legal underpinnings of research. Without anonymisa-tion, it is argued, the broader utility of market research will be severely harmed. On the other hand are those who argue that the anonymisation cannot be guaranteed in a way that can be aligned with the patterns of data collection and usage seen within the contemporary ‘big’ data strategies.27 The core of these two arguments are highlighted below:28
made this jump, the challenge was to find ways to send data faster. Now thousands of people use the same wire at the same time to pass voice and data to each other in both directions in real time. While telephone stayed analogue we needed an operator to make a physical connection between two telephones, and while the two parties were using that single piece of wire no other information could be passed down that wire. That is where marketing research is stuck now. The analogue way to get trustworthy informa-tion from a participant is to set up a separate circuit isolated from everything else. Which makes it clunky, costly, slow and methodologically suspect. But what if client companies find that they can indeed get usable customer data without analogue circuitry? Suppos-ing in a flurry of e-communications as a customer sends off for a new car brochure, they browse websites, watch ads on YouTube and Google Video and answer pop-up question-naires before and after? Suppose car companies find ways for customers to browse infor-mation systems in the showroom to choose their cars and then integrate research capture. They could be gathering research data at the same time as selling. Unthinkable? Why ever not? This is called duplex information flow. All digital devices have had it for years, but marketing research hasn’t. Playing ‘peekaboo’ with identity is a poor way to protect an industry as established as marketing research. If the industry does not find a way around the anonymity issue, we may be like the rest of analogue technology and find ourselves consigned to history. The client can talk directly to customers and prospects and they willingly talk back, even initiating an exchange. So, what was your role again?
Real research Reidentifying the health details of Governor Weld29
The story of how the health details of former Massachusetts Governor William Weld were reidentified highlights both the risks of reidentification, but also the danger of exaggera-tion from media hype. A graduate student named Latanya Sweeney, now a Professor at Harvard, carried out the analysis. The Massachusetts Group Insurance Commission had

903Chapter 30 Research ethics
made available to researchers (supposedly) anonymised data containing information on treatment date, ZIP code and gender. At the same time, Sweeney was able to purchase, for $20, a full set of electoral roll data containing ZIP code, birth date and gender.30 Based upon these variables it is not difficult to see how the data sets could be easily combined, and from this a single match was identified and Sweeney was able to send the correct set of reidentified health records to the Governor.
This example has since been widely used to illustrate the risks of data reidentifica-tion in the internet era. If the Governor of Massachusetts can have his health data rei-dentified so easily, couldn’t anyone? However, there are some flaws in this argument. The provision of ZIP code and gender narrows the field of potential individuals to such a great extent that the addition of even a small number of additional variables enables reidentification. In addition to the way that the data was anonymised there are the characteristics of the data subjects themselves. This example included a high-profile individual for whom there existed a set of existing public data. It was therefore possible to verify with a high level of certainty that the individual was the one identified from the data.
Real research How much do celebrities really tip? Analysing New York taxi data
An example of the impact of reidentification among large data sets emerged from a set of anonymised data made available by the NYC Taxi and Limousine Commission, opera-tor of New York’s famous Yellow Taxi. By making use of a freedom of information request, a developer was able to secure a set of data files containing details of more than 170 million New York taxi trips.31 These were provided with certain key information (the medallion and licence numbers that identify individual drivers) anonymised. However, the anonymisation technique used a cryptographic function that assumed that you didn’t know anything about what the original encrypted data looked like.32 This was a problem as it’s very easy to work out what a New York taxi licence number should look like as they are visible to anyone taking a ride in a taxi. As a result it took only two min-utes to reidentify the data and a further hour of computer processing time to link it back to individual journeys.
Of course, this only tells you which journeys were taken – not who was taking them. However, this was taken further by an intern working at US information analytics firm Neustar, who built a database using public photos of celebrities getting into taxis and then matched this back to the original database of taxi journeys.33 From this data we were able to find out that celebrities – including Bradley Cooper and Jessica Alba – did not leave a tip when they took a taxi. This information is relatively harmless, even by the standards of celebrity news. It nevertheless puts information into the public domain that was previously private and demonstrates how combining multiple public data sets can threaten privacy. Who knows what other private information might be lurking in this database of taxi rides that has yet to have been made public?
1 Anonymisation must work. This perspective focuses on wider social and economic bene-fits of anonymisation while playing down the extent of the technical risks. Effectively, this argues that critics of anonymisation are highlighting purely theoretical risks that matter far less in the real world. In other words, the risks that have been related to anonymisation have been exaggerated.34 A number of explanations are provided. The first is that many of

904 Marketing Research
the problems associated with anonymisation are really down to the data not having been properly anonymised in the first place. Secondly, the issues with reidentification assume that there is someone willing and able to exploit the misuse of data. If someone wants to access personal data, and they are willing to ignore the law, there are far simpler mecha-nisms to gaining personal data than a complex reidentification process. Finally, there is the low level of risk posed by reidentification compared to tolerated risks. In a widely cited example of US health data being reidentified,35 the reidentification rate was 0.04% – similar to the lifetime risk of being hit by lightening and considerably less risky than dying in an accident at home.36 Even as risks grow over time, as the scope of data and power of technology increase these must be put into perspective in terms of other general risks within society.
2 Anonymisation can’t work. This perspective argues that however much we would wish for anonymisation to work, changes in the technological environment surrounding research mean that anonymity is incompatible with the characteristics of present-day data collec-tion. Although anonymisation worked well over the early era of the internet, in the face of increasing computer power and availability of data sets it is no longer effective. The bar-riers to reidentification are lower than might be supposed, with 87% of Americans being uniquely identifiable from a ZIP code, birth date and sex.37 The key point is not that data cannot be anonymised, but that doing so effectively removes much of the usefulness that might be gained from analysing the data. Even bearing in mind the need to understand risks due to the difficulties in identifying future technology capabilities and the inability to delete data once made public, it is not just that the risk is unknown – it is unknowable.38
How can market researchers address these two, apparently incompatible, views? One answer is that a combination of regulatory and technical solutions are required to protect the public from the risks of reidentification of personal data and determine levels of acceptable risk. However, for marketing research this is not a straightforward issue. As with the wider research sector, there is a desire for the status quo not only in terms of anonymisation but also in terms of self-regulation. The key limit of self-regulation is that it can only apply to the actions of those organisations that have chosen to be part of a particular regulatory regime. As the ‘data sector’ has grown to be much broader in scope that the traditionally defined market research sector, so has the potential for externalities that cannot be controlled through self-regulation.
With the growth of big data and the subsequent trend towards collection and analysis of secondary data such as social media or sensor data, many areas of research involve a shift from researchers being ‘creators’ of data to ‘users’ of data created by others. To appreciate the extent of this, one only has to look at how many leading firms that used to define them-selves as being in marketing research now describe their business as ‘data science’. In this shift to analysis, a dependency is created upon the norms of organisations driven by a com-mercial imperative to work with individual-level rather than anonymised data. An approach that pushes for statutory legislation to protect the effectiveness of anonymisation therefore carries with it an implicit acceptance of the limits of self-regulation.
These issues underline the importance of the management of current and future potential risks related to anonymisation and of communicating them to research participants. These risks should not be seen as being entirely, or even wholly, related to the potential for data reiden-tification. To re-emphasise the point made earlier: given the large volumes of data being collected, the risk of accidental reidentification remains comparatively low. Rather, the potential risk is that participants in research perceive the concept of anonymisation to be misleading, or ineffective, and that this perception impacts upon the types of data that they are willing to share with researchers. The collection of data carries with it risk, and researchers need to share these risks with the public. The question for the future is how marketing researchers can ensure that participants are better aware of the risks while still maintaining the principle of anonymity.
SuggingThe use of marketing research to deliberately disguise a sales effort. ‘Sugging’ is a market research industry term, meaning ‘selling under the guise of research’. Sugging occurs when individuals or companies pretend to be market researchers conducting a research, when in reality they are trying to build databases, generate sales leads or directly sell products or services.

905Chapter 30 Research ethics
Key issues in research ethics: sugging and frugging
A growing challenge facing the marketing research industry is image, as the public may not distinguish between ‘genuine’ research and telemarketing. This identity crisis is exacerbated by the action of some firms in carrying out sugging and frugging – industry terms for selling or fundraising under the guise of a survey. The overall effect of these activities has given a poor image in particular to telephone research, raising the cost and making it difficult for researchers to obtain full and representative samples.
FruggingFundraising under the guise of market research is referred to as ‘frugging’.
Real research Responding to sugging and frugging39
The potential impact of sugging and frugging has created concerns among marketing research industry bodies around the long-term impact upon research. In 2013 the MRS received approximately 1,250 complaints relating to nuisance calls that were ‘disguised’ as research. To respond to this challenge, the MRS has launched a hotline to enable the public to raise issues directly relating to incidences of sugging or frugging.
Jane Frost, CEO of the MRS, highlighted the importance of addressing sugging in terms of maintaining trust in research:40
We all know that that little word ‘trust’ is a critical basis in all industries, but the research sector probably relies on it more overtly than most. Which is why MRS will always take on complaints about sugging as a critical part of promoting the standards of the sector.
Summary Understanding and applying ethical practices within the marketing research process is a key part of carrying out effective research. Marketing research provides a rare example of a business discipline in which principles of ethics are widely accepted and imple-mented by the profession. This is done through the the adoption of, and adherence to, a set of marketing research codes. Key concepts that ensure continuing ethical research practice include the preservation of participant anonymity, ensuring that research par-ticipants have given informed consent and protecting participants from harm – particularly when they are members of vulnerable groups.
This chapter has demonstrated the importance of research ethics within the practice of successful market research. However, while the concept of research ethics appears to be well established, there are a number of threats that could impact the future effec-tiveness of current ethics procedures. Many of the core principles of research ethics have their origins in the post-war period and are therefore built around the methods that were common at that time. Changes in technology, the increasing role of regula-tion and the difficulty marketing research has in differentiating itself from other mar-keting activities are all sources of future risk. However, of all factors that have been discussed in this text, it is the effectiveness of ethics that, arguably, is the greatest guarantor of the future of marketing research. Most importantly, only through continu-ing ethical practice can the cornerstone of future research success – participant trust – be maintained.

906 Marketing Research
Questions 1 Why is participant anonymity so important in market research?
2 How can you ensure you have properly gained informed consent when carrying out a survey?
3 Explain the concept of uninformed consent.
4 Describe the key concepts embedded in the ESOMAR code of conduct.
5 What are the consequences of unethical behaviour by marketing researchers?
6 Why does research into children create particular ethical challenges?
7 How can researchers prevent adverse effects from occurring when carrying out focus groups?
8 What are the particular ethical challenges associated with the use of secondary data?
9 Summarise the threats presented by new technologies to the effectiveness of anonymisation of participant data.
10 Why is self-regulation viewed as important by professional bodies in marketing research?
Exercises 1 Re-read the ‘Real research’ segment on anonymity. The author quoted in this piece, John Griffiths, questions whether marketing research can exist without anonymisation of personal data. In groups, discuss the extent to which you agree with this view.
2 Go to Facebook and read the currently available Data Policy (https://www.facebook.com/about/privacy). Discuss what you believe would be ethical use of data from Facebook for research purposes based upon the kinds of consent gathered when individuals sign-up to Facebook.
3 Read the full ESOMAR or MRS codes of conduct. Consider whether any of the requirements would be difficult to implement within your own research projects.
Notes
1. Poynter, R. ‘It’s time for market research to join the 21st Century’, personal blog, available at: http://raypoynter.com/it%E2%80%99s-time-for-market-research-to-join-21st-century/, accessed 3 May 2016.
2. Hanson, S., ‘Informed consent out of context’, Journal of Business Ethics 63 (2006), 49–154.
3. Perry, G., ‘Behind the shock machine: The untold story of the notorious Milgram psychology experiments’. Scribe (2012).
4. McLeod, S., ‘The Milgram Experiment’, http://www.simplypsychology.org/milgram.html, accessed 3 May 2016.
5. ‘MRS Code of Conduct’, https://www.mrs.org.uk/standards/code_of_conduct, accessed 3 May 2016.
6. ‘ESOMAR Codes & Guidelines’, https://www.esomar.org/knowledge-and-standards/codes-and-guidelines.php, accessed 3 May 2016.
7. ESOMAR News, ‘New Chair of ESOMAR’S Professional Standards Committee’, https://www.esomar.org/utilities/news-multimedia/news.php?idnews=196, accessed 3 May 2016.
8. ‘ESOMAR Financial Report 2014’, https://www.esomar.org/about-esomar/financial.php, accessed 3 May 2016.
9. ‘MRS Annual Review 2014–15’, https://www.mrs.org.uk/mrs/annual_review, accessed 3 May 2016.
10. ‘ESOMAR Financial Report 2014’, https://www.esomar.org/about-esomar/financial.php, accessed 3 May 2016.
11. ESOMAR News, ‘It’s here: What the new EU Data Protection law means for market research’, https://www.esomar.org/utilities/news-multimedia/news.php?idnews=195, accessed 3 May 2016.
12. ‘MRS Code of Conduct’, https://www.mrs.org.uk/standards/guidance, accessed 3 May 2016.

907Chapter 30 Research ethics
13. ‘ESOMAR Codes & Guidelines’, https://www.esomar.org/knowledge-and-standards/codes-and-guidelines.php, accessed 3 May 2016.
14. Hair, N. and Clark, M., ‘The ethical dilemmas and challenges of ethnographic research in online communities’, International Journal of Market Research (2007).
15. ‘MRS Code of Conduct’, https://www.mrs.org.uk/standards/guidance, accessed 3 May 2016.
16. Hanson, S., ‘Informed consent out of context’, Journal of Business Ethics 63 (2006), 49–154.
17. Barnes, ‘A privacy paradox: Social networking in the United States’, http://firstmonday.org/ojs/index.php/fm/article/viewArticle/1394, accessed 3 May 2016.
18. Nunan, D. and Yenicoglu, B., ‘Informed, uninformed and participative consent in social media research’, International Journal of Market Research 55 (6) (2013).
19. Tarran, B., ‘41% do not trust market research companies with their data’, Research Live, available at: http://www.research-live.com/news/news-headlines/41-do-not-trust-market-research-companies-with-their-data/4011288.article, accessed 3 May 2016,
20. Moorman, C., Deshpande, R., and Zaltman, G., ‘Factors affecting trust in market research relationships’, Journal of Marketing 57 (1) (1993).
21. Morgan, R.M. and Hunt, S.D., ‘The commitment-trust theory of relationship marketing’, Journal of Marketing 58 (July) (1994), 20–38.
22. Moorman, C., Zaltman, G. and Deshpandé, R., ‘Relationships between providers and users of market research: The dynamics of trust within and between organizations, Journal of Marketing Research 29 (August 1992), 314–29.
23. Lwin, M.O., Wirtz, J. and Williams, J., ‘Consumer responses to personal informational privacy concerns on the internet: A power-responsibility equilibrium perspective’, Journal of the Academy of Marketing Science 35 (4) (2007), 572–85.
24. Wirtz, J. and Lwin, M.O., ‘Regulatory focus theory, trust, and privacy concern’, Journal of Service Research 12 (2) (2009), 190–207.
25. Griffiths, J., ‘Viewpoint – MR confidential: Anonymity in market research’, International Journal of Market Research 50 (6) (2008), 717–18.
26. Aldhouse F., ‘Anonymisation of personal data: A missed opportunity for the European Commission’, Computer Law & Security Review 30 (4) (2014), 403–18.
27. Nunan, D. and Di Domenico, M., ‘Market research and the ethics of big data’ International Journal of Market Research (2013).
28. Nunan, D. and Di Domenico, M., ‘Exploring reidentification risk: Is anonymization a promise we can keep?’, International Journal of Market Research (2016).
29. Ohm, P., ‘Broken promises of privacy: Responding to the surprising failure of anonymization’, UCLA Law Review 97 (2009), 1701.
30. Ohm, P., ‘Broken promises of privacy: Responding to the surprising failure of anonymization’, UCLA Law Review, 97 (2009), 1701.
31. Whong, C., ‘FOILing NYC’s taxi trip data’, http://chriswhong.com/open-data/foil_nyc_taxi/, accessed 3 May 2016.
32. Pandurangan, V., ‘On taxis and rainbows’, https://medium.com/vijay-pandurangan/of-taxis-and-rainbows-f6bc289679a1#, accessed 3 May 2016.
33. ‘Riding with the stars: Passenger privacy in the NYC taxicab dataset’, http://research.neustar.biz/2014/09/15/riding-with-the-stars-passenger-privacy-in-the-nyc-taxicab-dataset/, accessed 3 May 2016.
34. Yakowitz, J., ‘Tragedy of the data commons’, Harvard Journal of Law & Technology 25 (1) (Fall 2011).
35. Sweeney, L., ‘Patient identifiability in pharmaceutical marketing data’, Data Privacy Lab Working Paper 1015 (Cambridge, MA: 2011).
36. Calman K., and Royston, G., ‘Risk language and dialects’, British Medical Journal 315 (1997), 939–42.
37. Sweeney, L., ‘Simple demographics often identify people uniquely’, Carnegie Mellon University Privacy Working Paper 3, (Pittsburgh: 2000).
38. Narayanan, A., Huey, J. and Felten, E., ‘A precautionary approach to big data privacy’, Computers, Privacy & Data Protection Conference (2015).
39. ‘MRS launches sugging hotline to combat the practice of “selling under the guise of research”’, https://www.mrs.org.uk/article/item/1666, accessed 9 May 2016.
40. ‘The politics of trust’, https://www.mrs.org.uk/janefrost_archive/blog/936, accessed 9 May 2016.

AAccess panel A general ‘pool’ of individuals or
households who have agreed to be available for surveys of widely varying types and topics.
Acquiescence bias (yea-saying) This bias is the result of some participants’ tendency to agree with the direction of a leading question.
Action research A team research process, facilitated by a professional researcher(s), linking with decision makers and other stakeholders who together wish to improve particular situations.
Active social media research Researchers engaging with communities themselves or starting them (i.e. the active generation of social media data, such as through an MROC).
Agglomerative clustering A hierarchical clustering procedure where each object starts out in a separate cluster. Clusters are formed by grouping objects into bigger and bigger clusters.
Alpha error (A) See Type I error.
Alternative-forms reliability An approach for assessing reliability that requires two equivalent forms of the scale to be constructed and then the same participants to be measured at two different times.
Alternative hypothesis A statement that some difference or effect is expected. Accepting the alternative hypothesis will lead to changes in opinions or actions.
Analysis of covariance (ANCOVA) An advanced ANOVA procedure in which the effects of one or more metric-scaled extraneous variables are removed from the dependent variable before conducting the ANOVA.
Analysis of variance (ANOVA) A statistical technique for examining the differences among means for two or more populations.
Analysis sample Part of the total sample used to check the results of the discriminant function.
Analytical model An explicit specification of a set of variables and their interrelationships designed to represent some real system or process in whole or in part.
Analytical services Companies that provide guidance in the development of research design.
A posteriori contrasts Contrasts made after conducting the analysis. These are generally multiple comparison tests.
A priori contrasts Contrasts determined before conducting the analysis, based on the researcher’s theoretical framework.
Area sampling A common form of cluster sampling in which the clusters consist of geographical areas such as counties, housing tracts, blocks or other area descriptions.
Association techniques A type of projective technique in which participants are presented with a stimulus and are asked to respond with the first thing that comes to mind.
Asymmetric lambda A measure of the percentage improvement in predicting the value of the dependent variable given the value of the independent variable in contingency table analysis. Lambda also varies between 0 and 1.
Audit A data collection process derived from physical records or performing inventory analysis. Data are collected personally by the researcher, or by representatives of the researcher, and are based on counts usually of physical objects rather than people.
Average linkage A linkage method based on the average distance between all pairs of objects, where one member of the pair is from each of the clusters.
BBack translation A translation technique that translates
a questionnaire from the base language by a translator whose native language is the one into which the questionnaire is being translated. This version is then retranslated back into the original language by someone whose native language is the base language. Translation errors can then be identified.
Glossary

909Glossary
Balanced scale A scale with an equal number of favourable and unfavourable categories.
Bar chart A chart that displays data in bars positioned horizontally or vertically.
Bayesian approach A selection method where the elements are selected sequentially. The Bayesian approach explicitly incorporates prior information about population parameters as well as the costs and probabilities associated with making wrong decisions.
Beta error (b) See Type II error.
Bibliographic databases Databases composed of citations to articles in journals, magazines, newspapers, marketing research studies, technical reports, government documents and the like. They often provide summaries or abstracts of the material cited.
Binary logit model The binary logit model commonly deals with the issue of how likely an observation is to belong to each group. It estimates the probability of an observation belonging to a particular group.
Binominal test A goodness-of-fit statistical test for dichotomous variables. It tests the goodness of fit of the observed number of observations in each category to the number expected under a specified binominal distribution.
Bivariate regression A procedure for deriving a mathematical relationship, in the form of an equation, between a single metric-dependent variable and a single metric-independent variable.
Blog and buzz mining Provide the means to observe, track or initiate views in research communities, social networks and anywhere else that people post comments, visuals, music and other forms of art on the internet.
Branching question A question used to guide an interviewer (or participant) through a survey by directing the interviewer (or participant) to different spots on the questionnaire depending on the answers given.
Branded market research products Specialised data collection and analysis procedures developed to address specific types of marketing research problems.
Broad statement of the problem The initial statement of the marketing research problem that provides an appropriate perspective on the problem.
Buzz score A score based on the total number of people searching for specific subjects on internet search engines.
CCarryover effects Where the evaluation of a particular
scaled item significantly affects the participant’s judgement of subsequent scaled items.
Cartoon tests Cartoon characters are shown in a specific situation related to the problem. Participants are asked to indicate the dialogue that one cartoon character might make in response to the comment(s) of another character.
Case study A detailed study based upon the observation of the intrinsic details of individuals, groups of individuals and organisations.
Casewise deletion A method for handling missing responses in which cases or participants with any missing responses are discarded from the analysis.
Category equivalence A construct equivalence issue that deals specifically with whether the categories in which brands, products and behaviour are grouped are the same in different countries.
Causal research A type of conclusive research where the major objective is to obtain evidence regarding cause-and-effect (causal) relationships.
Causality Causality applies when the occurrence of X increases the probability of the occurrence of Y.
Census A complete enumeration of the elements of a population or study objects.
Centroid method A variance method of hierarchical clustering in which the distance between two clusters is the distance between their centroids (means for all the variables).
Characteristic profile An aid to interpreting discriminant analysis results by describing each group in terms of the group means for the predictor variables.
Chi-square distribution A skewed distribution whose shape depends solely on the number of degrees of freedom. As the number of degrees of freedom increases, the chi-square distribution becomes more symmetrical.
Chi-square statistic The statistic used to test the statistical significance of the observed association in a cross-tabulation. It assists us in determining whether a systematic association exists between the two variables.
Classification information Socio-economic and demographic characteristics used to classify respondents.
Cluster sampling A two-step probability sampling technique where the target population is first divided into mutually exclusive and collectively exhaustive subpopulations called clusters, and then a random sample of clusters is selected based on a probability sampling technique such as SRS. For each selected cluster, either all the elements are included in the sample, or a sample of elements is drawn probabilistically.

910 Marketing Research
Co-creation The practice of developing new designs including products or marketing communications through collaboration with consumers.
Codebook A book containing coding instructions and the necessary information about the questions and potential answers in a survey.
Coding Assigning a code to represent a specific response to a specific question along with the data record and column position that the code will occupy.
Coding and data entry services Companies whose primary service offering is their expertise in converting completed surveys or interviews into a usable database for conducting statistical analysis.
Coding data Breaking down qualitative data into discrete chunks and attaching a reference to those chunks of data.
Coefficient alpha A measure of internal consistency reliability that is the average of all possible split-half coefficients resulting from different splittings of the scale items.
Coefficient of variation A useful expression in sampling theory for the standard deviation as a percentage of the mean.
Cohort analysis A multiple cross-sectional design consisting of surveys conducted at appropriate time intervals. The cohort refers to the group of participants who experience the same event within the same time interval.
Common factor analysis An approach to factor analysis that estimates the factors based only on the common variance. Also called principal axis factoring.
Communality Communality is the variance of a measured variable that is explained by the construct on which it loads.
Comparative scales One of two types of scaling technique in which there is direct comparison of stimulus objects with one another.
Complete linkage A linkage method that is based on maximum distance of the farthest neighbour approach.
Completion rate The percentage of qualified participants who complete the interview. It enables researchers to take into account anticipated refusals by people who qualify.
Completion technique A projective technique that requires particpants to complete an incomplete stimulus situation.
Conceptual equivalence A construct equivalence issue that deals with whether the interpretation of brands, products, consumer behaviour and the marketing effort are the same in different countries.
Conceptual map A way to link the broad statement of the marketing decision problem to the marketing research problem.
Conclusive research A research design characterised by the measurement of clearly defined marketing phenomena.
Concomitant variation A condition for inferring causality that requires that the extent to which a cause, X, and an effect, Y, occur together or vary together is predicted by the hypothesis under consideration.
Concurrent validity A type of validity that is assessed when the data on the scale being evaluated and on the criterion variables are collected at the same time.
Confidence intervals The range into which the true population parameter will fall, assuming a given level of confidence.
Configural equivalence Concerns the relationships of measured items to the latent constructs and implies that the patterns of factor loadings should be the same across countries or cultural units.
Confounding variables Variables used to illustrate that extraneous variables can confound the results by influencing the dependent variable; synonymous with extraneous variables.
Conjoint analysis A technique that attempts to determine the relative importance consumers attach to salient attributes and the utilities they attach to the levels of attributes.
Conjoint analysis model The mathematical model expressing the fundamental relationship between attributes and utility in conjoint analysis.
Consistency checks A part of the data cleaning process that identifies data that are out of range, logically inconsistent or have extreme values. Data with values not defined by the coding scheme are inadmissible.
Constant sum scaling A comparative scaling technique in which respondents are required to allocate a constant sum of units such as points, euros, chits, stickers or chips among a set of stimulus objects with respect to some criterion.
Construct A specific type of concept that exists at a higher level of abstraction than do everyday concepts. Also called a factor, a construct is measured by multiple indicators or observed variables.
Construct equivalence A type of equivalence that deals with the question of whether the marketing constructs have the same meaning and significance in different countries.
Construct validity A type of validity that addresses the question of what construct or characteristic the scale is

911Glossary
measuring. An attempt is made to answer theoretical questions of why a scale works and what deductions can be made concerning the theory underlying the scale.
Construction technique A projective technique in which participants are required to construct a response in the form of a story, dialogue or description.
Content analysis The objective, systematic and quantitative description of the manifest content of a communication.
Content validity A type of validity, sometimes called face validity, that consists of a subjective but systematic evaluation of the representativeness of the content of a scale for the measuring task at hand.
Contingency coefficient A measure of the strength of association in a table of any size.
Contingency table A cross-tabulation table; it contains a cell for every combination of categories of the two variables.
Continuous rating scale A measurement scale that has participants rate the objects by placing a mark at the appropriate position on a line that runs from one extreme of the criterion variable to the other. The form may vary considerably. Also called graphic rating scale.
Contrasts In ANOVA, a method of examining differences among two or more means of the treatment groups.
Contrived observation Observing behaviour in an artificial environment.
Controlled test market A test-marketing programme conducted by an outside research company in field experimentation. The research company guarantees distribution of the product in retail outlets that represent a predetermined percentage of the market.
Convenience sampling A non-probability sampling technique that attempts to obtain a sample of convenient elements. The selection of sampling units is left primarily to the interviewer.
Convergent validity A measure of construct validity that measures the extent to which the scale correlates positively with other measures of the same construct.
Cookie A group of letters and numbers stored in a web surfer’s browser that identifies the browser’s computer.
Correspondence analysis An MDS technique for scaling qualitative data that scales the rows and columns of the input contingency table in corresponding units so that each can be displayed in the same low-dimensional space.
Covariance A systematic relationship between two variables in which a change in one implies a corresponding change in the other (COVxy).
Covariate A metric-independent variable used in ANCOVA.
Cramer’s V A measure of the strength of association used in tables larger than 2 × 2.
Criterion validity A type of validity that examines whether the measurement scale performs as expected in relation to other selected variables as meaningful criteria.
Critical request The target behaviour being researched.
Cross-cultural analysis A type of across-countries analysis in which the data could be aggregated for each country and then aggregate statistics analysed.
Cross-sectional design A type of research design involving the collection of information from any given sample of population elements only once.
Cross-tabulation A statistical technique that describes two or more variables simultaneously and results in tables that reflect the joint distribution of two or more variables that have a limited number of categories or distinct values.
Cross-validation A test of validity that examines whether a model holds on comparable data not used in the original estimation.
Customer database A database that details characteristics of customers and prospects that can include names and addresses, geographic, demographic and buying behaviour data.
Customer relationship management (CRM) The processes involved in the identification of profitable customers and/or customer groups and the cultivation of relationships with these customers. The aim of such processes is to build customer loyalty, raise retention rates and therefore increase profitability.
Customised services Companies that tailor research procedures to best meet the needs of each client.
DData assembly The gathering of data from a variety
of disparate sources.
Data cleaning Thorough and extensive checks for consistency and treatment of missing responses.
Data display Involves summarising and presenting the structure that is seen in collected qualitative data.
Data reduction The organising and structuring of qualitative data.
Data verification Involves seeking alternative explanations of the interpretations of qualitative data, through other data sources.
Debriefing After a disguised experiment, informing participants and subjects what the experiment was about and how the experimental manipulations were performed.

912 Marketing Research
Decomposition of the total variation In one-way ANOVA, separation of the variation observed in the dependent variable into the variation due to the independent variables, plus the variation due to error.
Deduction A form of reasoning in which a conclusion is validly inferred from some premises, and must be true if those premises are true.
Demand artefacts Responses given because the participants attempt to guess the purpose of the experiment and respond accordingly.
Dependence techniques Multivariate techniques appropriate when one or more of the variables can be identified as dependent variables and the remaining ones as independent variables.
Dependent variables Variables that measure the effect of the independent variables on the test units.
Derived approaches In MDS, attribute-based approaches to collecting perception data requiring participants to rate the stimuli on the identified attributes using semantic differential or Likert scales.
Description The unique labels or descriptors that are used to designate each value of the scale. All scales possess description.
Descriptive research A type of conclusive research that has as its major objective the description of something, usually market characteristics or functions.
Design control A method of controlling extraneous variables that involves using specific experimental designs.
Determinism A doctrine espousing that everything that happens is determined by a necessary chain of causation.
Dichotomous question A structured question with only two response alternatives, such as yes and no, often supplemented by a neutral alternative.
Direct approach A type of qualitative research in which the purposes of the project are disclosed to the participant or are obvious given the nature of the interview.
Direct method An approach to discriminant analysis that involves estimating the discriminant function so that all the predictors are included simultaneously.
Directory databases Databases that provide information on individuals, organisations and services.
Discriminant analysis A technique for analysing marketing research data when the criterion or dependent variable is categorical and the predictor or independent variables are interval in nature.
Discriminant analysis model The statistical model on which discriminant analysis is based.
Discriminant function The linear combination of independent variables developed by discriminant analysis that will best discriminate between the categories of the dependent variable.
Discriminant validity A type of construct validity that assesses the extent to which a measure does not correlate with other constructs from which it is supposed to differ.
Disordinal interaction The change in the rank order of the effects of one factor across the levels of another.
Distance The characteristic of distance means that absolute differences between the scale descriptors are known and may be expressed in units.
Divisive clustering A hierarchical clustering procedure where all objects start out in one giant cluster. Clusters are formed by dividing this cluster into smaller and smaller clusters.
Double-barrelled question A single question that attempts to cover two issues. Such questions can be confusing to participants and result in ambiguous responses.
Double cross-validation A special form of validation in which the sample is split into halves. One half serves as the estimation sample and the other as a validation sample. The roles of the estimation and validation halves are then reversed and the cross-validation process is repeated.
Double sampling A sampling technique in which certain population elements are sampled twice.
Dummy variables A respecification procedure using variables that take on only two values, usually 0 or 1.
EEditing A review of the questionnaires with the objective
of increasing accuracy and precision.
Elbow criterion A plot of stress versus dimensionality used in MDS. The point at which an elbow or a sharp bend occurs indicates an appropriate dimensionality.
Electronic observation An observational research strategy in which electronic devices, rather than human observers, record the phenomenon being observed.
Element An object that possesses the information sought by the researcher and about which inferences are to be made.
Empiricism A theory of knowledge; a broad category of the philosophy of science that locates the source of all knowledge in experience.
Estimated or predicted value The value Yi = a + bx, where a and b are, respectively, estimators of b0 and b1, the corresponding population parameters.

913Glossary
Ethnography A research approach based upon the observation of the customs, habits and differences between people in everyday situations.
Euclidean distance The square root of the sum of the squared differences in values for each variable.
Evolving research design A research design where particular research techniques are chosen as the researcher develops an understanding of the issues and respondents.
Experiment The process of manipulating one or more independent variables and measuring their effect on one or more dependent variables, while controlling for the extraneous variables.
Experimental design The set of experimental procedures specifying: (1) the test units and sampling procedures; (2) the independent variables; (3) the dependent variables; and (4) how to control the extraneous variables.
Experimental group An initial focus group, run to test the setting of the interview, the opening question, the topic guide and the mix of participants that make up the group.
Exploratory research A research design characterised by a flexible and evolving approach to understanding marketing phenomena that are inherently difficult to measure.
Expressive technique A projective technique in which participants are presented with a verbal or visual situation and are asked to relate the feelings and attitudes of other people to the situation.
External analysis of preferences A method of configuring a spatial map such that the ideal points or vectors based on preference data are fitted in a spatial map derived from the perception data.
External data Data that originate outside the organisation.
External suppliers Outside marketing research companies hired to supply marketing research services.
External validity A determination of whether the cause-and-effect relationships found in the experiment can be generalised.
Extraneous variables Variables, other than dependent and independent variables, that may influence the results of an experiment.
Eye-tracking equipment Instruments that record the gaze movements of the eye.
FFactor An underlying dimension that explains the
correlations among a set of variables.
Factor analysis A class of procedures primarily used for data reduction and summarisation.
Factor scores Composite scores estimated for each participant on the derived factors.
Factorial design A statistical experimental design used to measure the effects of two or more independent variables at various levels and to allow for interactions between variables.
Factors Categorical independent variables in ANOVA. The independent variables must all be categorical (non-metric) to use ANOVA.
F distribution A frequency distribution that depends upon two sets of degrees of freedom: the degrees of freedom in the numerator and the degrees of freedom in the denominator.
Field environment An experimental location set in actual market conditions.
Field force Both the actual interviewers and the supervisors involved in data collection.
Field notes A log or diary of observations, events and reflections made by a researcher as a study is planned, implemented and analysed.
Field services Companies whose primary service is offering their expertise in collecting data for research projects.
Filter question An initial question in a questionnaire that screens potential participants to ensure they meet the requirements of the sample.
Fixed-response alternative questions Questions that require participants to choose from a set of predetermined answers.
Focus group A discussion conducted by a trained moderator among a small group of participants in an unstructured and natural manner.
Forced rating scale A rating scale that forces participants to express an opinion because a ‘no opinion’ or ‘no knowledge’ option is not provided.
Frequency distribution A mathematical distribution whose objective is to obtain a count of the number of responses associated with different values of one variable and to express these counts in percentage terms.
Friendship pair A technique used to interview children as two friends or classmates together.
Frugging The use of marketing research to deliberately disguise fundraising activities.
F statistic The ratio of two sample variances.
F test A statistical test of the equality of the variances of two populations.
Full-service suppliers Companies that offer a full range of marketing research activities.

914 Marketing Research
Full-text databases Databases that contain the complete text of secondary source documents comprising the database.
Functional equivalence A construct equivalence issue that deals specifically with whether a given concept or behaviour serves the same role or function in different countries.
Funnel approach A strategy for ordering questions in a questionnaire in which the sequence starts with the general questions followed by progressively specific questions, to prevent specific questions from biasing general questions.
GGalvanic skin response Changes in the electrical
resistance of the skin that relate to a participant’s affective state.
Gamification The process of adding game mechanics to processes, programs and platforms that wouldn’t traditionally use such concepts.
Gamma A test statistic that measures the association between two ordinal-level variables. It does not make an adjustment for ties.
Generalisability The degree to which a study based on a sample applies to the population as a whole.
Geodemographic classification This groups consumers together based on the types of neighbourhood in which they live. If a set of neighbourhoods are similar across a wide range of demographic measures, they may also offer similar potential across most products, brands, services and media.
Geodemographic information system (GIS) At a base level, a GIS matches geographic information with demographic information. This match allows subsequent data analyses to be presented on maps.
Graphic rating scale See Continuous rating scale.
Graphical models Analytical models that provide a visual picture of the relationships between variables.
Grounded theory A qualitative approach to generating theory through the systematic and simultaneous process of data collection and analysis.
Grounded theory data coding A form of shorthand that distils events and meanings without losing their essential properties.
HHierarchical clustering A clustering procedure
characterised by the development of a hierarchy or treelike structure.
Histogram A vertical bar chart in which the height of the bar represents the relative or cumulative frequency of occurrence.
History Specific events that are external to the experiment but that occur at the same time as the experiment.
Hit ratio The percentage of cases correctly classified by discriminant analysis.
Hybrid conjoint analysis A form of conjoint analysis that can simplify the data collection task and estimate selected interactions as well as all main effects.
Hypothesis An unproven statement or proposition about a factor or phenomenon that is of interest to a researcher.
IIdentification information A type of information
obtained in a questionnaire that includes name, address and phone number.
Implicit alternative An alternative that is not explicitly expressed.
Implicit assumptions An assumption that is not explicitly stated in a question.
Imputation A method to adjust for non-response by assigning the characteristic of interest to the non-participants based on the similarity of the variables available for both non-participants and participants.
Incidence rate Refers to the rate of occurrence or the percentage of persons eligible to participate in a study.
Independent samples The samples are independent if they are drawn randomly from different populations.
Independent variables Variables that are manipulated by the researcher and whose effects are measured and compared.
In-depth interview An unstructured, direct, personal interview in which a single participant is probed by an experienced interviewer to uncover underlying motivations, beliefs, attitudes and feelings on a topic.
Indirect approach A type of qualitative research in which the purposes of the project are disguised from the participants.
Induction A form of reasoning that usually involves the inference that an instance or repeated combination of events may be universally generalised.
Instrumentation An extraneous variable involving changes in the measuring instrument, in the observers, or in the scores themselves.
Integrating analysis Creating an order and connectivity that is seen to be emerging from memos.

915Glossary
Interaction When assessing the relationship between two variables, an interaction occurs if the effect of X1 depends on the level of X2, and vice versa.
Interactive testing effect An effect in which a prior measurement affects the test unit’s response to the independent variable.
Interdependence technique A multivariate statistical technique in which the whole set of interdependent relationships is examined.
Internal analysis of preferences A method of configuring a spatial map such that the spatial map represents both brands or stimuli and participant points or vectors and is derived solely from the preference data.
Internal consistency reliability An approach for assessing the internal consistency of a set of items, where several items are summated in order to form a total score for the scale.
Internal data Data available within the organisation for whom the research is being conducted.
Internal secondary data Data held within an organisation for some purpose other than a research problem at hand.
Internal validity A measure of accuracy of an experiment. It measures whether the manipulation of the independent variables, or treatments, actually caused the effects on the dependent variable(s).
Interquartile range The range of a distribution encompassing the middle 50% of the observations.
Interval scale A scale in which the numbers are used to rank objects such that numerically equal distances on the scale represent equal distances in the characteristic being measured.
Intra-cultural analysis Within-country analysis of international data.
Itemised rating scale A measurement scale having numbers or brief descriptions associated with each category. The categories are ordered in terms of scale position.
JJudgemental sampling A form of convenience
sampling in which the population elements are purposely selected based on the judgement of the researcher.
KKolmogorov–Smirnov (K–S) one-sample test A one-
sample non-parametric goodness-of-fit test that compares the cumulative distribution function for a variable with a specified distribution.
Kolmogorov–Smirnov (K–S) two-sample test Non-parametric test statistic that determines whether two distributions are the same. It takes into account any differences in the two distributions, including median, dispersion and skewness.
Kruskal–Wallis one-way ANOVA A non-metric ANOVA test that uses the rank value of each case, not merely its location relative to the median.
k-sample median test A non-parametric test used to examine differences among more than two groups when the dependent variable is measured on an ordinal scale.
Kurtosis A measure of the relative peakedness of the curve defined by the frequency distribution.
LLaboratory environment An artificial setting for
experimentation in which the researcher constructs the desired conditions.
Laddering A technique for conducting in-depth interviews in which a line of questioning proceeds from product characteristics to user characteristics.
Latin square design A statistical design that allows for the statistical control of two non-interacting external variables in addition to the manipulation of the independent variable.
Leading question A question that gives the participant a clue as to what the answer should be.
Least squares procedure A technique for fitting a straight line into a scattergram by minimising the vertical distances of all the points from the line.
Level of significance The probability of making a Type I error.
Lifestyles Distinctive patterns of living described by the activities people engage in, the interests they have and the opinions they hold of themselves and the world around them.
Likert scale A measurement scale with five response categories ranging from ‘strongly disagree’ to ‘strongly agree’ that requires participants to indicate a degree of agreement or disagreement with each of a series of statements related to the stimulus objects.
Limited-service suppliers Companies that specialise in one or a few phases of a marketing research project.
Line chart A chart that connects a series of data points using continuous lines.
Linguistic equivalence The equivalence of both spoken and written language forms used in scales and questionnaires.

916 Marketing Research
Linkage methods Agglomerative methods of hierarchical clustering that cluster objects based on a computation of the distance between them.
Listening Involves the evaluation of naturally occurring conversations, behaviours and signals. This information that is elicited may or may not be guided, but it brings the voice of consumers’ lives to brand.
Longitudinal design A type of research design involving a fixed sample of population elements measured repeatedly. The sample remains the same over time, thus providing a series of pictures that, when viewed together, vividly illustrate the situation and the changes that are taking place.
Loyalty card At face value, a sales promotion device used by supermarkets, pharmacists, department stores, petrol stations and even whole shopping centres and towns to encourage repeat purchases. For the marketing researcher, the loyalty card is a device that can link customer characteristics to actual product purchases.
MMahalanobis procedure A stepwise procedure used in
discriminant analysis to maximise a generalised measure of the distance between the two closest groups.
Main testing effect An effect of testing occurring when a prior observation affects a later observation.
Mann–Whitney U test A statistical test for a variable measured on an ordinal scale, comparing the differences in the location of two populations based on observations from two independent samples.
Market research reports and advisory services Companies that provide off-the-shelf reports as well as data and briefs on a range of markets, consumer types and issues.
Marketing decision problem The problem confronting the marketing decision maker, which asks what the decision maker has to do.
Marketing intelligence Qualified observations of events and developments in the marketing environment.
Marketing research A key element within the total field of marketing information. It links the consumer, customer and public to the marketer through information that is used to identify and define marketing opportunities and problems; to generate, refine and evaluate marketing actions; and to improve understanding of marketing as a process and of the ways in which specific marketing activities can be made more effective.
Marketing Research Online Community An invited group of consumers with a common focus on a particular brand. This group is brought together online
to develop conversations and to react to set quantitative and qualitative tasks.
Marketing research problem A problem that entails determining what information is needed and how it can be obtained in the most feasible way.
Marketing research process A set of six steps that define the tasks to be accomplished in conducting a marketing research study. These include problem definition, developing an approach to the problem, research design formulation, fieldwork, data integrity and analysis communicating research findings.
Matching A method of controlling extraneous variables that involves matching participants on a set of key background variables before assigning them to the treatment conditions.
Mathematical models Analytical models that explicitly describe the relationship between variables, usually in equation form.
Maturation An extraneous variable attributable to changes in the test units themselves that occur with the passage of time.
Mean The average; that value obtained by summing all elements in a set and dividing by the number of elements.
Measure of location A statistic that describes a location within a data set. Measures of central tendency describe the centre of the distribution.
Measure of variability A statistic that indicates the distribution’s dispersion.
Measurement The assignment of numbers or other symbols to characteristics of objects according to certain pre-specified rules.
Measurement equivalence Deals with the comparability of responses to particular (sets of) items. Measurement equivalence includes configural (structural), metric (measurement unit) and scalar equivalence.
Measurement error The variation in the information sought by the researcher and the information generated by the measurement process employed.
Media panels A data-gathering technique composed of samples of participants whose TV viewing behaviour is automatically recorded by electronic devices, supplementing the purchase information recorded in a diary.
Median A measure of central tendency given as the value above which half of the values fall and below which half of the values fall.
Memo writing Anything from loosely written makes through to fully formed analytical arguments, which are added to the original data and interpretations.

917Glossary
Metric data Data that are interval or ratio in nature.
Metric equivalence See Scalar equivalence.
Metric MDS An MDS scaling method that assumes the input data are metric.
Metric scale A scale that is either interval or ratio in nature.
Missing responses Values of a variable that are unknown because the participants concerned provided ambiguous answers to the question or because their answers were not properly recorded.
Mode A measure of central tendency given as the value that occurs with the most frequency in a sample distribution.
Model fit Model fit is determined by comparing how closely the estimated covariance matrix πk, matches the observed (sample) covariance matrix, S, i.e. the fit statistics are based on |S – πk|.
Model identification Model identification concerns whether there is enough information in the covariance matrix to enable us to estimate a set of structural equations.
Moderator An individual who conducts a focus group interview, by setting the purpose of the interview, questioning, probing and handling the process of discussion.
Monadic scale See Non-comparative scale.
Mood board A collage created in a focus group setting. Focus group participants are asked to snip words and pictures from magazines that they see as representing the values a particular brand is perceived to have. In some circumstances, collages can also be made up from audio- and videotapes.
Mortality An extraneous variable attributable to the loss of test units while the experiment is in progress.
Multicollinearity A state of high intercorrelations among independent variables.
Multidimensional scaling (MDS) A class of procedures for representing perceptions and preferences of participants spatially by means of a visual display.
Multi-item scale A multi-item scale consists of multiple items, where an item is a single question or statement to be evaluated.
Multiple comparison tests A posteriori contrasts that enable the researcher to construct generalised confidence intervals that can be used to make pairwise comparisons of all treatment means.
Multiple cross-sectional design A cross-sectional design in which there are two or more samples of participants, and information from each sample is obtained only once.
Multiple discriminant analysis Discriminant analysis technique where the criterion variable involves three or more categories.
Multiple H2 The strength of the joint effect of two (or more) factors, or the overall effect.
Multiple regression A statistical technique that simultaneously develops a mathematical relationship between two or more independent variables and an interval-scaled dependent variable.
Multiple regression model An equation used to explain the results of multiple regression analysis.
Multiple time series design A time series design that includes another group of test units to serve as a control group.
Multivariate analysis of variance (MANOVA) An ANOVA technique using two or more metric dependent variables.
Multivariate techniques Statistical techniques suitable for analysing data when there are two or more measurements on each element and the variables are analysed simultaneously. Multivariate techniques are concerned with the simultaneous relationships among two or more phenomena.
Mystery shopper An observer visiting providers of goods and services as if they were really a customer, and recording characteristics of the service delivery.
NNatural observation Observing behaviour as it takes
place in the environment.
Netnography An adaptation of ethnography that analyses the free behaviour of individuals in online environments.
Neuromarketing The application of neuroscience in marketing, primarily to measure emotions through brain imaging.
Nominal scale A scale whose numbers serve only as labels or tags for identifying and classifying objects with a strict one-to-one correspondence between the numbers and the objects.
Nomological validity A type of validity that assesses the relationship between theoretical constructs. It seeks to confirm significant correlations between the constructs as predicted by a theory.
Non-comparative scale One of two types of scaling techniques in which each stimulus object is scaled independently of the other objects in the stimulus set. Also called monadic scale.
Non-hierarchical clustering A procedure that first assigns or determines a cluster centre and then groups all objects within a pre-specified threshold value from the centre.

918 Marketing Research
Non-metric ANOVA An ANOVA technique for examining the difference in the central tendencies of more than two groups when the dependent variable is measured on an ordinal scale.
Non-metric correlation A correlation measure for two non-metric variables that relies on rankings to compute the correlation.
Non-metric data Data derived from a nominal or ordinal scale.
Non-metric MDS A type of MDS that assumes that the input data are ordinal.
Non-metric scale A scale that is either nominal or ordinal in nature.
Non-parametric tests Hypothesis-testing procedures that assume that the variables are measured on a nominal or ordinal scale.
Non-probability sampling Sampling techniques that do not use chance selection procedures but rather rely on the personal judgement of the researcher.
Non-response bias Bias caused when actual participants differ from those who refuse to participate.
Non-response error A type of non-sampling error that occurs when some of the participants included in the sample do not respond. This error may be defined as the variation between the true mean value of the variable in the original sample and the true mean value in the net sample.
Non-sampling error An error that can be attributed to sources other than sampling and that can be random or non-random.
Normal distribution A basis of classical inference that is bell shaped and symmetrical in appearance. Its measures of central tendency are all identical.
Null hypothesis A statement in which no difference or effect is expected. If the null hypothesis is not rejected, no changes will be made.
Numeric databases Databases containing numerical and statistical information that may be important sources of secondary data.
n-way analysis of variance An ANOVA model where two or more factors are involved.
OObjective evidence Perceived to be unbiased evidence,
supported by empirical findings.
Oblique rotation Rotation of factors when the axes are not maintained at right angles.
Omega squared (v2) A measure indicating the proportion of the variation in the dependent variable that is related to a particular independent variable or factor.
Omnibus survey A distinctive form of survey that serves the needs of a syndicated group. The omnibus survey targets particular types of participants, such as those in specific geographic locations, e.g. Luxembourg residents, or consumers of particular types of products, e.g. business air travellers. With that target group of participants, a core set of questions can be asked, with other questions added as syndicate members wish.
One-group pre-test–post-test design A pre-experimental design in which a group of participants is measured twice.
One-shot case study A pre-experimental design in which a single group of participants is exposed to a treatment X, and then a single measurement of the dependent variable is taken.
One-tailed test A test of the null hypothesis where the alternative hypothesis is expressed directionally.
One-way analysis of variance An ANOVA technique in which there is only one factor.
Online community providers Online research communities where researchers can employ a wide variety of quantitative and qualitative techniques to connect to consumers.
Online databases Databases that require a telecommunications network to access.
Online focus groups and streaming Provide platforms for running online focus groups and streaming the results.
Online services Companies that specialise in the use of the internet to collect, analyse and distribute marketing research information.
Operational data Data generated about an organisation’s customers, through day-to-day transactions.
Operational equivalence A type of equivalence that measures how theoretical constructs are operationalised in different countries to measure marketing variables.
Operationalised The derivation of measurable characteristics to encapsulate marketing phenomena; e.g. the concept of ‘customer loyalty’ can be operationalised through measurements such as frequency of repeat purchases or the number of years that a business relationship has existed.
Optimising partitioning method A non-hierarchical clustering method that allows for later reassignment of objects to clusters to optimise an overall criterion.
Order The relative sizes or positions of the descriptors. Order is denoted by descriptors such as greater than, less than and equal to.

919Glossary
Order bias A participant’s tendency to choose an alternative merely because it occupies a certain position, or is listed in a certain order.
Ordinal interaction An interaction where the rank order of the effects attributable to one factor does not change across the levels of the second factor.
Ordinal scale A ranking scale in which numbers are assigned to objects to indicate the relative extent to which some characteristic is possessed. Thus, it is possible to determine whether an object has more or less of a characteristic than some other object.
Origin The origin characteristic means that the scale has a unique or fixed beginning or true zero point.
Orthogonal rotation Rotation of factors in which the axes are maintained at right angles.
PPaired comparison scaling A comparative scaling
technique in which a participant is presented with two objects at a time and asked to select one object in the pair according to some criterion. The data obtained are ordinal in nature.
Paired samples The samples are paired when the data for the two samples relate to the same group of participants.
Paired samples t test A test for differences in the means of paired samples.
Pairwise deletion A method for handling missing responses in which all cases or participants with any missing responses are not automatically discarded; rather, for each calculation, only the cases or participants with complete responses are considered.
Pan-cultural analysis Across-countries analysis in which the data for all participants from all the countries are pooled and analysed.
Panel A sample of participants who have agreed to provide information at specified intervals over an extended period.
Panel providers Provide access to consumer, b2b and specialist panels of participants alongside scripting and hosting surveys.
Paradigm A set of assumptions consisting of agreed-upon knowledge, criteria of judgement, problem fields and ways to consider them.
Parallel threshold method A non-hierarchical clustering method that specifies several cluster centres at once. All objects that are within a pre-specified threshold value from the centre are grouped together.
Parallel translation A translation method in which a committee of translators, each of whom is fluent in at least two languages, discuss alternative versions
of a questionnaire and make modifications until consensus is reached.
Parametric tests Hypothesis-testing procedures that assume that the variables of interest are measured on at least an interval scale.
Part correlation coefficient A measure of the correlation between Y and X when the linear effects of the other independent variables have been removed from X (but not from Y).
Partial correlation coefficient A measure of the association between two variables after controlling or adjusting for the effects of one or more additional variables.
Passive social media research Analysing what is already being discussed in social media channels (i.e. the analysis of pre-existing data).
Perceived participant anonymity The participants’ perceptions that their identities will not be discerned by the interviewer or researcher.
Personal observation An observational research strategy in which human observers record the phenomenon being observed as it occurs.
Personification technique Participants are asked to imagine that the brand is a person and then describe characteristics of that person.
Phi coefficient (F) A measure of the strength of association in the special case of a table with two rows and two columns (a 2 × 2 table).
Picture response technique A projective technique in which participants are shown a picture and are asked to tell a story describing it.
Pie chart A round chart divided into sections.
Pilot-testing Testing the questionnaire on a small sample of particpants for the purpose of improving the questionnaire by identifying and eliminating potential problems.
Population The aggregate of all the elements, sharing some common set of characteristics, that comprise the universe for the purpose of the marketing research problem.
Position bias See Order bias.
Positivism A philosophy of language and logic consistent with an empiricist philosophy of science.
Post-test-only control group design Experimental design in which the experimental group is exposed to the treatment but the control group is not, and no pre-test measure is taken.
Power of a statistical test The probability of rejecting the null hypothesis when it is in fact false and should be rejected.

920 Marketing Research
Pre-coding In questionnaire design, assigning a code to every conceivable response before data collection.
Predictive validity A type of validity that is concerned with how well a scale can forecast a future criterion.
Pre-experimental designs Designs that do not control for extraneous factors by randomisation.
Pre-test–post-test control group design An experimental design in which the experimental group is exposed to the treatment but the control group is not. Pre-test and post-test measures are taken on both groups.
Primary data Data originated by the researcher specifically to address the research problem.
Principal axis factoring See Common factor analysis.
Principal components analysis An approach to factor analysis that considers the total variance in the data.
Probability proportionate to size (PPS) A selection method where the probability of selecting a sampling unit in a selected cluster varies inversely with the size of the cluster. Therefore, the size of all the resulting clusters is approximately equal.
Probability sampling A sampling procedure in which each element of the population has a fixed probabilistic chance of being selected for the sample.
Probing A motivational technique used when asking questions to induce the participants to enlarge on, clarify or explain their answers.
Problem audit A comparative examination of a marketing problem to understand its origin and nature.
Problem definition A broad statement of the general problem and identification of the specific components of the marketing research problem.
Problem-identification research Research undertaken to help identify problems that are not necessarily apparent on the surface, yet exist or are likely to arise in the future.
Problem-solving research Research undertaken to help solve marketing problems.
Product moment correlation (r) A statistic summarising the strength of association between two metric variables.
Projective technique An unstructured and indirect form of questioning that encourages participants to project their underlying motivations, beliefs, attitudes or feelings regarding the issues of concern.
Psycho-galvanometer An instrument that measures a participant’s galvanic skin response.
Psychographics Quantified profiles of individuals based upon lifestyle characteristics.
Pupilometer An instrument that measures changes in the eye pupil diameter.
Purchase panels A data-gathering technique in which participants record their purchases in a diary.
p value This is the probability of observing a value of the test statistic as extreme as, or more extreme than, the value actually observed, assuming that the null hypothesis is true.
QQ-sort scaling A comparative scaling technique that
uses a rank order procedure to sort objects based on similarity with respect to some criterion.
Qualitative research An unstructured, primarily exploratory design based on small samples, intended to provide depth, insight and understanding.
Quantitative observation The recording and counting of behavioural patterns of people, objects and events in a systematic manner to obtain information about the phenomenon of interest.
Quantitative research Research techniques that seek to quantify data and, typically, apply some form of statistical analysis.
Quasi-experimental designs Designs that apply part of the procedures of true experimentation yet lack full experimental control.
Questionnaire A structured technique for data collection consisting of a series of questions, written or verbal, that a participant answers.
Quota sampling A non-probability sampling technique that is two-stage restricted judgemental sampling. The first stage consists of developing control categories or quotas of population elements. In the second stage, sample elements are selected based on convenience or judgement.
RRandom error An error that arises from random changes
or differences in participants or measurement situations.
Random sampling error The error because the particular sample selected is an imperfect repesentation of the population of interest. It may be defined as the variation between the true mean value for the sample and the true mean value of the population.
Randomisation A method of controlling extraneous variables that involves randomly assigning test units to experimental groups by using random numbers. Treatment conditions are also randomly assigned to experimental groups.

921Glossary
Randomised block design A statistical design in which the test units are blocked on the basis of an external variable to ensure that the various experimental and control groups are matched closely on that variable.
Range The difference between the smallest and largest values of a distribution.
Rank order scaling A comparative scaling technique in which participants are presented with several objects simultaneously and asked to order or rank them according to some criterion.
Ratio scale The highest scale. This scale allows the researcher to identify or classify objects, rank order the objects and compare intervals or differences. It is also meaningful to compute ratios of scale values.
Regression analysis A statistical procedure for analysing associative relationships between a metric-dependent variable and one or more independent variables.
Reliability The extent to which a scale produces consistent results if repeated measurements are made on the characteristic.
Repeated measures ANOVA An ANOVA technique used when participants are exposed to more than one treatment condition and repeated measurements are obtained.
Reporting Offers research companies reporting solutions that seek to engage clients in oral and electronic presentations beyond conventional reporting methods, such as hard-copy reports and PowerPoint.
Research brief A document produced by the users of research findings or the buyers of a piece of marketing research. The brief is used to communicate the perceived requirements of a marketing research project.
Research design A framework or blueprint for conducting the marketing research project. It specifies the details of the procedures necessary for obtaining the information needed to structure or solve marketing research problems.
Research proposal The official layout of the planned marketing research activity.
Research questions Refined statements of the specific components of the problem.
Residual The difference between the observed value of Yi and the value predicted by the regression equation Yi. In SEM, the residuals are the differences between the observed and estimated covariance matrices.
Response error A type of non-sampling error arising from participants who do respond but who give inaccurate answers, or whose answers are mis-recorded or mis-analysed. It may be defined as a variation
between the true mean value of the variable in the net sample and the observed mean value obtained in the market research project.
Response latency The amount of time it takes to respond to a question.
Response rate The percentage of the total attempted interviews that are completed.
Role playing Participants are asked to assume the behaviour of someone else.
Runs test A test of randomness for a dichotomous variable.
SSample A subgroup of the elements of the population
selected for participation in the study.
Sample control The ability of the survey mode to reach the units specified in the sample effectively and efficiently.
Sample size The number of elements to be included in a study.
Sampling control An aspect of supervising that ensures that the interviewers strictly follow the sampling plan rather than select sampling units based on convenience or accessibility.
Sampling distribution The distribution of the values of a sample statistic computed for each possible sample that could be drawn from the target population under a specified sampling plan.
Sampling frame A representation of the elements of the target population that consists of a list or set of directions for identifying the target population.
Sampling unit An element, or a unit containing the element, that is available for selection at some stage of the sampling process.
Sampling with replacement A sampling technique in which an element can be included in the sample more than once.
Sampling without replacement A sampling technique in which an element cannot be included in the sample more than once.
Scalar equivalence The demonstration that two individuals from different countries with the same value on some variable will score at the same level on the same test. Also called metric equivalence.
Scale transformation A manipulation of scale values to ensure compatibility with other scales or to otherwise make the data suitable for analysis.
Scaling The generation of a continuum upon which measured objects are located.

922 Marketing Research
Scanner data Data obtained by passing merchandise over a laser scanner that reads the UPC from the packages.
Scanner panels Scanner data where panel members are identified by an ID card, allowing information about each panel member’s purchases to be stored with respect to the individual shopper.
Scanner panels with cable TV The combination of a scanner diary panel with manipulations of the advertising that is being broadcast by cable TV companies.
Secondary data Data previously collected for some purpose other than the problem at hand.
Selection bias An extraneous variable attributable to the improper assignment of test units to treatment conditions.
Semantic differential A seven-point rating scale with end points associated with bipolar labels.
Semiotics The study of signs in the context of consumer experience.
Sentence completion A projective technique in which participants are presented with a number of incomplete sentences and are asked to complete them.
Sequential sampling A probability sampling technique in which the population elements are sampled sequentially, data collection and analysis are done at each stage and a decision is made as to whether additional population elements should be sampled.
Sequential threshold method A non-hierarchical clustering method in which a cluster centre is selected and all objects within a pre-specified threshold value from the centre are grouped together.
Shadow team A small cross-functional boundary-spanning group that learns everything about a competitive unit.
Sign test A non-parametric test for examining differences in the location of two populations, based on paired populations, that compares only the signs of the differences between pairs of variables without taking into account the magnitude of the differences.
Significance of the interaction effect A test of the significance of the interaction between two or more independent variables.
Significance of the main effect of each factor A test of the significance of the main effect for each individual factor.
Significance of the overall effect A test that some differences exist between some of the treatment groups.
Simple random sampling (SRS) A probability sampling technique in which each element has a known and equal probability of selection. Every element is
selected independently of every other element, and the sample is drawn by a random procedure from a sampling frame.
Simulated test market A quasi-test market in which participants are preselected; they are then interviewed and observed on their purchases and attitudes towards the product.
Single cross-sectional design A cross-sectional design in which one sample of participants is drawn from the target population and information is obtained from this sample once.
Single linkage A linkage method based on minimum distance, or the nearest neighbour rule.
Skewness A characteristic of a distribution that assesses its symmetry about the mean.
Snowball sampling A non-probability sampling technique in which an initial group of participants is selected randomly. Subsequent participants are selected based on the referrals or information provided by the initial participants. By obtaining referrals from referrals, this process may be carried out in waves.
Social desirability The tendency of respondents to give answers that may not be accurate but may be desirable from a social standpoint.
Social media Activity that reflects the sharing of user-generated content without necessarily leveraging existing connections between users.
Social network Tools that enable communication between people who are already connected through some form of social group. Social networking sites can therefore be seen as making use of social media technologies (i.e. they are a subset of social media), but not all social media technology is necessarily a social network.
Software providers Provide software packages that create platforms to script, host and analyse surveys, or Software as a Service (SaaS) options.
Solomon four-group design An experimental design that explicitly controls for interactive testing effects, in addition to controlling for all the other extraneous variables.
Special-purpose databases Databases that contain information of a specific nature, e.g. data on a specialised industry.
Specific components of the problem The second part of the marketing research problem definition that focuses on the key aspects of the problem and provides clear guidelines on how to proceed further.
Specification search An empirical approach that uses the model diagnostics and trial and error to find a better-fitting model.

923Glossary
Split-half reliability A form of internal consistency reliability in which the items constituting the scale are divided into two halves and the resulting half scores are correlated.
Standard deviation The square root of the variance.
Standard error The standard deviation of the sampling distribution of the mean or proportion.
Standard test market A test market in which the product is sold through regular distribution channels. For example, no special considerations are given to products simply because they are being test marketed.
Standardisation The process of correcting data to reduce them to the same scale by subtracting the sample mean and dividing by the standard deviation.
Standardised residuals Used as a diagnostic measure of model fit, these are residuals each divided by its standard error.
Stapel scale A scale for measuring attitudes that consists of a single adjective in the middle of an even-numbered range of values.
Static group A pre-experimental design in which there are two groups: the experimental group (EG), which is exposed to the treatment, and the control group (CG). Measurements on both groups are made only after the treatment, and test units are not assigned at random.
Statistical control A method of controlling extraneous variables by measuring the extraneous variables and adjusting for their effects through statistical methods.
Statistical designs Designs that allow for the statistical control and analysis of external variables.
Statistical inference The process of generalising the sample results to a target population.
Statistical regression An extraneous variable that occurs when test units with extreme scores move closer to the average score during the course of the experiment.
Stepwise discriminant analysis Discriminant analysis in which the predictors are entered sequentially based on their ability to discriminate between the groups.
Stepwise regression A regression procedure in which the predictor variables enter or leave the regression equation one at a time.
Story completion A projective technique in which participants are provided with part of a story and are required to give the conclusion in their own words.
Stratified sampling A probability sampling technique that uses a two-step process to partition the population into subsequent subpopulations, or strata. Elements are selected from each stratum by a random procedure.
Structural equation modelling (SEM) Collection of statistical techniques including factor analysis and
multiple regression. It allows the researcher to examine relationships between several continuous or discrete independent variables and several continuous or discrete dependant variables. The independent and dependent variables can be latent or measured variables.
Structured data collection Use of a formal questionnaire that presents questions in a prearranged order.
Structured observation Observation where the researcher clearly defines the behaviours to be observed and the techniques by which they will be measured.
Structured questions Questions that pre-specify the set of response alternatives and the response format. A structured question could be multiple-choice, dichotomous or a scale.
Substitution A procedure that substitutes for non-respondents other elements from the sampling frame who are expected to respond.
Sugging The use of marketing research to deliberately disguise a sales effort.
Surrogate variables A subset of original variables selected for use in subsequent analysis.
Survey method A structured questionnaire administered to a sample of a target population, designed to elicit specific information from participants.
Survey techniques Techniques based upon the use of structured questionnaires given to a sample of a population.
Surveys Interviews with a large number of people using a questionnaire.
Symmetric lambda The symmetric lambda does not make an assumption about which variable is dependent. It measures the overall improvement when prediction is done in both directions.
Syndicated services Companies that collect and sell common pools of data designed to serve information needs shared by a number of clients.
Syndicated sources (services) Information services offered by marketing research organisations that provide information from a common database to different firms that subscribe to their services.
Systematic error An error that affects the measurement in a constant way and represents stable factors that affect the observed score in the same way each time the measurement is made.
Systematic sampling A probability sampling technique in which the sample is chosen by selecting a random starting point and then picking every ith element in succession from the sampling frame.

924 Marketing Research
TTarget population The collection of elements or objects
that possess the information sought by the researcher and about which inferences are to be made.
tau b A test statistic that measures the association between two ordinal-level variables. It makes an adjustment for ties and is the most appropriate when the table of variables is square.
tau c A test statistic that measures the association between two ordinal-level variables. It makes an adjustment for ties and is most appropriate when the table of variables is not square but a rectangle.
t distribution A symmetrical bell-shaped distribution that is useful for sample testing (n < 30). It is similar to the normal distribution in appearance.
Telescoping A psychological phenomenon that takes place when an individual telescopes or compresses time by remembering an event as occurring more recently than it actually occurred.
Territorial map A tool for assessing discriminant analysis results by plotting the group membership of each case on a graph.
Test market A carefully selected part of the marketplace particularly suitable for test marketing.
Test marketing An application of a controlled experiment done in limited, but carefully selected, test markets. It involves a replication of the planned national marketing programme for a product in test markets.
Test statistic A measure of how close the sample has come to the null hypothesis. It often follows a well-known distribution, such as the normal, t, or chi-square distribution.
Test units Participants, organisations or other entities whose response to independent variables or treatments is being studied.
Testing effects Effects caused by the process of experimentation.
Test–retest reliability An approach for assessing reliability, in which respondents are administered identical sets of scale items at two different times, under as nearly equivalent conditions as possible.
Thematic maps Maps that solve marketing problems. They combine geography with demographic information and a company’s sales data or other proprietary information and are generated by a computer.
Theoretical sampling Data gathering driven by concepts derived from evolving theory and based on the concept of ‘making comparisons’.
Theory A conceptual scheme based on foundational statements, or axioms, that are assumed to be true.
Third-person technique A projective technique in which participants are presented with a verbal or visual situation and are asked to relate the beliefs and attitudes of a third person in that situation.
Time series design A quasi-experimental design that involves periodic measurements of the dependent variable for a group of participants. Then the treatment is administered by the researcher or occurs naturally. After the treatment, periodic measurements are continued to determine the treatment effect.
Topic guide A list of topics, questions and probes that are used by a moderator to help manage a focus group discussion.
Total error The variation between the true mean value in the population of the variable of interest and the observed mean value obtained in the marketing research project.
Trace analysis An approach in which data collection is based on physical traces, or evidence, of past behaviour.
Transcripts ‘Hard copies’ of the questions and probes and the corresponding answers and responses in focus groups or in-depth interviews.
Transitivity of preference An assumption made to convert paired comparison data into rank order data. It implies that if Brand A is preferred to Brand B, and Brand B is preferred to Brand C, then Brand A is preferred to Brand C.
Treatment In ANOVA, a particular combination of factor levels or categories.
Trend analysis A method of adjusting for non-response in which the researcher tries to discern a trend between early and late participants. This trend is projected to non-participants to estimate their characteristic of interest.
Triangulation A process that facilitates the validation of data through cross-verification from more than two sources.
True experimental designs Experimental designs distinguished by the fact that the researcher can randomly assign test units to experimental groups and also randomly assign treatments to experimental groups.
True score model A mathematical model that provides a framework for understanding the accuracy of measurement.
t statistic A statistic that assumes that the variable has a symmetric bell-shaped distribution, that the mean is known (or assumed to be known) and that the population variance is estimated from the sample.

925Glossary
t test A univariate hypothesis test using the t distribution, which is used when the standard deviation is unknown and the sample size is small.
Two-group discriminant analysis Discriminant analysis technique where the criterion variable has two categories.
Two-sample median test Non-parametric test statistic that determines whether two groups are drawn from populations with the same median. This test is not as powerful as the Mann–Whitney U test.
Two-tailed test A test of the null hypothesis where the alternative hypothesis is not expressed directionally.
Type I error An error that occurs when the sample results lead to the rejection of a null hypothesis that is, in fact, true. Also known as alpha error (α).
Type II error An error that occurs when the sample results lead to acceptance of a null hypothesis that is, in fact, false. Also known as beta error (β).
UUnivariate techniques Statistical techniques
appropriate for analysing data when there is a single measurement of each element in the sample, or, if there are several measurements on each element, when each variable is analysed in isolation.
Unstructured observation Observation that involves a researcher monitoring all relevant phenomena, without specifying the details in advance.
Unstructured questions Open-ended questions that participants answer in their own words.
VValidation sample That part of the total sample used to
check the results of the estimation sample.
Validity The extent to which a measurement represents characteristics that exist in the phenomenon under investigation.
Variable respecification The transformation of data to create new variables, or the modification of existing variables so that they are more consistent with the objectives of the study.
Variance The mean-squared deviation of all the values of the mean.
Variance method An agglomerative method of hierarchical clustering in which clusters are generated to minimise the within-cluster variance.
Varimax procedure An orthogonal method of factor rotation that minimises the number of variables with high loadings on a factor, thereby enhancing the interpretability of the factors.
Verbal models Analytical models that provide a written representation of the relationships between variables.
Verbal protocol A technique used to understand participants’ cognitive responses or thought processes by having them think aloud while completing a task or making a decision.
Voice-pitch analysis Measurement of emotional reactions through changes in the participant’s voice.
Volume-tracking data Scanner data that provide information on purchases by brand, size, price and flavour or formulation.
WWard’s procedure A variance method in which the
squared Euclidean distance to the cluster means is minimised.
Web analytics The process of collection, measurement and analysis of user activity on a website to understand and help achieve the intended objective of that website.
Weighting A statistical procedure that attempts to account for non-response by assigning differential weights to the data depending on the response rates.
Wilcoxon matched-pairs signed-ranks test A non-parametric test that analyses the differences between the paired observations, taking into account the magnitude of the differences.
Word association A projective technique in which participants are presented with a list of words, one at a time. After each word, they are asked to give the first word that comes to mind.
Zz test A univariate hypothesis test using the standard
normal distribution.
z value The number of standard errors a point is away from the mean.

Note: page references in bold type relate to the Glossary
Subject Index
Aa posteriori contrasts 622, 908a priori contrasts 622, 908a priori determination 717a priori knowledge 769absolute fit indices 798, 805–7access challenge, b2b research 863–5access panels see panelsaccuracy
data 96, 97–8information 62prediction 650
achievements, social media 507acquiescence bias 392, 908action research 148, 171–4, 908active observation 291active social media research 495, 496–7, 908adding value 24adjusted goodness-of-fit index (AGFI) 806administration 35–6, 325–6advergames 309advertising
agencies 109, 172, 422brand attitudes 640branded entertainment 309creativity 307emotional aspects 213–14evaluation 110–11, 277, 765food 255global brands 651–2humour 241influencing lifestyles 238length of commercials 588meta-theories 169positive and negative 303–4pre-testing 222semiotics 258
advisory services 18, 916affluence 84Afghanistan 486
age discrimination 290–1agencies 17–19, 39–40, 109, 422AGFI (adjusted goodness-of-fit index) 806agglomeration schedules 739agglomerative clustering 742, 908Akaike Information Criterion (AIC) 744, 752–4alarms, personal 708–9alcoholic drinks during focus groups 894alpha errors see Type I errorsalternative-forms reliability 360, 908alternative hypothesis 565–7, 908alternatives, implicit 393, 914ambiguity 391–2American approach to focus groups 156–8American style qualitative research 156–8analysts, b2b 861analytical models 52–3, 908analytical services 19, 908analytics
customers 133, 141web 136–9, 925
ANCOVA (analysis of covariance) 314, 604, 619–20, 664, 908
anonymisation‘can’t work’ 904‘must work’ 903–4
anonymity 286, 882–3confidentiality 895ethics 901–4participants 884, 889, 891, 892
ANOVA (analysis of variance) 601–4, 908assumptions 613–14conducting 606–10covariance see ANCOVAdecomposition of total variation 607–8dependent variables 606discriminant analysis relationships 676effects measurement 608F test 622factors 604, 615, 621–2illustrative examples 609–18

927Subject Index
independent variables 606interactions 614, 620–1k-sample median test 624Kruskal–Wallis 547, 624logit analysis relationships 676multiple comparisons 622multivariate ANOVA (MANOVA) 624–5n-way 604, 614–18, 918non-metric ANOVA 624, 918omega squared (ω2) 621–2one-way 547, 604, 605–14, 918with regression 664repeated measures ANOVA 622–3, 921results interpretation 609significance testing 608–9, 614–15statistics associated with 606treatment 604
API (Application Programming Interfaces) 497appendices in reports 840Application Programming Interfaces (API) 497apps, mobile research 518–20, 521, 523area sampling 430–1, 908assembly of data 239–43, 911association
strength and significance of 647–50techniques 223–4, 908
assumptions, implicit 393, 914asymmetric lambda 579, 908attitude–scale construction 765attitudinal data 127attributes 216, 777audimeters 292audio data collection 521audio recordings, focus groups 894audits 108, 908
problem audits 42–3, 920retail audits 115–16
average linkage 742–3, 908average variance extracted (AVE) 798, 808, 820–1
Bb2b research see business to business researchbaby milk market 131–2badness of fit 807balanced scales 353, 909banks 377, 418, 476, 867–8bar charts 843–4, 909bar codes see electronic scanner servicesBartlett’s test of sphericity 711, 714basic information 394Bayesian approach to sampling design 416, 909Bayesian Information Criterion (BIC) 744beers 767–74Behavioural Conversion Programme 137behavioural data 124, 127behavioural processes 166behavioural segmentation 140beliefs 834
benefit segmentation 738beta errors see Type II errorsbeta weights 662Beverage Brand Barometer 38–9bias
acquiescence 392, 908ethics 891–2interviewer 274, 285non-response 283, 461, 891–2, 918in observation 295order 387, 919position 387, 919questionnaire design 896in questions 392response 79, 461scales 895selection 313, 922self-selection 505–6
bibliographic databases 105, 909BIC (Bayesian Information Criterion) 744big data 122, 134–6billboards 268–9binary logit analysis 696–701, 909binomial tests 547, 581, 589, 909bivariate correlation see product moment correlationbivariate cross-tabulation 571–2bivariate regression 641–51, 909blogs 23, 503boosting 478boots 779–85brainstorming 195–6branching questions 395–6, 909brand MROCs 502–3branded entertainment 309branded marketing research products 19, 909brands
attitudes 640Beverage Brand Barometer 38–9cars 774–5development 91–2emotional branding 68global 651–2international brand equity 593market share 777perception 756personality 225–6recall 278in songs 373
broad statements of problems 50, 909browsable online databases 104bulletin boards 181business intelligence 141business to business (b2b) research 854–6
access challenge 863–5competitive intelligence 873–6concepts 858–60conjoint analysis 856consumer marketing compared 857–8cross-sectional design 872–3

928 Marketing Research
definition 857ethics 875ethnography 864future 876importance 856–7individual customer importance 868–71initial contact 863–4interviews 865networks 859–60purchasing decisions 860–1
number of people involved 861–2professional buyers 862–6
relationships 858–9, 872–3sampling 870–1social media 855technical competence 865time factor 866–8
buyer behaviour 738, 860–73buying centres 861buzz mining 499, 909
CCambodia, sampling 436candour 30, 43, 888canonical correlation 677canonical loadings 684CAPI (computer-assisted personal interviews) 278, 280, 379car brands 774–5career progression 25carryover effects 343, 909cartoon tests 225, 909case studies 160, 909casewise deletion 542, 909catalogues 558Category Deep Dive 31CATI (computer-assisted telephone interviews) 22, 275, 280, 379CATS (completely automated telephone survey) 288causal modelling 798, 823
see also structural equation modellingcausal research 79–82, 889, 909causality 160, 302–4, 909
absence of other possible factors 306–7concepts 304–5, 308–10concomitant variation 305–6conditions for 305–8definitions 308–10extraneous variables 308–9, 311–15symbols 310test marketing 326–8time order of occurrence of variables 306validity 310–11see also experimentation
censuses 95, 102, 413, 909central-location interviews 288central office control 482centroid method 677, 739, 743, 909CFA see confirmatory factor analysis
CFI see comparative fit indexchannel decisions 765characteristics
conclusive research 70exploratory research 70profiles 686, 909
charities 277Chartered Purchasers 863charts
flow charts 249–50, 845in reports 842–5
cheating errors 84Chebychev distance 741chi-square distribution 577–8, 798, 909chi-square statistic 576–8, 798, 909chi-square tests 547, 581, 806chicken flavours 180–1children 35–6, 213–14, 255, 894China
chicken tastes 180–1communities 478–9Golden Shield Project 493marketing intelligence 93–4online communities 478–9service quality, Hong Kong shoppers 428
chocolate 163CIT (critical incident technique) 82citizen journalism 522city-block distance 741clarification 478classification
analysis see cluster analysisexperimental designs 315–16geodemographics 129–30, 914information 394, 909marketing research 12–15matrices 677online databases 104–5qualitative research 182–3research design 69–73sampling techniques 419–20scaling techniques 342secondary data 99–100surveys 270
cleaning data 541–2, 911client–participant focus groups 194closeness 30, 43, 888cluster analysis 735–7
agglomerative clustering 742applications 738–9, 750–4centroid method 743concept 737–9discriminant analysis compared 737distance measures 741divisive clustering 742hierarchical 742, 744–6, 747interpretation 747–8linkage methods 742–3non-hierarchical 743–4, 747, 750–4
business to business (continued)

929Subject Index
number of clusters 746–7optimising partitioning method 743parallel threshold method 743problem formulation 740–1procedure selection 742–6profiling clusters 747–8reliability 748–9sequential threshold method 743statistics associated with 739steps 739–49TwoStep clustering 744, 752–4validity 748–9variables selection 740variance methods 743–4Ward’s procedure 743, 744–6
cluster centres 739, 750–1cluster components 754cluster membership 739, 750, 752cluster sampling see samplingclustering variables 754–6co-creation 165, 910co-creative nature of social media 899codebooks 530, 538–9, 910coding 259, 386, 398, 910coding and data-entry services 19, 910coding data 244–7, 252–3, 530, 533–9, 910coefficient alpha 360, 910coefficient of determination 642coefficient of multiple determination 652, 698coefficient of variation 564, 910cognitive approach to focus groups 156–8cognitive structure 216cohort analysis 75–6, 910collaborative techniques 23colour coding 398common factor analysis 717, 910communalities 710–11, 717–18, 724, 805, 910communities
Bose 22in China 478–9cross-cultural review 402–3ethics 898importance 833–4mobile research 517online providers 19, 918online research 23social media 501–4Weihenstephan 149
communication 30, 43, 888to research commissioners 24of research findings see findings
comparative fit index (CFI) 806, 807, 816–19, 822comparative scales 342–7, 910competition
social media 507study 749
competitive intelligence 873–6complete linkage 742, 910completely automated telephone survey (CATS) 288
completion rates 455, 910completion techniques 224, 910complex phenomena 154compliance techniques 473–4components
of problems 50, 922of research approach 50–1
composite reliability (CR) 798, 816, 820computer-assisted personal interviews (CAPI) 278, 280computer-assisted telephone interviews see CATIcomputer companies 701conative approach to focus groups 156–8conceptual maps 47–9, 910conceptual thinking 24conciseness, reports 841conclusions, drawing 259conclusive research 60, 69–73, 910concomitant variation 305–6, 910concurrent validity 362, 910confidence 30, 43, 888
intervals 419, 443, 445, 448–54, 910confidentiality see anonymityconfiguration interpretation 771–2confirmatory factor analysis (CFA) 796–7, 798, 800, 813–14confounding variables 313, 910conjoint analysis 762–5, 910
applications 777assumptions 786b2b research 856concepts 776–7estimation set 780holdout set 780hybrid 786input data 781limitations 786model 781–2, 910multidimensional scaling (MDS) in combination with 786–8multiple-factor evaluations 779–80problem formulation 778–9reliability 785–6results interpretation 784–5statistics and terms associated with 777steps 778–86stimuli 779–80two-factor evaluations 779validity 785–6
connection 259consent
informed see informed consentuninformed 899–900
consequences 216consistency checks 541, 910constant sum scaling 345–6, 910construction techniques 224–5, 911constructs 356–7, 910
elicitation, repertory grid technique 218structural equation modelling see structural
equation modellingvalidity 362, 910–11

930 Marketing Research
consumersadvisers 503choice attributes 777digital measurement of 891insight gained by marketing research 141, 142marketing, b2b compared 857–8panels see panelsprofiles 136see also customers
contentanalysis 254–6, 911data 98–9of questions 380–1validity 362, 911
context 500contextualism 164contingency coefficient 578–9, 911contingency tables 570, 911
see also cross-tabulationscontinuity 30, 43, 888continuous rating scales 348–9, 911contrasts 622, 911contrived observation 291–2, 911controllable marketing variables 5controlled test markets 328, 911convenience sampling 419, 420–1, 434, 911convergent validity 362, 808, 911cookies 294, 911cooperation 30, 43, 888
participants 893refusal, panel members 79
coordinates 766corporate social responsibility 382correlation 632–4
canonical 677coefficient see product moment correlationfactor analysis 709matrices 712, 713–16non-metric 640–1partial 638–40product momentum 634–8relationships 800–1
correspondence analysis 775–6, 911cosmetic surgery 456costs 38
constraints 35experimentation 325fieldwork 482–3focus groups 196in-depth interviews 214mobile research see mobile researchonline surveys 273return on investment 19–21surveys 286
counter arguments 347covariance 635, 911
ANCOVA (analysis of covariance) see ANCOVAestimated covariance matrices 798
relationships 801sample covariance matrices 799structure analysis see structural equation
modelling (SEM)covariates 604, 911Cox and Snell R square 698CR (composite reliability) 798, 816, 820Cramer’s V 579, 911creativity 30, 43, 307–8, 888criterion validity 362, 911criterion variables 641critical incident technique (CIT) 82critical requests 284, 911critical value determination 568–9CRM (customer relationship management)
see customersCronbach’s alpha 360, 361cross-cultural analysis 402–3, 548–9, 911cross-sectional designs 74–6, 77–9, 872–3, 889, 911cross-tabulations 556–8, 559, 570, 911
chi-square 576–8contingency coefficient 578–9Cramer’s V 579data display 249gamma 580lambda coefficient 579phi coefficient 578refining relationships 573–4spurious relationships 574suppressed association 574–5tau b 580tau c 580three variables 572–6two variables 571–2
cross-validation 662–3, 911crowdsourcing 504–6culture
codes 45cross-cultural analysis 402–3, 548–9, 911data 135–6fieldwork 485–6intra-cultural analysis 548–9values 234–6
currency exchange rates 869–70currency of data 98currency of information 62customers
action research 172analytics 133, 141databases 126–8, 911profiles 127relationship management (CRM) 122–3, 132–4, 140–1,
858–9, 911satisfaction 4, 271–2, 701see also consumers
customised services 18, 911cutting edge 494cyclical designs 777

931Subject Index
Ddashboards 832, 845–7data
accuracy 96, 97–8analysis 11–12, 233–5
coding see codingcontent analysis 254–6cross-tabulations see cross-tabulationscultural values 234–6, 548–9data assembly 239–43data display 247–50data reduction 243–7, 739data verification 250–1errors 84ethics 896–8field notes 240–2focus groups 193geodemographic 128–32grounded theory approach 251–4hypothesis testing see hypothesis testingin-depth interviews 214integrating analysis 253–4learning 238–9marketing understanding 237mechanistic 261memo writing 253narrative 236–8photography 242–3primary data 46proposals 38questionnaires 377repertory grid technique 217–19reports 839self reflection 235–6semiotics 256–9skills 135social values 234–6software 259–62statistical techniques 546–8strategy 545–8theoretical understanding 237, 250transcripts 243–4, 539–41triangulation 251validation 251visuals 242–3
assembly 239–43, 911big 122, 134–6challenges 141cleaning 541–2, 911coding see codingcollection 10–11
audio 521census data 95, 102databases 104–5, 122–8directories 101–2electronic scanner services 106, 113–15ethics 890–1flexibility 280
geodemographic information systems see geodemographic information systems
government sources 94–5, 102–4guides 100–1hypothesis testing 567–8industry services 116–17multidimensional scaling (MDS) 767–9non-governmental statistics 102operational data 125–8passive 516, 520primary data 10–11, 46, 92, 150–2process 475proposals 38reports 839retail audits 115–16Social Trends 103structured 269video 521–2see also panels; secondary data; surveys
communicating findings 12culture 135–6display 247–50, 259, 911entry services 19, 910external 100, 913fragmentation 259integrity 11–12, 528–30
casewise deletion 542cleaning data 541–2consistency checks 541cultures 548–9editing 530, 532–3ethics 897–8imputation 542missing responses 541–2neutral values 542pairwise deletion 542process 530–1questionnaire checking 531–2scale transformation 545standardisation 545statistical adjustments 543–5transcribing 539–41variable respectification 544weighting 543
internal 99–100, 915linking 139–44mining 72non-metric 547, 781, 918non-text 521online collection tools 22organisation problems 135–6preparation 11–12primary see primary dataprivate, on social media 509protection laws, EU 886–7public, on social media 509quality 135, 274, 483quantity 282–3

932 Marketing Research
reduction 243–7, 739, 911reliability, sentiment analysis 500richness 183science 904secondary see secondary datasharing 135–6social media see social mediasyndicated 106–17variety 135velocity 135veracity 135verification 250–1, 259, 911volume 135see also information
databases 104–5, 122–8debriefing 399, 895, 911deception avoidance 892decision-makers 24, 42–4, 62–3, 861decision-making 569, 833–4decision problem 46–9, 916decomposition of total variation 607–8, 912deduction 161–2, 912deep understandings 209–10demand artefacts 324, 912demographic segmentation 140demographics of focus groups 184–5dendrograms 739, 746dependability of data 99dependence relationships 800–1dependence techniques 548, 912dependent variables 80, 308–9, 606, 641, 912derived approaches 767–8, 912description 336, 912descriptive research 73–4, 80–2, 912
cohort analysis 75–6cross-sectional designs see cross-sectional designsethics 889longitudinal designs 76–9
designscontrol 314–15, 912cross-sectional see cross-sectional designscyclical 777fractional factorial 777questionnaires see questionnairesresearch see research
‘desktop first’ approach 523detergent market 223–4, 787–8determination coefficient 642determinism 160, 912development, research approach 39–41diagnosis, action research 173diaries 239–42
mobile 522panels 106SMS 517–18
dichotomous questions 388–9, 912difficult questions 395digital application 483–5
digital cameras 755digital dashboards 832, 845–7digital measurement of consumers 891digital newspapers 360–1dignity preservation, participants 892dimension labelling 771–2direct approach, qualitative research 182–3, 912direct mail 674–5direct method 679–80, 912directories 101–2directors 590–1directory databases 105, 912discriminant analysis 673–5, 912
ANOVA relationships 676basic concept 675characteristic profiles 686cluster analysis compared 737ethics 702factor analysis and, relationships 776hit ratios 687model 676–7, 912multidimensional scaling (MDS) and, relationships 776multiple 675, 688–95objectives 675problem formulation 678–9, 688regression relationships 676results interpretation 684–6, 692–3statistics 677–8stepwise 680, 696two-group 675, 676, 679validity 686–8, 694
discriminant function coefficients 677–8, 689–91discriminant functions 675, 684, 692, 912discriminant loadings 684discriminant scores 677discriminant validity 362, 912discussions with decision makers 42–4disguised observation 290–1disordinal interactions 620–1, 912display of data 247–50, 259, 911disputes, social media 506distance 336–7, 912distance measures 741distributing reports 845distribution research 14diversity 893diversity of questions 280divisive clustering 742, 912DIY research 39–40doctors 864dogma 834double-barrelled questions 381, 912double cross-validation 663, 912double sampling 432–3, 912downloading apps 518–20, 523drop-off surveys 288dropout of panel members 79dual-moderator focus groups 194duelling-moderator focus groups 194
data (continued)

933Subject Index
dummy variables 544, 663–4, 782, 912duplex information flow 902
Eease of use 770eating habits 80–1eclecticism, intellectual 25editing 481–2, 530, 532–3, 912EFA (exploratory factor analysis) 710, 810, 814effects measurement 608EFS (Enterprise Feedback System) 123eigenvalues 678, 689, 712, 717elbow criterion 769–70, 912elderly people 585–6election outcomes prediction 498–9electronic community research 892–3electronic observation 292–4, 295, 912electronic scanner services 106, 113–15elements 218–19, 414, 417, 871, 912email surveys 272emergent drinkers 60–1, 69emoticons 500–1emotional aspects of advertising 213–14emotional branding 67, 68empiricism 155, 912employee behaviour 728–9empowerment 411enabling devices, mood boards as 192–3encouragement, moderators 194endogenous constructs 798, 801Engagement Warehouse 137Enterprise Feedback System (EFS) 123Enterprise Resource Planning (ERP) 133entity recognition 501environment control 284environmental context, problem definition 42epilepsy 423ERP (Enterprise Resource Planning) 133errors
cheating 84data accuracy 96, 97–8data analysis 84inability 84, 867measurement 83, 358–9, 797, 916non-response 83, 918non-sampling 82–3, 918participant 867–8participant selection 84population definition 84questioning 84questionnaire checking 531–2random 358, 920random sampling 82–3, 920recording 84research design potential sources of 82–5response 83, 84–5, 375, 867, 921sampling design 413, 443–4sampling frame 84
scaling 358–9standard see standard errorsstructural 799sum of squared 642surrogate information 83systematic 358, 923total 82–3, 924Type I 567–8, 925Type II 567–8, 925unwillingness 85, 867–8
ESOMARchildren 894ethics code 883, 884–7, 896International Code on Market and Social Research 134marketing research and data gathering distinguished 884see also entry in Company Index
estimated covariance matrices 798estimated or predicted values 646, 912estimation samples 678estimation sets 780ethics 881–4
anonymity 901–4b2b research 875bias 891–2communication of research findings 898data analysis 896–8data collection 890–1data integrity 897–8discriminant analysis 702employee behaviour 728–9fieldworkers 890–1focus groups 183, 893–4informed consent 898–900online research 664–5perceptions of 613–14, 624–5, 756, 788, 826primary data 891privacy see privacyproblem definition 888product placements 444–5professional codes 863, 884–7qualitative research 183, 892–5quantitative research 895–6reports 898research approach 888research design 889–90research process 888–96respondent trust, maintaining 900–1sample size 891secondary data 891social media 23, 899–900web scraping 498
ethnographic research 149–50, 162–7b2b 864data verification 250ethics 892mobile research 517, 521–2qualitative techniques comparisons 227–8visual ethnography 154, 242–3
ethnography 162–3, 913

934 Marketing Research
EU data protection laws 886–7Euclidean distance 741, 744, 913European approach to focus groups 156–8European Social Survey 276European style qualitative research 156–8European Union data protection laws 886–7European voters 71evaluation
action research 173advertising 110–11, 277, 765apprehension 195projects 850scales 358–63secondary data 96–9
evidence-based decision-making 833–4evidence, objective 51–2, 918evolving research design 161, 913exchange rates 869–70executive summaries 838–9exogenous constructs 798, 801expenditure on marketing research 15–17experiential design research 14experimental designs 308–9, 325–6, 913experimental groups 190, 913experimentation 302–4
administration 325–6classification of experimental designs 315–16cost 325design control 314–15, 912factorial designs 322–3, 913field environment 323–5, 913history 311–12instrumentation 312–13, 914invalidity 320laboratory environment 323–5, 915Latin square designs 321–2, 915matching 314, 916maturation 312, 916mortality 313, 917multiple time series designs 319–20, 917new products 314–15non-experimental designs 325–6one-group pre-test post-test 315, 316, 320, 918one-shot case study 315, 316, 320, 918post-test-only control group 317–18, 320, 919pre-experimental 315–17, 320, 920pre-test-post-test control group 317, 320, 920quasi-experimental designs 315–16, 318–20, 920randomisation 314, 920randomised block designs 321, 921selection bias 313, 922Solomon four-group designs 318, 922static group design 315, 316–17, 320, 923statistical control 314, 923statistical designs 315–16, 320–3, 923statistical regression 313, 923testing effects 312, 924time 325time series designs 319, 320, 924
true experimental designs 315–16, 317–18, 320, 924validity 310–11, 320
experiments 308, 895, 913see also experimentation
experts, interviews with 44–5exploratory factor analysis (EFA) 710, 810, 814exploratory research 60–1, 69–72, 80–2, 913expressive techniques 225–6, 913extended text 247external analysis of preferences 773–4, 913external data 100, 913external suppliers 17–19, 913
see also agenciesexternal validity 311, 913extraneous variables 160, 308–9, 311–15, 913eye-tracking equipment 293, 913
FF distribution 584, 649–50, 678, 913F statistic 584, 913F tests 584–5, 622, 652–3, 913face-to-face interviews 896face-to-face surveys 276–9, 280–8FaceTrace 51factorial design 322–3, 913factors 604, 621–2, 709, 913
analysis 707–9, 913applications 709–10, 724–9calculation of scores 721common factor analysis 717concept 709–10correlation 709–10correlation matrices 712, 713–16discriminant analysis and, relationships 776interpretation 720method selection 717model 710–11model fit 721–2multidimensional scaling (MDS) and, relationships 776number of factors 717–19principal axis factoring 717principal components analysis 717problem formulation 712–13residuals 712, 721rotation of factors 719–20surrogate variables 721
loadings 712matrices 712, 719pattern matrices 712, 719, 720, 724scores 712, 721, 913
fast-moving consumer goods (FMCG) 126, 138feedback, action research 173field force 284–5, 913field notes 240–2, 259, 913field services 19, 913fieldwork 471–4
central office control 482concluding interviews 479

935Subject Index
cost 482–3cultures 485–6data collection process 475data quality 483editing 481–2environment 323–5, 913initial contact 476nature 474–5online research 483–5probing 477–9quality control 481–2, 483questions 476–7recording answers 479–81response rates 483sampling control 482selecting fieldworkers 475–6supervising 481–2time 482–3training 476–9, 480validation 482
fieldworkers, ethics 890–1filler questions 381filter questions 382, 913findings
communicating 12, 831–3, 898conclusive research 70exploratory research 70integration 24interpreting 24presentation see reportsresearch brief use 34–5
finite population correction 445, 450Finland 40firmness, moderators 193first-order factor model 799, 813–17fitness wristbands 514five Ms 187–8fixed-response alternative questions 269–70, 913flexibility, moderators 194flexible research designs 164flow charts 249–50, 845flu 506FMCG (fast-moving consumer goods) 126, 138focal relationships 859–60focus groups 11, 61, 179–83, 913
advantages 186–8, 200–1alcoholic drinks during 894American approach 156–8audio recordings 894characteristics 184–6children 894cognitive approach 156–8conative approach 156–8conducting 188–93costs 196data analysis 193disadvantages 186–8, 201duration 184, 185ethics 183, 893–4
European approach 156–8experimental groups 190Japanese approach 156–7location 184, 185misconceptions 196–8moderators 180, 183, 184–7, 193–4, 196–7, 917mood boards 184, 185, 191–2, 917number of groups 190–1observation techniques 182, 183online 19, 188, 198–202, 918participant recruitment 184–5, 198–9planning 188–93probing 186purpose 183qualitative techniques comparisons 227–8questions 188–9refreshments 185sensitive topics 197silence 241size 184topic guides 188–9two-way mirrors 894validation 197variations 194videotaping 184, 894
follow-up 460, 849–50foods
advertising 255frozen 544
forced rating scales 354, 913formulation, hypothesis testing 565–7fractional factorial designs 777fragmentation of data 259fragrances 67, 208–9frequency distributions 556–7, 560–2, 913
chi-square test 576–8, 798, 806F tests 584, 584–5, 622, 649–50, 652–3, 678measures of location 562–3measures of shape 564–5measures of variability 563normal distribution 443, 446t test 581, 582–7, 587–8tests 547z values 447, 448–52, 583, 586
friendship pairs 214, 913frozen foods 544frugging 905, 913full enterprise-level analytics services 137–8full profiles 777full-service suppliers 17, 913full-text databases 105, 914funnel approach 395, 914
Ggalvanic skin response (GSR) 293, 914gamification 507–8, 914gamma 580, 914gatekeepers, b2b 861

936 Marketing Research
general surveys 111generalisability 363, 914geodemographic classification 129–30, 914geodemographic information systems (GIS) 123, 128–32, 914geographic segmentation 140GFI (goodness-of-fit index) 806, 816–18GIS see geodemographic information systemsglobal brands 651–2GlobalCash 865, 867goodness-of-fit index (GFI) 806, 816–18government data sources 94–5, 102–4grammar 375, 500graphic rating scales see continuous rating scalesgraphical models 52–3, 914graphs 561, 841, 842–5Greece, banking services 418grounded theory 148, 168–70, 251–2, 914grounded theory data coding 252–3, 914group means 678group standard deviations 678GSR (galvanic skin response) 293, 914guides 100–1
HH statistic 624hard gamification 507harm prevention, participants 892health attitudes and behaviour 277health care 103, 545, 694–5heartfelt responses 494heterogeneity, b2b sampling 871hierarchical clustering 742, 744–6, 747, 914high-intensity situations 166histograms 561, 843–4, 914history 311–12, 914hit ratios 687, 914holdout samples 678–9holdout sets 780holiday industry 137, 305–6, 322holistic dimension 154–5home surveys 276–7, 280–8honesty 892horse ownership 424household data 109–15HTML5: 519humour 241, 500hybrid conjoint analysis 786, 914hype 834hypotheses 54, 914hypothesis testing 556–7
conclusion 569–70critical value determination 568–9data collection 567–8decision making 569formulation 565–7non-parametric tests 581, 588–93parametric tests 581–8
probability determination 568–9procedure 565–70relating to differences 580–1significance level choice 567–8statistical technique selection 567summary of 592test statistic calculation 567–8
hypothesised relationships 812
Iice cream 549, 736–7icicle diagrams 739, 744, 746identification information 394, 914ideology 834IFM Sports Marketing Surveys
FIBA Brand Tracker 557–8, 559, 561Formula One Racetrack Project 530, 534–8, 541Racetrack Project 223, 224
image data, social media research 508–9image measurement 765immediacy 494implicit alternatives 393, 914implicit assumptions 393, 914imputation 463, 542, 914in-depth interviews 207–22, 241, 914
see also projective techniquesin-house research 39–40inability errors 84, 867incentives 460incidence rates 287–8, 455, 914incomplete understanding, moderators 193–4incremental fit indices 799, 805–7independent samples 547, 583–6, 914independent variables 80, 308–9, 606, 641, 662, 914index of information searches (ISS) 544India 44, 871indirect approach, qualitative research 182–3, 914individuals, quality 71induction 162, 914industry services 108, 116–17industry statistics 15–17influencers, b2b 861influenza 506infographics 847information
accuracy 62availability 62basic 394classification information 394, 909currency 62duplex flow 902gatherers 60identification information 394, 914questionnaires 394relevance 62–3sensitive see sensitive informationsufficiency 62

937Subject Index
systems challenges 141total field of 9see also data
informed consent 882–5, 892–3, 898–900initiators, b2b 861insight 8institutions, syndicated data from 115–17instrumentation 312–13, 914insurance 192integrating analysis 253–4, 914integration of findings 24integrity, data 11–12intellectual eclecticism 25intellectual property, social media 506intelligence
competitive 873–6marketing 92–4, 916
interactions 614, 915effects, significance of 615, 922
interactive testing effect (IT) 312, 915interdependence techniques 548, 709, 915interdependent relationships 709internal analysis of preferences 773, 915internal consistency reliability 360, 915internal data 99–100, 915internal secondary data 125–8, 915internal validity 310–11, 777, 915international brand equity 593international marketing research
field experiments 324–5sampling 436–7
internationalisation of service firms 825internet see online researchinternet connected mobile devices 515interpretation 24, 155interpretivist paradigm 158–62interquartile range 563, 915interval scales 338, 340–1, 915interviewers
bias 274, 285credibility 865–6
interviews 32b2b research 865central-location 288competitive intelligence 874concluding 479ethics 894–5, 896face-to-face 896in-depth 207–22, 241, 914video recordings 894–5
intra-cultural analysis 548–9, 915introductory questions 189invalidity, experimentation 320involvement, moderators 193iPad surveys 143–4iPhone surveys 143–4ISS (index of information searches) 544itemised rating scales 348, 349–56, 915
JJapan 43–4
focus groups 156–7Tokyo Girls Collection (TGC) 237–8
javascript 519judgemental sampling 419, 420, 421–2, 434, 915
KK–S tests see Kolmogorov–Smirnov testsk-means clustering see non-hierarchical clusteringk-sample median test 624, 915Kaiser–Meyer–Olkin (KMO) measure 712, 714key questions 189kindness, moderators 193kiosk-based surveys 288KMO (Kaiser–Meyer–Olkin) measure 712, 714knowledge, obsolete 833Kolmogorov–Smirnov (K–S) tests 547
one-sample tests 581, 588–9, 915two-sample tests 581, 590–1, 915
Kruskal-Wallis one-way ANOVA 547, 624, 915kurtosis 565, 915
Llaboratory environment 323–5, 915laddering 215–17, 915lambda coefficient 579language 100lap-top replacement tablets 514latent variable analysis 798, 823
see also structural equation modellingLatin square designs 321–2, 915layers of response 63–7leading questions 392, 915learning 238–9least squares procedure 644–5, 915level of significance 567–8, 915
see also significancelibraries 101life satisfaction 76lifestyles 110, 140, 238, 915Likert scales 348, 349–51, 354, 915limited-service suppliers 18, 915line charts 843, 915linkage methods 742–3, 916linking data 139–44listening 166–7, 496, 916literacy issues 390–1living standards 74–5, 76local brands 651–2location measures 562–3, 916log-likelihood measure 744logical order of questions 395–6logistic regression 697logit analysis 673–6, 696–701London buses 3longitudinal designs 76–9, 872–3, 889, 916

938 Marketing Research
loyalty cards 126–7, 138–9, 155–8, 916luxury goods 796–7
Mmacroenvironmental factors 5magnitude estimation 347Mahalanobis procedure 696, 916main effects of each factor, significance of 615, 922main testing effect (MT) 312, 916managers
in-depth interviews 212thoughts about reports 836
Manhattan distance 741manifest content 255–6Mann–Whitney tests 547
U test 581, 589–90, 916MANOVA (multivariate ANOVA) 624–5, 917manufacturing promotion components 722–4maps 842
conceptual 47–9, 910spatial 765, 769territorial 693, 924
market barometers 217market research 7market research reports, 18, 916Market Research Society (MRS) 6
annual conference 24ethics code 884–7, 897, 898marketing research and data gathering distinguished 884sugging and frugging hotline 905
market testing 326–8, 738marketing challenges 141marketing decision problem 46–9, 916marketing intelligence 92–4, 916marketing research 916
advisory services 18, 916classification 12–15consumer insight gained by 141, 142definition 6–15global industry 15–19history 6investments, justifying 19–21meaning 3–6problem 46–50, 916process 8–12, 916role 4–5skills gap 22–5see also research
Marketing Research Online Communities (MROC) 497, 502–5, 517, 916
marketing understanding 237marketing variables, controllable 5matching 314, 916mathematical models 52–3, 916mathematically derived scales 364maturation 312, 916maximum likelihood method 698McNemar tests 547, 581, 592
means 445, 449–51, 562–3, 916means–end–chain (MEC) 216measurement and scaling 333–5
accuracy of measurement 358choosing scaling techniques 363–4comparative scales 342–7, 910constant sum scaling 345–6, 910continuous rating scales 348–9, 911definitions
measurement 335, 916scaling 336, 921
description 336, 912distance 336–7, 912errors of measurement 83, 358–9, 797, 916evaluation 358–63generalisability 363interval scales 338, 340–1, 915itemised rating scales 348, 349–56, 915Likert scales 348, 349–51, 354, 915mathematically derived scales 364metric scales 342, 917multidimensional scaling see multidimensional scalingnominal scales 337–9, 917non-comparative scales 343, 347–9, 917order 336, 918ordinal scales 338, 340, 919origin 337, 919paired comparison scaling 343–4, 919primary scales 337–42Q-sort scaling 346–7, 920questionnaire use of scales 389rank order scaling 344–5, 921ratio scales 338, 341–2, 921reliability 359–61, 363, 921scale transformation 545semantic differential scales 348, 351–2, 922Stapel scales 348, 352, 923validity 361–3, 925verbal protocols 347, 925
measurement model see structural equation modellingmeasures of location 562–3, 916measures of shape 564–5measures of variability 563, 916MEC (means–end–chain) 216mechanistic data analysis 261media panels 108, 111–12, 916medians 562–3, 916
tests 547, 581, 590, 624meeting, focus groups 188memo writing 253, 259, 916memory of participants, inadequate 166messiness, focus groups 187meta-theories of advertising 169metaphors 219–21metric data 547, 781, 917metric MDS 769, 917metric scales 342, 917microenvironmental factors 5Milgram experiments 883

939Subject Index
mini focus groups 194misjudgement, focus groups 187misrepresentation
avoidance 893focus groups 187
missing responses 541–2, 917missing values 533mixed-mode surveys 289mobile devices 513–14
online surveys 271, 273meaning and nature 514–16
mobile diaries 522‘mobile first’ world 522–3mobile research 22, 513–14
approaches to 516–18apps, downloading 518–20, 521, 523audio data collection 521challenges 522–5costs
to participants 521of research 524
downloading apps 518–20, 523ethnography 517, 521–2guidelines 518–22insights 524‘mobile first’ world 522–3passive data collection 516, 520photographic data collection 521research communities 517response quality 523SMS research 517–18surveys 516, 523telephone-based 521text-based 517video data collection 521–2wearable devices 525
mobile surveys 268–9, 271, 273design 523research 516, 523telephone surveys compared 386–7, 458
model fit 721–2, 801–2, 805–6, 811, 917model identification 802, 917moderation, focus groups 187moderators see focus groupsmodes 562–3, 917modification index 799, 810monadic scales see non-comparative scalesmood boards 184, 185, 191–2, 917mortality 313, 917motivation 216MROC (Marketing Research Online Communities) 497,
502–5, 517, 916MRS see Market Research SocietyMRS/AMRS/CASRO ‘Mobile research guidelines’ 521multi-item scales 356–7, 917multi-method designs 82multicollinearity 661–2, 917multidimensional scaling (MDS) 762–5, 917
applications 765
assumptions 773concepts 765configuration interpretation 771–2conjoint analysis in combination with 786–8correspondence analysis 775–6data collection 767–9derived approaches 767–8dimension labelling 771–2direct approaches 767, 768discriminant analysis and, relationship 776factor analysis and, relationship 776limitations 773metric MDS 769non-metric MDS 769number of dimensions 769–70perception data 767–8preference data 768–9, 773–5problem formulation 766–7procedure selection 769reliability 772–3statistics and terms associated with 765–6steps 766–75validity 772–3
multinomial logit 701multiple-choice questions 387–8multiple comparison tests 622, 917multiple cross-sectional designs 74–5, 872, 917multiple determination coefficient 652, 698multiple discriminant analysis 675, 688–95, 917multiple regression 651–61, 917multiple regression model 651–2, 917multiple time series design 319–20, 917multiple η2 614, 917multivariate analysis of variance (MANOVA) 624–5, 917multivariate techniques 546–8, 917mystery shoppers 289–91, 521, 917
Nn-way ANOVA 604, 614–18, 918Nagelkerke R square 698narrative 236–8National Censuses 95, 102natural observation 291–2, 917negative advertising 303–4nested model 799Net Promoter Score (NPS) 76netnography 164–5, 917networks
b2b 859–60social 493, 922
neuromarketing 293, 917neutral questions 381, 478neutral values 542new product development 20–1, 314–15, 738, 765new theory development 155news programmes 107newspapers, digital 360–1NFI (normed fit index) 806, 807

940 Marketing Research
NNFI see non-normed fit indexnominal scales 337–9, 917nomological validity 362, 917non-comparative scales 343, 347–9, 917non-experimental designs 325–6non-governmental statistics 102non-hierarchical clustering 743–4, 747, 750–4, 917non-metric ANOVA 624, 918non-metric correlation 640–1, 918non-metric data 547, 781, 918non-metric MDS 769, 918non-metric scales 343, 918non-normed fit index (NNFI) 806, 807, 818–19, 822non-parametric tests 581, 588, 918
binomial 589Kolmogorov-Smirnov 588–9, 590Mann-Whitney U 589–90median 590one sample 588–9paired samples 591–3runs 589sign 592two independent samples 589–91Wilcoxon matched pairs 590, 591
non-probability sampling 419, 420–5, 433–4, 870–1, 918non-recursive model 799non-response 283
bias 283, 461, 891–2, 918errors 83, 918issues 457–64
non-sampling errors 82–3, 918non-text data 521
exclusion 261normal distribution 443, 446, 466–8, 918normed fit index (NFI) 806, 807not-at-homes 461NPS (Net Promoter Score) 76null hypothesis 565–7, 918numeric databases 105, 918numerical taxonomy see cluster analysis
Oobjective evidence 51–2, 918objective questions 478objectives 34, 37
conclusive research 70exploratory research 70questionnaires 374–5in reports 839research briefs 34secondary data 98
objectivity 841oblique rotation 720, 918observation
moderators 194techniques 267–9
active 291advantages 296
bias 295competitive intelligence 874contrived 291–2disadvantages 296disguised 290–1electronic 292–4, 295evaluation 295–6in focus groups 182, 183mystery shoppers 289–91natural 291–2passive 291personal 292, 295quantitative 289structured 290trace analysis 294, 295undisguised 290–1unstructured 290
obsolete knowledge 833OLS (ordinary least squares) regression 644, 697, 700Olympic Games 421, 485–6omega squared (ω2) 621–2, 918omnibus surveys 109–11, 277, 918one-group pre-test-post-test designs 315, 316, 320, 918one-sample non-parametric tests 588–9one-sample parametric tests 583one-shot case study 315, 316, 320, 918one-tailed tests 566–7, 918one-way ANOVA 547, 604, 605–14, 918online banking 418online communities 502
providers 19, 918see also communities; Marketing Research Online
Communitiesonline data collection tools 22online databases 104–5online focus groups 19, 188, 198–202, 918online research 483–5
blogs 23brainstorming 195–6bulletin boards 181, 199communities 23databases 104–5ethics 664–5focus groups 68, 198–202insights 524panels 77, 79, 372–3, 460–1publications 360–1surveys 271–2
email 272response rates 283–4sample control 280–2
web analytics 136–9web portals 460–1
online services, 18, 918online shopping 603, 634, 660online streaming 19, 918online traffic figures 97–8open-ended questions 385, 539opening questions 394

941Subject Index
operational data 125–8, 918operational marketing managers 172operational use of dashboards 846operationalised variables 155, 918opinion polls 6, 443, 499optical scanning 540–1optimising partitioning method 743, 918oral presentations 847–8order 336, 918order bias 387, 919order of questions 394–6ordinal interactions 620–1, 919ordinal scales 338, 340, 919ordinary least squares (OLS) regression 644, 697, 700organic labelling 453origin 337, 919orthogonal arrays 777, 780orthogonal rotation 719–20, 919outdoor advertisements 269overall effects, significance of 614–15, 922overload 835oversimplification avoidance 849overview, loss of 261
Pp value 568–9, 920PA (path analysis) 795–6, 799, 823–6pace of work 835paired comparison scaling 343–4, 919paired samples 547, 581, 587–8, 591–3, 919paired samples t tests 587, 919paired t tests 547pairwise deletion 542, 919pairwise tables 777pan-cultural analysis 549, 919panels 77, 919
access panels 77, 282, 372–3, 908advantages 78disadvantages 79, 112Homescan 113media 108, 111–12, 916online 77, 79, 372–3, 460–1providers 19, 919purchase 108, 112–13, 920quality issues 373response bias 79sample control 282
paradigms 50–1, 155–6, 919interpretivist 158–62positivist 155, 158, 159–62
parallel threshold method 743, 919parametric tests 581, 919
F tests 584–5, 622, 649–50, 652–3, 678one sample 583paired samples 547, 587–8, 591–3proportions 586t test 581, 582–7, 587–8two independent samples 583–6z values 447, 448–52, 583, 586
parsimony fit indices 799, 805–7parsimony goodness-of-fit index (PGFI) 806, 807parsimony normed fit index (PNFI) 806, 807parsimony ratio 799part correlation coefficient 639–40, 662, 919part-worth functions 777partial correlation coefficient 638–9, 662, 919partial regression coefficients 653–4participant–moderator focus groups 194participants
anonymity 134, 884, 889, 891, 892control 288cooperation 893dignity preservation 892errors 84, 867–8harm prevention 892memory inadequate 166mobile research costs 521perceived anonymity 286, 919privacy 885, 892, 896recruitment
errors 84fieldworkers 475–6focus groups 184–5, 189–90, 198–9
reluctance 166research design perspective 63–9researcher and, relationships 160selection errors 84shame 166surveys 270, 286, 287trust 893unsatisfactory 533validation 251wrongdoing to, prevention 892
participative nature of social media 899passive data collection 516, 520passive observation 291passive social media research 495–6, 919path analysis (PA) 795–6, 799, 823–6path diagrams 799, 801, 811pauses 477payments, panel members 79Pearson correlation coefficient see product moment
correlationperceived participant anonymity 286, 919perceived product parity 756percentage of variance 718Perception Analyzer 349perceptions
of brands 756data 767–8of ethics see ethics
permissiveness, moderators 193personal alarms 708–9personal experience 833–4personal mobile devices 515personal observation 292, 295, 919personalisation 460personality of brands 225–6

942 Marketing Research
personification techniques 225–6, 919PGFI (parsimony goodness-of-fit index) 806, 807phablets 514phi coefficient 578, 919philosophy and qualitative research 155–62photographic data collection 521photography and visuals 242–3physical stimuli 280picture response techniques 225, 919pie charts 842–3, 919piggybacking 896pilot-testing 398–9, 402, 919pizzas 875planning, focus groups 188–93PNFI (parsimony normed fit index) 806, 807pooled within-group correlation matrix 678population 919
definition errors 84parameters 412–13, 416, 445–6, 451
portability, mobile devices 515position bias 387, 919positive advertising 303–4positivism 155, 158, 159–62, 919post-test-only control group design 317–18, 320, 919postal surveys 278–9, 280–8posters 268–9power of a statistical test 567, 919PPS (probability proportionate to size) 431–2, 920pre-coding 386, 396, 920pre-experimental designs 315–17, 320, 920pre-test-post-test control group design 317, 320, 920pre-testing advertising 222predicted or estimated values 646, 912predictive validity 362, 920predictors
relative importance 662variables 641
preference data 768–9, 773–5preference rankings 765presentations
of findings see reportsinfographics 847oral 847–8presenters’ performance 851quality variable in 835reports 836–7, 898
pricing 50analysis 765research 14
primary data 10–11collection and analysis 46definition 92, 920ethics 891qualitative versus quantitative research 150–2
primary scales of measurement 337–42principal axis factoring 717principal components analysis 717, 920printed questionnaires 397–8prior notification 459
privacykey issues 901–4participants 884, 885, 889, 891, 892, 896, 899, 903social media policies 899–900, 901
private data on social media 509private sector, b2b sampling 871probability determination, hypothesis testing 568–9probability proportionate to size (PPS) 431–2, 920probability sampling 419, 425–34, 920probing 186, 211–12, 285, 477–9, 920problems
audits 42–3, 920big data 135–6broad statements of 50, 909data organisation 135–6definition 9, 10, 30, 31–2, 37, 920
approach development 39–41components of problems 50conceptual maps 47–9decision problem 46–9discussions with decision-makers 42–4environmental context 42ethics 888interviews with experts 44–5in reports 839research problem 46–50statements of problems 50
identification research 12–15, 920formulation
binary logit analysis 696–8cluster analysis 740–1conjoint analysis 778–9discriminant analysis 678–9, 688factor analysis 712–13multidimensional scaling (MDS) 766–7
solving research 13–15, 920specific components of 50, 922technical, online surveys 274
product moment correlation 634–8, 920production blocking 195products
parity perceptions 756placements
brands in songs 373ethics 444–5
research 14branded marketing 19, 909new product development 20–1, 314–15, 738, 765
professional buyers 862–6professional codes of ethics 884–7professional panel participants 79profiling 887
clusters 747–8project evaluation 850projective techniques 182, 183, 221–7, 920promotions research 14proportions 446–9, 451–4, 586protocols 347, 399psycho-galvanometers 293, 920

943Subject Index
psychographics 110, 140, 920variables 709–10
psychological segmentation 140public data on social media 509public domain, social media 506public records 874public sector, b2b sampling 871published sources of secondary data 100–4pupilometers 293, 920purchase panels 108, 112–13, 920purchasing
decisions, b2b see business-to-businessmobile devices playing key part in process 515
QQ-sort scaling 346–7, 920qualitative research 10–12, 70–2, 147–50, 920
action research 148, 171–4American style 156–8classification 182–3comparisons 226–7cross-tabulation 249, 570direct approach 182–3, 912ethics 183, 892–5European style 156–8expenditure 16–17grounded theory 148, 168–70, 251–4holistic dimension 154–5indirect approach 182–3, 914intellectual traditions 152interpretation 155interviews 894–5listening 166–7nature 151–2new theory development 155objective viewpoint 169–70philosophy and 155–62quantitative research compared 150–2rationale 152–5sensitive information 153see also ethnographic research; focus groups; in-depth
interviews; projective techniques;……….surveysquality
control 481–2, 483data 135individuals 71responses see responsesvariable in presentations 835
quantitative observation techniques 289, 920quantitative research 10–12, 69–72, 920
content analysis 256ethics 895–6expenditure 16–17experiments 895qualitative research compared 150–2questionnaire design 896scales 895
quantity of data 282–3quasi-experimental designs 315–16, 318–20, 920questioning errors 84questionnaires 6
checkingassigning missing values 533data integrity 531–2unsatisfactory responses 532–3
definition 374–5, 920design 371–3
ambiguity 391–2assumptions and alternatives 393bias 896checklist 400–1colour coding 398content of questions 380–1cross-cultural 402–3data analysis 377defining issues 390encouraging answers 384–5estimates 393ethics 896exchange of values 374–5flow chart 396form 396–7funnel approach 395, 914generalisations 393information required 378, 394interviewing method 379–80layout 396–7negative statements 394numbering 396–7order of questions 394–6pilot-testing 398–9, 402positive statements 394printed questionnaires 397–8process 375–8refusal rates decrease 460wording 389–94
discards 533fieldworkers and 476–7information 394objectives 374–5reproducing 397–8
questions 53–4, 921bias 392branching 395–6, 909context 384dichotomous 388–9, 912difficult 395diversity 280double-barrelled 381, 912fieldwork 476–7filler 381filter 382, 913fixed-response alternative 269–70, 913in focus groups 188–9framing, social media 507inability to remember 382–3

944 Marketing Research
layers of response 63–7leading 392, 915logical order 395–6multiple-choice 387–8neutral 381, 478objective 478open-ended 385, 539opening 394repeating 477response errors 83, 84–5, 375rules use, social media 507structured 387–9, 923unstructured 385–7, 532, 925unwillingness to answer 381–5wording 389–94
quota sampling 419, 420, 422–4, 434, 920
RR-square 698, 766, 772random errors 358, 920random sampling see samplingrandomisation 314, 920randomised block design 321, 921range 563, 921rank order scaling 344–5, 921rapport 285–6ratio scales 338, 341–2, 921reality 159reassuring 478rebates 674–5, 726–7reciprocity ensuring 893recording answers 479–81recording errors 84recruitment see participantsrecursive model 799reduction of data 243–7, 739, 911reference points, mood boards as 192refusal rates 459regression analysis 632–4, 641, 921
accuracy 650ANOVA and 604–5, 664assumptions 651bivariate 641–51cross-validation 662–3dependent variables 641discriminant analysis relationships 676double cross-validation 663dummy variables 663–4, 782estimated or predicted value 646, 650F distribution 649–50F tests 652–3general model 645independent variables 641, 662least squares procedure 644–5logistic 697logit analysis relationships 676multicollinearity 661–2
multiple regression 651–61parameters 645–6partial regression coefficients 653–4predictor variables 641, 662residuals 657–8scatter diagrams 642–5significance of association 647–50significance test 656standardised regression coefficient 646–7statistical terms 642, 652–3stepwise regression 658–61, 662strength of association 647–50, 655
reidentification 902–3, 904relationships
b2b 858–9, 872–3building 60–1customer relationship management see customersfocal 859–60
relative importance weights 777relative non-centrality index (RNI) 806, 807relevance of information 62–3reliability 160, 921
cluster analysis 748–9conjoint analysis 785–6measurement and scaling 359–61, 363, 921multidimensional scaling (MDS) 772–3structural equation modelling 805–9, 816, 818–21
reluctance of participants 166repeated measures ANOVA 622–3, 921repeating questions and responses 477repertory grid technique (RGT) 217–19replacement, sampling with 416, 921replacement, sampling without 416, 921reporting 260, 921
solutions providers 19reports 12, 832
appendices 840caveats 840client questions 849conciseness 841conclusions 839–40data analysis 839data collection 839digital dashboards 832, 845–7distribution 845ethics 898executive summaries 838–9format 837–40graphs 841, 842–5importance 835–6infographics 847limitations 840managers’ thoughts about 836market research, 18, 916mistakes 842objectives 839objectivity 841oral presentations 847–8oversimplification avoidance 849
questions (continued)

945Subject Index
preparation 836–42, 898presentation 836–7, 898problem definition 839project evaluation 850proposals 38readership 840–1recommendations 839–40research design 839research follow-up 849–50results 839–8submission letters 838tables 841tables of contents 838title page 838writing 840–2
requests, critical 284, 911research
approachcomponents 50–1development 9, 39–41ethics 888
briefs 32–3, 921administration 35–6background information 33–4, 37components 33–6constraints 35findings, use 34–5objectives 34target groups 34
design 9–10, 59–61, 921classification 69–73conclusive research see conclusive researchcross-sectional designs see cross-sectional designsdecision-makers’ perspective 62–3definition 61–2descriptive research see descriptive researcherrors 82–5ethics 889–90evolving 161, 913exploratory research see exploratory researchflexible 164multi-method designs 82participants’ perspective 63–9proposals 38reports 839secondary data 97theory and 160
follow-up 460, 849–50objectives 34organisation 38problems see problemsprocess, ethics 888–96proposals 36–9, 921questions see questionssocial media see social mediatargets 34users, preferences and/or experience 152–3
Research 2.0: 23researchers
action research 172experience 152language 160participants and, relationships 160preferences 152on social media research 509
residuals 657–8, 712, 721, 802, 806–7, 809–10, 921respectification, variables 544, 925respondent trust, ethics 900–1responses
bias 79, 461errors 83, 84–5, 375, 867, 921imputed, substitution 542latency 293, 294, 921layers 63–7missing 541–2, 917non-response see non-responsequality
mobile research 523online surveys 273
rates 283–4, 921calculation 456–7compliance techniques 473–4fieldwork 483following-up 460improving 459–61imputation 463incentives 460missing responses 541–2not-at homes 461online surveys 283–4personalisation 460prior notification 459questionnaire design 460refusal rates 459replacement 462subjective estimates 462subsampling of non-participants 462substitution 462surveys and 458trend analysis 462–3unwillingness to answer 381–5, 867–8weighting 463
repeating 477unsatisfactory 532–3
responsibilities 25results see findingsretail audits 115–16retrieval 259return on investment 19–21rewards, social media 507RGT (repertory grid technique) 217–19rigour 260RMSEA see root mean square error of approximationRMSR (root mean square residual) 806–7RNI (relative non-centrality index) 806, 807role playing 225, 226, 921root mean square error of approximation (RMSEA) 806, 807,
816–19, 822

946 Marketing Research
root mean square residual (RMSR) 806–7rotation of factors 719–20round charts 842–3runs tests 589, 921
SSaaS (software as a service) 19samples 413, 921
control 280–2, 921covariance matrices 799independent 547paired 547size 416, 442–3, 921
completion rates 455confidence intervals 419, 443, 445, 448–54, 910ethics 891finite population correction 445, 450incidence rates 455means 445, 449–51multiple parameters 454non-response issues 457–64normal distribution 443, 446proportions 446–9, 451–4standard deviation 445, 448–52, 563–4standard error 445, 446–7, 450statistical approach 447statistical inference 446structural equation modelling 804–5symbols 445z values 447, 448–52
sampling 10, 260, 409–12area sampling 430–1b2b research 862, 870–1Bayesian approach 416classification of techniques 419–20cluster sampling 419, 425, 429–32, 434, 435, 909confidence intervals 419, 443, 445, 448–54, 910control 482, 921convenience sampling 419, 420–1, 434, 911design errors 413, 443–4design process 414–18distribution 446–7, 921double 432–3elements 414, 417errors 82–5, 413, 443–4fieldwork 482frames 84, 274, 281–2, 415–16, 871, 921international research 436–7judgemental 419, 420, 421–2, 434, 915non-probability 419, 420–5, 433–4, 870–1, 918population parameters 445–6, 451probability 419, 425–34probability proportionate to size (PPS) 431–2quota sampling 419, 420, 422–4, 434, 920random 411–12, 419, 425–7, 434, 435
errors 82–3, 920with replacement 416, 921without replacement 416, 921
sequential 432snowball sampling 419, 420, 424–5, 434, 922stratified 419, 425, 428–9, 430, 434, 435, 923systematic 419, 425, 427–8, 434, 435, 870, 923target populations 414–15techniques 416–17theoretical 161, 253, 924units 414, 417, 921validation 418
sarcasm 500SAS (Small Area Statistics) 192scales
bias 895ethics 895transformation 545, 921
scaling see measurement and scalingscanner data 108, 106, 114–15, 922scanner panels 114, 922scanner panels with cable TV 108, 114–15, 922scatter diagrams 642–5scattergrams 642–5scents 67schematic figures 845Schwarz’s Bayesian Information Criterion (BIC) 744scientific scrutiny, focus groups 187S:Comm Leisure Time Survey
interval scale 341nominal scale 339ordinal scale 340ratio scale 342
scores, discriminant 677scree plots 712, 718search 259second-order factor model 799, 813–14, 817–23secondary data 90–2
advantages 94–5analysis 45–6classification 99–100collection 45–6databases 104–5, 122–8definition 92–3, 922disadvantages 96ethics 891evaluation 96–9external sources
government 102–4published 100–4
internal sources 125–8, 915linking data 139–44syndicated sources 106–17uses 94–5
security, focus groups 187segmentation 765
baby milk market 131–2cluster analysis 738, 752conjoint analysis 777methods 140parents and children 426–7research 14

947Subject Index
selection bias 313, 922self reflection 235–6self-regulation 884, 886, 899, 904self-selection bias 505–6SEM see structural equation modellingsemantic differential scales 348, 351–2, 922semiotics 922
advertising and 258data analysis 256–9
sensitive information 65–6, 153, 197, 287, 384, 395sensitive questions 896sensitivity 170
moderators 194sentence completion 224, 922sentiment analysis 499–501sequential sampling 432, 922sequential threshold method 743, 922serendipity, focus groups 187set-top box (STB) data 292seven Cs 30, 43, 888shadow teams 94, 922shame, participants 166shape measures 564–5sharing data 135–6showrooming 515sign tests 547, 592, 922significance
of association 647–50of interaction effects 615, 922level 567–8, 915level choice, hypothesis testing 567–8of main effects of each factor 615, 922of overall effects 614–15, 922tests
correlation and regression 656factor analysis 718logit analysis 698one-way ANOVA 608–9n-way ANOVA 614–15
silence 241, 477silos 30–1similarity/distance coefficient matrices 739similarity judgements 765simple correlation
coefficient 662see also product moment correlation
simple random sampling (SRS) 419, 425, 426–7, 434, 435, 922
simulated test markets 328, 922single cross-sectional designs 74–5, 872, 922single linkage 742, 922skewness 564, 922skills
data analysis 135gap 22–5specialist 834
Slovenia, advertising agencies 422Small Area Statistics (SAS) 192smartphones 516
smartwatches 514, 525SMC (squared multiple correlations) 799, 809, 817SMS research 517–18snowball sampling 419, 420, 424–5, 434, 922snowballing 186social desirability 287, 922social listening 496social media
b2b research 855blogs 503co-creative nature of 899communities 501–4data
access 497–9collection 899–900examples 499reliability 500
ethics 899–900informed consent 899–900meaning 492–4, 922participative nature of 899privacy policies 899–900, 901private data on 509public data on 509research 22, 141–2,
active 495, 496–7, 908approaches to 495–7blogs 503challenges 495communities 501–4crowdsourcing 504–6emergence 494–5entity recognition 501gamification 507–8with image data 508–9limitations 509methods 499–508passive 495–6, 919sentiment analysis 499–501strengths 495with video data 508–9
researchers on 509uninformed consent 899–900
social networks 493, 922social responsibility 382Social Trends 103social values 234–6soft gamification 507software
data analysis 259–62data display 247–8providers, 19, 922
software as a service (SaaS) 19Solomon four-group design 318, 922songs 373Sophisticated Singles 130source derogation arguments 347spatial maps 765, 769special-purpose databases 105, 922

948 Marketing Research
specialisation, focus groups 187specialist skills 834specific components of problems 50, 922specification search 810, 922spectators, b2b 862speed 260
focus groups 187online surveys 273
spelling 500sphericity 711, 714split-half reliability 360, 718, 923sponsorship 278spontaneity 187, 494sports ticket prices 659spreadsheets 247–8SPSS practice data analysis
ANOVA 625–6cluster analysis 757–8conjoint analysis 788–9correlation and regression 665–6data analysis 593–5data integrity 549–51discriminant analysis 702–3factor analysis 729–30MDS 788–9
spurious relationships 574squared multiple correlations (SMC) 799, 809, 817SRMR (standardised root mean residual) 806–7,
818, 822SRS see simple random samplingstaff retention 685–6standard deviation 445, 448–52, 563–4, 891, 923standard errors 445, 446–7, 450, 642, 923standard test markets 327–8, 923standardisation 545, 646–7, 923standardised regression coefficient 646–7standardised residuals 809–10, 923standardised root mean residual (SRMR) 806–7, 818, 822Stapel scales 348, 352, 923statements of problem 50, 909static group design 315, 316–17, 320, 923statistical adjustments 543–5statistical approaches 770statistical control 314, 923statistical designs 315–16, 320–3, 923statistical inference 446, 923statistical regression 313, 662, 923statistical technique selection, hypothesis testing 567statistical test, power of 567, 919STB (set-top box) data 292stepwise discriminant analysis 680, 696, 923stepwise regression 658–61, 923stimulation, focus groups 187stimuli 280, 779–80storage 259story completion 224, 923strategic marketing managers 172strategic use of dashboards 846strategy formulation 590–1
stratified sampling see samplingstreaming, online 19, 918street surveys 278strength of association 647–50, 655stress values 765, 769–70, 772structural equation modelling (SEM) 795–7, 923
applications 814–23chi-square test 806communality 805compared to other techniques 814concepts 797–8conclusions and recommendations 812–13, 817, 823constructs 797
endogenous 798, 801exogenous 798, 801individual, defining 802–3, 815, 817–18
correlational relationships 800–1dependence relationships 800–1first-order factor model 799, 813–17foundations 800–2higher order models 813–14hypothesised relationships 812measurement model 799, 800, 803–4, 815–16, 818–21model fit 801–2, 805–6, 811model identification 802modification index 810path diagrams 801reliability 805–9, 816, 818–21residuals 802, 806–7, 809–10sample size 804–5second-order factor model 799, 813–14, 817–23specification search 810statistics and terms associated with 798–9structural models 799, 800, 801, 810–13, 817, 821–3validity 805–10, 811–12, 816–17
structural errors 799structural models see structural equation modellingstructural relationships 799structure
correlations 678focus groups 187
structured data collection 269, 923structured direct surveys 269structured observation 290, 923structured questions 387–9, 923subconscious feelings 153subjective estimates 462submission letters 838subsampling of non-participants 462substitution 462, 923sufficiency of information 62sugging 905, 923sum of squared errors 642supervising fieldworkers 481–2suppliers
external 17–19, 913full-service 17, 913limited-service 18, 915see also agencies

949Subject Index
support arguments 347suppressed association 574–5surrogate information errors 83surrogate variables 721, 923surveys 2, 4, 6, 108, 109, 267–9, 923
anonymity 286classification 270completion rates 455computer-assisted personal interviews 278, 280, 379content 523cost 286diversity of questions 280drop-off surveys 288email 272environment control 284evaluation of methods 279–88face-to-face 276–9, 280–8field force control 284–5fixed-response alternative questions 269–70flexibility 280general 111home 276–7, 280–8incidence rates 287–8interviewer bias 285invitations 523kiosk-based 288methods 269–71, 923mixed-mode 289mobile see mobile surveysomnibus 109–11, 277, 918online see online researchparticipants 270, 286, 287physical stimuli 280postal 278–9, 280–8probing 285quantity of data 282–3questionnaire design 379–80rapport 285–6response rates 283–4, 457–64sample control 280–2sampling frames 281–2sensitive information 287situational factors 284social desirability 287speed 286street 278structured direct 269techniques 270, 278–81, 923telephone see telephone surveysworkplace 276–7, 280–8see also fieldwork
surveytainment 273–4symmetric lambda 579, 923syndicated data 106–17syndicated services 18, 923syndicated sources 106–9, 923synergy, focus groups 186systematic errors 358, 923systematic sampling see sampling
Tt distribution 582, 924t statistic 582, 924t tests 547, 581, 582–7, 587–8, 925tables in reports 841tablets 514tactical use of dashboards 846TAM (technology acceptance model) 814–17Tango Facebook 376target customers, action research 172target groups, online surveys 274target population 160, 414–15, 924targets, research 34task factors, surveys 279TAT (thematic apperception tests) 225tau b 580, 924tau c 580, 924taxonomy, numerical see cluster analysisteams 260technical competence 865technical problems, online surveys 274technology acceptance model (TAM) 814–17teenagers 213–14, 255telecommunications industry 431–2telemarketing 905telephone-based research 521telephone focus groups 194telephone interviewing, computer-assisted see CATItelevision set-top box (STB) data 292telephone surveys 275, 280–8, 386–7, 458
see also mobile surveystelescoping 383, 867–8, 924television
motivations 74reception 617–18users or non-users 687–8
ten Ss186–7territorial maps 693, 924test marketing 326–8, 924test markets 326–8, 738, 924test-retest reliability 359, 924test statistic 567, 567–8, 924test units 308–9, 924testing effects 312, 924text-based mobile research 517text, extended 247Thailand 738, 787–8thematic apperception tests (TAT) 225thematic maps 128, 924theoretical base 23theoretical framework 51–2theoretical sampling 161, 253, 924theoretical understanding 237, 250theory 51–2, 155, 168, 924
building 260thermometer scales 355third-person techniques 225, 924time 325time order of occurrence of variables 306

950 Marketing Research
time series designs 319, 320, 924TLI (Tucker Lewis index) 806, 807Tokyo Girls Collection (TGC) 237–8top performers, mindless mimicry of 834topic guides 188–9, 924total correlation matrix 678total errors 82–3, 924total field of information 9tourism destinations 602–3, 738trace analysis 294, 295, 924training fieldworkers 476–9, 480transcripts 243–4, 259, 539–41, 924transformation of scale 545, 921transition questions 189transitivity of preference 343, 924transparency, maintaining 893travel companies 137, 305–6, 322, 602–3treatment 604, 924trend analysis 462–3, 924triangulation 251, 924true experimental designs 315–16, 317–18, 320, 924true feelings 863–4True Loyalty 76true score model 358, 924trust 23
participants 893Tucker Lewis index (TLI) 806, 807TV see televisiontwo-group discriminant analysis 675, 676, 679, 925two independent samples
non-parametric tests 589–91parametric tests 581, 583–6
two-sample median test 590, 925two-tailed tests 566–7, 925two-way focus groups 194two-way mirrors, focus groups 894TwoStep clustering 744, 752–4Type I errors 567–8, 925Type II errors 567–8, 925
UU statistic 589–90, 678unbalanced scales 353undisguised observation 290–1unethical employee behaviour 728–9unfolding 766, 773unidimensionality 799uninformed consent, social media 899–900unit definition, b2b sampling 871United Nations Statistics Division 102univariate techniques 546–7, 925unsatisfactory responses 532–3unstructured observation 290, 925unstructured questions 385–7, 532, 925unwillingness errors 85, 867–8unwillingness to answer 381–5, 867–8users, b2b 861utility functions 777
Vvalidation samples 678–9, 925validity 160, 925
causality 310–11cluster analysis 748–9conjoint analysis 785–6construct validity 362, 910–11content validity 362, 911convergent 362, 808, 911criterion validity 362, 911cross-validation 662–3data 251discriminant analysis 686–8, 694discriminant validity 362, 809, 912experimentation 310–11, 320external 311, 913fieldwork 482focus groups 197internal 310–11, 777, 915logit analysis 698–9measurement and scaling 361–3multidimensional scaling (MDS) 772–3participant validation 251sampling design 418structural equation modelling 805–10, 811–12, 816–17triangulation 251
values 160, 216variability measures 563, 916variables
clustering 754–6confounding 313, 910criterion 641dependent 80, 308–9, 606, 641, 912dummy 544, 663–4, 782extraneous see extraneous variablesindependent 80, 308–9, 641, 662, 914latent variable analysis 798, 823operationalised 155, 918predictor 641, 662psychographic 709–10respectification 544, 925selection, cluster analysis 740surrogate 721, 923time order of occurrence 306
variance 563, 925method 743–4, 925percentage of 712, 718standard deviation see standard deviationsee also ANOVA (analysis of variance)
variation coefficient 564, 910variety 24–5, 135varimax procedure 719–20, 925velocity, data 135veracity, data 135verbal descriptions 354verbal models 52–3, 925verbal protocols 347, 925verification of data 250–1, 259, 911

951Subject Index
video datacollection 521–2social media research 508–9
video recordingsfocus groups 184, 894interviews 894–5
Vietnam, sampling 436vision 5visual ethnography 154, 242–3visuals use, social media 507voice-pitch analysis 293, 925voice recognition systems 540volume
data 135obsession with 261tracking data 114, 115, 925
voters, European 71
WWard’s procedure 743, 744–6, 925wearable devices 525Web 2.0: 23web access, online surveys 274web analytics 136–9, 925
see also online research
web portals 460–1web scraping 498web surveys 22websites or mobile apps 519–20weighting 463, 543, 777, 925Wilcoxon matched-pairs signed-ranks test 547, 581, 590,
591, 925Wilks’ λ 678, 684Women in Muslim Countries (WIMC) study 411word association 223–4, 925wording of questions 389–94working environments 25workplace surveys 276–7, 280–8writing reports 840–2wrongdoing to participants, prevention 892
Yyea-saying 392, 908
Zz tests 547, 583–5, 925z values 447, 448–52, 586, 925Zaltman metaphor elicitation technique (ZMET) 219–21

Aalto, Juha 40Angell, Ian 272Attfield, John 283
Bevolo, Marco 150Bradford Smith, Kim 486Bruce, Clare 124
Clark, Moira 892Cooper, Peter 158
Dahl, Stephan 493Derrida, J. 259Dibb, S. 857Donato, Paul 114Dorsey, Jack 494Drummond-Dunn, Denyse 139Dyson, James 21
Ekman, Paul 51
Ford, David 857, 858, 860Frost, Jane 905
Glaser, B.G. 168, 251Gnädig, Ayobamidele 163Gobé, Marc 68Goldfarb, Jamie 541Gordon, Wendy 20Griffiths, John 901–2Gutman, J. 216
Hair, Neil 892Harristhal, Johan 531Hill, Alistair 516
Jobs, Steve 3–4, 20
Kakar, Sudhir 45Kaminska, Olena 458Keller, Peter 411–12Kelly, George 217Kroll, Bob 593
Lavrakas, Paul 458Lenhart, A. 497Lewin, Kurt 171–2Likert, Rensis 349Lynn, Peter 458
Maguire, Louise 517Mariampolski, Hy 80Meax, Dimitri 142Mecklin, Taina 40Mellor, Stephen 525Merkel, Angela 77Metcalf, Peter 163Milgram, Stanley 883Mouncey, Peter 464Murray, Gavin 40
Nunan, D. 899Nuzzo, Regina 849
Obama, Barrack 499
Pearson, Karl 634Pointer, Ray 882Prasad, Shobha 241
Rapaille, Clotaire, 45Reichheld, Frederick 76Reidenbach, R.E. 756Robin, D.P. 756Roddick, Anita 20Ruohomaa, Erja 40
Scheffler, Hartmut 412Schieleit, Oliver 163Shearer, Colin 124Smith, Patten 412Spaeth, Jim 124Stapel, Jan 352Storry, Grant 398Strauss, A.L. 168, 251Sutton, Bob 833Sweeney, Latanya 902–3
Name Index

953Name Index
Tilvanen, Jukka 40Tufte, Edward 834
Webster, Frederick 858, 861Weld, William, Governor 902–3Whiting, Mark 840
Wind, Y. 861Wolf, Sharon 80
Yenicoglu, B. 899
Zelin, Andrew 412

@BRINT 1012CV 5227-Up 763–4ABCe 97–8
A.C. Nielsen 292A.C. Nielsen Homescan 113Access Testing 293Adidas Japan 268–9Adobe Analytics 137Air New Zealand 398Allied Domecq 60–1AMA (American Marketing Association) 7, 26Amazon 493, 507American Association for Public Opinion Research 436American Marketing Association (AMA) 7, 26Amos 826Apple 3–4, 68, 514, 525Apple Pay 516Apple Watch 525Arçelik 192Ariel 44Asda 30–1AT&T 726–7Atlas.ti 260ATUO BILD 217Auchan 126Audi 775Avon Products 633–4
Bailey’s Irish Cream 66Bally 779Barclays Bank 476Barilla Alimentare 80BBDO Worldwide 756BBH 376Becks 767–74Beetle 728BEHAVIORSCAN 115BH&HPA (British Holiday & Home Parks
Association) 271–2bizeurope.com 102BlackPlanet 167BluMis 36
BMW 832–3, 869BMWG (Broadband Measurement Working Group) 98Boden 123The Body Shop 20Boots 326, 764Bose 22, 23BrainJuicer 51, 195–6Brand Tracker 415Brass 484–5Braun 497Bristol City Council 505–6British Airways 496British Gas 496British Holiday & Home Parks Association
(BH&HPA) 271–2British Office for National Statistics 102, 103Broadband Measurement Working Group
(BMWG) 98BSkyB 111, 114Budvar 343–4, 767–74Budwieser 767–74Bureau Van Dijk 116–17Business Intelligence Group (BIG) 856
CACI 129, 130, 132Cadillac 775Canadian Marketing Research and Intelligence
Association 896Carlsberg 343–4, 767–74Caterpillar 779CBOS (Centrum Badania Opinii Spotecznej) 75–5CCR Data 129Central Bureau voor de Statistiek Nederlands 102Centrum Badania Opinii Spotecznej (CBOS) 75–5Chartered Institute of Purchasing and Supply (CIPS) 863Cheeseborough Ponds 327Christian Dior 208–9, 215Chrysler 774–5Cint 437Circle Research 856, 868Clausthaler 652Clear Channel 269Cobalt Sky Ltd 19Coca-Cola 38–9, 138, 343, 381, 763–4
Company Index

955Company Index
Colgate 392, 593, 787–8Colgate Palmolive 293Conquest Metaphorix 220Consumer Zoom 126Cooperative Bank 867Coors Light 225–6Corning Display Techniques 74Corona 767–74Crazy Egg 137CRM Metrix 167Crowd DNA 522Cspace 19, 22
D3 Systems 411Dagmar 415Dalgety Animal Feeds 424Danmarks Statistik 102Datamonitor 101, 116DataSift 498Datastar 105Debenhams 133Dell 675Department for Education 426–7Desgrippes Gobé Group 68Deutsche Telekom 174Diageo 8, 503–4Diet Coke 763–4Digitab 19Directory of Open Access Journals 105Dr Martens 779Dr Pepper 763–4Dubit 894Dun and Bradstreet 116–17Dunnhumby 138Durex 65–6Dyson 21
e-Rewards 19easyJet 4eBay 209–10, 522, 857ECB (European Central Bank) 104EgeBank 602Emerald Insight 105ESOMAR 6, 7, 12, 16, 519
Directory of Research Organisations 102Global Market Research Industry Study 15, 19–20see also entry in Subject Index
ESP Properties 53Euromonitor 18, 102Europages 102European Central Bank (ECB) 104European Directories 105European Society for Opinion and Market Research see
ESOMAREurostat 103Experian 129–31Experian MOSAIC 105, 123, 129–31Eyebox2 269
Facebook 22, 135, 272, 376, 493, 494, 497, 498, 508, 521–2, 900
FashionLife 116Federal Statistical Office of Germany 102Firefish 213Flickr 494FocusVision 19FreshMinds 19
Gale Newspaper Database 105Gartner 17GfK 17, 18
BEHAVIORSCAN 115Custom Research 531FashionLife 116
Girlswalker.com 237–8Givaudan 67, 180Global Change Network 382GlobalPark 123, 143Google 498, 506, 525Google Analytics 137Google Glass 525Google Vision 508Grenson 125Grolsch 343–4, 767–74
Häagen-Dazs 66, 127, 549, 736–7Hall and Partners 376Harp 767–74Harvey Research 110Heineken 846Hennessy Cognac 167, 840Hermès 48Hewlett-Packard 701Hitachi Europe 866, 867Hollis 101Holsten 343–4, 767–74Honda 774–5H.T.P. Concept 163Huober Brezeln 453Hyundai 775HYVE Innovation Research 497
IAG Cargo 868IBM 134–5, 859–60ICI Agricultural Products 787The iD Factor 199IDEO 250, 398IFABC (International Federation of Audit Bureaux of
Circulation) 98IFM Sports Marketing 64–5IKEA 388IMF (International Monetary Fund) 104IMRI 105IMS Health Inc. 17In/situm 68Indiefield 19Information Resources Symphony 110

956 Marketing Research
ING Bank NV 130Inside Flyer 98Insight Research Group 864Instagram 272, 494Institut National de la Statistique et des Études Economiques,
France 102International Basketball Federation FIBA 415International Federation of Audit Bureaux of Circulation
(IFABC) 98International Monetary Fund (IMF) 104International Olympic Committee (IOC) 421Interview NSS 76Ipsos 17, 24Ipsos MORI 76, 109, 412, 473
Jaguar 775JCDecaux 269Jigsaw Research 293
Kantar 17, 39, 113Kellogg’s 13–14, 15Keynote 102Kiasma Museum of Contemporary Art 415Kissmetrics 137Knorr 237–8KPMG Nutwood 82Kraft 875
Labbrand 180Lego 165Lexus 775LG Electronics 149–50LightspeedGMI 19LinkedIn 493, 900LISREL 826London School of Economics 71
Maersk 855Marktest 386MAXQDA 260Mercedes 322–3, 609–10, 774–5Microsoft 153Millward Brown 39, 110, 277Millward Brown’s Vermeer 19Mintel 18, 847Mosaic Global 130Moving Motor Show 64–5MTV 40MTV Networks 154Mueller Dairy Group 149Mullen’s 92Mumsnet 502
NASA 834Natural Marketing Institute 110NatWest 81–2Nestlé 35–6, 138, 139Neustar 903
Nielsen Claritas 737Nielsen Company 17, 114Nielsen Media Research 458NielsenConnect 114Nike 68, 165Nikon 755Nintendo 123Nivea 164–5Nudge 376NVivo 260, 262NYC Taxi and Limousine Commission 903
OgilvyOne New York 142OnePoll 18OpenMx 826Opinium Research 71Optimisa 213Orbitz 309
PARC (Pan Arab Research Centre) 276–7Pegram Walters International 60Pepsi Cola 763–4Performance Research 421Perrier 652Persil 44Philips 76, 150, 181Pinterest 900Porsche 774–5Prada 182Premier Farnell 856Princess Cruises 540–1Procter and Gamble 44, 327–8, 497Progressive Sports Technologies 260, 262
QSR 169, 260Qualtrics 16, 19
R 826Radio Ad Effectiveness Lab (RAEL) 110–11Readers Digest 40Red Cross 303Rémy Martin 166Renault 538, 869Repères 208, 215Research 2.0: 23The Research Box 271–2Research International 40ResearchNow 131, 485–6Rexona 257
Saatchi & Saatchi 640San Miguel 767–74Scholler 36Schwan 875SCI INTAGE 112–13Scottish Epilepsy Association 423Sense Scotland 128–9Simmons 92

957Company Index
Sky Media 111–12Sky UK 473SMA 131–2smartFOCUS 123Snap surveys 271Society of Competitive Professionals (SCIP) 873–4Sony 222, 273–4, 303SPSS 133SSI (Survey Sampling International) 371, 421Statistical Office of the European Community 103Statistical Yearbook 102Stella Artois 343–4, 767–74Suncorp 192Surf 43–4Survey Sampling International (SSI) 371, 421Surveymonkey 16, 19Swedish Information ‘Smorgasbord’ 102Swedish Tourism Trade Association 102Synovate 398
Taloustutkimus 40Tango 763Taylor Nelson Sofres see TNSTesco 138–9TfL (Transport for London) 3, 4Thomson Holidays 137Timberland 779TNS 18, 39, 77, 79, 107, 111, 114, 132, 222, 278,
478–9, 496
TNS Infratest 412TOMORROW FOCUS Media 143–4Toyota 774–5Transport for London (TfL) 3, 4Trinity McQueen 30TripAdvisor 493Twitter 494, 497, 900
UBS 848Unilever 43–4, 138, 213, 257United Nations Economic Commission for Europe (UNICE)
104uSamp 524
Virgin 91–2, 98VW 774–5VW Beetle 728
WARC 101Weihenstephan 149WGSN 105WhatsApp 498Wikipedia 504–5World Statistics Pocketbook 102
Yankelovich and Partners 651–2YLE 40YouGov 18, 76, 411YouTube 494, 508